Effects of Eutrophication, Seasonality and Macrofouling on the Diversity of Bacterial Biofilms in...
11
Effects of Eutrophication, Seasonality and Macrofouling on the Diversity of Bacterial Biofilms in Equatorial Coral Reefs Yvonne Sawall 1¤ , Claudio Richter 2 , Alban Ramette 3 * 1 Leibniz Center for Tropical Marine Ecology, Bremen, Germany, 2 Alfred Wegener Institute for Polar and Marine Research, Bremerhaven, Germany, 3 HGF-MPG Group for Deep Sea Ecology and Technology, Max Planck Institute for Marine Microbiology, Bremen, Germany Abstract Biofilms play an important role as a settlement cue for invertebrate larvae and significantly contribute to the nutrient turnover in aquatic ecosystems. Nevertheless, little is known about how biofilm community structure generally responds to environmental changes. This study aimed to identify patterns of bacterial dynamics in coral reef biofilms in response to associated macrofouling community structure, microhabitat (exposed vs. sheltered), seasonality, and eutrophication. Settlement tiles were deployed at four reefs along a cross-shelf eutrophication gradient and were exchanged every 4 months over 20 months. The fouling community composition on the tiles was recorded and the bacterial community structure was assessed with the community fingerprinting technique Automated Ribosomal Intergenic Spacer Analysis (ARISA). Bacterial operational taxonomic unit (OTU) number was higher on exposed tiles, where the fouling community was homogenous and algae-dominated, than in sheltered habitats, which were occupied by a variety of filter feeders. Furthermore, OTU number was also highest in eutrophied near-shore reefs, while seasonal variations in community structure were most pronounced in the oligotrophic mid-shelf reef. In contrast, the macrofouling community structure did not change significantly with seasons. Changes in bacterial community patterns were mostly affected by microhabitat, seasonal and anthropogenically derived changes in nutrient availability, and to a lesser extent by changes in the macrofouling community structure. Path analysis revealed a complex interplay of various environmental and biological factors explaining the spatial and temporal variations in bacterial biofilm communities under natural conditions. Citation: Sawall Y, Richter C, Ramette A (2012) Effects of Eutrophication, Seasonality and Macrofouling on the Diversity of Bacterial Biofilms in Equatorial Coral Reefs. PLoS ONE 7(7): e39951. doi:10.1371/journal.pone.0039951 Editor: Jack Anthony Gilbert, Argonne National Laboratory, United States of America Received February 23, 2012; Accepted May 29, 2012; Published July 6, 2012 Copyright: ß 2012 Sawall et al. This is an open-access article distributed under the terms of the Creative Commons Attribution License, which permits unrestricted use, distribution, and reproduction in any medium, provided the original author and source are credited. Funding: This study was funded by the German Federal Ministry of Education and Research (BMBF) under a bilateral German-Indonesian project (SPICE, grant number 03F0472A). Further support was given by the Bremen International Graduate School for Marine Sciences (GLOMAR) funded by the German Research Foundation (DFG). AR was supported by the Max Planck Society. The funders had no role in study design, data collection and analysis, decision to publish, or preparation of the manuscript. Competing Interests: The authors have declared that no competing interests exist. * E-mail: [email protected] ¤ Current address: Research Unit Benthic Ecology, Helmholtz Center for Ocean Research (GEOMAR), Kiel, Germany Introduction Microbial biofilms play an important role in aquatic systems by providing a conditioned surface for larval settlement and metamorphosis of sessile organisms [1] and by contributing to nutrient turnover and productivity [2–3]. Biofilms generally have a high microbial diversity, which is maintained by exogenous [4] as well as endogenous [3] mechanisms. Exogenous drivers may consist of either a top-down control by predation or viral lysis of bacteria, which limits the dominance of certain species in the community and would allow for the co-existence of different species within the same niche, or a bottom-up control may consist of the wide variety of energy sources and substrates available in an ecosystem, which offer a large variety of niches for bacteria [4]. Endogenous mechanisms include interactions among microbial species, with dynamic exchanges of metabolites, which thereby further contribute to the formation of various ecological niches [3]. Although diversity is generally high, biofilm community structure can greatly vary with changes in environmental conditions [5–6], such as nutrient availability, temperature, salinity and light, which can moreover fluctuate over space and time [2], [7–9]. Nutrient availability was found to be one of the major factors affecting biofilm diversity and composition (reviewed by [2]), and to vary with seasons [7], [10] or with human impact, i.e. eutrophication [9], [11–12]. Higher nutrients generally cause a shift from autotrophic to heterotrophic and to sulphur reducing bacteria as a response to decreased light availability and increased load in organic material [9], [11], [13], while the overall biofilm diversity has been found to either remain unaffected [8], [14] or to increase [12], [15]. Those changes in the biofilm community may further affect the behaviour and success of larval settlement of sessile macroorgan- isms [16–19]. Conversely, macroorganisms reacting to environ- mental changes may modify their chemical composition and consequently affect their associated bacterial community [20–21]. Negri et al. [22] demonstrated that the algae encrusted substrate affected the overlying bacteria, which further influenced the settlement of coral larvae in laboratory experiments [22]. These studies demonstrate well the interactions between biofilm compo- sition and macrofouling, where initial biofilm formation influences PLoS ONE | www.plosone.org 1 July 2012 | Volume 7 | Issue 7 | e39951
-
Upload
independent -
Category
Documents
-
view
0 -
download
0
Transcript of Effects of Eutrophication, Seasonality and Macrofouling on the Diversity of Bacterial Biofilms in...
Effects of Eutrophication, Seasonality and Macrofoulingon the Diversity of Bacterial Biofilms in Equatorial CoralReefsYvonne Sawall1¤, Claudio Richter2, Alban Ramette3*
1 Leibniz Center for Tropical Marine Ecology, Bremen, Germany, 2 Alfred Wegener Institute for Polar and Marine Research, Bremerhaven, Germany, 3 HGF-MPG Group for
Deep Sea Ecology and Technology, Max Planck Institute for Marine Microbiology, Bremen, Germany
Abstract
Biofilms play an important role as a settlement cue for invertebrate larvae and significantly contribute to the nutrientturnover in aquatic ecosystems. Nevertheless, little is known about how biofilm community structure generally responds toenvironmental changes. This study aimed to identify patterns of bacterial dynamics in coral reef biofilms in response toassociated macrofouling community structure, microhabitat (exposed vs. sheltered), seasonality, and eutrophication.Settlement tiles were deployed at four reefs along a cross-shelf eutrophication gradient and were exchanged every 4months over 20 months. The fouling community composition on the tiles was recorded and the bacterial communitystructure was assessed with the community fingerprinting technique Automated Ribosomal Intergenic Spacer Analysis(ARISA). Bacterial operational taxonomic unit (OTU) number was higher on exposed tiles, where the fouling community washomogenous and algae-dominated, than in sheltered habitats, which were occupied by a variety of filter feeders.Furthermore, OTU number was also highest in eutrophied near-shore reefs, while seasonal variations in communitystructure were most pronounced in the oligotrophic mid-shelf reef. In contrast, the macrofouling community structure didnot change significantly with seasons. Changes in bacterial community patterns were mostly affected by microhabitat,seasonal and anthropogenically derived changes in nutrient availability, and to a lesser extent by changes in themacrofouling community structure. Path analysis revealed a complex interplay of various environmental and biologicalfactors explaining the spatial and temporal variations in bacterial biofilm communities under natural conditions.
Citation: Sawall Y, Richter C, Ramette A (2012) Effects of Eutrophication, Seasonality and Macrofouling on the Diversity of Bacterial Biofilms in Equatorial CoralReefs. PLoS ONE 7(7): e39951. doi:10.1371/journal.pone.0039951
Editor: Jack Anthony Gilbert, Argonne National Laboratory, United States of America
Received February 23, 2012; Accepted May 29, 2012; Published July 6, 2012
Copyright: � 2012 Sawall et al. This is an open-access article distributed under the terms of the Creative Commons Attribution License, which permitsunrestricted use, distribution, and reproduction in any medium, provided the original author and source are credited.
Funding: This study was funded by the German Federal Ministry of Education and Research (BMBF) under a bilateral German-Indonesian project (SPICE, grantnumber 03F0472A). Further support was given by the Bremen International Graduate School for Marine Sciences (GLOMAR) funded by the German ResearchFoundation (DFG). AR was supported by the Max Planck Society. The funders had no role in study design, data collection and analysis, decision to publish, orpreparation of the manuscript.
Competing Interests: The authors have declared that no competing interests exist.
* E-mail: [email protected]
¤ Current address: Research Unit Benthic Ecology, Helmholtz Center for Ocean Research (GEOMAR), Kiel, Germany
Introduction
Microbial biofilms play an important role in aquatic systems by
providing a conditioned surface for larval settlement and
metamorphosis of sessile organisms [1] and by contributing to
nutrient turnover and productivity [2–3]. Biofilms generally have a
high microbial diversity, which is maintained by exogenous [4] as
well as endogenous [3] mechanisms. Exogenous drivers may
consist of either a top-down control by predation or viral lysis of
bacteria, which limits the dominance of certain species in the
community and would allow for the co-existence of different
species within the same niche, or a bottom-up control may consist
of the wide variety of energy sources and substrates available in an
ecosystem, which offer a large variety of niches for bacteria [4].
Endogenous mechanisms include interactions among microbial
species, with dynamic exchanges of metabolites, which thereby
further contribute to the formation of various ecological niches [3].
Although diversity is generally high, biofilm community
structure can greatly vary with changes in environmental
conditions [5–6], such as nutrient availability, temperature, salinity
and light, which can moreover fluctuate over space and time [2],
[7–9]. Nutrient availability was found to be one of the major
factors affecting biofilm diversity and composition (reviewed by
[2]), and to vary with seasons [7], [10] or with human impact, i.e.
eutrophication [9], [11–12]. Higher nutrients generally cause a
shift from autotrophic to heterotrophic and to sulphur reducing
bacteria as a response to decreased light availability and increased
load in organic material [9], [11], [13], while the overall biofilm
diversity has been found to either remain unaffected [8], [14] or to
increase [12], [15].
Those changes in the biofilm community may further affect the
behaviour and success of larval settlement of sessile macroorgan-
isms [16–19]. Conversely, macroorganisms reacting to environ-
mental changes may modify their chemical composition and
consequently affect their associated bacterial community [20–21].
Negri et al. [22] demonstrated that the algae encrusted substrate
affected the overlying bacteria, which further influenced the
settlement of coral larvae in laboratory experiments [22]. These
studies demonstrate well the interactions between biofilm compo-
sition and macrofouling, where initial biofilm formation influences
PLoS ONE | www.plosone.org 1 July 2012 | Volume 7 | Issue 7 | e39951

the settlement of macroorganisms and the macroorganisms may in
turn affect biofilm formation (see also [23–24]). However, these
studies were all species-specific and so far did not consider
community level approaches so as to assess the interplay between
microbial and macrobial communities (assembly of fleshy and
calcareous algae, bryozoans, ascidicans, barnacles, spirorbid
worms, etc.). Furthermore, biofilm studies on hard substratum in
coral reefs are scarce. To the best of our knowledge, our study is
the first attempt to date to simultaneously address the interactions
of microbial biofilms and macrofouling communities in coral reefs
in response to spatio-temporal changes in the environment.
Understanding these dynamics is of increasing importance in the
context of anthropogenic water quality changes, which may
strongly affect the interplay of the two communities and
consequently the stability of the coral reef ecosystem.
Here, the diversity and dynamics of colonizing bacterial
communities were investigated on tiles, which were deployed so
as to create sheltered and exposed microhabitats in several coral
reefs of the Spermonde Archipelago, Indonesia, over 20 months
(Fig. 1). Spermonde is characterized by an eutrophication gradient
between nutrient-rich coastal and oligotrophic offshore waters and
by seasonal changes in nutrient input and turbidity mainly due to
variations in rain fall. The macrofouling community that settled on
the tiles was included in the analyses to examine its relationship
with biofilm diversity and dynamics. The following main questions
were addressed: (1) How much do eutrophication, geographic
location and seasonality affect bacterial diversity and community
structure? (2) How important is the presence and composition of
the macrofouling community for microbial dynamics in the
context of microhabitats, eutrophication and seasonality? (3) What
effects do microhabitats have on the bacterial community
structure? By disentangling the respective effects of space, season,
and environmental parameters by using a combination of
multivariate statistical tools, a community ecology approach was
applied to examine the principles underlying the assembly and
shifts of the microbial community and its reciprocal interactions
with the macrofouling communities in their natural environment.
Results
Spatial Variation in Benthic Community StructureThe benthic community at the near-shore reef (site LAE)
featured the lowest live coral cover (18.3%) and the highest
proportion of dead coral (25.2%) and other organisms (33.5%)
(Fig. 2A), especially soft corals (14.4%) and hydrozoans (9.1%)
(Table S1). The highest live coral cover was found in the mid-shelf
reefs (SAM: 52.5% and BBA: 48.4%), while off-shore LNK
featured a live coral of 31.9% and a high cover by sand (34.5%)
(Fig. 2A).
Seasonal and Spatial Variations in Water ParametersSeasonal fluctuations and spatial differences were reflected in
the water parameters (Fig. 2B), with highest Chl a concentrations
towards the end of the wet season (IV) at all sites, particularly in
near-shore LAE waters (1.5960.16 mg l21) (mean 6 SE) com-
pared to mid-shelf and off-shore reefs (1.060.08 to 1.17 mg l21) (in
LNK season IV, only one water sample was available). Highest
POC concentrations were also found in near-shore LAE at the end
of the wet season (IV) (236623 mg l21) and peaked in the same
season in off-shore LNK (137 mg l21). The mid-shelf reefs SAM
(127613 mg l21) and BBA (105612 mg l21) had a lower POC
peak, which occurred towards the end of the dry season (III)
(Fig. 2B). C/N ratios and DOC concentrations showed less
pronounced seasonal and spatial patterns with C/N ratios between
5.7 and 9.8 and DOC concentrations between 52.267.1 and
147.1 mM (Table S2).
Seasonal and Spatial Variations in the MacrofoulingCommunity on tiles
For a total of 246 samples from tile pairs that were examined
(not all tiles were available for recovery after the 4-months
deployments), pronounced differences between the macrofouling
community composition of the upper and lower sides were
significant (ANOSIM R = 0.819, p = 0.001; Table S3) with a
strong dominance of algae on the upper and of heterotrophs on
lower sides, throughout the sites and seasons (Fig. 2C; Fig. S1).
Spatial (site) effects were mainly found on the upper side
(ANOSIM, R = 0.696, p = 0.001) with a visible shift from
filamentous to crustose algae forms from the near- to off-shore
sites (Fig. 2C). In contrast to the strong differences found between
tile sides for the fouling community, no significant effects of water
parameters, location or season were evidenced using multiple
regression analyses (data not shown). These findings were
corroborated by path analysis, where the best model found did
not include a relationship between any of these factors and the
fouling community (Fig. 3B and C).
Seasonal and Spatial Variations in Bacterial OTU NumbersOn the 97 tile samples examined for bacterial diversity, a total
of 445 OTUs were detected, with 400 OTUs occurring on more
than 3 tiles. Overall, more OTUs were found on the upper side
(356 OTUs on .3 tiles) compared to the lower side of the tiles
(307 OTUs) (Fig. 2D), with 289 OTUs being shared between
upper and lower sides. Overall, 352 OTUs occurred at all sites at
least once within the 20-month period. Differences between the
upper and lower side of the tiles were most pronounced in near-
shore LAE and the overall OTU number was higher in the reefs
close to shore (LAE and SAM) compared to mid-shelf BBA and
off-shore LNK: The highest OTU number was found in near mid-
shelf SAM (dry season VI: 330 OTUs), followed by near-shore
LAE (wet season IV: 324 OTUs). The lowest OTU number was
found in mid-shelf BBA (transition period V: 95 OTUs), which
was also the site with highest seasonal variability, where OTU
numbers varied between 95 (transition period V) and 316 (dry
season VI) (Fig. 2D).
Factors Influencing Bacterial Community StructureVariation partitioning analysis was carried out to assess the
individual and combined effects of contextual parameters on
changes in bacterial community structure. Only data sets with
complete contextual parameters were retained, thus excluding
from the analyses, season VI in LAE, SAM and BBA, due to a lack
of water parameters. Noticeably, each factor had a significant
effect on the changes in bacterial community structure (Fig. S2),
namely tile position (p,0.001 using 1000 permutations), season
(p,0.001), site (p,0.001) and water parameter (p = 0.007), with
generally between 1 and 3% of explained variance by the pure
factor effects. Although the overall explained variance was rather
low (8%, p,0.001), no covariation between factors was detected,
indicating that no confounding effect was present among factors.
Yet, when evaluating more specific comparisons using pairwise
ANOSIM, the seasonal impact was found to greatly vary between
sites, with the highest impact mid-shelf (BBA: R = 0.312, p,0.001)
and lowest impact off-shore (LNK: R = 0.127, p,0.001). Further-
more, bacterial communities were most dissimilar during the wet
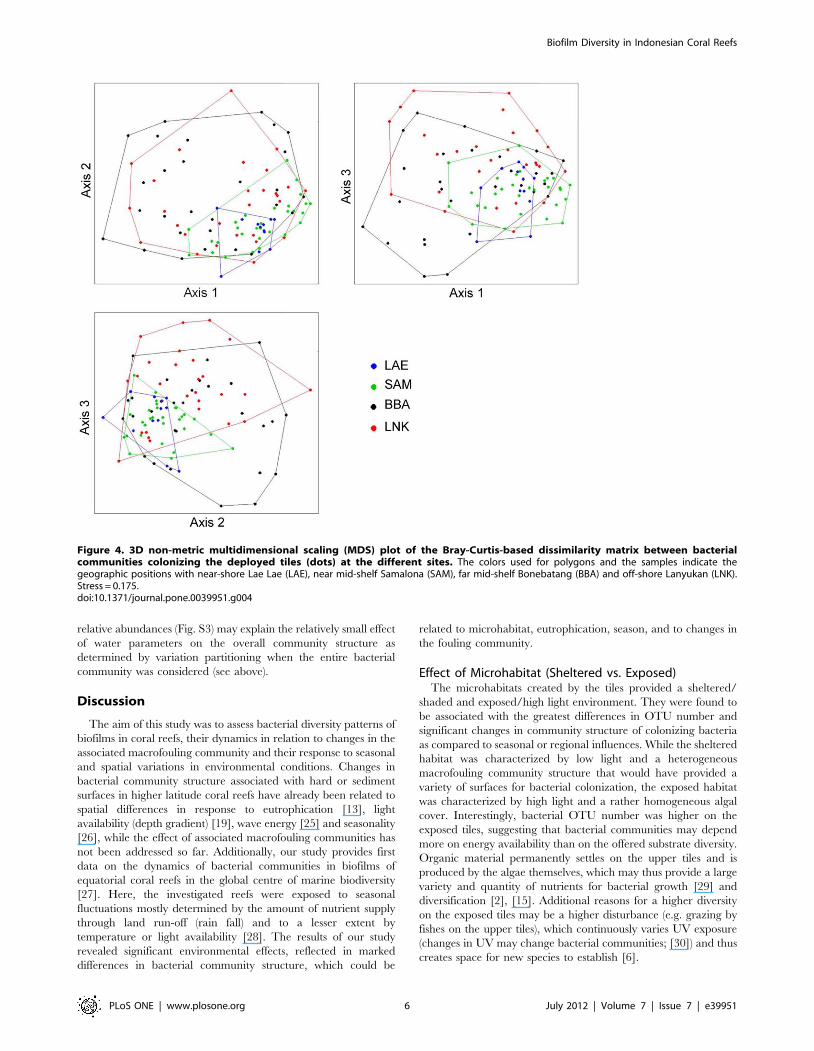
season across all sites (IV: R = 0.363, p,0.001). The most striking
finding was that bacterial community heterogeneity (as visualized
Biofilm Diversity in Indonesian Coral Reefs
PLoS ONE | www.plosone.org 2 July 2012 | Volume 7 | Issue 7 | e39951
by the spread of sample points within each site across seasons in
the MDS plot; Fig. 4) was inversely related to the degree of site
eutrophication, with the largest heterogeneity mid-shelf (BBA) and
lowest near-shore (LAE; Fig. 4).
Because a large number of samples is generally required to carry
out path analysis and, in our study the factor ‘‘tile position’’ was
nested into the factor ‘‘site’’, the finer distinction of upper and
lower tile positions was not further considered. Path analysis was
carried out to evaluate causal relationships between all factors (see
Materials and Methods), with the initial model representing the
most plausible relationships (Fig. 3A) as determined by our
previous analyses (multiple regression analyses; see above). This
resulted in a configuration (Bayesian Information Criterion [BIC],
a measure of model fit and complexity, of 218.85), in which
bacterial community structure was directly and mostly influenced
by the macrofouling community (path coefficient of 0.20),
environmental parameters (i.e. combined variation in particulate
organic matter [POM], C/N ratio, dissolved organic carbon
[DOC], and chlorophyll a [Chl a]; 0.19), location (0.19), and to a
lesser extent by the benthic community (0.14). Environmental
parameters were themselves mostly changing as a function of
seasons (0.53) and, to a lesser degree, as a function of distance from
shore (0.16).
After assessing the robustness of the initial configuration and
removing less significant relationships, two best fitting models were
found (BIC = 230.48 and 230.86, respectively): In Model 1
(Fig. 3B), water parameters were still largely influenced by
seasonality (0.54). Bacterial community structure was equally
influenced by the macrofouling community, the distance from
shore and water parameters (all coefficients about 0.21). Model 2
(Fig. 3C) differed from Model 1 by the reversion of the arrow from
bacterial community to macrofouling community (thus suggesting
that changes in bacterial communities are the ones leading to
subsequent changes in the fouling community), which resulted in a
slightly better model fit with an increased site/distance effect (0.23)
and a higher influence of the bacterial community on the
macrofouling community (0.25) than in Model 1 (0.21).
When performing variation partitioning at the individual OTU
level to detect those OTUs that significantly responded to each
contextual factor while taking the other factors into consideration,
water parameters explained in general more of the variation (14%)
than the other two factors (Fig. 5). Yet, those OTUs represented a
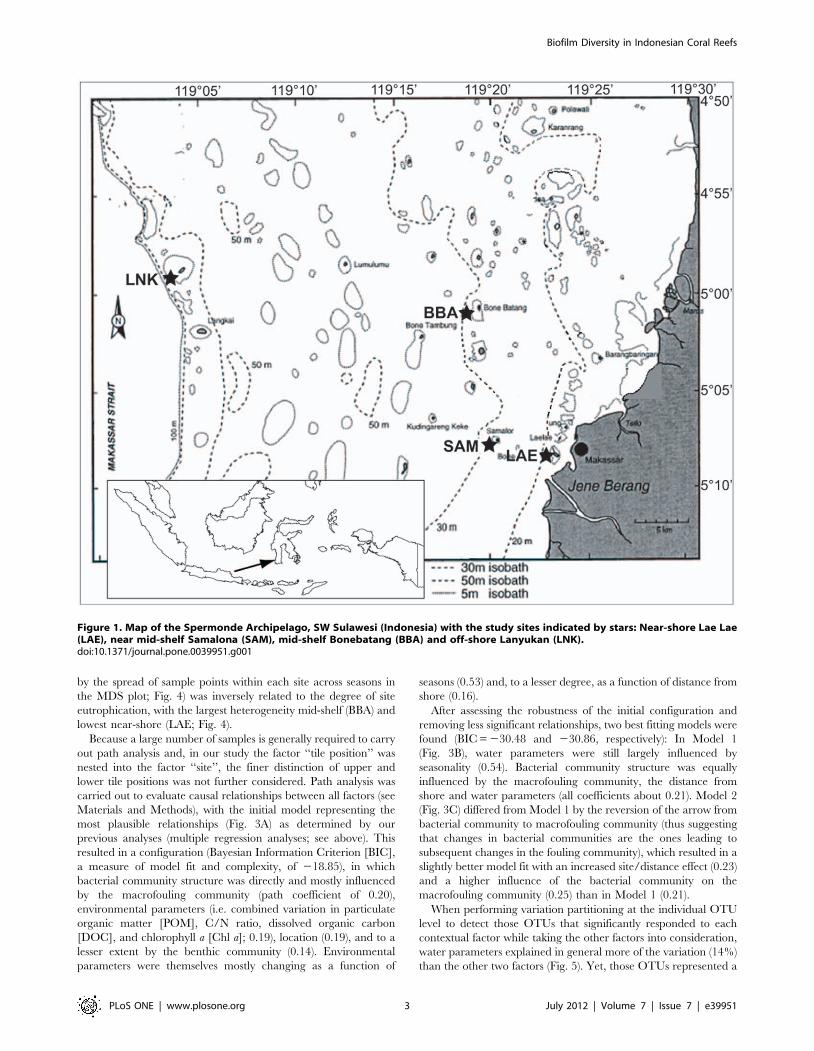
Figure 1. Map of the Spermonde Archipelago, SW Sulawesi (Indonesia) with the study sites indicated by stars: Near-shore Lae Lae(LAE), near mid-shelf Samalona (SAM), mid-shelf Bonebatang (BBA) and off-shore Lanyukan (LNK).doi:10.1371/journal.pone.0039951.g001
Biofilm Diversity in Indonesian Coral Reefs
PLoS ONE | www.plosone.org 3 July 2012 | Volume 7 | Issue 7 | e39951
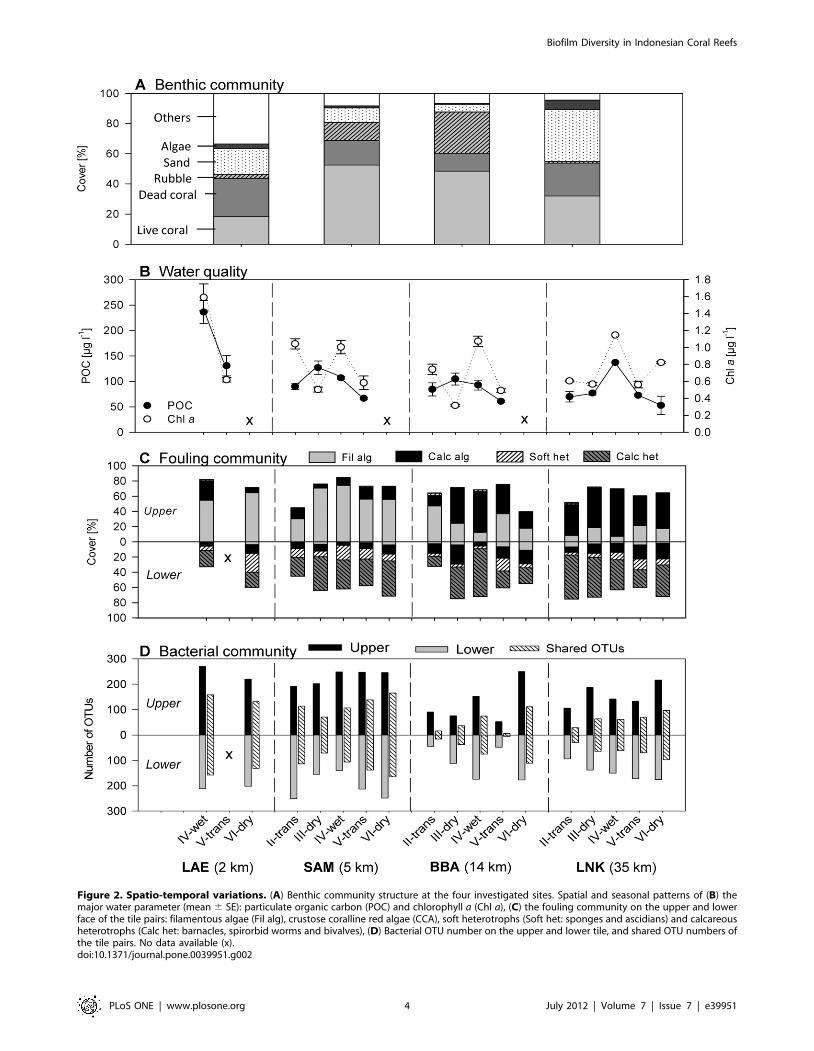
Figure 2. Spatio-temporal variations. (A) Benthic community structure at the four investigated sites. Spatial and seasonal patterns of (B) themajor water parameter (mean 6 SE): particulate organic carbon (POC) and chlorophyll a (Chl a), (C) the fouling community on the upper and lowerface of the tile pairs: filamentous algae (Fil alg), crustose coralline red algae (CCA), soft heterotrophs (Soft het: sponges and ascidians) and calcareousheterotrophs (Calc het: barnacles, spirorbid worms and bivalves), (D) Bacterial OTU number on the upper and lower tile, and shared OTU numbers ofthe tile pairs. No data available (x).doi:10.1371/journal.pone.0039951.g002
Biofilm Diversity in Indonesian Coral Reefs
PLoS ONE | www.plosone.org 4 July 2012 | Volume 7 | Issue 7 | e39951

relatively small fraction with 6.6% (29 OTUs) of the whole dataset
as compared to the number of OTUs whose variations were purely
explained by the two other factors (Fig. 5). Furthermore,
environmentally, spatially or temporally controlled OTUs in the
dataset were not necessarily the more abundant ones (as measured
in relative fluorescence units) in general (Fig. S3). Although the
effect of varying water parameters was most significant on certain
OTUs, their small number (Fig. 5) associated with small to average
Figure 3. Results of path analysis including the initial (A), and final model 1 (B) and model 2 (C). In the final model 1 the path is directedfrom the fouling to the bacterial community (B) and in final model 2 from the bacterial to the fouling community (C). The significance value for theChi-square test is given, assessing whether the model is significantly different from the corresponding correlation matrix. The Bayesian InformationCriterion (BIC) is a measure of the goodness-of-fit and is minimized to obtain a better model fit. Numbers on each arrow indicate partial correlationcoefficients associated with each causal relationship, and arrow thickness is also proportional to the partial correlation value.doi:10.1371/journal.pone.0039951.g003
Biofilm Diversity in Indonesian Coral Reefs
PLoS ONE | www.plosone.org 5 July 2012 | Volume 7 | Issue 7 | e39951
relative abundances (Fig. S3) may explain the relatively small effect
of water parameters on the overall community structure as
determined by variation partitioning when the entire bacterial
community was considered (see above).
Discussion
The aim of this study was to assess bacterial diversity patterns of
biofilms in coral reefs, their dynamics in relation to changes in the
associated macrofouling community and their response to seasonal
and spatial variations in environmental conditions. Changes in
bacterial community structure associated with hard or sediment
surfaces in higher latitude coral reefs have already been related to
spatial differences in response to eutrophication [13], light
availability (depth gradient) [19], wave energy [25] and seasonality
[26], while the effect of associated macrofouling communities has
not been addressed so far. Additionally, our study provides first
data on the dynamics of bacterial communities in biofilms of
equatorial coral reefs in the global centre of marine biodiversity
[27]. Here, the investigated reefs were exposed to seasonal
fluctuations mostly determined by the amount of nutrient supply
through land run-off (rain fall) and to a lesser extent by
temperature or light availability [28]. The results of our study
revealed significant environmental effects, reflected in marked
differences in bacterial community structure, which could be
related to microhabitat, eutrophication, season, and to changes in
the fouling community.
Effect of Microhabitat (Sheltered vs. Exposed)The microhabitats created by the tiles provided a sheltered/
shaded and exposed/high light environment. They were found to
be associated with the greatest differences in OTU number and
significant changes in community structure of colonizing bacteria
as compared to seasonal or regional influences. While the sheltered
habitat was characterized by low light and a heterogeneous
macrofouling community structure that would have provided a
variety of surfaces for bacterial colonization, the exposed habitat
was characterized by high light and a rather homogeneous algal
cover. Interestingly, bacterial OTU number was higher on the
exposed tiles, suggesting that bacterial communities may depend
more on energy availability than on the offered substrate diversity.
Organic material permanently settles on the upper tiles and is
produced by the algae themselves, which may thus provide a large
variety and quantity of nutrients for bacterial growth [29] and
diversification [2], [15]. Additional reasons for a higher diversity
on the exposed tiles may be a higher disturbance (e.g. grazing by
fishes on the upper tiles), which continuously varies UV exposure
(changes in UV may change bacterial communities; [30]) and thus
creates space for new species to establish [6].
Figure 4. 3D non-metric multidimensional scaling (MDS) plot of the Bray-Curtis-based dissimilarity matrix between bacterialcommunities colonizing the deployed tiles (dots) at the different sites. The colors used for polygons and the samples indicate thegeographic positions with near-shore Lae Lae (LAE), near mid-shelf Samalona (SAM), far mid-shelf Bonebatang (BBA) and off-shore Lanyukan (LNK).Stress = 0.175.doi:10.1371/journal.pone.0039951.g004
Biofilm Diversity in Indonesian Coral Reefs
PLoS ONE | www.plosone.org 6 July 2012 | Volume 7 | Issue 7 | e39951

Although the high densities of cryptic filter-feeders are also
known to harness significant amounts of organic material on both,
artificial [31] and natural reef surfaces [32], thus potentially
enriching this microhabitat, the reduced photosynthesis and lack
of sedimentation may have reduced the overall supply of organic
material to the microbial communities. In addition, the potentially
antibacterial activity of the diverse secondary metabolites
produced by macrofouling organisms (e.g. [20], [33–34]) may
have contributed to the lower OTU numbers on the lower side of
the tiles.
Effect of EutrophicationThe eutrophication gradient was clearly evidenced in the
macrofouling community structure by a shift from filamentous to
crustose algae, which was previously described as an indicator for
eutrophication [35–36]. Also the benthic community structure
revealed strong signs of eutrophication and pollution in the most
near-shore reef by a shift from hard corals to soft heterotrophic
filter-feeding organisms [37]. However, the eutrophication gradi-
ent was less evidenced by the measured water parameters,
although POC and Chl a have been found to be useful indicators
in this area [38], most likely due to the localized and discontinuous
nature of the water sampling campaign in this study.
Along the decreasing eutrophication gradient, bacterial com-
munities were characterized by decreasing OTU numbers
(Fig. 2D), but by increasing bacterial community heterogeneity
(i.e. beta diversity; Fig. 4). Higher local bacterial diversity might be
obtained in accordance to the energy-diversity relationships (e.g.
[39–40]), which would favour high diversity under higher nutrient
availability in near-shore reefs. This explanation would be further
supported by our observations at the microhabitat level, where the
bacterial community on the upper tiles experienced a stronger
effect of eutrophication, since they harbour dense filamentous
algae carpets that may serve as effective traps for sediment,
particulate organic matter and associated pollutants in near-shore
reefs.
The more similar community structure obtained in the
eutrophied areas would be supported by previous observations of
wider range of energy sources available in human impacted areas,
which allow for more similar species to co-exist and for the
selection of bacterial species that are generally more robust against
the higher load of pollutants and toxins in eutrophied environ-
ments [15]. At the less impacted sites, the opposite processes would
then be true, with less impact on local richness but more on the
variation in community structure. From a technical viewpoint, it
should also be noted that ARISA fingerprinting may not
necessarily provide an accurate depiction of bacterial species
richness, because e.g. the discrimination between bacterial types is
based on ITS sequence length and ribosomal operon copy number
may vary across microbial genomes [41], which would overall
result in overestimating OTU number. Shifts in community
structure based on ARISA community fingerprinting are yet useful
to infer changes in diversity across samples and are generally in
good agreement with patterns obtained by sequencing-based
approaches of ribosomal genes (e.g. [26], [42–43]).
Changes in water quality can be crucial for some bacterial
species and hence may limit their distribution. This seemed to be
the case for 29 OTUs, which change in relative abundance and
distribution was purely due to water parameters, regardless of
variation in geographic location or seasons (Fig. 5). Such
behaviour has been previously related to that of specialist species,
while species purely affected by location and not by environmental
conditions or seasonal fluctuations were considered generalist [44].
Here we followed this classification but, in addition, propose to
also classify as generalists OTUs that were found at least once at
each site regardless of season, tile side, or environmental
conditions (n = 267 OTUs, from which 61 were already consid-
ered in the OTU numbers reported in Fig. 5). Due to limitations in
detecting rarer OTUs, it should be mentioned that OTUs only
found at a site may in fact have broader distribution range in the
environment.
Effect of SeasonalitySeasonality was clearly reflected in the variation of water
parameters, bacterial community structure, but only weakly in
changes of the fouling community. The OTU composition in mid-
shelf reefs (SAM and BBA) revealed a pronounced seasonality,
while the near- and off-shore reefs (LAE and LNK) featured a
lower seasonality. This suggests a lower dependency of the
bacterial community on substrate availability (i.e. fouling commu-
nity), but rather a dependency on nutritional load. To explain
those observations, we may thus propose the following scenario: At
near-shore LAE, chronically high nutrient supply selects for
specific bacterial community structure throughout the year. At
near mid-shelf SAM, OTU numbers were high throughout the
seasons and community structure was variable. This may be
explained by a nutrient supply, which is comparatively high but
still variable in its composition throughout the year, entailing
variations in community structure. The oligotrophic mid-shelf
BBA was associated with the largest differences in OTU number
and community structure. Low OTU numbers were evidenced
during the most nutrient-depleted period that occurs at the end of
the transition period from wet to dry season, while tiles sampled in
the dry season experienced occasional impacts of land run-off
(rainfall) at the end of the season, which increased nutrient load
levels and OTU number. At off-shore LNK, other oceanic factors
(e.g. currents, upwelling) weakened the effects of monsoon related
Figure 5. Detecting specialists vs. generalist OTUs by variationpartitioning for individual OTUs. The numbers in italics indicateOTU numbers (percentage of the total of 437 OTUs), which variation inrelative abundance was purely explained by the corresponding factoron the x-axis as determined by multivariate partial regression analyses,while taking all other factors into account. Different letters indicatesignificantly different means at p,0.05 (Welch two-sample t-test).doi:10.1371/journal.pone.0039951.g005
Biofilm Diversity in Indonesian Coral Reefs
PLoS ONE | www.plosone.org 7 July 2012 | Volume 7 | Issue 7 | e39951
variability in nutrient supply (e.g. land run-off) that normally
dominate on the shelf.
Although each factor was found to significantly affect changes in
community structure when all parameters were included in the
analyses, the overall low amount of explained community variation
(variation partitioning) found in our study may be typical of classical
community ecology studies (e.g. [45–46]). This is also consistent with
the idea that environmental variables significantly explaining
variation in community structure should be taken as putative
ecological scenarios rather than as true reconstruction of the sources
of variation under complex natural conditions.
Relationships between Bacterial and MacrofoulingCommunities
Numerous studies have demonstrated the effects of biofilms on
larval settlement by revealing large variations in species-specific
responses and sensitivities (reviewed by [1]). A strong interplay
between biofilm compositions and macrofouling has been
suggested, with reciprocal effects between the biofilm community
and settling macroorganisms [22–24]. Such reciprocal interactions
between the two communities were also detected in our study by
the path analysis approach, further justifying the use of comple-
mentary multivariate statistical approaches. However, the depen-
dence was rather of weak magnitude due to differential responses
of the two communities to external changes. Indeed, eutrophica-
tion clearly affected both macrofouling and bacterial communities,
while seasonal fluctuations in environmental parameters only
affected bacterial community structure, but hardly the macrofoul-
ing community structure.
Although we cannot exclude that the characterization of the two
communities at different levels of taxonomic resolution might have
masked some patterns of community covariation, the following
reasons may most likely explain the low dependence: First,
microorganisms may be expected to have much shorter generation
times and larger population sizes than macroorganisms, which
lead to much higher dynamics in bacterial than in macrofouling
communities in response to environmental changes. Second, after
4 months of tile deployment, bacterial populations would have
established their own microenvironments [2–3], which might have
sheltered them from subsequent changes in the macrofouling
community. The same may be valid for the macrofouling
community, which also reaches an advanced state of succession
after 4 months [47], allowing a certain independence from surface
conditioning. Third, the bioactivity of secondary metabolites of the
macrofouling community changes with seasons and this may affect
microbial communities [48], while the macrofouling community
structure may itself remain mostly unchanged.
In conclusion, this study identified bacterial patterns in biofilms of
equatorial coral reefs and the likely factors that significantly affect
them, be they variations in microhabitat, eutrophication level,
seasonality or co-occurring macrofouling community. The complex
interplay of all those factors was disentangled and resulted in new
hypotheses: Not only nutrient availability and its seasonal fluctua-
tions, but also the specific locations and degree of exposure, may be
key parameters that shape bacterial community structure, diversity
and ultimately functions. Because all factors had significant, yet
modest contributions, other yet-unknown factors may also be at play
in the study area and would need to be identified in the future (e.g.
succession, secondary metabolites, other environmental parame-
ters), as well as the impact of inter- and intra-species interactions
within each of the investigated communities.
Materials and Methods
Study Sites and Sampling DesignFour reefs were sampled along a cross-shelf transect in the
Spermonde Archipelago, Sulawesi (Indonesia) (Fig. 1), situated at
the core of the Coral Triangle, the center of global marine
biodiversity [49]. The archipelago consists of more than 100 small
islands situated on a 40-km wide carbonate shelf surrounded by
coral reefs. Due to environmental and ecological variability across
the shelf, the archipelago has been divided into different ecological
zones running parallel to the coast line [28], [50]. The near-shore
zone, which includes the study site Lae Lae (LAE, 2 km distance
from shore), is most strongly impacted by land run-off discharging
waste water, fertilizers and sediments from the 1.5 million people
harbor city Makassar and surroundings [28], [37]. This highly
eutrophied, sediment loaded and polluted zone features the lowest
diversity in various benthic reef taxa [51]. The mid-shelf zone
includes the study sites Samalona (SAM, 5 km) and Bonebatang
(BBA, 14 km). While SAM is still influenced by land run-off during
the rainy season [28], BBA is situated in an oligotrophic
environment beyond the reach of river plumes and features the
highest diversity of corals [50] and other benthic reef taxa [51] in
Spermonde Archipelago. The 4th study site Lanyukan (LNK,
35 km) is situated on the off-shore edge of the Spermonde shelf
bordering the deep Makassar Strait. Oceanic waters with
moderate upwelling of nutrients [52–53] contribute to the lush
development of coral reefs with intermediate levels of biodiversity
[50].
The wet NW monsoon prevails from November to February
(peak of rainfall: January, 730 mm month21) and the dry SE
monsoon from June to September (lowest rainfall: August, 15 mm
month21) (World Meteorological Organization). In this study,
three seasons were considered, wet season (wet), transition from
wet to dry season (trans) and dry season (dry), and consecutively
labeled from II to VI: II (trans): March to June 2008; III (dry): July
to October 2008; IV (wet): November 2008 to February 2009), V
(trans): March to June 2009; VI (dry): July to October 2009.
Settlement tiles were deployed at 16 locations along the reef
edge at about 3 m water depth, depth at which the highest live
coral cover and reef diversity in the area are found [50]. A pair
consisted of two terracotta tiles (15615 cm) connected in the
middle by a stainless steel bolt with unglazed sides facing outwards.
The tile pairs were fixed on dead coral boulders in an angle of
about 45u resulting in one upper (exposed) and one lower
(sheltered) side. They were exchanged every 4 months between
seasons. Sampling was performed underwater, while 3 pairs of tiles
were chosen randomly and a small piece of each upper and lower
tile was carefully broken and individually placed in small zip-lock
bags. They were kept cool (max. 2 h) and subsequently frozen
(220uC) until microbial investigations were performed. The rest of
the tiles and the remaining tiles were dried in the sun for the
examination of the macrofouling community.
Description of Macrofouling CommunityUpper and lower sides of all tile pairs were inspected under a
dissecting microscope. The following taxa of macrofouling
community were distinguished: Filamentous algae, crustose
coralline red algae, bryozoans, sponges, ascidians, barnacles,
spirorbid worms and bivalves. The percentage cover of each taxon
was recorded based on the visual estimation of total coverage of
the upper or lower tile surface, respectively.
Biofilm Diversity in Indonesian Coral Reefs
PLoS ONE | www.plosone.org 8 July 2012 | Volume 7 | Issue 7 | e39951
Description of Benthic Community Composition of theReefs
A 60-m line-intercept transect was conducted at each site along
the reef edge in order to assess the benthic community
composition of the reef [54]. A measuring tape was laid out along
the transect and the underlying substrate was recorded on a cm-
scale. The following categories were applied and calculated in
percentage contribution: live coral (LC), dead coral (DC; .15 cm
in diameter), coral rubble (RB; ,15 cm), sand (SA), macroalgae
(ALG) and others (OT), which included soft coral, sponge,
anemone, ascidians and hydrozoans.
Water ParametersWater samples (n = 3) were taken with a 5-l Niskin bottle at the
time of tile exchange at all sites. From each water sample, a 1-l
subsample was filtered through a GF/F filter for chlorophyll a (Chl
a) measurement and two 1-l subsamples were filtered through a
pre-combusted and pre-weighed GF/F filter for analyses of total
nitrogen and organic carbon of the particulate matter (particulate
organic carbon: POC), respectively. Filters were stored at 220uC.
A 10-ml sample of each filtrate was filled into a glass ampoule,
acidified with H3PO4 (pH,2.0) and flame sealed for dissolved
organic carbon (DOC) analyses. Chl a was extracted from the filter
with 90% acetone over 24 h at 4uC, the sample was centrifuged
(4000 rcf, 5 min) and measured fluorometrically (10-AU Fluo-
rometer, Turner Design, CA) in a glass cuvette at an emission
wavelength of 668 nm and an extinction wave length of 430 nm
[55]. Calibration was carried out with a Chl a standard (Fluka,
Sigma-Aldrich, Switzerland). Nitrogen and POC concentrations
were measured with an elemental analyzer (NA2100 Protein,
calibrated with CHNS standard [LECO]), while the filters for
POC were acidified with 1 N HCl and dried prior analyses to
remove the inorganic carbon. The C/N ratio was calculated by
dividing the POC with the nitrogen value. DOC was measured via
the combustion method with a total organic carbon analyzer
(TOC-VCPH, Shimadzu) using low carbon and deep sea water
standards (Hansell, RSMAS, Univ. of Miami).
DNA Extraction and Automated rRNA Intergenic SpacerAnalysis (ARISA)
An area of 2.25 cm2 (1.561.5 cm) on each tile was scraped with
a scalpel. Microorganisms were suspended in 0.8 ml sodium
phosphate buffer (120 mM, pH 8.0) and the suspension shaken
(300 rpm, 10 min) and filtered through a 1.2 mm glass fiber filter
(Type APFC, Millipore) to remove protists and eukaryotic cells
[25], [56]. The filtrate was used for DNA extraction with the
UltraClean soil DNA isolation kit (MoBio Laboratories, Inc.,
Carlsbad, CA, USA). Changes in the bacterial community
structure were determined by ARISA [41] and ARISA-PCR were
conducted in triplicates after the standard protocol described
previously [57]. Briefly, 50-ml reactions were conducted with the
universal primers ITSF (59-GTCGTAACAAGGTAGCCGTA-39)
and eubacterial ITSReub (59-GCCAAGGCATCCACC-39), the
latter being labeled with the phosphoramidite dye HEX
(Biomers.net, Ulm, Germany). PCR cycling conditions consisted
of an initial denaturation at 94uC for 3 min, followed by 30 cycles
of 94uC for 45 s, 55uC for 45 s, 72uC for 30 s, and a final
extension of 72uC for 5 min. PCR products were purified with
Sephadex G-50 Superfine (Sigma-Aldrich, Germany) and the
DNA concentrations were determined photometrically (Infinite
200 NanoQuant, Tecan). 100 ng of sample DNA were added to a
separation cocktail containing 0.5 ml of internal size standard Map
Marker 1000 Rox (50–1000 bp) (BioVentures, Inc., Washington
D.C., USA) and 14.5 ml of deionized Hi-Di formamide (Applied
Biosystems, Foster City, CA, USA) [57].
The amplified fragments were discriminated by capillary
electrophoresis (Applied Biosystems, Foster City, CA). ARISA
profiles were analyzed using the GeneMapper Software v3.7
(Applied Biosystems) and operational taxonomic units (OTUs)
were identified for peaks with a minimum of 50 fluorescence units
and OTU sizes between 100 and 1,000 bp. The GeneMapper
output tables were further subjected to a ‘‘fixed window’’ binning
strategy with a bin size of 2 bp [56–57]
Statistical AnalysesGeneral patterns in changes in bacterial and macrofouling
communities considering sites, seasons and tile position were
visualized by non-metric multidimensional scaling (MDS) ordina-
tion based on the Bray-Curtis dissimilarity matrix between
samples. Analysis of Similarity (ANOSIM) was used to confirm
the significance (p,0.05) of the community differences between
groups of samples. The alpha criterion for significance was
corrected for multiple pairwise comparisons using the Bonferroni
correction criterion (see [58–59]). MDS and ANOSIM were
performed with the multivariate statistic software PRIMER v6.
Prior to performing further multivariate analyses, a consensus
community profile was obtained for each sample by merging the
triplicate PCR and by considering an OTU present if it appeared
at least twice among the triplicates [57]. The merged table was
Hellinger transformed to minimize the effects of the strongly left
skewed distribution curve [60].
The specific effects of the main factors (distance from shore,
season, tile position, water parameters, macrofouling communi-
ty, benthic cover) and their co-variations on bacterial commu-
nity structure were disentangled using ‘‘variation partitioning’’
and further explored in the deterministic modeling framework
‘‘path analysis’’ [61]. The effects of the overall model as well as
those of each specific factor in variation partitioning were
determined by simple and partial multivariate regression
approaches and by testing their significance using 1000 Monte
Carlo permutation tests. Those tests were carried out on with
the statistical platform R (http://cran.r-project.org/) using the
vegan package. Path analysis assesses the likelihood of different
ecological scenarios (i.e. path models), which are represented by
a network of dependencies between factors and/or variables,
when confronted to the actual correlation structure of the data
at hand [61]. Multivariate correlations between matrices were
determined using the RV coefficient [62] applied to standard-
ized data matrices, using the R package FactoMineR. The
adequacy between the overall causal model and the original
correlation matrix was assessed by Chi-square test, in which the
p-value should not be significant, because the proposed model
should be in good agreement with the data at hand and not
reject it. The Bayesian Information Criterion (BIC, [63]) that
measures model fit and complexity (i.e. a lower BIC value
indicates a better fit of the model) was also used to evaluate
model’s fit. The individual path coefficients (i.e. partial
regression coefficients) that indicate the strength of the relation
between causal and response variables and the fit of the overall
path model were evaluated using the R package sem.
Supporting Information
Figure S1 Non-metric multidimensional scaling (MDS)of the fouling communities colonizing the deployed tilesat the different sites: near-shore Lae Lae (LAE), nearmid-shelf Samalona (SAM), far mid-shelf Bonebatang
Biofilm Diversity in Indonesian Coral Reefs
PLoS ONE | www.plosone.org 9 July 2012 | Volume 7 | Issue 7 | e39951
(BBA) and off-shore Lanyukan (LNK). The colors indicate
the different seasons: transition period (trans: II & V), dry season
(dry: III & VI) and wet season (wet: IV) on the upper (cross and
star symbols) and lower tiles (filled symbols).
(TIF)
Figure S2 Non-metric multidimensional scaling (MDS)of the bacterial communities colonizing the deployedtiles at the different sites: near-shore Lae Lae (LAE),near mid-shelf Samalona (SAM), far mid-shelf Bone-batang (BBA) and off-shore Lanyukan (LNK). The colors
indicate the different seasons: transition period (trans: II & V), dry
season (dry: III & VI) and wet season (wet: IV) on the upper (cross
and star symbols) and lower tiles (filled symbols).
(TIF)
Figure S3 Abundance of OTUs, which are purelyexplained by the water parameters (red), the location(green) and by the seasons (blue). The x axis represents the
sum of relative fluorescence intensity for each OTU across all
samples (i.e. its dominance in the dataset), while the y axis
measures the frequency of each dominance class.
(TIF)
Table S1 Composition of the benthic community at the different
sites.
(DOC)
Table S2 Water parameter at the different sites and during the
different seasons.
(DOC)
Table S3 Results of Analysis of Similarity (ANOSIM) repre-
senting the spatial and seasonal patterns of the bacterial and
fouling community.
(DOC)
Acknowledgments
We are grateful to S. Menger and C. Bienhold (both MPI Bremen) for their
input and assistance in the laboratory, as well as to the director Dr.
Jamaluddin Jompa and students of our cooperation partner in Indonesia
(CCRR, Hasanuddin University) for assistance in the field.
Author Contributions
Conceived and designed the experiments: YS CR. Performed the
experiments: YS. Analyzed the data: YS AR. Contributed reagents/
materials/analysis tools: YS CR AR. Wrote the paper: YS CR AR.
References
1. Wieczorek SW, Todd CD (1998) Inhibition and facilitation of settlement of
epifaunal marine invertebrate larvae by microbial biofilm cues. Biofouling 12:81–118.
2. Costerton JW, Lewandowski Z, Caldwell DE, Korber DR, Lappin-Scott HM(1995) Microbial biofilms. Annu Rev Microbiol 49: 711–745.
3. Poltak SR, Cooper VS (2011) Ecological succession in long-term experimentallyevolved biofilms produces synergistic communities. ISME J 5: 369–378.
4. Torsvik V, Ovreas L, Thingstad TF (2002) Prokaryotic diversity - Magnitude,dynamics and controlling factors. Science 296: 1064–1066.
5. Hall-Stoodley L, Costerton JW, Stoodley P (2004) Bacterial biofilms: from thenatural environment to infectious diseases. Nat Rev Micro 2: 95–108.
6. Qian PY, Dahms HU (2009) A Triangle Model: environmental changes affectbiofilms that affect larval settlement. In: Flemming H-C, Murthy PS, Venkatesan
R, Cooksey K, Qian PY, et al., editors. Marine and industrial biofouling. Vol 4.
Berlin: Springer. 315–328.
7. Lau SCK, Thiyagarajan V, Cheung SCK, Qian P-Y (2005) Roles of bacterial
community composition in biofilms as a mediator for larval settlement of threemarine invertebrates. Aquat Microb Ecol 38: 41–51.
8. Moss JA, Nocker A, Lepo JE, Snyder RA (2006) Stability and change inestuarine biofilm bacterial community diversity. Appl Environ Microbiol 72:
5679–5688.
9. Webster NS, Negri AP (2006) Site-specific variation in Antarctic marine biofilms
established on artificial surfaces. Environ Microbiol 8: 1177–1190.
10. Claret C, Marmonier P, Bravard J-P (1998) Seasonal dynamics of nutrient and
biofilm in interstitial habitats of two contrasting riffles in a regulated large river.Aquatic Sciences - Research Across Boundaries 60: 33–55.
11. Meyer-Reil L-A, Koster M (2000) Eutrophication of marine waters: effects onbenthic microbial communities. Mar Pollut Bull 41: 255–263.
12. Nocker A, Lepo JE, Snyder RA (2004) Influence of an oyster reef ondevelopment of the microbial heterotrophic community of an estuarine biofilm.
Appl Environ Microbiol 70: 6834–6845.
13. Uthicke S, McGuire K (2007) Bacterial communities in Great Barrier Reef
calcareous sediments: Contrasting 16S rDNA libraries from nearshore and outershelf reefs. Estuar Coast Shelf Sci 72: 188–200.
14. Pringault O, Duran R, Jacquet S, Torreton J-P (2008) Temporal variations ofmicrobial activity and diversity in marine tropical sediments (New Caledonia
Lagoon). Microb Ecol 55: 247–258.
15. Ford TE (2000) Response of marine microbial communities to anthropogenic
stress. J Aquat Ecosyst Stress Recovery 7: 75–89.
16. Hung OS, Thiyagarajan V, Wu RSS, Qian PY (2005) Effect of ultraviolet
radiation on biofilms and subsequent larval settlement of Hydroides elegans. Mar
Ecol Prog Ser 304: 155–166.
17. Jin T, Qian PY (2005) Amino acid exposure modulates the bioactivity of biofilms
for larval settlement of Hydroides elegans by altering bacterial communitycomponents. Mar Ecol Prog Ser 297: 169–179.
18. Huang Y-L, Dobretsov S, Xiong H, Qian P-Y (2007) Effect of biofilm formationby Pseudoalteromonas spongiae on induction of larval settlement of the polychaete
Hydroides elegans. Appl Environ Microbiol 73: 6284–6288.
19. Webster NS, Smith LD, Heyward AJ, Watts JEM, Webb RI, et al. (2004)
Metamorphosis of a scleractinian coral in response to microbial biofilms. ApplEnviron Microbiol 70: 1213–1221.
20. Armstrong E, Yan L, Boyd KG, Wright PC, Burgess JG (2001) The symbiotic
role of marine microbes on living surfaces. Hydrobiologia 461: 37–40.
21. Ainsworth TD, Thurber RV, Gates RD (2010) The future of coral reefs: a
microbial perspective. Trends Ecol Evol 25: 233–240.
22. Negri AP, Webster NS, Hill RT, Heyward AJ (2001) Metamorphosis of
broadcast spawning corals in response to bacteria isolated from crustose algae.Mar Ecol Prog Ser 223: 121–131.
23. Walls JT, Ritz DA, Blackman AJ (1993) Fouling, surface bacteria andantibacterial agents of four bryozoan species found in Tasmania, Australia.
J Exp Mar Biol Ecol 169:1–13.
24. Gillan DC, Speksnijder AGCL, Zwart G, De Ridder C (1998) Genetic diversity
of the biofilm covering Montacuta ferruginosa (Mollusca, Bivalvia) as evaluated by
denaturing gradient gel electrophoresis analysis and cloning of PCR-amplifiedgene fragments coding for 16S rRNA. Appl Environ Microbiol 64: 3464–3472.
25. Hewson I, Fuhrman JA (2006b) Spatial and vertical biogeography of coral reefsediment bacterial and diazotroph communities. Mar Ecol Prog Ser 306: 79–86.
26. Schottner S, Pfitzner B, Grunke S, Rasheed M, Wild C, et al. (2011) Drivers ofbacterial diversity dynamics in permeable carbonate and silicate coral reef sands
from the Red Sea. Environm Microbiol 13: 1815–1826.
27. Roberts CM, McClean CJ, Veron JEN, Hawkins JP, Allen GR, et al. (2002)
Marine biodiversity hotspots and conservation priorities for tropical reefs.Science 295: 1280–1284.
28. Renema W, Troelstra SR (2001) Larger foraminifera distribution on amesotrophic carbonate shelf in SW Sulawesi (Indonesia). Palaeogeogr Palaeo-
climatol Palaeoecol 175: 125–146.
29. Cole JJ (1982) Interactions between bacteria and algae in aquatic ecosystems.
Annu Rev Ecol Syst 13: 291–314.
30. Elasri MO, Miller RV (1999) Study of the response of a biofilm bacterial
community to UV radiation. Appl Environm Microbiol 65: 2025–2031.
31. Buss LW, Jackson JBC (1981) Planktonic food availability and suspension-feeder
abundance: evidence of in situ depletion. J Exp Mar Biol Ecol 49: 151–161.
32. Richter C, Wunsch M, Rasheed M, Kotter I, Badran MI (2001) Endoscopic
exploration of Red Sea coral reefs reveals dense populations of cavity-dwellingsponges. Nature 413: 726–730.
33. Al-Ogily SM, Knight-Jones EW (1977) Anti-fouling role of antibiotics producedby marine algae and bryozoans. Nature 265: 728–729.
34. Slattery M, McClintock JB, Heine JN (1995) Chemical defenses in Antarctic softcorals: evidence for antifouling compounds. J Exp Mar Biol Ecol 190: 61–77.
35. Delgado O, Lapointe BE (1994) Nutrient-limited productivity of calcareousversus fleshy macroalgae in a eutrophic, carbonate-rich tropical marine
environment. Coral Reefs 13: 151–159.
36. Belliveau SA, Paul VJ (2002) Effects of herbivory and nutrients on the early
colonization of crustose coralline and fleshy algae. Mar Ecol Prog Ser 232: 105–
114.
37. Edinger EN, Jompa J, Limmon GV, Widjatmoko W, Risk MJ (1998) Reef
degradation and coral biodiversity in Indonesia: Effects of land-based pollution,destructive fishing practices and changes over time. Mar Pollut Bull 36: 617–
630.
38. Sawall Y, Teichberg M, Seemann J, Litaay M, Jompa J, et al. (2011) Nutritional
status and metabolism of the coral Stylophora subseriata along a eutrophicationgradient in Spermonde Archipelago (Indonesia). Coral Reefs 30: 841–853.
Biofilm Diversity in Indonesian Coral Reefs
PLoS ONE | www.plosone.org 10 July 2012 | Volume 7 | Issue 7 | e39951

39. Chase JM, Leibold MA (2002) Spatial scale dictates the productivity –
biodiversity relationship. Nature 416: 427–429.40. Bienhold C, Boetius A, Ramette A (2012) The energy-diversity relationship of
complex bacterial communities in Arctic deep-sea sediments. ISME J 6: 724–
732.41. Fisher MM, Triplett EW (1999) Automated approach for ribosomal intergenic
spacer analysis of microbial diversity and its application to freshwater bacterialcommunities. Appl Environ Microbiol 65: 4630–4636.
42. Abed RMM, Ramette A, Hubner V, De Deckker P, Beer D (2012) Microbial
diversity of eolian dust sources from saline lake sediments and biological soilcrusts in arid Southern Australia. FEMS Microb Ecol. 80: 294–304.
43. Gobet A, Boer SI, Huse SM, van Beusekom JEE, Quince C, et al. (2012)Diversity and dynamics of rare and of resident bacterial populations in coastal
sands. ISME J 6: 542–553.44. Pandit SN, Kolasa J, Cottenie K (2009) Contrasts between habitat generalists
and specialists: an empirical extension to the basic metacommunity framework.
Ecology 90: 2253–2262.45. Cottenie K (2005) Integrating environmental and spatial processes in ecological
community dynamics. Ecol Lett 8: 1175–1182.46. Boer SI, Hedtkamp SIC, van Beusekom JEE, Fuhrman JA, Boetius A, et al.
(2009) Time- and sediment depth-related variations in bacterial diversity and
community structure in subtidal sands. ISME J 3: 780–791.47. Fairfull SJL, Harriott VJ (1999) Succession, space and coral recruitment in a
subtropical fouling community. Mar Freshw Res 50: 235–242.48. Stirk WA, Reinecke DL, van Staden J (2007) Seasonal variation in antifungal,
antibacterial and acetylcholinesterase activity in seven South African seaweeds.J Appl Phycol 19: 271–276.
49. Renema W, Hoeksema B (2007) Delineation of the Indo-Malayan Centre of
maximum marine biodiversity: The Coral Triangle. In: Landman NH, JonesDS, Traverse A, Xiao S, Kaufman AJ, et al., editors. Biogeography, time and
place: Distributions, barriers and islands, Vol. 29. Dordrecht, The Netherlands:Springer. 117–178.
50. Moll H (1983) Zonation and diversity of scleractinia on reefs off S. W. Sulawesi,
Indonesia. Ph.D thesis, Leiden University.
51. Cleary DFR, Becking LE, de Voogd NJ, Renema W, de Beer M, et al. (2005)
Variation in the diversity and composition of benthic taxa as a function of
distance offshore, depth and exposure in the Spermonde Archipelago, Indonesia.
Estuar Coast Shelf Sci 65: 557–570.
52. Hoeksema BW, Moka W (1989) Species assemblages and phenotypes of
mushroom corals (Fungiidae) related to coral reef habitats in the Flores Sea.
Neth J Sea Res 23: 149–160.
53. Kinkade C, Marra J, Langdon C, Knudson C, Ilahudet AG (1997) Monsoonal
differences in phytoplankton biomass and production in the Indonesian Seas:
tracing vertical mixing using temperature. Deep-Sea Res Part I Oceanogr Res
Pap 44: 581–592.
54. English S, Wilkinson C, Baker V (1997) Survey manual for tropical marine
resources, Vol. 2. Townsville, Australia: Australian Institute of Marine Science.
55. Boto KG, Bunt JS (1978) Selective excitation fluorometry for the determination
of chlorophylls and pheophytins. Analytical Chemistry 50: 392–395.
56. Hewson I, Fuhrman J (2006) Improved strategy for comparing microbial
assemblage fingerprints. Microb Ecol 51: 147–153.
57. Ramette A (2009) Quantitative community fingerprinting methods for
estimating the abundance of operational taxonomic units in natural microbial
communities. Appl Environ Microbiol 75: 2495–2505.
58. Clarke KR (1993) Non-parametric multivariate analyses of changes in
community structure. Aust J Ecol 18: 117–143.
59. Ramette A (2007) Multivariate analyses in microbial ecology. Microb Ecol 62:
142–160.
60. Legendre P, Gallagher E (2001) Ecologically meaningful transformations for
ordination of species data. Oecologia 129: 271–280.
61. Legendre P, Legendre L (1998) Numerical Ecology, Vol. 2. Amsterdam: Elsevier
Science BV. 853 p.
62. Robert P, Escoufier Y (1976) A Unifying Tool for Linear Multivariate Statistical
Methods: The RV-Coefficient. Applied Statistics 25 (3): 257–265.
63. Johnson JB, Omland KS (2004) Model selection in ecology and evolution.
Trends Ecol Evol 19: 101–108.
Biofilm Diversity in Indonesian Coral Reefs
PLoS ONE | www.plosone.org 11 July 2012 | Volume 7 | Issue 7 | e39951