Effects of dietary protein restriction on nephron number in the mouse
24
Hoppe et al. R-00442-2006.R1 29/01/2007 THE EFFECTS OF DIETARY PROTEIN RESTRICTION ON NEPHRON NUMBER IN THE MOUSE Chantal C Hoppe 1 , Roger G Evans 2 , John F Bertram 1 and Karen M Moritz 1 . Departments of 1 Anatomy & Cell Biology and 2 Physiology, Monash University, Melbourne, Victoria, Australia. Address for Correspondence: Ms Chantal Hoppe, Department of Anatomy & Cell Biology, School of Biomedical Sciences, Monash University, Victoria, 3800, Australia Phone: 61-3-99052707 Fax: 61-3-99052766 E-mail: [email protected] Page 1 of 24 Articles in PresS. Am J Physiol Regul Integr Comp Physiol (February 1, 2007). doi:10.1152/ajpregu.00442.2006 Copyright © 2007 by the American Physiological Society.
Transcript of Effects of dietary protein restriction on nephron number in the mouse

Hoppe et al. R-00442-2006.R1 29/01/2007
THE EFFECTS OF DIETARY PROTEIN RESTRICTION ON NEPHRON NUMBER IN
THE MOUSE
Chantal C Hoppe1, Roger G Evans2, John F Bertram1 and Karen M Moritz1.
Departments of 1Anatomy & Cell Biology and 2Physiology, Monash University,
Melbourne, Victoria, Australia.
Address for Correspondence:
Ms Chantal Hoppe,
Department of Anatomy & Cell Biology,
School of Biomedical Sciences,
Monash University,
Victoria, 3800,
Australia
Phone: 61-3-99052707
Fax: 61-3-99052766
E-mail: [email protected]
Page 1 of 24Articles in PresS. Am J Physiol Regul Integr Comp Physiol (February 1, 2007). doi:10.1152/ajpregu.00442.2006
Copyright © 2007 by the American Physiological Society.
2
Abstract
In rats, maternal protein restriction reduces nephron endowment and often leads to adult
hypertension. Sex differences in these responses have been identified. The molecular and genetic
bases of these phenomena can best be identified in a mouse model, but effects of maternal protein
restriction on kidney development have not been examined in mice. Therefore, we determined how
combined prenatal and postnatal protein restriction in mice affects organ weight, glomerular
number and dimensions and renal expression of angiotensin receptor mRNA, in both male and
female offspring. C57/Bl6/129sv mice received either a normal (20% w/w; NP) or low (9% w/w;
LP) protein diet during gestation and postnatal life. Offspring were examined at postnatal day 30.
Protein restriction retarded growth of the kidney, liver, spleen, heart and brain. All organs except
the brain weighed less in female than male offspring. Protein restriction increased normalized (to
body weight) brain weight, with females having relatively heavier brains than males. The effects of
protein restriction were not sex-dependent, except that normalized liver weight was reduced in
males but increased in females. Glomerular volume, but not number, was greater in female than
male mice. Maternal protein restriction reduced nephron endowment similarly in male and female
mice. Renal expression of AT1A receptor mRNA was ~6-fold greater in female than male NP mice,
but similar in male LP and female LP mice. We conclude that maternal protein restriction reduces
nephron endowment in mice. This effect provides a basis for future studies of developmental
programming in the mouse.
Abstract word count: 248
Key Words: stereology, nephron deficit, sex, mice, kidney
Page 2 of 24

3
Introduction
The hypothesis that adult disease can have developmental origins has been a major focus of
experimental and human studies in the last decade (36). There is now considerable evidence that the
in utero and early postnatal environment has a major impact on adult behaviour, physiology and
risk of adult disease (2, 7, 16, 29, 30, 36, 40, 41). There is also considerable evidence that the
effects of the perinatal environment on offspring development and adult renal and cardiovascular
function can be sex-specific (23, 30, 36, 41, 42). The most widely studied model of developmental
programming is maternal protein restriction in rats. Rat dams fed a low protein (8-9% w/w) diet
during pregnancy give rise to offspring with a 10-30% deficit in nephrons, a finding consistent
across a range of studies (14, 17, 39, 41, 43). This is often associated with hypertension in
adulthood (41). Nephron number data in female offspring following maternal protein restriction,
however, are somewhat conflicting. Some studies have shown females from protein restricted
mothers have a nephron deficit (17, 24, 39, 44). In contrast, Woods et al recently found that female
rats subjected to maternal protein restriction did not have a reduced nephron endowment (42).
Importantly, studies that have investigated both sexes following protein restriction have either used
a relatively severe form of protein restriction (39), maceration techniques (24) or pooled male and
female data, making it difficult to discern sex differences (17). Importantly, we are aware of no
previous studies that have specifically investigated whether the effects of modest protein restriction
on nephron endowment are sex-dependent in the mouse.
The increasing evidence that interactions between genotype, sex and the developmental
environment dominate adult cardiovascular health, calls for intense study of the molecular and
genetic bases of developmental programming. Currently, such studies can best be performed in
mice. A most powerful approach to assessing the pathophysiological role of potential genes
involved in developmental programming is to examine the consequences of gene disruption using
genetically modified animals. To date the mouse is the only mammalian species in which complex
investigations of molecular mechanisms can be easily performed. Before such studies can be
Page 3 of 24

4
performed we must define the effects of maternal protein restriction on nephron endowment in the
mouse. However, there are no previous published reports of the effects of maternal protein
restriction on renal development in mice. Therefore, in the current study we tested the primary
hypothesis that in mice, combined prenatal and postnatal protein restriction reduces nephron
endowment, alters glomerular morphology and retards the growth of major organs. There is strong
evidence from studies in rats that changes in the renin/angiotensin system contribute to reduced
nephron endowment associated with maternal protein restriction (41). Therefore, we also measured
renal expression of angiotensin receptors. Our secondary hypothesis was that the effects of
combined prenatal and postnatal protein restriction are sex-dependent, so we studied both male and
female offspring. Our findings suggest that maternal protein restriction reduces nephron endowment
in mice, and that the effects of protein restriction on the development of the kidney and other organs
are largely independent of sex. Thus, our current study characterizes a new model of maternal
protein restriction in mice.
Methods
Animals and their diets
Experiments were conducted in accordance with the National Health and Medical Research Council
of Australia ‘Australian Code of Practice for the Care and Use of Animals for Scientific Purposes’
(7th edition, 2004) and were approved by the Monash University, Biochemistry, Anatomy and
Microbiology Animal Ethics Committee. Previously unmated female C57/Bl6 mice were fed either
a normal-protein (20% w/w; Growth Diet AIN93G, Specialty Feeds, WA, Australia) (NP) or near-
isocaloric low-protein (9% w/w; 9% Protein Modified AIN93G, Specialty Feeds, WA, Australia)
(LP) diet from 2 weeks before mating with 129SV males. The LP diet was rendered near-isocaloric
by addition of sucrose and a small amount of starch, making it a high sucrose diet. After
compensation of low protein by sucrose-starch, the LP diet was nearly isocaloric with energy
Page 4 of 24

5
content being only 3.7% less than the NP diet. The compositions of the diets are given in Table 1.
Female breeders were maintained on their given diet throughout pregnancy and lactation. Only first
litters were studied. Protein restriction continued after birth to ensure that offspring were protein
restricted throughout the entire period of nephrogenesis, which in mice extends into the postnatal
period. Offspring were also maintained on their mother’s designated diet after weaning at 21 days,
to avoid the potentially confounding effects of altering dietary protein intake in the week before
animals were killed for post mortem measurements. We have previously used this approach in rats
(14), so our current observations allow a direct comparison across the two species. Male and female
offspring were used in all experiments. To minimize handling stress, animals were not weighed at
birth, but were weighed every 5 days of age, from postnatal day 5.
Morphometric measurements and stereological estimation of kidney volume, glomerular
number and glomerular volume
At postnatal day 30, mice were humanely killed via cervical dislocation and the kidneys, liver,
spleen, heart and brain were removed and weighed. Left kidneys were placed in 10% formalin for
stereological estimation of total nephron number and right kidneys were snap frozen and stored at -
70 ْC for analysis of gene expression. Total body weight and the weights of internal organs were
determined in a total of 12-16 animals from each diet and sex group, obtained from 4-6 different
litters.
Total glomerular number was estimated in 4-7 male and female animals per dietary group. Left
kidneys were decapsulated and sliced at 1 mm and every slice was processed for embedding in
glycolmethacrylate (Technovit 7100; Kulzer and Co, Germany). Tissue blocks were exhaustively
sectioned at 20 µm and every 10th and 11th section (section pair) collected and stained with
Periodic-Acid Schiff’s stain.
Total glomerular number (Nglom) and mean glomerular (Vglom) and mean renal corpuscle (Vcorp)
volumes were determined as previously described using unbiased stereological techniques (4). In
Page 5 of 24

6
brief, the areas of all sampled kidney sections were estimated using stereological point counting
with the aid of a microfiche reader using a magnification of 19.2x. Grid points overlying all
sections were designated Ps and those overlying complete sections were designated Pf. The total
number of glomeruli in a kidney was determined using physical disectors in a known fraction of the
kidney, the so-called physical disector/fractionator combination. Two light microscopes modified
for projection were employed, and each pair of sections was mounted on the microscopes.
Corresponding fields on the two sections were found, and glomeruli sampled by an unbiased
counting frame in one section that were not present in the section pair were counted (Q-). Nglom was
estimated using:
Nglom = 10 x (Ps/Pf) x [1/(2fa)] x Q-
where 10 is the inverse of the section sampling fraction, and Ps/Pf and 1/(2fa) give the fraction of the
total section area used to count glomeruli.
Kidney volume (Vkid) was estimated using the Cavalieri principle (4) through:
Vkid = 10 x t x a(p) x Ps
where t was section thickness and a(p) was the area of the stereological grid associated with each
grid point after adjustment for magnification.
Vglom was estimated using:
Vglom = VVglom,kid / NVglom,kid
where VVglom,kid was estimated by dividing the number of grid points overlying glomerular profiles
by the number of points overlying kidney sections. A similar point counting approach was used to
estimate Vcorp. NVglom,kid was obtained by dividing Nglom by Vkid. To calculate total glomerular and
total renal corpuscle volumes, mean volumes were multiplied by Nglom.
Gene expression studies
Total RNA was extracted from half of the right kidney using a commercially available kit (Qiagen).
Samples were DNase treated to eliminate any residual genomic DNA. Samples were reverse
transcribed to form cDNA and an ABI Prism 7700 Sequence Detector System (PE Biosystems,
Page 6 of 24

7
Foster City, CA) was used to perform real-time PCR (26). This assay was used to determine relative
levels of mRNA expression for the AT1A, AT1B and AT2 receptors. All primers and TaqMan®
probes were designed using Primer Express TM Version 1.0 (PE Biosystems) (see Table 2).
A comparative CT (cycle of threshold fluorescence) method was utilized with 18S used as an
endogenous reference. To calculate the relative expression levels in each sample, the CT value for
18S was subtracted from the CT value of the gene of interest to give a CT value. The CT value of
the calibrator was then subtracted from each individual sample to give a CT value. The calibrator
used was the mean CT of the normal protein male group. This number was then inserted into the
formula 2- CT to give the expression level relative to the calibrator.
Statistics
Data are reported as mean ± SEM. Statistical analyses were performed using the software packages
SYSTAT (Version 11.0, SPSS Inc, Chicago, IL) and SPSS (Version 14.0, SPSS Inc). Mean and SEM of
data from individual mice were weighted by litter, via least squares regression. Data were analysed by
univariate analysis of variance, the factors comprising ‘protein intake’ and ‘sex’, but weighted for ‘litter’
as recommended by Festing (9). The main effect of ‘protein intake’ (PProtein) tested for effects of protein
restriction independent of sex. The main effect of ‘sex’ (PSex) tested for sex differences independent of
protein intake. The interaction term (PSex*Protein) tested whether the effects of protein restriction differed in
male and female mice. Analysis of changes in body weight over the first 30 days of postnatal life was
performed by analysis of covariance, and individual regression lines were determined by the least-
squares method (19). P ≤ 0.05 was considered statistically significant.
Page 7 of 24

8
Results
Body and organ weight, litter size
Effects of protein restriction: Litter size was similar for LP- (7.6 ± 1.8 pups) and NP- (6.6 ± 2.5
pups) dams (P = 0.25, unpaired t-test), and therefore no adjustment of litter size was performed.
There were no observed adverse effects of protein restriction on survival of pups to 30 days of age.
At postnatal day 30, body weight and the absolute weights of the kidneys, liver, spleen, heart and
brain were less in LP than NP offspring (Table 3A). The smaller weights of all organs in LP
offspring, except the brain, were proportional to the deficit in body weight, as evidenced by the fact
that protein restriction did not significantly alter the ratios of organ weight to body weight (Table
3B). In contrast, the ratio of brain weight to body weight was significantly increased by protein
restriction.
Sex differences: Body weight and the weight of all organs except the brain were less in females than
males (Table 3A). Sex differences in the weights of the liver, spleen and heart were in proportion to
differences in body weight, as evidenced by the fact that sex did not significantly affect the
normalized weights of these organs. In contrast, normalized kidney weight was significantly less in
female mice than male mice. Normalized brain weight, on the other hand, was significantly greater
in female than male mice.
The effects of protein restriction on body weight and the weights of internal organs were similar in
male and female mice, with the exception of the liver. Protein restriction reduced liver weight by
28% in male mice, but only by 11% in female mice. Consequently, protein restriction reduced
normalized liver weight in males (by 9%) but increased it in females (by 12%).
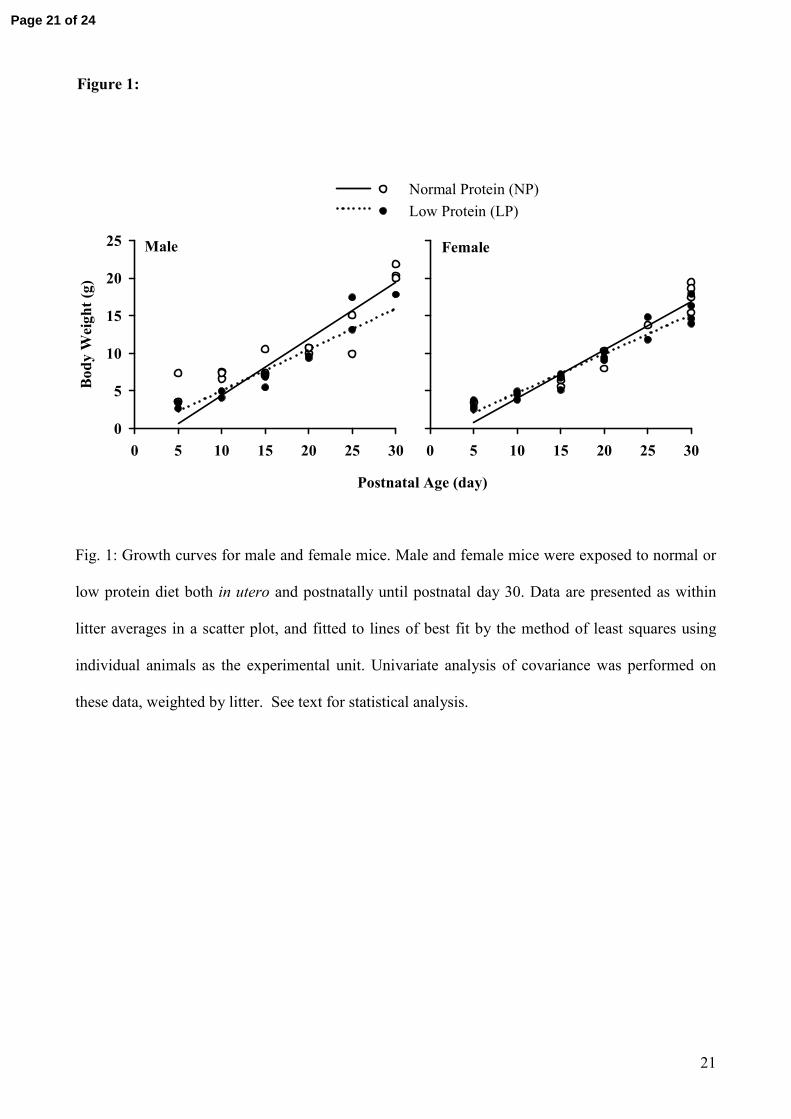
Covariant analysis of body weight up to postnatal day 30: There was a highly significant positive
relationship between postnatal age and body weight (r2 = 0.90-0.93 in the 4 groups of mice; PAge <
0.001). The rate of growth was greater in male than in female mice (PAge*Sex = 0.008). Protein
Page 8 of 24

9
restriction significantly reduced the slope of the growth curve (PAge*Protein < 0.001), but the
magnitude of this effect was similar in male and female mice (PAge*Protein*Sex = 0.511) (Figure 1).
Nephron Number
Total glomerular number, and therefore nephron number, was similar in male and female NP mice
(male = 10755 ± 937, female = 10695 ± 864). Glomerular number was significantly less in protein
restricted male offspring (by 22 %, 8364 ± 468) and female offspring (by 16%, 8977 ± 494) (Figure
2A). Similarly, kidney volume was significantly less in LP than NP mice (PProtein < 0.001). Mean
and total glomerular and renal corpuscle volumes were greater in female than in male mice. There
were no apparent interactions between the respective effects of sex and protein intake (Figure 2).
Renal gene expression
In male mice, relative expression of AT1A receptor mRNA was similar in LP and NP animals. AT1A
receptor mRNA was ~6-fold greater in NP female mice than in corresponding male mice, but
similar in LP female mice compared with the corresponding male mice (Figure 3). There were no
significant effects of protein or sex on AT1B receptor expression (Figure 3). Low levels of AT2
receptor mRNA were detected in all mice, but the level of expression was highly variable between
animals. There were no apparent effects of sex or protein intake on AT2 receptor expression (data
not shown). A positive control from E17.5 kidney tissue revealed a significantly greater expression
of AT2 receptor mRNA compared to mice from postnatal day 30.
Discussion
The most important finding of the present study was that combined pre- and post-natal protein
restriction led to a reduction in nephron endowment, of similar magnitude in male and female mice.
Furthermore, growth retardation in this model of protein restriction, both in terms of total body
weight and the weights of individual organs, was with the exception of the liver, of a similar
magnitude in male and female offspring. However, we did identify underlying sex differences in
Page 9 of 24

10
gross body and renal morphology. Interestingly, both mean glomerular volume and total glomerular
volume were greater in female mice than male mice. Furthermore, renal AT1A-receptor gene
expression was greater in female than male NP-mice, although similar in female and male LP mice.
The results of this study highlight the importance of analyzing offspring of both sexes in
experimental models of maternal protein restriction.
To our knowledge, this is the first report of reduced nephron endowment in a mouse model of
maternal protein restriction. We employed a relatively mild degree of protein restriction, similar to
that we have employed previously in rats (14). However, it is important to note that the LP diet
contains approximately 3.7% less energy than the NP diet, and contains a higher sucrose content,
and different starch: sucrose ratio. Nevertheless, in the present study in the mouse, the LP diet did
not reduce litter size or offspring survival. Our current observations do not address the impact of
combined pre- and post-natal protein restriction on adult cardiovascular health. However, our
characterization of this new mouse model of maternal protein restriction provides a basis for future
studies to examine both adult cardiovascular outcomes and the molecular mechanisms that mediate
renal developmental programming in the mouse. A nephron deficit, as seen in our study in both
male and female LP mice, has been implicated in the development of adult diseases, via Brenner’s
hypothesis (5). For example, maternal protein restriction in rats can reduce offspring nephron
endowment and lead to adult hypertension (17, 41). The nephron deficit seen in protein restricted
rats is characterized by a 10-30% reduction in glomerular number (14, 17, 41, 43). Thus, at least in
this respect, our findings in mice replicate previous observations in the rat. Interestingly, estimates
of female offspring nephron number following maternal protein restriction, have produced
somewhat conflicting data (17, 39, 42, 43). For example, Zimanyi et al, using unbiased techniques,
found that female protein restricted rats had a nephron deficit compared to controls (44). In contrast,
Woods et al. found that female offspring of moderately protein restricted rats dams had normal
nephron endowment (42). Strain and diet variation may account for these disparate findings in rats.
Of particular importance to the study of nephron number is the use of unbiased stereology.
Page 10 of 24

11
Alternatives to this ‘gold-standard’ technique are subject to considerable bias, leading to inaccurate
results. In our current study using unbiased stereology, we have shown that maternal protein
restriction can lead to a nephron deficit in both male and female mice. We were unable to detect a
sex-dependent difference in the magnitude of this effect.
However, we were able to detect sex-dependent differences in underlying renal morphology in
mice, in that female mice were found to have larger glomeruli and renal corpuscles than males, yet
have smaller kidneys. Total glomerular volume and total renal corpuscle volume was also found to
be greater in female than male mice. Two previous studies investigated sex differences in
glomerular morphology in mice at a similar age, yet failed to detect sex differences in renal
corpuscle diameter or glomerular area (28) (18), although neither study employed unbiased
stereological techniques. Okada et al found no sex differences in cortical corpuscle diameter in
DBA/2CrSlc mice at 30 days of age, although corpuscle diameter was greater in males from 90
days of age (28). Lovegrove et al found no sex differences in glomerular area in wild type mice at
70 days of age (18). Differences between our current observations, and those of these previous
studies, might be explained by strain differences, or by differences in the stereological techniques
employed. Our findings merit further investigation of adult mice of both sexes, to determine
whether the greater glomerular size in females confers a greater or decreased survival advantage,
under certain physiological conditions.
Total body weight, and the weight of all organs studied, was less in LP than NP mice. These
observations are consistent with the outcomes of previous studies of combined pre-natal and post-
natal protein restriction in rats (6, 14). In our study, retarded growth, of all organs except the brain,
was in proportion to the retardation in total body weight. This contrasts with the effects of
combined pre- and post-natal protein restriction in the rat, where the weights of the spleen and the
liver were found to be reduced proportionally more than was total body weight (14). ‘Brain-sparing’
following protein restriction occurred in both sexes in mice, consistent with previous findings in the
rat (3, 6). Similarly, brain sparing has been shown in rabbits and sheep subjected to intrauterine
Page 11 of 24

12
growth restriction (12, 29) and occurs in human growth restricted infants (10, 11, 20). Brain sparing
may confer an immediate survival advantage to the offspring, whilst growth of other organs is
compromised.
The effects of protein restriction on gross organ morphology were not sex-dependent, except in the
case of the liver. Protein restriction retarded growth of the liver far more in male mice than in
female mice. Sex-dependent effects of maternal protein restriction on hepatic glycogen stores have
been identified in rats (1). The significance of these sex-dependent effects of protein restriction on
liver development remains to be determined. They may reflect the potential for sex-dependent
developmental programming of metabolic disorders.
Female mice in our study had a significantly lower kidney and body weight than males, consistent
with observations from previous studies (18, 28). Brain weight, as a proportion of total body
weight, was greater in female than male mice. This has not previously been demonstrated in mice,
although our observations are consistent with the results of previous studies in rats (21, 31).
In the current study, we measured renal expression of AT1A, AT1B, and AT2 receptor mRNA in 30
day old mice. AT1A-receptor mRNA was detected in all kidneys, as was AT1B- and AT2-receptor
mRNA expression. Compared to our positive control of fetal kidney tissue, where the AT2 receptor
is constitutively highly expressed, the levels of AT2 receptor in postnatal day 30 tissues was
considerably lower and highly variable. This is perhaps explained by the fact that after birth, levels
of AT2 receptor expression reduce markedly (35), and the timing of this reduction to very low levels
may vary between individual mice. In the mouse kidney, the AT1 receptor is expressed in
developing glomeruli and S-shaped bodies, and in proximal and distal tubules, where it is thought to
mediate cellular differentiation and proliferation during nephrogenesis (15). Expression is greatest
at the end of gestation and decreases following birth. We found considerably greater renal AT1A
receptor mRNA levels in female NP mice compared with male NP mice at postnatal day 30. This
observation is consistent with the results of a previous study in rats (23), although other studies
Page 12 of 24

13
have failed to replicate this observation (24). The greater levels of renal AT1A receptor expression in
NP female than NP male mice might reflect sex differences in the time-course of renal
development, in that they are ‘leftover’ from the higher levels of AT1A receptor expression present
during nephrogenesis in these relatively young (adolescent) mice. This phenomenon could possibly
contribute to the sex-differences in glomerular morphology observed in the current study. We might
also therefore expect to find an eventual decrease in AT1A-receptor expression in female mice
beyond 30 days of age. Studies are currently underway to investigate these possibilities.
There is now considerable evidence, from a number of models of developmental programming, for
roles of abnormalities in the renal renin/angiotensin system (32). For example, maternal protein
restriction in rats reduced renal renin mRNA levels and renal tissue angiotensin II levels in newborn
male pups and resulted in adult hypertension (41). Moreover, AT1 receptor density was increased,
while AT2 receptor density was reduced, in protein restricted male rats at 4 weeks of age (33). We
found a clear effect of maternal protein restriction on renal AT1A receptor expression, but only in
female offspring. Thus, renal AT1A receptor expression was considerably less in LP compared to NP
female mice, but at a similar level to both LP and NP male mice. Previous studies of the effects of
maternal protein restriction on AT1A-receptor expression have produced conflicting results (22-24,
33, 34). Our current data raise the possibility that the sex-dependent effects of maternal protein
restriction on renal AT1A-receptor expression might lead to sex differences in the impact of
maternal protein restriction on adult disease. This hypothesis merits further investigation.
One important caveat must be applied to our current findings. The genetic background of the male
breeder mice (129sv) differed from that of the female breeders (C57/Bl6). We took this approach to
ensure hybrid vigor in the offspring, since we are currently undertaking intensive studies of
cardiovascular and renal physiology in these animals in adulthood. The advantages of a hybrid
strain include offspring vigor, uniformity, and litter sizes that are often larger than those of pure
isogenic strains (9). It does, however, mean that the single X-chromosomes of the male offspring
are exclusively of the C57/Bl6, whereas the females have both the 129sv and C57/Bl6 X-
Page 13 of 24

14
chromosome. However, we believe this is unlikely to have greatly confounded our current
observations since, in mice, X inactivation is imprinted with preferential silencing of the paternal X
chromosome (37). This means that the C57/Bl6 X chromosome should dominate in both male and
female mice. There is a small possibility that some X-linked genes are still expressed from the
inactive X chromosome. However, this phenomenon is less frequent in mice than humans (13).
Perspectives
Sex and gender have important influences on adult risk of disease (38). It might therefore be
expected that sex could greatly influence adult cardiovascular and renal function. Indeed, there is
now evidence that this is the case in the model of maternal protein restriction in rats (42), whilst
other studies have identified important differences between the sexes in basal renal haemodynamics
(25, 27) and renal function (8). Our current study is, to our knowledge, the first to examine the
effects of maternal protein restriction in mice on offspring renal morphology, and incorporates
measurements in both male and female offspring. Our results indicate that maternal protein
restriction reduces nephron endowment in the offspring of mice, as is the case in rats (14). This
effect, and many of the other effects of maternal protein restriction, was similar in male and female
offspring. However, there were sex-dependent effects of protein restriction on renal AT1A receptor
expression and liver weight, the significance of which requires further study. We also identified
sex-differences in underlying glomerular morphology that have not previously been described. The
mouse model we describe here should facilitate future study of the molecular bases of
developmental programming, and its sex-dependence.
Acknowledgements
The authors acknowledge the expert technical assistance of Mrs. Sue Connell and Ms Debbie
Arena.
Page 14 of 24

15
Grants:
This work was supported by grants from the National Health and Medical Research Council of
Australia (384207, 384101, 384279) and by an Australian Postgraduate Award (CCH) through the
Commonwealth Government of Australia. RGE is also supported by a NH&MRC Senior Research
Fellowship and KMM by a NH&MRC Career Development Award.
References:
1. Bellinger L, and Langley-Evans SC. Fetal programming of appetite by exposure to a maternal low-protein diet in the rat. Clin Sci (Lond) 109: 413-420, 2005. 2. Bellinger L, Sculley DV, and Langley-Evans SC. Exposure to undernutrition in fetal life determines fat distribution, locomotor activity and food intake in ageing rats. Int J Obes (Lond) 30:729-738, 2006. 3. Bennis-Taleb N, Remacle C, Hoet JJ, and Reusens B. A low-protein isocaloric diet during gestation affects brain development and alters permanently cerebral cortex blood vessels in rat offspring. J Nutr 129: 1613-1619, 1999. 4. Bertram JF. Analyzing renal glomeruli with the new stereology. Int Rev Cytol 161: 111-172, 1995. 5. Brenner BM, Garcia DL, and Anderson S. Glomeruli and blood pressure. Less of one, more the other? Am J Hypertens 1: 335-347, 1988. 6. Desai M, Crowther NJ, Lucas A, and Hales CN. Organ-selective growth in the offspring of protein-restricted mothers. Br J Nutr 76: 591-603, 1996. 7. Edwards LJ, Coulter CL, Symonds ME, and McMillen IC. Prenatal undernutrition, glucocorticoids and the programming of adult hypertension. Clin Exp Pharmacol Physiol 28: 938-941, 2001. 8. Evans RG, Stevenson KM, Bergstrom G, Denton KM, Madden AC, Gribben RL, Weekes SR, and Anderson WP. Sex differences in pressure diuresis/natriuresis in rabbits. Acta Physiol Scand 169: 309-316, 2000. 9. Festing MF. Design and statistical methods in studies using animal models of development. Ilar J 47: 5-14, 2006. 10. Fu J, and Olofsson P. Restrained cerebral hyperperfusion in response to superimposed acute hypoxemia in growth-restricted human fetuses with established brain-sparing blood flow. Early Hum Dev 82: 211-216, 2006. 11. Garrow JS, Fletcher K, and Halliday D. Body Composition in Severe Infantile Malnutrition. J Clin Invest 44: 417-425, 1965. 12. Harel S, Yavin E, Tomer A, Barak Y, and Binderman I. Brain: body ratio and conceptional age in vascular-induced intrauterine growth retarded rabbits. Brain Dev 7: 575-579, 1985. 13. Heard E, Clerc P, and Avner P. X-chromosome inactivation in mammals. Annu Rev Genet 31: 571-610, 1997. 14. Hoppe CC, Evans RG, Moritz KM, Cullen-McEwen LA, Fitzgerald SM, Dowling J, and Bertram JF. Combined prenatal and postnatal protein restriction influences adult kidney structure, function and arterial pressure. Am J Physiol Regul Integr Comp Physiol 2006.15. Kakuchi J, Ichiki T, Kiyama S, Hogan BL, Fogo A, Inagami T, and Ichikawa I.Developmental expression of renal angiotensin II receptor genes in the mouse. Kidney Int 47: 140-147, 1995.
Page 15 of 24

16
16. Langley-Evans SC, Phillips GJ, Benediktsson R, Gardner DS, Edwards CR, Jackson AA, and Seckl JR. Protein intake in pregnancy, placental glucocorticoid metabolism and the programming of hypertension in the rat. Placenta 17: 169-172, 1996. 17. Langley-Evans SC, Welham SJ, and Jackson AA. Fetal exposure to a maternal low protein diet impairs nephrogenesis and promotes hypertension in the rat. Life Sci 64: 965-974, 1999. 18. Lovegrove AS, Sun J, Gould KA, Lubahn DB, Korach KS, and Lane PH. Estrogen receptor alpha-mediated events promote sex-specific diabetic glomerular hypertrophy. Am J Physiol Renal Physiol 287: F586-591, 2004. 19. Ludbrook J. Comparing methods of measurement. Clinical and Experimental Pharmacology and Physiology 24: 193-203, 1997. 20. Lumbers ER, Yu ZY, and Gibson KJ. The selfish brain and the barker hypothesis. Clin Exp Pharmacol Physiol 28: 942-947, 2001. 21. McArthur S, Siddique ZL, Christian HC, Capone G, Theogaraj E, John CD, Smith SF, Morris JF, Buckingham JC, and Gillies GE. Perinatal glucocorticoid treatment disrupts the hypothalamo-lactotroph axis in adult female, but not male, rats. Endocrinology 147: 1904-1915, 2006. 22. McMullen S, Gardner DS, and Langley-Evans SC. Prenatal programming of angiotensin II type 2 receptor expression in the rat. Br J Nutr 91: 133-140, 2004. 23. McMullen S, and Langley-Evans SC. Maternal low-protein diet in rat pregnancy programs blood pressure through sex-specific mechanisms. Am J Physiol Regul Integr Comp Physiol 288:R85-90, 2005. 24. McMullen S, and Langley-Evans SC. Sex-specific effects of prenatal low-protein and carbenoxolone exposure on renal angiotensin receptor expression in rats. Hypertension 46: 1374-1380, 2005. 25. Messow C, Gartner K, Hackbarth H, Kangaloo M, and Lunebrink L. Sex differences in kidney morphology and glomerular filtration rate in mice. Contrib Nephrol 19: 51-55, 1980. 26. Moritz K, Koukoulas I, Albiston A, and Wintour EM. Angiotensin II infusion to the midgestation ovine fetus: effects on the fetal kidney. Am J Physiol Regul Integr Comp Physiol 279:R1290-1297, 2000. 27. Munger K, and Baylis C. Sex differences in renal hemodynamics in rats. Am J Physiol 254: F223-231, 1988. 28. Okada A, Yabuki A, Matsumoto M, and Suzuki S. Development of gender differences in DBA/2Cr mouse kidney morphology during maturation. J Vet Med Sci 67: 877-882, 2005. 29. Oyama K, Padbury J, Martinez A, Chappell B, Stein H, and Humme J. Effects of fetal growth retardation on the development of central and peripheral catecholaminergic pathways in the sheep. J Dev Physiol 18: 217-222, 1992. 30. Ozaki T, Nishina H, Hanson MA, and Poston L. Dietary restriction in pregnant rats causes gender-related hypertension and vascular dysfunction in offspring. J Physiol 530: 141-152, 2001. 31. Rao S, Joshi S, Kale A, Hegde M, and Mahadik S. Maternal folic acid supplementation to dams on marginal protein level alters brain fatty acid levels of their adult offspring. Metabolism 55: 628-634, 2006. 32. Rasch R, Skriver E, and Woods LL. The role of the RAS in programming of adult hypertension. Acta Physiol Scand 181: 537-542, 2004. 33. Sahajpal V, and Ashton N. Increased glomerular angiotensin II binding in rats exposed to a maternal low protein diet in utero. J Physiol 563: 193-201, 2005. 34. Sahajpal V, and Ashton N. Renal function and angiotensin AT1 receptor expression in young rats following intrauterine exposure to a maternal low-protein diet. Clin Sci (Lond) 104: 607-614, 2003. 35. Shanmugam S, Llorens-Cortes C, Clauser E, Corvol P, and Gasc JM. Expression of angiotensin II AT2 receptor mRNA during development of rat kidney and adrenal gland. Am J Physiol 268: F922-930, 1995.
Page 16 of 24
17
36. Symonds ME, and Gardner DS. Experimental evidence for early nutritional programming of later health in animals. Curr Opin Clin Nutr Metab Care 9: 278-283, 2006. 37. Takagi N, and Sasaki M. Preferential inactivation of the paternally derived X chromosome in the extraembryonic membranes of the mouse. Nature 256: 640-642, 1975. 38. Torgrimson BN, and Minson CT. Sex and gender: what is the difference? J Appl Physiol 99: 785-787, 2005. 39. Vehaskari VM, Aviles DH, and Manning J. Prenatal programming of adult hypertension in the rat. Kidney Int 59: 238-245, 2001. 40. Vickers MH, Breier BH, McCarthy D, and Gluckman PD. Sedentary behavior during postnatal life is determined by the prenatal environment and exacerbated by postnatal hypercaloric nutrition. Am J Physiol Regul Integr Comp Physiol 285: R271-273, 2003. 41. Woods LL, Ingelfinger JR, Nyengaard JR, and Rasch R. Maternal protein restriction suppresses the newborn renin-angiotensin system and programs adult hypertension in rats. Pediatr Res 49: 460-467, 2001. 42. Woods LL, Ingelfinger JR, and Rasch R. Modest maternal protein restriction fails to program adult hypertension in female rats. Am J Physiol Regul Integr Comp Physiol 289: R1131-1136, 2005. 43. Zimanyi MA, Bertram JF, and Black MJ. Does a nephron deficit in rats predispose to salt-sensitive hypertension? Kidney Blood Press Res 27: 239-247, 2004. 44. Zimanyi MA, Denton KM, Forbes JM, Thallas-Bonke V, Thomas MC, Poon F, and Black MJ. A developmental nephron deficit in rats is associated with increased susceptibility to a secondary renal injury due to advanced glycation end-products. Diabetologia 49: 801-810, 2006.
Page 17 of 24

18
Table 1: Composition of the diets
_______________________________________________
Constituent (g/kg
of diet)
Normal Protein
Diet (NP)
Low Protein
Diet (LP)
_______________________________________________
Casein 200 87
Canola Oil 70 70
Sucrose 100 200
Wheat Starch 404 417
Cellulose 50 50
D/L-Methionine 3 3
Sodium Chloride 2.6 2.6
Protein (%) 19.5 8.4
Total Fat (%) 7 7
Energy (MJ/kg) 16.1 15.5
_______________________________________________
Semi-pure diets were obtained from Specialty Feeds, Western Australia. Feed was manufactured as
a 12 mm diameter cube, vacuum packed, and stored at -20 ˚С until use. Low protein diets were
rendered isocaloric by addition of sucrose/starch.
Page 18 of 24

19
Table 2: Primer and probe sequences
Gene of Interest Concentrations Used
Primer and Probe Sequence
AT1A 50 Forward 5- GGG CTG TCT ATA CCG CTA
TGG AA -3
GenBank accession no. NM_177322
300 Reverse 5- GCC GAA GCG ATC TTA CAT AGG TG -3
75 Probe 5- ACC GCT GGC CCT TCG GCA A -3
AT1B 900 Forward 5- GGG CAG TTT ATA CCG CTA TGG A -3
GenBank accession no. NM 175086
900 Reverse 5- TGG CCG AAG CGA TCT TAC AT -3
200 Probe 5- TAC CAG TGG CCC TTC GGC AAT CA -3
AT2 300 Forward 5- TGT GTT GGC ATT CAT CAT TTG -3
GenBank accession no. NM_007429
900 Reverse 5- CCA TCC AAG CTA GAG CAT CCA -3
125 Probe 5- TGG CTT CCC CAT GTT CTG ACC TTC -3
AT1A = angiotensin receptor 1A; AT1B= angiotensin receptor 1B; AT2 = angiotensin receptor 2.
Page 19 of 24
20
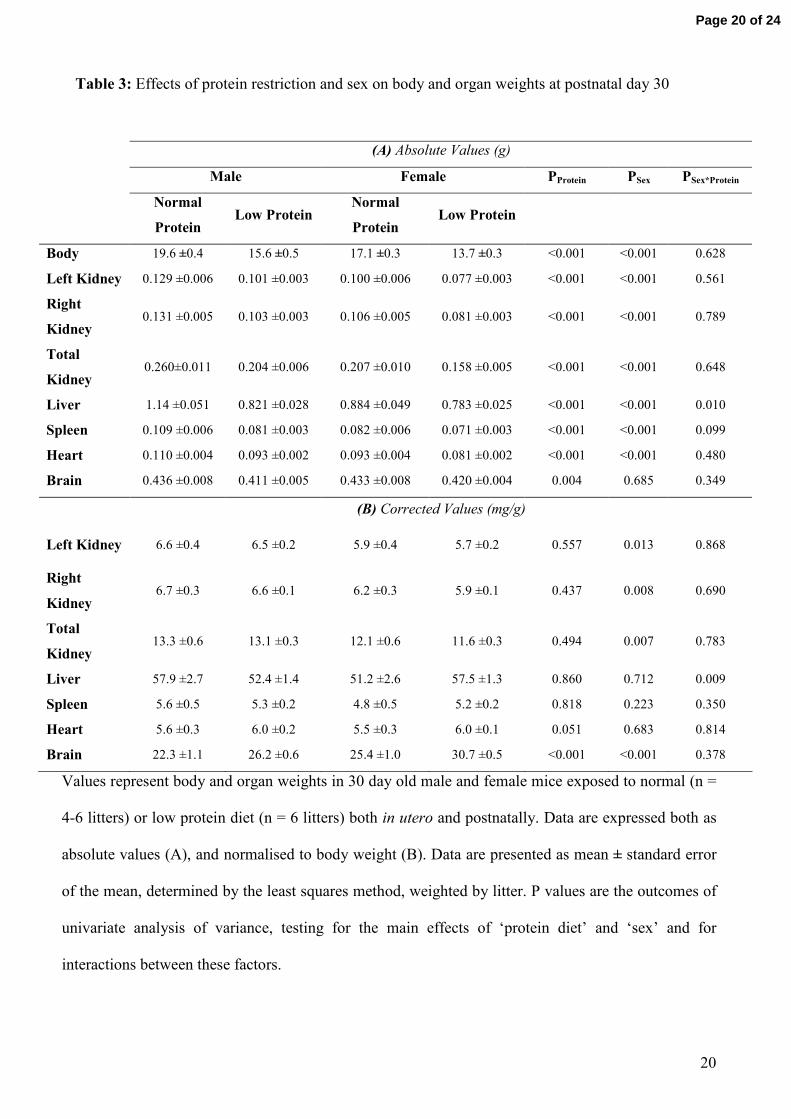
Table 3: Effects of protein restriction and sex on body and organ weights at postnatal day 30
Values represent body and organ weights in 30 day old male and female mice exposed to normal (n =
4-6 litters) or low protein diet (n = 6 litters) both in utero and postnatally. Data are expressed both as
absolute values (A), and normalised to body weight (B). Data are presented as mean ± standard error
of the mean, determined by the least squares method, weighted by litter. P values are the outcomes of
univariate analysis of variance, testing for the main effects of ‘protein diet’ and ‘sex’ and for
interactions between these factors.
(A) Absolute Values (g)
Male Female PProtein PSex PSex*Protein
Normal
Protein Low Protein
Normal
Protein Low Protein
Body 19.6 ±0.4 15.6 ±0.5 17.1 ±0.3 13.7 ±0.3 <0.001 <0.001 0.628
Left Kidney 0.129 ±0.006 0.101 ±0.003 0.100 ±0.006 0.077 ±0.003 <0.001 <0.001 0.561
Right
Kidney 0.131 ±0.005 0.103 ±0.003 0.106 ±0.005 0.081 ±0.003 <0.001 <0.001 0.789
Total
Kidney 0.260±0.011 0.204 ±0.006 0.207 ±0.010 0.158 ±0.005 <0.001 <0.001 0.648
Liver 1.14 ±0.051 0.821 ±0.028 0.884 ±0.049 0.783 ±0.025 <0.001 <0.001 0.010
Spleen 0.109 ±0.006 0.081 ±0.003 0.082 ±0.006 0.071 ±0.003 <0.001 <0.001 0.099
Heart 0.110 ±0.004 0.093 ±0.002 0.093 ±0.004 0.081 ±0.002 <0.001 <0.001 0.480
Brain 0.436 ±0.008 0.411 ±0.005 0.433 ±0.008 0.420 ±0.004 0.004 0.685 0.349
(B) Corrected Values (mg/g)
Left Kidney 6.6 ±0.4 6.5 ±0.2 5.9 ±0.4 5.7 ±0.2 0.557 0.013 0.868
Right
Kidney 6.7 ±0.3 6.6 ±0.1 6.2 ±0.3 5.9 ±0.1 0.437 0.008 0.690
Total
Kidney 13.3 ±0.6 13.1 ±0.3 12.1 ±0.6 11.6 ±0.3 0.494 0.007 0.783
Liver 57.9 ±2.7 52.4 ±1.4 51.2 ±2.6 57.5 ±1.3 0.860 0.712 0.009
Spleen 5.6 ±0.5 5.3 ±0.2 4.8 ±0.5 5.2 ±0.2 0.818 0.223 0.350
Heart 5.6 ±0.3 6.0 ±0.2 5.5 ±0.3 6.0 ±0.1 0.051 0.683 0.814
Brain 22.3 ±1.1 26.2 ±0.6 25.4 ±1.0 30.7 ±0.5 <0.001 <0.001 0.378
Page 20 of 24
21
Figure 1:
Male
Postnatal Age (day)
0 5 10 15 20 25 30
Body
Wei
ght(
g)
0
5
10
15
20
25 Female
0 5 10 15 20 25 30
Normal Protein (NP)Low Protein (LP)
Fig. 1: Growth curves for male and female mice. Male and female mice were exposed to normal or
low protein diet both in utero and postnatally until postnatal day 30. Data are presented as within
litter averages in a scatter plot, and fitted to lines of best fit by the method of least squares using
individual animals as the experimental unit. Univariate analysis of covariance was performed on
these data, weighted by litter. See text for statistical analysis.
Page 21 of 24

22
Figure 2: G
lom
erul
arN
umbe
r
0
2000
4000
6000
8000
10000
12000
14000
PSex = 0.706 PProtein = 0.010
PSex*Protein = 0.647
PSex = 0.030
PProtein = 0.614
PSex*Protein = 0.592
TCV
(mm
3 )
0
1
2
3
4
Vco
rp(1
0-4m
m3 )
0
1
2
3
4
PSex = 0.011
PProtein = 0.199
PSex*Protein = 0.484
Vgl
om(1
0-4m
m3 )
0.0
0.5
1.0
1.5
2.0
2.5
3.0
3.5
PSex = 0.041 PProtein = 0.207
PSex*Protein = 0.464
A
B
C
D
E
Low Protein MalesNormal Protein Males
Normal Protein FemalesLow Protein Females
TGV
(mm
3 )
0.0
0.5
1.0
1.5
2.0
2.5
3.0
3.5
PSex = 0.05 PProtein = 0.733
PSex*Protein = 0.508
Page 22 of 24

23
Fig. 2: Nephron number and glomerular dimensions. Male and female mice were exposed to normal
or low protein diets both in utero and postnatally until postnatal day 30. Unbiased stereological
techniques were used to determine total glomerular (nephron) number (A); mean glomerular
volume (Vglom) (B); total glomerular volume (TGV) (C); mean renal corpuscle volume (Vcorp) (D);
and total renal corpuscle volume (TCV) (E). For mice exposed to a normal protein diet n=4-6
animals from n=3-4 litters. For mice exposed to a low protein diet n=6-7 animals from n=4 litters.
Values are mean ± standard error of the mean. P values are the outcomes of univariate analysis of
variance weighted for litter, testing the main effects of ‘protein diet’ and ‘sex’ and for interactions
between these factors.
Page 23 of 24

24
Figure 3:
A
B
Rel
ativ
eA
T 1a
rece
ptor
mR
NA
expr
essi
on
0
2
4
6
8
PSex = 0.013PProtein = 0.023PSex*Protein = 0.011
Rel
ativ
eA
T1b
rece
ptor
mR
NA
expr
essi
on
0
1
2
3
4
5
PSex = 0.388PProtein = 0.288PSex*Protein = 0.913
Normal Protein MalesLow Protein MalesNormal Protein FemalesLow Protein Females
Fig. 3: Relative expression of AT1A and AT1B receptor mRNA. Male and female mice were exposed
to a normal or low protein diet both in utero and postnatally until postnatal day 30. Real-time PCR
was performed using tissue from the left kidneys of these animals. Data are presented as mean ±
standard error of the mean, analyzed statistically as for Figure 2.
Page 24 of 24