Effects of C/N ratio and substrate addition on natural food communities in freshwater prawn...
10
Effects of C/N ratio and substrate addition on natural food communities in freshwater prawn monoculture ponds M. Asaduzzaman a, ⁎, M.M. Rahman b , M.E. Azim c , M. Ashraful Islam a , M.A. Wahab a , M.C.J. Verdegem d , J.A.J. Verreth d a Department of Fisheries Management, Faculty of Fisheries, Bangladesh Agricultural University, Mymensingh-2202, Bangladesh b Aquatic Resource Science, Faculty of Fisheries, Kagoshima University, Shimoarata 4-50-20, Kagoshima 890-0056, Japan c Department of Physical and Environmental Sciences, University of Toronto, 1265 Military Trail, Toronto, Ontario, Canada M1C 1A4 d Fish Culture and Fisheries Group, Department of Animal Sciences, Wageningen University, P.O. Box 338, 6700 AH Wageningen, The Netherlands abstract article info Article history: Received 28 September 2009 Received in revised form 27 May 2010 Accepted 31 May 2010 Keywords: C/N ratio Substrates addition Freshwater prawn Natural food community Plankton Periphyton Heterotrophic bacteria Benthic macroinvertebrates An on-station trial was conducted to investigate the effects of three C/N ratios (10/1, 15/1 and 20/1) along with substrate presence or absence on natural food communities in freshwater prawn culture ponds. An experiment was carried out in 40 m 2 ponds stocked with a stocking density of 2 prawn juveniles (5.023 ± 0.02 g) m −2 .A locally formulated and prepared feed containing 30% crude protein with C/N ratio 10 was applied to all ponds. In order to raise the C/N ratio of the feed input to 15 and 20, tapioca starch was applied separately as a source of carbohydrate in addition to the artificial feed. Under substrate treatments, bamboo side shoots were posted vertically in pond bottoms resulting in 100% additional surface area as periphyton substrates. The treatments with different C/N ratios are referred to as “CN10”, “CN15” and “CN20”. Increasing the C/N ratio from 10 to 20 significantly increased the biovolume of phytoplankton, crustaceans and rotifers in the water column by 15%, 6% and 11%, respectively. The biovolume of periphyton was 50% higher in treatment CN20 compared to treatment CN10. Increasing the C/N ratio from 10 to 20 raised the biovolume of total heterotrophic bacteria (THB) in the water column (70%), sediment (36%) and periphyton (40%). The chironomids biovolume was also significantly higher (28%) in treatment CN20 compared to treatment CN10. The addition of substrates decreased the biovolume of water column plankton by 14% but the combined biovolume (plankton + periphyton) was almost double in substrate-added ponds. The biovolume of plankton, periphyton and THB increased significantly with culture time duration whereas the biovolume of benthic macroinvertebrates decreased significantly with culture time indicating that freshwater prawn grazed on them. A significant interaction between C/N ratios and substrate presence or absence was only observed for plankton biovolume in the water column. This study demonstrated that plankton, periphyton and microbial biofloc communities were under-utilized by the freshwater prawn in treatment CN20. This leaves room for increasing the stocking density of prawn and/or inclusion of periphyton grazing fish species to improve nutrient utilization efficiency and overall sustainability. © 2010 Elsevier B.V. All rights reserved. 1. Introduction The ecology of aquaculture ponds consists of a number of inter- related physical, chemical and biological processes. Among them, following three basic processes are important: production, consumption and decomposition. The primary productivity is based on the use of solar energy to convert carbon dioxide into plant biomass through photo- synthesis. Phytoplankton, periphytic algae and submerged plants all contribute to this primary productivity on which the food web in ponds is partially based. In aquaculture ponds, the food web is enhanced by added organic matter in the form of manure and artificial feed. In the consumption process, both autochthonous and added organic matters are eaten directly or indirectly by aquatic animals and used as building blocks of biomass and a source of energy. The decomposition of in situ produced and added organic matter is mediated by mainly heterotro- phic microorganisms that break down and/or decompose organic matter producing detritus and inorganic nutrients. The released inorganic nutrients stimulate primary production, and broaden the base of autotrophic food webs. Pond aquaculture of finfish and crustaceans contributes bulk (47.4% and 6.2%, respectively) of the world aquaculture production (FAO, 2006). The majority of ponds are operated extensively or semi- intensively, strongly depending on the natural food production in the pond, but driven by external nutrient inputs. Artificial diet in prawn/ shrimp aquaculture accounts 50–70% of total operating cost, and therefore, optimizing the natural productivity would be the most Aquaculture 306 (2010) 127–136 ⁎ Corresponding author. Tel.: + 880 1735 558884; fax: + 880 91 55810. E-mail address: [email protected] (M. Asaduzzaman). 0044-8486/$ – see front matter © 2010 Elsevier B.V. All rights reserved. doi:10.1016/j.aquaculture.2010.05.035 Contents lists available at ScienceDirect Aquaculture journal homepage: www.elsevier.com/locate/aqua-online
-
Upload
independent -
Category
Documents
-
view
2 -
download
0
Transcript of Effects of C/N ratio and substrate addition on natural food communities in freshwater prawn...

Aquaculture 306 (2010) 127–136
Contents lists available at ScienceDirect
Aquaculture
j ourna l homepage: www.e lsev ie r.com/ locate /aqua-on l ine
Effects of C/N ratio and substrate addition on natural food communities in freshwaterprawn monoculture ponds
M. Asaduzzaman a,⁎, M.M. Rahman b, M.E. Azim c, M. Ashraful Islam a, M.A. Wahab a,M.C.J. Verdegem d, J.A.J. Verreth d
a Department of Fisheries Management, Faculty of Fisheries, Bangladesh Agricultural University, Mymensingh-2202, Bangladeshb Aquatic Resource Science, Faculty of Fisheries, Kagoshima University, Shimoarata 4-50-20, Kagoshima 890-0056, Japanc Department of Physical and Environmental Sciences, University of Toronto, 1265 Military Trail, Toronto, Ontario, Canada M1C 1A4d Fish Culture and Fisheries Group, Department of Animal Sciences, Wageningen University, P.O. Box 338, 6700 AH Wageningen, The Netherlands
⁎ Corresponding author. Tel.: +880 1735 558884; faxE-mail address: [email protected] (M. Asadu
0044-8486/$ – see front matter © 2010 Elsevier B.V. Aldoi:10.1016/j.aquaculture.2010.05.035
a b s t r a c t
a r t i c l e i n f oArticle history:Received 28 September 2009Received in revised form 27 May 2010Accepted 31 May 2010
Keywords:C/N ratioSubstrates additionFreshwater prawnNatural food communityPlanktonPeriphytonHeterotrophic bacteriaBenthic macroinvertebrates
An on-station trial was conducted to investigate the effects of three C/N ratios (10/1, 15/1 and 20/1) alongwithsubstrate presence or absence on natural food communities in freshwater prawn culture ponds. An experimentwas carried out in 40 m2 ponds stocked with a stocking density of 2 prawn juveniles (5.023±0.02 g)m−2. Alocally formulated and prepared feed containing 30% crude protein with C/N ratio 10 was applied to all ponds.In order to raise the C/N ratio of the feed input to 15 and 20, tapioca starchwas applied separately as a source ofcarbohydrate in addition to the artificial feed. Under substrate treatments, bamboo side shoots were postedvertically in pond bottoms resulting in 100% additional surface area as periphyton substrates. The treatmentswith different C/N ratios are referred to as “CN10”, “CN15” and “CN20”. Increasing the C/N ratio from 10 to 20significantly increased the biovolume of phytoplankton, crustaceans and rotifers in the water column by 15%,6% and 11%, respectively. The biovolume of periphyton was 50% higher in treatment CN20 compared totreatment CN10. Increasing the C/N ratio from 10 to 20 raised the biovolume of total heterotrophic bacteria(THB) in thewater column (70%), sediment (36%) and periphyton (40%). The chironomids biovolumewas alsosignificantly higher (28%) in treatment CN20 compared to treatment CN10. The addition of substratesdecreased the biovolume of water column plankton by 14% but the combined biovolume (plankton+periphyton) was almost double in substrate-added ponds. The biovolume of plankton, periphyton and THBincreased significantly with culture time duration whereas the biovolume of benthic macroinvertebratesdecreased significantly with culture time indicating that freshwater prawn grazed on them. A significantinteraction between C/N ratios and substrate presence or absencewas only observed for plankton biovolume inthewater column. This study demonstrated that plankton, periphyton andmicrobial biofloc communitieswereunder-utilized by the freshwater prawn in treatment CN20. This leaves room for increasing the stockingdensity of prawn and/or inclusion of periphyton grazing fish species to improve nutrient utilization efficiencyand overall sustainability.
: +880 91 55810.zzaman).
l rights reserved.
© 2010 Elsevier B.V. All rights reserved.
1. Introduction
The ecology of aquaculture ponds consists of a number of inter-related physical, chemical and biological processes. Among them,following threebasic processes are important: production, consumptionanddecomposition. Theprimaryproductivity is basedon theuse of solarenergy to convert carbon dioxide into plant biomass through photo-synthesis. Phytoplankton, periphytic algae and submerged plants allcontribute to this primary productivity onwhich the foodweb in pondsis partially based. In aquaculture ponds, the food web is enhanced byadded organic matter in the form of manure and artificial feed. In the
consumption process, both autochthonous and added organic mattersare eaten directly or indirectly by aquatic animals and used as buildingblocks of biomass and a source of energy. The decomposition of in situproduced and added organic matter is mediated by mainly heterotro-phic microorganisms that break down and/or decompose organicmatter producing detritus and inorganic nutrients. The releasedinorganic nutrients stimulate primary production, and broaden thebase of autotrophic food webs.
Pond aquaculture of finfish and crustaceans contributes bulk(47.4% and 6.2%, respectively) of the world aquaculture production(FAO, 2006). The majority of ponds are operated extensively or semi-intensively, strongly depending on the natural food production in thepond, but driven by external nutrient inputs. Artificial diet in prawn/shrimp aquaculture accounts 50–70% of total operating cost, andtherefore, optimizing the natural productivity would be the most

128 M. Asaduzzaman et al. / Aquaculture 306 (2010) 127–136
efficient strategy to optimize the cost of production. Therefore, betterintegration between various resources available on the farm andoptimization of natural productivity of food webs is essential toimprove on-farm efficiency. During the last decades, several attempts(polyculture and/or pond fertilization) have been made to increaseand utilize the pond communities, which serve as natural food itemsfor cultured fish species in aquaculture ponds. To this end, develop-ments such as (1) C/N ratio control (Avnimelech, 1999; Hari et al.,2004; Avnimelech, 2007; Asaduzzaman et al., 2008) and (2) providingsubstrates for periphyton development (van Dam et al., 2002; Tidwellet al., 2000, 2002; Azim et al., 2003a,b; Keshavanath et al., 2001;Milstein et al., 2009) have been found promising to increase naturalfood communities in aquaculture ponds, the formermainly increasingheterotrophic bacteria, the later mainly increase autotrophicorganisms.
The C:N ratio ofmost of the feeds used in semi-intensive aquacultureponds is around 10:1, but bacteria require about 20 units of carbon perunit of nitrogen assimilated (Avnimelech, 1999). Therefore, with such alow C:N ratio in the feed, carbon is the limiting nutrient forheterotrophic bacteria populations in aquaculture ponds. So, thebacterial population will not expand beyond a certain point due to thelimited availability of carbon. The C:N ratio in the pond can be increasedby adding different locally available cheap carbon sources (for reviewsee Hargreaves, 2006). If the C:N ratio is increased by adding acarbohydrate source such as tapioca starch in addition to the regularfeed, the increased availability of carbon allows the heterotrophicbacterial population to grow to adensemass. Therefore,manipulation inthe C/N ratiomay result in a shift from an autotrophic to a heterotrophicsystem (Avnimelech, 1999; Browdy et al., 2001). The heterotrophicbacteria population utilizes the ammonium in addition to the organicnitrogenous wastes to synthesize new cells (single cell microbialprotein) (Schneider et al., 2005), and it may be utilized as a naturalfood source by carps, tilapias (Schroeder, 1987; Beveridge et al., 1989;Rahmatullah and Beveridge, 1993), shrimps (Burford et al., 2004) orfreshwater prawn (Asaduzzaman et al., 2008).
The principle of periphyton based aquaculture is to increase thenatural food production by adding hard substrate materials into thewater column. In a traditional fish pond, phytoplankton is the mostimportant component for energy fixation and fuelling the food web.When substrates are installed in the pond, inorganic nutrients can alsofollow the extra “periphyton loop” (Azim, 2001). This adds a thirdnatural food source existing of periphytic microorganisms that can beconsumed by the fish and also dead periphyton contributes to thedetrital mass in the ponds (van Dam and Verdegem, 2005). However,unlike dead phytoplankton, dead periphyton remains attached tosubstrates, providing a rich source of organic nutrients for heterotrophicmicroorganisms. Processing of this organic matter yields inorganicnutrients that can be utilized by living algae again (Wetzel, 1983).
Recently, we investigated the combined effects of C/N ratio controland periphyton substrates (referred to as C/N-CP technology) onfreshwater prawn production in extensive ponds (Asaduzzaman et al.,2008). Although the effects of C/N ratio control and substrate additionon the finfish and shellfish production are well documented, theircombined effects on natural communities, part of which serve asnatural diet for aquacultured species, have never been investigated.This paper is further analysis of the above mentioned experimentinvestigating how C/N ratio control and presence and absence ofadded substrates influence the natural food communities in aquacul-ture ponds.
2. Materials and methods
2.1. Experimental design
The experiment had a 3×2 factorial design with three levels of C:Nratio (10, 15 and 20) and two levels of substrate (with and without
substrates). Treatments with different C/N ratio are referred to as“CN10”, “CN15” and “CN20”. Treatments were executed in triplicateand assigned randomly between ponds.
2.2. Experimental site and pond preparation
The experiment was carried out at the Fisheries Field Laboratory ofthe Faculty of Fisheries, Bangladesh Agricultural University (BAU),Mymensingh, Bangladesh for a period of 120 days. A 81×8.9 mearthen pond was drained completely and partitioned by galvanizediron sheets into 18 small ponds of 40 m2 each with an average waterdepth of 1 m. The ponds were rain-fed and fully exposed to prevailingsunlight and used before for research. Before starting the experiment,ponds were manually cleaned of aquatic vegetation. All unwantedfishes were eradicated by rotenone application at the rate of100 g pond−1. Lime (CaCO3) was applied to all ponds at the rate of250 kg ha−1 (Day 1). On Day 2, ponds were filled with water from thenearby deep tube-well. On Day 4, 15 bamboo kanchi (side shoots ofbamboo) per m2 water surface area, with a mean diameter of 2.8 cmwere posted vertically into the bottom mud in substrate treatmentponds, excluding a 0.5 m wide perimeter. This resulted in anadditional area of 40 m2 for periphyton development equaling about100% of the pond surface area. On Day 5, all ponds were fertilized withsemi decomposed cattle manure (3000 kg ha−1), urea (100 kg ha−1)and triple super phosphate (100 kg ha−1). After fertilization, theponds were left for 10 days to allow plankton development in thewater column and periphyton growth on substrates, and weresubsequently stocked.
2.3. Prawn stocking and pond management
Juveniles of M. rosenbergii (5.023±0.02 g) purchased from anearby commercial hatchery were stocked in the ponds at a density of2 juveniles m−2. A locally formulated and prepared pellet feed(2 mm) containing 30% protein with C/N ratio close to 10 wasapplied. The daily feeding rate was 5% body weight at the start ofexperiment, and declined gradually to 3% body weight at the end ofthe culture period with assuming 80% survival of total stock in eachpond. Feed was distributed evenly over the ponds' surface, twice dailyat 07:00 and 18:00 h. Weights of 10% of total number of prawn weremeasured individually in every month to adjust the feeding rate. Thetapioca starch was used as carbohydrate source for manipulating theC/N ratio. In order to raise the C/N ratio from 10 (as control) to 15 and20, 0.45 and 0.9 kg tapioca starch were applied for each kg offormulated feed in the CN15 and CN20 treatment ponds, respectively.The pre-weighed tapioca starch was mixed in a beaker with pondwater and uniformly distributed over the ponds' surface directly afterthe feed application at 07:00 h.
2.4. Assessment of the plankton in water column
Plankton samples were collected monthly by pooling 10 l of waterfrom five different locations in each pond and passing them through a45 μmmesh plankton net. The concentrated samples were preserved insmall plastic bottles with 5% buffered formalin. Qualitative andquantitative estimations of plankton were done using a Sedgewick–Rafter (S–R) cell containing 1000 1-mm3 cells. A 1 ml samplewas put inthe S–R cell andwas left 15 min undisturbed to allow plankton to settle.The plankton in 10 randomly selected cellswere indentified up to genuslevel and counted under a binocular microscope (Swift, M-4000).Planktons were identified using keys by Ward and Whipple (1959),Prescott (1962), Belcher and Swale (1976), and Bellinger (1992).Plankton abundance was calculated using the following formula:
N = P×C×100ð Þ=L

129M. Asaduzzaman et al. / Aquaculture 306 (2010) 127–136
where N is the number of plankton cells or units per liter of originalwater; P, the number of plankton counted in 10 fields; C, the volumeof final concentrate of the sample (ml); L, the volume (l) of the pondwater sample.
2.5. Assessment of periphyton
From each pond, three bamboo kanchiwere selected randomly and2×2 cm2 samples of periphyton were taken at each of three depths(25, 50 and 75 cm below from the water surface) per pole on amonthly basis starting after 7 days of substrate installation. Periph-yton samples from different depths and different bamboo kanchiwerepooled and preserved in a labeled plastic vial containing 5% bufferedformalin. After vigorous shaking, a 1 ml sub-sample was transferred inan S–R cell and the periphyton number was estimated in 10 randomlyselected cells under a binocular microscope (Swift, M-4000). Taxawere identified to genus level using the similar keys as plankton.Periphyton density was calculated using the following formula:
N = P×C×100ð Þ=S
where N is the number of periphyton cells or units per cm2 surfacearea; P, the number of periphyton units counted in 10 fields; C, thevolume of final concentrate of the sample (ml); S, the area of scrapedsurface (cm2).
2.6. Assessment of bacterial load in water, sediment and periphyton
Total bacterial load of pond water, sediment and periphyton weredetermined on monthly basis between 09:00 and 10:00 h. All sampleswere collected from 5 different locations, mixed homogenously andcollected with sterile glass bottles for bringing to the BacteriologicalLaboratory, Department of Microbiology and Hygiene, Faculty ofVeterinary Science, BAU, Mymensingh, Bangladesh. One milliliterwater sample was transferred with a sterile pipette to a test tubecontaining 9.0 ml of phosphate buffered saline (PBS) and the tube wasshaken thoroughly whereas 5.0 g of each sediment and periphytonsamples were weighed and transferred to a sterile conical flask andmade up to 50 ml with phosphate buffered saline (PBS) and thecontentsmixed thoroughly to prepare a stock solution. Serial dilution ofup to 10−6 for water and 10−8 for sediment and periphyton wereprepared with PBS. Volumes (0.1 ml) of each dilution were spread overthe surface of duplicate plates of tryptone soya agar (TSA; Difco, Detroit,MI, USA) with incubation at 30 °C for 24–48 h. Plates with 30–300 colony forming units (CFU) were counted with a Leica QuebecDarkfield Colony Counter (Leica, Inc., Buffalo, NY, USA) and expressed asCFU.
2.7. Assessment of benthic macroinvertebrates
The benthic macroinvertebrates samples were collected monthlywith an Ekman grab (area: 225 cm2). In each pond, bottom mudsamples were collected from 3 different locations, which were thencombined into a composite sample. Benthic macroinvertebrates werecollected after filtering sediments through a 250 μm mesh sieve andpreserved in a plastic vial containing a 10% buffered formalin.Identification keys used for benthic macroinvertebrates were Brin-khurst (1971), and Pinder and Reiss (1983). Benthic macroinverte-brates density was calculated using the formula,
N = Y × 10;000= 3A
with N= the number of benthic organisms (number m−2); Y=totalnumber of benthic organisms counted in 3 samples; A=area ofEkman dredge (cm2).
2.8. Data analysis
The biovolumes of plankton, periphyton and benthic macroinver-tebrates were calculated according to Rahman et al. (2006). Thebiovolumes of heterotrophic bacteria were calculated using the valueof Nakano and Kawabata (2000). The biovolumes of plankton,periphyton, THB and benthic macroinvertebrates were analyzed byrepeated measures ANOVAwith addition of substrate and C/N ratio asmain factors and time as the sub-factor (Gomez and Gomez, 1984).The data were checked for normality, and percentage and ratio datawere arcsine transformed. All ANOVA were performed using SAS 6.21program (SAS Institute, Cary, NC 27513, USA). If a main effect wassignificant, the ANOVAwas followed by Tukey's Test at Pb0.05 level ofsignificance.
3. Results
3.1. Effects on plankton biovolume
The plankton communities in pond water consisted of four groupsof phytoplankton and two groups of zooplankton in all treatments.Forty four genera of phytoplankton belonging to Bacillariophyceae(13 genera), Chlorophyceae (21 genera), Cyanophyceae (7 genera)and Euglenophyceae (3 genera) were found (Table 1). Seventeengenera of zooplankton, including nine genera of Crustacea and eightgenera of Rotifera were also identified (Table 1). In all treatments thesame genera of plankton were found. Among phytoplankton Synedra,Tabellaria, Fragillaria, Melosira, Navicula, and Nitzschia (Bacillariophy-ceae), Chlorella, Coelastrum, Palmella, Pediastrum, Sphaerocystis,Stigeoclonium, Ulothrix and Scenedesmus (Chlorophyceae),Microcystis,Anabaena and Gomphosphaeria (Cyanophyceae), Euglena and Phacus(Euglenophyceae), and among zooplankton Cyclops, Diaphanosomaand crustacean nauplii, and Brachionus, Asplanchna and Trichocerca(Rotifera) were the dominating genera.
The results of the ANOVA on the biovolume of major groups ofplankton are shown in Table 2. C/N ratio control influenced thebiovolume of all the major groups of plankton (except Chlorophyceaeand Cyanophyceae). The mean total biomass of Bacillariophyceae,Euglenophyceae and total phytoplankton were higher in treatmentCN20 than in treatment CN10. In the case of Crustacea, Rotifera, totalzooplankton and total plankton, the mean total biomass were higher intreatments CN20 and CN15 compared to treatment CN10. Increasing C/N ratio from 10 to 20 increased the biovolume of phytoplankton by 15%and zooplankton by 8.5%. The addition of substrates also influenced thebiovolume of all the major groups of plankton (except Chlorophyceae).It decreased the biovolume of phytoplankton by 11.2% and zooplanktonby 14.4%. There was an interaction effect of C/N ratio control andperiphyton substrates on biovolume of all of the major groups ofplankton (except Chlorophyceae), total phytoplankton, total zooplank-ton and total plankton (Table 2; Fig. 1). The ponds provided withperiphyton substrates had similar biovolume in treatment CN10, muchlower biovolume in CN15 and lower biovolume in CN20 than in pondswithout periphyton substrates (interaction effects, Fig. 1). However,plankton biomasswas always higher in substrates free ponds comparedto substrates added ponds (Fig. 2) indicating that periphyton systemsaffect planktonproduction to some extent. However, although planktonbiomass was always lower in substrate-added ponds, combinedbiomass (plankton+periphyton) was significantly higher (95.7%) inthese ponds compared to the substrate free ponds (Table 2). The meanbiomass of different groups of plankton, total phytoplankton, totalzooplankton and total plankton were tending to increase from thesecondmonth and continued until the end of the experiment (Table 3).There was an interaction effect of experimental period (months) andsubstrates addition on biovolume of all of the major groups of plankton(except Bacillariophyceae and Chlorophyceae), total phytoplankton,total zooplankton and total plankton.However, therewasno interaction

Table 1List of plankton and periphyton genera recorded from the experimental ponds.
Group Genus Plankton Periphyton
Bacillariophyceae Actinella √ ×Asterionella √ ×Coscinodiscus √ √Cyclotella √ √√Diatoma √ √√Fragillaria √√ √√Melosira √√ √Navicula √√ √√Nitzschia √√ √Rhizosolenia √ ×Surirella √ √Synedra √√ √√Tabellaria √√ √√
Chlorophyceae Actinastrum √ √Ankistrodesmus √ √Botryococcus √ √Chaetophora √ √Chlorella √√ √√Closterium √ √Coelastrum √√ √Draparnaldia √ √Gonatozygon √ √Microspora × √√Oedogonium √ √Oocystis √ √√Palmella √√ √√Pediastrum √√ √√Scenedesmus √√ √√Sphaerocystis √√ √√Spirogyra √ ×Stigeoclonium √√ √Tetraedron √ √Ulothrix √√ √√Volvox √ √Zygnema √ √
Cyanophyceae Anabaena √√ √√Anacystis √ √Aphanizomenon √ √√Aphanocapsa √ √√Gomphosphaeria √√ √√Microcystis √√ √√Oscillatiria √ √
Euglenophyceae Euglena √√ √√Phacus √√ √√Trachelomonas √ ×
Rotifera Asplanchna √√ √√Brachionus √√ √√Filinia √ √√Keratella √ ×Lecane √ √Trichocerca √√ √Polyarthra √ ×Notholca √ ×
Crustaceans Ceriodaphnia √ ×Cyclops √√ ×Daphnia √ ×Diaphanosoma √√ ×Diaptomus √ ×Lepotodora √ ×Moina √ ×Nauplius larvae √√ √√Sida √ ×
“√” indicates presence; “√√” indicates dominating genera “×” indicates absence.
130 M. Asaduzzaman et al. / Aquaculture 306 (2010) 127–136
effect of C/N ratio control and experimental periods on the biovolume ofany groups of water column plankton (Table 3).
3.2. Effects on periphyton biovolume
The list of the identified genera under the different groups ofperiphyton is summarized in Table 1. Most of the identified algalperiphytic genera were common in water column phytoplankton
(except 5 genera). About 40 genera of algae belonging to Bacillar-iophyceae (10 genera), Chlorophyceae (21), Cyanophyceae (7) andEuglenophyceae (2) and 6 genera of attached zooplankton belongingto Rotifer (5) and Crustacea (1) were identified as periphytoncommunities in substrate-added ponds. Among autotrophic periph-yton communities, Synedra, Tabellaria, Navicula, Fragillaria, Cyclotellaand Diatoma (Bacillariophyceae), Chlorella, Sphaerocystes, Palmella,Pediastrum, Microspora, Oocystis, Ulothrix and Scenedesmus (Chlor-ophyceae), Microcystis, Anabaena, Aphanizomenon, Aphanocapsa andGomphosphaeria (Cyanophyceae), Euglena and Phacus (Euglenophy-ceae), and among zoobenthic periphyton crustacean nauplii, andAsplanchna, Brachionus and Filinia (Rotifera) were the dominatinggenera.
The results of the ANOVA ofmajor groups of periphyton biovolumeare shown in Table 4. C/N ratio control influenced the biovolume of allthe major groups of periphytic plankton except Crustaceans. Themean total biomass of all the major groups of algal periphyton andzoobenthic periphyton (except Crustaceans) were significantly higherin treatment CN20 than in treatment CN10. Increasing C/N ratio from10 to 20 increased the biovolume of algal periphyton by 64%,zoobenthic periphyton by 48% and total periphyton by 50%. Thebiovolume of all the major groups of periphyton (except Eugleno-phyceae and Crustaceans) also varied with the culture period and themean total biomass was higher at the end of the culture periods(Table 4). However, therewas no interaction effect of C/N ratio controland experimental periods on the biovolume of all groups ofperiphyton.
3.3. Effects on total heterotrophic bacterial biovolume (THB)
C/N ratio control influenced the THB biovolume of water column,sediment and periphyton whereas the addition of substrates had noeffects on them (Table 5). Increasing C/N ratio from 10 to 20 increasedthe biovolume of water THB by 70%, sediment THB by 36% andperiphyton THB by 40%. The biovolume of THB in the water column,sediment and periphyton increased during the culture period and therate of increase was the highest in treatment CN20, intermediate intreatment CN15 and the lowest in treatment CN10 (Fig. 3; Table 6).There was no interaction effect of experimental periods (month) andsubstrates addition on the biovolume of THB load in water column,sediment and periphyton. However, an interaction effect of experi-mental period (month) and C/N ratio control was observed on thebiovolume of THB load in water column, sediment and periphyton(Table 6).
3.4. Effects on benthic macroinvertebrates biovolume
The results of the ANOVA of major groups of benthic macro-invertebrates biovolume are shown in Table 7. The benthic macro-invertebrates were divided into Chironomidae, Oligochaeta, Molluscaand un-identified groups. Chironomidae was the most dominantgroups among benthos contributing 65 to 70% to the total biomassfollowed by Oligochaeta. C/N ratio control influenced the biovolumeof Chironomidae only among all the major groups of benthicmacroinvertebrates. Increasing C/N ratio from 10 to 20 increasedthe biovolume of total benthic macroinvertebrates by 21%. Addition ofsubstrates had no effect on the biovolume of any groups of benthicmacroinvertebrates. The biovolume of Chironomidae and totalbenthic macroinvertebrates was similar during the initial samplingand the first month of culture and then decreased continuously untilthe end of the culture period (Table 8). However, there was nointeraction effect of C/N ratio control and experimental periods andsubstrates addition and experimental periods on the biovolume of allof the major groups of benthic macroinvertebrates (Table 8).
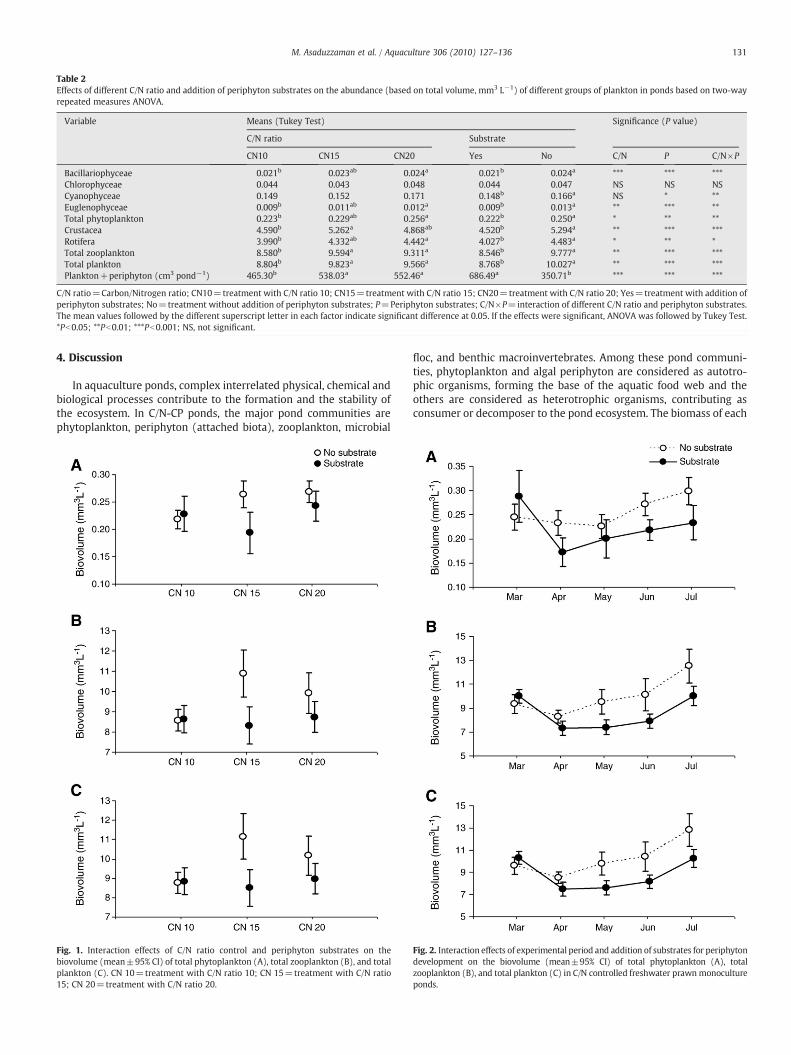
Table 2Effects of different C/N ratio and addition of periphyton substrates on the abundance (based on total volume, mm3 L−1) of different groups of plankton in ponds based on two-wayrepeated measures ANOVA.
Variable Means (Tukey Test) Significance (P value)
C/N ratio Substrate
CN10 CN15 CN20 Yes No C/N P C/N×P
Bacillariophyceae 0.021b 0.023ab 0.024a 0.021b 0.024a *** *** ***Chlorophyceae 0.044 0.043 0.048 0.044 0.047 NS NS NSCyanophyceae 0.149 0.152 0.171 0.148b 0.166a NS * **Euglenophyceae 0.009b 0.011ab 0.012a 0.009b 0.013a ** *** **Total phytoplankton 0.223b 0.229ab 0.256a 0.222b 0.250a * ** **Crustacea 4.590b 5.262a 4.868ab 4.520b 5.294a ** *** ***Rotifera 3.990b 4.332ab 4.442a 4.027b 4.483a * ** *Total zooplankton 8.580b 9.594a 9.311a 8.546b 9.777a ** *** ***Total plankton 8.804b 9.823a 9.566a 8.768b 10.027a ** *** ***Plankton+periphyton (cm3 pond−1) 465.30b 538.03a 552.46a 686.49a 350.71b *** *** ***
C/N ratio=Carbon/Nitrogen ratio; CN10=treatment with C/N ratio 10; CN15=treatment with C/N ratio 15; CN20=treatment with C/N ratio 20; Yes=treatment with addition ofperiphyton substrates; No=treatment without addition of periphyton substrates; P=Periphyton substrates; C/N×P=interaction of different C/N ratio and periphyton substrates.The mean values followed by the different superscript letter in each factor indicate significant difference at 0.05. If the effects were significant, ANOVA was followed by Tukey Test.*Pb0.05; **Pb0.01; ***Pb0.001; NS, not significant.
131M. Asaduzzaman et al. / Aquaculture 306 (2010) 127–136
4. Discussion
In aquaculture ponds, complex interrelated physical, chemical andbiological processes contribute to the formation and the stability ofthe ecosystem. In C/N-CP ponds, the major pond communities arephytoplankton, periphyton (attached biota), zooplankton, microbial
Fig. 1. Interaction effects of C/N ratio control and periphyton substrates on thebiovolume (mean±95% CI) of total phytoplankton (A), total zooplankton (B), and totalplankton (C). CN 10=treatment with C/N ratio 10; CN 15=treatment with C/N ratio15; CN 20=treatment with C/N ratio 20.
floc, and benthic macroinvertebrates. Among these pond communi-ties, phytoplankton and algal periphyton are considered as autotro-phic organisms, forming the base of the aquatic food web and theothers are considered as heterotrophic organisms, contributing asconsumer or decomposer to the pond ecosystem. The biomass of each
Fig. 2. Interaction effects of experimental period and addition of substrates for periphytondevelopment on the biovolume (mean±95% CI) of total phytoplankton (A), totalzooplankton (B), and total plankton (C) in C/N controlled freshwater prawnmonocultureponds.

Table 3Effects of experimental period and its interactions with addition of substrates and different C/N ratio on the abundance (based on total volume, mm3 L−1) of different groups ofplankton in ponds based on two-way repeated measures ANOVA.
Variable Means (Tukey Test) Significance (P value)
Month
March April May June July Month Month×Subs Month×C/N
Bacillariophyceae 0.025ab 0.019d 0.020 cd 0.023 cd 0.026a *** NS NSChlorophyceae 0.056a 0.036b 0.042ab 0.047ab 0.045ab ** NS NSCyanophyceae 0.173a 0.143ab 0.0131b 0.164ab 0.176a ** ** NSEuglenophyceae 0.011b 0.010b 0.010b 0.010b 0.041a *** ** NSTotal phytoplankton 0.265a 0.207b 0.204b 0.273ab 0.261a *** ** NSCrustacea 5.089ab 4.088c 4.747bc 4.796bc 5.814a *** * NSRotifera 4.570b 3.770c 3.557c 4.079bc 5.296a *** * NSTotal zooplankton 9.659b 7.859c 8.035c 8.875bc 11.110a *** ** NSTotal plankton 9.925b 8.066c 8.508c 9.118bc 11.371a *** ** NSPlankton+periphyton (cm3 pond−1) 533.90b 456.12c 464.52c 505.96bc 632.50a *** ** NS
The mean values followed by the different superscript letter in each factor indicate significant difference at 0.05. If the effects were significant, ANOVA was followed by Tukey Test.*Pb0.05; **Pb0.01; ***Pb0.001; NS, not significant.
Table 4Effects of C/N ratio control and experimental period on the abundance (based on total volume, mm3 cm−2) of different groups of periphyton in ponds based on two-way repeatedmeasures ANOVA.
Variable Means (Tukey Test) Significance (P value)
C/N ratio Month
CN10 CN15 CN20 March April May June July C/N Month C/N×Month
Bacillariophyceae 0.015c 0.020b 0.026a 0.014b 0.023a 0.019ab 0.023a 0.023a *** *** NSChlorophyceae 0.027b 0.037a 0.043a 0.023c 0.034bc 0.033bc 0.040ab 0.048a *** *** NSCyanophyceae 0.039b 0.050ab 0.062a 0.031b 0.060a 0.058a 0.057a 0.044ab ** ** NSEuglenophyceae 0.001b 0.001b 0.002a 0.001 0.002 0.001 0.001 0.001 * NS NSTotal algae 0.081c 0.108b 0.133a 0.069b 0.119a 0.110a 0.120a 0.116a *** *** NSRotifera 0.336b 0.399ab 0.498a 0.411ab 0.344b 0.321b 0.411ab 0.568a * * NSCrustacea 0.149 0.218 0.219 0.204 0.204 0.189 0.175 0.204 NS NS NSTotal zoobenthic periphyton 0.485b 0.618ab 0.716a 0.615ab 0.548b 0.511b 0.586ab 0.772a ** * NSTotal periphyton 0.566b 0.726a 0.849a 0.685ab 0.667b 0.621b 0.706ab 0.888a *** * NS
C/N ratio=Carbon/Nitrogen ratio; CN10=treatment with C/N ratio 10; CN15=treatment with C/N ratio 15; CN20=treatment with C/N ratio 20; C/N×Month=interaction ofdifferent C/N ratio andmonths. Themean values followed by the different superscript letter in each factor indicate significant difference at 0.05. If the effects were significant, ANOVAwas followed by Tukey Test. *Pb0.05; **Pb0.01; ***Pb0.001; NS, not significant.
132 M. Asaduzzaman et al. / Aquaculture 306 (2010) 127–136
of these communities in aquaculture ponds and lakes is influenced bymanagement factors, such as species used in culture system, fishstocking density and ratio, and nutrient input quality and quantity(Milstein, 1993; Diana et al., 1997). Fish feeding habits also have animportant influence on the quantity of these freshwater communitiesboth directly by consumption and indirectly through influencing thefood web and nutrients availability (Rahman et al., 2006).
Table 5Effects of different C/N ratio and addition of periphyton substrates on the abundance(based on total volume) of total heterotrophic bacterial load in water, sediment andperiphyton based on two-way repeated measures ANOVA.
Variable Means (Tukey Test) Significance(Pvalue)
C/N ratio Periphytonsubstrate
CN10 CN15 CN20 Yes No C/N P C/N×P
Water THB(×103 μm3 ml−1)
38.33c 52.49b 65.29a 52.20 51.88 *** NS NS
Sediment THB(×105 μm3 g−1)
56.58c 66.39b 76.99a 66.43 66.88 *** NS NS
Periphyton THB(×105 μm3 g−1)
33.45a 38.97b 46.74c – – *** – –
C/N ratio=Carbon/Nitrogen ratio; CN10=treatmentwithC/N ratio10; CN15=treatmentwith C/N ratio 15; CN20=treatment with C/N ratio 20; Yes=treatment with addition ofperiphyton substrates; No=treatment without addition of periphyton substrates;P=Periphyton substrates; C/N×P=interaction of different C/N ratio and periphytonsubstrates. The mean values followed by the different superscript letter in each factorindicate significant difference at 0.05. If the effects were significant, ANOVA was followedby Tukey Test. ***Pb0.001; NS, not significant.
In the present research, the observed increase in the biovolume ofplankton (9%) and periphyton (50%) in higher C:N ratio treatmentmight be due to the higher amount of added organic matter in suchponds. Thehigher C:N ratio treatment ponds (CN20) receivedadditional0.9 kg tapioca starch for each kg of applied feed to maintain a high C/Nratio compared to the CN10 treatment ponds. Azim and Little (2006)reported that the formation of autotrophic organisms in aquacultureponds can be supplemented by the addition of organic matter. It hasbeen reported that increased amounts of organic matter indirectlysupplies inorganic nutrients through decomposition by bacteria(Moriarty, 1986, 1997; Milstein, 1992). In our previous study(Asaduzzaman et al., 2008), this resulted overall higher inorganicnutrient (except nitrogenous compounds) concentration in treatmentCN20 compared to the other treatments. In turn, increased nutrientsavailability resulted in increased phytoplankton and periphytonproduction as indicated by a greater biovolume of them in treatmentCN20. Another cause might be due to the stimulatory effects betweenautotrophic and heterotrophic organisms. The experiment was con-ducted in earthen aquaculture ponds where both autotrophic andheterotrophic organisms interact. Algae and bacteria have a range ofstimulatory or inhibitory effects on each other (Cole, 1982). Along withthe added carbohydrate, senescent algae or algal detritus are a majorsource of organic substrate for heterotrophic bacterial growth whereasliving algae provide oxygen for decomposition. In return, bacteriaregenerate inorganic nutrients and vitamins that stimulate algalproductivity (Cole, 1982). At the same time, higher amount ofphytoplankton, periphytic algae and THB might have quickly utilizedthe nutrients components mainly ammonia and nitrate from the watercolumn resulting in a significant reduction of it in treatment CN20
Fig. 3. Interaction effects of different C/N ratio and experimental time on the biovolume(mean±95% CI) of water heterotrophic bacteria (A), sediment heterotrophic bacteria(B) and periphyton heterotrophic bacteria (C) in C/N controlled freshwater prawnmonoculture ponds.
Table 7Effects of different C/N ratio and addition of periphyton substrates on the abundance(based on total volume, cm3 m−2) of different groups of benthic macroinvertebrates inponds based on two-way repeated measures ANOVA.
Variable Means (Tukey Test) Significance(P value)
C/N ratio Substrate
CN10 CN15 CN20 Yes No C/N P C/N×P
Chironomidae 7.837b 7.794b 10.058a 8.192 8.934 ** NS NSOligochaeta 2.088 2.389 2.345 2.150 2.397 NS NS NSMollusca 1.037 1.137 1.062 1.144 1.014 NS NS NSUn-identifiedgroups
0.823 0.754 0.841 0.854 0.758 NS NS NS
Total benthos 11.787b 12.077ab 14.309a 12.343 13.105 * NS NS
C/N ratio=Carbon/Nitrogen ratio; CN10=treatmentwithC/N ratio10; CN15=treatmentwith C/N ratio 15; CN20=treatment with C/N ratio 20; Yes=treatment with addition ofperiphyton substrates; No=treatment without addition of periphyton substrates;P=Periphyton substrates; C/N×P=interaction of different C/N ratio and periphytonsubstrates. The mean values followed by the different superscript letter in each factorindicate significant difference at 0.05. If the effects were significant, ANOVA was followedby Tukey Test. *Pb0.05; **Pb0.01; ***Pb0.001; NS, not significant.
133M. Asaduzzaman et al. / Aquaculture 306 (2010) 127–136
(Asaduzzaman et al., 2008). The Pearson correlation analysis showedthat there was a significant relationship among the nitrogenouscompounds concentration, plankton and heterotrophic bacteria biovo-lume (Fig. 4). It showed that observed higher biomass of bacteria andphytoplankton reduced the concentration of TAN and NO3–N. Ingeneral, phytoplanktons take up inorganic N and bacteria releaseinorganic N (through decomposition). In C/N controlled system,increased heterotrophic bacteria utilizeN to synthesize bacterial proteinand new cells thereby, reduced toxic nitrogenous compounds from theaquaculture ponds (Hari et al., 2004).
Periphyton is a complex mixture of autotrophic and heterotrophicorganisms (Azim et al., 2005) and hence, there is an intense exchangeof inorganic and organic solutes between autotrophic and heterotro-
Table 6Effects of experimental period and its interactions with addition of substrates and different Cin water, sediment and periphyton based on two-way repeated measures ANOVA.
Variable Means (Tukey Test)
Month
March April May
Water THB (×103 μm3 ml−1) 32.97e 49.05d 55.38c
Sediment THB (×105 μm3 g−1) 49.29e 60.63d 67.67c
Periphyton THB (×105 μm3 g−1) 24.26e 34.91d 42.35c
The mean values followed by the different superscript letter in each factor indicate significa***Pb0.001; NS, not significant.
phic components within the periphyton assemblage (Verdegem et al.,2005). Again in ponds with substrates, organic matter and nutrientsderived from feed and carbohydrates are partly trapped by periphyton(van Dam et al., 2002) which had a fertilization effect on autotrophicperiphyton in higher C/N ratio treatments. Hence, a better growth andturnover of bacteria in the periphyton, also means more inorganicnutrients for the algae in higher C/N ratio treatments. The biovolumeof all of the major groups of autotrophic periphyton increased steadilyduring the experimental period (Table 3), indicating the low grazingpressure on periphyton by the overall low biomass of prawns. Thereported stocking densities of freshwater prawn were as high as120,000 ha−1 in substrate based systems (Tidwell and Bratvold, 2005)which was much higher than the density maintained in the presentstudy. Freshwater prawn selectively feeds (animal portion anddetrital aggregates rather than picking up mixed biomass) onperiphyton (Uddin et al., 2006) thereby, allowing them to growcontinuously in low stocking density monoculture ponds.
The observed higher biovolume of autotrophic organisms due toincreased C:N ratio also influenced zooplankton and zoobenthicperiphyton, resulting in higher biomass in treatment CN20 comparedto treatment CN10. Substrates addition decreased the phytoplanktonbiovolume in thewater column, whichmight be due to the competitionbetween periphytic algae and water column algae for light andbioavailable nutrients in overlying water. Secondly, periphyton sub-stratesmight have shading effects which reduce sunlight availability forphytoplankton. Thirdly, some algal species might prefer to be colonizedon hard substrates and therefore move from planktonic state to theperiphytic state if substrate were available. The observed higherbiovolume (96%) of combined production of plankton and periphytonin substrate based ponds indicated that periphyton substrates compen-sated the adverse effects on water column plankton. In addition,substrates based system provided additional natural food source
/N ratio on the abundance (based on total volume) of total heterotrophic bacterial load
Significance (P value)
June July Month Month×Subs Month×C/N
59.36b 63.44a *** NS ***74.46b 81.33a *** NS ***46.43b 50.65a *** – ***
nt difference at 0.05. If the effects were significant, ANOVA was followed by Tukey Test.
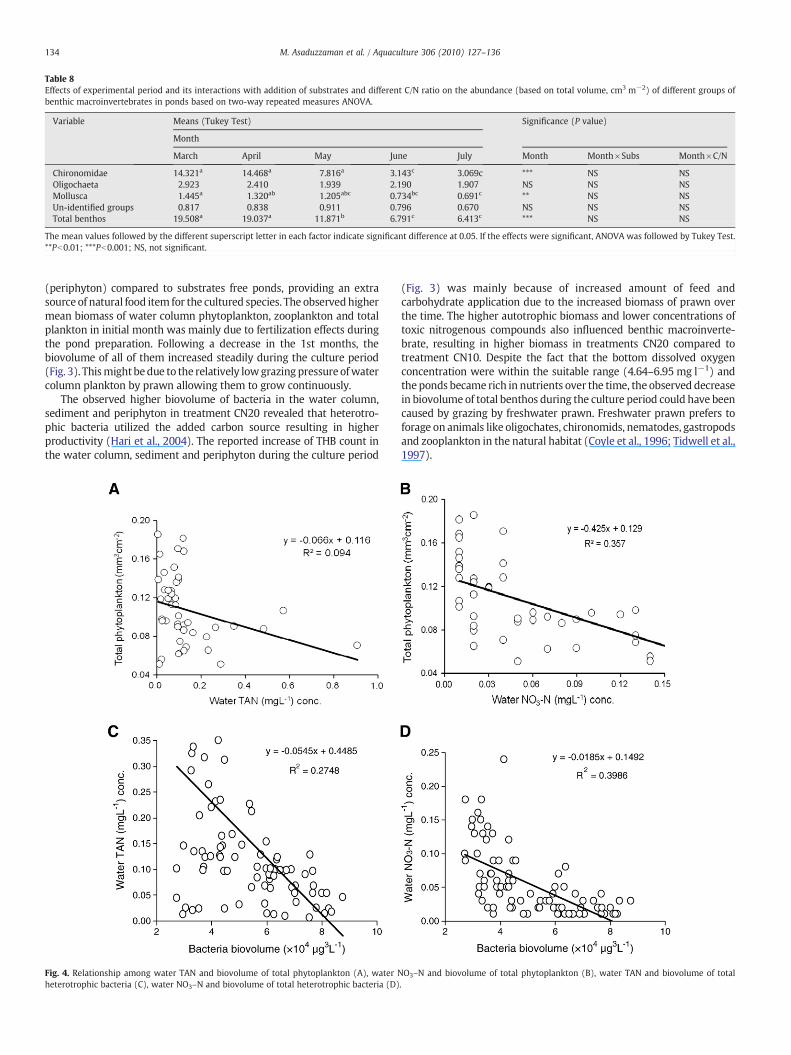
Table 8Effects of experimental period and its interactions with addition of substrates and different C/N ratio on the abundance (based on total volume, cm3 m−2) of different groups ofbenthic macroinvertebrates in ponds based on two-way repeated measures ANOVA.
Variable Means (Tukey Test) Significance (P value)
Month
March April May June July Month Month×Subs Month×C/N
Chironomidae 14.321a 14.468a 7.816a 3.143c 3.069c *** NS NSOligochaeta 2.923 2.410 1.939 2.190 1.907 NS NS NSMollusca 1.445a 1.320ab 1.205abc 0.734bc 0.691c ** NS NSUn-identified groups 0.817 0.838 0.911 0.796 0.670 NS NS NSTotal benthos 19.508a 19.037a 11.871b 6.791c 6.413c *** NS NS
The mean values followed by the different superscript letter in each factor indicate significant difference at 0.05. If the effects were significant, ANOVA was followed by Tukey Test.**Pb0.01; ***Pb0.001; NS, not significant.
134 M. Asaduzzaman et al. / Aquaculture 306 (2010) 127–136
(periphyton) compared to substrates free ponds, providing an extrasource of natural food item for the cultured species. The observedhighermean biomass of water column phytoplankton, zooplankton and totalplankton in initial month was mainly due to fertilization effects duringthe pond preparation. Following a decrease in the 1st months, thebiovolume of all of them increased steadily during the culture period(Fig. 3). Thismight bedue to the relatively lowgrazing pressure ofwatercolumn plankton by prawn allowing them to grow continuously.
The observed higher biovolume of bacteria in the water column,sediment and periphyton in treatment CN20 revealed that heterotro-phic bacteria utilized the added carbon source resulting in higherproductivity (Hari et al., 2004). The reported increase of THB count inthe water column, sediment and periphyton during the culture period
Fig. 4. Relationship among water TAN and biovolume of total phytoplankton (A), water Nheterotrophic bacteria (C), water NO3–N and biovolume of total heterotrophic bacteria (D)
(Fig. 3) was mainly because of increased amount of feed andcarbohydrate application due to the increased biomass of prawn overthe time. The higher autotrophic biomass and lower concentrations oftoxic nitrogenous compounds also influenced benthic macroinverte-brate, resulting in higher biomass in treatments CN20 compared totreatment CN10. Despite the fact that the bottom dissolved oxygenconcentration were within the suitable range (4.64–6.95 mg l−1) andthe ponds became rich in nutrients over the time, the observed decreasein biovolume of total benthos during the culture period could have beencaused by grazing by freshwater prawn. Freshwater prawn prefers toforage on animals like oligochates, chironomids, nematodes, gastropodsand zooplankton in the natural habitat (Coyle et al., 1996; Tidwell et al.,1997).
O3–N and biovolume of total phytoplankton (B), water TAN and biovolume of total.

Fig. 5. A conceptual model of nitrogenous compounds, freshwater communities and cultured prawn interaction, as influenced by the increasing C/N ratio from 10 to 20 and additionof substrates for periphyton development.
135M. Asaduzzaman et al. / Aquaculture 306 (2010) 127–136
A conceptual model of nitrogenous compounds, freshwater prawnand foodorganisms interaction, as influencedby the increasingC/N ratiofrom 10 to 20 and addition of substrates for periphyton developmentusing thedata fromAsaduzzamanet al. (2008)andTables 2–8 is given inFig. 5. The uneaten feed and feces contributed to the organicmatter loadof the system. The microbial decomposition of organic matter in thesystem led to increased levels of TAN and nitrite, both harmful tofreshwater prawns even at low concentrations (Jiménez-Montealegreet al., 2002; Torres-Beristain et al., 2006). The process of nitrogenouscompounds utilization and transformations take place in water,sediment and periphyton mat as indicated by blue block arrows(Fig. 5). In C/N controlledperiphyton basedponds (CN20+P) the addedcarbon source, together with the waste nitrogen was converted intomicrobial floc, which in turn can be eaten by the cultured freshwaterprawn (Crab et al., 2007). Nitrifying bacteria process the ammonia intonitrite, which is also toxic, and then nitrite into nitrate, which is muchless harmful. Both TAN and nitrate were assimilated by the phyto-plankton, periphyton andmicrobialfloc present in the ponds. IncreasingC/N ratio increased the biovolume of plankton, periphyton, heterotro-phic bacteria and benthos, and finally increased the freshwater prawnproduction as indicated by upwards yellow block arrows (Fig. 5).Among these natural food items, freshwater prawn effectively graze onbenthos indicated by solid arrow resulting in decrease of abundanceover the time as indicated by downwards black block arrow, whereas,other natural food items were under-utilized by freshwater prawn asindicated by the dotted arrows.
In conclusion, increasing C/N ratio increased the biovolume ofplankton, periphyton, heterotrophic bacteria and benthic macroinver-tebrate. However, the availability of pond communities in the presentresearch seemed to be under-utilized by the freshwater prawn. Thissuggests further investigation on the possibility of decreasing artificialfeeding rate or increasing in stocking density of prawn. In this system,the biomass of plankton and periphyton seemed to be totally unutilizedby the freshwater prawn. Therefore, inclusion of both plankton andperiphyton grazing fish species like tilapia (Dempster et al., 1993;Huchette et al., 2000; Azim et al., 2003a, Uddin, 2007) can furtherincrease the production, system environment and overall sustainabilityin C/N-CP ponds and is subject of further research.
Acknowledgement
This research was supported by the Committee on Scientific andTechnological Cooperation of the Organization of Islamic Conference(COMTECH), Islamabad, Pakistan and the International Foundation forScience (IFS), Stockholm, Sweden, through a grantee no A/4176-1. Theauthors sincerely acknowledge the technical assistance of Md. AkterHossain (Fish Nutrition Laboratory), Md. Abdul Baki (Laboratory ofMicrobiology and Hygiene) and all of the field staff of Fisheries FieldLaboratory, Bangladesh Agricultural University, Mymensingh,Bangladesh.
References
Asaduzzaman, M., Wahab, M.A., Verdegem, M.C.J., Azim, M.E., Haque, S., Salam, M.A.,2008. C/N ratio control and substrate addition for periphyton development jointlyenhance freshwater prawn Macrobrachium rosenbergii production in ponds.Aquaculture 280, 117–123.
Avnimelech, Y., 1999. C/N ratio as a control element in aquaculture systems.Aquaculture 176, 227–235.
Avnimelech, Y., 2007. Feeding with microbial flocs by tilapia in minimal discharge bio-flocs technology ponds. Aquaculture 264, 140–147.
Azim, M.E., 2001. The potential of periphyton-based aquaculture production systems.Ph.D. Thesis. Fish Culture and Fisheries Group, Wageningen University, TheNetherlands, 219 pp.
Azim, M.E., Little, D.C., 2006. Intensifying aquaculture production through newapproaches to manipulating natural food. CAB Reviews: in Agriculture, VeterinaryScience, Nutrition and Natural Resources 1, No. 062. 23 pp.
Azim, M.E., Verdegem, M.C.J., Mantingh, I., van Dam, A.A., Beveridge, M.C.M., 2003a.Ingestion and utilization of periphyton grown on artificial substrates by NileTilapia, Oreochromis niloticus L. Aquaculture Research 34, 85–92.
Azim, M.E., Verdegem, M.C.J., Singh, M., van Dam, A.A., Beveridge, M.C.M., 2003b. Theeffects of periphyton substrate and fish stocking density on water quality,phytoplankton, periphyton and fish growth. Aquaculture Research 34, 685–695.
Azim, M.E., Beveridge, M.C.M., van Dam, A.A., Verdegem, M.C.J., 2005. Periphyton andaquatic production: an introduction. In: Azim, M.E., Verdegem, M.C.J., van Dam, A.A., Beveridge, M.C.M. (Eds.), Periphyton: Ecology, Exploitation and Management.CABI Publishing, Wallingford, UK, pp. 1–11.
Belcher, H., Swale, S., 1976. A Beginner's Guide to Freshwater Algae. Institute ofTerrestrial Ecology, Natural Environmental Research Council, London. 47 pp.
Bellinger, E.G., 1992. A Key to Common Algae. The Institute ofWater and EnvironmentalManagement, London. 138 pp.
Beveridge, M.C.M., Begum,M., Frerichs, G.N., Millar, S., 1989. The ingestion of bacteria insuspension by the tilapia Oreochromis niloticus. Aquaculture 81, 373–378.

136 M. Asaduzzaman et al. / Aquaculture 306 (2010) 127–136
Brinkhurst, R.O., 1971. A Guide for the Identification of British Aquatic Oligochaeta.Freshwater Biological Association, Kendal, Wilson. 22, 55 pp.
Browdy, C.L., Bratvold, D., Stockes, A.D., McIntosh, R.P., 2001. Perspectives on theapplication of closed shrimp culture systems. In: Browdy, C.L., Jory, D.E. (Eds.), TheNew Wave, Proceedings of the Special Session on Sustainable Shrimp Culture,Aquaculture 2001. The World Aquaculture Society, Baton Rouge, USA, pp. 20–34.
Burford, M.A., Thompson, P.J., McIntosh, D., Bauman, R.H., Pearson, D.C., 2004. Thecontribution of flocculated material to shrimp (Litopenaeus vannamei) nutrition ina high-intensity, zero-exchange system. Aquaculture 232, 525–537.
Cole, J.J., 1982. Interactions between bacteria and algae in aquatic ecosystems. AnnualReview of Ecology and Systematics 13, 291–314.
Coyle, S.D., Najeeullah, T., Tidwell, J.H., 1996. Evaluation of naturally occurring organisms,distillery by-products, and prepared diets as food for juvenile freshwater prawnsMacrobrachium rosenbergii. Journal of Applied Aquaculture 6, 57–66.
Crab, R., Avnimelech, Y., Defoirdl, T., Bossier, P., Verstraete, W., 2007. Nitrogen removaltechniques in aquaculture for a sustainable production. Aquaculture 270, 1–14.
Dempster, P.W., Beveridge, M.C.M., Baird, D.J., 1993. Herbivory in the tilapiaOreochromis niloticus: a comparison of feeding rates of phytoplankton andperiphyton. Journal of Fish Biology 43, 385–392.
Diana, J.S., Szyper, J.P., Batterson, T.R., Boyd, C.E., Piedrahita, R.H., 1997. Water quality inponds. In: Egna, H.S., Boyd, C.E. (Eds.), Dynamics of Pond Aquaculture. CRC pressLLC, pp. 53–72.
FAO, 2006. State of World Aquaculture 2006. FAO Fisheries Technical Paper No 500.134 pp.
Gomez, K.A., Gomez, N.E., 1984. Statistical Procedures for Agricultural Research, 2ndedition. John Wiley and Sons, New York. 680 pp.
Hargreaves, J.A., 2006. Photosynthetic suspended-growth system in aquaculture.Aquaculture Engineering 34, 344–363.
Hari, B., Kurup, M.B., Varghese, J.T., Sharma, J.W., Verdegem, M.C.J., 2004. Effects ofcarbohydrate addition on production in extensive shrimp culture systems.Aquaculture 241, 179–194.
Huchette, S.M.H., Beveridge, M.C.M., Baird, D.J., Ireland, M., 2000. The impact of grazingby tilapias (Oreochromis niloticus L.) on periphyton communities growing onartificial substrate in cages. Aquaculture 186, 45–60.
Jiménez-Montealegre, R., Verdegem, M.C.J., Zamora, J.E., Verreth, J.A.J., 2002. Organicmatter sedimentation and resuspension in tilapia (Oreochromis niloticus) pondsduring a production cycle. Aquaculture Engineering 26, 1–12.
Keshavanath, P., Gangadhar, B., Ramesh, T.J., van Rooij, J.M., Beveridge, M.C.M., Baird, D.J.,Verdegem, M.C.J., van Dam, A.A., 2001. Use of artificial substrates to enhanceproduction of freshwater herbivorous fish in pond culture. Aquaculture Research 32,189–197.
Milstein, A., 1992. Ecological aspects of fish species interactions in polyculture ponds.Hydrobiologia 231, 177–186.
Milstein, A., 1993. Water quality and freshwater fish culture intensification: the Israeliexample. Aquaculture Research 24, 715–724.
Milstein, A., Peretz, Y., Harpaz, S., 2009. Culture of organic tilapia to market size inperiphyton based ponds with reduced feed inputs. Aquaculture Research 40, 55–59.
Moriarty, D.J.W., 1986. Bacterial productivity in ponds for culture of penaeid prawns.Microbial Ecology 12, 259–270.
Moriarty, D.J.W., 1997. The role of microorganisms in aquaculture ponds. Aquaculture151, 333–349.
Nakano, S., Kawabata, Z., 2000. Changes in cell volume of bacteria and heterotrophicnanoflagellates in a hypereutrophic pond. Hydrobiologia 428, 197–203.
Pinder, L.C., Reiss, F., 1983. The larvae of Chironomidae (Diptera: Chironomidae) of theHolactic region. In: Wiederholm, T. (Ed.), Chironomidae of the Holarctic Region,Entomological Scandinavic Supplement No. 19, pp. 293–437.
Prescott, G.W., 1962. Algae of the Western Great Lakes Area. Wm. C. Brown Co.,Dubuque, lowa. 977 pp.
Rahman,M.M., Verdegem,M.C.J., Nagelkerke, L.A.J.,Wahab,M.A.,Milstein, A., Verreth, J.A.J.,2006. Growth, production and food preference of rohu Labeo rohita (H.) inmonoculture and in polyculture with common carp Cyprinus carpio (L.) under fedand non-fed ponds. Aquaculture 257, 359–372.
Rahmatullah, S.M., Beveridge, M.C.M., 1993. Ingestion of bacteria in suspension byIndian major carps (Catla catla, Labeo rohita) and Chinese carps (Hypophthal-michthys molotrix, Aristichthys nobilis). Hydrobiologia 264, 79–84.
Schneider, O., Sereti, V., Eding, E.H., Verreth, J.A.J., 2005. Analysis of nutrient flows inintegrated intensive aquaculture systems. Aquaculture Engineering 32, 379–401.
Schroeder, G.L., 1987. Carbon and nitrogen budget in manured fishponds on Israel'scoastal plain. Aquaculture 62, 259–279.
Tidwell, J.H., Bratvold, D., 2005. Utility of added substrates in shrimpculture. In: Azim,M.E.,Verdegem, M.C.J., van Dam, A.A., Beveridge, M.C.M. (Eds.), Periphyton: Ecology,Exploitation and Management. CABI Publishing, Wallingford, UK, pp. 247–268.
Tidwell, J.H., Coyle, S.D., Webster, C.D., Sedlacek, J.D., Weston, P.A., Knight, W.L., Hill, S.J.,D'Abramo, L.R., Daniel, H.W., Fuller, M.J., 1997. Relative prawn production andbenthic macroinvertebrate densities in unfed, organically fertilized, and fed pondsystems. Aquaculture 149, 227–242.
Tidwell, J.H., Cycle, S., Van Arnum, A., Weibel, C., 2000. Production response offreshwater prawns Macrobrachium rosenbergii to increasing amounts of artificialsubstrate in ponds. Journal of the World Aquaculture Society 31, 452–458.
Tidwell, J.H., Coyle, S.D., Van Arnum, A., Weibel, C., 2002. Effects of substrate amountand orientation on production and population structure of freshwater prawnsMacrobrachium rosenbergii in ponds. Journal of theWorld Aquaculture Society 33 (1),63–69.
Torres-Beristain, B., Verdegem, M.C.J., Kerepeczki, E., Verreth, J.A.J., 2006. Decomposi-tion of high protein aquaculture feed under variable oxic conditions. WaterResearch 40, 1341–1350.
Uddin, M.S., 2007. Mixed culture of tilapia (Oreochromis niloticus) and freshwaterprawn (Macrobrachium rosenbergii) in periphyton-based ponds. Ph.D. Thesis. FishCulture and Fisheries Group, Wageningen University, The Netherlands, 208 pp.
Uddin, M.S., Azim, M.E., Wahab, M.A., Verdegem, M.C.J., 2006. The potential of mixedculture of genetically improved farmed tilapia (GIFT, Oreochromis niloticus) andfreshwater prawn (Macrobrachium rosenbergii) in periphyton-based systems.Aquaculture Research 37, 241–247.
van Dam, A.A., Verdegem, M.C.J., 2005. Utilization of periphyton for fish production inponds: a systems ecology perspective. In: Azim,M.E., Verdegem,M.C.J., van Dam, A.A.,Beveridge, M.C.M. (Eds.), Periphyton: Ecology, Exploitation and Management. CABIPublishing, Wallingford, UK, pp. 91–109.
van Dam, A.A., Beveridge, M.C.M., Azim, M.E., Verdegem, M.C.J., 2002. The potential of fishproduction based on periphyton. Reviews in Fish Biology and Fisheries 12, 1–31.
Verdegem, M.C.J., Eding, E.H., Sereti, V., Munubi, R.N., Satacruz-Reyes, R.A., van Dam, A.A.,2005. Similarities between microbial and periphytic bioflim in Aquaculture systems.In: Azim, M.E., Verdegem, M.C.J., van Dam, A.A., Beveridge, M.C.M. (Eds.),Periphyton: Ecology, Exploitation and Management. CABI Publishing, Wallingford,UK, pp. 191–205.
Ward, H.B., Whipple, G.C., 1959. Freshwater Biology. JohnWiley and Sons Inc., New York.Wetzel, R.G., 1983. Attached algal-substrata interactions: fact of myth, and when and
how? In: Wetzel, R.G. (Ed.), Periphyton of Freshwater Ecosystem. Dr. W. Junkpublisher, The Hague, The Netherlands, pp. 207–215.