Effects of carbonation on the pore structure of non-hydraulic lime mortars
14
1 The impact of carbonation on the pore structure of non- hydraulic lime mortars. R.M.H.Lawrence a *, T.J.Mays b , S.P.Rigby b , P.Walker a , D.D'Ayala a a Department of Architecture and Civil Engineering, University of Bath, Bath, BA2 7AY, United Kingdom b Department of Chemical Engineering, University of Bath, Bath, BA2 7AY, United Kingdom _____________________________________________________________________ Abstract The pore structures of carbonated non-hydraulic lime mortars made with a range of different aggregates and concentrations of lime have been determined using mercury intrusion porosimetry (MIP). MIP data have been correlated with scanning electron microscopy images and other porosity data. During carbonation there is an increase in pore volume in the ~0.1μm pore diameter range across all mortar types which is attributed to the transformation of portlandite to calcite. Also there is a monotonic increase in the volumes of pores with diameters below 0.03μm. A model is proposed for the changes in pore structure caused by carbonation. This attributes the increase in the volume of sub 0.03μm pores to the attachment of calcite crystals to the surface of aggregate particles, and in some cases to the surface of portlandite crystals. This phenomenon may explain the continuing presence of portlandite in mortars that, apparently, have fully carbonated. Key Words: Air Lime; B: Mercury Porosimetry; B: Microstructure; C: Carbonation; E: Mortar ________________________________________________________________________________ 1. Introduction This paper examines the changes in pore size distribution in non-hydraulic lime (air lime) mortars caused by carbonation and discusses the implication of these changes on the performance of the mortar. During the C19th and the first half of the C20th lime mortars were replaced by cement based mortars which were seen as stronger, more consistent, quicker setting and therefore 'better'. Whereas modern construction might have benefited from cement mortars in terms of speed of construction and reliability, their use on historic structures proved to be extremely damaging [1]. Cement mortars are often more resistant to degradation processes, such as freeze/thaw and salt crystallisation, than the historic substrate causing older material to fail preferentially under stress. Cement mortars have low porosity which results in a build up of water and soluble salts at the substrate-mortar interface. This build up encourages salt crystallisation and freeze- thaw damage which can produce rapid deterioration in the substrate. Lime mortars, especially air lime mortars, do not produce these effects, and indeed can be used as sacrificial material eliminating unwanted water and salt accretions. Failed mortar can then be replaced at intervals with no damage to the surrounding historic material. In addition, due to the slow carbonation process, lime mortars retain plasticity for extended periods of time. This means that structures built with non-hydraulic lime mortar accommodate movement and better retain their integrity when subjected to stresses. It therefore became evident that lime mortars could make a significant contribution to the conservation and restoration of cultural heritage through their greater compatibility with historic materials. This compatibility is most evident with air limes and feebly and moderately hydraulic limes. The setting of a hydraulic lime is a two-phase process. Initially there is a 'hydraulic set' resulting mainly from the formation of calcium silicate hydrates (C-S-H) and calcium aluminate hydrates (C-A-H). These reactions take place over a period of between two days (eminently hydraulic) and 28 days (feebly hydraulic) depending on the hydraulicity of the lime. Setting continues after this time through the carbonation of free hydroxide. By contrast, air lime mortars, following an initial hardening through drying, set entirely through carbonation. Carbonation is the process whereby slaked lime, or portlandite, [Ca(OH) 2 ] reacts in solution with atmospheric carbon dioxide (CO 2 ) to form calcium carbonate, or calcite, (CaCO 3 ) which is significantly stronger and less soluble than the portlandite it replaces. For carbonation to occur, the presence of water is essential, since it requires the dissolution of CO 2 . Ca(OH) 2 is accessed by the CO 2 in its dissolved state [2].There are five stages involved:
Transcript of Effects of carbonation on the pore structure of non-hydraulic lime mortars

1
The impact of carbonation on the pore structure of non-hydraulic lime mortars.
R.M.H.Lawrencea*, T.J.Maysb, S.P.Rigbyb, P.Walkera, D.D'Ayalaa
a Department of Architecture and Civil Engineering, University of Bath, Bath, BA2 7AY, United Kingdom b Department of Chemical Engineering, University of Bath, Bath, BA2 7AY, United Kingdom _____________________________________________________________________ Abstract The pore structures of carbonated non-hydraulic lime mortars made with a range of different aggregates and concentrations of lime have been determined using mercury intrusion porosimetry (MIP). MIP data have been correlated with scanning electron microscopy images and other porosity data. During carbonation there is an increase in pore volume in the ~0.1µm pore diameter range across all mortar types which is attributed to the transformation of portlandite to calcite. Also there is a monotonic increase in the volumes of pores with diameters below 0.03µm. A model is proposed for the changes in pore structure caused by carbonation. This attributes the increase in the volume of sub 0.03µm pores to the attachment of calcite crystals to the surface of aggregate particles, and in some cases to the surface of portlandite crystals. This phenomenon may explain the continuing presence of portlandite in mortars that, apparently, have fully carbonated. Key Words: Air Lime; B: Mercury Porosimetry; B: Microstructure; C: Carbonation; E: Mortar ________________________________________________________________________________ 1. Introduction This paper examines the changes in pore size distribution in non-hydraulic lime (air lime) mortars caused by carbonation and discusses the implication of these changes on the performance of the mortar. During the C19th and the first half of the C20th lime mortars were replaced by cement based mortars which were seen as stronger, more consistent, quicker setting and therefore 'better'. Whereas modern construction might have benefited from cement mortars in terms of speed of construction and reliability, their use on historic structures proved to be extremely damaging [1]. Cement mortars are often more resistant to degradation processes, such as freeze/thaw and salt crystallisation, than the historic substrate causing older material to fail preferentially under stress. Cement mortars have low porosity which results in a build up of water and soluble salts at the substrate-mortar interface. This build up encourages salt crystallisation and freeze-thaw damage which can produce rapid deterioration in the substrate. Lime mortars, especially air lime mortars, do not produce these effects, and indeed can be used as sacrificial material eliminating unwanted water and salt accretions. Failed mortar can then be replaced at intervals with no damage to the surrounding historic material. In addition, due to the slow carbonation process, lime mortars retain plasticity for extended periods of time. This means that structures built with non-hydraulic lime mortar accommodate movement
and better retain their integrity when subjected to stresses. It therefore became evident that lime mortars could make a significant contribution to the conservation and restoration of cultural heritage through their greater compatibility with historic materials. This compatibility is most evident with air limes and feebly and moderately hydraulic limes. The setting of a hydraulic lime is a two-phase process. Initially there is a 'hydraulic set' resulting mainly from the formation of calcium silicate hydrates (C-S-H) and calcium aluminate hydrates (C-A-H). These reactions take place over a period of between two days (eminently hydraulic) and 28 days (feebly hydraulic) depending on the hydraulicity of the lime. Setting continues after this time through the carbonation of free hydroxide. By contrast, air lime mortars, following an initial hardening through drying, set entirely through carbonation. Carbonation is the process whereby slaked lime, or portlandite, [Ca(OH)2] reacts in solution with atmospheric carbon dioxide (CO2) to form calcium carbonate, or calcite, (CaCO3) which is significantly stronger and less soluble than the portlandite it replaces. For carbonation to occur, the presence of water is essential, since it requires the dissolution of CO2. Ca(OH)2 is accessed by the CO2 in its dissolved state [2].There are five stages involved:

2
Diffusion of gaseous CO2 through the pores of the mortar. Dissolution of the CO2 in the pore water. Dissolution of Ca(OH)2 in the pore water. Solution reaction between Ca(OH)2 and CO2 Precipitation of solid CaCO3. Carbonation changes the microstructure of the mortar, not only improving the mechanical properties but also affecting the pore structure, and hence water transport characteristics. Compared with cement-based mortars, this results in a much more extended setting time, lower compressive strengths and higher porosity, deformability, and water transport characteristics [3]. These last four characteristics have proved to be useful in the field of conservation architecture as exemplified by the work currently being undertaken by the RILEM Technical Committee on Repair Mortars for Historic Masonry and grounded in the need to develop compatible new repair materials as identified by the Venice Charter (1964) adopted by UNESCO in 1965.
The difference in porosity between carbonated and uncarbonated mortar is clearly evident in the images in Fig. 1 below. These show a section through a 360 day-old lime mortar made with 1 part by volume of lime putty to 1 part crushed stone dust. The left hand image is of the surface when it is air dry. The central image is of the same surface when saturated with water, and the right hand image is of the dry surface after being sprayed with phenolphthalein, which highlights areas of high alkalinity. Highly alkaline areas of lime mortar consist of uncarbonated calcium hydroxide. When calcium hydroxide carbonates it loses its alkalinity, and will no longer show a phenolphthalein stain. The darker area in the saturated mortar contains more water than the surrounding area, which is an indication of higher porosity. This area coincides closely with the phenolphthalein stained area in the right hand image, demonstrating that uncarbonated material is more porous than carbonated material.
Dry Mortar Saturated Mortar Phenolphthalein stained
Mortar Fig. 1: Partially carbonated lime mortar demonstrating the coincidence of higher porosity (dark region in central image) with
uncarbonated material (dark region in left image). Each specimen is ~50mm in width and in height.
The pore structure of a mortar is an important characteristic in defining its performance and durability. In cement and hydraulic lime mortars, the compressive strength decreases with increasing porosity, whereas in air lime mortars this relationship is less evident [4]. Pore size distribution controls the gas permeability of a mortar and water absorption characteristics. These two factors are critical in the case of air lime mortars since strength gains, after the initial drying phase, occur only through carbonation, which is dependent on access to CO2 and water vapour. In the following, we outline the methods and models used to describe changes in pore structure in air lime mortars during carbonation.
2. Mercury Intrusion Porosimetry The pore structure of materials can be examined using a wide range of techniques [5]. Mercury intrusion porosimetry (MIP) is a powerful technique which can be used to explore the structure of pores larger than about 10 nm. This includes the pore size range (0.01 – 100mm) involved in the carbonation process in lime mortars [6]. In MIP, the volume of liquid metal that penetrates a solid is measured as a function of applied pressure. Subsequent analysis is based on the capillary law governing liquid penetration into small pores. Since mercury is a non-wetting liquid for most materials (its contact angle is greater than 90°), an externally imposed pressure
3
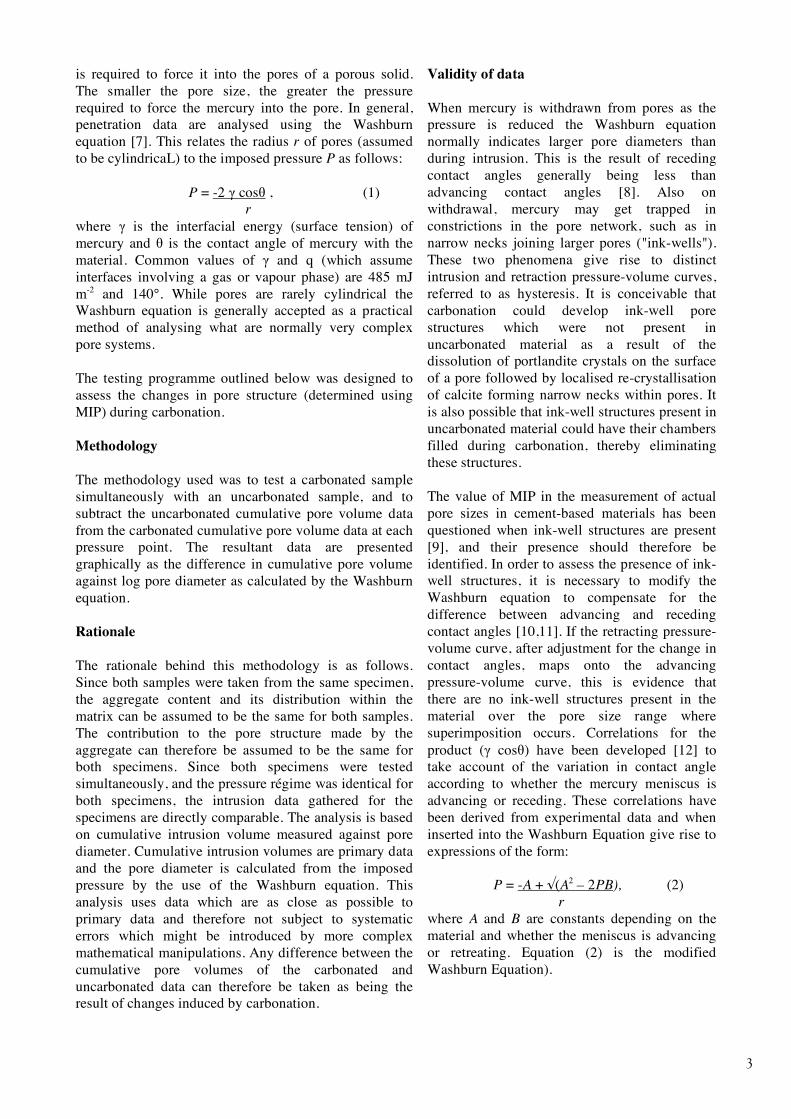
is required to force it into the pores of a porous solid. The smaller the pore size, the greater the pressure required to force the mercury into the pore. In general, penetration data are analysed using the Washburn equation [7]. This relates the radius r of pores (assumed to be cylindricaL) to the imposed pressure P as follows: P = -2 γ cosθ , (1) r where γ is the interfacial energy (surface tension) of mercury and θ is the contact angle of mercury with the material. Common values of γ and q (which assume interfaces involving a gas or vapour phase) are 485 mJ m-2 and 140°. While pores are rarely cylindrical the Washburn equation is generally accepted as a practical method of analysing what are normally very complex pore systems. The testing programme outlined below was designed to assess the changes in pore structure (determined using MIP) during carbonation. Methodology The methodology used was to test a carbonated sample simultaneously with an uncarbonated sample, and to subtract the uncarbonated cumulative pore volume data from the carbonated cumulative pore volume data at each pressure point. The resultant data are presented graphically as the difference in cumulative pore volume against log pore diameter as calculated by the Washburn equation. Rationale The rationale behind this methodology is as follows. Since both samples were taken from the same specimen, the aggregate content and its distribution within the matrix can be assumed to be the same for both samples. The contribution to the pore structure made by the aggregate can therefore be assumed to be the same for both specimens. Since both specimens were tested simultaneously, and the pressure régime was identical for both specimens, the intrusion data gathered for the specimens are directly comparable. The analysis is based on cumulative intrusion volume measured against pore diameter. Cumulative intrusion volumes are primary data and the pore diameter is calculated from the imposed pressure by the use of the Washburn equation. This analysis uses data which are as close as possible to primary data and therefore not subject to systematic errors which might be introduced by more complex mathematical manipulations. Any difference between the cumulative pore volumes of the carbonated and uncarbonated data can therefore be taken as being the result of changes induced by carbonation.
Validity of data When mercury is withdrawn from pores as the pressure is reduced the Washburn equation normally indicates larger pore diameters than during intrusion. This is the result of receding contact angles generally being less than advancing contact angles [8]. Also on withdrawal, mercury may get trapped in constrictions in the pore network, such as in narrow necks joining larger pores ("ink-wells"). These two phenomena give rise to distinct intrusion and retraction pressure-volume curves, referred to as hysteresis. It is conceivable that carbonation could develop ink-well pore structures which were not present in uncarbonated material as a result of the dissolution of portlandite crystals on the surface of a pore followed by localised re-crystallisation of calcite forming narrow necks within pores. It is also possible that ink-well structures present in uncarbonated material could have their chambers filled during carbonation, thereby eliminating these structures. The value of MIP in the measurement of actual pore sizes in cement-based materials has been questioned when ink-well structures are present [9], and their presence should therefore be identified. In order to assess the presence of ink-well structures, it is necessary to modify the Washburn equation to compensate for the difference between advancing and receding contact angles [10,11]. If the retracting pressure-volume curve, after adjustment for the change in contact angles, maps onto the advancing pressure-volume curve, this is evidence that there are no ink-well structures present in the material over the pore size range where superimposition occurs. Correlations for the product (γ cosθ) have been developed [12] to take account of the variation in contact angle according to whether the mercury meniscus is advancing or receding. These correlations have been derived from experimental data and when inserted into the Washburn Equation give rise to expressions of the form: P = -A + √(A2 – 2PB), (2) r where A and B are constants depending on the material and whether the meniscus is advancing or retreating. Equation (2) is the modified Washburn Equation).
4
3 Experimental Lime mortar samples, typical of those used in building restoration, were manufactured using 1 part of a range of different forms of lime and 1 part, 2 parts and 3 parts of three different aggregates: crushed bioclastic stone, crushed oolitic stone and silicate sand. The proportions were on the basis of dry volumes of portlandite and aggregate. Thus the amount of lime putty added to the mix was that which, when dried, comprise 50%, 33.3% and 25% of the total volume of dry ingredients. The mortars under test were made using a paddle mixer and the workability of each mix was controlled since the intention was to work with mortars which could be used for plastic repairs. These require a stiff texture similar to modelling clay. Where necessary, water was added to the
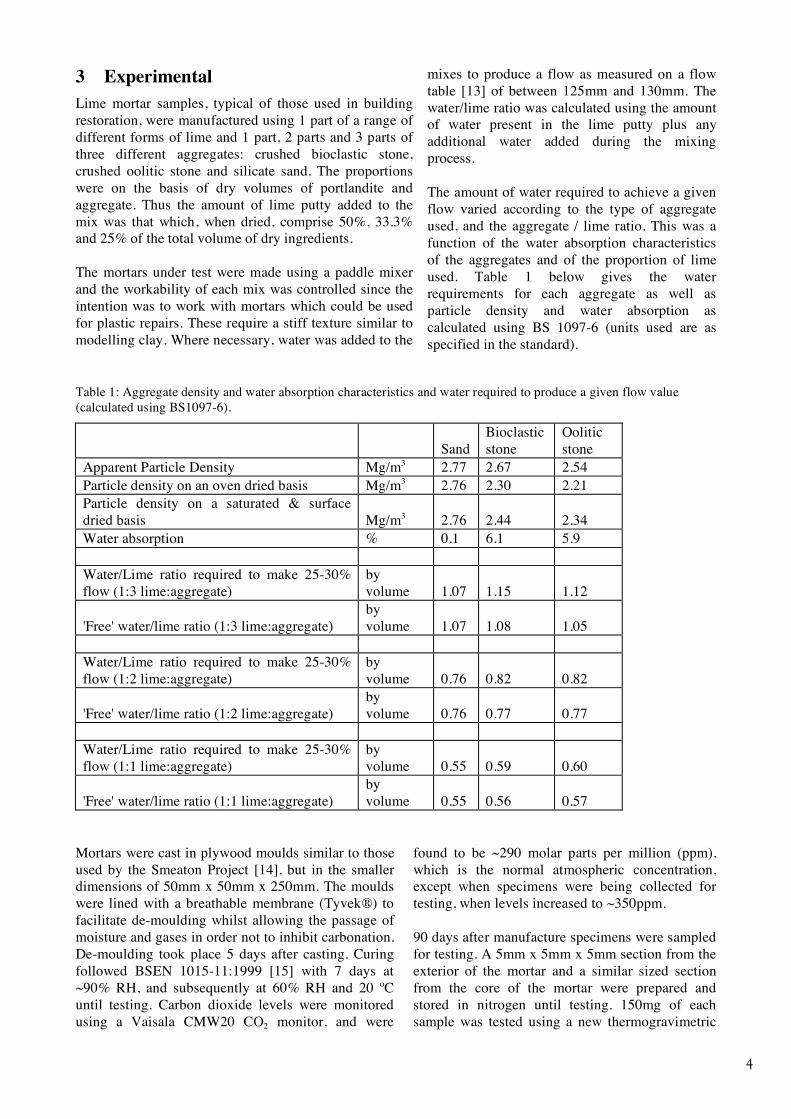
mixes to produce a flow as measured on a flow table [13] of between 125mm and 130mm. The water/lime ratio was calculated using the amount of water present in the lime putty plus any additional water added during the mixing process. The amount of water required to achieve a given flow varied according to the type of aggregate used, and the aggregate / lime ratio. This was a function of the water absorption characteristics of the aggregates and of the proportion of lime used. Table 1 below gives the water requirements for each aggregate as well as particle density and water absorption as calculated using BS 1097-6 (units used are as specified in the standard).
Table 1: Aggregate density and water absorption characteristics and water required to produce a given flow value (calculated using BS1097-6).
Sand Bioclastic stone
Oolitic stone
Apparent Particle Density Mg/m3 2.77 2.67 2.54 Particle density on an oven dried basis Mg/m3 2.76 2.30 2.21 Particle density on a saturated & surface dried basis Mg/m3 2.76 2.44 2.34 Water absorption % 0.1 6.1 5.9 Water/Lime ratio required to make 25-30% flow (1:3 lime:aggregate)
by volume 1.07 1.15 1.12
'Free' water/lime ratio (1:3 lime:aggregate) by volume 1.07 1.08 1.05
Water/Lime ratio required to make 25-30% flow (1:2 lime:aggregate)
by volume 0.76 0.82 0.82
'Free' water/lime ratio (1:2 lime:aggregate) by volume 0.76 0.77 0.77
Water/Lime ratio required to make 25-30% flow (1:1 lime:aggregate)
by volume 0.55 0.59 0.60
'Free' water/lime ratio (1:1 lime:aggregate) by volume 0.55 0.56 0.57
Mortars were cast in plywood moulds similar to those used by the Smeaton Project [14], but in the smaller dimensions of 50mm x 50mm x 250mm. The moulds were lined with a breathable membrane (Tyvek®) to facilitate de-moulding whilst allowing the passage of moisture and gases in order not to inhibit carbonation. De-moulding took place 5 days after casting. Curing followed BSEN 1015-11:1999 [15] with 7 days at ~90% RH, and subsequently at 60% RH and 20 ºC until testing. Carbon dioxide levels were monitored using a Vaisala CMW20 CO2 monitor, and were
found to be ~290 molar parts per million (ppm), which is the normal atmospheric concentration, except when specimens were being collected for testing, when levels increased to ~350ppm. 90 days after manufacture specimens were sampled for testing. A 5mm x 5mm x 5mm section from the exterior of the mortar and a similar sized section from the core of the mortar were prepared and stored in nitrogen until testing. 150mg of each sample was tested using a new thermogravimetric

5
technique [16] to measure the extent of carbonation. The exterior and core samples were simultaneously tested using a Micromeritics Autopore III mercury intrusion porosimeter. This allowed the samples to be tested using precisely the same pressure régime, and therefore to be directly compared. Scanning electron microscopy was undertaken using a J.E.O.L JSM-6310 Scanning Electron Microscope. 4 Results and analysis Fig. 2 shows a typical cumulative mercury intrusion/retraction curve for carbonated and uncarbonated mortar analysed using the Washburn Equation. (with γ = 485 mJ m-2 and θ = 140° .) Fig. 3 shows the same pressure/intrusion data analysed using the modified Washburn Equation. Values of the constants A and B used for this analysis are in Table 2. These values are those which provided the closest superposition of the retraction curve on the intrusion curve. Whilst the constants were similar for both the calcitic aggregates, different values were required for the silicate aggregate. This is likely to be a result of differing contact angles for mercury on calcitic and silicate material. It should be noted that carbonated material is between 3% and 5% denser than uncarbonated material, depending on the type of aggregate and binder:aggregate ratio. Since cumulative pore volume is measured in ml g-1 this means that direct comparisons contain a small systematic error. However this error is constant across the range of pore sizes and since the analysis is based on subtracting the two data sets, conclusions drawn will still be valid, as the effect of this systematic error will be a minor shift on the Y axis of all the data points.
Table 2: Constants used in the modified Washburn
equation
Constant Intrusion Retraction Oolitic mortar A 230 90 B -0.739 -150 Bioclastic mortar A 230 100 B -0.739 -150 Silicate sand mortar A 210 100 B -30 -180 It should be noted that the constant B relates to the contact angle between mercury and the material. The oolitic and bioclastic mortars are both mineralogically similar, consisting essentially of calcium carbonate. The silicate sand consists entirely of silicate. the difference in the value of the constant B is attributed to the differenced in chemistry between silicates and carbonates which affects the contact angle with the mercury. It can be seen that the retraction curve produced by the modified Washburn equation maps closely onto the intrusion curve for pores below 0.3µm in diameter. This matching of the intrusion/retraction curve is similar for every mortar type irrespective of the lime concentration or of the aggregate type. It can be concluded from this that the pore size distribution of the mortars as analysed is truly representative of the pore sizes in the mortars, and that differences between carbonated and uncarbonated materials therefore represent differences in actual pore structure.
Oolitic mortar (Washburn Equation)
0
0.05
0.1
0.15
0.2
0.25
0.3
0.35
0.001 0.01 0.1 1 10 100 1000
Cu
mu
lati
ve P
ore V
olu
me (
ml/
g)
Carbonated Un-Carbonated
Intrusion
Retraction
6
Fig. 2: Cumulative mercury porosimetry data analysed using the Washburn equation for a carbonated and uncarbonated lime mortar made with 1 part oolitic stone and 2 parts lime.
Oolitic mortar (Modified Washburn Equation)
0
0.05
0.1
0.15
0.2
0.25
0.3
0.35
0.001 0.01 0.1 1 10 100 1000
Cu
mu
lati
ve P
ore V
olu
me (
ml/
g)
Carbonated Un-Carbonated
Fig. 3: Cumulative mercury porosimetry data analysed using the modified Washburn equation for a carbonated and
uncarbonated lime mortar made with 1 part oolitic stone and 2 parts lime.
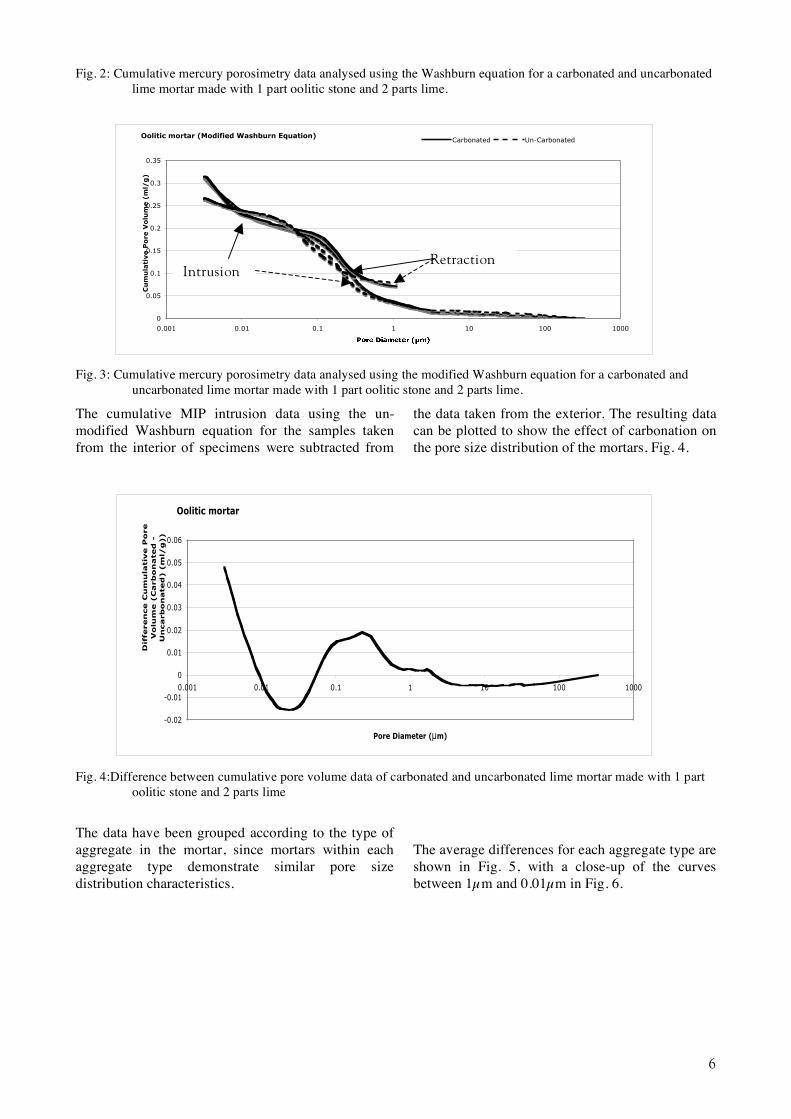
The cumulative MIP intrusion data using the un-modified Washburn equation for the samples taken from the interior of specimens were subtracted from
the data taken from the exterior. The resulting data can be plotted to show the effect of carbonation on the pore size distribution of the mortars, Fig. 4.
Oolitic mortar
-0.02
-0.01
0
0.01
0.02
0.03
0.04
0.05
0.06
0.001 0.01 0.1 1 10 100 1000
Pore Diameter (!m)
Dif
feren
ce C
um
ula
tiv
e P
ore
Vo
lum
e (
Carb
on
ated
-
Un
carb
on
ated
) (
ml/
g))
Fig. 4:Difference between cumulative pore volume data of carbonated and uncarbonated lime mortar made with 1 part
oolitic stone and 2 parts lime
The data have been grouped according to the type of aggregate in the mortar, since mortars within each aggregate type demonstrate similar pore size distribution characteristics.
The average differences for each aggregate type are shown in Fig. 5, with a close-up of the curves between 1µm and 0.01µm in Fig. 6.
Intrusion Retraction

7
Average Pore size changes produced by carbonation
-0.02
0
0.02
0.04
0.06
0.08
0.1
0.12
0.14
0.16
0.001 0.01 0.1 1 10 100 1000
Pore Diameter (!m)
Dif
feren
ce C
arb
on
ate
d-U
ncarb
on
ate
d C
um
ula
tive
Po
re V
olu
me (
ml/
g)
Bioclastic Sand Oolitic Average Fig. 5 : Difference in pore size distribution between carbonated and uncarbonated mortars (all types)
Average Pore size changes produced by carbonation
-0.02
-0.01
0
0.01
0.02
0.03
0.04
0.05
0.01 0.1 1
Pore Diameter (!m)
Dif
feren
ce C
arb
on
ate
d-U
ncarb
on
ate
d C
um
ula
tive
Po
re V
olu
me (
ml/
g)
Bioclastic Sand Oolitic Average Fig. 6: Difference in pore size distribution between carbonated and uncarbonated mortars (all types) between 1µm and
0.01µm
It can be seen that irrespective of the type of aggregate or the type of binder, there are common features in the changes to pore size distribution induced by carbonation. There is a distinct peak in the increase of pores of 0.1µm in diameter. Below about 0.03µm the difference in the volume of pores penetrated between carbonated and uncarbonated
mortar increases monotonically with decreasing pore size. The open porosity of each mortar type was calculated using BSEN 1936 [19] and is shown in Table 3 below:
Table 3: Open porosity of mortars as calculated by BSEN 1936:1999
Bioclastic mortar Oolitic mortar Silicate sand mortar Open porosity 29.20% 28.23% 18.66%

8
The pore size distribution as measured by Mercury Intrusion Porosimetry is as shown in Table 4. 29.17% of the pores in the silicate sand mortar are larger than 10µm, compared with 13.33% of the bioclastic and 2.88% of the oolitic. It is these larger pores which
offer the greatest access to atmospheric CO2. The silicate sand mortar carbonates the most quickly as a result of this and the oolitic mortar carbonates the slowest.
Table 4: Pore size distribution of mortars as measured by Mercury Intrusion Porosimetry % Intrusion Volume Bioclastic mortar Oolitic mortar Silicate sand mortar >10µm 13.33 2.88 29.17 10µm > 1µm 11.12 10.81 2.54 1µm > 0.1µm 30.16 54.07 13.98 0.1µm > 0.01µm 21.50 18.99 23.19 < 0.01µm 23.89 13.25 31.12 Total 100 100 100
Fig. 7 shows a scanning electron microscope (SEM) micrograph at x2000 magnification of the interior of a bioclastic lime mortar. The surface of the aggregate is lightly covered with amorphous calcium carbonate
crystals. This can be contrasted with Fig. 8 which is a SEM micrograph of the exterior of the same specimen. The aggregate appears to be densely coated with calcium carbonate crystals
Fig. 7: SEM micrograph of poorly carbonated bioclastic mortar
10µm

9
Fig. 8: SEM micrograph of well carbonated bioclastic mortar
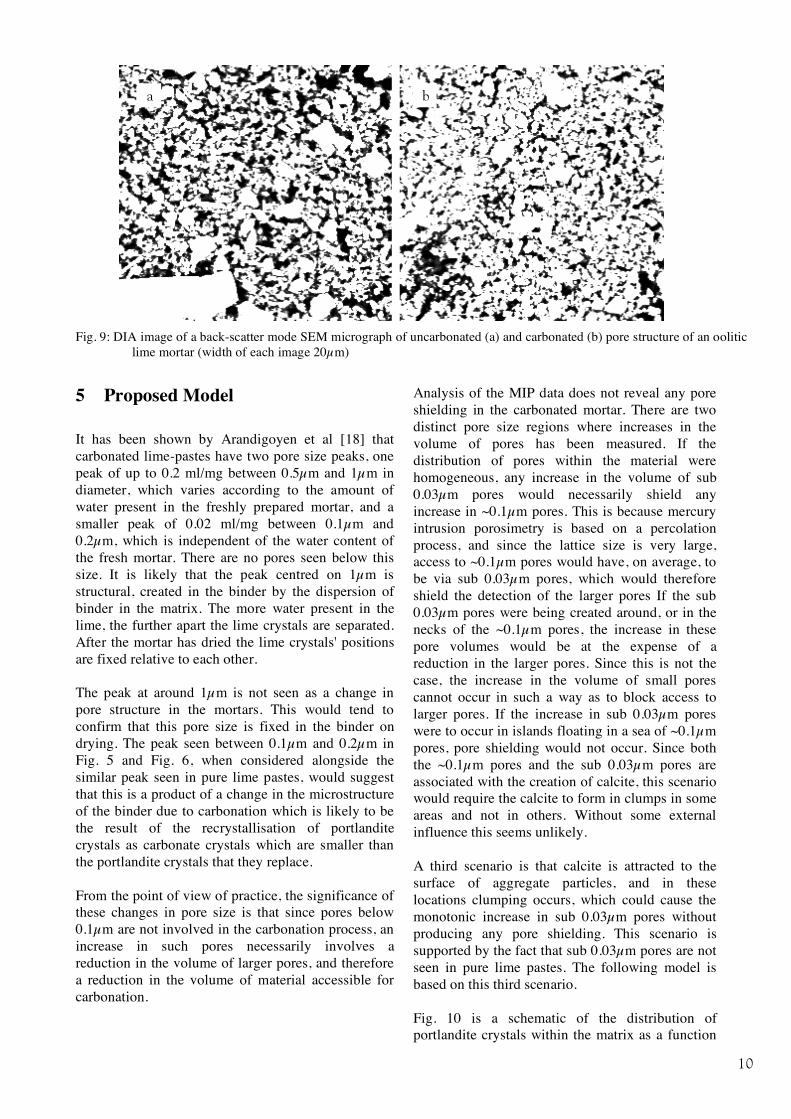
Support for the interpretation of the MIP data can be offered through qualitative examination of digital image analysis (DIA) of backscattered electron SEM images, (BEI). Such methods have been shown to highlight differences in pore sizes and distribution in lime mortars [17]. Pores in mortars when prepared for BEI analysis are filled with hardened resin which has a very low back-scatter coefficient. As a result, their grey levels are low and they appear dark on the resulting image. Figure 9 is the result of process of binary segmentation on BSI images of uncarbonated (a) and carbonated (b) material. In this process, pixels which are darker than an arbitrary grey level have been converted to black, whilst pixels which are
brighter that the same arbitrary level have been converted to white. The grey level selected is that which best represents the pore outline as determined by examination of the original BEI image. The image analysis was made using Adobe Photoshop CS. DIA of a polished section of an oolitic mortar clearly demonstrates the difference in pore sizes. Fig. 9 shows two sections of a specimen - each image being 20µm wide. The left hand image is taken from the core (relatively uncarbonated), and the right hand image from the exterior (fully carbonated). The sizes of the pores are noticeably smaller in the carbonated material
10µm
10
Fig. 9: DIA image of a back-scatter mode SEM micrograph of uncarbonated (a) and carbonated (b) pore structure of an oolitic
lime mortar (width of each image 20µm)
5 Proposed Model It has been shown by Arandigoyen et al [18] that carbonated lime-pastes have two pore size peaks, one peak of up to 0.2 ml/mg between 0.5µm and 1µm in diameter, which varies according to the amount of water present in the freshly prepared mortar, and a smaller peak of 0.02 ml/mg between 0.1µm and 0.2µm, which is independent of the water content of the fresh mortar. There are no pores seen below this size. It is likely that the peak centred on 1µm is structural, created in the binder by the dispersion of binder in the matrix. The more water present in the lime, the further apart the lime crystals are separated. After the mortar has dried the lime crystals' positions are fixed relative to each other. The peak at around 1µm is not seen as a change in pore structure in the mortars. This would tend to confirm that this pore size is fixed in the binder on drying. The peak seen between 0.1µm and 0.2µm in Fig. 5 and Fig. 6, when considered alongside the similar peak seen in pure lime pastes, would suggest that this is a product of a change in the microstructure of the binder due to carbonation which is likely to be the result of the recrystallisation of portlandite crystals as carbonate crystals which are smaller than the portlandite crystals that they replace. From the point of view of practice, the significance of these changes in pore size is that since pores below 0.1µm are not involved in the carbonation process, an increase in such pores necessarily involves a reduction in the volume of larger pores, and therefore a reduction in the volume of material accessible for carbonation.
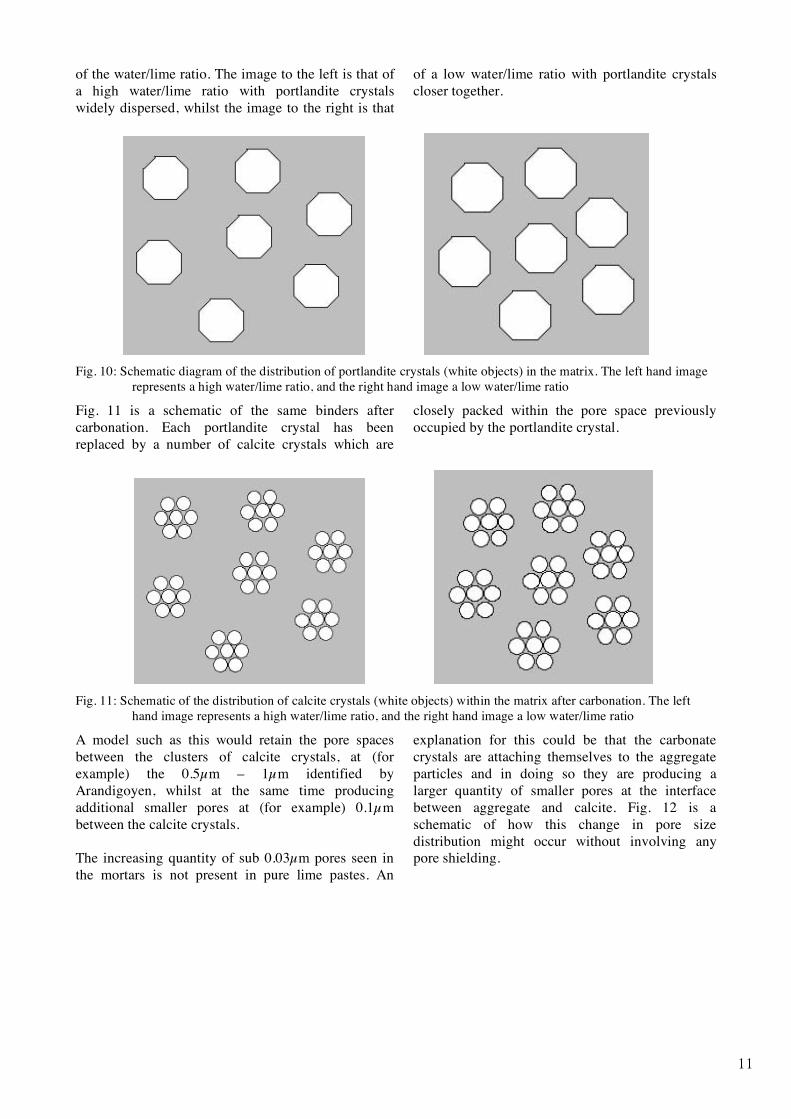
Analysis of the MIP data does not reveal any pore shielding in the carbonated mortar. There are two distinct pore size regions where increases in the volume of pores has been measured. If the distribution of pores within the material were homogeneous, any increase in the volume of sub 0.03µm pores would necessarily shield any increase in ~0.1µm pores. This is because mercury intrusion porosimetry is based on a percolation process, and since the lattice size is very large, access to ~0.1µm pores would have, on average, to be via sub 0.03µm pores, which would therefore shield the detection of the larger pores If the sub 0.03µm pores were being created around, or in the necks of the ~0.1µm pores, the increase in these pore volumes would be at the expense of a reduction in the larger pores. Since this is not the case, the increase in the volume of small pores cannot occur in such a way as to block access to larger pores. If the increase in sub 0.03µm pores were to occur in islands floating in a sea of ~0.1µm pores, pore shielding would not occur. Since both the ~0.1µm pores and the sub 0.03µm pores are associated with the creation of calcite, this scenario would require the calcite to form in clumps in some areas and not in others. Without some external influence this seems unlikely. A third scenario is that calcite is attracted to the surface of aggregate particles, and in these locations clumping occurs, which could cause the monotonic increase in sub 0.03µm pores without producing any pore shielding. This scenario is supported by the fact that sub 0.03µm pores are not seen in pure lime pastes. The following model is based on this third scenario. Fig. 10 is a schematic of the distribution of portlandite crystals within the matrix as a function
a b
11
of the water/lime ratio. The image to the left is that of a high water/lime ratio with portlandite crystals widely dispersed, whilst the image to the right is that
of a low water/lime ratio with portlandite crystals closer together.
Fig. 10: Schematic diagram of the distribution of portlandite crystals (white objects) in the matrix. The left hand image
represents a high water/lime ratio, and the right hand image a low water/lime ratio
Fig. 11 is a schematic of the same binders after carbonation. Each portlandite crystal has been replaced by a number of calcite crystals which are
closely packed within the pore space previously occupied by the portlandite crystal.
Fig. 11: Schematic of the distribution of calcite crystals (white objects) within the matrix after carbonation. The left
hand image represents a high water/lime ratio, and the right hand image a low water/lime ratio
A model such as this would retain the pore spaces between the clusters of calcite crystals, at (for example) the 0.5µm – 1µm identified by Arandigoyen, whilst at the same time producing additional smaller pores at (for example) 0.1µm between the calcite crystals. The increasing quantity of sub 0.03µm pores seen in the mortars is not present in pure lime pastes. An
explanation for this could be that the carbonate crystals are attaching themselves to the aggregate particles and in doing so they are producing a larger quantity of smaller pores at the interface between aggregate and calcite. Fig. 12 is a schematic of how this change in pore size distribution might occur without involving any pore shielding.

12
Fig. 12: Schematic of the interaction of binder with aggregate particles. The left hand image represents uncarbonated material,
the right hand image represents carbonated material.
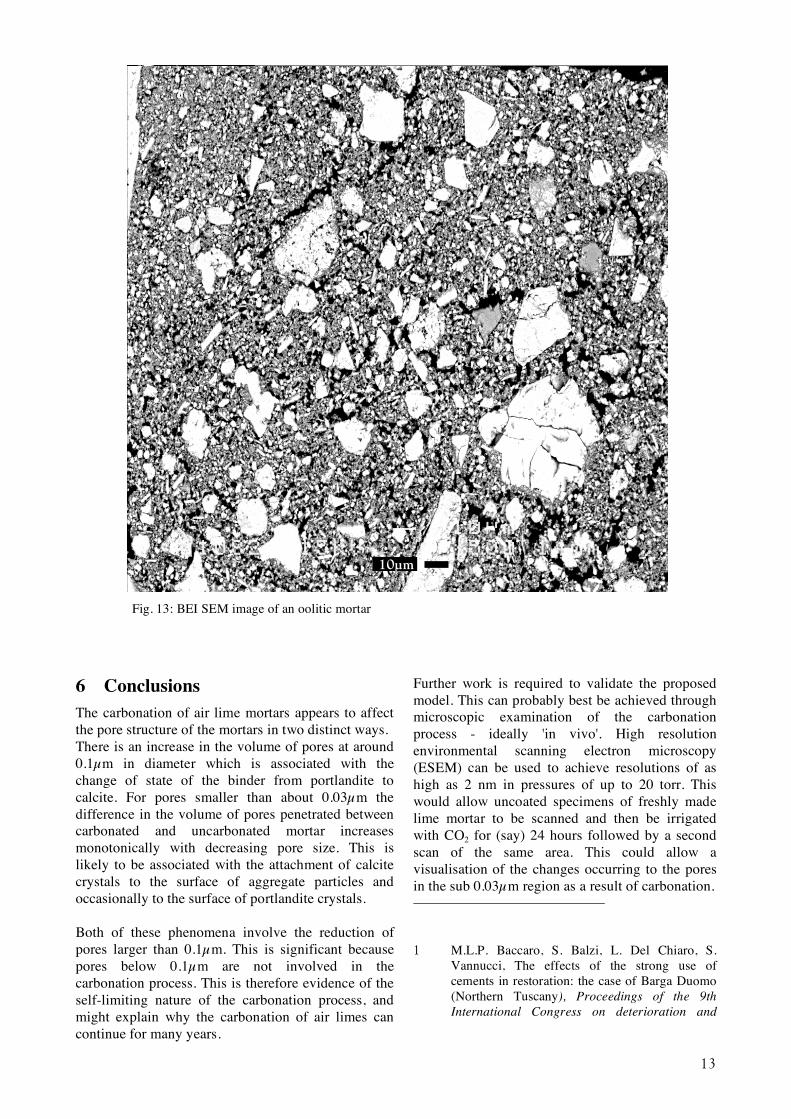
This model assumes that where an aggregate particle is surrounded by portlandite crystals, it is evenly distributed with the binder particles within the matrix. Once the portlandite carbonates, the calcite crystals are attracted to, and adhere to, the surface of the aggregate. In doing this, they form a dense mass around the aggregate particles and create an environment with large numbers of very small pores. A model such as this would produce an increase in smaller pores at the interface between calcite crystals and aggregate, without producing pore blocking of larger pores in the areas which were not immediately adjacent to aggregate particles. This model is in contrast to the model proposed by Houst et al [19] where interfacial zones between aggregate and bulk cement paste have lower porosity than the binder. This emphasises the fundamental difference between binders that set using hydration products and those that set using carbonation. Fig.13 shows a backscattered electron SEM image of a carbonated oolitic lime mortar specimen. The light
areas are particles of aggregate, the grey areas are calcite crystals, and the dark areas are pores. It can be seen that the aggregate particles are not so densely packed that the attachment of calcite crystals to their surfaces would fill the gaps between them, and hence create pore blocking. Under these circumstances, free entry to the pores of the system is still possible, apart from the particles which are densely coated with calcite crystals. Continued access of CO2 to the matrix remains possible which therefore allows carbonation to proceed in the normal diffusion limited manner. Where a crystal of portlandite becomes coated with a dense layer of calcite crystals, the pores around this particle will be too small to permit the access of pore water, thereby not allowing the portlandite to dissolve in order to react with dissolved CO2. 'Shielding' of a small proportion of portlandite crystals in this manner may explain why, even after a periods of several hundred years, lime mortars still retain a small quantity of unreacted portlandite [20].
13
Fig. 13: BEI SEM image of an oolitic mortar
6 Conclusions The carbonation of air lime mortars appears to affect the pore structure of the mortars in two distinct ways. There is an increase in the volume of pores at around 0.1µm in diameter which is associated with the change of state of the binder from portlandite to calcite. For pores smaller than about 0.03µm the difference in the volume of pores penetrated between carbonated and uncarbonated mortar increases monotonically with decreasing pore size. This is likely to be associated with the attachment of calcite crystals to the surface of aggregate particles and occasionally to the surface of portlandite crystals. Both of these phenomena involve the reduction of pores larger than 0.1µm. This is significant because pores below 0.1µm are not involved in the carbonation process. This is therefore evidence of the self-limiting nature of the carbonation process, and might explain why the carbonation of air limes can continue for many years.
Further work is required to validate the proposed model. This can probably best be achieved through microscopic examination of the carbonation process - ideally 'in vivo'. High resolution environmental scanning electron microscopy (ESEM) can be used to achieve resolutions of as high as 2 nm in pressures of up to 20 torr. This would allow uncoated specimens of freshly made lime mortar to be scanned and then be irrigated with CO2 for (say) 24 hours followed by a second scan of the same area. This could allow a visualisation of the changes occurring to the pores in the sub 0.03µm region as a result of carbonation. 1 M.L.P. Baccaro, S. Balzi, L. Del Chiaro, S.
Vannucci, The effects of the strong use of cements in restoration: the case of Barga Duomo (Northern Tuscany), Proceedings of the 9th International Congress on deterioration and
10µm

14
conservation of stone. 2. Venice, 19-24 June 2000 (2) (2000) 3-12
2 B. Johannesson, P. Utgenannt, Microstructural changes caused by carbonation of cement mortar, Cem Concr Res, 31 (2001) 925-931
3 Peroni, S, Tersigni, C, Porraca, G, Cerea, S, Forti, M, Guidobaldi, F, Rossi-Doria, P, De Rege, A, Picci, D, Pietrafitta, FJ, Benedetti, G, Lime based mortars for the repair of ancient masonry and possible substitutes, Mortars, cements and grouts used in the conservation of historic buildings Symposium 3-6/11/1981, ICCROM, Rome, (1981) 63-99.
4 J.Lanas, J.I.Alvarez, Masonry repair lime-based mortars: Factors affecting the mechanical behaviour, Cem Concr Res, 33 (2003) 1867-1876
5 F.Schuth, K.S.W. Sing, J. Weltkamp, Handbook of Porous Solids, Weinheim, Wiley-VCH, 2002
6 A.Moropoulou - Reverse engineering: a proper methodology for compatible restoration mortars. RILEM Conference on historic mortars, Delft, 2005, - preprints
7 E.W.Washburn, The dynamics of capillary flow. Phys Rev, 17 (1921) 273-283
8 J.van Brakel, S. Modry, M. Svata, Mercury Pososimetry: state of the art. Powder Technol, 29 (1981) 1-12.
9 S. Diamond, Mercury porosimetry, an inappropriate method for the measurement of pore size distributions in cement-based material, Cem Concr Res, 30 (2000) 1517-1525
10 J.Kloubek, Hysteresis in porosimetry, Powder Technol, 29 (1981) 63-73
11 L.Muscou, S.Lub, Practical use of mercury porosimetry in the study of porous solids, Powder Technol, 29 (1981) 45-52
12 S.P.Rigby, New methodologies in mercury porosimetry, Stud Surf Sci Catal, 144 (2002) 185-192
13 British Standards, BS EN 1015-3, 1999. 14 J.M. Teutonico, I. McCraig, C. Burns, J. Ashurst,
Bulletin of the Association for Preservation Technology, 25 (1994) 32-49.
15 British Standards, BS EN 1015-11, 1999 16 R.M.H.Lawrence, T.J.Mays, P.Walker, D.D'Ayala,
Determination of carbonation profiles in non-hydraulic lime mortars using thermogravimetric analysis, Thermochim Acta, 2006, doi:10.1016/j.tca.2006.03.002
17 M. Arandigoyuen, J.L. Pérez Bernal, M.A. Bello López, J.I.Alvarez, Lime-pastes with different kneading water: Pore structure and capillary porosity, Appl Surf Sci, 252 (2005) 1449-1459
18 M. Arandigoyen, et al (ibid) 19 Y.F. Houst, H. Sadouki, F.H. Wittmann, Influence
of aggregate concentration on the diffusion of CO2 and O2. Interfaces in Cementitious Composites, J.C. Maso (ed), E & FN Spon, London, (1993) 279-288
20 J. Adams, D. Dollimore, L.D. Griffiths, Thermal Analytical investigation of unaltered Ca(OH)2 in
dated mortars and plasters, Thermochim Acta, 324 (1998) 67-76.