yamaha dt100a, b, c - dt125a, b, c - dt175a, b, c (1974-1976)
Upload
process-nmrCategory
view
4download
0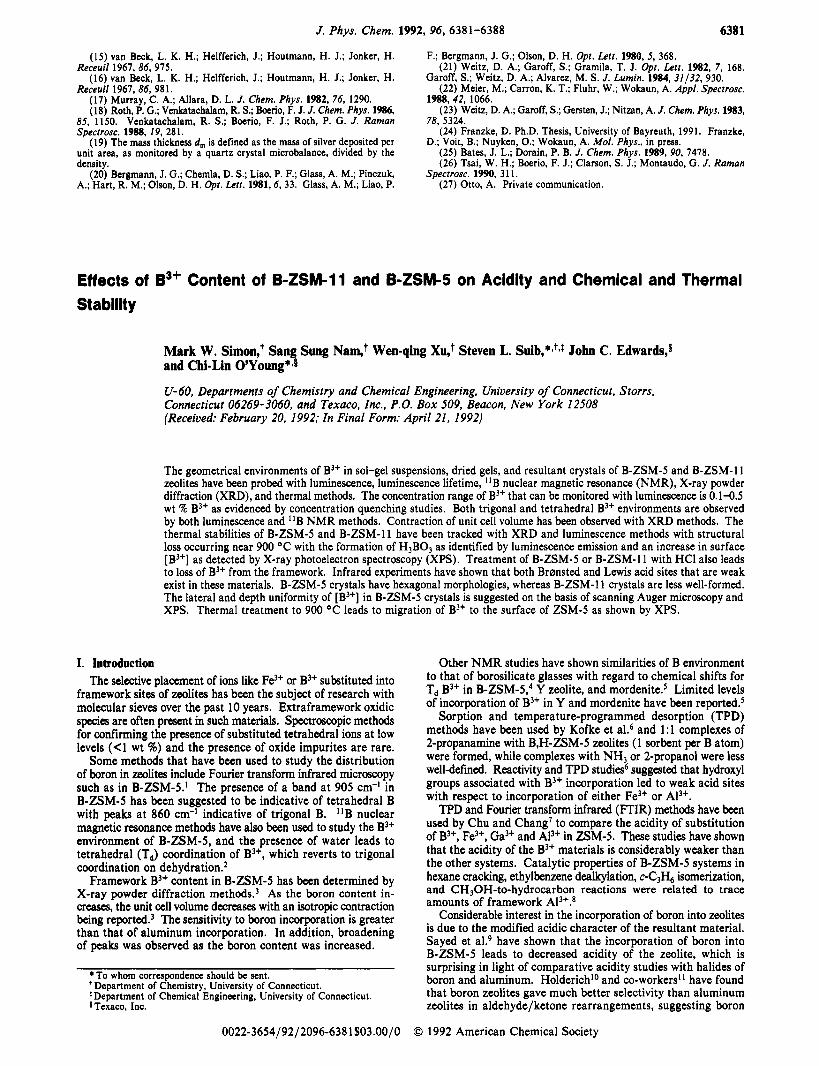
J. Phys. Chem. 1992, 96,6381-6388 6381
(15) van Beck, L. K. H.; Helfferich, J.; Houtmann, H. J.; Jonker, H. Receuil 1967, 86, 975.
(16) van Beck, L. K. H.; Helfferich, J.; Houtmann, H. J.; Jonker, H. Receuil 1967, 86, 981.
(17) Murray, C. A.; Allara, D. L. J . Chem. Phys. 1982, 76, 1290. (18) Roth, P. G.; Venkatachalam, R. S.; Boerio, F. J. J. Chem. Phys. 1986,
85, 1150. Venkatachalam, R. S.; Boerio, F. J.; Roth, P. G. J. Raman Spectrosc. 1988, 19, 28 1.
(19) The mass thickness d , is defined as the mass of silver deposited per unit area, as monitored by a quartz crystal microbalance, divided by the density.
(20) Bergmann, J. G.; Chemla, D. S.; Liao, P. F.; Glass, A. M.; Pinczuk, A.; Hart, R. M.; Olson, D. H. Opt. Lett. 1981,6, 33. Glass, A. M.; Liao, P.
Effects of Stability
F.; Bergmann, J. G.; Olson, D. H. Opt. Lett. 1980, 5, 368.
Garoff, S.; Weitz, D. A.; Alvarez, M. S . J. Lumin. 1984, 31/32, 930.
1988, 42, 1066.
78, 5324.
D.; Voit, B.; Nuyken, 0.; Wokaun, A. Mol. Phys., in press.
Spectrosc. 1990, 3 1 1.
(21) Weitz, D. A.; Garoff, S.; Gramila, T. J. Opt. Letr. 1982, 7, 168.
(22) Meier, M.; Carron, K. T.; Fluhr, W.; Wokaun, A. Appl. Spectrosc.
(23) Weitz, D. A.; Garoff, S.; Gersten, J.; Nitzan, A. J . Chem. Phys. 1983,
(24) Franzke, D. Ph.D. Thesis, University of Bayreuth, 1991. Franzke,
(25) Bates, J. L.; Dorain, P. B. J . Chem. Phys. 1989, 90, 7478. (26) Tsai, W. H.; Boerio, F. J.; Clarson, S. J.; Montaudo, G. J. Raman
(27) Otto, A. Private communication.
B3+ Content of B-ZSM-11 and B-ZSM-5 on Acidity and Chemical and Thermal
Mark W. Simon: Sang Sung Nam,t Wen-qing Xu,+ Steven L. Suib,**f*l John C. Edwards,s and Chi-Lin O'Young*-l
U-60, Departments of Chemistry and Chemical Engineering, University of Connecticut, Storrs, Connecticut 06269-3060, and Texaco, Inc., P.O. Box 509, Beacon, New York 12508 (Received: February 20, 1992; In Final Form: April 21, 1992)
The geometrical environments of B3+ in sol-gel suspensions, dried gels, and resultant crystals of B-ZSM-5 and B-ZSM-11 zeolites have been probed with luminescence, luminescence lifetime, IlB nuclear magnetic resonance (NMR), X-ray powder diffraction (XRD), and thermal methods. The concentration range of B3+ that can be monitored with luminescence is 0.1-0.5 wt % B3+ as evidenced by concentration quenching studies. Both trigonal and tetrahedral B3+ environments are observed by both luminescence and IlB NMR methods. Contraction of unit cell volume has been observed with XRD methods. The thermal stabilities of B-ZSM-5 and B-ZSM-11 have been tracked with XRD and luminescence methods with structural loss occurring near 900 "C with the formation of H3B03 as identified by luminescence emission and an increase in surface [B3+] as detected by X-ray photoelectron spectroscopy (XPS). Treatment of B-ZSM-5 or B-ZSM-11 with HCl also leads to loss of B3+ from the framework. Infrared experiments have shown that both Bransted and Lewis acid sites that are weak exist in these materials. B-ZSM-5 crystals have hexagonal morphologies, whereas B-ZSM-11 crystals are less well-formed. The lateral and depth uniformity of [B3+] in B-ZSM-5 crystals is suggested on the basis of scanning Auger microscopy and XPS. Thermal treatment to 900 OC leads to migration of B3+ to the surface of ZSM-5 as shown by XPS.
I. Introduction The selective placement of ions like Fe3+ or B3+ substituted into
framework sites of zeolites has been the subject of research with molecular sieves over the past 10 years. Extraframework oxidic species are often present in such materials. Spectroscopic methods for confirming the presence of substituted tetrahedral ions at low levels (<1 wt %) and the presence of oxide impurites are rare.
Some methods that have been used to study the distribution of boron in zeolites include Fourier transform infrared microscopy such as in B-ZSM-5.' The presence of a band at 905 cm-' in B-ZSM-5 has been suggested to be indicative of tetrahedral B with peaks at 860 cm-' indicative of trigonal B. 'lB nuclear magnetic resonance methods have also been used to study the B3+ environment of B-ZSM-5, and the presence of water leads to tetrahedral (Td) coordination of B3+, which reverts to trigonal coordination on dehydration.*
Framework B3+ content in B-ZSM-5 has been determined by X-ray powder diffraction method^.^ As the boron content in- creases, the unit cell volume decreases with an isotropic contraction being rep~r ted .~ The sensitivity to boron incopration is greater than that of aluminum incorporation. In addition, broadening of peaks was observed as the boron content was increased.
To whom correspondence should be sent.
*Department of Chemical Engineering, University of Connecticut. ITexaco. Inc.
Department of Chemistry, University of Connecticut.
Other NMR studies have shown similarities of B environment to that of borosilicate glasses with regard to chemical shifts for Td B3+ in B-ZSM-5,4 Y zeolite, and mordenite.s Limited levels of incorporation of B3+ in Y and mordenite have been reported.5
Sorption and temperature-programmed desorption (TPD) methods have been used by Kofke et a1.6 and 1 : 1 complexes of 2-propanamine with B,H-ZSM-5 zeolites (1 sorbent per B atom) were formed, while complexes with NH3 or 2-propanol were less well-defined. Reactivity and TF'D studies6 suggested that hydroxyl groups associated with B3+ incorporation led to weak acid sites with respect to incorporation of either Fe3+ or A13+.
TPD and Fourier transform infrared (FTIR) methods have been used by Chu and Chang' to compare the acidity of substitution of B3+, Fe3+, Ga3+ and AI3+ in ZSM-5. These studies have shown that the acidity of the B3+ materials is considerably weaker than the other systems. Catalytic properties of B-ZSM-5 systems in hexane cracking, ethylbenzene dealkylation, c-C& isomerization, and CH30H-to-hydrocarbon reactions were related to trace amounts of framework AI3+.*
Considerable interest in the incorporation of boron into zeolites is due to the modified acidic character of the resultant material. Sayed et aL9 have shown that the incorporation of boron into B-ZSM-5 leads to decreased acidity of the zeolite, which is surprising in light of comparative acidity studies with halides of boron and aluminum. Holderichlo and co-workers1 * have found that boron zeolites gave much better selectivity than aluminum zeolites in aldehyde/ketone rearrangements, suggesting boron
0 1992 American Chemical Societv 0022-365419212096-638 1103.0010 , , I -

6382 The Journal of Physical Chemistry, Vol. 96, No. 15, 1992 Simon et al.
zeolites have unique weak acid sites. In this paper, we report that the coordination environment of
boron in B-ZSM-5 and B-ZSM-11 molecular sieves can be monitored with luminescence emission, excitation, and lifetime methods for sols, dried gels, and crystalline materials. The local geometries determined by luminescence have been verified by I'B magic angle spinning nuclear magnetic resonance (MASNMR) methods. The presence of unreacted boron starting material, boron(II1) oxide, and the effects of thermal and chemical treatment of such molecular sieves can also be observed with these methods. Acid sites have also been probed with FTIR and TPD methods. Morphologies of the B-ZSM-5 and B-ZSM-11 Zeolites have also been studied with scanning electron microscopy (SEM). Lateral and depth uniformities of [B3+] have been studied with XPS and scanning Auger microscopy (SAM).
II. Experimental Section A. Preparation of B Zeolites. 1. B-ZSM-11. About 25 g of
Ludox AS40 (Du Pont, 40% Si02) was added slowly (while vigorously stirring) to a mixture of solution which contained 2.07 g of H3B03, 52.89 g of 55% tetra-n-butylammonium hydroxide (TBAOH) solution, and 189 mL of water. The addition of Ludox gave a curdy, gelatinous, milky solution. The molar composition of the gel was 3.36[(TBA),O], l.0(B203), 10(Si02), and 680- (HZO).
The solution had a pH of 13.0. The mixture was transferred to a Teflon liner and sealed in a steel autoclave. The autoclave was kept in an oven at 165 "C for 7 days. After that it was cooled, and its contents were filtered. The recovered white crystalline material was washed with copious amounts of water and dried at 110 OC for 16 h. The dried sample was calcined at 592 "C under nitrogen for 4 h and then under air for another 2 h to remove the organic template. The yield is 7.12 g. This particular sample contains 44.2% Si and 0.24% B for a Si/B ratio of 7 1. ZSM-11 samples with the B3+ content varying from 0.1 to 0.5 wt % were prepared by using similar procedures to those given above.
2. B-ZSM-5 Zeolites. B-ZSM-5 zeolites were prepared by making a sol9 mixture of H3B03 (0.4 g), tetraethyl orthosilicate [TEOS] (12.1 g), NH40H (2.14 g), tetrapropylammonium bromide (5.36 g), and water (80 g). The sol was then heated in an autoclave at 165 "C for 48 h at autogeneous pressure, resulting in crystalline B-ZSM-5.I2 Dehydration of all boron zeolites was done in increments of 50 "C/h to a final temperature of 380 "C under vacuum at 2 X Torr. The treatment temperature was held for 8 h, and the tubes for luminescence experiments were sealed under vacuum.
B. Luminescence. Luminescence excitation and emission spectra were recorded with a Spex Model 1680B double-mono- chromator luminescence spectrometer. Lifetime experiments were done with a PRA Model 3000 luminescence lifetime spectrometer with a hydrogen arc lamp as the excitation source.23
C. IlB Magic Angle Spinning Nuclear Magnetic Resonance. MASNMR experiments for *'B were done on a Varian Unity-300 superconducting NMR system with full solids capability. The spectra were aquired at 96.25 MHz with a Doty 7-mm CP/MAS multinuclear probe, using proton decoupling, a 3-ps pulse width, relaxation delay of 1 s, and an MAS spinning speed of 5 kHz. The spcctra are referenced to a solid sample of NaBH, (0 ppm). The same samples that were analyzed with luminescence, and luminescence lifetime experiments were used in these studies by transferring the samples from the sealed tubes to NMR tubes.
D. X-ray Powder Diffraction. X-ray powder diffraction, (XRD) experiments were done on a Scintag Model PDS 2000 diffractometer. Samples were mounted on glass slides by sprin- kling powder onto the slides to avoid preferential ordering. E. WllL Analyses. Atomic absorption analyses for B, AI, and
Si were measured with a Varian Techtron atomic absorption spectrometer using standard addition methods.
F. Scadng Ekctron Mimecopy a d Eeergy Dbpersive X-ray Analyses. SEM experiments were done with an AMRAY Model 18 10 D microscope with an AMRAY PV 9800 energy dispersive X-ray analyzer equipped with a windowless detector for obser-
vation of elements with atomic numbers below Na and greater than Be. Samples were loaded on Cu holders.
G. Fourier Transform Infrared Spectroscopy. FTIR spectra were collected on a Mattson Galaxy spectrometer with 2-cm-' resolution by using either self-supporting wafers or KBr pellets and a triglycine sulfate detector. Pyridine chemisorption ex- periments were done with self-supporting wafers in a home-built in situ cell by first dehydrating the zeolite to a desirable tem- perature (typically 380 "C) followed by sorption of pyridine at room temperature. The samples were then evacuated at 1 X Torr overnight to remove physisorbed pyridine, and infrared spectra were recorded.
H. X-ray Photoelectron Spectroscopy. X-ray photoelectron spectroscopy (XPS) experiments were done on a bybold Heraeus Model LHS 10 spectrometer with an EA10 hemispherical analyzer detector. The spectrometer was calibrated to both the Au 4f7,2 transition at 83.8 eV and the Cu 2~312 transition at 923.4 eV. Both Mg and A1 Ka radiation were used. Samples were loaded on indium foil, and the C 1s signal was set at 284.6 eV for adventitious carbon.
I. Scpnning Auger Microscopy. A Perkin-Elmer PHI Model 610 scanning Auger microprobe was used for SAM experiments. A sample angle of 30' relative to the normal electron beam was used for all analyses. A base pressure of 1 X kPa was maintained before and during data collection. An electron beam voltage of 3 keV and a sample current of 20 nA were used in order to minimize charge buildup on the sample. Depth profiles were done by sputtering the surface with argon ions with a beam current of 0.05 pA and a raster area of 2 mm X 2 mm.
J. Temperaturehogrammed Desorption. TPD experiments were done on a home-built system consisting of a gas chroma- tograph detector, a tube furnace, a temperature programmer, an integrator, and a stainless steel reactor. Variable-temperature program rates were used in these experiments. Samples were first dehydrated in situ in He at 500 "C for 1 h and then cooled to 100 "C in He; then ammonia was sorbed at 100 "C and physi- sorbed ammonia was removed with flowing He at 100 "C over- night for sorption experiments relating the amount absorbed to the B3+ content. Temperature programming in He gas was then carried out.
For variable-flow-rate experiments and for studies of NH3 sorption at various temperatures, the same exact procedures as given above were followed, except the samples were first calcined to desired temperatures in air for 5 h and then cooled to room temperature in air.
III. Results A. Structural Data. The XRD data for B-ZSM-5 and
BZSM-11 show sharp peaks with no indication of broadening due to amorphous impurities. The XRD data for B-ZSM- 11 after calcination are shown in Figure la. The XRD data for B-ZSM-5 after heat treatment at 900 "C in air for 14 h are shown in Figure 1 b. Note that the relative intensities of the two intense peaks between 7 and 10°28 have changed after heat treatment, with the lowest 28 peak (10.7 = d, -8'28) increasing in intensity. The relative intensities of the doublet structure near 46O28 have also changed after heat treatment at 1000 "C in air for 14 h. The peak widths are roughly the same before and after heat treatment. Treatment of B-ZSM-5 with a solution of 1.0 M HCl (refluxed for 12 h) leads to considerable reduction in intensity of the most intense peaks near 24'28 and an overall reduction in intensity of all peaks. The major diffraction lines for B203 and H3B03 are not consistent with any of the diffraction peaks observed for B-ZSM-5 before or after heat or chemical treatment with HC1.
The XRD data for B-ZSM-11 are shown in Figure 2a. Heat treatment of B-ZSM-11 to 1000 "C in air for 14 h leads to diffraction patterns similar to those shown in Figure 2b. The doublet peaks between 8 and 10°28 are somewhat different after heat treatment with a decrease in intensity of the higher 28 peak near 10O28. Chemical treatment of B-ZSM-11 with 1.0 M HCl leads to a tremendous decrease in intensity of most peaks as shown in Figure 2c and an almost completely amorphous material. Peaks
Effects of B3+ Content of B-ZSM-11 and B-ZSM-5 The Journal of Physical Chemistry, Vol. 96, No. 15, 1992 6383
1620.0-
1440.0: 1260 .O
8 .84 4 . 4 4 2 . 9 8 2 . 2 5 1 . 8 2 1 .54 100 1800.0 , '
8 - - c f I
1080.0i 900.0 d I, E: i30
7 2 0 . 0
5 4 0 . 0
360.0
1 8 0 . 0
0 .o
8 .84 4 . 4 4 2 . 9 8 2 . 2 5 1 .82 1 . 5 4 1000 .o ,--E 1100
9 0 0 . 0 - E
800.0-
7 0 0 . 0 - - 6 0 0 . 0 - 1 1
2
500.0
400 .O
300.0
2 0 0 . 0
100.0
0 .o 10 2 0 30 4 0 50 60
3700,0j 8 .84 , 4.44 , 2.,98 2:25 l ; 8 2 1,;
3330.0 - 2960.0- 5 2590 .O.
2220 .o.
1850 .O - 1480 .O.
1110.0- I 10 20 30 40 50 60
Figure 1. X-ray powder diffraction of B-ZSM-5: (a, top) calcined at 380 O C in N2 for 4 h and then in air for 4 h; (b, middle) heated to 900 O C in air for 14 h; (c, bottom) treated with 1.0 M HC1. for B203 are not consistent for any of the observed diffraction data for the heat-treated or HC1-treated B-ZSM-11. Peaks near 15"20 and 28"28 observed in the HC1-treated B-ZSM-11 sample are consistent with the most intense peaks of boric acid whose spectrum is shown in Figure 2d.
Unit cell volume contraction is observed for both the B-ZSM-5 and B-ZSM-11 systems. For B-ZSM-11 with Si/B = 228, the unit cell volume is 5344 A3. For B-ZSM-11 with Si/B = 212 an 162, the unit cell volumes are 5334 and 5312 A3, respectively. For B-ZSM-5 with Si/B = 113 and 90, the unit cell volumes are 5347 and 5319 A3, respectively. B. Morphology of Crystals. An SEM photograph of a B-
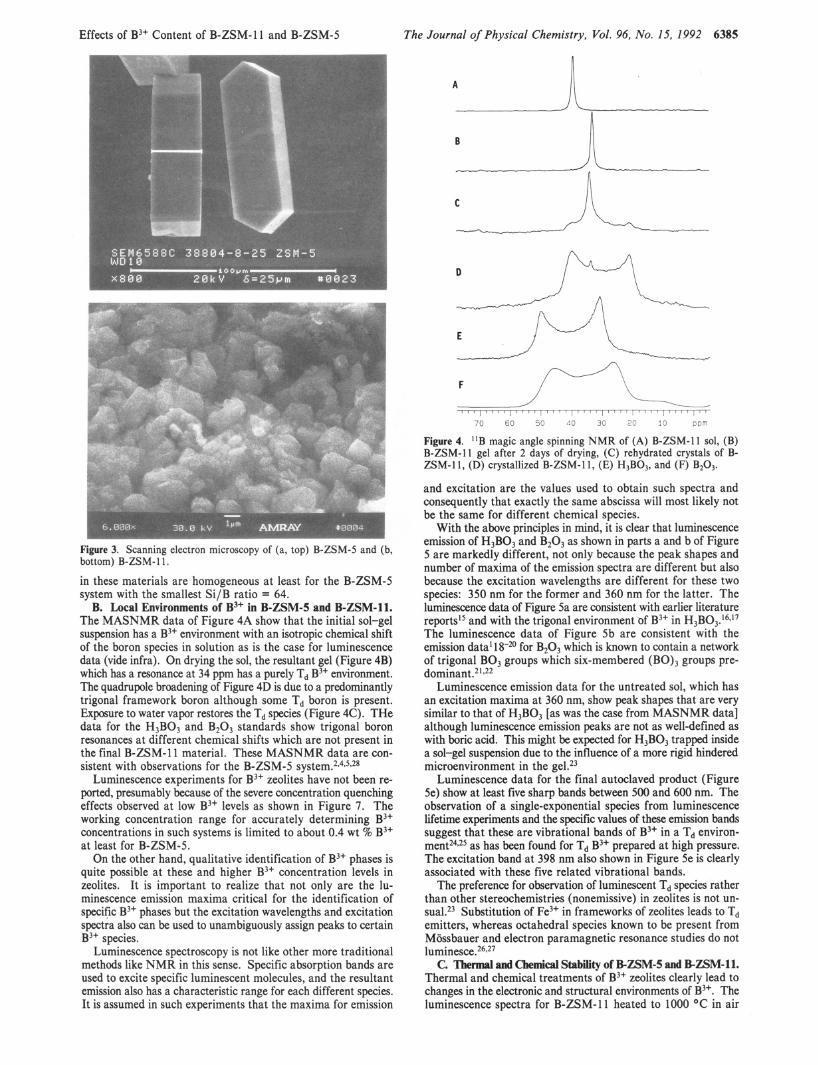
ZSM-5 single crystal is shown in Figure 3a. Such crystals are about 60 pm long, about 25 pm across, and about 10 pm wide and have a hexagonal morphology. Intergrowths and twinning are also observed as seen in the upper left-hand section of this photo. A corresponding SEM photograph of B-ZSM-11 crystals is shown in Figure 3b. The morphology of B-ZSZM-11 crystals is not as welldefmed as for B-ZSM-5. The overall length of these crystals is about 5-20 pm, with some crystals showing a hexag- onal-like morphology.
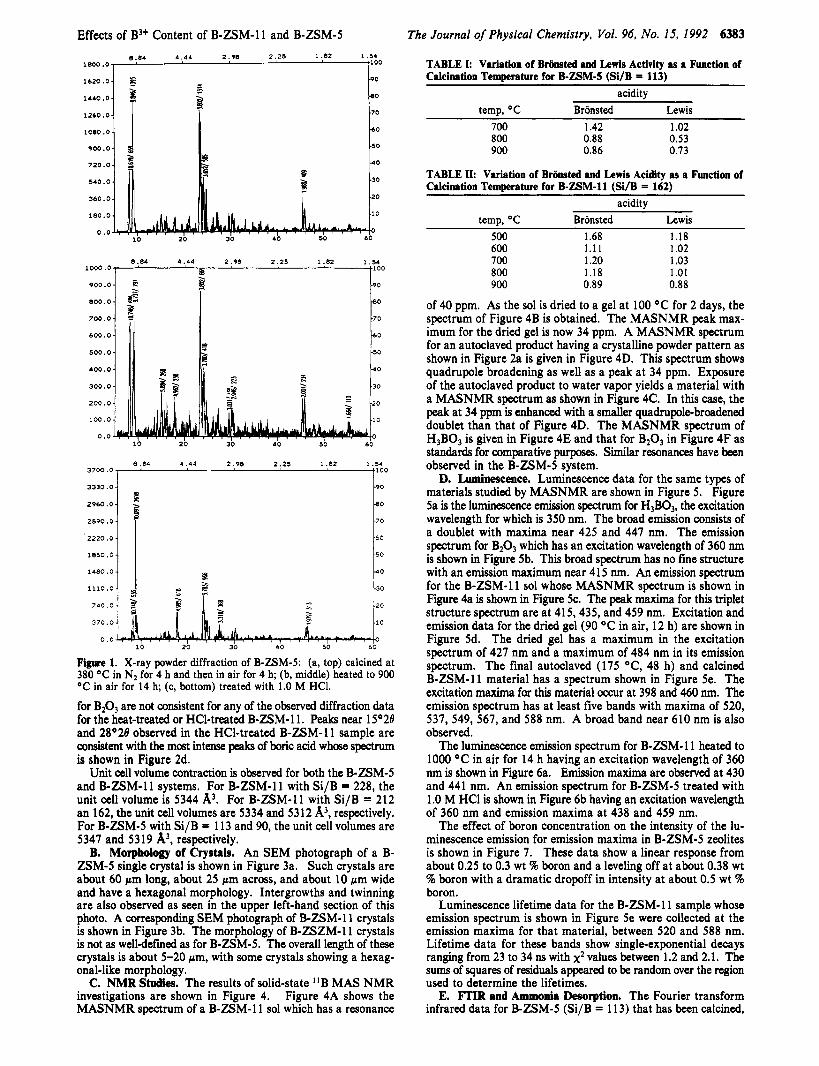
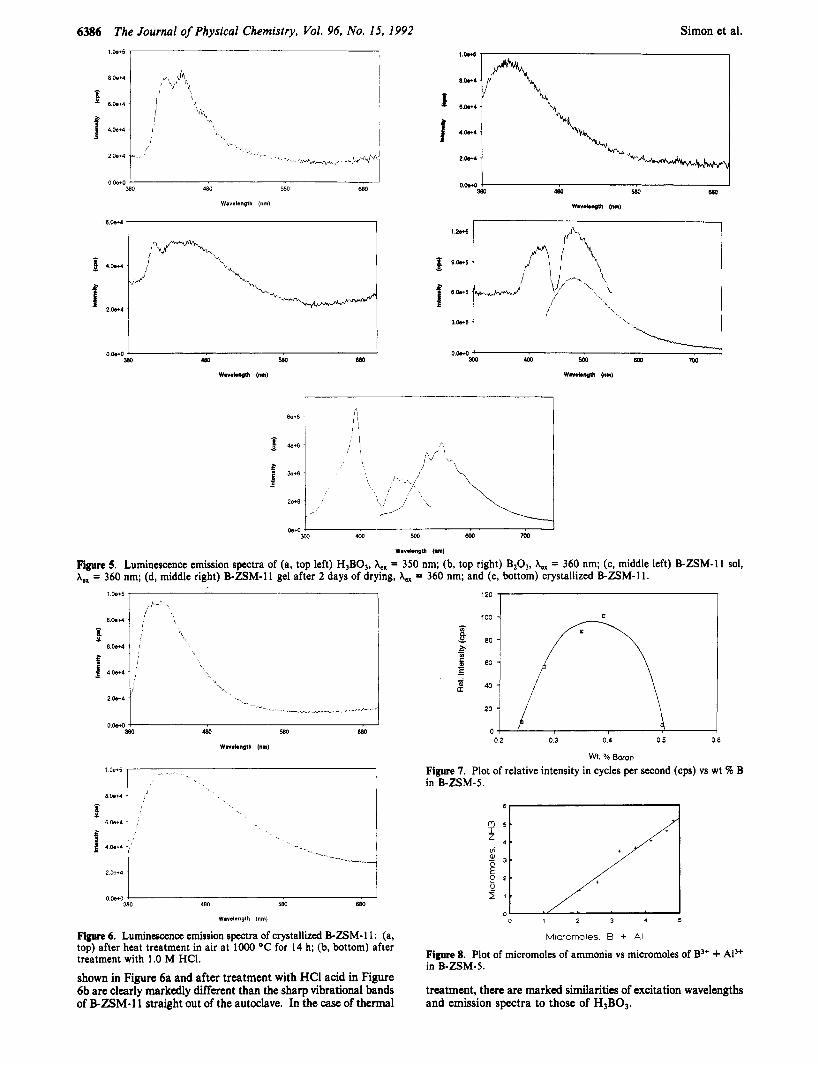
C. N M R Studies. The results of solid-state IlB MAS NMR investigations are shown in Figure 4. Figure 4A shows the MASNMR spectrum of a B-ZSM-11 sol which has a resonance
TABLE I: Variation of Brhsted and Lewis Activity as a Function of Calcination Temwrature for B-ZSM-5 (Si/B = 113)
acidity temp, O C BrBnsted Lewis
700 1.42 1.02 800 0.88 0.53 900 0.86 0.13
TABLE 11: Venation of Bronsted end Lewis Acidity as e Function of Calcination Temperature for B-ZSM-11 (Si/B = 162)
acidity temp, "C BrBnsted Lewis
500 1.68 1.18 600 1.1 1 1.02 700 1.20 1.03 800 1.18 1.01 900 0.89 0.88
of 40 ppm. As the sol is dried to a gel at 100 OC for 2 days, the spectrum of Figure 4B is obtained. The MASNMR peak max- imum for the dried gel is now 34 ppm. A MASNMR spectrum for an autoclaved product having a crystalline powder pattern as shown in Figure 2a is given in Figure 4D. This spectrum shows quadrupole broadening as well as a peak at 34 ppm. Exposure of the autoclaved product to water vapor yields a material with a MASNMR spectrum as shown in Figure 4C. In this case, the peak at 34 ppm is enhanced with a smaller quadrupolebroadened doublet than that of Figure 4D. The MASNMR spectrum of
is given in Figure 4E and that for B203 in Figure 4F as standards for comparative purposes. Similar reSOnanceS have k e n observed in the B-ZSM-5 system.
D. Luminescence. Luminescence data for the same types of materials studied by MASNMR are shown in Figure 5. Figure Sa is the l u m i n m c e emission spectrum for H3BO3, the excitation wavelength for which is 350 nm. The broad emission consists of a doublet with maxima near 425 and 447 nm. The emission spectrum for B203 which has an excitation wavelength of 360 nm is shown in Figure 5b. This broad spectrum has no fine structure with an emission maximum near 415 nm. An emission spectrum for the B-ZSM-11 sol whose MASNMR spectrum is shown in Figure 4a is shown in Figure 5c. The peak maxima for this triplet structure spectrum are at 415,435, and 459 nm. Excitation and emission data for the dried gel (90 "C in air, 12 h) are shown in Figure 5d. The dried gel has a maximum in the excitation spectrum of 427 nm and a maximum of 484 nm in its emission spectrum. The final autoclaved (175 "C, 48 h) and calcined B-ZSM-11 material has a spectrum shown in Figure 5e. The excitation maxima for this material OCCUT at 398 and 460 nm. The emission spectrum has at least five bands with maxima of 520, 537, 549, 567, and 588 nm. A broad band near 610 nm is also observed.
The luminescence emission spectrum for B-ZSM-I 1 heated to 1000 "C in air for 14 h having an excitation wavelength of 360 nm is shown in Figure 6a. Emission maxima are observed at 430 and 441 nm. An emission spectrum for B-ZSM-5 treated with 1 .O M HCl is shown in Figure 6b having an excitation wavelength of 360 nm and emission maxima at 438 and 459 nm.
The effect of boron concentration on the intensity of the lu- minescence emission for emission maxima in B-ZSM-5 zeolites is shown in Figure 7. These data show a linear response from about 0.25 to 0.3 wt 5% boron and a leveling off at about 0.38 wt %J boron with a dramatic dropoff in intensity at about 0.5 wt % boron.
Luminescence lifetime data for the B-ZSM-11 sample whose emission spectrum is shown in Figure 5e were collected at the emission maxima for that material, between 520 and 588 nm. Lifetime data for these bands show single-exponential decays ranging from 23 to 34 ns with x2 values between 1.2 and 2.1. The sums of squares of residuals appeared to be random over the region used to determine the lifetimes. E. FTIR and Ammonia Desorption. The Fourier transform
infrared data for B-ZSM-5 (Si/B = 113) that has been calcined,

6384 The Journal of Physical Chemistry, Vol. 96, No. 15, 1992
8 . 8 4 4 . 4 4 2 .98 2 . 2 5 1.82 1.54 1600.0
1440.0
1 2 8 0 . 0
1 1 2 0 . 0
9 6 0 . 0
800.0
6 4 0 . 0
4 8 0 . 0
3 2 0 . 0
1 6 0 . 0
0 .o 10 20 30 40 50 60
200.0-
175.0-
Simon et al.
4 4.,44 2 ; 9 8 2;25 1;82 2 5 0 . 0
2 2 5 . 0
s . i - - 1 40
8 . 8 4 4 . 4 4 2 . 9 8 2 . 2 5 1 .e2 1.54 100 1000.0
E s 9 0 0 . 0
i
3 0 0 . 0 0
2 0 0 . 0 0
1 0 0 . 0 0
0 .o 10 20 30 40 50 60
8 .84 4 . 4 4 2 . 9 8 2 . 2 5 1.82 1 . 5 4 13000.0, '
11700.0
10400.0
3 . p 9 1 0 0 . 0 -70
7800 .O 60
6500 , 0 -50
5200 .O do
3 9 0 0 . 0 -30
2600 .O
1 3 0 0 . 0
0 . 0 10 20 30 4 0 50 60
Figure 2. X-ray powder diffraction of (a, top left) B-ZSM-11 calcined at 380 O C in N2 for 4 h and then in air for 4 h; (b, top right) B-ZSM-11 heated to 1000 O C in air for 14 h; (c, bottom left) B-ZSM-11 treated with 1.0 M HCI; and (d, bottom right) H3B0,.
exposed to pyridine, and evacuated to remove physisorbed pyridine in an in situ cell are given in Table I. Peaks at 1540 cm-' are assigned to Brransted acid sites, and peaks at 1460 cm-l are as- signed to Lewis sites. The band at 1890 cm-' is used as an internal standard. The Brransted acid sites decrease from 1.42 relative area to 0.86 as the calcination temperature is raised from 700 to 900 O C . The Lewis acid sites decrease from a relative area of 1.02 to 0.73 over this same temperature range.
Similar pyridine chemisorption infrared data are given in Table I1 for B-ZSM-11 (Si/B = 162). As the temperature of initial calcination increases from 500 to 900 "C, there is a decrease in relative area of the Brransted peak from 1.68 to 0.89. In addition, as the temperature is increased Over this same range, the relative area of the Lewis peak decreases from 1.18 to 0.88. The ammonia sorption data for various levels of [B3+] substitution in B-ZSM-5 measured by TPD of chemisorbed ammonia are shown in Figure 8. The number of micromoles of ammonia sorbed increases from 1.2 pmol for a sample containing 2.2 Wmol of B3+ and A13+ to 5 pmol for a sample containing 4.9 pmol B3+ and Al".
The number of micromoles of ammonia desorbed from B- ZSM-5 as a function of the calcination temperature of B-ZSM-5 decreases from 5.2 to 0.98 pmol as the calcination temperature increases from 600 to 900 OC for B-ZSM-5 (Si/B = 68) as shown in Figure 9. A similar trend is observed for B-ZSM-5 (Si/B = 113) where over the same temperature range the number of micromoles of desorbed NH3 decreases from 3.5 to 1.98. As the programming rate is increased from 7.5 to 22.5 "C/min,
the temperature maxima for ammonia desorption increase from 417.9 to 454.6 K for B-ZSM-5 calcined at 600 O C as shown in Figure 10. Ammonia TPD data for BZSM-5 (Si/B = 64) zeolite calcined at temperatures from 873 K to 1173 K are shown in Figure 11. The areas for ammonia desorbed under each curve decrease as the temperature is raised to 1173 K, whereas the temperature maxima decreise from 437.4 to 430.8 to 426 K at 873,973, and 1073 K, respectively. At a calcination temperature of 1173 K, the temperature maximum appears at 446.8 K, a value higher than the lower calcination temperatures. F. Bulk d Surface Properties. Bulk analyses for B-ZSM-5
obtained from atomic absorption show that materials with Si/B ratios between 64 and 113 can be prepared that have XRD
patterns similar to that of Figure la. The [A13+] content of such materials is between 300 and 400 ppm. Similar bulk analytical data for B-ZSM-11 show Si/B ratios between 98 and 212 with [A13+] concentrations in a similar range to that of B-ZSM-5.
A depth profile for B-ZSM-5 (Si/B = 64) is shown in Figure 12. The Si, Al, B, and 0 atomic concentration ratios at the surface are similar to those after considerable sputtering time (84 min). SAM spot analyses did not show any deviations from these atomic concentrations on the B-ZSM-5 material for analyses of about 10 different spots for each sample.
XPS survey spectra for BZSM-5 thermally treated at 600,800, and 900 "C are shown in Figure 13. Note that a peak about 190 eV appears for the sample heated to 900 O C which is not apparent at lower thermal treatment temperatures. The B/Si surface ratio for the sample heated at 600 O C is 0.06, for 800 O C treatment is 0.05, and for the 900 "C treatment is 1.4.
IV. Discussion A. Structure, Morphology, and Composition of B-ZSM-5 and
B-ZSM-11. XRD data such as those of Figures la and 2a clearly show that pure B-ZSM-5 and B-ZSM-11 materials have been prepared. The structural data are in line with the porotectosilicate five-membered ring ZSM-5 structure with B3+ substituting in Td sites with two-layer pair stacking related by an inversion center in B-ZSM-5 and by mirror symmetry and an inversion center in B-ZSM-1 l.13J4
Chemical analyses are also consistent with the incorporation of B3+ into both ZSM-5 and ZSM-11, although the amount of B3+ incorporation in B-ZSM-5 is roughly 1.5 times greater than for B-ZSM-11 systems. Trace levels of A13+ at 300-400 ppm are found in all materials studied here. The decrease in unit cell volume of both B-ZSM-5 and B-ZSM-11 is due to the incorpo- ration of B3+ in these systems. Similar trends have been reported in the l i t e r a t~ re .~ .~
The morphological data of Figure 3 show that B-ZSM-5 crystals can be singular with hexagonal shapes, although twinning and intergrowths are common. The shapes of the B-ZSM-11 crystals are not as pronounced as in the B-ZSM-5 system.
The data from Auger spot analyses and depth profiles as shown in Figure 13 suggest that the lateral and depth B3+ distributions
Effects of B3+ Content of B-ZSM-11 and B-ZSM-5 The Journal of Physical Chemistry, Vol. 96, No. 15, 1992 6385
I
Figure 3. Scanning electron microscopy of (a, top) B-ZSM-5 and (b, bottom) B-ZSM- 1 1.
in these materials are homogeneous at least for the B-ZSM-5 system with the smallest Si/B ratio = 64.
B. Local Environments of B3+ in B-ZSM-5 and B-ZSM-11. The MASNMR data of Figure 4A show that the initial sol-gel suspension has a B3+ environment with an isotropic chemical shift of the boron species in solution as is the case for luminescence data (vide infra). On drying the sol, the resultant gel (Figure 4B) which has a resonance at 34 ppm has a purely Td B3+ environment. The quadrupole broadening of Figure 4D is due to a predominantly trigonal framework boron although some Td boron is present. Exposure to water vapor restores the Td species (Figure 4C). THe data for the H3B03 and B203 standards show trigonal boron resonances at different chemical shifts which are not present in the final B-ZSM-11 material. These MASNMR data are con- sistent with observations for the B-ZSM-5 system.2,4*5*28
Luminescence experiments for B3+ zeolites have not been re- ported, presumably because of the severe concentration quenching effects observed at low B3+ levels as shown in Figure 7. The working concentration range for accurately determining B3+ concentrations in such systems is limited to about 0.4 wt % B3+ at least for B-ZSM-5.
On the other hand, qualitative identification of B3+ phases is quite possible at these and higher B3+ concentration levels in zeolites. It is important to realize that not only are the lu- minescence emission maxima critical for the identification of specific B3+ phases but the excitation wavelengths and excitation spectra also can be used to unambiguously assign peaks to certain B3+ species.
Luminescence spectroscopy is not like other more traditional methods like NMR in this sense. Specific absorption bands are used to excite specific luminescent molecules, and the resultant emission also has a characteristic range for each different species. It is assumed in such experiments that the maxima for emission
A I\
B ll
D
70 60 50 40 30 20 10 ppm
Figure 4. IlB magic angle spinning NMR of (A) B-ZSM-11 sol, (B) B-ZSM-11 gel after 2 days of drying, (C) rehydrated crystals of B- ZSM-11, (D) crystallized B-ZSM-11, (E) H3BO3, and (F) B203.
and excitation are the values used to obtain such spectra and consequently that exactly the same abscissa will most likely not be the same for different chemical species.
With the above principles in mind, it is clear that luminescence emission of H$03 and B203 as shown in parts a and b of Figure 5 are markedly different, not only because the peak shapes and number of maxima of the emission spectra are different but also because the excitation wavelengths are different for these two species: 350 nm for the former and 360 nm for the latter. The luminescence data of Figure 5a are consistent with earlier literature reports15 and with the trigonal environment of B3+ in H3B03.16*17 The luminescence data of Figure 5b are consistent with the emission datal 18-20 for B203 which is known to contain a network of trigonal BO, groups which six-membered (BO), groups pre- dominant.2 *22
Luminescence emission data for the untreated sol, which has an excitation maxima at 360 nm, show peak shapes that are very similar to that of H3B03 [as was the case from MASNMR data] although luminescence emission peaks are not as well-defined as with boric acid. This might be expected for H$03 trapped inside a sol-gel suspension due to the influence of a more rigid hindered microenvironment in the gel.23
Luminescence data for the final autoclaved product (Figure 5e) show at least five sharp bands between 500 and 600 nm. The observation of a single-exponential species from luminescence lifetime experiments and the specific values of these emission bands suggest that these are vibrational bands of B3+ in a Td environ- ment24*25 as has been found for Td B3+ prepared at high pressure. The excitation band at 398 nm also shown in Figure 5e is clearly associated with these five related vibrational bands.
The preference for observation of luminescent Td species rather than other stereochemistries (nonemissive) in zeolites is not un-
Substitution of Fe3+ in frameworks of zeolites leads to Td emitters, whereas octahedral species known to be present from Mossbauer and electron paramagnetic resonance studies do not l ~ m i n e s c e . ~ ~ * ~ ~
Thermal and chemical treatments of B3+ zeolites clearly lead to changes in the electronic and structural environments of B3+. The luminescence spectra for B-ZSM-11 heated to 1000 "C in air
C. Thermal and chemical Stability of B-ZSM-5 and B-ZSM-11.
6386 The Journal of Physical Chemistry, Vol. 96, No. 15, 1992 1 b + S ,
480 580 680 0 b.0
380
Wavrlmplh (nm)
Simon et al.
Figure 5. Luminescence emission spectra of (a, top left) H3BO3, X, = 350 nm; (b, top right) B,O,, A,, = 360 nm; (c, middle left) B-ZSM-11 sol, A,, = 360 nm; (d, middle right) B-ZSM-11 gel after 2 days of drying, A,, = 360 nm; and (e, bottom) crystallized B-ZSM-11.
1 b + 5
8 b t 4
J 480 580 BBO
0 . w o 380
Wavolenglh (nm)
F i 6. Luminescence emission spectra of crystallized B-ZSM- 1 1 : (a, top) after heat treatment in air at lo00 O C for 14 h; (b, bottom) after treatment with 1.0 M HCl.
shown in Figure 6a and after treatment with HCl acid in Figure 6b are clearly markedly different than the sharp vibrational bands of BZSM-11 straight out of the autoclave. In the case of thermal
0 2 0.3 0.4 05 06
Wt. % Boron
Figure 7. Plot of relative intensity in cycles per second (cps) vs wt W B in B-ZSM-5.
0 1 2 3 4 5
Micromoles. B + AI
Figure 8. Plot of micromoles of ammonia vs micromoles of B3+ + A13+ in B-ZSM-5.
treatment, there are marked similarities of excitation wavelengths and emission spectra to those of H3B03.

Effects of B3+ Content of B-ZSM-11 and B-ZSM-5 The Journal of Physical Chemistry, Vol. 96, No. 15, 1992 6381
8 0.52 % B 0 0.95 % B
Temperature (C)
Figure 9. Plot of micromoles of ammonia vs temperature of calcination ("C) for B-ZSM-5.
373.2 473.2 573.2 673.2 773.2 873.2 TEMPERATURE. K
Figure 10. Plot of ammonia signal from GC vs temperature of calcina- tion ("C) for B-ZSM-5 at various temperature-programming rates.
1073 K
~-- 7 I I I
373.2 473.2 573.2 673.2 773.2 873.2 TEMPERATURE, K
Figure 11. Temperature-programmed desorption data for ammonia for B-ZSM-5 calcined at various temperatures.
In the case of acid treatment of B-ZSM-11, a broad emission spectrum (Figure 6b) that is significantly different from the autoclaved product is also obtained. This emission is in the same region as H3B03, but an exact assignment is not possible from the luminescence data. The XRD data of parts c and d of Figure
B/SI = 0.06
Y. N
YI 1 B/SI = 0.06
I I
5 Y -1 B/SI = 0.05 I I R t i
EO0 0 400 0 0 0 B i n d i n p E n e r g y / ev
F m e 12. XPS survey spectra of B-ZSM-5 heated to 600,800, and 900 O C : intensity vs binding energy (ev).
I Auora DEPTH PROFILE
i B 2511-5
B
0 C : 0 10 w t m m TIY m w . ) 100
PRE-SPWCR
Figure 13. SAM depth profile for B-ZSM-5: atomic concentration vs sputtering time (min).
2 clearly show that some H3B03 is formed in this material and that acid treatment is more severe than with B-ZSM-5 (Figure IC).
Thermal treatments of B-ZSM-5 to 900 "C and B-ZSM-11 to 1000 OC do show changes in the relative intensities of various XRD reflections (Figures l b and 2b); however, new diffraction lines indicative of the formation of extraframework B3+ or other species are not readily apparent. The data from TPD experiments such as those of Figures 9 and 1 1, however, show a pronounced effect on the amount of NH, desorbed from materials heated above 900 OC. The observation of one TPD peak near 440 K is in good agreement with the data of Chu and Chang for B-ZSM-5.'
The XPS data of Figure 12 clearly show that B3+ migrates to the surface of the zeolite with an enhanced B/Si ratio with respect to thermal treatment at temperatures below 900 "C. The TPD and surface spectroscopies appear to be more sensitive to the beginning stages of B3+ framework instability than with bulk methods.
D. Acidity of B-ZSM-5 and B-ZSM-11. The data of Figure 8 show that as the B3+ content increases, sorption of NH3 also increases. The infrared data of Tables I and I1 clearly show that both Brbnsted and Lewis sites are present in both B-ZSM-5 and B-ZSM-11. The data of Tables I and I1 as well as Figures 9 and 11 show that the number of acid sites diminishes as calcination temperature is raised from 600 to 900 O C . The data of Figure 10 can be used to calculate an apparent activation energy for ammonia desorption of about 8.6 kcal/mol. Observations of weak
6388 The Journal of Physical Chemistry, Vol. 96, No. 15, 1992 Simon et al.
Registry No. B, 7440-42-8; NH3, 7664-41-7; H3B03, 10043-35-3; pyridine, 1 10-86- 1.
References and Notes (1) Jansen, J. C.; de Ruiter, R.; van Bekkum, H. In Zeolites: Facts,
Figures, Future; Jacobs, P. A., Van Santen, R. A., Eds.; Elsevier: New York, 1989; pp 679-688.
(2) (a) Scholle, K. F. M. J. G.; Veeman, W. S. Zeolites 1985,5, 118-122. (b) Scholle, K. F. M. J. G.; Kentgens, A. P. M.; Veeman, W. S.; Frenken, P. F.; Ven der Velden, G. P. M. J . Phys. Chem. 1984, 88, 5-8.
(3) Meyers, B. L.; Ely, S. R.; Kutz, N. A.; Kaduk, J. A. J . Catal. 1985,
(4) Sulikowski, B.; Klinowski, J. In Zeolite Synthesis; Occelli, M. L., Robson, H. E., Eds.; ACS Symposium Series No. 398; American Chemical Society: Washington, DC, 1989; pp 393-404.
(5) Gaffney, T. R.; Pierantozzi, T.; Seger, M. R. In Zeolite Synthesis; Occelli, M. L., Robson, H. E., Eds.; ACS Symposium Series No. 398; Am- erican Chemical Society: Washington, DC, 1989; pp 374-392.
(6) Kofke, T. J. G.; Gorte, R. J.; Kokotailo, G. T. J . Carol. 1989, 116,
(7) Chu, C. T.-W.; Chang, C. D. J. Phys. Chem. 1985,89, 1569-1571. ( 8 ) Chu, C. T.-W.; Kuehl, G. H.; Lago, R. M.; Chang, C. D. J . Catal.
(9) Sayed, M. 8.; Aroux, A.; Vedrine, J . C. J. Catal. 1989, 116, 1-10. (10) Holderich, W. In Proc. 7th Int. Zeolite Con/.; Murakami, Y., Ed.;
Kodansha: Tokyo; Elsevier: Amsterdam, 1986; p 827. (1 1) Holderich, W.; Merger, F.; Mrosz, W. D.; Fischer, R. Eur. Patent
0,162,387, 1985. (12) Taramasso, M.; Perego, G.; Notari, B. Proc. 5th Int. ConJ Zeolites
1980, 4C-48. (13) Thomas, J. M.; Williams, C. In Chemical Reactions in Organic and
Inorganic Constrained Systems; Setton, R., Ed.; D. Reidel: New York, 1986;
(14) Kokotailo, G. T.; Chu, P.; Lawton, S. L.; Meier, W. M. Nature 1978,
(15) Inoue, T.; Kunitomi, M.; Sibata, E. J . SOC. Chem. Jpn. 1939, 60,
(16) Greenwood, N. N.; Earnshaw, A. Chemistry of the Elements; Per-
(17) Wells, A. F. Structural Inorganic Chemistry, 4th ed.; Clarendon:
(18) Kazema, K. Y.; Lindpere, A. K.; Luts, L. A. Tr. Ins. Fiz. Akad.
(19) Gaft, M. L.; Ermolenko, V. I.; Litventsev, E. G.; Nazarov, V. V.;
(20) Stokowski, S. E.; Cook, L.; Mueller, H.; Weber, M. J. J . Luminesc.
(21) Greenwood, N. N.; Earnshaw, A. Chemistry of the Elements; Per-
(22) Wells, A. F. Structural Inorganic Chemistry, 4th ed.; Clarendon:
(23) Suib, S. L. Focus on Photochemistry; CRC: Boca Raton, FL, 1991;
(24) Karasev, V. E.; Korptkikh, 0. A. Zn. Neorg. Khim. 1985, 30,
(25) Tischler, R. L.; Scheller, K. Combust. Name 1968, 12, 367-370. (26) Pott, G. T.; Stork, W. H. J. Catal. Rev.-Sci. Eng. 1975, 12,
(27) McNicol, B. D.; Pott, G. T.; Loos, K. R.; Mulder, N. ACSSymp. Ser.
(28) Kutz, N. A. In Perspectives in Molecular Sieve Science, Flank, W. H., Whyte, T. E., Eds.; ACS Symposium Series No. 368; American Chemical Society: Washington, DC, 1988; pp 532-541.
(29) Beyer, H. K.; Borbely, G. In Proc. 7th Int. Zeolite Conf.; Murakami, Y., Ed.; Elsevier: Amsterdam, 1986; pp 867-874.
91, 352-355.
252-262.
1985, 93, 451-458.
pp 49-80.
275, 119-120.
149-156.
gamon: Oxford, 1984; pp 229-230.
Oxford, 1975; p 852.
Nauk. Eston., SSR 1958, 7 , 34-48.
Valschikov, A. V. Ob. Rud. 1985, 4 , 10-13.
1984, 31-2, 823-826.
gamon: Oxford, 1984; pp 228-23 1.
Oxford, 1975; pp 96, 852.
pp 1-40.
2269-2272.
163-199.
1973, 121, 152-156.
acidity for the B-ZSM-5 have been reported.6.7~9~18~19~26~29 We note that similar weak acidity is observed for the B-ZSM-11 system. E. Properties of B3+ Zeolites as a Function of B3+ Content.
There are several trends of chemical properties of B3+ zeolites as the B3+ content is increased. As the boron content is increased in either B-ZSM-5 or B-ZSM-11, the B3+ migration is enhanced. This is evident from comparison of XPS data for thermally ac- tivated B3+ zeolites. As the boron content is increased, the thermal stability of the resultant zeolite decreases. This observation is in line with other data from the literaturesq9 that suggest that substitution levels of B3+ in zeolites are limited.
As the boron content is increased, the amount of sorbed am- monia increases as shown in Figure 8. As the boron content is therefore increased, the concentration of Briinsted and Lewis sites is increased. At calcination temperatures around 900 OC, acidity is diminished (Figure 9) and B3+ leaves the framework and mi- grates to the surface (Figure 12), perhaps in the form of H3B03 a suggested by the luminescence data of Figure 6a.
Finally, both Bronsted and Lewis sites decrease as the calci- nation temperature is increased. This decrease in acidity is greater for higher B3+-containing zeolites than lower B3+-containing zeolites as shown in the data of Figure 9. This is very likely due to the enhanced stability of low level B3+-substituted materials, due to less contraction of the unit cell.
v. Conclusions The data presented here for the B-ZSM-5 and B-ZSM-11
systems clearly show interrelationships among B3+ content, acidity, B3+ migration, thermal stability, structural integrity, local B3+ geometry (at least some framework B3+ is Td), and chemical stability. The TPD and FTIR results show that both Lewis and Brbnsted sites are present in these materials and that there is an overall decrease in acidity as the calcination temperature of the zeolite is increased. B3+ migrates at 900 OC to the surface out-of-framework sites to form H3B03 as shown by XPS and luminescence methods. The apparent heats of desorption are near 7-9 kcal/mol, indicative of weak acid sites in these materials. Luminescence and MASNMR methods have been used to study the local B3+ environment from the sol precursor through nu- cleation. Information regarding the chemical stability of B3+ zeolites has been obtained with XRD, luminescence, and XPS techniques to show that B-ZSM-5 is more acid resistant than B-ZSM-11. The thermal stability of both B-ZSM-5 and B- ZSM-11 is good until about 900 OC when B3+ migrates from the framwork to the external surfaces of these zeolites.
Acknowledgment. We thank Dr. William S. Willis for col- lecting the XPS data, Dr. Beng Jit Tan for the SAM data, and Lynn Kurihara for the luminescence lifetime data. S.L.S. ac- knowledges the Department of Energy, Office of Basic Energy Sciences, Division of Chemical Sciences for support of this re- search. We also acknowledge Texaco, Inc., for support of this research.
Copyright © 2022 FDOKUMEN


![Investigation of the acidity constants and Hammett relations of some oxazolo[4,5-b]pyridin derivatives using semiempirical AM1 quantum chemical calculation method](https://static.fdokumen.com/doc/165x107/63367766a1ced1126c0b3a4f/investigation-of-the-acidity-constants-and-hammett-relations-of-some-oxazolo45-bpyridin.jpg)
![One-pot synthesis of mesoporous [Al]-SBA-16 and acidity characterization by CO adsorption](https://static.fdokumen.com/doc/165x107/633e3ad94f039e2afc0181e4/one-pot-synthesis-of-mesoporous-al-sba-16-and-acidity-characterization-by-co-adsorption.jpg)