Effectiveness of a Pilot Healthy Eating and Lifestyle Promotion ...
301
Effectiveness of a Pilot Healthy Eating and Lifestyle Promotion Program for Hong Kong Middle-aged Women PAU King-man A Thesis Submitted in Partial Fulfillment P \ \ of the Requirements for the Degree of Master of Philosophy in Food and Nutritional Sciences ©The Chinese University of Hong Kong October 2001 The Chinese University of Hong Kong holds the copyright of this thesis. Any person(s) intending to use a part or whole of the materials in the thesis in a proposed publication must seek copyright release from the Dean of the Graduate School.
-
Upload
khangminh22 -
Category
Documents
-
view
1 -
download
0
Transcript of Effectiveness of a Pilot Healthy Eating and Lifestyle Promotion ...

Effectiveness of a Pilot Healthy Eating and Lifestyle
Promotion Program for Hong Kong Middle-aged Women
PAU King-man
A Thesis Submitted in Partial Fulfillment
P \ \
of the Requirements for the Degree of
Master of Philosophy
in
Food and Nutritional Sciences
©The Chinese University of Hong Kong
October 2001
The Chinese University of Hong Kong holds the copyright of this thesis. Any
person(s) intending to use a part or whole of the materials in the thesis in a proposed
publication must seek copyright release from the Dean of the Graduate School.

fen 1 a J® J i j
W v ~ i » R S i T Y 1 $ ) ^gvLIBRARY SYSTEM/^/

Acknowledgements
I would like to express my most sincere gratitude to my supervisor, Professor
Georgia S. Guldan, for her guidance, encouragement, patience and inspiration for my
works during the past two years. Her professional experience boosted my interests
in research work.
I am especially thankful to Ms Kwong Yuet Sum and Ms Chan Sau Wan, who are the
chairladies of the two women centres, for their assistance in recruiting the
participants, arranging the venues and materials for my research. Many thanks wish
to be given to the women who participated in the health promotion program and the
assessments.
I would also like to thank Mr Chui Kwan Ho Kenneth, technician of Department of
Biochemistry of the CUHK, for his invaluable advice during the analysis of the
results.
Last but not least, I would like to express my warmest gratitude to my parents, my
brother, my relatives and my friends for their love and their support throughout my
work.
i

ABSTRACT
Unbalanced diet and inadequate physical activity contribute to serious health
problems, with overweight and the disease of obesity a common outcome. Local
data indicated that Hong Kong middle-aged women (aged 30-50 years) have a low
awareness of the importance of healthy diet and regular physical activity, though they
showed high rates of cardiovascular risk factors. However, no health programs
have been undertaken to promote healthy lifestyle for them in Hong Kong.
Therefore, a pilot program aimed at promoting healthy eating and lifestyle was
organized among middle-aged women. A two-group pre-post design with a six-
month follow-up was used to assess the effects of the program, and to test the
hypothesis that the Education Group will improve their knowledge, attitudes and
behavior significantly more than the Control Group.
A questionnaire, three-day dietary record, weight, height, percent body fat and total
blood cholesterol levels were used to measure the program impacts. Results
showed that the Education Group ( , 8 1 ) increased significantly the mean Nutrition
Knowledge Score between the Pre- and Posttests (7.4 Vs 9.8, respectively; P<0.001).
Significant increases were also found in the proportion of women in the Education
Group only who had heard of saturated fat (from 46 to 83%; PO.OOl),the food
pyramid (from 79 to 100%;尸<0.001), and those who correctly matched all the food
groups with their corresponding level of the food pyramid (from 32 to 56%;
P<0.001). Moreover, only the Education Group showed significant increases in the
mean Physical Activity Knowledge Score (5.9 Vs 8.9, respectively;尸<0.01) and in
the proportion of women who had heard of the physical activity pyramid (from 14 to
79%;尸<0.001), and those who correctly matched all the physical activity groups
ii

with the corresponding level of the physical activity pyramid (from 2 to 21%;
P<0.001). The Control Group (A^-103) showed no significant changes in any
knowledge variables between the Pre- and Posttests. The Education Group
maintained all these nutrition and physical activity knowledge variables at six
months after the program (the Follow-up).
A significant improvement (P<0.01) was seen for only the Education Group in their
awareness of decreasing saturated fat intake at the Posttest. Additionally,
significant improvements (P<0.05) were found for the Education Group in their
awareness of increasing fruit and vegetable intakes at the Follow-up. However, no
significant improvements were observed in anthropometric measurements or eating
and physical activity behavior in either the Education or Control Group.
These findings clearly showed that this program successfully increased the nutrition
and physical activity knowledge among the middle-aged women, as well as their
awareness of decreasing saturated fat and increasing fruit and vegetable intakes.
This study also demonstrated that health behavior change among the local middle-
aged women is a challenge for local health promotion. Therefore, further
development and expansion of effective health promotion programs emphasizing
behavior change for Hong Kong middle-aged women are needed
Keywords: healthy eating, lifestyle, middle-aged women, physical activity, health
promotion
iii
一項有關香港中年婦女健康飮食及運動推廣活動的硏究及其成效
論文摘要
不均衡和不足夠的運動會引致嚴重的健康問題’而過重及肥胖是較爲常見的後
果°根據本地數據顯示’香港中年婦女〔年齡介乎30至50歲〕有高比率的心
血管病危險因素’可是她們對於健康飲食及定時運動的重要性卻只有很低的意
識。然而,香港沒有舉辦過針對中年婦女健康生活的推廣活動°故此’ 一項有
關香港中年婦女健康飮食及運動的推廣活動便舉行°爲了評估這項活動的成
效’硏究的設計爲對教育組和對照組兩組於活動前、後’及六個月後的評估結
果作出比較。是次硏究的假說是教育組相比對照組無論在知識’意識或行爲上
均會有較明顯的改善。
量度是次活動成效的工具包括問卷,三天的飮食記錄,體重,身高’身體脂肪
百分比和血液的總膽固醇含量。研究的結果顯示教育組〔斤二81〕於推廣活動後
明顯增加了平均的營養知識分數〔從7.4到9.8 ; P<0.00\〕o教育組中曾聽過
飽和脂肪的比例〔從46到83% ; P<0.001〕和食物金字塔的比例〔從79到
100% ; P<0.001〕亦出現明顯的增加。教育組中能夠正確知道食物金字塔每一
層是甚麼食物的比例亦有明顯的增加〔從32到56% ; ^<0.001〕O另一方面’
教育組於推廣活動後明顯增加了平均的運動知識分數〔從5.9到8.9 ;
?<0.001��教育組中曾聽過運動金字塔的比例出現明顯的增加〔從14到
79% ; PC0.001��教育組中能夠正確知道運動金字塔每一層是甚麼運動的比例
亦有明顯的增加〔從2到21% ; P<0.001〕。相反,對照組〔"=103〕在這段期
間並沒有在任何營養或運動的知識上有明顯的改變°在六個月後的追蹤硏究
中,教育組能夠維持所有的營養或運動知識°
只有教育組於推廣活動後在減少進食飽和脂肪的意識上有明顯的改善
〔P<0.01〕。另外,在六個月後的追蹤硏究中,亦只有教育組能夠在增加進食
生果和蔬菜的意識上有明顯的改善〔P<0.05〕。可是,無論是教育組或對照組’
人體測量的結果以及飮食和運動的行爲於推廣活動後或六個月後的追蹤研究中
均沒有明顯的改善。
硏究的結果淸楚顯示是次推廣活動能夠成功增加中年婦女的營養和運動知識,
以及減少進食飽和脂肪,增加進食生果和蔬菜的意識。硏究亦顯示對於健康推
廣活動而言,要改變本地中年婦女飮食和運動的行爲是一項挑戰。故此,香港
是需要更多針對改變本地中年婦女健康行爲的推廣活動。
要詞:健康飮食,生活方式’中年婦女’運動,健康推廣
iv

Table of Contents
Page
Acknowledgements i
Abstract ii
Abstract (Chinese version) iii
Table of Contents iv
List of Figures xii
List of Tables xiii
List of Abbreviations xxiv
CHAPTER ONE: INTRODUCTION
1.1 Women's Overweight and Obesity Prevalence and Trends 1
1.2 Etiology of Overweight and Obesity 2
1.3 Health Consequences of Obesity in Women 4
1.4 Dietary and Physical Activity Recommendations for Good Health for 6
Adults
1.5 Health Behavior Change Theories 8
1.6 Weight Control/Loss Interventions for Women 10
1.7 Weight Loss Risks 11
1.8 Health Promotion Programs for Women 12
1.9 General Situation and Population Trends Among Hong Kong Middle- 15
aged Women
1.10 Nutrition-related Morbidity and Mortality Among Hong Kong Women 16
1.11 Diet Composition of Hong Kong Middle-aged Women 20
1.12 Physical Activity Patterns of Hong Kong Middle-aged Women 21
1.13 Education and Health in Hong Kong Middle-aged Women 23
1.14 Attitudes Toward and Beliefs About Diet and Health of Hong Kong 24
Middle-aged Women
1.15 Common Weight Loss Methods Among Hong Kong Middle-aged 25
Women
1.16 Sources of Health Information Among Hong Kong Middle-aged 25
Women
XV

Page 1.17 Summary 26
1.18 Study Purpose and Objectives 26
CHAPTER TWO: METHODOLOGY
2.1 Recruitment of Participants 29
2.2 Focus Groups 29
2.3 Survey Instrument 30
2.3.1 Questionnaire 30
2.3.2 Three-day Dietary Record 35
2.3.3 Anthropometric and Cholesterol Measurements 35
2.4 Intervention 37
2.5 Evaluation 39
2.5.1 Process Evaluation 39
2.5.2 Outcome Evaluation 40
2.6 Data Management 40
2.7 Statistics 4Q
2.8 Data Analysis 41
2.8.1 Physical Activity Patterns 41
2.8.2 Dietary Patterns 44
2.8.3 Nutrition Knowledge Score 45
2.8.4 Physical Activity Knowledge Score 46
2.8.5 Blood Total Cholesterol 46
2.8.6 Body Mass Index 47
2.8.7 Percent Body Fat 47
2.9 Ethics 47
CHAPTER THREE: RESULTS
3.1 Focus Group Results 43
3.1.1 General Description of Participants 48
3.1.2 Perceived Values and Views on 'Health' 50
3.1.3 Perceived Values and Views on 'Healthy Lifestyle' 51
vi

Page 3.1.4 Perceived Values and Views on ‘Healthy Eating' 52
3.1.5 Perceived Values and Views on 'Physical Activity' 53
3.1.6 The Factors Motivating the Women to Adopt a Healthy 53
Lifestyle
3.1.7 Sources of Information About Healthy Eating and Physical 55
Activity
3.1.8 Suggestions for the Type and Content of Activities in a Health 55
Promotion Program
3.2 Participation Rate in the Study 56
3.3 Pretest 57
3.3.1 General Participant Sociodemographic Description 57
3.3.2 Anthropometry 59
3.3.3 Health Conditions Reported 60
. 3.3.4 Meal Patterns 61
3.3.5 Nutrient Supplements Practices 62
3.3.6 Cooking Practices 63
3.3.7 Food Removal Behavior 65
3.3.8 Food Label Reading 65
3.3.9 Dietary Intake 66
a. From the Three-day Dietary Records 66
b. From the Food Frequency Questionnaire 68
3.3.10 Nutrition Knowledge 59
3.3.11 Physical Activity Habits 72
3.3.12 Physical Activity Knowledge 73
3.3.13 Intention and Confidence in Changing Behavior 76
3.3.14 Perceived Difficulties in Changing Behavior 77
3.3.15 Perceived Methods Facilitating Behavior Change 79
3.3.16 Health Information Desired 80
3.3.17 Areas of Health the Women Would Like to Improve 81
3.3.18 Summary Profile of the Women at Pretest 82
3.4 Outcome Evaluation 35
3.5 Posttest g^
vii

Page
3.5.1 General Participant Sociodemographic Description 85
3.5.2 Anthropometry 86
3.5.3 Health Conditions Reported 87
3.5.4 Meal Patterns 88
3.5.5 Nutrient Supplements Practices 89
3.5.6 Cooking Practices 90
3.5.7 Food Removal Behavior 91
3.5.8 Food Label Reading 91
3.5.9 Dietary Intake 93
a. From the Three-day Dietary Records 93
b. From the Food Frequency Questionnaire 94
3.5.10 Nutrition Knowledge 95
3.5.11 Physical Activity Habits 98
3.5.12 Physical Activity Knowledge 99
3.5.13 Analysis the Changes by Education Level 102
3.5.14 Analysis the Changes by Age Group 104
3.5.15 Intention and Confidence in Changing Behavior 105
3.5.16 Perceived Difficulties in Changing Behavior 107
3.5.17 Perceived Methods Facilitating Behavior Change 109
3.5.18 Health Information Desired 110
3.5.19 Areas of Health the Women Would Like to Improve 111
3.5.20 Summary Profile of the Women at Posttest 112
3.6 Participants' Evaluation of the Intervention Program 113
3.7 Follow-up 118
3.7.1 General Participant Sociodemographic Description 118
3.7.2 Anthropometry 118
3.7.3 Health Conditions Reported 121
3.7.4 Meal Patterns 121
3.7.5 Nutrient Supplements Practices 122
3.7.6 Cooking Practices 123
3.7.7 Food Removal Behavior 125
3.7.8 Food Label Reading 126
viii

Page
3.7.9 Dietary Intake 127
a. From the Three-day Dietary Records 127
b. From the Food Frequency Questionnaire 129
3.7.10 Nutrition Knowledge 131
3.7.11 Physical Activity Habits 135
3.7.12 Physical Activity Knowledge 136
3.7.13 Intention and Confidence in Changing Behavior 140
3.7.14 Analysis the Changes by Education Level 142
3.7.15 Analysis the Changes by Age Group 143
3.7.16 Perceived Difficulties in Changing Behavior 144
3.7.17 Perceived Methods Facilitating Behavior Change 145
3.7.18 Health Information Desired 148
3.7.19 Areas of Health the Women Would Like to Improve 149
3.7.20 Summary Profile of the Women at Follow-up 150
CHAPTER FOUR: DISCUSSION
4.1 Implications of Findings 154
4.1.1 Current Situations in Diet and Physical Activity of Hong Kong 154
Middle-aged Women
4.1.2 Overall Effects of the Program 161
a. Changes in Knowledge 161
b. Changes in Awareness and Intention 163
c. Changes in Behavior 164
d. Changes in Anthropometery 166
4.2 Strengths and Limitations of the Study 167
4.3 Implications and Recommendations for Meeting the Challenges of 169
Improving Hong Kong Middle-aged Women's Nutrition and Physical
Activity Habits
4.4 Suggestions for Future Research 170
CHAPTER FIVE: CONCLUSIONS 172 ix

Page
References 173
Appendices
A Consent form (Chinese version) 182
B Consent form (English version) 183
C Questionnaire (Chinese version) 184
D Questionnaire (English version) 196
E Photos for food amount quantities and household measures (Chinese 210
version)
F Photos for food amount quantities and household measures (English 213
version)
G Sample of dietary record (Chinese version) 216
H Sample of dietary record (English version) 217
I Three-day dietary record (Chinese version) 218
J Three-day dietary record (English version) 221
K Pamphlets for health talks (Chinese version) 224
L Pamphlets for health talks (English version) 236
M Pamphlets for physical activity demonstration (Chinese version) 248
N Pamphlets for physical activity demonstration (English version) 253
O Process evaluation questionnaire (Chinese version) 258
P Process evaluation questionnaire (English version) 260
Q Overall evaluation questionnaire (Chinese version) 262
R Overall evaluation questionnaire (English version) 263
S Focus group questionnaire (Chinese version) 264
T Focus group questionnaire (English version) 265
U Focus group question guides (Chinese version) 266
x

Page
V Focus group question guides (English version) 268
W The food consumption patterns of women in the Education and 270
Control Groups
xi

List of Figures
Page Figure 1.1 A social marketing wheel 9
Figure 1.2 Percentages of Hong Kong females in specific age groups 18
classified as overweight and obese according to an Asian
definition (overweight as BMI=23.6-30.0 kg/m2 and obesity as
BMI >30.0 kg/m2)
Figure 1.3 Proportion of Hong Kong males and females with blood 19
cholesterol >5.2 mmol/L and >6.2 mmol/L
Figure 1.4 The study design of the pilot nutrition and health promotion 27
program
Figure 1.5 The conceptual framework of the study 28
Figure 3.1 Changes in Nutrition Knowledge Score between Pretest, Posttest 132
and Follow-up in the Education and Control Groups
Figure 3.2 Changes in Physical Activity Knowledge Score between Pretest, 137
Posttest and Follow-up in the Education and Control Groups
xii

List of Tables
Page Table 1.1 The secular trends of obesity by gender in selected countries 2
Table 1.2 The leading causes of death by age group among Hong Kong 17
females in 1997 (%)
Table 1.3 Age-specific hip fracture incidence rates in Hong Kong women 20
per 100,000 population in 1966, 1985 and 1991
Table 1.4 Physical activity frequency of male and female participants by 22
age group
Table 1.5 Education level of Hong Kong adults and their BMI & WHR 24
Table 1.6 Percentages of women in specific age group who obtain health 26
information from the three most common sources
Table 2.1 The list of physical activities under different categories 31
Table 2.2 Topics and objectives for each class/activity 37
Table 2.3 The intensity codes for the physical activities 42
Table 2.4 The frequency score, the duration score and the factor for each 43
index score
Table 2.5 Estimation of oil for cooking/consuming 45
Table 2.6 The marking scheme for calculating the Nutrition Knowledge 45
Score
Table 2.7 The marking for calculating the Physical Activity Knowledge 46
Score
Table 2.8 Proposed classification of BMI in adult Asians 47
Table 3.1 Date, duration and number of women participating in each focus 48
group
Table 3.2 Focus group participants' demographic characteristics (n=42) 49
Table 3.3 Number of women participating in each activity of Pretest, 56
Posttest and Follow-up
Table 3.4 Demographic characteristics of women in the Education and 58
Control Groups
xiii

Page Table 3.5 Physical measurement data, distributions of BMI levels 60
according to Asian definition, percent body fat levels and fasting
total blood cholesterol levels of women in the Education and
Control Groups
Table 3.6 Number (%) of self-reported cases of six health conditions in the 61
Education and Control Groups
Table 3.7 Number (%) of women rating their own health in different 61
categories in the Education and Control Groups
Table 3.8 Mean number of days 士 S.D. per week of having breakfast, 62
lunch, dinner and mean number 士 S.D of snacks per day in the
Education and Control Groups
Table 3.9 Number (%) of women who had breakfast every day, skipped 62
breakfast every day or had lunch every day in the Education and
Control Groups
Table 3.10 Number of supplements the women taken in the Education and 63
Control Groups
Table 3.11 Number (%) of women in taking the following types of 63
supplements in the Education and Control Groups
Table 3.12 Number (%) of women in using the following oils in the 64
Education and Control Groups
Table 3.13 Number (%) of women in using the following cooking methods 64
for fish, pork/beef, poultry and vegetables in the Education and
Control Groups
Table 3.14 Number (%) of women reported removing fat from meat and 65
removing skin from poultry in the Education and Control
Groups
Table 3.15 Number (%) of women reported reading the food labels with 66
different frequencies in the Education and Control Groups
Table 3.16 Number (%) of women reported different degrees of clarity of 66
the food labels in the Education and Control Groups
Table 3.17 Energy and nutrient intake data of the women in the Education 67
and Control Groups from the three-day dietary records
xiv

Page
Table 3.18 Number (%) of women exceeding the recommended percent 67
energy from total fat, SFA, PUFA and MUFA in the Education
and Control Groups
Table 3.19 Number (%) of women who met the recommended intake levels 68
of selected nutrients in the Education and Control Groups
Table 3.20 Number (%) of women who reported never/rarely consuming 69
specific dairy products in a typical week in the Education and
Control Groups
Table 3.21 Number (%) of women who reported consuming specific high 69
fat or unhealthy food two times or more in a typical week in the
Education and Control Groups
Table 3.22 Mean Nutrition Knowledge Score 士 S.D and the number (%) of 70
women reported having heard of saturated fat or the food
pyramid, and who correctly matched all four food groups with
their corresponding level of the food pyramid in the Education
and Control Groups
Table 3.23 Responses to the ten additional nutrition knowledge questions 71
between the Education and Control Groups
Table 3.24 Mean 土 S.D. reported daily energy expenditure (kcal/day), 72
summary physical activity index and number of flights of steps
climbed up per day in the Education and Control Groups
Table 3.25 Mean time (mins) 土 S.D. spent per day spent on the top ten most 73
frequent physical activities reported by the women in the
Education and Control Groups
Table 3.26 Mean Physical Activity Knowledge Score 土 S.D. and the 73
number (%) of women reported having heard of the physical
activity pyramid, and correctly matched all four physical activity
groups with their corresponding level of the physical activity
pyramid the Education and Control Groups
Table 3.27 Comparison between the number (%) of correct responses to the 75
nine additional physical activity knowledge questions between
the Education and Control Groups
XV

Page Table 3.28 The stages of change of behavior in the Education and Control 77
Groups
Table 3.29 Difficulties reportedly encountered preventing different 78
behavioral changes in the Education and Control Groups
Table 3.30 Methods suggested by the women in the Education and Control 79
Groups for facilitating different behavioral changes
Table 3.31 Topics about which the women would like to learn more in the 81
Education and Control Groups
Table 3.32 Aspects of health the women would like to improve in the 82
Education and Control Groups
Table 3.33 Comparison between physical measurement data, distributions 87
of BMI levels according to Asian definition, percent body fat
levels and fasting total blood cholesterol levels of women
between Pre- and Posttests in the Education and Control Groups
Table 3.34 Comparison between the number (%) of self-reported cases of 88
six health conditions between Pre- and Posttests in the
Education and Control Groups
Table 3.35 Comparison between the self-rated health relative to that of 88
peers between Pre- and Posttests in the Education and Control
Groups
Table 3.36 Comparison between the mean number of days 士 S.D. per week 89
of having breakfast, lunch and dinner, and the mean number of
snacks 土 S.D per day between Pre- and Posttests in the
Education and Control Groups
Table 3.37 Comparison between the number (%)of women who had 89
breakfast every day, skipped breakfast every day or had lunch
every day between Pre- and Posttests in the Education and
Control Groups
Table 3.38 The types of supplements taken in Pre- and Posttest in the 90
Education and Control Groups
xvi

Page
Table 3.39 Comparison between the number (%) of women reported 91
removing fat from meat and removing skin from poultry
between Pre- and Posttests in the Education and Control Groups
Table 3.40 Comparison between the number (%) of women reported 92
reading the food labels with different frequencies between Pre-
and Posttests in the Education and Control Groups
Table 3.41 Comparison between the distribution of the number (%) of 92
women citing different degrees of clarity of the food labels
between Pre- and Posttests in the Education and Control Groups
Table 3.42 Comparison between the energy and nutrient intake data 93
between Pre- and Posttests in the Education and Control Groups
Table 3.43 Comparison between the number (%) of women exceeding the 94
recommended percent energy from total fat, SFA, PUFA and
MUFA between Pre- and Posttests in the Education and Control
Groups
Table 3.44 Comparison between the number (%) of women who met the 94
recommended intake levels of selected nutrients between Pre-
and Posttests in the Education and Control Groups
Table 3.45 Comparison between the number (%) of women who reported 95
never/rarely consuming specific dairy products in a typical week
between Pre- and Posttests in the Education and Control Groups
Table 3.46 Comparison between the mean Nutrition Knowledge Score 土 96
S.D. and the number (%) of women reported having heard of
saturated fat or the food pyramid, and who correctly matched all
four food groups with their corresponding level of the food
pyramid between Pre- and Posttests in the Education and
Control Groups
Table 3.47 Comparison between the number (%) of correct responses to the 97
ten additional nutrition knowledge questions between Pre- and
Posttests in the Education and Control Groups
xvii

Page
Table 3.48 Comparison between the number (%) of women correctly 98
matched the specific food group in the food pyramid between
Pre- and Posttests in the Education and Control Groups
Table 3.49 Comparison between the mean 士 S.D. reported daily energy 99
expenditure (kcal/day), summary physical activity index and
number of flights of steps climbed up per day between Pre- and
Posttests in the Education and Control Groups
Table 3.50 Comparison between the mean Physical Activity Knowledge 100
Score 士 S.D. and the number (%) of women reported having
heard of the physical activity pyramid, and correctly matched all
the physical activity groups with their corresponding level of the
physical activity pyramid between Pre- and Posttests in the
Education and Control Groups
Table 3.51 Comparison between the number (%) of correct responses to the 101
nine additional physical activity knowledge questions between
Pre- and Posttests in the Education and Control Groups
Table 3.52 Comparison between the number (%) of women correctly 102
matched the specific physical activity group in the physical
activity pyramid between Pre- and Posttests in the Education
and Control Groups
Table 3.53 Comparison between the mean Nutrition and Physical Activity 104
Knowledge Scores 士 S.D.’ and the number (%) who had heard
of saturated fat, the food pyramid and the physical activity
pyramid of Education Group's women of different education
level between Pre- and Posttests
Table 3.54 Comparison between the mean Nutrition and Physical Activity 105
Knowledge Scores 士 S.D., and the number (%) who had heard
of saturated fat, the food pyramid and the physical activity
pyramid of Education Group's women of different age group
between Pre- and Posttests
Table 3.55 Comparison between the stages of change of behavior between 106
Pre- and Posttests in the Education and Control Groups
xviii

Page
Table 3.56 Comparison between the difficulties reportedly encountered 108
preventing different behavioral changes between Pre- and
Posttests in the Education and Control Groups
Table 3.57 Comparison between the suggested methods for assisting 109
different behavioral changes between Pre- and Posttests in the
Education and Control Groups
Table 3.58 Comparison between the interested topics which the women 111
would like to learn more between Pre- and Posttests in the
Education and Control Groups
Table 3.59 Comparison between the aspects of health to improve between 112
Pre- and Posttests in the Education and Control Groups
Table 3.60 Reasons for participating the program (n=63) 114
Table 3.61 Reasons for attending (n=16)/not attending (n=47) all the 114
activities
Table 3.62 Ideas on the different aspects of the program (n=63) 114
Table 3.63 Information the women had told others (n=52) 115
Table 3.64 Reasons for not telling information to others (n= 11) 115
Table 3.65 Information the women had learnt from the program (n=63) 116
Table 3.66 Reasons for recommending others to join future health 116
promotion program (n=63)
Table 3.67 Improvements for the program (n=63) 116
Table 3.68 Behavioral changes after the program (n=63) 117
Table 3.69 Reasons for not changing behaviors (n=63) 117
Table 3.70 Comparison between physical measurement data, distributions 120
of BMI levels according to Asian definition, percent body fat
levels and fasting total blood cholesterol level levels of women
between Pretest, Posttest and Follow-up in the Education and
Control Groups
Table 3.71 Comparison between the self-rated health relative to that of 121
peers between Pretest, Posttest and Follow-up in the Education
and Control Groups
xix

Page
Table 3.72 Comparison between the mean number of days 土 S.D. per week 122
of having breakfast, lunch and dinner, and the mean number of
snacks 士 S.D. per day between Pretest, Posttest and Follow-up
in the Education and Control Groups
Table 3.73 Comparison between the number (%) of women who had 122
breakfast every day, skipped breakfast every day or had lunch
every day between Pretest, Posttest and Follow-up in the
Education and Control Groups
Table 3.74 The types of supplements taken in Pretest, Posttest and Follow- 123
up in the Education and Control Groups
Table 3.75 Comparison between the number (%) of women in using the 123
following oils between Pretest, Posttest and Follow-up in the
Education and Control Groups
Table 3.76 Comparison between the number (%) of women in using the 125
following cooking methods for fish, pork/beef, poultry and
vegetables between Pretest, Posttest and Follow-up in the
Education and Control Groups
Table 3.77 Comparison between the number (%) of women reported 126
removing fat from meat and removing skin from poultry
between Pretest, Posttest and Follow-up in the Education and
Control Groups
Table 3.78 Comparison between the number (%) of women reported 126
reading the food labels with different frequencies between
Pretest,Posttest and Follow-up in the Education and Control
Groups
Table 3.79 Comparison between the distribution of the number (%) of 127
women citing different degrees of clarity of the food labels
between Pretest, Posttest and Follow-up in the Education and
Control Groups
Table 3.80 Comparison between the energy and nutrient intake data 128
between Pretest, Posttest and Follow-up in the Education and
Control Groups
XV

Page Table 3.81 Comparison between the number (%) of women exceeding the 129
recommended percent energy from total fat, SFA, PUFA and
MUFA between Pretest, Posttest and Follow-up in the Education
and Control Groups
Table 3.82 Comparison between the number (%) of women who met the 129
recommended intake levels of selected nutrients between
Pretest, Posttest and Follow-up in the Education and Control
Groups
Table 3.83 Comparison between the number (%) of women who reported 130
never/rarely consuming wheat bread and specific dairy products
in a typical week between Pretest, Posttest and Follow-up in the
Education and Control Groups
Table 3.84 Comparison between the number (%) of women reported having 132
heard of saturated fat or the food pyramid, and who correctly
matched all four food groups with their corresponding level of
the food pyramid between Pretest, Posttest and Follow-up in the
Education and Control Groups
Table 3.85 Comparison between the number (%) of correct responses to the 133
ten additional nutrition knowledge questions between Pretest,
Posttest and Follow-up in the Education Group
Table 3.86 Comparison between the number (%) of correct responses to the 134
ten additional nutrition knowledge questions between Pretest,
Posttest and Follow-up in the Control Group
Table 3.87 Comparison between the number (%) of women correctly 135
matched the specific food group in the food pyramid between
Pretest, Posttest and Follow-up in the Education and Control
Groups
Table 3.88 Comparison between the mean 土 S.D. reported daily energy 136
expenditure (kcal/day), summary physical activity index and
number of flights of steps climbed up per day between Pretest,
Posttest and Follow-up in the Education and Control Groups
xxi

Page Table 3.89 Comparison between the number (%) of women reported having 137
heard of the physical activity pyramid, and correctly matched all
the physical activity groups with the corresponding level of the
physical activity pyramid between Pretest, Posttest and Follow-
up in the Education and Control Groups
Table 3.90 Comparison between the number (%) of correct responses to the 138
nine additional physical activity knowledge questions between
Pretest, Posttest and Follow-up in the Education Group
Table 3.91 Comparison between the number (%) of correct responses to the 139
nine additional physical activity knowledge questions between
Pretest, Posttest and Follow-up in the Control Group
Table 3.92 Comparison between the number (%) of women correctly 140
matched the specific physical activity group in the physical
activity pyramid between Pretest, Posttest and Follow-up in the
Education and Control Groups
Table 3.93 Comparison between the stages of change of behavior between 141
Pretest, Posttest and Follow-up in the Education and Control
Groups
Table 3.94 Comparison between the mean Nutrition and Physical Activity 143
Knowledge Scores 土 S.D., and the number (%) who had heard
of saturated fat, the food pyramid and the physical activity
pyramid of Education Group's women of different education
level between Pretest, Posttest and Follow-up
Table 3.95 Comparison between the mean Nutrition and Physical Activity 144
Knowledge Scores 土 S.D.,and the number (%) who had heard
of saturated fat, the food pyramid and the physical activity
pyramid of Education Group's women of different age group
between Pretest, Posttest and Follow-up
Table 3.96 Comparison between the difficulties reportedly encountered 145
preventing different behavioral changes between Pretest,
Posttest and Follow-up in the Education and Control Groups
xxii

Page Table 3.97 Comparison between the suggested methods for assisting 146
different behavioral changes between Pretest, Posttest and
Follow-up in the Education and Control Groups
Table 3.98 Comparison between the interested topics which the women 148
would like to learn more between Pretest, Posttest and Follow-
up in the Education and Control Groups
Table 3.99 Comparison between the aspects of health to improve between 149
Pretest, Posttest and Follow-up in the Education and Control
Groups
Table 4.1 Comparison of the mean intake of the women in the present 159
study and the Hong Kong Adult Dietary Survey 1995
xxiii

List of Abbreviations
BMI Body mass index
CHD Coronary heart disease
MUFA Monounsaturated fatty acid
N/A Not applicable
N/S Non-significant
PUFA Polyunsaturated fatty acid
SD Standard deviation
SFA Saturated fatty acid
WHO World Health Organization
WHR Waist-to-hip-ratio
\
xxiv

CHAPTER ONE: INTRODUCTION
1.1 Women's Overweight and Obesity Prevalence and Trends
Unhealthy lifestyles, which include unbalanced diets composed of high fat,
cholesterol and protein but low in fibre, together with low levels of physical activity,
contribute to undesirable health outcomes, with overweight and the disease of
obesity common outcomes. Other chronic diseases such as certain kinds of cancers
(colon, breast etc), diabetes mellitus, hypertension, stroke, dyslipidemia, coronary
heart disease and osteoporosis may also result.
Overweight and obesity are increasingly common global health problems. Between
1985 and 1990, the prevalence of overweight in Canada increased from 19% to 27%
in men and 14% to 18% in women aged 18 years and over (Macdonald et al., 1997).
A US national survey showed that in 1988 to 1991, 33% of adults aged 20 years or
above were overweight, which had increased from 25% in 1976 to 1980 (Kuczmarski
etal., 1994).
The obesity prevalence in women has been shown to be higher than that for men in
some other countries, along with an increase in its prevalence for both genders in
recent years, as appear in the WHO'S statistics shown in Table 1.1.
• 1

Table 1.1 The secular trends of obesity by gender in selected countries Country Year Age (years) Men (%) Women (%)
Brazil 1975 25-64 3 8 1989 6 13
China 1989 20-45 0.3 0.9 1991 0.4 0.8 1992 1 2
East Germany 1989 25-65 13 21 1992 21 27
England 1980 16-64 6 8 1986/7 7 12 1991/2 13 15 1995 15 17
Japan 1982 >20 1 3 1987 1 3 1993 2 3
United States 1973 20-74 12 16 1978 12 15 1991 20 25
Source: [WHO, 1998]
1.2 Etiology of Overweight and Obesity
Obesity is a multi-factorial disease caused by the interaction of genetic, metabolic
and environmental factors. Bouchard et al found from a study of 1,698 members
from 409 families that biological inheritance accounted for only five percent of the
variance for subcutaneous fat and BMI, and 20 to 30 percent for the percent body fat,
fat mass, fat-free mass, and fat distribution. These results suggest that nongenetic
influences are important in determining the amount and distribution of body fat in the
population (Bouchard et al., 1988).
Metabolic factors also play a role in obesity. Total energy expenditure includes
resting energy expenditure (REE), thermogenesis of food and energy expended from
physical activity. Weinsier et al reviewed numerous studies and found that REE
had a small impact on body weight although it represents about 60% of daily energy
expenditure. According to his pair-matched study of 48 Caucasian females aged
49-67 years, 24 postmenopausal and moderately obese women were compared with
• 2

24 never-obese women of comparable age and body composition. There was no
significant difference between the obese and control women in REE after adjusting
for fat mass and fat free mass (Weinsier et al., 1995). Similar findings have been
seen in children. Goran et al demonstrated that the initial REE level did not predict
changes in fat mass in 75 children followed up annually for four years (Goran et al.,
1998).
Dietary intake and physical activity, the environmental factors, have been widely
studied to elucidate their associations with body weight. Samaras et al studied 436
healthy female twins of mean age 58 years and found that there was no relationship
between dietary fat and body fat in these women, controlled for genetic and
environmental factors (Samaras et al, 1998).
In contrast, studies have shown that physical activity has a vital role in the
development of obesity. Martinez-Gonzalez et al studied 15,239 men and women
aged 15 years or above in 15 member states of the European Union. They found
that the adjusted prevalence odds ratio for obesity was 0.52 (P<0.001) for people in
the upper quintile of physical activity, defined as greater than 30 metabolic
equivalents (METS), compared with people in the most physically inactive quintile
(<1.75 METS). Therefore, they concluded, obesity and higher body weight are
strongly associated with a sedentary lifestyle and lack of physical activity in the adult
population (Martinez-Gonzalez et al., 1999).
In summary, there is no single factor that leads to overweight or obesity. To prevent
overweight and obesity, modifiable factors, including diet and physical activity
should be the focus. Although research has shown that dietary factors had a
3

relatively lower effect than physical activity on the development of obesity, a
combination of healthy diet and active lifestyle are of no doubt the key means to
achieve and maintain a healthy weight, and prevent weight gain. The maintenance
of a healthy weight is essential because obesity may lead to other chronic diseases.
1.3 Health Consequences of Obesity in Women
Obesity, a disease itself, is associated with or else is a risk factor for many other
diseases such as coronary heart disease, diabetes mellitus, hypertension, stroke, some
forms of cancer and sleep apnea. Many studies have demonstrated the association
of obesity with these chronic diseases in women. A US cohort study which
included 82,473 female nurses aged 30-55 years with follow-up every two years
since 1976 showed that an increase in BMI of 1 kg/m2 in mid-life was associated
with a 12% increase in risk for hypertension, while an increase in BMI of 1 kg/m2 at
age 18 years was associated with an eight percent increase in risk. A 1-kg increase
in weight was associated with a five percent increase in risk (Huang et al., 1998).
BMI is not only associated with hypertension in women, but also with colon cancer
and breast cancer. Excess body weight is a risk factor for colon cancer as shown by
a US survey that included 7,914 women aged 25 years or over. Using BMI <22
kg/m2 as reference, the hazard ratios were 2.03, 2.17, 2.49, 3.64 and 2.74 for BMI
22-<24, 24-<26, 26-<28, 28-<30 and >30 kg/m2 respectively (Ford, 1999).
BMI was also found to be directly associated with breast cancer in postmenopausal
women, as shown by an Italian case-control study of 5,157 females at age 20-74
years in 1991-1994. The attributable risk for breast cancer (in this case, the
percentage of breast cancer cases attributable to overweight) in the postmenopausal
• 4

women was 10.2% for overweight (BMI>26.6 kg/m2) (Mezzetti et al., 1998).
Women with a higher BMI were also found to be at higher risk of stroke, diabetes
and arthritis. A health study of 116,759 US nurses aged 30-55 years in 1976 with
16 years follow-up found that women with a BMI >27 kg/m2 in mid-life were 1.7
times more likely to suffer ischemic stroke, while those with a BMI >32 kg/m2 were
2 times more likely than women with BMI <21 kg/m2. Women who gained 11.0-
19.9 kg were 1.7 times more likely to suffer ischemic stroke, while those who gained
20 kg or more were 2.5 times more likely than women who maintained a stable
weight at age 18 years (Rexrode et al, 1997). The same study also reported that
among the women with BMI >29 kg/m2, 70% of the CHD cases (including nonfatal
myocardial infarction and fatal coronary heart diseases) were due to obesity.
Overall 40% of the CHD cases were attributable to obesity (Manson et al., 1990).
In addition, an Italian national survey in 1983 involving 37,497 women aged >15
years showed that the age-adjusted relative risk of diabetes was 1.6 and 2.4 for
overweight (BMI 25-29.9 kg/m2) and obese (BMI >30 kg/m2) women respectively
(Negri et al” 1988).
With regard to a US study among 3,617 women done by Sahyoun et al, women with
BMI>29.0 kg/m2 and 25.0-28.9 kg/m2 had a relative risk of 1.44 and 1.14
respectively of developing arthritis compared with those with BMI 19.0-21.9 kg/m2.
These results showed that BMI was significantly associated with arthritis
susceptibility (Sahyoun et al., 1999).
Diverse negative effects of obesity or overweight in women, therefore, have been
demonstrated from many studies. This implies obesity and overweight are serious
5

problems with grave consequences requiring substantial attention and efforts to
decrease this burden.
1.4 Dietary and Physical Activity Recommendations for Good Health for
Adults
The American Heart Association (AHA) has recently published updated healthy
dietary guidelines for adults (American Heart Association, 2000). These ten
guidelines, when followed, may help their adherents improve heart rate, and also,
reduce the chance of getting diabetes, osteoporosis and certain kinds of cancers.
The dietary guidelines are as follow:
1) Eat a variety of fruit and vegetables. Choose five or more servings per day.
2) Eat a variety of grain products, including whole grains. Choose six or more
servings per day.
3) Include fat-free and low-fat milk products, fish, legumes (beans), skinless poultry
and lean meats.
4) Choose fats with two grams or less saturated fat per serving, such as liquid and tub
margarine, canola oil and olive oil.
5) Balance the calories that you eat with the calories that you use each day.
6) Maintain a level of physical activity that keeps you fit and matches the calories
you eat. Walk or do other activities for at least 30 minutes on most days. To
lose weight, do enough activity to use up more calories than you eat every day.
7) Limit your intake of foods high in calories or low in nutrition, including foods like
soft drinks and candy that have a lot of sugars.
8) Limit foods high in saturated fat, trans fat and/or cholesterol, such as full-fat milk
products, fatty meats, tropical oil, partially hydrogenated vegetable oils and egg
yolks.
• 6

9) Eat less than six grams (2,400 mg of sodium) of salt per day.
10) Have no more than one alcoholic drink per day if you are a woman and no more
than two if you are a man.
A public health recommendation on the types and amounts of physical activity
needed for health promotion and disease prevention was issued by the Centers for
Disease Control and Prevention and the American College of Sports Medicine (Curry
et al., 1992). The expert panel suggested that adults, both men and women, should
accumulate 30 minutes or more of moderate-intensity physical activity on most,
preferably all, days of the week. The recommended 30 minutes of activity can be
accumulated in short bouts of activity, for example, walking up the stairs instead of
taking the elevator, walking instead of driving short distances, doing calisthenics, or
pedaling a stationary cycle while watching television. Gardening, housework,
raking leaves, dancing, and playing actively with children can also contribute to the
30-minute-per-day total if performed at an intensity corresponding to brisk walking.
Those who perform lower-intensity activities should do them more often, for longer
periods of time, or both.
Additionally, the panel advises that people may also choose to walk or participate in
more vigorous activities, such as jogging, swimming, or cycling for 30 minutes daily.
Sports and recreational activities such as tennis can also be chosen. Those who do
not engage in regular physical activity should begin by incorporating a few minutes
of increased activity into their daily lives, building up gradually to 30 minutes per
day. Whereas those who are active on an irregular basis should adopt a more
consistent activity pattern.
• 7

1.5 Health Behavior Change Theories
Health behavior theories and models were developed to predict behavior change and
maintenance, and also assist the design and evaluation of health promotion
interventions. Although these theories are numerous, three of the most commonly
applied models are the (1) Health Belief Model, (2) Transtheoretical Model, and (3)
Social Marketing. The Health Belief Model (HBM) was developed by a group of
social psychologists in the US Public Health Service in the 1950s (Rosenstock, 1974).
The HBM was initially used to understand the widespread failure of people to accept
disease preventives or screening tests for the early detection of asymptomatic
disease.
The HBM consisted of several components: perceived susceptibility (one's opinion
of chances of getting a condition), perceived severity (one's opinion of how serious a
condition and its sequelae are), perceived benefits (one's opinion of the efficacy of
the advised action to reduce risk or seriousness of impact), perceived barriers (one's
opinion of the tangible and psychological costs of the advised action), cues to action
(strategies to activate one's readiness) and self-efficacy (one's confidence in one's
ability to take action) (Shumaker et al., 1998).
The Transtheoretical Model uses stages of change to integrate processes and
principles of change from across major theories of intervention, hence the name
'Transtheoretical'. One of the constructs is the stages of change, which represents
behavior change as a process, consisted of five stages. Precontemplation is the
stage in which people have no intention to take action. Contemplation is the stage
in which people are considering taking action, but they have no confidence to do it.
Preparation is the stage in which people intend to take action, and they have the
• 8

confidence to prepare to do it. Action is the stage in which people have changed a
specific behavior for less than six months. Maintenance is the stage in which
people have changed a specific behavior for six months or more (Shumaker et al.,
1998).
Social marketing is defined by Andreasen as the application of commercial
marketing technologies to the analysis, planning, execution, and evaluation of
programs designed to influence the voluntary behavior of target audiences in order to
improve their personal welfare and that of their society. The marketing process
includes six sequential stages, summarized in a 'social marketing wheel' (Figure 1.1),
as a framework for health communication programs (Glanz et al., 1996).
2) Selecting channels
1) Planning and 3) Developing materials
strategy and pretesting
Y
6) Feedback to refine 4) Implementation
program
X , . . / ^ \ 5) Assessing effectiveness ^
Figure 1.1 A social marketing wheel
Source: [Glanz et al, 1996]
• 9

1.6 Weight Control/Loss Interventions for Women
As the consequences of obesity are well established, many weight
reduction/maintenance programs have been carried out to tackle this problem.
Three methods, which differ in their emphasis, are commonly used: (1) diet therapy,
(2) exercise and (3) a combination of diet and exercise. These three methods more
or less employ techniques of behavioral modification.
Studies have demonstrated the benefits of fat restriction in addition to or instead of
energy restriction alone. One US behavioral weight loss program for 44 obese
females with non-insulin dependent diabetes mellitus (NIDDM) and 46 obese
females with a family history of diabetes, focusing on reducing calories and dietary
fat, produced significantly greater weight loss in women with NIDDM than a
program focusing on calorie restriction alone (7.7 kg Vs 4.6 kg). The former group
maintained a significantly larger amount of weight loss (5.2 kg Vs 1.0 kg) at one year
than the latter group (Pascale et al., 1995).
Another study in Denmark also showed low-fat eating is essential to weight loss.
Two obese males and 41 obese females with BMI 27-40 kg/m2 in Danish nutrition
clinics participated in a weight loss program. Results showed that for maintenance
of weight loss, the ad lib low-fat, high carbohydrate program was superior to the one
with fixed energy intake. After two years of the intervention, 65% of the ad lib
group and 40% of the fixed energy group maintained a weight loss of more than 5 kg
(Toubro & Astrup, 1997).
Sometimes, the weight lost by either method mentioned above is due to loss of lean
body mass. However, fat mass is the target of weight loss, and one program
• 10

demonstrated a way to preserve fat free mass during weight loss. Forty-four
overweight women, aged 20-49 years, maintained their fat free mass with a loss of
body mass by 3.7 to 5.4 kg after they had participated in a weight loss program with
a moderate diet and exercise intervention (a low fat diet with mean daily calorie
intake of 1236.75±67.21kcal and exercise time 3 days per week with each session of
30 minutes) (Marks et al., 1995).
As described above, a variety of methods are used to lose weight. However, the
effectiveness of the programs depends on long term maintenance of weight without
weight regain, and this is usually the most difficult task for overweight or obese
people. Therefore, some health promotion programs have been targeted to healthy
people, as it is always true that prevention is better than cure.
1.7 Weight Loss Risks
As has been described above, some studies showed that lost weight was regained
after a short period of time. In fact, Berg found that unsafe or unsupervised weight
loss can be harmful to health for several reasons: (1) Very-low-calorie-diets may
cause emotional disturbances and eating disorders. (2) Diet pills and drugs may be
dangerous and have exaggerated claims, and people may also abuse them. (3)
Weight cycling is associated with mortality from CHD because the weight regained
is usually in the form of abdominal fat. (4) Weight loss is associated with
demineralization of bones which may bring out osteoporosis. Therefore, losing
weight may not always improve health, and more attention should be paid to how
weight is lost and maintained (Berg, 1995).
• 11

1.8 Health Promotion Programs for Women
Various health promotion programs conducted in community and work-site
populations produced beneficial effects among the participants. Strategies used in
health promotion programs are similar to those of weight loss programs. Promotion
of healthy eating, regular physical activity and a combination of these are the most
popular, as studies have shown that diet and exercise influence various health
parameters. Therefore, healthful behaviors with respect to diet and exercise are
essential to good health.
The composition of diet plays a crucial role in health. Low fat, low cholesterol and
high fibre diets have been shown to be healthful. This is consistent with the
findings from a meta-analysis of 395 ward experiments. The study found that
isocaloric replacement of saturated fat (equal to 10% of the total calories) by
complex carbohydrates was associated with a decrease of 0.52 mmol/L total blood
cholesterol. In addition, isocaloric replacement of carbohydrates (equal to 5% of
the total calories) by polyunsaturated fat can further decrease blood cholesterol by
0.13 mmol/L. If dietary cholesterol was reduced to 200 mg, a further decrease of
0.13 mmol/L blood cholesterol occurred (Clarke et al., 1997). In contrast, a case
control study in India, with 86 hypertensives and 79 controls aged between 30-50
years indicated that high intakes of protein and salt were risk factors for hypertension
among women (Vijayalakshmi et al, 1999).
Besides healthy eating, regular physical activity has also been proven to be healthful.
A US population-based case-control study found that long term leisure time vigorous
activity was associated with lower colon cancer risk, with the odds ratios of a high
level of activity ( >1000 calories expended per week) to a low level (1-250 calories
• 12

per week) in men and women being 0.61 and 0.63 respectively (Slattery et al., 1997).
Walking has also been found to be of benefit to women. A US cohort study of
39,372 healthy female health professionals aged 45 years or above showed that
walking was associated with lower coronary heart disease (CHD) rates. Using
those who did not walk regularly as the reference, women who walked 1-59 mins,
1.0-1.5 hours, and 2 or more hours per week, had a relative risk of 0.86, 0.49 and
0.48, respectively, adjusted for potential confounders (Lee et al., 2001).
Physical activity is also associated with higher bone density. In the US, a study of
1,703 people aged 50 years or above showed that people with strenuous exercise like
jogging and squash for at least 15 minutes per session have hip bone density 6.5%
higher than those with mild (easy walking)/less than mild exercise of the same
duration. However, the study found no association between exercise and
osteoporotic fracture (Greendale et al, 1995).
As dietary fat intake influences health, several interventions involving a reduction of
percent dietary energy from fat have shown success and should be noted. For
example, a 2-year low-fat dietary intervention for 2,208 US women aged 50-79 years
of whom 28% were Black and 16% were Hispanic successfully reduced fat intake in
the intervention group from 40% of total energy to 26% after 6 months, as measured
by a food frequency questionnaire. The effect could be maintained at a 9%
reduction of percent energy from fat at 12 months and 18 months (Coates et al.,
1999).
Another program aimed at lowering fat intake was conducted in North Carolina.
• 13

This was a computer-based intervention for 378 low income women aged 18 years or
above. Results showed that the women significantly improved their nutrition
knowledge, stage of change and certain eating behaviors such as 'baked meat in
oven' and 'ate graham crackers or pretzels as snacks' (Campbell et al., 1999).
In addition to promoting lower fat intakes, increasing vegetable and fruit intake is
another goal. A health promotion intervention was organized in Maryland among
3,122 low-income women of age 18 years or above. The intervention group had
successfully increased their mean daily consumption of fruits and vegetables by 0.6土
0.1 servings, with an additional increase of 0.3± 0.1 servings after a year (Havas et
al., 1998).
Another important element of healthy lifestyle is regular physical activity. Health
promotion programs for women targeting regular physical activity have also been
shown to be successful. A weight-bearing exercise program in Australia for 19
postmenopausal women of mean age 66 years found that weight-bearing aerobic
exercise has a protective effect on lumbar and trochanteric bone mineral density
(Caplaner al., 1993).
A US lifestyle intervention also demonstrated the effect of exercise on bone density.
This program, designed for 236 premenopausal healthy women aged 44-50 years in
the US, emphasized lowering fat intake and increasing physical activity. It found
that women who increased their energy expenditure by more than 4180 kJ/wk can
reduce the rate of bone mineral density loss in their spine (Salamone et aL, 1999).
Various types of health promotion programs have been carried out among women.
• 14

The above programs illustrated that women would change their behaviors after being
given appropriate health information and skills to achieve a healthier lifestyle.
1.9 General Situation and Population Trends Among Hong Kong Middle-aged
Women
Statistics show that Hong Kong's population is an expanding but aging one. The
population is estimated to increase from 6,292,000 in mid-1996 to 8,205,900 in mid-
2016, while the percentage of the population aged 65 years or above will increase
from 10% to 13% at the same time (Census & Statistics Department, 1997). The
expected life at birth of males is expected to increase from 74.4 in 1988 to 78.1 in
2016, while that of females is expected to increase from 79.9 to 83.4 in the same
period (Census & Statistics Department, 1997) (Census & Statistics Department,
1998).
Although Hong Kong has experienced positive economic growth as its per capita
Gross Domestic Product (GDP) increased from HK$134,357 in 1992 to HK$ 192,290
in 1998 (Census & Statistics Department, 1998), health problems are still a
significantly large burden to the society. For instance, the number of
Comprehensive Social Security Assistance (CSSA) cases with ill health maintained
at a steady proportion of about 11% of total cases from '91/92 to ‘97/98 (Census &
Statistics Department, 1998). Total expenditures on medical and health services
increased from $4,520,000 in ‘87/88 to $24,122,000 in '96/97 (Census & Statistics
Department,1998).
In addition, health problems usually accompany aging and become more serious at
the same time. It is estimated that 25.9% of the elderly aged 70 years or over will
• 15

have hypertension in 2001, while prevalence rates of cardiac disease, bone fracture
and diabetes mellitus are estimated to be 14.3%, 12.0% and 7.9% respectively (Woo
et al., 1997). Several of these diseases are associated with obesity, a chronic
disease itself, and a forerunner to many others. Therefore, primary prevention of
obesity is the best way to reduce the prevalence of all these diseases.
From the Hong Kong population pyramid in mid-97, females aged 30-34 years and
35-39 years occupied the two highest proportions among all the females (Census &
Statistics Department, 1997). The estimated mid-year population of females aged
30-44 years increased from 638,900 in 1988 to 966,600 in 1997 (Census & Statistics
Department, 1998). To view with in a long-term perspective, a large number of
elderly females will be the outcome several decades later.
1.10 Nutrition-related Morbidity and Mortality Among Hong Kong Women
Overweight or obesity,common health problems in many developed countries, have
also emerged in Hong Kong, not only among the younger generation, but also among
adults, particularly the women. Other countries' health sectors, notably the US,
Canada and Britain, have health promotion and disease prevention programs,
objectives and guidelines in place to grapple with obesity. But in Hong Kong, such
efforts are minimal. Nutrition surveys and interventions in Hong Kong are not
unheard of among children, adolescents or the elderly. But usually, adults are an
almost neglected group as they are assumed to be a group with relatively few health
problems. In fact, adults also require adequate health knowledge and skills because
they make up the majority of the population and are also the major working group of
the society. They will face many years of life ahead which should be lived more
productively and without suffering preventable morbidity.
• 16

Table 1.2 presents prevalence of causes of mortality among three age groups of Hong
Kong women in 1997 (Hostpital Authority of Hong Kong, 1998). It shows that
cancer remains the top killer among Hong Kong females irrespective of their age.
Heart disease becomes the second highest killer in the middle and old ages, while
diabetes remains at the same rank in all age groups. Concern about the increasing
proportion of deaths from heart disease and diabetes is necessary because most of
these cases are preventable. Much of the cancer may also be preventable.
Table 1.2 The leading causes of death by age group among Hong Kong females in 1997 (%)
Age Group (years) Rank 15-44 45-64 >64 " 1 ~ C a n c e r (43) Cancer (53) Cancer (24)
2 Injury and Poisoning (30) Heart disease (11) Heart disease (18) 3 Pneumonia (4) Cerebrovascular disease (9) Pneumonia (17) 4 Heart disease (4) Injury and Poisoning (7) Cerebrovascular disease (13) 5 Cerebrovascular disease (3) Pneumonia (4) Nephritis, Nephrotic
syndrome and Nephrosis (4) 8 Diabetes Mellitus (0.4) Diabetes Mellitus (1) Diabetes Mellitus (2)
Source: [Hospital Authority Statistical Report, 97/98]
The Cardiovascular Risk Factor Prevalence Study conducted in 1995-1996 with
2,876 adults aged 25-64 years showed that there was a general increasing percentage
of women classified as overweight from the ages 35-39 years to 70-74 years, when
using an earlier Asian definition (overweight as BMI=23.6-30.0 kg/m2 and obesity as
BMI >30.0 kg/m2). The prevalence of obesity as shown in Figure 1.2 at the older
ages is more than double that of the younger ages (Janus, 1997).
• 17

45 40 7 , � � - 乂 z \ \ 3 5 \ \ - 一 ^
^ 3 0 7 —
W / 昏 25 — 7 ^ overweight -g 20 z ^ 1 - - _ - obesity _ » -v ,•‘ - t^ _ _
^ 1 S 7Z
^ 10 Z z ——
5 … Q 1 1 1 1 1 I I I I
2 5 - 2 9 3 0 - 3 4 3 5 - 3 9 4 0 - 4 4 4 5 - 4 9 5 0 - 5 4 5 5 - 5 9 6 0 - 6 4 6 5 - 6 9 7 0 - 7 4
Age group (years)
Figure 1,2 Percentages of Hong Kong females in specific age groups classified as
overweight and obese according to an Asian definition (overweight as BMI=23.6-
30.0 kg/m2 and obesity as BMI >30.0 kg/m2)
Source: [Janus, 1997].
That study also revealed that the proportions of people with blood cholesterol > 5.2
mmol/L and > 6.2 mmol/L in women were both lower than the rates for men at early
ages, but, as in other populations studied, this is reversed at later ages. The
proportions increased dramatically from young women to mid-life and then dropped
a little among the oldest women studied, as is shown in Figure 1.3.
• 18

80 n
70 — m a l e • - . , .——
一 60 一 female 一
邕 50 � 7 Z s ^ z y “‘ >5.2mmol/L & 40 z — r^ 扫 / y , . V S 30 T z . - •• / I 20 Z .. ^ ^ Z — — Ph “ — “ /
• • 一 •- 〜〜 —一〜、〜 ‘ 1 n * ^ . Z Z - , -……..… • • - � . � . . . . ...••••-••••
1VJ • _ -
0 _ ; " " ' , >6.2mmol/L
25-29 30-34 35-39 40-44 45-49 50-54 55-59 60-64 65-69 70-74
Age group (years)
Figure 1,3 Proportion of Hong Kong males and females with blood cholesterol >5.2
mmol/L and >6.2 mmol/L
Source: [Janus, 1997].
Compared with the Cardiovascular Risk Factor Prevalence Study, even larger
proportions of Hong Kong adults (aged >20 years) were found to have blood total
cholesterol levels higher than ideal in a lipid screening survey conducted in 1991,but
that survey was not population-based. Thirty-two percent of females had a total
cholesterol concentration between 5.2 and 6.2 mmol/L. Twenty-one percent of
females (n=407) had a total cholesterol concentration >6.2 mmol/L (Fong et al.,
1994).
It was shown in 1990 that aging and obesity are the major determinants of metabolic
syndrome (the clustering of hyperglycemia, hypertension, hypertriglyceridemia and
hyperinsulinemia) in 1,513 Hong Kong Chinese aged 30-65 years (Chan et al., 1996).
Therefore, the prevention of obesity is one of the primary strategies for preventing
other chronic diseases and should be the focus of health promotion programs among
Hong Kong adults.
• 19

The Cardiovascular Risk Factor Prevalence Study gives a more detailed description
of diabetes. It found that diabetes prevalence in females aged 35-44 years was 3%,
but it jumped to 29% in those aged 65-74 years. In addition, Impaired Glucose
Tolerance prevalence increased from 14% to 26% in the same age groups (Janus,
1997).
The age-adjusted incidence of hip fracture in Hong Kong women is increasing and is
also associated with age. Below the age of 60 years, there was not much change in
the incidence rate from 1966 to 1991. But above the age of 60 years, there was a
general increasing trend, particularly for the women above age of 70 years, as is
indicated in Table 1.3. Relative risk for hip fractures was significantly decreased
among women who performed walking outdoors, upstairs, uphill or with a load daily,
compared with those who performed these activities less than once a day (Lau,
1995).
Table 1.3 Age-specific hip fracture incidence rates in Hong Kong women per
100,000 population in 1966, 1985 and 1991 Rates (per 100,000 population)
Age Group (years) 1966 1985 1991 40-49 7 11 6 50-59 22 32 26 60-69 54 135 122 70-79 173 501 581 ^80 716 1521 1916
Adapted from [Lau, 1995]
1.11 Diet Composition of Hong Kong Middle-aged Women
From the Cardiovascular Risk Factor Prevalence Study, the proportions of females
aged 25 to 64 years having a diet comprising less than 30% fat, less than 10%
saturated fat as total energy and less than 300 mg cholesterol were only 60%, 86%
and 64% respectively (Janus, 1997). More than one-third of the females studied
• 20

had fat and cholesterol intakes higher than the recommended levels. Moreover, the
mean intakes of fat, saturated fat, cholesterol and percent energy from fat decreased
with increasing age in the women, showing that the need to promote healthy low-fat
eating among Hong Kong women should be started at an early ages.
1.12 Physical Activity Patterns of Hong Kong Middle-aged Women
A Women's Health Survey conducted in 1992 among 1,183 females aged 15-60
years revealed that only about 35% of the middle-aged (30-49 years) women had
physical activity at least once per week, and half of them had performed physical
activity only less than once in six months (The Family Planning Association of Hong
Kong, 1993). Within these age groups, half of them preferred moving or stretching
exercises, walking, morning walking or mountain hiking as their physical activities.
About one third of the middle-aged women who had performed physical activity at
least once in three months (38% in 30-39 years, 32% in 40-49 years) only performed
the activities for a duration of 15 minutes or less for each session.
With reference to the marital status of all respondents in that study, half of the
married women had performed physical activity less than once in six months, and
only 37% did it at least one per week. Among single women, only 23% had
performed physical activity less than once in six months, and 52% had performed
physical activity at least one per week. Married women preferred moving or
stretching exercises and walking, morning walking or mountain hiking while single
females preferred badminton, squash, tennis or swimming. However, 32% of the
married and 19% of the single females performed the activities for a duration of only
15 minutes or less for each physical activity session.
• 21

Similar findings have been revealed in other studies. Among those studied in the
Cardiovascular Risk Factor Prevalence Study, more than half of the middle-aged (30-
44 years) female respondents indicated they had had no exercise within the last
month (Janus, 1997).
In another study of 887 adults aged 18-60 years, among those respondents reporting
participating in any form of physical activity, females had a generally higher
frequency of participation than males (Table 1.4) (Fu et al., 1998). Older women
had a higher frequency of participation than the younger women, as is shown by the
figures that 43% females aged 31-40 years had physical activity with a frequency
less than once per week, with the proportion decreasing to 3% in women aged 51-60
years.
Table 1.4 Physical activity frequency of male and female participants by age group Age-gender group
18-30 years 31-40 years 41-50 years 51-60 years M F M F M F M F
Physical activity ~ % % % % % % % frequency
< 1 per month 27 35 21 22 10 10 10 0 2-3 per month 27 25 27 21 25 15 15 3 Once per week 27 15 28 31 25 22 27 10 2-3 per week 16 15 10 21 25 32 22 46 > 3 per week 4 10 13 6 15 32 27 42
Source: [Fu et al, 1998]
The above findings indicate that a certain proportion of Hong Kong middle-aged
women are extremely inactive, and the physical activity frequency among them is far
below the recommended level (30 minutes moderate-intensity activity on most,
preferably all, days of the week) even for those regularly participating in exercise.
• 22

1.13 Education and Health in Hong Kong Middle-aged Women
Almost one-third (31%) of Hong Kong females aged 30-34 years have attained an
education level only up to lower secondary education. This proportion rises to 49%
and 63% in age groups 35-39 years and 40-44 years respectively (Census & Statistics
Department, 1996).
As in other health surveys revealing associations between higher education and better
health, evidence if this relationship is also appearing among Hong Kong adults.
The data from the Cardiovascular Risk Factor Prevalence Study showed that a higher
educational level is associated with a healthier diet (P<0.01) and lower prevalence of
overweight (/^0.001) in Hong Kong women (Woo et al., 1999). An earlier smaller
telephone interview survey found that education level was positively associated with
nutrition knowledge (尸<0.001) (Ko et al., 1995).
In the Cardiovascular Risk Factor Prevalence Study, women but not men with higher
education levels also had a lower mean BMI and WHR, as shown in Table 1.5.
Women with higher education levels also had higher fruit consumption per week.
Single women had lower consumption of vegetables and fish per week, and had a
lower BMI. Therefore, about half of the Hong Kong middle-aged women, those
with lower educational levels, may have less nutrition knowledge and a higher BMI
and WHR, if these results can be generalized to the entire women's population.
• 23

Table 1.5 Education level of Hong Kong adults and their BMI & WHR Tertiary Secondary Primary Total
~ M F M F M F M F (n=79) (n=55) (n-311) (n=244) (n=110) (n二210) (n-500) (n=509)
BMI 24.3±2.8 22.0士2.9 24.3±3.3 23.1±3.4 24.4±3.7 25.6±4.1 24.3±3.324.0±3.9*** (kg/m2)
WHR 0,87±0.06 0.76±0.07 0.89土0.23 0.78±0.07 0.91±0.08 0.84±0.08 0.89±0.19 0.81i0.08***
***P<0.001 Source: [Woo etal, 1999]
1.14 Attitudes Toward and Beliefs About Diet and Health of Hong Kong
Middle-aged Women
The Women's Health Survey conducted in 1992 among 1,183 females aged 15-60
years found that 25% of women aged 30-39 years and 24% of those aged 40-49 years
said they paid no attention to diet (The Family Planning Association of Hong Kong,
1993). Additionally in that survey it was found that married females paid more
attention to diet than single females, with 75% of married women reporting that they
paid some or a lot of/much attention to diet, compared with only 65% of single
respondents. When asked 'Do you usually pay attention to your physical health?',
13% of women aged 30-39 years and 7% of those aged 40-49 years said they paid no
attention to physical health. Again, married females paid more attention to physical
health than single females. Thirty percent of the married females responded that
they paid much attention, compared with only 17% of the single women.
Proportions of females reporting paying attention to diet were much lower than those
reporting paying attention to physical health, suggesting that there is a general
interest in physical health among Hong Kong females. Additionally, in The Hong
Kong Adult Dietary Survey 1995, more than half (54%) of the females of ages 25-64
years reported they eat almost everything, showing that they paid little concern for a
healthy diet (Leung et al, 1997).
• 24

These findings showed that about one-third of the middle-aged females paid no
attention to diet. These women apparently have a very low awareness of the
benefits of adopting a healthy eating habit.
1.15 Common Weight Loss Methods Among Hong Kong Middle-aged Women
Nearly half of the women (46% in the age 30-39 years and 43% in the age 40-49
years) in the women's health survey reported using dieting as the way to achieve
ideal weight. Single women more commonly than married women were using
dieting (55% Vs 43%) and exercise (40% Vs 34%) as the ways to achieve ideal
weight (The Family Planning Association of Hong Kong, 1993).
The Hong Kong Adult Dietary Survey 1995 also revealed that 20% of females of
ages 25-64 years, had tried weight reduction diet occasionally in the past, showing
there is an interest in dieting among the females (Leung et al., 1997). However, as
already mentioned, dieting alone is not the best way to lose weight, because dieting
without supervision may be risky as it can cause nutrient deficiency, weakness and
eating disorders. Women, therefore, should acquire proper knowledge about
reasons, appropriate methods and consequences of weight loss.
1.16 Sources of Health Information Among Hong Kong Middle-aged Women
Table 1.6 shows that the three most popular sources of middle-aged women's health
information are TV/radio, newspapers/magazines and friends (The Family Planning
Association of Hong Kong, 1993). However, not all the messages delivered
through these channels are scientific and accurate, and some claims maybe
exaggerated or questionable. It is therefore necessary to have additional sources,
such as an organized program directed by health professionals to bring out
• 25

interesting, useful and correct and sound information and skills to women as well as
motivate them to apply the information and change their health behavior toward a
healthier direction.
Table 1.6 Percentages of women in specific age group who obtain health information
from the three most common sources Source Age group (years)
30-39 (%) 40-49 (%) TV/Radio 80 7 6 ~ Newspaper/Magazines 76 73 Friends 65 70
Source: [Report on Women's Health Survey, 1993]
1.17 Summary
The information about Hong Kong middle-aged women clearly demonstrates that a
certain proportion of them have a low awareness of diet and physical activity. This
may explain why some of them also have an unhealthy lifestyle. The middle-aged
Hong Kong women also were found to exhibit high prevalences of overweight and
obesity, and risky BMI and WHR levels. Therefore, the health picture emerging
from the above findings indicates that Hong Kong middle-aged women should be a
group targeted for nutrition and health promotion.
1.18 Study Purpose and Objectives
This paper describes a pilot study aimed at promoting a healthy lifestyle to middle-
aged women. Reasons for choosing the middle-aged women were that: they usually
purchase and prepare food for the family, they are not a highly educated group, and,
in spite of their low levels of health awareness, they are nevertheless probably very
concerned about the health of themselves and their families. The promotion of a
healthy lifestyle should not only benefit the women, but also their household
members. Hopefully, participating women can bring the healthy lifestyle messages
• 2 6

to their family members and act as a role model for their children.
This pilot study used a two-group pre-post approach with a six-month follow-up to
evaluate the longer-term effectiveness of the health promotion program. The goal
of this pilot program was to develop an effective program of primary prevention of
obesity for Hong Kong middle-aged women aged 30-50 years through healthy diet
and regular physical activity. Its objectives were to: (1) improve their awareness of
the benefits of healthy eating and physical activity behavior, (2) improve
participating women's intentions to change less healthy eating and physical activity
behavior, and (3) enable skills for participating women to eat healthier and become
more physically active. The study design and the conceptual framework are shown
in Figures 1.4 and 1.5, respectively.
Education Group
Month 1 Months 3-4 Month 5 Month 11
Baseline ^ Intervention ^ Posttest ^ 6-month
survey Follow-up
Control Group
Month 1 Month 5 Month 11
Baseline ^ Posttest ^ 6-month
survey Follow-up -
Figure 1.4 The study design of the pilot nutrition and health promotion program
• 27

Socio-demographic factors
Age, Education level, Marital status
Income level, Employment status
5
Attitudes, intentions,
knowledge, and skills
towards healthy lifestyle
• i
Low level of ~ , . , . . Unbalanced diet physical activity
T ± Overweight and Obesity
I t Undesirable health outcomes
Coronary heart disease, Stroke, Diabetes, Hypertension, Hypercholesterolemia, Some types of cancer (colon, breast etc), Dyslipidemia, Osteoporosis
Figure 1.5 The conceptual framework of the study
• 28

CHAPTER TWO: METHODOLOGY
2.1 Recruitment of Participants
Invitation letters were sent to ten women's centres in the New Territories and finally
two adjacent-district centres, 'Centre One,and 'Centre Two', agreed to participate in
the study, with Centre Two willing to be the control centre. Centre One has about
1,700 members from 30 to 50 years old and Centre Two has about 680 members
within this age range. Centre One women in this age group were invited to
participate in three health assessments and a health promotion program while Centre
Two women were invited to participate in three health assessments only. As an
incentive to attend all sessions, the women in the Education Group paid a small fee
for the classes, but were told they would receive their payment back if they attended
all six activity sessions. Informed consent (see Appendices A and B) was given to
all participants during their first visit, in which the study purpose and nature were
explained. Centre One and Centre Two recruited 81 and 103 women, respectively.
2.2 Focus Groups
A focus group is a qualitative research technique, in which a group of people,
recruited on the basis of similar demographics, and led by a group moderator, can
share their views, attitudes and feelings about a particular topic in a non-threatening
environment (Greenbaum, 2000). Simultaneous to the recruitment of the women in
the Education and Control Groups, four focus groups with New Territories women of
similar age and background to those who would participate in our program were
conducted prior to conducting the Pretest survey, in order to obtain information
useful to the design and conduct of the rest of the program.
• 2 9

The objectives of the focus groups were:
1) To elicit women's ideas on 'health', 'healthy lifestyle', 'healthy eating' and
'physical activity'.
2) To elicit the factors motivating them to adopt a healthy lifestyle.
3) To elicit their knowledge and attitudes towards a healthy lifestyle.
4) To elicit their ideas on the type and content of activities they would prefer in a
health promotion program.
2.3 Survey Instrument
A self-administered questionnaire and a three-day dietary record were designed to
obtain information about the women's lives and lifestyles as well as to evaluate the
effectiveness of the health promotion program. The questionnaire and the dietary
record were pre-tested among 40 middle-aged women from outside the program
districts in three separate pretests before they were finalized. During the Pretest, the
Posttest and the Follow-up, each participant completed the questionnaire, the three-
day dietary record and the measurements of height, weight, percent body fat and
fingertip fasting blood total cholesterol level.
2.3.1 Questionnaire
The questionnaire (see Appendices C and D) consisted of seven parts. These
included dietary habits; physical activity habits; intentions, attitudes and confidence
in changing behaviors; nutrition knowledge; physical activity knowledge; a food
frequency questionnaire and demographic characteristics.
The first part queried the dietary habits by asking the general dietary practices of the
women. Some of the questions were adopted and modified from The Hong Kong
• 30

Adult Dietary Survey in 1995 (Leung et al., 1997), the others were specially
designed for this study. It had 13 questions asking about the mean days per week of
having breakfast, lunch and dinner; the number of snacks eaten per day; the taking of
nutrient supplements; fat removal behavior when eating meat and poultry; household
responsibilities for cooking and buying food; oil(s) used for cooking and eating;
common cooking methods for fish, pork/beef, chicken/duck and vegetables; food
label reading habits and perceived clarity of food labels.
To estimate the women's mean daily energy expenditure and to understand their
awareness and behaviors regarding physical activity, the second part queried physical
activity habits and contained a list of common physical activities in four categories:
work, caregiving, recreation and exercise. These activities were modified from a
previous study assessing the physical activity level among US older adults (Dipietro
et al, 1993). The activities are listed in Table 2.1. The women were asked to state
the duration in minutes of each physical activity session and the number of session(s)
per week they spent doing each physical activity in a typical week (defined as ‘a
week when you had no illness, and your working level was normal for you').
Table 2.1 The list of physical activities under different categories Category Examples
Work Buying food, shopping, stair-climbing, walking while carrying a load, laundry, light and heavy housework, food preparation, food service, dishwashing, light and heavy home repairs and computer work
Caregiving Lifting/pushing wheelchair or stroller and running with children when playing
Recreation Leisurely/morning walking, needlework, dancing, bowling, playing golf, playing mahjong, watching TV, reading newspaper/magazine/book and eating
Exercise Brisk/hill walking, pool exercise, stretching, yoga, taichi and Iiu tong quen, doing aerobics, cycling, rope skipping, swimming, running, playing badminton or table tennis and playing tennis, volleyball or basketball.
• 31

Additionally, a summary index was calculated from five additional separate
questions concerning the time the women spent on five types of physical activities
(vigorous, walking, moving, standing and sitting) to indicate the general physical
activity level of the women. Vigorous activity was defined as activity lasting at
least ten minutes and causing a large increase in heart rate. Walking was defined as
walking at least ten minutes or more without stopping which was not strenuous
enough to cause a large increase in heart rate. Moving was defined as moving
around on foot while doing things (Dipietro et al., 1993).
The women were also asked to state the number of flights of steps (about 10 steps)
they climb each day. Additionally, they were asked to compare their physical
activity level in the study season with the other three seasons. For example, the
Pretest survey was carried out in the spring, so the women needed to compare their
physical activity level in spring with that of summer, fall and winter. A Likert scale
('Much less', 'Little less', 'Same', 'Little more' and 'Much more') was used to
indicate the difference in activity level.
Part Three asked their intentions, attitudes and confidence toward changing
behaviors. Stages of change questions were adopted from a US study assessing
stages of dietary fat reduction among 1,241 adults aged 18 years or more (Curry et
al., 1992). These questions were modified for the four behaviors targeted in the
present study: reducing intake of saturated fat, increasing intake of fresh fruits,
increasing intake of vegetables and doing more physical activity. For decreasing
saturated fat intake, the women were firstly asked whether they had heard of
saturated fat. If they had not, they did not need to answer the stages of change
question regarding decreasing saturated fat intake. Two additional questions were
• 32

added for each of the four behaviors in order to find out the women's difficulties
when trying to change their behavior and the most appropriate methods they could
suggest to facilitate their behavioral change.
Part Four queried their nutrition knowledge. Ten true-false nutrition knowledge
questions about saturated fat, fibre, cholesterol, protein, frozen food, diabetes, blood
vessel hardening and colon cancer. These questions were adopted from two studies
assessing nutrition knowledge among adults (Parmenter & Wardle, 1999) (Sapp &
Jensen, 1997). Women were required to state 'True', 'False' and 'Don't know' for
each question. Additionally, the women were asked whether they had heard of the
food pyramid. If they had, they needed to place each of the four food groups
(vegetables and fruits; oils, fats, salt and sugar; cereals; meats and dairy products) in
the appropriate food pyramid layer in order to assess their understanding of the food
pyramid. All of the above nutrition knowledge was to be covered in the health
promotion program.
Part Five queried their physical activity knowledge. Nine true-false physical
activity knowledge questions about fitness in general, physical activity
recommendations, aerobic physical activity, the relationships between physical
activity and disease prevention, and cardiovascular fitness were asked. These
questions were designed specially for this study. The women were required to state
'True', 'False' and 'Don't know' for each question. As with the nutrition
knowledge, the women were asked whether they had heard of the physical activity
pyramid. If they had, they needed to place each of the four physical activity groups
(exercise for flexibility and muscular strength, aerobic and active sports, lifestyle
physical activities and rest/inactivity) in the appropriate physical activity pyramid
• 33

layer in order to assess their understanding of the physical activity pyramid. All of
the above physical activity knowledge was to be covered in the health promotion
program.
Part Six was the food frequency questionnaire, which focused on weekly and daily
food consumption patterns. Sixty common food items were listed to elicit the
women's general food consumption pattern. The food items were adopted mainly
from The Hong Kong Adult Dietary Survey in 1995 (Leung et al., 1997). The
food items included foods from different food groups, such as dairy products (cheese,
yogurt, low fat yogurt, whole milk and skim milk etc), grains/cereals (white bread,
whole wheat bread, sushi, fried rice, plain rice and red/brown rice etc), fibre (fruit
and vegetable), meats (fried egg, boiled egg, fried fish and steam fish etc) and snacks
(hamburger, filet-O-fish,egg tart, french fries, fried dim sum, steam dim sum). The
women were asked to state their weekly and daily consumption frequency
('never/not consumed', 'once per week', 'twice per week', 'three to four times per
week', 'five to six times per week', 'once a day' or 'two to three times per day') in a
typical week for each food item. If the women consumed a particular food on a less
than weekly basis, the frequency was classified to be 'not consumed'. This
frequency classification was modified from a previous Hong Kong research study
(Cheung, 1998).
Part Seven consisted of seven questions asking the women's demographic
characteristics such as age, education level,marital status, employment status,
number of household members, total monthly household income and personal
monthly income. Four additional questions queried health-related concerns. They
were asked to state if they had diabetes, hypertension, high blood triglycerides, high
• 34

blood cholesterol, bone/joint pain and anemia. The women were also asked to rate
their health when compared with women of similar age, as indicated by Likert scale
response options ('Far worse', 'Worse', 'About the same', 'Better' and 'Far better').
Moreover, two questions were designed to understand their interest in health by
inquiring about topics about which they would like to learn more and the areas of
their health they would like to improve.
2.3.2 Three-day Dietary Record
A set of photos (see Appendices E and F) and a sample dietary record (see
Appendices G and H) were used to teach participants how accurately to estimate
their portion sizes and correctly fill in the dietary record at the first assessment. The
women were requested to record all foods and beverages they consumed on two
weekdays and one weekend day (see Appendices I and J).
2.3.3 Anthropometric and Cholesterol Measurements
Height was measured using a measuring tape fixed vertically on a wall. The
women wore light clothing without shoes and hats, standing straight and with heels
and feet together, and heels, buttocks, shoulder blades and the back of the head in
contact with the wall. Their eye level was kept horizontal, and their arms hung
loosely at their sides, with their palms facing the thighs, and their shoulders relaxed.
A measuring aid was put on the crown of the head of the women, and then their
height was measured by the investigator to the nearest 0.1 cm.
Weight and percent body fat were measured by a TANITA4j Body Composition
Analyzer (TBF-300GS, serial no: 00040005, Tokyo, Japan). The women wore
light clothing, were barefoot and stood erect so that their body weight was evenly
• 35
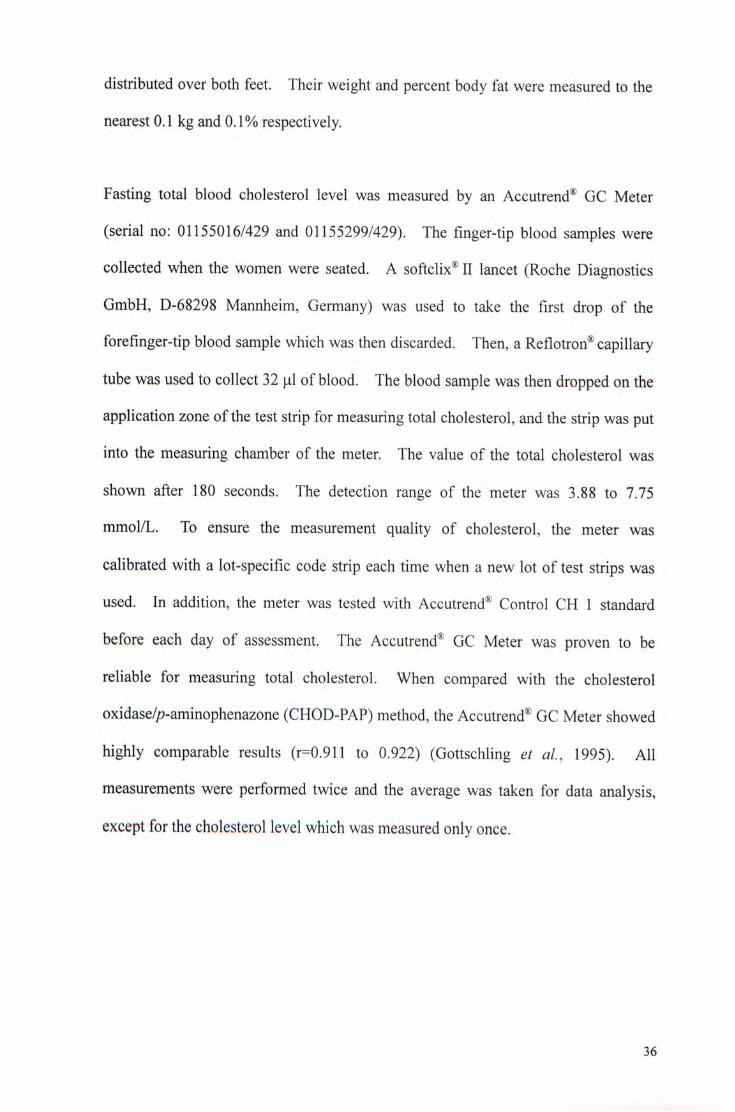
distributed over both feet. Their weight and percent body fat were measured to the
nearest 0.1 kg and 0.1% respectively.
Fasting total blood cholesterol level was measured by an Accutrend® GC Meter
(serial no: 01155016/429 and 01155299/429). The finger-tip blood samples were
collected when the women were seated. A softclix® II lancet (Roche Diagnostics
GmbH, D-68298 Mannheim, Germany) was used to take the first drop of the
forefinger-tip blood sample which was then discarded. Then, a Reflotron® capillary
tube was used to collect 32 jul of blood. The blood sample was then dropped on the
application zone of the test strip for measuring total cholesterol, and the strip was put
into the measuring chamber of the meter. The value of the total cholesterol was
shown after 180 seconds. The detection range of the meter was 3.88 to 7.75
mmol/L. To ensure the measurement quality of cholesterol, the meter was
calibrated with a lot-specific code strip each time when a new lot of test strips was
used. In addition, the meter was tested with Accutrend® Control CH 1 standard
before each day of assessment. The Accutrend® GC Meter was proven to be
reliable for measuring total cholesterol. When compared with the cholesterol
oxidase/p-aminophenazone (CHOD-PAP) method, the Accutrend® GC Meter showed
highly comparable results (r二0.911 to 0.922) (Gottschling et al., 1995). All
measurements were performed twice and the average was taken for data analysis,
except for the cholesterol level which was measured only once.
• 36

2.4 Intervention
Based primarily on the focus group results, five tailored weekly 1.5- to 2-hour
education classes and a healthy cooking demonstration were designed and held on
consecutive Saturday afternoons in a secondary school hall. In addition, a physical
activity demonstration and voluntary practice together with five minutes of
supervised fast walking within the hall were included as a break midway throughout
each of the five classes. Information taught from the talks, the cooking and
physical activity demonstrations were included in pamphlets (see Appendices K
through N), which were given to the women. An additional voluntary mid-week
fast walking/jogging activity was organized once per week in a nearby sports ground.
Table 2.2 lists the topics and objectives for each intervention activity.
Table 2.2 Topics and objectives for each class/activity
Talk 1: Diet, Physical Activity, Healthy Weight and Health.
After the class, participants should be able to
1. Correctly fill in the food groups according to the food pyramid
2. Correctly identify the importance of healthy diet and regular physical activity on
health, as measured by the true-false nutrition and physical activity knowledge
questions.
3. Define healthy weight by using BMI.
4. Give reasons why many women are on diets but not losing weight.
5. Apply healthy eating and regular physical activity in maintaining healthy weight.
6. Know the conditions that need to take nutrient supplements.
7. Increase their intention, as mentioned by stages of change statements, to change
unhealthy behaviors, such as consumption of a diet high in saturated fat but low in
fruits and vegetables and low participation in physical activity. The intention is
measured by stages of change statements.
8. Move forward, according to stages of change statements, in changing some of the
above unhealthy behaviors.
• 37

Talk 2: Food Choice, Cooking and Eating Out.
After the class, participants should be able to
1. Describe how the cooking method affects the fat content of food.
2. Identify common healthy food choices when buying food and eating out.
3. State the ways to eat less fat and cholesterol when eating out.
4. State some ways to eat more fibre when eating out.
5. State some ways to eat more calcium when eating out.
6. Identify components of a nutrition label, especially fat, saturated fat, cholesterol
and fibre contents.
7. Establish ways to overcome the barriers to healthier eating, as measured by their
responses to questions about whether they have such barriers and their own ways
to overcome them.
Talk 3: Genetically-modified Food, Food Safety and Food Hygiene.
After the class, participants should be able to
1. Define genetically-modified food.
2. Describe the effects of genetically-modified food on health.
3. Identify some common local genetically-modified food.
Healthy Cooking Demonstration
After the demonstration, participants should be able to practice low-fat cooking
methods, as measured by their reported common cooking methods for common food
items.
Talk 4: Physical Activity and Your Health
After the class, participants should be able to
1. Correctly fill in the types of physical activities according to its position in the
physical activity pyramid.
2. Describe the recommendations of physical activity for adults.
3. Explain the benefits of physical activity.
4. Establish ways to overcome barriers to having more physical activity, as measured
by their responses to questions about whether they have such barriers to doing more
physical activity and their own suggestions as to how to overcome them.
5. Be able to draw up a physical activity plan/schedule that they can follow for the
coming month.
6. Describe some myths or beliefs about different weight loss methods.
• 38

Physical Activity Demonstration
After the demonstration, participants should be able to
1. Practice some simple physical activities for flexibility, cardiovascular endurance
and muscle strength and endurance.
2. Build confidence in doing physical activity. The confidence is measured by stages
of change statements.
Talk 5: Healthy Lifestyle and Disease Prevention
After the class, participants should be able to
1. Identify the trends in the occurrence of obesity, diabetes, coronary heart disease,
hypertension, stroke, osteoporosis and some cancers in Hong Kong.
2. State some risk factors for each of these diseases.
3. Explain the importance of healthy lifestyle for the prevention of these conditions,
as measured by the true-false nutrition and physical activity knowledge questions.
4. Adopt healthier eating and regular physical activity behaviors, as measured by
stages of change statements.
2.5 Evaluation
Evaluation provided feedback to monitor and modify the program. In this pilot
study, two types of evaluation were used, process and outcome evaluations.
2.5.1 Process Evaluation
After each activity, a short evaluation questionnaire (samples in Appendices O and P)
was delivered to the participants to gather their comments on the corresponding
activity. Their responses acted as the direct feedback to the program, which was
continuously modified based on their comments.
At the end of the program, an additional evaluation questionnaire (Appendices Q and
R) was used in the Education Group to gather the women's ideas about the overall
program.
39

2.5.2 Outcome Evaluation
All the women in both the Education and Control Groups were re-assessed
immediately after the intervention and six months later. Except for some evaluation
questions for the Education Group only, all assessments were identical in the Pretest
and the two assessments. The results of these two assessments were then compared
with the Pretest results to determine any improvements in knowledge, attitudes,
health behavior and anthropometric and physiological measurements for the
Education Group, in order to determine the extent of success of the program.
2.6 Data Management
After each round of data collection, the questionnaires and the dietary records were
checked for clarity, and if necessary follow-up telephone calls were carried out for
clarification. The questionnaires and the dietary records were then coded and
entered into the computer with Statistical Package for Social Sciences Data Entry
Builder (SPSS Data Entry Builder Release 1.0.4, SPSS Inc., Chicago, the United
States) with double punching for verification. Finally the overall data set was
analyzed using the Statistical Package for Social Sciences (SPSS for windows,
version 9.0; SPSS Inc., Chicago).
2.7 Statistics
Comparisons of the variables between the Education and Control Groups in the
Pretest were conducted by using independent sample Mests and Chi-square tests.
Comparisons of variables between the Pre- and Posttests and the Follow-up within
the groups were conducted by using paired sample /-tests and Chi-square tests.
Significance levels of 95%, 99% and 99.9% were used in this study, with significant
changes then indicated by the 尸-values less than 0.05, 0.01 or 0.001.
4 0

2.8 Data Analysis
2.8.1 Physical Activity Patterns
Mean daily energy expenditure was calculated from each respondent's list of her
physical activities and the reported duration. The energy expenditure for each type
of activity was calculated by multiplying the duration in min/week and the intensity
code (kcal/min). This method was adopted from the previously mentioned study
assessing the physical activity level among adults (Dipietro et al., 1993). Then, the
energy expenditures for all activities were summed, and finally divided by seven
resulting in the mean daily energy expenditure. The energy expenditure level was
derived from the common physical activities of the women, thus estimating the
amount of energy the women expended in their daily lives. Table 2.3 lists the
intensity code assigned to each kind of activity.
41

Table 2.3 The intensity codes for the physical activities Type of activities Intensity code
(kcal/min) Work
Buying food 3.5 Shopping 3.5 Stair-climbing while carrying a load 8.5 Walking flat while carrying a load 3.5 Laundry (time loading, unloading, folding only) 3.0 Light housework: tidying, dusting, sweeping, collecting trash in home, 3.0
polishing, indoors gardening, ironing. Heavy housework: vacuuming, mopping, scrubbing floors and walls, 4.5
moving furniture, boxes or garbage cans. Food preparation: chopping, stirring, moving about to get food items, 2.5
pans. Food service : setting tables, carrying food, serving food. 2.5 Dishwashing : clearing table, washing/drying dishes, putting dishes 2.5
away. Light home repair: small appliance repair, light home maintenance/ 3.0
repair. Heavy home repair: painting, carpentry, washing/polishing car 5.5 Computer work, clerical work, typing. 1.5
Care giving Lifting, pushing wheelchair 5.5 Lifting, carrying, pushing stroller 4.0 Chasing children during playing 4.0
Recreational activities Leisurely walking, morning walk 3.5 Needlework: knitting, sewing, needlepoint, craft work 1.5 Dancing (moderate/fast) 5.5 Bowling 3.0 Golf 3.0 Playing Mahjong 2.0 Watching TV 1.3 Reading newspaper, magazine, book 1.2 Eating (total time for the 3 regular meals) 1.5
Exercise Brisk walking or hill walking 6.0 Pool exercises, stretching, yoga, taichi, Liu Tong Quan 3.0 Vigorous calisthenics, aerobics 6.0 Cycling, exercycle 6.0 Rope Skipping 10.0 Swimming 6.0 Running 8.0 Badminton, Table Tennis 7.0 Tennis, Volleyball, Basketball 7.0 Source: [Dipietro et al, 1993]
42

A summary index was calculated from the five types of physical activity, to indicate
the general physical activity level of the women. Each individual index score was
calculated by multiplying frequency score by duration score by a factor. Table 2.4
lists the frequency score, the duration score and the factor for each index score.
Table 2.4 The frequency score, the duration score and the factor for each index score Index Frequency score Duration score Factor
Vigorous activity O = no activity 1 = 10-30 mins 5 1 = 1-3 times per month 2 = 31 -60 mins 2 = 1 - 2 times per week 3 = >60 mins 3 = 3-4 times per week 4 = >5 times per week
Walking 0 = no activity 1 = 10-30 mins 4 1 = 1-3 times per month 2 = 31 -60 mins 2 = 1 - 2 times per week 3 = >60 mins 3 = 3-4 times per week 4 = >5 times per week
Daily Moving N/A 0 = not moving at all 3 1 = <1 hour per day 2 = 1 to less than 3 hours per day 3 = 3 to less than 5 hours per day 4 = 5 to less than 7 hours per day 5 = >7 hours per day
Daily Standing N/A 0 = not standing at all 2 1 = <1 hour per day 2 = 1 to less than 3 hours per day 3 = 3 to less than 5 hours per day 4 = 5 to less than 7 hours per day 5 = >7 hours per day
Daily Sitting N/A 0 = not sitting at all 1 1 二 <3 hours per day 2 = 3 to less than 6 hours per day 3 = 6 to less than 8 hours per day 4 = >8 hours per day
Source: [Dipietro et al, 1993]
43

2.8.2 Dietary Patterns
The nutrient composition of the three-day dietary record was analyzed by the
Nutritionist IV Diet Analysis software program (First Data Bank, San Bruno, Ca.)
with some local foods added to it. In addition, fifteen local foods were added to the
database especially for this study. Kilocalories, carbohydrate, protein, fat, SFA,
MUFA, PUFA, cholesterol, dietary fibre, calcium, iron and vitamins A, C and E were
estimated for each of the three days. The mean values were then taken for analysis.
The percent energy from carbohydrates, protein, fat, SFA, MUFA and PUFA were
calculated as follows:
Percent energy from carbohydrate = carbohydrate (g) *4 kcal / energy (kcal)* 100%
Percent energy from protein = protein (g) *4 kcal / energy (kcal)* 100%
Percent energy from fat = fat (g) *9 kcal / energy (kcal)* 100%
Percent energy from SFA = SFA (g) *9 kcal / energy (kcal)* 100%
Percent energy from MUFA = MUFA (g) *9 kcal / energy (kcal)* 100%
Percent energy from PUFA = PUFA (g) *9 kcal / energy (kcal)* 100%
4 4

The amount of oil used for cooking/consuming was estimated by a reference method
from The Hong Kong Adult Dietary Survey 1995 (Leung et al., 1997), as is shown in
Table 2.5.
Table 2.5 Estimation of oil for cooking/consuming
Foods Oil estimated (Tablespoon) Butter spread for 50 g bread 0.5 200 g fried noodle 0.5 100 g boiled vegetable with oil added 0.2 100 g stir fried vegetable 0.5 100 g steam fish, no sauce 0.3 100 g steam fish, with sauce 0.5 100 g fried fish 0.8 50 g fried meat 0.5 50 g deep fried meat 1.5 240 ml soup 0.3
Source: [Leung et al, 1993]
2.8.3 Nutrition Knowledge Score
An additive Nutrition Knowledge Score was calculated to indicate the nutrition
knowledge level, from the questions concerning heard of saturated fat and the food
pyramid, together with the ten additional true-false questions, and the knowledge of
the food groups and food group layers. The marking scheme is shown in Table 2.6.
The maximum achievable score was 16.
Table 2.6 The marking scheme for calculating the Nutrition Knowledge Score Nutrition knowledge questions Marks assigned Heard of saturated fat? One mark for ‘ Yes’, zero mark for 'No' . Heard of food pyramid? One mark for ‘Yes,,zero mark for 'No' . Matching each food pyramid One mark for each correct response for the four
layer with its food group corresponding levels of the food pyramid. Ten additional nutrition One mark for each correct response, zero for incorrect or
knowledge questions ‘Don,t know' response.
4 5

2.8.4 Physical Activity Knowledge Score
An additive Physical Activity Knowledge Score was calculated to indicate the
physical activity knowledge level from the questions concerning heard of the
physical activity pyramid, together with the nine additional true-false questions, and
the knowledge of the physical activity groups and physical activity pyramid layers.
The marking scheme is shown in Table 2.7. The maximum achievable score was
14.
Table 2.7 The marking for calculating the Physical Activity Knowledge Score Physical activity knowledge questions Marks assigned Heard of physical activity pyramid? One mark for 'Yes', zero mark for ‘No’. Matching physical activity pyramid One mark for each correct response for the
layer with its physical activity group four corresponding levels of the physical activity pyramid.
Nine additional physical activity One mark for each correct response, zero knowledge questions for incorrect or ^Don't know, response.
2.8.5 Blood Total Cholesterol
According to the guidelines issued by the National Cholesterol Education Program in
2001 (National Cholesterol Education Program, 2001), blood total cholesterol was
classified as 'desirable' if under 5.20 mmol/L. Levels between 5.20 and 6.19
mmol/L were 'borderline-high', and a level of 6.20 mmol/L or greater is "high"
blood cholesterol. This classification was identical to that adopted by The Hong
Kong Cardiovascular Risk Factor Prevalence Study 1995-1996 (Janus, 1997), and
also was adapted for use in the present study.
4 6

2.8.6 Body Mass Index
The BMI was calculated as weight in kilograms divided by the square root of height
in meters. According to the Asia-Pacific Steering Committee on Obesity (Asia-
Pacific steering committee, 2000), the newly proposed BMI classification for adult
Asians shown in Table 2.8 was used to classify overweight and obesity among the
subjects.
Table 2.8 Proposed classification of BMI in adult Asians
Classification BMI (kg/m2) Underweight <18.5 Normal 18.5-22.9 Overweight 23.0-24.9 Obese >25.0
Source: [Asia-Pacific Steering Committee on Obesity, 2000]
2.8.7 Percent Body Fat
As indicated by the TANITA® manufacturer, the desirable range of percent body fat
for Asian females aged over 30 years is 20-27%.
2.9 Ethics
This study received ethical approval from The Clinical Research Ethics Committee
of The Chinese University of Hong Kong.
4 7

CHAPTER THREE: RESULTS
3.1 Focus Group Results
3.1.1 General Description of Participants
Four focus groups among a total of 42 women were conducted in February 2000,
each taking about 1 to 1.5 hours. The number of women in each group ranged from
six to sixteen, as is shown in Table 3.1.
T^blg 3.1 Date, duration and number of women participating in each focus group Group Date Number of women Duration (hours)
1 23-2-2000 12 1.5 2 23-2-2000 16 1.5 3 23-2-2000 6 1.0 4 24-2-2000 8 1,25
A brief self-administered short questionnaire (see Appendices S and T) was used to
elicit their demographic characteristics, and the data are presented in Table 3.2.
About 93% of them were 30-49 years old, and all were married. About 83% of
them were housewives. Three-quarters of them had attained primary or lower
secondary (Form one to three) education, and three-quarters of them had three to five
household members. Half of them had monthly household income below $15,000
while another half were above that level.
48

Table 3.2 Focus group participants' demographic characteristics (n=42)
Demographic variables Number of women (%) Age group
25-29 1 (2) 30-34 3 (7) 35-39 7 (17) 40-44 17(40) 45-49 12(29) 5 0 ^ 4 2_(5)
Marital status Married 42 (100)
Working status Full time 2 (5) Part time 4 (10) Housewife 35 (83) No work 1 (2)
Education level No formal schooling 2 (5) Primary 15(36) Lower secondary (Form 1-3) 17 (40) Upper secondary (Form 4-7) 7 (17) Post secondary 1 (2)
Household member 2 1(2) 3 6(14) 4 18(43) 5 8(19) 6 3(7)
Missing 6 (14) Household income
$5,001-$10,000 5 (12) $ 1 0 , 0 0 1 - $ 1 5 , 0 0 0 1 5 ( 3 6 )
$15,001420,000 8 (19) $20,001425,000 7 (17) $ 2 5 , 0 0 1 - $ 3 0 , 0 0 0 1 ( 2 )
>$30,000 4 (10) Missing 2 (5)
The overall atmosphere of the focus groups was lively and open. Most of the
women were willing to express their views and opinions and enjoyed discussing with
others. They seemed interested in health issues and would like to know more about
healthy eating and physical activity because they all hoped to become healthier.
The focus groups mainly discussed several aspects: Their views on 'health', 'healthy
4 9

lifestyle', 'healthy eating' and 'physical activity'; factors motivating healthy lifestyle;
sources of health information and ideas for a health promotion program.
3.1.2 Perceived Values and Views on 'Health'
During each session, 24 questions (see Appendix U and V) were raised to initiate the
discussion about health issues. The first one was 'What comes to your mind when
you think of health?'. All groups replied that they would think about balanced diet
(飮食均衡 ‘yam sik gwan hang') and physical activity (做運動 ‘cho wan dung').
Physical health (身體健康 ' s an tai gin hong'), adequate rest (有足夠休息 ' y au
chuk gau yau sik') and having an open mind/always be happy (快樂 ' f a a i Iok' or
開朗 ‘hoi long') were mentioned by women in three groups. Most of the
participants agreed that these six items were the most common things related to
health. Other items such as family health (家庭要健康 ‘ka ting yiu gin hong'),
beauty (親 ‘leng,),keep fit and free of illnesses (無病無痛 ‘ m o ban mo tung') were
given by some participants.
When asked which of the above was the most important, a variety of responses was
observed. Some of the women said physical activity and diet were equally
important (運動同飮食同樣係 重要 ‘wan dung tong yam sik tong yeung hai jui
chung yiu'). The rest felt that physical activity, diet or healthy mind individually
was the most important to their health ( 重要思想健康,開心 ‘jui chung yiu si
seung gin hong, hoi sum,,做多啲運動至重要 ‘cho doh d wan dung chi gan yiu' or
重要飮食,可以 fit 啲 ‘jui chung yiu yam sik, hak yee fit d').
Most of the women said their own health was just average or had no health problems,
however, they stated that they did not always pay attention to physical activity, diet
50

or both (我誌ok啦,有時唔係好注意飮食同少做運動 ‘ngo Ium ok la, yau si ng
hai ho chu yee yam sik tong siu cho wan dung'). Women in all groups said that in
order to improve their health, they should do more physical activity or start doing it
and pay more attention to their diet, and always keep these thoughts in their mind (要
成日誌住做多d運動先得,同埋要睇吓食咗啲乜‘yiu shing yat Ium chu cho doh d
wan dung sin tak, tong mai yiu tai ha sik joh d mut'). Some said if they could have
enough rest or keep relaxed, this could also improve their health.
3.1.3 Perceived Values and Views on 'Healthy Lifestyle,
Most women had similar views on 'Healthy lifestyle' and 'Health'. They regarded
'Healthy Lifestyle' as having more physical activity (做運動 ‘doh wan dung'),
balanced diet (飮食要健康 ‘yam sik yiu gwan hang'), and regular mealtime (定時
飮食 ‘ting shi yam sik'). Some mentioned adequate rest (睡眠要充足 ‘sui min
yiu chung chuk'), healthy thoughts (有健康思想 ‘yau gin hong si seung' and family
health (家庭都要健康 ‘ka ting dou yiu gin hong'). About half of the women
thought they had a healthy lifestyle as they had already achieved most of the above
criteria such as regular physical activity and balanced diet (我有做運動嫁,都算健康
掛 ‘ngo yau cho wan dung ka, duo suen gin hong gaar' or 我都有注意飮食嗦 ' n g o
do yau chu yee yam sik ka'). The other half felt that they did not have a healthy
lifestyle, as some barriers such as lack of health knowledge and constraints from
their families and friends prevented them from achieving a healthy lifestyle. For
example, there were limited healthy food choices when eating out (出街食野唔健康
‘chut gaai sik ye ng gin hong’ or 出街好難有健康選擇 ‘chut gaai ho naan yau gin
hong suen jaak'). If their friends chose some unhealthy/fatty food, the women said
it was difficult to refuse eating these foods (同朋友出街食飯,人地叫咗啲唔健康或
者肥嘅餸,有時好難話唔食 'tong pang yau chut gaai sik faan, yan dei giujoh d ng
51

gin hong waak je fei ge song, yau si ho naan wa ng sik').
3.1.4 Perceived Values and Views on 'Healthy Eating'
Most of the women agreed that healthy eating means using less oil during cooking
(用少P的油嚟煮餸 'yung siu d yau lei chu song'), eating more vegetables and fruit
but less meat (食多啲菜,少啲肉 ' s ik doh d choi, siu d yuk' or 食多啲水果 ‘sik
doh d shu gwoh'). Some said healthy eating implied eating everything in a
balanced way (食得均衡啲 ‘sik tak gwan hang d' or 乜都食,自我控制 'mu t do
sik, chi ngo hung chai,). About half of them said they already have had a healthy
eating habit. But some said they did not know what is healthy eating. Some
mentioned they tried to eat healthily, such as using canola oil instead of peanut/corn
oil, steaming the food rather than frying/deep frying, using more lean meat, eating
more vegetables and fish, using less sugar/salt/oil when cooking or seasoning.
For those who regarded themselves as having healthy eating habits, nearly all of
them replied' they would like to become more healthy, not only themselves but also
their whole families (想健康啲 ‘ s eung gin hong d' o r全家人都可以健康啲
'chuen ka yan do hak yee gin hong d'). Most of them said they should be healthy
because they need to take care their family members (我要照顧家人‘我要身體健
康’唔可以病 ' n g o yiu jiu koo ka yan, ngo yiu san tai gin hong, ng hak yee ban,).
Some said healthy eating could prevent diseases such as diabetes, high blood
pressure and stroke (防止疾病,好似糖尿病,高血壓,中風啦‘fong chijat ban, ho
chi tong Iiu ban, go huet aat, chung fung la'). In addition, some said healthy eating
is a way to prevent weight gain because they were afraid of being fat, or they thought
they were a bit fat (我怕肥’所以要食得健康口的 kngo pa fei, sho yee yiu sik tak gin
hong d' or ‘我覺得自己有啲月巴,想減肥 ngo gaau tak chi gei yau d fei, seung gaam
52

fei').
3.1.5 Perceived Values and Views on 'Physical Activity'
About half of the women regarded themselves as having regular physical activity,
usually two to three times per week. However, most of their activities were less
vigorous although they performed about 20-60 minutes for each session. Different
kinds of activities, ranging from some less vigorous types such as tai-chi; yoga;
morning walk; Iiu tong quan and social dance to some more vigorous such as
badminton; swimming and aerobic dance were mentioned. Most of them performed
more than one kind of physical activity. When asked the reasons for doing physical
activity, most of the women replied that hoped to become healthier and prevent
diseases, some would like to lose weight and keep fit (我想健康昍勺'ngo seung gin
hong d\ “想防止有病,就做運動 seung fong chi yau ban, jiu cho wan dung' or 我
想減月巴'ngo seung gaam fei'). Some said that physical activity enabled them to
move their joints and muscles, which was healthier than being inactive (有P動吓筋骨
同關節,總好過口吾有'yuk tong ha gan gwat tong gei yuk, chung ho gwoh ng yuk').
3.1.6 The Factors Motivating the Women to Adopt a Healthy Lifestyle
For women who already had healthy eating habits, they said these were not difficult
to achieve because they were responsible for choosing the cooking method and
deciding what food to be purchased (唔難做到,因爲我負責煮飯同買餸‘ng naan
cho do, yan wei ngo foo jaak chu faan tong mai song’). Some said they prevented
their children from eating unhealthy food by limiting the frequency of eating out (我
好少俾細路出街食野,啲野食唔健康‘ngo ho siu bei sai Io chut gaai sik ye, d ye
sik ng gin hong'). Overall, they agreed that family support and family acceptance
were very important in adopting healthy eating (我家人好支持我’呢樣係好緊要
53

'ngo ka yan ho chi chi ngo, lei yeung hai ho gan yiu' or 全家合作,可以一齊健康
'cheun ka hap jok, hak yee yat chai gin hong').
However, some women expressed that it was difficult to achieve healthy eating,
because it was easier said than done, especially when eating out, in which it was
difficult to control the healthiness of the food eaten (講就易’要做就難 ‘kong jau
yee, yiu chojau naan’ or出街食野好難控制’啲野唔係我煮 ‘chut gaai sik ye ho
naan hung chai, d ye ng hai ngo chu’). Some also said that they had to fry or deep
fry the food in order to fulfill their children's taste preferences (我有時要煎吓,炸吓
啲食物,如果唔係啲細路唔食飯‘ngo yau si yiu chin ha, cha ha d sik mat, yue
gwoh ngo hai d sai Io ngo sik faair), Furthermore, some said they lacked adequate
knowledge about nutrition and healthy eating, so it was difficult for them to achieve
healthy eating.
With regard to physical activity, the active women said it was already a habit to do
physical activity (我依家有習慣做運動 ' ngo yi ging yau chap gwaan cho wan
dung’). Most of them agreed that they had more free time as their children had
grown up, so they could have time to participate in various physical activities (口的糸田
路大咗,我有多啲時間 ‘d sai Io dajoh, ngo yau doh d si gaan’).
Nevertheless, all inactive women said' they were lazy about doing physical activity
(我好懶,無恆心做 kngo hao laan, mo hang sam cho), but some said they had no
time because they needed to work or spent most of their time on housuework and
taking care of their young children (我要返工’無時間 ‘ngo yiu faan gong, mo si
gaan' o r要做家務同照顧細路’無時間 ‘ y i u cho ka mo tong jiu goo sai lo, mo si
gaan,). Lack of companions (都無人陪 ‘dou mo yan pui') and cold weather were
54

also mentioned by a few women.
3.1.7 Sources of Information About Healthy Eating and Physical Activity
Almost all women said that the mass media (including television, radio, newspapers
and magazines), chatting or discussion with peers were the most common sources of
health information. Some women pointed out that the women's centre, health talks,
books and doctors were other sources. Although they acquired the information
from various sources, more than half of the women doubted the reliability of this
information, with some said that information from doctors were more reliable than
others.
3.1.8 Suggestions for the Type and Content of Activities in a Health Promotion
Program
When the women were asked what health information they were interested in
learning, most of the women wanted to know something about women's diseases,
especially those common at their age (同我地年紀有關嘅病 ‘tong ngo tei nin ki yau
gwan gei ban'). Osteoporosis, cancer, blood vessel blockage and heart disease were
mentioned by them (想知骨質疏鬆’癌症’血管硬化’心臟病嘅野‘seung chi gwat
chat soh sung, ngaam ching, huet goon ngaang fa, sam chong ban gei ye'), and they
wanted to know the causes and the prevention of these conditions (預防呢啲病嘅方
法 cyue fong lei d ban gei fong faat'). More than half of the women wanted to
know basic knowledge about diet and nutrition, nutrient content of common food,
and suitable types of physical activity for their ages (食啲乜野健康啲 ‘sik d mer ye
gin hong d’,有啲乜運動啱我地做 ‘yau d mer wan dung arm ngo tei cho' or 食物
嘅營養成份 ‘sik mat ger ying yeung shing fair). Some would like to know about'
food preservatives and genetically modified food (食物嘅防腐劑對身體嘅影響 ‘sik
55

mat gei fong fu chai dui san tai ger ying heung,or邊啲係基因改造食物,食卩左會點
'bin d hai ger yan goi cho sik mat, sik joh kooi dim’).
With regard to the activities of the health promotion program, nearly all women
suggested talks, cooking and physical activity demonstrations and a body check for
blood cholesterol level, blood triglyceride level, blood pressure, blood glucose and
body fat.
Most of the women responded that they would join the health program if they had
time, and they suggested Saturday afternoon would be a suitable time. They
emphasized that if they knew more about healthy lifestyle, they could bring the
health information to their family members and become a role model for their
children as well.
3.2 Participation Rate in the Study
Table 3.3 shows the number of women who returned the questionnaire, the three-day
dietary record, and participated in body measurements in the Pretest, the Posttest and
the Follow-up.
Table 3.3 Number of women participating in each activity of Pretest, Posttest and
Follow-up Education Group Control Group
Pretest Posttest Follow-up Pretest Posttest Follow-up Questionnaire 81 63 51 103 65 50 Three-day dietary record 75 58 43 72 49 33 Body measurements 80 53 39 100 62 39
56

3.3 Pretest
3.3.1 General Participant Sociodemographic Description
Eighty-one women participated in the Pretest in the Education Group and 103
women in the Control Group. Their demographic characteristics are listed in Table
3.4, and no significant differences were found between the two groups. The mean
age of the Education Group and the Control Group was 42.7 years and 42.4 years,
respectively. About 60% in both groups had finished primary or lower secondary
education level, while 20% below that level. Over 90% of the women were married
and 70% of them were housewives. Although more than half of the women
reported having four household members, about 80% of them had at least that many.
About 50% of them had monthly household income $10,001-$20,000 with 20%
below that level and 30% above. Over 70% of the women had no personal income.
Compared with the Hong Kong middle-aged women's population (aged 30-49 years)
(Census & Statistics Department, 1996), more women in the present study had
primary or lower secondary education (81% Vs 46%), more of the women in this
group women were married (95% Vs 80%), and more were housewives (71 % Vs
37%). Similarly, 32% of the women in the Census but 57% in the present study
reported having four household members. In the Census, 35% of women compared
to 49% in the present study had monthly household income in the $10,001 to
$20,000 range. However, more women in the present study reported no personal
income (72% Vs 41%). Therefore, the demographic characteristics of the middle-
aged women in the present study were quite different from those in the whole Hong
Kong population. This group appeared to be less educated, with larger households,
with a higher proportion of housewives and with lower household income than the
Hong Kong middle-aged women's population at large.
57

Table 3.4 Demographic characteristics of women in the Education and Control Groups Demographic variables Education Group Control Group Significance
(n=81) (n=103) Mean 士 S.D.
Age (years) 42.7 ± 5.2 42.4 ±5.5 N/S Number (%)
Education level Never O (0) 2 (2) N/S Incomplete primary 16 (20) 20 (19) Complete primary 16 (20) 31 (30) Lowersecondary 32 (40) 34 (33) Upper secondary 15(18) 16(16) University 2_(2) 0_(0)
Marital status Single 3(4) 2(2) N/S Married 74 (91) 100 (97) Divorced 4 (5) 0 (0) Widowed 0_(0) l_(lj
Working status No work 6(7) 3(3) N/S Full time 8(10) 13 (13) Part time 10(13) 13 (13) Housewife 57 (70) 74 (71)
Household member 2 3(4) 1(1) N/S 3 14(17) 12(12) 4 40 (49) 64 (62) 5 17(21) 17(16)
^6 7_(9) 9_(9) Household income
<$5,000 4 (5) 4 (4) N/S $5,001-$10,000 13 (16) 17 (16) $10,001-$15,000 20 (25) 31 (30) $15,001-$20,000 17 (21) 23 (22) $20,001-$25,000 12 (15) 11 (11) $25,001-$30,000 9 (11) 8 (8) >$30,000 6 (7) 8 (8) Missing 0_(0) 1_(1)
Personal income None 60 (74) 73 (71) N/S $1-$ 1,000 1(1) 4 (4) $1,001-$2,000 2 (3) 6 (6) $2,001-$3,000 1 (1) 5 (5) $3,001-$4,000 5 (6) 1(1) $4,001-$5,000 1(1) 2 (2) $5,001-$10,000 7 (9) 7 (7) $10,001-$15,000 2 (3) 2 (2) >$15,000 2_(3) 3_(3)
58

3.3.2 Anthropometry
Eighty and 100 women completed body measurements in the Education and Control
Groups respectively. Their mean body weight, mean body height, mean BMI
(calculated by body weight in kilograms divided by square of body height in meters),
mean percent body fat and mean fasting blood cholesterol level (excluding those
with a ‘low’ (n=36) or�high , (n=l ) readings outside the range of the equipment) are
all shown in Table 3.5. There were no significant differences in the mean values of
any body measurements between the two groups. The mean BMI, the mean percent
body fat and the mean fasting blood cholesterol level was 23.5 kg/m2, 31.5% and 4.7
mmol/L respectively in the Education Group compared with 23.2 kg/m2, 30.8% and
4.5 mmol/L in the Control Group.
According to the Asian classification of BMI (overweight as BMI=23.0-24.9 kg/m2
and obesity as BMI >25.0 kg/m2), 28% and 12% of the Education and Control
Groups, respectively, were classified as overweight. The prevalences of obesity
were 26% and 32% in the Education and Control Groups respectively. More than
70% of the Education Group and about 60% of the Control Group had percent body
fat exceeding the desirable range (20-27%). Only 21% and 35% of the Education
Group and the Control Group had percent body fat within the desirable level.
Most of the women, 80% in the Education Group and 90% in the Control Group, had
normal (less than 5.2 mmol/L) fasting total blood cholesterol level. Only 16% and
9% of the Education Group and the Control Group women were within the
borderline range (5.20-6.19 mmol/L), and very few of them were classified as high
(> 6.2 mmol/L).
59

Table 3.5 Physical measurement data, distributions of BMI levels according to Asian
definition, percent body fat levels and fasting total blood cholesterol levels of women
in the Education and Control Groups Mean 士 S.D.
Measurement n Education n Control Significance Group Group
Weight (kg) 80 57.2 ± 7 . 6 " " " 1 0 0 5 6 . 1 ±9.2 N/S Height (cm) 80 156.2 ± 5.3 100 155.4 ±4.9 N/S BMI (kg/m2) 80 23.5 ±2.9 100 23.2 ±3.7 N/S Percent body fat (%) 80 31.5 ± 6.3 100 30.8 ±7.1 N/S Fasting total blood 68 4.7 ± 0.6 75 4.5 ± 0.6 N/S
cholesterol level (mmol/L) Number (%)
BMI levels n=103 Underweight 2(3) 5(5) N/S Normal weight 35 (44) 51 (51) Overweight 22 (28) 12 (12). Obese 21 (26) 32 (32)
Percent body fat levels n=81 n=103 Below range 2(3) 2(2) N/S Desirable range 17 (21) 35 (35) Above range 61 (76) 63 (63)
Fasting total blood n=81 n=103 cholesterol levels
Desirable 64 (80) 90 (90) N/S Borderline 13 (16) 9(9) High 3_(4) W )
3.3.3 Health Conditions Reported
There were no significant differences in the number of self-reported diabetes,
hypertension, high blood cholesterol, high blood triglycerides, bone/joint pain,
anemia and other diseases between the two groups (Table 3.6). About one-third of
the women in both groups reported they had bone/joint pain, and 16 to 17% of the
women had anemia. Table 3.7 shows that about half of the women said their health
was the same as the other women while one-third of them rated their health
better/much better than their peers.
60

Table 3.6 Number (%) of self-reported cases of six health conditions in the Education
and Control Groups Diseases Education Group Control Group Significance
(n=81) (n=103) Diabetes u j ) 0^0) Hypertension 9(11) 10(10) N/S High blood cholesterol 7 (9) 4 (4) N/S High blood triglycerides 2 (2) 2 (2) N/S Bone/joint pain 24 (30) 37 (36) N/S Anemia 14(17) 16(16) N/S
Table 3.7 Number (%) of women rating their own health in different categories in the
Education and Control Groups Rating of health Education Group Control Group Significance
(n=81) (n-103) Much worse 3~(4) 0^0) N/S Worse 20 (25) 18 (18) Same 35 (43) 49 (48) Better 20 (25) 32 (31) M u c h better 3 J 4 ) 4_(1)
3.3.4 Meal Patterns
Table 3.8 shows the mean number of days of having breakfast, lunch and dinner of
the women in the two groups. In both groups, breakfast was the most commonly
skipped meal while dinner was the least. There were no significant differences in
the mean number of days per week of the three regular meals between the two groups.
About 30% of the women in both groups reported never having snacks. Even so,
the mean frequency among the snack eaters in the Education Group and the Control
Group was 2.3 and 1.8 times/day respectively. There were no significant
differences in the data concerning snacks between the two groups.
61

Table 3.8 Mean number of days 土 S.D. per week of having breakfast, lunch, dinner and mean number 土 S.D of snacks per day in the Education and Control Groups Meal Education Group Control Group Significance
(n=81) (n=103) Breakfast (d/wk) 5.8 ±2.2 6.0 ± 1.8 N/S Lunch (d/wk) 6.4 ± 1.5 6.4 ± 1.3 N/S Dinner (d/wk) 7.0 ± 0.2 7.0 ± 0.0 N/S Snacks (per day) 2.3 土 1.9 1.8 士 1.3 N/S
Additionally, only about 70% of women in both groups replied they had breakfast
every day, and about 80% of them had lunch every day, as is presented in Table 3.9.
Breakfast skipping was somewhat common in both groups only, with about two-
thirds of the women reporting eating breakfast daily, and 7% and 5%, respectively, in
the Education Group and the Control Group reporting never having breakfast. No
significant differences between the two groups were seen in any of these findings.
Table 3.9 Number (%) of women who had breakfast every day, skipped breakfast
every day or had lunch every day in the Education and Control Groups Education Group Control Group Significance
(n二81) (n=103) Ate breakfast daily 54 (67) 71 (69) N/S Never ate breakfast 6(7) 5(5) N/S Ate lunch daily 66(81) 79 (77) N/S
3.3.5 Nutrient Supplements Practices
There was a significant difference (尸<0.001) in the number of women who took
supplements regularly between the two groups (Table 3.10). Twenty-seven percent
of the Education Group compared to 6% of the Control Group reported taking
nutrient supplements. In the Education Group, it was obvious that most of the
supplement takers (17%) took one supplement only. The most common type of
supplement taken was vitamin E, followed by unspecified vitamin(s), calcium and
vitamin C. The types of supplements taken are listed in Table 3.11.
62

Table 3.10 Number of supplements the women taken in the Education and Control
Groups Number of supplements taken Education Group Control Group Significance
(11=81) (n 二 103) None 59 (73) 97 (94) P<0.01 One 14(17) 2(2) Two 5 (6) 2 (2) Three 0(0) 1(1) Four 3_(4) U l )
Table 3.11 Number (%) of women in taking the following types of supplements in
the Education and Control Groups Type of supplement Education Group Control Group Total
(11=22) (n=6) (n=28) ^ V i t a m i n E 9 (41) 3 (50) 12 (43)
Vitamin(s) (unspecified) 7 (32) 1 (17) 8 (29) Calcium 6 (27) 1 (17) 7 (25) Vitamin C 4(18) 2(33) 6(21) Vitamin B 2(9) 3 (50) 5 (18) Fishoil 3(14) 0(0) 3 (11) Manganese 1(5) 1 (17) 2(7) Protein powder 1 (5) 0 (0) 1 (4) Traditional Chinese 1 (5) 0 (0) 1 (4)
Medicine Others 2_(9) IJVJ) 3 (11)
3.3.6 Cooking Practices
Almost all (97%) of the women in both groups were responsible for cooking at home.
More than half of them used corn oil for cooking and about half of them used peanut
oil as is shown in Table 3.12. The Education Group had significantly higher
proportion who reported using butter/margarine (尸<0.05), canola oil (尸<0.01) and
safflower oil (P<0.05).
63
Table 3.12 Number (%) of women in using the following oils in the Education and
Control Groups Types of oil Education Group Control Group Significance
(11=81) (11=103) Corn oil 47 (58) 56 (55) N/S Peanut oil 36 (44) 49 (48) N/S But te r /Margar ine 36 (44) 29 (28) 尸<0.05 Canola oil 36 (44) 25 (25) ?<0.01 Sa f f lower oil 4 ( 5 ) 0 ( 0 ) 尸<0.05 Olive oil 3J4) 1_(1) N/S
When asked the common cooking methods for fish, the three most common methods
were steaming, frying and boiling. Steaming was also the most common method
for cooking poultry, followed by boiling and grilling. Stir frying was used most
frequently for cooking pork/beef and vegetables, the results are listed in Table 3.13.
Table 3.13 Number (%) of women in using the following cooking methods for fish,
pork/beef, poultry and vegetables in the Education and Control Groups Food item Cooking methods Education Group Control Group Significance
(11=81) ( n : 1 0 3 ) Fish
Steaming 76 (94) 98 (95) N/S Frying 71 (63) 53 (52) N/S Boiling 18 (22) 28 (28) N/S
Pork/Beef Stir frying 49 (61) 65 (63) N/S Boiling 37 (46) 47 (46) N/S Steaming 35 (43) 38 (37) N/S
Poultry Steaming 52 (64) 67 (65) N/S Boiling 34 (42) 34 (33) N/S Grilling 32 (40) 31 (30) N/S
Vegetables Stir frying 70 (86) 88 (86) N/S Boiling 58 (72) 56 (54) P<0.05
64

3.3.7 Fat Removal Behavior
Over 60% of the women in both groups removed some fat from meat before eating.
About 31% of the Education Group and 25% of the Control Group removed all fat
from meat before eating. Regarding poultry, over 50% of women removed some
skin before eating in the two groups. About 36% of the Education Group and 25%
of the Control Group removed all skin before eating. There was no significant
difference between the two groups in these practices, with results shown in Table
3.14.
Table 3.14 Number (%) of women reported removing fat from meat and removing
skin from poultry in the Education and Control Groups Food Fat/skin removal Education Group Control Group Significance item (n=81) (n=103) Meat
Not remove any fat 1 (1) 12(12) N/S Removed some fat 53 (65) 63 (61) Removed all fat 25 (31) 26 (25) Never consume meat 2 (3) 2 (2)
Poultry Not remove any skin 8(10) 18(18) N/S Removed some skin 43 (53) 58 (56) Removed all skin 29 (36) 26 (25) Never consume poultry 1(1) 1(1)
3.3.8 Food Label Reading
Almost all (94%) of the women in both groups were responsible for buying food for
their families. Also, 93% of the women reported reading food labels when buying
pre-packed food for the first time, however, only half of them read it each time or
usually do so (Table 3.15). For those who read food label, only 5% of the
Education Group and 11% of the Control Group replied that the food label is
clear/very clear to them with Table 3.16 showing the results.
65

Table 3.15 Number (%) of women reported reading the food labels with different
frequencies in the Education and Control Groups Frequency Education Group Control Group Significance
(n二81) (n=lQ3) Never 6~{T) 6^6) N/S Usually 37 (46) 50 (49) Always 18 (22) 27 (26) Each time 20 (25) 20(19)
Table 3.16 Number (%) of women reported different degrees of clarity of the food
labels in the Education and Control Groups Clarity Education Group Control Group Significance
(n=75) (n=97) ^ V e r y unclear f(T) 2(2) N/S
Unclear 10(13) 10(10) So-So 60 (80) 74 (76) Clear 4(5) 10(10) Very clear 0^0) 1_(1)
3.3.9 Dietary Intake
a. From the Three-day Dietary Records
The three-day dietary record provided information about the general energy and
nutrient intakes of the women, with these data presented in Table 3.17. In the
Education and Control Groups, 75 and 72 women, respectively, returned the dietary
records. Significant differences (尸<0.05) were seen in the mean intakes of energy,
fat and vitamin C, in which the intakes in the Education Group were lower than those
of the Control Group.
66

Table 3.17 Energy and nutrient intake data of the women in the Education and Control Groups from the three-day dietary records
Mean 土 S.D. Diet component Education Group Control Group Significance
(n=75) (n=72) Energy (kcal) 1853.4 ± 4 0 7 . 3 2 0 3 5 . 8 ± 606.5 ^<0.05 Carbohydrate (g) 232.3 土 59.2 250.1 ± 74.7 N/S Protein (g) 74.2 ± 20.9 79.8 ± 27.8 N/S Fat (g) 73.8 ± 23.1 83.0 ± 3 1 . 7 尸<0.05 SFA (g) 14.8 ±6.4 16.0 ±6.7 N/S PUFA (g) 14.5 ±6.3 16.8 ±9.0 N/S MUFA (g) 22.6 ± 9.2 25.9 ±11.3 N/S Cholesterol (mg) 232.6 土 128.8 236.5 士 156.8 N/S Fibre (g) 9.0 ±5.4 10.1 ±5.8 N/S Calcium (mg) 504.7 ± 280.5 515.8 ±213.1 N/S Iron (mg) 15.7 ±13.8 15.6 ±7.5 N/S Sodium (mg) 1807.8 ± 810.0 1924.9 ± 1314.6 N/S Vitamin A (RE) 859.5 ± 1074.1 1008.3 土 809.0 N/S Vitamin C (mg) 153.8 ± 83.4 184.5 ±102.1 尸<0.05 Vitamin E (mg) 8.9 ±7.1 11.5 ±10.6 N/S
Over 80% of the women in both groups had percent energy from total fat >30% and
more than half had percent energy from MUFA >10%, greater than the recommended
intake (Table 3.18). Moreover, nearly all of them had insufficient fibre intake
(Table 3.19). Low calcium intakes were also found among the women, as less than
10% of them met the recommended intake level. Additionally, about 40% had
insufficient iron intake, as well as one-fourth of them having cholesterol intakes that
exceeded the recommended amount.
Table 3.18 Number (%) of women exceeding the recommended percent energy from
total fat, SFA, PUFA and MUFA in the Education and Control Groups Percent of women Education Group Control Group Significance
(n=75) (n=72) With energy from total fat >30% 62 (83) 61 (85) N/S With energy from SFA >10% 9(12) 4(6) N/S With energy from PUFA > 10% 7(9) 7(10) N/S With energy from MUFA >10% 38(51) 47 (65) N/S
67

Table 3.19 Number (%) of women who met the recommended intake levels of selected nutrients in the Education and Control Groups Nutrient Education Group Control Group Significance
(n=75) (n=72) Protein >70 g 41 (55) 45 (63) Cholesterol <300 mg 58 (77) 52 (72) N/S Fibre >25 g 0(0) 1(1) N/S Calcium >800 mg 7(9) 6(8) N/S Iron >12 mg 44 (59) 45 (63) N/S Vitamin A >800 RE 29 (39) 37 (51) N/S Vitamin C >60 mg 67 (89) 66 (92) N/S Vitamin E >12 mg 13(17) 18(25) N/S
b. From the Food Frequency Questionnaire
The use of the food frequency questionnaire in this study was to understand the
general food consumption patterns of common local food items among the women.
The consumption frequencies of all the sixty food items in the questionnaire are
shown in Appendix W. Among all the food items, only five of them showed a
significant difference (?<0.05) between the Education and Control Groups. They
were whole milk, tofu skin, potato crisps, chocolate and salad dressing. The
Control Group had higher consumption frequencies of these five food items than did
the Education Group.
Moreover, it was revealed that dairy product consumption was uncommon among the
women. More than half of them never or rarely consumed dairy products such as
cheese, yogurt or skim milk, etc, in a typical week (defined as 'during which you
have no illness, and your working level was normal to you,),as is shown in Table
3.20. However, some of the high fat or less healthy food such as dim sum, fried
eggs, fried pork etc, were consumed frequently among the women, as is shown in
Table 3.21, and ice-cream was the most frequently consumed of the dairy products
queried.
68

Table 3.20 Number (%) of women who reported never/rarely consuming specific
dairy products in a typical week in the Education and Control Groups Food item Education Group Control Group Significance
(n二81) (n=lQ3) Cheese 56 (69) 68 (66) N/S Yogurt 67 (83) 84 (82) N/S Low-fat yogurt 67 (83) 84 (82) N/S Whole milk 71(88) 70 (68) 尸<0.05 Skim milk 57 (71) 67 (65) N/S High-calcium low-fat milk 41 (51) 61 (59) N/S Ice-cream 42 (52) 44 (43) N/S
Table 3.21 Number (%) of women who reported consuming specific high fat or
otherwise 'less healthy' food two times or more in a typical week in the Education
and Control Groups
Food item Education Group Control Group Significance (11=81) (n=103)
Steam dim sum 43 (53) 51 (50) N/S Fried pork 40 (49) 54 (52) N/S Fried egg 39 (48) 41 (40) N/S Chicken wing 36 (44) 39 (38) N/S Fried fish 30 (37) 39 (38) N/S Fried dim sum 24 (30) 29 (28) N/S Fried noodles 23 (28) 29 (28) N/S Fried beef 20 (25) 25 (24) N/S Ham 17(21) 21 (20) N/S Cup noodles 15 (19) 18 (17) N/S Soft drink 13 (16) 25 (24) N/S Sausage 12(15) 21 (20) N/S
3.3.10 Nutrition Knowledge
No significant difference in the mean Nutrition Knowledge Score between the
Education and Control Groups was found. About half (51%) of the women in the
Education Group reported they had heard of saturated fat, compared to only 35% in
the Control Group (P<0.05). About 80% and 70% of the Education Group and the
Control Group, respectively, reported they had heard of the food pyramid, however,
only 35% and 27% of the Education Group and Control Group women, respectively,
were able to correctly matched all the food groups with their corresponding level of
the food pyramid, as is shown in Table 3.22.
69

Table 3.22 Mean Nutrition Knowledge Score 士 S.D and the number (%) of women
reporting having heard of saturated fat or the food pyramid, and who correctly
matched all four food groups with their corresponding level of the food pyramid in
the Education and Control Groups Nutrition knowledge questions Education Group Control Group Significance
(n=81) (11=103) Nutrition Knowledge Score 7.7 ±3.6 6.7 ±3.4 N/S Hadheard of saturated fat 41(51) 36 (35) 尸<0.05 Had heard of the food pyramid 64 (79) 72 (70) N/S Correctly matched food pyramid 28 (35) 28 (27) N/S levels
No significant differences were seen for the ten additional nutrition knowledge
questions between the Education and Control Groups (Table 3.23). In both groups,
about 80% of the women knew that fibre can help prevent colon cancer, and 82% and
72% of the Education and Control Group, respectively, correctly replied that whole
wheat bread has more fibre than white bread. However, less than 10% of the
women in both groups correctly stated that the hardening of blood vessels is not
mainly caused by too much dietary cholesterol. Additionally, only around 10% of
the women knew that high cholesterol food has a smaller effect than high saturated
fat food on raising blood cholesterol level.
70

Table 3.23 Responses to the ten additional nutrition knowledge questions in the Education and Control Groups Nutrition knowledge questions Education Group Control Group
(n二81) (n-103) Egg white has more saturated fat Correct 46 (58) 47 (46) than egg yolk. Incorrect 9 (11) 15(15)
Don’t know 26 (32) 41 (40) Skim milk has more saturated fat Correct 51 (64) 55 (53) than whole milk. Incorrect 8(10) 14(14)
Doirt know 22 (27) 34 (33) Some foods contain a lot of fat Correct 19 (24) 19(18) but no cholesterol. Incorrect 35 (43) 43 (42)
Don't know 27 (33) 41 (40) High cholesterol food has a Correct 9 (11) 12(12) greater effect than high saturated Incorrect 31 (38) 29 (28) fat food on raising blood Don't know 41 (51) 62 (60) cholesterol level. White bread has more fibre than Correct 66 (82) 74 (72) whole wheat bread. Incorrect 9(11) 10(10)
DoiVt know 6(7) 19(18) Whole milk contains more Correct 31 (38) 35 (34) protein than skim milk. Incorrect 24 (30) 29 (28)
Doirt know 26 (32) 39 (38) Frozen foods have the same Correct 45 (56) 39 (62) nutrients as fresh foods. Incorrect 20 (32) 19 (30)
Doirt know 8(13) 5 (8) Eating a lot of sugars will cause Correct 19 (24) 21 (20) diabetes. Incorrect 54 (67) 65 (63)
DoiVt know 8 (10) 17(17) The hardening of blood vessel is Correct 4(5) 7(7) mainly caused by too much Incorrect 68 (84) 79 (77) cholesterol in your diet. Don't know 9(11) 17(17) A high fibre diet can help Correct 65 (80) 79 (77) prevent colon cancer. Incorrect 4 (5) 2 (2)
DoiVt know 12(15) 22 (21)
71

3.3.11 Physical Activity Habits
The mean reported daily energy expenditure calculated by group from each woman's
list of activities was not significantly different (Table 3.24). However, the
Education Group had a significantly (P<0.05) higher summary physical activity
index (indicating the level of physical activity from five types of activities: vigorous
physical activity, walking, moving, standing and sitting) than the Control Group.
More than half (58% and 54% in the Education and Control Groups, respectively) of
the women reported no daily stair climbing. Among those who did, the number of
flights was 3.0 flights per day in the Education Group and 3.7 flights per day in the
Control Group, not a significant difference. About 60% of women in both groups
replied that there were no seasonal differences in their activity level.
Table 3.24 Mean 土 S.D. reported daily energy expenditure (kcal/day), summary
physical activity index and number of flights of steps climbed per day in the
Education and Control Groups Education Group Control Group Significance
(n:81) (n-103) Daily energy expenditure (kcal/day) 1444.6 土 632.6 1656.7 土 786.5 N/S Summary physical activity index 31.9 ± 19.0 25.7 土 15.4 尸<0.05 Number of flights of steps climbed 3.0 士 2.7 3.7 土 5.2 N/S
per day
Among the top ten most frequent physical activities performed by the women, all of
them were sedentary activities which were not vigorous enough for gaining health
benefits. Data revealed that the women spent about 2 hours per day watching
television and about 1.5 hours having meals, as is shown in Table 3.25. No
significant differences were noted between the two groups in the mean time they
performed the top ten most frequent physical activities, which were the same in both
groups.
72

Table 3.25 Mean time (mins) 土 S.D. spent per day spent on the top ten most frequent physical activities reported by the women in the Education and Control Groups Top ten frequent Education Group Top ten frequent physical Control Group physical activities (n=81) activities (n=103) Watching television 123.5 士 122.7 Watching television 115.2 士 86.9 Eating 91.3±58.8 Eating 108.0± 103.2 Reading newspaper, 49.1 土 43.5 Food preparation 55.7 土 59.7
magazines and books Food preparation 42.6 土 44.9 Reading newspaper, 49.8 土 45.4
magazines and books Light housework 37.4 士 33.3 Light housework 41.0 土 38.1 Shopping 31.5 ±29.9 Shopping 35.6 ± 30.0 Leisurely walking 27.4 士 30.3 Buying food 32.0 士 20.5 Buying food 27.2 ± 18.4 Playing Mahjong 31.2 土 49.9 Laundry 19.6 ±17.7 Heavy housework 25.0 土 33.6 Dishwashing 19.5 士 15.5 Dishwashing 23.8 ± 19.1
3.3.12 Physical Activity Knowledge
There was no significant difference in the mean Physical Activity Knowledge Score
between the two groups (Table 3.26). About 17% and 21% of the Education and
Control Group women, respectively, reported that they had heard of the physical
activity pyramid. However, only a few women (about 2% of the Education Group
and 4% of the Control Group) could correctly match all the physical activity groups
with their corresponding level of the physical activity pyramid.
Table 3.26 Mean Physical Activity Knowledge Score 土 S.D. and the number (%) of
women who reported having heard of the physical activity pyramid, and correctly
matched all four physical activity groups with their corresponding level of the
physical activity pyramid the Education and Control Groups Physical activity knowledge Education Group Control Group Significance questions (n=81) (n=103) Physical Activity Knowledge Score 6.0 ± 2.2 5.6 ±2.7 N/S Had heard of the physical activity 14(17) 22 (21) N/S
pyramid Correctly matched physical activity 2 (2) 4 (4) N/S
pyramid levels
73
Regarding the nine additional physical activity knowledge questions, a significant
difference (P<0.05) between the Education and Control Groups was seen in one
question only, which is about the relationship between physical activity and diabetes,
more women in the Control Group than the Education Group did not know how to
answer this question (Table 3.27). Most of the women (83% and 73% in the
Education and Control Groups, respectively) correctly stated that regular physical
activity decreases the chance of osteoporosis. Moreover, 73% and 76% of the
Education and Control Groups, respectively, replied correctly that physical activity
need not be hard enough to require more exertion than normal to produce gains in
health-related fitness. Nevertheless, only about 20 to 25% of the women in both
groups correctly responded to either of the two questions concerning the
recommendations for physical activity.
74
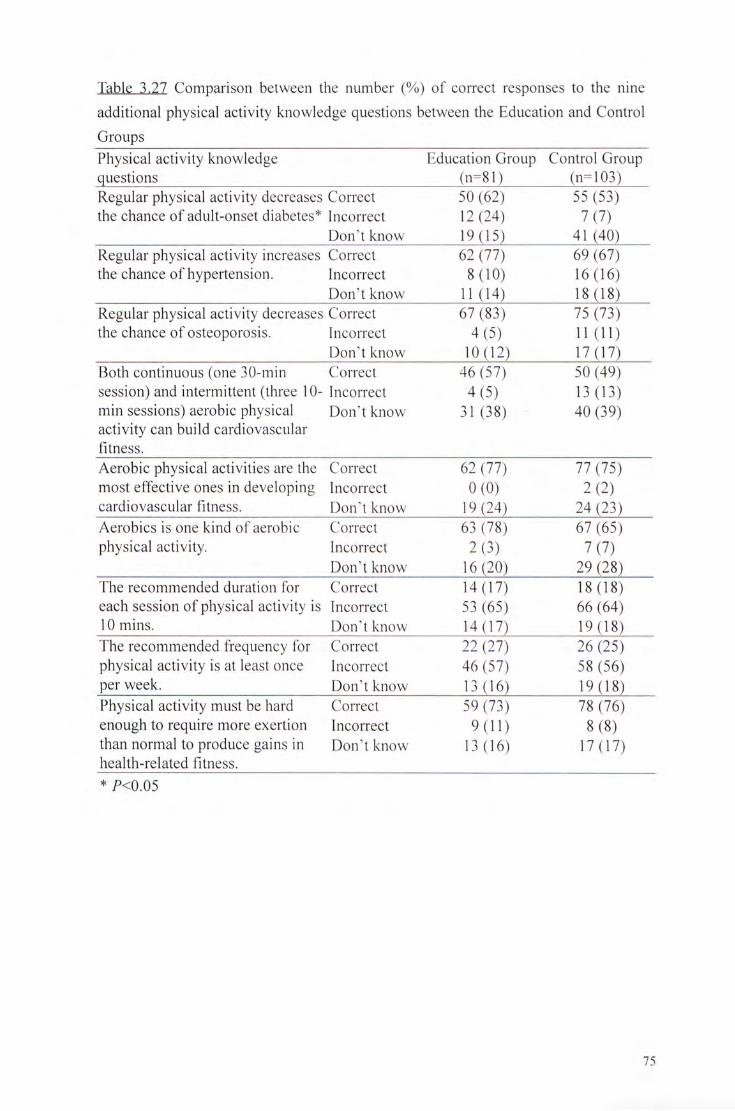
Table 3.27 Comparison between the number (%) of correct responses to the nine
additional physical activity knowledge questions between the Education and Control
Groups Physical activity knowledge Education Group Control Group questions (n=81) (n=103) Regular physical activity decreases Correct 50 (62) 55 (53) the chance of adult-onset diabetes* Incorrect 12 (24) 7(7)
Dorft know 19(15) 41 (40) Regular physical activity increases Correct 62 (77) 69 (67) the chance of hypertension. Incorrect 8(10) 16(16)
Dorft know 11 (14) 18(18) Regular physical activity decreases Correct 67 (83) 75 (73) the chance of osteoporosis. Incorrect 4(5) 11 (11)
Dorft know 10(12) 17(17) Both continuous (one 30-min Correct 46 (57) 50 (49) session) and intermittent (three 10- Incorrect 4 (5) 13 (13) min sessions) aerobic physical Doirt know 31 (38) 40 (39) activity can build cardiovascular f i tness. Aerobic physical activities are the Correct 62 (77) 77 (75) most effective ones in developing Incorrect O (0) 2 (2) cardiovascular fitness. Don't know 19 (24) 24 (23) Aerobics is one kind of aerobic Correct 63 (78) 67 (65) physical activity. Incorrect 2 (3) 7 (7)
DoiVt know 16(20) 29 (28) The recommended duration for Correct 14(17) 18(18) each session of physical activity is Incorrect 53 (65) 66 (64) lOmins. Don’t know 14(17) 19(18) The recommended frequency for Correct 22 (27) 26 (25) physical activity is at least once Incorrect 46 (57) 58 (56) per week. Doirt know 13 (16) 19 (18) Physical activity must be hard Correct 59 (73) 78 (76) enough to require more exertion Incorrect 9(11) 8(8) than normal to produce gains in DoiVt know 13 (16) 17(17) health-related fitness. * 尸 < 0 . 0 5
75

3.3.13 Intention and Confidence in Changing Behavior
The stages of change situation for the behaviors of decreasing saturated fat intake,
increasing fruit intake, increasing vegetable intake and doing more physical activity
in the two groups are listed in Table 3.28. There was a significant difference
(尸<0.01) in the stages of change distribution for decreasing saturated fat intake
between the two groups, in which the Education Group had greater proportion who
were currently decreasing the intake than did the Control Group. In the Education
Group, 53% of them were in the precontemplation stage whereas in the Control
Group, 69% in this stage. In contrast, the total percentage of women in the action
and the maintenance stages in the Education Group was three times that of the
Control Group (40% Vs 13%).
Moreover, there was a significant difference (尸<0,05) in the stages of change
distribution for increasing vegetable intake between the two groups. The Education
Group again showed that they had higher intention and confidence in this behavior
than the Control Group as well, as there were only 11% of them in the
precontemplation stage compared with 24% in the Control Group. There were no
significant differences between the two groups in the stages of change for increasing
fruit intake and doing more physical activity. About one-third and one-fifth of the
women in the two groups were in the precontemplation stage for increasing
vegetable intake and increasing physical activity, showing that many had low
awareness about changing their behavior in these two areas.
76

Table 3.28 The stages of change of behavior in the Education and Control Groups Number (%) of women
Behavior Education Group Control Group Significance (n-81) (n-103)
Decreasing saturated fat intake 尸 < 0 . 0 1
Precontemplation 43 (53) 71 (69) Contemplation 2 (3) 6 (6) Preparation 4(5) 13 (13) Action 16 (20) 5 (5) Maintenance 16(20) 8_(8)
Increasing fruit intake N/S Precoiitemplation 22 (27) 34 (33) Contemplation 3 (4) 6 (6) Preparation 18(22) 15 (15) Action 15 (19) 12 (12) Maintenance 23 (28) 36 (35)
Increasing vegetable intake 尸 < 0 . 0 5
Precontemplation 9 (11) 25 (24) Contemplation 6 (7) 2 (2) Preparation 10(12) 12 (12) Action 19(24) 12(12) Maintenance 37 (46) 52 (51)
Doing more physical activity N/S Precontemplation 14 (17) 23 (23) Contemplation 8 (10) 12(12) Preparation 15 (19) 24 (24) Action 17 (21) 18(18) Maintenance 27 (33) 25 (25)
3.3.14 Perceived Difficulties in Changing Behavior
Only about 10% of the women in either group reported they had difficulties in
changing their eating behavior, whereas 38% of the Education Group and 22% of the
Control Group reported having difficulties in doing more physical activity.
Resisting the attraction of food was the most common difficulty faced when the
women tried to decrease saturated fat intake. The top three barriers to doing more
physical activity were laziness, makes me feel tired, too vigorous and no time.
Table 3.29 lists all the difficulties reported by the women in eating less saturated fat,
eating more fruit, eating more vegetable and doing more physical activity.
77

Table 3.29 Difficulties reportedly encountered preventing different behavioral
changes in the Education and Control Groups Number (%)
Behavior and difficulties Education Control Group Total Group (n=81) (n=103) (n=184)
Eating less saturated fal No difficulties reported 72 (89) 96 (93) 168 (91) Attraction of food 7 (9) 3 (3) 10 (5) Pressure from families/ friends 1(1) 2 (2) 3 (2) Feel hungry/no energy/ 1(1) 2(2) 3(2)
Uncomfortable Eating more fruit
No difficulties reported 75 (93) 101 (98) 176 (96) No time 2(2) 0(0) 2(1) Lazy 2(2) 0(0) 2(1) Can't eat when feel full 1(1) 1 (1) 2 (1) Feel discomfort 1 (1) 1 (1) 2 (1) Cannot have food in some 1(1) 0(0) 1(1)
occasions Fear to be fat 1(1) 0(0) 1(1) Afraid of fertilizers 1(1) 0(0) 1 (1) Others \_{\) 0_(0) 1 (1)
Eating more vegetables No difficulties reported 78 (95) 101 (98) 179 (97) Dislike the texture/taste 2 (2) 2 (2) 4 (2) Afraid of fertilizers 2(2) 0(0) 2(1) Don't know how to cook them 1_(1) Q (0) 1 (1)
Doing more physical activity No difficulties reported 50 (62) 80 (78) 130 (71) Laziness 13 (16) 6(6) 19 (10) Feel tired because too vigorous 8(10) 9(9) 17(9) No time 7(9) 7(7) 14(8) Health problems 2 (2) 1 (1) 3 (2) No company 1(1; 1 (1) 2 (1) Can't perform some physical 1(1) 0(0) 1(1)
activities Others 3^(4) 0_(0) 3 (2)
78

3.3.15 Perceived Methods Facilitating Behavior Change
Although not many of the women reported barriers to changing their behaviors, more
of them reported already knowing some methods for supporting their change, as are
shown in Table 3.30. Most commonly, the women pointed out that having a healthy
eating habit was a way to decrease saturated fat intake. Buying more fruit,
developing a habit of eating fruit and choosing their favorite fruit were the popular
ways to increase fruit intake. Buying/cooking more vegetables, eating less
meat/dishes and thinking of the benefits of vegetables were the most common
methods for increasing vegetable intake among the women. Thinking of the
benefits of physical activity, joining more physical activities and self encouragement
were cited by most of them as the methods for increasing physical activity.
Table 3.30 Methods suggested by the women in the Education and Control Groups
for facilitating different behavioral changes
Number (%) Behavior and methods Education Control Total
Group Group (n=184) (n-81) (n=103)
Eating less saturated fat No methods suggested 47 (58) 86 (83) 133 (72) Have healthy eating practices 23 (28) 5 (5) 28 (15) Co-operate with family 3 (4) 3 (3) 6 (3) Buy/cook fatty food less frequently 3 (4) 2 (2) 5 (3) Self control/self remind 3 (4) 2 (2) 5 (3) Pay attention to eating habits and food 2 (1) 0 (0) 2 (1)
composition Others 0_(0) 5 (5) 5 (3)
Eating more fruit No methods suggested 33 (41) 59 (57) 92 (50) Buy fruit more frequent 12 (15) 7(7) 19(10) Choose favorite/different types of fruit 7 (9) 9 (9) 16 (9) Develop a habit of eating fruit 8(10) 7(7) 15 (8) Have fruit as snacks 9(11) 2 (2) 11 (6) Eat less meat/dishes 3 (4) 8 (8) 11 (6) Remember the benefits of eating more 3 (4) 3 (3) 6 (3)
fruit Eat salad/assorted fruit basket 1(1) 1(1) 2(1) Others 5 (10) 7(7) 12(7)
79

Number (%) Behavior and methods Education Control Total
Group Group (n=184) (n=81) (n-103)
Eating more vegetables No methods suggested 36 (44) 63 (61) 99 (54) Buy/cook vegetables more frequent 15(19) 9(9) 24 (13) Eat less meat/dishes 10 (12) 9 (9) 19 (10) Remember the benefits of eating more 6 (7) 9 (9) 15 (8)
vegetables Develop a habit of eating vegetables 5 (6) 4 (4) 9 (5) Use a healthy cooking method 5 (6) 4 (4) 9 (5) Choose favorite vegetables 3 (4) 5 (5) 8 (4) Others H U 0(0) 1 (1)
Doing more physical activity No methods suggested 33 (41) 55 (53) 88 (48) Remember the benefits of doing 10 (12) 13 (13) 23 (13)
physical activity Self encouragement/More wi 11 power 8 (10) 10(10) 18(10) Join more physical activities 6 (7) 9 (9) 15(18) Save more time for doing physical 7(9) 5(5) 12(7)
activity Have company 9 (11) 2 (2) 11 (6) Try to incorporate physical activity in 3 (4) 5 (5) 8 (4)
daily activities/in different occasions Build an interest in doing physical 2(1) 3 (3) 5 (3)
activity Other internal factors 2(1) 3 (3) 5 (3) Others U l j 3_(3) 4(2)
3.3.16 Health Information Desired
When asked what kind of health information they would like to learn more about, a
variety of topics were mentioned, with the most commonly cited interesting topic
being nutrition-related diseases (16% in the Education Group and 10% in the Control
Group). All the topics are listed in Table 3.31. However, only 32% and 16% of
the Education and Control Groups, respectively, responded to this question.
80

Table 3.31 Topics about which the women would like to learn more in the Education and Control Groups
Number (%) Health topics Education Group Control Group Total
(n=81) (n=103) (n=184) No topics suggested 62 (77) 90 (87) 152 (83) Nutrition-related diseases 13(16) 10(10) 23 (13) Nutrition information 9(11) 2(2) 11(6) One's health status 5 (6) 6 (6) 11 (6) All-rounded information 5 (6) 2 (2) 7 (4) Organ's functioning 2 (2) 2 (2) 4 (2) Other diseases 2(2) 1(1) 3(2) Women's health 1(1) 1(1) 2(1) Dieting/weight control methods 2 (2) 0 (0) 2(1) Physical activity information 2(2) 0(0) 2(1) Others 2_(2) 0_(0) 2(1)
3.3.17 Areas of Health the Women Would Like to Improve
When asked what aspects of health they would like to improve, only 69% and 62%
of the Education and Control Groups, respectively, responded to this question.
About one-fourth of all women mentioned their physical activity habits (27% in the
Education Group and 21% in the Control Group) and one-sixth of them mentioned
eating habits (21% in the Education Group and 13% in the Control Group). Other
aspects mentioned included losing weight; relieving joint/bone pain and
strengthening their health etc, all listed in Table 3.32.
81

Table 3.32 Aspects of health the women would like to improve in the Education and
Control Groups
Number (%) Aspects of health Education Group Control Group Total
(n=81) (11=103) (n=184) No improvements mentioned 36 (44) 58 (56) 94 (51) Physical activity habits 22 (27) 22 (21) 44 (24) (unspecified) Eating habits (unspecified) 17(21) 13 (13) 30(16) Lose weight 9(11) 13 (13) 22(12) Strength physical health 6 (7) 5 (5) 11 (6) Improve mental health 7(9) 1(1) 8(4) Relieve joint/bone pain 3 (4) 5 (5) 8 (4) Benefit a parts of the body 3 (4) 4 (4) 7 (4) Improve osteoporosis 4 (5) 1(1) 5(3) Gain weight 0 (0) 3 (3) 3 (2) Improve hypertension 1(1) 2(2) 3(2) Improve high blood cholesterol 2 (2) 1(1) 3(2) Get more rest 0 (0) 2 (2) 2 (1) Others 5(6) 4 (4) 9 (5 )
3.3.18 Summary Profile of the Women at Pretest
The Pretest provided a basis for evaluating the impact of the program. Among all
the variables measured in the Pretest, only few of them showed significant
differences between the Education and Control Groups. The few relatively small
differences revealed were those in nutrient supplements taking; physical activity
habits; intention/confidence in changing saturated fat and vegetable intakes;
proportion of them who had heard of saturated fat; energy, fat and vitamin C intakes
and consumption frequencies of whole milk, tofu skin, potato crisps, chocolate and
salad dressing.
The Pretest also revealed that about two-third of the total surveyed women had
complete primary or lower secondary education level. Most (70%) of them were
housewives, and more than 90% of the women were responsible for cooking at home.
The prevalence of overweight and obesity was 18% and 29% respectively, and about
82

70% of the women exceeded the desirable range of percent body fat. A better
situation prevailed for the fasting total blood cholesterol level, in which 86% of the
women had a normal level.
About 70% and 80% of the women ate breakfast and lunch daily, respectively, in
both groups, and less than 10% of them never ate breakfast. One-third of the
women in both groups reported never having snacks. The frequency of snack
eating among the eaters was twice per day. Taking supplements was more common
in the Education Group than the Control Group (27% Vs 6%;尸<0.05), and vitamin E
was the most popular supplement taken in both groups.
The women mainly used either corn oil or peanut oil for cooking. Regarding their
cooking methods, steaming was the most common for fish (95%) and poultry (65%),
while stir frying was the most popular for pork/beef (62%) and vegetables (86%).
About 30% of the women removed all the fat/skin before they eating meat or poultry.
About half of the women replied they sometimes read the food labels, only 8%
indicated that the labels were clear or very clear.
The three-day dietary records showed that about 80% of the women's percent energy
from fat was greater than the recommended level (less than 30%), mainly come from
the fried food such as fried meat, chicken wing, fried dim sum and fried noodles.
Fibre intake needed some attention because almost none of the women met the
recommended intake levels, because vegetables consumption was low among the
women. Calcium and vitamin E intakes were another concern, as less than 10% of
the women achieved the recommended intake level for calcium, and only one-fifth of
them had sufficient vitamin E intake. Additionally, from the food frequency
83

questionnaire, the women rarely consume the dairy products, except for ice-cream.
Half and one-third of the Education and Control Groups, respectively, reported they
had heard of saturated fat. More women had heard of the food pyramid, in which
80% of the Education Group and 70% of the Control Group responded they had
heard of it, however, only about 30% from both groups could correctly match all the
food groups with the corresponding levels of the food pyramid.
Stair climbing was not common among the surveyed women as more than half of
them did no daily stair climbing. The physical activity on which the women spent
the most time was watching television (two hours per day), followed by having
meals (one and a half hours per day). Not many of the women (20% in both groups)
had heard of the physical activity pyramid, and only less than 5% of the women
could correctly match all the physical activity groups with their corresponding levels
of the physical activity pyramid.
Sixty-one percent of the total surveyed women had no awareness about decreasing
their saturated fat intake, revealed from the stages of change question. The
proportion of women who had no awareness to increase fruit intake, increase
vegetable intake and do more physical activity was 30%, 18% and 20% respectively.
The women reported more difficulties when they tried to do more physical activity
than when they tried to eat less saturated fat or eat more fruit and vegetables.
Laziness and feeling tired were the top two barriers for doing more physical activity
among the surveyed women. To facilitate their behavior change, some of the
women did mention various methods, however.
84

Less than one-third of the women seemed interested enough in various health
information topics, in which nutrition-related diseases was the most attractive one to
them. Among the total surveyed women, only 24% and 16% replied they would
like to improve their physical activity and eating habits respectively.
In summary, the Pretest showed that a certain proportion of the surveyed middle-
aged women had unhealthy lifestyles in various aspects, such as diets with high
saturated fat, low fibre, vitamin E and calcium intakes, as well as frequently
participating in sedentary activities such as watching television, eating and reading.
These findings further support the development of a health promotion program
emphasizing healthy eating and regular physical activity as necessary for local
middle-aged women such as these.
3.4 Outcome Evaluation
To evaluate the effectiveness of the program, both the Education and Control Groups
were assessed twice after the program: immediately after the program (the Posttest),
and six months later (the Follow-up). The assessments were the same as in the
Pretest, and comparisons were made from these two assessments to determine if any
aspects of their knowledge, attitudes and behavior underwent any significant change.
3.5 Posttest
3.5.1 General Participant Sociodemographic Description
About two-thirds of the women, 63 women in the Education Group (78% of the
Pretest) and 65 women in the Control Group (63% of the Pretest), participated in the
Posttest. There were no significant differences in any of the demographic
characteristics between the two groups. There were also no significant differences
85

in the demographic characteristics between the dropouts and those remaining at the
Posttest in the two groups. Therefore, the nature of the subjects was not strongly
affected even though some dropped out from the Pre- to Posttest. All the
comparisons between Pre- and Posttests were based on those who had completed
both assessments, that is, 63 women in the Education Group and 65 women in the
Control Group.
3.5.2 Anthropometry
Only 53 and 59 women completed both body measurements in the Pre- and Posttests
in the Education Group and the Control Group respectively. None of the body
indices were changed significantly in the two groups, except that the mean fasting
blood cholesterol level which increased significantly both in the Education Group
(from 4.7 to 5.0 mmol/L,尸<0.01) and the Control Group (from 4.6 to 4.8 mmol/L,
尸<0.05). No significant changes were observed in the distributions of women in
different categories of BMI, percent body fat and fasting total blood cholesterol level
(Table 3.33).
86

Table 3.33 Comparison between physical measurement data, distributions of BMI levels according to Asian definition, percent body fat levels and fasting total blood cholesterol levels of women between Pre- and Posttests in the Education and Control Groups
Mean 士 S.D. Education Group (n=53) Control Group (n=59)
Measurement Pretest Posttest Pretest Posttest W e i g h t (k§) 58.2 ± 7.2 57.4 1 7.9 55.9 ± 10.0""55.4 ± 10.8 Height (cm) 155.8 ±4.9 155.7 ±5.1 155.3 ±4.8 155.4 ±4.6 BMI (kg/m2) 24.0 ±2.9 23.7 ± 3.2 23.2 ±4.0 23.0 ±4.4 Percent body fat (%) 32.8 ± 6.2 33.9 ± 7.3 30.7 ± 7.7 30.6 ± 7.5 Fasting total blood 4.7 ± 0.7 5.0 ±0.8** 4.6 ± 0.5 4.8 ± 0.6*
cholesterol level (mmol/L) ~ Number (%)
BMI levels Underweight 1(2) 2(4) 5(9) 7(12) Normal weight 20 (38) 17 (32) 29 (49) 26 (44) Overweight 16 (30) 18 (34) 6 (10) 9 (15) 0 b e s e 16 (30) 16 (30) 19 (32) 17 (29)
Percent body fat levels Below range 1 (2) 1 (2) 2 (3) 2 (3) Desirable range 7 (13) 5 (9) 21 (36) 20 (34) Above range 45 (85) 47(89) 36 (61) 37 (63)
Fasting total blood cholesterol levels D e s i r a b l e 40 (76) 35 (66) 53 (90) 51 (86) Borderline 11 (21) 15 (28) 5(9) 7(12) H i g h 2_(4) 3_(6) \ J2) 1 (2)
* 尸 < 0 . 0 5 * * 尸 < 0 . 0 1
3.5.3 Health Conditions Reported
About the same number of women reported having the same six conditions in the
two groups between the Pre- and Posttests, as is shown in Table 3.34, no significant
changes were noted in either group. About one-third of the women claimed that
they had bone/joint pain, while the prevalence of the other diseases/conditions were
not high among the women.
87

Table 3.34 Comparison between the number (%) of self-reported cases of six health conditions between Pre- and Posttests in the Education and Control Groups
Number (%) Education Group (n=63) Control Group (n=65)
Disease/condition Pretest Posttest Pretest Posttest Diabetes f (2 ) i~(2) 0^0) 0^0) Hypertension 8 (13) 6 (10) 7(11) 5 (8) High blood cholesterol 5(8) 11 (17) 3(5) 2(3) High blood triglycerides 1 (2) O (0) 2 (3) 1 (2) Bone/joint pain 19 (30) 18 (29) 25 (38) 23 (35) Anemia 8 (13) 5J8) 9(14) 8(12)
The percentage of women who rated their health as worse or much worse than that of
their peers dropped from 29 to 15% in the Education Group while the percentage was
maintained at 19% in the Control Group (Table 3.35). The change in the Education
Group corresponded to an increase in the number who rated their health as the same
as their peers. However, none of these changes were significant.
Table 3.35 Comparison between the self-rated health relative to that of peers between
Pre- and Posttests in the Education and Control Groups
Number (%) Education Group (n=63) Control Group (n=65)
Rating of health Pretest Posttest Pretest Posttest Much worse 3^5) 1 (2) oTO) 0 ~ ( 0 ) ^ Worse 15 (24) 8(13) 12(19) 12(19) Same 26 (41) 38 (61) 33 (51) 37 (57) Better 17 (27) 13 (21) 20 (31) 15 (23) Much better 2_(3) 3_(5) 0(0) 1 (2)
3.5.4 Meal Patterns
Breakfast remained the most commonly skipped meal among the women while
dinner was the least. There were no significant changes in the meal patterns in
either the Education Group or the Control Group. There were also no significant
changes in the number of women having breakfast or lunch every day or skipping
breakfast daily (Tables 3.36 and 3.37). No significant changes was also seen in the
88

percentage of women who reported that they never had snacks, remaining at about
30%.
Table 3.36 Comparison between the mean number of days 土 S.D. per week of having breakfast, lunch and dinner, and the mean number of snacks 土 S.D per day between Pre- and Posttests in the Education and Control Groups
Education Group (n=63) Control Group (n=65) Meal Pretest Posttest Pretest Posttest
Breakfast (d/wk) 5.7 ± 2.2 5.8 ± 2.0 6.1 土 1.8 5.9 ±2.1 Lunch (d/wk) 6.6 ±1.1 6.4 ±1.3 6.5 土 1.3 6.6 ±1.1 Dinner (d/wk) 7.0 士 0.0 6.9 士 0.5 7.0 土 0.0 7.0 土 0.2 Snacks (per day) 1.5±1.7 1.1 ± 1.2 1.3±1.5 1.4±1.3
Table 3.37 Comparison between the number (%) of women who had breakfast every
day, skipped breakfast every day or had lunch every day between Pre- and Posttests
in the Education and Control Groups
Education Group (n^63) Control Group (n=65) Pretest Posttest Pretest Posttest
Ate breakfast daily 42 (67) 36 (57) 45 (69) 42 (65) Never ate breakfast 4 (6) 3 (6) 4 (6) 5 (8) Ate lunch daily 54 (86) 47 (75) 53 (82) 53 (82)
3.5.5 Nutrient Supplements Practices
There were no significant changes in the prevalence of taking nutrient supplements
regularly among the women in both groups between the Pre- and Posttests. Among
those who taking supplements, vitamin E was the most common supplement in either
group in the two assessments. The types of supplements that the women took are
listed in Table 3.38.
89

Table 3.38 The types of supplements taken in Pre- and Posttest in the Education and
Control Groups
Number (%) Education Group (n=63) Control Group (n=65)
Types of supplements Pretest Posttest Pretest Posttest None 45 (71) 41 (65) 61(94) 58 (89) Vitamin E 9(14) 11 (17) 3(5) 3(5) Calcium 5 (8) 5 (8) 1 (2) 1 (2) Vitamin(s) (unspecified) 6(10) 6(10) O (0) 1 (2) Vitamin B 1 (2) 2 (3) 2 (3) 2 (3) Vitamin C 4(6) 2 (3) 1 (2) 1 (2) F ish oil 2 (3) 2 (3) O (0) 1 (2) Manganese 1 (2) O (0) 1 (2) 1 (2) Protein powder 1(2) 2(3) 0(0) 0(0) Traditional Chinese 1 (2) 2 (3) 0 (0) O (0)
Medicine Others Q (0) 2 (3) Q (0) 1 (2)
3.5.6 Cooking Practices
There were again no significant changes in the proportion in using each type of oil in
both groups. Corn oil remained the most common cooking oil with more than half
of them women reported using it, followed by peanut oil, used by nearly half of the
surveyed women.
Both groups maintained the same rank for the common cooking methods for fish;
pork/beef; poultry and vegetables. The three most common cooking methods for
fish were steaming, frying and boiling. However, significant increase (尸<0.05) was
found in the Education Group in the proportion of using stir frying for fish (from 0%
to 8%). While in the Control Group, significant decrease (尸<0.05) was seen in the
proportion of using boiling for fish (from 34% to 17%).
No significant changes were observed in the proportion of women using different
cooking methods for pork/beef, poultry and vegetables in both groups. Stir frying,
boiling and steaming were remained the top three common cooking methods for
90

pork/beef. The top three cooking methods for poultry were steaming, grilling and
boiling, while stir frying and boiling were still the most common methods for
cooking vegetables.
3.5.7 Fat Removal Behavior
In assessing their fat removal behavior, there were no significant changes for meat
and poultry in the Education and Control Groups (Table 3.39).
Table 3.39 Comparison between the number (%) of women reported removing fat
from meat and removing skin from poultry between Pre- and Posttests in the
Education and Control Groups
Education Group Control Group (n=63) (n-65)
Food item Fat/skin removal Pretest Posttest Pretest Posttest Meat
Not remove any fat 1 (2) 1 (2) 8(12) 4 (6) Removed some fat 43 (68) 39 (62) 43 (66) 40 (62) Removed all fat 17 (27) 22 (35) 12 (19) 20 (31) Never consume meat 2 (3) 1 (2) 2 (3) 1 (2)
Poultry Not remove any skin 7 (11) 3(5) 10(15) 9 (14) Removed some skin 37 (59) 36 (57) 39 (60) 35 (54) Removed all skin 18 (29) 24 (38) 15 (23) 20 (31) Never consume poultry 1 (2) Q (Q) 1 (2) 1 (2)
3.5.8 Food Label Reading
The Posttest revealed that there was no significant change in the proportion of
women responsible for buying food for their families, with the proportion remaining
at more than 90% of the women in both groups. No significant changes were also
found in the frequency of reading food labels in the two groups. When asked about
the clarity of the food labels, although there was a 5% increase of women who
replied these were clear/very clear in the Education Group, whereas the same
percentage was seen for the Control Group. However, this change was not
significant for the two groups between Pre- and Posttests (Tables 3.40 and 3.41).
91

Table 3.40 Comparison between the number (%) of women reported reading the food
labels with different frequencies between Pre- and Posttests in the Education and
Control Groups Education Group (n=63) Control Group (n=65)
Frequency Pretest Posttest Pretest Posttest Never 4(6) 2(3) 4(6) 7(11) Sometimes 30 (48) 36 (57) 30 (46) 30 (46) Usually 14 (22) 10 (16) 18 (28) 14 (22) Each time 15 (24) 15 (24) 13 (20) 14 (22)
Table 3.41 Comparison between the distribution of the number (%) of women citing
different degrees of clarity of the food labels between Pre- and Posttests in the
Education and Control Groups Education Group Control Group
Clarity Pretest Posttest Pretest Posttest (n-59) (n=61) (n=61) (n=58)
Very unclear 1 (2) f (2 ) U 2 ) 0(0) Unclear 6(10) 9(15) 9(15) 7(12) So-So 49 (83) 45 (74) 46 (75) 47 (81) Clear 3(5) 5(8) 5(8) 4(7) Very clear 0_(0) \ J2) 0^0) O(Q)
92

3.5.9 Dietary Intake
a. From the Three-day Dietary Records
Totals of 58 and 43 women returned the dietary record in both Pre- and Posttests in
the Education and Control Groups respectively. No significant changes were
observed among any of the dietary components measured in either group from Pre-
to Posttests (Table 3.42).
Table 3.42 Comparison between the energy and nutrient intake data between Pre- and
Posttests in the Education and Control Groups Mean 土 S.D.
Education Group (n=58) Control Group (n=43) Diet component Pretest Posttest Pretest Posttest Energy (kcal) 1826.0 ±404.9 1777.6 ± 399.7 2036.3 ±492.4 2089.9 ± 572.9 Carbohydrate (g) 230.0 ± 61.9 223.8 ± 53.8 250.9 ± 61.4 270.7 ± 76.3 Protein (g) 72.8 ±19.8 72.0 ±19.7 79.2 ±21.6 81.3 ±29.5 Fat (g) 72.3 ± 22.6 70.7 ± 23.5 82.1 ± 29.3 80.1 ±31.4 SFA (g) 14.0 ±5.5 14.7 ±6.5 15.4 ±6.1 15.5 ±8.2 PUFA (g) 13.8 ±6.3 13.2 ±8.2 16.7 ±8.0 15.9 ±8.8 MUFA (g) 21.7 ±8.6 21.4 ± 9.0 25.5 ± 10.5 24.8 ±12.4 Cholesterol (mg) 230.0 ± 134.9 218.1 ± 126.5 233.9 ± 170.7 237.5 ±122.1 Fibre (g) 8.3 ± 5.2 8.1 ±5.4 9.8 ± 4.5 10.7 ±4 .8 Calcium (mg) 502.6 ± 300.1 438.0 ± 158.8 477.8 ± 148.5 481.9 ±163.9 Iron (mg) 15.9 ±15.3 18.5 ±16.6 14.8 ±5.7 15.4 ±7 .9 Sodium (mg) 1799.1 ± 856.1 1781.4 ± 857.1 1713.6 ± 595.5 1945.2 ± 867.4 Vitamin A (RE) 841.5 815.0 ± 654.2 967.2 ± 675.6 997.4 土 643.4
土 1 2 0 3 . 6
Vitamin C (mg) 142.8 ± 82.5 153.0 ±117.5 176.9 ±83.3 180.6 ±79.7 Vitamin E (mg) 8.4 ± 7.3 8.2 ±9.6 11.0 ±10.5 11.1 ±9.9
There were no significant changes in the percentages of women exceeding the
recommended percent energy from total fat, SFA, PUFA or MUFA in the two groups,
as is shown in Table 3.43. There were also no significant changes in the
percentages of women meeting the recommended intakes of selected nutrients in the
two groups (Table 3.44).
93

Table 3.43 Comparison between the number (%) of women exceeding the recommended percent energy from total fat, SFA, PUFA and MUFA between Pre-and Posttests in the Education and Control Groups
Education Group (n=58) Control Group (n=43) Percent of women Pretest Posttest Pretest Posttest With energy from total fat > 3 0 % 4 6 (79) 44 (76) 35 (81) 29 (67) With energy from SFA >10% 5 (9) 8 (14) 1 (2) 4 (9) With energy from PUFA >10% 5(9) 5(9) 2(5) 5 (12) With energy from MUFA >10% 28 (48) 36 (62) 27 (63) 21 (49)
Table 3.44 Comparison between the number (%) of women who met the
recommended intake levels of selected nutrients between Pre- and Posttests in the
Education and Control Groups Education Group (n=58) Control Group (n=43)
Nutrient Pretest Posttest Pretest Posttest Protein >70 g 32 (55) 26 (45) 27 (63) 26 (61) Cholesterol <300 mg 46 (79) 49 (85) 33 (77) 30 (70) Fibre >25 g O (0) 1 (2) 0 (0) 0 (0) Calcium >800 mg 6(10) 1 (2) 0 (0) 1 (2) Iron >12 mg 34 (59) 36 (62) 28 (65) 25 (58) Vitamin A >800 RE 19 (33) 23 (40) 22 (51) 25 (58) Vitamin C >60 mg 51 (88) 47 (81) 40 (93) 41 (95) Vitamin E >12 mg 7(12) 8(14) 9(21) 10(23)
b. From the Food Frequency Questionnaire
None of the food items in the food frequency questionnaire, except boiled egg,
showed significant changes. The Education Group women reported significantly
(尸<0.05) increased the frequency of consumption of boiled eggs (those who
consumed once or more per week was increased from 35 to 45%).
Also, the number of women who never consumed/not consumed dairy products such
as cheese and low fat yogurt in a typical week was decreased in the Education Group
after the intervention, implying that more women in the Education Group had tried to
consume those dairy products. While in the Control Group, the number of women
94

who never consumed/not consumed was remained nearly unchanged (Table 3.45).
Table 3.45 Comparison between the number (%) of women who reported never/rarely consuming specific dairy products in a typical week between Pre- and Posttests in the Education and Control Groups
Education Group (n=63) Control Group (n=65) Food item Pretest Posttest Pretest Posttest
Cheese 45 (71) 36 (57) 39 (60) 44 (68) Low-fat yogurt 54 (86) 48 (76) 50 (77) 53 (82) Whole milk 55 (87) 51(81) 42 (65) 49 (75) Skim milk 43 (68) 37 (59) 39 (60) 44 (68) High-calcium low-fat milk 32 (51) 22 (35) 34 (52) 35 (54)
3.5.10 Nutrition Knowledge
The mean Nutrition Knowledge Score increased significantly (^<0.001) in the
Education Group, from 7.4 in the Pretest to 9.8 in the Posttest (Table 3.46). No
significant change was seen in the Control Group. The increase in nutrition
knowledge showed no association with better body measurements, such as less
weight or blood cholesterol increase.
There was a significant increase (尸<0.001) in the number of people who had heard of
saturated fat in the Education Group, which increased from 46 to 83%. However,
there was no significant increase in the percentage in the Control Group who had
heard of saturated fat. The percentage of women who had heard of the food
pyramid increased significantly (^<0.001) in the Education Group from 79 to 100%,
whereas no significant increase was observed in the Control Group. The number of
the women who correctly answered the four layers' content of the food pyramid
increased from 20 to 35 (尸<0.001), while the number remained the same in the
Control Group.
95

Table 3.46 Comparison between the mean Nutrition Knowledge Score 士 S.D. and the
number (%) of women reported having heard of saturated fat or the food pyramid,
and who correctly matched all four food groups with their corresponding level of the
food pyramid between Pre- and Posttests in the Education and Control Groups Education Group (n=63) Control Group (n=65)
Nutrition knowledge questions Pretest Posttest Pretest Posttest Nutrition Knowledge Score 7.4 ±3.3 9.8 ±3.1*** 6.8 ± 3.7 6.7 ±3.1 Had heard of saturated fat 29 (46) 52 ( 8 3 ) " * 23 (35) 24 (37) Had heard of the food pyramid 50 (79) 6 3 ( 1 0 0 ” * * 44 (68) 48 (74) Correctly matched food 20 (32) 35 (56)*** 14 (22) 14 (22)
pyramid levels * * * 尸 < 0 . 0 0 1
The Education Group improved significantly (尸<0.05 or 尸<0.001) the proportion of
correct responses in five out of the ten additional nutrition knowledge questions
while the Control Group showed no significant changes in any of the questions
(Table 3.47). The other five questions, which were about cholesterol, protein,
frozen food, blood vessel hardening and colon cancer did not show any significant
changes in either group from Pre- to Posttests.
96

Table 3.47 Comparison between the number (%) of correct responses to the ten additional nutrition knowledge questions between Pre- and Posttests in the Education and Control Groups
Education Group Control Group (n=63) (n=65)
Nutrition knowledge questions Pretest Posttest Pretest Posttest Egg white has more saturated fat Correct 31 (49) 51 (81) 34 (52) 29 (45) than egg yolk. Incorrect 8 (13) 5(8) 9(14) 7(11) (E***) Don't know 24 (38) 7 (11) 22 (34) 29 (45) Skim milk has more saturated fat Correct 38 (60) 54 (86) 40 (62) 34 (52) than whole milk. Incorrect 6(10) 4(6) 8 (12) 8 (12) (E***) Don^t know 19 (30) 5 (8) 17 (26) 23 (35) Some foods contain a lot of fat b u t C o r r e c t 16 (25) 16 (25) 13 (20) 12 (18) no cholesterol. Incorrect 25 (40) 35 (56) 25 (38) 22 (34)
Doirt know 22 (35) 12 (19) 27 (42) 31 (48) High cholesterol food has a greater Correct 6 (10) 12(19) 7 (11) 5(8) effect than high saturated fat food on Incorrect 22 (35) 32 (51) 17 (26) 18 (28) raising blood cholesterol level. Don't know 35 (56) 19 (30) 41 (63) 42 (65) (E*) White bread has more fibre than Correct 52 (83) 60 (95) 48 (74) 51 (79) whole wheat bread. Incorrect 7 (11) 3(5) 6 (9) 6 (9) (E*) Doirt know 4(6) O(Q) 11(17) 8 (12) Whole milk contains more protein Correct 23 (37) 31 (49) 21 (32) 23 (25) than skim milk. Incorrect 20 (32) 17 (27) 19 (29) 25 (39)
DoiVt know 20 (32) 15 (24) 25 (39) 17 (26) Frozen foods have the same Correct 35 (56) 39 (62) 40 (62) 37 (57) nutrients as fresh foods. Incorrect 20 (32) 19 (30) 16 (25) 22 (34)
DoiVt know 8(13) 5(8) 9(14) 6(9) Eating a lot of sugars will cause Correct 14 (22) 29 (46) 16 (25) 17 (26) diabetes. Incorrect 42 (67) 31 (49) 42 (65) 42 (65) (E*) DoiVt know 7(11) 3(5) 7(11) 6(9) The hardening of blood vessel is Correct 3 (5) 4 (6) 3 (5) 3 (5) mainly caused by too much Incorrect 52 (83) 56 (89) 53 (82) 54 (83) cholesterol in your diet. Don^know 8(13) 3(5) 9(14) 8(12) A high fibre diet can help prevent Correct 51 (81) 58 (92) 52 (80) 54 (83) colon cancer. Incorrect 4 (6) 3 (5) 2 (3) 3 (5)
DoiVt know 8 (13) 2(3) 11 (17) 8 (12) E = Education Group
* 尸 < 0 . 0 5 , * * * 尸 < 0 . 0 0 1
Significant increases (尸<0.001) were seen in the proportion of women who correctly
identified the specific position of each food group in the food pyramid for all four
food groups in the Education Group only, but not in the Control Group (Table 3.48).
97

Nearly 90% of the women in the Education Group accurately stated that oils, fats,
salt and sugar belonged at the top layer of the food pyramid after the intervention.
The proportions who correctly identified the position increased a further 23%, 26%
and 23% for meats and dairy products, vegetables and fruits, and cereals,
respectively, in the Education Group.
Table 3.48 Comparison between the number (%) of women correctly matched the specific food group in the food pyramid between Pre- and Posttests in the Education and Control Groups
Education Group Control Group Food group Pretest Posttest Pretest Posttest
(n=63) (n=63) (n=65) (n-65) Oils, fats, salt and sugar 39 (62) 55 (87)*** 36 (55) 37 (57) Meats and dairy products 33 (52) 47 (75)*** 26 (40) 26 (40) Vegetables and fruits 21 (33) 37 (59)*** 18 (28) 16 (25) Cereals 26 (41) 40 (64)*** 20 (31) 20 (31)
* * * 尸 < 0 . 0 0 1
3.5.11 Physical Activity Habits
There was no change in the mean of the reported daily energy expenditure in the
Education Group. However, the Control Group's mean daily energy expenditure
decreased about 13% (from 1644.6 to 1424.6 kcal/day), which was a significant
(尸<0.05) drop from Pre- to Posttest (Table 3.49). The summary physical activity
index, which represented the general physical activity level from the women, did not
change significantly in either groups. Even though the mean number of flights of
steps climbed per day increased 2-fold (from 1.2 to 2.3 flights) in the Education
Group though, no significant changes were found in the mean number of flights of
steps the women climbed each day in either group. However, half of the women
still reported they had no stair climbing in the two groups in the Posttest.
98

Table 3.49 Comparison between the mean ± S.D. reported daily energy expenditure (kcal/day), summary physical activity index and number of flights of steps climbed per day between Pre- and Posttests in the Education and Control Groups
Education Group (n=63) Control Group (n=65) Pretest Posttest Pretest Posttest
Daily energy expenditure 1488.8 1467.6 1644.6 1424.6 (kcal/day) ± 664.8 ± 852.0 ±669.8 ± 604.3*
Summary physical activity index 32.4±19.5 28.6 ± 15.2 25.8 ± 16.3 26.8 ±15.7 Number of flights climbed per 1.2 土 2.4 2.3 ± 5.5 1.7 ±2.0 2.0 ±5.6
d a y * 尸<0.05 between Pre- and Posttests
The ranking and the time spent on each activity of the top ten frequent physical
activities in the Posttest remained nearly the same as the Pretest in both the
Education and Control Groups. Watching television, eating meals and reading were
the top three physical activities that the women did most during the day. Women
from both groups still spent about 2 hours per day watching television and about 1.5
hours per day having meals.
! 3.5.12 Physical Activity Knowledge
As for the mean Nutrition Knowledge Score, the mean Physical Activity Knowledge
Score increased significantly (P<0.001) in the Education Group from 5.9 to 8.9
whereas no significant increase was seen in the Control Group (Table 3. 50).
The percentage of women who had heard of the physical activity pyramid increased
significantly (尸<0.001) in the Education Group from 14 to 79%. However, there
was no significant change in the Control Group. Also, a significant increase
(尸<0.001) was noted in the number of women (from 1 to 13) who correctly answered
the content of the physical activity pyramid was observed in the Education Group.
While in the Control Group, the number decreased from three to two women,
99

although this change was not significant.
Table 3.50 Comparison between the mean Physical Activity Knowledge Score 土 S.D. and the number (%) of women reported having heard of the physical activity pyramid, and correctly matched all the physical activity groups with their corresponding level of the physical activity pyramid between Pre- and Posttests in the Education and Control Groups
Education Group Control Group (n=63) (n-65)
Physical activity knowledge Pretest Posttest Pretest Posttest questions Physical Activity Knowledge Score 5.9 ±2.1 8.9 ±2.1*** 5.7 ±2.8 6.0 ± 2.6 Had heard of the physical activity 9 (14) 50 (79)*** 13 (20) 14 (22)
pyramid Correctly matched physical activity 1 (2) 13 (21) *** 3 (5) 2 (3)
levels * * * 尸 < 0 . 0 0 1
The Education Group improved significantly (尸<0.05 or 尸<0.01) in four out of the
nine additional physical activity knowledge questions while the Control Group
showed no significant changes in any of the questions (Table 3.51). The other five I
questions, which were about diabetes, aerobic physical activity, physical activity
recommendations and fitness did not show any significant changes in the two groups
from Pre- to Posttest.
1 0 0

Table 3.51 Comparison between the number (%) of correct responses to the nine
additional physical activity knowledge questions between Pre- and Posttests in the Education and Control Groups
Education Group Control Group (n 二 63) (n=65)
Physical activity knowledge Pretest Posttest Pretest Posttest questions Regular physical activity decreases Correct 38 (60) 48 (76) 36 (55) 34 (52) the chance of adult-onset diabetes. Incorrect 12 (19) 5(8) 6(9) 10(15)
Dorftknow 13 (21) 10 (16) 23 (35) 21 (32) Regular physical activity increases Correct 48 (76) 57 (91) 46 (71) 49 (75) the chance of hypertension. Incorrect 7(11) 6(10) 10(15) 9(14) (E*) Don^ know 8(13) O (O) 9(14) 7(11) Regular physical activity decreases Correct 51 (81) 59 (94) 43 (66) 54 (83) the chance of osteoporosis. Incorrect 4(6) 3(5) 10 (15) 4(6) (E*) DoiVt know 8 (13) 1(1) 12 (19) 7(11) Both continuous (one 30-min Correct 38 (60) 40 (64) 33 (51) 42 (65) session) and intermittent (three 10- Incorrect 2(3) 13 (21) 8 (12) 6(9) min sessions) aerobic physical Doirt know 23 (37) 10 (16) 24 (37) 17 (26) activity can build cardiovascular fitness. (E**) Aerobic physical activities are the Correct 50 (79) 62 (98) 49 (75) 49 (75) most effective ones in developing Incorrect 0(0) 0(0) 2(3) 0(0) cardiovascular fitness. Don't know 13 (21) 1(2) 14 (22) 16 (25) (E**) Aerobics is one kind of aerobic Correct 49 (78) 55 (87) 41 (63) 42 (65) physical activity. Incorrect 2(3) 0(0) 6 (9) 4 (6)
Dorf tknow 12 (19) 8 (13) 18 (28) 19 (29) The recommended duration for each Correct 9(14) 7 (11) 15(23) 10(15) session of physical activity is 10 Incorrect 41 (65) 51 (81) 41 (63) 47 (72) m i n s - DoiVt know 13 (21) 5(8) 9(14) 8 (13) The recommended frequency for Correct 16 (25) 20 (32) 18 (28) 24 (37) physical activity is at least once per Incorrect 36 (57) 39 (62) 34 (52) 34 (52) w e e k . Doirt know 11 (18) 4(6) 13 (20) 7(11) Physical activity must be hard Correct 48 (76) 54 (86) 49 (75) 53 (82) enough to require more exertion than Incorrect 5 (8) 5 (8) 5 (8) 3 (5) normal to produce gains in health- Doirl know 10(16) 4(6) 11(17) 9(14) related fitness.
E = Education Group
* 尸 < 0 . 0 5 , * * 尸 < 0 . 0 1
Significant increases (?<0.001) were found in the proportion of women who
correctly identified the specific position of physical activity group in the physical
activity pyramid for all the four physical activity groups in the Education Group only,
101

but not in the Control Group (Table 3.52). Seventy-percent of women in the
Education Group accurately stated that rest/inactivity was in the top layer of the
physical activity pyramid in the Posttest. For the other three levels, significant
increases in the proportion of correct responses in the Education Group.
Table 3.52 Comparison between the number (%) of women correctly matched the
specific physical activity group in the physical activity pyramid between Pre- and
Posttests in the Education and Control Groups
Education Group Control Group Physical activity group Pretest Posttest Pretest Posttest
(n=63) (n-63) (n=65) (n-65) Rest/inactivity 8 (13) 45 (69)*** 10 (15) 12 (18) Exercise for flexibility and 2(3) 15 (23)*** 5(8) 4(6)
muscular strength Aerobic and active sports 4 (6) 24 (37)*** 6 (9) 3 (5) Lifestyle physical activity 2 (3) 23 (35)*** 6 (9) 3 (5) * * * 尸 < 0 . 0 0 1
As the Education Group significantly improved their nutrition knowledge and
physical activity knowledge after the intervention, analysis was made by education 1
level and age group to investigate whether any subgroups of women had made better
improvement.
3.5.13 Analysis of the Changes by Education Level
When the Education Group was divided into four education levels (incomplete
primary; complete primary; lower secondary and upper secondary), no association
was found between the education level and any of the body parameter changes. The
mean Nutrition Knowledge Score was significantly increased (P<0.05 or P<0.01),
for all the education level groups, except for those of lower secondary level. The
women in complete primary education had the greatest increase while those in lower
secondary had the least increase (Table 3.53).
102

All the education levels increased the proportion who had heard of saturated fat.
Significant changes were seen in three education levels: complete primary ^<0.01) ,
lower secondary (尸<0.05) and upper secondary (尸<0.05). All the women, no
matter what their education level, replied that they had heard of the food pyramid in
the Posttest. Significant increases were observed in two education levels:
incomplete primary (尸<0.05) and lower secondary (尸<0.01).
Women at all the education levels had significantly increased (^<0.05, P<0.01 or
?<0.001) their mean Physical Activity Knowledge Score. The greatest increase
was found in complete primary while the least increase was seen in incomplete
primary. Moreover, significant increases (尸<0.05,尸<0.01 or �< 0 . 0 0 1 ) were
observed in all the education level groups with regard to the proportion who had
heard of the physical activity pyramid. The increase in the percentage of women
ranged from four-fold for upper secondary education (from 15% to 62%) to seven-
fold for complete primary education (from 14% to 93%). However, education level
showed no associations with the changes of proportion who could correctly fill in the
food and physical activity pyramids, and the stages of change in behavior.
103

Table 3.53 Comparison between the mean Nutrition and Physical Activity
Knowledge Scores 土 S.D., and the number (%) who had heard of saturated fat, the
food pyramid and the physical activity pyramid of Education Group's women of
different education level between Pre- and Posttests Education level Pretest Posttest Incomplete primary (n=13)
Nutrition Knowledge Score 5.7 ± 3.3 7.8 ± 2.8* Had heard of saturated fat 5 (39) 9 (69) Had heard of the food pyramid 8 (62) 13 (100)* Physical Activity Knowledge Score 5.7 土 2.0 8.0 士 2.0* Had heard of the physical activity pyramid 2(15) 10 (77)**
Complete primary (n=14) Nutrition Knowledge Score 6.6 土 2.8 10.1 土 3.0** Had heard of saturated fat 3 (21) 10(71)** Had heard of the food pyramid 13 (93) 14 (100) Physical Activity Knowledge Score 5.4 ±2.2 8.9 ±2.1** Had heard of the physical activity pyramid 2(14) 13 (93)***
Lower secondary (n:22) Nutrition Knowledge Score 7.9 ±3.6 9.6 ±3.4 Had heard of saturated fat 11 (50) 19 (89)* Had heard of the food pyramid 16 (73) 22 (100)** Physical Activity Knowledge Score 5.9 ± 2.2 8.7 ±2.0*** Had heard of the physical activity pyramid 3(14) 18 (82)***
Upper secondary (n=13) Nutrition Knowledge Score 8.8 ± 2.5 11.7 ±1.4** Had heard of saturated fat 9 (69) 13 (100)* Had heard of the food pyramid 12 (92) 13 (100) Physical Activity Knowledge Score 6.5 ±2.1 9.8 ±2.3** Had heard of the physical activity pyramid 2(15) 8 (62)*
* 尸 < 0 . 0 5 , * * 尸 < 0 . 0 1 , * * * 尸 < 0 . 0 0 1
3.5.14 Analysis of the Changes by Age Group
When the Education Group was divided into two age groups, 30-39 years and 40-50
years, no association was found between age and any of the body parameter changes.
Both age groups' mean Nutrition Knowledge Score increased significantly ( ^ 0 . 0 5
or 尸<0.001) in the Posttest (Table 3.54). Significant increases (尸<0.01) were
obtained in both age groups with respect to the proportion who had heard of
saturated fat, resulting in more than 80% of the women had heard of it. Significant
increase (尸<0.001) was only observed in age group 30-39 years in the proportion
104

who had heard of the food pyramid.
The mean Physical Activity Knowledge Score increased significantly (尸<0.001) in
both age groups. Significant (尸<0.001) and tremendous increases were observed in
both age groups in the proportion of women who had heard of the physical activity
pyramid. The proportion increased from 0 to 72% in age group 30-39 years and
from 20 to 82% in age group 40-50 years. Nevertheless, as like education level, age
group showed no effects on the changes of proportion who could correctly fill in the
food and physical activity pyramids, and the stages of change in behavior.
Table 3.54 Comparison between the mean Nutrition and Physical Activity
Knowledge Scores 土 S.D., and the number (%) who had heard of saturated fat, the
food pyramid and the physical activity pyramid of Education Group's women of
different age group between Pre- and Posttests Education level Pretest Posttest 30-39 years (n=18)
Nutrition Knowledge Score 8.7 ± 2.6 10.2 ±3.1* Had heard of saturated fat 7 (39) 15 (83)** Had heard of the food pyramid 16 (89) 18 (100) Physical Activity Knowledge Score 6.3 士 1.2 9.0 士 2.0*** Had heard of the physical activity pyramid Q (Q) 13 (72)***
40-50 years (n=45) Nutrition Knowledge Score 6.9 ± 3.5 9.7 ±3.1*** Had heard of saturated fat 22 (49) 37 (82)** Had heard of the food pyramid 34 (76) 45 (100)*** Physical Activity Knowledge Score 5.7 ±2.3 8.8 ±2.2*** Had heard of the physical activity pyramid 9 (20) 37 (82)***
* 尸 < 0 . 0 5 , * * 尸 < 0 . 0 1 , * * * 尸 < 0 . 0 0 1
3.5.15 Intention and Confidence in Changing Behavior
Table 3.55 shows that significant change (尸<0.01) was found in the Education Group
only in stages of change in decreasing saturated fat consumption, in which less
women were in the precontemplation stage, resulting in more women were in the
action and maintenance stages in the Posttest. However, no significant changes in
105

stages of change in increasing fruit consumption, increasing vegetable consumption
or doing more physical activity were observed in both groups.
Education level and age did not demonstrate any association with changes in stages
of change in these behavior. Women in the maintenance stage of any of these four
behaviors had no significant differences in dietary and physical activity habits with
those in the earlier stages.
Table 3.55 Comparison between the stages of change of behavior between Pre- and
Posttests in the Education and Control Groups Number (0Zo) of women
Education Group (n=63) Control Group (n=65) Behavior Pretest Posttest Pretest Posttest Decreasing saturated fat intake (E**)
Precontemplation 35 (56) 14 (22) 46 (71) 47 (72) Contemplation 1 (2) 3 (5) 3 (5) 4 (6) Preparation 4(6) 11(17) 6 (9) 4 (6) Action 15 (24) 22 (35) 3 (5) 3 (5) Maintenance 8(13) 13 (21) 7(11) 7(11)
Increasing fruit intake Precontemplation 17 (27) 8 (13) 24 (37) 12 (19) Contemplation 3 (5) 1 (2) 3 (5) 5 (8) Preparation 15(24) 12(19) 8(12) 7(11) Action 14 (22) 20 (32) 7 (11) 12 (19) Maintenance 14 (22) 22 (35) 23 (35) 29 (45)
Increasing vegetable intake Precontemplation 8(13) 7(11) 19(29) 10(15) Contemplation 5 (8) 3 (5) 2 (3) 1 (2) Preparation 8 (13) 12(19) 5(8) 5 (8) Action 17 (27) 15 (24) 8 (12) 13 (20) Maintenance 25 (40) 26 (41) 31 (48) 36 (55)
Doing more physical activity Precontemplation 12(19) 7(11) 14 (22) 11(17) Contemplation 7(11) 6(10) 7(11) 14(22) Preparation 10(16) 14 (22) 17 (27) 14 (22) Action 11 (18) 14 (22) 13 (20) 10 (15) Maintenance 23 (37) 22 (35) 13 (20) 16 (25)
E = Education Group
* * 尸 < 0 . 0 1
106

3.5.16 Perceived Difficulties in Changing Behavior
Not many women reported difficulties in changing their behavior, except for doing
more physical activity. A slight increase in the number of people (from seven to
twelve) in the Education Group who said that they faced difficulties in decreasing
saturated fat intake was seen, as the attraction of the food was still the major problem
for the women. At the same time, the number of women who reported difficulties
in decreasing saturated fat intake in the Control Group was dropped a little (from six
to three), Table 3.56.
The number of women who reported difficulties in increasing fruit intake was nearly
the same in the Education Group while in the Control Group the number increased
from zero to six. A variety of difficulties were mentioned by the women, as is
shown in Table 3.56.
The main difficulty in increasing vegetable intake was dislike the texture/taste of
vegetables for the two groups. An increase in number was observed in the Control
Group for physical activity (from 15 to 20). Among all the difficulties, laziness was
the one most commonly mentioned by the women.
107

Table 3.56 Comparison between the difficulties reportedly encountered preventing different behavioral changes between Pre- and Posttests in the Education and Control Groups
Number of women Education Group (n=63) Control Group (n=65)
Behavior and difficulties Pretest Posttest Pretest Posttest Eating less saturated fat
Attraction of food 5 8 2 1 Pressure from families/friends 1 3 2 1 Feel hungry/no energy/ 1 2 2 1
uncomfortable Eating more fruit
No time 2 1 0 0 Cannot have food in some 1 0 0 0
occasions Lazy 2 1 0 1 Fear to be fat 1 1 0 0 Afraid of fertilizers 1 0 0 0 Can't eat when feel full 1 1 0 1 Feel discomfort 1 0 0 1 Dislike the taste 0 1 0 1 Expensive 0 1 0 1 Others 1 0 0 2
Eating more vegetables Dislike the texture/taste 0 3 1 1 Afraid of fertilizers 1 1 0 0 Feel full 0 1 0 0 Don't know how to cook 0 0 0 1
Doing more physical activity Lazy 12 13 5 3 No time 4 2 4 3 Feel tired because too 5 2 5 9
vigorous No company 1 3 1 5 Health problems 0 0 1 3 Can't perform some physical 1 3 0 3
activity actions/don't know how to do
Others 3 2 0 Q
108

3.5.17 Perceived Methods for Facilitating Behavior Change
The number of people who suggested methods for behavioral changes was not
changed greatly for any behavior, except for the number mentioning decreasing
saturated fat in the Education Group. The number in this case was increased from
16 to 36, and there were some new suggestions in the Posttest, for instance, healthy
cooking method and decreased frequency of eating out, which were new ideas were
not cited by the Control Group. Some new ideas were also seen in the Control
Group in the Posttest. The percentages of all the ideas mentioned were not changed
significantly in the two groups (Table 3.57).
Table 3.57 Comparison between the suggested methods for assisting different
behavioral changes between Pre- and Posttests in the Education and Control Groups Number of women
Education Group (n=63) Control Group (n=65) Behavior and methods Pretest Posttest Pretest Posttest Eating less saturated fat
Buy/cook fatty food less 2 5 2 2 frequently
Have healthy eating practices 16 18 4 5 Have healthy cooking practices O 6 0 0 Decrease frequency of eating out 0 3 0 0 Pay attention to eating habits and 2 1 0 0
food composition Self control/self remind 2 8 2 4 Cooperate with families 2 2 2 0 Others 0 1 3 l
Eating more fruits Buy more fruit 12 18 5 12 Have fruit as snacks 6 5 0 6 Remember the benefits of eating 1 2 1 0
more fruit Choose favorite/different types 6 4 6 4
of fruit Develop a habit of eating fruit 6 9 5 1 Eat less meat/dishes 3 2 6 3 Eat salad/assorted fruit basket 1 0 1 1 Others 4 6 2 5
109

Number of women Education Group (n=63) Control Group (n二65)
Behavior and methods Pretest Posttest Pretest Posttest Eating more vegetables
Buy/cook vegetables more 14 17 9 12 frequent
Eat less meats/dishes 8 9 7 2 Remember the benefits of eating 2 2 5 3
more vegetables Choose favorite vegetables 2 4 3 0 Develop a habit of eating 4 1 3 0
vegetables Modified cooking method 3 3 2 4 Others 1 4 0 3
Doing more physical activity Save more time for doing physical 5 7 5 5
activity Have company 6 9 2 5 Self encouragement/More will 8 9 8 5
power Develop an interest in doing 2 4 2 0
physical activity Remember the benefits of doing 8 6 8 4
physical activity Joined more physical activities 5 3 9 7 Want to lose weight 0 1 0 5 Try to incorporate physical 3 4 1 2
activity in daily activities/in different occasions
Others 3 3 5 4
3.5.18 Health Information Desired
More people replied that they would like to learn more about health in both groups in
the Posttest (Table 3.58). In the Education Group, an increase of the number of
women was seen in topics such as nutrition information and all-rounded information,
but a drop was seen in nutrition-related diseases. In the Control Group, increases
were observed in many topics, for example, nutrition information, all-rounded
information, women's health and nutrition-related diseases.
110

Table 3.58 Comparison between the interested topics which the women would like to
learn more between Pre- and Posttests in the Education and Control Groups Number
Education Group (n=63) Control Group (n=65) Health topics Pretest Posttest Pretest Posttest
Women's health 1 2 1 5 Nutrition-related diseases 9 2 8 11 Other diseases 2 1 1 3 Nutrition information 7 12 1 8 Dieting/Weight control 2 3 0 3 methods Physical activity information 2 1 0 1 All-rounded information 3 6 1 8 One's health status 4 4 5 3 Organ's functioning 2 0 2 2 Others 2 3 O Q
3.5.19 Areas of Health the Women Would Like to Improve
A little drop of the number of women was found in the Education Group who
reported aspects of health they would like to improve, while a little increase was seen
in the Control Group (Table 3.59). Increases in the number were observed in
'eating habits' and ‘physical activity habits' in both groups, together with a decrease
in areas such as improvements of joint/bone pain and relief of osteoporosis in the
Education Group. Other areas mentioned maintained nearly the same number of
women.
I l l

Table 3.59 Comparison between the aspects of health the women desired to improve
between Pre- and Posttests in the Education and Control Groups Number
Education Group (n=63) Control Group (n=65) Aspects of health Pretest Posttest Pretest Posttest
No improvements mentioned Eating habits (unspecified) 15 18 6 8 Physical activity habits 19 24 17 20
(unspecified) Lose weight 8 6 10 10
Get more rest 0 0 1 3 Improve mental health 4 4 1 1 Improve osteoporosis 4 1 1 0 Relieve joint/bone pain 2 1 4 5 Gain weight 0 0 2 2 Strengthen physical health 3 1 3 2 Improve hypertension 1 0 2 1 Improve high blood cholesterol 2 1 1 0 Benefit all parts of the body 3 0 4 0 Others 4 2 2 3
3.5.20 Summary Profile of Women at Posttest
The Pre- and Posttests comparisons showed that the intervention successfully
improved the nutrition knowledge and physical activity knowledge of the Education
Group. Education level and age seemed to have little association with these
changes. Nearly all the education and age groups made significant increases in the
nutrition knowledge variables.
However, increases in women's nutrition and physical activity knowledge did not
lead to a significant improvement in their eating and physical activity behavior or
their body measurements. No significant changes were seen in reported health
conditions, meal patterns, nutrient supplements, cooking practices, fat removal
behavior, food label reading, energy and nutrient intakes, stages of change in
increasing fruit and vegetable intakes, stages of change in doing more physical
activity.
112

Few significant changes were seen in both groups. Both groups increased the mean
fasting total blood cholesterol level. The Education Group increased the reported
frequency of consuming boiled eggs, and the stages of change in decreasing saturated
fat intake in which more women were classified in the action and maintenance stages
after the intervention. On the other hand, the Control Group decreased significantly
their daily energy expenditure, as revealed from a list of common physical activities.
The Posttest's findings showed that the intervention could increase knowledge
significantly in a short period of time, but behavioral changes may take more time to
do. Therefore, a Follow-up was taken after six months to observe the maintenance
of their knowledge level and to monitor any behavioral changes.
3.6 Participants' Evaluation of the Intervention Program
After the intervention, the Education Group was asked to complete an evaluation
questionnaire. Results showed that 70% of the women joined the program because
they would like to learn more about health (Table 3.60). However, only 25% of
them attended all six of the Saturday afternoon activities. One-third (38%) of them
attended five sessions, one-fifth (19%) attended four sessions, and the rest attended
either three (13%) or two (5%) sessions. Most of these women replied they had no
time to join all (Table 3.61). Sixty-eight percent of the women strongly
agreed/agreed that Saturday is the best time for organizing talks; 81% of them
strongly agreed/agreed school hall was the best venue for the talks; more than half
(60%) of them strongly agreed/agreed the slides used in talks were clear enough;
about two-thirds (65%) of them strongly agreed/agreed the layout or design of
pamphlets was good; most (87%) of them strongly agreed/agreed the content of
pamphlets was useful; and that the information given from the talks was practical
113

(87%) and easily understood (80%) (Table 3.62).
Table 3.60 Reasons for participating the program (n=63) Reasons Number (%)
To learn more about health 44 (70) To know one's health status and improve one's health 14 (22) As a women center's member to accompany friends 9(14) To obtain useful content 2 (3) No reason given 2 (3)
Table 3.61 Reasons for attending (n二 16)/not attending (n=47) all the activities Number (%)
Reasons for attending Learned more about health 11 (17) Content of the program was useful 1 (2) Enjoy group activity 1 (2) No idea/No reason 3 (5)
Reasons for not attending No time 36 (57) Other specific reasons like being sick, forgot to go, etc 11 (17)
Table 3.62 Ideas on the different aspects of the program (n=63) Number (%)
Strongly Agree Fair Disagree Strongly agree disagree
Saturday is the best time for 12(19) 31(49) 1 0 ( 1 6 ) 9 ( 1 4 ) 1 (2) organizing a series of talks
School hall was the best venue for 13 (21) 38 (60) 11 (18) 1 (2) 0 (0) delivering a series of talks
The slides used in the talks were clear 7 (11) 31 (49) 21 (33) 4 (6) 0 (0) The layout/design of the pamphlets 5 (8) 36 (57) 22 (35) 0 (0) 0 (0)
was good The content of the pamphlets was 5 (8) 50 (79) 8 (13) 0 (0) 0 (0)
useful The information given from the talks 9 (14) 46 (73) 8 (13) 0 (0) 0 (0)
was practical The information given in the talks 8 (13) 42 (67) 12 (19) 1 (2) 0 (0)
was easily understood
Eight-three percent of the women reported that they had told what they learnt to their
families and friends. Most of them had told diet information (23%) and physical
activity information (27%), other information included that about fat, saturated fat
and cholesterol (17%) and healthy eating behavior (12%) etc. Seventeen percent of
114

the women said they had not told the information to others because there was no
chance (36%) or it was difficult to express the messages (27%) etc, as is shown in
Tables 3.63 and 3.64.
Table 3.63 Information the women had told others (n=52) Information Number (0Zo)
Physical activity 16 (31) Diet 12(23) Fat, saturated fat and cholesterol 9 (17) Healthy eating behavior 6 (12) Healthy cooking demonstration 4 (8) All information 3 (6) The food pyramid 2 (4) Benefits and harms of food 2 (4) Others 3_(6)
Table 3.64 Reasons for not telling information to others (n=l 1) Reasons Number (%)
No chance 4 (36) Difficult to express 3 (27) Others 2(18) No idea/No reason 2(18)
When asked what they had learnt from the program, 25% replied information about
physical activity, 19% said information about food and nutrition, and 19% said
information about saturated, unsaturated fat, cholesterol and calories etc (Table 3.65).
All of them said they would recommend that others join similar health promotion
programs in the future because their friends can learn about health from the program
(38%), as is shown in Table 3.66.
115

Table 3.65 Information the women had learnt from the program (n=63) Topics Number (%)
Physical activity 16(25) Food and nutrition 12(19) Saturated/Unsaturated fat, cholesterol and calories 12(19) Health 7(11) Importance of healthy eating 7(11) Healthy eating behavior 7(11) Healthy eating 6 (10) Importance of physical activity 6 (10) Food pyramid 3 (5) Physical activity pyramid 3 (5) Paying attention to health 2 (3) Others 7 (11)
Table 3.66 Reasons for recommending others to join future health promotion
program (n=63) Reasons Number (%)
They can learn more health knowledge 24 (38) The program is useful 13 (21) Want others to be healthy 10 (16) No idea/No reason 16 (25)
The women were asked to give comments to improve the program. Forty-three
percent of them said there should be some improvements for the program, for
example, ten percent of them said the scheduling should be re-arranged, better not to
hold the classes on Saturday; ten percent of them pointed out that the program should
include more information; Eight percent of them said the program should be
shortened (Table 3.67).
Table 3.67 Improvements for the program (n=63) Reasons Number (%)
Better scheduling 6(10) More information/activities 6 (10) Shorten the time between sessions 5 (8) More active participation 4 (6) Reduce the number of sessions 2 (3) Others 6 (10)
116

One evaluation question asked the women if they made any changes in their eating
and physical activity behavior, and 87% of the women reported they had made
changes after the program. Thirty-seven percent of them reported reducing their
intakes of high fat/high saturated fat/high cholesterol/high sugar food, 35% of them
said they had done more physical activity and 19% had paid more attention to diet.
All of the changes are listed in Table 3.68. Thirteen percent of the women replied
they had not changed their behavior because they already followed a healthy diet and
physical activity patterns or else because it was difficult to change (Table 3.69).
Table 3.68 Behavioral changes after the program (n=63) Behavioral changes Number (%)
Ate less high fat/high saturated fat/high 23 (37) cholesterol/high sugar food
Did more physical activity 22 (35) Paid more attention to diet 12(19) Attempted to achieve healthy eating 8 (13) Ate more vegetables/fruits/cereals 6(10) Paid more attention to physical activity 5 (8)
Table 3.69 Reasons for not changing behaviors (n=63) Reasons Number (%)
Already paid attention to diet and physical activity 3 (5) Difficult to change diet/No will power to change 2 (2) No idea/No reason 3 (5)
117

3.7 Follow-up
3.7.1 General Participant Sociodemographic Description
Fifty-one women (63% of the Pretest) and 50 women (49% of the Pretest) in the
Education Group and Control Groups, respectively, attended the Follow-up
evaluation. No significant differences were found in any demographic
characteristics between the Education and Control Groups. There were also no
significant differences in the demographic characteristics between the dropouts and
the participants in the two groups, except that the mean age of those remaining in the
Education Group was significantly greater than that of the dropouts (43.8 ±5.0 years
Vs 40.2±4.7 years; ^ 0 . 0 5 ) . Comparisons were made between the Pretest and the
Follow-up evaluation, and the Posttest and the Follow-up evaluation. Analyses
were based on those who had completed the three assessments, that is, 51 women in
the Education Group and 50 women in the Control Group. However, only 43
women and 33 women in the Education Group and Control Groups, respectively,
completed the dietary record and 39 women in both groups took part in the
anthropometric measurements.
3.7.2 Anthropometry
No significant change was observed for the mean body weight in the Education
Group, while a significant increase (from 53.9 kg in Posttest to 55.4 kg in the
Follow-up;尸<0.05) was found in the Control Group. The mean BMI showed no
significant change in either group. However, a significant increase (?<0.001) was
seen in the mean percent body fat between the Pretest and the Follow-up in both the
Education and Control Groups (32.2% Vs 34.0% in the Education Group and 29.5%
Vs 31.1% in the Control Group). Additionally, significant increase was found in
the mean fasting blood cholesterol level in both groups. In the Education Group,
118

the mean value increased significantly (尸<0.05) from 4.4 mmol/L in the Pretest to
5.0 mmol/L in the Follow-up, however, the level was maintained from the Posttest to
the Follow-up. In the Control Group, however, the mean fasting blood cholesterol
level increased significantly (尸<0.001) in the Follow-up when compared with either
the Pretest or the Posttest.
Although there were changes in anthropometric parameters, there were no significant
changes in the distribution of women in different categories of BMI and percent body
fat. At the Follow-up, more than 60% and about half of the Education Group and
the Control Group respectively remained classified as overweight and obese. More
women were found to be over-fat (percent body fat greater than 27%) at the Follow-
up, a five percent and a twelve percent increase was seen in the Education and
Control Groups, respectively.
There was also no significant change observed in the distribution of women in
different fasting total blood cholesterol level categories in the Education Group only.
However, a significant change (尸<0.05) was found in the Control Group. The
percentage of women with desirable cholesterol level decreased from 92% in the
Pretest to 67% in the Follow-up, six months after the program. Table 3.70 shows
all the anthropometric data of the two groups.
119

Table 3.70 Comparison between physical measurement data, distributions of BMI
levels according to Asian definition, percent body fat levels and fasting total blood
cholesterol level levels of women between Pretest, Posttest and Follow-up in the
Education and Control Groups Mean 土 S.D.
Education Group (n=39) Control Group (n=39) Pretest Posttest Follow-up Pretest Posttest Follow-up
Weight (kg) 58.0 57.0 57.4 54.8 53.9 55.4 ±6.2 ±7.3 ±7.4 ±9.0 ±10.0* ±8.5
Height (cm) 156.0 155.7 155.9 155.3 155.3 155.4 ±4.6 ±4.6** ±4.5 ±5.0 ±5.0 ±4.9
BMI (kg/m2) 23.9 23.6 23.6 22.7 22.4 23.0 ±2.6 ±3.0 ±3.0 ±3.8 ±4.2 ±3.6
Percent body fat (%) 32.2 33.9 34.0 29.5 29.8 31.1 ± 5 . 2 * * * 土 7 . 0 ± 5 . 6 ± 7 . 2 * * * ± 7 . 7 ± 7 . 1
Fasting total blood 4.4 4.9 5.0 4.0 4.1 5.2 cholesterol level ±1.2* ±1.0 ±1.3 ± ! 2*** ± 1.4*** ±0.8 (mmol/L)
一 Number (%) BMI levels
Underweight 1(3) 2(5) 2(5) 5(13) 7(8) 3(8) Normal weight 13 (33) 11 (28) 11 (28) 18 (46) 15 (39) 18 (46) Overweight 14 (36) 13 (33) 15 (39) 5 (13) 8 (21) 8 (21) Obese 11 (28) 13 (33) 11(28) 11(28) 9 (23) 10 (26)
Percent body fat levels Below range 1 (3) 1 (3) 0 (0) 2 (5) 2 (5) 0 (0) Desirable range 5 (13) 4 (10) 4 (10) 16 (41) 15 (39) 13 (33) Above range 33 (85) 34 (87) 35 (90) 21 (54) 22 (56) 26 (67)
Fasting total blood cholesterol levels Desirable 29 (74) 26 (67) 24 (62) 36 (92)* 34 (87) 26 (67) Borderline 8 (21) 11(28) 11(28) 2 (5) 4 (10) 9 (23) High 2(5) 2(5) 4(10) 1(3) 1(3) 4(10)
* 尸<0.05 for difference between Pretest or Posttest and Follow-up by paired /-tests
** 尸<0.01 for difference between Pretest or Posttest and Follow-up by paired /-tests
*** 尸<0.001 for difference between Pretest or Posttest and Follow-up by paired l-
tests
1 2 0

3.7.3 Health Conditions Reported
No significant change was seen in the self-rated health in either the Education or
Control Group. A similar distribution of women in different rankings was observed
in the two groups (Table 3.71).
Table 3.71 Comparison between the self-rated health relative to that of peers between
Pretest, Posttest and Follow-up in the Education and Control Groups Number (%)
Education Group (n=51) Control Group (n=5Q) Rating of health Pretest Posttest Follow-up Pretest Posttest Follow-up Much worse 3 (6) 1 (2) 1 (2) O (O) O (O) O (O) Worse 10 (20) 7 (14) 8 (16) 11 (22) 9 (18) 7 (14) Same 22 (43) 31 (61) 28 (55) 25 (50) 29 (58) 30 (60) Better 14 (28) 10 (20) 13 (26) 14 (28) 11 (22) 12 (24) Much better 2 (4) 2 (4) 1 (2) 0 (0) 1 (2) 1 (2)
3.7.4 Meal Patterns
Regarding the women's eating frequencies of breakfast, lunch and dinner, no
significant changes were noted in the Education Group (Table 3.72). However, the
mean breakfast eating frequency was significantly increased (P<0.05) in the Control
Group from 6.1 士 1.8 days per week in the Posttest to 6.4 土 1.5 days per week in the
Follow-up. Lunch and dinner eating frequencies did not change significantly.
Referring to their snack eating frequency, a significant increase (尸<0.05) was noticed
in the Education Group in their mean snack eating frequency, from 1.2 times per day
in the Posttest to 1.6 times per day in the Follow-up, returning to nearly the same
level as in the Pretest. No significant change was found in the Control Group.
The proportion of women who had breakfast every day, skipped breakfast every day
or had lunch every day did not change significantly in both the Education and
Control Groups (Table 3.73).
1 2 1

Table 3.72 Comparison between the mean number of days 土 S.D. per week of having
breakfast, lunch and dinner, and the mean number of snacks 土 S.D. per day between
Pretest, Posttest and Follow-up in the Education and Control Groups Education Group (n=51) Control Group (n=50)
Meal Pretest Posttest Follow-up Pretest Posttest Follow-up Breakfast 5.6 ±2.3 5 .7±2.0 5.8±2.1 6 .2±1.6 6.1 土 6 .4±1.5 (d/wk) 1.8* Lunch 6.5 ±1 .2 6.4 ±1.3 6.5 ±1.3 6.5 ±1.1 6.6 ±1.1 6.2 ±1.8 (d/wk) Dinner 7.0 ± 0.0 6.9 ± 0.6 6.9 ± 0.8 7.0 ± 0.0 7.0 ± 0.3 7.0 ±0.1 (d/wk) Snacks 1.7±1.8 1.2±1.2* 1.6±1.7 1.6±1.6 1.5±1.4 1.5±1.7 (per day) * 尸<0.05 for Posttest and Follow-up by paired /-test
Table 3.73 Comparison between the number (%) of women who had breakfast every
day, skipped breakfast every day or had lunch every day between Pretest, Posttest
and Follow-up in the Education and Control Groups Education Group (n=51) Control Group (n:50)
Pretest Posttest Follow-up Pretest Posttest Follow-up Ate breakfast daily 34 (67) 30 (59) 31 (61) 36 (72) 33 (66) 38 (76) Never ate breakfest 3 (6) 2 (4) 3 (6) 2 (4) 2 (4) 1 (2) Ate lunch every daily 43 (84) 39 (77) 42 (82) 40 (80) 40 (80) 39 (78)
3.7.5 Nutrient Supplements Practices
No significant change was seen in the number of women who reported taking
nutrient supplements in both groups. Vitamin E was the most common type of
nutrient supplement the women taken in each assessment period in both the
Education Group and Control Groups (Table 3.74).
122

Table 3.74 The types of supplements taken in Pretest, Posttest and Follow-up in the
Education and Control Groups Number (%)
Education Group (n=51) Control Group (n=50) Type of supplement Pretest Posttest Follow-up Pretest Posttest Follow-up None 34 (67) 25 (49) 24 (47) 42 (84) 39 (78) 36 (72) Vitamin E 6(12) 10(20) 7(14) 3(6) 3(6) 3(6) Calcium 2(4) 4(8) 6(12) 1(2) 1(2) 2(4) Vitamin(s) 3 (6) 3 (6) 4 (8) 0 (0) 1 (2) 1 (2) (unspecified) Vitamin B 1 (2) 2 (4) 0 (0) 2 (4) 2 (4) 2 (4) Vitamin C 3 (6) 2 (4) 3 (6) 1 (2) 1 (2) 1 (2) Fish oil 0 (0) 1 (2) 1 (2) 0 (0) 1 (2) 2 (4) Manganese 0 (0) 0 (0) 1 (2) 1 (2) 1 (2) 1 (2) Protein powder 1 (2) 1 (2) 2 (4) 0 (0) 0 (0) 0 (0) Traditional Chinese 1 (2) 1 (2) 1 (2) 0 (0) 0 (0) 0 (0)
Medicine Others Q (0) 2 (4) 2 (4) Q (Q) 1 (2) 2 (4)
3.7.6 Cooking Practices
There were no significant changes in the proportion in using each type of oil in both
groups (Table 3.75). Canola oil (51%) became the most popular cooking oil in the
Follow-up in the Education Group, followed by corn oil (49%) and peanut oil (35%).
Whereas in the Control Group, corn oil (58%) and peanut oil (58%) remained the
first two most common types of cooking oils used, followed by canola oil (30%).
Table 3.75 Comparison between the number (%) of women in using the following
oils between Pretest, Posttest and Follow-up in the Education and Control Groups Education Group (n=51) Control Group (n=5Q)
Types of oil Pretest Posttest Follow-up Pretest Posttest Follow-up Corn oil 30 (59) 27 (53) 25 (49) 24 (48) 27 (55) 29 (58) Peanut oil 20 (39) 20 (39) 18 (35) 25 (50) 26 (53) 29 (58) Canola oil 25 (49) 23 (45) 26 (51) 11 (22) 13 (27) 15 (30)
Both groups maintained the same rank for the common cooking methods for fish;
pork/beef; poultry and vegetables (Table 3.76). The three most common cooking
methods for fish were steaming, frying and boiling. Significant decrease (尸<0.05)
123

was found in the Education Group in the proportion of using frying for fish (from
73% in the Pretest to 49% in the Follow-up). In the Control Group, a significant
decrease (尸<0.05) was seen in using stir frying for cooking fish (from 14% in the
Pretest to 2% in the Follow-up).
Significant decrease (尸<0.05) was observed in the Education Group only in using
deep frying for pork/beef (from 10% in the Pretest to zero in the Follow-up). Stir
frying, boiling and steaming were remained the top three common cooking methods
for pork/beef. The top three cooking methods for poultry were steaming, grilling
and boiling. Significant decrease (尸<0.05) was found in the Education Group only
in using deep frying for pork/beef (from 18% in the Pretest to 4% in the Follow-up).
Stir frying and boiling were still the most common methods for cooking vegetables.
However, the percentage of stir frying was decreased in the Education Group from
90% in the Pretest to 77% in the Follow-up, while at the same time, the percentage of
boiling was increased from 67% to 75%, though these changes were not significant.
In the Control Group, the percentage of boiling was increased from 64% in the
Pretest to 76% in the Follow-up while the percentage of stir frying was dropped a
little from 86% to 80%.
124

Table 3.76 Comparison between the number (%) of women in using the following
cooking methods for fish, pork/beef, poultry and vegetables between Pretest, Posttest
and Follow-up in the Education and Control Groups Food item Cooking Education Group (n=51) Control Group (n=50)
method Pretest Posttest Follow-up Pretest Posttest Follow-up Fish
Steaming 47 (92) 48 (94) 49 (96) 49 (98) 50 (100) 48 (96) Frying 37 (73)* 30 (59) 25 (49) 26 (52) 23 (46) 30 (60) Boiling 9 (18) 13 (26) 10 (20) 18 (36) 10 (20) 15 (30) Stir frying 0(0) 4(8) 2(4) 7(14)* 2(4) 1(2)
Pork/Beef Stir frying 28 (55) 29 (58) 32 (63) 37 (74) 36 (72) 33 (66) Boiling 27 (53) 24 (48) 28 (55) 22 (44) 17 (34) 23 (46) Steaming 20 (39) 21 (42) 25 (49) 18 (36) 20 (40) 22 (44) Deep frying 5 (10)* 1(2) Q(Q) 1(2) 4(8) 4(8)
Poultry Steaming 33 (65) 31 (62) 33 (65) 32 (64) 36 (72) 38 (76) Boiling 22 (43) 20 (40) 15 (29) 18 (36) 16 (32) 14 (28) Grilling 20 (39) 16 (32) 30 (39) 20 (40) 20 (40) 16 (32) Frying 2(4) 9(18)* 2(4) 10(20) 5(10) 5 (10)
Vegetables Stir frying 46 (90) 42 (84) 39 (77) 43 (86) 40 (80) 40 (80) Boiling 34 (67) 35 (70) 38 (75) 32 (64) 30 (60) 38 (76)
* 尸<0.05 for Pretest or Posttest and Follow-up
3.7.7 Fat Removal Behavior
In response to their fat removal behavior, no significant changes were seen in the
Education Group for meat and poultry. Similarly, no significant change was
observed in the Control Group for poultry. Unexpectedly, there was a significant
increase (尸<0.05) in the number of women in the Control Group who reported
removing all fat from meat before they consumed (Table 3.77).
125

Table 3.77 Comparison between the number (%) of women reported removing fat
from meat and removing skin from poultry between Pretest, Posttest and Follow-up
in the Education and Control Groups Food item and Education Group (n=51) Control Group (n=50) fat/skin removal Pretest Posttest Follow-up Pretest* Posttest Follow-up Meat Not remove any fat 1 (2) O (O) 1 (2) 4 (8) 2 (4) O (O) Removed some fat 33 (65) 33 (65) 31 (61) 35 (70) 31 (62) 28 (56) Removed all fat 15 (29) 17 (33) 19 (37) 11 (22) 17 (34) 22 (44) Never consume meat 2 (4) 1 (2) Q (Q) O (Q) O (Q) O (Q) Poultry Not remove any skin 7(14) 2(4) 2(4) 3(6) 3(6) 1(2) Removed some skin 27 (53) 31 (61) 38 (75) 34 (68) 28 (56) 25 (50) Removed all skin 16 (31) 18 (35) 11 (22) 13 (26) 19 (38) 24 (48) Never consume 1 (2) O (0) O (0) O (0) O (0) O (0) poultry
* 尸<0.05 for Pretest and Follow-up
3.7.8 Food Label Reading
No significant change was noted in either the Education or Control Group in their
habit of food label reading. Among those who read the food label, the proportion of
women who replied the label is clear was increased in the Education Group though
this was not significant. In the Control Group, there was also no significant change
regarding the clarity of the food label (Tables 3.78 and 3.79).
Table 3.78 Comparison between the number (%) of women reported reading the food
labels with different frequencies between Pretest, Posttest and Follow-up in the
Education and Control Groups Education Group (11=51) Control Group (n=5Q)
Frequency Pretest Posttest Follow-up Pretest Posttest Follow-up Never 4 (8) 2 (4) 1 (2) 3 (6) 3 (6) 3 (6) Sometimes 24 (47) 29 (57) 29 (57) 23 (46) 24 (48) 22 (44) Usually 8 (16) 7 (14) 12 (24) 15 (30) 10 (20) 13 (26) Each time 15 (29) 13 (26) 9 (18) 9 (18) 13 (26) 12 (24)
1 2 6

Table 3.79 Comparison between the distribution of the number (%) of women citing different degrees of clarity of the food labels between Pretest, Posttest and Follow-up in the Education and Control Groups
Education Group Control Group Clarity Pretest Posttest Follow-up Pretest Posttest Follow-up
(n=47) (n=49) (n=50) (n=47) (n=47) (n=47) Very unclear 1 (2) UT) 0^0) 0~(0) 0(0) 1 (2) Unclear 4(9) 7(14) 5 (10) 6(13) 6(13) 4(9) So-So 39 (83) 35 (71) 38 (76) 37 (79) 37 (79) 38 (81) Clear 3(6) 5 (10) 7(14) 4(9) 4(9) 4(9) Very clear Q (Q) 1 (2) Q (Q) Q (0) 0 (0) Q (Q)
3.7.9 Dietary Intake
a. From the Three-Day Dietary Records
None of the energy or nutrient intakes showed significant changes, except for the
mean total fat intake in the Education Group which significant decreased (尸<0.05)
from 72.8 g in the Posttest to 66.3 g in the Follow-up, as is shown in Table 3.80.
127

Table 3.80 Comparison between the energy and nutrient intake data between Pretest,
Posttest and Follow-up in the Education and Control Groups Mean 土 S.D.
Education Group (n=43) Control Group (n=33) Diet component Pretest Posttest Follow-up Pretest Posttest Follow-up Energy (kcal) 1809.2 1806.9 1719.1 2037.7 2150.5 1994.7
±423.4 ± 399.5 ±439.6 ± 526.7 ±617.5 ± 392.8 Carbohydrate (g) 231.5 226.1 210.5 253.0 275.6 257.1
±64.4 土 51.8 ±59.1 ±63.7 士 80.0 ±55.7 Protein (g) 71.5 72.7 75.4 78.8 84.7 84.1
±22.0 ±20.3 ±25.4 ±22.4 ±31.1 ±26.4 Fat (g) 70.6 72.8 66.3 82.4 82.7 72.8
± 2 3 . 4 ± 2 3 . 9 * ± 2 1 . 0 ± 3 1 . 7 土 3 4 . 5 ± 1 8 . 3
SFA (g) 13.2 ±5.7 14.6 ±6.5 12.9 ±5.0 14.8 ±6.1 16.1 ±9.0 13.9 ±5.2 PUFA (g) 13.2 ±6.2 13.9 ±8,9 12.3 ±5.2 17.2 ±8.8 17.2 ±9.5 15.0 ±7.8 MUFA (g) 20.6 土 9.3 21.9 土 9.2 20.7 土 8.0 24.9 土 10.6 25.7 土 13.6 22.2 土 7.9 Cholesterol (mg) 233.4 227.6 206.0 233.8 239.7 218.9
±147.3 ±138.9 ±102.7 ±191.0 ±125.9 ±112.9 Fibre (g) 8.2 ± 4.9 7.9 ±5.0 7.7 ± 4.7 9.6 士 4.3 10.7 ± 5.0 9.9 ± 4.5 Calcium (mg) 465.4 429.0 466.9 487.6 505.4 532.6
±257.8 ±149.3 ±189.8 ±156.1 ±162.8 ±236.4 Iron (mg) 16.2 19.6 15.4 14.9 16.5 17.5
±17.4 ±18.4 ±12.9 ±5.9 ±8.7 ±9.9 Sodium (mg) 1827.0 1942.6 1701.4 1681.66 1901.9 1726.7
± 897.3 ± 865.0 ±571.5 ± 584.8 ±902.3 ± 573.4 Vitamin A (RE) 835.1 772.6 870.9 999.9 956.9 1052.2
±1385.0 土 593.4 士 573.2 ± 738.0 ±561.0 ±905.8 Vitamin C (mg) 134.4 140.6 160.7 180.0 180.1 214.2
±89.8 ±113.1 ±100.1 ±84.5 士 82.1 ±130.8 Vitamin E (mg) 7.5 士 6.3 8.9 ±10.9 7.4 ±5.5 11.6 ±11.8 11.9 ±11.2 9.9 ±10.5 * 尸<0.05 for Posttest and Follow-up by paired /-test
When the women's fat intakes were classified according to the recommendation, no
significant change was seen for the total fat, SFA or PUFA in both the Education
Group and Control Groups (Table 3.81). Whereas few of them exceeded the
recommended intake amount for SFA and polyunsaturated, however, more than 70%
of the women exceeded the recommended intake amount for total fat. Moreover,
only the Education Group significantly increased (尸<0.05) the proportion of women
exceeding the recommended intake amount for MUFA between the Pretest and the
Follow-up (37% to 65%).
128

Table 3.81 Comparison between the number (%) of women exceeding the recommended percent energy from total fat, SFA, PUFA and MUFA between Pretest Posttest and Follow-up in the Education and Control Groups
Education Group (n=43) Control Group (11=33) Percent of women Pretest Posttest Follow-up Pretest Posttest Follow-up With energy from total fat >30% 32 (74) 34 (79) 34 (79) 26 (79) 21 (64) 24 (73) With energy from SFA >10% 3(7) 5 (12) 1(2) O(O) 4(12) 2(6) With energy from PUFA >10% 3(7) 5 (12) 1(2) 2(6) 4(12) 2(6) With energy from MUFA >10% 16 (37)* 28 (65) 28 (65) 20 (61) 16 (49) 14 (42)
* 尸<0.05 for Pretest and Follow-up
With regard to other nutrients, no significant changes were observed for the
proportion of women meeting the recommended intakes in the Education Group.
On the other hand, in the Control Group only, a significant decrease (/^0.05) was
found for the proportion of women having cholesterol intake less than 300 mg while
a significant increase (尸<0.05) was noted for the proportion of women meeting the
recommended intake of calcium (>800 mg) (Table 3.82).
Table 3.82 Comparison between the number (%) of women who met the
recommended intake levels of selected nutrients between Pretest, Posttest and
Follow-up in the Education and Control Groups Education Group (n:43) Control Group (n=33)
Nutrient Pretest Posttest Follow-up Pretest Posttest Follow-up Protein >70 g 21 ( 4 9 ) 2 1 ( 4 9 ) 2 4 ( 5 6 ) 2 0 ( 6 1 ) 20 ( 6 1 ) “ “ 2 3 (70) Cholesterol <300 mg 10 (23) 8 (19) 9 (21) 8 (24) 11 (33)* 4 (12) Fibre >25 g 0(0) 1 (2) 0 (0) 0 (0) 0 (0) 0 (0) Calcium >800 mg 3(7) 0(0) 2(5) 0(0)* 1(3) 5 (15) Iron >12 mg 26 (61) 29 (67) 21(49) 21(64) 22 (67) 22 (67) Vitamin A >800 RE 11 (26) 15 (35) 19 (44) 16 (49) 20 (61) 16 (49) Vitamin C >60 mg 36 (84) 33 (77) 36 (84) 31 (94) 31 (94) 33 (100) Vitamin E >12 mg 4(9) 7(16) 9(14) 7(21) 10(30) 6(18)
* P<0.05 for Pretest/Posttest and Follow-up
b. From the Food Frequency Questionnaire
Among the sixty food items listed in the food frequency table, only a few of them
showed significant changes. In the Education Group, the proportion of women who
never consumed/not consumed evaporated milk in the typical week significantly
129

decreased (尸<0.05) from 77% in the Posttest to 53% in the Follow-up. Similarly,
the proportion of women who never consumed/not consumed no-cream cake
significantly decreased (?<0.05) from 67% in the Pretest to 51% in the Follow-up.
Nevertheless, the proportion of women who consumed candy and chocolate once or
more per week significantly increased 24% and 16% (尸<0.05) respectively in the
Follow-up when compared with the Pretest.
In the Control Group, significant changes were only seen for soft drinks and fried
dim sum consumption. The proportion of women who consumed soft drinks once
or more per week significantly decreased from 54% to 42% (尸<0.05) in the Follow-
up when compared with the Posttest. However, the proportion of women who
consumed fried dim sum three times or more per week significantly increased from
18% to 26% (尸<0.05) in the Follow-up when compared with the Pretest.
The Education Group increased their consumption in wheat bread together with some
of the dairy products such as cheese, low-fat yogurt, skim milk and high-calcium
low-fat milk. From the Pretest to the Follow-up, the proportions of women who
did not consumed these products in a typical week decreased, but these changes were
not significant (Table 3.83).
Table 3.83 Comparison between the number (%) of women who reported
never/rarely consuming wheat bread and specific dairy products in a typical week
between Pretest, Posttest and Follow-up in the Education and Control Groups Education Group (n=51) Control Group (n=50)
Food item Pretest Posttest Follow-up Pretest Posttest Follow-up Wheat bread 30 (59) 20 (39) 22 (43) 18 (36) 20 (40) 24 (48) Cheese 38 (75) 30 (59) 34 (67) 29 (58) 31 (62) 39 (78) Low-fat yogurt 46 (90) 40 (78) 42 (82) 38 (76) 40 (80) 44 (88) Skimmilk 36 (71) 29 (57) 31 (61) 29 (58) 31 (62) 31 (62) High-calcium low-fat milk 28 (55) 18 (35) 20 (39) 27 (54) 26 (52) 22 (44)
130
3.7.10 Nutrition Knowledge
The mean Nutrition Knowledge Score (Figure 3.1) increased significantly between
the Pretest and the Follow-up in the Education Group (7.3 Vs 9.9;尸<0.001). The
score was maintained between the Posttest and the Follow-up (10.1 Vs 9.9).
Unexpectedly, the mean Nutrition Knowledge Score also increased significantly in
the Control Group between the Pretest and the Follow-up (7.4 Vs 8.2;尸<0.05) and
between the Posttest and the Follow-up (7.0 Vs 8.2;尸<0.001).
When asked if they had heard of saturated fat, a significant increase (尸<0.01) in
positive responses was found in the Education Group only, from 45% in the Pretest
to 71% in the Follow-up (Table 3.84). Concerning the food pyramid, a significant
increase was found in the Education Group only. Ninety-eight percent of the
women in the Follow-up had heard of the food pyramid, compared with about 80%
in the Pretest (尸<0.01). Besides, among those who had heard of the food pyramid,
the proportion of women who could correctly matched all the food groups with the
levels of the food pyramid also increased significantly in the Education Group only
(33% Vs 57%;尸<0.01).
131

12
驾 a
I 10 ——— ±—— W) O
rT-J (S ’ ^ ^ mi 1 ‘ ‘ -
S _ � • b,c J 4 — F = = = = ^ , : , A Education Group o
» <-H
B 2 Control Group Z
Q 1 1 1 1 1 I I I
0 1 2 3 4 5 6 7 8 9 Time (months)
a 尸<0.001 for Pretest and Follow-up by paired /-test
V<0.05 for Pretest and Follow-up by paired /-test
P<0.001 for Posttest and Follow-up by paired /-test
Figure 3.1 Changes in Nutrition Knowledge Score between Pretest, Posttest and Follow-up in the Education and Control Groups
Table 3.84 Comparison between the number (%) of women reported having heard of
saturated fat or the food pyramid, and who correctly matched all four food groups
with their corresponding level of the food pyramid between Pretest, Posttest and
Follow-up in the Education and Control Groups Nutrition knowledge Education Group (n二51) Control Group (n=50) questions Pretest Posttest Follow-up Pretest Posttest Follow-up Had heard of 23 (45)** 41(80) 36 (71) 19 ( 3 8 ) 1 7 (34) 19 (38)
saturated fat Had heard of the food 40 (78)** 51 (100) 50 (98) 38 (76) 38 (76) 42 (84)
pyramid Correctly matched 17 (33)** 27 (53) 29 (57) 12 (24) 12 (24) 11 (22)
food pyramid levels
** 尸<0.01 for Pretest and Follow-up
Responses to nine out of the ten additional nutrition knowledge questions improved
in the Education Group, in which a significant increase (户<0.05) of correct responses
occurred for one question concerning saturated fat. However, most of the women
still thought incorrectly that the hardening of blood vessel is mainly caused by too
132

much cholesterol in diet, this resulted in only 10% of the Education Group could
correctly answer this question. In the control Group, no significant changes were
observed in any of the nutrition knowledge questions (Tables 3.85 and 3.86).
Table 3.85 Comparison between the number (%) of correct responses to the ten
additional nutrition knowledge questions between Pretest, Posttest and Follow-up in
the Education Group Education Group (n=51)
Nutrition knowledge questions Pretest Posttest Follow-up Egg white has more saturated fat than Correct 26 (51) 42 (82) 40 (78) egg yolk.* Incorrect 5 (10) 3 (6) 1 (2)
Dorftknow 20 (39) 6 (12) 10 (20) Skim milk has more saturated fat than Correct 30 (59) 44 (86) 39 (77) whole milk. Incorrect 4(8) 3(6) 5 (10)
Don't know 17(33) 4(8) 7(14) Some foods contain a lot of fat but no Correct 13 (26) 12 (24) 12 (24) cholesterol. Incorrect 19 (37) 27 (53) 27 (53)
Don't know 19 (37) 12 (24) 12 (24) High cholesterol food has a greater Correct 5(10) 7(14) 11 (22) effect than high saturated fat food on Incorrect 17 (33) 27 (53) 22 (43) raising blood cholesterol level. Doirt know 29 (57) 17 (33) 18 (35)
White bread has more fibre than whole Correct 40 (78) 48 (94) 43 (84) wheat bread. Incorrect 7(14) 3 (6) 5(10)
Don't know 4(8) Q(O) 3 (6) Whole milk contains more protein Correct 16 (31) 24 (47) 27 (53) than skim milk. Incorrect 19 (37) 13 (26) 13 (26)
Don't know 16(31) 14 (28) 11 (21) Frozen foods have the same nutrients Correct 26 (51) 31 (61) 33 (65) as fresh foods. Incorrect 17 (32) 15 (29) 16 (31)
DoiVt know 8(16) 5 (10) 2(4) Eating a lot of sugars will cause Correct 11 (22) 25 (49) 21 (41) diabetes. Incorrect 33 (65) 23 (45) 23 (45)
DoiVt know 7(14) 3(6) 7(14) The hardening of blood vessel is Correct 3 (6) 4 (8) 5 (10) mainly caused by too much Incorrect 41(80) 44 (86) 43 (84) cholesterol in your diet. DoiVt know 7(14) 3(6) 3(6) A high fibre diet can help prevent Correct 39 (77) 46 (90) 45 (88) colon cancer. Incorrect 4 (8) 3 (6) 2 (4)
Don't know 8 (16) 2(4) 4(8) * 尸<0.05 for Pretest and Follow-up
133

Table 3.86 Comparison between the number (%) of correct responses to the ten additional nutrition knowledge questions between Pretest, Posttest and Follow-up in the Control Group
Control Group (n=50) Nutrition knowledge questions Pretest Posttest Follow-up Egg white has more saturated fat than Correct 29 (58) 23 (46) 33 (66) egg yolk. Incorrect 7(14) 4(8) 2(4)
DoiVt know 14 (28) 23 (46) 15 (30) Skim milk has more saturated fat than Correct 33 (66) 26 (52) 34 (68) whole milk. Incorrect 5 (10) 5 (10) 3 (6)
DoiVt know 12 (24) 19 (38) 13 (26) Some foods contain a lot of fat but no Correct 11 (22) 9 (18) 15 (30) cholesterol. Incorrect 22 (44) 20 (40) 18 (36)
Dorft know 17 (34) 21 (42) 17 (34) High cholesterol food has a greater Correct 6 (12) 4(8) 6 (12) effect than high saturated fat food on Incorrect 14 (28) 13 (26) 17 (34) raising blood cholesterol level. Don't know 30 (60) 33 (66) 27 (54) White bread has more fibre than whole Correct 38 (76) 40 (80) 43 (86) wheat bread. Incorrect 4(8) 4(8) 4(8)
Doirt know 8(16) 6(12) 3(6) Whole milk contains more protein Correct 10 (20) 19 (38) 21 (42) than skim milk. Incorrect 14 (28) 20 (40) 14 (28)
Doirt know 18 (36) 11 (22) 15 (30) Frozen foods have the same nutrients Correct 33 (66) 30 (60) 37 (74) as fresh foods. Incorrect 11 (22) 16 (32) 10 (20)
Dorftknow 6(12) 4(8) 3(6) Eating a lot of sugars will cause Correct 15 (30) 15 (30) 18 (36) diabetes. Incorrect 32 (64) 32 (64) 25 (50)
DoiVt know 3(6) 3(6) 7(14) The hardening of blood vessel is Correct 3 (6) 3 (6) 2 (4) mainly caused by too much Incorrect 43 (86) 43 (86) 45 (90) cholesterol in your diet. Doirt know 4 (8) 4 (8) 3 (6) A high fibre diet can help prevent Correct 41 (82) 43 (86) 45 (90) colon cancer. Incorrect 2 (4) 1 (2) 1 (2)
Doirt know 7(14) 6 (12) 4(8)
The proportion of correct responses for each of the four layers in the food pyramid
significantly increased (尸<0.01) in the Education Group. On the other hand, none
of the variables concerning the food pyramid showed significant changes in the
Control Group (Table 3.87).
134

Table 3.87 Comparison between the number (%) of women correctly matched the
specific food group in the food pyramid between Pretest, Posttest and Follow-up in
the Education and Control Groups Education Group (n=51) Control Group (n=50)
Food group Pretest Posttest Follow-up Pretest Posttest Follow-up Oils, fats, salt and 31 (61)** 44 (86) 43 (84) 31 (62) 29 (58) 33 (66)
sugar Meats and dairy 28 (55)** 38 (75) 37 (72) 22 (44) 21 (42) 29 (58)
products Vegetables and 18 (35)** 29 (57) 31 (61) 16 (32) 14 (28) 13 (26)
fruits Cereals 21 (41)** 31 (61) 32 (63) 17 (34) 17 (34) 18 (36) ** 尸<0.01 for Pretest/Posttest and Follow-up
3.7.11 Physical Activity Habits
Table 3.88 shows that no significant change in the mean reported daily energy
expenditure or the summary physical activity index was found in the Education
Group. However, a significant decrease was noted in the Control Group between
the Pretest and the Follow-up (1666 kcal/day Vs 1466 kcal/day;尸<0.05).
Additionally, significant increase in the summary physical activity index was
observed in the Control Group (28.0 in the Pretest Vs 37.5 in the Follow-up;尸<0.05,
27.1 in the Posttest Vs 37.5 in the Follow-up;尸<0.01), indicating that there was a
contradiction in the Control Group's physical activity level, assessed by daily energy
expenditure and summary physical activity index. There was also no significant
change in the mean number of flights of steps climbed per day in either the
Education or Control Group.
135

Table 3.88 Comparison between the mean 土 S.D. reported daily energy expenditure
(kcal/day), summary physical activity index and number of flights of steps climbed
per day between Pretest, Posttest and Follow-up in the Education and Control Groups Education Group (n=51) Control Group (n=50)
Pretest Posttest Follow-up Pretest Posttest Follow-up Daily energy 1538.5 1495.9 1379.3 1666.0 1416.0 1466.4
expenditure ± 682.9 ±915.9 ± 657.3 ± 693.7* ±618.0 ± 594.1 (kcal/day)
Summary physical 34.5 29.5 30.2 28.0 27.1 37.5 activity index ±20.5 ±15.8 ±17.0 ±17.2* ±15.6** ±20.3
Number of flights 1.3 土 2.6 2.5 ± 6.0 1.5 ±2 .5 2.1 ±3 .5 1.6 ±4 .3 1.4 ±2 .2 of steps climbed per day
* ^<0.05 for Pretest or Posttest and Follow-up by paired /-test
** 尸<0.01 for Posttest and Follow-up by paired /-test
3.7.12 Physical Activity Knowledge
The mean Physical Activity Knowledge Score (Figure 3.2) increased significantly in
the Education Group only between the Pretest and the Posttest (5.9 Vs 8.8;尸<0.001).
The score was maintained at the same level between the Posttest and the Follow-up.
When asked if the women had heard of the physical activity pyramid, a significant
increase was found in the Education Group only between the Pretest and the Follow-
up (16% Vs 82%;尸<0.001). The same proportion was maintained for those who
had heard of the physical activity pyramid between the Posttest and the Follow-up.
A significant increase was also observed in the Education Group for those who could
correctly match all the physical activity groups with the corresponding level of the
physical activity pyramid between the Pretest and the Follow-up (2% Vs 16%;
尸<0.001),these data are shown in Table 3.89.
136

^ 10 a
1 9 ^ •
<U 8 7 —
r^ 6 - _ " _ _ : Z: - :
§ s 2 ) ^ 4 A Education Group '> 3 • T-H J < 2 Control Group -g 1 •I o 1 1 1 1 1 1 ‘ ‘ £ 0 1 2 3 4 5 6 7 8 9
Time (months) a 尸<0.001 for Pretest and Follow-up by paired /-test
Figure 3.2 Changes in Physical Activity Knowledge Score between Pretest, Posttest
and Follow-up in the Education and Control Groups
Table 3.89 Comparison between the number (%) of women reported having heard of
the physical activity pyramid, and correctly matched all the physical activity groups
with the corresponding level of the physical activity pyramid between Pretest,
Posttest and Follow-up in the Education and Control Groups Physical activity Education Group (n二51) Control Group (n=50) knowledge Pretest Posttest Follow-up Pretest Posttest Follow-up questions Had heard of the 8 (16)*** 42 ( 8 2 ) 4 2 ( 8 2 ) 1 2 ( 2 4 ) 1 3 (26) 15 (30)
physical activity pyramid
Correctly matched 1(2)*** 9(18) 8 (16) 3(6) 1(2) 1(2) physical activity levels
*** 尸<0.001 for Pretest and Follow-up
Among the proportion of correct responses to the nine additional physical activity
knowledge questions, three questions showed significant improved in the Education
Group. However, only 12% of the women could correctly answer that the
recommended duration for each session of physical activity is not 10 mins. On the
other hand, the Control Group showed no significant changes in either the mean
137

Physical Activity Knowledge Score or in the proportion of correct responses for each
physical activity knowledge question (Tables 3.90 and 3.91).
Table 3.90 Comparison between the number (%) of correct responses to the nine
additional physical activity knowledge questions between Pretest, Posttest and
Follow-up in the Education Group
Education Group (n=51) Physical activity knowledge questions Pretest Posttest Follow-up Regular physical activity decreases the Correct 31 (61) 38 (75) 39 (77) chance of adult-onset diabetes. Incorrect 9 (18) 4(8) 5 (10)
DoiVt know 11(22) 9(18) 7(14) Regular physical activity increases the Correct 38 (75) 45 (88) 47 (92) chance of hypertension. * incorrect 5 (10) 6 (12) 4(8)
— Don't know 8 (16) 0 (0) Q(Q) Regular physical activity decreases the Correct 41 (80) 48 (94) 50 (98) chance of osteoporosis. * Incorrect 3 (6) 2 (4) 1 (2)
DoiVt know 7(14) 1(2) Q (Q) Both continuous (one 30-min session) Correct 30 (59) 32 (63) 31 (61) & intermittent (three 10-min sessions) Incorrect 2(4) 9(18) 15(29) aerobic physical activity can build Don't know 19 (37) 10 (20) 5 (10) cardiovascular fitness.*
Aerobic physical activities are the Correct 40 (78) 50 (98) 46 (90) most effective ones in developing Incorrect 0 (0) 0 (0) 1 (2) cardiovascular fitness. DoiVt know 11 (21) 1 (2) 4 (8)
Aerobics is one kind of aerobic Correct 39 (77) 45 (88) 41 (80) physical activity. Incorrect 1 (2) 0 (0) 3 (6)
DoiVt know 11 (22) 6(12) 7 (14) The recommended duration for each Correct 7(14) 6 (12) 6(12) session of physical activity is 10 mins. Incorrect 33 (65) 41 (80) 41 (80)
DoiVt know 11 (22) 4(8) 4(8) The recommended frequency for Correct 14 (28) 18 (35) 25 (49) physical activity is at least once per Incorrect 27 (53) 29 (57) 21 (41) w e e k . Doirt know 10(20) 4(8) 5(10) Physical activity must be hard enough Correct 36 (71) 43 (84) 40 (78) to require more exertion than normal Incorrect 5 (10) 4(8) 1 (14) to produce gains in health- Doirt know 10 (20) 4(8) 4(8) related .fitness * 尸<0.05 for Pretest and Follow-up
138

Table 3.91 Comparison between the number (%) of correct responses to the nine
additional physical activity knowledge questions between Pretest, Posttest and Follow-up in the Control Group
Control Group (n=5Q) Physical activity knowledge questions Pretest Posttest Follow-up Regular physical activity decreases the Correct 29 (58) 28 (56) 34 (68) chance of adult-onset diabetes. Incorrect 6(12) 8(16) 8(16)
Dorftknow 15 (30) 14 (28) 8 (16) Regular physical activity increases the Correct 39 (78) 38 (76) 40 (80) chance of hypertension. Incorrect 8(16) 8(16) 8(16)
Dorft know 3 (6) 4 (8) 2 (4) Regular physical activity decreases the Correct 37 (74) 44 (88) 39 (78) chance of osteoporosis. Incorrect 8 (16) 3 (6) 6(12)
Don't know 5(10) 3(6) 5 (10) Both continuous (one 30-min session) Correct 27 (54) 33 (66) 27 (54) and intermittent (three 10-min Incorrect 7 (14) 6(12) 9 (18) sessions) aerobic physical activity can Don't know 16 (32) 11 (22) 14 (28) build cardiovascular fitness.
Aerobic physical activities are the Correct 39 (78) 38 (76) 42 (84) most effective ones in developing Incorrect 2 (4) O (0) 1 (2) cardiovascular fitness. Don,t know 9(18) 12 (24) 7(14)
Aerobic physical activity is one kind Correct 33 (66) 32 (64) 37 (74) of aerobic physical activity. Incorrect 6(12) 4(8) 1(2)
Dorftknow 11 (22) 14 (28) 12 (24) The recommended duration for each Correct 12 (24) 9 (18) 35 (70) session of physical activity is 10 mins. Incorrect 32 (64) 35 (70) 10 (20)
DonH know 6(12) 6(12) 5 (10) The recommended frequency for Correct 15 (30) 21 (42) 23 (46) physical activity is at least once per Incorrect 25 (50) 24 (48) 21 (42) w e e k . DoiVt know 10(20) 5 (10) 6(12) Physical activity must be hard enough Correct 39 (78) 42 (84) 42 (84) to require more exertion than normal Incorrect 4 (8) 3 (6) 4 (8) to produce gains in health-related Don't know 7(14) 5(10) 4(8) fitness.
Moreover, when divided the physical activity pyramid into four individual layers, the
correct responses for each layer was significantly increased (尸<0.001) in the
Education Group. In contrast, none of the variables concerning the physical activity
pyramid showed significant changes in the Control Group (Table 3.92).
139

Table 3.92 Comparison between the number (%) of women correctly matched the specific physical activity group in the physical activity pyramid between Pretest, Posttest and Follow-up in the Education and Control Groups
Education Group (n=51) Control Group (n=50) Physical activity Pretest Posttest Follow-up Pretest Posttest Follow-up group Rest/inactivity 7 (14)*** 37 (73) 37 (73) 10 (20) 11 (22) 12 (24) Exercise for 2 (4)*** 11 (22) 13 (25) 5 (10) 3 (6) 4 (8)
flexibility and muscular
strength Aerobic and active 4 (8)*** 18 (35) 17 (33) 6 (12) 2 (4) 4 (8)
sports Lifestyle physical 2 (4)*** 17 (33) 16 (32) 6 (12) 2 (4) 3 (6)
activity *** 尸<0.001 for Pretest and Follow-up
3.7.13 Intention and Confidence in Changing Behavior
No significant change was seen in the Education Group for their intention and
confidence in decreasing saturated fat intake or doing more physical activity.
Significant change (尸<0.05) was noted in the Education Group only for increasing
fruit intake and increasing vegetable intake. The proportion of women in the
precontemplation stage for increasing fruit intake decreased significantly from 29%
in the Pretest to 6% in the Follow-up, while the proportion of women in the
maintenance stage increased significantly from 24% to 47% during the same period.
In addition, the proportion of women in the contemplation stage for increasing
vegetable intake decreased significantly from 10% in the Pretest to zero percent in
the Follow-up, together with a significant increase in the proportion of women in the
maintenance stage from 24% to 47% during the same period (Table 3.93). However,
there were no significant differences between the maintainers in increasing fruit
intake or increasing vegetable (those in the maintenance stage) and those in earlier
stages in any of the eating behavior. No significant changes were observed in the
Control Group for each of the behavior. No significant difference was also noted in
140

any of these behavior changes between women in the maintenance stage and the
earlier stages in dietary and physical activity habits.
Table 3.93 Comparison between the stages of change of behavior between Pretest,
Posttest and Follow-up in the Education and Control Groups
Number (%) of women B — r Education Gro叩(n=51) Control Group (n-5Q)
Pretest Posttest Follow-up Pretest Posttest Follow-up Decreasing
saturated fat intake Precontemplation 29 (57) 13 (26) 17 (33) 34 (68) 36 (72) 31 (62) Contemplation 1 (2) 3 (6) 1 (2) 2 (4) 3 (6) 1 (2) Preparation 3(6) 8(16) 8(16) 6(12) 3(6) 5(10) A c t i o n H (22) 16 (31) 10 (20) 3 (6) 3 (6) 5 (10) Maintenance 7 (24) 11(22) 15 (29) 5 (10) . 5 (10) 8 (16)
Pretest* Posttest* Fol low-up~Pre tes tPos t tes t Follow-up Increasing fruit
intake Precontemplation 15 (29) 8(16) 3(6) 17(34) 7(14) 5 (10) Contemplation 3(6) 0(0) 5 (10) 3(6) 2(4) 3(6) Preparation 11 (22) 11 (22) 10 (20) 7 (14) 6 (12) 9 (18) A c t i o n 10 (20) 16 (31) 9 (18) 5 (10) 11 (22) 9 (18) Maintenance 12 (24) 16 (31) 24 (47) 18 (36) 24 (48) 24 (48)
Pretest* Posttest Follow-up Pretest Posttest Follow-up Increasing
vegetable intake Precontemplation 7(14) 7(14) 6(12) 15 (30) 6(12) 6(12) Contemplation 5(10) 3(6) 0(0) 2(4) 1(2) 0(0) Preparation 6(12) 7(14) 7(14) 4(8) 4(8) 5(10) Action 14 (28) 14 (28) 7 (14) 4 (8) 12 (24) 10 (20) Maintenance 19 (37) 20 (39) 31 (61) 25 (50) 27 (54) 29 (58)
Pretest Posttest Follow-up Pretest Posttest Follow-up Doing more physical activity
Precontemplation 11 (22) 5 (10) 5 (10) 10 (20) 9 (18) 7 (14) Contemplation 4(8) 4(8) 14(28) 6(12) 8(16) 7(14) Preparation 10 (20) 12 (14) 9 (18) 16 (32) 13 (26) 15 (30) Action 7(14) 10(20) 9(18) 7(14) 8(16) 9(18) Maintenance 19 (37) 20 (39) 14 (28) 11 (22) 12 (24) 12 (24)
* 尸<0.05 for Pretest or Posttest and Follow-up
When comparisons were made between the Pretest and the Follow-up, it was clear
that the Education Group had significantly improved their nutrition and physical
141

activity knowledge, together with their intention and confidence to increase fruit and
vegetable intakes. Further analysis showed that their education level and age also
influenced these changes.
3.7.14 Analysis of the Changes Education Level
When the Education Group was divided into four education levels (incomplete
primary; complete primary; lower secondary and upper secondary), no association
was noticed in the education level and any of the body parameter changes.
Additionally, it was found that women in complete primary, lower secondary and
upper secondary had significantly increased (尸<0.05 or 尸<0.01) the mean Nutrition
Knowledge Score between the Pretest and the Follow-up (Table 3.94). However’
only among the women who had complete primary education did the percentage who
had heard of saturated fat between the Pretest and the Follow-up significantly
increased (尸<0.05). Also, only among the women in incomplete primary did the
percentage who had heard of the food pyramid during the same period significantly
increased (尸<0.05). Therefore, women of all education levels had significantly
increased (尸<0.05,尸<0.01 or 尸<0.001) their mean Physical Activity Knowledge
Score, and also showed an increase in the percentage of women who had heard of the
physical activity pyramid between the Pretest and the Follow-up. Education level
showed no associations with the stages of change of behavior or the proportions of
women who could correctly fill in the food and the physical activity pyramids
between the Pretest and the Follow-up.
142

Table 3.94 Comparison between the mean Nutrition and Physical Activity
Knowledge Scores 土 S.D., and the number (%) who had heard of saturated fat, the
food pyramid and the physical activity pyramid of Education Group's women of
different education level between Pretest, Posttest and Follow-up Education level Pretest Posttest Follow-up Incomplete primary (Iir=I 1)
Nutrition Knowledge Score 5.7 ±3.6 7.7 ±3.1 8.5 ± 3.0 Had heard of saturated fat 4 (36) 8 (73) 5 (46) Had heard of the food pyramid 7 (64)* 11 (100) 11 (100) Physical Activity Knowledge Score 5.8 土 1.7** 7.7 士 2.0 8 6 ± 9 1 Had heard of the physical activity pyramid 2 (18)** 8 (73) 9 (82)
Complete primary (n=13) Nutrition Knowledge Score 6.7 士 3.0** 10.3 土 3.6 8.9 土 3.6 Had heard of saturated fat 3 (23)* 9 (69) 8 (62) Had heard of the food pyramid 12 (92) 13 (100) 13 (100) Physical Activity Knowledge Score 5.6 ±2.2* 8.6 ±2.1 8.2 ± 2 6 Had heard of the physical activity pyramid 2 (15)** 12 (92) 9 (69)
Lower secondary (n=16) Nutrition Knowledge Score 7.3 ±3.7* 10.3 ±2.8 10.2 ±3.0 Had heard of saturated fat 8 (50) 13 (81) 12 (75) Had heard of the food pyramid 11 (69) 16 (100) 15 (94) Physical Activity Knowledge Score 5.5 ±2.5** 9.1 ±2.1 9 2 ± 2 2 Had heard of the physical activity pyramid 3 (19)*** 15 (94) 14 (88)
Upper secondary (11= 10) Nutrition Knowledge Score 9.3 士 2.5* 11.9 ± 1 1 1 1 7 + 1 8 Had heard of saturated fat 7 (70) 10 (100) 10 (100) Had heard of the food pyramid 9 (90) 10 (100) 10 (100) Physical Activity Knowledge Score 7.0 ±1.3* 9.5 ± 2.3 9 2 ± 1 8 Had heard of the physical activity pyramid 1 (10)*** 6 (60) 9 (90)
* 尸<0.05 for Pretest/Posttest and Follow-up * * 尸 < 0 . 0 1 for Pretest/Posttest and Follow-up *** 尸<0.001 for Pretest/Posttest and Follow-up
3.7.15 Analysis of the Changes by Age Group
When the Education Group was divided into two age groups, 30-39 and 40-50, as
was found when analyzing by education level, no associations were found between
the age and body parameter changes. Also, both age groups’ mean Nutrition
Knowledge Score increased significantly (尸<0.05 or 尸<0.001) between the Pretest
and the Follow-up (Table 3.95). Significant increases (P<0.05 or 尸<0.01) were
observed in the older group only in the proportion who had heard of saturated fat or
143

the food pyramid between the Pretest and the Follow-up. Both age groups showed
a significant increase (尸<0.01 or 尸<0.001) in their mean Physical Activity
Knowledge Score and the proportion of women who had heard of the physical
activity pyramid between the Pretest and the Follow-up. Moreover, in the older
group only, a significant increase (from 40 to 70%;尸<0.01) was seen in the
percentage of women in the action and maintenance stages of increasing fruit intake
between the Pretest and the Follow-up.
Table 3.95 Comparison between the mean Nutrition and Physical Activity
Knowledge Scores 土 S.D., and the number (%) who had heard of saturated fat, the
food pyramid and the physical activity pyramid of Education Group's women of
different age group between Pretest, Posttest and Follow-up Education level Pretest Posttest Follow-up 30-39 years (n=l l )
Nutrition Knowledge Score 8.2 土 2.8* 10.5 士 3.1 10.4 土 3.1 Had heard of saturated fat 4 (36) 9 (82) 6 (55) Had heard of the food pyramid 9 (82) 11 (100) 10 (91) Physical Activity Knowledge Score 6.3 士 1.2** 8.7 ±1 .9 9.1 土 2.2 Had heard of the physical activity pyramid Q (Q)*** 8 (73) 8 (73)
40-50 years (n=40) Nutrition Knowledge Score 7.0 土 3.6*** 10.0 士 2.8 9.8 士 3.2 Hadheard of saturated fat 19 (48)* 32 (80) 30 (75) Had heard of the food pyramid 31 (78)** 40 (100) 40 (100) Physical Activity Knowledge Score 5.8 土 2.3*** 8.9 土 2.2 8.8 土 2.2 Had heard of the physical activity pyramid 8 (20)*** 34 (85) 34 (85)
* 尸<0.05 for Pretest/Posttest and Follow-up ** 尸<0.01 for Pretest/Posttest and Follow-up *** P<0.001 for Pretest/Posttest and Follow-up
3.7.16 Perceived Difficulties in Changing Behavior
Only a few of the women in both the Education and Control Groups reported having
difficulty when they had tried to eat less saturated fat, eat more fruit or eat more
vegetables, as revealed in the Pretest, the Posttest and the Follow-up (Table 3.96).
Doing more physical activity remained the most difficult behavioral change among
the women in the Pretest, the Posttest or the Follow-up. Laziness, no time and
144

tiredness were the three common barriers mentioned preventing them from doing
more physical activity.
Table 3.96 Comparison between the difficulties reportedly encountered preventing
different behavioral changes between Pretest, Posttest and Follow-up in the
Education and Control Groups Number of women
Education Group (n=51) Control Group (n=5Q) Behavior and difficulties Pretest Posttest Follow-up Pretest Posttest Follow-up Eating less saturated fat
Attraction of food 4 5 6 2 1 O Pressure from 1 2 2 2 1 O
families/friends Feel hungry/no energy/ 1 1 0 1 0 0
uncomfortable Don't know the cooking 0 0 0 0 0 1
method Eating more fruit
No time 1 0 1 0 0 1 Cannot have food in 1 0 0 0 1 0
some occasions Lazy 2 1 0 0 2 1 Others 3 4 4 Q 2 1
Eating more vegetables Dislike the texture/taste 0 3 1 1 1 0 Afraid of fertilizers 1 0 1 0 0 0 Feel full 0 1 0 0 0 1 Don't know how to cook 0 0 0 0 1 0 Eat less when eating out 0 0 1 0 0 0 Others Q Q Q Q Q 1
Doing more physical activity Lazy 8 9 12 5 2 2 No time 4 2 4 3 2 3 Feel tired because too 5 1 7 3 7 7
vigorous No company 0 3 0 1 5 0 Health problems 0 0 0 1 2 2 Others 2 2 1 0 2 l
3.7.17 Perceived Methods Facilitating Behavior Change
When asked for suggestions of methods facilitating their eating less saturated fat,
more women in the Education Group but not the Control Group could state some
145

methods after the intervention (Table 3.97). 'Have healthy eating practices' and
'self control' or 'self reminder' were the most common methods mentioned in both
the Education and Control Groups. However, there was only little change in the
methods for increasing fruit and vegetables intakes and doing more physical activity
as revealed in both Education and Control Groups.
Table 3.97 Comparison between the suggested methods for assisting different
behavioral changes between Pretest, Posttest and Follow-up in the Education and
Control Groups Number of women
Education Group (n=51) Control Group (n=50) Behavior and methods Pretest Posttest Follow-up Pretest Posttest Follow-up
Eating less saturated fat Buy/cook fatty food less O 2 1 2 2 0
frequent Have healthy eating 12 13 18 3 2 6
practices Have healthy cooking 0 5 2 0 0 1
practices Decrease frequency 0 2 2 0 0 0
of eating out Pay attention to eating 2 1 1 0 0 2
habits and food composition
Self control/self remind 2 8 8 1 4 5 Co-operate with 2 1 0 2 0 1
families Others Q 1 2 2 1 1
Eating more fruits Buy more fruit 6 13 11 5 11 9 Have fruit as snacks 5 4 2 0 4 1 Remember the benefits 1 2 1 1 0 7
of eating more fruit Choose favorite/ 6 4 7 4 4 5
different types of fruit Develop a habit of 6 7 4 5 1 4
eating fruit Eat less meat/dishes 3 2 1 5 3 1 Eat salad/assorted fruit 1 0 1 1 1 0
basket Not being a food 0 0 0 0 0 1
picker Eat less snacks 0 0 1 0 0 0 Others 3 4 3 2 4 1
146

Number of women Education Group (n=51) Control Group (n=5Q)
Behavior and methods Pretest Posttest Follow-up Pretest Posttest Follow-up Eating more vegetables
Buy/cook vegetables 12 13 9 9 12 9 more frequent
Eat less meats/dishes 6 9 2 6 2 1 Remember the benefits 1 2 5 4 3 5
of eating more vegetables
Choose favorite 2 4 3 2 0 2 vegetables
Develop a habit of 4 1 5 1 0 2 eating vegetables
Modify cooking 2 2 2 2 3 1 method
Have meals at home 0 0 2 0 0 O Choose the one easy to O O 2 0 0 0
cook Use different cooking 0 0 0 0 0 1
methods Choose different types 0 0 0 0 0 4
of vegetables Others 1 3 1 Q 4 1
Doing more physical activity Save more time for 5 7 3 5 4 8
doing physical activity
Have company 5 8 8 2 4 6 Self encouragement/ 6 6 6 7 5 2
More will power Develop an interest 2 3 1 1 0 0
in doing physical activity
Remember the benefits 5 5 3 6 4 6 of doing physical activity
Join more physical 5 3 2 8 7 1 activities
Want to lose weight 0 0 0 0 2 0 Try to incorporate 3 3 4 1 1 0
physical activity in daily activities/in different occasions
Go to the park 0 0 1 0 0 0 As a way to relax 0 0 0 0 0 1 Others 2 2 1 5 3 3
147

3.7.18 Health Information Desired
More people reported they would like to learn health information in the Follow-up
than in the Pre- and Posttests in both the Education Group and the Control Groups
(Table 3.98). In the Education Group, an increase was seen in the number of
women who would like to learn all kinds of health information. On the other hand,
an increase was observed in the number of women who would like to know nutrition
information in the Control Group.
Table 3.98 Comparison between the interested topics which the women would like to
learn more between Pretest, Posttest and Follow-up in the Education and Control
Groups Number of women
Education Group (n=51) Control Group (n=50) Health topics Pretest Posttest Follow-up Pretest Posttest Follow-up Women's health 1 2 0 1 5 3 Nutrition-related 8 2 5 7 9 10 diseases Other diseases 2 1 1 1 1 3 Nutrition information 7 10 7 1 8 9 Dieting/Weight control 1 2 2 0 3 4
methods Physical activity 2 1 0 0 1 1
information All-rounded 1 4 16 1 5 7 information One's health status 4 3 3 5 2 4 Organ's functioning 0 0 2 1 1 0 Ways to keep healthy 0 0 1 0 0 0 Others 2 3 O Q 0 1
148

3.7.19 Areas of Health the Women Would Like to Improve
When the women were asked to state which part of their health they would like to
improve, more women in the both groups responded to this question in the Follow-up
(Table 3.99). Most of them reported that they would like to improve their physical
activity habits, followed by their eating habits. However, nearly the same number
of women in the Control Group also replied with areas of their health that they would
like to improve. As with the Education Group, about half of them would like to
improve their physical activity habits.
Table 3.99 Comparison between the aspects of health to improve between Pretest,
Posttest and Follow-up in the Education and Control Groups Number of women
Education Group (n二51) Control Group (n=50) Aspects of health Pretest Posttest Follow-up Pretest Posttest Follow-up Eating habits 10 12 18 6 7 12
(unspecified) Physical activity habits 12 16 26 14 18 20
(unspecified) Lose weight 5 5 4 8 7 4 Get more rest 0 0 1 1 2 0 Improve mental health 3 3 2 1 1 2 Improve osteoporosis 4 1 1 1 0 0 Relieve joint/bone pain 2 1 1 3 4 2 Gain weight 0 0 0 2 2 1 Strengthen physical 3 1 0 3 1 2
health Improve hypertension 0 0 1 2 0 1 Improve high blood 1 1 2 1 0 0
cholesterol Benefit all parts of the 3 0 2 3 0 3 body Others 3 2 5 1 2 3
149

3.7.20 Summary Profile of Women at Follow-up
In the Education Group, only older women tended to return for the Follow-up.
Except for this, none of the demographic variables were found to have significant
difference within the group or between the Education and Control Groups.
Between the Pretest and the Follow-up, both groups increased the mean percent body
fat and fasting total blood cholesterol level. In the Control Group only, significant
less women were within the desirable total blood cholesterol level in the Follow-up
when compared with the Pretest. No significant changes were observed in the
reported health conditions in the two groups.
The Education Group significantly increased the number of snacks they ate daily
between the Posttest and the Follow-up after decreasing from Pre- to Posttest, and
returned to nearly the same frequency as in the Pretest. In the Control Group, a
significant increase was seen in the mean days of having breakfast between the
Posttest and the Follow-up. No significant changes were found in the taking of
nutrient supplements in either group.
No significant changes were noted in the types of oil used for cooking in the two
groups. Significant decreases were obtained in the Education Group in using the
less healthy cooking methods such as frying and deep frying. Interestingly, the
proportion of women who reported removing all fat from meat before they consumed
it significantly increased in the Control Group, whereas no significant change were
found in the Education Group. No significant changes were observed in food label
reading.
Except that the mean total fat intake was significantly decreased in the Education
150

Group between the Posttest and the Follow-up, none of the energy or nutrient intakes
showed significant changes in the two groups. However, in the Education Group
only, a significant increase was seen in the proportion with energy from MUFA
greater than the recommended intake level (>10%). Significant changes were also
found in the Control Group, and the proportion of women meeting the recommended
intake of cholesterol decreased in the Follow-up, while the proportion of those
meeting the recommended intake level of calcium increased. Some of the food
items in the food frequency assessment also showed significant changes from the
Pretest to the Follow-up. Significantly more women consumed evaporated milk,
no-cream cake, candy and chocolate in the Education Group. On the other hand,
significantly more women consumed fried dim sum and significantly less women
consumed soft drink were found in the Control Group.
No significant changes were found in the Education Group regarding to the physical
activity behavior. However, the Control Group significantly decreased their mean
daily energy expenditure between the Pretest and the Follow-up, while at the same
time significantly increasing the summary physical activity index.
The Education Group successfully maintained their nutrition and physical activity
knowledge for six months after the intervention. Only the Education Group
significantly increased their awareness of eating more fruit and vegetables.
Education level only to a small degree and age to a larger extent were found to be
associated with some of the changes of women's nutrition and physical activity
knowledge in the Education Group. Only women in complete primary significantly
increased the proportion of women who had heard of saturated fat between the
151

Pretest and the Follow-up, and only women in incomplete primary significantly
increased the proportion of women who had heard of the food pyramid. When
analyzed by age group, significant increases were observed in the older group only in
the proportion who had heard of saturated fat or the food pyramid between the
Pretest and the Follow-up. Age also showed some effects on women's intention to
change their behavior. Among the older group, a significant increase was seen in
the proportion of women in the action and maintenance stages in increasing fruit
intake.
In summary, the Follow-up findings showed that most of the eating and physical
activity behavior did not change significantly in both the Education and Control
Groups, but significant changes were mainly noted in the nutrition and physical
activity knowledge level in the Follow-up when compared with the Pretest.
152

CHAPTER FOUR: DISCUSSION
Understanding Hong Kong middle-aged women's attitudes towards healthy eating
and regular physical activity, their nutrition and physical activity knowledge,
together with their eating and physical activity practices is essential to the
development of a nutrition and physical activity promotion program for them. This
study described the effects of a pilot healthy eating and lifestyle promotion program,
designed with respect to the above factors, aimed at improving their awareness of the
benefits of a healthy lifestyle, improving their intentions to change less healthy
eating and physical activity behavior, and enabling skills for them to eat healthier and
become more physically active. The need for a primary prevention program for
local women is supported by Lau (Lau, 2000), who reported that many conditions
affecting women are preventable, and also, health behavior of women may influence
their family members. A study of 2,452 Lithuanian men and 3,365 Dutch men
(Bosma et al., 1995), found that men whose spouses of lower education apparently
had an increased risk of all-cause mortality, when controlled for men's education.
The relative risks (RR) were 1.57 in Lithuanian men and 2.15 in Dutch men.
Although that study referred to the women's formal education, and not just their
health education, it may be that providing health education to women may help
improve their husbands' health.
This study began by conducting focus groups to gather ideas from women about how
to effectively implement a health promotion intervention tailored to them. The use
of focus groups has been utilized in other studies, for example, Gettleman and
Winkleby used it for the implementation of a cardiovascular diseases intervention
program tailored to low-income women in California (Gettleman & Winkleby, 2000).
153

Moreno et al conducted focus groups to gather relevant information for a heart
disease prevention and education campaign designed for Latinos (Moreno et al.’
1997). The focus groups in the present study suggested that health talks, cooking
and physical activity demonstrations were suitable activities for the healthy eating
and lifestyle promotion program. Based on the focus groups’ results, a healthy
eating and lifestyle promotion program was designed. The study used a two-group
Education and Control Group design with Pre-, Post- and Follow-up evaluations to
determine the effects of this program.
4.1 Implications of Findings
4.1.1 Current Situation in Diet and Physical Activity of Hong Kong Middle-
aged Women from the Pretest Survey
The Pretest survey provided insights to the women,s anthropometry, as well as their
diet, knowledge, attitudes and behavior related to healthy lifestyle. The findings
showed that the prevalences of overweight (BMI =23.0-24.9 kg/m2) and obesity
(BMI >25.0 kg/m2) among the local middle-aged women was 18% and 29%
respectively. These prevalences differed from those found in The Hong Kong
Cardiovascular Risk Factor Prevalence Study (Janus, 1997), which revealed that 22%
of women of age 30-49 years were overweight (BMI 二25.1-30.0 kg/m2) and 6% of
them were obese (BMI >30.0 kg/m2). The difference comes from the adoption of a
different BMI classification. The present study used an Asian definition, which has
been developed from various Asian studies about risk factors and morbidities (Asia-
Pacific steering committee, 2000). The use of the lower BMI cut-offs to define
obesity has also received support from a local study which found that the Hong Kong
Chinese population have a higher percent body fat for a given BMI. When using
BMI to predict percent body fat, the BMI under-estimated the value by 3.4% in
154

females when compared with the value obtained from dual-energy X-ray
absorptiometry. This occurred because the prediction formula was developed from
Caucasian populations, leading the authors to recommend the newly proposed BMI
classification for Hong Kong adults (He el al., 2001). If the Asian definition were
applied to The Hong Kong Cardiovascular Risk Factor Prevalence Study, 28% of the
middle-aged women aged 30-49 years in that study would have been classified as
obese, which is consistent with the present study.
Sixty-seven percent of the women exceeded the desirable percent body fat (20-27%).
The mean percent body fat of the total surveyed women was 31.1%, which was
similar to that found in Japanese and Chinese populations, but lower than Indonesian
and Dutch populations. A Japan study of 794 women found that the mean percent
body fat was 29.1% and 32.2% for those of 30-39 and 40-49 years, respectively (Ito
et al., 2001). Another Beijing survey of 124 females of mean age 34 years, found
that the mean percent body fat was 32.1% (Wang & Deurenberg, 1996). A study
including 51 Indonesian women of mean age 35 years and 42 Dutch Caucasians of
mean age 34 years, showed that the mean percent body fat was 36.0% and 33.2%,
respectively (Gurrici et al., 1998). Additionally, only 12% and 2% of the surveyed
women had fasting total blood cholesterol level within the borderline range (5.20-
6.19 mmol/L) and high (> 6.2 mmol/L) respectively. These were lower than those
found from The Hong Kong Cardiovascular Risk Factor Prevalence Study, in which
23% and 7% of women were classified as borderline and high, respectively.
The study found that overweight or obesity and being above desirable percent body
fat were common among the local middle-aged women, although most of the women
were within desirable total cholesterol range. This phenomenon should be
155

improved, because obesity has been found to be a central determinant of the
metabolic syndrome (the clustering of cardiovascular risk factors like hypertension,
glucose intolerance, high triglycerides, low HDL cholesterol, hyperinsulinemia, and
microalbuminuria) in Hong Kong adults aged 30-65 years (Chan et al., 1996).
Reduction of obesity prevalence should be a first step to reduce risk of morbidity and
mortality of these diseases among Hong Kong women.
Regarding nutrient supplement practices, 15% of the total surveyed women took
supplements, which is similar to the findings from The Hong Kong Adult Dietary
Survey 1995 (Leung et al, 1997), which revealed that 18% of females took
supplements.
Generally speaking, the common types of cooking methods for fish, poultry and
vegetables are also similar in the present study and the 1995 Dietary Survey. The
same proportion (95%) of women in the present study and of females in the 1995
dietary survey reported using steaming for fish. Steaming was also frequently used
in both the present study (65%) and the dietary survey (77%) for poultry. Eighty-
six percent of women and 91% of females in the present study and the dietary survey,
respectively, reported stir frying was the common cooking method for vegetables.
A difference, however, was noted in cooking pork/beef. Most of the women (62%)
in the present study used stir frying, whereas most of the females (88%) in the
dietary survey reported using boiling.
Twenty-eight percent of the total surveyed women in the present study reported
removing all fat from meat, which was lower than that reported by the females in the
dietary survey (35%). Instead, most of the women (63%) in that present study
156

reported removing some fat, which was higher than in the dietary survey (43%).
Moreover, more women in the present study reported removing some skin from
poultry than the dietary survey (55% Vs 45%), whereas a similar proportion was
seen in both studies of removing all skin from poultry (30% and 32% in the present
study and the dietary survey, respectively.).
At the beginning of the study, 42% of the total surveyed women had heard of
saturated fat while 74% of them had heard of the food pyramid. The recent
promotion of the food pyramid via the mass media may explain why more women
had heard of it than saturated fat. However, only 30% of the women could correctly
match all the food groups with their corresponding level of the food pyramid. That
means the women are not fully understanding the content of the food pyramid, which
is intended to guide people to achieve healthy eating. As Dixon said, the food
pyramid is the foundation of the development of food guidance system to assist
consumers in the learning of key themes of the total diet, i.e., variety, moderation and
proportionality (Dixon et al., 2001). Therefore, more in-depth promotion and
education about the food pyramid are needed to help women develop a healthy eating
habit, if the food pyramid is to truly function as it is intended.
In addition, from the true-false nutrition knowledge questions, middle-aged women
showed confusion with respect to the effects of cholesterol on health. When asked
whether it is true that 'The hardening of blood vessels is mainly caused by too much
cholesterol in diet', most of the women (80%) wrongly indicated that it is true.
Another question also revealed similar pattern, when asked whether vHigh
cholesterol food has a greater effect than high saturated fat food on raising blood
cholesterol level', in which only 11% of women correctly stated that it is false and
157
more than half (56%) had no idea about this. This implies middle-aged women lack
adequate understanding about relationships between dietary cholesterol, dietary
saturated fat, and hardening of the arteries, and shows that education emphasizing
these relationships is essential of them. Also, the stages of change questions in the
pretest found that with 63% of the surveyed women in the precontemplation stage,
they had low awareness about decreasing saturated fat intake, partly because some of
them do not know what saturated fat is, and partly because they do not know the
health risks of high saturated fat intake. Additionally, 30% and 18% of the women
had low awareness (being in the precontemplation stage) of increasing fruit and
vegetable intakes, respectively.
Regarding the diet composition, when compared with the findings from The Hong
Kong Adult Dietary Survey 1995 (Leung el al, 1997), the women's mean intakes of
total fat and sodium in this present study are higher while the mean intakes of
cholesterol, calcium and vitamins A are lower than the 1995 survey. The mean
intakes of energy and other nutrients are similar in both studies, as is shown in Table
4.1.
158

Table 4.1 Comparison of the mean dietary intake of the women in the present study
and the Hong Kong Adult Dietary Survey 1995 Diet component Present study Hong Kong Adult
(n=147, age=30-50 years) Dietary Survey 1995 (n=133, age二35-44 years)
Energy (kcal) 1942.8 1869.9 Carbohydrate (g) 241.0 245.0 Protein (g) 76.9 89.0 Fat (g) 78.3 62.1 SFA (g) 15.4 16.9 PUFA (g) 15.6 14.4 MUFA (g) 24.2 21.5 Cholesterol (mg) 234.5 299.8 Fibre (g) 9.5 9.3 Calcium (mg) 510.1 594.7 Iron (mg) 15.6 15.4 Sodium (mg) 1865.2 1113.0 Vitamin A (RE) 932.4 1419.2 Vitamin C (mg) 168.9 179.5 Vitamin E (mg) \ 0 2 H J
Eighty-four percent of the women in the present study had percent energy from fat
>30%, which is greater than the recommended intake level. Reduction of dietary
fat intake among the women is essential because this is associated with reducing the
risk for diseases such as cardiovascular diseases (Hooper et al., 2001), type II
diabetes (Tuomilehto et al., 2001) and some kinds of cancers (Steinmaus et al., 2000)
(Weisburger, 1997). This indicates that healthy cooking methods, especially for
vegetables and pork/beef, may be introduced to the women to reduce their fat intake,
because most of the women reported they used stir frying for cooking these food.
In addition, teaching them to trim off all the visible fat from meat and all skin from
poultry is another method, because only one-third of the women reported removing
all fat or skin from meat and poultry.
On the other hand, only 13% and 9% of them achieved the recommended intake
levels of vitamin E and calcium, respectively. Few of them met the recommended
159

intake levels of fibre. The insufficient intakes of these nutrients may be
problematic because they have many health benefits. For example, fibre has been
shown to reduce the risk of heart diseases (Anderson, 1995) and colon cancer
(Dwyer, 1993). Calcium can reduce the rate of bone loss (Dawson-Hughes, 1996)
(Kaufman, 1995). The low intake of calcium among the women may be because of
their infrequent consumption of dairy products such as cheese, yogurt and milk.
The Pretest also revealed that while only 20% of the women had heard of the
physical activity pyramid, and very few of them (3% of the total surveyed women)
could correctly match all four physical activity groups with their corresponding level
of the physical activity pyramid. One major reason for this situation is that the
promotion of the physical activity pyramid has not begun on a wide scale in Hong
Kong. Moreover, the additional physical activity knowledge questions showed that
the surveyed women knew little about physical activity recommendations. When
asked whether it is true that ‘The recommended duration for each session of physical
activity is 10 mins', only 17% could correctly state that it is false. Another question
is 'The recommended frequency for physical activity is at least 1 time per week',
only one-fourth of women correctly stated that it is false. In addition, 20% of
women had never thought of or tried to do more physical activity. The findings
suggested that education about the physical activity pyramid and the physical activity
recommendations is necessary for the middle-aged women, so as to help them
develop regular physical activity.
Among the top ten most frequent physical activities, most of them were not of the
vigorous type. Instead, women were found to have frequent sedentary and lifestyle
activities which required less energy. Watching television, having meals and
160

reading were the top three daily physical activities on which the women spent most
of their time, with the mean time of doing these three activities totaling 4.5 hours per
day.
Along with their inadequate nutrition and physical activity knowledge, an
imbalanced diet and sedentary lifestyle, the low awareness of the local women
towards healthy eating and regular physical activity revealed from the Pretest clearly
revealed the urgent need for a health promotion for the local middle-aged women.
4.1.2 Overall Effects of the Program
a. Changes in Knowledge
The Posttest findings showed that only the Education Group significantly increased
their nutrition and physical activity knowledge immediately after the intervention,
reflected from the mean Nutrition Knowledge and Physical Activity Knowledge
Scores. Significant increases were seen in some individual nutrition knowledge
questions, too, including heard of saturated fat and the food pyramid, correct filling
of the food pyramid, and five out of ten true-false questions about saturated fat,
cholesterol, fibre and diabetes. However, almost no increase in correct responses
for two true-false questions concerning cholesterol (kSome foods contain a lot of fat
but no cholesterol,and 'The hardening of blood vessel is mainly caused by too much
cholesterol in diet') were seen. The women were found to know little about these
two questions in the Posttest, still, as the same results in the Pretest. A possible
explanation is that the idea about cholesterol is difficult to the women because it was
not taught clearly enough for them to grasp.
Similarly, some physical activity knowledge questions were significantly improved.
161

However, the proportion of women who correctly answered the questions about
physical activity recommendations did not change significantly between the Pre- and
Posttests, although the health talk had focused on these recommendations.
Education level demonstrated only a minor association with the increase in nutrition
knowledge in the Education Group, but none at all with the physical activity
knowledge. Women who had incomplete primary, lower and upper secondary
showed significant increases in the mean Nutrition Knowledge Score, while no
significant change was observed among only women who had complete primary
education. Age group did not show any association with the changes in either
nutrition or physical activity knowledge in the Education Group. This showed that,
generally, women of any education level or age group could enhance nutrition and
physical activity knowledge from this health promotion program.
The Education Group maintained their increased nutrition and physical activity
knowledge for six months after the intervention. Surprisingly, the Control Group
also significantly increased their mean Nutrition Knowledge Score in the Follow-up.
This may be because after participating in the assessments in the Pre- and Posttests,
the Control Group women had increased interest and paid more attention to nutrition
information, so that improvement was then observed in the Follow-up. Another
reason is that the dropout rate in the Control Group at the Follow-up in which only
49% of the Pretest women maintained. Those women who stayed with the activity
may have been more health conscious, and therefore, their nutrition knowledge was
found to be improved.
When the Education Group was divided into four education levels and two age
162

groups, both nutrition and physical activity knowledge were maintained at the
Follow-up among women of different education levels or age groups. However, the
improvements in nutrition and physical activity knowledge did not show any
associations with the changes in either anthropometric data or health behavior. This
will be discussed later.
b. Changes in Awareness
The changes of awareness toward behavior change were assessed from the stages of
change questions. The stages of change questions revealed that only the Education
Group had significantly improved in decreasing saturated fat intake between the Pre-
and Posttests. At the Posttest, more individuals reported themselves to be in the
action or maintenance stage whereas fewer individuals reported themselves to be in
the precontemplation stage. This implied the program had successfully raised the
women's awareness in decreasing saturated fat intake, and more women maintained
this behavior. This is consistent with a nutrition education program in North
Carolina which was tailored to 378 low-income women aged 18 years or above.
That program showed significant improvements in stages of change in low-fat eating,
as well as low-fat eating knowledge (Campbell et al., 1999). However, there were
no significant changes seen in the stages of change for increasing fruit or vegetable
intakes, or for doing more physical activity. Education level and age group did not
show significant differences in the stages of change for these behaviors.
At six months after the intervention, only the Education Group significantly
increased their awareness about or action toward to increase fruit and vegetable
intakes, and more of the Education Group women reported maintaining their
behavior of eating more fruit and vegetables for six months or more (in the
163
maintenance stage). However, no significant changes were observed in the reported
stages of change for decreasing saturated fat intake or doing more physical activity.
The results suggested that women could change their awareness of increasing fruit
and vegetables intakes, through a period of time. Education level showed no
significant association with the stages of change in either of the behavior changes
assessed, whereas age group did demonstrate association with stage of change in
increasing fruit intake only. Only the older group (aged 40-50 years) showed
significant improvement in that behavior, in which more women reported being in
the action and maintenance stages in the Follow-up when compared with the Pretest.
As for the improvements in knowledge, the improvements in progress towards
behavior change did not demonstrate any association with their changes in health
behavior. In addition, the maintainers of behavior change (those classified in the
maintenance stage) did not show any significant differences in health behavior than
those who reported themselves being in the earlier stages. One of the possible
reasons is that the sample size in these subgroups is too small for a significant
difference to be detected. Although the consumption frequency of fruit was higher
among the maintainers than the women in the earlier stage, this difference was not
statistically significant. Another reason is that some of the women may regard their
consumption, says fruit, was adequate in the Follow-up when compared with the past,
but in fact they did not yet reach adequate consumption frequencies.
c. Changes in Behavior
Regarding their eating and physical activity behavior, only few significant changes
were observed between the Pre- and Posttests, including the daily energy expenditure.
This was maintained in the Education Group between the Pre- and Posttests, but it
164

decreased significantly in the Control Group, indicating that the program could help
maintain the physical activity level of the women. The few significant changes,
perhaps, implied that behavior change takes time to occur as the Posttest was carried
out immediately after the intervention. This situation is consistent with a US
nutrition education program for 337 participants (98% female), which demonstrated
little nutrition-related behavior changes were noted immediately after the 5-class
program. The authors reported that time is required to assimilate the information,
put the information into practice, and succeed enough to report positively (Taylor et
"/.,2000).
Few of the eating and physical activity behavior in the Education Group showed
further significant improvements, also, between the Pretest and the Follow-up.
Desirable changes were observed in the Education Group only for decreasing the
consumption of cream cake. Unexpectedly, the Education Group significantly
increased their consumption frequencies of evaporated milk, candy and chocolate.
Perhaps this was because the Follow-up evaluation in the Education Group was
carried out shortly after the Lunar New Year, and the consumption of candy and
chocolate may be higher in that period, although the 'typical week' criteria in the
question would have been ignored by the respondents. Or, perhaps the women in
the Education Group were now more aware of their actual consumption of these
common snack foods.
In contrast, the Control Group showed significant changes in some of their eating
and physical activity practices between the Pretest and the Follow-up. Significantly
more women met the recommended intake level of calcium and removed all fat from
meat before they ate. However, the Control Group significantly increased their
165

consumption frequency of fried dim sum. Regarding physical activity, a significant
decrease was found in the mean reported daily energy expenditure from physical
activity whereas a significant increase was noted in the mean summary index.
Most of the behavior variables did not change significantly between the Pretest and
the Follow-up, demonstrating a knowledge-behavior gap about healthy lifestyle
exists among local women. This gap was also found from a local study about
diabetic patients, in which no association between diabetes knowledge and behavior
compliance was shown (Chan & Molassiotis, 1999). Rimal stated that self-efficacy
may fill this gap, as revealed from studies that knowledge-behavior correlations were
higher among participants with higher efficacy (Rimal, 2000), but self-efficacy was
not directly measured in this program. Moreover, Marcus et al pointed out that
behavior changes in diet or physical activity may be difficult because people may not
be aware that their current dietary and physical activity habits are unhealthy or the
consequences are too far away to stimulate actions toward making changes (Marcus
et al, 2000). Also, the single class and short activity breaks devoted to physical
activity and health in this program may have been too brief to have stronger impact.
d. Changes in Anthropometry
There were no significant changes in BMI or percent body fat between the Pre- and
Posttests in either the Education or Control Group. Unexpectedly, the fasting total
blood cholesterol level significantly increased in both groups. The Follow-up
showed that both the Education and Control Groups significantly increased their
mean percent body fat and mean fasting blood cholesterol level between the Pretest
and the Follow-up. The increases in percent body fat and blood cholesterol level
may be due to aging and hormonal effects (Torng et al, 2000) (O'Connor et al., 1999)
166

(Chang et al., 2000). The Education Group maintained the cholesterol level
between the Posttest and the Follow-up, whereas the Control Group significantly
increased the level during the same period. The maintenance of blood cholesterol
level in the Education Group may have been due to the increased awareness in
healthy eating among the women, which, through some undetected change in eating
or physical activity habits, may have protected them from further increase in their
blood cholesterol level. Neither education level nor age group showed any
associations with any of the changes in body measurements in either the Education or
Control Group.
4.2 Strengths and Limitations of the Study
The study is the first one that systemically organized and evaluated a health
promotion program about nutrition and physical activity for the Hong Kong middle-
aged women. This study provided information about the women's attitude,
knowledge and behavior towards nutrition and physical activity. It also monitored
the extent of changes among the women in these aspects and evaluated the feasibility
of such kind of health promotion program for the local women. Therefore, this
pilot study fills the gap in the above areas, and serves as a basis for future action and
research.
Limitations of the study should be noticed when interpreting the findings. First,
most of the findings from this study are self-reported. In the present study,
objective measures such as the percent body fat and blood cholesterol level were also
taken, however, to minimize influence of potentially exaggerated self-reported data.
Second, the generalizability of the findings has some limitations. Although the
167

study was designed for the middle-aged women, only self-selected, highly-motivated
women in the women's centre were included (5% of eligible women in Centre One
and 15% in Centre Two). Therefore, women who are not interested in health or not
members of the centre or women members who do not actively participate in the
women's centre activities were excluded. Moreover, the small sample size of this
study may not be representative enough of the Hong Kong middle-aged women's
population. This is because more housewives, with low personal income and of
lower educational level when compared with the general population of Hong Kong
middle-aged women, participated in this study. However, as this is a pilot study,
this sample size is favorable, given the available resources. Even though this group
of respondents was, in theory, a self-selected group, level of expressed interest and
awareness levels were still quite low. Whether this was due to their low education
or is a general phenomenon among Hong Kong women still needs to be established.
Finally, the dropout rate in the two groups (22% and 37% at the Posttest for the
Education and Control Groups, respectively; and 37% and 51% at the Follow-up for
the Education and Control Groups, respectively) may affect the findings because
only the more motivated or more health conscious women remained throughout the
program. This attrition problem affects many health promotion programs, and
represents a challenge to those designing health work.
168

4.3 Implications and Recommendations for Meeting the Challenges of
Improving Hong Kong Middle-aged Women's Nutrition and Physical Activity
Habits
The results indicated that Hong Kong middle-aged women can be taught basic
nutrition and physical activity knowledge, generally irrespective of their education
level and age. Women of different education levels and age can maintain the
nutrition and physical activity knowledge six months after the intervention.
According to Brownel 1, education is the primary step in dietary change because lack
of knowledge may prevent individuals from recognizing the benefits of a healthy diet
(Brownell & Cohen, 1995). After completing the program, women indicated that
they learnt nutrition and physical activity knowledge from it, and would recommend
that their friends to join similar programs in the future.
Behavior change is the most challenging aspect in such a health promotion program,
when compared with improvements in knowledge and awareness, as is shown from
this study that few of the eating and physical activity behavior had significantly
improved. According to Marcus et al, behavior is triggered by cognitive, emotional,
environmental, physical and social factors that interact with each other. The
awareness of these factors would help people to develop a plan to change behavior
(Marcus el al., 2000). Besides, behavioral skills are also important for behavior
change as Brownell and Cohen state that behavioral procedures such as self-
monitoring, stimulus control, coping skills, and relapse prevention are necessary for
programs targeting behavior change (Brownell & Cohen, 1995). Therefore, it is
recommended that future health promotion programs should understand and target
the personal, interpersonal and environmental factors, as well as incorporate
behavioral skills to yield desirable behavior changes.
169

To expand this kind of health promotion program in a larger women's population, the
continued cooperation with local women's centres is recommended because
women's centres can approach many women in the community. Additionally, they
have established linkages with community resources and experience organizing
different kinds of activities which can assist the implementation of the health
promotion program.
Another concern for a health promotion is to minimize the attrition rate. To
encourage participation for the controls, incentives such as supermarket coupons may
be used. Mail or frequent telephone reminders are also possible methods to remind
participants to attend the activities and evaluation. Both of these methods,
however, will increase the cost and/or the labor involved. Reduction of subjects'
burden is another method. Some participants may think that taking dietary record
by themselves is a burden, in this case, telephone interview or other potentially less
burdensome methods of dietary data collection can be explored to gather the
information. To encourage people to attend follow-up assessments, health checks in
additional aspects may also be provided, but it would have to be explored as to which
aspects would attract the women and also how these would add to the costs of the
intervention.
4.4 Suggestions for Future Research
More research should be done among the Hong Kong middle-aged women in order
to expand the knowledge about how to implement effective health promotion for
them. Additionally, more efforts should be paid to changing the dietary and
physical activity habits of the women. Future health promotion programs should
continue to target behavior change but focus still more on behavioral skills to
170

facilitate the changes, for example, participants should learn how to cope with
difficulties when trying to change behavior, how to choose and prepare a healthy diet,
how to set goals for behavior change. Maintaining behavior change is also
challenging, and future research is needed to investigate the best ways to prevent
relapse. In order to sustain the effects of the health promotion programs, women
may keep simple food daily checklists and physical activity daily records to monitor
their eating and physical activity patterns, respectively. Women may be encouraged
to do physical activity together by forming some small groups such as walking group
in order to maintain long-term behavior change. Moreover, competitions between
women's centres can be carried out, to encourage improvements in eating or physical
activity patterns among participants from the women's centre. In addition, future
health promotion may try to involve business sector collaboration to expand
resources, for example, a cereal product company may provide healthy breakfast to
the participants, and at the same time the company can promote their products. The
involvement of the government and Department of Health in health promotion are
also important because they have more influence in creating a health-promoting
environment. To evaluate the effects of future health promotion programs, it is
suggested that long-term follow-up evaluation such as one year or 1.5 year should be
taken because behavior change does take time to occur.
171
CHAPTER FIVE: CONCLUSIONS
It is hoped that this pilot healthy eating and lifestyle promotion program can provide
background information about the knowledge, attitudes and behavior of local middle-
aged women. It is hoped that this work will facilitate the design and development
of future similar programs. In addition, it is hoped that improvements of Hong
Kong middle-aged women's eating and physical activity behavior will be achieved
by future effective longer-term health promotion programs, in order to optimize the
health of the local middle-aged women population.
172

REFERENCES
American Heart Association (2000). An eating plan for healthy Americans.
Anderson, J. W. (1995). Dietary fibre, complex carbohydrate and coronary artery
disease. Can.J.Cardiol. 11 Suppl G, 55G-62G.
Asia-Pacific steering committee (2000). The Asia-Pacific perspective: redefining
obesity and its treatment.
Berg, F. M. (1995). Health risks of weight loss, 3 ed.
Bosnia, H., Appels, A., Sturmans, F., Grabauskas, V., & Gostautas, A. (1995).
Educational level of spouses and risk of mortality: the WHO Kaunas-Rotterdam
Intervention Study (KRIS). Int. J.Epidemiol. 24, 119-126.
Bouchard, C., Perusse, L., Leblanc, C., Tremblay, A., & Theriault, G. (1988).
Inheritance of the amount and distribution of human body fat. Int.J Obes. 12, 205-
215.
Brownell, K. D. & Cohen, L. R. (1995). Adherence to dietary regimens. 1: An
overview of research. Behav.Med. 20, 149-154.
Brownell, K. D. & Cohen, L. R. (1995). Adherence to dietary regimens. 2:
Components of effective interventions. Behav. Med. 20, 155-164.
Campbell, M. K., Honess-Morreale, L., Farrell, D., Carbone, E.,& Brasure, M.
(1999). A tailored multimedia nutrition education pilot program for low-income
women receiving food assistance. Health Educ Res 14, 257-267.
Caplan, G. A., Ward, J. A., & Lord, S. R. (1993). The benefits of exercise in
postmenopausal women. Aust. JPublic Health 17, 23-26.
Census & Statistics Department (1996). 1996 population by census- main tables.
173

Census & Statistics Department (1997). Hong Kong populations projections 1997-
2016.
Census & Statistics Department (1997). Hong Kong social and economic trends
1997.
Census & Statistics Department (1998). Hong Kong annual of digest 1998.
Chan, J. C., Cheung, J. C., Lau, E. M., Wooa, J., Chan, A. Y., Swaminathan, R., &
Cockrama, C. S. (1996). The metabolic syndrome in Hong Kong Chinese. The
interrelationships among its components analyzed by structural equation modeling.
Diabetes Care 19, 953-959.
Chan, Y. M. & Molassiotis, A. (1999). The relationship between diabetes knowledge
and compliance among Chinese with non-insulin dependent diabetes mellitus in
Hong Kong. J.Adv.Nurs. 30, 431-438.
Chang, C. J., Wu, C. H., Yao, W. J., Yang, Y. C., Wu, J. S., & Lu, F. H. (2000).
Relationships of age, menopause and central obesity on cardiovascular disease risk
factors in Chinese women. Int.J.Obes.Relat Metab Disord. 24, 1699-1704.
Cheung, L. T. Diet, physical activities, and parental care in the nutritional health of
Hong Kong primary school children. (1998). The Chinese University of Hong Kong.
Clarke, R., Frost, C., Collins, R.’ Appleby, P., & Peto, R. (1997). Dietary lipids and
blood cholesterol: quantitative meta-analysis of metabolic ward studies. BMJ 314,
112-117.
Coates, R. J., Bowen, D. J., Kristal, A. R., Feng, Z., Oberman, A., Hall, W. D.,
George, V., Lewis, C. E., Kestin, M., Davis, M., Evans, M., Grizzle, J. E., & Clifford,
C. K. (1999). The Women's Health Trial Feasibility Study in Minority Populations:
changes in dietary intakes. Am J Epidemiol. 149, 1104-1112.
Curry, S. J., Kristal, A. R., & Bowen, D. J. (1992). An application of the stage model
of behavior change to dietary fat reduction. Health Educ. Res. 7,97-105.
174

Dawson-Hughes, B. (1996). Calcium and vitamin D nutritional needs of elderly
women. J.Nutr. 126, 1165S-1167S.
Dipietro, L., Caspersen, C. J., Ostfeld, A. M., & Nadel, E. R. (1993). A survey for
assessing physical activity among older adults. Med Sci.Sports Exerc 25, 628-642.
Dixon, L. B” Cronin, F. J., & Krebs-Smith, S. M. (2001). Let the pyramid guide your
food choices: capturing the total diet concept. J.Nutr. 131, 461S-472S.
Dwyer, J. (1993). Dietary fiber and colorectal cancer risk. Nutr.Rev. 51. 147-148.
Fong, P. C., Tam, S. C., Tai, Y. T., Lau, C. P., Lee, J., & Sha, Y. Y. (1994). Serum
lipid and apolipoprotein distributions in Hong Kong Chinese. J
Epidemiol.Community Health 48 , 355-359.
Ford, E. S. (1999). Body mass index and colon cancer in a national sample of adult
US men and women. Am J Epidemiol. 150, 390-398.
Fu, F. H., Chow, B. C., Chung, P. K., & Lobo, L. (1998). The wellbeing of the Hong
Kong people Hong Kong Baptist University.
Gettleman, L. & Winkleby, M. A. (2000). Using focus groups to develop a heart
disease prevention program for ethnically diverse, low-income women. J. Community
Health 25, 439-453.
Glanz, K., Lewis, F. M., & Rimer, B. K. (1996). Health behavior and health
education, 2 ed. Jossey-Bass Inc..
Goran, M. I., Shewchuk, R., Gower, B. A., Nagy, T. R., Carpenter, W. H., &
Johnson, R. K. (1998). Longitudinal changes in fatness in white children: no effect of
childhood energy expenditure. Am J Clin Nutr 67, 309-316.
175

Gottschling, H. D.,Reuter, W., Ronquist, G., Steinmetz, A., & Hattemer, A. (1995).
Multicentre evaluation of a non-wipe system for the rapid determination of total
cholesterol in capillary blood, Accutrend Cholesterol on Accutrend GC.
Eur.J.Clin.Chem.Clin.Biochem. 33, 373-381.
Greenbaum, T. L. (2000). Moderating focus groups Sage Publications, Inc..
Greendale, G. A., Barrett-Connor, E., Edelstein, S., Ingles, S., & Haile, R. (1995).
Lifetime leisure exercise and osteoporosis. The Rancho Bernardo study. Am J
Epidemiol. 141,951-959.
Gurrici, S., Hartriyanti, Y., Hautvast, J. G., & Deurenberg,P. (1998). Relationship
between body fat and body mass index: differences between Indonesians and Dutch
Caucasians. Eur.J.Clin.Nutr. 52, 779-783.
Havas, S., Anliker, J., Damron, D., Langenberg, P., Ballesteros, M.,& Feldman, R.
(1998). Final results of the Maryland WIC 5-A-Day Promotion Program. Am J
Public Health 88, 1161-1167.
He, M., Tan, K. C., Li, E. T., & Kung, A. W. (2001). Body fat determination by dual
energy X-ray absorptiometry and its relation to body mass index and waist
circumference in Hong Kong Chinese. Int.J.Obes.Relat Metab Disord. 25, 748-752.
Hooper, L., Summerbell, C. D., Higgins, J. P., Thompson, R. L., Capps, N. E., Smith,
G. D., Riemersma, R. A., & Ebrahim, S. (2001). Dietary fat intake and prevention of
cardiovascular disease: systematic review. BMJ 322, 757-763.
Hostpital Authority of Hong Kong (1998). Hospital Authority statistics report 97/98.
Huang, Z., Willett, W. C., Manson, J. E., Rosner, B., Stampfer, M. J., Speizer, F. E.,
& Colditz, G. A. (1998). Body weight, weight change, and risk for hypertension in
women. Ann.Intern.Med 128, 81-88.
176
Ito, H., Ohshima, A., Ohto, N., Ogasawara, M., Tsuzuki, M., Takao, K., Hijii, C.,
Tanaka, H., & Nishioka, K. (2001). Relation between body composition and age in
healthy Japanese subjects. Eur. J.Clin.Nutr. 55, 462-470.
Janus, E. D. (1997). The Hong Kong cardiovascular risk factor prevalence study
1995-1996 Hong Kong : Dept. of Clinical Biochemistry, Queen Mary Hospital.
Kaufman, J. M. (1995). Role of calcium and vitamin D in the prevention and the
treatment of postmenopausal osteoporosis: an overview. Clin. Rheumatol. 14 SuppI 3,
9-13.
Ko, S., Lee, T. K., Guldan, G. S., Chan, U., Chan, M., Hui, W., Khor, S., Kim, Y. T.,
Lok, J., Ng, S., & Shing, S. (1995). Dietary intake, food habits and nutrition
knowledge of adults- a telephone survey in Hong Kong (1990-91). Nutrition
Research 15, 633-645.
Kuczmarski, R. J., Flegal, K. M., Campbell, S. M., & Johnson, C. L. (1994).
Increasing prevalence of overweight among US adults. The National Health and
Nutrition Examination Surveys, 1960 to \99\.JAMA 272,205-211.
Lau, E. M. (1995). The epidemiology, treatment and prevention of osteoporosis in
Hong Kong Chinese. HKMJ 1 ,31 -37.
Lau, E. M. (2000). Women's health in Hong Kong. Hong.Kong.Med.J. 6’ 341-342.
Lee, I. M., Rexrode, K. M.,Cook, N. R., Manson, J. E., & Buring, J. E. (2001).
Physical activity and coronary heart disease in women: is "no pain, no gain" passe?
JAMA 285, 1447-1454.
Leung , S. F., Ho, S., Woo, J., Lam, T. H., & Janus, E. D. (1997). Hong Kong adult
dietary survey 1995.
Macdonald, S. M., Reeder, B. A., Chen, Y., & Despres, J. (1997). Obesity in Canada:
a descriptive analysis. Canadian Medical Association Journal 157, 3S-9S.
177

Manson, J. E., Colditz, G. A., Stampfer, M. J.’ Willett. W. C., Rosner, B., Monson, R.
R., Speizer, F. E., & Hennekens, C. H. (1990). A prospective study of obesity and
risk of coronary heart disease in women. N.Engl. J Med 322, 882-889.
Marcus,B. H., Clark, M. M., & Bock, B. C. (2000). Promoting Adoption and
Maintenance of Physical Activity and Dietary Behavior Change. In Exercise,
nutrition, and the older woman : wellness for women over fifty, ed. Fiatarone Singh,
M. A., pp. 545-560. CRC Press.
Marks, B. L., Ward, A., Morris, D. H., Castellani, J., & Rippe, J. M. (1995). Fat-free
mass is maintained in women following a moderate diet and exercise program. Med
Sci.Sports Exerc 27, 1243-1251.
Martinez-Gonzalez, M. A., Martinez, J. A., Hu, F. B., Gibney, M. J., & Kearney, J.
(1999). Physical inactivity, sedentary lifestyle and obesity in the European Union.
Int.J.Obes.Relat Metab Disord. 23, 1192-1201.
Mezzetti, M., La Vecchia, C., Decarli, A., Boyle, P., Talamini, R., & Franceschi, S.
(1998). Population attributable risk for breast cancer: diet, nutrition, and physical
exercise. JNatl.Cancer Inst. 90, 389-394.
Moreno, C., Alvarado, M., Balcazar, H., Lane, C., Newman, E., Ortiz, G., & Forrest,
M. (1997). Heart disease education and prevention program targeting immigrant
Latinos: using focus group responses to develop effective interventions.
J.Community Health 22, 435-450.
National Cholesterol Education Program (2001). Executive Summary of the Third
Report of the National Cholesterol Education Program (NCEP) Expert Panel on
Detection, Evaluation, and Treatment of High Blood Cholesterol in Adults (Adult
Treatment Panel III). JAMA 285, 2486-2497.
Negri, E., Pagano, R., Decarli, A., & La Vecchia, C. (1988). Body weight and the
prevalence of chronic diseases. J Epidemiol. Community Health 42, 24-29.
178
O'Connor, K. G., Harman, S. M., Stevens, T. E., Jayme, J. J., Bellantoni, M. F.,
Busby-Whitehead, M. J., Christmas, C., Munzer, T., Tobin, J. D., Roy, T. A.,Cottrell,
E., St Clair, C., Pabst, K. M., & Blackman, M. R. (1999). Interrelationships of
spontaneous growth hormone axis activity, body fat, and serum lipids in healthy
elderly women and men. Metabolism 48, 1424-1431.
Parmenter, K. & Wardle, J. (1999). Development of a general nutrition knowledge
questionnaire for adults. Eur. J.Clin.Nutr. 53, 298-308.
Pascale, R. W., Wing, R. R., Butler, B. A., Mullen, M.’ & Bononi, P. (1995). Effects
of a behavioral weight loss program stressing calorie restriction versus calorie plus
fat restriction in obese individuals with NIDDM or a family history of diabetes.
Diabetes Care 18’ 1241-1248.
Rexrode, K. M., Hennekens, C. H., Willett, W. C., Colditz, G. A., Stampfer, M. J.,
Rich-Edwards, J. W., Speizer, F. E., & Manson, J. E. (1997). A prospective study of
body mass index, weight change, and risk of stroke in women. JAMA 277, 1539-
1545.
Rimal, R. N. (2000). Closing the knowledge-behavior gap in health promotion: the
mediating role of self-efficacy. Health Commun. 1 2 , 219-237.
Rosenstock, I. M. (1974). Historical origins of the health belief model. Health
Education Monographs 2, 328-335.
Sahyoun, N. R., Hochberg, M. C., Helmick, C. G., Harris, T., & Pamuk, E. R. (1999).
Body mass index, weight change, and incidence of self-reported physician-diagnosed
arthritis among women. Am J Public Health 89, 391-394.
Salamone, L. M.,Cauley, J. A., Black, D. M., Simkin-Silverman, L., Lang, W.,
Gregg, E., Palermo, L., Epstein, R. S., Kuller, L. H.,& Wing, R. (1999). Effect of a
lifestyle intervention on bone mineral density in premenopausal women: a
randomized trial. American Journal of Clinical Nutrition 70, 97-103.
179

Samaras, K., Kelly, P. J., Chiano, M. N., Arden, N., Spector, T. D., & Campbell, L.
V. (1998). Genes versus environment. The relationship between dietary fat and total
and central abdominal fat. Diabetes Care 21, 2069-2076.
Sapp, S. G. & Jensen, H. H. (1997). Reliability and validity of nutrition knowledge
and diet-health awareness tests developed from the 1989-1991 diet and health
knowledge surveys. Journal of Nutrition Education 29, 63-72.
Shumaker, S. A., Schron, E. B., Ockene, J. K., & McBee, W. L. (1998). The
handbook of health behavior change, 2 ed.,pp. 59-62. Springer Publishing Company,
Inc., New York.
Shumaker, S. A., Schron, E. B., Ockene, J. K., & McBee, W. L. (1998). The
handbook of health behavior change, 2 ed., pp. 8-10. Springer Publishing Company,
Inc., New York.
Slattery, M. L., Edwards, S. L., Ma, K. N., Friedman, G. D., & Potter, J. D. (1997).
Physical activity and colon cancer: a public health perspective. Ann.Epidemiol. 7,
137-145.
Steinmaus, C. M., Nunez, S., & Smith, A. H. (2000). Diet and bladder cancer: a
meta-analysis of six dietary variables. Am. J. Epidemiol. 151, 693-702.
Taylor, T., Serrano, E., Anderson, J., & Kendall, P. (2000). Knowledge, skills, and
behavior improvements on peer educators and low-income Hispanic participants
after a stage of change-based bilingual nutrition education program. J. Community
Health 25, 241-262.
The Family Planning Association of Hong Kong (1993). Report on women's health
survey.
Torng, P. L., Su, T. C., Sung, F. C., Chien, K. L., Huang, S. C., Chow, S. N., & Lee,
Y. T. (2000). Effects of menopause and obesity on lipid profiles in middle-aged
Taiwanese women: the Chin-Shan Community Cardiovascular Cohort Study.
Atherosclerosis 153, 413-421.
180

Toubro, S. & Astrup, A. (1997). Randomised comparison of diets for maintaining
obese subjects' weight after major weight loss: ad lib, low fat, high carbohydrate diet
vs fixed energy intake. BMJ 314, 29-34.
Tuomilehto, J.,Lindstrom, J., Eriksson, J. G., Valle, T. T., Hamalainen, H., Ilanne-
Parikka, P., Keinanen-Kiukaanniemi, S., Laakso, M., Louheranta, A., Rastas, M.,
Salminen, V., & Uusitupa, M. (2001). Prevention of type 2 diabetes mellitus by
changes in lifestyle among subjects with impaired glucose tolerance. N.Engl.J.Med.
344, 1343-1350.
Vijayalakshmi, K., Mallikharjuna, R. K., Prasanna, K. T., Thummala, C. R. R.,
Parvathi, E., & Kamala, K. (1999). Dietary factors as determinants of hypertension:
A case control study in an urban Indian population. Asia Pacific J Clin Nutr 8, 184-
189.
Wang, J. & Deurenberg, P. (1996). The validity of predicted body composition in
Chinese adults from anthropometry and bioelectrical impedance in comparison with
densitometry. Br.J.Nutr. 76, 175-182.
Weinsier, R. L., Nelson, K. M., Hensrud, D. D., Darnell,B. E., Hunter, G. R., &
Schutz, Y. (1995). Metabolic predictors of obesity. Contribution of resting energy
expenditure, thermic effect of food, and fuel utilization to four-year weight gain of
post-obese and never-obese women. J Clin Invest. 95. 980-985.
Weisburger, J. H. (1997). Dietary fat and risk of chronic disease: mechanistic
insights from experimental studies. J.Am.Diet.Assoc. 97, S16-S23.
Woo, J.,Ho, S. C., Chan, S. G., Yu, A. L., Yuen, Y. K., & Lau, J. (1997). An
estimate of chronic disease burden and some economic consequences among the
elderly Hong Kong population. J Epidemiol. Community Health 51, 486-489.
Woo, J.,Leung, S. S., Ho, S. C., Sham, A., Lam, T. H., & Janus, E. D. (1999).
Influence of educational level and marital status on dietary intake, obesity and other
cardiovascular risk factors in a Hong Kong Chinese population. Eur.J Clin Nutr 53,
461-467.
1 8 1

Appendix V
香港婦女健康生活評估活動參加同意書
香港中文大學現正進行一項婦女健康習慣的調查,目的爲瞭解現時香港婦女對健
康的看法及其健康的行爲,以籌劃合適的健康推廣活動。在未來的一年,你將會
被邀請參加三次活動。每次活動將包括簡單身體檢查,如量度身高、體重、身體
脂肪百分比及血液膽固醇,塡寫有關健康習慣的問卷和飮食記錄。在量度血液膽
固醇時,需要在手指尖抽5-6滴血液,而抽取的過程是絕對安全及衛生的。如參
與是次硏究,你便能進一步知道自己的健康狀況。硏究所收集的一切資料將會絕
對保密,只作爲硏究分析之用。
本人 (參加者姓名)已經完全明白是次硏究的目的及內容,亦有機
會詢問並得到滿意的回覆。本人同意參與是次硏究。
如有任何問題,歡迎致電26035830聯絡負責人鮑敬文先生。
參加者簽名:
見證人簽名: 曰期:
1 8 2

Appendix V
Women^s Healthy Lifestyle Assessment Activity Consent Form
The Chinese University of Hong Kong is now conducting research about women's
health habits. The purpose is to understand women's ideas about health and
women's health behavior, in order to plan of appropriate health promotion in future.
Over the next year, you are invited to participate three activities. Each activity will
include simple body measurements such as height, weight, percent body fat and blood
cholesterol level, a health questionnaire and a food record. For the blood cholesterol
measurement, about 5-6 drops of finger tip blood is needed with appropriate attention
to hygiene. If you participate in this research, you will learn more about your health
status. All the data will be kept confidential and will be used only for research
purposes.
I (participant's name) fully understood the research purpose and
content, and have had the opportunity to ask questions about it with satisfactory
responses. I agree to participate in this research.
If you have any questions, please feel free to contact us at 26035830.
Participant's signature:
Witness' signature: Date :
183

Appendix V
問卷編號:
香港婦女飮食及運動習慣調查
香港中文大學現正進行一項婦女飮食及運動習慣調查,目的爲瞭解現時香港婦女
對健康的看法,以籌劃合適的健康推廣活動。你的積極參與會爲是次調查提供寶
貴的資料,請仔細考慮每條問題並回答所有問題,而這裡沒有對或錯的答案。在
本問卷上塡寫的一切資料將會絕對保密,只作爲硏究分析之用。
第一部份:飮食習慣 此欄不用塡寫
1. 一星期中,你有幾多日會吃早餐? 日 ( )
2. 一星期中,你有幾多日會吃午餐? 日 ( )
3. 一星期中’你有幾多日會吃晚餐? 日 ( )
4.你每日會食幾多次小食(早午晚三餐以外的食物) ? 次 ( )
5.你有沒有定時服食營養補充劑呢?
•⑴有’是哪樣呢? ( )
( )
• (O)沒有 ( )
( )
6.當你吃肉類(豬,牛,羊等)的時候,如看見脂肪在肉上,你會 ( )
• (0)從不吃肉類
• (1)吃前除去所有脂肪
• (2)吃前除去部分脂肪 ( )
• (3)不除去任何脂肪
7.當你吃家禽(雞,鴨,鵝,乳鶴等)的時候,你會
• (0)從不吃家禽
• (1)吃前除去所有皮
• (2)吃前除去部分皮 ( )
• (3)不除去任何皮
8.在家中,你是否負責煮飯呢?
• ⑴ 是 ( )
• (0)不是
184

9.你/你家人煮餸和食用時(如搽麵包) 常用的油是哪樣呢?可選超過一項 此欄不用塡寫
• (O)不知道 口⑶橄欖油 ( ) ( )
• ⑴ 粟 米 油 口(6)椰油 ( ) ( )
• ⑵ 花 生 油 [11(7)牛油或人造牛油 ( ) ( )
• ⑶ 芥 花 籽 油 • (8)豬油或雞油 ( ) ( )
• (4)葵花籽油 口 (9)其他’請註明 ( ) ( )
10.當你/你家人煮以下食物時, 常用的煮食方法是哪樣呢? 多選3種方法
不知道蒸 灼 / 赞 湯 炒 煎 炸 燉 坟 燒 烤 微 波
魚 • • • • • • • • • •
豬 牛 肉 • • • • • • • • • •
雞 鴨 鵝 • • • • • • • • • •
蔬菜 • • • • • • • • • •
H.你是否爲家人買食物呢?
• ⑴ 是 ( )
• (0)不是
12.當你首次買或進食某一樣包裝食品時,你會閱讀食品標籤嗎?
• (0)從不1轉答後面第二部份
• ⑴ 間 中
• ⑵ 經 常 ( )
• (3)每次都會
13.你覺得食品標籤淸晰嗎?
• (0)非常不淸晰
• (1)不淸晰
• (2) 一般 ( )
• (3)淸晰
• ⑷ 非 常 淸 晰
185
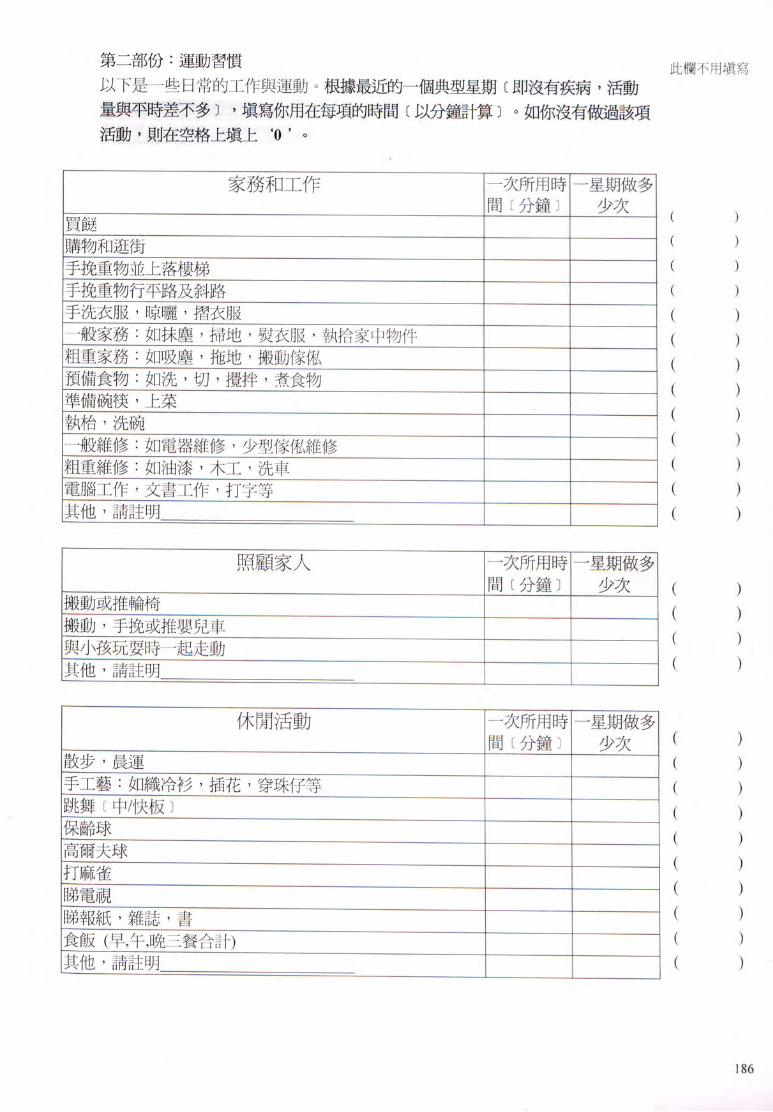
第二部份:運動習慣 此欄不用塡寫
以下是一些日常的工作與運動。根據 近的一個典型星期〔即沒有疾病’活動
量與平時差不多〕,塡寫你用在每項的時間〔以分鐘計算〕。如你沒有做過該項
活動,貝(I在空格上塡上‘O , O
家務和工作 I 一次所用時I 一星期做多
間〔分鐘〕 少次 ( 、
買餸 一 ( )
購物和逛街 一 ( )
手挽重物並上落樓梯 一 ( )
手挽重物行平路及斜路 一 ( )
手洗衣服,晾曬,摺衣服 — ( )
一般家務:如抹塵’掃地,熨衣服,執拾家中物件 — ( )
粗重家務:如吸塵,拖地,搬動傢權、 一 ( )
預備食物:如洗,切,攪拌,煮食物 一 (
準備碗筷,上菜 —
執枱,洗碗 — ( )
一般維修:如電器維修,少型傢ffi維修 一 ( )
粗重維修:如油漆,木工,洗車 — ( )
電腦工作,文書工作,打字等 ~ ( )
其他,請註明 ( )
照顧家人 I 一次所用時I 一星期做多
間〔分鐘〕 少次 ( )
搬動或推輪椅 ZZZZI ( ) 搬動,手挽或推嬰兒車 —
與小孩玩耍時一起走動 — ( )
其他,請註明 ( )
休閒活動 I 一次所用時I 一星期做多
間〔分鐘〕 少次 (
)
散步’晨運 Z Z Z H ( )
手工藝:如織冷衫,插花,穿珠仔等 一 ( )
跳舞〔中/快板〕 “ ( ) _保齡球 — ( )
高爾夫球 “ —
打麻雀 ““ (
-蹄電視 “ ~ ( )
1弟報紙,雜誌,書 一 “ (
)
養飯(早,午,晚三餐合計) Z Z Z I I ( )
1他,請註明 ( )
1 8 6

運動 I 一 次 所 用 時 I 一 星 期 做 多 I 此 欄 不 用 塡 寫
間〔分鐘〕 少次
急速步行(會令你感到氣喘),行山 一 ( )
瑜珈,太極,六通拳或伸展運動 一 ( )
健身運動或健康舞 —
單車或健身單車
W w —
“ 一 ( )
mW ~ ( )
羽毛球,乒乓球 ~ ( )
網球,籃球,排球“ 一 ( )
其他,請註明 ( )
1.在上個星期或上個月中’你有多少次至少十分鐘而令你心臟劇烈跳動
的運動呢?只需塡 a或 b行
a )上星期 有 次,每次 分鐘 ( )
b)上個月 有 次,每次 分鐘
2.在上個星期或上個月中,你有多少次連續行路至少十分鐘,但沒有令你 •
心臟劇烈跳動呢?只需塡a或b行
a )上星期 有 次,每次 分鐘 ( )
b)上個月 有 次,每次 分鐘
3.你平均每日花多少時間在需要走動的工作呢?請指出真正走動的時間
小時 ( )
4.你平均每日花多少時間站立?
小時 ( )
5.你平均每日花多少時間坐下(如食飯’睇電視’睇報紙)? ( )
小時
6.你平均每日行多少層樓梯(1層等於10-12級樓梯)?
層 ( )
7.你剛才塡寫是春天的活動量’與其他季節比較’活動量有沒有不同呢?
(1)非常少(2)較少 (3)與春天差不多(4)較多 (5)非常多
夏天 • • • • • ( )
秋天 • • • • • ( )
冬天 • • • • • ( )
187

第三部份:行爲上的改變 此欄不用塡寫
1.你知道甚麼是飽和脂肪嗎?
•(1)知道
• (O)不知道=> 轉答第5題 ( )
2.以下哪一句 能表達你進食飽和脂肪的行爲呢?
• (1)從無想過或試過食少些
• (2)過去有想過或試過食少些’而現在沒有,也沒有信心將來可以做到。
• (3)過去有想過或試過食少些’而現在沒有’但有信心將來可以做到。 ( )
• (4)現在已食少了 ’並維持了 6個月或以下。
• (5)現在已食少了,並維持了超過6個月。
3.當你嘗試食少些飽和脂肪時,有沒有遇到任何困難呢?
•⑴有,請註明 ( )
: ( )
• (0)沒有 ( )
( ) 4.有甚麼方法可以幫你食少些飽和脂肪呢?
( )
( )
( ) 5.以下哪一句 能表達你進食新鮮水果的行爲昵?
• (1)從無想過或試過增加食多些
• (2)過去有想過或試過食多些’而現在沒有’也沒有信心將來可以做到。
• (3)過去有想過或試過食多些’而現在沒有,但有信心將來可以做到。 ( )
• (4)現在已食多了,並維持了 6個月或以下。
• (5)現在已食多了,並維持了超過6個月。
6.當你嘗試食多些新鮮水果時’有沒有遇到任何困難呢?
•⑴有’請註明 ( )
( )
• (0)沒有 ( )
( ) 7.有甚麼方法可以幫你食多些新鮮水果呢?
( )
( )
( )
1 8 8

8-以下哪一句 能表達你進食蔬菜的行爲呢? 此欄不用塡寫
• (1)從無想過或試過增加食多些
• (2)過去有想過或試過食多些’而現在沒有,也沒有信心將來可以做到。
• (3)過去有想過或試過食多些’而現在沒有,但有信心將來可以做到。 ( )
• (4)現在已食多了,並維持了 6個月或以下。
• (5)現在已食多了,並維持了超過6個月。
9.當你嘗試食多些蔬菜時’有沒有遇到任何困難呢?
•⑴有’請註明 ( )
( )
• (O)沒有 ( )
( ) 10.有甚麼方法可以幫你食多些蔬菜呢?
( )
: ( )
( ) 11.以下哪一句 能表達你運動的行爲呢?
• (1)從無想過或試過做多些
• (2)過去有想過或試過做多些’而現在沒有’也沒有信心將來可以做到。
• (3)過去有想過或試過做多些,而現在沒有’但有信心將來可以做到。 ( )
• (4)現在已做多了,並維持了 6個月或以下。
•⑶現在已做多了,並維持了超過6個月。
12.當你嘗試做多些運動時’有沒有遇到任何困難呢?
•⑴有’請註明 ( )
• (0)沒有 ( )
13.有甚麼方法可以幫你做多些運動呢?
189

第四部份:營養知識
請指出以下句子是對或是錯’並在空格加上V,號。 此欄不用塡寫
� ( O ) (2)
對 錯 不 知 道
1.蛋白比蛋黃有更多飽和脂肪。 • • • ( )
2.脫脂奶比全脂奶有更多飽和脂肪° • • • ( )
3.有些食物有大量脂肪’卻完全沒有膽固醇。 • • • ( )
4.高膽固醇食物比高飽和脂肪食物更能增加血液膽固醇。• • • ( )
5.白麵包比全麥麵包有更多食用纖維。 • • • ( )
6•全脂奶比脫脂奶有更多蛋白質。 • • • ( )
7.冷藏與新鮮肉類有相同的營養。 • • • ( )
8.食太多高糖份的食物會導致糖尿病° • • • ( )
9.血管硬化主要是飮食中的膽固醇過高。 • • • ( )
10.高纖維的飮食能幫助預防結腸癌o • • • ( )
11.你有否聽過或見過‘食物金字塔’呢?
• ⑴ 有
• (0)沒有1轉答後面第五部份 ( )
12.請將以下食物放入‘食物金字塔’的括號中?只需塡寫食物旁邊的數字在
括號內
1.蔬果類
2.油,鹽和糖
3.飯麵類
4.肉類和奶類製品
赢 : :
Z LJ A ( ) 食物金字塔
190

第五部份:運動知識
請指出以下句子是對或是錯,並在空格加上7,號。 此欄不用塡寫
� ( O ) (2)
對 錯 不 知 道
1.定期做運動可減少患上成人型糖尿病的機會。 • • • ( )
2.定期做運動會增加患上高血壓的機會。 • • • ( )
3.定期做運動可減少患上骨質疏鬆症的機會° • • • ( )
4.連續的有氧運動(1次做30分鐘)與分開3次做
(每次10分鐘)’同樣可以提高心肺功能。 • • • ( )
5.有氧運動是提高心肺功能的 有效方法。 • • • ( )
6.健康舞是一種有氧運動° • • • ( )
7-根據建議’每次運動至少要10分鐘。 • • 口 ( )
8-根據建議’ 一星期至少要做1次運動。 • • 口 ( )
9.如要身體健康,要做比一般活動更爲劇烈的運動° • • • ( )
10.你有否聽過或見過‘運動金字塔’呢?
• ⑴ 有
• (0)沒有。轉答後面第六部份 ( )
n.請將以下運動放入‘運動金字塔’的括號中?只需塡寫運動旁邊的數字在
括號內
1.伸展運動和強化肌肉運動
2.有氧運動
3.曰常生活中的運動
4.休息或不做運動
::
運動金字塔
191

匕匕
S
)
)
)
)
)
)
)
)
)
)
)
)
)
)
)
)
)
)
)
)
) ) )
)
)
)
0
W
丨
巨
4
¾
用
(
(
(
(
(
(
(
(
(
(
(
(
(
(
(
(
(
(
(
(
(
(
(
(
(
(
出
不
選
欄
並
物
的
^
(
6
)
雖
曰对����������曰匆���������日匁�����
�
�
_
每
2
-
3
每
2
-
3
每
2
-
3
0
1 M
DnnDnnnnn 曰
IOntIlnn
�
�
仔
每
I
^
每
1
�
每
W
食
4
)
4
)
撤
期匆����������期匆::口:::口000口0
期
�
�
的
星
6
星6
星6
Od
1
-
-
_
1
-
5
5
5
a
�
)
)
)
S 3
3
3
艇
J
匆����������期匆���������期匁����� •
•
§
。
星
4
星4
星4
M -
_
-
-
1
,
一虎 .
3
3
3
臉
‘
J知����������期如���������期如����� �
�
纟
麇
K
星
星,
星,
^mm -
2 一
2
一
2
•請格 j}
j}
j}
1
,
空
期
n
期G
期G
I品在 曰1
次••••••••••星次•••••••••星次•••••••
魁職, :1
1 .
1
I
物
次
請
食
食
6食的
�
慰
I
i
f
份f難?���������� WnnnDDnnnn
WDDnnn
�
�
靴
是
妮
^
/
^
等等!^
AgTXE澍附 奶
穌
確
穌
_樹_脑
第
以
表
酪
脂奶
從
包
/
f
i
r
從
撞
型
撞
熟
乳
奶
奶
低
力
包麵
米麵麵_
腐
份
中
份
煮
士
酪
脂
糕
脂
脂
鈣
古
奶
奶 麵
麥
司
飯
飯
|
|
粉
&
食
腐
豆
竹
皮
竹
果
個
菜
亂
芝
乳
低
雪
全
低
高
朱
鍊
淡 白
全
壽
炒
白
紅
炒
湯
即
豆
炸
腐
腐
枝
生
一
蔬
一

m
)
)
)
)
)
)
)
)
)
)
)
) )
)
)
)
)
)
)
)
)
)
)
)
)
)
)
)
)
)
)
)
)
)
9
3
塡
丨
ffl (
(
(
(
(
(
(
(
(
(
(
( (
(
(
(
(
(
(
(
(
(
(
(
(
(
(
(
(
(
(
(
(
(
不 l
此 \
~/
、~/
6
6
日
gncunnnsnnnon H^DDnDn
�����������������
每
2
-
3
每
W
H
M
nDDDn
�����������������
每Q
+
每
U
\
/
、^/
ffl-nDnnnnnnDnnn 期^(400000
�����������������
星6
星6
1
• 1
-
5
5
3
3
^^nnnDDnnnnnnn 期匆00000
�����������������
星:;
星4
- -
.
-
3
3
,
�����������������
星^
?汐
1
.
2
.
2
I
I
3JJ
\~,
_
期
C
-
'
W
1
^•••••••••••口 1¾••口••
•••••••••••••••••
-
1
1
•••••••••••口 •••••••••••••••••
、
肉
肉
^
V
r
s
舶
磨
從
g 條 种
憐
管
好
忌忌點
條
水
心
�
顶
树
洲
对
/
v
f
l
魚
彳
包
包
s
/
�
力
汽
鬼 點、」
料
醬
醬
應赁:/^漁池鄉/^翼啕肉腿腸 堡
柳
撻
餅
餅
他
明
餅
條
餅
片
果
古
水
肥
炸
什
W
I
f
r
油
造
生
律
炒
烚
煎
蒸
煎
煎
煎
雞
沙
煙
火
香 漢
魚
蛋
西
西
其
註
薄
薯
薯
薯
糖
朱
汽
减
油
牛
煎
蒸
牛
人
花
沙

第七部份:個人資料 此欄不用塡寫
1.請問你今年幾多歲呢?
歲 ( )
2.你的教育程度是:
• (1)從未接受教育/幼稚園
• (2)小學〔未完成課程〕
• (3)小學〔完成課程〕
• (4)初中〔中一至中三〕 ( }
• (5)高中〔中四至中七〕
• (6)大專,大學或以上
3.你的婚姻狀況是:
• 0 )單身
• (2)已婚
• (3)離婚/分居 ( )
• (4)喪偶
4.你的職業是:
•⑴沒有工作〔非家庭主婦〕
•⑵全職工作
• (3)兼職工作 ( )
• (4)家庭主婦
5.你的家庭成員〔包括你在內〕共有多少人?
• ⑴ 1 人
• ⑵ 2 人
• (3)3 人
• (4)4 人 ( }
• ⑶ 5 人
• (6) 6人或以上
6.你的家庭每月總收入大約畏:
• (1) $5,000 或以下
• (2) $5,001-10,000
• (3) $10,001-15,000
• (4) $15,001-20,000
• (5) $20,001-25,000 ( )
• (6) $25,001-30,000
• (7) $30,000 以上
194

7.你的個人每月總收入大約是: 此欄不用塡寫
• (O)無收入
• (1) $1-1,000
• (2) $1,001-2,000
• (3) $2,001-3,000
• (4) $3,001-4,000
• (5) $4,001-5,000 ( )
• (6) $5,001-10,000
• (7) $10,001-15,000
• (8) $15,000 以上
8-你有沒有以下的疾病呢?
⑴有 (0)沒有
糖尿病 • • ( )
高血壓 • • ( )
高膽固醇 • • ( )
高血脂 • • ( )
骨或關節痛 • • ( )
貧血 • • ( )
其他’請註明 • • ( )
9.與其他差不多年紀的婦女比較’你認爲自己的健康如何9
• (1)非常差
• (2)較差
•⑶跟她們差不多 ( }
• (4)較好
•⑶非常好
10.你希望知道健康的資料嗎?
•⑴希望,請註明 ( )
• (0)不希望 ~ ( )
11•如你能夠改善自己的健康’會是哪方面呢?
你的名字:中文 英文—
聯絡電話: 問 卷 完 畢 ^ W ^ o
195

Appendix V
Survey ID
Hong Kong Women's Dietary and Physical Activity Survey
This survey is carried out by The Chinese University of Hong Kong. It aims at collecting information about your ideas about health so that appropriate health-improving interventions can be organized in future. Your kind cooperation will contribute much to this survey, so please answer all the questions after you have considered each one carefully. There are no right or wrong answers. All information will be kept confidential and used only for research purposes.
Part I) Dietary Habits
1. How many day(s) per week do you have breakfast? day(s)
2. How many day(s) per week do you have lunch? day(s)
3. How many day(s) per week do you have dinner? day(s)
4. How many between-meal snacks (food excluding that from regular meals) per day do you take? time(s)
5. Do you take any nutrient supplements regularly?
• (1) Yes. What kind(s)?
• (0) No
6. When you eat meat (e.g. pork, beef, lamb), if you see some fat on the meat, you would Q (0) Do not eat meat
• (1) Remove all the fat before eating
D (2) Remove some of the fat before eating
• (3) Do not remove any fat
7. When you eat poultry (e.g. chicken, duck, goose, pigeon), you would O (0) Do not eat poultry
• (1) Remove all skin before eating
D (2) Remove some skin before eating
• (3) Do not remove any skin
8. Are you responsible for cooking at home?
• (I)Yes
• (0) No
196

9. Which type(s) of oil do you/your family use for cooking and eating (e.g. spreading on bread)?
Could choose more than one.
• (0) Don't know • (5) Olive oil
• ( I )Corn oil • (6) Palm oil
• (2) Peanut oil 口 (7) Butter or Margarine
• (3) Canola oil 口 (8) Lard or Chicken oil
• (4) Safflower oil • (9) Others please specify
10. Which cooking methods do you/your family most frequently use for the following food?
丨 or each food item,maximum three cooking methods can be chosen.
Don't Steam Boil Stir fry Fry Deep fry Stew Grill Barbecue Microwave Know
F i s h • • • • • • • • • •
Pork/Beef • • • • • • •
Chicken/Duck/ Goose • 口 口 口 I I l ~ I l I l
Vegetable • • • • • 匚
11. Are you responsible for buying food ?
• � Yes
• (0) No
12. When you buy or eat a new packaged food, how often do you read the food label?
• (0) Never 4 Go to Part II on next page
I I (1) Sometimes
• � Usually
• (3) Every time
13. How clear is the food label to you?
• (0) Very unclear
• � Unclear
• (2) So-So
• (3) Clear
• (4) Very clear
197

Part II) Physical Activity
Here is a list of common types of physical activities. Please think carefully about each activity and
write down how much time (in minutes) you spent doing each activity during a recent typical week
(when you had no illness, and your working level was normal for you). If you have not done that
activity, please write down ‘O,.
Housework and Work ~ Minutes !Frequency per time per week
Buying food Shopping Stair-climbing while carrying a load Walking flat while carrying a load Laundry (time loading, unloading, folding only) — Light housework: tidying, dusting, sweeping, ironing, collecting trash in home. Heavy housework: vacuuming, mopping, scrubbing floors and walls, moving furniture. Food preparation: chopping, stirring, cooking food — Food service : setting tables, carrying food, serving food. Dishwashing : clearing table, washing/drying dishes, putting dishes away. Light home repair: small appliance repair, light home maintenance/ repair. Heavy home repair: painting, carpentry, washing/polishing car Computer work, clerical work, typing-Other, please specify
Care giving Minutes !Frequency
— ^ per time per week Lifting, pushing wheelchair Lifting, carrying, pushing stroller Chasing children during playing Other,please specify
198

Recreational activities Minutes !Frequency ~; per time per week Leisurely walking, morning walk Needlework: knitting, sewing, needlepoint, craftwork 一
Dancing (moderate/fast) Bowling Golf Playing mahjong Watching TV Reading newspaper, magazine, book Eating (total time for the 3 regular meals) Other, please specify
Exercise Minutes Frequency per time per week
Brisk walking (makes you feel breathless) or hill walking Yoga, Tai Chi, Liu Tong Quan, stretching exercises — Vigorous calisthenics, aerobics Cycling, exercycle Rope skipping Swimming Running Badminton, table tennis Tennis, basketball, volleyball Other, please specify
~ 11 ' I . .
199

1. About how often during the past week or month did you participate in vigorous activities that
lasted at least 10 minutes and caused a large increase in heart rate? FiU in line a or b only.
a ) times per week, minutes per time
b ) times per month, minutes per time
2. About how often during the past week or month did you walk for at least 10 minutes or more
without stopping which was n o t strenuous enough to cause large increases in heart rate? Fill in
line a or b only.
a ) times per week, minutes per time
b ) times per month, minutes per time
3. About how many hours a day do you spend moving around on your feet while doing things?
Please state only the time that you are actually moving.
hours
4. About how many hours per day do you stand?
hours
5. About how many hours did you spend sitting (such as when eating, watching television, reading etc) on an average day?
hours
6. About how many flights of steps (about 10-12 steps) do you climb each day?
flights
7. Please compare the amount of physical activity that you do during other seasons of the year with
the amount of activity you just reported. For example, do you do more or less activity than what
you reported? Check the appropriate box. Consider this survey as 'spring' activity.
(O (2) (3) (4) (5)
Much less Little less Same Little more Much more Summer • • 口
Fall • • Q
Winter 口 • 口 [
200

Part III) Changing Behavior
1. Do you know what saturated fat is?
• (1) Yes
] ( 0 ) No Go to Q5
2. Which of the following best describes vour behavior regarding saturated fat intake?
• (1) Never thought of or tried to reduce the intake.
• (2) H a v e thought or tried, but currently not reducing, and have no confidence to reduce in the future.
• � Have thought or tried, but currently not reducing, and have confidence to reduce in the future.
• (4) Currently reducing, have been limiting 6 months or less.
• (5) Currently reducing, have been limiting more than 6 months.
3. When you tried to decrease the intake of saturated fat. did you have any difficulties?
• (1) Yes, please specify
• (0) No
4. What would help you to decrease the intake of saturated fat?
5. Which of the following best describes vour behavior regarding fresh fruit intRke^
• (1) Never thought of or tried to increase the intake.
口 (2) Have thought or tried, but currently not increasing, and have no confidence to increase in the future.
• (3) Have thought or tried, but currently not increasing, and have confidence to increase in the
future.
D (4) Currently increasing, have been increasing 6 months or less. • (5) Currently increasing, have been increasing more than 6 months.
6. When you tried to increase the intake of fresh fruit, did you have any difficulties?
• (1) Yes, please specify
• (0) No
7. What would help you to increase the intake of fresh fruit?
201

8. Which of the following best describes your behavior regarding vegetables intake?
• (1) Never thought of or tried to increase the intake.
• (2) Have thought or tried, but currently not increasing, and have no confidence to increase in the future.
Zl (3) Have thought or tried, but currently not increasing, and have confidence to increase in the future.
• (4) Currently increasing, have been increasing 6 months or less. • (5) Currently increasing, have been increasing more than 6 months.
9’ When you tried to increase the intake of vegetables, did you have any difficulties?
• (1) Yes, please specify
] ( 0 ) No
10. What would help you to increase the intake of vegetables?
11. Which of the following best describes your behavior regarding doing physical activity?
• (1) Never thought of or tried to increase the frequency or duration.
• (2) Have thought or tried, but currently not increasing, and have no confidence to increase in
the future.
口 (3) Have thought or tried, but currently not increasing, and have confidence to increase in the future.
D (4) Currently increasing, have been increasing 6 months or less. • (5) Currently increasing, have been increasing more than 6 months.
12. When you tried to increase your physical activity frequency or duration, did you have any difficulties?
• (1) Yes, please specify
• (0) No
13. What would help you to increase your physical activity frequency or duration?
202

Part IV) Nutrition Knowledge
State whether the following statements are true or false. Please put a ‘,,in a box.
(1) (0) (2) T F Don't know
1. Egg white has more saturated fat than egg yolk.
2. Skim milk has more saturated fat than whole milk.
3. Some foods contain a lot of fat but no cholesterol.
4. High cholesterol food has a greater effect than high
saturated fat food on raising blood cholesterol level. • • 口
5. White bread has more fibre than whole wheat bread.
6. Whole milk contains more protein than skim milk.
7. Frozen foods have the same nutrients as fresh foods.
8. Eating a lot of sugars will cause diabetes.
9. The hardening of blood vessels is mainly caused by
too much cholesterol in the diet.
10. A high fibre diet can help prevent colon cancer.
11. Have you ever heard of or seen the food pyramid?
• (I)Yes
• (0) No => Go to Part V on next page
12. Please arrange each of the following food groups to its correct level of the food pyramid. Put the : : : � / .: � ... :. V: • :. ::: : • . :.. .: •::' f :: ‘ :.: .... '::;•••.
number only of the food group in the brackets. 1 .Vegetables and Fruits 2. Oils, Fats, Salt and Sugar. 3. Cereals 4. Meats and Dairy products
Ax Z LJ A The Food Pyramid
203

Part V) Physical Activity Knowledge
State whether the following statements are true or false. Please put a in a box.
(1) (0) (2)
丁 F Don't know
1. Regular exercise decreases the chance of adult-onset d i abe te sQ • •
2. Regular exercise increases the chance of hypertension. • • 口
3. Regular exercise decreases the chance of osteoporosis. • • 口
4. Both continuous (one 30-minute session) and intermittent
(three 10-minute sessions) aerobic exercise can build
cardiovascular fitness. 口 I ~
5. Aerobic physical activities are the most effective one in
developing cardiovascular fitness. • • [
6. Aerobic dance is one kind of aerobic exercise. • • [
7. The recommended duration for each session of physical
activity is at least 10 minutes. • • IZ
8. The recommended frequency of exercise is at least one
time per week. ~~| | ~ 9. Exercise must be hard enough to require more exertion
than normal to produce gains in health-related fitness. • • [
10. Have you ever heard of or seen the physical activity pyramid?
• ( I )Yes
• (0) No => Go to Part VI on next page
11. Please arrange each of the following physical activities to the physical activity pyramid. 1 ut the number only of the different physical activity groups in the brackets.
1. Exercise for flexibility and muscular strength
2. Aerobic and active sports
3. Lifestyle physical activity
4. Rest or Inactivity
急 '~— \
The Physical Activity Pyramid
204

Part VI) Food Frequency Table
Here is a list of common foods and beverages. Think carefully about each one and how often you
consume it in a recent typical week. Then put a ' Z, in the box under the frequency that most
closely represents your consumption frequency.
Not consume 1/wk 2/wk 3-4/wk 5-6/wk 1/day 2-3/day
(0) (1) (2) (3) (4) (5) (6)
Cheese • • • • • • •
Yogurt • • • • • • •
Low fat yogurt • • • • • • •
S c r e a m • • • • • • •
Whole milk • • • • • • •
Skimmilk • • • • • • •
High Calcium
low fat milk • • • • • • •
Chocolatemilk • • • • • • •
Condensed milk • • 口 • • • 口
EvaporatedmilkQ • • • • • •
Not consume 1/wk 2/wk 3-4/wk 5-6/wk 1/day 2-3/day (O) (1) (2) (3) (4) (5) (6)
Whitebread • • • • • 口 •
Whole wheat b r e a d • • • • • • • Sushi • • • • • • •
Fried rice • • • • • • • pIainrice • • • • • • •
Red/brown rice 口 • 口 • • 口 口
noodles • • • • • • •
Noodles in soup 口 • 口 • • 口
Cup noodles/
Instant noodles • • • • • • •
205

06
2
y y
:!§
•••••• •
WDnnnnnnDDnnn
3 3
I
I
2
2 !
����口 �
•
DnDnnnnnnnnn
11
- -
5 5
• •
•
nnDDnnnnnnnn
言昼• •舊__
2
2
C
k
v
k
}
口
�
IonnSOODODOOD
11
N..::^.:.. ..
••,
••。
、,
.今.
〜
'
\
\
. ...
、:,
:
IHI
n
:
-
、,.).:.,.,
^
Tle
Llm
n
s
l
S
u
^
WDDDnn a
Oe
口(;������������
_ tol
哪
.
�
咖
h
e
l
l
叩
cH
嫩
ggghflsefAick.wl
tofsheskig ㈨u
m
t
a
b
l
a
l
s
t
w
g^fls^-achlkengl
鄉
m
.
l
e
d
f
u
f
u3
a
n
u
l
t
e
d
i
g
e
q
u
a
請 d
.
l
l
e
d
_
-
s
d
e
d
l
c
k
r
d
i
§
m
脱
T
O
F
r
T
O
T
O
B
e
F
r
u
I
v
e
(
e
q
b w^Friste^Fri^ch%BaHasal

7
2
1(6)••口 • •
••••••••••••
•••••
3 -
2 柳
⑶��� �
�
������������ �����
// IP.
一
二::“
...
::'::¾.:
11 1
�口口口 口
�
������������ �����
-
5 ^
wnnn •
•
••••••••••••
•••••
-3 /
Wk
⑵••• •
•
••••••••••••
•••••
2 /
Wk
⑴••• •
•
••••••••••••
•••••
1
職
、
• •
••••••••••••
•••••
N
o
t
) -
^
w
a
i
m
l
g
e
r
l
s
h
e
l
e
_
s
t
r
y
吨
i
e
s
w
n
.
- :
I
J
l
l
s
l
t
d
i
n
e
u
t
t
e
.
i
叫
3
-
f
r
t
a
k
⑶
a
k
i
p
a
s
p
e
c
汗 s
c
h
s
a
t
l
n
k
a
l
a
r
f
f
a
.
L
m
d
.lnbu比
b
u
-
o
l
c
l
c
c
r
e
w
e
s
p
c
h
b
o
i
e
o
l
d
r
l
s
o
c
h
d
d
l
e
d
ta
.Iletgg二 =
=71 _
a
s
h
o
t
a
t
a
n
d
h
o
co
f
t
d
l
e
t
M
e
e
fn
Z
H
F
E
M
h
M
c
n
o
p
l
I 朽 £H£ccsoDYaBeFrstsuBUMpesa

Part VII) Personal data
1. How old are you?
years
2. What is the highest education level you attained?
• (1) No formal schooling/ kindergarten
I I (2) Some Primary
• (3) Completed Primary
I I (4) Lower Secondary (Form 1-3)
• (5) Higher Secondary (Form 4-7)
I I (6) Post Secondary, University or above
3. What is your marital status?
• (I)Single
• (2) Married
口 (3) Divorced/Separated
• (4) Widowed
4. What is your employment status?
• (1) No work (not housewife)
• (2) Full-time
• (3) Part-time
• (4) Housewife
5. How many household members (including yourself) do you have?
• (1)1 person
• (2) 2 people
• (3) 3 people
• (4) 4 people
• (5) 5 people
• (6) 6 people or above
6. Which of the following ranges represent your total monthly household income
• (1) $5,000 or less
• (2) $5,001-10,000
• (3) $10,001-15,000
• (4) $15,001-20,000
• (5) $20,001-25,000
• (6) $25,001-30,000
• (7) More than $30,000
208

7. Which of the following ranges represent vour own monthly income?
• (0) No income
• (1)$1-1,000
• (2) $1,001-2,000
• (3) $2,001-3,000
• (4) $3,001-4,000
• (5) $4,001-5,000
• (6) $5,001-10,000
• (7) $10,001-15,000
• (8) More than $15,000
8. Do you have any of the following diseases?
(I)Yes (O)No
Diabetes 口 口
Hypertension
High blood cholesterol
High blood triglycerides • •
Bone or joint diseases
Anemia
O t h e r s , please specify
9. How do you rate your health, when compared with other women of similar age?
• (1) Far worse
• (2) Worse
口 (3) About the same
• (4) Better
• (5) Far better
10. Is there anything you would like to learn about health?
] ( 1 ) Yes, please specify
• (0) No
11. If you could improve your health, what would you improve?
Your name: Chinese English
Contact no:
End of Questionnaire.
Thank You!
209

A p p e n d i x E
食 物 份 量 與 器 皿 容 量 照 片
• . 生 雞 翼 丨 両 … , . ‘ 熟 雞 翼 1 両
_ “納卵从細** …卿料科m H灿«L ^ “扑认»• 以J ” . u ” •“叫—.,.„ .. -SC� ^ ^ ^tt..、 ,^^^immm^L
. ^ ― ^ _ _ _ _ 丨 |
^^ WJ9
”、、、、"、、: *�. r
. » 書 «: Sfti
— ^ n w 5.5 ^ 5 s M m械m m 脚 脚 譽 料々*竹料科^补^鄉 "、、柳/作口 I^J
矽 、、棚如丨喻i A CAtMaiii Wi iV - l 丨 „ , ^ , , . pfe A -.',-..,.,VV,. ,. ,.�
墨 ::
11,11111 . MI11""11111 •科.:^TOrr8^^.!!^^
« $ . H I .缘
作 生 魚 腩 1 両 m 熟魚腩 1両
• _ � ?、} • ‘ i 1¾;
生魚尾 3両 •、、’ 孰魚厚 3両 、丨她細她&麵“!!;!!赢办乂、、, - • . . j. I ‘ • ‘ ‘‘ ‘ >
—"•""Y 广 •• •” ‘丨 •
^竹^ ““絲:::::• •• 生紅衫 2両 , …‘、‘ 熟紅衫 2両 210

,k “ 二 ; 生 豬 机
1両 ,, . M , “ „牌, .熟猪机 1両
.•躲 m fit m 職 峡 ^ ‘
_ _画圓
• ^^ 生豬肉
1両 《 «^ * - 熟 豬 肉 1 両 ―
: W ‘ # ~ 生 排 骨 1 両 * ‘ ’“ 孰排骨1両
^K' i為 n m n ^ ^ ^ I / » � � J 7 r « 显 I h h J
•J-AW^X-WJ-^vscsxv�V ? j *"" ‘' S 够1 ** 、’.
I ^ .W 聊 . .
橙 小 中 大 ‘ ‘ ‘ 提子3両 11 ii — • J1 …._…V ’ • l>t ?«
明1
寻
…々丄二::么:西瓜250 g 211

> % ^ ( % » ,
鄉铋秘娜M狄m m ^ ^ ^ ^ ^ •絲脉•料微胁议械M , ^ ^ i l X 1
p I i r : : : 1 r i m
- J > Jf4^ , ^ ; ""I “ ^ » . ‘ :
80 ml 150 ml 220 ml 卩 180ml 200ml 200ml 300ml ' W' ^
— — / / ‘
150m丨 180ml 220m丨 230ml 250ml 5 nil 9 ml 12ml 17 nil .:;:,
i ‘ 二——
IOOmI 140 ml 180 ml 250 ml _ 250 ml 290 ml 330 ml 450 ml ^ _,_::•:、:。:, : … . . . . " " . — - ~ ~ : — ^ —
a z 1 L

Appendix F
I Photos for Food Amount Quantities and Household Measures
z * ‘ r- #,誦
B二 Sk
.
糕: ^ , 4 0 g / l t a e l (raw) 40 g / 1 tad (cooked) 粉綠树 Jw 丨,丨�聊糊 ^ m mm _ _ m VW rn JL X U 外 W 队.UU. m UU , , 训 聊 柳 , „ , . „„•• W ,
、气霸寧::代、/ ••詹峰彻,胁 .‘ …知�,… �…^^itfitf纖
� C f & ?"' 二 r h 料 j
* “ "1 2 2 0 g Z 5 . 5 t a e I ( r a w ) 拟 - , ” 2 2 0 g / 5.5 tael (cooked)
V y V — - L 40 g / 1 tael (raw) ^ M „ m 40 g / 1 tael (cooked)
H m H p
, B ::"二 120 g / 3 tael (raw) : 120 g / 3 tael (cooked) 一一L “ U ™ — _ , . Ii I ^
f “ 倫 ‘
' ' * j T T v'"' J I . » ” . 80 g / 2 tael (raw) ^ — 权 8 0 g / 2 tael (cooked)

r -iI —,
: 二 j 40 g / l t a e l (raw) _ , j 40 g / l t a e l (cooked)
HHHHHB JK UHjjj^k
40 g / 1 tael (raw) w _ 40 g / 1 tael ( c o o k e d ) .
树 — 4 0 g / 1 tael (raw) , 40 g / 1 tael (cooked) j ” •
1 ——:
small medium large “‘ ' ' 23 grapes/135 g ^ ^ ^ ^ ^ ^ B m - M m t »
•丨
- m … 钱 ; 二 二 ^ 杯 250 g 214

急
辨权 I ^K 書
糾….〉4 0 g / 1 tael (raw) 料 , _ 40 g / 1 tael (cooked)
遂 ' : . : : L — —
100 g / 2 . 5 tael (raw) „ 100 g / 2 . 5 tael (cooked)
8 0 m» 150 ml 220 ml | 180 ml 200 ml 200 ml 300 ml
. . ..
P f f P P i 150 ml 180 ml 220 ml 230 ml 250 ml g J L 5 ml 9 ml 12 ml 17 ml
‘ . ' M ^ M m w - ^ j
m m m y \ / / \ mm
^ ^ 1 … %
ll""™-
100 ml 140 ml 180 ml 250 ml | 250 ml 290 ml 330 ml 450 ml
™;-

Appendix V
飮食記錄(例子)
"時間 食物 份量 進食地點 9:00am 牛油多士 —
~ ~ 1.多士 一 1 塊 —
2-牛油 1 茶 匙 — —
火腿通粉 一 一 大家 g
1.火腿 半塊 一
2 . 通 g 1 標 準 碗 一
3-什豆 — 1湯匙
熱奶茶 1杯 _ 大家樂
12:30pm 癞餃 一 2 粒
燒賣 — 2粒 酒 g
蓮蓉飽 1個 g g
煎腸粉 “ 3 條 — 酒樓
揚州炒飯 “ 一 酒樓
1.火腿 — 1湯匙
2.雞蛋 1湯匙 一
3.蝦仁 一 8隻
4.飯 _ 2 酒樓碗一
4:30pm — 1 個
: 維他檸檬茶250 ml 一 1包 家中 —
^ O O p m 菜心炒牛肉 _ 家中
1.菜心 4條
2.牛肉 一 2両
3.栗米油 2湯匙
豉汁蒸烏頭 2両 ^
1.栗米油 2 湯 匙 一 “
青紅蘿蔔煲豬骨湯 家中 —
1.豬肉 1両
2 .湯 標準碗一
2 標 準 碗 — 家中
i o o p m 橙(中型) U
“11 :00pm雞蛋腐竹糖水 “ 家中 —
1.雞蛋 一― 1 隻 一
― ― 2.腐竹糖水 1標準碗
216

Appendix H
Dietary Record (Sample) T i m e Food item Quantity/ Serving size Place
8:00am Toast with butter Cafe de Coral 1. Toast 1 piece 2. Butter 1 tea spoon
Macaroni with ham Cafe de Cora厂
1- Ham 1/2 slice 一
2. Macaroni 1 standard size bowl — 3.Mixed vegetable discs 1 table spoon
H o t t e a 1 cup Cafe de Coral—
12:30pm Shrimp dumpling 2 pieces Chinese restaurant
Siu-mai 1 piece Chinese restaurant
Lotus seed paste bread 1 bun Chinese restaurant
Fried cheung-fun 3 rolls ‘ Chinese restaurant
Fried rice in Yeung Chao Style Chinese restaurant
1 • Ham 1 table spoon ~ 2- Egg 1 table spoon 3. Shrimp 8 pieces 4- Rice 2 Chinese restaurant
bowls
Opm Egg tart 一1 item Home 一
VITA lemon tea 250ml 1 pack Home
7:30pm Stir fried Choi sum with Beef " Home 1. Choi sum 160g 2. Beef 2 taels 3. Corn oil 2 table spoons —
Steam fish with fermented soybean 4 table spoons H o m e ~ 1 • Corn oil 1 table spoon “
Chinese soup with red turnip , green Home turnip and pork bones
1. Green turnip 2 taels 2. Red turnip 2 taels ~ 3. Pork bones 1 taels 4. Soup 2 standard bowls
Rice 1 standard bowl Home
9:00pm Orange (medium) Htem Home
11:00pm Sweet soup with egg and tofu-sheet Home L Egg 1 item 2. Sweet soup with Tofu sheet 1 standard bowl
217

Appendix I
飮食胃己錄(1) 星期六或星期日
你的名字:中文 問卷編號:
英文 電話:
時間 食物 份量 進食通 I T ^
218

飮食言已錄(2) 星期一至五其中一曰
你的名字:中文 問卷編號:
英文 電話:
時間 食物 份量 進食M i T "
219

飮食記錄(3 ) 星期一至五其中一曰
你的名字:中文 問卷編號:
英文 電話:
時間 食物 份量 進 食 ^ ^
220

Appendix J
Dietary Record (1)
Saturday or Sunday Name: Chinese Survey ID :
English
Telephone no:
T i me Food item Quantity/ Serving size Place
221

Dietary Record (2)
One day from Monday to Friday Name: Chinese Survey ID :
English
Telephone no:
Time Food item Quantity/ Serving size Place
222

Dietary Record (3)
One day from Monday to Friday Name: Chinese Survey ID :
English Telephone no:
Time Food item Quantity/ Serving size Place
223

何謂膽
固醇
? 一
^^
^ 何
謂B
MI
? 醒
膽固
醇是
一W
l旨性
物
^^
BM
I (B
od
y M
ass
Ind
ex)就
是身
體質
量指
質’
由身
體肝
臟製
造出
來,
亦可
從食
物中
數,
用以
評估
身高
體重
的比
例是
否合
乎標
吸取
,例
如蛋
黃、
內臟
、魷
魚、
肉類
等。
準。
杳
港中
5:
大學
如果
血液
中的
膽固
醇過
高,
會容
易積
聚在
血管
壁上
,使
血管
硬化
和狹
窄,
而導
致血
“―
&键
必从
13
u
T
o
大水
圍婦
女聯
口曾
口辦
管
栓塞
、中
風、
冠心
病等
。
如何
計算
我的
BM
I
?
計法
:體
重(
公斤
〕+身
高(
米)
2
婦女
健康
飮食
及運
動推
廣活
動
知多
D,「脂」少
D
例子:
脂肪
主要
分爲
兩大
類:
《八
广,
^也
..
..
55公斤,1.57米
健康
講座
(一
)
(1
)不
飽和
脂肪
B
MI二
55
+(1
.57
)2=
22
.3
[ )
从入
�
�叙
彻仏
从化
电斤
粟米
汕、
花生
油、
芥花
籽油
、^j k
k
K^
J 飲
食、
運動
與你
的健
康舊
葵花
籽油
,橄
欖油
含較
多不
^^
, T
Q \
I
飽和
脂肪
,有
助降
低血
液中
如何
評估
我的
BM
I
? \
^
的膽
固醇
’但
這&汕
類仍
有
^ 女丨生
m
iY
mm
^m
m
飽和
脂肪
和高
卡路
里,
所以
不應
吃太
多。
過輕
<18.5
妊丛胺駅灯
脰呢
(2
)飽
和脂
肪
過重
2
3.0
-2:9
跟隨
食物
金字
塔
牛油
、肥
肉、
雞皮
、臘
腸、
肥豬
骨湯
、糕
肥胖
2
5.0
或以
上
*
餅’
全脂
奶等
食物
含較
多飽
和脂
肪’
進食
以上
的例
子(B
MI=
22.3
)便是
屬於
理想
了
o
iM
k
過多
含高
飽和
脂肪
的食
物會
提高
血液
中
felA
k
的膽
固醇
,增
加患
上心
臟病
和中
風的
機
第二
次講
座
會’
所以
應該
避免
進食
° 日
期:
10
-6-2
00
0
(显期
六)
M
MM
1M
^k
時問
:2
:00
-3:3
0
pin
^^
^ 題
目:
-選
揮’
麗删
腊
jM
m
rj
‘ Z
t

I 健
康生
活習
慣的
重要
性
食物
金字
塔
蔬菜
類、
水果
類
⑴預
防慢
性疾
病,
如:
心臟
病、
糖尿
應吃
大量
,包
括各
J
^i
病、
高血
壓、
中風
、癌
症等
O
/K
類蔬
果及
水果
,這
(2)改
善體
質,
並維
持理
想體
重O
j
i油
、鹽
及糖
些
食物
含大
量纖
W
^k
K
⑶減
慢身
體衰
老的
速度
。
量少
食
維素
、礦
物質
及維
/;
)7
肉,
家禽
,蛋
,
他命
,是
維持
身體
鬌
•“
,
如何
實踐
?
奶類
豆類
%両
機能
的必
需品
°
瓜菜
類^
¾¾
¾^
¾^
生果
類
^
均衡
飮食
+適量
運動
6両
以j^
^R
ij^
i^個
奶類
^
便_
_的
方法
二二
二
K;
血
•
i .
..
….
..
•
豐富
的蛋
白質
及鈣
質,
幫助
X
j^
J^
^^
維持
牙齒
及骨
骼的
健康
。
^^
!i
wl
rl
M^
^
註:
每天
應喝
6至
8杯
流質
飮品
,如
開
水、
—
肉類
、蛋
類及
豆類
o
應吃
適量
’包
括:
瘦
^f
^^
m
五毅類
S
l^
L二
^
^m
MM
jM
吃多
,包
括:飯
、粉
」
N ,1
白質
,有
助肌
肉發
展。
黃豆
類製
品是
這類
J^
^/
^g
fm
麵、
麵包
、餅
乾、
麥片
、¢^¾¾!
食物
的重
要成
員。
^^
^^
^ 和
粟米
片等
。這
類食
物M
iS
m
^]
¾!
二二
=;
m¥
脂肪
、油
、後
及糖
類
:m
\m
S
lfI H
wff
l批ffi
源。
應
吃少
,因
含高
熱
^^
^^
量,
吃過
量會
引肥
胖^
^^
^^
及其
他疾
病。
to
r
J
a

r
健康
煮食
小貼
士
®
1.煲
湯前
出水
,肉
去皮
去肥
2.用
瘦肉
代替
五花
腩或
肥豬
肉
3.用
易潔
鑊,
少落
油
4.上
湯代
替食
油
香港
中交
大學
5.烹
調後
倒去
多餘
的油
T
【八
^t
6.坟、蒸、侷、烚、烤、灼相比煎和炸是較健康的
天
水圍
細女
聯合
會合
辦
7.多
選用
深綠
色的
蔬菜
、少
油快
炒
8.蔬
菜可
用水
及少
量油
、鹽
灼熟
婦女
健康
飮食
及運
動推
廣活
動
健康
飲食
小貼
士
1.可
利用
隔油
杯撇
去湯
上的
汕份
2.少
吃內
臟,
如豬
腰、
蝦頭
、魚
頭和
肥肉
等
健康
講座
(二
)
3.多
吃麥
片或
麥皮
,不
但味
美,
更含
豐富
纖維
和蛋
白質
!
/i
#古
# I,
^L ^
n^
^ 4.混
合丨勺米與紅米或糖米
健
康J、
調、
出夕
卜用
腊敦
門、
5問
巾以
麥包
代替
白麵
包
食物
標籤
知多
D
一―
健康食物選擇
/V
較佳
選擇
較證
選擇
M
^K
屮.
白阪
/湯
河粉
/麵
/米
粉/烏
冬/通
粉炒
飯/粉
麵/公
仔麵
魚片
/鲮
魚球
/魚
皮較
牛腩
/牛
雜/炸
魚皮
謹粉
油
器嫌
_ ’煎-堆
两餐
JpjlglK
餐
包(
免牛
油)
/咸
豬仔
包Z果
醬多
士瓯
多士
Z奶
醬多
/奶
油多
i
^g
ff
^f
ff
l^
^^
_全
麥麵
包,法
國麵
包
献食
物z
牛浦
——
I雜菜
沙律
(免
沙律
醬)
/新
鮮水
果
I布甸
/奶
昔/雪
糕
IO
ro
On

^^膽
固醇
和脂
肪的
每天
建議
攝取
量
食品
標籤
之營
養成
份(N
UT
RIT
IOJV
FA
CT
S)
總脂
肪•
•減
少飮
食中
的脂
肪量
,降
低至
總熱
量的
30
%
NU
TR
ITIO
N F
AC
TS(某
朱古
力的
營養
成份
)
飽和
脂肪
:減
少飽
和脂
肪至
總熱
量的
10
%
Serv
ing S
ize(食
用份
量)
l b
ar
(1
^)
單元
不飽
和及
多元
不飽
和脂
肪:
各佔
總熱
量的
10
%
se
mn
gs
Per
Co
nta
iner
1
膽固
醇:
少於
30
0毫
克
侮包裝所含的食用份量)
常用
油類
的脂
肪成
份比
較
Ca
lorie
s(卡
路里
)2
30
多元
不飽
和脂
肪單
元不
飽和
脂肪
飽和
脂肪
C
alo
ries
fro
m f
at
100
Perc
en
tag
e D
ail
y V
alu
es(
IJi)
植物
性花
生油
3
2%
4
6%
1
7%
(從
脂肪
中得
到的
卡路
里)
粟米
油
59
%
24
%
13
%
To
tal
Fa
t (總
脂肪)
12g
18%
?^花
辛子油
2
9%
5
9%
7
%
Satu
rate
d f
at(飽
和脂
肪)
7
g
36
%
橄欖
油
9%
7
4%
1
4%
C
ho
lest
cro
K 膽
固醇)
IO
mg
3%
動物
性豬
油
12
%
45
%
39
%
Smliu
m(鈉
)
65
mg
3%
人造
牛汕
3
3%
3
7%
18
%
Tot
al C
arbo
hydr
ate
29g
10%
I牛油
4
%
30
%
65
%(
總碳
水化
合物
)
Die
tary
Fib
er(食
用纖
維)
<
lg
3%
常見
食物
的脂
肪與
飽和
脂肪
佔總
熱量
的百
分比
及膽
固醇
的含
量
Sugar
s(糖)
2
4g
常見
食物
脂肪
佔總
熱量
飽和
脂肪
佔總
熱墩
的
膽岡附(迤
克)
Pr
otei
n(?f
i[-l
W)
I e
的西
分比
(%
) 百
分比
(%
) V
it
am
in
A(維
他命
A)
负柳
也
43.H
1
9J
50
V
it
;,
mi
n
C(維
他命
C)
。%
屮薯
條
—
47.8
10.2
0 趵
6%
漢堡
包
31.8
17
.6
37
Ir01
1(鐵)
0%
T^
Z;
T:
Z
T
,Z
註:
Perce丨
丨丨
age
Dai
ly
Va
lue
s是
根據
每天
20
00卡
路里
熱量
的建
議營
L
l 無,
46.8
2
0 1(
)()
養攝
取量
麥
樂雞
(六
件)
50
0
31
3
55
氏顾
^里
雜錦
piz
za (—件)
5
6,6
32
參考
資:
1)
EN
Wh
itn
ey &
SR
Rol
fcs.
Und
erstn
mU
nv N
utrit
ion.
19
93
熱狗
8L
3 5±
9 27
“
�
2)
AB
Nat
ow
& J
Hesl
in.
Th
e F
ast
-Food
Nu
trit
ion
C
ou
nte
r.
1994
炒飯
(一
標準
碗)
35,4
17
CA
星州
炒米
(一
碟)
6
63
1L
9
39
0
炒運
68
,2
IO
21
3
g I 恰
虽
61
.9
L^
Z
21
3

1
; •—
•—…
.___
____
—
r
何謂
基因
?
MSU
iliiftsi
4.
HiG
對蟲
害的
抵抗
力,
從而
減少
使用
除
國
越因
是由
脫氧
核糖
核酸
(DN
A)聚
合而
成。
不同
的
蟲劑
。
DN
A俳
列組
合會
構成
不同
的基
因,
從而
決定
植物
m
么n
M
MM
t
q
和動物的特質。
基因
改造
食物
會否
影響
我們
的健
康?
香港
中文
大學
>所
有基
因改
造食
物都
會接
受由
生產
公司
及
^s
ft
qp
^
mm
-h
-m
^^
^m
许、
止备
从:
从店
饰
來源
地方
監管
機構
的嚴
格測
試和
安全
評估
° 胥
港大
水圍
如艾
聯口
曾
口辦
改造
食物
基因
的原
理
> 評
估的
基礎
是以
「實
質等
同」
爲原
則。
很多
移植
到農
作物
內的
DN
A片
段是
按照
動物
或
> 「
實質
等同
」是
將原
本與
基因
改造
的食
物進
細菌
的基
因排
列複
製的
:
行多
方面
比較
(包
括毒
理、
過敏
性和
營養
成
份等
),
如兩
者沒
有差
別時
,就
符合
標準
。
科學家按照某個動物或細菌基因的排序
V所
以,
現時
市場
出售
的基
因改
造食物
都不
會
U
比原本的食物不安全
。
婦女
健康
飮食
及運
動推
廣活
動
什麼
食物
是基
因改
造?
再移植入農作物中
黃
豆,
粟米
,芥
花籽
,蕃
茄,
馬鈴
薯,
花生
等。
#
$ f 二、
在香
港約
有20%的
加工
食品
含趟
因改
造成
份’
^
^ I 二
}
註:
不是
由動
物或
細菌
中直
接抽
取基
因放
入農
作包
括即
食麵
,粟
米造
的零
食’
豆腐
,贾
奶,
兒萤
^
iK
^ ^
pi
物內
的,
而是
放進
某一
棵植
物中
,以
產生
種子
作用
的苣
奶粉
等。
U
農作
物的
生產
。
在外
觀上
,大
部份
基因
改造
食物
與原
產品
大致
相
^ft
ra #
、生
i ^
n
農作
物有
了該
段外
來的
DN
A片
段後
’便
擁有
那同
’要
分辨
的話
,便
只有
利用
生.物
化學
的方
法。
個基
因功
能,
如抗
蟲、
抗農
藥和
抗乾
旱等
。
標f
t制
度
為4十
麼要
改造
食物
基因
?
現時
香港
並沒
有規
定基
因改
造食
物要
附上
標
^^
ii
ri
ir
ii
^^
改造
食物
基因
有以
下好
處:
籤,
但政
府正
考慮
標籤
制度
的可
行性
,並
同意
於
1.增
加食
物的
產量
’解
決糧
食問
題。
2-3年
內實
施°
nm
ii
ii
i^
^f
f 2.令
農作
物更
能適
應不
利的
生長
環境
’例
如提
高未
解裝
的問
題
3.改
良食
物的
營養
成分
及品
質,
例如
增加
稻米
的基
因食
物對
健康
,環
境和
農業
的長
期性
影饗
?
to
OO

I ^
r
食得
安全
D
>保持
煮食
地方
淸潔
,以
免招
惹蟲
鼠。
食
物安
全溫
度指
標
以下
食物
很容
易受
到細
菌或
毒素
的沾
染。
如
> 淸
潔和
消毒
食具
器皿
,並
要存
在防
麈防
蟲的
攝
氏100度
:沸
騰,
細菌
死亡
。
‘
處理
不當
’進
食後
便感
染食
物傳
染病
。
碗櫃
內。
、
彻
;::;;;•
J^
S
攝氏
74度
:烹
調食
物的
溫度
‘:
'‘
‘.
I
高危
食物
I所
沾染
的細
菌或
毒素
f
1魚
生’
糖及
壽司
監門
g�
溶二
攝氏。度以上:保持熱働的溫度’:‘’;::.::::
菌’葡萄球菌,李斯特菌
P
^f
ej
^^
^W
f 十
爐細
汽:
:,
v'
i “
2
.甲/貝
殻類
海產
甲型
肝炎
,霍
亂,
麻疹
性
’
大多
數細
菌不
會繁
殖,
但仍
能生
存。
•,,
(屯豪’
ft,
青口
等)
貝类頁中毒
一—
I
V
3.深
海珊
湖魚
、
g卡
毒
一烹
調鼠
1進
食一
攝
氏4至
63度
:稱
爲「
危險
地帶
」’
;;.,'I ‘;'
4.燒
味,
歯味
沙門
氏菌
,金
黃葡
萄球
菌、
蔬菜
要徹
底洗
浸和
煮熟
’以
防農
藥中
毒o
食物
不宜
存放
於這
個範
圍°
—
I -
(叉
燒,
燒鴨
,燒
鵝等
) >
深度
冷藏
的食
物要
完全
解凍
後才
可烹
煮
‘
H|
|
^八
爪魚
’海
蜇
副溶
血性
弧菌
— >
徹底
煮熟
食物
,留
意食
物的
巾心
部份
亦巳
煮
攝氏
4度
以下
:冷
凍食
物的
溫度
,大
6.自
製沙
律,
冷藏
奶李
斯特
菌
熱至
少攝
氏74度
。
多數
細菌
不會
繁殖
,但
仍能
生存
。
類食
>
徹底
翻熱
隔夜
飯菜
丨
L7
-^
^ >
食物
煮熟
後要
盡快
食用
’否
則應
放在
「安
全
攝氏
-1
8度
••
急凍
食物
的溫
度,
一些
Hf
l
如何
預防
食物
傳染
疾病
溫
度J〔
攝氏
4度以
下的
雪概
內或
攝氏
63
細菌
會生
存。
^
^^
r _
度以
上的
熱概
內貯
存:1。
歉力
_ >
應設
有兩
套砧
板和
刀具
’分
別用
來切
割生
和
攝氏
4至
63度
的範
圍稱
爲「
危險
地帶
j,
‘V前
、如
厕後
、飯
前或
處理
垃圾
後’
熟
的食
物。
因
爲誦
在此
範圍
繁殖
快。
故此
’應
將食
必邊
I以肥
程和
熱水
洗手
° >
生和
熟的
食物
要分
開處
理,
以免
交叉
感染
。
物儲
存於
「安
全溫
度j。
>若
有腹
瀉和
嘔吐
等腸
胃不
適的
情況
,應
避免
>
生和
熟的
食物
要分
開存
放,
熟食
應放
在雪
櫃
處理
食物
。
的上
格。
資
料來
源:
、,
防水
敷料
包裹
傷•
’以
免傷
•的
細縣
L
htt
o:/
/ww
w.i
nfo
. go
v.h
k/f
eh
d
染食
物。
2
.惠康
‘基
因改
造食
物之
利與
弊.
�_
3
.衛
生署
‘家
展•
廣/生
’ 1
998.
食
•源
4
.胡令
芳、
老有
所厂
養j ‘
19
99
. p
.74
V向
有牌
和信
譽良
好的
店舖
選購
>不
要光
顧無
牌小
販及
購買
無遮
蓋的
食物
IO
to
-O

^r
四)番
薯香
蕉杏
仁棗
_
材料
番碧
肉560克
(14兩
)
赞池
巾文
大學
1P
^
1 ®
香淮
天水
圓婦
女聯
合會
合辦
糖米
粉1湯
匙
婦女
健康
飲食
及運
動推
廣活
動
杏仁
片1.5湯
匙
一
糖
1/4茶
匙
健康
煮食
示範
做法
一
)微
波爐
糯米
飯
1.番
薯肉
切薄
片,
蒸熟
(約
2O至
25分
鋪)
。
材料
2-將
帮薯
片搓
爛,
加糖
’攪
溶後
,M
•加
入糯
米粉
,拃
勺成
粉_。
糯
米
1.5杯
•
3-將
粉糰
平分
爲1
2份
。
冬菇
4
0克
(丨
兩)
4.香
蕉切
成12小
粒作
餡料
° 乾
瑤柱
40克
(1兩
)
5.每
份粉
糰以
手按
薄’
包入
香蕉
,做
成棗
形°拍
上少
許水
,黏
I:杏
f :
片’
蝦米
2O克
(半
兩)
放入
已預
熱的
锔爐
’刖
中火
煱10分
鐘至
金便
完成
。
蔥
適量
做法
1.糯
米洗
作,
用水
浸2小
時,
水要
過面
。
資料
來源
:
2.冬
菇洗
淨’
H
j水浸
至軟
身,
去蒂
切粒
,水
留用
。
•康心
臟新事典
’許綺赀,帛冠出版社(芮
港)何
限公
司,
1999。
1乾
瑤忭
洗淨
’用
水浸
軟,
撕成
幼絲
’水
留用
。
4.蝦
米洗
淨,
用水
浸軟
,隔
淸水
分o
將糯
米,
冬菇
粒,
乾搖
柱絲
,蝦
米混
合在
微波
爐飯
煲中
’加
入冬
菇及
乾瑤
柱水
至糯
米水
平’
用高
火先
煲五
分鐘
,取
出攪
勻。
6.
F�:煲
四分
鐘,
取出
JS勻
:然
後煲
四分
鐘,
取出
攪勻
。
7-再
煲三
分鐘
,取
出,
加入
蔥花
,攒
句,
媚片
刻。
再煲
三分
鐘便
完成
。
資料
來源
I
健康
心臟
新事
典,
許綺
賢,
皇冠
出版
社(香
港)有
限公
司,
1999
。
to
O-)
I O

I 二)香
滑雞
卷
三)香茅魚餅
材料
材料
I 雞
胸肉
160克
(4兩
)
鲮魚
肉
160克
(4兩
)
(去
皮’
去筋
)
芥茅
碎
2茶
匙
雞蛋
白
1隻
馬蹄
碎
2茶
匙
脫脂
奶
3湯
匙
生菜
絲隨
意
紅甜
椒碎
1湯
匙
憩(切
碎)
!條
青椒
碎
1湯
匙
汕
2茶
匙
雞肉
調味
料
魚肉
調味
料
鹽
1/4茶
匙
鹽
1/4茶
匙
•
胡椒
粉少
許
糖
1/4
^
z主粉
1
.5茶
匙
做法
水
1茶
匙
1.雞
肉剁
至幼
滑(可
用碎
肉機
),
加入
蛋f'丨
,攒
至完
金混
合。
胡
椒粉
少許
2.脫
脂奶
慢慢
注入
雞肉
内,
ffi勻
,丙
加入
捋紅
椒碎
及調
味料
忭勻
。
麻汕
少
許
3.用
錫紙
將雞
肉捲
好,
兩端
紮緊
,放
在雪
概內
半小
時茫
形。
4.煲
滾4杯
水,
將已
定形
的雞
卷放
入滾
水中
’器
上煲
盈。
水�
!f滾
後便
熄 做
法
火,
讓雞
卷在
水中
浸5至
7分
鐘’雞
卷熟
後便
取/U
。冷
卻後
切成
12
1.
肉加
•剁
碎,
放在
碗巾
’加
入調
味料
攪至
起膠
。
片便
完成
° 2.加
入馬
蹄碎
、香
茅碎
和蔥
碎到
鲮魚
肉內
,攪
勻,
分成
8件
。
3.燒
熱易
潔錢
,加
油,
將魚
肉放
在鑊
中,
按成
圓形
魚餅
,用
慢火
煎至
兩
資料
來源
:
而熟
透。
然後
用中
火煎
至兩
丽金
黃色
便完
成’
上碟
後以
生菜
絲伴
碟。
健康心臟
新事典
,許綺賢,皇冠出版社(香
港)有
限公
司,
1999�
資料
來源
:
缝收
心臓
新T�
f_,
許綺
Bf,
冠出
版社
(香港
)符限
公司
,1999
O
IO

h ‘
運動
時候
的S標
心跳
率計
算法
均衡
健康
飲食
+適
量運
動
一般
來說
,運
動時
候的
目標
心跳
率:
丨
^l
ra
低:(220-年齡)
X 6
0%
^
高:
(22
0-^
¾)
X 9
0O/O
(
IQ
^ 維
持健
康和
達致
理想
體重
^
jS
fc
例子
••
40
歲
的最
佳及
效方
法
香港
中寸
大與
目標
心跳
率=每
分鐘
10
8 -
184次
\
J.
Uf
~
^r
H
^Z
^m
iZ
^
^^
下次
•-
健劃
•嫉
細防
香
港天
水圍
婦女
聯合
會合
辦
曰 I切
:1
5-7
-90
00
身體
質量
指數
(B
MI
) 時問:
2:0
0-3
:30pm
計法
:體
重(公
斤)+
身高
2 (米
)
婦女
健康
飮食
及運
動推
廣活
動
營费
參考
齊
身體
月旨
肪百
分比
m成心臓新
^m,許綺行’�;丨冠
M丨
版社
(涔港
洧 健
康講
座(
五)
女
性理
想範
圍:
20
-27
%
限公
1 ?】
,1
9" °
…
FI
T足
一世
紀
資料
來源
^ “
1.
R P
Pan
graz
i. Th
e Ph
ysic
al A
cliv
ilv V
yram
id. T
op C
lin
理想
體N
u(
r 1
99
9,1
4(3
):5
3-6
1.
,银
叙入
々设
2.
AC
SM
's G
uid
elin
es
for
Excr
cise
Tes
ting
nnd
Pres
crip
tion
Jc^
WTl
^¾
包括
三個
同等
重要
的原
素:
5"、1
xy
三個
原素
I如
何ig到
3. R
Gil
l g()l
d- S
ucce
ssfu
l Age
ing.
2,u
I cd,
Oxf
ord
Uni
vcrs
ily
態沾動
1)心肺功能
持
久迚
續性
的活
_,
如总
速步
Press,
J999,pl()
9.
/V
行、
劇烈
述動
強化
肌肉
丨_]/\仲
展述
動
2)肌
力及
肌耐
力舉
重、
手挽
墮物
行路
及行
他俤
-I
jOJ
2-3
V
^
.期3-
7次
3)柔
軟度
I拉
筋及
熱身
述動
1

HpP
i- 運
動的
好處
運
動金
字塔
^
tr
S!
^ <
〜J
IL
^r
o
例如
:拉
筋,
熱身
運動
等
^^
舰控
制體
重,
維持
理想
體重
^m
:
-m
m
3^
7^
Il
A
__
多_
旨肪
’
__
AJ
f 謊
:i
S
Is
ii
10
3.改
善體
型
/^
~\
做
至60秒
強
化肌
肉運
動仲
展運
動
主枚
^
^ ^
碰…
1.增
強自
信
一星
期2-3¾/
A
\M.m
3-7次
2.舒
暢身
心
/有
氧運
-強
肉S
Kj
m^
m
3.舒
緩精
神
/一
星期
3-
0次
\ 例
如:
健身
,啞
鈐等
>常
生活
巾的
運動
次數
:一
星期
2至
3次
生理…
減低
患上多種病的機會(例
如:背
/ 每天
f
\ ;
^^二
組,
每組
重複
動
痛、
高血
壓、
中風
、心
臟病
、糖
尿病
、
1t^
1 ^
骨質
疏鬆
症和
腸癌
等)
—
2改
盖心
臟健
康
曰常生活中的運動
清
3:
增1血
液循
環
例如
:行
路,
行樓
梯’
做家
ft
靜態
活動
f
m^
M
4.增
強抵
抗力
務等
- I
l 例
如:
蹄電
視’
打麻
雀等
5.增
強運
動時
的耐
力,
不易
感到
疲倦
次
數:每
日或
盡量
每日
{
盡量
少做
S
l^
ii
P
和氣
喘
時間
:30分
鐘或
以上
^
fe
fi
6.加
強關
節活
動’
防止
老化
,
減少
患上
骨質
疏鬆
症的
機會
^ i
^i
ur
it
ISJ.
A
^L W
r ^
^ O
7.改
善身
體的
協調
性,
改善
柔軟
度’
如
诃跃
勵目
己夕
做逯
勑r
使動
作更
優雅
,,
L與
朋友
或小
組一
起做
運動
z
例如
.跑
^;
^康
愿m
,.
2.參
與一
些運
動組
織,
如保
齡球
會,
游泳
會
^^
游水
二 m^
’ ^類
蓮動
导
3.選
擇自
己有
興趣
和配
合個
人生
活模
式
^W
l 次
數:
一星
期3至
6次
的
運動
W^
i 時
間:
20分
鐘或
以上
4.經
常自
我鼓
勵:
「我
會持
之以
恆°」
ji
/^
Z
5.訂
立短
期和
長期
而可
達到
的目
標
/^
^r
l^
k
H
— ^
6
.當有
進步
時’
JS
SB錄
下來
’並獎
勵自
5«
^ <7/
7.
提腿
’
mm
mi
“
yI
8.^運
動融
入你
的曰
常生
活中
)/
f 9.參
與多
類型
的運
動
^ f
广丄
f
10.緊
記運
動是
一種
減壓
的方
法

Hp
^
骨質
疏鬆
症
v適
量及
定時
的負
噩運
_ ^
^
>適
量的
陽光
(可
以節
协製
造維
他命
D
Il鈣
饩
隨著
年齡
的增
長,
骨骼
的質
與量
漸減
,骨
質流
失
的貯
存)
^
^^
過速
就形
成了
骨質
疏鬆
症或
骨折
O三
十五
歲以
V避
免煙
酒和
過瓒
的咖
#、
濃茶
或辦
(減
少鈣
後,
每年
骨質
平均
減少
1%。
質流
失)
香
港中
文大
學
I哲
MB
^M
^
m
每日鈣質攝取建議量
香港
天水
圍婦
女聯
合會
合辦
骨
質疏
鬆症
的成
因
,M
P吣,,
1
1-2
4歲
女性
1
20
0毫
克
_
. _
.
^
^
家族
遣傳
荷
爾蒙
影響
25
歲以
上女
性
800
_克
fe
女健
康飮
食及
運動
推廣
活動
女性
老
化
孕婦
及哺
乳的
女性
12
00 ¾克
缺
乏運
動
飮食
缺乏
鈣、
磷質
和維
他命
D
^ a
^
常見食物的含約量
為何
女性
容易
發生
骨質
疏鬆
症?
健
康講
座(
六)
V婦
女骨
架及
體密
度少
於男
性
S
—=
-疾
病知
識齊
齊認
識
>懷
孕生
產時
需耗
用大
量鈣
質等
營養
物質
g奶
…湯匙石孓克)
42
V
女性
的活
動量
比男
性少
座
上)
10
人丨
丄丨丨
B叫刀里比力丨土乂
萵鈣低脂迈奶
-杯
(NO堪/丨
.)
402
>更
年期
後女
性荷
爾蒙
分泌
減少
^
mM
面
Tu
I
r^
1
•芝
J:
-/V
'(^
IID
13
2
f^
-r
f 5 霞
I
板肥
AZ腐
•碑(丨
60贞)
20
0
\ ^
f ’丨丨I
骨質
疏鬆
症的
影響
妃/
too
t
-J
^m
S
白芝麻
二
1_些
11
2 座
)__
W^
k ^
PH
>弓
丨起
關節
痛及
腰背
痛
J^
•
(120
^)—
1川
J
tL
�\
V S
骨折
’特
赚手
骨、
手腕
骨、
胸骨
及If
eii
l^=
^=
盤
骨,
因骨
質變
得脆
弱�
两巧菜
H兩(】
20,)
一
36
m
mm
^ 如
彻箱
眯脣
晳旃
狡
一湯匙(12克)
()7
、
mi
mw
^m
如
何預
防骨
質疏
鬆
銀魚乾
二
湯匙
(7克
)—
50
>每
天吸
收足
夠鈣
質
登
I一
18
0克
)
52
IO
OJ

r
^
三大
殺手
病
> 腳
部受
細菌
感染
要切
除
一
I V昏
迷,
甚至
死亡
癌
症
^癌
Ik
S^
^
Ym
^
?
v
30
-40
%是
與不
M飲
食習
惯有
關
2儿、臟病
满敢
易思
上糖
尿病
/ >缺
乏抗
氧化
物(
維他
命A
, C
, E
)
3.屮
風
、過
重
、莊
腸癌
缺
乏食
用纖
維和
運動
什麼
是糖
尿病
?
V家
族巾
有糖
尿病
患者
>
乳癌
-進
食過
多脂
肪
•
、缺
乏蓮
動
y
口腔
癌、
咽喉
癌、
食道
癌一
過量
酒精
糖尿
病主
要是
因爲
體內
胰島
素分
泌不
平衡
V曾
在懷
孕時
患上
妊娠
性糖
尿病
V胃
癌、
腸癌
、膀
胱癌
_過
鼂進
食含
致癌
物晳
所致
’或
因爲
由胰
臟分
泌出
來的
胰島
素不
能發
揮
> 過
量攝
取食
物中
的脂
肪
亞確
基化
合物
的食
物
應有
的作
用。
胰島
素用
於葡
萄糖
的新
陳代
謝。
i
^r
^s
j^
&f
i^
f^
? 糖
尿病
分爲
第一
型及
第二
型兩
種,
第一
型常
於
如何
預防
糖尿
病?
預
防癌
症
小童
時期
已能
診斷
,佔
總患
者的
小部
份(少
於一
V維
持JT•
常的
體爾
>
良好
飲食
習惯
可以
減少
三至
四成
患癌
機會
成)
’由
於胸
礙內
製造
胰島
素的
細胞
被破
壞,
不能
分
V增
加述
励徵
V跟
隨食
物金
字塔
泌胰
島素
’葡
萄糖
無法
進入
體內
各器
宮,
血糖
因此
V跟
隨食
物金
字塔
>
增加
進食
深綠
色及
橙黃
色的
蔬菜
和水
果
上升
。大
部份
患者
(九
成以
上)是
第二
型患
者,
在成
1
.每餐
不要
進食
過散
,妝
選擇
煺康
小食
- V選
擇一
個以
穀物
及蔬
果爲
主的
膳食
年後
才發
生’
患者
的胰
臟並
沒有
受到
破壞
,只
是
1.減
少進
食脂
肪,
特別
足飽
和脂
肪
〜免果每天一•至兩個
身體
內的
細胞
不能
對胰
島素
作出
反應
,這
類糖
尿
增加
進食
含萵
纖維
食物
匆丨
跪果
’穀
類等
。
〜蔬
菜毎
天六
兩以
上
病是
可以
避免
的。
4.避
免進
负萵
熱M:
和高
糖份
的食
物如
汽水
,雪
>
減少
進食
肥腻
食物
碳水
化合
物經
過消
化和
吸收
後會
轉化
爲血
糕
,煎
炸食
物“
V選
擇企
穀類
食物
而少
食加
工食
物
糖。
糖尿
病患
者不
能將
吸收
的糖
份有
效地
轉化
塞
抖、
、魅
庇广
勺枉
由窗
〉納
各路
、減
少進
食醃
製過
的食
物或
高鹽
食物
爲我
們日
常生
活所
需的
熱量
,過
多的
糖份
積
守双
〜職
购V
^ r风
)的
厄懷
U系
V避
免用
萬年
油來
炸食
物
聚在
血液
中’
令血
糖增
高,
並經
由尿
液俳
出,
危險
因素
(不
可改
變)
危險
闪素
(可
改變
)
、維
持健
康體
重
故稱
爲糖
尿。
—+、
& @
>做
適的
運動
家
族遺
傳
吸焯
‘
\
患上
糖尿
病的
嚴重
後果
男
性
高_明
、
減少
飮酒
“
^^
J取
里1文
不
年齡
不
良飲
食習
惯
> 減
少進
食紅
肉,
每天
應少
於二
兩
引致
倂發
症’
例如
:
高血
脂
V適
當貯
存食
物,
以避
免細
菌的
感染
>心
臟病
缺乏
運動
>腎
病,
嚴重
者需
洗賢
ff病
二S康
剛、
冊子
,錢
公司
>丨
視力
下降
,甚
至失
明
壓力
2.食物成份表,人民衛生出版社
M
3.
ww
w.
cc
h.
or
g.
tw
二
4.
ww
w.
he
al
th
ba
si
c.
co
m

r —
丨
Wl
ia
t i
s c
ho
lest
ero
l?
"^
m^
&K
c
ho
Ies
tero
1 ie
ve
I,
an
d
fi
na
^i
nc
re
as
es
th
e ff
m
一c
ha
nc
e
of
gett
ing
heart
d
isease
an
d
stro
ke,
Ch
ole
stero
l is
a l
ipid
wh
ich
is
'({
( ^
J^
so w
e sh
ould
eat
the
se h
igh
satu
rate
d fa
t pr
oduc
ed i
n th
e liv
er,
and
can
^^
food
s in
freq
uent
ly.
The
Chi
nese
Uni
vers
ity
of H
ong
Kon
g al
so b
e ea
ten
in f
ood,
esp
ecia
lly e
gg y
olk,
in
terna
l org
ans,
squi
d an
d m
eats
etc.
If th
e W
ha
t is
BM
F W
omen
's H
ealt
hy E
atin
g bl
ood
chol
este
rol
leve
l is
hig
h, t
he
• a
n(j
Ph
ysi
cal
Act
ivit
y ch
oles
tero
l w
ould
acc
umul
ate
on t
he w
all
BM
I (B
ody
Mas
s In
dex)
is
used
to
Pro
mot
ion
Pro
gram
of
the
blo
od v
esse
l an
d na
rrow
it,
and
may
ev
alua
te w
heth
er t
he r
atio
of
heig
ht t
o ca
use
athe
rosc
lero
sis,
str
oke
and
coro
nary
w
eigh
t m
eets
the
sta
ndar
d he
art
dise
ase
etc
He
alt
h ta
lk
(1)
How
do
I ca
lcul
ate
my
BM
I?
> ,
f f
. M
etho
d: H
eigh
t (k
g)/H
eigh
t(m
)2 D
ie
t’
P,
1^
iC
al
奴&
办
I L
ca
rn
m
or
e,
Lo
we
r f
at
^
, =
Exa
mpl
e:
B:
Fat
can
be c
lass
ifie
d as
tw
o ty
pes:
55
kg,
1.5
7m
an
d ^
ou
r H
ea
lth
r
(1)
Uns
atur
ated
fat
B
MI=
55/
(1.5
7)2 =
22.3
C
orn
oil,
pean
ut o
il, c
anol
a oi
l, sa
fllo
wer
oil,
oliv
e oi
l co
ntai
ns
, o
ivti
? F
ollo
w t
he
food
p
yram
id
, ,
,„
,.,
量- io
w
uo
i c
vB
iu
Htc
mv
is
ivii ;
w
w
„ .
» .
rela
tivel
y m
ore
unsa
tura
ted
fat,
whi
ch c
an
J --
Ha
ve
bet
ter
hea
lth
low
er t
he b
lood
cho
lest
erol
lev
el.
How
ever
, Fe
mal
e /y
we
shou
ld n
ot e
at t
oo m
uch
of t
hese
oils
as
Und
erw
eigh
t <1
8 .5
v
^j^
k
they
stil
l co
ntai
n so
me
satu
rate
d fa
t an
d ar
e N
orm
al
18.5
-22.
9 (
1 i
^^
ll
^k
high
in
calo
ries
. O
verw
eigh
t 23
.0-2
4.9
Obe
se
25.0
or
abov
e \
(2)
Satu
rjit
ed f
iit
^ ,.¾
¾¾!
^^
^^
^^
^^
^(1
^^
^^
^^
^^
�^
^
IM
ter,
La
t fa
t, C
hic
ken
sk
in,
Th
e a
bo
ve
exa.
ple (酬
=2
2.3
) is
/
1^
^^
8¾
Chi
nese
pre
serv
ed s
ausa
ge,
Fat
clas
sifi
ed a
s no
rmal
',丨
_
~—
^
pork
bon
e so
up,
Cak
e an
d W
hole
milk
con
tain
muc
h sa
tura
ted
fat.
A h
igh
S in
take
of
satu
rate
d fa
t in
crea
ses
the
bloo
d

^ Im
port
ance
of
heal
thy
lifes
tyle
T
he F
ood
Pyra
mid
V
eget
able
s an
d Fr
uits
(1
) Pr
even
t ch
roni
c di
seas
es s
uch
as
Eat
a lo
t, in
clud
ing
all
0^
< Id
hear
t di
seas
e, d
iabe
tes,
hyp
erte
nsio
n,
/kO
Ws,
sal
t, su
gar
kind
s of
veg
etab
les
and
stro
ke a
nd c
ance
rs e
tc
Jm
k E
atI
ess
fa
iits.
The
y ar
e ric
h in
^
¾¾
^¾
(2)
Impr
ove
phys
ical
hea
lth a
nd
diet
ary
fibre
s, m
iner
als
Vh
^p
^^
tam
tam
hea
lthy
wei
ght
MlI
k ^
¾]
¾¾
M
ea
t' P°U
丨吨
Eg
g,
an
d v
itam
ins,
all
ess
en
tial
T«
(3)
Slo
w d
ow
n b
od
y's
ag
ing r
ate
l'
2
cuP
s /¾
^!
Ij^
lfi
sh
‘ B
ea
n
ele
men
ts t
o o
ur
bo
dy
's f
un
cti
on
ing
.
5-6
taels
Veg
eta
ble
Jv
f |
F
't
Ho
w
t0
Pra
cti
ce
? 6
taei
st
Mil
k
她_
d
die
t A
deq
ua
te p
hys
ica
l M
E
at 讓
e,
-^
^i
ng
mil
k,
ch
eese
act
ivit
y is
th
e m
ost
ea
sies
t a
nd
b
ow
ls
and y
og
urt
. T
hey a
re r
ich i
n p
rote
in
r^L
^
effe
ctiv
e w
ay
t —
…
...•
^
and
calc
ium
whi
ch m
aint
ain
heal
th
Xl
/
of o
ur t
eeth
and
bon
es.
Soy
prod
ucts
are
^
Hk
^fck
R
emar
k: S
houl
d ha
ve 6
-8 c
ups
liqui
d im
port
ant
mem
bers
of
this
gro
up.
ever
yday
suc
h as
wat
er,
tea
and
thin
sou
p
Mea
t, E
ggs
and
Bea
ns
Cc
re
al
Eat
s_
e,
includi^
1 隱
meat,
po
ult
ry a
nd f
ish
. T
hey
^f
c ft
^
k
Ea
t t
he
mos
t> in
clud
ing
cont
ain
prot
ein
whi
ch a
ssis
ts
UP
P^
^jp
jlP
^^
pl
rice,
noo
dles
, br
ead,
th
e gr
owth
and
dev
elop
men
t of
mus
cle.
^B
mm
k bi
scui
ts
oa,m
eal
and
::
1;
::
~ Mm
O
^
Su
ga
r ^
:扩
P’
' H
^Pl[
觀lH
H
wh
ich s
up
ply
en
erg
y t
o o
ur
bo
dy
. E
at
min
imal
ly a
s th
ey a
re h
igh
^0
00^
“三
,1 爾
顯顆
in
calo
ries
too m
any o
f, w
hic
h c
ou
ld le
ad to
ob
esi
ty a
nd o
besi
ty-r
ela
ted
dis
ease
s.
IO
⑴
I
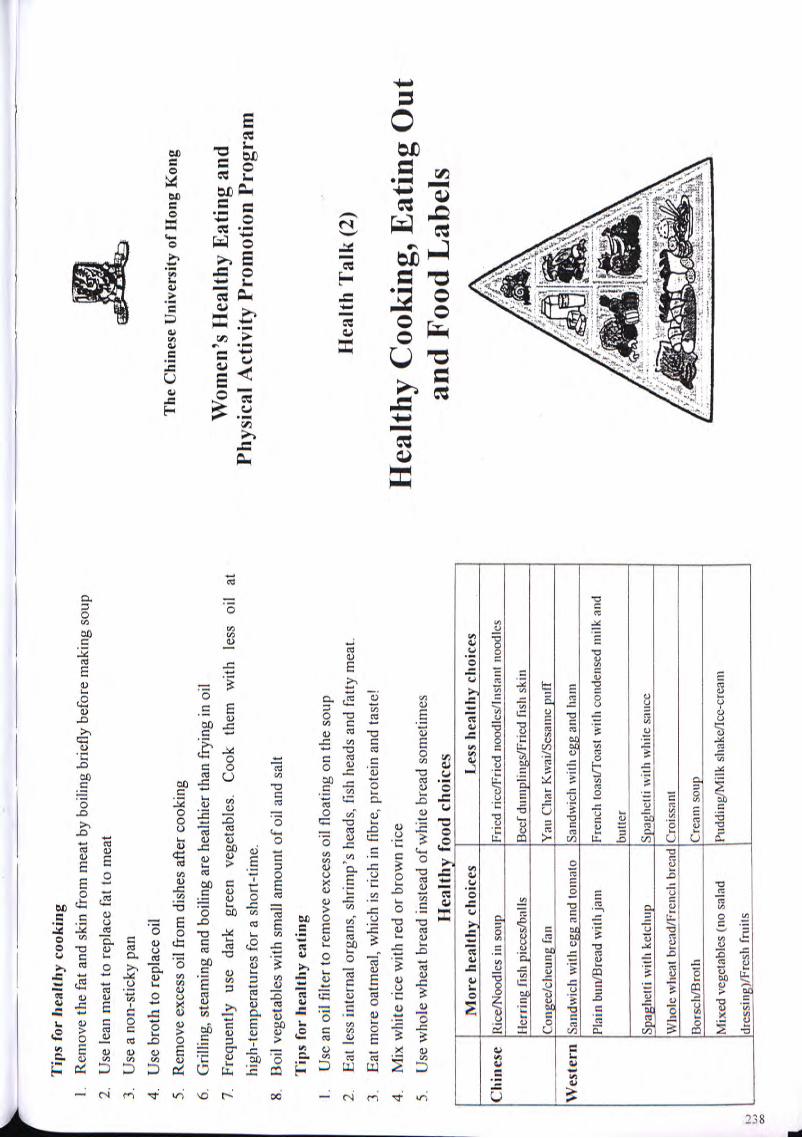
f —
Tip
s fo
r he
alth
y co
okin
g 1
Rem
ove
the
fat a
nd s
kin
from
mea
t by
boi
ling
brie
fly
befo
re m
akin
g so
up
2.
Use
lea
n m
eat
to r
epla
ce f
at t
o m
eat
^¾
¾
3.
Use
a n
on-s
tick
y pa
n j^m
' 4.
U
se b
roth
to
repl
ace
oil
5.
Rem
ove
exce
ss oi
l fro
m d
ishe
s af
ter
cook
ing
The
Chi
nese
Uni
vers
ity
of H
ong
Kon
g 6.
G
rilli
ng,
stea
min
g an
d bo
iling
are
hea
lthie
r th
an f
ryin
g in
oil
7.
Freq
uent
ly
use
dark
gr
een
vege
tabl
es.
Coo
k th
em
wit
h le
ss
oil
at
Wo
me
n's
H
ea
lth
y E
ati
ng
an
d hi
gh-t
empe
ratu
res
for
a sh
ort-
time.
Ph
ysic
al A
ctiv
ity
Prom
otio
n Pr
ogra
m
8.
Boi
l ve
geta
bles
with
sm
all
amou
nt o
f oi
l and
sal
t
Tip
s fo
r he
alth
y ea
ting
1.
Use
an
oil
filte
r to
rem
ove
exce
ss o
il fl
oatin
g on
the
sou
p
2.
Eat
les
s in
tern
al o
rgan
s, s
hrim
p's
head
s, f
ish
head
s an
d fa
tty m
eat.
Hea
lth
Tal
k (2
) 3.
E
at m
ore
oatm
eal,
whi
ch i
s ric
h in
fib
re, p
rote
in a
nd t
aste
! 4.
M
ix w
hite
ric
e w
ith r
ed o
r br
own
rice
H
ea
lt
hy
CO
Ok
il
lg
, E
at
it
tg
Ol
lt
5.
Use
who
le w
heat
bre
ad i
nste
ad o
f w
hite
bre
ad s
omet
imes
H
ealt
hy f
ood
choi
ces
and
Food
Lab
els
Mor
e he
alth
y ch
oice
s L
ess
heal
thy
choi
ces
八
77
^
/;
¾
Clu
ne
se
Ric
e/N
oodl
es i
n so
up
Frie
d ri
ce/F
ried
noo
dles
/Ins
tant
noo
dles
Her
ring
fis
h pi
eces
/bal
ls
Bee
f du
inpl
ings
/Fri
ed f
ish
skin
Cong
ee/c
heun
g fa
n Y
au C
har K
wai
/Scs
ame
pufT
I
Wes
tern
Sa
ndw
ich
with
egg
and
tom
ato
Sand
wic
h w
ith e
gg a
nd h
am
yZ
i^g
R] I
Plai
n bu
n/B
read
with
jam
Fr
ench
toa
st/T
oast
with
con
dens
ed m
ilk a
nd
V^
L^
iS^
U i
i^ 工
:^
Me i
yi^
l^p
v
Sp
ag
he
tti
wit
h k
etc
hu
p
Sp
ag
hett
i w
ith
w
hil
e sa
uc
e /,
.'•
-jA
-jl^
^ /—
^^•
“磁
^^辦
纖...〜
W
ho
le w
heat
bre
ad
/Fre
nch b
read
Cro
issa
nt
Bo
rscli
/Bro
th
Cre
am
so
up
Mix
ed v
eget
able
s (n
o sa
lad
Pudd
ing/
Milk
slia
ke/I
ce-c
ream
io
|dre
ssin
g)/F
resh
fru
its
CO
I

r •
“ •
I R
ecom
men
ded
daily
int
akes
of
cho
lest
erol
and
fat
N
UT
RIT
ION
F
AC
TS
Tot
al
fat:
les
s th
an
30%
of
the
to
tal
ener
gy
NU
TR
ITIO
N F
AC
TS
(of
a x
x ch
ocol
ate)
Sat
urat
ed
fat:
les
s th
an
10%
of
th
e to
tal
ener
gy
Serv
ing
Size
l
bar
Mo
no
- an
d P
oly
-un
satu
rate
d fa
t: e
ach
less
tha
n 10
%
of
the
tota
l en
ergy
Se
rvin
gs P
er C
onta
iner
1
Cho
lest
erol
: le
ss
than
30
0 m
g F
at c
omp
osit
ion
of c
om
mo
n oi
ls
Cal
orie
s 23
0
Poly
unsa
tura
ted
fat
Mon
ouns
atur
ated
fat
Sa
tura
ted
fat
Cal
orie
s fr
om fa
t 10
0 Pe
rcen
tage
Dai
ly V
alue
s*
Pla
nt
oil
Pea
nut
32
%
46
%
17%
T
otal
Fat
12
g 18
%
C°
rn
59%
24
%
13%
Sa
tura
tedf
at
7g
36%
C
an
ol
a 2
9%
59
%
7%
Cho
lest
erol
IO
mg
3%
Oli
ve
9%
74%
14
%
Sodi
um
65m
g 3%
An
ima l
oi
l L
ard
12%
45
%
39
%
Tot
al C
arbo
hydr
ate
29g
10%
Mar
gari
ne
33
%
37
%
18%
D
ieta
ry F
iber
<
lg
3%
丨 B
utt
er
4%
3
0%
6
5%
S
ug
ars
2
4g
Pe
rc
en
t e
ne
rg
y
fr
om
fa
t/s
atu
ra
te
d
fa
t a
nd
c
ho
les
te
ro
l in
s
om
e c
om
mo
n
Pr
ot
ei
n
^S
re
sta
ur
an
t a
nd
h
om
e p
re
pa
re
d
fo
od
it
em
s V
ita
min
A
0%
Fo
od
it
em
P
ercen
t e
ne
rg
y
Percen
t en
erg
y fr
om
C
ho
lest
ero
l V
ita
min
C
0%
fro
m f
at
(%)
satu
ra
ted
fa
t (%
) (m
^)
Ca
lciu
m
6%
Fil
et-
O-f
isli
bu
rge
r 41
8 19
,5
50
il2I
} ^
Fren
ch f
ries
47
^
j() 2
0
+ Per
cent
age
Dai
ly V
alue
s ar
e ba
sed
on a
2,0
00 c
alor
ie.
Ha
mb
urg
er
31.8
IT
6 37
t>
0
0 u
lnn
Ref
eren
ces :
1)
EN
Wli
itn
ey
& S
R R
olfe
s.
Und
ersta
ndin
g Nu
tritio
n.
1993
B
ig M
ac
46.H
/q
.q
川U
• •
c<
2) A
B N
nlow
& J
Hes
liu.
The
Fast-
Food
Nu
tritio
n Co
unte
r. 19
94
Chi
cken
Mcn
ugge
ts (
six
piec
es)
5().(
) m
”
Pizz
a (o
ne p
iece
) 56
.6
19.2
?>2
Hot
dog
81
.3
54,9
21
Frie
d ri
ce (
one
stan
dard
bow
l) 3^
4 U
64
Fr
ied
curr
ied
rice
noo
dles
沾 3
11 9
3
90
Fri
ed
eg
g
68.2
I
O
213
g iB
oile
deR
R
61.9
18
.7
__
21
3_
_

Bf"
Wh
at i
s a
gene
? ^
^^
KM
^M
A
re G
M f
ood
harm
ful t
o he
alth
? _
A
gene
is
co
mpo
sed
of
DN
A.
Dif
fere
nt
DN
A
> A
ll th
e G
M
food
are
tes
ted
and
eval
uate
d by
j^
ffl
com
posi
tion
pr
oduc
es
diff
eren
t ge
nes
whi
ch
the
prod
ucti
on
com
pany
an
d th
e ex
port
dete
rmin
e so
me
plan
t, an
imal
an
d ou
r ow
n m
onit
orin
g or
gani
zati
on
The
Chi
nese
Uni
vers
ity
of H
ong
Kon
g
char
acte
rist
ics.
>
The
ev
alua
tion
is
ba
sed
on
'Sub
stan
tial
Equ
ival
ence
' (S
E)
prin
cipl
e
Prin
cipl
e of
gen
etic
ally
-mod
ifie
d (G
M)
food
>
SE m
eans
com
pari
ng t
he o
rigi
nal
and
GM
foo
d
Man
y D
NA
fra
gmen
ts a
re t
rans
ferr
ed t
o cr
ops
from
in
di
ffer
ent
aspe
cts
(tox
icity
, al
lerg
y an
d
anim
al o
r ba
cter
ia
nutr
ient
co
nten
t).
If
ther
e ar
e no
di
ffer
ence
s W
om
en's
Hea
lth
y E
atin
g an
d
Sele
ct a
des
ired
an
imal
's o
r ba
cter
ia's
gen
es
betw
een
them
, th
e G
M
food
w
ill
mee
t th
e P
hys
ical
Act
ivit
y P
rom
otio
n P
rogr
am
U
stan
dard
.
Rep
lica
te t
he g
enes
>
The
refo
re,
the
GM
foo
d in
the
mar
ket
are
not
H
less
saf
e th
an t
he o
rigi
nal
food
Tra
nsfe
r to
the
crop
W
hat k
inds
of f
ood
are
gene
tical
ly-m
odifi
ed?
Hea
lth
Tal
k (3
) R
emar
k: T
he g
ene
is n
ot e
xtra
cted
dir
ectl
y fr
om t
he
Soyb
eans
, co
rn,
cano
la s
eed,
tom
atos
, po
tato
s an
d
anim
als
or b
acte
ria/
plan
t an
d th
en t
rans
ferr
ed i
nto
pean
uts
etc.
Abo
ut
20%
of
the
pro
cess
ed
food
in
^a
t S
afe
r a
nd
Kn
OW
M
or
e a
bo
ut
Ihc
crop
s, b
ut i
nto
a pl
ant
that
pro
duce
s se
eds
for
Hon
g K
ong
cont
ains
G
M
ingr
edie
nts,
in
clud
ing
. .
the
crop
s.
Whe
n th
e cr
ops
obta
in
the
DN
A
inst
ant
nood
les,
co
rn-b
ased
sn
acks
, to
fu,
som
e G
en
eti
ca
lly
Mo
dif
ied
Fo
od
frag
men
t, th
ey
will
ac
quir
e ce
rtai
n ge
ne
soyb
ean
mil
k,
soyb
ean
milk
po
wde
r et
c. M
ost
of
char
acte
rist
ics
such
as
an
ti-p
est,
anti
-fer
tili
zer
or
the
GM
foo
ds a
re n
earl
y th
e sa
me
as t
he
orig
inal
anti
-dro
ught
. fo
od w
ith
resp
ect
to t
heir
app
eara
nce.
B
ioch
emic
al
met
hods
ar
e th
e on
ly w
ay t
o di
stin
guis
h be
twee
n
•y
we
need
GM
foo
d?
then
, ^
1.
Incr
ease
cro
p pr
oduc
tion
, re
liev
e gl
obal
foo
d L
abel
ing
syst
em
h I
一
sho
rtag
e p
rob
lem
. U
p
to
no
w,
the
Ho
ng
K
on
g
go
ve
rnm
en
t h
as
no
^
^^
^H
fl
ff
lj
^^
2.
En
ab
le c
rop
s to
gro
w in
un
fav
ora
ble
co
nd
itio
ns
reg
ula
tio
ns
on
G
M
foo
d
lab
eli
ng
, b
ut
the
J/T
q^
^^
bR
^
3.
Impr
ove
the
nutr
itio
n co
nten
t an
d qu
alit
y of
go
vern
men
t is
co
nsid
erin
g th
e fe
asib
ilit
y of
a
food
, e.g
. in
crea
se t
he p
rote
in c
onte
nt o
f ri
ce.
labe
ling
sys
tem
, an
d ag
rees
to
have
it
2-3
year
s.
to4.
E
nabl
e th
e cr
ops
to h
ave
anti
-pes
t ab
ility
in
Una
nsw
ered
que
stio
n: T
he l
ong-
term
eff
ects
of
^ or
der
to r
educ
e th
e us
e of
pes
tici
des.
G
M f
ood
on h
ealt
h, e
nvir
onm
ent
and
agri
cult
ure?

r f Ents
afe
r ha
wke
rs
Tem
pera
ture
ind
ex f
or f
ood
safe
ty
The
fol
low
ing
food
s ar
e ea
sily
con
tam
inat
ed b
y E
nvir
onm
ent
and
Hyg
iene
bact
eria
or
toxi
n. I
f w
e ha
ndle
the
m i
mpr
oper
ly,
we
> St
ore
food
in
clea
n pl
aces
IO
O0C
: B
oilin
g, b
acte
ria
died
may
get
foo
d-bo
rne
dise
ases
. V
K
eep
all k
itche
n ut
ensi
ls i
n cl
ean
plac
es
厂'
;A
..
.
) 74
°C:
Coo
king
tem
pera
ture
�
Hig
h-r
isk
fo
od
C
on
tam
ina
ted
b
y
| A
, .
.1
Je
Sf
ls
h
or
oth
er
si
r^
ss
r,
-c
: 一
师.—
—.:,::、
:::
Lis
teri
a
mo
no
cyto
gen
es
l^
^p
/P
^^
^P
b
acte
ria
ca
n't
re
pro
du
ce
, b
ut
are
sti
ll
彳,
:..
2.
Cru
sta
ce
a H
ep
ati
tis
A v
iru
s, C
ho
lera
ali
ve.
''' •;•
‘'
:
vir
us,
P
ara
lyti
c sh
ell
fish
C
oo
kin
g
an
d
Ea
tin
g
' I
toxi
n *
I .
3 D
eep
bay
fish
C
igue
rato
xin
‘ >
Tho
roug
hly
was
h an
d co
ok v
eget
able
s to
4
to 6
3°C
: It
's ca
lled
the
'Dan
ger
Zon
e'.
I
4. B
arbe
cued
por
k or
Sa
lmon
ella
, av
oid
food
poi
soni
ng
Food
sho
uld
not
be k
ept
at t
his
_ 1
赫
roast
ed
p
ou
ltry
S
tap
hyl
oco
ccu
s a
ure
us
y D
efr
ost
froz
en f
ood
com
plet
ely
befo
re
tem
pera
ture
ran
ge.
5. O
ctop
us, j
elly
fish
Vi
brio
par
ahae
mol
ytic
us
cook
ing
6. S
alad
or
froz
en
Liste
ria
mon
ocyt
ogen
es
, ,
,, ,
^H
IH
da
iry
prod
ucts
T
horo
ughl
y co
ok t
he f
ood
until
the
mos
t in
ner
Bel
ow 4
°C:
Chi
lling
tem
pera
ture
. M
ost
of
^V
IH
7. V
eget
able
s Pe
stic
ides
pa
rt of
the
foo
d re
ache
s 74
°C
the
bact
eria
can
't re
prod
uce,
but
^
Rf
iS
V
Tho
roug
hly
reco
ok t
he f
ood
stor
ed o
vern
ight
ar
e st
ill a
live.
^
Blr
fl
Ho
w
to p
rev
ent
foo
d-t
ran
smit
ted
dise
ases
V
C
onsu
me
food
soo
n af
ter
cook
ing
or
^^
mm
Pers
onal
ke
ep t
hem
at
a sa
fe t
empe
ratu
re (
belo
w 4
°C i
n -1
8°C
: Fr
eezi
ng t
empe
ratu
re.
Onl
y so
me
of
V
Bef
ore
prep
arin
g fo
od a
nd h
avin
g m
eal,
afte
r re
frig
erat
or o
r ab
ove
63°C
in
war
min
g th
e ba
cter
ia a
re s
till
aliv
e,
toile
t an
d ha
ndlin
g ga
rbag
e, m
ust
clea
n ha
nds
mac
hine
)
with
soa
p an
d ho
t w
ater
. V
U
se t
wo
sets
of
chop
ping
boa
rds
and
clea
vers
- 4
to 6
3°C
is
calle
d th
e 'D
ange
r Z
one'
bec
ause
the
V
Avo
idin
g ha
ndlin
g fo
od i
f hav
ing
diar
rhea
, on
e fo
r ra
w f
ood
and
the
othe
r fo
r co
oked
ba
cter
ia r
epro
duce
qui
ckly
, so
the
foo
d sh
ould
be
vom
iting
or
gast
roin
test
inal
abn
orm
aliti
es.
food
. ke
pt a
t ot
her
safe
r te
mpe
ratu
res.
y C
over
ope
n w
ound
s w
ith p
last
er t
o av
oid
V
Han
dle
raw
and
coo
ked
food
sep
arat
ely
to
cont
amin
atin
g fo
od
prev
ent
cros
s co
ntam
inat
ion
V
Kee
p ra
w a
nd c
ooke
d fo
od s
epar
atel
y, w
ith
Foo(
i so
urcc
co
oked
foo
d ke
pt o
n th
e up
per
shel
ves
of t
he
y B
uy f
ood
from
lic
ense
d an
d re
puta
ble
shop
s re
frig
erat
or.
(O
、亡
V
Do
n't
b
uy
un
co
ve
red
fo
od
o
r fo
od
fro
m i
lleg
al

^ —
4)
Alm
ond
Swee
t Po
tato
Puf
f In
gred
ient
s QB
fc "
-*5¾
^!
Swee
t po
tato
56
0 g
(14
tael
s)
The
Chi
nese
Uni
vers
ity o
f H
ong
Kon
g
Smal
l ban
ana
1 W
omen
's H
ealt
hy E
atin
g an
d G
lutin
ous
rice
flou
r 1
tbsp
s Ph
ysic
al A
ctiv
ity
Prom
otio
n Pr
ogra
m
Alm
ond
slic
es
1.5
tbsp
s ,
Suga
r 1/
4 ts
p H
ealt
hy C
ooki
ng D
emon
stra
tion
1)
Mic
row
ave
Glu
tino
us R
ice
Met
hod
Ingr
edie
nts
1. T
hinl
y sl
ice
the
swee
t po
tato
and
ste
am u
ntil
soft
(app
roxi
mat
ely
20-2
5 G
lutin
ous
rice
1.5
cups
m
inut
es).
Dri
ed m
ushr
oom
s 40
g (
Itae
l) 2.
Mas
h th
e sw
eet
pota
to,
add
suga
r an
d st
ir un
til t
he s
ugar
dis
solv
es.
Mix
D
ried
sca
llops
40
g (1
tae
l) in
glu
tinou
s ric
e fl
our
to f
orm
a d
ough
. D
ried
shr
imps
20
g (
0.5
tael
)
3. D
ivid
e th
e do
ugh
into
12
port
ions
. C
hopp
ed s
prin
g on
ions
fe
w
4. D
ice
the
bana
na i
nto
12 p
iece
s to
for
m th
e fil
ling.
5.
Fla
tten
each
por
tion
of d
ough
int
o a
roun
d an
d fil
l with
a b
anan
a fil
ling.
M
etho
d D
raw
in
the
edge
s se
cure
ly t
o fo
rm in
to a
ova
l sh
ape.
B
nish
with
wat
er
1. W
ash
and
soak
the
glu
tinou
s ric
e in
col
d w
ater
for
tw
o ho
urs.
and
spre
ad i
t with
the
alm
ond
slic
es.
Bak
e in
a to
aste
r ov
en f
or
2.
Soak
the
mus
hroo
ms
until
sof
t. R
emov
e st
ems,
drai
n an
d di
ce.
Ret
ain
appr
oxim
atel
y .te
n m
inut
es.
the
wat
er f
or la
ter
use.
3.
W
ash
and
soak
the
drie
d sc
allo
ps u
ntil
soft
. Sh
red
the
scal
lops
. R
etai
n th
e w
ater
for
late
r us
e.
4. W
ash
and
soak
the
drie
d sh
rimps
, dr
ain
wel
l.
Ref
eren
ce:
5. P
ut t
he g
lutin
ous
rice,
drie
d m
ushr
oom
s, s
hred
ded
scal
lops
, an
d dr
ied
健康
心臟新事典
,許
綺賢’皇冠出版社(香
港)有
限公
司,
1999
° sh
rim
ps i
nto
a m
icro
wav
e-us
e co
ntai
ner.
Pour
the
ret
aine
d w
ater
to
the
rice
leve
l. C
ook
in a
mic
row
ave
over
hig
h he
at f
or f
ive
min
utes
, ta
ke o
ut
and
stir
wel
l. 6.
C
ontin
ue t
o co
ok f
or f
our
min
utes
, tak
e ou
t an
d st
ir w
ell.
7. R
epea
t st
ep 6
tw
ice
for t
hree
min
utes
. St
ir in
the
chop
ped
sprin
g on
ions
ro
»o

r —
and
keep
cov
ered
for
a w
hile
. Re
ady
to s
erve
. 3)
Fi
sh C
ake
wit
h L
emon
Gra
ss
Ingr
edie
nts
2)
Chi
cken
Rol
ls
Mud
car
p fil
let
160
g (4
tael
s)
Ingr
edie
nts
Cho
pped
lem
on g
rass
2
tsps
Chi
cken
bre
ast
(fle
sh o
nly)
16
0 g
(4 t
aels
) C
hopp
ed w
ater
che
stnu
ts
2 ts
ps
Egg
whi
te
1 ite
m
Shre
dded
let
tuce
op
tiona
l
Skim
milk
3
tbsp
s Sp
ring
oni
on(c
hopp
ed)
1 st
alk
Cho
pped
red
bel
l pe
pper
1
tbsp
O
il 2
tsps
Cho
pped
gre
en p
eppe
r 1
tbsp
Seas
onin
g fo
r fis
h Se
ason
ing
for
chic
ken
Salt
1/4
tsp
Salt
1/4
tsp
Suga
r 1/
4 ts
p
Pepp
er
dash
C
ornf
lour
1.
5 ts
ps
Wat
er
1 ts
p
Met
hod
Pepp
er
Das
h
1. F
inel
y m
ince
d th
e ch
icke
n br
east
(m
ay u
se a
foo
d pr
oces
sor
or m
eat
Sesa
me
oil
Das
h
chop
per)
, m
ix w
ith a
n eg
g w
hite
to
form
a p
aste
.
2.
Gra
dual
ly s
tir i
n th
e sk
im m
ilk.
Add
the
cho
pped
pep
pers
and
sea
soni
ng,
Met
hod
mix
wel
l. 1.
Cut
the
fill
et i
nto
slic
es.
Add
sal
t an
d m
ince
the
fill
et w
ith a
cho
pper
3.
Rol
l th
e ch
icke
n pa
ste
with
foi
l and
tig
hten
bot
h en
ds.
Plac
e in
to t
he
knife
. Tr
ansf
er t
o a
mix
ing
bow
l, ad
d th
e se
ason
ing
and
stir
until
a s
ticky
refr
iger
ator
to
shap
e fo
r ab
out
30 m
inut
es.
past
e is
form
ed.
4 B
oil
four
cup
s of
wat
er i
n a
sauc
epan
. Pu
t in
the
chic
ken
rolls
and
cov
er
2. P
our
in th
e ch
oppe
d w
ater
che
stnu
ts,
lem
on g
rass
and
spr
ing
onio
n, m
ix
to c
ook
until
the
wat
er b
oils
aga
in.
Turn
off
the
heat
and
allo
w t
he
wel
l. D
ivid
e in
to e
ight
equ
al p
ortio
ns.
chic
ken
to s
oak
for
five
to s
even
min
utes
or
until
coo
ked.
Ta
ke o
ut t
o 3.
Hea
t a
non-
stic
k fr
ying
pan
and
add
the
oil.
Sh
ape
the
fish
past
e in
to
cool
and
cut
int
o 12
slic
es.
smal
l ro
unds
and
sha
llow
fry
ove
r m
ediu
m-l
ow h
eat
until
bot
h si
des
are
light
gol
den.
A
rran
ge o
n a
serv
ing
plat
e ac
com
pani
ed b
y sh
redd
ed
lettu
ce.
Serv
e ho
t.
W
J
UJ

f Ta
rget
hear
trate
durin
g Ba
lanc
ed d
iet+
^^
Ph
ysic
al a
ctiv
ity
Reg
ular
phy
sica
l ac
tivity
W
k G
ener
ally
spe
akin
g, t
he t
arge
t he
art
rate
is:
I
Low
est:
(220
-age
) x
60%
High
est :
(220-
age)
x 90
%
The
bes
t an
d th
e m
ost
effe
ctiv
e T
he
Chi
nese
Uni
vers
ity
ofH
on
g K
ong
Exam
ple :
40
yea
rs o
ld
wa
Y
to m
ain
tain
an
d a
chie
ve
Ta
rg
et
he
ar
t r
ate 二
Y
^f
i d
es
ira
ble
w
eig
ht
Wo
men
's H
ea
lth
y E
ati
ng a
nd
*
' Ph
ysic
al A
ctiv
ity P
rom
otio
n Pr
ogra
m
Bod
y M
ass
Inde
x (B
MI)
M
etho
d: w
eigh
t (k
g) +
hei
ght2 (
m)
r f
J. R.
P. P
angr
azi.
The
Phys
ical
Act
ivity
Py
ram
id
Top
Clin
H
ea
lt
h T
al
k (
5)
Per
cent
bod
y fa
t N"
tr “卯;“⑶:休从
J
, 2.
AC
SM
's G
uid
eli
nes
for E
xerc
ise
Test
ing
and
Pres
crip
tion
Tm
Tn
n t*
�
t
a D
esi
rab
le r
an
ge
for
wo
men
: 2
0-2
7%
5'"
ed
rl
1 I
OT
Si
JN C
W
Ce
il
tl
ir
y 3.
R.G
ingo
ld, S
ucce
ssfu
l Ag
eing
, 2nd
ed,
Oxf
ord
Uni
vers
ily
Des
irab
le p
hysi
cal
heal
th
Pres
s �9
99
p
l 9
inclu
des
three
eq
ua
lly
im
po
rta
nt
ele
men
ts:
Th
e P
hy
sic
al
Ac
tiv
ity
P
yr
am
id
Ele
men
ts
Ho
w to
ach
iev
e
1)
Co
nti
nu
ou
s p
hy
sical
acti
vit
ies
/lii
ifi^
V^
lph
ysic
al
ac
tiv
ity
Ca
rdio
resp
ira
tory
su
ch
as
fast
walk
ing
, v
igo
rou
s M
usc
le b
uil
din
g
/ \\
/\\'
i D
o
le
ss
fl
tn
es
s e
xe
rcis
e Ph
ysic
al ,
acti
Yit
y/T
^t^e
tch
ing
phys
ical
act
ivit
y 2)
Mus
cle
stre
ngth
W
eigh
t tr
aini
ng,
Wal
king
and
2-
3 ti
i^sy
W^k
V
\ ^7
,'^^
s/w
eek
and
endu
ranc
e C
limbi
ng s
tair
s w
hile
car
ryin
g _C
> ^
丨‘卜卜
X
load
“
Ae
ro
b,
c P
hy
sic
al^
^t^
^
3)
Flex
ibili
ty
Stre
tchi
ng a
nd W
arm
-up
3-6
t
im
es
//e
^M
Iphysi
ca丨
acti
vit
ies
Lif
esty
le p
W^
J^l,
ficti
yH
yi!
),
^^
\
^^
/
d^
T
\
qT:
Il
' A
m
to
I

^ 一
一_^
B
enef
its
of
ph
ysic
al
act
ivit
y T
he
Ph
ysic
al
Act
ivit
y P
yram
id
Str
etch
ing p
hys
ical
act
ivit
y —
^ Ph
ysic
al
Exa
mpl
e: S
tret
chin
g, W
arm
up
1 . M
aint
ain
wei
ght
at h
ealth
ier
leve
l ex
erci
ses
2. B
urn
exce
ss f
at a
nd b
uild
mus
cles
A
lna
cti
ye, o
hv
sic
a|
ac
tiv
itv
Freq
uenc
y: 3
-7 t
imes
per
wee
k ^
^ 3.
Im
prov
e bo
dy c
ompo
siti
on a
nd b
ody
shap
e /
^^
ph
ys
ic
al
acti
vity
D
urat
ion:
1-3
set
s, e
ach
set
abou
t 10
-60
seco
nds
Mus
cle
build
ing
/•
• \
phys
i^lH
ctiv
itV
t
.jS
tXtc
^l^
^s
ica
l ac
tivi
ty
Mu
SC
,e
bu
il
di
nS
P^
sk
al
JK
gM
Ps
ycho
logi
cal
2-3
tiim/y
v My
^ \
timfe
s/w
eek
acti
vity
1.
Bui
ld u
p se
lf-c
onfi
denc
e /
- ~
Ex
am
pl
e:
Gym
exe
rcis
es,
^m
gf
ff
iW
2.
Fe
el
rela
xe
d
Ae
ro
bl
c
ph
y^
a
^c
tiV
ity
Du
mb b
ell
IH
V
3. R
educ
e st
ress
3
-6 t
i^g
gM
Mk
^ ^
Z.
\ Fr
eque
ncy:
2-3
tim
es p
er w
eek
Lif
esty
l e
i^qt
iyif
y \
Dur
atio
n: 1
-3 s
ets,
rep
eat
mot
ions
8-1
2 ti
mes
in
/ D
aily ,:
L
^p
) \
each
se
t
Ph
ysio
log
ica
l /_
A
…
.,:..
...-
.
1. R
educ
e ch
ance
of
gett
ing
dise
ases
suc
h as
bac
k In
acti
ve p
hys
ical
ac
tivi
ty
p7
' hy
pert
ensi
H°n;
d
iSe
aS
e,
Lif
est
yle
ph
ysi
ca
l a
cti
vit
y
Wat
chin
g T
V’
驪
2 二=
i�
n
,-
t—
•二
s,
Do
in
g
^
—
^m
m
3. I
mpr
ove
bloo
d ci
rcul
atio
n ^o
usew
ork
_ j
�‘
•
-. T
Fre
qu
en
cy
: D
ail
y o
r alm
ost
d
ail
y
I W
^
^^
sm
*^
==
==
=d
讓g
P—
l a
—
Du
lon
y3
0 ,L
es
or
abov
e 1
HO
W
to
en
co
ura
ge
6.
En
ha
nc
e j
oin
t m
ove
me
nt,
re
du
ce th
e ra
te o
f I
l m
ys
elf
to
do
mo
re
ph
ys
ic
al
ac
tiv
it
y?
dege
nera
tion
. ^
Ai
1. A
cc
om
Pa
nY
frie
nd
s
7 Im
prov
e bo
dy c
oord
inat
ion,
gra
cefu
lnes
s an
d •
\\
2. J
oin
som
e sp
orts
org
aniz
atio
ns s
uch
as b
owlin
g bo
dy f
lexi
bilit
y.
Aer
ob
ic p
hysi
cal
acti
vity
J
| cl
ub,
swim
min
g cl
ub.
Exa
mpl
es:
Jogg
ing,
Aer
obic
^
SS
U
3. C
hoos
e ph
ysic
al a
ctiv
ities
tha
t yo
u ar
e in
tere
sted
^
^^
danc
e, S
wim
min
g, R
ope
^ in
and
fit
your
dai
ly s
ched
ule.
sk
ippi
ng,
Bal
l ga
mes
4.
Alw
ays
rem
ind
your
self
: 'I
will
kee
p do
ing
^^
^^
^ Fr
eque
ncy:
3-6
tim
es p
er w
eek
phys
ical
act
ivity
.’ D
urat
ion:
20
min
utes
or
abov
e 5.
Set
up
shor
t-te
rm a
nd l
ong-
term
goa
ls.
j-A
6.
Rec
ord
your
pro
gres
s an
d pr
aise
you
rsel
f. ^
Xm
_
7. P
lan
ahea
d yo
ur t
ime
for
doin
g ph
ysic
al a
ctiv
ity
jf
lH
^^
KS
^j
y -
^ an
d st
ick
to
^jr
X
L ^/
F)
^ 8.
Inc
orpo
rate
phy
sica
l ac
tivity
int
o yo
ur d
aily
life
. T
^H
^^
^^
^N
^ I
p^
y V
/ 9.
Par
ticip
ate
in a
var
iety
of
phys
ical
act
iviti
es.
Ml
k '
。+
=,
一〜
to
LM

^ r • 八,
.
Wa
ys
to p
rev
en
t o
steo
po
ro
sis
Ost
eo
po
ro
sis
, T
J
..
,…
,
r >
Hav
e su
nici
ent
inta
ke o
r ca
lciu
m e
very
day
fu
SI^n
Bon
e de
nsity
are
dec
lines
wit
h ag
ing.
If
the
bone
>
Mod
erat
e re
gula
r w
eigh
t-be
arin
g ph
ysic
al
dens
ity d
eclin
es t
oo m
uch,
it w
ould
lea
d to
bon
e ac
tiviti
es
t^o
JSfe
t^
frac
ture
and
ost
eopo
rosi
s. T
he a
nnua
l lo
ss o
f bo
ne
V
Mod
erat
e su
n ex
posu
re (
help
s pr
oduc
ing
The
Chi
nese
Uni
vers
ity
of H
ong
Kon
g de
nsity
is
1% a
fter
the
age
of
35 y
ears
. vi
tam
in D
and
sto
ring
cal
cium
)
> A
void
sm
okin
g, e
xces
sive
cof
fee,
tea
and
sal
t W
omen
's h
ealt
hy
eati
ng
. in
take
s to
pre
vent
the
los
s of
cal
cium
an
d p
hys
ical
ac
tivi
ty
Ris
k fa
ctor
s fo
r os
teop
oros
is
„ r
,.
.. �
Rec
omm
ende
d da
ily i
ntak
e of
cal
cium
pr
omot
ion
prog
ram
In
heri
tanc
e W
omen
age
d 11
-24
year
s 12
00 m
g
Fem
ale
gend
er
Wom
en a
ged
25 y
ears
or
abov
e 80
0 m
g
Lack
of
phys
ical
act
ivity
Pr
egna
nt o
r la
ctat
ing
wom
en
1200
mg
Hea
lth
talk
(6)
H
orm
onal
eff
ects
Ag
ing
Cal
cium
con
tent
in s
ome
com
mon
foo
d ^
^ .,
.
Insu
ffic
ient
int
akes
of
calc
ium
, ph
osph
orus
and
it
tms
^^
Ca
lc
iu
m
cont
ent
I^II
OW
IV
lOre
A
bO
Ut
(m^)
v
ita
min
D
Skim
jniIk
Ic
up(2
40 n
il)
316
Pr
pv
pi
it
in
a H
igh
calc
ium
milk
1
cup
(24(
) ml)
370
JT I
C V
CH
I量
IIg
L
M>
e<
l�l
�
Whole
milk
1 c
up
(24
() m
l)
290
Wh
y
do
es
os
te
op
or
os
is
us
ua
lly
o
cc
ur
Con
den
sed
milk
1
tb
sp (
15
g)
42
“
o
S
oy
a m
ilk
1 c
up (240
ml)
10
am
on
g w
om
en
? H
Uh
calic
nm s
oya
nTilT
Icn
p (2
40 m
l) 40
H
—
r^
nf
Il Q
||
V
B
one
stru
ctur
e an
d bo
ne d
ensi
ty i
n w
omen
are
Lo
w fa
t yog
urt
1 cu
p (1
50 g
) 27
4 ]
^^
;•] 丨丨
a
Ched
dar
chee
se
lsli
ce
(2 丨
g)
132
^
¾¾
! sm
all
er
than
m
en
T
of
u
""
1 sli
ce (1
60 g
) 20
0 U
^
WR
V
Pr
egna
ncy
requ
ires
a l
arge
am
ount
of
calc
ium
So
y be
an
2 tb
sps
(51
g)
1()()
m
__
V
Phys
ical
act
^ty
in w
o.e
n 丨
s l
ess
th
an 画
二
:^
二
H6
乂^
fc
j^
V
Ho
rmo
na
l se
cre
tio
n d
ec
rea
ses
aft
er
me
no
pa
use
K
ai L
an C
hoy
3
tae
ls (
120
g)
154
I
^^
-^
^F
^m
U
M^
^
Bro
ccoli
.H
aels
(120
g)
80
J^
S^
L=
^^
^ W
ong
Nga
Pak
TT
nd7(
120
M)~
~ 83
^
W
IJ^
Eff
ects
Of
oste
opor
osis
W
mer
cres
s 3
(ael
s(12
()g)
兄
产J
/
> L
eads
t�
_
an
d b
on
e p
a,
-二
二
^
^B
UK
^^
^
y C
au
ses
hu
mp
ba
ck
D
ried
sh
rim
p
1 tb
sp (12
g)
67
, ,
„ .
,, •
• ,
Drie
d sil
ver f
ish
1 tb
sp (7
g)
50
^ >
Eas
y to
hav
e bo
ne f
ract
ures
, es
peci
ally
in
wri
st,
0n
mg
e i
„^„1
:(
180
g^
52
念
rib
s an
d h
ip,
be
ca
use
bo
ne
s b
ec
om
e fr
ag
ile.

HP
- g
—:-”
- 1—
:
:
‘
~*
r 门
• ,
.„
> A
mpu
tatio
n of
leg
due
to in
fect
ion
Can
cers
il
ie t
op t
hree
kill
ers
�广
�,
x n
> C
oma
or d
eath
>
30-4
0% a
re r
elat
ed t
o un
heal
thy
eatin
g ha
bits
1.
Can
cers
R
isk
fact
ors
for
diab
etes
>
La
ck o
f an
tioxi
dant
s (V
itam
ins
A5
C a
nd E
) 2.
Hea
rt di
seas
es
V
Ove
rwei
ght
or o
besi
ty
V
Col
on c
ance
r —La
ck o
f di
etar
y fi
bre,
exe
rcis
e 3.
St
roke
>
Fam
ily h
isto
ry o
f di
abet
es
> B
reas
t ca
ncer
—Ex
cess
ive
inta
ke o
f fat
y
Lac
k of
phy
sica
l ac
tivity
>
Ora
l can
cer,
phar
ynx
canc
er a
nd e
soph
agus
W
hat
is d
iabe
tes?
v
^ ^
u +
^ •
c .
.,
..
,,
, >
Had
dia
bete
s du
ring
pre
gnan
cy
canc
er —
Exc
essi
ve i
ntak
e or
alc
ohol
Dia
bete
s is
cau
sed
by i
mba
lanc
ed i
nsul
in s
ecre
tion
> Ex
cess
ive
inta
ke o
f fat
>
Stom
ach,
Col
on a
nd b
ladd
er c
ance
rs —
or
the
insu
lin c
anno
t fu
ncti
on p
rope
rly.
Ins
ulin
Ex
cess
ive
inta
kes
of n
itrat
es in
foo
d w
hich
is
help
s ou
r gl
ucos
e m
etab
olis
m.
Way
s to
pre
vent
dia
bete
s kn
own
to b
e ca
rcin
ogen
ic
Dia
bete
s ha
s tw
o ty
pes:
Typ
e 1
and
Type
2. L
ess
than
>
Mai
ntai
n a
heal
thy
wei
ght
10%
of t
he d
iabe
tic p
atie
nts
are
type
1. T
ype
1 of
ten
> In
crea
se l
evel
of
phys
ical
act
ivity
W
ays
to p
reve
nt c
ance
rs
iden
tifie
d in
chi
ldho
od, i
s ca
used
by
the
dam
age
of
V
Follo
w t
he f
ood
pyra
mid
V
H
ealth
y ea
ting
habi
ts c
an r
educ
e th
e ch
ance
of
panc
reat
ic c
ells
whi
ch a
re r
espo
nsib
le f
or p
rodu
cing
1.
Not
ove
reat
in
each
mea
l, ch
oose
hea
lthy
getti
ng c
ance
rs b
y 30
-40%
in
sulin
, the
n bl
ood
gluc
ose
cann
ot e
nter
oth
er c
ells
and
snac
ks.
> Fo
llow
the
foo
d py
ram
id
the
bloo
d gl
ucos
e le
vel r
ises
. Mos
t (>
90%
) of
the
2. D
ecre
ase
inta
ke o
f fa
t, es
peci
ally
sat
urat
ed f
at
V
Incr
ease
int
akes
of
dark
gre
en a
nd
diab
etic
pat
ient
s ar
e ty
pe 2
, whi
ch o
ccur
s in
the
3. I
ncre
ase
inta
ke o
f di
etar
y fi
bre
with
fru
its,
oran
ge-y
ello
w v
eget
able
and
fru
it ad
ulth
ood,
in w
hich
ther
e is
no d
amag
e in
the
panc
reas
, ve
geta
bles
, an
d w
hole
gra
ins.
V
C
hoos
e a
cere
al, v
eget
able
and
fru
it ba
sed
diet
bu
t the
cel
ls c
an n
ot r
espo
nd t
o in
sulin
. Ty
pe 2
4.
Avo
id o
vere
atin
g hi
gh c
alor
ie f
oods
with
litt
le
�1
to
2 f
ruit
ite
ms
per
day
dia
bet
es i
s p
rev
en
tab
le.
oth
er
nu
trit
ion
-sw
eet
dri
nk
s, i
ce-c
ream
an
d
�6
ta
els
or
ab
ov
e v
eg
eta
ble
per
day
Carb
oh
yd
rate
s b
eco
me
blo
od g
luco
se f
or
en
erg
y
deep f
ried
fo
od
s.
> Ea
t le
ss h
igh
fat f
ood
afte
r dig
estio
n an
d ab
sorp
tion.
Dia
betic
pat
ient
s ca
n >
Eat
less
pro
cess
ed f
ood
not
effe
ctiv
ely
conv
ert
the
carb
ohyd
rate
s to
ene
rgy.
R
isk
fact
ors
for
hear
t di
seas
es a
nd s
trok
e >
Eat
less
pre
serv
ed o
r hi
gh s
alt
food
Ex
cess
glu
cose
acc
umul
ates
in
the
bloo
d, a
nd i
s N
on-m
odif
iabl
e ri
sk
Mod
ifia
ble
risk
fac
tors
V
A
void
reu
sing
coo
king
oil
man
y tim
es
excr
eted
in
urin
e.
mh
eri
^^
T Sm
okin
g >
Ma
inta
m
a h
ea丨
%
Dia
bete
s is
serio
us!
B
ein
g m
ale
s H
yp
ert
en
sio
n
v
Ha
ve
ad
eq
uate
ph
ysi
cal
acti
vit
y
I ea
ds
to c
om
pli
cati
on
s su
ch a
s A
ge
Un
healt
hy e
ati
ng h
ab
its
> A
void
exc
essi
ve d
rink
ing
alco
holic
bev
erag
es
V
Ren
al d
isea
ses,
req
uire
s di
alys
is in
ser
ious
o
f^h
yS
activ
ity
V
Dec
reas
e co
nsum
ptio
n of
red
mea
ts t
o le
ss t
han
case
s H
ad d
iabe
tes
2 ta
els
Per
da
Y
§ V
D
ecre
ase
or l
oss
of v
isio
n Pr
essu
re
> St
ore
food
pro
perl
y to
avo
id b
acte
rial
inf
ectio
n

r 夏
—“
j
aT—
細
HH
H
Ei
2)自
內側
打圈
5次
婦
女健
康飮
食及
運動
推廣
活動
複
10次
。
二 =
S,
聽卜
):
卿(
5 0分
鐘)m^m
Em
I
^^
M
H
1
mm
手用
力推
向牆
’不
g
^H
^^
Mi
1)身
體企
直,
一隻
腳向
前後
擺動
5次
。
要反
彈,
維持
20
B^
^H
2)以
另一
隻腳
重複
以上
動作
^W
IlSy
秒
。
^
is
Mt
ei
Bp
4)換
腳重
複以
上動
1)身
體企
直,
並向
前屈
曲,
維持
5秒
。
註:
圖片
節錄
自’M
J Fr
anz
& J
Nor
stro
m.
作,
交替
3次
。
2)身
體企
直’
雙手
撐腰
’並
慢慢
向後
屈[丨
Il ’維
Dia
bet
es A
ctiv
ely
Sta
ying
Hea
lthy.
1990. p
.26-
30’
持 5 秒
。
3)重
複以
上動
作3次
。
ro
OO

:.
i.雖
上•
熱身
蓮動
^^
HKSB
BEf
flH2原
地踏
香
港巾
文大
學
IPii^
ri I^^
hS
步或
向
天水
圍婦
女聯
合會
合辦
^
li
ll
^f
l/
ij
®^
^H
^S
前
步行
婦
女健
康飮
食及
運動
推廣
活動
PiB
^iiM
yii
[;
關
“
m
3.短
距離
來回
跑,雙
、
®i
\
則慢
慢提
高,
離地
7.雙
腳合
起’
雙手
屈曲
。先
向左
跳,
手屈
曲,
慢慢
加
) 1
大槪
5-8吋
。另
一隻
然
後向
右跳
’重
覆以
上動
作15次
。
^^ 快
速度
’維
持大
腳
重覆
以上
動作
i
fm
t
槪3分
鐘。
R
epea
t O
8.靠
牆站
立’
身
/F
iM
^ V重
覆以
上動
作8次
。
t/
]體
慢慢
坐低
,維
持
I _
j=
…
^ 6站
在凳
後,
手扶
iripBy
4
.坐在
凳上
,用
重
斤
凳背
,一
隻腳
企
^C
T
鶴
物束
在腳
腕上
’背
靠
直,
另一
隻腳
:
著凳
背,
慢慢
提高
一
向後
慢慢
提
註:圓片節錄自
j,隻腳至伸直’腳趾指
\ •
高
,腳
趾離
地大
丨)
MJ
Frai
iz &
J N
orstr
om.
Dia
bete
s Ac
tivel
y St
ayin
g
向身
體。
另一
隻腳
g
t
t 槪
8-1
4吋。
另
//^"^990.01
3[
Sv
重濱
以-乍
。
0
:二
- “!
-'
W^
WlW
l^X
2
) M
li N
els
on
. S
tmn
g
IVo
mcn
Sta
y Y
ou
ng
. 1
99
7.
p. 1
18-1
23
P^
重覆
以
_h 動
作
8 次
_
h®
ijf乍
0 重
I
l 以
3
) T
Wa
lsh
. D
IVA
U
nle
ash
Y
ou
r F
ema
le
Po
wer
. 19
98.
p. I
i 2-
123
上動
fl
? 8
次
4)
Am
eric
an
Hea
rt
Ass
ocia
tio
n.
Fit
tin
g
Fit
nes
s in
Eve
n
Wh
en
Yo
u ’r
e Pr
esse
d fo
r Ti
mt:.
199
6. p
.6
0 j

^ ^
凰
.一
…
i.重
複第
一次
的熱
身運
動
+i
f^
+i
m
丨®
5.
雙手
垂直
,手
拿啞
香
港中
文大
學
^ o
m^m
mm,
m
mm
BB
^^
m
香港
天水
圍婦
女聯
合會
合辦
.
i至“S
S®�
@
m^
^^
^^
m
2原
地踏
步或
婦
女健
康飮
食及
運動
推廣
活動
•
'、
B
,-
,,
湓以
工i
^H
�
向前
步行
大
運動
示範
(三
):
簡易
運動
(10-15分
鐘)
HH
m
二二
I I
mm
^m
SS
^m
^^
^^
fP
JT
;後
屈。
以左
手作
撐抉
。
口
^
^ :.
丨”
1
¾?
¾!
;
T
^ 6手
拿1亞
鈴’
雙手
ish
I
^J屈
曲,
啞鈴
與膊
頭平
•;
3.坐
在櫈
上,
手拿
啞
^^
^書
‘
m
UPv衡
。雙手慢慢提高至
鈴。
手,
然後
/niV
/ r< f
仲
直。
重複
以上
麵乍
1齟
拳隱
W
Ii
8次
。
f/
r^
^l
m
作。
I
完全
仲直
。維
持約
5
,7
I ,,;;;::;
U
I
a ::
爾
i m
IF
ss
l ^
“
1 v、
A ^
m
註:
圖片
節錄
自
1
MJ
Fra
nz &
J N
orst
rom
. D
iabe
les
Activ
ely
Stay
ing
Hea
lthy.
19
90.
p.32
. ^i
^mm
mm
i 2.
ME
Nel
son.
Sl
rong
Wom
en S
lay
Youn
^. 1
997.
s 飄
~
� L
‘

^
J
m^
^^
e^
^^
m
- a
mm
I iim
ij
jl前、後、左、
7.雙
手合
起,
慢
•JH
B
右’
維持
8-10
香港
中文
大學
慢
轉動
手腕
,
秒
香港
天水
圍婦
女聯
合會
合辦
^
^^
Sa
S^
^B
B
重複
8-10次
HIi
a
婦女
健康
飮食
及運
動推
廣活
動
^^
^^
I以
下1
-1
3項
是每
天應
做的
全身
伸展
運動
I
I WM
ff
f.
韉―
a 4雙
手向後打圈
1¾^
¾!!!
!¾身向右側’維持
•
•
HR
8-10次
^
H
8-10秒
。左
手重
•H
H
i wK
隱
I HH
BFHB
IUI9.身體站直’腰
I m
asm
^mss
asm
^wib
m
IFIH
^^
I 5 右
T仲丨
|f〔,斤
•
慢
慢向
後
gn
i H
j 2.肩
膊向
前打
_ ^
sj
Wm
手屈丨丨丨丨輕按
_
轉,
直至
跟看
8-10
次,
向後
打圈
M
B
右T•手肘,維
JI
J足踝
’舟
體
KS
I I
8_
10次
W
A
持8-10秒。/丨
::
W
^m
轉向
兄•
邊
I^V
wH
H
^^M
mM
^BK
m
rm
複動
作
IiliilH
HBM
B
屯複
以上
動
H^
H^
^I 作
BB
iI
~
Wl
i6
i ^
S
9H
SS
9B91 圈
mo 次
gm
^g
gg 持
8-10 秒。左
BU
iPIStM
BB
手
重複
動作

fB
gB
gm
am
^^
^a
/ Ja右腳屈曲,左
跳繩
有以
下幾
種形
式,
建議
每種
做10
-20
I 腳伸直,維
持8-
�0
下••
秒、。左右腳交換重
向
前或
向後
跳,
雙腳
同時
離地
複以
上動
作
向前
或向
後跳
’單
腳離
地
雙手
交叉
向前
或向
後跳
雙人
或多
人跳
大繩
11
.右腳
向前
屈
��
®s
+r
�佳
^g
ta
p芍
^^
曲成
90度
,左
腳
?S
Su
3¾
¾
tf
^ m
^
向後
伸直
,維
持
計劃
階段
星
期一
星期
的次
數時
間(^
MTI
8-
10 秒 ° 左
右腳
-^
m
1 3
•交
換重
複以
上動
1
J
.
•作
2
3
14
3
3
16
4
3
18
12.雙
腳一
前一
5 3
20
腳重
複以
上動
作
3-
4
24
K^
^^
ff
l 1
4-
16
3
-4
2
4
17
-1
9
4-
5
28
^^
^a
^S
B
20
-23
4-5
3
0
^J
Bm
m
24
-27
4-5
3
0
I^
^^
H 二
尖二
=
維持
階段
28
或以
上
3
30-4
5
圈 8-10 次,然後
R^
H^
^^
I向外
側打
圈,
以
R^
^^
HH
HH
另一
_重
複
以上
動作
(力
to

r j
“ M
1)
Sta
nd a
side
the
wal
l ^
^k
^ ^
^^
^^
^^
^^
^^
^
Mm
S^
^^
^W
an
d ra
ise
one
leg.
T
he C
hine
se U
nive
rsit
y of
Hon
g K
ong
Ben
d tw
o le
gs
2)
Cir
cula
te fi
ve ti
mes
W
omen
's H
ealt
hy E
atin
g an
d Ph
ysic
al
a bit,
sw
ing
1¾
¾^
¾¾
¾¾
^^
¾
in a
nti-
cloc
kwis
e A
ctiv
ity
Prom
otio
n P
rogr
am
p^
H^
^^
^^
HL
^^
^ tw
o ha
nds.
£ ^
^K
ii
dire
ctio
n.
Phys
ical
act
ivity
dem
onst
rati
on (
1)
Rep
eat
10
W j
l £
^H
b 3)
C
ircu
late
five
tim
es
War
m-u
p ex
erci
ses
(5-1
0 m
ins)
B
B^
iB
^^
S^
^K
*,
^^
^ ti
mes
ifra
~
e M
^a
m^m
m
4)
ReP
ea
t th
e a
cti
on
s -
MM
hm
MM
St
and
stra
ight
,
wlth the
other leg
IP
JP:
漏
mm
^^
M —
二
ii
mm
^f
f^
i-
HB
Sf
c^
W
oth
er
rela
xed.
^^mK
^m
rM0 i
By
^f ^
^BB
jW^^
^^B
K.
2) R
epea
t th
e ac
tions
with
ano
ther
leg
, an
d v
^^m
mm
mm
B:
Im
^W
p^
jn
mj
/ m
^,
W/
K/
g/
ng
^^
^
I)
Fa
ce
to t
he
wall
, p
ress
1)
|B
HB
Hp
B
Sta
nd
st
raig
ht,
th
en
b
en
d
KE^
^lB
^r*
^
HQK"
itwithbo
thhands
and
five
^^
^I
MI
tW
S #
HE
iP
^I
P^al
lel
with
the
fr
flH
se
cond
s.
^l
f,
_2
) •
J^
^f
e »
the
othe
r st
raig
ht.
Ben
d ba
ckw
ard
slow
ly
1)
Stan
d st
raig
ht,
stri
ng o
ne l
eg f
orw
ard
and
.漏》藤
3
) K
ee
p t
he
feet
flat
on
an
d h
old
fiv
e
ba
ck
wa
rd
fiv
e ti
mes.
^
^遍
墨
the
flo
or.
Pre
ss t
he
wall
se
co
nd
s.
2)
Rep
eat
the
acti
ons
with
ano
ther
leg
w
ith b
oth
hand
s bu
t ^
BW
^K
^^
BS
^^
3) R
epea
t th
e ac
tions
^
BB
K no
t—Ho
,d fo
r mm
^mrn
thre
e times.
Ref
eren
ce:
'MJ
Fran
z &
J N
orst
rom
. D
iabe
tes
20 s
econ
ds.
Activ
ely
Stay
ing
Hea
lthy.
19
90.
p.26
-30’
4)
R
epea
t th
e ac
tions
with
the
oth
er l
eg,
and
^^
^^
^^
^^
遍
alt
ern
ate
th
ree
tim
es.
H
^^
j^
WB
j^
jB

: .
•
, :
:
- 一
^^
1 •
Re
pe
at
th
e p
re
vio
us w
ar
m,
ex
er
cis
es.
m
mB
Bm
ms
i^
^ T
he
Ch
ine
se
un
ive
rs
it^
of
iio
n^
Ko
ng
P^
^B
2. W
alk ab
out
Wom
en's
Hea
lthy
Eat
ing
and
Phys
ical
B
^^
wB
if
lB
^H
-e
_f
ive
A咖
办
P剛
o—
Pr
ogra
m
min
utes
, Ph
ysic
al a
ctiv
ity d
emon
stra
tion
(2)
顯
\ ^
Sm
\
back
wit
h h
an
ds.
*
J %
3.
Run
bac
k an
d fo
rth
a I
With
one
leg
kee
p 7.
Kee
p th
e tw
o le
gs t
oget
her
and
bend
the
leg
s.
^^ sh
ort
dist
ance
, st
raig
ht,
grad
ually
Ju
mp
to t
he l
eft s
ide,
the
n to
the
rig
ht s
ide.
grad
uall
y in
crea
se
^¾
¾^
¾¾
ra
ise
an
oth
er
un
til
Rep
eat
15 t
imes
,
the
pace
and
kee
p fo
r ^
/i
P \
^ ‘ “
“" 7^
inch
es w
ith t
he
;
thre
e m
ins.
^jm
tsJ
l 声:f
" \
^1°01" R
eP
ea
t w
ith
Rep
eat
8. S
tand
bes
ide
the
wal
l, an
othe
r le
g an
d gr
adua
lly l
ower
the
bod
y
�-
�j
j
alt
ern
ate
eig
ht
tim
es.
/
fV
an
d h
old
fo
r 10
seco
nd
s.
^^
H
Rep
eat
thre
e tim
es.
6. S
tand
beh
ind
a ch
air,
4.
Sit
on a
cha
ir,
fix a
^r
l ho
ld t
he c
hair
back
F.
wei
ght
on t
he l
eg.
/ jj
with
han
ds.
With
one
^
JU
^®
rm
G
radu
ally
rai
se
L le
g ke
ep s
trai
ght,
� o
ne
leg
wit
h t
he
gra
du
all
y ra
ise
an
oth
er
Refer
ence
s:
�^
丄 to
es
po
int
to t
he
i^
n
'.�
:
leg
ba
ck
wa
rd
un
til
I)
M.f F
ranz &
J N
orsfr
oni.
Din
bcws
Ac
tivel
y St
ayin
g ^
Pi
pm
?
J bo
dy.
Rep
eat
with
fj
^ ji
f
8-14
inc
hes
with
the
Ih
niih
y. 1
990.
P.3I
I r
S an
othe
r le
g an
d 'J"
_ U
fl
oor.
Rep
eat
with
2)
M
I: N
els
on
. S
tmn
g
n'o
men
Sla
y Y
ou
,^.
1997.
p. 118-12.1
alte
rnat
e ei
ght
4 an
oth
er l
eg a
nd
3)
T W
alsh
. D
IVA
Unl
eash
You
r Fem
ale
Poue
r. 19
98. P
112
-123
tim
es.
alte
rnat
e ei
ght
times
. 4)
Am
erica
n He
art A
ssociu
lion.
Fi
tting
Fitn
ess
in E
ven
Whe
n U)
Yo
u 'tv
Pre
ssed
for
Tim
e. 1
996.
p.6

r -
―—
^—
—m
二
1.
Rep
eat
the
prev
ious
war
m-u
p ex
erci
se
Th
e Chi
nese
Uni
vers
ity
of H
ong
Kon
g W
omen
's H
ealt
hy E
atin
g an
d Ph
ysic
al
Act
ivit
y Pr
omot
ion
Prog
ram
2.
Wal
k ab
out
Phys
ical
act
ivity
dem
onst
rati
on (
3)
W
< H
�y
j^
\
5.
Ho
ld t
wo
d
um
b
thre
e-f
ive
min
ute
s,
Sim
ple
exe
rcis
es (
10-1
5 m
ins)
二
bell
s w
ith
b
oth
h
an
ds,
gra
du
all
y i
ncre
ase
丨G
ra
du
al
ly
ra
ise
the
the
pace.
, -
^
, i
1
:/
. arm
s u
nti
l th
e le
vel
^
.W
V^
i 1
4.
Sit
on
a c
hair
an
d h
old
\
fi
Sj
"K
of
the
sho
ulde
r.
• '
^f
m
, a
dum
b be
ll w
ith r
ight
J
Sl
l ’:
^M
R
epea
t ei
ght
times
. m;^
!
han
d.
Ben
d b
ack
wa
rd
^
W5
! W
k
C
the
low
er
pa
rt
of
the
arm
J
T
T
Vi
Wv
v
KS
m
> an
d su
ppor
t w
ith t
he l
eft
| I
i |
3 . S
it on
a c
hair
and
f ^
感軚
&
^
\|
|\
JH
^h
^
, ;
to
th
e le
vel
of
the
_
^
M^
Hg
)^
. sh
ou
lder.
Rep
eat
eigh
t ^
) .
^ -S
T 6
Hold
the
dum
b ^
ff
lK
ti
me
s.
Repeat
wit
h
『
作
Lf
^ Il
bells a
nd th
en bend
m�
^^
a
no
the
r arm
. ':
叙
the
arm
s to
th
e le
vel
Uj
I M
^
tP
S
low
ly r
ais
e th
e ri
gh
t ^
f^
l^
f V
f'
f o
f th
e sh
ou
lder.
//
^¾
: f
fe
fc
. 1
arm
un
til
it i
s M
y
IM 丨
丨劝
如丨丨
|
Gra
du
all
y r
ais
e th
e
/^
¾¾
: I
) st
raig
ht.
H
old
fo
r fi
ve
Jg
fli
' ,
arm
s u
nti
l fu
lly
1
tf
fm
se
co
nd
s. R
epea
t ei
ght
^S
L :
-
ffl®
^
stra
igh
t. R
epea
t ei
ght
Wf
times
and
the
n re
peat
W
fSI
Vp
V
times
.
# - -
n:
“ ’,
1.
MJ
Fran
z &
J N
orst
rom
. D
iabe
tes
Activ
ely
M^
tm
W'
' St
ayin
g H
ealth
y.
\990
. p.
32.
U
2. M
E N
elso
n.
Stro
ng
Wom
en S
lay
Youn
g.
1997
. s
p1
25
-13
1'2
00

r •L
sio
wiY
be
nd
腫
8^
¾
the
head
J
^,
j^
^E
'^
S^
iH
! 7-
Gra
b th
e tw
o
forw
ard,
T
he C
hine
se U
nive
rsit
y of
Hon
g K
ong
^^
^K
tt
^C
T ha
nds
and
back
war
d, r
ight
W
om
en's
Hea
lth
y E
atin
g an
d P
hys
ical
sl
owly
rot
ate
the
and
left
Act
ivit
y P
rom
oti
on
Pro
gra
m
wri
sts.
Rep
eat
dire
ctio
n. H
old
Phys
ical
act
ivity
dem
onst
rati
on (
4)
eigh
t to
ten
each
for
eig
ht
[Bel
ow a
re t
he d
aily
str
etch
ing
exer
cise
s fo
r th
e tim
es,
to t
en s
econ
ds
|who
le b
ody|
I
^^
^^
IM
W^
PS
^^
i
2. R
otat
e th
e ba
ckw
ard
eigh
t to
j
^^
Sj
BB
^^
wai
stw
ith
the
righ
t
m^
^K
Kk
shou
lder
for
war
d te
n tim
es.
arm
. B
end
to t
he
for
eigh
t to
ten
rig
ht s
ide
with
the
HH
广r Re;eat
w,th
^^
SH
二
°ve;
head
back
war
d H
old
for
eigh
t to
dire
ctio
n.
^^
P^
BI
^^
^B
5.
St
raig
ht t
he
ten
seco
nds.
mm
^M
許爾
:漏
=:
rh
W^
M
^S
IBIIM
II H
BBnn
ELJi
w
3m
M
Wm
to
te
n
se
co
nd
s.
9.
Sta
nd
str
aig
lit
^Mm
mm
^m
a^S
M
R一
th
——
andtw:
s?。
^
mm
mm
um
^^
^S
Bi
^m
mj
sM
mi
mm
ms
sm
th
e le
ft a
rm.
up
pe
r b
od
y
tim
es.
^
^^
K^
^H
nH
I p
i 丨 t
it
on
th
e th
e o
pp
osi
te
WB
^S
sW
UK
Km
b
ac
k,
ho
ld
dir
ecti
on
. W
ltH
the
left
^m
^^
m
^^
^n
iH
^r
a a
rm
f
or
eig
ht
to
^
to t
en
seco
nd
s. R
epea
t w
ith t
he l
eft
arm
. 丨

I ;
;
:
r I ^r
aHj^
gL
yg
eMH
Heg
e™™
10
. Ben
d th
e ri
ght
leg
and
stre
tch
the
Rop
e sk
ippi
ng h
as d
iffe
rent
pla
ying
mod
es,
each
left
leg.
Hol
d fo
r on
e re
com
men
ded
for
10-2
0 re
petit
ions
e
igh
t to te
n
。
^H
BF
^H
^H
g^
^H
Q^
B
sec
on
ds.
Rep
eat
1) J
umpi
ng f
orw
ard
and
back
war
d w
ith t
wo
legs
^^
^^
JH
ff
lMB
BJ
jBB
w
ith
the
left
leg.
le
ave
the
floo
r.
^^
^^
^^
^^
^^
^^
^^
^^
^ 2)
Jum
ping
for
war
d an
d ba
ckw
ard
wit
h on
e le
g le
ave
mm
m^
^m
mm
mm
mm
i 11
. Ben
d th
e ri
ght
floo
r.
leg
forw
ard
to 9
0 3)
Cro
ssin
g th
e ar
ms
and
jum
ping
for
war
d an
d ba
ckw
ard,
degr
ee.
The
lef
t leg
4)
Jum
ping
with
one
or
mor
e pe
rson
s.
BmH
HII
Stre
tch
back
war
d.
f�
^1
1
r ^
•
I H
oid
fo
r eig
ht
to
Pr
og
re
ss
ta
bl
e o
t d
oi
ng
p
hy
si
ca
l a
ct
iv
it
y
^S
B
ten
sec
onds.
Rep
eat
Stag
e W
eek
Fre
qu
ency
D
urat
ion
^H
HM
hmI w
ith th
e lef
t leg
. p
er w
eek
(min
s)
,, B
egin
ning
1
3 12
•
12. B
end
the
two
legs
a b
it fo
rwar
d.,
^ ^
one
foot
in
fron
t of
3
3 1
6 th
e ot
her.
Hol
d fo
r 4
3 1
8 ei
ght
to t
en s
econ
ds.
5
3
20
Rep
eat
with
the
A
dv
an
ce
d 6
^9
3^
4 Y
l .I
I
^K
lf
^^
SS
S 8
10
-13
3-4
2
4
…
,•
K
14
-16
3-4
2
4 13
• R
otat
e th
e ri
ght
^^
M^
M
foot
ln
cloc
kwis
e 1
7-1
9 4
-5
28
dire
ctio
n ei
ght
to t
en
20
-2
3 4
-5
30
HI^
Hh
HB
^^
B tim
es w
ith
the
tip o
n Z
4-Z
/
4-5
30
the f
loor
. Rep
eat i
n 丨
Ma
in
te
na
nc
e 丨
28
or a
bov
e 3
30
45
P^
I^^
W^
^^
^B
B^
^^
B
anti
-clo
ckw
ise
dire
ctio
n. R
epea
t w
ith t
he o
ther
leg
. L

Appendix O
意見調查一講座
1-今日講座主要教你做些甚麼?
2.今日講座 値得記住的內容是甚麼?
3.你 喜歡或感興趣的內容是甚麼?
4.你 不喜歡或感沈悶的內容是甚麼?
5.今日講座的內容有沒有不淸楚的地方?如有,是甚麼?
6.你有沒有其他相關的資料想知道呢?如有,是甚麼?
你認爲講者的表現如何?
•⑴非常好口⑵好 口(3)普通 •⑷差 口(5)非常差
8.整體來說,你滿意今日的講座嗎?
•⑴非常滿意 口⑵滿意 •⑶普通 口⑷不滿意 • (5)非常不滿意
9.你認爲活動有何改善的地方?
10.參加完今日的活動後’你在行爲上將會作出甚麼改變?
多謝回答
L. !!!

意見調查-煮食示範
1.從今日示範你學到甚麼?
2.今日示範 値得記住的內容是甚麼?
3.你 喜歡或感興趣的內容是甚麼?
4.你 不喜歡或感沈悶的內容是甚麼?
5.今日示範的內容有沒有不淸楚的地方?如有,是甚麼?
6-你有沒有其他相關的資料想知道呢?如有,是甚麼?
7.你認爲講者的表現如何?
•⑴非常好•⑵好 口(3)普通 口(4)差 口(5)非常差
8.整體來說,你滿意今日的示範嗎?
•⑴非常滿意 •⑵滿意 口⑶普通 [:⑷不滿意 • (5悱常不滿意
9-你認爲活動有何改善的地方?
10.參加完今日的活動後,你將會嘗試煮哪幾個餸?(可選多過1個)
• (1)微波爐糯米飯• 香滑雞卷 • (3)香茅魚餅 • (4)番薯香蕉杏仁棗
多謝回答
259
L

Appendix P
Process Evaluation for Health Talks
1. What did the message ask you to do?
2. Was there anything that was worth remembering about the message?
3. What did you particularly like about the message?
4. Was there anything that you disliked or bothered you? If yes, please specify.
5. Was there anything in the message that was confusing? If yes, please specify.
6. Is there any relevant information about which you want to learn more? If yes, please specify.
7. How do you rate the speaker's performance?
8.
• (I)Excellent • (2) Good • � Average • (4) Bad D ( S ) P o o r
8. Overall, are you satisfied with today's talk?
• (1) Very Satisfied • (2) Satisfied 口 (3) Average 口 (4) Unsatisfied
口 (5) Very unsatisfied
9. Can you suggest any improvements for the talk?
10. After you attended today's talk, what behavior changes will you make?
Thank You
260
^ ^

Process Evaluation for Cooking Demonstration
1. What did today's demonstration ask you to do?
2. Was there anything that was worth remembering about the demonstration?
3. What did you particularly like about the demonstration?
4. Was there anything that you disliked or bothered you? If yes, please specify.
5. Was there anything in the message that was confusing? If yes, please specify.
6. Do you have any relevant information about which you want to learn more? If yes, please specify.
7. How do you rate the speaker's performance?
• (I)Excellent • (2) Good • (3) Average • (4) Bad • (5) Poor
8. Overall, are you satisfied with today's demonstration?
• � Very Satisfied 口 (2) Satisfied 口 (3) Average 口 (4) Unsatisfied
I I (5) Very unsatisfied
9. Can you suggest any improvements for the demonstration?
10. After you attended today's demonstration, which of the following dishes will you try to prepare? (can choose more than one)
• (1) Microwave Glutinous Rice 口 (2) Chicken Rolls
• (3) Fish Cake with Lemon Grass 口 (4) Almond Sweet Potato Puff
Thank You
261

Appendix V 意見調查
多謝你參加我們的健康賺活動^請仔細Hl答以下幾條問題,以助提供寶貴意見予將來同類型的活動O
1.甚麼原因驅使你參加這次活動呢? ( )
2.你是否出席所有的講座呢?
•⑴是。爲甚麼? ( )
• (O)不是。爲甚麼? ( )
3 - 以下每項’請以 V ’號表達你的意見。 非常 非常 ( )
同 意 同 意 普 通 不 同 意 不 同 意
a)星期六是舉辦一系列講座的 佳時間 • • • • • ( )
b)學校禮堂是舉辦一系列講座的 佳地方 • • • • • ( )
c)講座所用的投影片很淸楚(包括字體、顏色、光暗)• • • • • ( )
d)小冊子的設計很合適(包括字體、顏色) • • • • • ( )
e)小冊子的內容很有用 • • • • • ( )
f )講座的資料很有實用性 • • • • • ( )
g)講座的資料很容易明白 • • • • • ( )
4-你有否將所學到的知識告訴你家人、親戚或朋友呢? ( )
•⑴有。是哪些資料? ( )
• (0)沒有。爲甚麼? _IIZZIZIIZIIIIZIIIIZZIIIZIIZ () 5.你在整個活動學到甚麼呢? ( )
6.若將來我們在其他婦女中心舉辦同類型的活動’你會推薦朋友參加嗎?
•⑴會。爲甚麼? ( )
• (0)不會。爲甚麼? 一 ( )
7.若我們再舉辦同類型的活動,你會建議有哪些地方需作出改善呢? ( )
8-參加完整個活動後,你有否在飮食或運動的行爲上作出改變呢? ( )
•⑴有。是哪些行爲呢? ( )
• (0)沒有。爲甚麼? ^ r 、 ~ ~ — V /
你的名字:中文 英文
聯絡電話: 問卷完畢’多謝合作O
262
L

Appendix R Evaluation Questions Thanks for joining our health promotion program. Here are some questions aimed at obtaining your invaluable
^formation for future programs. Please answer all questions carefully.
1. What were your the reasons of joining our program?
2. Did you attend all the classes?
• Yes. Why?
• No. Why?
Please choose the most appropriate option for the following statements.
Strongly Agree Average Disagree Strongly
Agree disagree a) Saturday's afternoons are the best time for holding a series of talks. • • • • •
b) The School hall is the most suitable venue for holding a series of talks. • • • I • 口
c) The transparencies are easy to see (i.e Font size, Color, Brightness) • • • • 口
The design of pamphlets was appropriate (i.e Font size, Color, Brightness) • • • • • e) The contents of the pamphlets are useful. • • • • •
D All the information given in the talks are practical. • • • • •
& All the contents given in the talks are easy to understand
^ Have you passed any information you learnt to your family/ relatives or friends? • Yes. What kinds?
• No. Why?
• What kinds of new information did you learnt from our program?
If we are going to hold a similar program in other women's centres, would you recommend it to your friends? • Yes. Why?
• No. Why?
If we want to hold the program again, can you suggest any improvements for it?
" — -
Have you changed any behaviors after attending the program? 口 Yes. What kinds?
� N o . Why? _ _ _ _ H Z I Z I I Z Z I Z Z Z I Z Z Z Z Z ^ Z Z I Z Z ^ I
263
1

Appendix V Focus Group Questionnaire
請塡寫以下的個人資料’所有資料將全部保密,只作爲硏究分析之用。
1.你的教育程度是:
• 1.從未接受教育
• 2.小學
• 3.初中(中一至中三)
• 4.高中(中四至中七)
• 5.大專
• 6.大學或以上
2-你的職業是:
• 1.全職工作
• 2.兼職工作
• 3.家庭主婦
• 4.沒有工作
3.你的婚姻狀況是:
• 1.單身
• 2.已婚
• 3.離婚
• 4.喪偶
4.你的家庭成員(包括你在內)共有多少人?
人
5.你的家庭每月總收入大約是:
• 1. $5,000或以下
• 2. $5,001-10,000
• 3. $10,001-15,000
• 4. $15,001-20,000
• 5. $20,001-25,000
• 6. $25,001-30,000
• 7.$30,000 以上
6-你是屬於以下哪一個年齡組別呢?
• 1.25-¾ 歲 • 4. 40-44 歲
• 2. 30-34 歲 • 5. 45-49 歲
• 3. 35-39 歲 • 6. 50-54 歲
問卷完畢,多謝合作。
264

Appendix V Focus Group Questionnaire
Please fill in the following questions, all the information will be kept confidential and used only for research purposes.
1. What is the highest education level you attained?
I I 1. No formal schooling
] 2 . Primary
] 3 . Lower Secondary (Form 1-3)
] 4 . Higher Secondary (Form 4-7)
] 5 . Post Secondary
] 6 . University or above
2. What is your employment status?
• 1. Full-time
] 2 . Part-time
] 3 . Housewife
] 4 . No work
3. What is your marital status?
• 1. Single
• 2. Married
• 3. Divorced
• 4. Widowed
4. How many household members(including yourself) do you have? people
5. Which of the following ranges represent your total monthly household income?
• I - $5,000 or less • 5. $20,001-25,000
• 2. $5,001-10,000 • 6. $25,001-30,000
• 3. $10,001-15,000 • 7. More than $30,000 • 4. $15,001-20,000
6. To which of the following age ranges do you belong?
• 1.25-29 ages
• 2. 30-34 ages
• 3. 35-39 ages
• 4. 40-44 ages
• 5. 45-49 ages
• 6- 5 0 " 5 4 ages End of Questionnaire. Thank You!
265

Appendix V
Focus Group Questionnaire Guides
早晨/午安,多謝你們的來臨°首先讓我自我介紹’我叫鮑敬文,是香港中文大
學的碩士硏究生。我現正進行一項有關香港婦女健康的硏究,而今天的小組討論
就是爲了知道一些有關健康的資料O你們的任何意見,想法或建議’對於我都是
非常重要和寶貴。以下將討論的話題是沒有對或錯的答案’請各位暢所欲言,與
其他組員分享你的見解°所有討論的內容是絕對保密’只是用作學術硏究。請問
你們有沒有任何問題?如果沒有的話’我們現在便開始。首先請輪流介紹自己’
使我們知道如何稱呼你。
1.當你想起‘健康’這兩字,你會想起甚麼呢?
2.以上提及的各方面,對你來說哪一樣是 重要呢?爲什麼?
3.你會怎樣形容自己的健康呢?
4.你認爲自己可以改善健康嗎?甚麼方法?
5.當你想起‘健康生活’ ’你會想起甚麼呢?
6.你從何得知有關‘健康生活’的資料呢?
7.你認爲自己現已擁有‘健康生活’嗎?如何體現呢?
8.爲什麼你會/不會擁有‘健康生活’呢?
9.當你想起‘健康飮食’ ’你會想起甚麼呢?
10.你從何得知有關‘健康飮食’的資料呢?
11 .你認爲自己現已擁有‘健康飮食’嗎?如何體現呢?
12.爲什麼你會/不會擁有‘健康飮食’呢?
13•有些人說要在日常生活中做到‘健康飮食’是一件容易的事,但有些人卻不
認同。那麼你的看法是如何呢?
14•當你想起‘運動,,你會想起甚麼呢?
15.你從何得知有關‘運動’的資料呢?
16.你有做運動嗎?哪類運動呢?
17.爲什麼你會/不會做運動呢?
18.有些人說要在日常生活中做到‘適量運動,是一件容易的事,但有fe人卻不
認同。那麼你的看法是如何呢?
19.你曾經或現在有否在飮食上或運動上作任何改變呢?是甚麼改善呢?現在是
否仍然作此改善呢? 20.爲什麼你會/不會作改善呢?
21 •你希望知道一些有關健康飲食的資料嗎?如有,是甚麼呢?
22.你希望知道一些有關運動的資料嗎?如有,是甚麼呢?
23.如果有一項健康飮食和運動的推廣計劃將舉行’你希望當中有甚麼活動呢?
266

24.在你們提議的活動中’你對哪一項 有興趣呢?如果此項活動包含在該項推
廣計劃中,你有興趣參加嗎?
25.在討論結束前’你有沒有任何意見,睇法或問題需要補充呢?
若沒有的話’這次小組討論便到此結束’再一次多謝你們的來臨和熱烈的討論。
267

Appendix V Focus Group Questionnaire Guides
Good morning/afternoon. Thanks for coming, let me first introduce myself. My
name is Pau King Man, I'm an M.Phil, student from The Chinese University of Hong
Kong. I'm now conducting a survey about the health of Hong Kong women.
Today we will be discussing some issues about health. I'm interested in all your
comments and ideas. There are no right or wrong answers, so please feel free to
share with each other. All information will be kept confidential and only used for
research purposes. Do you have any questions? If no, we can start by introducing
yourselves. Please tell the others how you would like to be called.
1. When you think of 'Health', what comes to your mind?
2. For all mentioned aspects of 'Health', which one is the most important to you? Why?
3. How would you rate your health?
4. Can you do anything to improve your health? How?
5. When you think of 'Healthy Lifestyle', what comes to your mind?
6. How did you know something about 'Healthy Lifestyle'?
7. Do you think you have a 'Healthy Lifestyle'? In what way?
8. Why do/don't you have a 'Healthy Lifestyle'?
9. What does the word 'Healthy Eating' means to you?
10. By what means do you know something about 'Healthy Eating'?
11. Do you think you have a 'Healthy Eating, habit? In what way?
12. Why do/don't you have a 'Healthy Eating' habit?
13. Some people said it is easy to incorporate healthy eating in daily life while others said not, what is your opinion?
14. What does the word 'Physical Activity' means to you?
15. By what means do you know something about physical activity?
16. Do you do physical activity? What type(s)?
17. Why do/don't you do physical activity?
18. Some people said it is easy to incorporate physical activity in daily life while others said not, what is your opinion?
19. Have you ever made any changes in your diet and physical activity habits? What changes? Do you still do it?
20. Why do/don't you have changes? 2 1 . Would you like to learn something about healthy eating? If yes, what topics
would you like to know about?
268

22. Would you like to learn something about physical activity? If yes, what would you like to know about?
23. If a health promotion program about healthy eating and physical activity is
proposed, which activities do you recommend?
24. For those suggested activities, which one is the most interesting to you? If it is
included in the health promotion program, will you participate in the program?
25. Before we finish, do you have anything want to add?
That' s the end of the discussion, thank you for coming and discussing so
enthusiastically!
269

The
foo
d co
nsum
ptio
n pa
tter
ns o
f w
omen
in
the
Edu
cati
on a
nd C
ontr
ol G
roup
s E
duca
tion
Gro
up (
n=81
) C
ontr
ol G
roup
(n=
103)
Fr
eque
ncy
n(%
) Fr
eque
ncy
n(%
) Fo
od i
tem
s N
ever
/Not
1/
wk
2/w
k 3-
4/w
k 5-
6/w
k da
ily
2-3/
day
Nev
er/N
ot 1
/wk
2/w
k 3-
4/w
k 5-
6/w
k da
ily
2-3/
day
cons
ume
cons
ume
daily
2-
3/da
y
Che
ese
56 (
69)
19(2
4)
3(4)
3(
4)
0(0)
0(
0)
0(0)
68
(66
) 27
(26
) 5(
5)
1(1)
1
(1)
1 (1
) 0(
0)
Yog
urt
67 (
83)
11(1
4)
3(4)
0(
0)
0(0)
0(
0)
0(0)
84
(82
) 17
(17)
2(
2)
0(0)
0(
0)
0(0)
0(
0)
Low
fat
yog
urt
67 (
83)
12(1
5)
1(1)
1(
1)
0(0)
0(
0)
0(0)
84
(82
) 15
(15
) 3(
3)
1 (1
) 0(
0)
0(0)
0(
0)
Ice-
crea
m
42 (
52)
27 (
33)
9(11
) 2(
3)
1(1)
0(
0)
0(0)
44
(43
) 35
(34
) 16
(16)
4(
4)
3(3)
1
(1)
0(0)
W
hole
mil
k*
71 (
88)
6(7)
2(
3)
2(3)
0(
0)
0(0)
0(
0)
70 (
68)
16(1
6)
8(8)
8(
8)
1 (1
) 0(
0)
0(0)
Sk
im m
ilk
57 (
70)
9(11
) 5(
6)
8(10
) 1(
1)
1(1)
0(
0)
67 (
65)
18 (
18)
8(8)
8(
8)
1 (1
) 1
(1)
0(0)
>
Hig
h ca
lciu
m
41 (
51)
13 (
16)
5(6)
10
(12)
3
�
8(10
) 1(
1)
61 (
59)
19(1
8)
7(7)
11
(11)
3(
3)
1(1)
1(
1)
"a
low
fat
milk
7(
7)
11(1
1)
3(3)
1(
1)
1(1)
g
Cho
cola
te m
ilk
70 (
86)
5(6)
4(
5)
2(3)
0(
0)
0(0)
0(
0)
84 (
82)
15(1
5)
3(3)
1
(1)
0(0)
0(
0)
0(0)
a
Con
dens
ed
milk
63
(78
) 10
(12)
5(
6)
1 (O
0(
0)
2(3)
0(
0)
79 (
77)
18 (
18)
2(2)
2(
2)
1(1)
0(
0)
1 (1
)
Eva
pora
ted
milk
43
(53
) 16
(20)
9(
11)
4(5)
4(
5)
4(5)
1
(1)
65 (
63)
20(1
9)
6(6)
5(
5)
3(3)
3(
3)
1 (1
)
Whi
te b
read
18
(22
) 25
(31
) 19
(24)
12
(15)
5(
6)
2(5)
0(
0)
30 (
29)
25 (
24)
26 (
25)
18 (
18)
1 (1
) 3(
3)
0(0)
W
hole
whe
at
brea
d 40
(49
) 19
(24)
10
(12)
9(
11)
1 (1
) 2(
3)
0(0)
48
(47
) 31
(30
) 18
(18)
5(
5)
0(0)
1(
1)
0(0)
Sush
i 53
(65
) 23
(28
) 4(
5)
1�
0
(0)
0(0
) 0
(0)
56
(5
4)
41
(4
0)
6(6
) 0
(0)
0(0
) 0
(0)
0(0
) F
ried ri
ce
45
(5
6)
29
(3
6)
6(7
) 1
(1
) 0
(0)
0(0
) 0
(0)
48 (
47)
45 (
44)
8(8)
2(
2)
0(0)
0(
0)
0(0)
Pl
ain
rice
2(
3)
1 (1
) 5(
6)
4(5)
20
(25
) 24
(30
) 25
(31
) 6(
6)
1 (1
) 4(
4)
8(8)
21
(20)
21
(20)
42
(41
) R
ed/b
row
n ri
ce
71 (
88)
7(9)
3(
4)
0(0)
0(
0)
0(0)
0(
0)
85 (
83)
H (
11)
3(3)
2(
2)
0(0)
1(
1)
1 (1
) Fr
ied
nood
les
25 (
31)
33 (
41)
14(1
7)
7(9)
0(
0)
2(3)
0(
0)
22 (
21)
52 (
51)
22 (
21)
6(6)
1(
1)
0(0)
0(
0)
Noo
dles
in
11 (
14)
23 (
28)
20 (
25)
19(2
4)
5(6)
3(
4)
0(0)
8(
8)
29 (
28)
36 (
35)
26 (
25)
2(2)
2(
2)
0(0)
”
soup

Edu
cati
on G
roup
(n=
81)
Con
trol
Gro
up (�
1
=1
03
) F
req
ue
nc
y n
(%)
Fre
qu
en
cy
n(%
) F
oo
d it
em
s N
ev
er/
No
t 1
/wk
2/w
k
3-4
/wk
5-6
/wk
dail
y
2-3
/da
y
Ne
ve
r/N
ot
1/w
k
2/w
k
3-4
/wk
5
-6/w
k
dail
y
2-3
/day
c
on
su
me
co
nsu
me
dail
y
2-3
/day
Cu
p
39 (
48)
27 (
33)
11(1
4)
3(4)
1(
1)
0(0)
0(
0)
43 (
42)
42 (
41)
15(1
5)
3(3)
0(
0)
0(0)
0(
0)
nood
les/
Inst
ant
15(1
5)
3(3)
0(
0)
0(0)
0(
0)
nood
les
Tof
u 7(
9)
38 (
47)
21 (
26)
13 (
16)
1 (1
) 1(
1)
0(0)
13
(13
) 46
(45
) 25
(24
) 18
(18)
1
(1)
0(0)
0(
0)
Frie
d to
fu
57 (
70)
19(2
4)
4(5)
0(
0)
1(1)
0(
0)
0(0)
64
(62
) 34
(33
) 4(
4)
0(0)
1
(1)
0(0)
0(
0)
Tof
u sh
eet
39 (
48)
34 (
42)
5(6)
2(
3)
1 (1
) 0(
0)
0(0)
50
(49
) 40
(39
) 11
(11)
1(
1)
1 (1
) 0(
0)
0(0)
T
ofu
skin
* 54
(67
) 18
(22
) 7(
9)
2(3)
0(
0)
0(0)
0(
0)
54 (
52)
42 (
41)
5(5)
0(
0)
2(2)
0(
0)
0(0)
B
eanc
urd
shee
t 51
(63
) 24
(30
) 1
(O
3(4)
2(
3)
0(0)
0(
0)
59 (
57)
39 (
38)
3(3)
2(
2)
0(0)
0(
0)
0(0)
Fr
uit
(equ
als
to
2(3)
2(
3)
12(1
5)
16(2
0)
15(1
9)
23 (
28)
11 (
14)
1 (1
) 8(
8)
6(6)
16
(16)
29
(28
) 23
(22
) 20
(19)
a
med
ium
16
(16)
29
(28
) 23
(22
) 20
(19)
oran
ge)
Veg
etab
les
2(3)
3(
4)
3(4)
4(
5)
15(1
9)
30 (
37)
24 (
30)
1 (1
) 6(
6)
4(4)
11
(11)
24
(23
) 34
(30
) 23
(22
) (e
qual
s to
1
24 (
23)
34 (
30)
23 (
22)
rice
bow
l)
Frie
d eg
g 10
(12)
32
(40
) 21
(26)
15
(19)
3(
4)
0(0)
0(
0)
13 (
13)
49 (
48)
23 (
22)
13 (
13)
3(3)
2(
2)
0(0)
B
oile
d eg
g 59
(73
) 19
(24)
2(
3)
1 (O
0(
0)
0(0)
0(
0)
67 (
65)
26 (
25)
6(6)
1(
1)
2(2)
1
(1)
0(0)
Fr
ied
fish
34
(42
) 17
(21)
21
(26
) 7(
9)
1 (1
) 0(
0)
1(1)
26
(25
) 38
(37
) 25
(24)
9(
9)
3(3)
2(
2)
0(0)
St
eam
ed f
ish
6(7)
4(
5)
15(1
9)
31 (
38)
12(1
5)
9(11
) 4(
5)
7(7)
13
(13
) 25
(24
) 26
(25
) 16
(16)
15
(15
) 1(
1)
Frie
d be
ef
43 (
53)
18 (
22)
12(1
5)
7(9)
0(
0)
1 (O
0(
0)
44 (
43)
34 (
33)
15(1
5)
7(7)
1
(1)
2(2)
0(
0)
Frie
d po
rk
24 (
30)
17(2
1)
19(2
4)
18 (
22)
3(4)
0(
0)
0(0)
19
(18)
30
(29
) 28
(27
) 19
(18)
1(
1)
5(5)
1(
1)
Frie
d ch
icke
n 29
(36
) 22
(27
) 22
(27
) 5(
6)
3(4)
0(
0)
0(0)
33
(32
) 31
(30
) 24
(23
) 10
(10)
4(
4)
1(1)
0(
0)
Chi
cken
win
g 12
(15)
33
(41
) 24
(30
) 10
(12)
2(
3)
0(0)
0(
0)
12 (
12)
38 (
37)
35 (
34)
15 (
15)
3(3)
0(
0)
0(0)
Sa
rdin
e 63
(78
) 14
(17)
2(
3)
2(3)
0(
0)
0(0)
0(
0)
78 (
76)
23 (
22)
1 (1
) 0(
0)
1(1)
0(
0)
0(0)
B
acon
68
(84
) 10
(12)
2(
3)
1(1)
0(
0)
0(0)
0(
0)
90 (
87)
10(1
0)
3(3)
0(
0)
0(0)
0(
0)
0(0)
r-
j -
--
-

Edu
catio
n G
roup
(n=
81)
Con
trol
Gro
up (
n=10
3)
Freq
uenc
y 2/
wk
3-4/
wk
n(%
) Fr
eque
ncy
n(°/o
) Fo
od i
tem
s N
ever
/N
Ot
cons
ume
1/w
k Fr
eque
ncy
2/w
k 3-
4/w
k 5-
6/w
k da
ily
2-3/
day
Nev
er/N
Ot
co
nsum
e
1/w
k 2/
wk
3-4/
wk
5-6/
wk
daily
2-
3/da
y
Ham
37
(46
) 27
(33
) 10
(12)
6(
7)
1(1)
0(
0)
0(0)
41
(40
) 41
(40
) 15
(15)
5(
5)
1 (1
) 0(
0)
0 (0
) Sa
usag
e 34
(42
) 35
(43
) 9(
11)
3(4)
0(
0)
0(0)
0(
0)
36 (
35)
46 (
45)
16(1
6)
4(4)
1
(1)
0(0)
0
(0)
Ham
burg
er
54 (
67)
24 (
30)
1(1)
2(
3)
0(0)
0(
0)
0(0)
65
(63
) 34
(33
) 2(
2)
1 (1
) 1
(1)
0(0)
0
(0)
File
t-O
-fis
h 44
(54
) 33
(41
) 2(
3)
2(3)
0(
0)
0(0)
0(
0)
47 (
46)
52 (
51)
3(3)
1
(1)
0(0)
0(
0)
0(0)
E
gg t
art
38 (
47)
36 (
44)
6(7)
1(
1)
0(0)
0(
0)
0(0)
50
(49
) 44
(43
) 7(
7)
2(2)
0(
0)
0(0)
0(
0)
Min
i ca
ke
(with
cre
am)
41 (
51)
31 (
38)
7 (9
) 2(
3)
0(0)
0(
0)
0(0)
54
(52
) 42
(41
) 6(
60)
1(1)
0(
0)
0(0)
0(
0)
Min
i ca
ke (
no
crea
m)
53 (
65)
20 (
25)
6(7)
1(
1)
1 (1
) 0(
0)
0(0)
62
(60
) 30
(29
) 10
(10)
1(
1)
0(0)
0(
0)
0(0)
Oth
er p
astr
y 81
(10
0)
0(0)
0(
0)
0(0)
0(
0)
0(0)
0(
0)
103
0(0)
0(
0)
0(0)
0(
0)
0(0)
0(
0)
Pizz
a (1
00)
0(0)
0(
0)
Pizz
a 60
(74
) 20
(25
) 1
(U
0(0)
0(
0)
0(0)
0(
0)
77 (
75)
24 (
23)
2(2)
0(
0)
0(0)
0(
0)
0(0)
Fr
ench
fri
es
45(5
6)
26 (
32)
5(6)
4(
5)
1�
0
(0)
0(0
) 5
3 (
52
) 4
5 (4
3)
4(4
) 1
(1
) 0
(0)
0(0
) 0
(0)
Hash
b
row
n
61
(7
5)
16
(20
) 3
(4)
1(1
) 0
(0)
0(0
) 0
(0)
77
(7
5)
23
(2
2)
2(2
) 1 (
1)
0(0
) 0
(0)
0(0
) P
ota
to c
rips
* 62
(77
) 13
(16
) 4(
5)
2(3)
0(
0)
0(0)
0(
0)
65 (
63)
34 (
33)
4(4)
0(
0)
0(0)
0(
0)
0(0)
C
andi
es
45(5
6)
24 (
30)
6(7)
6(
7)
0(0)
0(
0)
0(0)
55
(53
) 38
(37
) 5(
5)
2G
) 1
(1)
2(2)
0(
0)
Cho
cola
te*
56 (
69)
16(2
0)
3(4)
6(
7)
0(0)
0(
0)
0(0)
62
(60
) 36
(35
) 4(
4)
1 (H
0(
0)
0(0)
0(
0)
Soft
dri
nk
49 (
61)
19(2
4)
6(7)
3(
4)
2(3)
2(
3)
0(0)
43
(42
) 35
(34
) 14
(14)
5(
5)
5(5)
1
(1)
0(0)
D
iet
soft
drin
k 73
(90
) 7(
9)
0(0)
0(
0)
0(0)
1
(1)
0(0)
92
(89
) 11
(11
) 0(
0)
0(0)
0(
0)
0(0)
0(
0)
Yau
cha
r kw
ai
65(8
0)
14(1
7)
2(3)
0(
0)
0(0)
0(
0)
0(0)
77
(75
) 25
(24
) 0(
0)
1 (U
0(
0)
0(0)
0(
0)
Bee
foff
al
64 (
79)
16(2
0)
0(0)
0(
0)
1 (1
) 0(
0)
0(0)
81
(79
) 20
(19)
1
(1)
0(0)
1
(1)
0(0)
0(
0)
Frie
d di
m s
um
KJ
32 (
40)
25 (
31)
13 (
16)
10(1
2)
1(1)
0(
0)
0(0)
43
(42
) 31
(30
) 23
(22
) 5(
5)
0(0)
1
�
0(0
) K)

Edu
cati
on G
roup
(n=
81)
Con
trol
Gro
up (
n=10
3)
Freq
uenc
y n(
%)
Freq
uenc
y n(
%)
Food
ite
ms
Nev
er/N
Ot
1/
wk
2/w
k 3-
4/w
k 5-
6/w
k da
ily
2-3/
day
Nev
er/N
Ot
co
nsum
e
1/w
k 2/
wk
3-4/
wk
5-6/
wk
daily
2-
3/da
y
cons
ume
Nev
er/N
Ot
co
nsum
e
Stea
med
dim
su
m
13 (
16)
25 (
31)
22 (
27)
15(1
9)
2(3)
4(
5)
0(0)
9(
9)
43 (
42)
20(1
9)
22 (
21)
6(6)
3(
3)
0(0)
But
ter
Mar
gari
ne
Pean
ut b
utte
r Sa
lad
dres
sing
*
60 (
74)
50 (
62)
41(5
1)
56 (
69)
15(1
9)
19(2
4)
25 (
31)
18 (
22)
5(6)
8(
10)
10(1
2)
5(6)
1(1)
3(
4)
4(5)
2(
3)
0(0
) 0
(0)
0(0
) 0
(0)
0(0
) 1(
1)
1(1)
0
(0)
0(0)
0(
0)
0(0)
0(
0)
74 (
72)
67 (
65)
48 (
47)
53 (
52)
23 (
22)
5 (5
) 1
(1)
29 (
28)
5 (5
) 1
(1)
46 (
45)
7 (7
) 2
(2)
43 (
42)
5 (5
) 0
(0)
0(0)
0(
0)
0(0)
2(
2)
0(0)
1(
1)
0(0)
0(
0)
0(0)
0(
0)
0(0)
0(
0)
* 尸
<0.0
5
to
UJ


CUHK L i b r a r i e s
圓 圓 _ _ 0Q3TSS704