Effectiveness and Evaluation of Wood Protection Against ...
258
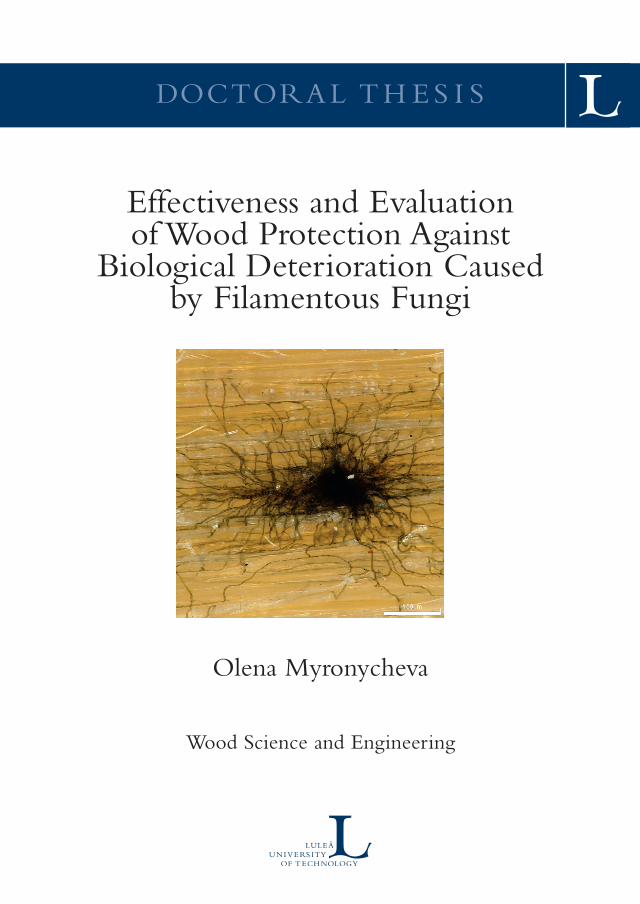
DOCTORAL THESIS Effectiveness and Evaluation of Wood Protection Against Biological Deterioration Caused by Filamentous Fungi Olena Myronycheva Wood Science and Engineering
-
Upload
khangminh22 -
Category
Documents
-
view
5 -
download
0
Transcript of Effectiveness and Evaluation of Wood Protection Against ...
DOCTORA L T H E S I S
Effectiveness and Evaluationof Wood Protection Against
Biological Deterioration Causedby Filamentous Fungi
Olena Myronycheva
Wood Science and Engineering
Doctoral Thesis
Division of Wood Science and Engineering
Department of Engineering Sciences and Mathematics
Luleå University of Technology
EFFECTIVENESS AND EVALUATION OF WOOD PROTECTION
AGAINST BIOLOGICAL DETERIORATION CAUSED BY FILAMENTOUS FUNGI
Olena Myronycheva
Supervisors:
Olov Karlsson
Margot Sehlstedt-Persson
Dennis Jones
Dick Sandberg
Skellefteå, Sweden
2021
Doctoral Thesis
Department of Engineering Sciences and Mathematics
Luleå University of Technology,
Skellefteå, Sweden
All rights reserved
Copyright © Olena Myronycheva, 2021
Division of Wood Science and Engineering
Department of Engineering Sciences and Mathematics
Luleå University of Technology,
Skellefteå, Sweden
931 87 Skellefteå, Sweden
Phone: +46 (0) 910 58 5312
Author e-mail: [email protected]
Picture for Cover page taken by Tomáš Kytka
ISBN: 978-91-7790-960-6 (print)
ISBN: 978-91-7790-961-3 (electronic)
Printed by Luleå University of Technology, Graphic Production 2021

"It is characteristic of science and of progress that they
continuously open new fields to our vision.
When moving forward toward the discovery of the unknown, the
scientist is like a traveller who reaches higher and higher
summits from which he sees in the distance new countries to
explore.
Take interest, I implore you, in those sacred dwellings which are
designated by the expression term, laboratories.
Demand that they be multiplied and advanced. These are the
temples of the future, temples of well-being and happiness ...
where humanity grows greater, stronger, better.”
Louis Pasteur (Dubos 1950)

ABSTRACT Developing a holistic understanding of the biological deterioration of wooden material by fungi
in the laboratory and outdoor conditions requires the development of new assessment procedures
and tools that allow describing the process with maximum precision and accuracy. Environmental
biodeterioration is a complex process including a combination of physical, chemical and
biological changes, with many uncertainties limiting the predictability and effectiveness of
selected preservatives after laboratory tests. Therefore, in the current thesis, the investigation of
the effectiveness of selected wood process parameters and protection systems against fungal
growth and evaluation of the applicability of near-infrared spectroscopy for wooden surfaces
assessment under fungal attack were accomplished.
The mould attack on copper impregnated Scots pine sapwood regulated to a greater extent by
planing depth than by the infection method. Air-borne contaminants can heavily occupy the
unplaned surfaces, but the extent of such occupation could be reduced with planing and
impregnation solutions. Despite the vulnerability of the differently planed and copper-
impregnated wood towards mould fungi, mass loss of that wood degraded by white-rot Trametes
versicolor was less than 5%. The distribution, quantity, and nature of lipophilic substances
beneath the surface in the air- and kiln-dried Scots pine sapwood boards significantly influenced
mould fungi attack. It was found that the concentration of total extractives was significantly higher
in kiln-dried than in air-dried samples and was higher close to the surface than in the layers
beneath. During kiln-drying, a migration front is created at a depth of 0.25 mm with a thickness
of about 0.5 mm. The evidence from the previous study is committed to understanding the
influence of extractives and other migrating compounds on the unplanned surface and,
consequently, on mould growth on that surface of Scots pine sapwood subjected to air and kiln
drying. Therefore, a multivariate regression model was developed.
The thermal modification at different temperatures of exotic African wood influenced the
chemistry. Iroko wood demonstrated stabilisation of pH and different patterns of chemical
changes compared to padouk.
The open process of wood treatment like heating-and-cooling (i.e. fully soaking heated wood in
cold liquor allowing the liquor to penetrate wood partially) can improve wood performance by
developing a protective layer beneath the surface on heat-induced curing. However, the applied
methacrylic resin demonstrated effectiveness during laboratory testing for biodeterioration but did
not perform efficiently during outdoor tests.

The test of available commercially of generally recognised as safe (GRAS) compounds and
biocidal treatment in laboratory conditions revealed a moderate inhibition effect on protection
against biodeterioration.
Hyperspectral imaging in the NIR region could be applied to classify thermally modified wood
but not for air/kiln-dried Scots pine wood. The use of a portable microNIR spectrometer
efficiently demonstrated the separation of no mould and mould specimens in laboratory tests of
Scots pine and allowed classifying boards treated with commercial biocides after outdoor
weathering.
SAMMANFATTNING För att uppnå en holistisk förståelse av svampars försämring av trämaterials egenskaper under
laboratorie- och utomhusförhållanden krävs utveckling av nya bedömningsförfaranden och
verktyg som gör det möjligt att beskriva processen med maximal precision och noggrannhet.
Biologisk påverkan i omgivande miljö utgörs av komplexa processer som inkluderar en
kombination av fysiska, kemiska och biologiska förändringar, och inkluderar många osäkerheter
som begränsar förutsägbarheten och effektiviteten hos utvalda träskyddsmedel vid specifika
laboratorietester. Avhandlingen baseras på undersökning av effektiviteten hos utvalda
träprocessparametrar och skyddssystem mot svamptillväxt samt utvärdering av tillämpligheten av
nära infraröd spektroskopi för bedömning av träytor vid svampattack.
Attack av mögelsvampar på kopparimpregnerad furusplint (Scots Pine) reglerades i större
utsträckning av hyveldjupet än av infektionsmetoden. Luftburna mikrober kan lättare fastna och
kolonisera de ohyvlade ytorna, men dess omfattning skulle kunna minskas genom hyvling och
användandet av lämpliga impregneringslösningar. Trots sårbarheten hos det ohyvlade virket mot
mögelsvampar var massförlusten av det kopparimpregnerade virket som bryts ned av vitrött-
svampen Trametes versicolor mindre än 5%. Fördelningen, kvantiteten och typ av lipofila ämnen
under ytan hos luft- och kammartorkade furuvirket samt inverkan på tillväxt av mögelsvampar i
mögelutsatt virke studerades. Mängden extraktivämnen var betydligt högre i kammartorkade än i
lufttorkade prover och högre i skikt nära virkesytan än i underliggande skikt. Det konstaterades
att vid kammartorkningen bildades en migrationsfront i virket med ett djup av 0,25 mm och med
en tjocklek av ca 0,5 mm. Resultat från studierna pekade på extraktivers och andra migrerande
föreningars inverkan på ohyvlade ytans kemi i det luft- och kammartorkade virket och
mögeltillväxten.
Kemiska egenskaper hos afrikanska träslag (Padouk and Iroko) som värmebehandlats vid olika
behandlingstemperaturer (20-210°C) studerades. Aciditet (pH) vid 20°C var olika för träslagen
men påverkades ej av en ökad behandlingstemperatur medan extraktivämneshalt och fenolhalt
skiftade mer.
Öppna och ej trycksatta processer för träbehandling som uppsugning av vätska genom
nedsänkning av uppvärmt virke i kall vätska har potential att förbättra träegenskaper genom att
utveckla ett skyddande skikt under ytan efter värmeinducerad fixering. Applicerat metakrylatharts
visade sig effektivt mot biologisk påverkan vid laboratoriebetingelser, men presterade inte
effektivt vid utomhus tester.

Behandlingar med kemiska föreningar och substrat som kan klassas som allmänt erkända som
säkra (GRAS) samt biocidinnehållande ytbehandlingsprodukter visade på en måttligt hämmande
effekt mot biologisk påverkan vid laboratorieförhållanden.
Erhållna resultat visar på att hyperspektral avbildning i NIR-regionen skulle kunna tillämpas för
att klassificera termiskt modifierat trä men inte för luft/kammartorkad furu. Användning av bärbar
mikroNIR-spektrometer visade sig vara ett effektivt hjälpmedel för separation av furuytor med
eller utan mögel. Tekniken tillät även klassificering av brädor som behandlats med kommersiella
biocidinnehållande produkter efter utomhusexponering.
АБСТРАКТ Розвиток всебічного розуміння біологічного руйнування дерев’яного матеріалу грибами в
лабораторних і зовнішніх умовах вимагає розробки нових процедур оцінки та інструментів,
які дозволяють описати процес з максимальною точністю і точністю. Біопсування у
навколишньому середовищі – це складний процес, що включає поєднання фізичних,
хімічних та біологічних змін, з багатьма невизначеними факторами, що обмежує
передбачуваність та ефективність обраних консервантів після лабораторних досліджень.
Тому в даній науковій роботі виконано дослідження ефективності вибраних параметрів
обробки деревини та систем захисту від грибкового росту та оцінка застосовності
спектроскопії ближнього інфрачервоного випромінювання для оцінки дерев’яних
поверхонь з наявністю грибка. Напад цвілі на просочену міддю заболонь сосни звичайної
регулюється більшою мірою глибиною стругання, ніж методом зараження. Забруднювачі,
що переносяться повітрям, можуть сильно забруднювати нестругані поверхні, але ступінь
такого забруднення можна зменшити за допомогою стругання та просочення різними
сполуками. Незважаючи на вразливість деревини, яка по-різному стругана та просочена
міддю, до цвілевих грибів, втрата маси цієї деревини, деградованої за допомогою білої
гнилі Trametes versicolor, становила менше 5%. Розподіл, кількість та природа ліпофільних
речовин під поверхнею в висушених на повітрі та в печі дошках із заболоні сосни звичайної
значно впливали на напад цвілевих грибів. Було виявлено, що концентрація загальних
екстрактивних речовин була значно вищою у висушених у печі зразках, ніж у висушених
на повітрі зразках, і була вищою біля поверхні, ніж у шарах під ними. Під час сушіння в
печі створюється фронт міграції на глибині 0,25 мм при товщині близько 0,5 мм. Дані з
попереднього дослідження спрямовані на розуміння впливу екстрактивних речовин та
інших мігруючих сполук на нестругану поверхню і, отже, на ріст цвілі на цій поверхні
заболоні звичайної, підданої сушці на повітрі та в печі. Тому була розроблена
багатовимірна регресійна модель.
Термічна модифікація при різних температурах екзотичної африканського дерева вплинула
на хімію деревени. Деревина іроко продемонструвала стабілізацію рН та різні напрямки
хімічних змін порівняно з падуком.
Відкритий процес обробки деревини, такий як нагрівання та подальше охолодження (тобто
повне замочування нагрітої деревини в холодному розчині, дозволяючи розчину частково
проникати в деревину), має потенціал для покращення характеристик деревини шляхом
створення захисного шару під поверхнею під час затвердіння під впливом тепла. Проте
застосована метакрилова смола продемонструвала ефективність під час лабораторних
випробувань на біопсування, але не ефективна під час випробувань на відкритому повітрі.
Випробування комерційних загальновизнаних безпечних (GRAS) сполук та біоцидної
обробки в лабораторних умовах виявило помірний інгібуючий ефект при захисті від
біопсування.
Гіперспектральне зображення в області NIR можна застосувати для класифікації термічно
модифікованої деревини, але не для деревини сосни звичайної, висушеної на повітрі або
при сушці в печі. Використання портативного спектрометра microNIR ефективно
продемонструвало поділ без плісняви та зразків з пліснявою в лабораторних дослідженнях
сосни звичайної та дозволило класифікувати дошки, оброблені комерційними біоцидами
після впливу зовніщнього середовища.
PREFACE After finishing my PhD journey and looking back, I feel happy with exciting opportunities
resulting from acquired knowledge. Coming to Sweden and being hungry for new things to
explore, I definitely could say that curiosity opens all opportunities and doors. The unique
connection between academia and industry I found in Sweden inspired me to work hard to develop
new applications because you can immediately see the results of your research in the practice and
how it influences the minds of people involved.
Firstly, I am grateful to the companies Martinsons (now Holmen) and particularly Peter
Jacobsson, NORRA Timber, Derome providing the test material and ideas for research. Support
from The European Regional Development Fund, the County Administration of Västerbotten, the
municipality of Skellefteå, and Wood Centre North is also greatly appreciated and acknowledged.
Furthermore, financial support from the Swedish Research Council for the Environment,
Agricultural Sciences and Spatial Planning (FORMAS) project “Experimental studies of capillary
phenomena in bio-based materials” 942-2016-64, “Fungal growth on modified wood-based
products under subarctic conditions” 2017-00419, is also gratefully acknowledged. Moreover,
support from the COST Action FP1407 “ModWoodLife” project “Understanding wood
modification through an integrated scientific and environmental impact approach” is gratefully
acknowledged. Finally, to equip laboratories would not be possible without support from Labfund
of LTU, Stiftelsen Rönnbäret and Kempe.
Secondly, my recognition to Ingrid and Elisabeth from Byske local community, Ayna Rönnblon
and her husband Lasse, Anna-Klara Granstrand with family, and Gunnar Landsell for compassion
during my hard time I will never forget.
My deep gratitude I express to my family Volodymyr and Agrypyna, mama, Maryna and Andriy,
for endless love and help. My Swedish friends Isabel, Symon, Anya and Solomon are being
around and supporting those years.
“Sist men inte minst” my most profound bow to supervisors for being all way supportive with
the commitment, diligence and patience not only with scientific content but also with a human
being, and for my joy to grow.
Finally, I am blessed to work with such excellent and intelligent professionals at the Wood Science
and Engineering Division at Luleå University of Technology, Skellefteå.
Sincerely,
Olena Myronycheva

LIST OF APPENDED PAPERS AND AUTHOR’S CONTRIBUTION Paper I
Myronycheva, Olena, Margot Sehlstedt-Persson, Olov Karlsson, and Dick Sandberg. 2018.
‘Growth of Mold and Rot Fungi on Copper-Impregnated Scots Pine Sapwood: Influence of
Planing Depth and Inoculation Pattern’. BioResources 13 (4): 8787-8801.
https://doi.org/10.15376/biores.13.4.8787-8801.
Author contribution: literature research, problem statement, planning and performing the
biodeterioration experiments, data analysis and draft of manuscript preparation.
Paper II
Myronycheva, Olena, Olov Karlsson, Margot Sehlstedt-Persson, Micael Öhman, and Dick
Sandberg. 2018. ‘Distribution of Low-Molecular Lipophilic Extractives beneath the Surface of
Air- and Kiln-Dried Scots Pine Sapwood Boards’. Edited by Martina Lahmann. PLOS ONE 13
(10): e0204212. https://doi.org/10.1371/journal.pone.0204212.
Author contribution: literature research, planning and performing the analytical experiments,
data analysis and draft of manuscript preparation, communication with reviewers.
Paper III
Karlsson, Olov, Olena Myronycheva, Margot Sehlstedt-Persson, Micael Öhman, and Dick
Sandberg. 2017. ‘Multivariate Modeling of Mould Growth in Relation to Extractives in Dried
Scots Pine Sapwood’. In 48th Conference of the International Research Group on Wood
Protection, IRG48. Ghent, Belgium. http://urn.kb.se/resolve?urn=urn:nbn:se:ltu:diva-63985.
Author contribution: literature research, planning and performing the analytical experiments,
data analysis and draft preparation.
Paper IV
Kroupa, Michal, Milan Gaff, Olov Karlsson, Olena Myronycheva, and Dick Sandberg. 2018.
‘Effects of Thermal Modification on Bending Properties and Chemical Structure of Iroko and
Padauk’. Proceedings of the 9th European Conference on Wood Modification 2018, Arnhem, the
Netherlands. 155–161. http://urn.kb.se/resolve?urn=urn:nbn:se:ltu:diva-72585.
Author contribution: literature research, planning and performing the analytical experiments,
data analysis and draft preparation regarding chemical analysis of extractives of African wood.

.
Paper V
Elustondo, Diego, Olena Myronycheva, Bror Sundqvist, and Olov Karlsson. 2016. ‘Localized
Wood Surface Modification, Part I: Method Characterization’. BioResources 12 (1): 283-295–
295. https://doi.org/10.15376/biores.12.1.283-295.
Author contribution: contribution to literature research, experiment planning, writing, editing
and further planning of the part II experiment for the biodeterioration resistance check.
Paper VI
Karlsson, Olov, Olena Myronycheva, Dennis Jones, Diego Elustondo, and Dick Sandberg. 2018.
‘Thermally Modified Wood Treated with Methacrylate’. In IRG49 Scientific Conference on
Wood Protection, Johannesburg, South Africa. http://urn.kb.se/resolve?urn=urn:nbn:se:ltu:diva-
68771.
Author contribution: planning and performing the biodeterioration experiments, data analysis
and draft preparation.
Paper VII
Kim, I., Karlsson, O., Myronycheva, O., Jones, D., and Sandberg, D. (2020). "Methacrylic resin
for protection of wood from discoloration by mould growth and weathering," BioResources.
15(3), 7018-7033.
Author contribution: planning and performing the biodeterioration experiments, data analysis
and manuscript draft preparation.
Paper VIII
Myronycheva, Olena, Faksawat Poohphajai, Margot Sehlstedt-Persson, Tommy Vikberg, Olov
Karlsson, Helmut Junge, and Dick Sandberg. 2019. ‘Application of GRAS Compounds for the
Control of Mould Growth on Scots Pine Sapwood Surfaces: Multivariate Modelling of Mould
Grade’. Forests 10 (9): 714. https://doi.org/10.3390/f10090714.
Author contribution: literature research, problem statement, planning of performing the
biodeterioration experiments, data analysis and the draft of manuscript preparation,
communication with reviewers.
Paper IX
Myronycheva, Olena, Injeong Kim, Peter Jacobsson, Olov Karlsson, Margot Sehlstedt-Persson,
and Dick Sandberg. 2020. ‘The Influence of Four Commercial Wood-Surface Treatments on
Mould-Fungi Growth in a Pure Culture’. In , 19–19. InnoRenew CoE.
http://urn.kb.se/resolve?urn=urn:nbn:se:ltu:diva-81365.
Author contribution: project methodology planning, performed experimental work with data
analysis, prepared the manuscript, and presented in the conference.
Paper X
Myronycheva O., Sidorova E., Hagman O., Sehlstedt-Persson M., Karlsson O., Sandberg D.
(2018). Hyperspectral imaging surface analysis for dried and thermally modified wood: an
exploratory study. Journal of Spectroscopy. https://doi.org/10.1155/2018/7423501
Author contribution: planning and performance of the experiment, data collection, analysis and
modelling, manuscript writing, communication with editor and reviewers.
Paper XI
Myronycheva O, Karlsson O, Sehlstedt-Persson M, Öhman M, Sandberg D. (2019). Portable
microNIR sensor for the evaluation of mould contaminated boards. In: The Proceeding from the
62nd SWST International Convention. Yosemite National Park, California, USA.
Author contribution: methodology planning, data collection, analysis, validation and
visualization, writing – original draft and presenting on the conference.
Paper XII
Olena Myronycheva, Alona Sekan, Injeong Kim, Olov Karlsson, Peter Jacobsson, Margot
Sehlstedt-Persson, Dick Sandberg (2020). ‘Spectroscopic Characterisation of Wood Treated by
Different Coatings after Weathering in Subarctic Conditions’. In Proceedings of the 2020 Society
of Wood Science and Technology International Convention. Portoroz, Slovenia: Society of Wood
Science and Technology.
Author contribution: methodology planning, data collection, analysis, validation and
visualization, writing – original draft and presenting on the conference.
Additional scientific work not included in the thesis:
1. Myronycheva O, Karlsson O. Extraction of extractives and analysis of low-molecular
lipophilic extractives beneath the surface of air- and kiln-dried scots pine sapwood boards
v1 (protocols.io.phqdj5w). doi:10.17504/protocols.io.phqdj5w
2. Wei M, Xiong S, Chen F, Geladi P, Eilertsen L, Myronycheva O, et al. Energy smart hot-
air pasteurisation as effective as energy intense autoclaving for fungal preprocessing of
lignocellulose feedstock for bioethanol fuel production. Renewable energy. 2020;155:
237–247. Available: http://urn.kb.se/resolve?urn=urn:nbn:se:ltu:diva-78347
3. Xiong S, Martín C, Eilertsen L, Wei M, Myronycheva O, Larsson SH, et al. Energy-
efficient substrate pasteurisation for combined production of shiitake mushroom
(Lentinula edodes) and bioethanol. Bioresource Technology. 2019;274: 65–72.
doi:10.1016/j.biortech.2018.11.071
4. Sekan AS, Myronycheva OS, Karlsson O, Gryganskyi AP, Blume Y. Green potential of
Pleurotus spp. in biotechnology. PeerJ. 2019;7: e6664. doi:10.7717/peerj.6664
5. Venditti T, Ladu G, Cubaiu L, Myronycheva O, D’hallewin G. Repeated treatments with
acetic acid vapors during storage preserve table grapes fruit quality. Postharvest biology
and technology. 2017;125: 91–98. Available:
http://urn.kb.se/resolve?urn=urn:nbn:se:ltu:diva-60574
6. Myronycheva O, Bandura I, Bisko N, Grygansky AP, Karlsson O. Assessment of the
Growth and Fruiting of 19 Oyster Mushroom Strains for Indoor Cultivation on
Lignocellulosic Wastes. BioResources. 2017;12: 4606–4626. Available:
http://urn.kb.se/resolve?urn=urn:nbn:se:ltu:diva-63345
7. Bandura I, Myronycheva O, Karlsson O, Anike FN, Isikhuemhen OS. Pretreatment of
wheat straw and solid state fermentation improves yield and biological efficiency in
Pleurotus ostreatus Jacq) P. Kumm. mushroom production. University of Palermo; 2017.
pp. 41–43. Available: http://urn.kb.se/resolve?urn=urn:nbn:se:ltu:diva-65995
8. Sehlstedt-Persson M, Öhman M, Marklund B, Myronycheva O. Hyveldjupets inverkan på
mögelbenägenhet hos råspont av furu och gran. TräCentrum Norr; 2016. Available:
http://urn.kb.se/resolve?urn=urn:nbn:se:ltu:diva-21861
9. Bandura I, Myronycheva O, Karlsson O. Assessment of Raw Plant material and Substrate
for Efficient production of Oyster Mushrooms (Pleurotusostreatus (Jacq.) P. Kumm.).
Technická univerzita vo Zvolene; 2016. pp. 27–33. Available:
http://urn.kb.se/resolve?urn=urn:nbn:se:ltu:diva-63206
TABLE OF CONTENTS
1. Introduction .............................................................................................................................. 19
2. Problem description ................................................................................................................. 21
2.1 Background ........................................................................................................................ 21
2.2 Vision ................................................................................................................................. 22
2.3 Objective ............................................................................................................................ 22
2.4 Research questions ............................................................................................................. 22
2.5 Limitations ......................................................................................................................... 22
3. State-of-the-art ......................................................................................................................... 25
3.1 Wood as a material with complex chemistry ..................................................................... 25
3.2 Fungi as decomposers of the wooden material .................................................................. 28
3.3 Fungi in the built environment ........................................................................................... 31
3.4 Wood protection methods against biodeterioration ........................................................... 35
3.5 Methods and evaluations describing fungal growth on wood ............................................ 38
4. Materials and methods ............................................................................................................. 45
4.1 Wood planing depth, impregnation and extractives influence on the fungal attack .......... 45 4.1.1 Wood specimens preparation for copper impregnation ............................................................ 45
4.1.2 Impregnation and evaluation of impregnation results .............................................................. 45
4.1.3 Wood specimens preparation for drying procedures evaluation .............................................. 46
4.1.4 Wood specimens preparation after thermal modification ......................................................... 46
4.1.5 Wood extractives chemical analysis ......................................................................................... 47
4.1.6 Test design for wood material biodeterioration ........................................................................ 47
4.2 Wood thermal modification, protection by GRAS and biocides under fungal attack ....... 49
4.3. Spectroscopic characterisation of wood under fungal attack ............................................ 51
4.4 Statistical analysis used in the thesis .................................................................................. 52
5. Results and Discussion ............................................................................................................. 53
5.1 Wood planing depth, impregnation and extractives influence on fungal attack ................ 53
5.2 Wood thermal modification, protection by GRAS and biocides under fungal attack ....... 61
5.3 Spectroscopic characterisation of wood under fungal attack ............................................. 66 5.3.1 Hyperspectral analysis of the surface ....................................................................................... 66
5.3.2 NIR modelling of kiln/air-dried wood under fungal attack ...................................................... 68
6. Conclusions .............................................................................................................................. 75
7. Future work .............................................................................................................................. 77
REFERENCES ............................................................................................................................. 79


19
1. INTRODUCTION
The desire of European leadership to transition towards a bio-based economy raises demand for
bio-based industrial solutions in all industries. Moreover, the European Union is aligned to the
United Nations 2030 Agenda and Sustainable Developmental Goals framework, where
sustainable raw materials are commonplace in use and crucial for efficient economic development
and prosperity (European Commission 2019).
Wood products are considered as a prominent “green” solution in terms of substitution of abiotic
and energy-intensive materials in construction (European Commission 2019) via processing of
raw forest products to value-added wood products, 80% of which are used in construction and
other civil-engineering projects (Swedish Wood 2021). That has resulted in a growth in the global
production rate of sawn timber of almost 17% since the decision was made in 2012, according to
the Food and Agriculture Organisation of the United Nations (FAO UN 2021). Notably, the
Swedish production volume of sawn timber reached the amount of 18.4 million m3 in 2020, of
which about 75% was exported, as reported by the Swedish Forest Industries (Skogsindustrierna
2021).
As a building and construction material, wood is still nearly 100% organic, renewable engineering
material of natural origin, forming a storage pool of wood-based carbon (UNECE 2008). Derived
from terrestrial vegetation, wood material is involved in the terrestrial carbon cycle and subjected
to decomposition caused by various abiotic and biotic factors (Carvalhais et al. 2014). After
manufactured processing and in moist conditions, sawn timber is highly susceptible to
biodeterioration and biodegradation by different microbes in the biosphere (Zabel and Morrell
1992). Therefore, different technologies of wood preservation have been developed since the
phenomenon was noticed (Feist and Hon 1984) to prolong material shelf life and extend the
maintenance period.
According to requirements within the Public Health Agency FoHMFS 2014:14 “The Swedish
Public Health Agency’s general advice on moisture and microorganisms” and The Swedish
National Board of Housing, Building and Planning rules (Boverket 2021) regulating moisture
security for materials and products included in the building section, wooden products are
considered to be more vulnerable compared to products from steel and concrete coming from non-
renewable sources. Since the hygroscopic nature of wood is known, and control of the living
environment is an obligation of property owners, some players in the building and construction
sector generate nebulous or “wishy-washy” type of knowledge (Olsson 2019). The considerable
maintenance cost of products and wood that has a heterogeneous origin that can impact the life
20
cycle credibility. When national and local governments spend enormous amounts of money
supporting global initiatives (for example, https://www.bioinnovation.se/) and the domestic
wooden industry (Skelleftea Commune 2021). The current trends in designing innovative
environmentally-friendly protecting systems, with a known end-life scenario with minimal toxic
preservative release and bioaccumulation, are significant challenges for wood-based material
development (Salminen et al. 2014). This is not very easy achievable only by strict control of
preservatives usage and implicates knowelege gap in terms of wood preservatives efficiencyto
reduce different fungi growth and avialability of proper evaluation procedures.
21
2. PROBLEM DESCRIPTION
2.1 BACKGROUND So far, the current EU standards are out of date and need to be revisited according to research
done in the last 30 years regarding material resistance and fungal biology (Kutnik, Suttie, and
Brischke 2014). At the same time, a little research has been conducted in the area of
biodegradation no shift from “wood preservation” that means to preserve by toxic chemicals
towards “wood protection”—aiming to develop flexible complex solutions considering the natural
properties of the wood-based material and its heterogeneity, interactions with water, biological
and organic contamination on the surface after process performance and during maintenance to
satisfy stakeholders’ preferences along the whole forest value chain is observed.
To achieve that state of wood protection the detailed knowledge about wood chemistry, its
interaction with different fungi and their physiological conditions in various wood material
applications should be produced using modern analytical equipment. That allows the development
of a comprehensive model based on the process parameters influence on wood chemistry and
understanding the influence of those parameters on the fungal attack. Moreover, a need for fast
assessing tools was stated from the industrial point of view.
Current work is dedicated to evaluating wood protection methods regarding the resulting wood
materials susceptibility towards fungal growth. The wooden species evaluated in our studies was
Scots pine, Norway spruce and two exotic African wood iroko and padouk, since pine and spruce
wood are the most abundant tree species used in the industrial production of wooden construction
material. Scots pine sapwood is quite vulnerable to fungal contaminations and growth. Several
surface treatments, modifications and impregnation were assessed for the material resistance
improvement. To compare the two exotic African wood species, padouk and iroko, were evaluated
regarding extractives enrichment and their chemical properties. The moisture influence was not
mainly focused since laboratory measurements were done in a highly saturated moisture
environment to promote fungal growth. The fungal cultures isolated from wood material with
native virulence were used throughout the tests. Special attention was paid to the distribution of
the extractives and conditions during the previous drying. Pattern recognition approach based on
multivariate statistical analysis seems to be a way to explore the data and draw relevant
conclusions about tests performances.
22
2.2 VISION Development of a holistic understanding of biological deterioration of wooden material by
filamentous fungi in laboratory and outdoor conditions.
2.3 OBJECTIVE Investigation of the effectiveness of selected wood process parameter and protection systems to
reduce fungal growth and evaluation of the applicability of near-infrared spectroscopy for wooden
surfaces assessment under fungal attack.
2.4 RESEARCH QUESTIONS 1. How wood planing depth, copper impregnation and extractives influence fungal attack.
2. How wood thermal modification, protection by GRAS and biocidal compounds influence the
degree of fungal growth in different testing conditions.
3. Which tested near infrared spectroscopic method is more relevant for characterising
conventionally dried and thermally modified timber under fungal attack?
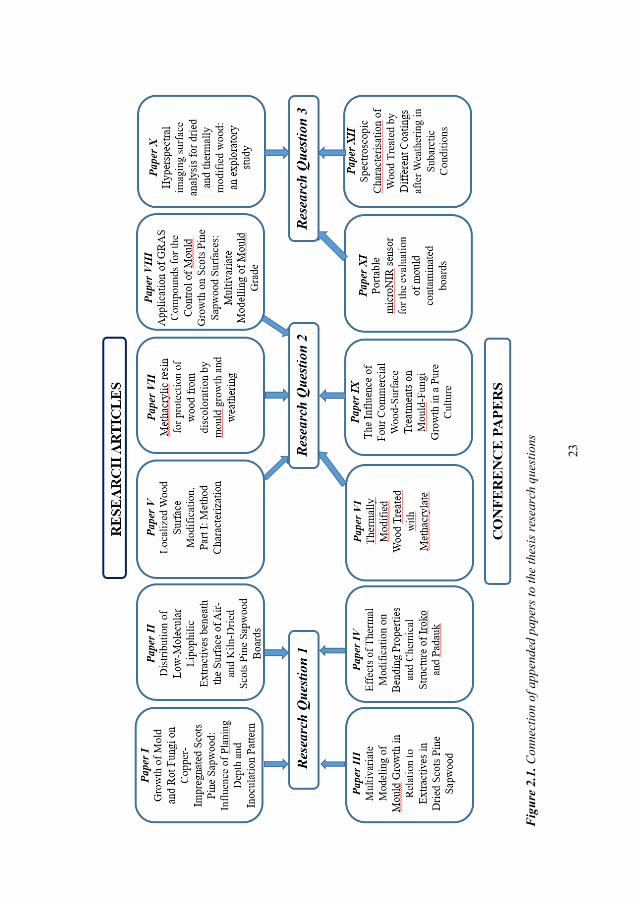
Figure 2.1 presents the connection of appended research paper to research questions.
2.5 LIMITATIONS There are several ways to evaluate biological deterioration. However, in current work, the
assessment for the mould growth was done in laboratory conditions without direct connection to
individual fungi, and community interactions existing in nature. The assessment of nutrients and
full extractives profile and link to individual fungi growth were not undertaken due to the
analytical complexity of the system. The sampling and analytical assessment is a dilemma as a
tiny layer about 100 micrometres below the surface is critical to moulding fungi residence.
Furthermore, the developed indexes used for fungal growth assessment was also a critical point
representing generalisation of the process. The question is still open regarding how to link the
surface assessment at a macro/micro level to environmental processes wood undergoes during
construction as well as exploitation to find decisive parameters in the description of fungi-wood
heterogeneity and move towards modelling, prediction of that system in the natural environment.
23
Fig
ure
2.1.
Con
nect
ion
of a
ppen
ded
pape
rs to
the
thes
is re
sear
ch q
uest
ions

24
25
3. STATE OF THE ART 3.1 WOOD AS A MATERIAL WITH COMPLEX CHEMISTRY
Wood as a raw construction material is a product from perennial woody plants prevailing in
land ecosystems in the form of trees. The formation of trees goes via complex biosynthetic
mechanisms of growth. Conifers or gymnosperm trees are a significant source of raw wood
material supply in Northern Europe (Ek et al. 2009). The stem has gymnosperm xylem
consisting of mostly tracheids arranged in 3D high-order macromolecular structures of lignified
cell walls of cellulose, hemicellulose and pectic substances that define the physical, chemical
and biological properties of softwoods that is a wood material from conifers (Terashima 2012).
At the macroscale, the roundwood before sawing consist of bark, heartwood and sapwood. Pine
heartwood is a dead tissue highly enriched by extractives. The detailed scheme of heartwood
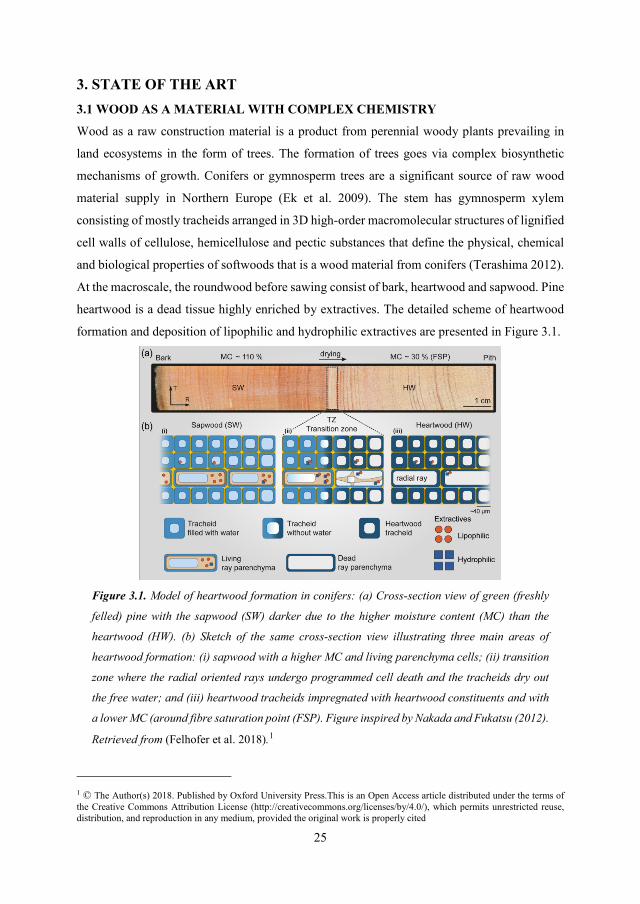
formation and deposition of lipophilic and hydrophilic extractives are presented in Figure 3.1.
Figure 3.1. Model of heartwood formation in conifers: (a) Cross-section view of green (freshly
felled) pine with the sapwood (SW) darker due to the higher moisture content (MC) than the
heartwood (HW). (b) Sketch of the same cross-section view illustrating three main areas of
heartwood formation: (i) sapwood with a higher MC and living parenchyma cells; (ii) transition
zone where the radial oriented rays undergo programmed cell death and the tracheids dry out
the free water; and (iii) heartwood tracheids impregnated with heartwood constituents and with
a lower MC (around fibre saturation point (FSP). Figure inspired by Nakada and Fukatsu (2012).
Retrieved from (Felhofer et al. 2018).1
1 © The Author(s) 2018. Published by Oxford University Press.This is an Open Access article distributed under the terms of the Creative Commons Attribution License (http://creativecommons.org/licenses/by/4.0/), which permits unrestricted reuse, distribution, and reproduction in any medium, provided the original work is properly cited
26
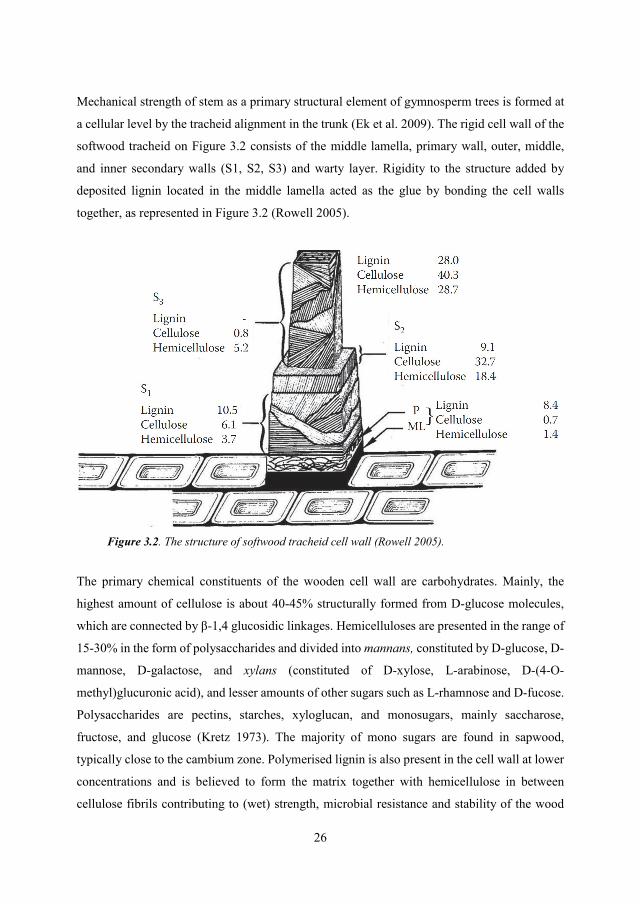
Mechanical strength of stem as a primary structural element of gymnosperm trees is formed at
a cellular level by the tracheid alignment in the trunk (Ek et al. 2009). The rigid cell wall of the
softwood tracheid on Figure 3.2 consists of the middle lamella, primary wall, outer, middle,
and inner secondary walls (S1, S2, S3) and warty layer. Rigidity to the structure added by
deposited lignin located in the middle lamella acted as the glue by bonding the cell walls
together, as represented in Figure 3.2 (Rowell 2005).
Figure 3.2. The structure of softwood tracheid cell wall (Rowell 2005).
The primary chemical constituents of the wooden cell wall are carbohydrates. Mainly, the
highest amount of cellulose is about 40-45% structurally formed from D-glucose molecules,
which are connected by β-1,4 glucosidic linkages. Hemicelluloses are presented in the range of
15-30% in the form of polysaccharides and divided into mannans, constituted by D-glucose, D-
mannose, D-galactose, and xylans (constituted of D-xylose, L-arabinose, D-(4-O-
methyl)glucuronic acid), and lesser amounts of other sugars such as L-rhamnose and D-fucose.
Polysaccharides are pectins, starches, xyloglucan, and monosugars, mainly saccharose,
fructose, and glucose (Kretz 1973). The majority of mono sugars are found in sapwood,
typically close to the cambium zone. Polymerised lignin is also present in the cell wall at lower
concentrations and is believed to form the matrix together with hemicellulose in between
cellulose fibrils contributing to (wet) strength, microbial resistance and stability of the wood
27
fibre. Lignin is a branched and irregular macropolymer formed by the phenolic coupling of the
phenylpropane derivatives (coumaryl alcohol, coniferyl alcohol, and sinapyl alcohol), resulting
in a solid structure. Pine heartwood is a dead tissue that possesses high durability due to the
natural deposition of phenolic compounds such as terpenes, flavonoids, lignans, stilbenes,
among others (Hillis 1987). However, the lipophilic (resin acids, long-chain fatty acids and
triglycerides), less hydrophobic (stilbenes, lignans) and non-structural sugars extractives are
also deposited in sapwood, but usually to lower content (Figure 3.1). The hydrophilic
extractives are polar compounds, mainly mono- and disaccharides that are food reserves. The
composition of these sugars is mainly of saccharose and other low-molecular sugars such as
glucose and fructose. The concentrations of those sugars vary during the winter and summer
seasons, respectively (Terziev et al. 1997). Regarding water-soluble polysaccharides in the
sapwood of Scots pine, they are primarily from neutral acetylated glucomannans with an
average monosaccharide ratio of Man:Glu:Gal of 4:1:0.5 (Willför et al. 2004). The extensive
amount of hydroxyl groups in those carbohydrates named polyoses or hemicellulose are mainly
responsible for hydrogen bonding of water molecules and hygroscopicity of wood material.
Acetyl side groups in hemicelluloses contribute to the acid formation during thermal treatment
(Sundqvist et al. 2006; Rowell 2005; Sundqvist 2004; Sundqvist 2002; Fengel et al 1989).
The surface of a wooden board could be described as a chemically heterogeneous and porous
structure affected by the anisotropy of wood. There is an unambiguous influence on the surface
of the wooden material of the complex natural processes during wood formation followed by
primary industrial processing such as harvesting, sawing and drying. Diffusion of extractives
after sawing and drying (Nussbaum 1999), and organic and inorganic contaminant
sedimentation adds further complexity to the wood surface and could change its hydrophilicity
and wettability. Wettability is a complex phenomenon that influences the adhesion of different
substances to the surface. It is found that wood itself has a acidic character (Mantanis and Young
1997), but infiltration by extractives turn it relatively more acidic according to Lewis acid-base
theory due to the redirection of functional groups and oxidation at the wood/extractives-air
interface (Wålinder 2000).
On the other hand, during weathering, the degradation of wood polymers and the leaching of
extractives notably accelerated on the surface makes the wood more hydrophylic. Different
opinions exist regarding the role of extractives on the wood surface, and their degradation
chemistry is not evident (Rowell 2005). The reduction in hydrophobicity and water exclusion
efficacy of Scots pine sapwood was reported during artificially accelerated weathering, but at
28
outdoor ageing conditions, it was found that abiotic and biotic factors were acting
interdependently (Žlahtič et al. 2016). The durable species kept their initial hydrophobicity, but
it is not clear whether this was due to their photodegradation resistance or the wood's natural
durability. Almost no information about chemical changes and composition of wood’s non-
polar (hydrophobic) extractives during weathering could be found in the scientific literature. It
is a fact that, after harvesting, the wood material undergoes chemical changes that reduce the
initial durability of the grown tree (Ahmed et al. 2013). Natural ageing is mainly related to
surface inactivation caused by migration of extractives from bulk to the surface and changes in
the chemistry owing to the oxidation of the extractives at the surface (Ahmed et al. 2013). To
add complexity to this, one can say that the natural design and evolution of plant vascular
development defines the complicated natural polydispersity of wood material in terms of
chemical properties of its constituents and is not yet fully clarified from a natural biosynthesis
perspective, nor the impact of wood processing on it (Terashima 2013; Terashima et al. 2016).
Another challenge faced is diversity of structural components in the hemicellulose-cellulose-
lignin matrix and non-structural wood extractive compounds in terms of chemical bonds
polarity. Moreover, the mono/oligo/polymers degradation and volatility within wood during
drying/heat/thermal/preservative treatment, combined with the complexity of reaction ongoing
during processing, add additional questions about the existing variability of wood material.
3.2 FUNGI AS DECOMPOSERS OF THE WOODEN MATERIAL
There is a accepted theory about the genetic coevolution of the fungal biome with the evolution
of forests horizons in the Earth (Eastwood et al. 2011). Consequently, the fungal ability to
decompose lignocellulosic biomass was driven by nutritional adaptation and the occupation of
free ecological niches (Floudas et al. 2012).
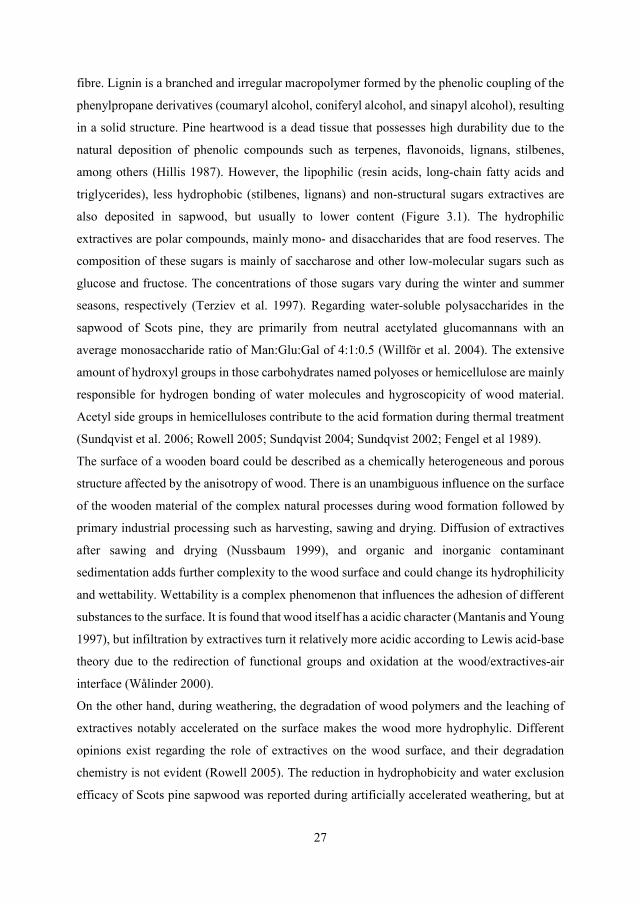
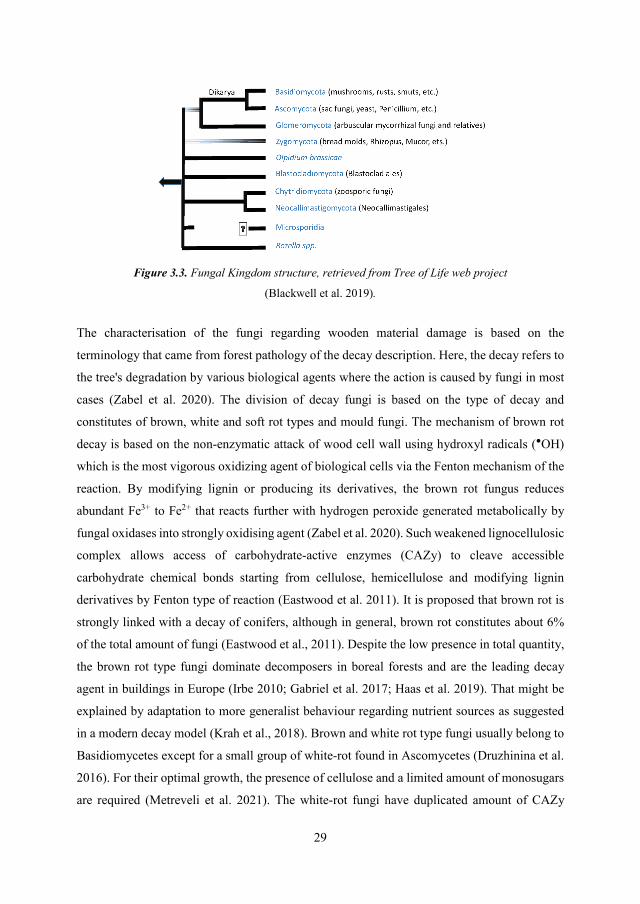
Today, the fungal kingdom is represented by 120,000 accepted fungal species, about 8% of the
estimated total fungal diversity (Hawksworth et al. 2017). However, despite such great
diversity, the harvested timber is an object of interest for fungi of three main phyla of fungi:
Basidiomycota, Ascomycota and Zygomycota, in Figure 3.3 that are saprotrophs (saprophytes)
and grow on non-living substrates (Deacon 2006).
29
Figure 3.3. Fungal Kingdom structure, retrieved from Tree of Life web project
(Blackwell et al. 2019).
The characterisation of the fungi regarding wooden material damage is based on the
terminology that came from forest pathology of the decay description. Here, the decay refers to
the tree's degradation by various biological agents where the action is caused by fungi in most
cases (Zabel et al. 2020). The division of decay fungi is based on the type of decay and
constitutes of brown, white and soft rot types and mould fungi. The mechanism of brown rot
decay is based on the non-enzymatic attack of wood cell wall using hydroxyl radicals (●OH)
which is the most vigorous oxidizing agent of biological cells via the Fenton mechanism of the
reaction. By modifying lignin or producing its derivatives, the brown rot fungus reduces
abundant Fe3+ to Fe2+ that reacts further with hydrogen peroxide generated metabolically by
fungal oxidases into strongly oxidising agent (Zabel et al. 2020). Such weakened lignocellulosic
complex allows access of carbohydrate-active enzymes (CAZy) to cleave accessible
carbohydrate chemical bonds starting from cellulose, hemicellulose and modifying lignin
derivatives by Fenton type of reaction (Eastwood et al. 2011). It is proposed that brown rot is
strongly linked with a decay of conifers, although in general, brown rot constitutes about 6%
of the total amount of fungi (Eastwood et al., 2011). Despite the low presence in total quantity,
the brown rot type fungi dominate decomposers in boreal forests and are the leading decay
agent in buildings in Europe (Irbe 2010; Gabriel et al. 2017; Haas et al. 2019). That might be
explained by adaptation to more generalist behaviour regarding nutrient sources as suggested
in a modern decay model (Krah et al., 2018). Brown and white rot type fungi usually belong to
Basidiomycetes except for a small group of white-rot found in Ascomycetes (Druzhinina et al.
2016). For their optimal growth, the presence of cellulose and a limited amount of monosugars
are required (Metreveli et al. 2021). The white-rot fungi have duplicated amount of CAZy
30
enzymes and oxidoreductases due to nutritional evolutional adaptation to angiosperms. Such
sophistication in decomposition evolved the appearance of selective lignin-degrading enzymes
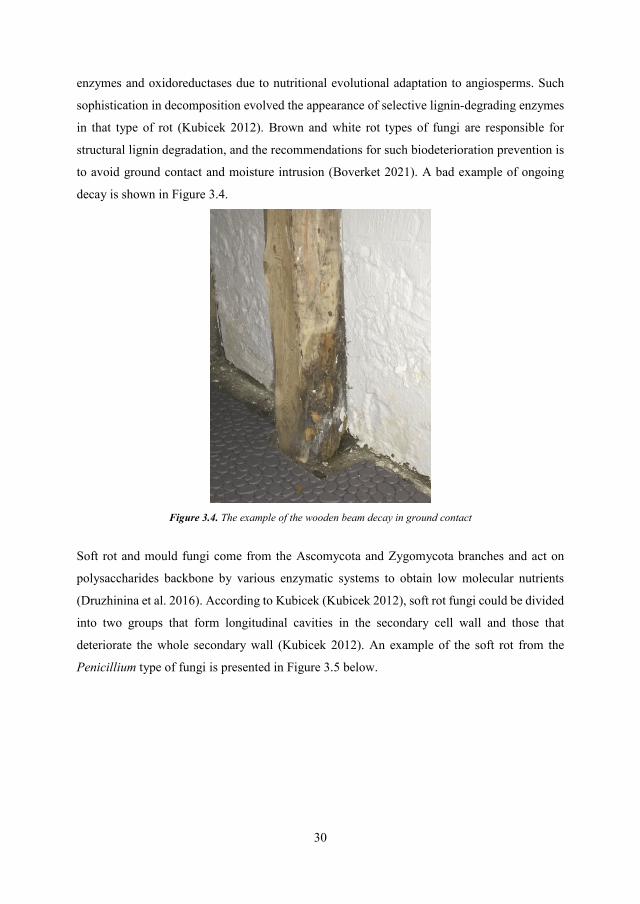
in that type of rot (Kubicek 2012). Brown and white rot types of fungi are responsible for
structural lignin degradation, and the recommendations for such biodeterioration prevention is
to avoid ground contact and moisture intrusion (Boverket 2021). A bad example of ongoing
decay is shown in Figure 3.4.
Figure 3.4. The example of the wooden beam decay in ground contact
Soft rot and mould fungi come from the Ascomycota and Zygomycota branches and act on
polysaccharides backbone by various enzymatic systems to obtain low molecular nutrients
(Druzhinina et al. 2016). According to Kubicek (Kubicek 2012), soft rot fungi could be divided
into two groups that form longitudinal cavities in the secondary cell wall and those that
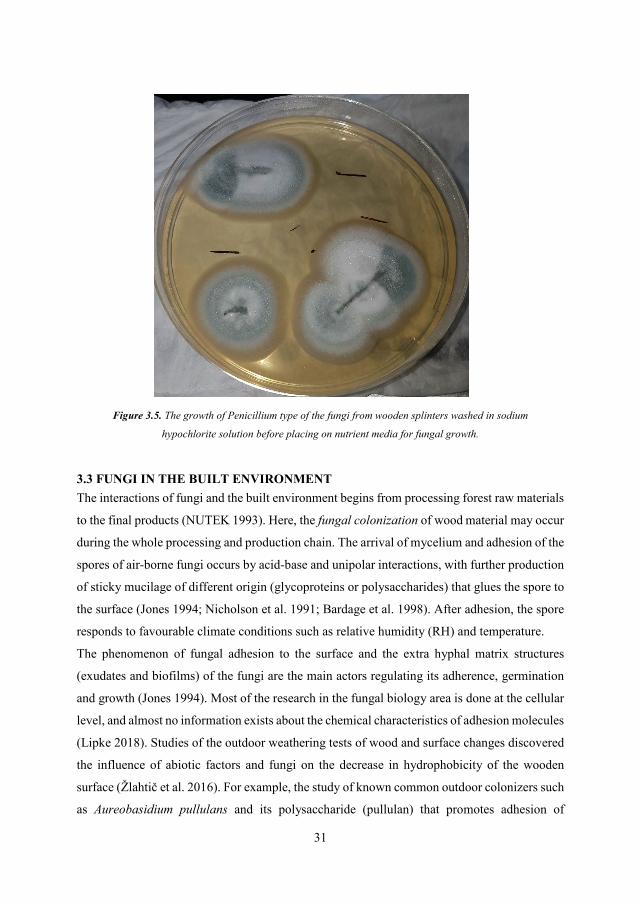
deteriorate the whole secondary wall (Kubicek 2012). An example of the soft rot from the
Penicillium type of fungi is presented in Figure 3.5 below.
31
Figure 3.5. The growth of Penicillium type of the fungi from wooden splinters washed in sodium
hypochlorite solution before placing on nutrient media for fungal growth.
3.3 FUNGI IN THE BUILT ENVIRONMENT The interactions of fungi and the built environment begins from processing forest raw materials
to the final products (NUTEK 1993). Here, the fungal colonization of wood material may occur
during the whole processing and production chain. The arrival of mycelium and adhesion of the
spores of air-borne fungi occurs by acid-base and unipolar interactions, with further production
of sticky mucilage of different origin (glycoproteins or polysaccharides) that glues the spore to
the surface (Jones 1994; Nicholson et al. 1991; Bardage et al. 1998). After adhesion, the spore
responds to favourable climate conditions such as relative humidity (RH) and temperature.
The phenomenon of fungal adhesion to the surface and the extra hyphal matrix structures
(exudates and biofilms) of the fungi are the main actors regulating its adherence, germination
and growth (Jones 1994). Most of the research in the fungal biology area is done at the cellular
level, and almost no information exists about the chemical characteristics of adhesion molecules
(Lipke 2018). Studies of the outdoor weathering tests of wood and surface changes discovered
the influence of abiotic factors and fungi on the decrease in hydrophobicity of the wooden
surface (Žlahtič et al. 2016). For example, the study of known common outdoor colonizers such
as Aureobasidium pullulans and its polysaccharide (pullulan) that promotes adhesion of
32
blastospores to water-borne paints was done by Bardage in 1998 (Bardage and Bjurman 1998),
while the control of that adhesion by uronic acid-based polymer and pullulan was discovered
(Pouliot et al. 2005).
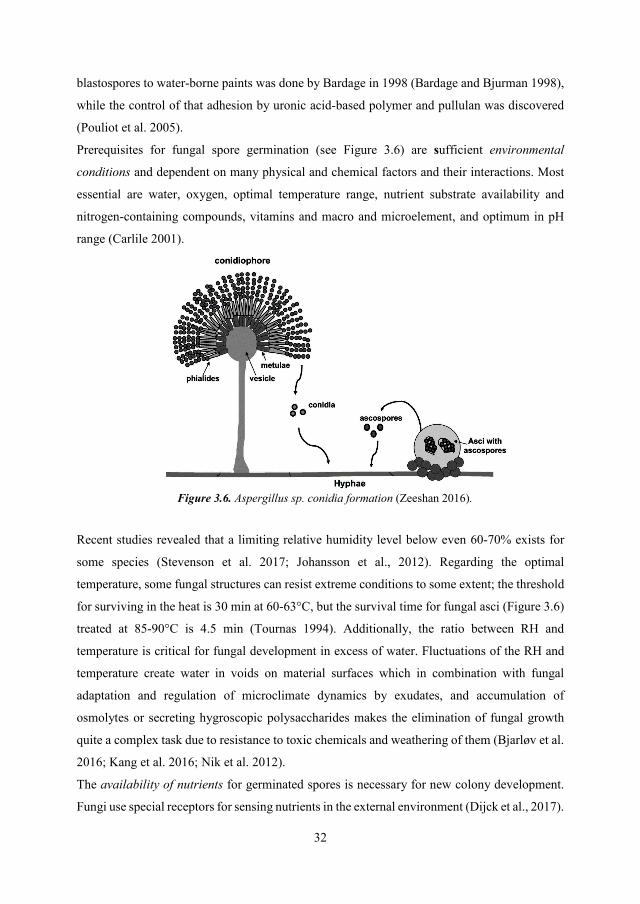
Prerequisites for fungal spore germination (see Figure 3.6) are sufficient environmental
conditions and dependent on many physical and chemical factors and their interactions. Most
essential are water, oxygen, optimal temperature range, nutrient substrate availability and
nitrogen-containing compounds, vitamins and macro and microelement, and optimum in pH
range (Carlile 2001).
Figure 3.6. Aspergillus sp. conidia formation (Zeeshan 2016).
Recent studies revealed that a limiting relative humidity level below even 60-70% exists for
some species (Stevenson et al. 2017; Johansson et al., 2012). Regarding the optimal
temperature, some fungal structures can resist extreme conditions to some extent; the threshold
for surviving in the heat is 30 min at 60-63°C, but the survival time for fungal asci (Figure 3.6)
treated at 85-90°C is 4.5 min (Tournas 1994). Additionally, the ratio between RH and
temperature is critical for fungal development in excess of water. Fluctuations of the RH and
temperature create water in voids on material surfaces which in combination with fungal
adaptation and regulation of microclimate dynamics by exudates, and accumulation of
osmolytes or secreting hygroscopic polysaccharides makes the elimination of fungal growth
quite a complex task due to resistance to toxic chemicals and weathering of them (Bjarløv et al.
2016; Kang et al. 2016; Nik et al. 2012).
The availability of nutrients for germinated spores is necessary for new colony development.
Fungi use special receptors for sensing nutrients in the external environment (Dijck et al., 2017).
33
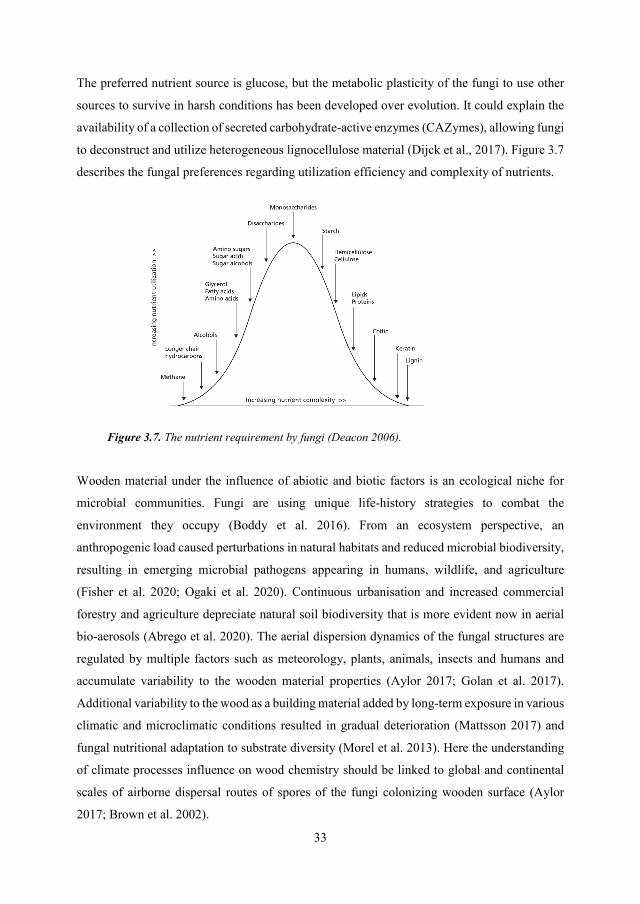
The preferred nutrient source is glucose, but the metabolic plasticity of the fungi to use other
sources to survive in harsh conditions has been developed over evolution. It could explain the
availability of a collection of secreted carbohydrate-active enzymes (CAZymes), allowing fungi
to deconstruct and utilize heterogeneous lignocellulose material (Dijck et al., 2017). Figure 3.7
describes the fungal preferences regarding utilization efficiency and complexity of nutrients.
Figure 3.7. The nutrient requirement by fungi (Deacon 2006).
Wooden material under the influence of abiotic and biotic factors is an ecological niche for
microbial communities. Fungi are using unique life-history strategies to combat the
environment they occupy (Boddy et al. 2016). From an ecosystem perspective, an
anthropogenic load caused perturbations in natural habitats and reduced microbial biodiversity,
resulting in emerging microbial pathogens appearing in humans, wildlife, and agriculture
(Fisher et al. 2020; Ogaki et al. 2020). Continuous urbanisation and increased commercial
forestry and agriculture depreciate natural soil biodiversity that is more evident now in aerial
bio-aerosols (Abrego et al. 2020). The aerial dispersion dynamics of the fungal structures are
regulated by multiple factors such as meteorology, plants, animals, insects and humans and
accumulate variability to the wooden material properties (Aylor 2017; Golan et al. 2017).
Additional variability to the wood as a building material added by long-term exposure in various
climatic and microclimatic conditions resulted in gradual deterioration (Mattsson 2017) and
fungal nutritional adaptation to substrate diversity (Morel et al. 2013). Here the understanding
of climate processes influence on wood chemistry should be linked to global and continental
scales of airborne dispersal routes of spores of the fungi colonizing wooden surface (Aylor
2017; Brown et al. 2002).
34
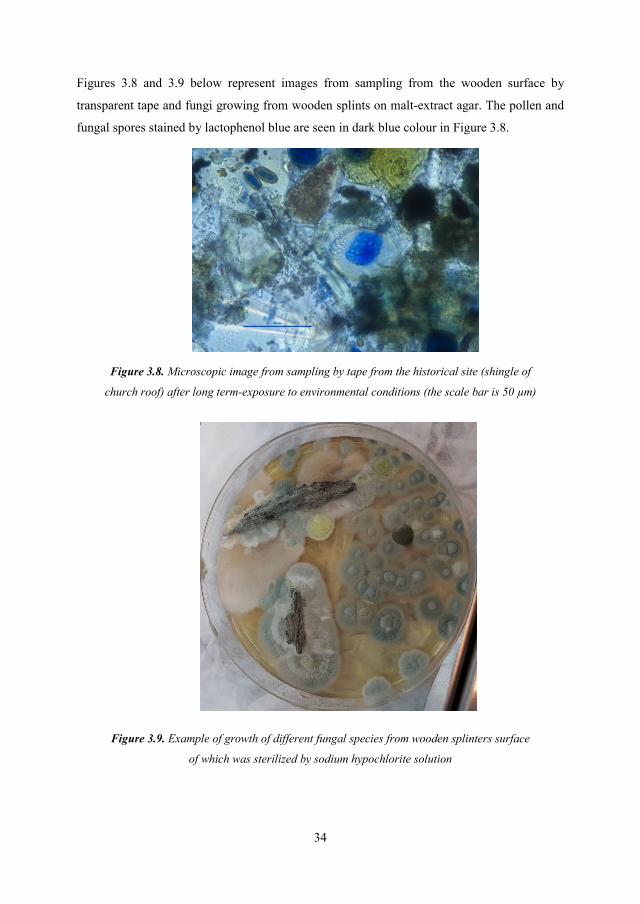
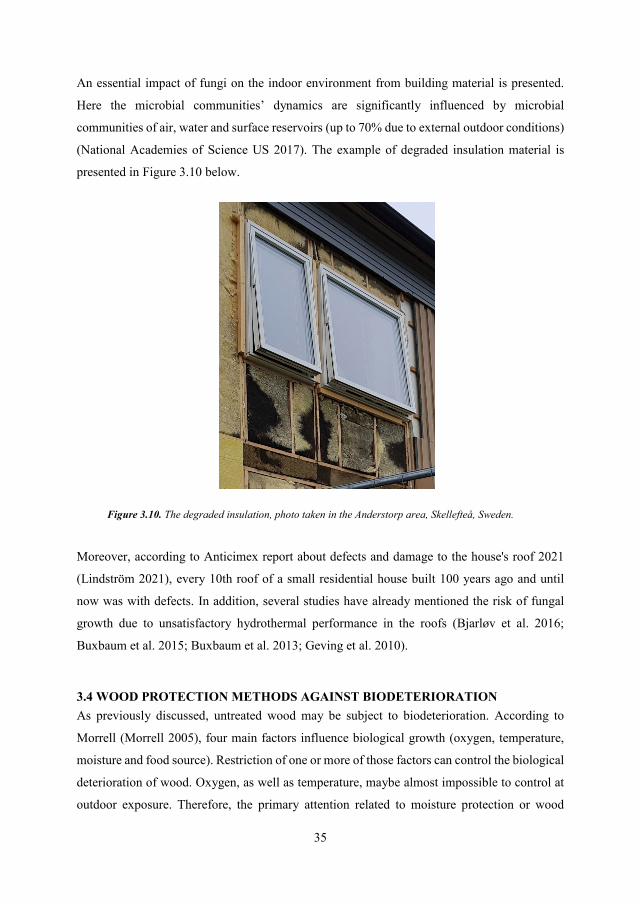
Figures 3.8 and 3.9 below represent images from sampling from the wooden surface by
transparent tape and fungi growing from wooden splints on malt-extract agar. The pollen and
fungal spores stained by lactophenol blue are seen in dark blue colour in Figure 3.8.
Figure 3.8. Microscopic image from sampling by tape from the historical site (shingle of
church roof) after long term-exposure to environmental conditions (the scale bar is 50 µm)
Figure 3.9. Example of growth of different fungal species from wooden splinters surface
of which was sterilized by sodium hypochlorite solution
35
An essential impact of fungi on the indoor environment from building material is presented.
Here the microbial communities’ dynamics are significantly influenced by microbial
communities of air, water and surface reservoirs (up to 70% due to external outdoor conditions)
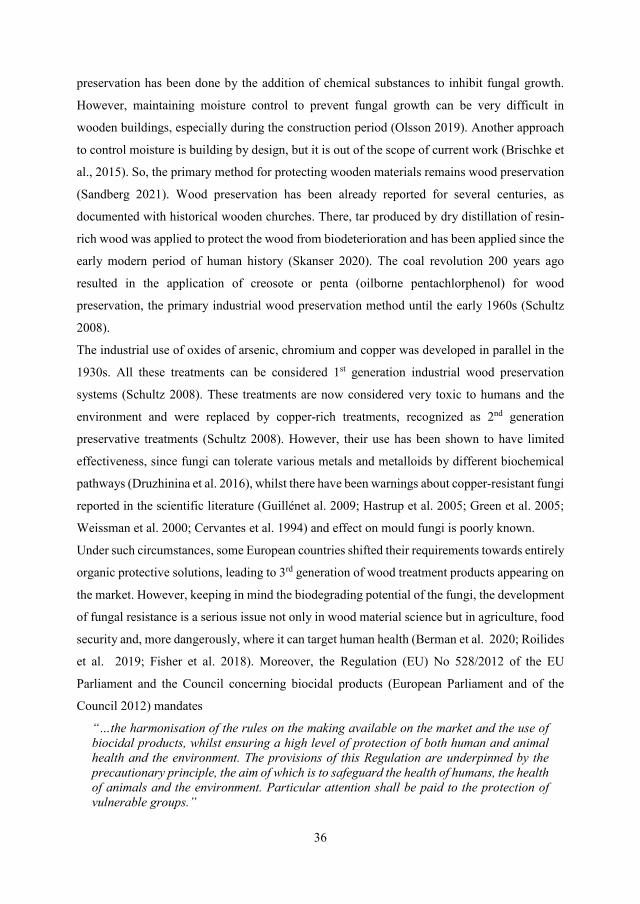
(National Academies of Science US 2017). The example of degraded insulation material is
presented in Figure 3.10 below.
Figure 3.10. The degraded insulation, photo taken in the Anderstorp area, Skellefteå, Sweden.
Moreover, according to Anticimex report about defects and damage to the house's roof 2021
(Lindström 2021), every 10th roof of a small residential house built 100 years ago and until
now was with defects. In addition, several studies have already mentioned the risk of fungal
growth due to unsatisfactory hydrothermal performance in the roofs (Bjarløv et al. 2016;
Buxbaum et al. 2015; Buxbaum et al. 2013; Geving et al. 2010).
3.4 WOOD PROTECTION METHODS AGAINST BIODETERIORATION As previously discussed, untreated wood may be subject to biodeterioration. According to
Morrell (Morrell 2005), four main factors influence biological growth (oxygen, temperature,
moisture and food source). Restriction of one or more of those factors can control the biological
deterioration of wood. Oxygen, as well as temperature, maybe almost impossible to control at
outdoor exposure. Therefore, the primary attention related to moisture protection or wood
36
preservation has been done by the addition of chemical substances to inhibit fungal growth.
However, maintaining moisture control to prevent fungal growth can be very difficult in
wooden buildings, especially during the construction period (Olsson 2019). Another approach
to control moisture is building by design, but it is out of the scope of current work (Brischke et
al., 2015). So, the primary method for protecting wooden materials remains wood preservation
(Sandberg 2021). Wood preservation has been already reported for several centuries, as
documented with historical wooden churches. There, tar produced by dry distillation of resin-
rich wood was applied to protect the wood from biodeterioration and has been applied since the
early modern period of human history (Skanser 2020). The coal revolution 200 years ago
resulted in the application of creosote or penta (oilborne pentachlorphenol) for wood
preservation, the primary industrial wood preservation method until the early 1960s (Schultz
2008).
The industrial use of oxides of arsenic, chromium and copper was developed in parallel in the
1930s. All these treatments can be considered 1st generation industrial wood preservation
systems (Schultz 2008). These treatments are now considered very toxic to humans and the
environment and were replaced by copper-rich treatments, recognized as 2nd generation
preservative treatments (Schultz 2008). However, their use has been shown to have limited
effectiveness, since fungi can tolerate various metals and metalloids by different biochemical
pathways (Druzhinina et al. 2016), whilst there have been warnings about copper-resistant fungi
reported in the scientific literature (Guillénet al. 2009; Hastrup et al. 2005; Green et al. 2005;
Weissman et al. 2000; Cervantes et al. 1994) and effect on mould fungi is poorly known.
Under such circumstances, some European countries shifted their requirements towards entirely
organic protective solutions, leading to 3rd generation of wood treatment products appearing on
the market. However, keeping in mind the biodegrading potential of the fungi, the development
of fungal resistance is a serious issue not only in wood material science but in agriculture, food
security and, more dangerously, where it can target human health (Berman et al. 2020; Roilides
et al. 2019; Fisher et al. 2018). Moreover, the Regulation (EU) No 528/2012 of the EU
Parliament and the Council concerning biocidal products (European Parliament and of the
Council 2012) mandates
“…the harmonisation of the rules on the making available on the market and the use of biocidal products, whilst ensuring a high level of protection of both human and animal health and the environment. The provisions of this Regulation are underpinned by the precautionary principle, the aim of which is to safeguard the health of humans, the health of animals and the environment. Particular attention shall be paid to the protection of vulnerable groups.”
37
As a result of concerns regarding the environmental impact of organic preservatives, there has
been an increase in considering wood modification as a 4th generation wood protection system,
aimed to improve the material properties of the wood whilst not causing environmental danger
in use or during demolition (Hill 2006; Brischke et al. 2016, Sandberg 2021). Wood
modification is a broad concept, and recently a detailed review of the current applications
published (Sandberg 2021). Briefly, there are four main types of modification, and their mode
of action based on chemical treatment, thermally-based treatment, treatment with
electromagnetic radiation and treatments based on the intelligent use of biological processes.
When knowledge about resistance of those treatment against mould fungi is limited. The
transition towards 5th generation treatments regarding the intelligent use of biological processes
occurred recently. The scientists proposed many compositions based on natural products, but
the industrial application was achieved to our current knowledge only with fungal-based wood
finishes (Nieuwenhuijzen et al. 2018) having a brand name Xyhlo (Xyhlo Biofinish 2021).
The traditional wood science understanding for wood modifications has been based on a
production of homogeneous, steady, predictable and reproducible material. However, the
scientific community has noted the failure of standard testing procedures of biodeterioration
due to poor predictability and reproducibility resulting from short-term to long-term exposure
tests (Kutnik et al. 2014). In addition, the concept of a fresh interactive approach to studying
wood through a “dynamic surface envelop”, which considers bulk and surface chemistry, is
more relevant nowadays and leads to designing modern wood modification via single
applications (Rowell 2021). The implication of this should be a data-driven approach since
there are no similar environmental conditions for construction sites. A holistic concept
considering physical, chemical and biological changes should be applied during the design of
wooden material applications to prolong service life, meet the demand for occupants health and
meet current regulations (Mattsson 2017). One possible action could be done by monitoring the
biodiversity of the fungal population; that is DNA-based survey which will enable the
possibility to identify patterns and align them with any microenvironmental influence on the
durability of wooden material against biodeterioration (Norbäck et al. 2011; Ovaskainen et al.
2020; Mueller, et al. 2004). Some cases have been reported about the resistance of wooden
material toward biodeterioration in moisture-enriched conditions (Austigard et al. 2020) and
the influence of wood-anatomical features on durability (Ligne et al. 2021). Moreover, the
fundamental aspects of fungal growth on wood should be switched from traditional single fungi
studies towards fungal colonisation patterns and multiple scale factors influencing that
38
colonisation, keeping in mind the dynamic nature of aerial bioaerosols (Šantl-Temkiv et al.
2020; Buiarelli et al. 2013; Kummer et al. 2008), which are responsible for 70% of indoor
microbial populations (Adams et al. 2013). The effect of antagonistic microbial interactions
should also be considered in parallel with inter- and intra- species interactions to find targets
for biodeterioration prevention (Fabiola Soto et al. 2018).
However, as mentioned in a review (Lipke 2018), the shortage of fundamental funding and a
dramatic shift in research towards human pathogens has moved the attention of fungal
researchers away from studies relating to the environmental processes of degradation. Such
essentials at the interface of wood and air are the adhesion of fungi to surfaces, the composition
of the extracellular matrix, community development under the different influence of abiotic
factors and nutrient availability. Are there any antifungal extractive molecules that are
available, for example, on the wood surface? Is it possible to get more precise durability at the
wood species level for a particular fungal genus, or is it possible to retain the confidence of data
stated in European Standard EN 350:2016 given that, for example, Scots pine sapwood exhibits
durability from 3 to 5 to Basidiomycetes but not to mould fungi? The durability of wood against
outdoor and indoor mould types and their metabolic activity investigation in response to
nutrient preferences in those conditions should also be concerned for potential risks and benefits
in the assessment procedures of wood material in the future.
In summary, there is no need “to re-invent the bicycle”, but look towards other industries such
as food and agriculture that deal with biological objects and environmental exposure and adopt
their best practices for the protection of wood against biodeterioration in practical uses.
Nevertheless, for a fundamental understanding, there is a need to modelling all discussed factors
and their influence on wood material properties under environmental exposure to
biodeterioration, including all influencing factors together and such an approach requires the
application of computer methods for theoretical and experimental modelling of dynamical
processes on a wooden surface and in the bulk of the material (Epstein 2008). Furthermore, it
is necessary to apply the complexity of methods and models that describe fungal growth on the
wood, as discussed below.
3.5 METHODS AND EVALUATIONS DESCRIBING FUNGAL GROWTH ON WOOD To understand the fundamental properties of fungal growth, the research community has
applied many testing methods and evaluating procedures to describe fungal growth on wood.
The task is quite challenging since a growing fungal colony on wood has a 3D structure.
39
The ergosterol content is helpful as a fungal biomarker since it is a unique sterol that maintains
cell membrane integrity (Lau et al. 2006; Mille-Lindblom et al. 2004; Hippelein et al. 2004;
Bjurman 1994; Newell et al. 1988). However, the general procedure for its determination is
quite complex and requires a sample preparation that complicates its use in an industrial
continuous testing. Another compound produced by fungi is nitrosamine (Olofsson et al. 2016),
which forms part of the structure of chitin, and is not unique just to fungi. Phospholipid fatty
acids have been used to estimate fungal biomass (Frostegård et al. 1996) but require
chromatographic separation, as with all markers mentioned above. Fluorescein diacetate has
been evaluated as a marker for fungal activity by estimating the wood's total esterase activity
(Verma et al., 2008). However, for some wood-decaying fungi, the hydrolysis of fluorescein
diacetate was not as effective as for other microbial species (Olsen et al. 1994). Molecular
biology development had led to the appearance of methods of fungal biomass quantification
aimed to determine the ratio between DNA and ergosterol content (Song et al. 2014); DNA,
chitin and mass loss (Eikenes et al. 2005); ergosterol, phospholipid fatty acid 18:2ω6.9 and
accepted fungal barcode internal transcribed spacer (ITS) (Baldrian et al. 2013). Another
method for assessing general biological contamination, including fungi, which is widely used
in hygiene control, is based on ATP measurement, but detection limits are pretty low
(Shaughnessy et al. 2013; Amodio et al. 2014; Nante et al. 2017) and requires evaluation for
use in wood regarding fungal growth.
Nevertheless, all these methods need calibration, verification, reliability and predictability.
Therefore, the main indexes for the fungal virulence estimation are still mass loss for rot fungi,
visual inspection and surface coverage for mould fungi (Boyle et al. 2011). Furthermore, those
indexes are applied when wood material should meet criteria described in standard procedures
for durability assessment and recognized by regulatory bodies.
There are only six standards related to mould growth terminology at the international level,
particularly on the International Standard Organization (ISO) web page. However, only one of
these was indirectly related to wood material ISO 13788:2012 (ISO 2012) and provided
recommendations regarding “simplified calculation methods for the internal surface
temperature of a building component or building element below which mould growth is likely,
given the internal temperature and relative humidity during installation process”. Another
international standardisation organisation ASTM International, formerly known as the
American Society for Testing and Material, applies only one standard related to mould and
unseasoned lumber, ASTM D4445-10 (ASTM International 2019). The evaluation of the
40
biodeterioration only related to the surface intensity of mould growth and visible discolouration
practices to score by using a scale from 0 to 5 where the 5 is maximum intensity. The same
pattern based on visual surface evaluation has been employed in ASTM D7855/D7855M - 13
standard to determine the intensity of mould growth on coated building products (ASTM
International 2013). That is very similar to ISO 4628-1:2016 (ISO 2016) and EU standard
harmonized in Sweden SS-EN 16492:2014 (SIS 2014).
On the European level, the main regulating document for wooden constructions is Eurocode 5:
Design of timber structures SS-EN 1995-1-1:2004 (SIS 2004), where the resistance to
biological attack is limited by “adequate durability for the particular hazard” or selected
preservative treatment. This regulates and ensures wood material quality and consumers’
assurance. Here, the main requirements for testing are described in the SS-EN 350:2016 (SIS
2016), whilst the testing procedures CEN/TS 15083-1 (CEN 2005) for Basidiomycetes was
withdrawn and CEN/TS 15083-2 (CEN 2005) for soft rotting fungi is still valid. Currently
updated, the SS EN 113:2020 is the main testing procedure for Basidiomycete rot-like fungi, in
preservative-treated wood, and is also used to evaluate thermally modified wood (SIS 2020a;
2020b). Procedures for susceptibility of wood to heavily sporulating fungi and wood
preservative efficiency includes soft rotting fungi, other inhabiting micro-organisms with main
assessment index as a mass loss and is regulated by SS-EN 807:2009 (SIS 2009). However,
that standard does not describe microbial colonization, and community development on the
wood and the decay mechanism is still unknown (Råberg et al. 2005). Finally, SS-EN 152:2011
(SIS 2011) is a standard that describes a procedure for testing the resistance of wood
preservatives against staining fungi using species from genus Aureobasidium, but not for other
micro-fungi with different physiological requirements for growth. An additional standard, SS-
EN 15457:2014 (SIS 2014), allows for assessing five fungal strains but only applies to paint
and varnish evaluations.
At the European level, the durability of wood and wood-based products in the European Union
is under the supervision of the European Committee for Standardization, and specifically the
committee CEN/TC 38. Their technical report SIS CEN/TR 16816:2016 (SIS 2017)
summarized guidance on the utilization and improvement of existing methods to estimate the
service life of wood and wood-based products.
It has been noted that current individual standards have poor applicability for modern
requirements of end-users. That was confirmed by Meyer-Veltrup, in a study of 24 different
test methods (Meyer-Veltrup et al. 2017), where differences in moisture and decay development

41
were recorded between testing methods. Therefore, scientists are still looking for efficient
evaluation methods that allow the prediction of material behaviour.
There is a need for empirical modelling based on the experimental conditions to apply to all
factors simultaneously. Since moisture and temperature areas are considered the primary
influencing parameters of decay, several studies have focused on prediction models for wood
in different environmental conditions. For example, Viitanen developed and validated a model
based on laboratory studies of timber under varied and fluctuating humidity conditions,
temperature and time, where the mould index was used for material evaluation (Viitanen et al.
2015; Viitanen 1997; Viitanen et al. 2010). The ERA-40 weather atlas for the period from 1979
to 2001 was used to model decay risk. In another approach, the Scheffer index has been used
for decay prediction (Scheffer 1971). Assessment of the actual decay is based on mass loss or
“by knife test” could be found in the EN 252 standard (SIS 2014).
Limiting moisture conditions for mould fungi growth on the wood material surface in a climate
has been used by Johansson (Johansson et al. 2012; Johansson et al. 2017; Johansson et al.
2013; Johansson 2012) where mould index about surface coverage was applied for the
evaluation. The drawback of the approaches mentioned above are the critical values for material
assessment based on the external environmental condition, but not on the intrinsic nature of the
wooden material and the availability of nutrients for fungi in those environments.
A meta-analysis done by Johansson (Johansson et al. 2017) indicated the importance of surface
structure, wood species and sawing pattern, and the variability of the wood characteristics and
how these were significant challenges for defining standardized specifications in the
susceptibility of wood to mould growth during testing. The wetting ability and durability model
during an outdoor performance of wood was developed from data obtained from laboratory
tests performed in Norway, Slovenia and Germany, and field tests performed in Norway
(Meyer-Veltrup et al. 2017). Such a coordinated activity with different geographical locations
is a way to evaluate wooden performance in different climate conditions.
Intrinsic properties such as the influence of process parameters for drying wood surface and
attempts to link it to mould growth were first pointed out in 1990 by Boutelje in studies at the
Swedish University of Agricultural Sciences in Uppsala (Boutelje 1990; Theander et al. 1993).
Following that, Terziev attributed the importance of felling time and the influence of low
molecular sugars and nitrogen migration on the intensity of mould fungi growth (Terziev et al.
1997; Terziev et al. 2007; Terziev 2009) since Scots pine has sugar-enriched sapwood, which
attracts mould fungi.
42
Attention to the influence of wood drying temperature on durability was shown in studies of
Sehlstedt-Persson (Sehlstedt-Persson et al. 2010). The study detected that an increase in the
drying temperature reduced durability to brown rot fungus. Furthermore, the total phenolic
content was lowered with drying temperature, with degradation of phenols occurring, and the
possibility for reducing decay was discussed (Sehlstedt-Persson et al. 2010). As a result,
investigations into whether different drying temperatures and board arrangements during drying
could force and have a direct influence on the migration of nutrients towards the wood surface
was undertaken. Thus, the monosaccharide and disaccharide content influence on mould growth
during outdoor testing was studied, along with the link to low molecular compound distribution
related to drying conditions. A solution to this was the planing of nutrient-rich gradients to
prevent mould growth (Sehlstedt-Persson et al., 2011).
Furthermore, tests on Norway spruce allowed a comparison with the migration pattern of Scots
pine in order to study wood species behaviour during drying (Karlsson et al., 2012).
Furthermore, the degradation of saccharides on the surface by contact heat treatment reduced
mould growth intensity, probably due to producing some toxic chemical compounds for fungi
during such short-term high-temperature treatment (Ahmed et al., 2013). All the above studies
focused on hydrophilic components such as sugars and their degradation. However, having a
holistic overview, the hydrophobic fractions or lipophilic extractives and their influence on
mould growth should be considered, and where the knowledge gap is evident.
The modern transition toward society digitalization raises demand for fast and non-destructive
solutions in the wood quality assessment, like surface sensing and determining chemical
compositions or contaminants. To achieve this, infrared (IR) and near-infrared (NIR)
spectroscopic techniques seem to be promising techniques for developing the prediction models
that can distinguish fungal deterioration on wood without applying complex destructive
measurements.
The IR technique allows detecting fundamental molecular vibration, and here sample
preparation might be required. Lecellier (Lecellier et al., 2015) successfully applied FTIR via
developing a spectral library to identify ca. 500 mycelial biomasses of single fungal strains with
relatively high precision for some strains. The presence of characteristic fundamental vibrations
and the relatively high-resolution power of IR allows the creation of individual fingerprints of
chemical compounds, with the authors noting the need for complete chemical profiling of those
strains. However, it does not truly work for ATR detection (Jelle et al. 2012). Another
spectroscopic technique, the combination of visible and near-infra red spectroscopy, has been

43
shown to be user friendly in terms of sample preparation and simplicity of application. It has
been widely tested for the evaluation of heterogeneous samples of biological origin. However,
such applications usually collect large arrays of data that should be appropriately processed and
analysed using multivariate calibration, analysis and chemometric techniques (Workman et al.
2012).
There are two ways to do that by using hyperspectral imaging technique (HSI) and
spectrometers. Hyperspectral imaging combines image and spectra analysis, but its application
in IR range is quite difficult for microbiological applications due to signal interference by water
or low microbial concentration. It is quite challenging to detect below 100 colony-forming units
per millilitre (Gowen et al., 2015). However, for the moisture content dynamics in wood, a new
approach using HSI was proposed recently using a GUI interface (Stefansson et al., 2021). The
attempt to use HSI for fungal development and individual fungi evaluation was made for the
Fusarium genus (Williams et al. 2012b; 2012a; 2012c), whereby it was possible to efficiently
measure fungal growth in pure culture in one media, at a constant temperature and by
integration of images as a sum of pixels over time, thus allowing the construction of microbial
growth curves.
A large volume of published studies describes the application of NIR spectroscopy, particularly
for wood performance evaluation. The fundamentals of NIR band assignments for wood and
wood components were summarized by Schwanninger (Schwanninger et al. 2011) and the
summary of research in wood presented by Tsuchikawa and Schwanninger (Tsuchikawa 2007;
Tsuchikawa et al. 2013). The practical solutions based on many years of research work
regarding trees, wood and derived products assessment were summarized in a tutorial by
Sandak (Sandak et al. 2016), which has led to several research groups undertaking successful
applications of NIR spectroscopy for wood modification quality evaluation. Quality evaluation
and the link to colour changes, mass loss of heat-treatment by NIR was investigated by
Todorovic (Todorović et al. 2020). Popescu (Popescu et al. 2018) separated structural changes
in modified wood in relative humidity fluctuations by using dendrograms. To measure the effect
of weathering phenomenon, it was suggested that analysis of the absorption band on
hemicellulose was a key factor for classification (Tsuchikawa et al. 2003). However, xylograms
and spectral filters developed (Sandak et al. 2016) to visualize the degradation/modification
process provided an insight into applying more unusual technique like aquaphotomics
(Tsenkova 2009) or optical characteristics (Tsuchikawa 1998) in future research and methods
were found to model water interference in spectroscopic techniques studies using NIR.
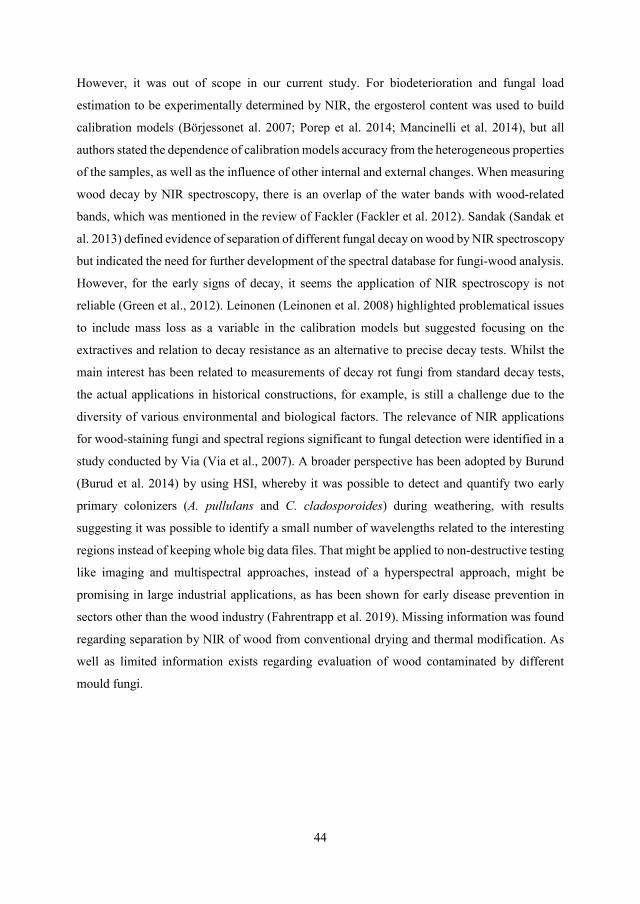
44
However, it was out of scope in our current study. For biodeterioration and fungal load
estimation to be experimentally determined by NIR, the ergosterol content was used to build
calibration models (Börjessonet al. 2007; Porep et al. 2014; Mancinelli et al. 2014), but all
authors stated the dependence of calibration models accuracy from the heterogeneous properties
of the samples, as well as the influence of other internal and external changes. When measuring
wood decay by NIR spectroscopy, there is an overlap of the water bands with wood-related
bands, which was mentioned in the review of Fackler (Fackler et al. 2012). Sandak (Sandak et
al. 2013) defined evidence of separation of different fungal decay on wood by NIR spectroscopy
but indicated the need for further development of the spectral database for fungi-wood analysis.
However, for the early signs of decay, it seems the application of NIR spectroscopy is not
reliable (Green et al., 2012). Leinonen (Leinonen et al. 2008) highlighted problematical issues
to include mass loss as a variable in the calibration models but suggested focusing on the
extractives and relation to decay resistance as an alternative to precise decay tests. Whilst the
main interest has been related to measurements of decay rot fungi from standard decay tests,
the actual applications in historical constructions, for example, is still a challenge due to the
diversity of various environmental and biological factors. The relevance of NIR applications
for wood-staining fungi and spectral regions significant to fungal detection were identified in a
study conducted by Via (Via et al., 2007). A broader perspective has been adopted by Burund
(Burud et al. 2014) by using HSI, whereby it was possible to detect and quantify two early
primary colonizers (A. pullulans and C. cladosporoides) during weathering, with results
suggesting it was possible to identify a small number of wavelengths related to the interesting
regions instead of keeping whole big data files. That might be applied to non-destructive testing
like imaging and multispectral approaches, instead of a hyperspectral approach, might be
promising in large industrial applications, as has been shown for early disease prevention in
sectors other than the wood industry (Fahrentrapp et al. 2019). Missing information was found
regarding separation by NIR of wood from conventional drying and thermal modification. As
well as limited information exists regarding evaluation of wood contaminated by different
mould fungi.
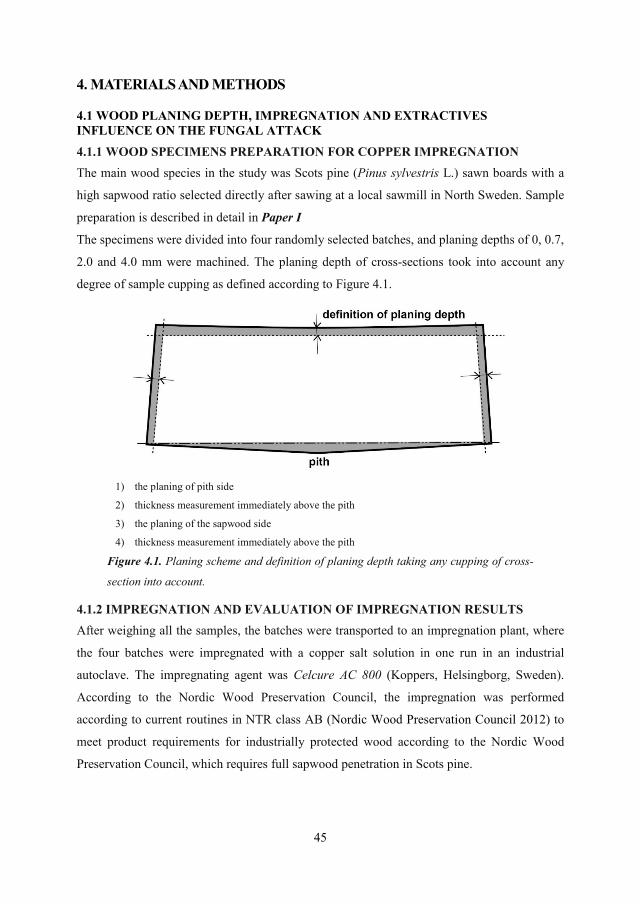
45
4. MATERIALS AND METHODS
4.1 WOOD PLANING DEPTH, IMPREGNATION AND EXTRACTIVES INFLUENCE ON THE FUNGAL ATTACK 4.1.1 WOOD SPECIMENS PREPARATION FOR COPPER IMPREGNATION The main wood species in the study was Scots pine (Pinus sylvestris L.) sawn boards with a
high sapwood ratio selected directly after sawing at a local sawmill in North Sweden. Sample
preparation is described in detail in Paper I
The specimens were divided into four randomly selected batches, and planing depths of 0, 0.7,
2.0 and 4.0 mm were machined. The planing depth of cross-sections took into account any
degree of sample cupping as defined according to Figure 4.1.
1) the planing of pith side
2) thickness measurement immediately above the pith
3) the planing of the sapwood side
4) thickness measurement immediately above the pith
Figure 4.1. Planing scheme and definition of planing depth taking any cupping of cross-
section into account.
4.1.2 IMPREGNATION AND EVALUATION OF IMPREGNATION RESULTS After weighing all the samples, the batches were transported to an impregnation plant, where
the four batches were impregnated with a copper salt solution in one run in an industrial
autoclave. The impregnating agent was Celcure AC 800 (Koppers, Helsingborg, Sweden).
According to the Nordic Wood Preservation Council, the impregnation was performed
according to current routines in NTR class AB (Nordic Wood Preservation Council 2012) to
meet product requirements for industrially protected wood according to the Nordic Wood
Preservation Council, which requires full sapwood penetration in Scots pine.

46
4.1.3 WOOD SPECIMENS PREPARATION FOR DRYING PROCEDURES EVALUATION Green sideboards from Scots pine (Pinus sylvetris L.), consisting only of sapwood, were taken
from a sawmill in Norrbotten, Sweden. The boards were divided into two groups for air-drying
and kiln-drying. For air-drying performance, boards were dried indoors on stickers at a
temperature of 20°C (RH about 10%). Kiln-drying was performed in a small-scale laboratory
kiln with air circulation according to the design in Figure 4.2. The detailed procedure is
described in Paper II.
Figure 4.2. Drying and board preparation scheme. (A) double-stacking of boards with the
sapwood side of each board facing outwards in each pair, (B) stacking of boards in the
laboratory kiln, and (C) planing depth scheme for specimens: (a) unplaned, (b) 0-0.25 mm,
(c) 0.25-0.75 mm, and (d) 0.75-1.75 mm planing depth.
4.1.4 WOOD SPECIMENS PREPARATION AFTER THERMAL MODIFICATION Two specie of exotic African wood, namely iroko (Milicia excelsa (Welw.) C.C. Berg) and padauk
(Pterocarpus soyauxii Taub.), were harvested in Gabon (Sablík et al. 2016). The dimension of
specimens was H20 x W20 x L300 mm. Moisture content before thermal treatment was 3±1%. The
thermal modification was achieved according to the Thermowood® process (International
ThermoWood Association 2003). The thermal treatment temperatures used in the study were 20,
160, 180 and 210°C. According to the procedure in Paper IV, the extractives content and chemical
analysis were performed and described shortly below.
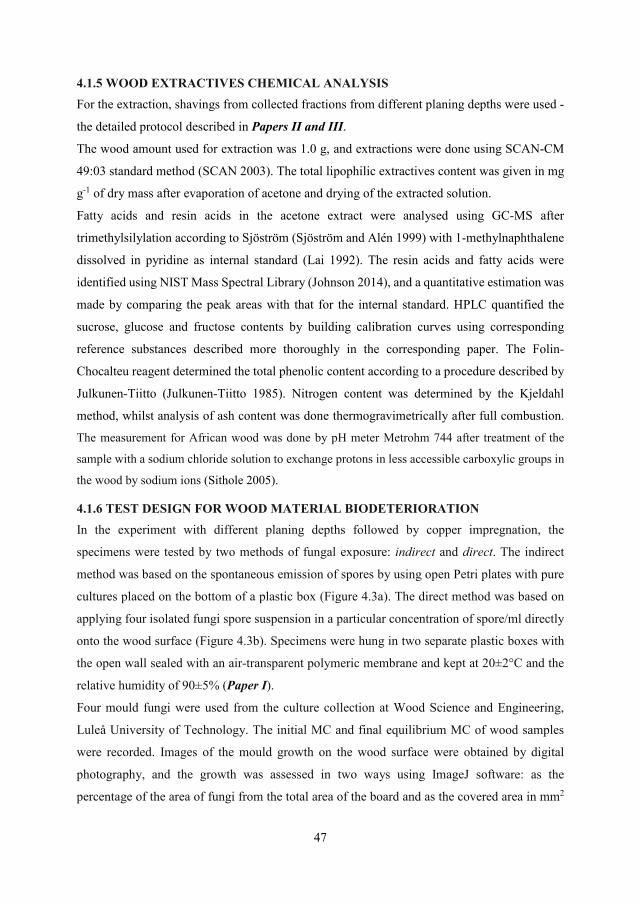
47
4.1.5 WOOD EXTRACTIVES CHEMICAL ANALYSIS For the extraction, shavings from collected fractions from different planing depths were used -
the detailed protocol described in Papers II and III.
The wood amount used for extraction was 1.0 g, and extractions were done using SCAN-CM
49:03 standard method (SCAN 2003). The total lipophilic extractives content was given in mg
g-1 of dry mass after evaporation of acetone and drying of the extracted solution.
Fatty acids and resin acids in the acetone extract were analysed using GC-MS after
trimethylsilylation according to Sjöström (Sjöström and Alén 1999) with 1-methylnaphthalene
dissolved in pyridine as internal standard (Lai 1992). The resin acids and fatty acids were
identified using NIST Mass Spectral Library (Johnson 2014), and a quantitative estimation was
made by comparing the peak areas with that for the internal standard. HPLC quantified the
sucrose, glucose and fructose contents by building calibration curves using corresponding
reference substances described more thoroughly in the corresponding paper. The Folin-
Chocalteu reagent determined the total phenolic content according to a procedure described by
Julkunen-Tiitto (Julkunen-Tiitto 1985). Nitrogen content was determined by the Kjeldahl
method, whilst analysis of ash content was done thermogravimetrically after full combustion.
The measurement for African wood was done by pH meter Metrohm 744 after treatment of the
sample with a sodium chloride solution to exchange protons in less accessible carboxylic groups in
the wood by sodium ions (Sithole 2005).
4.1.6 TEST DESIGN FOR WOOD MATERIAL BIODETERIORATION In the experiment with different planing depths followed by copper impregnation, the
specimens were tested by two methods of fungal exposure: indirect and direct. The indirect
method was based on the spontaneous emission of spores by using open Petri plates with pure
cultures placed on the bottom of a plastic box (Figure 4.3a). The direct method was based on
applying four isolated fungi spore suspension in a particular concentration of spore/ml directly
onto the wood surface (Figure 4.3b). Specimens were hung in two separate plastic boxes with
the open wall sealed with an air-transparent polymeric membrane and kept at 20±2°C and the
relative humidity of 90±5% (Paper I).
Four mould fungi were used from the culture collection at Wood Science and Engineering,
Luleå University of Technology. The initial MC and final equilibrium MC of wood samples
were recorded. Images of the mould growth on the wood surface were obtained by digital
photography, and the growth was assessed in two ways using ImageJ software: as the
percentage of the area of fungi from the total area of the board and as the covered area in mm2
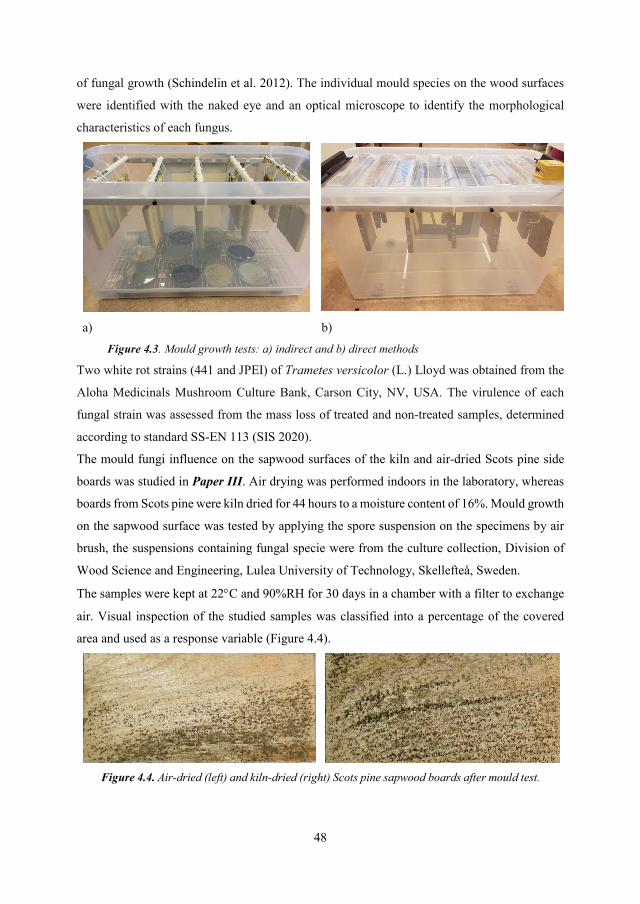
48
of fungal growth (Schindelin et al. 2012). The individual mould species on the wood surfaces
were identified with the naked eye and an optical microscope to identify the morphological
characteristics of each fungus.
a) b) Figure 4.3. Mould growth tests: a) indirect and b) direct methods
Two white rot strains (441 and JPEI) of Trametes versicolor (L.) Lloyd was obtained from the
Aloha Medicinals Mushroom Culture Bank, Carson City, NV, USA. The virulence of each
fungal strain was assessed from the mass loss of treated and non-treated samples, determined
according to standard SS-EN 113 (SIS 2020).
The mould fungi influence on the sapwood surfaces of the kiln and air-dried Scots pine side
boards was studied in Paper III. Air drying was performed indoors in the laboratory, whereas
boards from Scots pine were kiln dried for 44 hours to a moisture content of 16%. Mould growth
on the sapwood surface was tested by applying the spore suspension on the specimens by air
brush, the suspensions containing fungal specie were from the culture collection, Division of
Wood Science and Engineering, Lulea University of Technology, Skellefteå, Sweden.
The samples were kept at 22°C and 90%RH for 30 days in a chamber with a filter to exchange
air. Visual inspection of the studied samples was classified into a percentage of the covered
area and used as a response variable (Figure 4.4).
Figure 4.4. Air-dried (left) and kiln-dried (right) Scots pine sapwood boards after mould test.
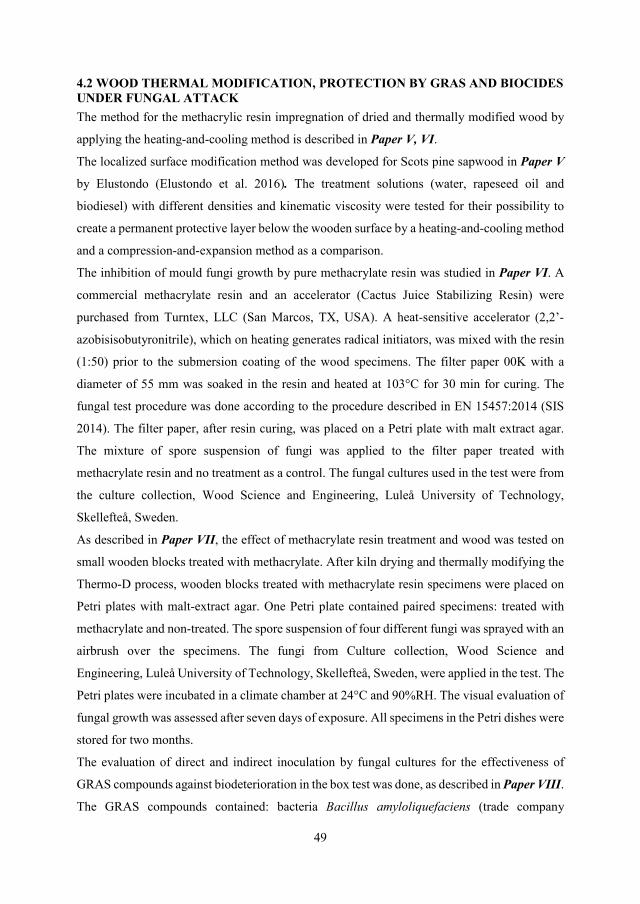
49
4.2 WOOD THERMAL MODIFICATION, PROTECTION BY GRAS AND BIOCIDES UNDER FUNGAL ATTACK The method for the methacrylic resin impregnation of dried and thermally modified wood by
applying the heating-and-cooling method is described in Paper V, VI.
The localized surface modification method was developed for Scots pine sapwood in Paper V
by Elustondo (Elustondo et al. 2016). The treatment solutions (water, rapeseed oil and
biodiesel) with different densities and kinematic viscosity were tested for their possibility to
create a permanent protective layer below the wooden surface by a heating-and-cooling method
and a compression-and-expansion method as a comparison.
The inhibition of mould fungi growth by pure methacrylate resin was studied in Paper VI. A
commercial methacrylate resin and an accelerator (Cactus Juice Stabilizing Resin) were
purchased from Turntex, LLC (San Marcos, TX, USA). A heat-sensitive accelerator (2,2’-
azobisisobutyronitrile), which on heating generates radical initiators, was mixed with the resin
(1:50) prior to the submersion coating of the wood specimens. The filter paper 00K with a
diameter of 55 mm was soaked in the resin and heated at 103°C for 30 min for curing. The
fungal test procedure was done according to the procedure described in EN 15457:2014 (SIS
2014). The filter paper, after resin curing, was placed on a Petri plate with malt extract agar.
The mixture of spore suspension of fungi was applied to the filter paper treated with
methacrylate resin and no treatment as a control. The fungal cultures used in the test were from
the culture collection, Wood Science and Engineering, Luleå University of Technology,
Skellefteå, Sweden.
As described in Paper VII, the effect of methacrylate resin treatment and wood was tested on
small wooden blocks treated with methacrylate. After kiln drying and thermally modifying the
Thermo-D process, wooden blocks treated with methacrylate resin specimens were placed on
Petri plates with malt-extract agar. One Petri plate contained paired specimens: treated with
methacrylate and non-treated. The spore suspension of four different fungi was sprayed with an
airbrush over the specimens. The fungi from Culture collection, Wood Science and
Engineering, Luleå University of Technology, Skellefteå, Sweden, were applied in the test. The
Petri plates were incubated in a climate chamber at 24°C and 90%RH. The visual evaluation of
fungal growth was assessed after seven days of exposure. All specimens in the Petri dishes were
stored for two months.
The evaluation of direct and indirect inoculation by fungal cultures for the effectiveness of
GRAS compounds against biodeterioration in the box test was done, as described in Paper VIII.
The GRAS compounds contained: bacteria Bacillus amyloliquefaciens (trade company
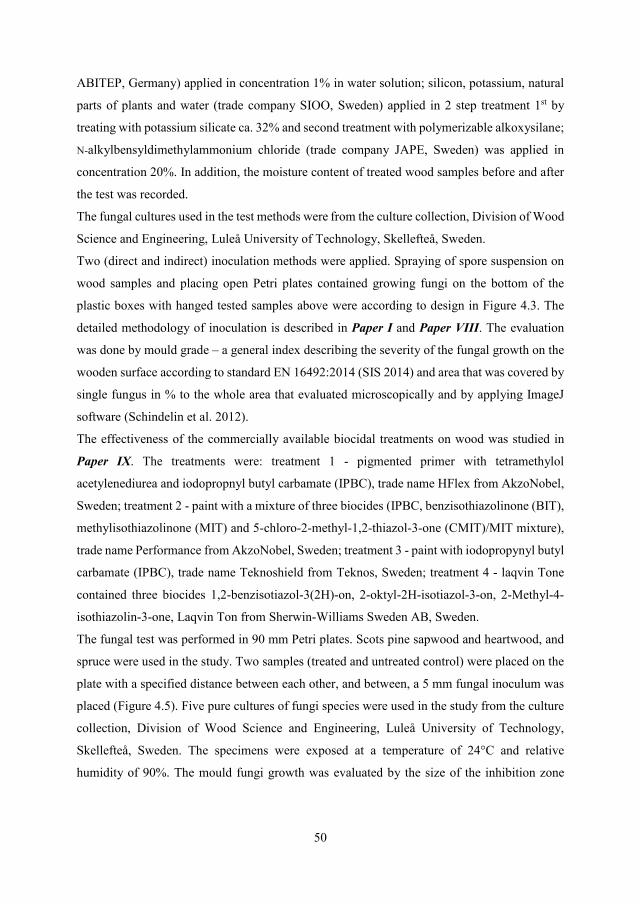
50
ABITEP, Germany) applied in concentration 1% in water solution; silicon, potassium, natural
parts of plants and water (trade company SIOO, Sweden) applied in 2 step treatment 1st by
treating with potassium silicate ca. 32% and second treatment with polymerizable alkoxysilane;
N-alkylbensyldimethylammonium chloride (trade company JAPE, Sweden) was applied in
concentration 20%. In addition, the moisture content of treated wood samples before and after
the test was recorded.
The fungal cultures used in the test methods were from the culture collection, Division of Wood
Science and Engineering, Luleå University of Technology, Skellefteå, Sweden.
Two (direct and indirect) inoculation methods were applied. Spraying of spore suspension on
wood samples and placing open Petri plates contained growing fungi on the bottom of the
plastic boxes with hanged tested samples above were according to design in Figure 4.3. The
detailed methodology of inoculation is described in Paper I and Paper VIII. The evaluation
was done by mould grade – a general index describing the severity of the fungal growth on the
wooden surface according to standard EN 16492:2014 (SIS 2014) and area that was covered by
single fungus in % to the whole area that evaluated microscopically and by applying ImageJ
software (Schindelin et al. 2012).
The effectiveness of the commercially available biocidal treatments on wood was studied in
Paper IX. The treatments were: treatment 1 - pigmented primer with tetramethylol
acetylenediurea and iodopropnyl butyl carbamate (IPBC), trade name HFlex from AkzoNobel,
Sweden; treatment 2 - paint with a mixture of three biocides (IPBC, benzisothiazolinone (BIT),
methylisothiazolinone (MIT) and 5-chloro-2-methyl-1,2-thiazol-3-one (CMIT)/MIT mixture),
trade name Performance from AkzoNobel, Sweden; treatment 3 - paint with iodopropynyl butyl
carbamate (IPBC), trade name Teknoshield from Teknos, Sweden; treatment 4 - laqvin Tone
contained three biocides 1,2-benzisotiazol-3(2H)-on, 2-oktyl-2H-isotiazol-3-on, 2-Methyl-4-
isothiazolin-3-one, Laqvin Ton from Sherwin-Williams Sweden AB, Sweden.
The fungal test was performed in 90 mm Petri plates. Scots pine sapwood and heartwood, and
spruce were used in the study. Two samples (treated and untreated control) were placed on the
plate with a specified distance between each other, and between, a 5 mm fungal inoculum was
placed (Figure 4.5). Five pure cultures of fungi species were used in the study from the culture
collection, Division of Wood Science and Engineering, Luleå University of Technology,
Skellefteå, Sweden. The specimens were exposed at a temperature of 24°C and relative
humidity of 90%. The mould fungi growth was evaluated by the size of the inhibition zone
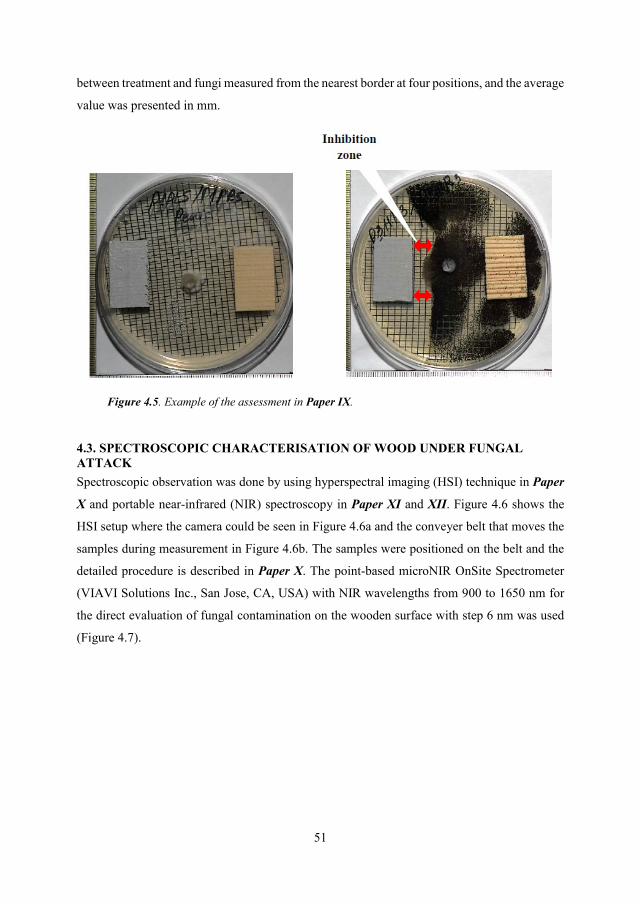
51
between treatment and fungi measured from the nearest border at four positions, and the average
value was presented in mm.
Figure 4.5. Example of the assessment in Paper IX.
4.3. SPECTROSCOPIC CHARACTERISATION OF WOOD UNDER FUNGAL ATTACK Spectroscopic observation was done by using hyperspectral imaging (HSI) technique in Paper
X and portable near-infrared (NIR) spectroscopy in Paper XI and XII. Figure 4.6 shows the
HSI setup where the camera could be seen in Figure 4.6a and the conveyer belt that moves the
samples during measurement in Figure 4.6b. The samples were positioned on the belt and the
detailed procedure is described in Paper X. The point-based microNIR OnSite Spectrometer
(VIAVI Solutions Inc., San Jose, CA, USA) with NIR wavelengths from 900 to 1650 nm for
the direct evaluation of fungal contamination on the wooden surface with step 6 nm was used
(Figure 4.7).
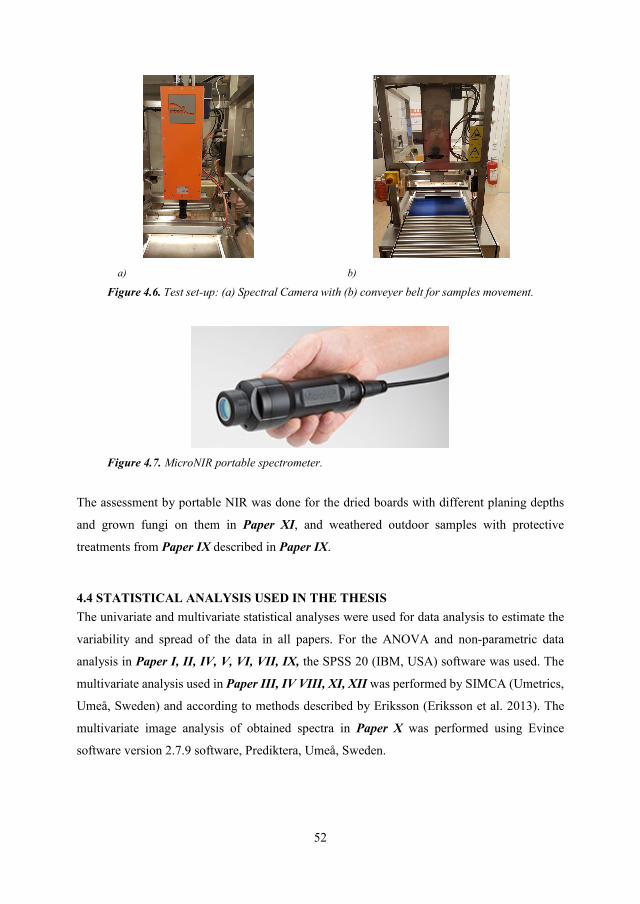
52
a) b)
Figure 4.6. Test set-up: (a) Spectral Camera with (b) conveyer belt for samples movement.
Figure 4.7. MicroNIR portable spectrometer.
The assessment by portable NIR was done for the dried boards with different planing depths
and grown fungi on them in Paper XI, and weathered outdoor samples with protective
treatments from Paper IX described in Paper IX.
4.4 STATISTICAL ANALYSIS USED IN THE THESIS The univariate and multivariate statistical analyses were used for data analysis to estimate the
variability and spread of the data in all papers. For the ANOVA and non-parametric data
analysis in Paper I, II, IV, V, VI, VII, IX, the SPSS 20 (IBM, USA) software was used. The
multivariate analysis used in Paper III, IV VIII, XI, XII was performed by SIMCA (Umetrics,
Umeå, Sweden) and according to methods described by Eriksson (Eriksson et al. 2013). The
multivariate image analysis of obtained spectra in Paper X was performed using Evince
software version 2.7.9 software, Prediktera, Umeå, Sweden.
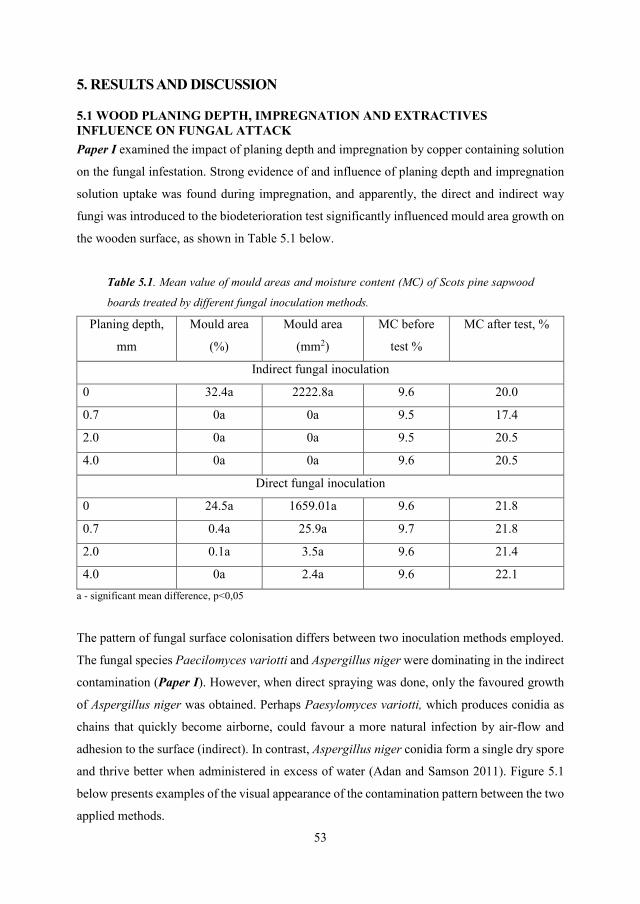
53
5. RESULTS AND DISCUSSION
5.1 WOOD PLANING DEPTH, IMPREGNATION AND EXTRACTIVES INFLUENCE ON FUNGAL ATTACK Paper I examined the impact of planing depth and impregnation by copper containing solution
on the fungal infestation. Strong evidence of and influence of planing depth and impregnation
solution uptake was found during impregnation, and apparently, the direct and indirect way
fungi was introduced to the biodeterioration test significantly influenced mould area growth on
the wooden surface, as shown in Table 5.1 below.
Table 5.1. Mean value of mould areas and moisture content (MC) of Scots pine sapwood
boards treated by different fungal inoculation methods.
Planing depth,
mm
Mould area
(%)
Mould area
(mm2)
MC before
test %
MC after test, %
Indirect fungal inoculation
0 32.4a 2222.8a 9.6 20.0
0.7 0a 0a 9.5 17.4
2.0 0a 0a 9.5 20.5
4.0 0a 0a 9.6 20.5
Direct fungal inoculation
0 24.5a 1659.01a 9.6 21.8
0.7 0.4a 25.9a 9.7 21.8
2.0 0.1a 3.5a 9.6 21.4
4.0 0a 2.4a 9.6 22.1 a - significant mean difference, p˂0,05
The pattern of fungal surface colonisation differs between two inoculation methods employed.
The fungal species Paecilomyces variotti and Aspergillus niger were dominating in the indirect
contamination (Paper I). However, when direct spraying was done, only the favoured growth
of Aspergillus niger was obtained. Perhaps Paesylomyces variotti, which produces conidia as
chains that quickly become airborne, could favour a more natural infection by air-flow and
adhesion to the surface (indirect). In contrast, Aspergillus niger conidia form a single dry spore
and thrive better when administered in excess of water (Adan and Samson 2011). Figure 5.1
below presents examples of the visual appearance of the contamination pattern between the two
applied methods.
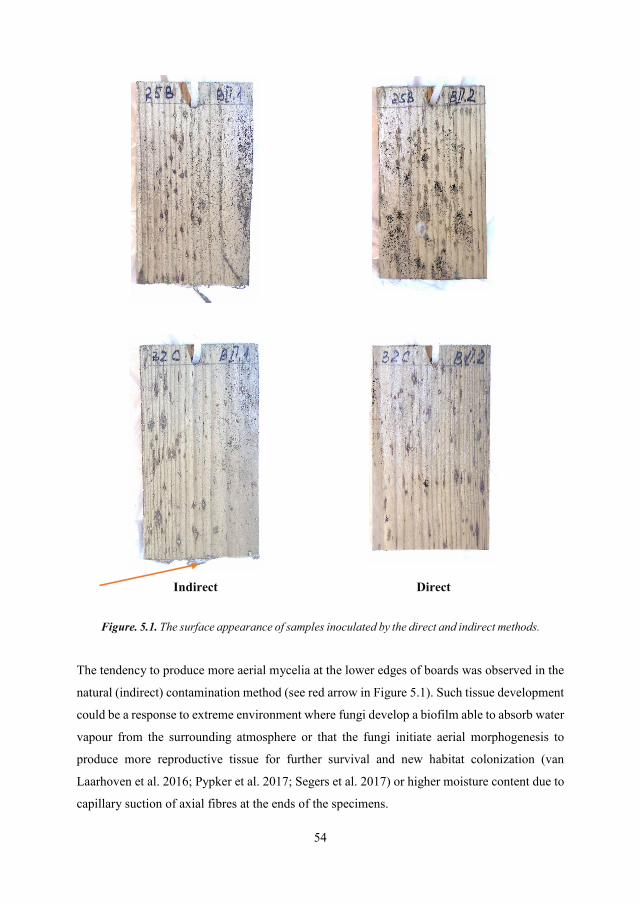
54
Indirect Direct
Figure. 5.1. The surface appearance of samples inoculated by the direct and indirect methods.
The tendency to produce more aerial mycelia at the lower edges of boards was observed in the
natural (indirect) contamination method (see red arrow in Figure 5.1). Such tissue development
could be a response to extreme environment where fungi develop a biofilm able to absorb water
vapour from the surrounding atmosphere or that the fungi initiate aerial morphogenesis to
produce more reproductive tissue for further survival and new habitat colonization (van
Laarhoven et al. 2016; Pypker et al. 2017; Segers et al. 2017) or higher moisture content due to
capillary suction of axial fibres at the ends of the specimens.
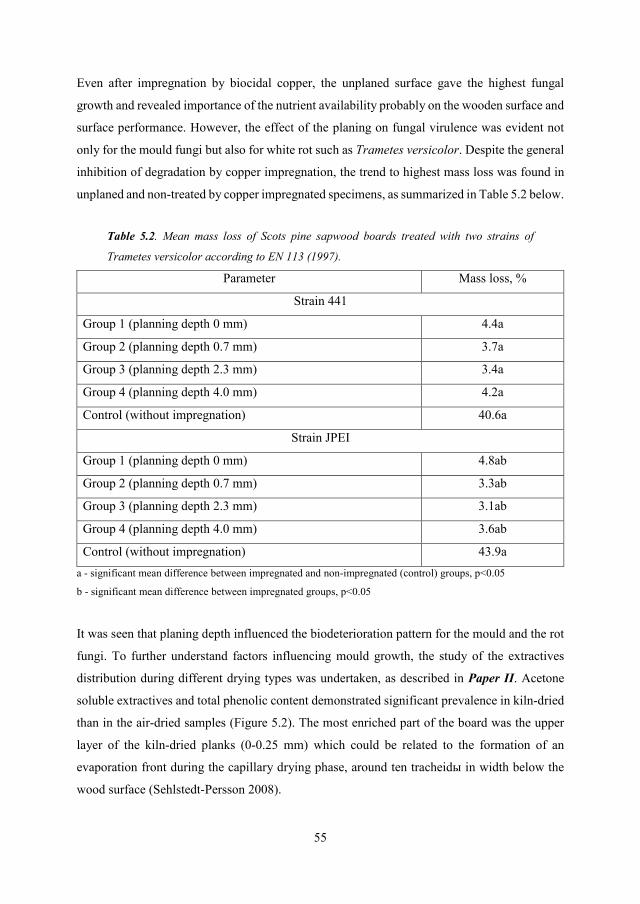
55
Even after impregnation by biocidal copper, the unplaned surface gave the highest fungal
growth and revealed importance of the nutrient availability probably on the wooden surface and
surface performance. However, the effect of the planing on fungal virulence was evident not
only for the mould fungi but also for white rot such as Trametes versicolor. Despite the general
inhibition of degradation by copper impregnation, the trend to highest mass loss was found in
unplaned and non-treated by copper impregnated specimens, as summarized in Table 5.2 below.
Table 5.2. Mean mass loss of Scots pine sapwood boards treated with two strains of
Trametes versicolor according to EN 113 (1997).
Parameter Mass loss, %
Strain 441
Group 1 (planning depth 0 mm) 4.4a
Group 2 (planning depth 0.7 mm) 3.7a
Group 3 (planning depth 2.3 mm) 3.4a
Group 4 (planning depth 4.0 mm) 4.2a
Control (without impregnation) 40.6a
Strain JPEI
Group 1 (planning depth 0 mm) 4.8ab
Group 2 (planning depth 0.7 mm) 3.3ab
Group 3 (planning depth 2.3 mm) 3.1ab
Group 4 (planning depth 4.0 mm) 3.6ab
Control (without impregnation) 43.9a a - significant mean difference between impregnated and non-impregnated (control) groups, p˂0.05
b - significant mean difference between impregnated groups, p˂0.05
It was seen that planing depth influenced the biodeterioration pattern for the mould and the rot
fungi. To further understand factors influencing mould growth, the study of the extractives
distribution during different drying types was undertaken, as described in Paper II. Acetone
soluble extractives and total phenolic content demonstrated significant prevalence in kiln-dried
than in the air-dried samples (Figure 5.2). The most enriched part of the board was the upper
layer of the kiln-dried planks (0-0.25 mm) which could be related to the formation of an
evaporation front during the capillary drying phase, around ten tracheidы in width below the
wood surface (Sehlstedt-Persson 2008).
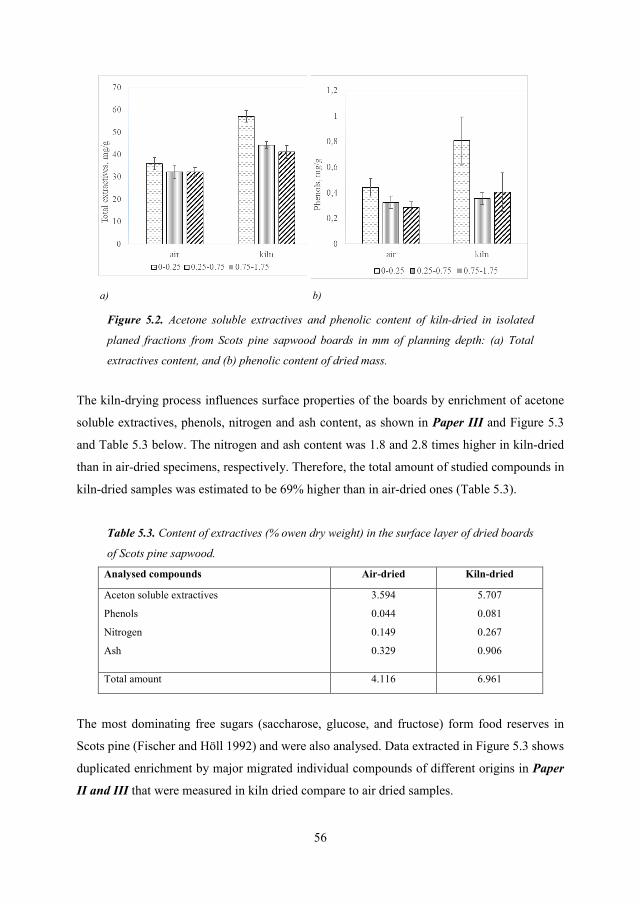
56
a) b)
Figure 5.2. Acetone soluble extractives and phenolic content of kiln-dried in isolated
planed fractions from Scots pine sapwood boards in mm of planning depth: (a) Total
extractives content, and (b) phenolic content of dried mass.
The kiln-drying process influences surface properties of the boards by enrichment of acetone
soluble extractives, phenols, nitrogen and ash content, as shown in Paper III and Figure 5.3
and Table 5.3 below. The nitrogen and ash content was 1.8 and 2.8 times higher in kiln-dried
than in air-dried specimens, respectively. Therefore, the total amount of studied compounds in
kiln-dried samples was estimated to be 69% higher than in air-dried ones (Table 5.3).
Table 5.3. Content of extractives (% owen dry weight) in the surface layer of dried boards
of Scots pine sapwood.
Analysed compounds Air-dried Kiln-dried
Aceton soluble extractives
Phenols
Nitrogen
Ash
3.594
0.044
0.149
0.329
5.707
0.081
0.267
0.906
Total amount 4.116 6.961
The most dominating free sugars (saccharose, glucose, and fructose) form food reserves in
Scots pine (Fischer and Höll 1992) and were also analysed. Data extracted in Figure 5.3 shows
duplicated enrichment by major migrated individual compounds of different origins in Paper
II and III that were measured in kiln dried compare to air dried samples.
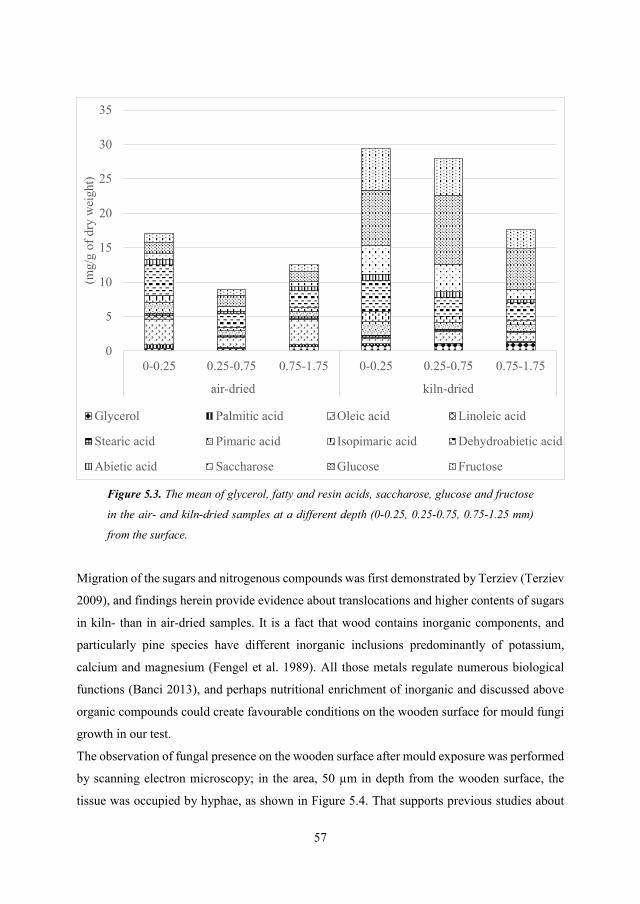
57
Figure 5.3. The mean of glycerol, fatty and resin acids, saccharose, glucose and fructose
in the air- and kiln-dried samples at a different depth (0-0.25, 0.25-0.75, 0.75-1.25 mm)
from the surface.
Migration of the sugars and nitrogenous compounds was first demonstrated by Terziev (Terziev
2009), and findings herein provide evidence about translocations and higher contents of sugars
in kiln- than in air-dried samples. It is a fact that wood contains inorganic components, and
particularly pine species have different inorganic inclusions predominantly of potassium,
calcium and magnesium (Fengel et al. 1989). All those metals regulate numerous biological
functions (Banci 2013), and perhaps nutritional enrichment of inorganic and discussed above
organic compounds could create favourable conditions on the wooden surface for mould fungi
growth in our test.
The observation of fungal presence on the wooden surface after mould exposure was performed
by scanning electron microscopy; in the area, 50 µm in depth from the wooden surface, the
tissue was occupied by hyphae, as shown in Figure 5.4. That supports previous studies about
0
5
10
15
20
25
30
35
0-0.25 0.25-0.75 0.75-1.75 0-0.25 0.25-0.75 0.75-1.75
air-dried kiln-dried
(mg/
g of
dry
wei
ght)
Glycerol Palmitic acid Oleic acid Linoleic acid
Stearic acid Pimaric acid Isopimaric acid Dehydroabietic acid
Abietic acid Saccharose Glucose Fructose
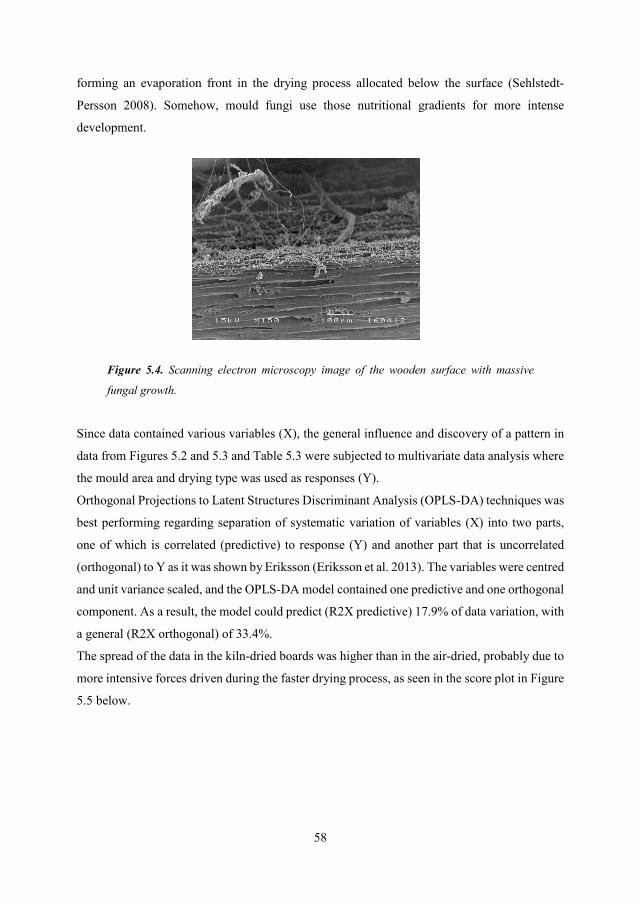
58
forming an evaporation front in the drying process allocated below the surface (Sehlstedt-
Persson 2008). Somehow, mould fungi use those nutritional gradients for more intense
development.
Figure 5.4. Scanning electron microscopy image of the wooden surface with massive
fungal growth.
Since data contained various variables (X), the general influence and discovery of a pattern in
data from Figures 5.2 and 5.3 and Table 5.3 were subjected to multivariate data analysis where
the mould area and drying type was used as responses (Y).
Orthogonal Projections to Latent Structures Discriminant Analysis (OPLS-DA) techniques was
best performing regarding separation of systematic variation of variables (X) into two parts,
one of which is correlated (predictive) to response (Y) and another part that is uncorrelated
(orthogonal) to Y as it was shown by Eriksson (Eriksson et al. 2013). The variables were centred
and unit variance scaled, and the OPLS-DA model contained one predictive and one orthogonal
component. As a result, the model could predict (R2X predictive) 17.9% of data variation, with
a general (R2X orthogonal) of 33.4%.
The spread of the data in the kiln-dried boards was higher than in the air-dried, probably due to
more intensive forces driven during the faster drying process, as seen in the score plot in Figure
5.5 below.
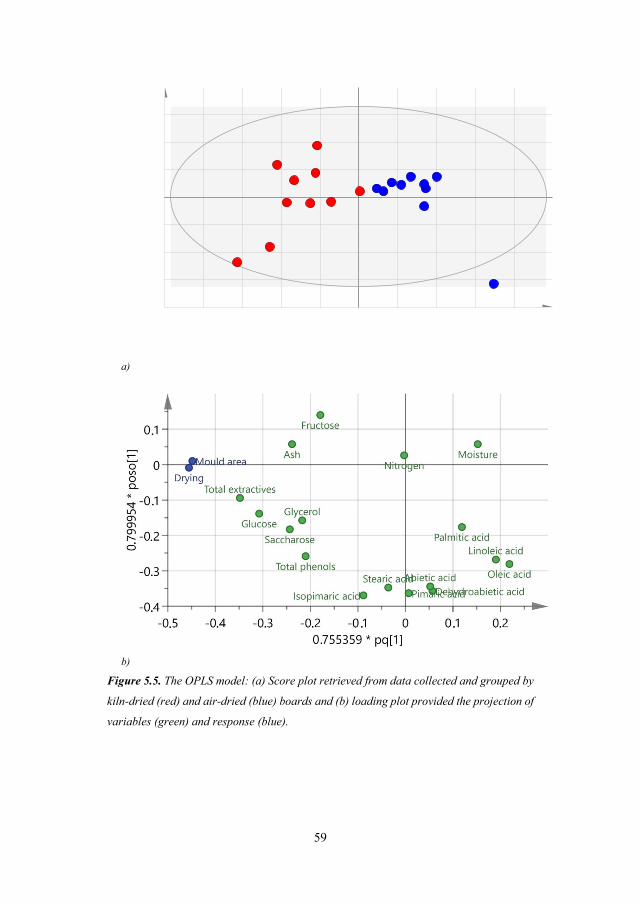
59
a)
b)
Figure 5.5. The OPLS model: (a) Score plot retrieved from data collected and grouped by
kiln-dried (red) and air-dried (blue) boards and (b) loading plot provided the projection of
variables (green) and response (blue).

60
The VIP variable total extractives, glucose and total phenols content contributed to the model
mostly (Figure 5.6). The remaining VIP variables had a high standard deviation at 95% of a
confidence interval, as shown in Figure 5.6.
Figure 5.6. VIP plot of the OPLS model.
During more harsh thermal treatments like the Thermo-D processing of softwoods, more severe
changes in extractives content and composition occur, such as removing volatile terpenes and
forming new compounds such as aldehydes, acids and phenols (Alén et al. 2002; Windeisen et
al. 2007; Karlsson et al. 2012; Karlsson et al. 2014), which may hamper mould growth. For the
evaluation of extractives and the remaining amount after thermal modification, two species of
exotic African wood were chosen for evaluation, namely and iroko respectively, since they are
already naturally quite rich in antioxidant compounds that are capable of hindering radical
formation during thermal modification (Hill et al. 2021). The total extractives and phenols in
untreated wood in studied samples corresponded to previously studied data (Saha et al., 2013;
Nagawa et al., 2015). The increase in temperature during thermal modification significantly
changed the total extractive content, as shown in Table 5.4 below. With the highest treatment
temperature (210°C), the wood contained the smallest amount of extractives and soluble
phenols. For padauk, a linear decrease of phenols with treatment temperature and time was
strongly evident. For hardwood species like birch, a significantly lower pH has been found in
thermally modified than in untreated wood (Dagbro et al., 2011). In the case of iroko, pH was
slightly higher as for birch, but the thermal treatment of iroko did not reduce the pH.
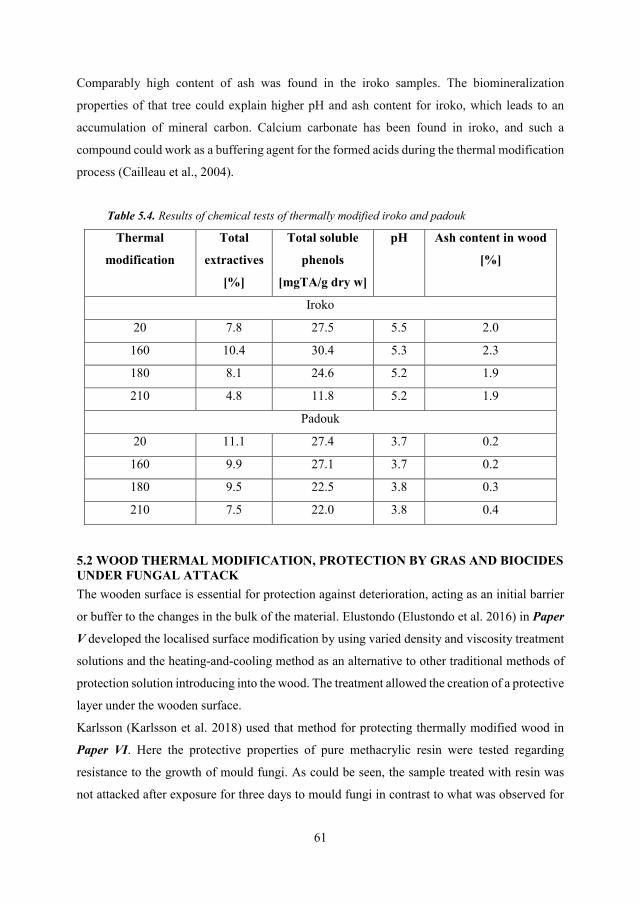
61
Comparably high content of ash was found in the iroko samples. The biomineralization
properties of that tree could explain higher pH and ash content for iroko, which leads to an
accumulation of mineral carbon. Calcium carbonate has been found in iroko, and such a
compound could work as a buffering agent for the formed acids during the thermal modification
process (Cailleau et al., 2004).
Table 5.4. Results of chemical tests of thermally modified iroko and padouk
Thermal
modification Total
extractives
[%]
Total soluble
phenols
[mgTA/g dry w]
pH Ash content in wood
[%]
Iroko
20 7.8 27.5 5.5 2.0
160 10.4 30.4 5.3 2.3
180 8.1 24.6 5.2 1.9
210 4.8 11.8 5.2 1.9
Padouk
20 11.1 27.4 3.7 0.2
160 9.9 27.1 3.7 0.2
180 9.5 22.5 3.8 0.3
210 7.5 22.0 3.8 0.4
5.2 WOOD THERMAL MODIFICATION, PROTECTION BY GRAS AND BIOCIDES UNDER FUNGAL ATTACK The wooden surface is essential for protection against deterioration, acting as an initial barrier
or buffer to the changes in the bulk of the material. Elustondo (Elustondo et al. 2016) in Paper
V developed the localised surface modification by using varied density and viscosity treatment
solutions and the heating-and-cooling method as an alternative to other traditional methods of
protection solution introducing into the wood. The treatment allowed the creation of a protective
layer under the wooden surface.
Karlsson (Karlsson et al. 2018) used that method for protecting thermally modified wood in
Paper VI. Here the protective properties of pure methacrylic resin were tested regarding
resistance to the growth of mould fungi. As could be seen, the sample treated with resin was
not attacked after exposure for three days to mould fungi in contrast to what was observed for
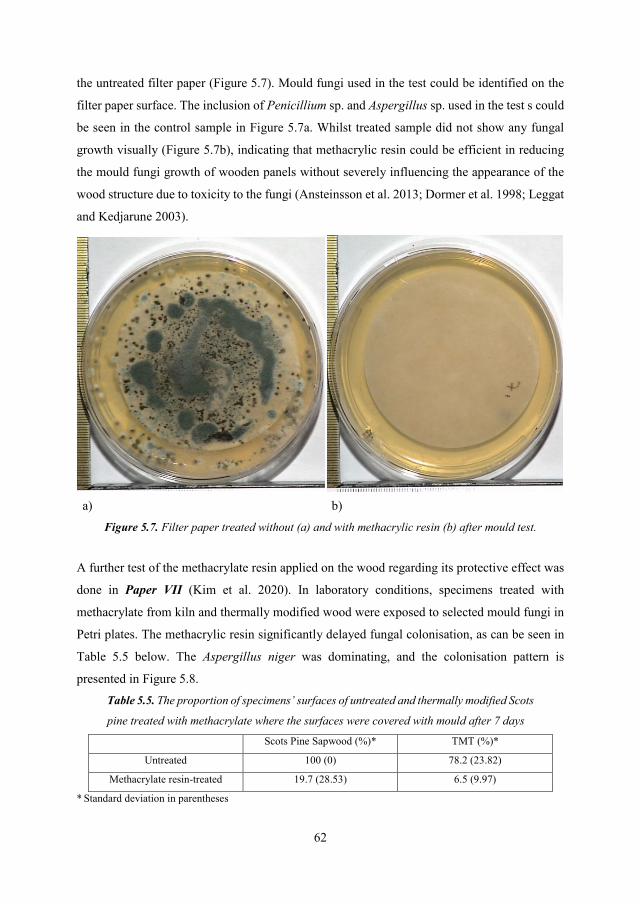
62
the untreated filter paper (Figure 5.7). Mould fungi used in the test could be identified on the
filter paper surface. The inclusion of Penicillium sp. and Aspergillus sp. used in the test s could
be seen in the control sample in Figure 5.7a. Whilst treated sample did not show any fungal
growth visually (Figure 5.7b), indicating that methacrylic resin could be efficient in reducing
the mould fungi growth of wooden panels without severely influencing the appearance of the
wood structure due to toxicity to the fungi (Ansteinsson et al. 2013; Dormer et al. 1998; Leggat
and Kedjarune 2003).
a) b) Figure 5.7. Filter paper treated without (a) and with methacrylic resin (b) after mould test.
A further test of the methacrylate resin applied on the wood regarding its protective effect was
done in Paper VII (Kim et al. 2020). In laboratory conditions, specimens treated with
methacrylate from kiln and thermally modified wood were exposed to selected mould fungi in
Petri plates. The methacrylic resin significantly delayed fungal colonisation, as can be seen in
Table 5.5 below. The Aspergillus niger was dominating, and the colonisation pattern is
presented in Figure 5.8. Table 5.5. The proportion of specimens’ surfaces of untreated and thermally modified Scots
pine treated with methacrylate where the surfaces were covered with mould after 7 days
Scots Pine Sapwood (%)* TMT (%)*
Untreated 100 (0) 78.2 (23.82)
Methacrylate resin-treated 19.7 (28.53) 6.5 (9.97)
* Standard deviation in parentheses
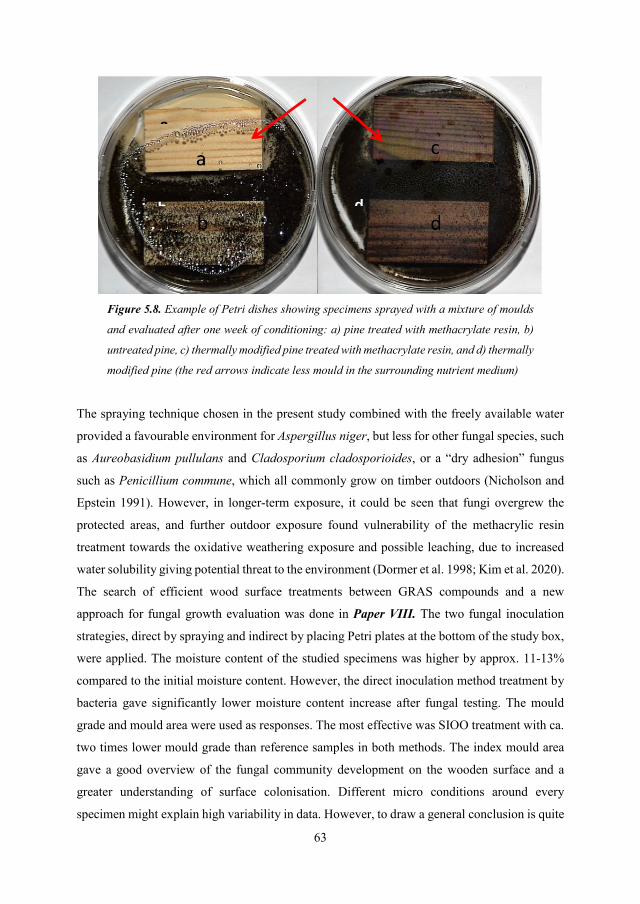
63
Figure 5.8. Example of Petri dishes showing specimens sprayed with a mixture of moulds
and evaluated after one week of conditioning: a) pine treated with methacrylate resin, b)
untreated pine, c) thermally modified pine treated with methacrylate resin, and d) thermally
modified pine (the red arrows indicate less mould in the surrounding nutrient medium)
The spraying technique chosen in the present study combined with the freely available water
provided a favourable environment for Aspergillus niger, but less for other fungal species, such
as Aureobasidium pullulans and Cladosporium cladosporioides, or a “dry adhesion” fungus
such as Penicillium commune, which all commonly grow on timber outdoors (Nicholson and
Epstein 1991). However, in longer-term exposure, it could be seen that fungi overgrew the
protected areas, and further outdoor exposure found vulnerability of the methacrylic resin
treatment towards the oxidative weathering exposure and possible leaching, due to increased
water solubility giving potential threat to the environment (Dormer et al. 1998; Kim et al. 2020).
The search of efficient wood surface treatments between GRAS compounds and a new
approach for fungal growth evaluation was done in Paper VIII. The two fungal inoculation
strategies, direct by spraying and indirect by placing Petri plates at the bottom of the study box,
were applied. The moisture content of the studied specimens was higher by approx. 11-13%
compared to the initial moisture content. However, the direct inoculation method treatment by
bacteria gave significantly lower moisture content increase after fungal testing. The mould
grade and mould area were used as responses. The most effective was SIOO treatment with ca.
two times lower mould grade than reference samples in both methods. The index mould area
gave a good overview of the fungal community development on the wooden surface and a
greater understanding of surface colonisation. Different micro conditions around every
specimen might explain high variability in data. However, to draw a general conclusion is quite
a
b
c
d

64
difficult by using only univariate data analysis, and here multivariate data modelling methods
had to be applied, which are presented in Table 5.6 below.
Table 5.6. Summary of multivariate analysis (MVA) of the effect of treatment of pine boards
with GRAS compounds.
№ Model PC Obs. R2X R2Y Q2(cum)
1 PCA 2 80 0.448 -0.0139
2 PLS-DA 2 80 0.404 0.36 0.319 Treatment class
3 OPLS-DA 2+1+0 80 0.534 0.394 0.336 Treatment class
4 PLS 3 80 0.49 0.843 0.75 Y mould grade
5 PLS 3 79 0.519 0.847 0.766 Y mould grade
Several PLS models were constructed, and PLS model number five in Table 5.6 showed the
best performance in predicting mould grade. In this model, the mould area and type of treatment
were among the most influencing variables. The correlation between mould areas for
Aspergillus sp. to the indirect method of fungal contamination was the highest, and the mould
areas of Penicillium sp. and Paecilomyces sp. were more influenced by the type of treatment
with GRAS. In general, the three-component PLS model demonstrated quite strong
performance and could predict about 77% of data variation (model number 5 in Table 5.6).
The evaluation of the effectiveness of commercially available wood protective products was
investigated in Paper IX. Here, wood samples of spruce, hearwood and sapwood of pine were
treated with wood protecting products (treatment 1-4) and untreated samples were tested in a
Petri plate, and the size of the inhibition zone was determined as described in the materials and
methods in section 4.2. After four days of incubation with selected individual moulds, fungal
growth was observed in all untreated samples. It was found that Trichoderma sp. and
Penicillium sp. had maximum resistance to the treatments. Specimens coated by a transparent
lacquer treatment 4 (Laqvin) were attacked by those fungi already after eight days, whilst fungal
colonies reached samples with treatment 1 (H-Flex) and treatment 2 (Performance) after 22
days of incubation for all types of wood. An effect on most common outdoor appearing fungi
Aureobasidium sp. and Cladosporium sp. for HFlex and Performance treatments was evident.
Table 5.7 presents the size of the inhibition zone between growing fungus and treated specimens
after 22 days of the experiment.
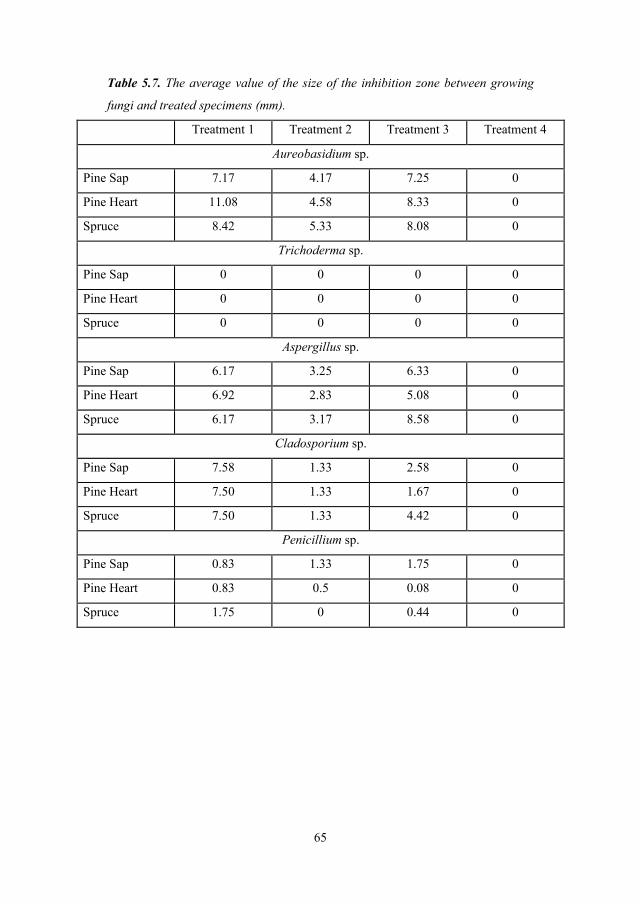
65
Table 5.7. The average value of the size of the inhibition zone between growing
fungi and treated specimens (mm).
Treatment 1 Treatment 2 Treatment 3 Treatment 4
Aureobasidium sp.
Pine Sap 7.17 4.17 7.25 0
Pine Heart 11.08 4.58 8.33 0
Spruce 8.42 5.33 8.08 0
Trichoderma sp.
Pine Sap 0 0 0 0
Pine Heart 0 0 0 0
Spruce 0 0 0 0
Aspergillus sp.
Pine Sap 6.17 3.25 6.33 0
Pine Heart 6.92 2.83 5.08 0
Spruce 6.17 3.17 8.58 0
Cladosporium sp.
Pine Sap 7.58 1.33 2.58 0
Pine Heart 7.50 1.33 1.67 0
Spruce 7.50 1.33 4.42 0
Penicillium sp.
Pine Sap 0.83 1.33 1.75 0
Pine Heart 0.83 0.5 0.08 0
Spruce 1.75 0 0.44 0
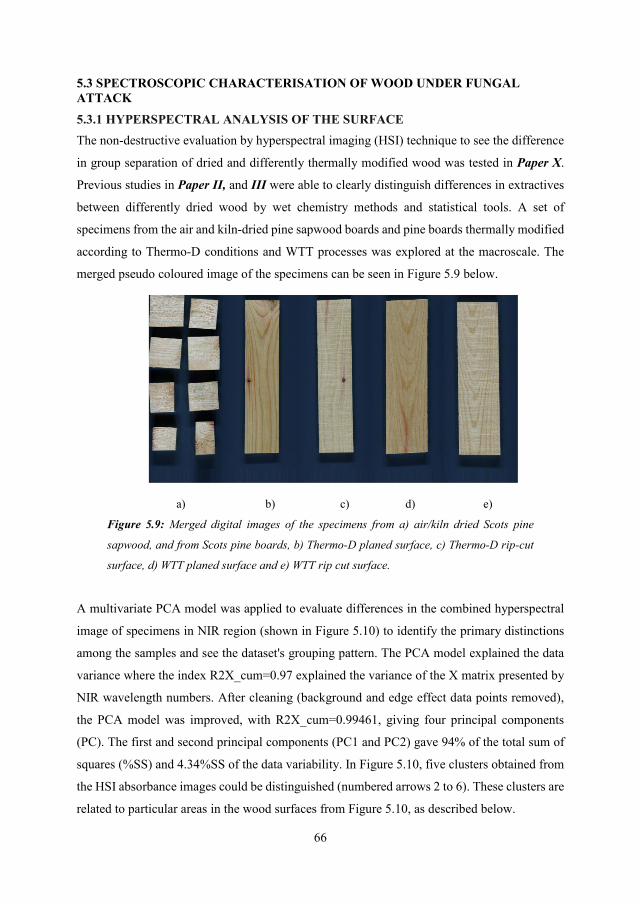
66
5.3 SPECTROSCOPIC CHARACTERISATION OF WOOD UNDER FUNGAL ATTACK
5.3.1 HYPERSPECTRAL ANALYSIS OF THE SURFACE The non-destructive evaluation by hyperspectral imaging (HSI) technique to see the difference
in group separation of dried and differently thermally modified wood was tested in Paper X.
Previous studies in Paper II, and III were able to clearly distinguish differences in extractives
between differently dried wood by wet chemistry methods and statistical tools. A set of
specimens from the air and kiln-dried pine sapwood boards and pine boards thermally modified
according to Thermo-D conditions and WTT processes was explored at the macroscale. The
merged pseudo coloured image of the specimens can be seen in Figure 5.9 below.
a) b) c) d) e)
Figure 5.9: Merged digital images of the specimens from a) air/kiln dried Scots pine
sapwood, and from Scots pine boards, b) Thermo-D planed surface, c) Thermo-D rip-cut
surface, d) WTT planed surface and e) WTT rip cut surface.
A multivariate PCA model was applied to evaluate differences in the combined hyperspectral
image of specimens in NIR region (shown in Figure 5.10) to identify the primary distinctions
among the samples and see the dataset's grouping pattern. The PCA model explained the data
variance where the index R2X_cum=0.97 explained the variance of the X matrix presented by
NIR wavelength numbers. After cleaning (background and edge effect data points removed),
the PCA model was improved, with R2X_cum=0.99461, giving four principal components
(PC). The first and second principal components (PC1 and PC2) gave 94% of the total sum of
squares (%SS) and 4.34%SS of the data variability. In Figure 5.10, five clusters obtained from
the HSI absorbance images could be distinguished (numbered arrows 2 to 6). These clusters are
related to particular areas in the wood surfaces from Figure 5.10, as described below.
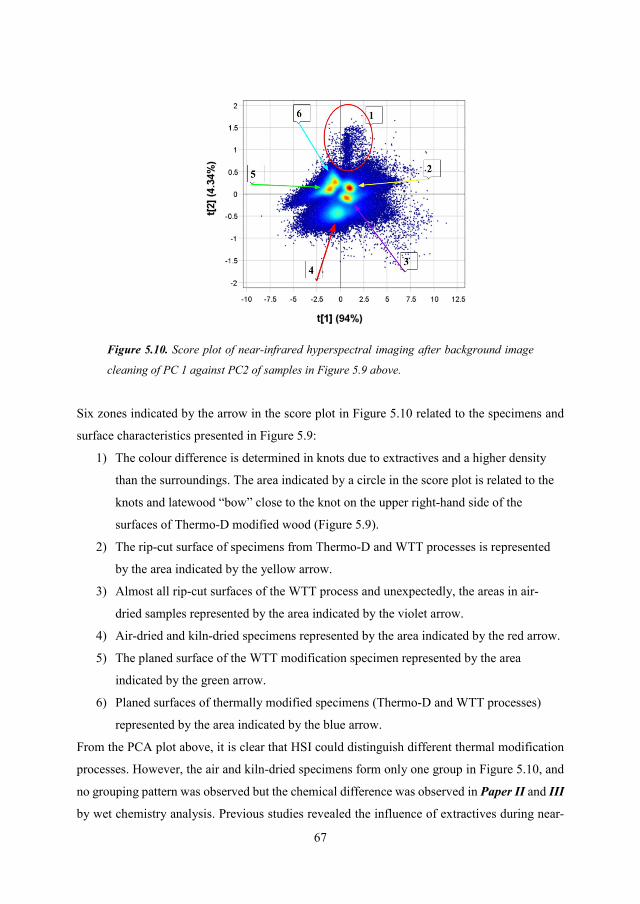
67
Figure 5.10. Score plot of near-infrared hyperspectral imaging after background image
cleaning of PC 1 against PC2 of samples in Figure 5.9 above.
Six zones indicated by the arrow in the score plot in Figure 5.10 related to the specimens and
surface characteristics presented in Figure 5.9:
1) The colour difference is determined in knots due to extractives and a higher density
than the surroundings. The area indicated by a circle in the score plot is related to the
knots and latewood “bow” close to the knot on the upper right-hand side of the
surfaces of Thermo-D modified wood (Figure 5.9).
2) The rip-cut surface of specimens from Thermo-D and WTT processes is represented
by the area indicated by the yellow arrow.
3) Almost all rip-cut surfaces of the WTT process and unexpectedly, the areas in air-
dried samples represented by the area indicated by the violet arrow.
4) Air-dried and kiln-dried specimens represented by the area indicated by the red arrow.
5) The planed surface of the WTT modification specimen represented by the area
indicated by the green arrow.
6) Planed surfaces of thermally modified specimens (Thermo-D and WTT processes)
represented by the area indicated by the blue arrow.
From the PCA plot above, it is clear that HSI could distinguish different thermal modification
processes. However, the air and kiln-dried specimens form only one group in Figure 5.10, and
no grouping pattern was observed but the chemical difference was observed in Paper II and III
by wet chemistry analysis. Previous studies revealed the influence of extractives during near-
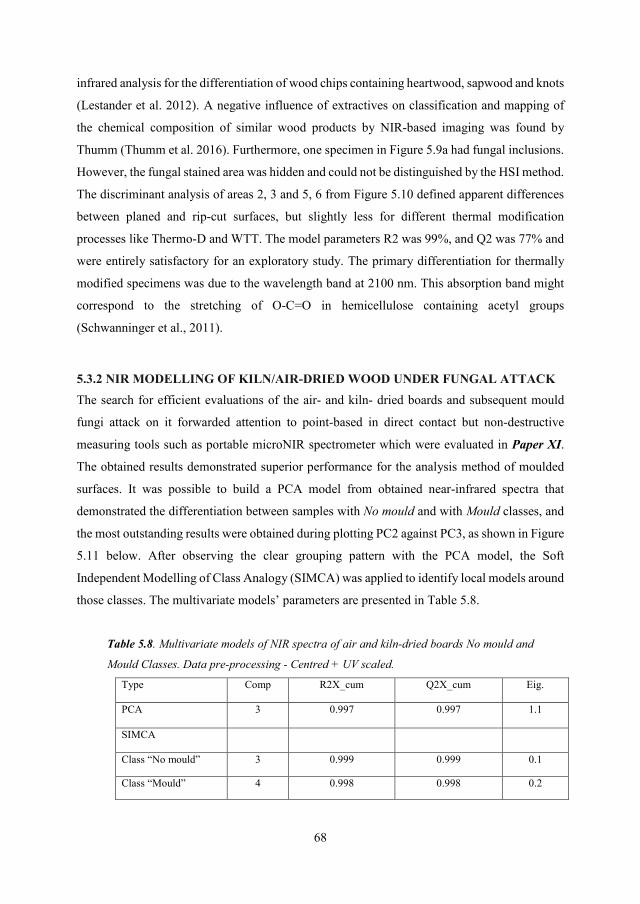
68
infrared analysis for the differentiation of wood chips containing heartwood, sapwood and knots
(Lestander et al. 2012). A negative influence of extractives on classification and mapping of
the chemical composition of similar wood products by NIR-based imaging was found by
Thumm (Thumm et al. 2016). Furthermore, one specimen in Figure 5.9a had fungal inclusions.
However, the fungal stained area was hidden and could not be distinguished by the HSI method.
The discriminant analysis of areas 2, 3 and 5, 6 from Figure 5.10 defined apparent differences
between planed and rip-cut surfaces, but slightly less for different thermal modification
processes like Thermo-D and WTT. The model parameters R2 was 99%, and Q2 was 77% and
were entirely satisfactory for an exploratory study. The primary differentiation for thermally
modified specimens was due to the wavelength band at 2100 nm. This absorption band might
correspond to the stretching of O-C=O in hemicellulose containing acetyl groups
(Schwanninger et al., 2011).
5.3.2 NIR MODELLING OF KILN/AIR-DRIED WOOD UNDER FUNGAL ATTACK The search for efficient evaluations of the air- and kiln- dried boards and subsequent mould
fungi attack on it forwarded attention to point-based in direct contact but non-destructive
measuring tools such as portable microNIR spectrometer which were evaluated in Paper XI.
The obtained results demonstrated superior performance for the analysis method of moulded
surfaces. It was possible to build a PCA model from obtained near-infrared spectra that
demonstrated the differentiation between samples with No mould and with Mould classes, and
the most outstanding results were obtained during plotting PC2 against PC3, as shown in Figure
5.11 below. After observing the clear grouping pattern with the PCA model, the Soft
Independent Modelling of Class Analogy (SIMCA) was applied to identify local models around
those classes. The multivariate models’ parameters are presented in Table 5.8.
Table 5.8. Multivariate models of NIR spectra of air and kiln-dried boards No mould and
Mould Classes. Data pre-processing - Centred + UV scaled.
Type Comp R2X_cum Q2X_cum Eig.
PCA 3 0.997 0.997 1.1
SIMCA
Class “No mould” 3 0.999 0.999 0.1
Class “Mould” 4 0.998 0.998 0.2
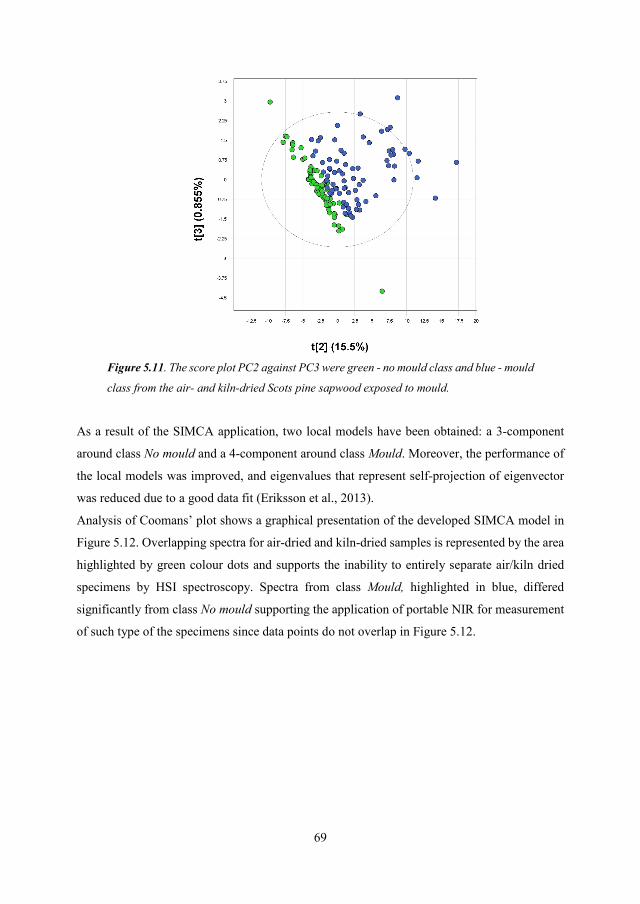
69
Figure 5.11. The score plot PC2 against PC3 were green - no mould class and blue - mould
class from the air- and kiln-dried Scots pine sapwood exposed to mould.
As a result of the SIMCA application, two local models have been obtained: a 3-component
around class No mould and a 4-component around class Mould. Moreover, the performance of
the local models was improved, and eigenvalues that represent self-projection of eigenvector
was reduced due to a good data fit (Eriksson et al., 2013).
Analysis of Coomans’ plot shows a graphical presentation of the developed SIMCA model in
Figure 5.12. Overlapping spectra for air-dried and kiln-dried samples is represented by the area
highlighted by green colour dots and supports the inability to entirely separate air/kiln dried
specimens by HSI spectroscopy. Spectra from class Mould, highlighted in blue, differed
significantly from class No mould supporting the application of portable NIR for measurement
of such type of the specimens since data points do not overlap in Figure 5.12.
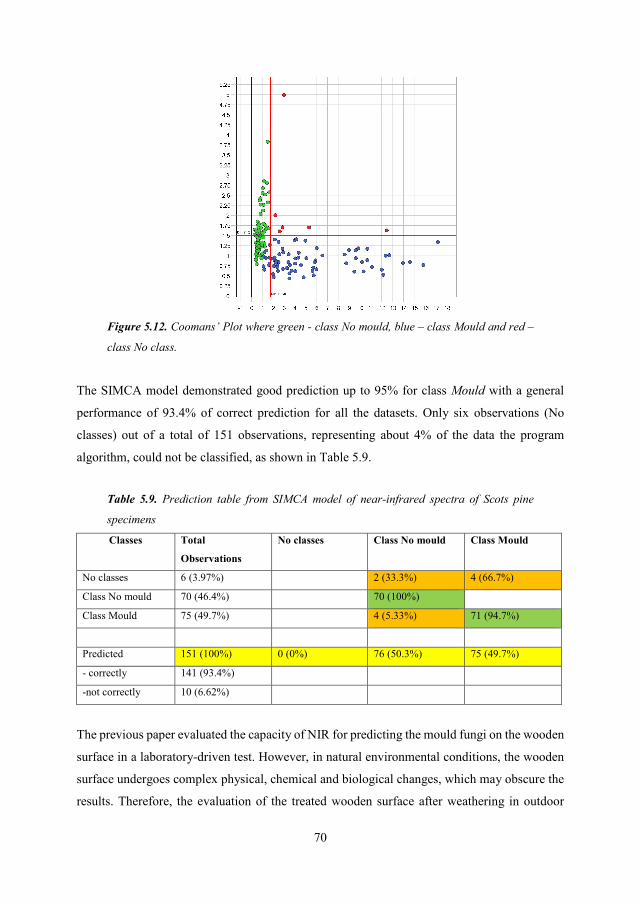
70
Figure 5.12. Coomans’ Plot where green - class No mould, blue – class Mould and red –
class No class.
The SIMCA model demonstrated good prediction up to 95% for class Mould with a general
performance of 93.4% of correct prediction for all the datasets. Only six observations (No
classes) out of a total of 151 observations, representing about 4% of the data the program
algorithm, could not be classified, as shown in Table 5.9.
Table 5.9. Prediction table from SIMCA model of near-infrared spectra of Scots pine
specimens
Classes Total
Observations
No classes Class No mould Class Mould
No classes 6 (3.97%) 2 (33.3%) 4 (66.7%)
Class No mould 70 (46.4%) 70 (100%)
Class Mould 75 (49.7%) 4 (5.33%) 71 (94.7%)
Predicted 151 (100%) 0 (0%) 76 (50.3%) 75 (49.7%)
- correctly 141 (93.4%)
-not correctly 10 (6.62%)
The previous paper evaluated the capacity of NIR for predicting the mould fungi on the wooden
surface in a laboratory-driven test. However, in natural environmental conditions, the wooden
surface undergoes complex physical, chemical and biological changes, which may obscure the
results. Therefore, the evaluation of the treated wooden surface after weathering in outdoor
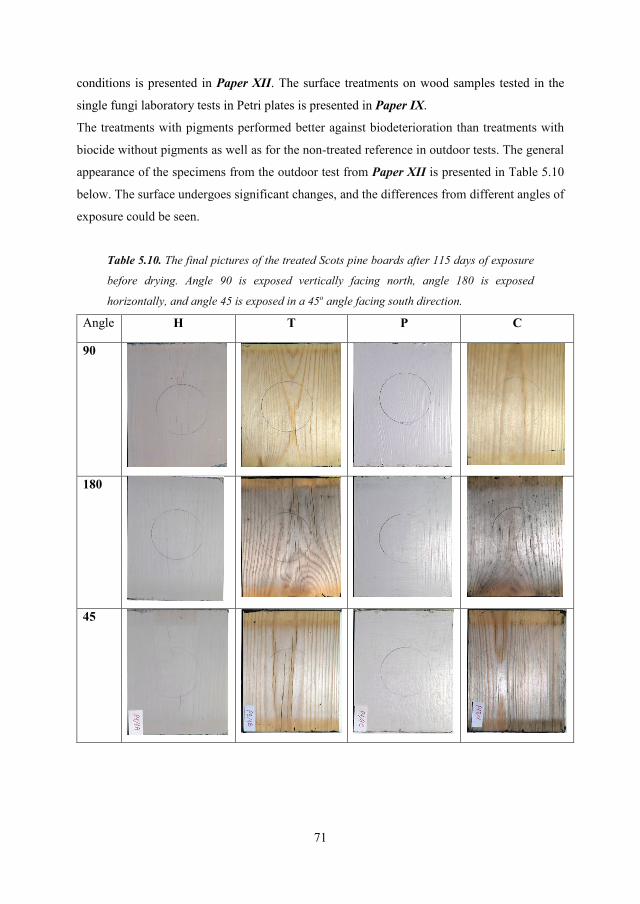
71
conditions is presented in Paper XII. The surface treatments on wood samples tested in the
single fungi laboratory tests in Petri plates is presented in Paper IX.
The treatments with pigments performed better against biodeterioration than treatments with
biocide without pigments as well as for the non-treated reference in outdoor tests. The general
appearance of the specimens from the outdoor test from Paper XII is presented in Table 5.10
below. The surface undergoes significant changes, and the differences from different angles of
exposure could be seen.
Table 5.10. The final pictures of the treated Scots pine boards after 115 days of exposure
before drying. Angle 90 is exposed vertically facing north, angle 180 is exposed
horizontally, and angle 45 is exposed in a 45o angle facing south direction.
Angle H T P C
90
180
45
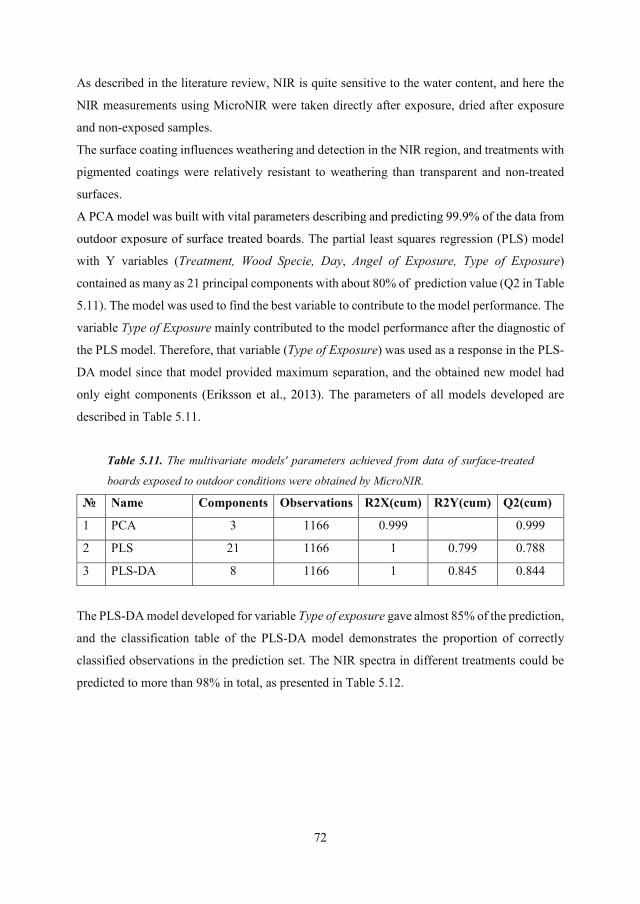
72
As described in the literature review, NIR is quite sensitive to the water content, and here the
NIR measurements using MicroNIR were taken directly after exposure, dried after exposure
and non-exposed samples.
The surface coating influences weathering and detection in the NIR region, and treatments with
pigmented coatings were relatively resistant to weathering than transparent and non-treated
surfaces.
A PCA model was built with vital parameters describing and predicting 99.9% of the data from
outdoor exposure of surface treated boards. The partial least squares regression (PLS) model
with Y variables (Treatment, Wood Specie, Day, Angel of Exposure, Type of Exposure)
contained as many as 21 principal components with about 80% of prediction value (Q2 in Table
5.11). The model was used to find the best variable to contribute to the model performance. The
variable Type of Exposure mainly contributed to the model performance after the diagnostic of
the PLS model. Therefore, that variable (Type of Exposure) was used as a response in the PLS-
DA model since that model provided maximum separation, and the obtained new model had
only eight components (Eriksson et al., 2013). The parameters of all models developed are
described in Table 5.11.
Table 5.11. The multivariate models' parameters achieved from data of surface-treated
boards exposed to outdoor conditions were obtained by MicroNIR.
№ Name Components Observations R2X(cum) R2Y(cum) Q2(cum)
1 PCA 3 1166 0.999 0.999
2 PLS 21 1166 1 0.799 0.788
3 PLS-DA 8 1166 1 0.845 0.844
The PLS-DA model developed for variable Type of exposure gave almost 85% of the prediction,
and the classification table of the PLS-DA model demonstrates the proportion of correctly
classified observations in the prediction set. The NIR spectra in different treatments could be
predicted to more than 98% in total, as presented in Table 5.12.
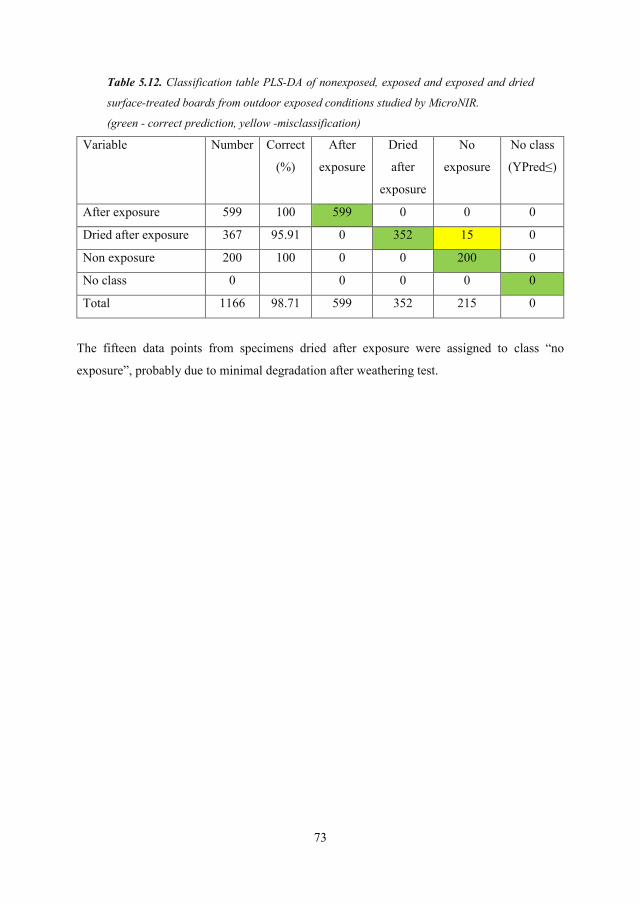
73
Table 5.12. Classification table PLS-DA of nonexposed, exposed and exposed and dried
surface-treated boards from outdoor exposed conditions studied by MicroNIR.
(green - correct prediction, yellow -misclassification)
Variable Number Correct
(%)
After
exposure
Dried
after
exposure
No
exposure
No class
(YPred≤)
After exposure 599 100 599 0 0 0
Dried after exposure 367 95.91 0 352 15 0
Non exposure 200 100 0 0 200 0
No class 0 0 0 0 0
Total 1166 98.71 599 352 215 0
The fifteen data points from specimens dried after exposure were assigned to class “no
exposure”, probably due to minimal degradation after weathering test.

74
75
6. CONCLUSIONS
The study of mould fungi attack on copper impregnated Scots pine sapwood has shown that
fungal growth is regulated to a greater extent by planing depth than by the infection method.
Air-borne contaminants can heavily occupy the unplaned surfaces, but the extent of such
occupation could be reduced with planing and impregnation of boards with preservative
solutions. However, even after impregnation by toxic compounds, it is necessary to process the
wood surface to avoid or hinder micro fungi settlement.
Despite the vulnerability of the differently planed and impregnated wood towards mould fungi,
the resistance of that wood towards white-rot Trametes versicolor was found to be relatively
steady and sufficient with the mass loss for all planing depths below 5%, thereby characterizing
that wood as durability class 1 – very durable, while the same fungi aggressively degraded non-
impregnated wood with a mass loss of over 40% making it not durable (class 5).
The distribution, quantity and nature of lipophilic substances beneath the surface in the air- and
kiln-dried Scots pine (Pinus sylvestris L.) sapwood boards were studied for influence on mould
fungi growth as nutrient and inhibition source. The concentration of total extractives was
significantly higher in studied areas of kiln-dried than in air-dried samples and was higher close
to the surface than in the layers beneath. The scatter in the values for the lipophilic extractives
was high in both drying types, being highest for linoleic acid and slightly lower for palmitic,
oleic and stearic acids. The amount of fatty acids was low in kiln-dried boards, probably due to
a more substantial degradation resulting from the high temperature employed. The most
abundant resin acid was dehydroabietic acid, followed by pimaric, isopimaric, and abietic acids
in both drying types. During kiln-drying, a migration front is created at a depth of 0.25 mm with
a thickness of about 0.5 mm.
Studies were committed towards an understanding of the influence of extractives and other
migrating compounds in unplaned Scots pine sapwood surfaces on mould growth on those
surfaces of timber subjected to air and kiln drying by developing a multivariate Orthogonal
Partial Least Squares (OPLS) regression model. The model described 51% variability in
descriptive X and 69% in Y with the prediction power of 55%. Results indicated that total
acetone soluble compounds and sugars like glucose contributed to the mould growth model,
whereas fatty acids were negatively influencing mould growth.
The thermal modification at different temperatures of exotic African wood influenced the
amount of acetone soluble extractives, pH, and ash content. Thus, iroko wood has, to some
extent, buffering capacity and a different pattern of chemical changes compared to padouk,
76
which provides evidence of the need to study each wood variety for chemistry and process
conditions instead of drawing general conclusions.
The open process of wood treatment like heating-and-cooling has a potential for wood
performance improvement by developing a protective layer beneath the surface. However, the
applied methacrylic resin demonstrated effectiveness during laboratory testing but did not
perform efficiently during outdoor tests.
The test of commercial GRAS compounds and biocidal treatments in laboratory conditions
revealed a moderate inhibition effect in protection against biodeterioration. The main
conclusion from those tests is the deepening of understanding of the fungal community
interactions during different inoculation scenarios like cohabitation of Penicillium sp. and
Paecylomyces sp. and individual fungi virulence like Trichoderma sp. resisting complex
biocidal solutions.
The HSI imaging could be efficiently applied to classify thermally modified wood but failed
for air- and kiln-dried wood. A PCA model determined that regions with high absorbance were
related to extractives with phenolic groups and aliphatic hydrocarbons. The sharp wavelength
band at 2135 nm was found by multivariate analysis to be useful for multivariate calibration.
This peak represented the most considerable variation that characterises the knot area and can
be related to regions in wood rich in hydrocarbons and phenols, and can perhaps be used for
future multivariate calibration.
To check the applicability of portable sensors for mould detection, microNIR OnSite
spectrometry was used to identify the differences in wood surfaces dried in kiln and air. The
obtained principal component analysis (PCA) could describe and predict 99.7% of the
spectroscopic data obtained. No influence of the drying method nor planed depth was
discovered during classification. The significance was discovered only for separating two
classes where the first one is No mould and the second one Mould as independent data points.
The SIMCA model could predict no mould and mould class boards 93.4% correctly.
The surface treatments containing commercial biocides evaluated by the NIR technology above
and a developed PLS-DA model provided almost 99% of prediction for outdoor weathering of
commercial coatings with biocides. That might be applicable for service life prediction of
wooden surfaces in future applications.
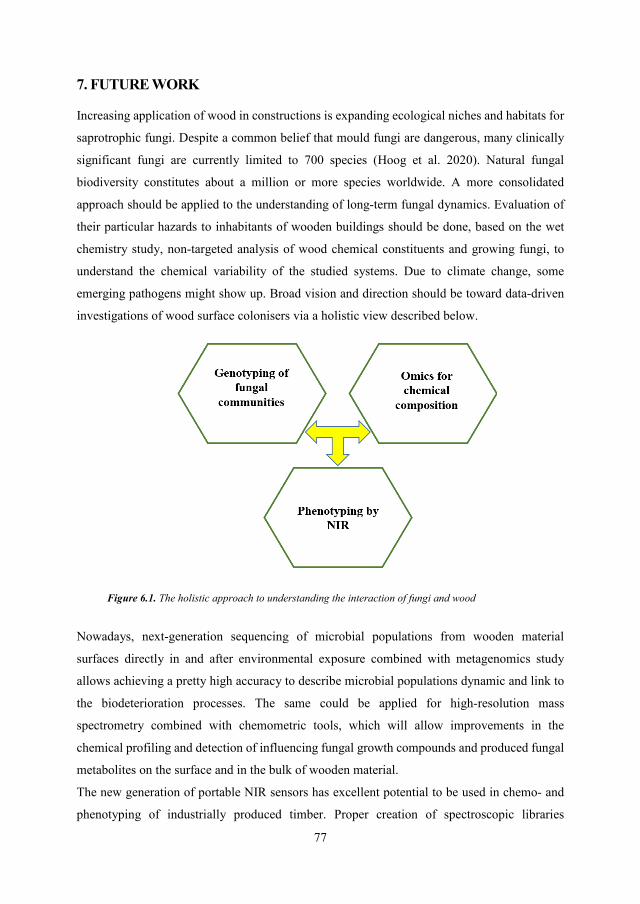
77
7. FUTURE WORK
Increasing application of wood in constructions is expanding ecological niches and habitats for
saprotrophic fungi. Despite a common belief that mould fungi are dangerous, many clinically
significant fungi are currently limited to 700 species (Hoog et al. 2020). Natural fungal
biodiversity constitutes about a million or more species worldwide. A more consolidated
approach should be applied to the understanding of long-term fungal dynamics. Evaluation of
their particular hazards to inhabitants of wooden buildings should be done, based on the wet
chemistry study, non-targeted analysis of wood chemical constituents and growing fungi, to
understand the chemical variability of the studied systems. Due to climate change, some
emerging pathogens might show up. Broad vision and direction should be toward data-driven
investigations of wood surface colonisers via a holistic view described below.
Figure 6.1. The holistic approach to understanding the interaction of fungi and wood
Nowadays, next-generation sequencing of microbial populations from wooden material
surfaces directly in and after environmental exposure combined with metagenomics study
allows achieving a pretty high accuracy to describe microbial populations dynamic and link to
the biodeterioration processes. The same could be applied for high-resolution mass
spectrometry combined with chemometric tools, which will allow improvements in the
chemical profiling and detection of influencing fungal growth compounds and produced fungal
metabolites on the surface and in the bulk of wooden material.
The new generation of portable NIR sensors has excellent potential to be used in chemo- and
phenotyping of industrially produced timber. Proper creation of spectroscopic libraries
78
followed by the data-driven investigation of wooden material properties allows evidence-based
conclusions and predictions. The multivariate analysis of obtained data could link wooden
fingerprints to the mould growth risk and service life scenario. The fundamental understanding
of such properties formation will lead to developing targeted and innovative wood protection
solutions with minimum environmental impact.
The main challenge to overcome is the complexity, variability and diversity of environmentally
formed fungi-wood matrices that require studying multiple analytes with different chemical
properties and associated degradation processes. Nevertheless, we are step a close to such a
solution with the research expertise developed today.
79
REFERENCES
Abrego, Nerea, Brittni Crosier, Panu Somervuo, Natalia Ivanova, Arusyak Abrahamyan, Amir
Abdi, Karoliina Hämäläinen, 2020. ‘Fungal Communities Decline with Urbanization—
More in Air than in Soil’. The ISME Journal 14 (11): 2806–15.
https://doi.org/10.1038/s41396-020-0732-1.
Adams, Rachel I., Marzia Miletto, John W. Taylor, and Thomas D. Bruns. 2013. ‘Dispersal in
Microbes: Fungi in Indoor Air Are Dominated by Outdoor Air and Show Dispersal
Limitation at Short Distances’. The ISME Journal 7 (7): 1262–73.
https://doi.org/10.1038/ismej.2013.28.
Adan, Olaf C. G., and Robert A. Samson. 2011. Fundamentals of Mold Growth in Indoor
Environments and Strategies for Healthy Living. Wageningen: Wageningen Academic
Publishers.
Ahmed, Sheikh Ali, Margot Sehlstedt-Persson, and Tom Morén. 2013. ‘Mould Susceptibility
of Scots Pine (Pinus Sylvestris L.) Sapwood: Impact of Drying, Thermal Modification,
and Copper-Based Preservative’. International Biodeterioration & Biodegradation 85
(November): 284–88. https://doi.org/10.1016/j.ibiod.2013.06.031.
Ahmed, Sheikh Ali, Qian Yang, Margot Sehlstedt-Persson, and Tom Morén. 2013.
‘Accelerated Mold Test on Dried Pine Sapwood Boards: Impact of Contact Heat
Treatment’. Journal of Wood Chemistry and Technology 33 (3): 174–87.
https://doi.org/10.1080/02773813.2013.773041.
Alén R., Kotilainen R., and Zaman A. 2002. ‘Thermochemical Behavior of Norway Spruce
Picea Abies at 180–225 °C’. Wood Science and Technology 36 (2): 163–71.
https://doi.org/10.1007/s00226-001-0133-1.
Amodio, Emanuele, and Claudia Dino. 2014. ‘Use of ATP Bioluminescence for Assessing the
Cleanliness of Hospital Surfaces: A Review of the Published Literature (1990–2012)’.
Journal of Infection and Public Health 7 (2): 92–98.
https://doi.org/10.1016/j.jiph.2013.09.005.
Ansteinsson, V., H. B. Kopperud, E. Morisbak, and J. T. Samuelsen. 2013. ‘Cell Toxicity of
Methacrylate Monomers—The Role of Glutathione Adduct Formation’. Journal of
Biomedical Materials Research Part A 101 (12): 3504–10.
https://doi.org/10.1002/jbm.a.34652.
ASTM International. 2013. ‘ASTM D7855/D7855M - 13. Standard Test Method for
Determination of Mold Growth on Coated Building Products Designed for Interior
80
Applications Using an Environmental Chamber and Indirect Inoculation.’ ASTM
International.
ASTM International. 2019. ‘ASTM D4445 - 10. Test Method for Fungicides for Controlling
Sapstain and Mold on Unseasoned Lumber (Laboratory Method)’. ASTM International.
https://doi.org/10.1520/D4445-10R19.
Austigard, Mari Sand, and J. Mattsson. 2020. ‘Fungal Damages in Norwegian Massive Timber
Elements – a Case Study’. Wood Material Science & Engineering 15 (6): 326–34.
https://doi.org/10.1080/17480272.2020.1801835.
Aylor, Donald E. 2017. Aerial Dispersal of Pollen and Spores. St. Paul, Minnesota, U.S.A: The
American Phytopathological Society.
Baldrian, Petr, Tomáš Větrovský, Tomáš Cajthaml, Petra Dobiášová, Mirka Petránková,
Jaroslav Šnajdr, and Ivana Eichlerová. 2013. ‘Estimation of Fungal Biomass in Forest
Litter and Soil’. Fungal Ecology 6 (1): 1–11.
https://doi.org/10.1016/j.funeco.2012.10.002.
Banci, Lucia, ed. 2013. Metallomics and the Cell. Vol. 12. Metal Ions in Life Sciences.
Dordrecht: Springer Netherlands. https://doi.org/10.1007/978-94-007-5561-1.
Bardage, Stig L, and Jonny Bjurman. 1998. ‘Isolation of an Aureobasidium Pullulans
Polysaccharide That Promotes Adhesion of Blastospores to Water-Borne Paints’.
Canadian Journal of Microbiology 44 (10): 954–58. https://doi.org/10.1139/w98-091.
Berman, Judith, and Damian J. Krysan. 2020. ‘Drug Resistance and Tolerance in Fungi’. Nature
Reviews Microbiology 18 (6): 319–31. https://doi.org/10.1038/s41579-019-0322-2.
Bjarløv, S.P., C.J. Johnston, and M.H. Hansen. 2016. ‘Hygrothermal Conditions in Cold, North
Facing Attic Spaces under the Eaves with Vapour-Open Roofing Underlay in a Cool,
Temperate Climate’. Building and Environment 95 (January): 272–82.
https://doi.org/10.1016/j.buildenv.2015.09.009.
Bjurman, J. 1994. ‘Ergosterol as an Indicator of Mould Growth on Wood in Relation to Culture
Age, Humidity Stress and Nutrient Level’. International Biodeterioration and
Biodegradation 33 (4): 355–68. https://doi.org/10.1016/0964-8305(94)90013-2.
Blackwell Meredith, Vilgalys Rytas, James Timothy Y., and Taylor John W. 2019. ‘Fungi’.
2019. http://tolweb.org/Fungi/2377.
Boddy, Lynne, and Jennifer Hiscox. 2016. ‘Fungal Ecology: Principles and Mechanisms of
Colonization and Competition by Saprotrophic Fungi’. Edited by Joseph Heitman and
81
Pedro W. Crous. Microbiology Spectrum 4 (6).
https://doi.org/10.1128/microbiolspec.FUNK-0019-2016.
Börjesson, T., B. Stenberg, and J. Schnürer. 2007. ‘Near-Infrared Spectroscopy for Estimation
of Ergosterol Content in Barley: A Comparison Between Reflectance and Transmittance
Techniques’. Cereal Chemistry 84 (3): 231–36. https://doi.org/10.1094/CCHEM-84-3-
0231.
Boutelje, J. B. 1990. ‘Increase in the Content of Nitrogenous Compounds at Lumber Surfaces
during Drying and Possible Biological Effects’. Wood Science and Technology 24 (2):
191–200. https://doi.org/10.1007/BF00229055.
Boverket. 2021. ‘Boverkets byggregler (2011:6) – föreskrifter och allmänna råd. Consolidated
version of the National Board of Housing, Building and Planning’s building regulations
Boverkets byggregler BFS 2011:6 med ändringar till och med BFS 2020:4’. Boverket.
2021. https://www.boverket.se/sv/lag--ratt/forfattningssamling/gallande/bbr---bfs-
20116/.
Boyle, C. David, and Bradley R. Kropp. 2011. ‘Development and Comparison of Methods for
Measuring Growth of Filamentous Fungi on Wood’. Canadian Journal of
Microbiology, February. https://doi.org/10.1139/m92-173.
Brischke C., Meyer-Veltrup L., Thelandersson S., and Malo K.A. 2015. ‘WOOD
PROTECTION BY DESIGN – CONCEPTS FOR DURABLE TIMBER BRIDGES’.
In . Poznan, Poland.
Brischke, C., and L. Meyer-Veltrup. 2016. ‘Performance of Thermally Modified Wood during
14 Years of Outdoor Exposure’. International Wood Products Journal 7 (2): 89–95.
https://doi.org/10.1080/20426445.2016.1160591.
Brown, James K. M., and Mogens S. Hovmøller. 2002. ‘Aerial Dispersal of Pathogens on the
Global and Continental Scales and Its Impact on Plant Disease’. Science 297 (5581):
537–41. https://doi.org/10.1126/science.1072678.
Buiarelli, Francesca, Silvia Canepari, Patrizia Di Filippo, Cinzia Perrino, Donatella Pomata,
Carmela Riccardi, and Roberto Speziale. 2013. ‘Extraction and Analysis of Fungal
Spore Biomarkers in Atmospheric Bioaerosol by HPLC–MS–MS and GC–MS’.
Talanta 105 (February): 142–51. https://doi.org/10.1016/j.talanta.2012.11.006.
Burud, Ingunn, Lone Ross Gobakken, Andreas Flø, Knut Kvaal, and Thomas K. Thiis. 2014.
‘Hyperspectral Imaging of Blue Stain Fungi on Coated and Uncoated Wooden
82
Surfaces’. International Biodeterioration & Biodegradation 88 (March): 37–43.
https://doi.org/10.1016/j.ibiod.2013.12.002.
Buxbaum, C., W. Gallent, S. Paulitsch, and O. Pankratz. 2013. ‘Impact of Cool Roofing
Membranes on the Hygrothermal Performance of Low-Sloped Roof Structures in
Timber Construction’. In CONFERENCE PROCEEDING by ASHRAE, 2013
https://www.scopus.com/inward/record.uri?eid=2-s2.0-
84966692205&partnerID=40&md5=e4582dd20d569992deac0eac6dac63de.
Buxbaum C. and Paulitsch S., "Moisture and Durability Performance of Low-Sloped Roof
Structures with Varying Surface Types," in Roofing Research and Standards
Development: 8th Volume, ed. W. Rossiter and S. Molleti (West Conshohocken, PA:
ASTM International, 2015), 123-138. https://doi.org/10.1520/STP159020150024
Cailleau, Guillaume, OlivierBraissant, and Eric P. Verrecchia. 2004. ‘Biomineralization in
Plants as a Long-Term Carbon Sink’. Naturwissenschaften 91 (4): 191–94.
https://doi.org/10.1007/s00114-004-0512-1.
Carlile, M. J. 2001. The Fungi. 2nd ed. San Diego, Calif: Academic Press.
Carvalhais, Nuno, Matthias Forkel, Myroslava Khomik, Jessica Bellarby, Martin Jung, Mirco
Migliavacca, Mingquan Μu, et al. 2014. ‘Global Covariation of Carbon Turnover Times
with Climate in Terrestrial Ecosystems’. Nature 514 (7521): 213–17.
https://doi.org/10.1038/nature13731.
CEN. 2005. ‘CEN/TS 15083-1:2005 En. Durability of Wood and Wood-Based Products -
Determination of the Natural Durability of Solid Wood against Wood-Destroying
Fungi, Test Methods - Part 1: Basidiomycetes’. 2005. https://www.nen.nl/en/cen-ts-
15083-1-2005-en-57623.
CEN. 2005. ‘CEN/TS 15083-2:2005 En. Durability of Wood and Wood-Based Products -
Determination of the Natural Durability of Solid Wood against Wood-Destroying
Fungi, Test Methods - Part 2: Soft Rotting Micro-Fungi’. 2005.
https://www.nen.nl/en/cen-ts-15083-2-2005-en-57624.
Cervantes, Carlos, and Felix Gutierrez-Corona. 1994. ‘Copper Resistance Mechanisms in
Bacteria and Fungi’. FEMS Microbiology Reviews 14 (2): 121–37.
https://doi.org/10.1111/j.1574-6976.1994.tb00083.x.
Dagbro, O., Torniainen, P. and Morén, T.. 2011. ‘Thermal Modification of Birch Using
Saturated and Superheated Steam’. In DIVA, 43–48. Norsk institutt for skog og
landskap. http://urn.kb.se/resolve?urn=urn:nbn:se:ltu:diva-33985.
83
Deacon J. W. 2006. Fungal Biology. 4th ed. Malden, MA: Blackwell Pub.
Dijck, Patrick Van, Neil Andrew Brown, Gustavo H. Goldman, Julian Rutherford, Chaoyang
Xue, and Griet Van Zeebroeck. 2017. ‘Nutrient Sensing at the Plasma Membrane of
Fungal Cells’. Microbiology Spectrum 5 (2).
https://doi.org/10.1128/microbiolspec.FUNK-0031-2016.
Dormer, W., R. Gomes, and M. E. Meek. 1998. Methyl Methacrylate. Concise International
Chemical Assessment Document 4. Geneva: World health organization.
Druzhinina, Irina S., and Christian P. Kubicek. 2016. Environmental and Microbial
Relationships. Springer.
Dubos Rene J. 1950. Louis Pasteur: FREE LANCE OF SCIENCE. Boston: Little, Brown, and
Company.
Eastwood, Daniel C., Dimitrios Floudas, Manfred Binder, Andrzej Majcherczyk, Patrick
Schneider, Andrea Aerts, Fred O. Asiegbu, et al. 2011. ‘The Plant Cell Wall–
Decomposing Machinery Underlies the Functional Diversity of Forest Fungi’. Science
333 (6043): 762–65. https://doi.org/10.1126/science.1205411.
Eikenes, Morten, Ari M. Hietala, Gry Alfredsen, Carl Gunnar Fossdal, and Halvor Solheim.
2005. ‘Comparison of Quantitative Real-Time PCR, Chitin and Ergosterol Assays for
Monitoring Colonization of Trametes Versicolor in Birch Wood’ 59 (5): 568–73.
https://doi.org/10.1515/HF.2005.093.
Ek, Monica, Goran Gellerstedt, and Gunnar Henriksson. 2009. Wood Chemistry and
Biotechnology. Pulp and Paper Chemistry and Technology / Ed. by Monica Ek 1. Berlin:
De Gruyter.
Elustondo, Diego, Olena Myronycheva, Bror Sundqvist, and Olov Karlsson. 2016a. ‘Localized
Wood Surface Modification, Part I: Method Characterization’. BioResources 12 (1).
https://doi.org/10.15376/biores.12.1.283-295.
Epstein, Joshua M. 2008. ‘Why Model?’ Text.Article. JASSS. 31 October 2008.
https://www.jasss.org/11/4/12.html.
Eriksson, L, T Byrne, E Johansson, J Trygg, and C Vikström. 2013. Multi- and Megavariate
Data Analysis: Basic Principles and Applications.
European Commission. Joint Research Centre. 2019. Mapping the Role of Raw Materials in
Sustainable Development Goals: A Preliminary Analysis of Links, Monitoring
Indicators and Related Policy Initiatives. LU: Publications Office.
https://data.europa.eu/doi/10.2760/026725.
84
European Parliament and of the Council. 2012. Regulation (EU) No 528/2012 of the European
Parliament and of the Council of 22 May 2012 Concerning the Making Available on the
Market and Use of Biocidal Products. Text with EEA Relevance. OJ L. Vol. 167.
http://data.europa.eu/eli/reg/2012/528/oj/eng.
Fabiola Soto, C., P. Claudia Tramón, M. Pedro Aqueveque, and J. De Bruijn. 2018. ‘Antagonist
Microorganisms That Inhibit the Development of Post-Harvest Pathogens in Lemons
(Citrus Limon L.)’. Chilean Journal of Agricultural and Animal Sciences 34 (2): 173–
84. https://doi.org/10.4067/S0719-38902018005000406.
Fackler, Karin, and Manfred Schwanninger. 2012. ‘How Spectroscopy and Microspectroscopy
of Degraded Wood Contribute to Understand Fungal Wood Decay’. Applied
Microbiology and Biotechnology 96 (3): 587–99. https://doi.org/10.1007/s00253-012-
4369-5.
Fahrentrapp, Johannes, Francesco Ria, Martin Geilhausen, and Bernd Panassiti. 2019.
‘Detection of Gray Mold Leaf Infections Prior to Visual Symptom Appearance Using a
Five-Band Multispectral Sensor’. Frontiers in Plant Science 10: 628.
https://doi.org/10.3389/fpls.2019.00628.
FAO UN. 2021. ‘FAOSTAT. Forestry Production and Trade’. 2021.
http://www.fao.org/faostat/en/#data/FO.
Feist, William C., and David N.-S. Hon. 1984. ‘Chemistry of Weathering and Protection’. In
The Chemistry of Solid Wood, edited by Roger Rowell, 207:401–51. Washington, DC:
American Chemical Society. https://doi.org/10.1021/ba-1984-0207.ch011.
Felhofer, Martin, Batirtze Prats-Mateu, Peter Bock, and Notburga Gierlinger. 2018. ‘Antifungal
Stilbene Impregnation: Transport and Distribution on the Micron-Level’. Tree
Physiology 38 (10): 1526–37. https://doi.org/10.1093/treephys/tpy073.
Fengel, Dietrich, and Gerd Wegener. 1989. Wood: Chemistry, Ultrastructure, Reactions.
Berlin: de Gruyter.
Fischer, Christine, and Wolfgang Höll. 1992. ‘Food Reserves of Scots Pine (Pinus Sylvestris
L.)’. Trees 6 (3): 147–55. https://doi.org/10.1007/BF00202430.
Fisher, Matthew C., Sarah J. Gurr, Christina A. Cuomo, David S. Blehert, Hailing Jin, Eva H.
Stukenbrock, Jason E. Stajich, et al. 2020. ‘Threats Posed by the Fungal Kingdom to
Humans, Wildlife, and Agriculture’. MBio 11 (3). https://doi.org/10.1128/mBio.00449-
20.
85
Fisher, Matthew C., Nichola J. Hawkins, Dominique Sanglard, and Sarah J. Gurr. 2018.
‘Worldwide Emergence of Resistance to Antifungal Drugs Challenges Human Health
and Food Security’. Science 360 (6390): 739–42.
https://doi.org/10.1126/science.aap7999.
Floudas, D., M. Binder, R. Riley, K. Barry, R. A. Blanchette, B. Henrissat, A. T. Martinez, et
al. 2012. ‘The Paleozoic Origin of Enzymatic Lignin Decomposition Reconstructed
from 31 Fungal Genomes’. Science 336 (6089): 1715–19.
https://doi.org/10.1126/science.1221748.
Frostegård, A., and E. Bååth. 1996. ‘The Use of Phospholipid Fatty Acid Analysis to Estimate
Bacterial and Fungal Biomass in Soil’. Biology and Fertility of Soils 22 (1): 59–65.
https://doi.org/10.1007/BF00384433.
Gabriel, Jiří, and Karel Švec. 2017. ‘Occurrence of Indoor Wood Decay Basidiomycetes in
Europe’. Fungal Biology Reviews 31 (4): 212–17.
https://doi.org/10.1016/j.fbr.2017.05.002.
Geving, S., and J. Holme. 2010. ‘The Drying Potential and Risk for Mold Growth in Compact
Wood Frame Roofs with Built-in Moisture’. Journal of Building Physics 33 (3): 249–
69. https://doi.org/10.1177/1744259109351441.
Golan, Jacob J., and Anne Pringle. 2017. ‘Long-Distance Dispersal of Fungi’. Edited by Joseph
Heitman and Pedro W. Crous. Microbiology Spectrum 5 (4).
https://doi.org/10.1128/microbiolspec.FUNK-0047-2016.
Gowen, Aoife A., Yaoze Feng, Edurne Gaston, and Vasilis Valdramidis. 2015. ‘Recent
Applications of Hyperspectral Imaging in Microbiology’. Talanta 137 (May): 43–54.
https://doi.org/10.1016/j.talanta.2015.01.012.
Green, Benny, Paul David Jones, Darrel D. Nicholas, Laurence R. Schimleck, Rubin Shmulsky,
and Joseph Dahlen. 2012. ‘Assessment of the Early Signs of Decay of Populus Deltoides
Wafers Exposed to Trametes Versicolor by near Infrared Spectroscopy’. Holzforschung
66 (4): 515–20. https://doi.org/10.1515/hf-2012-0501.
Green, Frederick, and Carol A. Clausen. 2005. ‘Copper Tolerance of Brown-Rot Fungi : Oxalic
Acid Production in Southern Pine Treated with Arsenic-Free Preservatives’.
International Biodeterioration & Biodegradation. Vol. 56 (2005): Pages 75-79.
https://www.fs.usda.gov/treesearch-beta/pubs/21521.
86
Guillén, Yudith, David Navias, and Ángela Machuca. 2009. ‘Tolerance to Wood Preservatives
by Copper-Tolerant Wood-Rot Fungi Native to South-Central Chile’. Biodegradation
20 (1): 135. https://doi.org/10.1007/s10532-008-9207-1.
Haas, Doris, Helmut Mayrhofer, Juliana Habib, Herbert Galler, Franz Ferdinand Reinthaler,
Maria Luise Fuxjäger, and Walter Buzina. 2019. ‘Distribution of Building-Associated
Wood-Destroying Fungi in the Federal State of Styria, Austria’. European Journal of
Wood and Wood Products 77 (4): 527–37. https://doi.org/10.1007/s00107-019-01407-
w.
Hastrup, Anne Christine Steenkjær, Frederick Green, Carol A. Clausen, and Bo Jensen. 2005.
‘Tolerance of Serpula Lacrymans to Copper-Based Wood Preservatives’. International
Biodeterioration & Biodegradation 56 (3): 173–77.
https://doi.org/10.1016/j.ibiod.2005.06.008.
Hawksworth, David L., and Robert Lücking. 2017. ‘Fungal Diversity Revisited: 2.2 to 3.8
Million Species’. Microbiology Spectrum 5 (4).
https://doi.org/10.1128/microbiolspec.FUNK-0052-2016.
Hill, Callum A. S. 2006. Wood Modification: Chemical, Thermal and Other Processes. Wiley
Series in Renewable Resources. Chichester, England ; Hoboken, NJ: John Wiley &
Sons.
Hill, Callum, Michael Altgen, and Lauri Rautkari. 2021. ‘Thermal Modification of Wood—a
Review: Chemical Changes and Hygroscopicity’. Journal of Materials Science 56 (11):
6581–6614. https://doi.org/10.1007/s10853-020-05722-z.
Hillis, W. E. 1987. Heartwood and Tree Exudates. Vol. 4. Springer Series in Wood Science.
Berlin, Heidelberg: Springer Berlin Heidelberg. https://doi.org/10.1007/978-3-642-
72534-0.
Hippelein, Martin, and Melanie Rügamer. 2004. ‘Ergosterol as an Indicator of Mould Growth
on Building Materials’. International Journal of Hygiene and Environmental Health
207 (4): 379–85. https://doi.org/10.1078/1438-4639-00303.
Hoog, Gerrit Sijbrand de, Josep Guarro, and J Gené. 2020. Atlas of Clinical Fungi: The Ultimate
Benchtool for Diagnostics. Part A, Part A,. Hilversum: Foundation Atlas.
International ThermoWood Association. 2003. ThermoWood Handbook. Finnish Thermowood
Association.
87
Irbe, Ilze, and Ingeborga Andersone. 2008. ‘Wood Decay Fungi in Latvian Buildings Including
Cultural Monuments’. In Proceedings of the International Conference Held by COST
Action IE0601 in Braga (Portugal). Braga, Portugal: Firenze University Press 2010.
ISO. 2012. ‘ISO 13788:2012. Hygrothermal Performance of Building Components and
Building Elements -- Internal Surface Temperature to Avoid Critical Surface Humidity
and Interstitial Condensation -- Calculation Methods’. ISO. 2012.
http://www.iso.org/cms/render/live/en/sites/isoorg/contents/data/standard/05/16/51615
.html.
ISO. 2016. ‘ISO 4628-1:2016. Paints and Varnishes -- Evaluation of Degradation of Coatings
-- Designation of Quantity and Size of Defects, and of Intensity of Uniform Changes in
Appearance -- Part 1: General Introduction and Designation System’. ISO. 2016.
http://www.iso.org/cms/render/live/en/sites/isoorg/contents/data/standard/06/48/64877
.html.
Jelle, B.P., and P.J. Hovde. 2012. ‘Fourier Transform Infrared Radiation Spectroscopy Applied
for Wood Rot Decay and Mould Fungi Growth Detection’. Advances in Materials
Science and Engineering 2012. https://doi.org/10.1155/2012/969360.
Johansson, P., T. Wamming, G. Bok, and M.-L. Edlund. 2013. ‘Mould Growth on Kiln-Dried
and Air-Dried Timber’. European Journal of Wood and Wood Products 71 (4): 473–81.
https://doi.org/10.1007/s00107-013-0699-y.
Johansson, Pernilla. 2012. ‘Critical Moisture Conditions for Mould Growth on Building
Materials’. Lund: Avdelningen för byggnadsfysik, Lunds universitet.
Johansson, Pernilla, Annika Ekstrand-Tobin, Thomas Svensson, and Gunilla Bok. 2012.
‘Laboratory Study to Determine the Critical Moisture Level for Mould Growth on
Building Materials’. International Biodeterioration & Biodegradation 73 (September):
23–32. https://doi.org/10.1016/j.ibiod.2012.05.014.
Johansson, Pernilla, Kristina Mjörnell, and Jesper Arfvidsson. 2017. ‘Examples of
Characteristics of Wood That Affect Mould Growth: A Meta-Analysis’. European
Journal of Wood and Wood Products 75 (4): 603–13. https://doi.org/10.1007/s00107-
016-1127-x.
Johnson, Sherena. 2014. ‘NIST Standard Reference Database 1A V14’. NIST. 19 June 2014.
https://www.nist.gov/srd/nist-standard-reference-database-1a-v14.
Jones, E. B. Gareth. 1994. ‘Fungal Adhesion’. Mycological Research 98 (9): 961–81.
https://doi.org/10.1016/S0953-7562(09)80421-8.
88
Julkunen-Tiitto, Riitta. 1985. ‘Phenolic Constituents in the Leaves of Northern Willows:
Methods for the Analysis of Certain Phenolics’. Journal of Agricultural and Food
Chemistry 33 (2): 213–17. https://doi.org/10.1021/jf00062a013.
Kang, Y., S.J. Chang, and S. Kim. 2016. ‘Analysis of Hygrothermal Performance of Wood
Frame Walls According to Position of Insulation and Climate Conditions’. Journal of
the Korean Wood Science and Technology 44 (2): 264–73.
https://doi.org/10.5658/WOOD.2016.44.2.264.
Karlsson, Olov, Ola Dagbro, and Kurt Granlund. 2014. ‘Soluble Degradation Products in
Thermally Modified Wood’. In Final Cost Action FP0904 Conference : “Recent
Advances in the Field of TH and THM Wood Treatment”, 16–17. Skelleftea: Luleå
tekniska universitet.
Karlsson, Olov, Petteri Torniainen, Ola Dagbro, and Tom Moren. 2012. ‘PRESENCE OF
WATER-SOLUBLE COMPOUNDS IN THERMALLY MODIFIED WOOD:
CARBOHYDRATES AND FURFURALS’ 7 (3): 3679–89.
https://doi.org/10.15376/biores.7.3.3679-3689.
Karlsson, Olov, Olena Myronycheva, Dennis Jones, Diego Elustondo, and Dick Sandberg.
2018. ‘Thermally Modified Wood Treated with Methacrylate’. In Proceedings IRG
Annual Meeting IRG49 Scientific Conference on Wood Protection Sandton,
Johannesburg, South Africa 29 April-3 May, 2018.
http://urn.kb.se/resolve?urn=urn:nbn:se:ltu:diva-68771.
Karlsson, Olov, Qian Yang, Margot Sehlstedt-Persson, and Tom Morén. 2012. ‘HEAT
TREATMENTS OF HIGH TEMPERATURE DRIED NORWAY SPRUCE BOARDS:
SACCHARIDES AND FURFURALS IN SAPWOOD SURFACES’. BioResources 7
(2). https://doi.org/10.15376/biores.7.2.2284-2299.
Kim, Injeong, Olov Karlsson, Olena Myronycheva, Dennis Jones, and Dick Sandberg. 2020.
‘Methacrylic Resin for Protection of Wood from Discoloration by Mould Growth and
Weathering’. BioResources 15 (3): 7018–33.
https://doi.org/10.15376/biores.15.3.7018-7033.
Krah, Franz-Sebastian, Claus Bässler, Christoph Heibl, John Soghigian, Hanno Schaefer, and
David S. Hibbett. 2018. ‘Evolutionary Dynamics of Host Specialization in Wood-Decay
Fungi’. BMC Evolutionary Biology 18 (1): 119. https://doi.org/10.1186/s12862-018-
1229-7.
89
Kretz, Alois. 1973. ‘Zucker, Cyclite Und Organische Säuren Des Cambialsaftes von Pinus
Silvestris L., Picea Abies Karst. Und Abies Alba Mill.’ Planta 110 (1): 1–14.
https://www.jstor.org/stable/23370706.
Kubicek, Christian P. 2012. Fungi and Lignocellulosic Biomass: Kubicek/Fungi and
Lignocellulosic Biomass. Oxford, UK: Wiley-Blackwell.
http://doi.wiley.com/10.1002/9781118414514.
Kummer, Volker, and Wolf R. Thiel. 2008. ‘Bioaerosols – Sources and Control Measures’.
International Journal of Hygiene and Environmental Health 211 (3–4): 299–307.
https://doi.org/10.1016/j.ijheh.2007.06.006.
Kutnik, Magdalena, Ed Suttie, and Christian Brischke. 2014. ‘European Standards on
Durability and Performance of Wood and Wood-Based Products – Trends and
Challenges’. Wood Material Science & Engineering 9 (3): 122–33.
https://doi.org/10.1080/17480272.2014.894574.
Laarhoven, Karel A. van, Hendrik P. Huinink, and Olaf C. G. Adan. 2016. ‘A Microscopy
Study of Hyphal Growth of Penicillium Rubens on Gypsum under Dynamic Humidity
Conditions’. Microbial Biotechnology 9 (3): 408–18. https://doi.org/10.1111/1751-
7915.12357.
Lai, Y.-Z. 1992. ‘Determination of Phenolic Hydroxyl Groups’. In Methods in Lignin
Chemistry, edited by Dr Stephen Y. Lin and Professor Emeritus Dr Carlton W. Dence,
423–34. Springer Series in Wood Science. Springer Berlin Heidelberg.
https://doi.org/10.1007/978-3-642-74065-7_28.
Lau, Arthur P. S., Alex K. Y. Lee, Chak K. Chan, and Ming Fang. 2006. ‘Ergosterol as a
Biomarker for the Quantification of the Fungal Biomass in Atmospheric Aerosols’.
Atmospheric Environment 40 (2): 249–59.
https://doi.org/10.1016/j.atmosenv.2005.09.048.
Lecellier, A., V. Gaydou, J. Mounier, A. Hermet, L. Castrec, G. Barbier, W. Ablain, M.
Manfait, D. Toubas, and G. D. Sockalingum. 2015. ‘Implementation of an FTIR
Spectral Library of 486 Filamentous Fungi Strains for Rapid Identification of Molds’.
Food Microbiology, Spoilers, wonder spores and diehard microorganisms: New insights
to integrate these super foes in food spoilage risk management, 45 (Part A): 126–34.
https://doi.org/10.1016/j.fm.2014.01.002.
90
Leggat, Peter A., and Ureporn Kedjarune. 2003. ‘Toxicity of Methyl Methacrylate in Dentistry’.
International Dental Journal 53 (3): 126–31. https://doi.org/10.1111/j.1875-
595X.2003.tb00736.x.
Leinonen, Asta, Anni M. Harju, Martti Venäläinen, Pekka Saranpää, and Tapio Laakso. 2008.
‘FT-NIR Spectroscopy in Predicting the Decay Resistance Related Characteristics of
Solid Scots Pine (Pinus Sylvestris L.) Heartwood’ 62 (3): 284–88.
https://doi.org/10.1515/HF.2008.033.
Lestander, Torbjörn A., Paul Geladi, Sylvia H. Larsson, and Mikael Thyrel. 2012. ‘Near
Infrared Image Analysis for Online Identification and Separation of Wood Chips with
Elevated Levels of Extractives’. Journal of Near Infrared Spectroscopy 20 (5): 591–99.
https://doi.org/10.1255/jnirs.992.
Ligne, Liselotte De, Jan Van den Bulcke, Jan M. Baetens, Bernard De Baets, Gang Wang, Imke
De Windt, Hans Beeckman, and Joris Van Acker. 2021. ‘Unraveling the Natural
Durability of Wood: Revealing the Impact of Decay-Influencing Characteristics Other
than Fungicidal Components’. Holzforschung 75 (4): 368–78.
https://doi.org/10.1515/hf-2020-0109.
Lindström Johanna. 2021. ‘Akuta problem med fler än ett av tio svenska tak’. Anticimex.
https://www.anticimex.se/nyhetsrum/akuta-problem-med-fler-an-ett-av-tio-svenska-
tak.
Lipke, Peter N. 2018. ‘What We Do Not Know about Fungal Cell Adhesion Molecules’.
Journal of Fungi 4 (2): 59. https://doi.org/10.3390/jof4020059.
Mancinelli, Giorgio, Maria Letizia Costantini, and Loreto Rossi. 2014. ‘Predicting Ergosterol
in Leaf Litter by Near-Infrared Spectroradiometry: A Preliminary Assessment’.
European Journal of Soil Biology 63 (July): 49–54.
https://doi.org/10.1016/j.ejsobi.2014.05.003.
Mantanis, G. I., and R. A. Young. 1997. ‘Wetting of Wood’. Wood Science and Technology 31
(5): 339. https://doi.org/10.1007/BF01159153.
Mattsson, Johan. 2017. The Impact of Microclimate on Biodeterioration of Wood in Historic
Buildings. NTNU. https://ntnuopen.ntnu.no/ntnu-xmlui/handle/11250/2432121.
Metreveli, Eka, Tamar Khardziani, and Vladimir Elisashvili. 2021. ‘The Carbon Source
Controls the Secretion and Yield of Polysaccharide-Hydrolyzing Enzymes of
Basidiomycetes’. Biomolecules 11 (9): 1341. https://doi.org/10.3390/biom11091341.
91
Meyer-Veltrup, Linda, Christian Brischke, Gry Alfredsen, Miha Humar, Per-Otto Flæte, Tord
Isaksson, Pia Larsson Brelid, Mats Westin, and Jöran Jermer. 2017. ‘The Combined
Effect of Wetting Ability and Durability on Outdoor Performance of Wood:
Development and Verification of a New Prediction Approach’. Wood Science and
Technology 51 (3): 615–37. https://doi.org/10.1007/s00226-017-0893-x.
Meyer-Veltrup, Linda, Christian Brischke, and Björn Källander. 2017. ‘Testing the Durability
of Timber above Ground: Evaluation of Different Test Methods’. European Journal of
Wood and Wood Products 75 (3): 291–304. https://doi.org/10.1007/s00107-016-1137-
8.
Mille-Lindblom, Cecilia, Eddie von Wachenfeldt, and Lars J. Tranvik. 2004. ‘Ergosterol as a
Measure of Living Fungal Biomass: Persistence in Environmental Samples after Fungal
Death’. Journal of Microbiological Methods 59 (2): 253–62.
https://doi.org/10.1016/j.mimet.2004.07.010.
Morel, Mélanie, Edgar Meux, Yann Mathieu, Anne Thuillier, Kamel Chibani, Luc Harvengt,
Jean-Pierre Jacquot, and Eric Gelhaye. 2013. ‘Xenomic Networks Variability and
Adaptation Traits in Wood Decaying Fungi’. Microbial Biotechnology 6 (3): 248–63.
https://doi.org/10.1111/1751-7915.12015.
Morrell, J. 2005. ‘Protection of Wood-Based Materials’. In Handbook of Environmental
Degradation of Materials, 299–317. https://doi.org/10.1016/B978-081551500-
5.50017-3.
Mueller, Gregory M., Gerald F. Bills, and Mercedes S. Foster, eds. 2004. Biodiversity of Fungi:
Inventory and Monitoring Methods. Amsterdam ; Boston: Elsevier.
Nagawa, Christine Betty, Stefan Böhmdorfer, and Thomas Rosenau. 2015. ‘Chemical
Composition of Volatiles Extracted from Indigenous Tree Species of Uganda:
Composition of Bark Extracts from Psorospermum Febrifugum and Milicia Excelsa’.
Holzforschung 69 (6): 815–21. https://doi.org/10.1515/hf-2014-0283.
Nante, N., E. Ceriale, G. Messina, D. Lenzi, and P. Manzi. 2017. ‘Effectiveness of ATP
Bioluminescence to Assess Hospital Cleaning: A Review’. Journal of Preventive
Medicine and Hygiene 58 (2): E177–83.
https://www.ncbi.nlm.nih.gov/pmc/articles/PMC5584088/.
National Academies of Sciences, Engineering, and Medicine, National Academy of
Engineering, Division on Engineering and Physical Sciences, Health and Medicine
Division, Division on Earth and Life Studies, Board on Infrastructure and the
92
Constructed Environment, Board on Environmental Studies and Toxicology, Board on
Life Sciences, and Committee on Microbiomes of the Built Environment: From
Research to Application. 2017. Microbiomes of the Built Environment: A Research
Agenda for Indoor Microbiology, Human Health, and Buildings. The National
Academies Collection: Reports Funded by National Institutes of Health. Washington
(DC): National Academies Press (US).
http://www.ncbi.nlm.nih.gov/books/NBK458827/.
Newell, S. Y., T. L. Arsuffi, and R. D. Fallon. 1988. ‘Fundamental Procedures for Determining
Ergosterol Content of Decaying Plant Material by Liquid Chromatography’. Applied
and Environmental Microbiology 54 (7): 1876–79.
http://www.ncbi.nlm.nih.gov/pmc/articles/PMC202764/.
Nicholson, Ralph L., and Lynn Epstein. 1991. ‘Adhesion of Fungi to the Plant Surface’. In The
Fungal Spore and Disease Initiation in Plants and Animals, edited by Garry T. Cole
and Harvey C. Hoch, 3–23. Springer US. https://doi.org/10.1007/978-1-4899-2635-7_1.
Nieuwenhuijzen, E. J, Olaf C. G Adan, and R. A Samson. 2018. ‘A Study of Natural Fungal-
Based Wood Finishes’. Eindhoven: Technische Universiteit Eindhoven.
Nik, Vahid M., Angela Sasic Kalagasidis, and Erik Kjellström. 2012. ‘Assessment of
Hygrothermal Performance and Mould Growth Risk in Ventilated Attics in Respect to
Possible Climate Changes in Sweden’. Building and Environment, Implications of a
Changing Climate for Buildings, 55 (September): 96–109.
https://doi.org/10.1016/j.buildenv.2012.01.024.
Norbäck, Dan, and Gui-Hong Cai. 2011. ‘Fungal DNA in Hotel Rooms in Europe and Asia—
Associations with Latitude, Precipitation, Building Data, Room Characteristics and
Hotel Ranking’. Journal of Environmental Monitoring 13 (10): 2895–2903.
https://doi.org/10.1039/C1EM10439J.
Nordic Wood Preservation Council. 2012. ‘Nordic Wood Preservation Classes and Product
Requirements for Preservative-Treated Wood. Part 1: Pine and Other Permeable
Softwoods. NWPC Document No. 1: 2013’. http://www.traskydd.com/1.0.2.0/115/1/.
Nussbaum, R. M. 1999. ‘Natural Surface Inactivation of Scots Pine and Norway Spruce
Evaluated by Contact Angle Measurements’. Holz Als Roh- Und Werkstoff 57 (6): 419–
24. https://doi.org/10.1007/s001070050067.
NUTEK. 1993. ‘Trä Och Fukt. R 1993:20’. R 1993:20. Närings- och teknikutvecklingsverket.
93
Ogaki, Mayara B., Rosemary Vieira, Marcelo C. Muniz, Carlos L. Zani, Tânia M. A. Alves,
Policarpo A. S. Junior, Silvane M. F. Murta, et al. 2020. ‘Diversity, Ecology, and
Bioprospecting of Culturable Fungi in Lakes Impacted by Anthropogenic Activities in
Maritime Antarctica’. Extremophiles 24 (4): 637–55. https://doi.org/10.1007/s00792-
020-01183-z.
Olofsson, Madelen A., and Dan Bylund. 2016. ‘Liquid Chromatography with Electrospray
Ionization and Tandem Mass Spectrometry Applied in the Quantitative Analysis of
Chitin-Derived Glucosamine for a Rapid Estimation of Fungal Biomass in Soil’.
International Journal of Analytical Chemistry 2016 (February): e9269357.
https://doi.org/10.1155/2016/9269357.
Olsen, Kurt K., and Elmer L. Schmidt. 1994. ‘An Attempt to Quantify Relative Mycelial
Development of Phanerochaete Chrysosporium Using the Fluorescein Diacetate
Spectrophotometric Assay’. Mycologia 86 (6): 741–42.
https://doi.org/10.1080/00275514.1994.12026478.
Olsson, Lars. 2019. ‘FUKTSÄKERHET VID KL-TRÄBYGGANDE UTAN VÄDERSKYDD
Fallstudie, Fältmätningar Och Intervjuer’. 13548. SBUF&RISE.
Ovaskainen, Otso, Nerea Abrego, Panu Somervuo, Isabella Palorinne, Bess Hardwick, Juha-
Matti Pitkänen, Nigel R. Andrew, et al. 2020. ‘Monitoring Fungal Communities With
the Global Spore Sampling Project’. Frontiers in Ecology and Evolution 7: 511.
https://doi.org/10.3389/fevo.2019.00511.
Popescu, Carmen-Mihaela, Parviz Navi, María Inés Placencia Peña, and Maria-Cristina
Popescu. 2018. ‘Structural Changes of Wood during Hydro-Thermal and Thermal
Treatments Evaluated through NIR Spectroscopy and Principal Component Analysis’.
Spectrochimica Acta Part A: Molecular and Biomolecular Spectroscopy 191
(February): 405–12. https://doi.org/10.1016/j.saa.2017.10.045.
Porep, Jan U., Martin E. Erdmann, Adrian Körzendörfer, Dietmar R. Kammerer, and Reinhold
Carle. 2014. ‘Rapid Determination of Ergosterol in Grape Mashes for Grape Rot
Indication and Further Quality Assessment by Means of an Industrial near
Infrared/Visible (NIR/VIS) Spectrometer – A Feasibility Study’. Food Control 43
(September): 142–49. https://doi.org/10.1016/j.foodcont.2014.03.008.
Pouliot, Jill M., Ian Walton, Matthew Nolen-Parkhouse, Laila I. Abu-Lail, and Terri A.
Camesano. 2005. ‘Adhesion of Aureobasidium Pullulans Is Controlled by Uronic Acid
94
Based Polymers and Pullulan’. Biomacromolecules 6 (2): 1122–31.
https://doi.org/10.1021/bm0492935.
Pypker, Thomas G., Michael H. Unsworth, John T. Van Stan, and Barbara J. Bond. 2017. ‘The
Absorption and Evaporation of Water Vapor by Epiphytes in an Old-Growth Douglas-
Fir Forest during the Seasonal Summer Dry Season: Implications for the Canopy Energy
Budget: Impact of Epiphytes on the Canopy Hydrology of Douglas-Fir Forests’.
Ecohydrology 10 (3): e1801. https://doi.org/10.1002/eco.1801.
Råberg, Ulrika, Marie-Louise Edlund, Nasko Terziev, and Carl Johan Land. 2005. ‘Testing and
Evaluation of Natural Durability of Wood in above Ground Conditions in Europe – an
Overview’. Journal of Wood Science 51 (5): 429–40. https://doi.org/10.1007/s10086-
005-0717-8.
Roilides, E., and E. Iosifidis. 2019. ‘Acquired Resistance in Fungi: How Large Is the Problem?’
Clinical Microbiology and Infection 25 (7): 790–91.
https://doi.org/10.1016/j.cmi.2019.02.018.
Rowell, Roger M., ed. 2005. Handbook of Wood Chemistry and Wood Composites. Boca Raton,
Fla: CRC Press.
Rowell, Roger M. 2021. ‘Understanding Wood Surface Chemistry and Approaches to
Modification: A Review’. Polymers 13 (15): 2558.
https://doi.org/10.3390/polym13152558.
Sablík, Pavel, Kyriaki Giagli, Petr Pařil, Jan Baar, and Peter Rademacher. 2016. ‘Impact of
Extractive Chemical Compounds from Durable Wood Species on Fungal Decay after
Impregnation of Nondurable Wood Species’. European Journal of Wood and Wood
Products 74 (2): 231–36. https://doi.org/10.1007/s00107-015-0984-z.
Saha, Jean-Bosco Tchinda, Daouda Abia, Stéphane Dumarçay, Maurice Kor Ndikontar,
Philippe Gérardin, Joseph Ngamveng Noah, and Dominique Perrin. 2013. ‘Antioxidant
Activities, Total Phenolic Contents and Chemical Compositions of Extracts from Four
Cameroonian Woods: Padouk (Pterocarpus Soyauxii Taubb), Tali (Erythrophleum
Suaveolens), Moabi (Baillonella Toxisperma), and Movingui (Distemonanthus
Benthamianus)’. Industrial Crops and Products 41 (January): 71–77.
https://doi.org/10.1016/j.indcrop.2012.04.012.
Salminen, Esa, Risto Valo, Maarit Korhonen, and Rikard Jernlås. 2014. ‘Wood Preservation
with Chemicals’. Nordisk Ministerråd. https://doi.org/10.6027/TN2014-550.
95
Sandak, Anna, Silvia Ferrari, Jakub Sandak, Ottaviano Allegretti, Nasko Terziev, and
Mariapaola Riggio. 2013. ‘Monitoring of Wood Decay by near Infrared Spectroscopy’.
Advanced Materials Research 778: 802–9.
https://doi.org/10.4028/www.scientific.net/AMR.778.802.
Sandak, Anna, Sandak, Jakub and Meder, Roger. 2016. ‘Tutorial: Assessing Trees, Wood and
Derived Products with near Infrared Spectroscopy: Hints and Tips’. Journal of Near
Infrared Spectroscopy 24 (6): 485. https://doi.org/10.1255/jnirs.1255.
Sandak, Jakub, Anna Sandak, and Ottaviano Allegretti. 2016. ‘Chemical Changes to Woody
Polymers Due to High-Temperature Thermal Treatment Assessed with near Infrared
Spectroscopy’. Journal of Near Infrared Spectroscopy 24 (6): 555–62.
https://doi.org/10.1255/jnirs.1220.
Sandberg, Dick. 2021. Wood Modification Technologies: Principles, Sustainability, and the
Need for Innovation. First edition. Boca Raton: CRC Press/Taylor & Francis Group.
Šantl-Temkiv, Tina, Branko Sikoparija, Teruya Maki, Federico Carotenuto, Pierre Amato,
Maosheng Yao, Cindy E. Morris, et al. 2020. ‘Bioaerosol Field Measurements:
Challenges and Perspectives in Outdoor Studies’. Aerosol Science and Technology 54
(5): 520–46. https://doi.org/10.1080/02786826.2019.1676395.
SCAN. 2003. ‘CM 49:03. Wood Chips for Pulp Production and Pulp - Content of Acetone-
Soluble Matter’. PFI.
Scheffer, Theodore C. 1971. ‘A Climate Index for Estimating Potential for Decay in Wood
Structures Above Ground’. Forest Products Journal 21 (10): 25–31.
Schindelin, Johannes, Ignacio Arganda-Carreras, Erwin Frise, Verena Kaynig, Mark Longair,
Tobias Pietzsch, Stephan Preibisch, et al. 2012. ‘Fiji: An Open-Source Platform for
Biological-Image Analysis’. Nature Methods 9 (7): 676–82.
https://doi.org/10.1038/nmeth.2019.
Schultz, Tor P., and American Chemical Society, eds. 2008. Development of Commercial Wood
Preservatives: Efficacy, Environmental, and Health Issues. ACS Symposium Series
982. Washington, DC : [New York]: American Chemical Society ; Distributed by
Oxford University Press.
Schwanninger, Manfrred, Rodrigues Jose Carlos, and Fackler Karin. 2011. ‘A Review of Band
Assignments in near Infrared Spectra of Wood and Wood Components’. Journal of
Near Infrared Spectroscopy 19 (5): 287–308. https://doi.org/10.1255/jnirs.955.
96
Segers, F.j.j., K.a. van Laarhoven, H.a.b. Wösten, and J. Dijksterhuis. 2017. ‘Growth of Indoor
Fungi on Gypsum’. Journal of Applied Microbiology 123 (2): 429–35.
https://doi.org/10.1111/jam.13487.
Sehlstedt-Persson, Margot. 2008. ‘Impact of Drying and Heat Treatment on Physical Properties
and Durability of Solid Wood’. Doctoral thesis, Luleå: Luleå tekniska universitet.
http://pure.ltu.se/portal/en/publications/impact-of-drying-and-heat-treatment-on-
physical-properties-and-durability-of-solid-wood(187a1050-9c37-11dd-94de-
000ea68e967b)/export.html.
Sehlstedt-Persson, Margot, and Olov Karlsson. 2010. ‘NATURAL DURABILITY AND
PHENOLIC CONTENT IN DRIED SCOTS PINE HEARTWOOD’. BioResources 5
(2): 1126–42. https://doi.org/10.15376/biores.5.2.1126-1142.
Sehlstedt-Persson, Margot, Olov Karlsson, Thomas Wamming, and Tom Morèn. 2011. ‘Mold
Growth on Sapwood Boards Exposed Outdoors: The Impact of Wood Drying’. Forest
Products Journal 61 (2): 170–79. https://doi.org/10.13073/0015-7473-61.2.170.
Sehlstedt-Persson, Margot, and Thomas Wamming. 2010. ‘Wood Drying Process: Impact on
Scots Pine Lumber Durability’. Journal of Wood Science 56 (1): 25–32.
https://doi.org/10.1007/s10086-009-1066-9.
Shaughnessy, Richard J., Eugene C. Cole, Demetrios Moschandreas, and Ulla Haverinen-
Shaughnessy. 2013. ‘ATP as a Marker for Surface Contamination of Biological Origin
in Schools and as a Potential Approach to the Measurement of Cleaning Effectiveness’.
Journal of Occupational and Environmental Hygiene 10 (6): 336–46.
https://doi.org/10.1080/15459624.2013.784633.
SIS. 2004. ‘SS-EN 1995-1-1:2004. Eurokod 5: Dimensionering av träkonstruktioner - Del 1-1:
Allmänt - Gemensamma regler och regler för byggnader’. Svenska institutet för
standarder, SIS. 2004. http://www.sis.se/produkter/byggnadsmaterial-och-
byggnader/byggnadsindustrin/tekniska-aspekter/ssen19951120042/
SIS. 2009. ‘Standard - Träskydd - Bestämning av skyddsverkan mot mögelröta och andra
mikroorganismer SS-ENV 807:2009’. Svenska institutet för standarder, SIS. 2009.
http://www.sis.se/produkter/kemiteknik-3b58b2e7/produkter-fran-kemisk-
industri/traskyddande-kemikalier/ssenv8072009/.
SIS. 2011. ‘Standard - Träskydd - Bestämning av den förebyggande skyddseffekten hos trä
behandlat mot blånad - Provning (Laboratoriemetod) SS-EN 152:2011’. Svenska
97
institutet för standarder, SIS. 2011. http://www.sis.se/produkter/kemiteknik-
3b58b2e7/produkter-fran-kemisk-industri/traskyddande-kemikalier/ssen1522011/.
SIS. 2014. ‘SS-EN 16492:2014. Paints and Varnishes - Evaluation of the Surface Disfigurement
Caused by Fungi and Algae on Coatings (Standard - Färg Och Lack - Utvärdering Av
Ytstörningar Orsakade Av Svampar Och Alger)’. 2014.
https://www.sis.se/produkter/fargindustrin/farg-och-lack/ssen164922014/.
SIS. 2014. ‘EN 252:2014 - Field Test Method for Determining the Relative Protective
Effectiveness of a Wood Preservative in Ground Contact’. SIS.
https://standards.iteh.ai/catalog/standards/cen/05a0cb9f-8790-48ee-bd8f-
5a367a24a086/en-252-2014.
SIS. 2014. ‘Standard - Färg Och Lack - Laboratoriemetod För Provning Av Effekten Mot
Svamptillväxt Hos Konserveringsmedel i Ytbeläggningar SS-EN 15457:2014 - SIS.Se’.
2014. https://www.sis.se/produkter/fargindustrin/farg-och-lack/ssen154572014/.
SIS. 2016. ‘SS-EN 350:2016. Trä och träbaserade produkters beständighet - Provning och
klassificering av beständighet mot biologisk nedbrytning hos trä och träbaserade
material’. Svenska institutet för standarder, SIS. 2016.
http://www.sis.se/produkter/trateknik-15e6ae2b/tra-sagtimmer-och-sagat-
virke/ssen3502016/.
SIS. 2017. ‘SIS-CEN/TR 16816:2016. End Use Performance of Wood Products -Utilization
and Improvement of Existing Methods to Estimate Servive Life Slutanvä’.
https://www.sis.se/api/document/preview/8022403/.
SIS. 2020a. ‘Standard - Träskydd - Provningsmetod mot träförstörande rötsvampar - Del 1:
Bedömning av den förebyggande effektiviteten hos träskyddsmedel SS-EN 113-
1:2020’. Svenska institutet för standarder, SIS. 2020.
http://www.sis.se/produkter/kemiteknik-3b58b2e7/produkter-fran-kemisk-
industri/traskyddande-kemikalier/ss-en-113-12020/.
SIS. 2020b. ‘Standard - Träskydd - Provningsmetod mot träförstörande rötsvampar - Del 2:
Bedömning av inneboende eller tillförd, förbättrad beständighet SS-EN 113-2:2020’.
Svenska institutet för standarder, SIS. 2020. http://www.sis.se/produkter/kemiteknik-
3b58b2e7/produkter-fran-kemisk-industri/traskyddande-kemikalier/ss-en-113-22020/.
Sithole, Bruce. 2005. ‘New Method of Measuring the PH of Wood Chips’. 59th Appita Annual
Conference and Exhibition: Incorporating the 13th ISWFPC (International Symposium
98
on Wood, Fibre and Pulping Chemistry), Auckland, New Zealand, 16-19 May 2005:
Proceedings, 391.
http://search.informit.com.au/documentSummary;dn=343790673708079;res=IELENG
.
Sjöström, Eero, and Raimo Alén. 1999. Analytical Methods in Wood Chemistry, Pulping, and
Papermaking. Berlin, Heidelberg: Springer Berlin Heidelberg.
http://dx.doi.org/10.1007/978-3-662-03898-7.
Skanser Lisa. 2020. ‘Rapport 2020:44. STAVSPÅN I VÄSTERÅS STIFT. Inventering Av
Spåntäckta Tak Och Fasader’. Stiftelsen Kulturmiljövård samt Strängnäs och Västerås
stift.
https://www.svenskakyrkan.se/filer/556588/KM2020_44_V%c3%a4ster%c3%a5s%2
0stift.pdf.
Skelleftea Commune. 2021. ‘Välkommen till Sara Kulturhus i Skellefteå’. Din guide till
Skellefteå | Allt du behöver veta. 2021. https://www.visitskelleftea.se/sv/sara-
kulturhus/.
Skogsindustrierna. 2021. ‘Statistik - Sågverksindustrin - Skogsindustrierna’. 2021.
https://www.skogsindustrierna.se/om-skogsindustrin/branschstatistik/sagade-travaror-
produktion-och-handel/.
Song, Zewei, Andrew Vail, M. J. Sadowsky, and Jonathan S. Schilling. 2014. ‘Quantitative
PCR for Measuring Biomass of Decomposer Fungi in Planta’. Fungal Ecology 7
(February): 39–46. https://doi.org/10.1016/j.funeco.2013.12.004.
Stefansson, Petter, Thomas Thiis, Lone Ross Gobakken, and Ingunn Burud. 2021.
‘Hyperspectral NIR Time Series Imaging Used as a New Method for Estimating the
Moisture Content Dynamics of Thermally Modified Scots Pine’. Wood Material
Science & Engineering 16 (1): 49–57. https://doi.org/10.1080/17480272.2020.1772366.
Stevenson, Andrew, Philip G. Hamill, Callum J. O’Kane, Gerhard Kminek, John D. Rummel,
Mary A. Voytek, Jan Dijksterhuis, and John E. Hallsworth. 2017. ‘Aspergillus
Penicillioides Differentiation and Cell Division at 0.585 Water Activity’.
Environmental Microbiology 19 (2): 687–97. https://doi.org/10.1111/1462-2920.13597.
Sundqvist, B., and T. Morén. 2002. ‘The Influence of Wood Polymers and Extractives on Wood
Colour Induced by Hydrothermal Treatment’. Holz Als Roh- Und Werkstoff 60 (5): 375–
76. https://doi.org/10.1007/s00107-002-0320-2.
99
Sundqvist, Bror. 2004. ‘Colour Changes and Acid Formation in Wood during Heating’. DIVA.
http://urn.kb.se/resolve?urn=urn:nbn:se:ltu:diva-26190.
Sundqvist, Bror, Olov Karlsson, and Ulla Westermark. 2006. ‘Determination of Formic-Acid
and Acetic Acid Concentrations Formed during Hydrothermal Treatment of Birch
Wood and Its Relation to Colour, Strength and Hardness’. Wood Science and
Technology 40 (7): 549–61. https://doi.org/10.1007/s00226-006-0071-z.
Swedish Wood. 2021. ‘Wood and Wood-Based Products’. Swedish Wood. 2021.
https://www.swedishwood.com/building-with-wood/construction/wood-and-wood-
based-products/.
Terashima, N. 2013. ‘Diversification of Lignin Supramolecular Structure during the Evolution
of Plants’. Mokuzai Gakkaishi/Journal of the Japan Wood Research Society 59 (2): 65–
80. https://doi.org/10.2488/jwrs.59.65.
Terashima, Noritsugu, Chisato Ko, Yasuyuki Matsushita, and Ulla Westermark. 2016.
‘Monolignol Glucosides as Intermediate Compounds in Lignin Biosynthesis. Revisiting
the Cell Wall Lignification and New 13C-Tracer Experiments with Ginkgo Biloba and
Magnolia Liliiflora’. Holzforschung 70 (9): 801–10. https://doi.org/10.1515/hf-2015-
0224.
Terashima, Noritsugu, Masato Yoshida, Jonas Hafrén, Kazuhiko Fukushima, and Ulla
Westermark. 2012. ‘Proposed Supramolecular Structure of Lignin in Softwood
Tracheid Compound Middle Lamella Regions’. Hfsg 66 (8): 907–15.
https://doi.org/10.1515/hf-2012-0021.
Terziev, Nasko. 2009. ‘Migration of Low-Molecular Sugars and Nitrogenous Compounds in
Pinus Sylvestris L. During Kiln and Air Drying’. Holzforschung - International Journal
of the Biology, Chemistry, Physics and Technology of Wood 49 (6): 565–74.
https://doi.org/10.1515/hfsg.1995.49.6.565.
Terziev, Nasko, and Julius Boutelje. 2007. ‘Effect of Felling Time and Kiln-Drying on Color
and Susceptibility of Wood to Mold and Fungal Stain During an Above-Ground Field
Test’. Wood and Fiber Science 30 (4): 360–67.
https://wfs.swst.org/index.php/wfs/article/view/764.
Terziev, Nasko, Julius Boutelje, and Kjell Larsson. 1997. ‘Seasonal Fluctuations of Low‐
molecular‐weight Sugars, Starch and Nitrogen in Sapwood of Pinus Sylvestris L.’
Scandinavian Journal of Forest Research 12 (2): 216–24.
https://doi.org/10.1080/02827589709355403.
100
Theander, O., J. Bjurman, and J. B. Boutelje. 1993. ‘Increase in the Content of Low-Molecular
Carbohydrates at Lumber Surfaces during Drying and Correlations with Nitrogen
Content, Yellowing and Mould Growth’. Wood Science and Technology 27 (5): 381–
89. https://doi.org/10.1007/BF00192224.
Thumm, Armin, Mark Riddell, Bernadette Nanayakkara, Jonathan Harrington, and Roger
Meder. 2016. ‘Mapping Within-Stem Variation of Chemical Composition by near
Infrared Hyperspectral Imaging’. Journal of Near Infrared Spectroscopy 24 (6): 605–
16. https://doi.org/10.1255/jnirs.1206.
Todorović, Nebojša, Zdravko Popović, Goran Milić, Marko Veizović, and Ranko Popadić.
2020. ‘Quality Evaluation of Heat-Treated Sessile Oak (Quercus Petraea L.) Wood by
Colour and FT-NIR Spectroscopy’. Wood Material Science & Engineering 0 (0): 1–8.
https://doi.org/10.1080/17480272.2020.1847188.
Tournas, Valerie. 1994. ‘Heat-Resistant Fungi of Importance to the Food and Beverage
Industry’. Critical Reviews in Microbiology 20 (4): 243–63.
https://doi.org/10.3109/10408419409113558.
Tsenkova, Roumiana. 2009. ‘Aquaphotomics: Dynamic Spectroscopy of Aqueous and
Biological Systems Describes Peculiarities of Water’. Journal of Near Infrared
Spectroscopy 17 (6): 303–13. https://doi.org/10.1255/jnirs.869.
Tsuchikawa, Satoru. 1998. ‘Non-Traditional Applications of near Infrared Spectroscopy Based
on the Optical Characteristic Models for a Biological Material Having Cellular
Structure’. Journal of Near Infrared Spectroscopy 6 (1): 41–46.
https://doi.org/10.1255/jnirs.119.
Tsuchikawa, Satoru. 2007. ‘A Review of Recent Near Infrared Research for Wood and Paper’.
Applied Spectroscopy Reviews 42 (1): 43–71.
https://doi.org/10.1080/05704920601036707.
Tsuchikawa, Satoru, and Manfred Schwanninger. 2013. ‘A Review of Recent Near-Infrared
Research for Wood and Paper (Part 2)’. Applied Spectroscopy Reviews 48 (7): 560–87.
https://doi.org/10.1080/05704928.2011.621079.
Tsuchikawa, Satoru, and Kaori Yamato. 2003. ‘Discriminant Analysis of Wood-Based
Materials with Weathering Damage by near Infrared Spectroscopy’. Journal of Near
Infrared Spectroscopy 11 (5): 391–99. https://doi.org/10.1255/jnirs.390.
UNECE. 2008. ‘Carbon Storage in Harvested Wood Products (HWP) | UNECE’. 2008.
https://unece.org/forests/carbon-storage-harvested-wood-products-hwp.
101
Verma, Pradeep, Jens Dyckmans, Holger Militz, and Carsten Mai. 2008. ‘Determination of
Fungal Activity in Modified Wood by Means of Micro-Calorimetry and Determination
of Total Esterase Activity’. Applied Microbiology and Biotechnology 80 (1): 125.
https://doi.org/10.1007/s00253-008-1525-z.
Via, Brian K., Lori G. Eckhardt, Chi-Leung So, Todd F. Shupe, Leslie H. Groom, and Michael
Stine. 2007. ‘The Response of Visible/Near Infrared Absorbance to Wood-Staining
Fungi’. Wood and Fiber Science 38 (4): 717–26.
https://wfs.swst.org/index.php/wfs/article/view/37.
Viitanen, H., M. Krus, T. Ojanen, V. Eitner, and D. Zirkelbach. 2015. ‘Mold Risk Classification
Based on Comparative Evaluation of Two Established Growth Models’. Energy
Procedia, 6th International Building Physics Conference, IBPC 2015, 78 (November):
1425–30. https://doi.org/10.1016/j.egypro.2015.11.165.
Viitanen, H., T. Toratti, L. Makkonen, R. Peuhkuri, T. Ojanen, L. Ruokolainen, and J. Räisänen.
2010. ‘Towards Modelling of Decay Risk of Wooden Materials’. European Journal of
Wood and Wood Products 68 (3): 303–13. https://doi.org/10.1007/s00107-010-0450-x.
Viitanen, H.A. 1997. ‘Modelling the Time Factor in the Development of Mould Fungi - The
Effect of Critical Humidity and Temperature Conditions on Pine and Spruce Sapwood’.
Holzforschung 51 (1): 6–14. https://doi.org/10.1515/hfsg.1997.51.1.6.
Wålinder Magnus. 2000. ‘WETTING PHENOMENA ON WOOD Factors Influencing
Measurements of Wood Wettability’. Doctoral Thesis, Stockholm: KTH-Royal Institute
of Technology. http://www.diva-portal.org/smash/get/diva2:8644/FULLTEXT01.pdf.
Weissman, Z., I. Berdicevsky, B. Z. Cavari, and D. Kornitzer. 2000. ‘The High Copper
Tolerance of Candida Albicans Is Mediated by a P-Type ATPase’. Proceedings of the
National Academy of Sciences of the United States of America 97 (7): 3520–25.
Willför, Stefan, and Bjarne Holmbom. 2004. ‘Isolation and Characterisation of Water Soluble
Polysaccharides from Norway Spruce and Scots Pine’. Wood Science and Technology
38 (3): 173–79. https://doi.org/10.1007/s00226-003-0200-x.
Williams, Paul J., Paul Geladi, Trevor J. Britz, and Marena Manley. 2012a. ‘Investigation of
Fungal Development in Maize Kernels Using NIR Hyperspectral Imaging and
Multivariate Data Analysis’. Journal of Cereal Science 55 (3): 272–78.
https://doi.org/10.1016/j.jcs.2011.12.003.
Williams. 2012b. ‘Near-Infrared (NIR) Hyperspectral Imaging and Multivariate Image
Analysis to Study Growth Characteristics and Differences between Species and Strains
102
of Members of the Genus Fusarium’. Analytical and Bioanalytical Chemistry 404 (6):
1759–69. https://doi.org/10.1007/s00216-012-6313-z.
Williams. 2012c. ‘Growth Characteristics of Three Fusarium Species Evaluated by Near-
Infrared Hyperspectral Imaging and Multivariate Image Analysis’. Applied
Microbiology and Biotechnology 96 (3): 803–13. https://doi.org/10.1007/s00253-012-
4380-x.
Windeisen, E., C. Strobel, and G. Wegener. 2007. ‘Chemical Changes during the Production of
Thermo-Treated Beech Wood’. Wood Science and Technology 41 (6): 523–36.
https://doi.org/10.1007/s00226-007-0146-5.
Workman, Jerry, and Lois Weyer. 2012. Practical Guide and Spectral Atlas for Interpretive
Near-Infrared Spectroscopy. 2nd ed. Boca Raton ; London: CRC Press.
Xyhlo Biofinish. 2021. ‘About Xyhlo Biofinish, Sustainable & Eco-Friendly’. 2021
https://www.xyhlo.com/en/bio-finish/.
Zabel, R. A, and Jeffrey J Morrell. 1992. Wood Microbiology: Decay and Its Prevention.
Oxford: Elsevier Science. http://www.123library.org/book_details/?id=64941.
Zabel, Robert A., and Jeffrey J. Morrell. 2020. Wood Microbiology: Decay and Its Prevention.
Second Edition. San Diego: Elsevier Science Publishing Co. Inc.
Zeeshan 2016. English: Conidia Formation Image. Own work.
https://commons.wikimedia.org/wiki/File:Conidia_Formation_Image.png.
Žlahtič, Mojca, and Miha Humar. 2016. ‘Influence of Artificial and Natural Weathering on the
Hydrophobicity and Surface Properties of Wood’. BioResources 11 (2): 4964-4989–
4989. https://doi.org/10.15376/biores.11.2.4964-4989.

Paper I

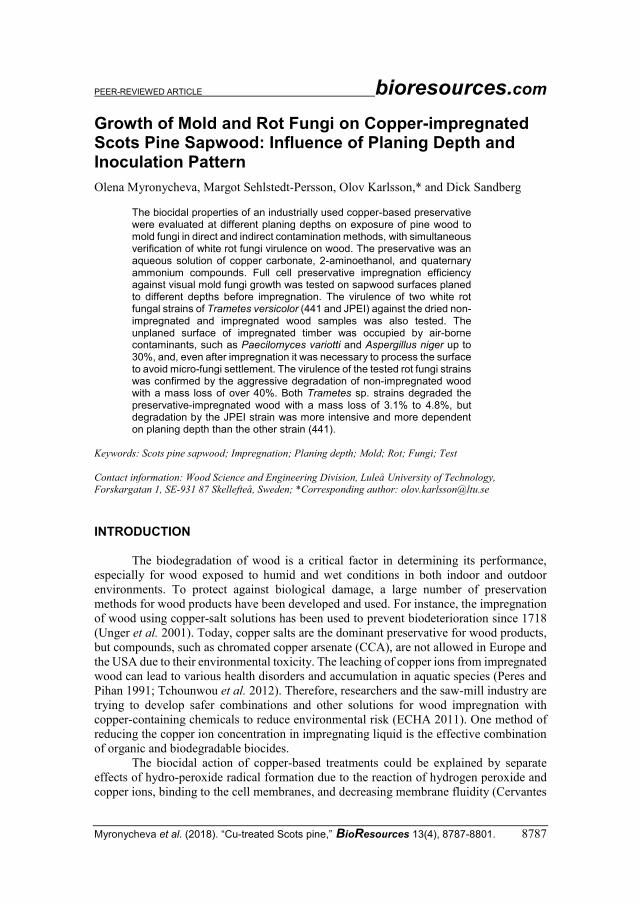
PEER-REVIEWED ARTICLE bioresources.com
Myronycheva et al. (2018). “Cu-treated Scots pine,” BioResources 13(4), 8787-8801. 8787
Growth of Mold and Rot Fungi on Copper-impregnated Scots Pine Sapwood: Influence of Planing Depth and Inoculation Pattern
Olena Myronycheva, Margot Sehlstedt-Persson, Olov Karlsson,* and Dick Sandberg
The biocidal properties of an industrially used copper-based preservative were evaluated at different planing depths on exposure of pine wood to mold fungi in direct and indirect contamination methods, with simultaneous verification of white rot fungi virulence on wood. The preservative was an aqueous solution of copper carbonate, 2-aminoethanol, and quaternary ammonium compounds. Full cell preservative impregnation efficiency against visual mold fungi growth was tested on sapwood surfaces planed to different depths before impregnation. The virulence of two white rot fungal strains of Trametes versicolor (441 and JPEI) against the dried non-impregnated and impregnated wood samples was also tested. The unplaned surface of impregnated timber was occupied by air-borne contaminants, such as Paecilomyces variotti and Aspergillus niger up to 30%, and, even after impregnation it was necessary to process the surface to avoid micro-fungi settlement. The virulence of the tested rot fungi strains was confirmed by the aggressive degradation of non-impregnated wood with a mass loss of over 40%. Both Trametes sp. strains degraded the preservative-impregnated wood with a mass loss of 3.1% to 4.8%, but degradation by the JPEI strain was more intensive and more dependent on planing depth than the other strain (441).
Keywords: Scots pine sapwood; Impregnation; Planing depth; Mold; Rot; Fungi; Test
Contact information: Wood Science and Engineering Division, Luleå University of Technology,
Forskargatan 1, SE-931 87 Skellefteå, Sweden; *Corresponding author: [email protected]
INTRODUCTION
The biodegradation of wood is a critical factor in determining its performance,
especially for wood exposed to humid and wet conditions in both indoor and outdoor
environments. To protect against biological damage, a large number of preservation
methods for wood products have been developed and used. For instance, the impregnation
of wood using copper-salt solutions has been used to prevent biodeterioration since 1718
(Unger et al. 2001). Today, copper salts are the dominant preservative for wood products,
but compounds, such as chromated copper arsenate (CCA), are not allowed in Europe and
the USA due to their environmental toxicity. The leaching of copper ions from impregnated
wood can lead to various health disorders and accumulation in aquatic species (Peres and
Pihan 1991; Tchounwou et al. 2012). Therefore, researchers and the saw-mill industry are
trying to develop safer combinations and other solutions for wood impregnation with
copper-containing chemicals to reduce environmental risk (ECHA 2011). One method of
reducing the copper ion concentration in impregnating liquid is the effective combination
of organic and biodegradable biocides.
The biocidal action of copper-based treatments could be explained by separate
effects of hydro-peroxide radical formation due to the reaction of hydrogen peroxide and
copper ions, binding to the cell membranes, and decreasing membrane fluidity (Cervantes
PEER-REVIEWED ARTICLE bioresources.com
Myronycheva et al. (2018). “Cu-treated Scots pine,” BioResources 13(4), 8787-8801. 8788
and Gutierrez-Corona 1994; Suwalsky et al. 1998; Borkow and Gabbay 2005). However,
some fungi have developed systems to overcome the biocidal action of copper-salt
preservatives. The general mechanisms of fungal resistance to heavy metals proposed by
Nies (1999) suggest decreasing the concentration of heavy metals in wood via effluxion of
such compounds, resulting in isolation by creating complex compounds or reduction to a
less toxic (oxidation) state. After several years of research, it was found that such a
treatment is only partially effective with soft rots, whereas brown rot fungi Fibroporia
radiculosa can detoxify copper compounds by forming oxalates (Ohno et al. 2015). As a
part of global geochemical processes, fungi can leach, recover, detoxify, and remediate
metal compounds (Gadd 2017).
Primary wood-colonizing fungi are a number of ascomycetes (deuteromycetes) and
basidiomycetes, which are initially transmitted by air to wood surfaces. The ascomycetes
on wood decompose mainly cellulosic fractions when basidiomycetes or rot fungi
decompose lignino-cellulosic matrix of wood (Crous et al. 2018). The spores germinate
under favorable moisture conditions in the presence of low-molecular nutrients. Rot fungi
usually invade wood at later stages of decomposition from soil or insect contamination
(Zabel and Morrell 1992). The diversity of fungi is enormous, but mold fungi associated
with bio-based building materials are restricted to air-borne, xerotolerant, or xerophilic
types. Most of these fungi are also clinically important, as they are known to be mycotoxin
producers (Samson and Houbraken 2010) and can cause substantial deterioration in indoor
environments. The physical and chemical properties of wood surfaces and the surrounding
humidity are the main factors that determine the suitability of conditions for fungal
development. Wood surface conditions are influenced by the migration of extractives
towards the surface during the drying process and enrichment of the surface by soluble
nutrients required for the growth of microorganisms (Terziev and Nilsson 2005; Terziev
and Boutelje 2007; Terziev 2009).
Pressure impregnation, like the full-cell, Lowry, and Rüping methods, is the most
common way to treat pine sapwood boards with solutions of copper salts (Reinprecht
2016). During impregnation the preservative penetrates into the wood via various pore
systems (Ahmed et al. 2012) and is assisted by a pressure gradient of between 10 bars and
15 bars. The copper-salt complexes are also believed to be able to move into the cell wall
of wood through a diffusion process. The ability of copper ions and ethanolamine to form
strong interactions with phenols and carboxylic acids in the wood stabilizes the structure
(Ruddick et al. 2005; Zhang and Kamdem 2007). However, the impregnation process
sometimes fails when there is an uneven distribution of chemicals in the cell structure due
to the morphological nature of wood, the extractives, and the relocation of the extractives
during the drying process before impregnation as was studied by using histochemical
methods (Ahmed et al. 2012).
Various test methods have been designed to evaluate bio-based building materials
with respect to their vulnerability to fungal damage in various applications. The reliability
and variation within the results of such tests are discussed widely, especially when
evaluating mold tests (Kutnik et al. 2014). The majority of studies of vulnerability of
building material to fungal growth focused on influence of temperature and relative
humidity in different combinations but not to properties of material itself and relevant
processing technologies such as drying and planning. The hypothesis proposed in this work
is that by removal of wood surface material enriched with migrated nutrients together with
impregnated biocides it is possible to lower fungal growth and increase durability of wood
material. Therefore, this study aims to explore the impregnation efficiency by studies on
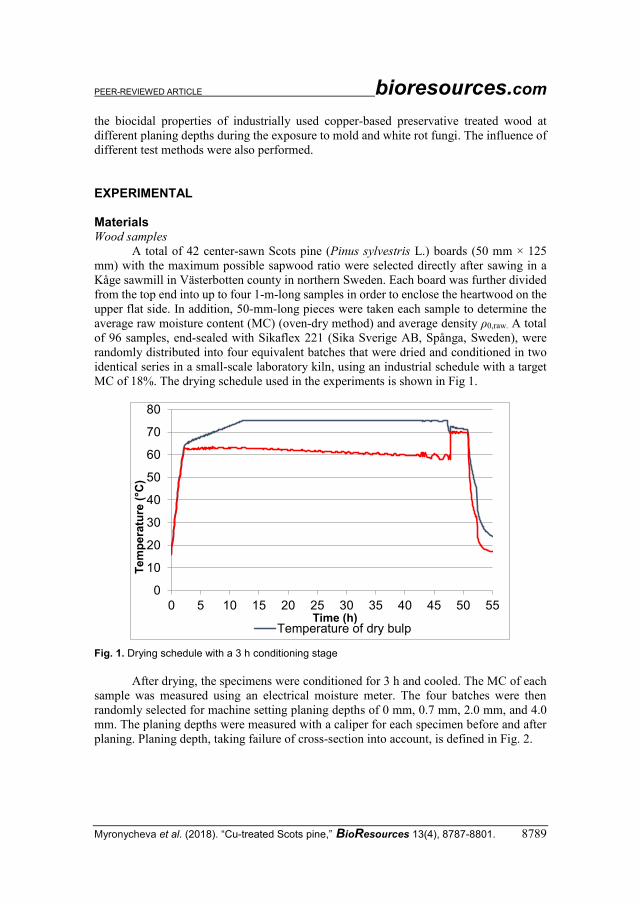
PEER-REVIEWED ARTICLE bioresources.com
Myronycheva et al. (2018). “Cu-treated Scots pine,” BioResources 13(4), 8787-8801. 8789
the biocidal properties of industrially used copper-based preservative treated wood at
different planing depths during the exposure to mold and white rot fungi. The influence of
different test methods were also performed.
EXPERIMENTAL Materials Wood samples
A total of 42 center-sawn Scots pine (Pinus sylvestris L.) boards (50 mm × 125
mm) with the maximum possible sapwood ratio were selected directly after sawing in a
Kåge sawmill in Västerbotten county in northern Sweden. Each board was further divided
from the top end into up to four 1-m-long samples in order to enclose the heartwood on the
upper flat side. In addition, 50-mm-long pieces were taken each sample to determine the
average raw moisture content (MC) (oven-dry method) and average density ρ0,raw. A total
of 96 samples, end-sealed with Sikaflex 221 (Sika Sverige AB, Spånga, Sweden), were
randomly distributed into four equivalent batches that were dried and conditioned in two
identical series in a small-scale laboratory kiln, using an industrial schedule with a target
MC of 18%. The drying schedule used in the experiments is shown in Fig 1.
Fig. 1. Drying schedule with a 3 h conditioning stage
After drying, the specimens were conditioned for 3 h and cooled. The MC of each
sample was measured using an electrical moisture meter. The four batches were then
randomly selected for machine setting planing depths of 0 mm, 0.7 mm, 2.0 mm, and 4.0
mm. The planing depths were measured with a caliper for each specimen before and after
planing. Planing depth, taking failure of cross-section into account, is defined in Fig. 2.
0
10
20
30
40
50
60
70
80
0 5 10 15 20 25 30 35 40 45 50 55
Tem
pera
ture
(°C
)
Time (h)Temperature of dry bulp
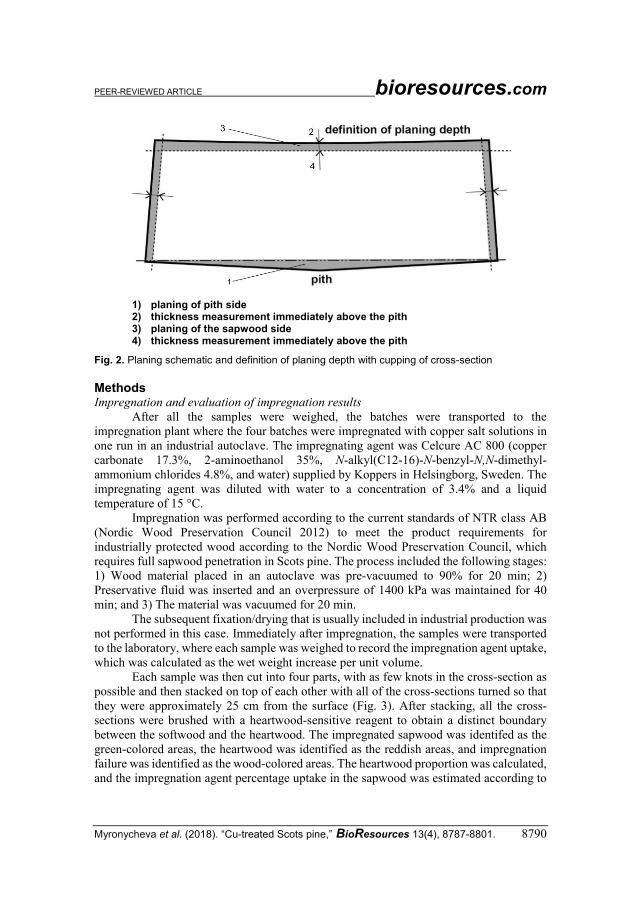
PEER-REVIEWED ARTICLE bioresources.com
Myronycheva et al. (2018). “Cu-treated Scots pine,” BioResources 13(4), 8787-8801. 8790
1) planing of pith side 2) thickness measurement immediately above the pith 3) planing of the sapwood side 4) thickness measurement immediately above the pith
Fig. 2. Planing schematic and definition of planing depth with cupping of cross-section
Methods Impregnation and evaluation of impregnation results
After all the samples were weighed, the batches were transported to the
impregnation plant where the four batches were impregnated with copper salt solutions in
one run in an industrial autoclave. The impregnating agent was Celcure AC 800 (copper
carbonate 17.3%, 2-aminoethanol 35%, N-alkyl(C12-16)-N-benzyl-N,N-dimethyl-
ammonium chlorides 4.8%, and water) supplied by Koppers in Helsingborg, Sweden. The
impregnating agent was diluted with water to a concentration of 3.4% and a liquid
temperature of 15 °C.
Impregnation was performed according to the current standards of NTR class AB
(Nordic Wood Preservation Council 2012) to meet the product requirements for
industrially protected wood according to the Nordic Wood Preservation Council, which
requires full sapwood penetration in Scots pine. The process included the following stages:
1) Wood material placed in an autoclave was pre-vacuumed to 90% for 20 min; 2)
Preservative fluid was inserted and an overpressure of 1400 kPa was maintained for 40
min; and 3) The material was vacuumed for 20 min.
The subsequent fixation/drying that is usually included in industrial production was
not performed in this case. Immediately after impregnation, the samples were transported
to the laboratory, where each sample was weighed to record the impregnation agent uptake,
which was calculated as the wet weight increase per unit volume.
Each sample was then cut into four parts, with as few knots in the cross-section as
possible and then stacked on top of each other with all of the cross-sections turned so that
they were approximately 25 cm from the surface (Fig. 3). After stacking, all the cross-
sections were brushed with a heartwood-sensitive reagent to obtain a distinct boundary
between the softwood and the heartwood. The impregnated sapwood was identifed as the
green-colored areas, the heartwood was identified as the reddish areas, and impregnation
failure was identified as the wood-colored areas. The heartwood proportion was calculated,
and the impregnation agent percentage uptake in the sapwood was estimated according to
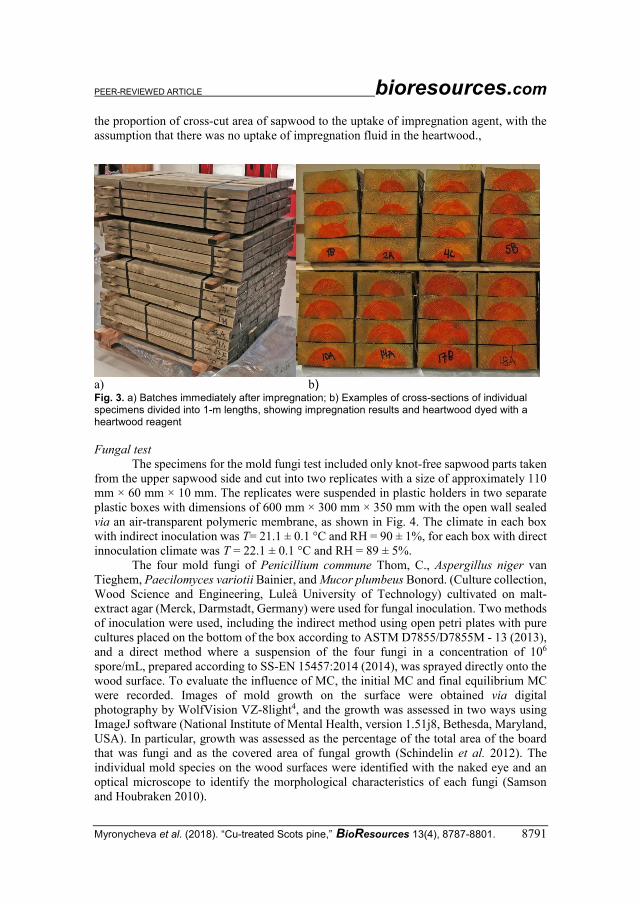
PEER-REVIEWED ARTICLE bioresources.com
Myronycheva et al. (2018). “Cu-treated Scots pine,” BioResources 13(4), 8787-8801. 8791
the proportion of cross-cut area of sapwood to the uptake of impregnation agent, with the
assumption that there was no uptake of impregnation fluid in the heartwood.,
a) b) Fig. 3. a) Batches immediately after impregnation; b) Examples of cross-sections of individual specimens divided into 1-m lengths, showing impregnation results and heartwood dyed with a heartwood reagent
Fungal test
The specimens for the mold fungi test included only knot-free sapwood parts taken
from the upper sapwood side and cut into two replicates with a size of approximately 110
mm × 60 mm × 10 mm. The replicates were suspended in plastic holders in two separate
plastic boxes with dimensions of 600 mm × 300 mm × 350 mm with the open wall sealed
via an air-transparent polymeric membrane, as shown in Fig. 4. The climate in each box
with indirect inoculation was T= 21.1 ± 0.1 °C and RH = 90 ± 1%, for each box with direct
innoculation climate was T = 22.1 ± 0.1 °C and RH = 89 ± 5%.
The four mold fungi of Penicillium commune Thom, C., Aspergillus niger van
Tieghem, Paecilomyces variotii Bainier, and Mucor plumbeus Bonord. (Culture collection,
Wood Science and Engineering, Luleå University of Technology) cultivated on malt-
extract agar (Merck, Darmstadt, Germany) were used for fungal inoculation. Two methods
of inoculation were used, including the indirect method using open petri plates with pure
cultures placed on the bottom of the box according to ASTM D7855/D7855M - 13 (2013),
and a direct method where a suspension of the four fungi in a concentration of 106
spore/mL, prepared according to SS-EN 15457:2014 (2014), was sprayed directly onto the
wood surface. To evaluate the influence of MC, the initial MC and final equilibrium MC
were recorded. Images of mold growth on the surface were obtained via digital
photography by WolfVision VZ-8light4, and the growth was assessed in two ways using
ImageJ software (National Institute of Mental Health, version 1.51j8, Bethesda, Maryland,
USA). In particular, growth was assessed as the percentage of the total area of the board
that was fungi and as the covered area of fungal growth (Schindelin et al. 2012). The
individual mold species on the wood surfaces were identified with the naked eye and an
optical microscope to identify the morphological characteristics of each fungi (Samson
and Houbraken 2010).

PEER-REVIEWED ARTICLE bioresources.com
Myronycheva et al. (2018). “Cu-treated Scots pine,” BioResources 13(4), 8787-8801. 8792
a) b) Fig. 4. Mold growth tests: a) indirect and b) direct methods
Two white rot strains (441 and JPEI) of Trametes versicolor (L.) Lloyd were
obtained from the Aloha Medicinals Mushroom Culture Bank in Carson City, NV, USA.
All the cultures were stored on solidified malt extract agar at 4 °C ± 1 °C with visual control
of their purity and activity. The virulence of each fungal strain was assessed by the mass
loss of the treated and non-treated wood samples, determined according to the SS-EN 113
(1996) standard with each sample having dimensions of 30 mm × 15 mm × 5 mm. The
experimental design and test methods are explained in the Table 1.
Table 1. Experimental Design
Experiment Test method Number of replicates at planning depth
Group 1
(0 mm)
Group 2 (0.7 mm)
Group 3 (2.3 mm)
Group 4 (4.0 mm)
Mould test
ASTM D7855/D7855M-13 5 5 5 5
SS-EN 15457:2014 5 5 5 5
Rot test
SS-EN 113 Trametes versicolor 441
20 20 20 20
SS-EN 113 Trametes versicolor JPEI
20 20 20 20
A complete data matrix for the mold test comprising of totally 40 observations (2
methods × 4 groups × 5 replicates) was obtained for each treatment method (indirect and
direct contamination) and each group (planing depth).
The analysis of the white rot test included a data matrix for the dry mass loss from
totally 200 observations (2 fungi × 5 batches × 20 replicates). A univariate analysis was
performed to study the influence of the planing depth on fungal growth after impregnation
by comparing their mean differences using IBM SPSS Statistics 20.0 (Armonk, NY, USA)
software. This approach makes it possible to summarize and compare differences across
one or more factors, or categorical variables.
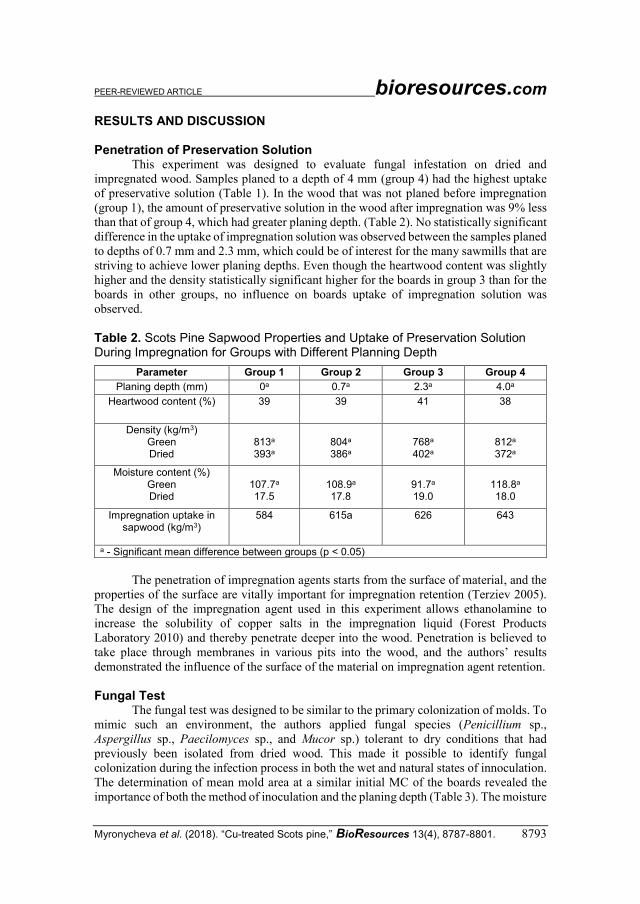
PEER-REVIEWED ARTICLE bioresources.com
Myronycheva et al. (2018). “Cu-treated Scots pine,” BioResources 13(4), 8787-8801. 8793
RESULTS AND DISCUSSION Penetration of Preservation Solution
This experiment was designed to evaluate fungal infestation on dried and
impregnated wood. Samples planed to a depth of 4 mm (group 4) had the highest uptake
of preservative solution (Table 1). In the wood that was not planed before impregnation
(group 1), the amount of preservative solution in the wood after impregnation was 9% less
than that of group 4, which had greater planing depth. (Table 2). No statistically significant
difference in the uptake of impregnation solution was observed between the samples planed
to depths of 0.7 mm and 2.3 mm, which could be of interest for the many sawmills that are
striving to achieve lower planing depths. Even though the heartwood content was slightly
higher and the density statistically significant higher for the boards in group 3 than for the
boards in other groups, no influence on boards uptake of impregnation solution was
observed.
Table 2. Scots Pine Sapwood Properties and Uptake of Preservation Solution During Impregnation for Groups with Different Planning Depth
Parameter Group 1 Group 2 Group 3 Group 4
Planing depth (mm) 0a 0.7a 2.3a 4.0a
Heartwood content (%) 39 39 41 38
Density (kg/m3) Green Dried
813a 393a
804a 386a
768a 402a
812a 372a
Moisture content (%) Green Dried
107.7a 17.5
108.9a 17.8
91.7a 19.0
118.8a 18.0
Impregnation uptake in sapwood (kg/m3)
584 615a 626 643
a - Significant mean difference between groups (p ˂ 0.05)
The penetration of impregnation agents starts from the surface of material, and the
properties of the surface are vitally important for impregnation retention (Terziev 2005).
The design of the impregnation agent used in this experiment allows ethanolamine to
increase the solubility of copper salts in the impregnation liquid (Forest Products
Laboratory 2010) and thereby penetrate deeper into the wood. Penetration is believed to
take place through membranes in various pits into the wood, and the authors’ results
demonstrated the influence of the surface of the material on impregnation agent retention.
Fungal Test The fungal test was designed to be similar to the primary colonization of molds. To
mimic such an environment, the authors applied fungal species (Penicillium sp.,
Aspergillus sp., Paecilomyces sp., and Mucor sp.) tolerant to dry conditions that had
previously been isolated from dried wood. This made it possible to identify fungal
colonization during the infection process in both the wet and natural states of innoculation.
The determination of mean mold area at a similar initial MC of the boards revealed the
importance of both the method of inoculation and the planing depth (Table 3). The moisture
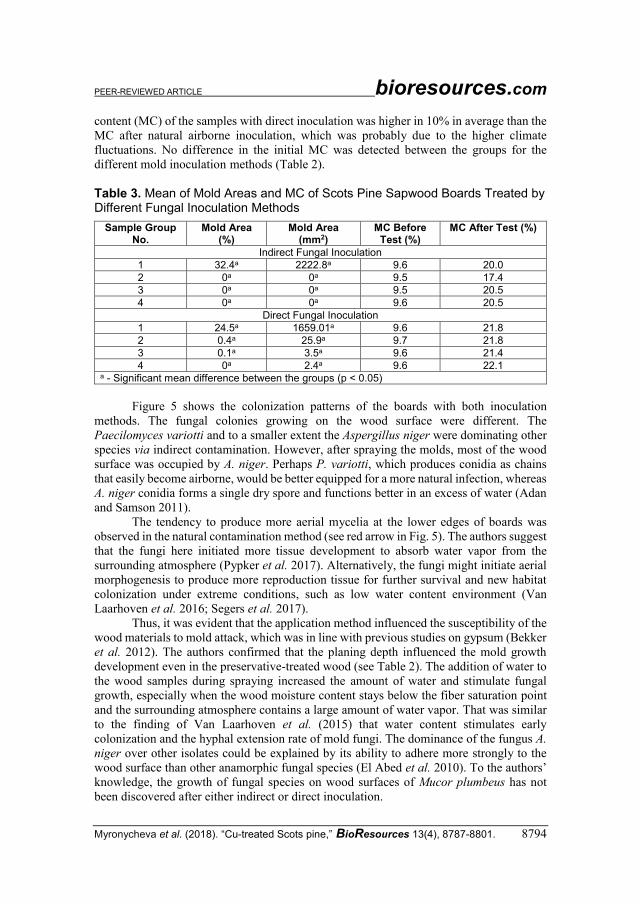
PEER-REVIEWED ARTICLE bioresources.com
Myronycheva et al. (2018). “Cu-treated Scots pine,” BioResources 13(4), 8787-8801. 8794
content (MC) of the samples with direct inoculation was higher in 10% in average than the
MC after natural airborne inoculation, which was probably due to the higher climate
fluctuations. No difference in the initial MC was detected between the groups for the
different mold inoculation methods (Table 2).
Table 3. Mean of Mold Areas and MC of Scots Pine Sapwood Boards Treated by Different Fungal Inoculation Methods
Sample Group No.
Mold Area (%)
Mold Area (mm2)
MC Before Test (%)
MC After Test (%)
Indirect Fungal Inoculation
1 32.4a 2222.8a 9.6 20.0
2 0a 0a 9.5 17.4
3 0a 0a 9.5 20.5
4 0a 0a 9.6 20.5
Direct Fungal Inoculation
1 24.5a 1659.01a 9.6 21.8
2 0.4a 25.9a 9.7 21.8
3 0.1a 3.5a 9.6 21.4
4 0a 2.4a 9.6 22.1 a - Significant mean difference between the groups (p ˂ 0.05)
Figure 5 shows the colonization patterns of the boards with both inoculation
methods. The fungal colonies growing on the wood surface were different. The
Paecilomyces variotti and to a smaller extent the Aspergillus niger were dominating other
species via indirect contamination. However, after spraying the molds, most of the wood
surface was occupied by A. niger. Perhaps P. variotti, which produces conidia as chains
that easily become airborne, would be better equipped for a more natural infection, whereas
A. niger conidia forms a single dry spore and functions better in an excess of water (Adan
and Samson 2011).
The tendency to produce more aerial mycelia at the lower edges of boards was
observed in the natural contamination method (see red arrow in Fig. 5). The authors suggest
that the fungi here initiated more tissue development to absorb water vapor from the
surrounding atmosphere (Pypker et al. 2017). Alternatively, the fungi might initiate aerial
morphogenesis to produce more reproduction tissue for further survival and new habitat
colonization under extreme conditions, such as low water content environment (Van
Laarhoven et al. 2016; Segers et al. 2017).
Thus, it was evident that the application method influenced the susceptibility of the
wood materials to mold attack, which was in line with previous studies on gypsum (Bekker
et al. 2012). The authors confirmed that the planing depth influenced the mold growth
development even in the preservative-treated wood (see Table 2). The addition of water to
the wood samples during spraying increased the amount of water and stimulate fungal
growth, especially when the wood moisture content stays below the fiber saturation point
and the surrounding atmosphere contains a large amount of water vapor. That was similar
to the finding of Van Laarhoven et al. (2015) that water content stimulates early
colonization and the hyphal extension rate of mold fungi. The dominance of the fungus A.
niger over other isolates could be explained by its ability to adhere more strongly to the
wood surface than other anamorphic fungal species (El Abed et al. 2010). To the authors’ knowledge, the growth of fungal species on wood surfaces of Mucor plumbeus has not
been discovered after either indirect or direct inoculation.
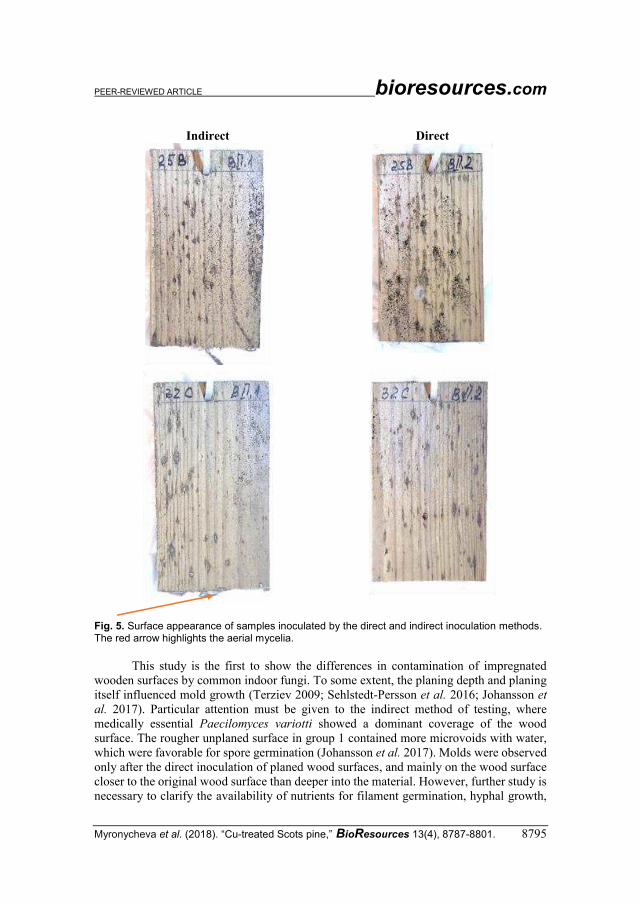
PEER-REVIEWED ARTICLE bioresources.com
Myronycheva et al. (2018). “Cu-treated Scots pine,” BioResources 13(4), 8787-8801. 8795
Fig. 5. Surface appearance of samples inoculated by the direct and indirect inoculation methods. The red arrow highlights the aerial mycelia.
This study is the first to show the differences in contamination of impregnated
wooden surfaces by common indoor fungi. To some extent, the planing depth and planing
itself influenced mold growth (Terziev 2009; Sehlstedt-Persson et al. 2016; Johansson et
al. 2017). Particular attention must be given to the indirect method of testing, where
medically essential Paecilomyces variotti showed a dominant coverage of the wood
surface. The rougher unplaned surface in group 1 contained more microvoids with water,
which were favorable for spore germination (Johansson et al. 2017). Molds were observed
only after the direct inoculation of planed wood surfaces, and mainly on the wood surface
closer to the original wood surface than deeper into the material. However, further study is
necessary to clarify the availability of nutrients for filament germination, hyphal growth,
Indirect Direct
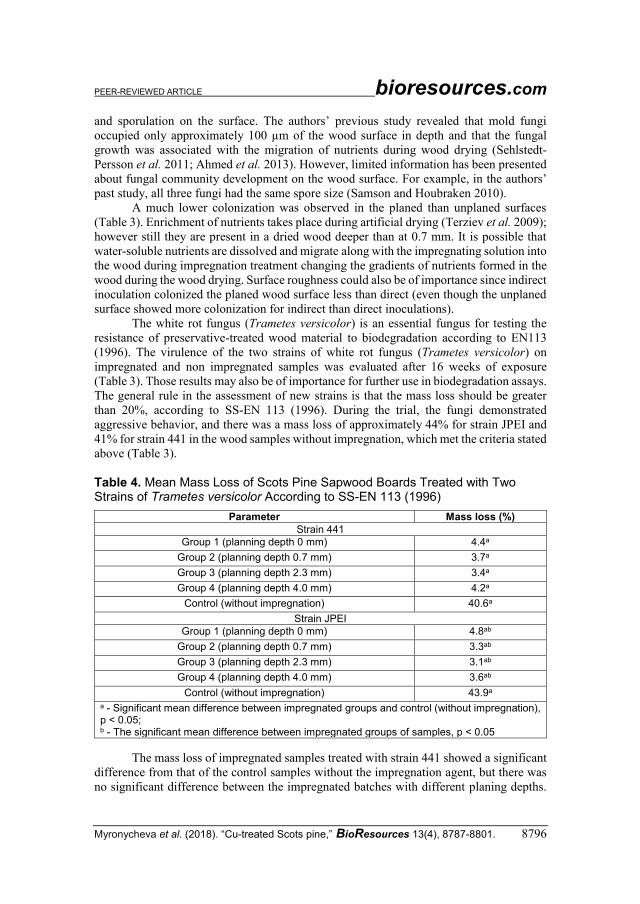
PEER-REVIEWED ARTICLE bioresources.com
Myronycheva et al. (2018). “Cu-treated Scots pine,” BioResources 13(4), 8787-8801. 8796
and sporulation on the surface. The authors’ previous study revealed that mold fungi
occupied only approximately 100 µm of the wood surface in depth and that the fungal
growth was associated with the migration of nutrients during wood drying (Sehlstedt-
Persson et al. 2011; Ahmed et al. 2013). However, limited information has been presented
about fungal community development on the wood surface. For example, in the authors’ past study, all three fungi had the same spore size (Samson and Houbraken 2010).
A much lower colonization was observed in the planed than unplaned surfaces
(Table 3). Enrichment of nutrients takes place during artificial drying (Terziev et al. 2009);
however still they are present in a dried wood deeper than at 0.7 mm. It is possible that
water-soluble nutrients are dissolved and migrate along with the impregnating solution into
the wood during impregnation treatment changing the gradients of nutrients formed in the
wood during the wood drying. Surface roughness could also be of importance since indirect
inoculation colonized the planed wood surface less than direct (even though the unplaned
surface showed more colonization for indirect than direct inoculations).
The white rot fungus (Trametes versicolor) is an essential fungus for testing the
resistance of preservative-treated wood material to biodegradation according to EN113
(1996). The virulence of the two strains of white rot fungus (Trametes versicolor) on
impregnated and non impregnated samples was evaluated after 16 weeks of exposure
(Table 3). Those results may also be of importance for further use in biodegradation assays.
The general rule in the assessment of new strains is that the mass loss should be greater
than 20%, according to SS-EN 113 (1996). During the trial, the fungi demonstrated
aggressive behavior, and there was a mass loss of approximately 44% for strain JPEI and
41% for strain 441 in the wood samples without impregnation, which met the criteria stated
above (Table 3).
Table 4. Mean Mass Loss of Scots Pine Sapwood Boards Treated with Two Strains of Trametes versicolor According to SS-EN 113 (1996)
Parameter Mass loss (%)
Strain 441
Group 1 (planning depth 0 mm) 4.4a
Group 2 (planning depth 0.7 mm) 3.7a
Group 3 (planning depth 2.3 mm) 3.4a
Group 4 (planning depth 4.0 mm) 4.2a
Control (without impregnation) 40.6a
Strain JPEI
Group 1 (planning depth 0 mm) 4.8ab
Group 2 (planning depth 0.7 mm) 3.3ab
Group 3 (planning depth 2.3 mm) 3.1ab
Group 4 (planning depth 4.0 mm) 3.6ab
Control (without impregnation) 43.9a a - Significant mean difference between impregnated groups and control (without impregnation), p ˂ 0.05; b - The significant mean difference between impregnated groups of samples, p ˂ 0.05
The mass loss of impregnated samples treated with strain 441 showed a significant
difference from that of the control samples without the impregnation agent, but there was
no significant difference between the impregnated batches with different planing depths.
PEER-REVIEWED ARTICLE bioresources.com
Myronycheva et al. (2018). “Cu-treated Scots pine,” BioResources 13(4), 8787-8801. 8797
For samples degraded by strain JPEI, significant mean differences were found between the
samples also treated with impregnation (Table 4).
White rot fungus (T. versicolor) is a selective degrader of lignocellulosic material,
particularly in the early stages of decay (Shirkavand et al. 2017). The primary target of the
attack is hemicellulose, but lignin and cellulose are also degraded (Chen et al. 2017). The
effect of planing depth on mass loss is shown in Table 3. The mass loss was lower at a
deeper planing depth for strain JPEI, but not for 441. The difference in the extent of
degradation of wood by the two white rot fungi may have been due to phylogenetic
variability within the species. Intraspecies variability in genetic and phenological traits are
evident in the fungal kingdom and can cause fungicide failure (Georgopoulos and
Skylakakis 1986; Nilsson et al. 2008). The agar media in the bottles developed a greenish
color at the end of the test. It was possible that the microorganisms assisted the leaching of
copper from the impregnated wood samples, which may be a result of a detoxification
mechanism via copper-transporting ATPase pumps (Weissman et al. 2000; Hall 2002;
Hastrup et al. 2005; Ohno et al. 2015).
CONCLUSIONS
1. The mold fungal damage of copper-impregnated Scots pine sapwood was influenced
to a greater extent by the planing depth compared to the infection method.
2. The unplaned surface of impregnated timber can be occupied by air-borne
contaminants, such as Paecilomyces variotti and Aspergillus niger, up to 30%, but the
extent of mold coverage was much less on the planed impregnated timber. Even after
impregnation by toxic compounds, the wood surface required processing to avoid or
hinder micro-fungi settlement.
3. The new strains of white rot fungus (Trametes versicolor) quite aggressively degraded
the non-impregnated wood with a mass loss of over 40%.
4. Both strains of white rot fungus (T. versicolor) degraded the wood impregnated with
an industrially used copper-based preservative, with an estimated mass loss of 3% to
5%. One of the strains (JPEI) was more incoherent and sensitive to planing depth.
ACKNOWLEDGMENTS
The authors thank Martinsons in Skellefteå, Sweden for providing test materials
and are grateful for the financial support of the Swedish Research Council for the
Environment Agricultural Sciences and Spatial Planning (FORMAS) projects:
“Experimental studies of capillary phenomena in bio-based materials” (942-2016-64) and
“Fungal growth on modified wood-based products under subarctic conditions” (2017-419).
In addition, the authors wish to express their gratitude for the support of COST Action
FP1407.
PEER-REVIEWED ARTICLE bioresources.com
Myronycheva et al. (2018). “Cu-treated Scots pine,” BioResources 13(4), 8787-8801. 8798
REFERENCES CITED
Adan, O. C. G., and Samson, R. A. (2011). Fundamentals of Mold Growth in Indoor
Environments and Strategies for Healthy Living, Wageningen Academic Publishers,
Wageningen, Netherlands.
Ahmed, S. A., Sehlstedt-Persson, M., Karlsson, O., and Morén, T. (2012). “Uneven distribution of preservative in kiln-dried sapwood lumber of Scots pine: Impact of
wood structure and resin allocation,” Holzforschung 66(2), 251-258. DOI:
10.1515/HF.2011.126
Ahmed, S. A., Sehlstedt-Persson, M., and Morén, T. (2013). “Development of a new rapid method for mould testing in a climate chamber: Preliminary tests,” European
Journal of Wood and Wood Products 71(4), 451-461. DOI: 10.1007/s00107-013-
0697-0
ASTM D7855/D7855M-13 (2013). “Standard test method for determination of mold
growth on coated building products designed for interior applications using an
environmental chamber and indirect inoculation,” ASTM International, West
Conshohocken, PA.
Bekker, M., Huinink, H. P., Adan, O. C. G., Samson, R. A., Wyatt, T., and Dijksterhuis,
J. (2012). “Production of an extracellular matrix as an isotropic growth phase of
Penicillium rubens on gypsum,” Applied and Environmental Microbiology 78(19),
6930-6937. DOI: 10.1128/AEM.01506-12
Borkow, G., and Gabbay, J. (2005). “Copper as a biocidal tool,” Current Medicinal
Chemistry 12(18), 2163-2175. DOI: 10.2174/0929867054637617
Cervantes, C., and Gutierrez-Corona, F. (1994). “Copper resistance mechanisms in bacteria and fungi,” FEMS Microbiology Reviews 14(2), 121-137. DOI:
10.1111/j.1574-6976.1994.tb00083.x
Chen, M., Wang, C., Fei, B., Ma, X., Zhang, B., Zhang, S., and Huang, A. (2017).
“Biological degradation of Chinese fir with Trametes Versicolor (L.) Lloyd,” Materials 10(7), 834. DOI: 10.3390/ma10070834
Crous, P. W., Verkley, G. J. M., Groenewald, J. Z., and Samson, R. A. (2018). Fungal
Biodiversity, Westerdijk Laboratory Manual Series, Westerdijk Fungal Biodiversity
Institute, Utrecht, The Netherlands.
ECHA (2011). “Directive 98/8/EC concerning the placing of biocidal products on the
market,” The European Parliament and The Council of the European Union, Brussels,
Belgium.
El Abed, S., Hamadi, F., Latrache, H., Iraqui, H. M., and Ibnsouda, K. S. (2010).
“Adhesion of Aspergillus niger and Penicillium expansumspores on Fez cedar wood
substrata,” Annals of Microbiology 60(3), 377-382. DOI: 10.1007/s13213-010-0045-0
Forest Products Laboratory (2010). Wood Handbook—Wood as an Engineering Material
(Report No. FPL-GTR-190), U.S. Department of Agriculture Forest Products
Laboratory, Madison, WI.
Gadd, G. M. (2017). “The geomycology of elemental cycling and transformations in the
environment,” in: The Fungal Kingdom, pp. 371-386. DOI:
10.1128/microbiolspec.FUNK-0010-2016
Georgopoulos, S. G., and Skylakakis, G. (1986). “Genetic variability in the fungi and the
problem of fungicide resistance,” Crop Protection 5(5), 299-305. DOI:
10.1016/0261-2194(86)90107-9
PEER-REVIEWED ARTICLE bioresources.com
Myronycheva et al. (2018). “Cu-treated Scots pine,” BioResources 13(4), 8787-8801. 8799
Hall, J. L. (2002). “Cellular mechanisms for heavy metal detoxification and tolerance,” Journal of Experimental Botany 53(366), 1-11.
Hastrup, A. C. S., Green, F., Clausen, C. A., and Jensen, B. (2005). “Tolerance of Serpula lacrymans to copper-based wood preservatives,” International
Biodeterioration and Biodegradation 56(3), 173-177. DOI:
10.1016/j.ibiod.2005.06.008
Johansson, P., Mjörnell, K., and Arfvidsson, J. (2017). “Examples of characteristics of wood that affect mould growth: A meta-analysis,” European Journal of Wood and
Wood Products 75(4), 603-613. DOI: 10.1007/s00107-016-1127-x
Kutnik, M., Suttie, E., and Brischke, C. (2014). “European standards on durability and performance of wood and wood-based products – Trends and challenges,” Wood
Material Science and Engineering 9(3), 122-133. DOI:
10.1080/17480272.2014.894574
Nies, D. H. (1999). “Microbial heavy-metal resistance,” Applied Microbiology and
Biotechnology 51(6), 730-750. DOI: 10.1007/s002530051457
Nilsson, R. H., Kristiansson, E., Ryberg, M., Hallenberg, N., and Larsson, K.-H. (2008).
“Intraspecific ITS variability in the kingdom fungi as expressed in the international
sequence databases and its implications for molecular species identification,” Evolutionary Bioinformatics Online 4, 193-201.
Nordic Wood Preservation Council (2012). “Nordic wood preservation classes and product requirements for preservative-treated wood. Part 1: Pine and other permeable
softwoods (NWPC Document No. 1: 2013), Nordic Wood Preservation Council,
Stockholm, Sweden.
Ohno, K. M., Clausen, C. A., Green, F., and Diehl, S. V. (2015). “Insights into the mechanism of copper-tolerance in Fibroporia radiculosa: The biosynthesis of
oxalate,” International Biodeterioration & Biodegradation 105, 90-96. DOI:
10.1016/j.ibiod.2015.08.016
Peres, I., and Pihan, J. C. (1991). “Study of accumulation of copper by carp (Cyprinus
carpio L.) ‐ adaptation analysis of bioconcentration by the gills,” Environmental
Technology 12(2), 169-177. DOI: 10.1080/09593339109384993
Pypker, T. G., Unsworth, M. H., Van Stan, J. T., and Bond, B. J. (2017). “The absorption and evaporation of water vapor by epiphytes in an old-growth Douglas-fir forest
during the seasonal summer dry season: Implications for the canopy energy budget,” Ecohydrology 10(3), e1801. DOI: 10.1002/eco.1801
Reinprecht, L. (2016). Wood Deterioration, Protection and Maintenance, John Wiley &
Sons, Hoboken, NJ, USA.
Ruddick, J. N. R., Xie, C., and Herring, F. G. (2005). “Fixation of amine copper
preservatives. Part 1. Reaction of vanillin, a lignin model compound with
monoethanolamine copper sulphate solution,” Holzforschung 55(6), 585-589. DOI:
10.1515/HF.2001.095
Samson, R. A., Houbraken, J., Thrane, U., Frisvald, J. C., and Andersen, B. (2010). Food
and Indoor Fungi, CBS-KNAW Fungal Biodiversity Centre, Utrecht, Netherlands.
Samson, R. A., and Houbraken, J. (eds.). (2010). Food and Indoor Fungi, Centraalbureau
voor Schimmelcultures, CBS laboratory manual series, CBS-KNAW Fungal
Biodiversity Centre, Utrecht.
Schindelin, J., Arganda-Carreras, I., Frise, E., Kaynig, V., Longair, M., Pietzsch, T.,
Preibisch, S., Rueden, C., Saalfeld, S., and Schmid, B., et al. (2012). “Fiji: An open-
PEER-REVIEWED ARTICLE bioresources.com
Myronycheva et al. (2018). “Cu-treated Scots pine,” BioResources 13(4), 8787-8801. 8800
source platform for biological-image analysis,” Nature Methods 9(7), 676-682. DOI:
10.1038/nmeth.2019
Segers, F. J. J., Van Laarhoven, K. A., Wösten, H. a. B., and Dijksterhuis, J. (2017).
“Growth of indoor fungi on gypsum,” Journal of Applied Microbiology 123(2), 429-
435. DOI: 10.1111/jam.13487
Sehlstedt-Persson, M., Karlsson, O., Wamming, T., and Morèn, T. (2011). “Mold growth
on sapwood boards exposed outdoors: The impact of wood drying,” Forest Products
Journal 61(2), 170-179. DOI: 10.13073/0015-7473-61.2.170
Sehlstedt-Persson, M., Ohman, M., Marklund, B., and Myronycheva, O. (2016).
Hyveldjupets Inverkan På Mögelbenägenhet Hos Råspont Av Furu Och gran [Impact
of Planing Depth on Mold Growth of Scots pine and Norway spruce Sapwood], Luleå
University of Technology, Slelleftea, Sweden.
Shirkavand, E., Baroutian, S., Gapes, D. J., and Young, B. R. (2017). “Pretreatment of radiata pine using two white rot fungal strains Stereum hirsutum and Trametes
versicolor,” Energy Conversion and Management 142(Supplement C), 13-19. DOI:
10.1016/j.enconman.2017.03.021
SS-EN 113 (1996). “Wood preservatives - Test method for determining the protective
effectiveness against wood destroying basiomycetes - Determination of the toxic
values,” Swedish Standards Institute, Stockholm, Sweden.
SS-EN 15457 (2014). “Standard - Paints and varnishes - Laboratory method for testing
the efficacy of film preservatives in a coating against fungi,” Swedish Standards
Institute, Stockholm, Sweden.
Terziev, N. (2009). “Migration of low-molecular sugars and nitrogenous compounds in
Pinus sylvestris L. during kiln and air drying,” Holzforschung 49(6), 565-574. DOI:
10.1515/hfsg.1995.49.6.565
Tchounwou, P. B., Yedjou, C. G., Patlolla, A. K., and Sutton, D. J. (2012). “Heavy metals toxicity and the environment,” in: Molecular, Clinical and Environmental
Toxicology Experienta Supplementum, Vol. 101, A. Luch (ed.), Springer, Basel,
Switzerland, pp. 133-164. DOI: 10.1007/978-3-7643-8340-4_6
Terziev, N. (2005). “Industrial kiln drying and its effect on microstructure, impregnation
and properties of scots pine timber impregnated for above ground use. Part 1. Effects
of initial, final dryings and preservative on impregnation and timber quality,” Holzforschung 56(4), 428-433. DOI: 10.1515/HF.2002.066
Terziev, N. (2009). “Migration of low-molecular sugars and nitrogenous compounds in
Pinus sylvestris L. during kiln and air drying,” Holzforschung 49(6), 565-574. DOI:
10.1515/hfsg.1995.49.6.565
Terziev, N., and Boutelje, J. (2007). “Effect of felling time and kiln-drying on color and
susceptibility of wood to mold and fungal stain during an above-ground field test,” Wood and Fiber Science 30(4), 360-367.
Terziev, N., and Nilsson, T. (2005). “Effect of soluble nutrient content in wood on its
susceptibility to soft rot and bacterial attack in ground test,” Holzforschung 53(6),
575-579. DOI: 10.1515/HF.1999.095
Unger, A., Schniewind, A. P., and Unger, W. (2001). Conservation of Wood Artifacts: A
Handbook, Springer Publishing Company, Heidelberg, Germany.
Van Laarhoven, K. A., Huinink, H. P., and Adan, O. C. G. (2016). “A microscopy study of hyphal growth of Penicillium rubens on gypsum under dynamic humidity
conditions,” Microbial Biotechnology 9(3), 408-418. DOI: 10.1111/1751-7915.12357
PEER-REVIEWED ARTICLE bioresources.com
Myronycheva et al. (2018). “Cu-treated Scots pine,” BioResources 13(4), 8787-8801. 8801
Van Laarhoven, K. A., Huinink, H. P., Segers, F. J. J., Dijksterhuis, J., and Adan, O. C.
G. (2015). “Separate effects of moisture content and water activity on the hyphal
extension of Penicillium rubens on porous media,” Environmental Microbiology
17(12), 5089-5099. DOI: 10.1111/1462-2920.13012
Weissman, Z., Berdicevsky, I., Cavari, B. Z., and Kornitzer, D. (2000). “The high copper tolerance of Candida albicans is mediated by a P-type ATPase,” Proceedings of the
National Academy of Sciences of the United States of America 97(7), 3520-3525.
Zabel, R. A., and Morrell, J. J. (1992). Wood Microbiology: Decay and Its Prevention,
Elsevier Science, Oxford, UK.
Zhang, J., and Kamdem, D. P. (2007). “Interaction of copper-amine with southern pine:
Retention and migration,” Wood and Fiber Science 32(3), 332-339.
Article submitted: March 8, 2018; Peer review completed: June 5, 2018; Revised version
received and accepted: October 3, 2018; Published: October 19, 2018.
DOI: 10.15376/biores.13.4.8787-8801


Paper II

RESEARCH ARTICLE
Distribution of low-molecular lipophilic
extractives beneath the surface of air- and
kiln-dried Scots pine sapwood boards
Olena Myronycheva, Olov KarlssonID*, Margot Sehlstedt-Persson, Micael Ohman,
Dick Sandberg
Division of Wood Science and Engineering, LuleåUniversity of Technology, Skellefteå, Sweden
Abstract
During industrial wood drying, extractives migrate towards the wood surfaces and make the
material more susceptible to photo/biodegradation. The present work provides information
about the distribution, quantity and nature of lipophilic substances beneath the surface in
air- and kiln-dried Scots pine (Pinus sylvestris L.) sapwood boards. Samples were taken
from knot-free sapwood surfaces and the composition of lipophilic extractives, phenols and
low-molecular fatty/resin acids layers at different nominal depths below the surface was
studied gravimetrically, by UV-spectrometry and by gas chromatography-mass spectrome-
try (GC-MS). The concentration of total extractives was significantly higher in kiln-dried than
in air-dried samples and was higher close to the surface than in the layers beneath. The
scatter in the values for the lipophilic extractives was high in both drying types, being highest
for linoleic acid and slightly lower for palmitic, oleic and stearic acids. The amount of fatty
acids was low in kiln-dried boards, probably due to a stronger degradation due to the high
temperature employed. The most abundant resin acid was dehydroabietic acid followed by
pimaric, isopimaric, and abietic acids in both drying types. It is concluded that during kiln-
drying a migration front is created at a depth of 0.25 mm with a thickness of about 0.5 mm.
Introduction
Wood is dried industrially to remove water to achieve a more durable and dimensionally stable
light-weight material. Drying and especially thermal modification influence the presence and
structure of the constituents of the wood material, and subsequently the characteristics and
service-life of the final wood products. During drying, complex changes in the properties of
wood occur, initiated by heat and mass flows towards the wood surfaces and by degradation of
wood constituents [1]. One mechanism is a migration of non-structural wood-cell compounds
such as polar and non-polar extractives. Contamination of both hydrophilic and hydrophobic
components beneath and at the wood surface by the migration of extractives during drying
reduces the adhesion of surface coatings [2,3], affects the speed of moisture absorption [4],
PLOS ONE | https://doi.org/10.1371/journal.pone.0204212 October 10, 2018 1 / 12
a1111111111
a1111111111
a1111111111
a1111111111
a1111111111
OPENACCESS
Citation: Myronycheva O, Karlsson O, Sehlstedt-
Persson M, Ohman M, Sandberg D (2018)
Distribution of low-molecular lipophilic extractives
beneath the surface of air- and kiln-dried Scots
pine sapwood boards. PLoS ONE 13(10):
e0204212. https://doi.org/10.1371/journal.
pone.0204212
Editor: Martina Lahmann, Bangor University,
UNITED KINGDOM
Received: May 5, 2017
Accepted: September 5, 2018
Published: October 10, 2018
Copyright: © 2018 Myronycheva et al. This is an
open access article distributed under the terms of
the Creative Commons Attribution License, which
permits unrestricted use, distribution, and
reproduction in any medium, provided the original
author and source are credited.
Data Availability Statement: All relevant data are
within the paper and its Supporting Information
files.
Funding: This work received support from the
Swedish Research Council for the Environment,
Agricultural Sciences and Spatial Planning
(FORMAS) project “Experimental studies of
capillary phenomena in bio-based materials” 942-
2016-64, “Fungal growth on modified wood-based
products under subarctic conditions” 2017-00419,
leads to an uneven distribution of preservatives during impregnation [5], and as a consequence
may reduce the durability of the wood product.
Scots pine (Pinus sylvestris L.) is one of the major raw materials for the forest products
industries in the Nordic countries. Scots pine is naturally highly enriched in extractives, which
influence the modification of sawn timber and the properties of the final product. The migra-
tion of hydrophilic extractive fractions to the sapwood surface during drying and thermal
modification has been widely described [6–9]. The movement of liphophilic extractives during
drying decreases the permeability and can lead to failure in impregnation [5,10]. Besides, the
hydrophobic fractions that remain from nutrient reserves and natural defensive systems
against pathogens in the living tree can be used as natural protection of wood products against
damage by environmental influences.
The main wood constituents are cellulose, hemicelluloses, lignin, and to a minor part
water-soluble and insoluble extracellular and low-molecular-weight compounds called
“extractives” [11,12]. The extractives are located in various tree compartments: parenchyma
and epithelial cells, resin canals, middle lamellae, intercellular spaces and the cell walls of tra-
cheids, libriform fibers and vessels [13]. The main compounds in softwoods are resin acids,
other terpenoids, fats, fatty acids, steryl esters, sterols, phenolic substances, glycosides, sugars,
starch, and proteins [14] with seasonal and geographical variations in distribution pattern
[15–17]. The content of extractives has been reported to be higher in knots than in stem wood,
with noted variation within the tree and between trees and a certain decrease in amount along
the radial direction of the tree [18].
The resins in Scots pine are primary lipid-soluble blends of volatile and non-volatile sec-
ondary compounds of terpenoid origin, produced in subcellular regions of epithelial cells and
then transported and stored in the resin duct [19]. The volatile fractions of the mono C10 and
sesquiterpene C15 resins give fluidity to resins and plasticise the more viscous C20 diterpenes.
Scots pine possesses the high level of constitutive resins in an interconnected system of resin
ducts located in the stem wood with long-lived epithelial cells from the initial state with domi-
nance in heartwood. The non-volatile resin fraction of Scots pine is usually characterized by
diterpene resin acids of the abietane and pimarane structural types [20]. The predominant
phenolic compounds are flavonoids, stilbenes and lignans. Their main function is to prevent
oxidation of biomolecules by abiotic and biotic substances attacking the trees [21]. The pino-
sylvin stilbenes are the predominant phenolic compounds in Scots pine heartwood and also
exist in sapwood [22]. Triglycerides, such as esters of glycerol and three fatty acids C16 and C18
with varying degrees of unsaturation and sterol/triterpenoid esters in Scots pine, are stored in
sapwood with higher concentrations of free fatty acids then in the heartwood, probably related
to degradation of triacylglycerols during heartwood formation [23]. Unsaturated fatty acids
such as oleic, linoleic, linolenic and eicosatrienoic, and the saturated palmitic and stearic fatty
acids, are the most abundant components of the triacylglycerol fraction [23,24].
Green wood retains metabolic activity after harvesting and processing, and this initiates a
natural anatomical response to injuries that trees sustain while exposed to pathogenic attack or
mechanical damage. It results in the release of constitutive defense agents and activates com-
plex changes in non-structural elements of Scots pine wood [25]. The moisture flux during the
drying process re-locates low-molecular sugars [7,26] beneath the sawn timber surface with
the formation of a so-called drying shell and kiln brown stain [6] that can be explained by the
hypothesis of an evaporative front (about 10 cell rows) of capillary water beneath the surface
[27].
Despite the large amount of research in recent decades into the extractives in Scots pine,
only limited and their fragmented information can be found regarding the distributionof
hydrophobic/lipophilic extractives and migration towards the surface during drying or
Extractives in dried pine surface
PLOS ONE | https://doi.org/10.1371/journal.pone.0204212 October 10, 2018 2 / 12
PI-Dr. Olov Karlsson; COST Action FP1407
“ModWoodLife” project “Understanding wood
modification through an integrated scientific and
environmental impact approach” PI-Prof. Dick
Sandberg.
Competing interests: The authors have declared
that no competing interests exist.
thermal treatment. Moreover, the accumulation and differences in chemical composition of
extractives in relation to the contribution of compound migration remains unclear. The pres-
ent work has sought to contribute information about the distribution, quantity and nature of
some of the hydrophobic substances in air- and kiln-dried Scots pine sapwood.
Material and methods
Specimen preparation and drying procedure
A total of 10 green sideboards from 10 different Scots pine (Pinus sylvetris L.) trees with cross-
sectional dimensions of 220 x 25 mm, and a length of about 4.5 metres were taken directly
after sawing from a sawmill in Norrbotten County in Sweden during the last week of Septem-
ber 2015. The trees were felled, bucked to logs and transported to the sawmill during Septem-
ber. Each board was cut into four pieces with a length of 0.96 m and the moisture content
(green state) was determined according to EN 13183–1 [28]. The boards consisted only of
sapwood.
No permits were required for the study, which complied with all relevant regulations. The
study did not involve endangered or protected species.
The boards were divided into two groups for air-drying and kiln-drying as follows: ten ran-
domly selected boards were single stacked and dried indoors on stickers at a temperature of
20˚C (RH about 10%) and used as reference for extractives analysis as air-dried samples. The
average moisture content after drying for 30 days was 4.6%.
Another 64 boards were kiln-dried in a small-scale laboratory kiln with air circulation. All
the boards were double-stacked with the sapwood sides of each pair turned outwards in order
to get a high flow of moisture from the inner part of the boards to the sapwood surface that
could enrich the surfaces with as much extractives as possible during drying (Fig 1). The dry-
ing schedule used is shown in Fig 2 and the moisture content (MC) is shown in Table 1.
The kiln-drying was performed without a conditioning phase in order to prevent influence
on distribution of extractives after drying.
Extraction of extractives and analysis
All the air-dried boards and 10 randomly selected kiln-dried boards were cut to a length of 250
mm and a width of 100 mm, and then split into four specimens (Fig 1C). These specimens
were used for the determination of the distribution of lipophilic extractives. The sapwood
sides of three of four specimens were planed three times to depths of 0.25, 0.75 and 1.75 mm
from the original un-planed surface. 3.5 g of the shavings from each planing were milled in a
Fritch planetary mill and 0.5 g was used for moisture content determination, 1.0 g was used for
the extraction of lipophilic compounds, and the remainder was left untreated and stored at a
temperature of -20˚C.
The extraction was done using acetone (VWR Chemicals: 20165.323, 75 ml) in a mini-
Soxhlet extractor according to the SCAN-CM 49:03 standard method [29]. The total lipophilic
extractives content was given in mg g-1 of dry mass after evaporation of the acetone and drying
of the extracted solution.
Fatty acids and resin acids in the acetone extract were analysed using GC-MS after tri-
methylsilylation. The silylation with 100 μl of BSTFA and 50 μl of TMSCl was performed in an
oven at 70˚C for 20 minutes according to Sjostrom [30] with 1-methylnaphthalene dissolved
in pyridine as internal standard [31].
A SUPELCO SLB-5 MS capillary column (L × I.D. 30 m × 0.25 mm, df 0.25 μm) was used
starting at a temperature of 100˚C (1 min initial) and finishing at 270˚C (2 min final) at a rate
10˚C/min with an entire analysis cycle of 25 minutes. The injector initial temperature was
Extractives in dried pine surface
PLOS ONE | https://doi.org/10.1371/journal.pone.0204212 October 10, 2018 3 / 12

270˚C with interface temperature 290˚C and fan temperature was 50˚C, control mode was
split. The scan group started from 40 m/z and end 500 m/z with scan speed 1000.
The resin acid and fatty acids were identified by NIST Mass Spectral Library [32] and a
quantitative estimation was made by comparing the peak areas with that for the internal stan-
dard. Retention time (RT) was: hexanoic acid (RT ~ 5.6 min.), heptanal (RT ~ 6.2 min.), glyc-
erol (RT ~ 8.6 min.), internal standard (RT ~ 9.4 min.), palmitic acid (RT ~ 17.9 min.), oleic
acid (RT ~ 19.6 min.), linoleic acid (RT ~ 19.4 min.), stearic acid (RT ~ 19.7 min.), pimaric
Fig 1. Drying and board preparation scheme. (A) double-stacking of boards with the sapwood side of each board
facing outwards in each pair, (B) stacking of boards in the laboratory kiln, and (C) planing depth scheme for
specimens: (a) unplaned, (b) 0–0.25 mm, (c) 0.25–0.75 mm, and (d) 0.75–1.75 mm planing depth.
https://doi.org/10.1371/journal.pone.0204212.g001
Fig 2. Drying schedule showing dry- and wet-bulb temperatures. The total drying time was 44 hours including a 1.7
hours heating phase, and a 5 hour cooling phase.
https://doi.org/10.1371/journal.pone.0204212.g002
Extractives in dried pine surface
PLOS ONE | https://doi.org/10.1371/journal.pone.0204212 October 10, 2018 4 / 12
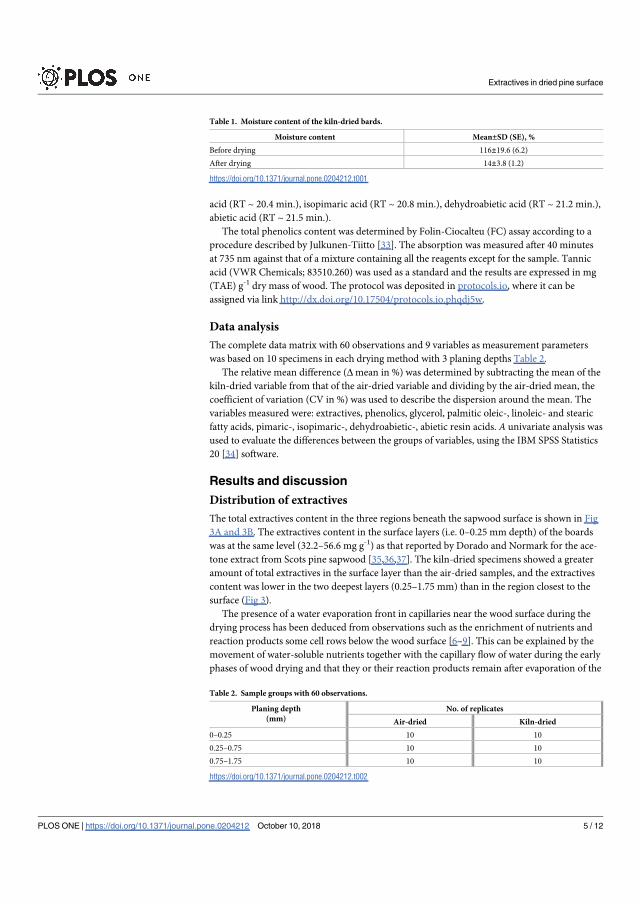
acid (RT ~ 20.4 min.), isopimaric acid (RT ~ 20.8 min.), dehydroabietic acid (RT ~ 21.2 min.),
abietic acid (RT ~ 21.5 min.).
The total phenolics content was determined by Folin-Ciocalteu (FC) assay according to a
procedure described by Julkunen-Tiitto [33]. The absorption was measured after 40 minutes
at 735 nm against that of a mixture containing all the reagents except for the sample. Tannic
acid (VWR Chemicals; 83510.260) was used as a standard and the results are expressed in mg
(TAE) g-1 dry mass of wood. The protocol was deposited in protocols.io, where it can be
assigned via link http://dx.doi.org/10.17504/protocols.io.phqdj5w.
Data analysis
The complete data matrix with 60 observations and 9 variables as measurement parameters
was based on 10 specimens in each drying method with 3 planing depths Table 2.
The relative mean difference (Δ mean in %) was determined by subtracting the mean of the
kiln-dried variable from that of the air-dried variable and dividing by the air-dried mean, the
coefficient of variation (CV in %) was used to describe the dispersion around the mean. The
variables measured were: extractives, phenolics, glycerol, palmitic oleic-, linoleic- and stearic
fatty acids, pimaric-, isopimaric-, dehydroabietic-, abietic resin acids. A univariate analysis was
used to evaluate the differences between the groups of variables, using the IBM SPSS Statistics
20 [34] software.
Results and discussion
Distribution of extractives
The total extractives content in the three regions beneath the sapwood surface is shown in Fig
3A and 3B. The extractives content in the surface layers (i.e. 0–0.25 mm depth) of the boards
was at the same level (32.2–56.6 mg g-1) as that reported by Dorado and Normark for the ace-
tone extract from Scots pine sapwood [35,36,37]. The kiln-dried specimens showed a greater
amount of total extractives in the surface layer than the air-dried samples, and the extractives
content was lower in the two deepest layers (0.25–1.75 mm) than in the region closest to the
surface (Fig 3).
The presence of a water evaporation front in capillaries near the wood surface during the
drying process has been deduced from observations such as the enrichment of nutrients and
reaction products some cell rows below the wood surface [6–9]. This can be explained by the
movement of water-soluble nutrients together with the capillary flow of water during the early
phases of wood drying and that they or their reaction products remain after evaporation of the
Table 1. Moisture content of the kiln-dried bards.
Moisture content Mean±SD (SE), %
Before drying 116±19.6 (6.2)
After drying 14±3.8 (1.2)
https://doi.org/10.1371/journal.pone.0204212.t001
Table 2. Sample groups with 60 observations.
Planing depth
(mm)
No. of replicates
Air-dried Kiln-dried
0–0.25 10 10
0.25–0.75 10 10
0.75–1.75 10 10
https://doi.org/10.1371/journal.pone.0204212.t002
Extractives in dried pine surface
PLOS ONE | https://doi.org/10.1371/journal.pone.0204212 October 10, 2018 5 / 12
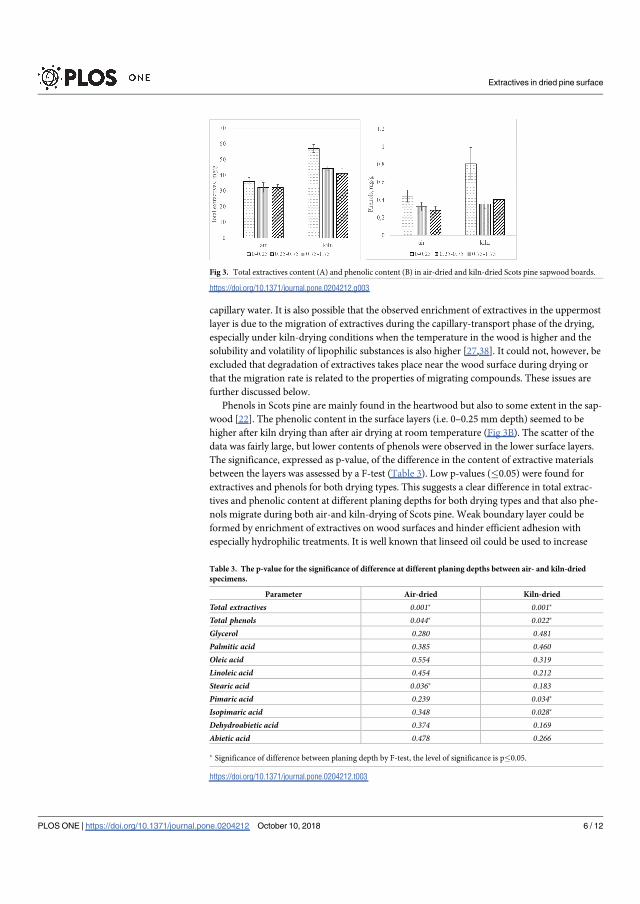
capillary water. It is also possible that the observed enrichment of extractives in the uppermost
layer is due to the migration of extractives during the capillary-transport phase of the drying,
especially under kiln-drying conditions when the temperature in the wood is higher and the
solubility and volatility of lipophilic substances is also higher [27,38]. It could not, however, be
excluded that degradation of extractives takes place near the wood surface during drying or
that the migration rate is related to the properties of migrating compounds. These issues are
further discussed below.
Phenols in Scots pine are mainly found in the heartwood but also to some extent in the sap-
wood [22]. The phenolic content in the surface layers (i.e. 0–0.25 mm depth) seemed to be
higher after kiln drying than after air drying at room temperature (Fig 3B). The scatter of the
data was fairly large, but lower contents of phenols were observed in the lower surface layers.
The significance, expressed as p-value, of the difference in the content of extractive materials
between the layers was assessed by a F-test (Table 3). Low p-values (�0.05) were found for
extractives and phenols for both drying types. This suggests a clear difference in total extrac-
tives and phenolic content at different planing depths for both drying types and that also phe-
nols migrate during both air-and kiln-drying of Scots pine. Weak boundary layer could be
formed by enrichment of extractives on wood surfaces and hinder efficient adhesion with
especially hydrophilic treatments. It is well known that linseed oil could be used to increase
Fig 3. Total extractives content (A) and phenolic content (B) in air-dried and kiln-dried Scots pine sapwood boards.
https://doi.org/10.1371/journal.pone.0204212.g003
Table 3. The p-value for the significance of difference at different planing depths between air- and kiln-dried
specimens.
Parameter Air-dried Kiln-dried
Total extractives 0.001� 0.001�
Total phenols 0.044� 0.022�
Glycerol 0.280 0.481Palmitic acid 0.385 0.460Oleic acid 0.554 0.319Linoleic acid 0.454 0.212Stearic acid 0.036� 0.183Pimaric acid 0.239 0.034�
Isopimaric acid 0.348 0.028�
Dehydroabietic acid 0.374 0.169Abietic acid 0.478 0.266
� Significance of difference between planing depth by F-test, the level of significance is p�0.05.
https://doi.org/10.1371/journal.pone.0204212.t003
Extractives in dried pine surface
PLOS ONE | https://doi.org/10.1371/journal.pone.0204212 October 10, 2018 6 / 12
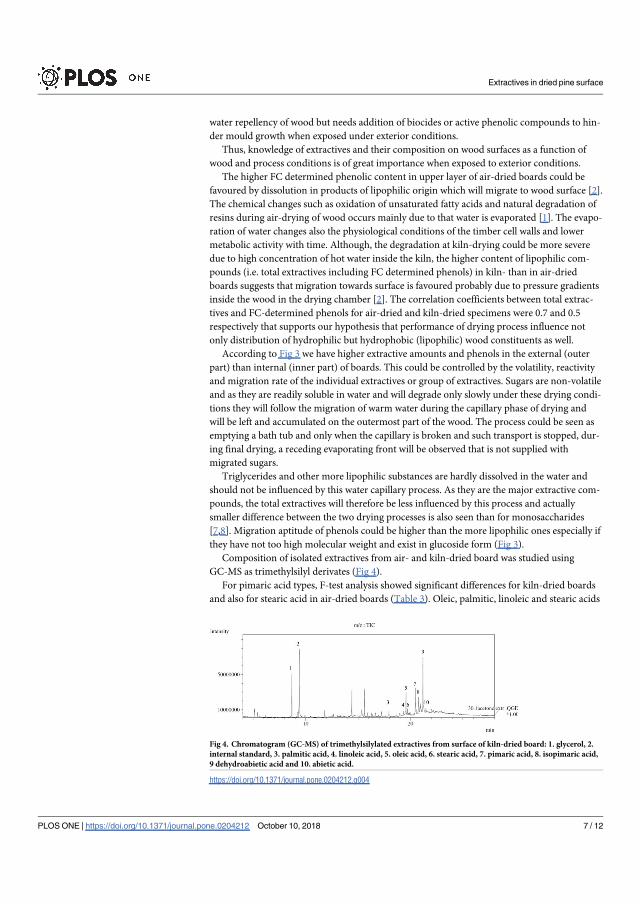
water repellency of wood but needs addition of biocides or active phenolic compounds to hin-
der mould growth when exposed under exterior conditions.
Thus, knowledge of extractives and their composition on wood surfaces as a function of
wood and process conditions is of great importance when exposed to exterior conditions.
The higher FC determined phenolic content in upper layer of air-dried boards could be
favoured by dissolution in products of lipophilic origin which will migrate to wood surface [2].
The chemical changes such as oxidation of unsaturated fatty acids and natural degradation of
resins during air-drying of wood occurs mainly due to that water is evaporated [1]. The evapo-
ration of water changes also the physiological conditions of the timber cell walls and lower
metabolic activity with time. Although, the degradation at kiln-drying could be more severe
due to high concentration of hot water inside the kiln, the higher content of lipophilic com-
pounds (i.e. total extractives including FC determined phenols) in kiln- than in air-dried
boards suggests that migration towards surface is favoured probably due to pressure gradients
inside the wood in the drying chamber [2]. The correlation coefficients between total extrac-
tives and FC-determined phenols for air-dried and kiln-dried specimens were 0.7 and 0.5
respectively that supports our hypothesis that performance of drying process influence not
only distribution of hydrophilic but hydrophobic (lipophilic) wood constituents as well.
According to Fig 3 we have higher extractive amounts and phenols in the external (outer
part) than internal (inner part) of boards. This could be controlled by the volatility, reactivity
and migration rate of the individual extractives or group of extractives. Sugars are non-volatile
and as they are readily soluble in water and will degrade only slowly under these drying condi-
tions they will follow the migration of warm water during the capillary phase of drying and
will be left and accumulated on the outermost part of the wood. The process could be seen as
emptying a bath tub and only when the capillary is broken and such transport is stopped, dur-
ing final drying, a receding evaporating front will be observed that is not supplied with
migrated sugars.
Triglycerides and other more lipophilic substances are hardly dissolved in the water and
should not be influenced by this water capillary process. As they are the major extractive com-
pounds, the total extractives will therefore be less influenced by this process and actually
smaller difference between the two drying processes is also seen than for monosaccharides
[7,8]. Migration aptitude of phenols could be higher than the more lipophilic ones especially if
they have not too high molecular weight and exist in glucoside form (Fig 3).
Composition of isolated extractives from air- and kiln-dried board was studied using
GC-MS as trimethylsilyl derivates (Fig 4).
For pimaric acid types, F-test analysis showed significant differences for kiln-dried boards
and also for stearic acid in air-dried boards (Table 3). Oleic, palmitic, linoleic and stearic acids
Fig 4. Chromatogram (GC-MS) of trimethylsilylated extractives from surface of kiln-dried board: 1. glycerol, 2.
internal standard, 3. palmitic acid, 4. linoleic acid, 5. oleic acid, 6. stearic acid, 7. pimaric acid, 8. isopimaric acid,
9 dehydroabietic acid and 10. abietic acid.
https://doi.org/10.1371/journal.pone.0204212.g004
Extractives in dried pine surface
PLOS ONE | https://doi.org/10.1371/journal.pone.0204212 October 10, 2018 7 / 12
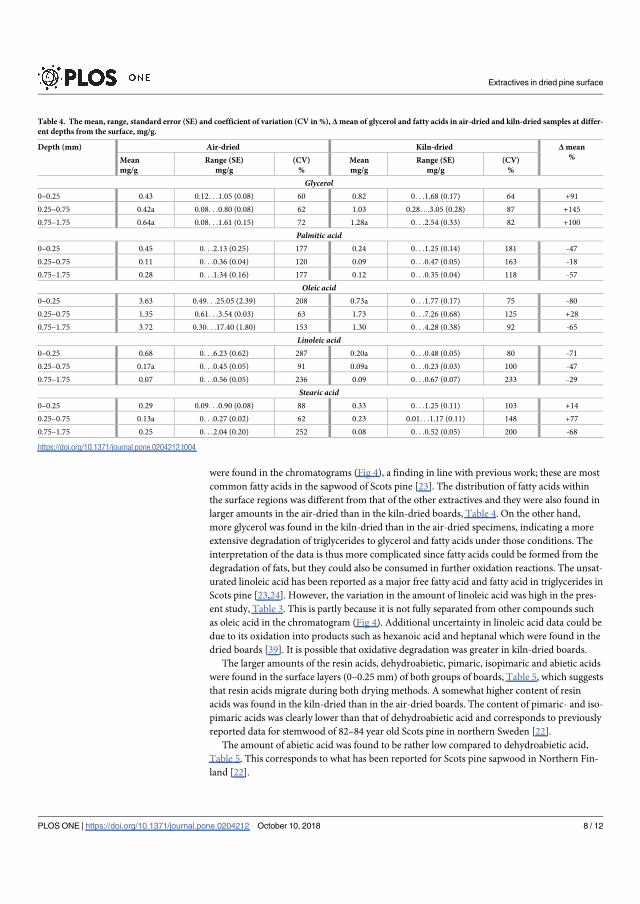
were found in the chromatograms (Fig 4), a finding in line with previous work; these are most
common fatty acids in the sapwood of Scots pine [23]. The distribution of fatty acids within
the surface regions was different from that of the other extractives and they were also found in
larger amounts in the air-dried than in the kiln-dried boards, Table 4. On the other hand,
more glycerol was found in the kiln-dried than in the air-dried specimens, indicating a more
extensive degradation of triglycerides to glycerol and fatty acids under those conditions. The
interpretation of the data is thus more complicated since fatty acids could be formed from the
degradation of fats, but they could also be consumed in further oxidation reactions. The unsat-
urated linoleic acid has been reported as a major free fatty acid and fatty acid in triglycerides in
Scots pine [23,24]. However, the variation in the amount of linoleic acid was high in the pres-
ent study, Table 3. This is partly because it is not fully separated from other compounds such
as oleic acid in the chromatogram (Fig 4). Additional uncertainty in linoleic acid data could be
due to its oxidation into products such as hexanoic acid and heptanal which were found in the
dried boards [39]. It is possible that oxidative degradation was greater in kiln-dried boards.
The larger amounts of the resin acids, dehydroabietic, pimaric, isopimaric and abietic acids
were found in the surface layers (0–0.25 mm) of both groups of boards, Table 5, which suggests
that resin acids migrate during both drying methods. A somewhat higher content of resin
acids was found in the kiln-dried than in the air-dried boards. The content of pimaric- and iso-
pimaric acids was clearly lower than that of dehydroabietic acid and corresponds to previously
reported data for stemwood of 82–84 year old Scots pine in northern Sweden [22].
The amount of abietic acid was found to be rather low compared to dehydroabietic acid,
Table 5. This corresponds to what has been reported for Scots pine sapwood in Northern Fin-
land [22].
Table 4. The mean, range, standard error (SE) and coefficient of variation (CV in %), Δmean of glycerol and fatty acids in air-dried and kiln-dried samples at differ-
ent depths from the surface, mg/g.
Depth (mm) Air-dried Kiln-dried Δ mean
%Mean
mg/g
Range (SE)
mg/g
(CV)
%
Mean
mg/g
Range (SE)
mg/g
(CV)
%
Glycerol0–0.25 0.43 0.12. . .1.05 (0.08) 60 0.82 0. . .1.68 (0.17) 64 +91
0.25–0.75 0.42a 0.08. . .0.80 (0.08) 62 1.03 0.28. . .3.05 (0.28) 87 +145
0.75–1.75 0.64a 0.08. . .1.61 (0.15) 72 1.28a 0. . .2.54 (0.33) 82 +100
Palmitic acid0–0.25 0.45 0. . .2.13 (0.25) 177 0.24 0. . .1.25 (0.14) 181 -47
0.25–0.75 0.11 0. . .0.36 (0.04) 120 0.09 0. . .0.47 (0.05) 163 -18
0.75–1.75 0.28 0. . .1.34 (0.16) 177 0.12 0. . .0.35 (0.04) 118 -57
Oleic acid0–0.25 3.63 0.49. . .25.05 (2.39) 208 0.73a 0. . .1.77 (0.17) 75 -80
0.25–0.75 1.35 0.61. . .3.54 (0.03) 63 1.73 0. . .7.26 (0.68) 125 +28
0.75–1.75 3.72 0.30. . .17.40 (1.80) 153 1.30 0. . .4.28 (0.38) 92 -65
Linoleic acid0–0.25 0.68 0. . .6.23 (0.62) 287 0.20a 0. . .0.48 (0.05) 80 -71
0.25–0.75 0.17a 0. . .0.45 (0.05) 91 0.09a 0. . .0.23 (0.03) 100 -47
0.75–1.75 0.07 0. . .0.56 (0.05) 236 0.09 0. . .0.67 (0.07) 233 -29
Stearic acid0–0.25 0.29 0.09. . .0.90 (0.08) 88 0.33 0. . .1.25 (0.11) 103 +14
0.25–0.75 0.13a 0. . .0.27 (0.02) 62 0.23 0.01. . .1.17 (0.11) 148 +77
0.75–1.75 0.25 0. . .2.04 (0.20) 252 0.08 0. . .0.52 (0.05) 200 -68
https://doi.org/10.1371/journal.pone.0204212.t004
Extractives in dried pine surface
PLOS ONE | https://doi.org/10.1371/journal.pone.0204212 October 10, 2018 8 / 12
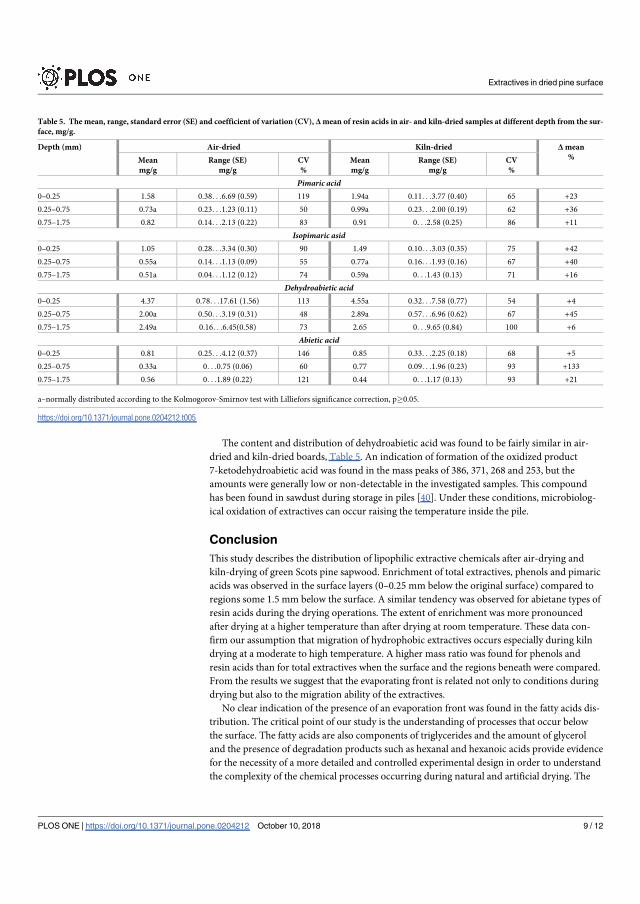
The content and distribution of dehydroabietic acid was found to be fairly similar in air-
dried and kiln-dried boards, Table 5. An indication of formation of the oxidized product
7-ketodehydroabietic acid was found in the mass peaks of 386, 371, 268 and 253, but the
amounts were generally low or non-detectable in the investigated samples. This compound
has been found in sawdust during storage in piles [40]. Under these conditions, microbiolog-
ical oxidation of extractives can occur raising the temperature inside the pile.
Conclusion
This study describes the distribution of lipophilic extractive chemicals after air-drying and
kiln-drying of green Scots pine sapwood. Enrichment of total extractives, phenols and pimaric
acids was observed in the surface layers (0–0.25 mm below the original surface) compared to
regions some 1.5 mm below the surface. A similar tendency was observed for abietane types of
resin acids during the drying operations. The extent of enrichment was more pronounced
after drying at a higher temperature than after drying at room temperature. These data con-
firm our assumption that migration of hydrophobic extractives occurs especially during kiln
drying at a moderate to high temperature. A higher mass ratio was found for phenols and
resin acids than for total extractives when the surface and the regions beneath were compared.
From the results we suggest that the evaporating front is related not only to conditions during
drying but also to the migration ability of the extractives.
No clear indication of the presence of an evaporation front was found in the fatty acids dis-
tribution. The critical point of our study is the understanding of processes that occur below
the surface. The fatty acids are also components of triglycerides and the amount of glycerol
and the presence of degradation products such as hexanal and hexanoic acids provide evidence
for the necessity of a more detailed and controlled experimental design in order to understand
the complexity of the chemical processes occurring during natural and artificial drying. The
Table 5. The mean, range, standard error (SE) and coefficient of variation (CV), Δmean of resin acids in air- and kiln-dried samples at different depth from the sur-
face, mg/g.
Depth (mm) Air-dried Kiln-dried Δ mean
%Mean
mg/g
Range (SE)
mg/g
CV
%
Mean
mg/g
Range (SE)
mg/g
CV
%
Pimaric acid0–0.25 1.58 0.38. . .6.69 (0.59) 119 1.94a 0.11. . .3.77 (0.40) 65 +23
0.25–0.75 0.73a 0.23. . .1.23 (0.11) 50 0.99a 0.23. . .2.00 (0.19) 62 +36
0.75–1.75 0.82 0.14. . .2.13 (0.22) 83 0.91 0. . .2.58 (0.25) 86 +11
Isopimaric asid0–0.25 1.05 0.28. . .3.34 (0.30) 90 1.49 0.10. . .3.03 (0.35) 75 +42
0.25–0.75 0.55a 0.14. . .1.13 (0.09) 55 0.77a 0.16. . .1.93 (0.16) 67 +40
0.75–1.75 0.51a 0.04. . .1.12 (0.12) 74 0.59a 0. . .1.43 (0.13) 71 +16
Dehydroabietic acid0–0.25 4.37 0.78. . .17.61 (1.56) 113 4.55a 0.32. . .7.58 (0.77) 54 +4
0.25–0.75 2.00a 0.50. . .3.19 (0.31) 48 2.89a 0.57. . .6.96 (0.62) 67 +45
0.75–1.75 2.49a 0.16. . .6.45(0.58) 73 2.65 0. . .9.65 (0.84) 100 +6
Abietic acid0–0.25 0.81 0.25. . .4.12 (0.37) 146 0.85 0.33. . .2.25 (0.18) 68 +5
0.25–0.75 0.33a 0. . .0.75 (0.06) 60 0.77 0.09. . .1.96 (0.23) 93 +133
0.75–1.75 0.56 0. . .1.89 (0.22) 121 0.44 0. . .1.17 (0.13) 93 +21
a–normally distributed according to the Kolmogorov-Smirnov test with Lilliefors significance correction, p�0.05.
https://doi.org/10.1371/journal.pone.0204212.t005
Extractives in dried pine surface
PLOS ONE | https://doi.org/10.1371/journal.pone.0204212 October 10, 2018 9 / 12
development of robust predictive models for the assessment of wood properties requires more
detailed studies of the chemistry of wood drying. That makes it possible to calibrate an on-site
evaluation tool for the properties of dried timber and a better sorting for product
development.
Supporting information
S1 Table. Data set of lipophilic extractives pine from air-dried and kiln-dried sapwood
Scots pine.
(DOCX)
Acknowledgments
The authors wish to thank NORRA Timber, Skellefteå, Sweden for providing the test material.
Support from The European Regional Development Fund, the County Administration of Vas-
terbotten, the municipality of Skellefteå, and WoodCentre North is also greatly appreciated
and acknowledged. Financial support from the Swedish Research Council for the Environ-
ment, Agricultural Sciences and Spatial Planning (FORMAS) project “Experimental studies of
capillary phenomena in bio-based materials” 942-2016-64, “Fungal growth on modified wood-
based products under subarctic conditions” 2017–00419, is also gratefully acknowledged. Sup-
port from the COST Action FP1407 “ModWoodLife” project (Understanding wood modifica-
tion through an integrated scientific and environmental impact approach), is gratefully
acknowledged.
Author Contributions
Conceptualization: Dick Sandberg.
Data curation: Olena Myronycheva.
Funding acquisition: Dick Sandberg.
Methodology: Margot Sehlstedt-Persson.
Project administration: Margot Sehlstedt-Persson.
Supervision: Olov Karlsson.
Validation: Micael Ohman.
Visualization: Micael Ohman.
Writing – original draft: Olena Myronycheva.
Writing – review & editing: Olov Karlsson, Micael Ohman, Dick Sandberg.
References1. Sehlstedt-Persson M, Wamming T. Wood drying process: impact on Scots pine lumber durability. J
Wood Sci. 2010; 56: 25–32. https://doi.org/10.1007/s10086-009-1066-9
2. Stehr M, Johansson I. Weak boundary layers on wood surfaces. J Adhes Sci Technol. 2000; 14: 1211–
1224. https://doi.org/10.1163/156856100742168
3. Bikerman JJ. Causes of poor adhesion: weak boundary layers. Ind Eng Chem. 1967; 59: 40–44. https://
doi.org/10.1021/ie51403a010
4. Chong ET, Achmadi SS. Effect of Extractives on Moisture Sorption and Shrinkage in Tropical Woods.
Wood and Fiber science. 1991; 23: 185–196.
Extractives in dried pine surface
PLOS ONE | https://doi.org/10.1371/journal.pone.0204212 October 10, 2018 10 / 12
5. Ahmed SA, Sehlstedt-Persson M, Karlsson O, Moren T. Uneven distribution of preservative in kiln-dried
sapwood lumber of Scots pine: Impact of wood structure and resin allocation. Holzforschung. 2012;66.
https://doi.org/10.1515/HF.2011.126
6. Sehlstedt-Persson M. Impact of drying and heat treatment on physical properties and durability of solid
wood [Internet]. Doctoral thesis, Luleå tekniska universitet. 2008. Available: http://pure.ltu.se/portal/en/
publications/impact-of-drying-and-heat-treatment-on-physical-properties-and-durability-of-solid-wood
(187a1050-9c37-11dd-94de-000ea68e967b)/export.html
7. Terziev N. Migration of Low-Molecular Sugars and Nitrogenous Compounds in Pinus sylvestris L. Dur-
ing Kiln and Air Drying. Holzforsch—Int J Biol Chem Phys Technol Wood. 2009; 49: 565–574. https://
doi.org/10.1515/hfsg.1995.49.6.565
8. Theander O, Bjurman J, Boutelje JB. Increase in the content of low-molecular carbohydrates at lumber
surfaces during drying and correlations with nitrogen content, yellowing and mould growth. Wood Sci
Technol. 1993; 27: 381–389. https://doi.org/10.1007/BF00192224
9. McDonald AG, Fernandez M, Kreber B, Laytner F. The Chemical Nature of Kiln Brown Stain in Radiata
Pine. Holzforschung. 2000;54. https://doi.org/10.1515/HF.2000.003
10. Haitong Song. Impact of drying conditions, wood extractives and structure to uneven distribution of pre-
servatives in Scots pine [Internet]. 2012. Available: http://pure.ltu.se/portal/sv/studentthesis/impact-of-
drying-conditions-wood-extractives-and-structure-to-uneven-distribution-of-preservatives-in-scots-pine
(86fd9f97-9e84-426a-9d39-9409b417617f).html
11. Fengel D, Wegener G. Wood: chemistry, ultrastructure, reactions. Berlin; New York: W. de Gruyter;
1984.
12. Sjostrom E. Wood chemistry: fundamentals and applications [Internet]. 1993. Available: http://search.
ebscohost.com/login.aspx?direct=true&scope=site&db=nlebk&db=nlabk&AN=944240
13. Fromm J, editor. Cellular aspects of wood formation. Berlin; New York: Springer; 2013.
14. Ek M, Gellerstedt G, Henriksson G. Pulp and paper chemistry and technology. Volume 1, Volume 1,
[Internet]. Berlin: Walter de Gruyter; 2009. Available: http://public.eblib.com/choice/publicfullrecord.
aspx?p=476006
15. Terziev N, Boutelje J, Larsson K. Seasonal fluctuations of low-molecular-weight sugars, starch and
nitrogen in sapwood of Pinus sylvestris L. Scand J For Res. 1997; 12: 216–224. https://doi.org/10.1080/
02827589709355403
16. Uggla C, Magel E, Moritz T, Sundberg B. Function and Dynamics of Auxin and Carbohydrates during
Earlywood/Latewood Transition in Scots Pine. Plant Physiol. 2001; 125: 2029–2039. https://doi.org/10.
1104/pp.125.4.2029 PMID: 11299382
17. Fischer C, Holl W. Food reserves of scots pine (Pinus sylvestris L.). Trees. 1992; 6: 147–155. https://
doi.org/10.1007/BF00202430
18. Bergstrom B. Chemical and structural changes during heartwood formation in Pinus sylvestris. Forestry.
2003; 76: 45–53. https://doi.org/10.1093/forestry/76.1.45
19. Langenheim JH. Plant resins: chemistry, evolution, ecology, and ethnobotany. Portland, Or: Timber
Press; 2003.
20. Keeling CI, Bohlmann J. Diterpene resin acids in conifers. Phytochemistry. 2006; 67: 2415–2423.
https://doi.org/10.1016/j.phytochem.2006.08.019 PMID: 16996548
21. Witzell J, Martın JA. Phenolic metabolites in the resistance of northern forest trees to pathogens—past
experiences and future prospects. Can J For Res. 2008; 38: 2711–2727. https://doi.org/10.1139/X08-
112
22. Willfor S, Hemming J, Reunanen M, Holmbom B. Phenolic and Lipophilic Extractives in Scots Pine
Knots and Stemwood. Holzforschung. 2005; 57: 359–372. https://doi.org/10.1515/HF.2003.054
23. Saranpaa P, Nyberg H. Lipids and sterols of Pinus sylvestris L. sapwood and heartwood. Trees. 1987;
1: 82–87. https://doi.org/10.1007/BF00203575
24. Piispanen R, Saranpaa P. Neutral lipids and phospholipids in Scots pine (Pinus sylvestris) sapwood
and heartwood. Tree Physiology. 2002; 22: 661–666. https://doi.org/10.1093/treephys/22.9.661 PMID:
12069923
25. Nagy NE, Krokene P, Solheim H. Anatomical-based defense responses of Scots pine (Pinus sylvestris)
stems to two fungal pathogens. Tree Physiol. 2006; 26: 159–167. https://doi.org/10.1093/treephys/26.
2.159 PMID: 16356912
26. Terziev N, Boutelje J. Effect of Felling Time and Kiln-Drying on Color and Susceptibility of Wood to Mold
and Fungal Stain During an Above-Ground Field Test. Wood Fiber Sci. 2007; 30: 360–367.
27. Wiberg P, Sehlstedt-P SMB, Moren TJ. Heat and Mass Transfer During Sapwood Drying Above the
Fibre Saturation Point. Dry Technol. 2000; 18: 1647–1664. https://doi.org/10.1080/07373930008917804
Extractives in dried pine surface
PLOS ONE | https://doi.org/10.1371/journal.pone.0204212 October 10, 2018 11 / 12
28. SS-EN 13183–1. Moisture content of a piece of sawn timber—Part 1: Determination by oven dry
method [Internet]. SIS; 2004. Available: http://www.sis.se/en/wood-technology/wood-sawlogs-and-
sawn-timber/ss-en-13183-1
29. SCAN. CM 49:03. Wood chips for pulp production and pulp—Content of acetone-soluble matter. PFI;
30. Sjostrom E, Alen R. Analytical Methods in Wood Chemistry, Pulping, and Papermaking [Internet]. Ber-
lin, Heidelberg: Springer Berlin Heidelberg; 1999. Available: http://dx.doi.org/10.1007/978-3-662-
03898-7
31. Lai Y-Z. Determination of Phenolic Hydroxyl Groups. In: Lin DSY, Dence PEDCW, editors. Methods in
Lignin Chemistry. Springer Berlin Heidelberg; 1992. pp. 423–434. https://doi.org/10.1007/978-3-642-
74065-7_28
32. Johnson S. NIST Standard Reference Database 1A v14. In: NIST [Internet]. 19 Jun 2014 [cited 27 Sep
2016]. Available: https://www.nist.gov/srd/nist-standard-reference-database-1a-v14
33. Julkunen-Tiitto R. Phenolic constituents in the leaves of northern willows: methods for the analysis of
certain phenolics. J Agric Food Chem. 1985; 33: 213–217. https://doi.org/10.1021/jf00062a013
34. IBM. SPSS Statistics [Internet]. United States: IBM; 2014. Available: http://www-01.ibm.com/support/
docview.wss?uid=swg21509012
35. Dorado J, Claassen FW, Lenon G, van Beek TA, Wijnberg JBPA, Sierra-Alvarez R. Degradation and
detoxification of softwood extractives by sapstain fungi. Bioresour Technol. 2000; 71: 13–20. https://doi.
org/10.1016/S0960-8524(99)00060-7
36. Dorado J, Beek TA van, Claassen FW, Sierra-Alvarez R. Degradation of lipophilic wood extractive con-
stituents in Pinus sylvestris by the white-rot fungi Bjerkandera sp. and Trametes versicolor. Wood Sci
Technol. 2001; 35: 117–125. https://doi.org/10.1007/s002260000077
37. Normark M, Winestrand S, Lestander TA, Jonsson LJ. Analysis, pretreatment and enzymatic saccharifi-
cation of different fractions of Scots pine. BMC Biotechnol. 2014; 14: 20. https://doi.org/10.1186/1472-
6750-14-20 PMID: 24641769
38. Steckel V, Welling J, Ohlmeyer M. Product emissions of volatile organic compounds from convection
dried Norway spruce (Picea abies (L.) H. Karst.) timber. Int Wood Prod J. 2011; 2: 75–80. https://doi.
org/10.1179/2042645311Y.0000000007
39. Salehi AM, Henriksson G, Johansson M. Effect of wood carbohydrates on the oxidation of unsaturated
fatty acids. Prog Org Coat. 2013; 76: 1068–1074. https://doi.org/10.1016/j.porgcoat.2013.03.002
40. Arshadi M, Geladi P, Gref R, Fjallstrom P. Emission of volatile aldehydes and ketones from wood pellets
under controlled conditions. Ann Occup Hyg. 2009; 53: 797–805. https://doi.org/10.1093/annhyg/
mep058 PMID: 19666956
Extractives in dried pine surface
PLOS ONE | https://doi.org/10.1371/journal.pone.0204212 October 10, 2018 12 / 12

Paper III

Proceedings IRG Annual Meeting (ISSN 2000-8953) © 2017 The International Research Group on Wood Protection
IRG/WP 17-20629
THE INTERNATIONAL RESEARCH GROUP ON WOOD PROTECTION
Section 2 Test methodology and assessment
Multivariate modeling of mould growth in relation to extractives in
dried Scots pine sapwood
Olov Karlsson, Olena Myronycheva, Margot Sehlstedt-Persson, Micael Öhman,
Dick Sandberg
Luleå University of Technology
Wood Science and Engineering
Forskargatan 1
SE-931 87, Skellefteå, Sweden
Poster paper prepared for the IRG48 Scientific Conference on Wood Protection
Ghent, Belgium
4-8 June 2017
IRG SECRETARIAT
Box 5609
SE-114 86 Stockholm
Sweden
www.irg-wp.com
Disclaimer
The opinions expressed in this document are those of the author(s) and
are not necessarily the opinions or policy of the IRG Organization.
Multivariate Modeling of Mould Growth in Relation to Extractives
in Dried Scots Pine Sapwood
Olov Karlsson, Olena Myronycheva, Margot Sehlstedt-Persson, Micael Öhman, Dick Sandberg
Div. of Wood Sci. Eng., Luleå University of Technology, [email protected],
[email protected], [email protected], [email protected],
ABSTRACT
Influence of extractives on mould growth on Scots pine sapwood dried in air or in kiln was
studied. Boards were sprayed with water mixtures of spores of the fungal species Penicillium sp.,
Aspergillus sp., Mucor sp., Paecilomyces sp., Trichoderma sp., treated at a temperature of 22ºC
at 90% RH, classified into a percentage of covered area. Acetone and water extracts were
isolated and analyzed for sugars, nitrogen, ash, resin/fatty acids, glycerol, and phenols. A
multivariate Orthogonal Partial Least Squares (OPLS) regression model was developed to study
relations between the extent of mould coverage of boards and chemical content. The model
describes 51% variability in X and 69% in Y with prediction power of 55%. The results
indicated that total acetone soluble extractives and sugars like glucose contributed to increased
mould growth whereas fatty acids prevent mould growth.
Keywords: multivariate analysis, sapwood, fungi
1. INTRODUCTION
To be able to move towards a sustainable economy, further development in use of wood is of
great importance. However, some challenges need to be addressed which could hinder a
successful usage such as maintenance costs in multi-storey buildings, entrapment of moisture in
passive houses, climate changes, use of less harmful preservative and surface treatments, etc.
Outdoors, a fungal growth regarding moulds is mostly related to aesthetic issues, and increased
maintenance cost whereas indoor released toxins could influence people's health. Mould growth
on wooden boards can be linked to many factors such as moisture content and its variation due to
climate conditions, temperature, sawing pattern, wood surface roughness (Johansson et al. 2012,
Viitanen 1994). Often mould growth on sawn timber is observed near the edges which are close
to where the living tree grow, rather than in middle parts of the flat side. Higher content of
nutrients like sugars has been found in kiln-dried than in air-dried boards (Ahmed et al. 2013;
Sehlstedt-Persson et al. 2011, Terziev & Boutelje 2007). This phenomenon is due to the
migration of capillary water during the first parts of industrial drying, and that soluble
compounds follow and accumulates on the wood surface. Hindrance of such flow during drying
could explain the development of sticker marks sometimes found in moulded side-boards. The
presence of other nutrients on wooden boards such as nitrogen containing or fatty extractives has
been declared (Theander et al. 1993). The wood surface also contains other types of extractives,
and some of them are antioxidants and could influence or even hinder mould growth. The
purpose was to study the influence of the chemical composition of extractives on colonization of
selected mould fungi on Scots pine sapwood.
2. EXPERIMENTAL METHODS
Sapwood surface of ten kiln or air dried Scots pine sideboards (220L x 100W x 25T mm) were
studied. Air drying was performed indoor whereas boards from Scots pine were conventionally
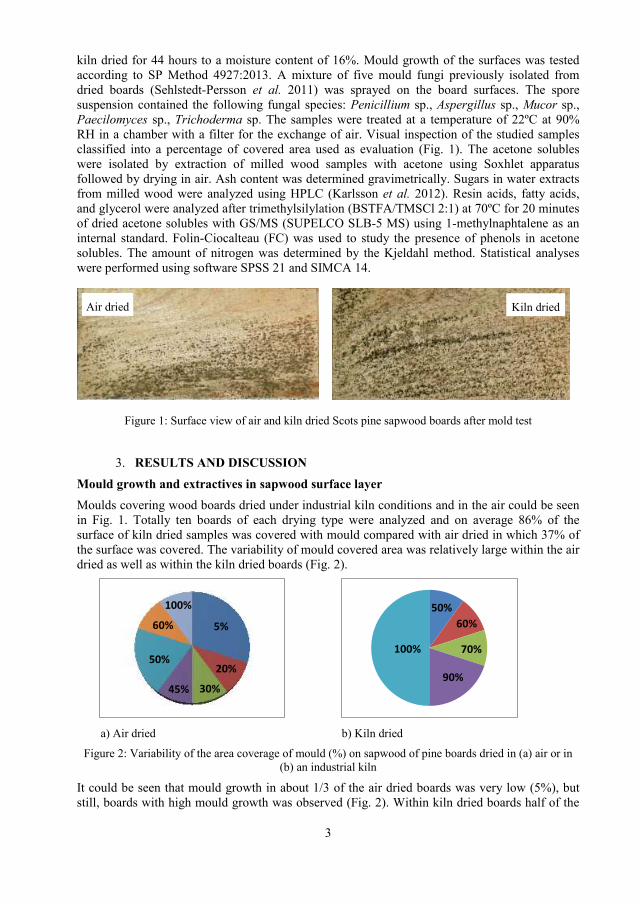
3
kiln dried for 44 hours to a moisture content of 16%. Mould growth of the surfaces was tested
according to SP Method 4927:2013. A mixture of five mould fungi previously isolated from
dried boards (Sehlstedt-Persson et al. 2011) was sprayed on the board surfaces. The spore
suspension contained the following fungal species: Penicillium sp., Aspergillus sp., Mucor sp.,
Paecilomyces sp., Trichoderma sp. The samples were treated at a temperature of 22ºC at 90%
RH in a chamber with a filter for the exchange of air. Visual inspection of the studied samples
classified into a percentage of covered area used as evaluation (Fig. 1). The acetone solubles
were isolated by extraction of milled wood samples with acetone using Soxhlet apparatus
followed by drying in air. Ash content was determined gravimetrically. Sugars in water extracts
from milled wood were analyzed using HPLC (Karlsson et al. 2012). Resin acids, fatty acids,
and glycerol were analyzed after trimethylsilylation (BSTFA/TMSCl 2:1) at 70ºC for 20 minutes
of dried acetone solubles with GS/MS (SUPELCO SLB-5 MS) using 1-methylnaphtalene as an
internal standard. Folin-Ciocalteau (FC) was used to study the presence of phenols in acetone
solubles. The amount of nitrogen was determined by the Kjeldahl method. Statistical analyses
were performed using software SPSS 21 and SIMCA 14.
Figure 1: Surface view of air and kiln dried Scots pine sapwood boards after mold test
3. RESULTS AND DISCUSSION
Mould growth and extractives in sapwood surface layer
Moulds covering wood boards dried under industrial kiln conditions and in the air could be seen
in Fig. 1. Totally ten boards of each drying type were analyzed and on average 86% of the
surface of kiln dried samples was covered with mould compared with air dried in which 37% of
the surface was covered. The variability of mould covered area was relatively large within the air
dried as well as within the kiln dried boards (Fig. 2).
a) Air dried b) Kiln dried
Figure 2: Variability of the area coverage of mould (%) on sapwood of pine boards dried in (a) air or in
(b) an industrial kiln
It could be seen that mould growth in about 1/3 of the air dried boards was very low (5%), but
still, boards with high mould growth was observed (Fig. 2). Within kiln dried boards half of the
5%
20%
30% 45%
50%
60%
100%
100%
50%
60%
70%
90%
Air dried Kiln dried
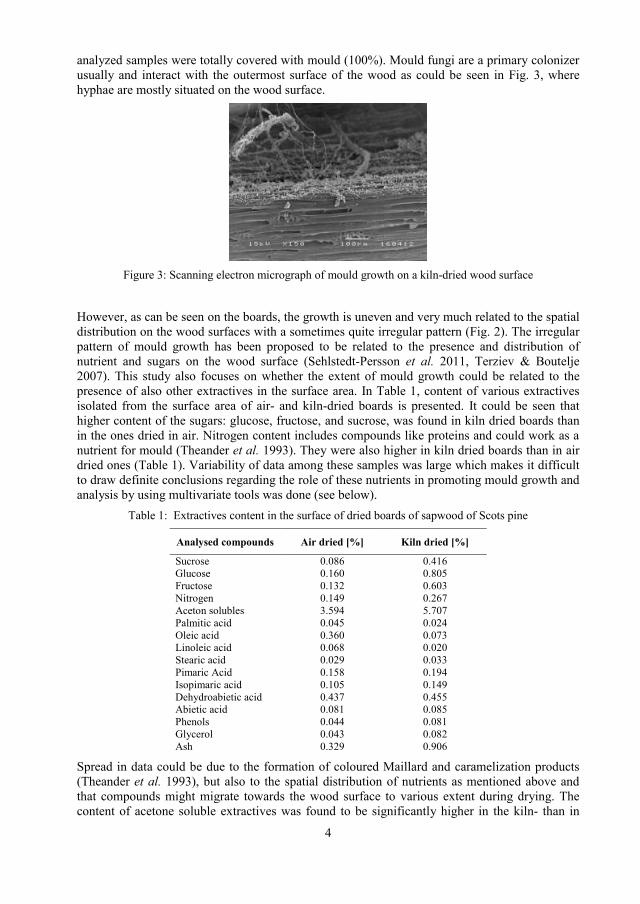
4
analyzed samples were totally covered with mould (100%). Mould fungi are a primary colonizer
usually and interact with the outermost surface of the wood as could be seen in Fig. 3, where
hyphae are mostly situated on the wood surface.
Figure 3: Scanning electron micrograph of mould growth on a kiln-dried wood surface
However, as can be seen on the boards, the growth is uneven and very much related to the spatial
distribution on the wood surfaces with a sometimes quite irregular pattern (Fig. 2). The irregular
pattern of mould growth has been proposed to be related to the presence and distribution of
nutrient and sugars on the wood surface (Sehlstedt-Persson et al. 2011, Terziev & Boutelje
2007). This study also focuses on whether the extent of mould growth could be related to the
presence of also other extractives in the surface area. In Table 1, content of various extractives
isolated from the surface area of air- and kiln-dried boards is presented. It could be seen that
higher content of the sugars: glucose, fructose, and sucrose, was found in kiln dried boards than
in the ones dried in air. Nitrogen content includes compounds like proteins and could work as a
nutrient for mould (Theander et al. 1993). They were also higher in kiln dried boards than in air
dried ones (Table 1). Variability of data among these samples was large which makes it difficult
to draw definite conclusions regarding the role of these nutrients in promoting mould growth and
analysis by using multivariate tools was done (see below).
Table 1: Extractives content in the surface of dried boards of sapwood of Scots pine
Analysed compounds Air dried [%] Kiln dried [%]
Sucrose
Glucose
Fructose
Nitrogen
Aceton solubles
Palmitic acid
Oleic acid
Linoleic acid
Stearic acid
Pimaric Acid
Isopimaric acid
Dehydroabietic acid
Abietic acid
Phenols
Glycerol
Ash
0.086
0.160
0.132
0.149
3.594
0.045
0.360
0.068
0.029
0.158
0.105
0.437
0.081
0.044
0.043
0.329
0.416
0.805
0.603
0.267
5.707
0.024
0.073
0.020
0.033
0.194
0.149
0.455
0.085
0.081
0.082
0.906
Spread in data could be due to the formation of coloured Maillard and caramelization products
(Theander et al. 1993), but also to the spatial distribution of nutrients as mentioned above and
that compounds might migrate towards the wood surface to various extent during drying. The
content of acetone soluble extractives was found to be significantly higher in the kiln- than in
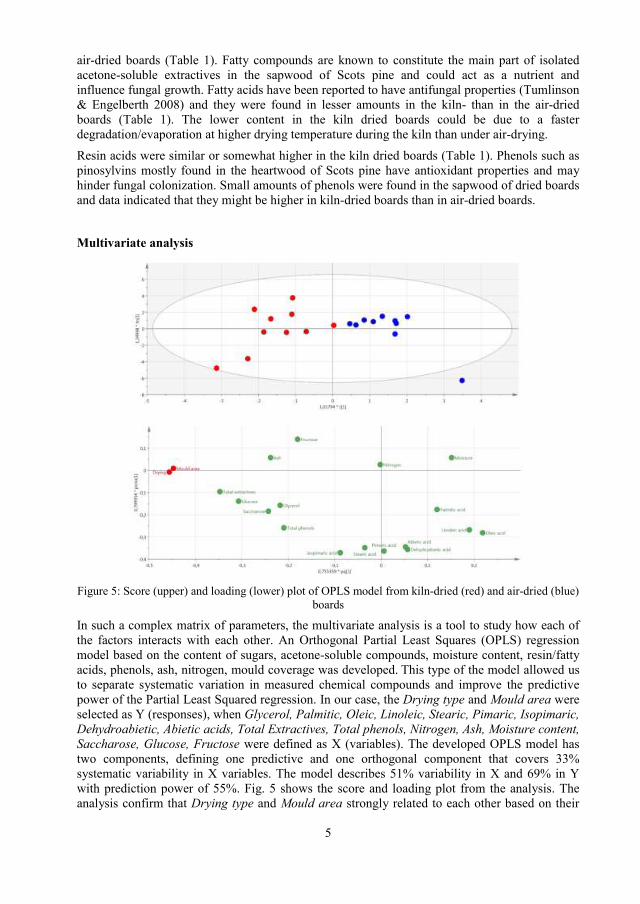
5
air-dried boards (Table 1). Fatty compounds are known to constitute the main part of isolated
acetone-soluble extractives in the sapwood of Scots pine and could act as a nutrient and
influence fungal growth. Fatty acids have been reported to have antifungal properties (Tumlinson
& Engelberth 2008) and they were found in lesser amounts in the kiln- than in the air-dried
boards (Table 1). The lower content in the kiln dried boards could be due to a faster
degradation/evaporation at higher drying temperature during the kiln than under air-drying.
Resin acids were similar or somewhat higher in the kiln dried boards (Table 1). Phenols such as
pinosylvins mostly found in the heartwood of Scots pine have antioxidant properties and may
hinder fungal colonization. Small amounts of phenols were found in the sapwood of dried boards
and data indicated that they might be higher in kiln-dried boards than in air-dried boards.
Multivariate analysis
Figure 5: Score (upper) and loading (lower) plot of OPLS model from kiln-dried (red) and air-dried (blue)
boards
In such a complex matrix of parameters, the multivariate analysis is a tool to study how each of
the factors interacts with each other. An Orthogonal Partial Least Squares (OPLS) regression
model based on the content of sugars, acetone-soluble compounds, moisture content, resin/fatty
acids, phenols, ash, nitrogen, mould coverage was developed. This type of the model allowed us
to separate systematic variation in measured chemical compounds and improve the predictive
power of the Partial Least Squared regression. In our case, the Drying type and Mould area were
selected as Y (responses), when Glycerol, Palmitic, Oleic, Linoleic, Stearic, Pimaric, Isopimaric,
Dehydroabietic, Abietic acids, Total Extractives, Total phenols, Nitrogen, Ash, Moisture content,
Saccharose, Glucose, Fructose were defined as X (variables). The developed OPLS model has
two components, defining one predictive and one orthogonal component that covers 33%
systematic variability in X variables. The model describes 51% variability in X and 69% in Y
with prediction power of 55%. Fig. 5 shows the score and loading plot from the analysis. The
analysis confirm that Drying type and Mould area strongly related to each other based on their
6
presence in the loading plot (Fig. 5). It could also be seen that Total extractives content and other
variables such as Glucose are situated quite close to Mould area in the loading plot whereas
others like Nitrogen seemed not to contribute to the developed model. A negative influence on
mould area is indicated for fatty acids such as for Oleic acid (Fig. 5).
4. CONCLUSIONS
To reach deeper in understanding on how mould grows on dried pine sapwood surfaces probably
also other characterization parameters such as spatial distribution has to be included to obtain a
more valid model. Furthermore, growth conditions of moulds depend on the species and the
microclimate on the wood surface and its physical properties.
5. REFERENCES
Ahmed, S. A., Sehlstedt-Persson, M. & Morén, T. (2013). Development of a new rapid method
for mould testing in a climate chamber: preliminary tests. Eur J Wood Wood Prod, 71(4), 451–
461.
Johansson, P., Ekstrand-Tobin, A., Svensson, T. & Bok, G. (2012). Laboratory study to
determine the critical moisture level for mould growth on building materials. Int Biodeter
Biodegr, 73, 23–32.
Karlsson, O., Yang, Q., Sehlstedt-Persson, M. & Morén, T. (2012). Heat treatments of high
temperature dried Norway spruce boards: Saccharides and furfurals in sapwood surfaces.
BioResources 7(2), 2284–2299.
Sehlstedt-Persson, M., Karlsson, O., Wamming, T. & Morèn, T. (2011). Mold Growth on
Sapwood Boards Exposed Outdoors: The Impact of Wood Drying. Forest Prod J, 61(2), 170–
179.
Terziev, N. & Boutelje, J. (2007). Effect of Felling Time and Kiln-Drying on Color and
Susceptibility of Wood to Mold and Fungal Stain During an Above-Ground Field Test. Wood
Fiber Sci, 30(4), 360–367.
Theander, O., Bjurman, J., & Boutelje, J. B. (1993). Increase in the content of low-molecular
carbohydrates at lumber surfaces during drying and correlations with nitrogen content, yellowing
and mould growth. Wood Sci Technol, 27(5), 381–389.
Tumlinson, J.H., Engelberth, J., 2008. Fatty Acid-Derived Signals that Induce or Regulate Plant
Defenses Against Herbivory, in: Schaller, A. (Ed.), Induced Plant Resistance to Herbivory.
Springer Netherlands, Dordrecht, pp. 389–407.
Viitanen, H. (1994). Factors affecting the development of biodeterioration in wooden
constructions. Mater Struc, 27(8), 483–493.

Paper IV

PROCEEDINGS
9th European Conference on Wood Modification
Burgers’ Zoo
Arnhem, The Netherlands
17-18 September 2018
In association with:
COST FP1407 ModWoodLife
Edited by:
Jos Creemers, Thomas Houben, Bôke Tjeerdsma, Holger Militz, Brigitte Junge
and Jos Gootjes
Secretariat:
SHR B.V.
Nieuwe Kanaal 9b
6709 PA Wageningen
www.ecwm9.shr.nl
2
Legal Notice
Although all reasonable efforts were made by the editorial team to ensure the scientific
quality of the contents of these conference proceedings, the final responsibility for the
contents of individual articles therein remains with the respective authors. The editors accept
no responsibility for the information contained herein. The inclusion of information in this
publication does not constitute any form of endorsement by the editors. The editorial team is
not responsible for the contents of external websites referred to in this publication.
No permission is required to reproduce or utilise the contents of these abstracts other than in
the case of diagrams, images, or other material from other copyright holders. In such cases the
permission of the original copyright holder must be obtained. The proceedings may be sited as
Proceedings of the 9th European Conference on Wood Modification 2018, Arnhem, The
Netherlands.
Copyright © SHR B.V.
Nieuwe Kanaal 9b, 6709 PA Wageningen, The Netherlands
www.shr.nl
ISBN: 978-90-829466-1-1

European Conference on Wood Modification 2018
155
Effects of thermal modification on bending properties and chemical
structure of Iroko and Padauk
Michal Kroupa1, Milan Gaff2, Olov Karlsson3, Olena Myronycheva4, Dick
Sandberg5
1Department of Wood Processing, Czech University of Life Science in Prague, Kamycka 1176,
Praha 6-Suchdol, 16521 Czech Republic [email: [email protected]] 2Department of Wood Processing, Czech University of Life Science in Prague, Kamycka 1176,
Praha 6-Suchdol, 16521 Czech Republic [email: [email protected]] 3Division of Wood Science and Engineering, Luleå University of Technology, SE-93187
Skellefteå [email: [email protected]] 4Division of Wood Science and Engineering, Luleå University of Technology, SE-93187
Skellefteå [email: [email protected]] 5Division of Wood Science and Engineering, Luleå University of Technology, SE-93187
Skellefteå [email: [email protected]]
Keywords: bending properties, Milicia excelsa, Pterocarpus soyauxii, thermal modification,
bendability, modulus of rupture, extractives, phenols, pH, Ec, ash
ABSTRACT
The thermal modification process essentially involves a controlled degradation of the
wood, primarily resulting in the degradation of hemicelluloses. In this study, thermal
modification at temperatures of 160, 180 and 210 °C was used in superheated steam.
Examined wood samples were iroko (Milicia excelsa (Welw.) C.C. Berg) and padauk
(Pterocarpus soyauxii Taub.). Testing of bending properties was done according to the
Standard ČSN 49 0116 (ASTM 04.10 WoodD143-09). The samples were loaded by three-
point bending. Chemical analysis of total extractives and phenols content, pH and Ec
changes and ash content.
The results show that with the increasing temperature of the thermal modification process,
the modulus of rupture and density decreases. The force and deflection at the limit of
proportionality increased. The thermal modification process affected the chemical
characteristics of both species. The distribution of total extractives and phenols varied
strongly for iroko, but for padauk decrease with increased treatment temperature and time
was observed. Having a more detailed assessment of wood chemical changes and
degradation products from structural and non-structural wood components and their
resistance to biological attack is necessary for the future development of sustainable
technologies for the thermal treatment of iroko and padouk.
INTRODUCTION
Commercial tropical timber species such as iroko (Milicia excelsa (Welw.) C.C. Berg)
and padauk (Pterocarpus soyauxii Taub.) possess increasing demand in various wood
products applications (International Tropical Timber Organization (ITTO) 2018a, b) that
requires to develop modern timber processing technologies. Iroko is widespread in
tropical and subtropical Africa. The colour of Iroko is usually yellow to golden or medium
brown. It is very durable and resistant to rot and insect attack. Padauk can be found in
central and tropical west Africa. Its colour can vary, ranging from pale pinkish-orange to
deep brownish red. Padauk has excellent decay resistance and is rated as a durable to very
durable species. It is also resistant to termite attacks and of another type of insect attack.
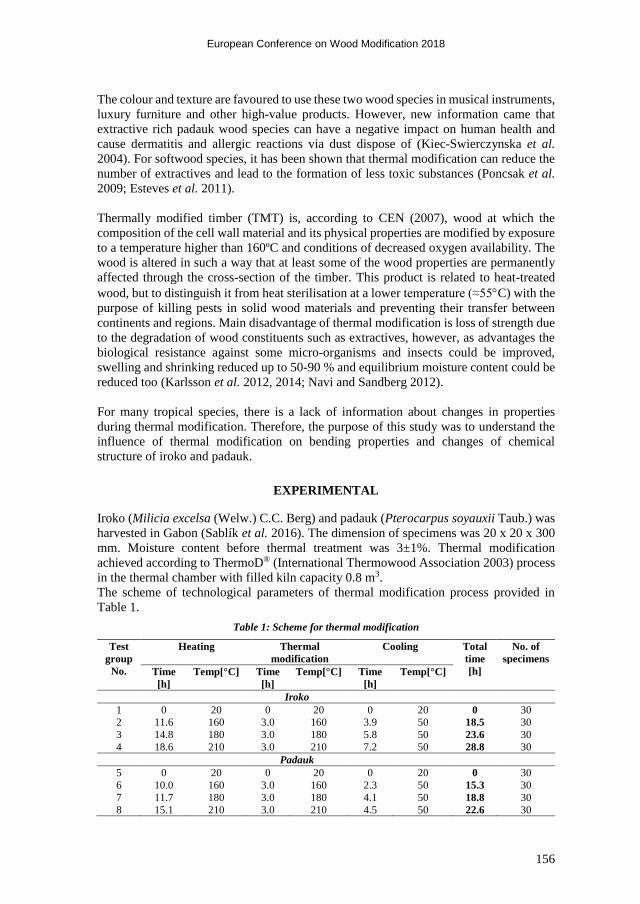
European Conference on Wood Modification 2018
156
The colour and texture are favoured to use these two wood species in musical instruments,
luxury furniture and other high-value products. However, new information came that
extractive rich padauk wood species can have a negative impact on human health and
cause dermatitis and allergic reactions via dust dispose of (Kiec-Swierczynska et al.
2004). For softwood species, it has been shown that thermal modification can reduce the
number of extractives and lead to the formation of less toxic substances (Poncsak et al.
2009; Esteves et al. 2011).
Thermally modified timber (TMT) is, according to CEN (2007), wood at which the
composition of the cell wall material and its physical properties are modified by exposure
to a temperature higher than 160ºC and conditions of decreased oxygen availability. The
wood is altered in such a way that at least some of the wood properties are permanently
affected through the cross-section of the timber. This product is related to heat-treated
wood, but to distinguish it from heat sterilisation at a lower temperature (≈55C) with the
purpose of killing pests in solid wood materials and preventing their transfer between
continents and regions. Main disadvantage of thermal modification is loss of strength due
to the degradation of wood constituents such as extractives, however, as advantages the
biological resistance against some micro-organisms and insects could be improved,
swelling and shrinking reduced up to 50-90 % and equilibrium moisture content could be
reduced too (Karlsson et al. 2012, 2014; Navi and Sandberg 2012).
For many tropical species, there is a lack of information about changes in properties
during thermal modification. Therefore, the purpose of this study was to understand the
influence of thermal modification on bending properties and changes of chemical
structure of iroko and padauk.
EXPERIMENTAL
Iroko (Milicia excelsa (Welw.) C.C. Berg) and padauk (Pterocarpus soyauxii Taub.) was
harvested in Gabon (Sablík et al. 2016). The dimension of specimens was 20 x 20 x 300
mm. Moisture content before thermal treatment was 3±1%. Thermal modification
achieved according to ThermoD® (International Thermowood Association 2003) process
in the thermal chamber with filled kiln capacity 0.8 m3.
The scheme of technological parameters of thermal modification process provided in
Table 1.
Table 1: Scheme for thermal modification
Test
group
No.
Heating Thermal
modification
Cooling Total
time
[h]
No. of
specimens
Time
[h]
Temp[°C] Time
[h]
Temp[°C] Time
[h]
Temp[°C]
Iroko
1 0 20 0 20 0 20 0 30
2 11.6 160 3.0 160 3.9 50 18.5 30
3 14.8 180 3.0 180 5.8 50 23.6 30
4 18.6 210 3.0 210 7.2 50 28.8 30
Padauk
5 0 20 0 20 0 20 0 30
6 10.0 160 3.0 160 2.3 50 15.3 30
7 11.7 180 3.0 180 4.1 50 18.8 30
8 15.1 210 3.0 210 4.5 50 22.6 30
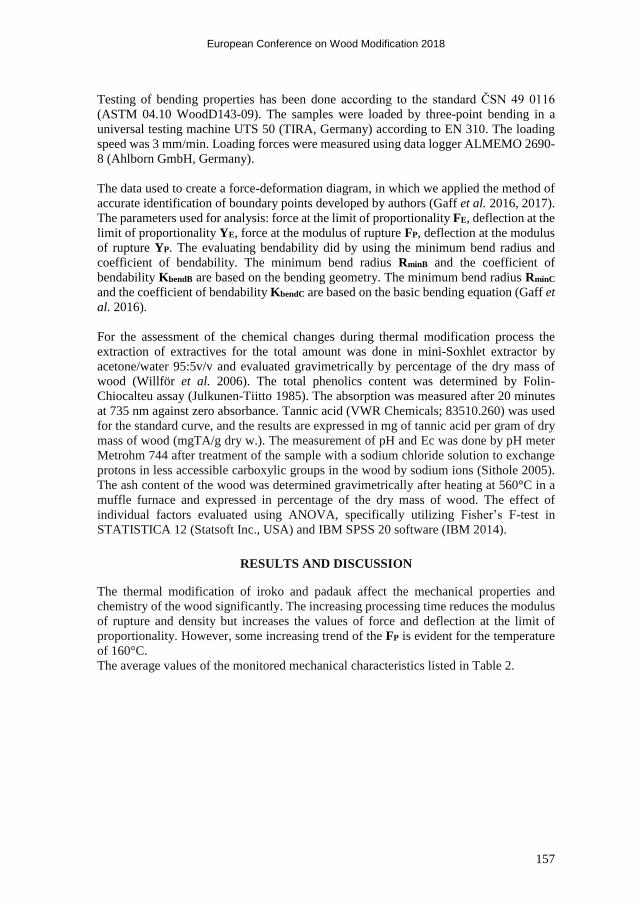
European Conference on Wood Modification 2018
157
Testing of bending properties has been done according to the standard ČSN 49 0116
(ASTM 04.10 WoodD143-09). The samples were loaded by three-point bending in a
universal testing machine UTS 50 (TIRA, Germany) according to EN 310. The loading
speed was 3 mm/min. Loading forces were measured using data logger ALMEMO 2690-
8 (Ahlborn GmbH, Germany).
The data used to create a force-deformation diagram, in which we applied the method of
accurate identification of boundary points developed by authors (Gaff et al. 2016, 2017).
The parameters used for analysis: force at the limit of proportionality FE, deflection at the
limit of proportionality YE, force at the modulus of rupture FP, deflection at the modulus
of rupture YP. The evaluating bendability did by using the minimum bend radius and
coefficient of bendability. The minimum bend radius RminB and the coefficient of
bendability KbendB are based on the bending geometry. The minimum bend radius RminC
and the coefficient of bendability KbendC are based on the basic bending equation (Gaff et
al. 2016).
For the assessment of the chemical changes during thermal modification process the
extraction of extractives for the total amount was done in mini-Soxhlet extractor by
acetone/water 95:5v/v and evaluated gravimetrically by percentage of the dry mass of
wood (Willför et al. 2006). The total phenolics content was determined by Folin-
Chiocalteu assay (Julkunen-Tiitto 1985). The absorption was measured after 20 minutes
at 735 nm against zero absorbance. Tannic acid (VWR Chemicals; 83510.260) was used
for the standard curve, and the results are expressed in mg of tannic acid per gram of dry
mass of wood (mgTA/g dry w.). The measurement of pH and Ec was done by pH meter
Metrohm 744 after treatment of the sample with a sodium chloride solution to exchange
protons in less accessible carboxylic groups in the wood by sodium ions (Sithole 2005).
The ash content of the wood was determined gravimetrically after heating at 560°C in a
muffle furnace and expressed in percentage of the dry mass of wood. The effect of
individual factors evaluated using ANOVA, specifically utilizing Fisher’s F-test in
STATISTICA 12 (Statsoft Inc., USA) and IBM SPSS 20 software (IBM 2014).
RESULTS AND DISCUSSION
The thermal modification of iroko and padauk affect the mechanical properties and
chemistry of the wood significantly. The increasing processing time reduces the modulus
of rupture and density but increases the values of force and deflection at the limit of
proportionality. However, some increasing trend of the FP is evident for the temperature
of 160°C.
The average values of the monitored mechanical characteristics listed in Table 2.
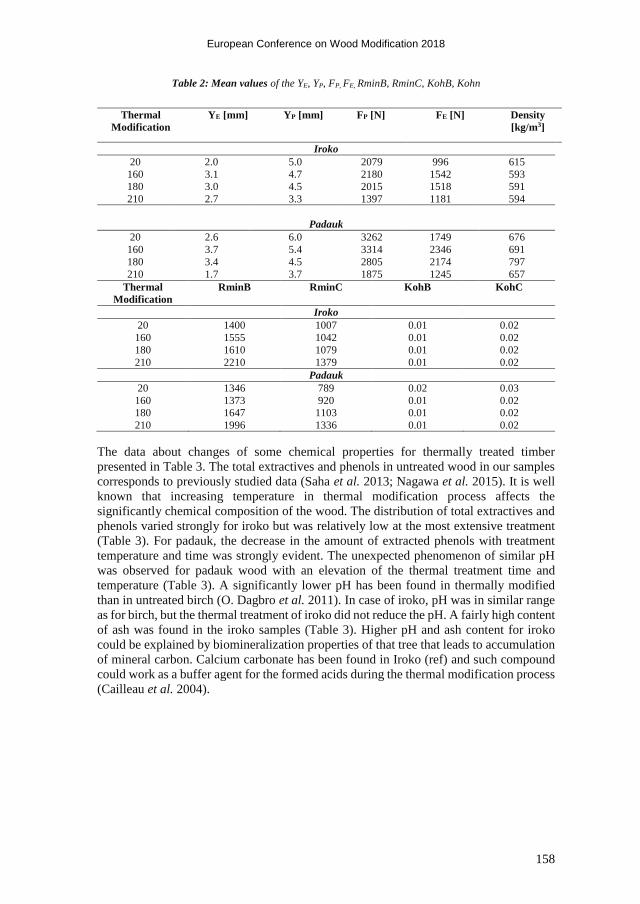
European Conference on Wood Modification 2018
158
Table 2: Mean values of the YE, YP, FP, FE, RminB, RminC, KohB, Kohn
Thermal
Modification
YE [mm] YP [mm] FP [N] FE [N] Density
[kg/m3]
Iroko
20 2.0 5.0 2079 996 615
160 3.1 4.7 2180 1542 593
180 3.0 4.5 2015 1518 591
210 2.7 3.3 1397 1181 594
Padauk
20 2.6 6.0 3262 1749 676
160 3.7 5.4 3314 2346 691
180 3.4 4.5 2805 2174 797
210 1.7 3.7 1875 1245 657
Thermal
Modification RminB RminC KohB KohC
Iroko
20 1400 1007 0.01 0.02
160 1555 1042 0.01 0.02
180 1610 1079 0.01 0.02
210 2210 1379 0.01 0.02
Padauk
20 1346 789 0.02 0.03
160 1373 920 0.01 0.02
180 1647 1103 0.01 0.02
210 1996 1336 0.01 0.02
The data about changes of some chemical properties for thermally treated timber
presented in Table 3. The total extractives and phenols in untreated wood in our samples
corresponds to previously studied data (Saha et al. 2013; Nagawa et al. 2015). It is well
known that increasing temperature in thermal modification process affects the
significantly chemical composition of the wood. The distribution of total extractives and
phenols varied strongly for iroko but was relatively low at the most extensive treatment
(Table 3). For padauk, the decrease in the amount of extracted phenols with treatment
temperature and time was strongly evident. The unexpected phenomenon of similar pH
was observed for padauk wood with an elevation of the thermal treatment time and
temperature (Table 3). A significantly lower pH has been found in thermally modified
than in untreated birch (O. Dagbro et al. 2011). In case of iroko, pH was in similar range
as for birch, but the thermal treatment of iroko did not reduce the pH. A fairly high content
of ash was found in the iroko samples (Table 3). Higher pH and ash content for iroko
could be explained by biomineralization properties of that tree that leads to accumulation
of mineral carbon. Calcium carbonate has been found in Iroko (ref) and such compound
could work as a buffer agent for the formed acids during the thermal modification process
(Cailleau et al. 2004).
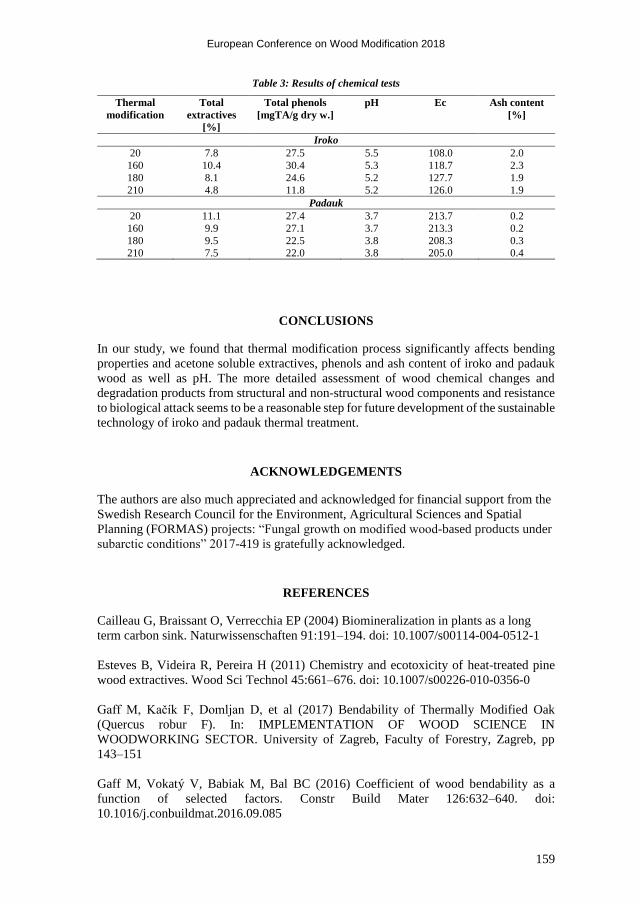
European Conference on Wood Modification 2018
159
Table 3: Results of chemical tests
Thermal
modification Total
extractives
[%]
Total phenols
[mgTA/g dry w.]
pH Ec Ash content
[%]
Iroko
20 7.8 27.5 5.5 108.0 2.0
160 10.4 30.4 5.3 118.7 2.3
180 8.1 24.6 5.2 127.7 1.9
210 4.8 11.8 5.2 126.0 1.9
Padauk
20 11.1 27.4 3.7 213.7 0.2
160 9.9 27.1 3.7 213.3 0.2
180 9.5 22.5 3.8 208.3 0.3
210 7.5 22.0 3.8 205.0 0.4
CONCLUSIONS
In our study, we found that thermal modification process significantly affects bending
properties and acetone soluble extractives, phenols and ash content of iroko and padauk
wood as well as pH. The more detailed assessment of wood chemical changes and
degradation products from structural and non-structural wood components and resistance
to biological attack seems to be a reasonable step for future development of the sustainable
technology of iroko and padauk thermal treatment.
ACKNOWLEDGEMENTS
The authors are also much appreciated and acknowledged for financial support from the
Swedish Research Council for the Environment, Agricultural Sciences and Spatial
Planning (FORMAS) projects: “Fungal growth on modified wood-based products under
subarctic conditions” 2017-419 is gratefully acknowledged.
REFERENCES
Cailleau G, Braissant O, Verrecchia EP (2004) Biomineralization in plants as a long
term carbon sink. Naturwissenschaften 91:191–194. doi: 10.1007/s00114-004-0512-1
Esteves B, Videira R, Pereira H (2011) Chemistry and ecotoxicity of heat-treated pine
wood extractives. Wood Sci Technol 45:661–676. doi: 10.1007/s00226-010-0356-0
Gaff M, Kačík F, Domljan D, et al (2017) Bendability of Thermally Modified Oak
(Quercus robur F). In: IMPLEMENTATION OF WOOD SCIENCE IN
WOODWORKING SECTOR. University of Zagreb, Faculty of Forestry, Zagreb, pp
143–151
Gaff M, Vokatý V, Babiak M, Bal BC (2016) Coefficient of wood bendability as a
function of selected factors. Constr Build Mater 126:632–640. doi:
10.1016/j.conbuildmat.2016.09.085
European Conference on Wood Modification 2018
160
IBM (2014) SPSS Statistics. IBM, United States International ThermoWood Association
(2003) ThermoWood Handbook International Tropical Timber Organization (ITTO)
(2018a) Iroko (Milicia excelsa). In: ITTO. http://www.tropicaltimber.info/specie/iroko-
milicia-excelsa/. Accessed 13 Jun 2018
International Tropical Timber Organization (ITTO) (2018b) Padouk d`Afrique
(Pterocarpus soyauxii). In: ITTO. http://www.tropicaltimber.info/specie/padouk-
dafrique-pterocarpus-soyauxii/. Accessed 13 Jun 2018
Julkunen-Tiitto R (1985) Phenolic constituents in the leaves of northern willows: methods
for the analysis of certain phenolics. J Agric Food Chem 33:213–217. doi:
10.1021/jf00062a013
Karlsson O, Dagbro O, Granlund K (2014) Soluble degradation products in thermally
modified wood. In: Final Cost Action FP0904 Conference : “Recent Advances in the Field
of TH and THM Wood Treatment.” Luleå tekniska universitet, Skelleftea, pp 16–17
Karlsson O, Torniainen P, Dagbro O, et al (2012) Presence of water-soluble compounds
in thermally modified wood : carbohydrates and furfurals. BioResources 7:3679–3689
Kiec-Swierczynska M, Krecisz B, Swierczynska-Machura D, Palczynski C (2004)
Occupational allergic contact dermatits caused by padauk wood (Pterocarpus soyauxii
Taub.). Contact Dermatitis 50:384–385. doi: 10.1111/j.0105-1873.2004.0350k.x
Nagawa CB, Böhmdorfer S, Rosenau T (2015) Chemical composition of volatiles
extracted from indigenous tree species of Uganda: composition of bark extracts from
Psorospermum febrifugum and Milicia excelsa. Holzforschung 69:815–821. doi:
10.1515/hf-2014-0283
Navi P, Sandberg D (2012) Thermo-Hydro-Mechanical Wood Processing. CRC Press
O. Dagbro, P. Torniainen, T. Morén (2011) Thermal modification of birch using saturated
and superheated steam. In: DIVA. Norsk institutt for skog og landskap, pp 43–48
Poncsak S, Kocaefe D, Simard F, Pichette A (2009) Evolution of extractive composition
during thermal treatment of Jack pine. J Wood Chem Technol 29:251–264. doi:
10.1080/02773810902928582
Sablík P, Giagli K, Pařil P, et al (2016) Impact of extractive chemical compounds from
durable wood species on fungal decay after impregnation of nondurable wood species.
Eur J Wood Wood Prod 74:231–236. doi: 10.1007/s00107-015-0984-z
Saha J-BT, Abia D, Dumarçay S, et al (2013) Antioxidant activities, total phenolic
contents and chemical compositions of extracts from four Cameroonian woods: Padouk
(Pterocarpus soyauxii Taubb), tali (Erythrophleum suaveolens), moabi (Baillonella
toxisperma), and movingui (Distemonanthus benthamianus). Ind Crops Prod 41:71–77.
doi: 10.1016/j.indcrop.2012.04.012
European Conference on Wood Modification 2018
161
Sithole B (2005) New Method of Measuring the pH of Wood Chips. 59th Appita Annu
Conf Exhib Inc 13th ISWFPC Int Symp Wood Fibre Pulping Chem Auckl N Z 16-19
May 2005 Proc 391
Willför S, Hemming J, Leppänen A-S (2006) Analysis of extractives in different pulps –
Method development, evaluation, and recommendations. Laboratory of Wood and Paper
Chemistry, Åbo Academi University


Paper V

PEER-REVIEWED ARTICLE bioresources.com
Elustondo et al. (2017). “Wood surface modification,” BioResources 12(1), 283-295. 283
Localized Wood Surface Modification, Part I: Method Characterization Diego Elustondo,a Olena Myronycheva,a Bror Sundqvist,b and Olov Karlsson a
This study assesses the potential of an open process for treatment of European Scots pine (Pinus sylvestris) with chemicals that could potentially make the surfaces stronger, more dimensionally stable, or more durable, depending on the treatment solution. The method provides an intermediate solution between full volume impregnation by pressure treatment and superficial surface treatment by dipping. Figuratively speaking, the process creates the equivalent of a layer of coating applied below the wood surfaces rather than above. Two different techniques were compared, namely, heating-and-cooling (H&C) and compression-and-expansion (C&E). Taking into account that commercial suppliers recommend 0.15 to 0.25 L/m2 of coating in sawn wood and 0.1 to 0.15 L/m2 in planed wood surfaces, then this study demonstrates that the H&C method can impregnate an equivalent amount of solution under the surfaces in less than 15 min using treatment temperatures below 150 °C.
Keywords: Scots pine; Wood surface modification; Heating-and-cooling; Compression-and-expansion
Contact information: a: Luleå University of Technology, Division of Wood Science and Engineering,
Campus Skellefteå, Forskargatan 1, 93187 Skellefteå, Sweden; b: SP Technical Research Institute of
Sweden, Laboratorgränd 2, SE-931 77 Skellefteå, Sweden;
* Corresponding author: [email protected]
INTRODUCTION
Wood is a biodegradable material. Thus, surfaces that are exposed to the external environment (such as in cladding, decking, flooring, and furniture) experience a slow degradation that is caused by a combination of moisture, temperature, sunlight, mechanical abrasion, and biological attack (Williams 2005). This problem is exacerbated in wood that was obtained from the periphery of the logs - such as the so called "side boards" in Sweden - since sapwood has normally lower durability (Homan and Jorissen 2004). Coating is the most widely used method for protecting wood surfaces from weathering, but the time that the material can be used between maintenance cycles (service life) is limited. Typical wood cladding used in residential and low rise buildings must be re-painted and re-stained every five to seven years (Athena 2002).
This problem is leading society slowly but consistently towards a future in which a renewable material such as wood will be replaced by other much more energy-intensive industrial alternatives that may irreversibly change the planet for future generations. One possible solution is to modify the entire volume of wood by impregnation with chemicals that can make wood stronger, more stable, or more durable, depending on the application. Examples include acetylation, furfurylation, and impregnation with oils and resins (Homan and Jorissen 2004). Acetylation (impregnation with acetic anhydride) replaces the moisture-accessible hydroxyls groups in the wood with hydrophobic acetyl groups (Hill 2006). Furfurylation (impregnation with furfuryl alcohol) creates a highly branched
PEER-REVIEWED ARTICLE bioresources.com
Elustondo et al. (2017). “Wood surface modification,” BioResources 12(1), 283-295. 284
and cross-linked polymer bonded to the wood cell walls (Westin et al. 2003; Lande 2008). Impregnation with oils is an effective method to control the absorption of moisture in wood (Alireza 2011), while impregnation with resins refers to the application of solutions that polymerize inside the wood (Nurmi 1998; Gsöls et al. 2003). It is well known, for instance, that impregnation with phenol formaldehyde resins improve wood durability, water resistance, and dimensional stability of wood (Takahashi and Imamura 1990; Ryu et al. 1991; Deka and Saikia 2000; Hill 2006; Gabrielli and Kamke 2010).
The most widely used method for impregnating the entire volume of wood with chemicals is pressure treatment (Hunt and Garratt 1967; Ormrod and Van Dalfsen 1993; Richardson 2003). Pressure treatment is applied inside pressure chambers, typically steel cylinders (Kollmann and Côté 1984), in which the wood is first exposed to vacuum to remove the air and then to pressures in the order of 8.5 to 12 atm to force the penetration of chemicals (Forest Products Laboratory 2010). However, fully modified wood has not yet found a large number of applications, probably because of the high volume of chemicals and long processing times required to impregnate the entire volume of wood. This is reflected in the cost. It was estimated that the approximate market prices for fully acetylated wood, furfurylated wood, and wood impregnated with sodium-silicate were 10 to 4 times higher than untreated pine (Sandberg et al. 2013).
Another option for impregnating chemicals is by submerging the wood into the treatment solution and letting the chemicals penetrate by diffusion (Tamblyn 1985). This is customarily called dipping. Preservatives that can be dissolved in water or oils can be potentially absorbed by dipping. Reported treatment times have ranged from seconds or minutes (Kollmann and Côté 1984) to hours or even days (Blew 1948). In this study the objective is to test a third option that provides an intermediate solution between pressure treatment and dipping. Two different techniques were compared. These are referred to in this study as heating-and-cooling (H&C) and compression-and-expansion (C&E) methods. The H&C method consists of increasing the temperature of the wood and subsequently submerging it into treatment solution at room temperature (Crawford 1907). The C&E method consists in compressing the wood with a press and then allowing it to expand while submerged in treatment solution (Fry 1973; Inoue et al. 2008). In principle, both methods have the capacity to induce internal vacuum by reducing the density of the gases. The H&C method reduces the gas temperature at constant volume and the C&E method increases the gas volume at constant temperature. In this study the C&E method was only implemented to assess its potential in comparison with the H&C method, but the effect of the process parameters was not investigated further. The methods were implemented with European Scots pine (Pinus sylvestris) side boards which predominantly contain sapwood. EXPERIMENTAL Materials
The wood for this study was European Scots pine (Pinus sylvestris) supplied by Norra Skogsägarna sawmill in Kåge, Sweden. The boards were 19 mm thick in radial direction by 75 mm wide in the tangential direction by 5 m long in the longitudinal direction, and they contained mainly sapwood (referred as side boards in the industry). The boards thickness was reduced to approximately 18 mm with a planer, cut into 200 mm long sections free of knots and bark, and then end-sealed with commercial glue that
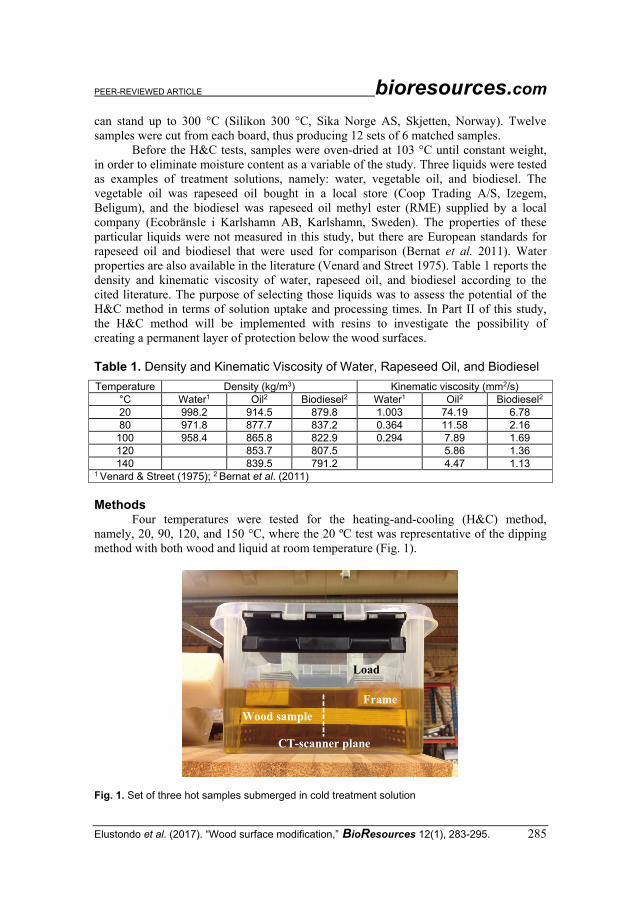
PEER-REVIEWED ARTICLE bioresources.com
Elustondo et al. (2017). “Wood surface modification,” BioResources 12(1), 283-295. 285
can stand up to 300 °C (Silikon 300 °C, Sika Norge AS, Skjetten, Norway). Twelve samples were cut from each board, thus producing 12 sets of 6 matched samples.
Before the H&C tests, samples were oven-dried at 103 °C until constant weight, in order to eliminate moisture content as a variable of the study. Three liquids were tested as examples of treatment solutions, namely: water, vegetable oil, and biodiesel. The vegetable oil was rapeseed oil bought in a local store (Coop Trading A/S, Izegem, Beligum), and the biodiesel was rapeseed oil methyl ester (RME) supplied by a local company (Ecobränsle i Karlshamn AB, Karlshamn, Sweden). The properties of these particular liquids were not measured in this study, but there are European standards for rapeseed oil and biodiesel that were used for comparison (Bernat et al. 2011). Water properties are also available in the literature (Venard and Street 1975). Table 1 reports the density and kinematic viscosity of water, rapeseed oil, and biodiesel according to the cited literature. The purpose of selecting those liquids was to assess the potential of the H&C method in terms of solution uptake and processing times. In Part II of this study, the H&C method will be implemented with resins to investigate the possibility of creating a permanent layer of protection below the wood surfaces.
Table 1. Density and Kinematic Viscosity of Water, Rapeseed Oil, and Biodiesel
Temperature Density (kg/m3) Kinematic viscosity (mm2/s)
°C Water1 Oil2 Biodiesel2 Water1 Oil2 Biodiesel2
20 998.2 914.5 879.8 1.003 74.19 6.78
80 971.8 877.7 837.2 0.364 11.58 2.16
100 958.4 865.8 822.9 0.294 7.89 1.69
120 853.7 807.5 5.86 1.36
140 839.5 791.2 4.47 1.13 1 Venard & Street (1975); 2 Bernat et al. (2011)
Methods
Four temperatures were tested for the heating-and-cooling (H&C) method, namely, 20, 90, 120, and 150 °C, where the 20 ºC test was representative of the dipping method with both wood and liquid at room temperature (Fig. 1).
Fig. 1. Set of three hot samples submerged in cold treatment solution
CT-scanner plane
Wood sample
Frame
Load
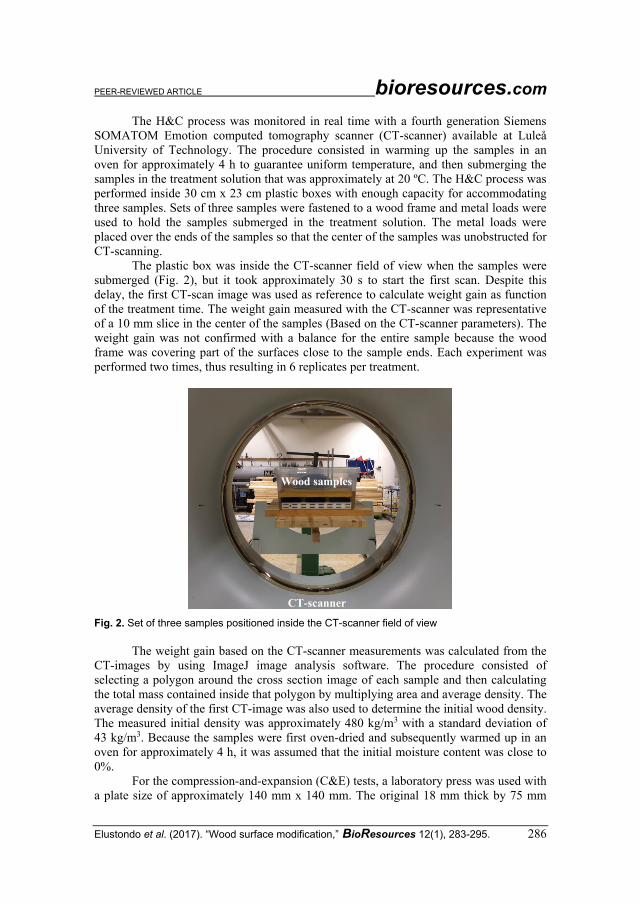
PEER-REVIEWED ARTICLE bioresources.com
Elustondo et al. (2017). “Wood surface modification,” BioResources 12(1), 283-295. 286
The H&C process was monitored in real time with a fourth generation Siemens SOMATOM Emotion computed tomography scanner (CT-scanner) available at Luleå University of Technology. The procedure consisted in warming up the samples in an oven for approximately 4 h to guarantee uniform temperature, and then submerging the samples in the treatment solution that was approximately at 20 ºC. The H&C process was performed inside 30 cm x 23 cm plastic boxes with enough capacity for accommodating three samples. Sets of three samples were fastened to a wood frame and metal loads were used to hold the samples submerged in the treatment solution. The metal loads were placed over the ends of the samples so that the center of the samples was unobstructed for CT-scanning.
The plastic box was inside the CT-scanner field of view when the samples were submerged (Fig. 2), but it took approximately 30 s to start the first scan. Despite this delay, the first CT-scan image was used as reference to calculate weight gain as function of the treatment time. The weight gain measured with the CT-scanner was representative of a 10 mm slice in the center of the samples (Based on the CT-scanner parameters). The weight gain was not confirmed with a balance for the entire sample because the wood frame was covering part of the surfaces close to the sample ends. Each experiment was performed two times, thus resulting in 6 replicates per treatment.
Fig. 2. Set of three samples positioned inside the CT-scanner field of view
The weight gain based on the CT-scanner measurements was calculated from the
CT-images by using ImageJ image analysis software. The procedure consisted of selecting a polygon around the cross section image of each sample and then calculating the total mass contained inside that polygon by multiplying area and average density. The average density of the first CT-image was also used to determine the initial wood density. The measured initial density was approximately 480 kg/m3 with a standard deviation of 43 kg/m3. Because the samples were first oven-dried and subsequently warmed up in an oven for approximately 4 h, it was assumed that the initial moisture content was close to 0%.
For the compression-and-expansion (C&E) tests, a laboratory press was used with a plate size of approximately 140 mm x 140 mm. The original 18 mm thick by 75 mm
Wood samples
CT-scanner
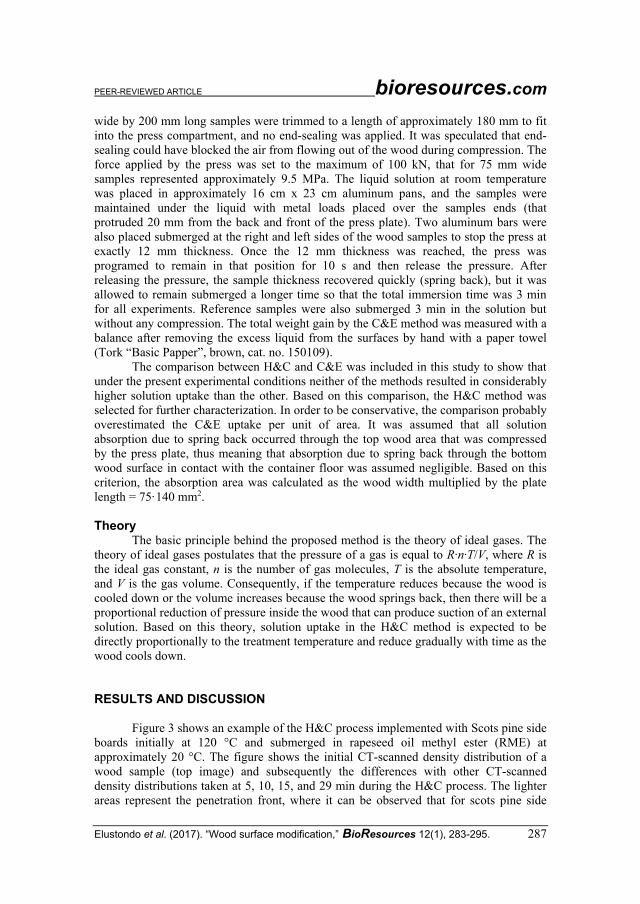
PEER-REVIEWED ARTICLE bioresources.com
Elustondo et al. (2017). “Wood surface modification,” BioResources 12(1), 283-295. 287
wide by 200 mm long samples were trimmed to a length of approximately 180 mm to fit into the press compartment, and no end-sealing was applied. It was speculated that end-sealing could have blocked the air from flowing out of the wood during compression. The force applied by the press was set to the maximum of 100 kN, that for 75 mm wide samples represented approximately 9.5 MPa. The liquid solution at room temperature was placed in approximately 16 cm x 23 cm aluminum pans, and the samples were maintained under the liquid with metal loads placed over the samples ends (that protruded 20 mm from the back and front of the press plate). Two aluminum bars were also placed submerged at the right and left sides of the wood samples to stop the press at exactly 12 mm thickness. Once the 12 mm thickness was reached, the press was programed to remain in that position for 10 s and then release the pressure. After releasing the pressure, the sample thickness recovered quickly (spring back), but it was allowed to remain submerged a longer time so that the total immersion time was 3 min for all experiments. Reference samples were also submerged 3 min in the solution but without any compression. The total weight gain by the C&E method was measured with a balance after removing the excess liquid from the surfaces by hand with a paper towel (Tork “Basic Papper”, brown, cat. no. 150109).
The comparison between H&C and C&E was included in this study to show that under the present experimental conditions neither of the methods resulted in considerably higher solution uptake than the other. Based on this comparison, the H&C method was selected for further characterization. In order to be conservative, the comparison probably overestimated the C&E uptake per unit of area. It was assumed that all solution absorption due to spring back occurred through the top wood area that was compressed by the press plate, thus meaning that absorption due to spring back through the bottom wood surface in contact with the container floor was assumed negligible. Based on this criterion, the absorption area was calculated as the wood width multiplied by the plate length = 75·140 mm2. Theory
The basic principle behind the proposed method is the theory of ideal gases. The theory of ideal gases postulates that the pressure of a gas is equal to R·n·T/V, where R is the ideal gas constant, n is the number of gas molecules, T is the absolute temperature, and V is the gas volume. Consequently, if the temperature reduces because the wood is cooled down or the volume increases because the wood springs back, then there will be a proportional reduction of pressure inside the wood that can produce suction of an external solution. Based on this theory, solution uptake in the H&C method is expected to be directly proportionally to the treatment temperature and reduce gradually with time as the wood cools down. RESULTS AND DISCUSSION
Figure 3 shows an example of the H&C process implemented with Scots pine side boards initially at 120 °C and submerged in rapeseed oil methyl ester (RME) at approximately 20 °C. The figure shows the initial CT-scanned density distribution of a wood sample (top image) and subsequently the differences with other CT-scanned density distributions taken at 5, 10, 15, and 29 min during the H&C process. The lighter areas represent the penetration front, where it can be observed that for scots pine side
PEER-REVIEWED ARTICLE bioresources.com
Elustondo et al. (2017). “Wood surface modification,” BioResources 12(1), 283-295. 288
boards the penetration front developed relatively uniformly below the wood surfaces, with some areas of course absorbing more RME than others. The core of the samples also showed a higher tendency to absorb solution, arguably because of internal tensions developed during the process. It is speculated that internal stresses may have been caused by swelling of the external wood surfaces in contact with the treatment solution, but this could not be detected with the CT-Scanner. The CT-scanner showed however that internal checks developed in some pieces when water was used as model of treatment solution, but internal checks were never observed during rapeseed oil or RME absorption.
Fig. 3. Initial CT-image and density differences after 5, 10, 15, and 29 min of RME absorption
The fact that some wood areas absorb more liquid than others may be a
disadvantage or an advantage if more protection is desired in areas with higher liquid permeability. This also makes the process more difficult to predict. Figure 4 is presented as an example of the variability observed among individual samples for the particular case of RME absorption. Similar variability among individual samples was also observed for rapeseed oil and water absorption. In the figure the solution uptake was converted to L/m2, which is a customary unit for commercial coatings. The conversion from grams to
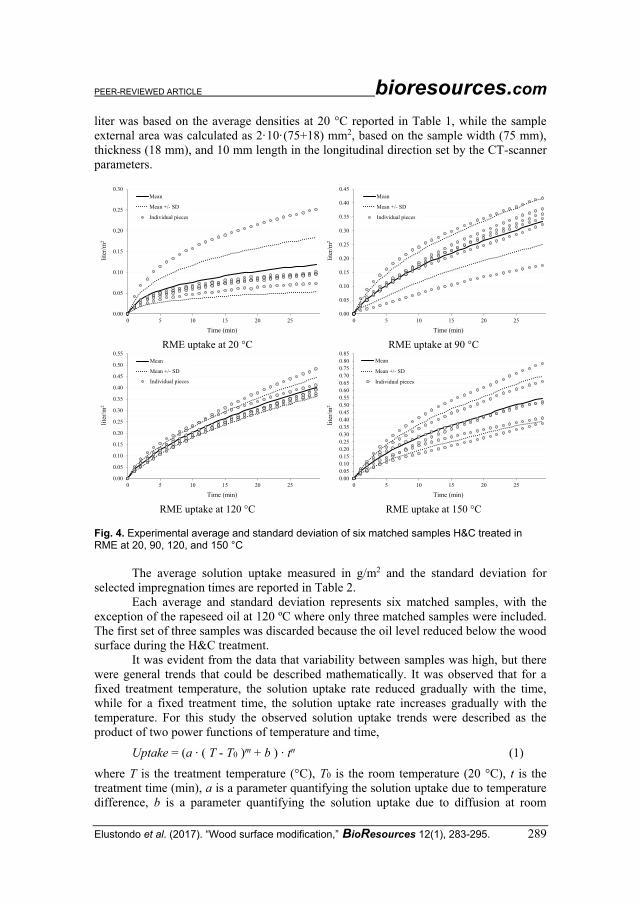
PEER-REVIEWED ARTICLE bioresources.com
Elustondo et al. (2017). “Wood surface modification,” BioResources 12(1), 283-295. 289
liter was based on the average densities at 20 °C reported in Table 1, while the sample external area was calculated as 2·10·(75+18) mm2, based on the sample width (75 mm), thickness (18 mm), and 10 mm length in the longitudinal direction set by the CT-scanner parameters.
RME uptake at 20 °C RME uptake at 90 °C
RME uptake at 120 °C RME uptake at 150 °C Fig. 4. Experimental average and standard deviation of six matched samples H&C treated in RME at 20, 90, 120, and 150 °C
The average solution uptake measured in g/m2 and the standard deviation for
selected impregnation times are reported in Table 2. Each average and standard deviation represents six matched samples, with the
exception of the rapeseed oil at 120 ºC where only three matched samples were included. The first set of three samples was discarded because the oil level reduced below the wood surface during the H&C treatment.
It was evident from the data that variability between samples was high, but there were general trends that could be described mathematically. It was observed that for a fixed treatment temperature, the solution uptake rate reduced gradually with the time, while for a fixed treatment time, the solution uptake rate increases gradually with the temperature. For this study the observed solution uptake trends were described as the product of two power functions of temperature and time,
Uptake = (a ∙ ( T - T0 )m + b ) ∙ tn (1)
where T is the treatment temperature (°C), T0 is the room temperature (20 °C), t is the treatment time (min), a is a parameter quantifying the solution uptake due to temperature difference, b is a parameter quantifying the solution uptake due to diffusion at room
0.00
0.05
0.10
0.15
0.20
0.25
0.30
0 5 10 15 20 25 30
Mean
Mean +/- SD
Individual pieces
Time (min)
lite
r/m
2
0.00
0.05
0.10
0.15
0.20
0.25
0.30
0.35
0.40
0.45
0 5 10 15 20 25 30
Mean
Mean +/- SD
Individual pieces
Time (min)li
ter/
m2
0.00
0.05
0.10
0.15
0.20
0.25
0.30
0.35
0.40
0.45
0.50
0.55
0 5 10 15 20 25 30
Mean
Mean +/- SD
Individual pieces
Time (min)
lite
r/m
2
0.000.050.100.150.200.250.300.350.400.450.500.550.600.650.700.750.800.85
0 5 10 15 20 25 30
Mean
Mean +/- SD
Individual pieces
Time (min)
lite
r/m
2
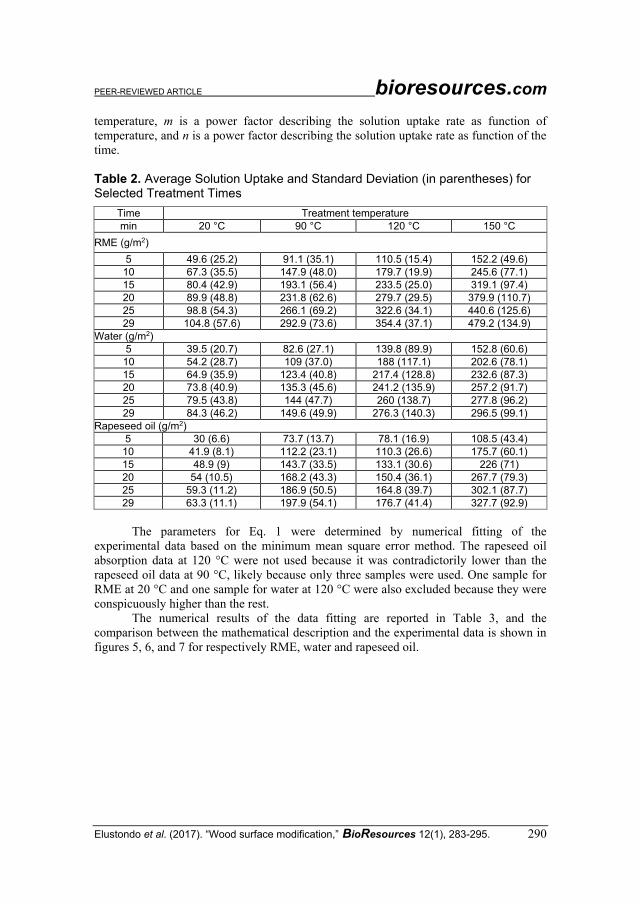
PEER-REVIEWED ARTICLE bioresources.com
Elustondo et al. (2017). “Wood surface modification,” BioResources 12(1), 283-295. 290
temperature, m is a power factor describing the solution uptake rate as function of temperature, and n is a power factor describing the solution uptake rate as function of the time. Table 2. Average Solution Uptake and Standard Deviation (in parentheses) for Selected Treatment Times
Time Treatment temperature
min 20 °C 90 °C 120 °C 150 °C
RME (g/m2)
5 49.6 (25.2) 91.1 (35.1) 110.5 (15.4) 152.2 (49.6)
10 67.3 (35.5) 147.9 (48.0) 179.7 (19.9) 245.6 (77.1)
15 80.4 (42.9) 193.1 (56.4) 233.5 (25.0) 319.1 (97.4)
20 89.9 (48.8) 231.8 (62.6) 279.7 (29.5) 379.9 (110.7)
25 98.8 (54.3) 266.1 (69.2) 322.6 (34.1) 440.6 (125.6)
29 104.8 (57.6) 292.9 (73.6) 354.4 (37.1) 479.2 (134.9)
Water (g/m2)
5 39.5 (20.7) 82.6 (27.1) 139.8 (89.9) 152.8 (60.6)
10 54.2 (28.7) 109 (37.0) 188 (117.1) 202.6 (78.1)
15 64.9 (35.9) 123.4 (40.8) 217.4 (128.8) 232.6 (87.3)
20 73.8 (40.9) 135.3 (45.6) 241.2 (135.9) 257.2 (91.7)
25 79.5 (43.8) 144 (47.7) 260 (138.7) 277.8 (96.2)
29 84.3 (46.2) 149.6 (49.9) 276.3 (140.3) 296.5 (99.1)
Rapeseed oil (g/m2)
5 30 (6.6) 73.7 (13.7) 78.1 (16.9) 108.5 (43.4)
10 41.9 (8.1) 112.2 (23.1) 110.3 (26.6) 175.7 (60.1)
15 48.9 (9) 143.7 (33.5) 133.1 (30.6) 226 (71)
20 54 (10.5) 168.2 (43.3) 150.4 (36.1) 267.7 (79.3)
25 59.3 (11.2) 186.9 (50.5) 164.8 (39.7) 302.1 (87.7)
29 63.3 (11.1) 197.9 (54.1) 176.7 (41.4) 327.7 (92.9)
The parameters for Eq. 1 were determined by numerical fitting of the
experimental data based on the minimum mean square error method. The rapeseed oil absorption data at 120 °C were not used because it was contradictorily lower than the rapeseed oil data at 90 °C, likely because only three samples were used. One sample for RME at 20 °C and one sample for water at 120 °C were also excluded because they were conspicuously higher than the rest.
The numerical results of the data fitting are reported in Table 3, and the comparison between the mathematical description and the experimental data is shown in figures 5, 6, and 7 for respectively RME, water and rapeseed oil.
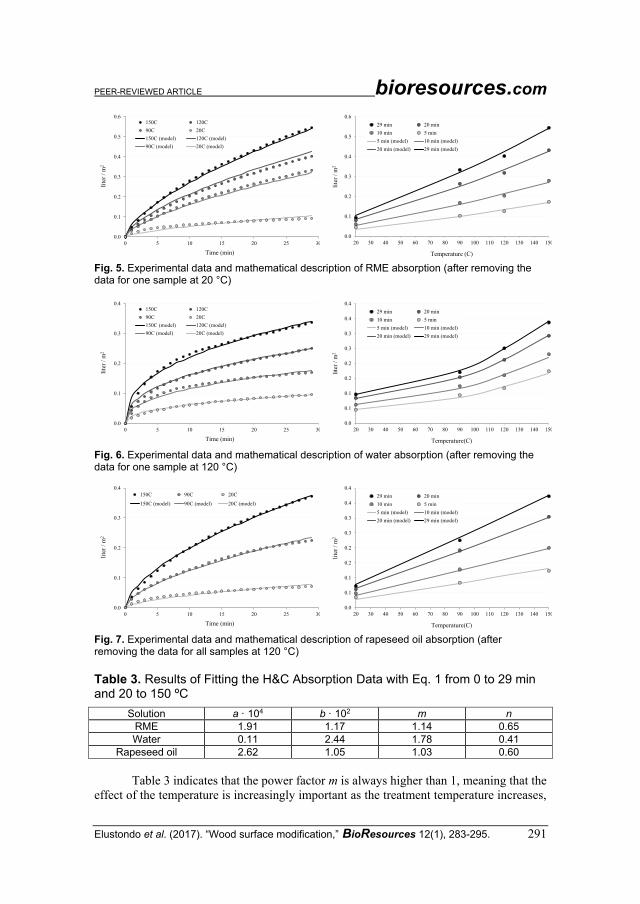
PEER-REVIEWED ARTICLE bioresources.com
Elustondo et al. (2017). “Wood surface modification,” BioResources 12(1), 283-295. 291
Fig. 5. Experimental data and mathematical description of RME absorption (after removing the data for one sample at 20 °C)
Fig. 6. Experimental data and mathematical description of water absorption (after removing the data for one sample at 120 °C)
Fig. 7. Experimental data and mathematical description of rapeseed oil absorption (after removing the data for all samples at 120 °C)
Table 3. Results of Fitting the H&C Absorption Data with Eq. 1 from 0 to 29 min and 20 to 150 ºC
Solution a · 104 b · 102 m n
RME 1.91 1.17 1.14 0.65
Water 0.11 2.44 1.78 0.41
Rapeseed oil 2.62 1.05 1.03 0.60
Table 3 indicates that the power factor m is always higher than 1, meaning that the
effect of the temperature is increasingly important as the treatment temperature increases,
0.0
0.1
0.2
0.3
0.4
0.5
0.6
0 5 10 15 20 25 30
150C 120C
90C 20C
150C (model) 120C (model)
90C (model) 20C (model)
Time (min)
lite
r /
m2
0.0
0.1
0.2
0.3
0.4
0.5
0.6
20 30 40 50 60 70 80 90 100 110 120 130 140 150
29 min 20 min
10 min 5 min
5 min (model) 10 min (model)
20 min (model) 29 min (model)
Temperature (C)
lite
r /
m2
0.0
0.1
0.2
0.3
0.4
0 5 10 15 20 25 30
150C 120C
90C 20C
150C (model) 120C (model)
90C (model) 20C (model)
Time (min)
lite
r /
m2
0.0
0.1
0.1
0.2
0.2
0.3
0.3
0.4
0.4
20 30 40 50 60 70 80 90 100 110 120 130 140 150
29 min 20 min
10 min 5 min
5 min (model) 10 min (model)
20 min (model) 29 min (model)
Temperature(C)
lite
r /
m2
0.0
0.1
0.2
0.3
0.4
0 5 10 15 20 25 30
150C 90C 20C
150C (model) 90C (model) 20C (model)
Time (min)
lite
r /
m2
0.0
0.1
0.1
0.2
0.2
0.3
0.3
0.4
0.4
20 30 40 50 60 70 80 90 100 110 120 130 140 150
29 min 20 min
10 min 5 min
5 min (model) 10 min (model)
20 min (model) 29 min (model)
Temperature(C)
lite
r /
m2
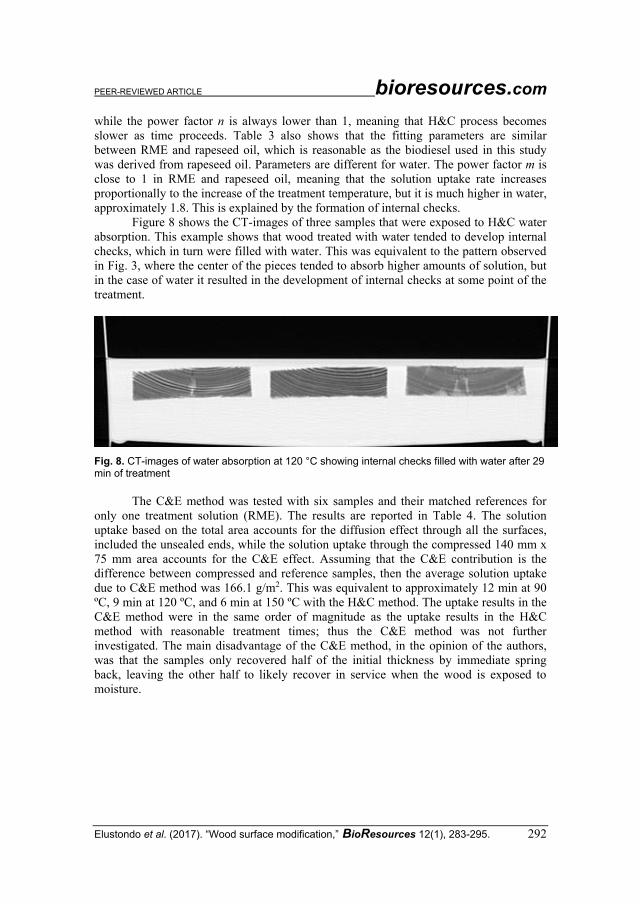
PEER-REVIEWED ARTICLE bioresources.com
Elustondo et al. (2017). “Wood surface modification,” BioResources 12(1), 283-295. 292
while the power factor n is always lower than 1, meaning that H&C process becomes slower as time proceeds. Table 3 also shows that the fitting parameters are similar between RME and rapeseed oil, which is reasonable as the biodiesel used in this study was derived from rapeseed oil. Parameters are different for water. The power factor m is close to 1 in RME and rapeseed oil, meaning that the solution uptake rate increases proportionally to the increase of the treatment temperature, but it is much higher in water, approximately 1.8. This is explained by the formation of internal checks.
Figure 8 shows the CT-images of three samples that were exposed to H&C water absorption. This example shows that wood treated with water tended to develop internal checks, which in turn were filled with water. This was equivalent to the pattern observed in Fig. 3, where the center of the pieces tended to absorb higher amounts of solution, but in the case of water it resulted in the development of internal checks at some point of the treatment.
Fig. 8. CT-images of water absorption at 120 °C showing internal checks filled with water after 29 min of treatment
The C&E method was tested with six samples and their matched references for
only one treatment solution (RME). The results are reported in Table 4. The solution uptake based on the total area accounts for the diffusion effect through all the surfaces, included the unsealed ends, while the solution uptake through the compressed 140 mm x 75 mm area accounts for the C&E effect. Assuming that the C&E contribution is the difference between compressed and reference samples, then the average solution uptake due to C&E method was 166.1 g/m2. This was equivalent to approximately 12 min at 90 ºC, 9 min at 120 ºC, and 6 min at 150 ºC with the H&C method. The uptake results in the C&E method were in the same order of magnitude as the uptake results in the H&C method with reasonable treatment times; thus the C&E method was not further investigated. The main disadvantage of the C&E method, in the opinion of the authors, was that the samples only recovered half of the initial thickness by immediate spring back, leaving the other half to likely recover in service when the wood is exposed to moisture.
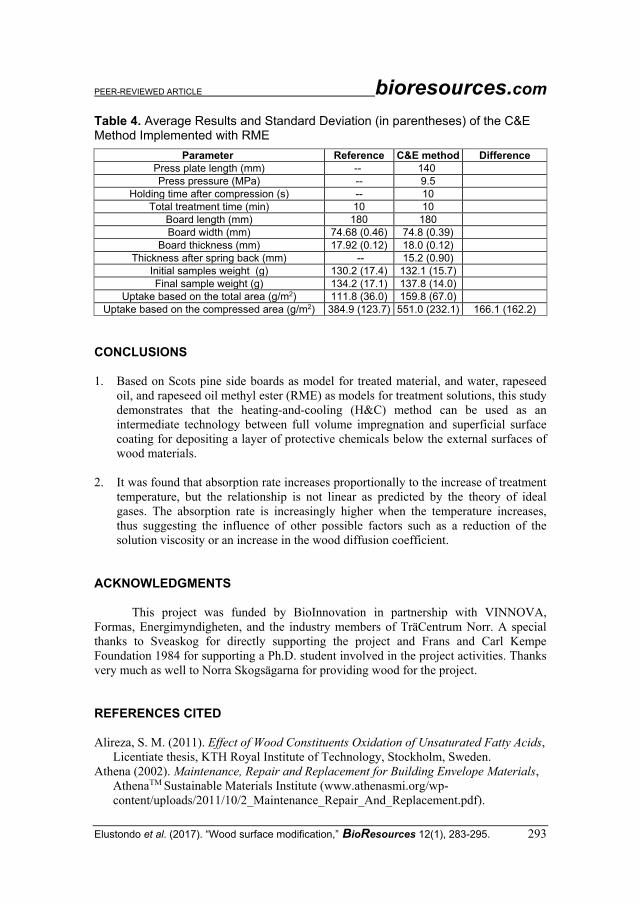
PEER-REVIEWED ARTICLE bioresources.com
Elustondo et al. (2017). “Wood surface modification,” BioResources 12(1), 283-295. 293
Table 4. Average Results and Standard Deviation (in parentheses) of the C&E Method Implemented with RME
Parameter Reference C&E method Difference
Press plate length (mm) -- 140
Press pressure (MPa) -- 9.5
Holding time after compression (s) -- 10
Total treatment time (min) 10 10
Board length (mm) 180 180
Board width (mm) 74.68 (0.46) 74.8 (0.39)
Board thickness (mm) 17.92 (0.12) 18.0 (0.12)
Thickness after spring back (mm) -- 15.2 (0.90)
Initial samples weight (g) 130.2 (17.4) 132.1 (15.7)
Final sample weight (g) 134.2 (17.1) 137.8 (14.0)
Uptake based on the total area (g/m2) 111.8 (36.0) 159.8 (67.0)
Uptake based on the compressed area (g/m2) 384.9 (123.7) 551.0 (232.1) 166.1 (162.2)
CONCLUSIONS 1. Based on Scots pine side boards as model for treated material, and water, rapeseed
oil, and rapeseed oil methyl ester (RME) as models for treatment solutions, this study demonstrates that the heating-and-cooling (H&C) method can be used as an intermediate technology between full volume impregnation and superficial surface coating for depositing a layer of protective chemicals below the external surfaces of wood materials.
2. It was found that absorption rate increases proportionally to the increase of treatment
temperature, but the relationship is not linear as predicted by the theory of ideal gases. The absorption rate is increasingly higher when the temperature increases, thus suggesting the influence of other possible factors such as a reduction of the solution viscosity or an increase in the wood diffusion coefficient.
ACKNOWLEDGMENTS
This project was funded by BioInnovation in partnership with VINNOVA, Formas, Energimyndigheten, and the industry members of TräCentrum Norr. A special thanks to Sveaskog for directly supporting the project and Frans and Carl Kempe Foundation 1984 for supporting a Ph.D. student involved in the project activities. Thanks very much as well to Norra Skogsägarna for providing wood for the project. REFERENCES CITED Alireza, S. M. (2011). Effect of Wood Constituents Oxidation of Unsaturated Fatty Acids,
Licentiate thesis, KTH Royal Institute of Technology, Stockholm, Sweden. Athena (2002). Maintenance, Repair and Replacement for Building Envelope Materials,
AthenaTM Sustainable Materials Institute (www.athenasmi.org/wp-content/uploads/2011/10/2_Maintenance_Repair_And_Replacement.pdf).
PEER-REVIEWED ARTICLE bioresources.com
Elustondo et al. (2017). “Wood surface modification,” BioResources 12(1), 283-295. 294
Bernat, E., Jordi-Roger, R., Grau, B., Antoni, R., and Rita, P. (2011). "Temperature dependence of density and viscosity of vegetable oils," Biomass & Bioenergy 42(2012),164-171. DOI: 10.1016/j.biombioe.2012.03.007
Blew, J. O. (1948). Treating Wood in Pentachlorophenol Solutions by the Cold-Soaking
Method, Report No. R1445, Forest Products Laboratory, Madison, WI. Crawford, C. G. (1907). The Open-Tank Method for the Treatment of Timber (Circular
101), US Forest Service, Washington, DC. Deka, M., and Saikia, C. N. (2000). “Chemical modification of wood with thermosetting
resin: effect on dimensional stability and strength property,” Bioresour. Technol. 73(2), 179-181. DOI: 10.1016/S0960-8524(99)00167-4
Fry, H. J. (1973). “Compression impregnation of wood veneers,” US Patent # 3950577A. Forest Products Laboratory (2010). Wood Handbook—Wood as an Engineering Material,
General Technical Report FPL-GTR-190, U.S. Department of Agriculture, Forest Products Laboratory, Madison, WI.
Gabrielli, C. P., and Kamke, F. A. (2010). “Phenol–formaldehyde impregnation of densified wood for improved dimensional stability,” Wood Sci. Technol. 44(1), 95-104. DOI: 10.1007/s00226-009-0253-6
Gsöls, I., Rätzsch, M., and Ladner, C. (2003). "Interactions between wood and melamine resins effect on dimensional stability properties and fungal attack," in: Proceedings of
the First European Conference on Wood Modification, Ghent, Belgium, pp. 221-225. Hill, C. A. S. (2006). Wood Modification: Chemical, Thermal and Other Processes, C. V.
Stevens (ed.), John Wiley & Sons, UK. Homan, W. J., and Jorissen, A. J. M. (2004). "Wood modification developments,"
HERON 49(4), 361-386. Hunt, G. M., and Garratt, G. A. (1967). Wood Preservation, 3rd Ed., McGraw-Hill, New
York, NY. Inoue, M., Adachi, K., Tsunoda, K., Rowell, R. M., and Kawai, S. (2008). "A new
procedure for treating wood," Wood Material Science & Engineering 3(1-2), 46-54. DOI: 10.1080/17480270802605495
Kollmann, F. F. P., and Côté, W. A. (1984). Principles of Wood Science and Technology.
Volume I: Solid Wood, Springer-Verlag, Berlin, Germany. Lande, S. (2008). Furfurylation of Wood – Wood Modification by the Use of Furfuryl
Alcohol, Ph.D dissertation, Norwegian University of Life Science, Ås, Norway. Nurmi, A. (1998). Natural Resins as a Potential Wood Protecting Agent (Final Report),
EC’s fourth framework programme, FAIR CT95-0089, 1995-1998. Ormrod, D. J., and Van Dalfsen, B. (1993). Wood Preservation on the Farm (Final
Report), Ministry of Agriculture, Fisheries and Food, British Columbia, Canada. Richardson, B. A. (2003). Wood Preservation (2nd Ed.), Chapman & Hall, London, UK. Ryu, J. Y., Takahashi, M., Imamura, Y., and Sato, T. (1991). “Biological resistance of
phenol-resin treated wood,” Mokuzai Gakkaishi 37(9), 852-858. Sandberg, K., Pousette, A., Karlsson, O., Sundqvist, B. (2013). Fasader i Trä för
Flervåningsbyggnader Jämförelse Mellan Material och Behandlingsmetoder (SP Rapport 2013:21), SP Technical Research Institute of Sweden, Skellefteå, Sweden.
. Takahashi, M., and Imamura, Y. (1990). Biological Resistance of Phenol-Resin Treated
Wood, Doc. No. IRG/WP 3602, International Research Group on Wood Preservation, Stockholm, Sweden.
PEER-REVIEWED ARTICLE bioresources.com
Elustondo et al. (2017). “Wood surface modification,” BioResources 12(1), 283-295. 295
Tamblyn, N.E. (1985). "Treatment of wood by diffusion," in: Preservation of Timber in
the Tropics, W. P. K. Findlay (ed.), Springer, Amsterdam, The Netherlands, pp. 121-140. DOI: 10.1007/978-94-017-2752-5_6
Tikkurila (2016). Commercial Information from Paint Supplier, Vantaa, Finland, (www.tikkurila.sk/pdfexport/index.phtml%3Fs%3D80.pdf).
Venard, J. K., and Street, R. L. (1975). Elementary Fluid Mechanics (5th ed.), Wiley, New York, NY.
Westin, M., Lande, S., and Schneider, M. (2003). "Furfurylation of wood - Process, properties and commercial production," in: Proceedings of the First European
Conference on Wood Modification, Ghent, Belgium, pp. 289-306. Williams, R. S. (2005). "Weathering of wood," in: Handbook of Wood Chemistry and
Wood Composites, R.M. Rowell (ed.), CRC Press, Boca Raton, FL, pp. 139-185. Article submitted: June 25, 2016; Peer review completed: October 6, 2016; Revised version received and accepted: October 30, 2016; Published: November 14, 2016. DOI: 10.15376/biores.12.1.283-295.


Paper VI

Proceedings IRG Annual Meeting (ISSN 2000-8953) © 2018 The International Research Group on Wood Protection
IRG/WP 18-40849
THE INTERNATIONAL RESEARCH GROUP ON WOOD PROTECTION
Section 4 Processes and properties
Thermally modified wood treated with methacrylate
Olov Karlsson(s)*
Olena Myronycheva
Dennis Jones
Dick Sandberg
Wood Science and Engineering, Luleå University of Technology,
Forskargatan 1
S-93197 Skellefteå, Sweden,
Diego Elustondo
Jägarvägen 11, S-93140 Skellefteå, Sweden
Paper prepared for the IRG49 Scientific Conference on Wood Protection
Johannesburg, South Africa
29 April – 3 May 2018
IRG SECRETARIAT
Box 5604
SE-114 86 Stockholm
Sweden
www.irg-wp.com
Disclaimer The opinions expressed in this document are those of the author(s) and
are not necessarily the opinions or policy of the IRG Organization.
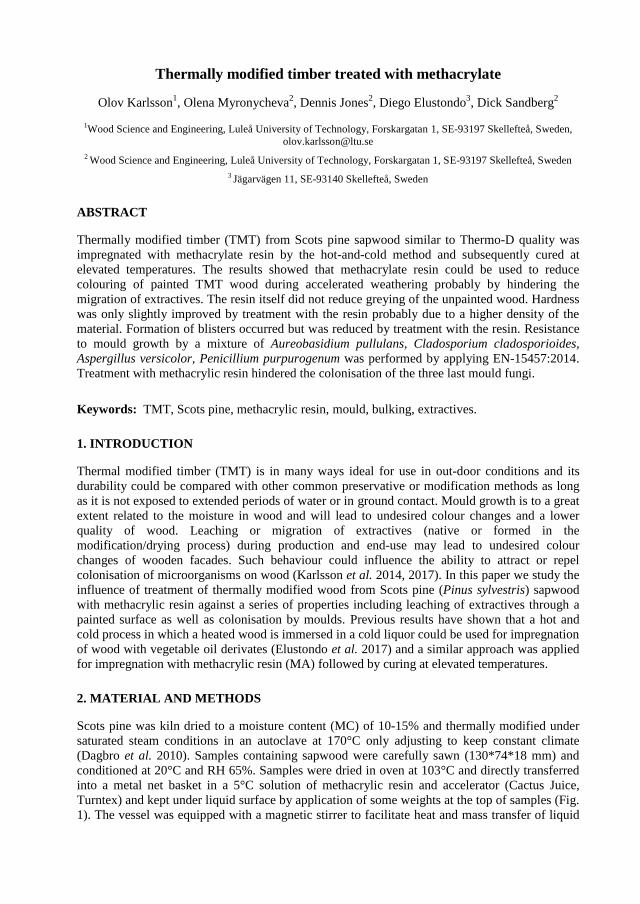
Thermally modified timber treated with methacrylate
Olov Karlsson1, Olena Myronycheva
2, Dennis Jones
2, Diego Elustondo
3, Dick Sandberg
2
1Wood Science and Engineering, Luleå University of Technology, Forskargatan 1, SE-93197 Skellefteå, Sweden,
2 Wood Science and Engineering, Luleå University of Technology, Forskargatan 1, SE-93197 Skellefteå, Sweden
3 Jägarvägen 11, SE-93140 Skellefteå, Sweden
ABSTRACT
Thermally modified timber (TMT) from Scots pine sapwood similar to Thermo-D quality was
impregnated with methacrylate resin by the hot-and-cold method and subsequently cured at
elevated temperatures. The results showed that methacrylate resin could be used to reduce
colouring of painted TMT wood during accelerated weathering probably by hindering the
migration of extractives. The resin itself did not reduce greying of the unpainted wood. Hardness
was only slightly improved by treatment with the resin probably due to a higher density of the
material. Formation of blisters occurred but was reduced by treatment with the resin. Resistance
to mould growth by a mixture of Aureobasidium pullulans, Cladosporium cladosporioides,
Aspergillus versicolor, Penicillium purpurogenum was performed by applying EN-15457:2014.
Treatment with methacrylic resin hindered the colonisation of the three last mould fungi.
Keywords: TMT, Scots pine, methacrylic resin, mould, bulking, extractives.
1. INTRODUCTION
Thermal modified timber (TMT) is in many ways ideal for use in out-door conditions and its
durability could be compared with other common preservative or modification methods as long
as it is not exposed to extended periods of water or in ground contact. Mould growth is to a great
extent related to the moisture in wood and will lead to undesired colour changes and a lower
quality of wood. Leaching or migration of extractives (native or formed in the
modification/drying process) during production and end-use may lead to undesired colour
changes of wooden facades. Such behaviour could influence the ability to attract or repel
colonisation of microorganisms on wood (Karlsson et al. 2014, 2017). In this paper we study the
influence of treatment of thermally modified wood from Scots pine (Pinus sylvestris) sapwood
with methacrylic resin against a series of properties including leaching of extractives through a
painted surface as well as colonisation by moulds. Previous results have shown that a hot and
cold process in which a heated wood is immersed in a cold liquor could be used for impregnation
of wood with vegetable oil derivates (Elustondo et al. 2017) and a similar approach was applied
for impregnation with methacrylic resin (MA) followed by curing at elevated temperatures.
2. MATERIAL AND METHODS
Scots pine was kiln dried to a moisture content (MC) of 10-15% and thermally modified under
saturated steam conditions in an autoclave at 170°C only adjusting to keep constant climate
(Dagbro et al. 2010). Samples containing sapwood were carefully sawn (130*74*18 mm) and
conditioned at 20°C and RH 65%. Samples were dried in oven at 103°C and directly transferred
into a metal net basket in a 5°C solution of methacrylic resin and accelerator (Cactus Juice,
Turntex) and kept under liquid surface by application of some weights at the top of samples (Fig.
1). The vessel was equipped with a magnetic stirrer to facilitate heat and mass transfer of liquid
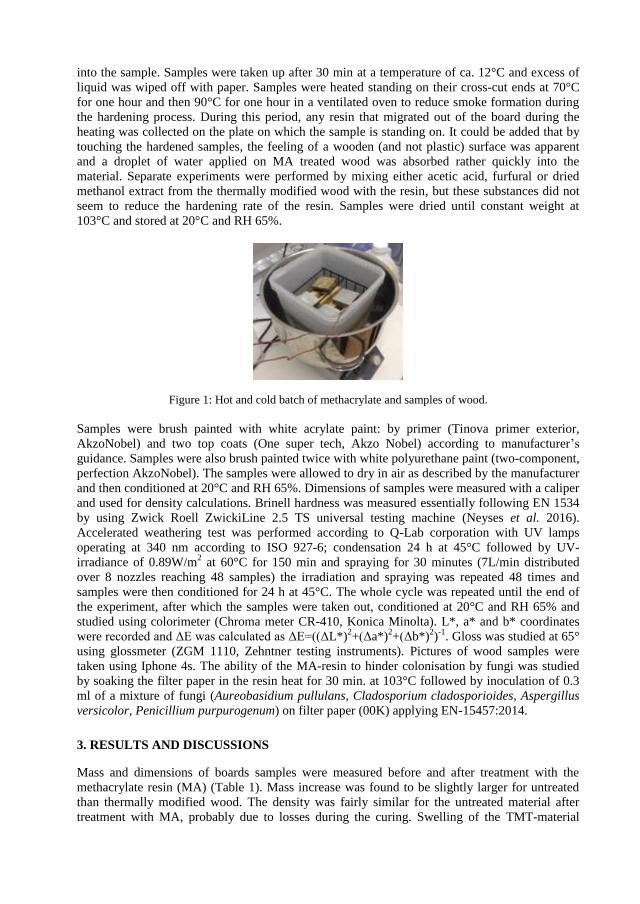
into the sample. Samples were taken up after 30 min at a temperature of ca. 12°C and excess of
liquid was wiped off with paper. Samples were heated standing on their cross-cut ends at 70°C
for one hour and then 90°C for one hour in a ventilated oven to reduce smoke formation during
the hardening process. During this period, any resin that migrated out of the board during the
heating was collected on the plate on which the sample is standing on. It could be added that by
touching the hardened samples, the feeling of a wooden (and not plastic) surface was apparent
and a droplet of water applied on MA treated wood was absorbed rather quickly into the
material. Separate experiments were performed by mixing either acetic acid, furfural or dried
methanol extract from the thermally modified wood with the resin, but these substances did not
seem to reduce the hardening rate of the resin. Samples were dried until constant weight at
103°C and stored at 20°C and RH 65%.
Figure 1: Hot and cold batch of methacrylate and samples of wood.
Samples were brush painted with white acrylate paint: by primer (Tinova primer exterior,
AkzoNobel) and two top coats (One super tech, Akzo Nobel) according to manufacturer’s
guidance. Samples were also brush painted twice with white polyurethane paint (two-component,
perfection AkzoNobel). The samples were allowed to dry in air as described by the manufacturer
and then conditioned at 20°C and RH 65%. Dimensions of samples were measured with a caliper
and used for density calculations. Brinell hardness was measured essentially following EN 1534
by using Zwick Roell ZwickiLine 2.5 TS universal testing machine (Neyses et al. 2016).
Accelerated weathering test was performed according to Q-Lab corporation with UV lamps
operating at 340 nm according to ISO 927-6; condensation 24 h at 45°C followed by UV-
irradiance of 0.89W/m2 at 60°C for 150 min and spraying for 30 minutes (7L/min distributed
over 8 nozzles reaching 48 samples) the irradiation and spraying was repeated 48 times and
samples were then conditioned for 24 h at 45°C. The whole cycle was repeated until the end of
the experiment, after which the samples were taken out, conditioned at 20°C and RH 65% and
studied using colorimeter (Chroma meter CR-410, Konica Minolta). L*, a* and b* coordinates
were recorded and ΔE was calculated as ΔE=((ΔL*)2+(Δa*)
2+(Δb*)
2)-1
. Gloss was studied at 65°
using glossmeter (ZGM 1110, Zehntner testing instruments). Pictures of wood samples were
taken using Iphone 4s. The ability of the MA-resin to hinder colonisation by fungi was studied
by soaking the filter paper in the resin heat for 30 min. at 103°C followed by inoculation of 0.3
ml of a mixture of fungi (Aureobasidium pullulans, Cladosporium cladosporioides, Aspergillus
versicolor, Penicillium purpurogenum) on filter paper (00K) applying EN-15457:2014.
3. RESULTS AND DISCUSSIONS
Mass and dimensions of boards samples were measured before and after treatment with the
methacrylate resin (MA) (Table 1). Mass increase was found to be slightly larger for untreated
than thermally modified wood. The density was fairly similar for the untreated material after
treatment with MA, probably due to losses during the curing. Swelling of the TMT-material
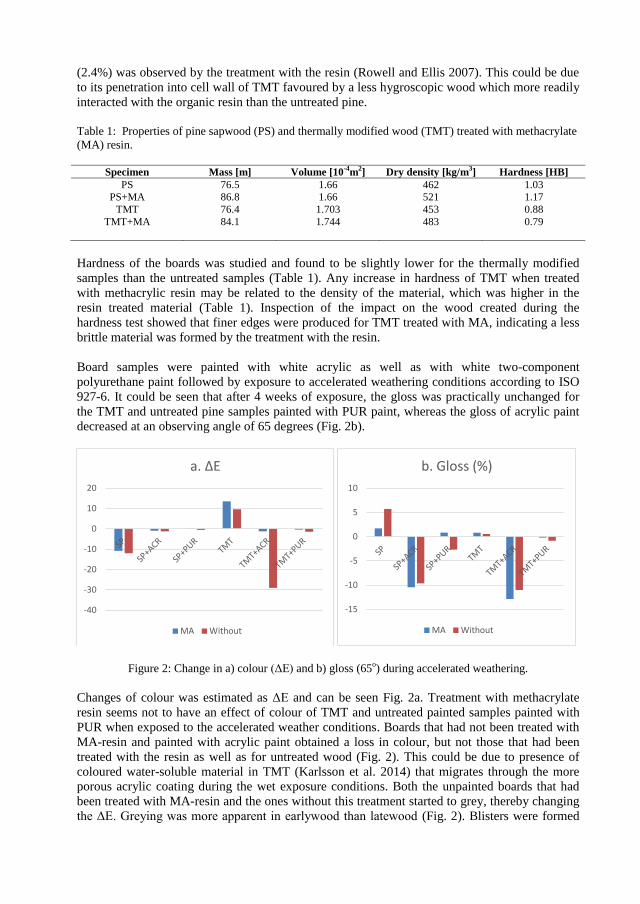
(2.4%) was observed by the treatment with the resin (Rowell and Ellis 2007). This could be due
to its penetration into cell wall of TMT favoured by a less hygroscopic wood which more readily
interacted with the organic resin than the untreated pine.
Table 1: Properties of pine sapwood (PS) and thermally modified wood (TMT) treated with methacrylate
(MA) resin.
Specimen Mass [m] Volume [10
-4m
2] Dry density [kg/m
3] Hardness [HB]
PS
PS+MA
TMT
76.5
86.8
76.4
1.66
1.66
1.703
462
521
453
1.03
1.17
0.88
TMT+MA 84.1 1.744 483 0.79
Hardness of the boards was studied and found to be slightly lower for the thermally modified
samples than the untreated samples (Table 1). Any increase in hardness of TMT when treated
with methacrylic resin may be related to the density of the material, which was higher in the
resin treated material (Table 1). Inspection of the impact on the wood created during the
hardness test showed that finer edges were produced for TMT treated with MA, indicating a less
brittle material was formed by the treatment with the resin.
Board samples were painted with white acrylic as well as with white two-component
polyurethane paint followed by exposure to accelerated weathering conditions according to ISO
927-6. It could be seen that after 4 weeks of exposure, the gloss was practically unchanged for
the TMT and untreated pine samples painted with PUR paint, whereas the gloss of acrylic paint
decreased at an observing angle of 65 degrees (Fig. 2b).
Figure 2: Change in a) colour (ΔE) and b) gloss (65o) during accelerated weathering.
Changes of colour was estimated as ΔE and can be seen Fig. 2a. Treatment with methacrylate
resin seems not to have an effect of colour of TMT and untreated painted samples painted with
PUR when exposed to the accelerated weather conditions. Boards that had not been treated with
MA-resin and painted with acrylic paint obtained a loss in colour, but not those that had been
treated with the resin as well as for untreated wood (Fig. 2). This could be due to presence of
coloured water-soluble material in TMT (Karlsson et al. 2014) that migrates through the more
porous acrylic coating during the wet exposure conditions. Both the unpainted boards that had
been treated with MA-resin and the ones without this treatment started to grey, thereby changing
the ΔE. Greying was more apparent in earlywood than latewood (Fig. 2). Blisters were formed
-40
-30
-20
-10
0
10
20
a. ΔE
MA Without
-15
-10
-5
0
5
10
b. Gloss (%)
MA Without
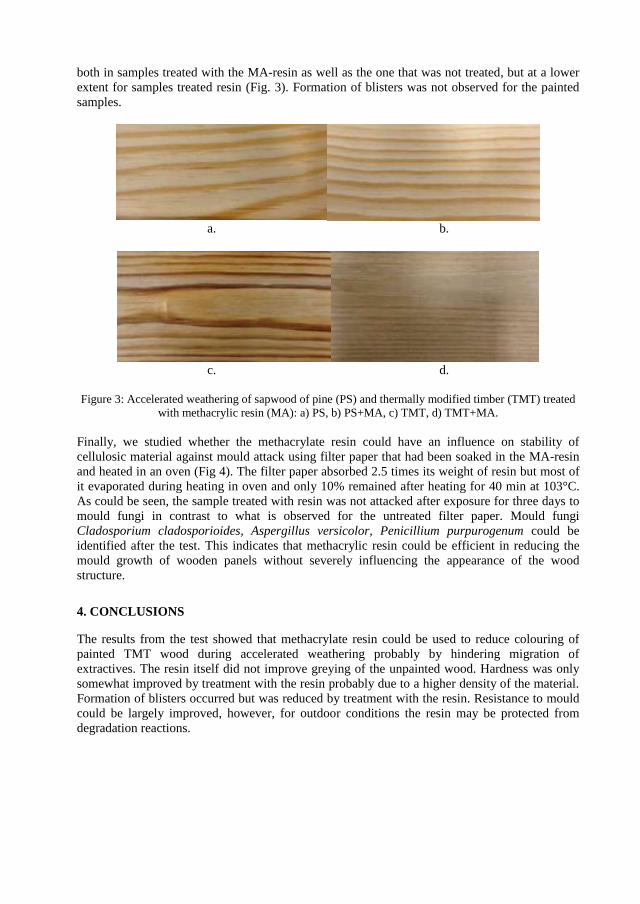
both in samples treated with the MA-resin as well as the one that was not treated, but at a lower
extent for samples treated resin (Fig. 3). Formation of blisters was not observed for the painted
samples.
a. b.
c. d.
Figure 3: Accelerated weathering of sapwood of pine (PS) and thermally modified timber (TMT) treated
with methacrylic resin (MA): a) PS, b) PS+MA, c) TMT, d) TMT+MA.
Finally, we studied whether the methacrylate resin could have an influence on stability of
cellulosic material against mould attack using filter paper that had been soaked in the MA-resin
and heated in an oven (Fig 4). The filter paper absorbed 2.5 times its weight of resin but most of
it evaporated during heating in oven and only 10% remained after heating for 40 min at 103°C.
As could be seen, the sample treated with resin was not attacked after exposure for three days to
mould fungi in contrast to what is observed for the untreated filter paper. Mould fungi
Cladosporium cladosporioides, Aspergillus versicolor, Penicillium purpurogenum could be
identified after the test. This indicates that methacrylic resin could be efficient in reducing the
mould growth of wooden panels without severely influencing the appearance of the wood
structure.
4. CONCLUSIONS
The results from the test showed that methacrylate resin could be used to reduce colouring of
painted TMT wood during accelerated weathering probably by hindering migration of
extractives. The resin itself did not improve greying of the unpainted wood. Hardness was only
somewhat improved by treatment with the resin probably due to a higher density of the material.
Formation of blisters occurred but was reduced by treatment with the resin. Resistance to mould
could be largely improved, however, for outdoor conditions the resin may be protected from
degradation reactions.
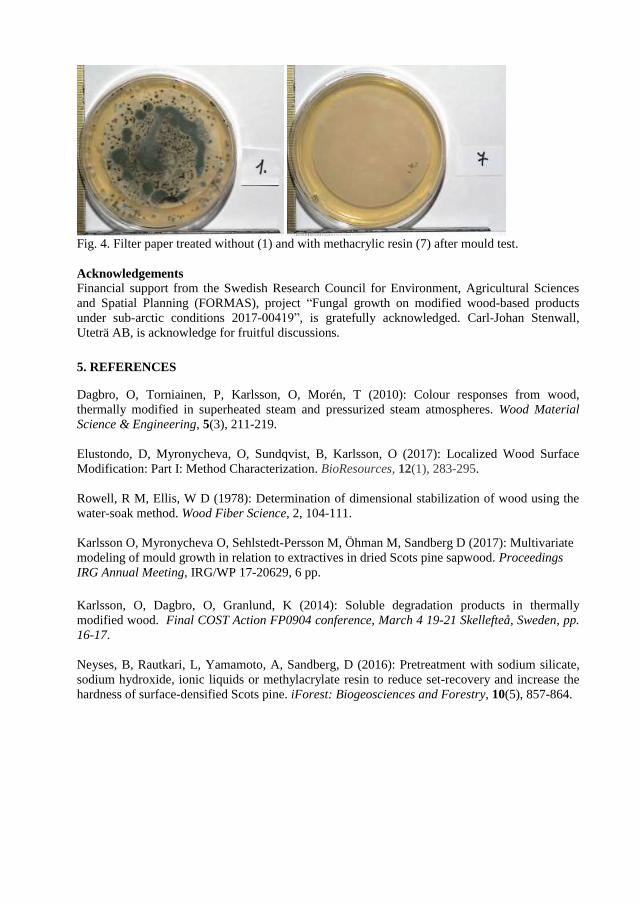
Fig. 4. Filter paper treated without (1) and with methacrylic resin (7) after mould test.
Acknowledgements
Financial support from the Swedish Research Council for Environment, Agricultural Sciences
and Spatial Planning (FORMAS), project “Fungal growth on modified wood-based products
under sub-arctic conditions 2017-00419”, is gratefully acknowledged. Carl-Johan Stenwall,
Uteträ AB, is acknowledge for fruitful discussions.
5. REFERENCES
Dagbro, O, Torniainen, P, Karlsson, O, Morén, T (2010): Colour responses from wood,
thermally modified in superheated steam and pressurized steam atmospheres. Wood Material
Science & Engineering, 5(3), 211-219.
Elustondo, D, Myronycheva, O, Sundqvist, B, Karlsson, O (2017): Localized Wood Surface
Modification: Part I: Method Characterization. BioResources, 12(1), 283-295.
Rowell, R M, Ellis, W D (1978): Determination of dimensional stabilization of wood using the
water-soak method. Wood Fiber Science, 2, 104-111.
Karlsson O, Myronycheva O, Sehlstedt-Persson M, Öhman M, Sandberg D (2017): Multivariate
modeling of mould growth in relation to extractives in dried Scots pine sapwood. Proceedings
IRG Annual Meeting, IRG/WP 17-20629, 6 pp.
Karlsson, O, Dagbro, O, Granlund, K (2014): Soluble degradation products in thermally
modified wood. Final COST Action FP0904 conference, March 4 19-21 Skellefteå, Sweden, pp.
16-17.
Neyses, B, Rautkari, L, Yamamoto, A, Sandberg, D (2016): Pretreatment with sodium silicate,
sodium hydroxide, ionic liquids or methylacrylate resin to reduce set-recovery and increase the
hardness of surface-densified Scots pine. iForest: Biogeosciences and Forestry, 10(5), 857-864.

Paper VII

PEER-REVIEWED ARTICLE bioresources.com
Kim et al. (2020). “Methacrylic resin wood protection,” BioResources 15(3), 7018-7033. 7018
Methacrylic Resin for Protection of Wood from Discoloration by Mould Growth and Weathering
Injeong Kim,* Olov Karlsson, Olena Myronycheva, Dennis Jones, and Dick Sandberg
The discoloration of uncoated wood surfaces in both outdoor and indoor use in non-heated spaces has become an increasing problem in European timber constructions due to the use of less toxic substances for protection and also changes in outdoor climate conditions, necessitating the use of protective coatings. To investigate the effect of methyl methacrylic (MMA) resin for the protection of wood from discoloration and mould growth, resin-treated wood surfaces were studied in a laboratory-scale mould test, as well as in an outdoor weathering test. Non-modified Scots pine and Norway spruce were used, and some of the test materials were also thermally modified. The resin suppressed mould growth for the laboratory-scale experiments. The protective effect was considerably reduced for outdoor tests. The MA resin did not effectively prevent the wood from greying from ultraviolet (UV) radiation exposure; there was some protective effect detected on the pine. The Fourier transform infrared (FTIR) spectra of weathered specimens showed a reduction of lignin-associated absorption bands for all treatments, which corresponded to the UV degradation and greying of the wood surface. It is suggested that MMA resin may provide adequate protection against mould growth on wood without direct exposure to rain and sunshine (e.g., attics, basements, etc).
Keywords: Methacrylic resin; Scots pine; Norway spruce; Thermally modified timber; FTIR; Mould
Contact information: Wood Science and Engineering, Luleå University of Technology, Forskargatan 1, 931
87 Skellefteå, Sweden; *Corresponding author: [email protected]
INTRODUCTION
Wood can be a very durable material against different types of degradation, but its
durability depends upon the circumstances, such as the environment, where the wood is in
use, the type of wood, and how it has been protected. In constructions where wood-based
building materials are not exposed to extreme chemical or thermal environments, wood
durability is mainly related to biological, physical, and photochemical degradation
mechanisms on its exposed surfaces or its interior, which can reduce its function and/or
appearance. High durability is also important as it is often related to lowered maintenance
costs.
The biological degradation of wood in northern Europe is mainly due to wood-
destroying fungi (e.g., white-rot, brown-rot and soft-rot fungi), which can not only degrade
the structure of wood and have a significant effect on functional properties, but also
influence the appearance of the wood material by discoloration. Degradation may also
occur with discoloring or mould fungi, which as their name suggest, result in deterioration
in appearance without impacting mechanical performance. However, the presence of
discoloring and mould fungi may be a prelude to subsequent attack by wood-destroying
fungi (Brischke and Unger 2017). Mould fungi can also induce allergic reactions in humans
and, as a consequence, it is important to prevent mould growth in buildings. Mould growth
PEER-REVIEWED ARTICLE bioresources.com
Kim et al. (2020). “Methacrylic resin wood protection,” BioResources 15(3), 7018-7033. 7019
is usually related to the accessibility of nutrients and moisture to these microorganisms, as
well as ventilation and condensation (Brischke and Unger 2017). Mould can grow indoors,
especially in areas that have limited heating and airflow, such as inside the attic and
basement, as well as outside where the wood may be exposed to higher levels of humidity
or rain.
The conventional method to prevent fungal growth is to apply a toxic preservative,
such as a copper-based agent. However, due to their toxicity to humans and to the
environment, many of these preservatives are banned or need to be substituted. Alternative
wood modifications and biocides based on an organic system have been proposed to
substitute conventional preservatives. To prevent mould, compounds, such as 3-iodo-2-
propynyl butylcarbamate (IPBC), diiodomethyl-p-tolylsulfone (e.g., Amical 48), and
examples of isothiazolinones are used. However, these compounds are only capable of
protecting the wood for a short period (Schultz et al. 2007); hence, a better solution for the
protection of wood against mould is needed.
Besides mould growth, the discoloration of wood can occur due to different abiotic
factors. During outdoor exposure, wood is degraded and discolored by a combination of
ultraviolet (UV) radiation, water or moisture, and elevated temperatures. This results in
internal stresses and degradation mainly at the surfaces of the wood, resulting in reductions
of the material’s service life (Forest Products Laboratory 1975). Because of the limited
ability of radiation to penetrate into the wood, the effect of the UV degradation is limited
to a region approx. 2.5 mm beneath the wood’s surface; also, wood erosion is slow, i.e., 5
to 12 mm per 100 years (Browne and Simonson 1957; Feist and Mraz 1978).
When wood absorbs light, its color change depends on the components that interact
with the light. All major components of wood are sensitive to UV radiation; cellulose
strongly absorbs radiation between 200 to 300 nm, while lignin and polyphenols (i.e.,
extractives) strongly absorb light below 200 nm and at 280 nm. Lignin is responsible for
80 to 95% of the total light absorption coefficient for wood (Norrström 1969; Gierer and
Lin 1972; Hon 1981; Hon and Minemura 2001), and its degradation is believed to proceed
rapidly via the formation of radicals that oxidize phenolic units to chromophoric structures,
such as unsaturated and conjugated carbonyl structures (Feist and Hon 1984; Pandey and
Vuorinen 2008). These conjugated chromophoric structures are not stable to further
exposure to UV-radiation. They will be degraded and finally removed from the middle
lamella of the cell wall, resulting in wood surfaces with loosely attached fibres with low
chroma. Therefore, the color starts to change more or less directly when the surface is
exposed to UV radiation, with a grey hue developing as the lignin degradation products are
washed away (Feist and Hon 1984).
This discoloration and/or degradation is typical for uncoated wood surfaces;
however, the same behaviour occurs with thermally modified timber (TMT) surfaces. The
thermal modification process of wood is most frequently used today to give a durable and
dimensionally stable material with an initial brownish color (Jones et al. 2019). The
brownish color is related to the degradation of the hemicelluloses and lignin during the
modification process (Esteves and Pereira 2008), and the color can be varied by the choice
of wood species and process conditions (International ThermoWood Association 2003;
Bekhta and Niemz 2005). The chromophores present in TMT before and after UV radiation
exposure are not known in detail, but a study (Tolvaj et al. 2014) showed that thermal
modification processes reduced the red color discoloration during photodegradation, whilst
limiting changes in yellow color associated with lignin degradation. It was concluded that
thermal modification provided a slight improvement in photodegradative stabilization.
PEER-REVIEWED ARTICLE bioresources.com
Kim et al. (2020). “Methacrylic resin wood protection,” BioResources 15(3), 7018-7033. 7020
TMT has been found to be more durable against biological degradation than
unmodified timber, possibly due to the reduced levels of easily accessible nutrients. The
presence of quickly metabolised sugars and methanol-soluble extractives has been shown
to be lower in TMT processed under open superheated conditions versus TMT processed
under closed and saturated steam conditions (Karlsson et al. 2012a, 2012b; Sidorova et al.
2018).
Because lignin and polyphenols are the wood constituents most susceptible to
photodegradation, attempts to increase the UV-stability of lignin in wood have been
accomplished with benzophenones (Kiguchi and Evans 1998; Olsson et al. 2012) and with
UV-absorbers, such as hindered amine light stabilizers (HALS), in conjunction with
Tinuvin® lignin radical stabilisers (Schaller and Rogez 2007; Forsthuber et al. 2013).
Reactions using benzoyl chloride (Pandey and Chandrashekar 2006; Pandey and Srinivas
2013), vinyl benzoate (Jebrane et al. 2009), acetylation of wood, and treatment with certain
chromium compounds (Evans 2009) can also reduce the discoloration of weathered wood.
Iron-based salts with or without oxidants can influence the color of TMT during weathering
(Karlsson and Morén 2010). The addition of pigments into an oil coating of TMT can
improve its color stability (Jämsä et al. 2000). Silicon-based sol-gel (Mahltig et al. 2010)
and TiO2 and ZnO nanoparticles can improve color stability, but the latter can also lead to
increased cracking of the waterborne polyacrylate film coating during both outdoor and
artificial exposure (Miklečić et al. 2015). Methyl methacrylate (MMA) is known to
increase the hardness of wood; it has also been suggested that it has a stabilizing effect on
wood degradation by UV radiation (Feist et al. 1991).
MMA is a monomer that is produced on a large scale for the production of
poly(methyl methacrylate). It has been used to improve the dimensional stability of wood;
however, the effect of MMA resin is limited because the monomer does not easily penetrate
into the cell walls (Ellis and O’Dell 1999). Some studies on the application of MMA to
wood have shown an improvement of the dimensional stability, surface characteristics, and
density (Koubaa et al. 2012; Li et al. 2012).
MMA has a distinctive acrid odour that makes it difficult to handle. Karlsson et al.
(2018) have suggested applying a commercial MMA-based resin to improve the resistance
of wood to mould growth. Colonisation of such microorganisms on surfaces in wood
constructions may not only influence their aesthetic appearance but may also cause health
problem for residents.
The purpose of the present study is to investigate the possibility of applying
commercial MMA-based resin to untreated and thermally-modified wood to improve its
resistance to mould growth and to surface discoloration when exposed outdoors for a
limited period of weather exposure (for example during the construction of a wooden
building). Based on the results of the experiments, examples of the use of the treatment
system in wooden constructions are proposed.
EXPERIMENTAL
Two different tests were performed: an outdoor weathering test with wood
specimens of dimensions of 20 mm × 100 mm × 150 mm (length (L) × width (W) × height
(H)), and an in vitro mould test with wood specimens of dimensions of 45 mm × 22 mm ×
5 mm (L × W × H).
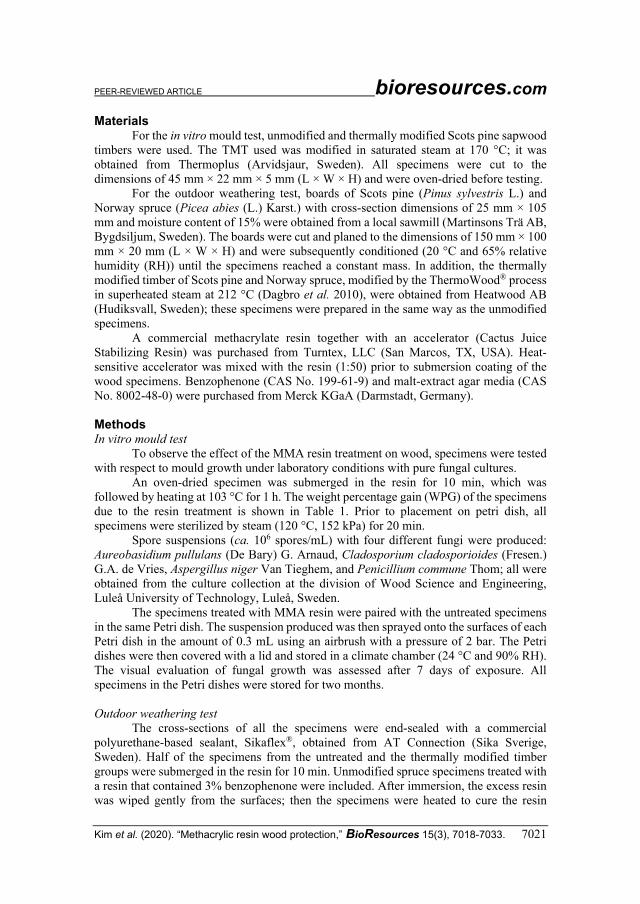
PEER-REVIEWED ARTICLE bioresources.com
Kim et al. (2020). “Methacrylic resin wood protection,” BioResources 15(3), 7018-7033. 7021
Materials For the in vitro mould test, unmodified and thermally modified Scots pine sapwood
timbers were used. The TMT used was modified in saturated steam at 170 °C; it was
obtained from Thermoplus (Arvidsjaur, Sweden). All specimens were cut to the
dimensions of 45 mm × 22 mm × 5 mm (L × W × H) and were oven-dried before testing.
For the outdoor weathering test, boards of Scots pine (Pinus sylvestris L.) and
Norway spruce (Picea abies (L.) Karst.) with cross-section dimensions of 25 mm × 105
mm and moisture content of 15% were obtained from a local sawmill (Martinsons Trä AB,
Bygdsiljum, Sweden). The boards were cut and planed to the dimensions of 150 mm × 100
mm × 20 mm (L × W × H) and were subsequently conditioned (20 °C and 65% relative
humidity (RH)) until the specimens reached a constant mass. In addition, the thermally
modified timber of Scots pine and Norway spruce, modified by the ThermoWood® process
in superheated steam at 212 °C (Dagbro et al. 2010), were obtained from Heatwood AB
(Hudiksvall, Sweden); these specimens were prepared in the same way as the unmodified
specimens.
A commercial methacrylate resin together with an accelerator (Cactus Juice
Stabilizing Resin) was purchased from Turntex, LLC (San Marcos, TX, USA). Heat-
sensitive accelerator was mixed with the resin (1:50) prior to submersion coating of the
wood specimens. Benzophenone (CAS No. 199-61-9) and malt-extract agar media (CAS
No. 8002-48-0) were purchased from Merck KGaA (Darmstadt, Germany).
Methods In vitro mould test
To observe the effect of the MMA resin treatment on wood, specimens were tested
with respect to mould growth under laboratory conditions with pure fungal cultures.
An oven-dried specimen was submerged in the resin for 10 min, which was
followed by heating at 103 °C for 1 h. The weight percentage gain (WPG) of the specimens
due to the resin treatment is shown in Table 1. Prior to placement on petri dish, all
specimens were sterilized by steam (120 °C, 152 kPa) for 20 min.
Spore suspensions (ca. 106 spores/mL) with four different fungi were produced:
Aureobasidium pullulans (De Bary) G. Arnaud, Cladosporium cladosporioides (Fresen.)
G.A. de Vries, Aspergillus niger Van Tieghem, and Penicillium commune Thom; all were
obtained from the culture collection at the division of Wood Science and Engineering,
Luleå University of Technology, Luleå, Sweden.
The specimens treated with MMA resin were paired with the untreated specimens
in the same Petri dish. The suspension produced was then sprayed onto the surfaces of each
Petri dish in the amount of 0.3 mL using an airbrush with a pressure of 2 bar. The Petri
dishes were then covered with a lid and stored in a climate chamber (24 °C and 90% RH).
The visual evaluation of fungal growth was assessed after 7 days of exposure. All
specimens in the Petri dishes were stored for two months.
Outdoor weathering test
The cross-sections of all the specimens were end-sealed with a commercial
polyurethane-based sealant, Sikaflex®, obtained from AT Connection (Sika Sverige,
Sweden). Half of the specimens from the untreated and the thermally modified timber
groups were submerged in the resin for 10 min. Unmodified spruce specimens treated with
a resin that contained 3% benzophenone were included. After immersion, the excess resin
was wiped gently from the surfaces; then the specimens were heated to cure the resin
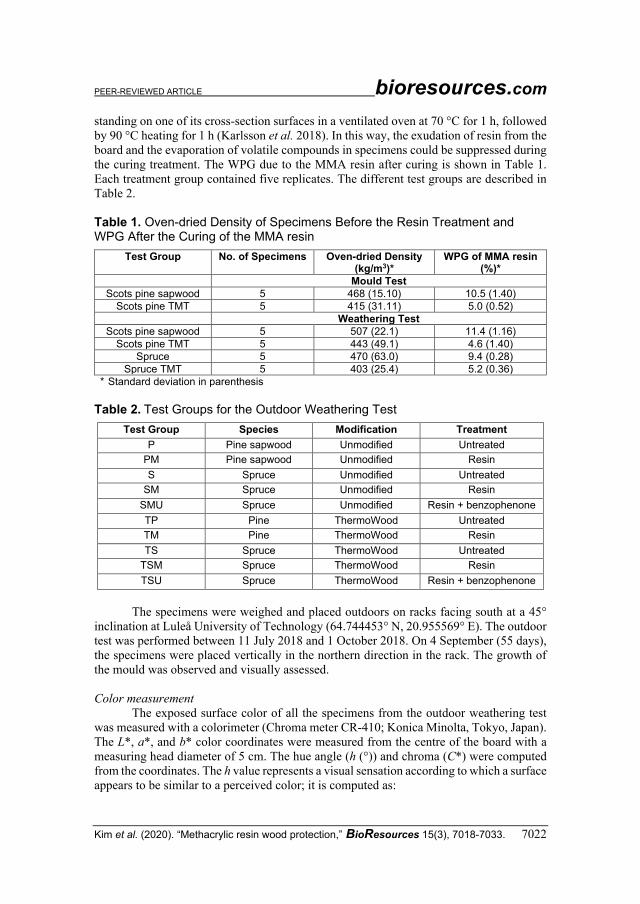
PEER-REVIEWED ARTICLE bioresources.com
Kim et al. (2020). “Methacrylic resin wood protection,” BioResources 15(3), 7018-7033. 7022
standing on one of its cross-section surfaces in a ventilated oven at 70 °C for 1 h, followed
by 90 °C heating for 1 h (Karlsson et al. 2018). In this way, the exudation of resin from the
board and the evaporation of volatile compounds in specimens could be suppressed during
the curing treatment. The WPG due to the MMA resin after curing is shown in Table 1.
Each treatment group contained five replicates. The different test groups are described in
Table 2.
Table 1. Oven-dried Density of Specimens Before the Resin Treatment and WPG After the Curing of the MMA resin
Test Group No. of Specimens Oven-dried Density (kg/m3)*
WPG of MMA resin (%)*
Mould Test
Scots pine sapwood 5 468 (15.10) 10.5 (1.40)
Scots pine TMT 5 415 (31.11) 5.0 (0.52)
Weathering Test
Scots pine sapwood 5 507 (22.1) 11.4 (1.16)
Scots pine TMT 5 443 (49.1) 4.6 (1.40)
Spruce 5 470 (63.0) 9.4 (0.28)
Spruce TMT 5 403 (25.4) 5.2 (0.36)
* Standard deviation in parenthesis
Table 2. Test Groups for the Outdoor Weathering Test
Test Group Species Modification Treatment
P Pine sapwood Unmodified Untreated
PM Pine sapwood Unmodified Resin
S Spruce Unmodified Untreated
SM Spruce Unmodified Resin
SMU Spruce Unmodified Resin + benzophenone
TP Pine ThermoWood Untreated
TM Pine ThermoWood Resin
TS Spruce ThermoWood Untreated
TSM Spruce ThermoWood Resin
TSU Spruce ThermoWood Resin + benzophenone
The specimens were weighed and placed outdoors on racks facing south at a 45°
inclination at Luleå University of Technology (64.744453° N, 20.955569° E). The outdoor
test was performed between 11 July 2018 and 1 October 2018. On 4 September (55 days),
the specimens were placed vertically in the northern direction in the rack. The growth of
the mould was observed and visually assessed.
Color measurement
The exposed surface color of all the specimens from the outdoor weathering test
was measured with a colorimeter (Chroma meter CR-410; Konica Minolta, Tokyo, Japan).
The L*, a*, and b* color coordinates were measured from the centre of the board with a
measuring head diameter of 5 cm. The hue angle (h (°)) and chroma (C*) were computed
from the coordinates. The h value represents a visual sensation according to which a surface
appears to be similar to a perceived color; it is computed as:
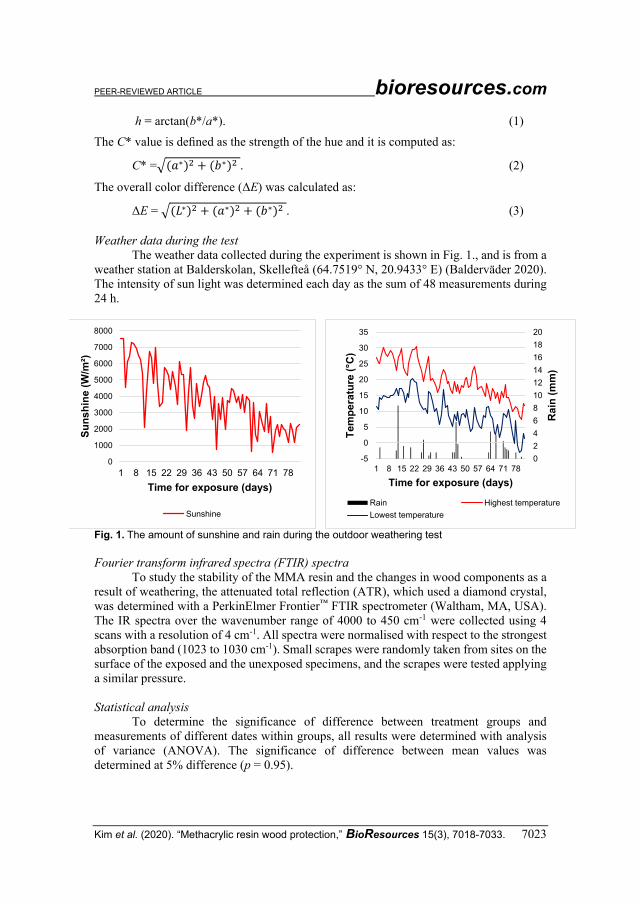
PEER-REVIEWED ARTICLE bioresources.com
Kim et al. (2020). “Methacrylic resin wood protection,” BioResources 15(3), 7018-7033. 7023
h = arctan(b*/a*). (1)
The C* value is defined as the strength of the hue and it is computed as:
C* =√(𝑎∗)2 + (𝑏∗)2 . (2)
The overall color difference (ΔE) was calculated as:
ΔE = √(𝐿∗)2 + (𝑎∗)2 + (𝑏∗)2 . (3)
Weather data during the test
The weather data collected during the experiment is shown in Fig. 1., and is from a
weather station at Balderskolan, Skellefteå (64.7519° N, 20.9433° E) (Balderväder 2020).
The intensity of sun light was determined each day as the sum of 48 measurements during
24 h.
Fig. 1. The amount of sunshine and rain during the outdoor weathering test
Fourier transform infrared spectra (FTIR) spectra
To study the stability of the MMA resin and the changes in wood components as a
result of weathering, the attenuated total reflection (ATR), which used a diamond crystal,
was determined with a PerkinElmer Frontier™ FTIR spectrometer (Waltham, MA, USA).
The IR spectra over the wavenumber range of 4000 to 450 cm-1 were collected using 4
scans with a resolution of 4 cm-1. All spectra were normalised with respect to the strongest
absorption band (1023 to 1030 cm-1). Small scrapes were randomly taken from sites on the
surface of the exposed and the unexposed specimens, and the scrapes were tested applying
a similar pressure.
Statistical analysis
To determine the significance of difference between treatment groups and
measurements of different dates within groups, all results were determined with analysis
of variance (ANOVA). The significance of difference between mean values was
determined at 5% difference (p = 0.95).
0
1000
2000
3000
4000
5000
6000
7000
8000
1 8 15 22 29 36 43 50 57 64 71 78
Su
nsh
ine (
W/m
²)
Time for exposure (days)
Sunshine
0
2
4
6
8
10
12
14
16
18
20
-5
0
5
10
15
20
25
30
35
1 8 15 22 29 36 43 50 57 64 71 78
Ra
in (
mm
)
Tem
pera
ture
(°C
)
Time for exposure (days)
Rain Highest temperature
Lowest temperature
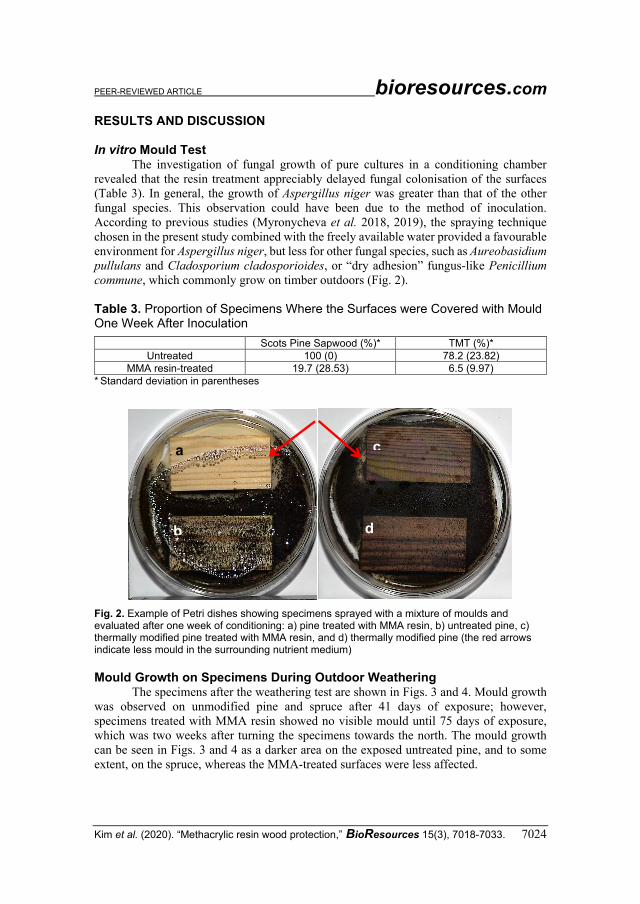
PEER-REVIEWED ARTICLE bioresources.com
Kim et al. (2020). “Methacrylic resin wood protection,” BioResources 15(3), 7018-7033. 7024
RESULTS AND DISCUSSION In vitro Mould Test
The investigation of fungal growth of pure cultures in a conditioning chamber
revealed that the resin treatment appreciably delayed fungal colonisation of the surfaces
(Table 3). In general, the growth of Aspergillus niger was greater than that of the other
fungal species. This observation could have been due to the method of inoculation.
According to previous studies (Myronycheva et al. 2018, 2019), the spraying technique
chosen in the present study combined with the freely available water provided a favourable
environment for Aspergillus niger, but less for other fungal species, such as Aureobasidium
pullulans and Cladosporium cladosporioides, or “dry adhesion” fungus-like Penicillium
commune, which commonly grow on timber outdoors (Fig. 2).
Table 3. Proportion of Specimens Where the Surfaces were Covered with Mould One Week After Inoculation
Scots Pine Sapwood (%)* TMT (%)*
Untreated 100 (0) 78.2 (23.82)
MMA resin-treated 19.7 (28.53) 6.5 (9.97)
* Standard deviation in parentheses
Fig. 2. Example of Petri dishes showing specimens sprayed with a mixture of moulds and evaluated after one week of conditioning: a) pine treated with MMA resin, b) untreated pine, c) thermally modified pine treated with MMA resin, and d) thermally modified pine (the red arrows indicate less mould in the surrounding nutrient medium)
Mould Growth on Specimens During Outdoor Weathering The specimens after the weathering test are shown in Figs. 3 and 4. Mould growth
was observed on unmodified pine and spruce after 41 days of exposure; however,
specimens treated with MMA resin showed no visible mould until 75 days of exposure,
which was two weeks after turning the specimens towards the north. The mould growth
can be seen in Figs. 3 and 4 as a darker area on the exposed untreated pine, and to some
extent, on the spruce, whereas the MMA-treated surfaces were less affected.
a
b
c
d
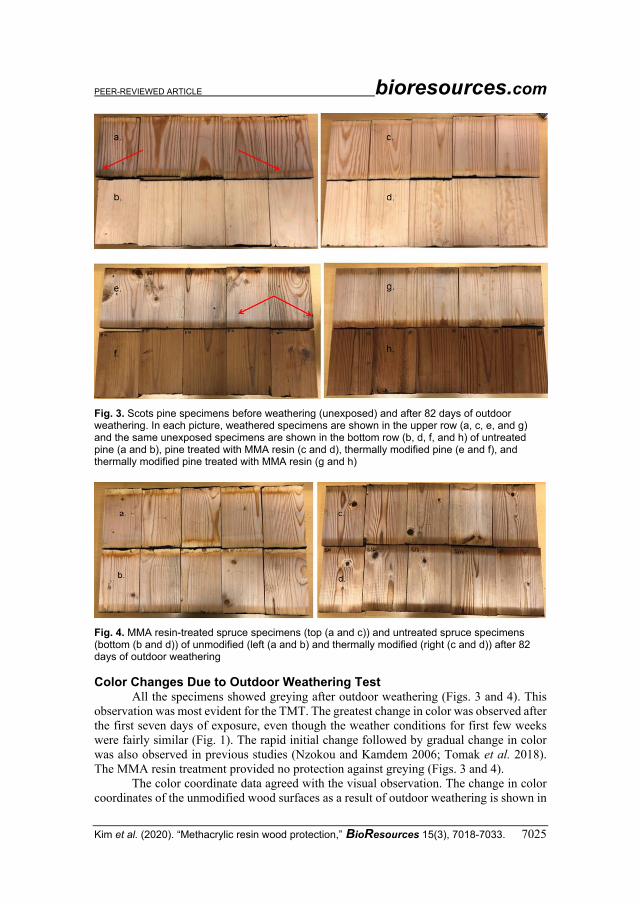
PEER-REVIEWED ARTICLE bioresources.com
Kim et al. (2020). “Methacrylic resin wood protection,” BioResources 15(3), 7018-7033. 7025
Fig. 3. Scots pine specimens before weathering (unexposed) and after 82 days of outdoor weathering. In each picture, weathered specimens are shown in the upper row (a, c, e, and g) and the same unexposed specimens are shown in the bottom row (b, d, f, and h) of untreated pine (a and b), pine treated with MMA resin (c and d), thermally modified pine (e and f), and thermally modified pine treated with MMA resin (g and h)
Fig. 4. MMA resin-treated spruce specimens (top (a and c)) and untreated spruce specimens (bottom (b and d)) of unmodified (left (a and b) and thermally modified (right (c and d)) after 82 days of outdoor weathering
Color Changes Due to Outdoor Weathering Test All the specimens showed greying after outdoor weathering (Figs. 3 and 4). This
observation was most evident for the TMT. The greatest change in color was observed after
the first seven days of exposure, even though the weather conditions for first few weeks
were fairly similar (Fig. 1). The rapid initial change followed by gradual change in color
was also observed in previous studies (Nzokou and Kamdem 2006; Tomak et al. 2018).
The MMA resin treatment provided no protection against greying (Figs. 3 and 4).
The color coordinate data agreed with the visual observation. The change in color
coordinates of the unmodified wood surfaces as a result of outdoor weathering is shown in
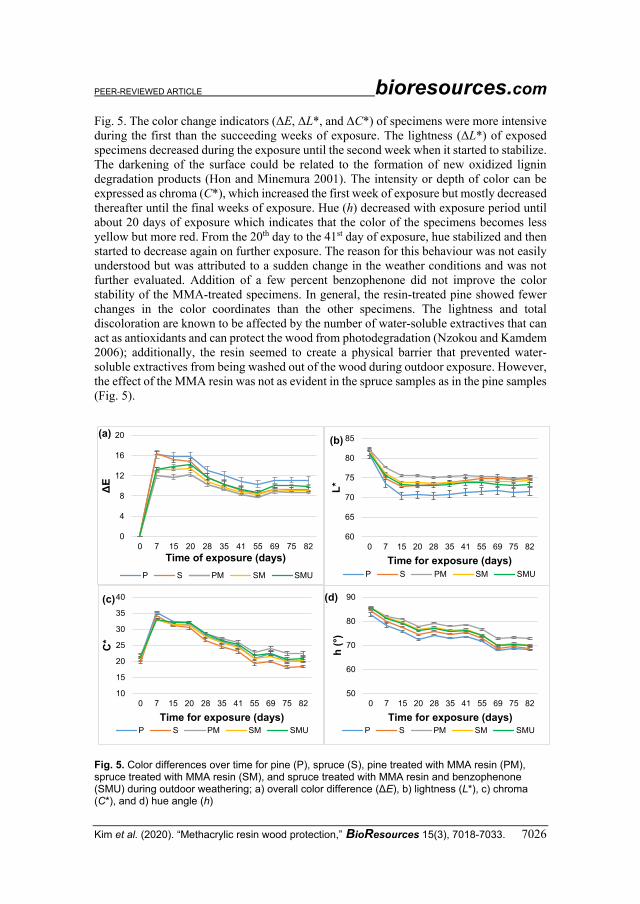
PEER-REVIEWED ARTICLE bioresources.com
Kim et al. (2020). “Methacrylic resin wood protection,” BioResources 15(3), 7018-7033. 7026
Fig. 5. The color change indicators (ΔE, ΔL*, and ΔC*) of specimens were more intensive
during the first than the succeeding weeks of exposure. The lightness (ΔL*) of exposed
specimens decreased during the exposure until the second week when it started to stabilize.
The darkening of the surface could be related to the formation of new oxidized lignin
degradation products (Hon and Minemura 2001). The intensity or depth of color can be
expressed as chroma (C*), which increased the first week of exposure but mostly decreased
thereafter until the final weeks of exposure. Hue (h) decreased with exposure period until
about 20 days of exposure which indicates that the color of the specimens becomes less
yellow but more red. From the 20th day to the 41st day of exposure, hue stabilized and then
started to decrease again on further exposure. The reason for this behaviour was not easily
understood but was attributed to a sudden change in the weather conditions and was not
further evaluated. Addition of a few percent benzophenone did not improve the color
stability of the MMA-treated specimens. In general, the resin-treated pine showed fewer
changes in the color coordinates than the other specimens. The lightness and total
discoloration are known to be affected by the number of water-soluble extractives that can
act as antioxidants and can protect the wood from photodegradation (Nzokou and Kamdem
2006); additionally, the resin seemed to create a physical barrier that prevented water-
soluble extractives from being washed out of the wood during outdoor exposure. However,
the effect of the MMA resin was not as evident in the spruce samples as in the pine samples
(Fig. 5).
Fig. 5. Color differences over time for pine (P), spruce (S), pine treated with MMA resin (PM), spruce treated with MMA resin (SM), and spruce treated with MMA resin and benzophenone (SMU) during outdoor weathering; a) overall color difference (ΔE), b) lightness (L*), c) chroma (C*), and d) hue angle (h)
0
4
8
12
16
20
0 7 15 20 28 35 41 55 69 75 82
ΔE
Time of exposure (days)
P S PM SM SMU
60
65
70
75
80
85
0 7 15 20 28 35 41 55 69 75 82
L*
Time for exposure (days)
P S PM SM SMU
10
15
20
25
30
35
40
0 7 15 20 28 35 41 55 69 75 82
C*
Time for exposure (days)P S PM SM SMU
50
60
70
80
90
0 7 15 20 28 35 41 55 69 75 82
h (°)
Time for exposure (days)P S PM SM SMU
(a)
(d) (c)
(b)
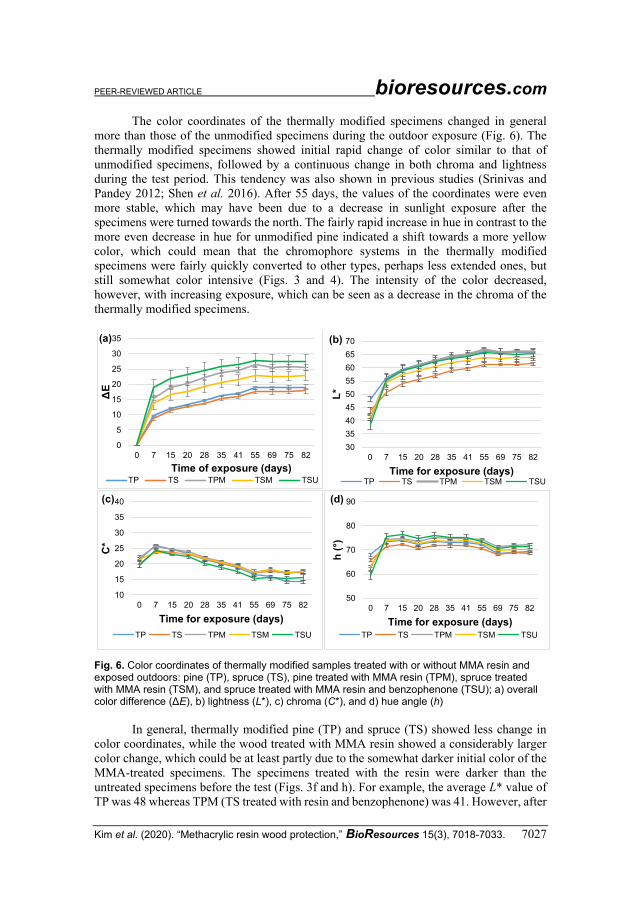
PEER-REVIEWED ARTICLE bioresources.com
Kim et al. (2020). “Methacrylic resin wood protection,” BioResources 15(3), 7018-7033. 7027
The color coordinates of the thermally modified specimens changed in general
more than those of the unmodified specimens during the outdoor exposure (Fig. 6). The
thermally modified specimens showed initial rapid change of color similar to that of
unmodified specimens, followed by a continuous change in both chroma and lightness
during the test period. This tendency was also shown in previous studies (Srinivas and
Pandey 2012; Shen et al. 2016). After 55 days, the values of the coordinates were even
more stable, which may have been due to a decrease in sunlight exposure after the
specimens were turned towards the north. The fairly rapid increase in hue in contrast to the
more even decrease in hue for unmodified pine indicated a shift towards a more yellow
color, which could mean that the chromophore systems in the thermally modified
specimens were fairly quickly converted to other types, perhaps less extended ones, but
still somewhat color intensive (Figs. 3 and 4). The intensity of the color decreased,
however, with increasing exposure, which can be seen as a decrease in the chroma of the
thermally modified specimens.
Fig. 6. Color coordinates of thermally modified samples treated with or without MMA resin and exposed outdoors: pine (TP), spruce (TS), pine treated with MMA resin (TPM), spruce treated with MMA resin (TSM), and spruce treated with MMA resin and benzophenone (TSU); a) overall color difference (ΔE), b) lightness (L*), c) chroma (C*), and d) hue angle (h)
In general, thermally modified pine (TP) and spruce (TS) showed less change in
color coordinates, while the wood treated with MMA resin showed a considerably larger
color change, which could be at least partly due to the somewhat darker initial color of the
MMA-treated specimens. The specimens treated with the resin were darker than the
untreated specimens before the test (Figs. 3f and h). For example, the average L* value of
TP was 48 whereas TPM (TS treated with resin and benzophenone) was 41. However, after
0
5
10
15
20
25
30
35
0 7 15 20 28 35 41 55 69 75 82
ΔE
Time of exposure (days)TP TS TPM TSM TSU
30
35
40
45
50
55
60
65
70
0 7 15 20 28 35 41 55 69 75 82
L*
Time for exposure (days)TP TS TPM TSM TSU
10
15
20
25
30
35
40
0 7 15 20 28 35 41 55 69 75 82
C*
Time for exposure (days)
TP TS TPM TSM TSU
50
60
70
80
90
0 7 15 20 28 35 41 55 69 75 82
h (°)
Time for exposure (days)TP TS TPM TSM TSU
(a)
(d)
(b)
(c)
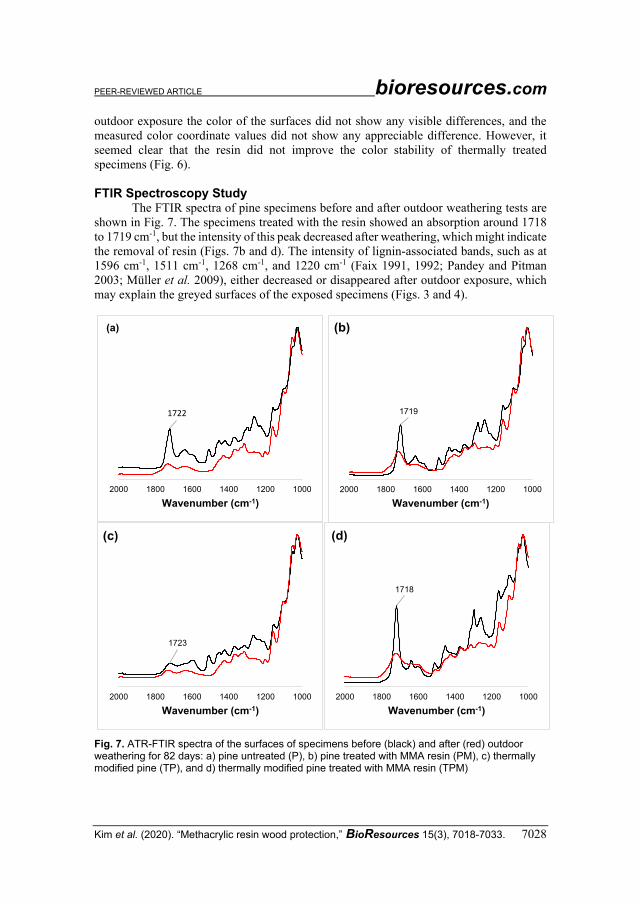
PEER-REVIEWED ARTICLE bioresources.com
Kim et al. (2020). “Methacrylic resin wood protection,” BioResources 15(3), 7018-7033. 7028
outdoor exposure the color of the surfaces did not show any visible differences, and the
measured color coordinate values did not show any appreciable difference. However, it
seemed clear that the resin did not improve the color stability of thermally treated
specimens (Fig. 6).
FTIR Spectroscopy Study
The FTIR spectra of pine specimens before and after outdoor weathering tests are
shown in Fig. 7. The specimens treated with the resin showed an absorption around 1718
to 1719 cm-1, but the intensity of this peak decreased after weathering, which might indicate
the removal of resin (Figs. 7b and d). The intensity of lignin-associated bands, such as at
1596 cm-1, 1511 cm-1, 1268 cm-1, and 1220 cm-1 (Faix 1991, 1992; Pandey and Pitman
2003; Müller et al. 2009), either decreased or disappeared after outdoor exposure, which
may explain the greyed surfaces of the exposed specimens (Figs. 3 and 4).
Fig. 7. ATR-FTIR spectra of the surfaces of specimens before (black) and after (red) outdoor weathering for 82 days: a) pine untreated (P), b) pine treated with MMA resin (PM), c) thermally modified pine (TP), and d) thermally modified pine treated with MMA resin (TPM)
1722
2000 1800 1600 1400 1200 1000
Wavenumber (cm-1)
1719
2000 1800 1600 1400 1200 1000
Wavenumber (cm-1)
1723
2000 1800 1600 1400 1200 1000
Wavenumber (cm-1)
1718
2000 1800 1600 1400 1200 1000
Wavenumber (cm-1)
(b)
(c) (d)
(a)
PEER-REVIEWED ARTICLE bioresources.com
Kim et al. (2020). “Methacrylic resin wood protection,” BioResources 15(3), 7018-7033. 7029
The extent of the absorption at 1722 to 1723 cm-1 was lower for the thermally
modified than for the unmodified specimens after outdoor exposure (Figs. 7a and c).
Hydrolysis of the acetyl group bond is believed to be caused by thermal modification
(Nuopponen et al. 2005), but the FTIR absorption due to ester groups in wood components
still seemed to be present, although to a lesser extent (Fig. 7c). Oxidised and water-soluble
lignin photodegradation products have been found to absorb in this region (Bejo et al.
2019). However, they contributed to a minor extent in the exposed specimens.
CONCLUSIONS 1. The methacrylate resin improved the mould resistance but not the discoloration of
wood during outdoor exposure, which was presumably because the methacrylate resin
was removed by the exposure to outdoor weathering.
2. To prevent mould growth and greying the resin treatment could be applied to wood
surfaces that are not directly exposed to sunshine and rain, but where the RH is high,
like under a roof or in an attic.
ACKNOWLEDGMENTS
Financial support from the Swedish Research Council for Environment,
Agricultural Sciences and Spatial Planning (FORMAS), project “Fungal growth on modified wood-based products under sub-arctic conditions 2017-00419,” is gratefully acknowledged.
REFERENCES CITED Balderväder (2020). Statistik: http://balderskolan.se/vader/stat.php
Bejo, L., Tolvaj, L., Kannar, A., and Preklet, E. (2019). “Effect of water leaching on
photodegraded spruce wood monitored by IR spectroscopy,” J. Photochem Photobiol
A: Chem. 382, Paper 111948. DOI: 10.1016/j.jphotochem.2019.111948
Bekhta, P., and Niemz, P. (2005). “Effect of high temperature on the change in color, dimensional stability and mechanical properties of spruce wood,” Holzforschung
57(5), 539-546. DOI: 10.1515/HF.2003.080
Brischke, C., and Unger, W. (2017). “Potential hazard and degrading agents,” in: Performance of Bio-based Building Materials, D. Jones, and C. Brischke (eds.),
Woodhead Publishing, Duxford, England, pp. 188-202.
Browne, F. L., and Simonson, H. (1957). “The penetration of light into wood,” Forest
Products Journal 7(10), 303-314.
Dagbro, O., Torniainen, P., Karlsson, O., and Morén, T. (2010). “Color responses from
wood, thermally modified in superheated steam and pressurized steam atmospheres,” Wood Material Science & Engineering 5(3-4), 211-219. DOI:
10.1080/17480272.2010.520739
Ellis, W. D., and O’Dell, J. L. (1999). “Wood-polymer composites made with acrylic
monomers, isocyanate, and maleic anhydride,” Journal of Applied Polymer Science
PEER-REVIEWED ARTICLE bioresources.com
Kim et al. (2020). “Methacrylic resin wood protection,” BioResources 15(3), 7018-7033. 7030
73(12), 2493-2505. DOI: 10.1002/(SICI)1097-4628(19990919)73:12<2493::AID-
APP18>3.0.CO;2-C
EN 15457 (2014). “Paints and varnishes - Laboratory method for testing the efficacy of
film preservatives in a coating against fungi,” European Committee for Standardization, Brussels, Belgium.
Esteves, B. M., and Pereira, H. M. (2008). “Wood modification by heat treatment: A review,” BioResources 4(1), 370-404. DOI: 10.15376/biores.4.1.370-404
Evans, P. D. (2009). “Review of the weathering and photostability of modified wood,” Wood Material Science & Engineering 4(1-2), 2-13. DOI:
10.1080/17480270903249391
Faix, O. (1991). “Classification of lignins from different botanical origins by FT-IR
spectroscopy,” Holzforschung 45(S1), 21-28. DOI: 10.1515/hfsg.1991.45.s1.21
Faix, O. (1992). “Fourier transform infrared spectroscopy,” in: Methods in Lignin
Chemistry, S. Y. Lin, and C. W. Dence (eds.), Springer-Verlag, Berlin, Germany.
DOI: 10.1007/978-3-642-74065-7_7
Feist, W. C., and Hon, D. N.-S. (1984). “Chemistry of weathering and protection,” in: The Chemistry of Solid Wood, R. Rowell (ed.), American Chemical Society,
Washington, DC, USA, pp. 401-451. DOI: 10.1021/ba-1984-0207.ch011
Feist, W. C., Rowell, R. M., and Ellis, W. D. (1991). “Moisture sorption and accelerated weathering of acetylated and methacrylated aspen,” Wood and Fiber Science 23(1),
128-136.
Feist, W. C., and Mraz, E. A. (1978). “Comparison of outdoor and accelerated weathering of unprotected softwoods,” Forest Products Journal 28(3), 38-43.
Forest Products Laboratory (1975). Wood Finishing: Weathering of Wood (Research
Note FPL-0135), U.S. Department of Agriculture Forest Products Laboratory, Forest
Service, Madison, WI, USA.
Forsthuber, B., Schaller, C., and Grüll, G. (2013). “Evaluation of the photo stabilising efficiency of clear coatings comprising organic UV absorbers and mineral UV
screeners on wood surfaces,” Wood Science and Technology 47(2), 281-297. DOI:
10.1007/s00226-012-0487-6
Gierer, J., and Lin, S. Y. (1972). “Photodegradation of lignin. A contribution to the mechanism of chromophore formation,” Svensk Papperstidning 75, 233-239.
Hon, D. N.-S. (1981). “Weathering of wood in structural use,” in: Proceedings of Second
International Conference on Environmental Degradation of Engineering Materials,
Virginia Polytechnic Institute, Blacksburg, VA, USA, pp. 519-529.
Hon, D. N.-S., and Minemura, N. (2001). “Color and discoloration,” in: Wood and
Cellulosic Chemistry, D. N.-S. Hon, and N. Shirashi (eds.), Marcel Dekker, New
York, NY, USA, pp. 385-442.
International ThermoWood Association (2003). ThermoWood® Handbook, International
ThermoWood Association, Helsinki, Finland.
Jämsä, S., Ahola, P., and Viitaniemi, P. (2000). “Long‐term natural weathering of coated ThermoWood,” Pigment & Resin Technology 29(2), 68-74. DOI:
10.1108/03699420010317807
Jebrane, M., Sèbe, G., Cullis, I., and Evans, P. D. (2009). “Photostabilisation of wood
using aromatic vinyl esters,” Polymer Degradation and Stability 94(2), 151-157.
DOI: 10.1016/j.polymdegradstab.2008.11.013
PEER-REVIEWED ARTICLE bioresources.com
Kim et al. (2020). “Methacrylic resin wood protection,” BioResources 15(3), 7018-7033. 7031
Jones, D., Sandberg, D., Goli, G., and Todaro, L. (2019). Wood Modification in Europe:
A State-of-the-Art About Processes, Products, Applications, Florence University,
Florence, Italy. (In publication)
Karlsson, O., and Moren, T. (2010). “Color stabilization of heat modified Norway spruce
exposed to out-door conditions,” in: 11th International IUFRO Wood Drying
Conference, LTU Skelleftea, Skelleftea, Sweden, pp. 265-268.
Karlsson, O., Myronycheva, O., Jones, D., Sandberg, D., and Elustondo, D. (2018).
“Thermally modified wood treated with methacrylate,” in: IRG49 International
Research Group on Wood Protection Annual Meeting (IRG/WP 18-40849),
Johannesburg, South Africa, pp. 1-13.
Karlsson, O., Torniainen, P., Dagbro, O., Granlund, K., and Morén, T. (2012a).
“Presence of water-soluble compounds in thermally modified wood : Carbohydrates and furfurals,” BioResources 7(3), 3679-3689. DOI: 10.15376/biores.7.3.3679-3689
Karlsson, O., Yang, Q., Sehlstedt-Persson, M., and Morén, T. (2012b). “Heat treatments
of high temperature dried Norway spruce boards: Saccharides and furfurals in
sapwood surfaces,” BioResources 7(2), 2284-2299. DOI: 10.15376/biores.7.2.2284-
2299
Kiguchi, M., and Evans, P. D. (1998). “Photostabilisation of wood surfaces using a grafted benzophenone UV absorber,” Polymer Degradation and Stability 61(1), 33-
45. DOI: 10.1016/S0141-3910(97)00124-9
Koubaa, A., Ding, W., Chaala, A., and Bouafif, H. (2012). “Surface properties of methyl methacrylate hardened hybrid poplar wood,” Journal of Applied Polymer Science
123(3), 1428-1436. DOI: 10.1002/app.33799
Li, Y., Wu, Q., Li, J., Liu, Y., Wang, X., and Liu, Z. (2012). “Improvement of dimensional stability of wood via combination treatment: Swelling with maleic
anhydride and grafting with glycidyl methacrylate and methyl methacrylate,” Holzforschung 66(1), 56-66. DOI: 10.1515/HF.2011.123
Mahltig, B., Arnold, M., and Löthman, P. (2010). “Surface properties of sol-gel treated
thermally modified wood,” Journal of Sol-Gel Science and Technology 55(2), 221-
227. DOI: 10.1007/s10971-010-2236-3
Miklečić, J., Blagojević, S. L., Petrič, M., and Jirouš-Rajković, V. (2015). “Influence of TiO2 and ZnO nanoparticles on properties of waterborne polyacrylate coating
exposed to outdoor conditions,” Progress in Organic Coatings 89, 67-74. DOI:
10.1016/j.porgcoat.2015.07.016
Müller, G., Schöpper, C., Vos, H., Kharazipour, A., and Polle, A. (2009). “FTIR-ATR
spectroscopic analyses of changes in wood properties during particle and fibreboard
production of hard- and softwood trees,” BioResources 4(1), 49-71. DOI:
10.15376/biores.4.1.49-71
Myronycheva, O., Sehlstedt-Persson, M., Karlsson, O., and Sandberg, D. (2018).
“Growth of mold and rot fungi on copper-impregnated scots pine sapwood: Influence
of planning depth and inoculation pattern,” BioResources 13(4), 8787-8801. DOI:
10.15376/biores.13.4.8787-8801
Myronycheva, O., Poohphajai, F., Sehlstedt-Persson, M., Vikberg, T., Karlsson, O.,
Junge, H., and Sandberg, D. (2019). “Application of GRAS compounds for the control of mould growth on Scots pine sapwood surfaces: multivariate modelling of
mould grade,” Forests 10(9), Article number 714. DOI: 10.3390/f10090714
Norrström, H. (1969). “Color of unbleached sulfate pulp,” Svensk Papperstidning 19,
605-619.
PEER-REVIEWED ARTICLE bioresources.com
Kim et al. (2020). “Methacrylic resin wood protection,” BioResources 15(3), 7018-7033. 7032
Nuopponen, M., Vuorinen, T., Jämsä, S., and Viitaniemi, P. (2005). “Thermal modifications in softwood studied by FT-IR and UV resonance Raman
spectroscopies,” Journal of Wood Chemistry and Technology 24(1), 13-26. DOI:
10.1081/WCT-120035941
Nzokou, P., and Kamdem, D. P. (2006). “Influence of wood extractives on the photo-
discoloration of wood surfaces exposed to artificial weathering,” Color Research and
Applications 31(5), 425-434. DOI: 10.1002/col.20248
Olsson, S., Johansson, M., Westin, M., and Östmark, E. (2012). “Grafting of 2-hydroxy-
4(2,3-epoxypropoxy)-benzophenone and epoxidized soybean oil to wood: Reaction
conditions and effects on the color stability of Scots pine,” Polymer Degradation and
Stability 97(9), 1779-1786. DOI: 10.1016/j.polymdegradstab.2012.06.006
Pandey, K. K., and Chandrashekar, N. (2006). “Photostability of wood surfaces esterified
by benzoyl chloride,” Journal of Applied Polymer Science 99(5), 2367-2374. DOI:
10.1002/app.22685
Pandey, K. K., and Pitman, A. J. (2003). “FTIR-ATR studies of the changes in wood
chemistry following decay by brown-rot and white-rot fungi,” International
Biodeterioration & Biodegradation 52(3), 151-160. DOI: 10.1016/S0964-
8305(03)00052-0
Pandey, K. K., and Srinivas, K. (2013). “Study of UV resistance and natural weathering of coatings on chemically modified wood,” in: IRG44 International Research Group
on Wood Protection Annual Meeting (IRG/WP 13-40629), Stockholm, Sweden, pp.
1-6.
Pandey, K. K., and Vuorinen, T. (2008). “Comparative study of photodegradation of wood by a UV laser and a xenon light source,” Polymer Degradation and Stability
93(12), 2138-2146. DOI: 10.1016/j.polymdegradstab.2008.08.013
Schaller, C., and Rogez, D. (2007). “New approaches in wood coating stabilization,” Journal of Coatings Technology and Research 4(4), 401-409. DOI: 10.1007/s11998-
007-9049-5
Schultz, T. P., Nicholas, D. D., and Preston, A. F. (2007). “A brief review of the past, present, and future of wood preservation,” Pest Management Science 63(8), 784-788.
DOI: 10.1002/ps.1386
Shen, H., Cao, J., Sun, W., and Peng, Y. (2016). “Influence of post-extraction on
photostability of thermally modified scots pine wood during artificial weathering,”
BioResources 11(2), 4512-4525.
Sidorova, E., Karlsson, O., and Sandberg, D. (2018). “Composition of monosaccharides in aqueous extracts from thermally modified wood,” in: 9th European Conference on
Wood Modification ECWM9 Proceedings, SHR B.V., Wageningen, Netherlands, pp.
571-580.
Srinivas, K., and Pandey, K.K. (2012). “Photodegradation of thermally modified wood,” Journal of Photochemistry and Photobiology B: Biology 117, 140-145.
Tolvaj, L., Nemeth, R., Pasztory, Z., Bejo, L., and Takats, P. (2014). “Color stability of
thermally modified wood during short-term photodegradation,” BioResources 9(4),
6644-6651. DOI: 10.1006/jcis.2000.6898
Tomak, E. D., Ustaomer, D., Ermezdan, M. A., and Yildiz, S. (2018). “An investigation
of surface properties of thermally modified wood during natural weathering for
48 months,” Measurement 127, 187-197.
PEER-REVIEWED ARTICLE bioresources.com
Kim et al. (2020). “Methacrylic resin wood protection,” BioResources 15(3), 7018-7033. 7033
Tribulová, T., Kačík, F., Evtuguin, D., and Čabalová, I. (2016). “Assessment of chromophores in chemically treated and aged wood by UV-Vis diffuse reflectance
spectroscopy,” Cellulose Chemistry and Technology 50(5-6), 659-667.
Article submitted: December 29, 2019; Peer review completed: March 28, 2020; Revised
version received and accepted: July 21, 2020; Published: July 24, 2020.
DOI: 10.15376/biores.15.3.7018-7033

Paper VIII

Article
Application of GRAS Compounds for the Control ofMould Growth on Scots Pine Sapwood Surfaces:Multivariate Modelling of Mould Grade
Olena Myronycheva 1 , Faksawat Poohphajai 1,2, Margot Sehlstedt-Persson 1, Tommy Vikberg 3,Olov Karlsson 1,* , Helmut Junge 4 and Dick Sandberg 1
1 Wood Science and Engineering, Luleå University of Technology, 50115 Skellefteå, Sweden2 InnoRenew CoE, 6310 Izola, Slovenia3 RISE Research Institutes of Sweden, 50115 Skellefteå, Sweden4 ABiTEP GmbH, D-12489 Berlin, Germany* Correspondence: [email protected]; Tel.: +46-910-585-705
Received: 30 May 2019; Accepted: 19 August 2019; Published: 21 August 2019�����������������
Abstract: Research Highlights: In this study, the Generally Recognised as Safe (GRAS) compounds wereapplied in order to study mould-fungi growth on dried Scots pine sapwood. Background and Objectives:The transition to the use of more sustainable wood-material may be possible by applying GRAScompounds that can control and prevent contamination by primary colonising mould fungi. Materialsand Methods: Kiln-dried sawn timber was treated with three different GRAS compounds, and differentfungal inoculation methods applied in order to investigate differences in the development of fungalcommunities. Results: Substances based on potassium silicate significantly reduced fungal growthand mould contamination on the studied wood surfaces. By combining wood-surface treatmentswith GRAS compounds, fungal-area size as predictors and mould grade as response, a partial leastsquares (PLS) model that makes it possible to predict mould grade on wood surfaces was developed.The PLS model is a key component in the development of a smart grading-systems equipped bye.g. high-speed digital cameras for the early detection of fungal attack on wood surfaces in differentapplications. However, the measurements based on chemical characterisation should be the nextstep to take in order significantly to enhance the model and increase the range of robust applications.In the current study, a multivariate model describing the influence of each fungal-covering area onmould grade was presented for the first time.
Keywords: bacteria; potassium silicate; N-Alkylbensyldimethylammonium chloride; wood; fungi;mould area; PLS modeling
1. Introduction
The negative load of fossil- and petrol-based biocidal substances on the environment and thereduction of volatile organic compounds (VOCs) emitted while using solvent-based coatings, requirethe introduction of new concepts for wood-surface treatment for outdoor and indoor applications [1,2].A significant problem when wood is used and the moisture level is high, e.g. in outdoor conditions,is biodegradation caused primarily by fungi which have a unique nutrient-sensing mechanism [3]which makes the task of wood protection difficult. Environmental processes that affect the wood inoutdoor use result in aesthetic concerns and increased maintenance costs [4]. Fungal bio-aerosolsaccumulating on outdoor building-material surfaces may also have a significant impact on indoorbiological contamination, especially under sub-arctic conditions [5].
Toxigenic moulds, particularly ascomycetes, are ordinary food and indoor inhabitants associatedwith everyday human activity and they may present a health risk to humans. For example, information
Forests 2019, 10, 714; doi:10.3390/f10090714 www.mdpi.com/journal/forests
Forests 2019, 10, 714 2 of 16
from public health monitoring programs related to secondary metabolites of toxigenic moulds knownas mycotoxins has raised concern about health aspects [6]. Urinary multi-biomarker analysis amongadults in Sweden revealed that “common and concurrent exposure to more than one toxin was foundin 69% of the studied population” [7]. Nowadays, mycotoxin studies face many masked mycotoxins,and the analytical methods are quite complex due to the polydiversity of compounds’ properties.When modern regulations require “minimal fungi” levels and at the same time environmentallyfriendly solutions for bio-based materials such as wood and other related products.
Wood in the living tree is a durable material with an active defence mechanism includingextractives enrichment [8–11]. The processing of a log to sawn timber was initially developed tomeet the need for a cheap and easily available building material, and the sawmill drying procedurewas aimed to lower the sawn-timber moisture content to reduce the board weight and the risk offungal attack. Already during felling, the initial immunity of the tree starts to decrease, and the woodresistance is reduced during the further processing of the tree for use in wood-based products. Previousstudies have shown, for example, that industrial wood drying leads to the migration of hydrophilicand hydrophobic substances towards the wood surface, resulting in the creation of a nutrient gradientin the sawn timber [8,9]. Despite the enrichment of extractives, the accessibility of the wood surfaceto mould attack may be greater after industrial kiln drying than in e.g. sawn timber seasoned in theopen air [10]. The enormous biodiversity and short life cycles of fungi also emphasises other issuesinvolved in wood protection. The application of traditional copper-based wood preservatives has ledto the adaptation of fungi to these compounds and the appearance of copper-tolerant rot fungi [9].Colonising mould fungi such as Aspergillus sp. and Penicillium sp. can early grow and sporulate on acopper-impregnated wood surface, but the fungi gave different growth-patterns [12]. These differencesare addressed in the present study.
Those fungi that are most economically significant and deleterious, related to food spoilage,mycotoxin production and bio-deterioration head the list of fungi under observation by the authorities.Attention has been paid to Paecilomyces spp. for several years due to its feared negative impact onthe human body. In the present study, these fungal species (all the fungi were from the same orderEurotiales and all cosmopolitans [13]) were selected for the study because of their dominance in thesimultaneous tests and because it was planned to model the growth of the selected fungi and todevelop a method to predict fungal growth after surface treatments with Generally Recognised as Safe(GRAS) compounds.
The standard fungal test uses the mould grade index in the assessment of the treatment and mostof the models for the prediction of fungal and mould growth on wooden surfaces are based on moistconditions. There is, however, no reliable information about the interactions between mould fungi onwooden surfaces under different test conditions. In a previous study [12], the mould-area index wasintroduced for the assessment of mould growth on wooden surfaces, but more information about theinfluence of Ascomycete genera on wood degradation is required in order to better understand thebiological phenomenon.
The concept of GRAS compounds used by the Food and Drug Administration (FDA) in the USAhas been said by qualified experts to guarantee the use of adequately safe substances. This could be a“green alternative” to be applied as a wood-surface treatment to prevent biological attack by harmfulmicroorganisms [14,15]. The GRAS database includes more than 370 active GRAS substances that canbe applied in a “smart way” for wood protection without any threat to humans or the environment.For example, a study of post-harvest treatment of fruits to prevent microbiological disease successfullyreported an effective control of fungal growth [16]. GRAS compounds can be grouped by their action:biocontrol agents, natural antimicrobials, decontaminating agents and physical barriers [16].
This study has investigated the efficiency of treatments using selected GRAS compounds oforganic and inorganic origin to restrict mould-fungi growth on wood surfaces of industrial kiln-driedScots pine sapwood. The primary objective was to establish criteria for modelling and predicting
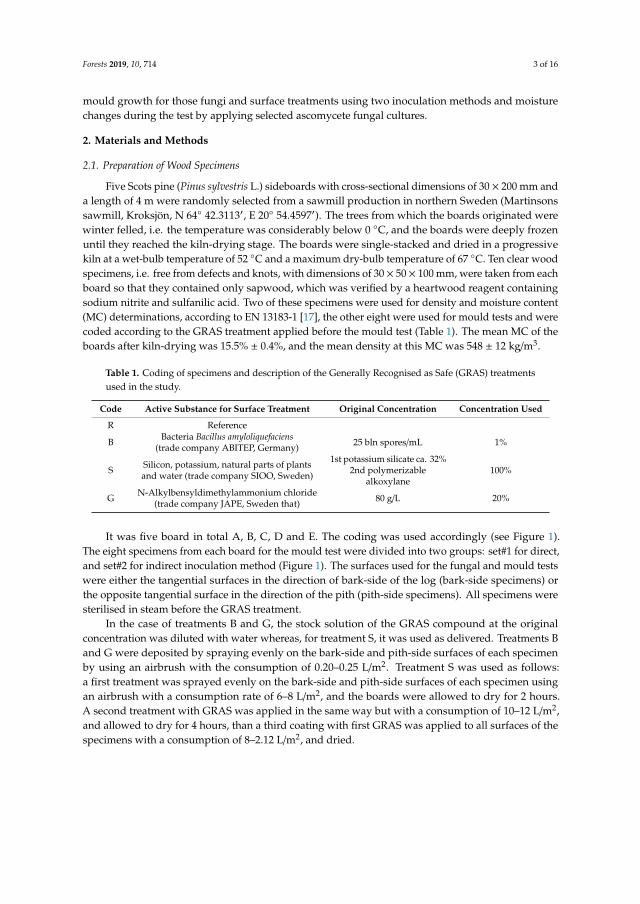
Forests 2019, 10, 714 3 of 16
mould growth for those fungi and surface treatments using two inoculation methods and moisturechanges during the test by applying selected ascomycete fungal cultures.
2. Materials and Methods
2.1. Preparation of Wood Specimens
Five Scots pine (Pinus sylvestris L.) sideboards with cross-sectional dimensions of 30 × 200 mm anda length of 4 m were randomly selected from a sawmill production in northern Sweden (Martinsonssawmill, Kroksjön, N 64◦ 42.3113′, E 20◦ 54.4597′). The trees from which the boards originated werewinter felled, i.e. the temperature was considerably below 0 ◦C, and the boards were deeply frozenuntil they reached the kiln-drying stage. The boards were single-stacked and dried in a progressivekiln at a wet-bulb temperature of 52 ◦C and a maximum dry-bulb temperature of 67 ◦C. Ten clear woodspecimens, i.e. free from defects and knots, with dimensions of 30 × 50 × 100 mm, were taken from eachboard so that they contained only sapwood, which was verified by a heartwood reagent containingsodium nitrite and sulfanilic acid. Two of these specimens were used for density and moisture content(MC) determinations, according to EN 13183-1 [17], the other eight were used for mould tests and werecoded according to the GRAS treatment applied before the mould test (Table 1). The mean MC of theboards after kiln-drying was 15.5% ± 0.4%, and the mean density at this MC was 548 ± 12 kg/m3.
Table 1. Coding of specimens and description of the Generally Recognised as Safe (GRAS) treatmentsused in the study.
Code Active Substance for Surface Treatment Original Concentration Concentration Used
R Reference
B Bacteria Bacillus amyloliquefaciens(trade company ABITEP, Germany) 25 bln spores/mL 1%
S Silicon, potassium, natural parts of plantsand water (trade company SIOO, Sweden)
1st potassium silicate ca. 32%2nd polymerizable
alkoxylane100%
G N-Alkylbensyldimethylammonium chloride(trade company JAPE, Sweden that) 80 g/L 20%
It was five board in total A, B, C, D and E. The coding was used accordingly (see Figure 1).The eight specimens from each board for the mould test were divided into two groups: set#1 for direct,and set#2 for indirect inoculation method (Figure 1). The surfaces used for the fungal and mould testswere either the tangential surfaces in the direction of bark-side of the log (bark-side specimens) orthe opposite tangential surface in the direction of the pith (pith-side specimens). All specimens weresterilised in steam before the GRAS treatment.
In the case of treatments B and G, the stock solution of the GRAS compound at the originalconcentration was diluted with water whereas, for treatment S, it was used as delivered. Treatments Band G were deposited by spraying evenly on the bark-side and pith-side surfaces of each specimenby using an airbrush with the consumption of 0.20–0.25 L/m2. Treatment S was used as follows:a first treatment was sprayed evenly on the bark-side and pith-side surfaces of each specimen usingan airbrush with a consumption rate of 6–8 L/m2, and the boards were allowed to dry for 2 hours.A second treatment with GRAS was applied in the same way but with a consumption of 10–12 L/m2,and allowed to dry for 4 hours, than a third coating with first GRAS was applied to all surfaces of thespecimens with a consumption of 8–2.12 L/m2, and dried.
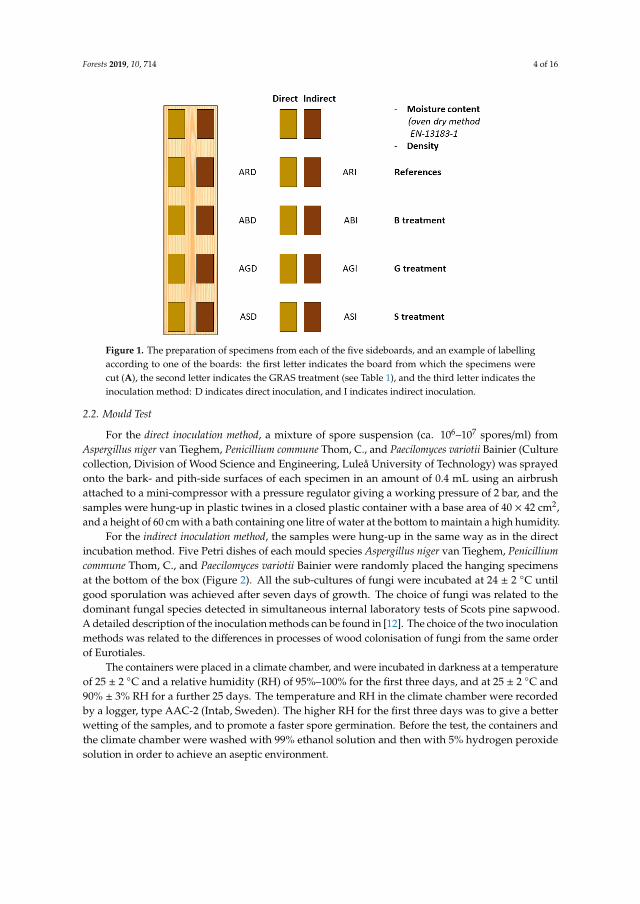
Forests 2019, 10, 714 4 of 16Forests 2019, 10, x FOR PEER REVIEW 4 of 16
Figure 1. The preparation of specimens from each of the five sideboards, and an example of labelling according to one of the boards: the first letter indicates the board from which the specimens were cut (A), the second letter indicates the GRAS treatment (see Table 1), and the third letter indicates the inoculation method: D indicates direct inoculation, and I indicates indirect inoculation.
In the case of treatments B and G, the stock solution of the GRAS compound at the original concentration was diluted with water whereas, for treatment S, it was used as delivered. Treatments B and G were deposited by spraying evenly on the bark-side and pith-side surfaces of each specimen by using an airbrush with the consumption of 0.20–0.25 L/m². Treatment S was used as follows: a first treatment was sprayed evenly on the bark-side and pith-side surfaces of each specimen using an airbrush with a consumption rate of 6–8 L/m2, and the boards were allowed to dry for 2 hours. A second treatment with GRAS was applied in the same way but with a consumption of 10–12 L/m2, and allowed to dry for 4 hours, than a third coating with first GRAS was applied to all surfaces of the specimens with a consumption of 8–2.12 L/m2, and dried.
2.2. Mould Test
For the direct inoculation method, a mixture of spore suspension (ca. 106–107 spores/ml) from Aspergillus niger van Tieghem, Penicillium commune Thom, C., and Paecilomyces variotii Bainier (Culture collection, Division of Wood Science and Engineering, Luleå University of Technology) was sprayed onto the bark- and pith-side surfaces of each specimen in an amount of 0.4 mL using an airbrush attached to a mini-compressor with a pressure regulator giving a working pressure of 2 bar, and the samples were hung-up in plastic twines in a closed plastic container with a base area of 40 × 42 cm2, and a height of 60 cm with a bath containing one litre of water at the bottom to maintain a high humidity.
For the indirect inoculation method, the samples were hung-up in the same way as in the direct incubation method. Five Petri dishes of each mould species Aspergillus niger van Tieghem, Penicillium commune Thom, C., and Paecilomyces variotii Bainier were randomly placed the hanging specimens at the bottom of the box (Figure 2). All the sub-cultures of fungi were incubated at 24 ± 2°C until good sporulation was achieved after seven days of growth. The choice of fungi was related to the dominant fungal species detected in simultaneous internal laboratory tests of Scots pine sapwood. A detailed description of the inoculation methods can be found in [12]. The choice of the two inoculation methods was related to the differences in processes of wood colonisation of fungi from the same order of Eurotiales.
Figure 1. The preparation of specimens from each of the five sideboards, and an example of labellingaccording to one of the boards: the first letter indicates the board from which the specimens werecut (A), the second letter indicates the GRAS treatment (see Table 1), and the third letter indicates theinoculation method: D indicates direct inoculation, and I indicates indirect inoculation.
2.2. Mould Test
For the direct inoculation method, a mixture of spore suspension (ca. 106–107 spores/ml) fromAspergillus niger van Tieghem, Penicillium commune Thom, C., and Paecilomyces variotii Bainier (Culturecollection, Division of Wood Science and Engineering, Luleå University of Technology) was sprayedonto the bark- and pith-side surfaces of each specimen in an amount of 0.4 mL using an airbrushattached to a mini-compressor with a pressure regulator giving a working pressure of 2 bar, and thesamples were hung-up in plastic twines in a closed plastic container with a base area of 40 × 42 cm2,and a height of 60 cm with a bath containing one litre of water at the bottom to maintain a high humidity.
For the indirect inoculation method, the samples were hung-up in the same way as in the directincubation method. Five Petri dishes of each mould species Aspergillus niger van Tieghem, Penicilliumcommune Thom, C., and Paecilomyces variotii Bainier were randomly placed the hanging specimensat the bottom of the box (Figure 2). All the sub-cultures of fungi were incubated at 24 ± 2 ◦C untilgood sporulation was achieved after seven days of growth. The choice of fungi was related to thedominant fungal species detected in simultaneous internal laboratory tests of Scots pine sapwood.A detailed description of the inoculation methods can be found in [12]. The choice of the two inoculationmethods was related to the differences in processes of wood colonisation of fungi from the same orderof Eurotiales.
The containers were placed in a climate chamber, and were incubated in darkness at a temperatureof 25 ± 2 ◦C and a relative humidity (RH) of 95%–100% for the first three days, and at 25 ± 2 ◦C and90% ± 3% RH for a further 25 days. The temperature and RH in the climate chamber were recordedby a logger, type AAC-2 (Intab, Sweden). The higher RH for the first three days was to give a betterwetting of the samples, and to promote a faster spore germination. Before the test, the containers andthe climate chamber were washed with 99% ethanol solution and then with 5% hydrogen peroxidesolution in order to achieve an aseptic environment.
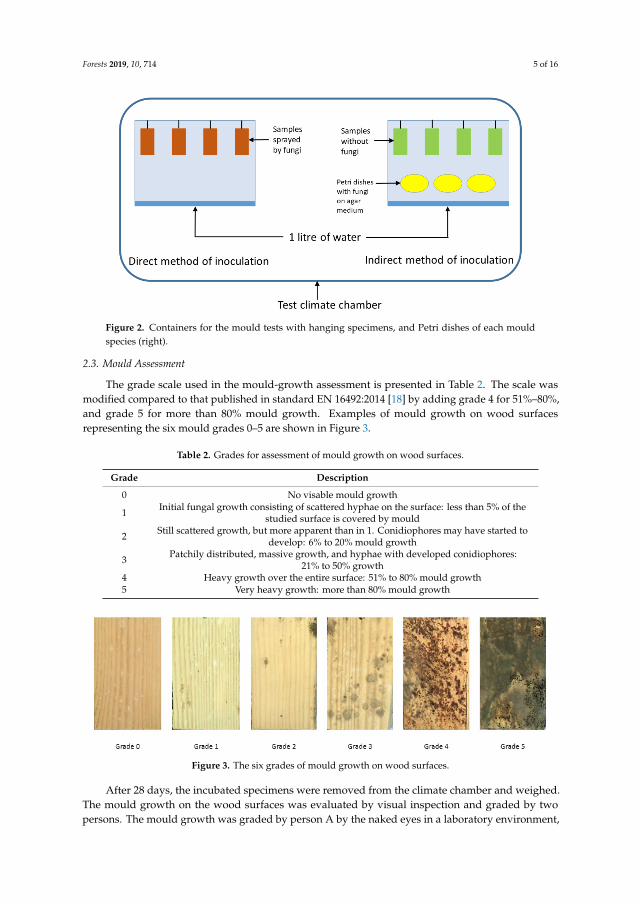
Forests 2019, 10, 714 5 of 16
The containers were placed in a climate chamber, and were incubated in darkness at a temperature of 25 ± 2 °C and a relative humidity (RH) of 95%–100% for the first three days, and at 25 ± 2 °C and 90% ± 3% RH for a further 25 days. The temperature and RH in the climate chamber were recorded by a logger, type AAC-2 (Intab, Sweden). The higher RH for the first three days was to give a better wetting of the samples, and to promote a faster spore germination. Before the test, the containers and the climate chamber were washed with 99% ethanol solution and then with 5% hydrogen peroxide solution in order to achieve an aseptic environment.
Figure 2. Containers for the mould tests with hanging specimens, and Petri dishes of each mould species (right).
2.3. Mould Assessment
The grade scale used in the mould-growth assessment is presented in Table 2. The scale was modified compared to that published in standard EN 16492:2014 [18] by adding grade 4 for 51%–80%, and grade 5 for more than 80% mould growth. Examples of mould growth on wood surfaces representing the six mould grades 0–5 are shown in Figure 3.
Table 2. Grades for assessment of mould growth on wood surfaces.
Grade Description
0 No visable mould growth
1 Initial fungal growth consisting of scattered hyphae on the surface: less than 5% of the studied surface is covered by mould
2 Still scattered growth, but more apparent than in 1. Conidiophores may have started to
develop: 6% to 20% mould growth
3 Patchily distributed, massive growth, and hyphae with developed conidiophores: 21% to 50% growth
4 Heavy growth over the entire surface: 51% to 80% mould growth
5 Very heavy growth: more than 80% mould growth
After 28 days, the incubated specimens were removed from the climate chamber and weighed. The mould growth on the wood surfaces was evaluated by visual inspection and graded by two persons. The mould growth was graded by person A by the naked eyes in a laboratory environment,
Figure 2. Containers for the mould tests with hanging specimens, and Petri dishes of each mouldspecies (right).
2.3. Mould Assessment
The grade scale used in the mould-growth assessment is presented in Table 2. The scale wasmodified compared to that published in standard EN 16492:2014 [18] by adding grade 4 for 51%–80%,and grade 5 for more than 80% mould growth. Examples of mould growth on wood surfacesrepresenting the six mould grades 0–5 are shown in Figure 3.
Table 2. Grades for assessment of mould growth on wood surfaces.
Grade Description
0 No visable mould growth
1 Initial fungal growth consisting of scattered hyphae on the surface: less than 5% of thestudied surface is covered by mould
2 Still scattered growth, but more apparent than in 1. Conidiophores may have started todevelop: 6% to 20% mould growth
3 Patchily distributed, massive growth, and hyphae with developed conidiophores:21% to 50% growth
4 Heavy growth over the entire surface: 51% to 80% mould growth5 Very heavy growth: more than 80% mould growth
Forests 2019, 10, x FOR PEER REVIEW 6 of 16
whereas person B graded the growth from images at 1× magnification where the ImageJ software [19] was used for the detection of mould growth. The individual mould species detected on the wood surfaces were identified with the optical microscope to classify the morphological characteristics of each fungus.
Figure 3. The six grades of mould growth on wood surfaces.
After assessment of mould growth, the specimens were dried in an oven at a temperature of 103 °C for 24 hours to determine the MC. The coefficient of variation (CV in %) was used to describe the scatter of the data around the mean value. The variables used for the univariate and the multivariate analysis (MVA) are described in Table 3.
The data set for statistical analysis represented in the Table S1.Univariate statistical analysis (descriptive statistics, analysis of variance (ANOVA) and post hoc tests for analysis of variance) was performed in IBM SPSS Statistics 20.0 (Armonk, NY, USA). Principal component analysis (PCA), soft independent modelling by class analogy (SIMCA) and partial least squares discriminant analysis
Figure 3. The six grades of mould growth on wood surfaces.
After 28 days, the incubated specimens were removed from the climate chamber and weighed.The mould growth on the wood surfaces was evaluated by visual inspection and graded by twopersons. The mould growth was graded by person A by the naked eyes in a laboratory environment,
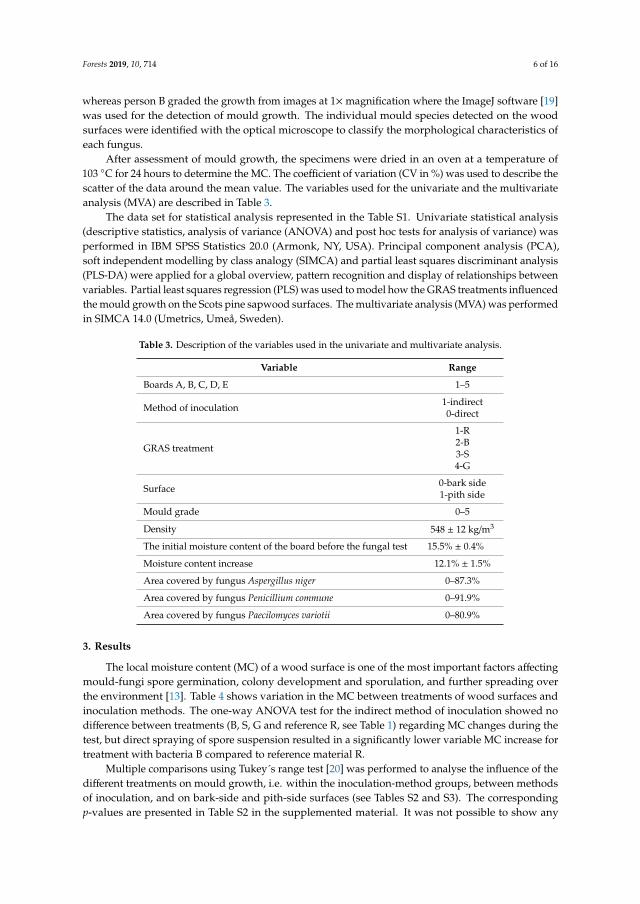
Forests 2019, 10, 714 6 of 16
whereas person B graded the growth from images at 1×magnification where the ImageJ software [19]was used for the detection of mould growth. The individual mould species detected on the woodsurfaces were identified with the optical microscope to classify the morphological characteristics ofeach fungus.
After assessment of mould growth, the specimens were dried in an oven at a temperature of103 ◦C for 24 hours to determine the MC. The coefficient of variation (CV in %) was used to describe thescatter of the data around the mean value. The variables used for the univariate and the multivariateanalysis (MVA) are described in Table 3.
The data set for statistical analysis represented in the Table S1. Univariate statistical analysis(descriptive statistics, analysis of variance (ANOVA) and post hoc tests for analysis of variance) wasperformed in IBM SPSS Statistics 20.0 (Armonk, NY, USA). Principal component analysis (PCA),soft independent modelling by class analogy (SIMCA) and partial least squares discriminant analysis(PLS-DA) were applied for a global overview, pattern recognition and display of relationships betweenvariables. Partial least squares regression (PLS) was used to model how the GRAS treatments influencedthe mould growth on the Scots pine sapwood surfaces. The multivariate analysis (MVA) was performedin SIMCA 14.0 (Umetrics, Umeå, Sweden).
Table 3. Description of the variables used in the univariate and multivariate analysis.
Variable Range
Boards A, B, C, D, E 1–5
Method of inoculation 1-indirect0-direct
GRAS treatment
1-R2-B3-S4-G
Surface 0-bark side1-pith side
Mould grade 0–5
Density 548 ± 12 kg/m3
The initial moisture content of the board before the fungal test 15.5% ± 0.4%
Moisture content increase 12.1% ± 1.5%
Area covered by fungus Aspergillus niger 0–87.3%
Area covered by fungus Penicillium commune 0–91.9%
Area covered by fungus Paecilomyces variotii 0–80.9%
3. Results
The local moisture content (MC) of a wood surface is one of the most important factors affectingmould-fungi spore germination, colony development and sporulation, and further spreading overthe environment [13]. Table 4 shows variation in the MC between treatments of wood surfaces andinoculation methods. The one-way ANOVA test for the indirect method of inoculation showed nodifference between treatments (B, S, G and reference R, see Table 1) regarding MC changes during thetest, but direct spraying of spore suspension resulted in a significantly lower variable MC increase fortreatment with bacteria B compared to reference material R.
Multiple comparisons using Tukey´s range test [20] was performed to analyse the influence of thedifferent treatments on mould growth, i.e. within the inoculation-method groups, between methodsof inoculation, and on bark-side and pith-side surfaces (see Tables S2 and S3). The correspondingp-values are presented in Table S2 in the supplemented material. It was not possible to show any
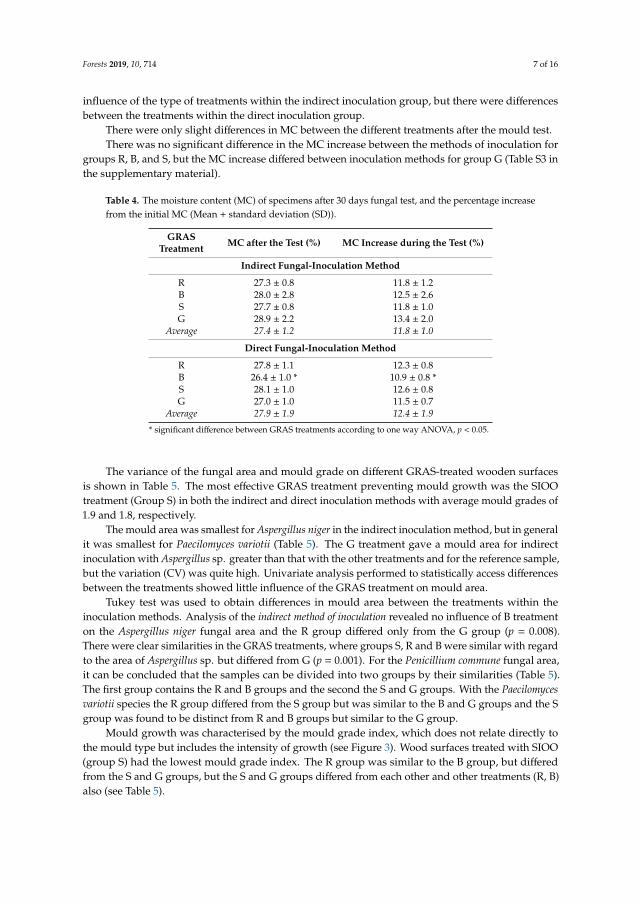
Forests 2019, 10, 714 7 of 16
influence of the type of treatments within the indirect inoculation group, but there were differencesbetween the treatments within the direct inoculation group.
There were only slight differences in MC between the different treatments after the mould test.There was no significant difference in the MC increase between the methods of inoculation for
groups R, B, and S, but the MC increase differed between inoculation methods for group G (Table S3 inthe supplementary material).
Table 4. The moisture content (MC) of specimens after 30 days fungal test, and the percentage increasefrom the initial MC (Mean + standard deviation (SD)).
GRASTreatment MC after the Test (%) MC Increase during the Test (%)
Indirect Fungal-Inoculation Method
R 27.3 ± 0.8 11.8 ± 1.2B 28.0 ± 2.8 12.5 ± 2.6S 27.7 ± 0.8 11.8 ± 1.0G 28.9 ± 2.2 13.4 ± 2.0
Average 27.4 ± 1.2 11.8 ± 1.0
Direct Fungal-Inoculation Method
R 27.8 ± 1.1 12.3 ± 0.8B 26.4 ± 1.0 * 10.9 ± 0.8 *S 28.1 ± 1.0 12.6 ± 0.8G 27.0 ± 1.0 11.5 ± 0.7
Average 27.9 ± 1.9 12.4 ± 1.9
* significant difference between GRAS treatments according to one way ANOVA, p < 0.05.
The variance of the fungal area and mould grade on different GRAS-treated wooden surfacesis shown in Table 5. The most effective GRAS treatment preventing mould growth was the SIOOtreatment (Group S) in both the indirect and direct inoculation methods with average mould grades of1.9 and 1.8, respectively.
The mould area was smallest for Aspergillus niger in the indirect inoculation method, but in generalit was smallest for Paecilomyces variotii (Table 5). The G treatment gave a mould area for indirectinoculation with Aspergillus sp. greater than that with the other treatments and for the reference sample,but the variation (CV) was quite high. Univariate analysis performed to statistically access differencesbetween the treatments showed little influence of the GRAS treatment on mould area.
Tukey test was used to obtain differences in mould area between the treatments within theinoculation methods. Analysis of the indirect method of inoculation revealed no influence of B treatmenton the Aspergillus niger fungal area and the R group differed only from the G group (p = 0.008).There were clear similarities in the GRAS treatments, where groups S, R and B were similar with regardto the area of Aspergillus sp. but differed from G (p = 0.001). For the Penicillium commune fungal area,it can be concluded that the samples can be divided into two groups by their similarities (Table 5).The first group contains the R and B groups and the second the S and G groups. With the Paecilomycesvariotii species the R group differed from the S group but was similar to the B and G groups and the Sgroup was found to be distinct from R and B groups but similar to the G group.
Mould growth was characterised by the mould grade index, which does not relate directly tothe mould type but includes the intensity of growth (see Figure 3). Wood surfaces treated with SIOO(group S) had the lowest mould grade index. The R group was similar to the B group, but differedfrom the S and G groups, but the S and G groups differed from each other and other treatments (R, B)also (see Table 5).
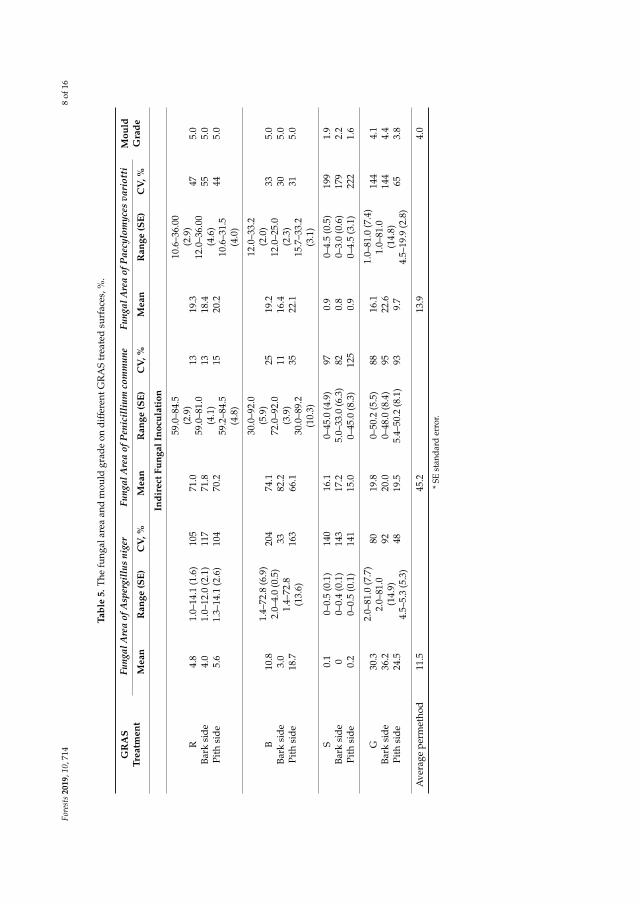
Fore
sts
2019
,10,
714
8of
16
Tabl
e5.
The
fung
alar
eaan
dm
ould
grad
eon
diff
eren
tGR
AS
trea
ted
surf
aces
,%.
GR
AS
Trea
tmen
tFu
ngal
Are
aof
Asp
ergi
llus
nige
rFu
ngal
Are
aof
Pen
icil
lium
com
mun
eFu
ngal
Are
aof
Pae
cylo
myc
esva
riot
tiM
ould
Gra
deM
ean
Ran
ge(S
E)C
V,%
Mea
nR
ange
(SE)
CV
,%M
ean
Ran
ge(S
E)C
V,%
Indi
rect
Fung
alIn
ocul
atio
n
RBa
rksi
dePi
thsi
de
4.8
4.0
5.6
1.0–
14.1
(1.6
)1.
0–12
.0(2
.1)
1.3–
14.1
(2.6
)
105
117
104
71.0
71.8
70.2
59.0
–84.
5(2
.9)
59.0
–81.
0(4
.1)
59.2
–84.
5(4
.8)
13 13 15
19.3
18.4
20.2
10.6
–36.
00(2
.9)
12.0
–36.
00(4
.6)
10.6
–31.
5(4
.0)
47 55 44
5.0
5.0
5.0
BBa
rksi
dePi
thsi
de
10.8
3.0
18.7
1.4–
72.8
(6.9
)2.
0–4.
0(0
.5)
1.4–
72.8
(13.
6)
204
33 163
74.1
82.2
66.1
30.0
–92.
0(5
.9)
72.0
–92.
0(3
.9)
30.0
–89.
2(1
0.3)
25 11 35
19.2
16.4
22.1
12.0
–33.
2(2
.0)
12.0
–25.
0(2
.3)
15.7
–33.
2(3
.1)
33 30 31
5.0
5.0
5.0
SBa
rksi
dePi
thsi
de
0.1 0 0.2
0–0.
5(0
.1)
0–0.
4(0
.1)
0–0.
5(0
.1)
140
143
141
16.1
17.2
15.0
0–45
.0(4
.9)
5.0–
33.0
(6.3
)0–
45.0
(8.3
)
97 82 125
0.9
0.8
0.9
0–4.
5(0
.5)
0–3.
0(0
.6)
0–4.
5(3
.1)
199
179
222
1.9
2.2
1.6
GBa
rksi
dePi
thsi
de
30.3
36.2
24.5
2.0–
81.0
(7.7
)2.
0–81
.0(1
4.9)
4.5–
5.3
(5.3
)
80 92 48
19.8
20.0
19.5
0–50
.2(5
.5)
0–48
.0(8
.4)
5.4–
50.2
(8.1
)
88 95 93
16.1
22.6
9.7
1.0–
81.0
(7.4
)1.
0–81
.0(1
4.8)
4.5–
19.9
(2.8
)
144
144
65
4.1
4.4
3.8
Ave
rage
perm
etho
d11
.545
.213
.94.
0
*SE
stan
dard
erro
r.
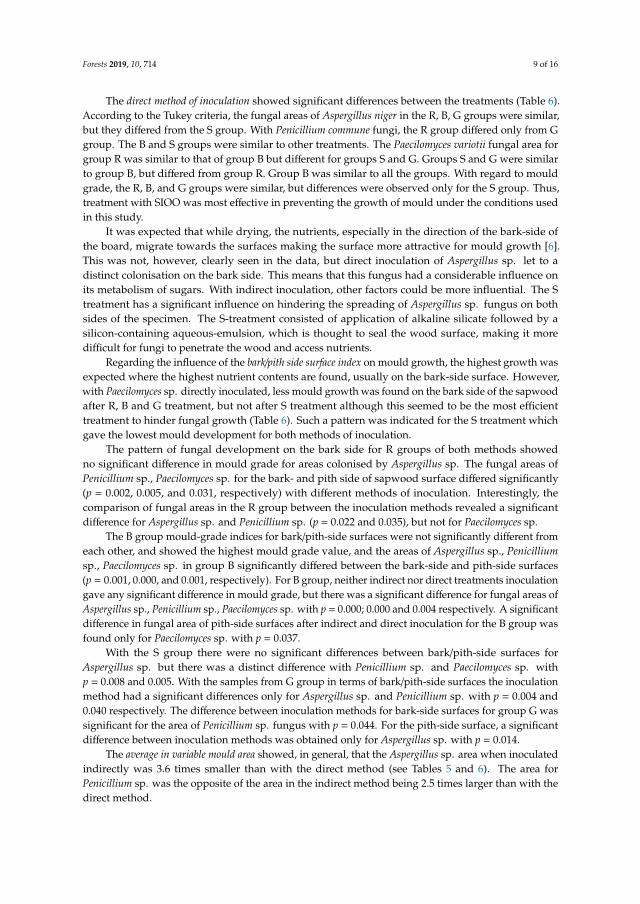
Forests 2019, 10, 714 9 of 16
The direct method of inoculation showed significant differences between the treatments (Table 6).According to the Tukey criteria, the fungal areas of Aspergillus niger in the R, B, G groups were similar,but they differed from the S group. With Penicillium commune fungi, the R group differed only from Ggroup. The B and S groups were similar to other treatments. The Paecilomyces variotii fungal area forgroup R was similar to that of group B but different for groups S and G. Groups S and G were similarto group B, but differed from group R. Group B was similar to all the groups. With regard to mouldgrade, the R, B, and G groups were similar, but differences were observed only for the S group. Thus,treatment with SIOO was most effective in preventing the growth of mould under the conditions usedin this study.
It was expected that while drying, the nutrients, especially in the direction of the bark-side ofthe board, migrate towards the surfaces making the surface more attractive for mould growth [6].This was not, however, clearly seen in the data, but direct inoculation of Aspergillus sp. let to adistinct colonisation on the bark side. This means that this fungus had a considerable influence onits metabolism of sugars. With indirect inoculation, other factors could be more influential. The Streatment has a significant influence on hindering the spreading of Aspergillus sp. fungus on bothsides of the specimen. The S-treatment consisted of application of alkaline silicate followed by asilicon-containing aqueous-emulsion, which is thought to seal the wood surface, making it moredifficult for fungi to penetrate the wood and access nutrients.
Regarding the influence of the bark/pith side surface index on mould growth, the highest growth wasexpected where the highest nutrient contents are found, usually on the bark-side surface. However,with Paecilomyces sp. directly inoculated, less mould growth was found on the bark side of the sapwoodafter R, B and G treatment, but not after S treatment although this seemed to be the most efficienttreatment to hinder fungal growth (Table 6). Such a pattern was indicated for the S treatment whichgave the lowest mould development for both methods of inoculation.
The pattern of fungal development on the bark side for R groups of both methods showedno significant difference in mould grade for areas colonised by Aspergillus sp. The fungal areas ofPenicillium sp., Paecilomyces sp. for the bark- and pith side of sapwood surface differed significantly(p = 0.002, 0.005, and 0.031, respectively) with different methods of inoculation. Interestingly, thecomparison of fungal areas in the R group between the inoculation methods revealed a significantdifference for Aspergillus sp. and Penicillium sp. (p = 0.022 and 0.035), but not for Paecilomyces sp.
The B group mould-grade indices for bark/pith-side surfaces were not significantly different fromeach other, and showed the highest mould grade value, and the areas of Aspergillus sp., Penicilliumsp., Paecilomyces sp. in group B significantly differed between the bark-side and pith-side surfaces(p = 0.001, 0.000, and 0.001, respectively). For B group, neither indirect nor direct treatments inoculationgave any significant difference in mould grade, but there was a significant difference for fungal areas ofAspergillus sp., Penicillium sp., Paecilomyces sp. with p = 0.000; 0.000 and 0.004 respectively. A significantdifference in fungal area of pith-side surfaces after indirect and direct inoculation for the B group wasfound only for Paecilomyces sp. with p = 0.037.
With the S group there were no significant differences between bark/pith-side surfaces forAspergillus sp. but there was a distinct difference with Penicillium sp. and Paecilomyces sp. withp = 0.008 and 0.005. With the samples from G group in terms of bark/pith-side surfaces the inoculationmethod had a significant differences only for Aspergillus sp. and Penicillium sp. with p = 0.004 and0.040 respectively. The difference between inoculation methods for bark-side surfaces for group G wassignificant for the area of Penicillium sp. fungus with p = 0.044. For the pith-side surface, a significantdifference between inoculation methods was obtained only for Aspergillus sp. with p = 0.014.
The average in variable mould area showed, in general, that the Aspergillus sp. area when inoculatedindirectly was 3.6 times smaller than with the direct method (see Tables 5 and 6). The area forPenicillium sp. was the opposite of the area in the indirect method being 2.5 times larger than with thedirect method.
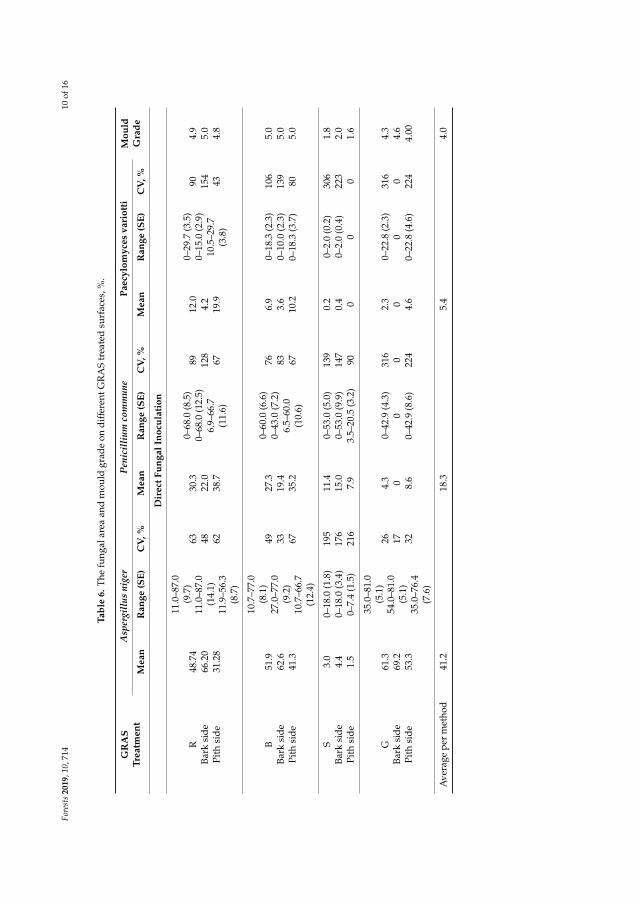
Fore
sts
2019
,10,
714
10of
16
Tabl
e6.
The
fung
alar
eaan
dm
ould
grad
eon
diff
eren
tGR
AS
trea
ted
surf
aces
,%.
GR
AS
Trea
tmen
tA
sper
gill
usni
ger
Pen
icil
lium
com
mun
ePa
ecyl
omyc
esva
riot
tiM
ould
Gra
deM
ean
Ran
ge(S
E)C
V,%
Mea
nR
ange
(SE)
CV
,%M
ean
Ran
ge(S
E)C
V,%
Dir
ectF
unga
lIno
cula
tion
RBa
rksi
dePi
thsi
de
48.7
466
.20
31.2
8
11.0
–87.
0(9
.7)
11.0
–87.
0(1
4.1)
11.9
–56.
3(8
.7)
63 48 62
30.3
22.0
38.7
0–68
.0(8
.5)
0–68
.0(1
2.5)
6.9–
66.7
(11.
6)
89 128
67
12.0
4.2
19.9
0–29
.7(3
.5)
0–15
.0(2
.9)
10.5
–29.
7(3
.8)
90 154
43
4.9
5.0
4.8
BBa
rksi
dePi
thsi
de
51.9
62.6
41.3
10.7
–77.
0(8
.1)
27.0
–77.
0(9
.2)
10.7
–66.
7(1
2.4)
49 33 67
27.3
19.4
35.2
0–60
.0(6
.6)
0–43
.0(7
.2)
6.5–
60.0
(10.
6)
76 83 67
6.9
3.6
10.2
0–18
.3(2
.3)
0–10
.0(2
.3)
0–18
.3(3
.7)
106
139
80
5.0
5.0
5.0
SBa
rksi
dePi
thsi
de
3.0
4.4
1.5
0–18
.0(1
.8)
0–18
.0(3
.4)
0–7.
4(1
.5)
195
176
216
11.4
15.0
7.9
0–53
.0(5
.0)
0–53
.0(9
.9)
3.5–
20.5
(3.2
)
139
147
90
0.2
0.4 0
0–2.
0(0
.2)
0–2.
0(0
.4)
0
306
223 0
1.8
2.0
1.6
GBa
rksi
dePi
thsi
de
61.3
69.2
53.3
35.0
–81.
0(5
.1)
54.0
–81.
0(5
.1)
35.0
–76.
4(7
.6)
26 17 32
4.3 0 8.6
0–42
.9(4
.3)
00–
42.9
(8.6
)
316 0 224
2.3 0 4.6
0–22
.8(2
.3)
00–
22.8
(4.6
)
316 0 224
4.3
4.6
4.00
Ave
rage
per
met
hod
41.2
18.3
5.4
4.0
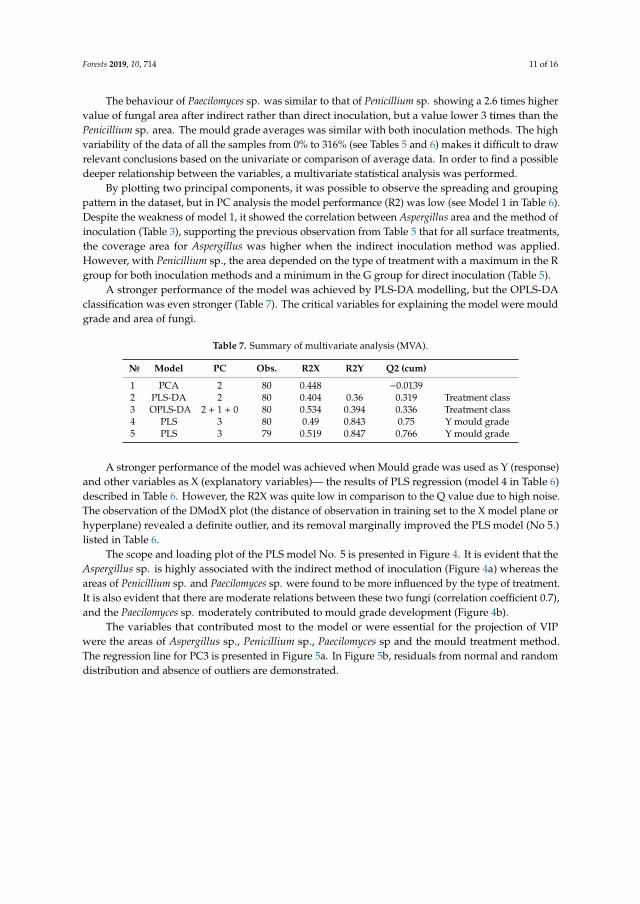
Forests 2019, 10, 714 11 of 16
The behaviour of Paecilomyces sp. was similar to that of Penicillium sp. showing a 2.6 times highervalue of fungal area after indirect rather than direct inoculation, but a value lower 3 times than thePenicillium sp. area. The mould grade averages was similar with both inoculation methods. The highvariability of the data of all the samples from 0% to 316% (see Tables 5 and 6) makes it difficult to drawrelevant conclusions based on the univariate or comparison of average data. In order to find a possibledeeper relationship between the variables, a multivariate statistical analysis was performed.
By plotting two principal components, it was possible to observe the spreading and groupingpattern in the dataset, but in PC analysis the model performance (R2) was low (see Model 1 in Table 6).Despite the weakness of model 1, it showed the correlation between Aspergillus area and the method ofinoculation (Table 3), supporting the previous observation from Table 5 that for all surface treatments,the coverage area for Aspergillus was higher when the indirect inoculation method was applied.However, with Penicillium sp., the area depended on the type of treatment with a maximum in the Rgroup for both inoculation methods and a minimum in the G group for direct inoculation (Table 5).
A stronger performance of the model was achieved by PLS-DA modelling, but the OPLS-DAclassification was even stronger (Table 7). The critical variables for explaining the model were mouldgrade and area of fungi.
Table 7. Summary of multivariate analysis (MVA).
№ Model PC Obs. R2X R2Y Q2 (cum)
1 PCA 2 80 0.448 −0.01392 PLS-DA 2 80 0.404 0.36 0.319 Treatment class3 OPLS-DA 2 + 1 + 0 80 0.534 0.394 0.336 Treatment class4 PLS 3 80 0.49 0.843 0.75 Y mould grade5 PLS 3 79 0.519 0.847 0.766 Y mould grade
A stronger performance of the model was achieved when Mould grade was used as Y (response)and other variables as X (explanatory variables)— the results of PLS regression (model 4 in Table 6)described in Table 6. However, the R2X was quite low in comparison to the Q value due to high noise.The observation of the DModX plot (the distance of observation in training set to the X model plane orhyperplane) revealed a definite outlier, and its removal marginally improved the PLS model (No 5.)listed in Table 6.
The scope and loading plot of the PLS model No. 5 is presented in Figure 4. It is evident that theAspergillus sp. is highly associated with the indirect method of inoculation (Figure 4a) whereas theareas of Penicillium sp. and Paecilomyces sp. were found to be more influenced by the type of treatment.It is also evident that there are moderate relations between these two fungi (correlation coefficient 0.7),and the Paecilomyces sp. moderately contributed to mould grade development (Figure 4b).
The variables that contributed most to the model or were essential for the projection of VIPwere the areas of Aspergillus sp., Penicillium sp., Paecilomyces sp and the mould treatment method.The regression line for PC3 is presented in Figure 5a. In Figure 5b, residuals from normal and randomdistribution and absence of outliers are demonstrated.
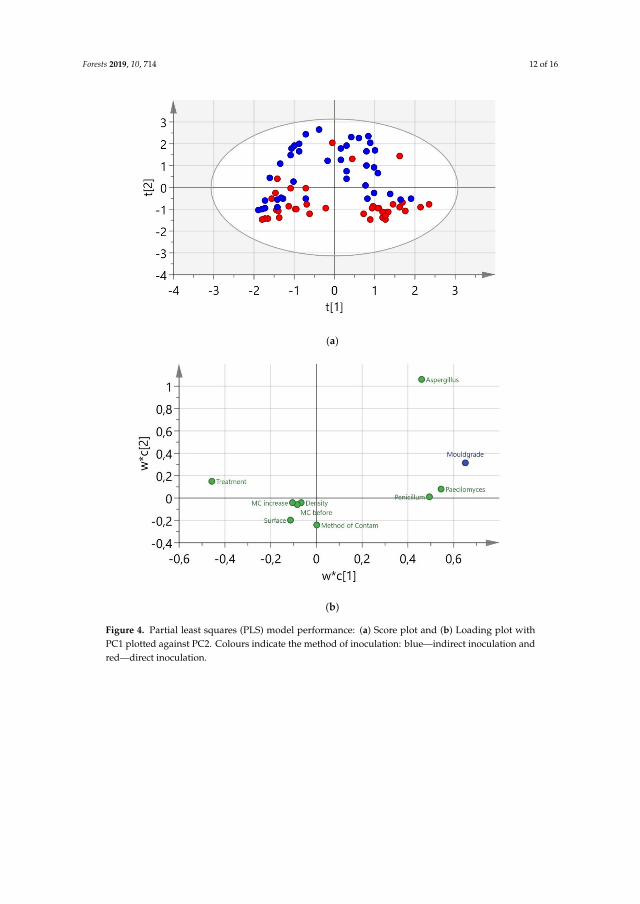
Forests 2019, 10, 714 12 of 16
The scope and loading plot of the PLS model No. 5 is presented in Figure 4. It is evident that the Aspergillus sp. is highly associated with the indirect method of inoculation (Figure 4a) whereas the areas of Penicillium sp. and Paecilomyces sp. were found to be more influenced by the type of treatment. It is also evident that there are moderate relations between these two fungi (correlation coefficient 0.7), and the Paecilomyces sp. moderately contributed to mould grade development (Figure 4b).
(a)
(b)
Figure 4. Partial least squares (PLS) model performance: (a) Score plot and (b) Loading plot withPC1 plotted against PC2. Colours indicate the method of inoculation: blue—indirect inoculation andred—direct inoculation.
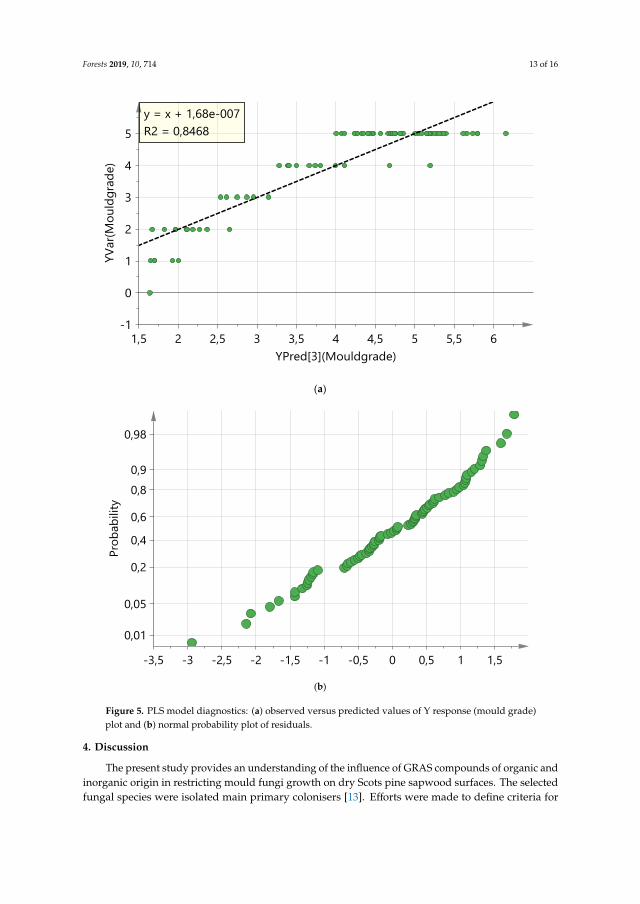
Forests 2019, 10, 714 13 of 16
direct inoculation.
The variables that contributed most to the model or were essential for the projection of VIP were
the areas of Aspergillus sp., Penicillium sp., Paecilomyces sp and the mould treatment method. The
regression line for PC3 is presented in Figure 5a. In Figure 5b, residuals from normal and random
distribution and absence of outliers are demonstrated.
(a)
(b)
Figure 5. PLS model diagnostics: (a) observed versus predicted values of Y response (mould grade)
plot and (b) normal probability plot of residuals. Figure 5. PLS model diagnostics: (a) observed versus predicted values of Y response (mould grade)plot and (b) normal probability plot of residuals.
4. Discussion
The present study provides an understanding of the influence of GRAS compounds of organic andinorganic origin in restricting mould fungi growth on dry Scots pine sapwood surfaces. The selectedfungal species were isolated main primary colonisers [13]. Efforts were made to define criteria for
Forests 2019, 10, 714 14 of 16
multivariate modelling and the prediction of mould growth for various GRAS treatments under theinfluence of different inoculation methods.
Between selected GRAS treatments, the most effective treatment was treatment S (potassiumsilicate) which gave the greatest reduction in fungal growth in the direct method of inoculationwith the lowest mould grade. The known fact that potassium silicate has a fungicidal effect viareinforcement of the wood surface and acts as a physical barrier for the fungi improves the propertiesof the material [21–23]. The efficiency of bacterial treatment was lowest and rather stimulated fungalgrowth. This effect is surprising because the biocidal role of Bacillus sp. has been reported in woodprotection [24]. The biocidal action of quaternary ammonium compounds (group G) was found to besmall and seemed not to be useful for mould control. The non-treated reference boards showed highmould grade, but it was lower in the direct method of inoculation than with indirect inoculation due tolow fungal growth on the inner pith surface with a variation of 43%–67%. In general, the growth offungi on inner pith surfaces was lower than on the bark side surface of the samples. This was expectedbecause of the presence of extensive nutrients close to the cambium/bark. In this study, boards weresingle stacked during drying and the movement of nutrients occurred in all directions. Such a nutrientenrichment of the sapwood side influenced fungal growth even after subsequent preservative surfacetreatment [8,9,12]. Noticeable was the great variation in the data within the test results particularlywhen direct inoculation was applied (from 0% to over 300%). The equilibrium moisture content(EMC) for the reference wood sample was calculated to be ca 24.4% in our test conditions according totables [25]. At the end of the test, the MC of all samples was higher than that EMC value but the finalMC was found to have a negligible influence on fungal growth probably because the high moistureconditions are favourable for mould growth.
The method of inoculation influenced the development of Aspergillus sp. growth, the developmentof the fungal area was quite significant in the direct method of inoculation. It agrees with our previousstudy [12], and the necessity of a water reservoir for single dry spores’ germination of Aspergillus sp.was proposed [13]. The Penicillium sp. growth was more related to the type of treatment and was moreintense with the indirect method of inoculation. It is reasonable since the growth of Penicillium sp.and Paecylomyces sp. were related in our study, and previous studies have shown that, for example,Penicillium sp. spores and probably Paecylomyces sp. do not require large amounts of water forgermination and no influence on the growth of the method of inoculation was found [26]. The areasof all fungi in our study influenced the mould grade in the multivariate model the Paecylomyces sp.having most significant influence on the model performance. The three-component PLS model showedquite a strong performance and can predict about 77% of data variation (Q2 = 0.766).
5. Conclusions
This study contributes to the transition to sustainable wood materials by applying GRAScompounds that can control and prevent contamination by primary colonising mould fungi. Substancesbased on potassium silicate could be excellent sustainable substances for wood treatment. By combiningwood surface treatments with the response to a fungal attack, a PLS model makes it possible to predictthe contamination rate of wood. The model may be beneficial in the use of smart sorting systemsequipped with high-speed digital cameras in industrial use. It shows the ability to model such acomplicated phenomenon that standard tests do not provide. However, the measurements basedon chemical characterisation should be the next step to take in order to significantly enhance modelproperties and increase the range of robust applications.
Supplementary Materials: The following are available online at http://www.mdpi.com/1999-4907/10/9/714/s1:Table S1: Data set used for data analysis in the article; Table S2: The p-value for the significance of moisture contentchanges after test difference between treatments in the indirect and direct method of inoculation, significantdifference p < 0.05; Table S3: The p-value for the significance of difference between treatments in both methods,significant difference p < 0.05.
Forests 2019, 10, 714 15 of 16
Author Contributions: Conceptualization, O.M., F.P., M.S.-P., and O.K.; methodology, O.M., M.S.-P., and O.K.;software, D.S.; validation, O.M., F.P., M.S.-P., and O.K., T.V., D.S., H.J.; formal analysis, O.M., F.P.; investigation,O.M., F.P.; resources, T.V., D.S., H.J.; data curation, O.M., F.P., M.S.-P., and O.K.; writing—original draft preparation,O.M., F.P.; writing—review and editing, O.M., F.P., M.S.-P., and O.K., T.V., D.S., H.J.; visualization, O.M..;supervision, M.S.-P., O.K.; project administration, M.S.-P., O.K.; funding acquisition, D.S., O.K.
Funding: This research was funded by the FORMAS (Swedish Research Council for the Environment AgriculturalSciences and Spatial Planning) (FORMAS), project number 419, 2017 and 942-2016-64, 2016.
Acknowledgments: Support from Martinsons Såg AB sawmill, The European Regional Development Fund, theCounty Administration of Västerbotten, the municipality of Skellefteå, and WoodCentreNorth is much appreciatedand acknowledged. Also, the authors express appreciation for the support of COST Action FP1407. The EuropeanCommission is gratefully acknowledged for funding the InnoRenew CoE project (#Grant Agreement 739574)under the Horizon2020 Widespread-Teaming program.
Conflicts of Interest: The authors declare no conflict of interest.
References
1. European Union. European Parliament and of the Council Directive 2004/42/CE on the Limitation of Emissionsof Volatile Organic Compounds Due to the Use of Organic Solvents in Certain Paints and Varnishes and VehicleRefinishing Products and Amending Directive 1999/13/EC; European Union: Brussels, Belgium, 2004.
2. European Union. ECHA Directive 98/8/EC Concerning the Placing of Biocidal Products on the Market; EuropeanUnion: Brussels, Belgium, 2011.
3. Dijck, P.V.; Brown, N.A.; Goldman, G.H.; Rutherford, J.; Xue, C.; Zeebroeck, G.V. Nutrient Sensing at thePlasma Membrane of Fungal Cells. Microbiol. Spectr. 2017, 5. [CrossRef]
4. Evans, P.D. Weathering of Wood and Wood Composites. In Handbook of Wood Chemistry and Wood Composites;Rowell, R.M., Ed.; Taylor & Francis Group: Abingdon, UK, 2013.
5. Kujanpää, L.; Reiman, M.; Kujanpää, R.; Halonen, R.; Kokotti, H. The Influence of Outdoor Air Micro Floraand Season on the Indoor Surfaces of a Building. In Proceedings of the International Society of Indoor AirQuality and Climate, Beijing, China, 4–9 September 2005; pp. 1772–1776.
6. Bennett, J.W.; Klich, M. Mycotoxins. Clin. Microbiol. Rev. 2003, 16, 497–516. [CrossRef] [PubMed]7. Wallin, S.; Gambacorta, L.; Kotova, N.; Lemming, E.W.; Nälsén, C.; Solfrizzo, M.; Olsen, M. Biomonitoring of
concurrent mycotoxin exposure among adults in Sweden through urinary multi-biomarker analysis. FoodChem. Toxicol. 2015, 83, 133–139. [CrossRef] [PubMed]
8. Terziev, N. Migration of Low-Molecular Sugars and Nitrogenous Compounds in Pinus sylvestris L. DuringKiln and Air Drying. Holzforsch. Int. J. Biol. Chem. Phys. Technol. Wood 2009, 49, 565–574.
9. Myronycheva, O.; Karlsson, O.; Sehlstedt-Persson, M.; Öhman, M.; Sandberg, D. Distribution of low-molecularlipophilic extractives beneath the surface of air- and kiln-dried Scots pine sapwood boards. PLoS ONE 2018,13, e0204212. [CrossRef] [PubMed]
10. Karlsson, O.; Myronycheva, O.; Sehlstedt-Persson, M.; Öhman, M.; Sandberg, D. Multivariate modeling ofmould growth in relation to extractives in dried Scots pine sapwood. In Proceedings of the 48th Conferenceof the International Research Group on Wood Protection, IRG48, Ghent, Belgium, 4–8 June 2017.
11. Guillén, Y.; Navias, D.; Machuca, Á. Tolerance to wood preservatives by copper-tolerant wood-rot funginative to south-central Chile. Biodegradation 2009, 20, 135. [CrossRef] [PubMed]
12. Myronycheva, O.; Sehlstedt-Persson, M.; Karlsson, O.; Sandberg, D. Growth of Mold and Rot Fungi onCopper-impregnated Scots Pine Sapwood: Influence of Planing Depth and Inoculation Pattern. BioResources2018, 13, 8787–8801. [CrossRef]
13. Adnan, O.C.G.; Samson, R.A. Fundamentals of Mold Growth in Indoor Environments and Strategies for HealthyLiving; Wageningen Academic Publishers: Wageningen, The Netherlands, 2011; ISBN 978-90-8686-135-4.
14. U.S. Food and Drug Administration Generally Recognized as Safe (GRAS). Available online: https://www.fda.gov/Food/IngredientsPackagingLabeling/GRAS/ (accessed on 16 January 2019).
15. U.S. Food and Drug Administration GRAS Substances (SCOGS) Database. Available online: https://www.fda.gov/food/ingredientspackaginglabeling/gras/scogs/default.htm (accessed on 17 January 2019).
16. Romanazzi, G.; Lichter, A.; Gabler, F.M.; Smilanick, J.L. Recent advances on the use of natural and safealternatives to conventional methods to control postharvest gray mold of table grapes. Postharvest Biol.Technol. 2012, 63, 141–147. [CrossRef]
Forests 2019, 10, 714 16 of 16
17. CEN-European Committee for Standardization. EN 13183-1 Moisture Content of a Piece of Sawn Timber-Part 1:Determination by Oven Dry Method 2004; CEN-European Committee for Standardization: Brussels, Belgium,2004.
18. CEN-European Committee for Standardization. EN 16492:2014 Paints and Varnishes-Evaluation of the SurfaceDisfigurement Caused by Fungi and Algae on Coatings; CEN-European Committee for Standardization: Brussels,Belgium, 2014.
19. Schindelin, J.; Arganda-Carreras, I.; Frise, E.; Kaynig, V.; Longair, M.; Pietzsch, T.; Preibisch, S.; Rueden, C.;Saalfeld, S.; Schmid, B.; et al. Fiji: An open-source platform for biological-image analysis. Nat. Methods 2012,9, 676–682. [CrossRef] [PubMed]
20. Tukey, J.W. Comparing Individual Means in the Analysis of Variance. Biometrics 1949, 5, 99–114. [CrossRef][PubMed]
21. Rodrigues, F.A.; Datnoff, L.E. Silicon and Plant Diseases; Springer International Publishing: Basel, Switzerland,2015; ISBN 978-3-319-22929-4.
22. Okon, K.E.; Lin, F.; Chen, Y.; Huang, B. Effect of silicone oil heat treatment on the chemical composition,cellulose crystalline structure and contact angle of Chinese parasol wood. Carbohydr. Polym. 2017, 164,179–185. [CrossRef] [PubMed]
23. Lahtela, V.; Kärki, T. Effects of impregnation and heat treatment on the physical and mechanical propertiesof Scots pine (Pinus sylvestris) wood. Wood Mater. Sci. Eng. 2016, 11, 217–227. [CrossRef]
24. Kreber, B.; Morrell, J.J. Ability of Selected Bacterial and Fungal Bioprotectants to Limit Fungal Stain inPonderosa Pine Sapwood. Wood Fiber Sci. 2007, 25, 23–34.
25. Esping, B. Trätorkning: Grunder i Torkning; Trätek: Stockholm, Sweden, 1992; ISBN 978-91-88170-06-4.26. Nguyen Van Long, N.; Rigalma, K.; Coroller, L.; Dadure, R.; Debaets, S.; Mounier, J.; Vasseur, V. Modelling
the effect of water activity reduction by sodium chloride or glycerol on conidial germination and radialgrowth of filamentous fungi encountered in dairy foods. Food Microbiol. 2017, 68, 7–15. [CrossRef] [PubMed]
© 2019 by the authors. Licensee MDPI, Basel, Switzerland. This article is an open accessarticle distributed under the terms and conditions of the Creative Commons Attribution(CC BY) license (http://creativecommons.org/licenses/by/4.0/).

Paper IX

2020
InnoRenew CoE International Conference2020
Integrating sustainability and health in buildings through renewable materials
InnoRenew CoE Livade 6, 6310 Izola, Slovenia
IRIC2020 Scientific CommitteeAndreja KutnarAnna SandakDavid DeVallanceIztok ŠušteršičJakub SandakMichael BurnardMiklós Krész
innorenew.eu
InnoRenew CoE is funded by the European Commission under Horizon 2020, the EU Framework Programme for Research and
Innovation (H2020 WIDESPREAD-2-Teaming #739574), and by investment funding from the Republic of Slovenia and the
European Regional Development Fund.
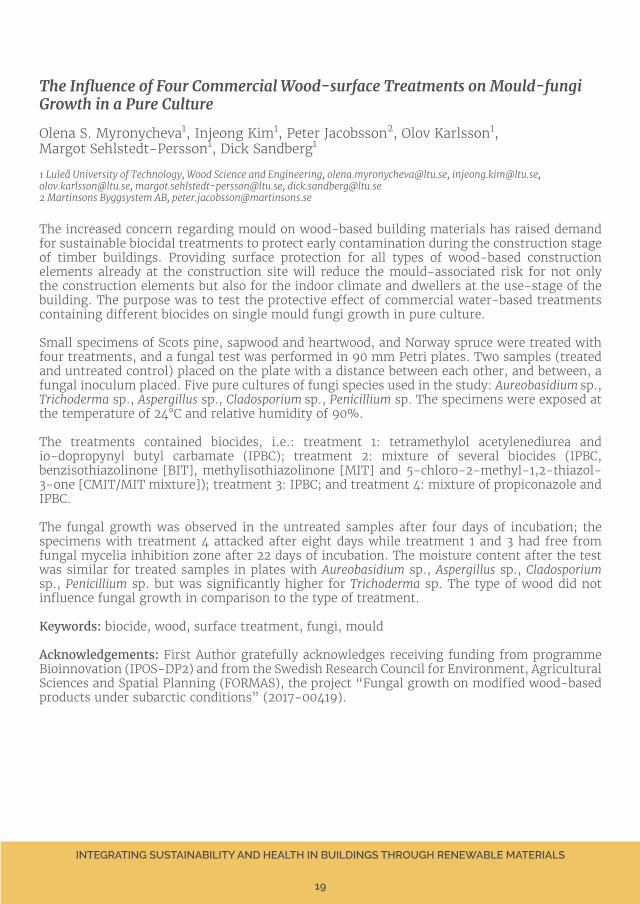
INTEGRATING SUSTAINABILITY AND HEALTH IN BUILDINGS THROUGH RENEWABLE MATERIALS
19
The increased concern regarding mould on wood-based building materials has raised demand for sustainable biocidal treatments to protect early contamination during the construction stage of timber buildings. Providing surface protection for all types of wood-based construction elements already at the construction site will reduce the mould-associated risk for not only the construction elements but also for the indoor climate and dwellers at the use-stage of the building. The purpose was to test the protective effect of commercial water-based treatments containing different biocides on single mould fungi growth in pure culture.
Small specimens of Scots pine, sapwood and heartwood, and Norway spruce were treated with four treatments, and a fungal test was performed in 90 mm Petri plates. Two samples (treated and untreated control) placed on the plate with a distance between each other, and between, a fungal inoculum placed. Five pure cultures of fungi species used in the study: Aureobasidium sp., Trichoderma sp., Aspergillus sp., Cladosporium sp., Penicillium sp. The specimens were exposed at the temperature of 24°C and relative humidity of 90%.
The treatments contained biocides, i.e.: treatment 1: tetramethylol acetylenediurea and io-dopropynyl butyl carbamate (IPBC); treatment 2: mixture of several biocides (IPBC, benzisothiazolinone [BIT], methylisothiazolinone [MIT] and 5-chloro-2-methyl-1,2-thiazol-3-one [CMIT/MIT mixture]); treatment 3: IPBC; and treatment 4: mixture of propiconazole and IPBC.
The fungal growth was observed in the untreated samples after four days of incubation; the specimens with treatment 4 attacked after eight days while treatment 1 and 3 had free from fungal mycelia inhibition zone after 22 days of incubation. The moisture content after the test was similar for treated samples in plates with Aureobasidium sp., Aspergillus sp., Cladosporium sp., Penicillium sp. but was significantly higher for Trichoderma sp. The type of wood did not influence fungal growth in comparison to the type of treatment.
Keywords: biocide, wood, surface treatment, fungi, mould
Acknowledgements: First Author gratefully acknowledges receiving funding from programme Bioinnovation (IPOS-DP2) and from the Swedish Research Council for Environment, Agricultural Sciences and Spatial Planning (FORMAS), the project “Fungal growth on modified wood-based products under subarctic conditions” (2017-00419).
The Influence of Four Commercial Wood-surface Treatments on Mould-fungi Growth in a Pure Culture
Olena S. Myronycheva1, Injeong Kim1, Peter Jacobsson2, Olov Karlsson1, Margot Sehlstedt-Persson1, Dick Sandberg1
1 Luleå University of Technology, Wood Science and Engineering, [email protected], [email protected], [email protected], [email protected], [email protected] Martinsons Byggsystem AB, [email protected]

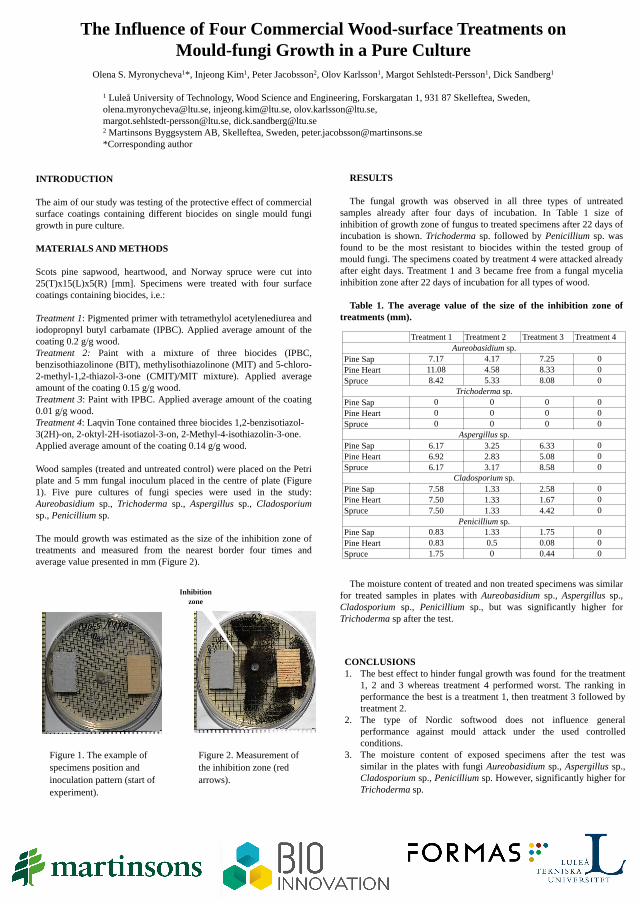
The Influence of Four Commercial Wood-surface Treatments on
Mould-fungi Growth in a Pure Culture
Olena S. Myronycheva1*, Injeong Kim1, Peter Jacobsson2, Olov Karlsson1, Margot Sehlstedt-Persson1, Dick Sandberg1
1 Luleå University of Technology, Wood Science and Engineering, Forskargatan 1, 931 87 Skelleftea, Sweden,
[email protected], [email protected], [email protected],
[email protected], [email protected] Martinsons Byggsystem AB, Skelleftea, Sweden, [email protected]
*Corresponding author
INTRODUCTION
The aim of our study was testing of the protective effect of commercial
surface coatings containing different biocides on single mould fungi
growth in pure culture.
MATERIALS AND METHODS
Scots pine sapwood, heartwood, and Norway spruce were cut into
25(T)x15(L)x5(R) [mm]. Specimens were treated with four surface
coatings containing biocides, i.e.:
Treatment 1: Pigmented primer with tetramethylol acetylenediurea and
iodopropnyl butyl carbamate (IPBC). Applied average amount of the
coating 0.2 g/g wood.
Treatment 2: Paint with a mixture of three biocides (IPBC,
benzisothiazolinone (BIT), methylisothiazolinone (MIT) and 5-chloro-
2-methyl-1,2-thiazol-3-one (CMIT)/MIT mixture). Applied average
amount of the coating 0.15 g/g wood.
Treatment 3: Paint with IPBC. Applied average amount of the coating
0.01 g/g wood.
Treatment 4: Laqvin Tone contained three biocides 1,2-benzisotiazol-
3(2H)-on, 2-oktyl-2H-isotiazol-3-on, 2-Methyl-4-isothiazolin-3-one.
Applied average amount of the coating 0.14 g/g wood.
Wood samples (treated and untreated control) were placed on the Petri
plate and 5 mm fungal inoculum placed in the centre of plate (Figure
1). Five pure cultures of fungi species were used in the study:
Aureobasidium sp., Trichoderma sp., Aspergillus sp., Cladosporium
sp., Penicillium sp.
The mould growth was estimated as the size of the inhibition zone of
treatments and measured from the nearest border four times and
average value presented in mm (Figure 2).
Inhibition
zone
Figure 1. The example of
specimens position and
inoculation pattern (start of
experiment).
Figure 2. Measurement of
the inhibition zone (red
arrows).
RESULTS
The fungal growth was observed in all three types of untreated
samples already after four days of incubation. In Table 1 size of
inhibition of growth zone of fungus to treated specimens after 22 days of
incubation is shown. Trichoderma sp. followed by Penicillium sp. was
found to be the most resistant to biocides within the tested group of
mould fungi. The specimens coated by treatment 4 were attacked already
after eight days. Treatment 1 and 3 became free from a fungal mycelia
inhibition zone after 22 days of incubation for all types of wood.
Table 1. The average value of the size of the inhibition zone of
treatments (mm).
The moisture content of treated and non treated specimens was similar
for treated samples in plates with Aureobasidium sp., Aspergillus sp.,
Cladosporium sp., Penicillium sp., but was significantly higher for
Trichoderma sp after the test.
Treatment 1 Treatment 2 Treatment 3 Treatment 4
Aureobasidium sp.
Pine Sap 7.17 4.17 7.25 0
Pine Heart 11.08 4.58 8.33 0
Spruce 8.42 5.33 8.08 0
Trichoderma sp.
Pine Sap 0 0 0 0
Pine Heart 0 0 0 0
Spruce 0 0 0 0
Aspergillus sp.
Pine Sap 6.17 3.25 6.33 0
Pine Heart 6.92 2.83 5.08 0
Spruce 6.17 3.17 8.58 0
Cladosporium sp.
Pine Sap 7.58 1.33 2.58 0
Pine Heart 7.50 1.33 1.67 0
Spruce 7.50 1.33 4.42 0
Penicillium sp.
Pine Sap 0.83 1.33 1.75 0
Pine Heart 0.83 0.5 0.08 0
Spruce 1.75 0 0.44 0
CONCLUSIONS
1. The best effect to hinder fungal growth was found for the treatment
1, 2 and 3 whereas treatment 4 performed worst. The ranking in
performance the best is a treatment 1, then treatment 3 followed by
treatment 2.
2. The type of Nordic softwood does not influence general
performance against mould attack under the used controlled
conditions.
3. The moisture content of exposed specimens after the test was
similar in the plates with fungi Aureobasidium sp., Aspergillus sp.,
Cladosporium sp., Penicillium sp. However, significantly higher for
Trichoderma sp.


Paper X

Research ArticleHyperspectral Imaging Surface Analysis for Dried andThermally Modified Wood: An Exploratory Study
Olena Myronycheva , Ekaterina Sidorova, Olle Hagman, Margot Sehlstedt-Persson,Olov Karlsson , and Dick Sandberg
Lulea University of Technology, Wood Science and Engineering, Forskargatan 1, 931 87 Skelleftea, Sweden
Correspondence should be addressed to Olena Myronycheva; [email protected]
Received 25 May 2018; Revised 13 August 2018; Accepted 16 October 2018; Published 14 November 2018
Guest Editor: Ingunn Burud
Copyright © 2018 Olena Myronycheva et al. )is is an open access article distributed under the Creative Commons AttributionLicense, which permits unrestricted use, distribution, and reproduction in any medium, provided the original work isproperly cited.
Naturally seasoned, kiln-dried, and thermally modified wood has been studied by hyperspectral near-infrared imaging between980 and 2500 nm in order to obtain spatial chemical information. Evince software was used to explore, preprocess, and analysespectral data from image pixels and link these data to chemical information via spectral wavelength assignment. A PCA modelshowed that regions with high absorbance were related to extractives with phenolic groups and aliphatic hydrocarbons. )e sharpwavelength band at 2135 nm was found by multivariate analysis to be useful for multivariate calibration. )is peak represents thelargest variation that characterizes the knot area and can be related to areas in wood rich in hydrocarbons and phenol, and it canperhaps be used for future calibration of other wood surfaces. )e discriminant analysis of thermally treated wood showed thestrongest differentiation between the planed and rip-cut wood surfaces and a fairly clear discrimination between the two thermalprocesses. )e wavelength band at 2100 nm showed the greatest difference and may correspond to stretching of C�O-O ofpolymeric acetyl groups, but this requires confirmation by chemical analysis.
1. Introduction
Increased automation in wood-manufacturing processeswould allow a more custom-oriented approach that en-courages companies in the wood industry to move fromtraditional quality grading with high-speed visual inspectioncamera systems (VIS) to more sophisticated systems for thegrading of sawn and further processed timber. )e VISmethods are in some cases not sufficiently precise and ef-ficient because of wood variability and wood-treatmentheterogeneity [1].
Near-infrared spectroscopy (NIR) is a well-knowntechnology for the nondestructive analysis of wood. )eadvantages of the NIR technology are speed and the ability tomeasure a broad range of the chemical and physicalproperties, which make the technology promising for in-dustrial use [2]. )e main challenge for developing an ef-fective predictive model based on NIR data and for itsfurther use in wood-manufacturing processes is, however, to
find the reliable absorption range of interest in a highlyheterogeneous material such as wood and to calibrate themodel for quantitative process parameters assessment [3].Portable NIR sensors use point-based measurements thathave to be developed experimentally, and they will not givea 2-dimensional spatial visualisation of the variation in NIRabsorptions from a surface.)is weakness can, at least partly,be reduced by using a more stationary technique likehyperspectral imaging for accurate data collection andmodel development and relating this information to othersources such as a portable NIR sensor.
Hyperspectral techniques can be used for the develop-ment of models that quantify the heterogenic chemicalcomposition of the wood surface. )e objective of thecurrent study was to use a hyperspectral imaging techniqueand follow the recommendations of Sandak et al. [4] to builda classification model for wood surfaces in the NIR spectralregion. Hyperspectral imaging provides spatially resolvedinformation of the wood surface in the NIR range, and
HindawiJournal of SpectroscopyVolume 2018, Article ID 7423501, 10 pageshttps://doi.org/10.1155/2018/7423501
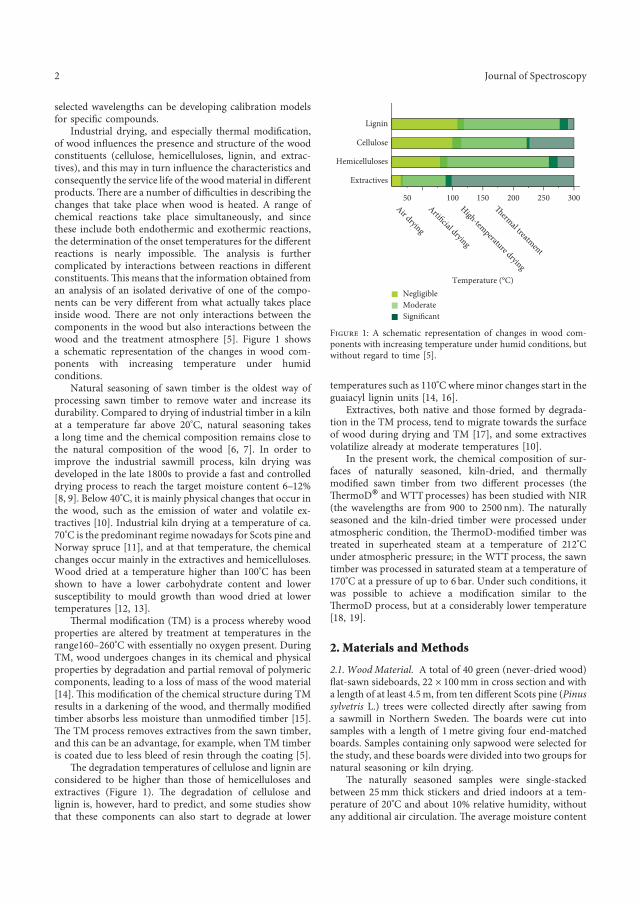
selected wavelengths can be developing calibration modelsfor specific compounds.
Industrial drying, and especially thermal modification,of wood influences the presence and structure of the woodconstituents (cellulose, hemicelluloses, lignin, and extrac-tives), and this may in turn influence the characteristics andconsequently the service life of the woodmaterial in differentproducts. )ere are a number of difficulties in describing thechanges that take place when wood is heated. A range ofchemical reactions take place simultaneously, and sincethese include both endothermic and exothermic reactions,the determination of the onset temperatures for the differentreactions is nearly impossible. )e analysis is furthercomplicated by interactions between reactions in differentconstituents.)is means that the information obtained froman analysis of an isolated derivative of one of the compo-nents can be very different from what actually takes placeinside wood. )ere are not only interactions between thecomponents in the wood but also interactions between thewood and the treatment atmosphere [5]. Figure 1 showsa schematic representation of the changes in wood com-ponents with increasing temperature under humidconditions.
Natural seasoning of sawn timber is the oldest way ofprocessing sawn timber to remove water and increase itsdurability. Compared to drying of industrial timber in a kilnat a temperature far above 20°C, natural seasoning takesa long time and the chemical composition remains close tothe natural composition of the wood [6, 7]. In order toimprove the industrial sawmill process, kiln drying wasdeveloped in the late 1800s to provide a fast and controlleddrying process to reach the target moisture content 6–12%[8, 9]. Below 40°C, it is mainly physical changes that occur inthe wood, such as the emission of water and volatile ex-tractives [10]. Industrial kiln drying at a temperature of ca.70°C is the predominant regime nowadays for Scots pine andNorway spruce [11], and at that temperature, the chemicalchanges occur mainly in the extractives and hemicelluloses.Wood dried at a temperature higher than 100°C has beenshown to have a lower carbohydrate content and lowersusceptibility to mould growth than wood dried at lowertemperatures [12, 13].
)ermal modification (TM) is a process whereby woodproperties are altered by treatment at temperatures in therange160–260°C with essentially no oxygen present. DuringTM, wood undergoes changes in its chemical and physicalproperties by degradation and partial removal of polymericcomponents, leading to a loss of mass of the wood material[14]. )is modification of the chemical structure during TMresults in a darkening of the wood, and thermally modifiedtimber absorbs less moisture than unmodified timber [15].)e TM process removes extractives from the sawn timber,and this can be an advantage, for example, when TM timberis coated due to less bleed of resin through the coating [5].
)e degradation temperatures of cellulose and lignin areconsidered to be higher than those of hemicelluloses andextractives (Figure 1). )e degradation of cellulose andlignin is, however, hard to predict, and some studies showthat these components can also start to degrade at lower
temperatures such as 110°C where minor changes start in theguaiacyl lignin units [14, 16].
Extractives, both native and those formed by degrada-tion in the TM process, tend to migrate towards the surfaceof wood during drying and TM [17], and some extractivesvolatilize already at moderate temperatures [10].
In the present work, the chemical composition of sur-faces of naturally seasoned, kiln-dried, and thermallymodified sawn timber from two different processes (the)ermoD® and WTTprocesses) has been studied with NIR(the wavelengths are from 900 to 2500 nm). )e naturallyseasoned and the kiln-dried timber were processed underatmospheric condition, the )ermoD-modified timber wastreated in superheated steam at a temperature of 212°Cunder atmospheric pressure; in the WTT process, the sawntimber was processed in saturated steam at a temperature of170°C at a pressure of up to 6 bar. Under such conditions, itwas possible to achieve a modification similar to the)ermoD process, but at a considerably lower temperature[18, 19].
2. Materials and Methods
2.1. WoodMaterial. A total of 40 green (never-dried wood)flat-sawn sideboards, 22 × 100mm in cross section and witha length of at least 4.5m, from ten different Scots pine (Pinussylvetris L.) trees were collected directly after sawing froma sawmill in Northern Sweden. )e boards were cut intosamples with a length of 1metre giving four end-matchedboards. Samples containing only sapwood were selected forthe study, and these boards were divided into two groups fornatural seasoning or kiln drying.
)e naturally seasoned samples were single-stackedbetween 25mm thick stickers and dried indoors at a tem-perature of 20°C and about 10% relative humidity, withoutany additional air circulation. )e average moisture content
Extractives
Hemicelluloses
Cellulose
Lignin
Air drying
Artificial drying
300100 200High-temperature drying
Thermal treatment
50 150 250
Temperature (°C)NegligibleModerateSignificant
Figure 1: A schematic representation of changes in wood com-ponents with increasing temperature under humid conditions, butwithout regard to time [5].
2 Journal of Spectroscopy
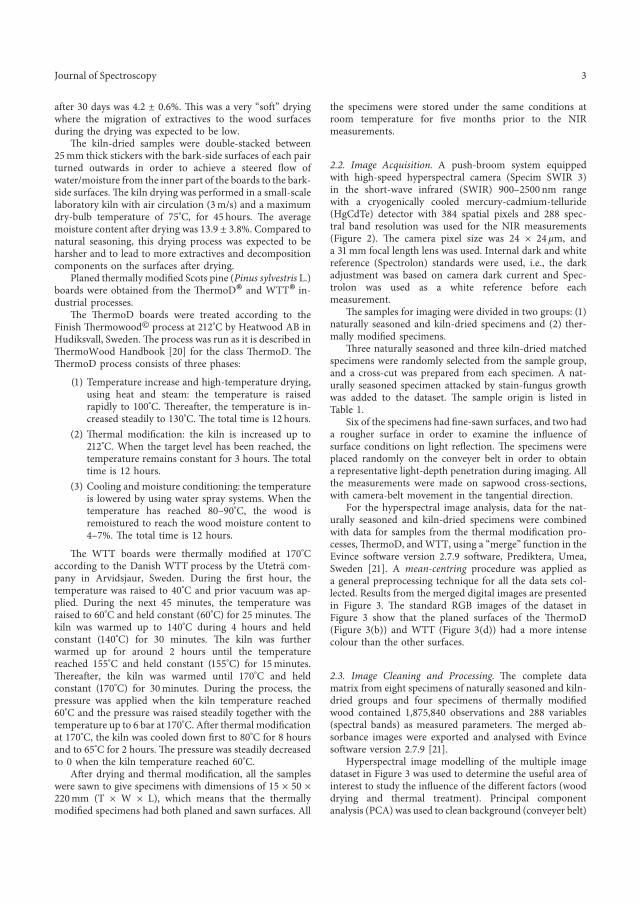
after 30 days was 4.2 ± 0.6%. )is was a very “soft” dryingwhere the migration of extractives to the wood surfacesduring the drying was expected to be low.
)e kiln-dried samples were double-stacked between25mm thick stickers with the bark-side surfaces of each pairturned outwards in order to achieve a steered flow ofwater/moisture from the inner part of the boards to the bark-side surfaces. )e kiln drying was performed in a small-scalelaboratory kiln with air circulation (3m/s) and a maximumdry-bulb temperature of 75°C, for 45 hours. )e averagemoisture content after drying was 13.9 ± 3.8%. Compared tonatural seasoning, this drying process was expected to beharsher and to lead to more extractives and decompositioncomponents on the surfaces after drying.
Planed thermally modified Scots pine (Pinus sylvestris L.)boards were obtained from the )ermoD® and WTT® in-dustrial processes.
)e )ermoD boards were treated according to theFinish )ermowood© process at 212°C by Heatwood AB inHudiksvall, Sweden.)e process was run as it is described in)ermoWood Handbook [20] for the class )ermoD. )e)ermoD process consists of three phases:
(1) Temperature increase and high-temperature drying,using heat and steam: the temperature is raisedrapidly to 100°C. )ereafter, the temperature is in-creased steadily to 130°C. )e total time is 12 hours.
(2) )ermal modification: the kiln is increased up to212°C. When the target level has been reached, thetemperature remains constant for 3 hours. )e totaltime is 12 hours.
(3) Cooling and moisture conditioning: the temperatureis lowered by using water spray systems. When thetemperature has reached 80–90°C, the wood isremoistured to reach the wood moisture content to4–7%. )e total time is 12 hours.
)e WTT boards were thermally modified at 170°Caccording to the Danish WTT process by the Utetra com-pany in Arvidsjaur, Sweden. During the first hour, thetemperature was raised to 40°C and prior vacuum was ap-plied. During the next 45 minutes, the temperature wasraised to 60°C and held constant (60°C) for 25 minutes. )ekiln was warmed up to 140°C during 4 hours and heldconstant (140°C) for 30 minutes. )e kiln was furtherwarmed up for around 2 hours until the temperaturereached 155°C and held constant (155°C) for 15minutes.)ereafter, the kiln was warmed until 170°C and heldconstant (170°C) for 30minutes. During the process, thepressure was applied when the kiln temperature reached60°C and the pressure was raised steadily together with thetemperature up to 6 bar at 170°C. After thermal modificationat 170°C, the kiln was cooled down first to 80°C for 8 hoursand to 65°C for 2 hours. )e pressure was steadily decreasedto 0 when the kiln temperature reached 60°C.
After drying and thermal modification, all the sampleswere sawn to give specimens with dimensions of 15 × 50 ×
220mm (T × W × L), which means that the thermallymodified specimens had both planed and sawn surfaces. All
the specimens were stored under the same conditions atroom temperature for five months prior to the NIRmeasurements.
2.2. Image Acquisition. A push-broom system equippedwith high-speed hyperspectral camera (Specim SWIR 3)in the short-wave infrared (SWIR) 900–2500 nm rangewith a cryogenically cooled mercury-cadmium-telluride(HgCdTe) detector with 384 spatial pixels and 288 spec-tral band resolution was used for the NIR measurements(Figure 2). )e camera pixel size was 24 × 24 µm, anda 31mm focal length lens was used. Internal dark and whitereference (Spectrolon) standards were used, i.e., the darkadjustment was based on camera dark current and Spec-trolon was used as a white reference before eachmeasurement.
)e samples for imaging were divided in two groups: (1)naturally seasoned and kiln-dried specimens and (2) ther-mally modified specimens.
)ree naturally seasoned and three kiln-dried matchedspecimens were randomly selected from the sample group,and a cross-cut was prepared from each specimen. A nat-urally seasoned specimen attacked by stain-fungus growthwas added to the dataset. )e sample origin is listed inTable 1.
Six of the specimens had fine-sawn surfaces, and two hada rougher surface in order to examine the influence ofsurface conditions on light reflection. )e specimens wereplaced randomly on the conveyer belt in order to obtaina representative light-depth penetration during imaging. Allthe measurements were made on sapwood cross-sections,with camera-belt movement in the tangential direction.
For the hyperspectral image analysis, data for the nat-urally seasoned and kiln-dried specimens were combinedwith data for samples from the thermal modification pro-cesses, )ermoD, andWTT, using a “merge” function in theEvince software version 2.7.9 software, Prediktera, Umea,Sweden [21]. A mean-centring procedure was applied asa general preprocessing technique for all the data sets col-lected. Results from the merged digital images are presentedin Figure 3. )e standard RGB images of the dataset inFigure 3 show that the planed surfaces of the )ermoD(Figure 3(b)) and WTT (Figure 3(d)) had a more intensecolour than the other surfaces.
2.3. Image Cleaning and Processing. )e complete datamatrix from eight specimens of naturally seasoned and kiln-dried groups and four specimens of thermally modifiedwood contained 1,875,840 observations and 288 variables(spectral bands) as measured parameters. )e merged ab-sorbance images were exported and analysed with Evincesoftware version 2.7.9 [21].
Hyperspectral image modelling of the multiple imagedataset in Figure 3 was used to determine the useful area ofinterest to study the influence of the different factors (wooddrying and thermal treatment). Principal componentanalysis (PCA) was used to clean background (conveyer belt)
Journal of Spectroscopy 3
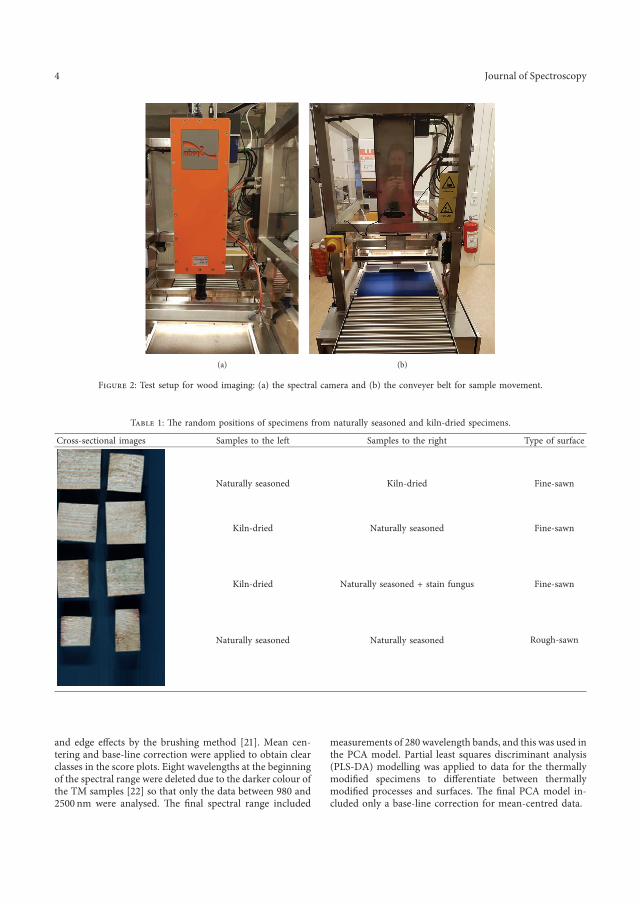
and edge effects by the brushing method [21]. Mean cen-tering and base-line correction were applied to obtain clearclasses in the score plots. Eight wavelengths at the beginningof the spectral range were deleted due to the darker colour ofthe TM samples [22] so that only the data between 980 and2500 nm were analysed. )e final spectral range included
measurements of 280 wavelength bands, and this was used inthe PCA model. Partial least squares discriminant analysis(PLS-DA) modelling was applied to data for the thermallymodified specimens to differentiate between thermallymodified processes and surfaces. )e final PCA model in-cluded only a base-line correction for mean-centred data.
(a) (b)
Figure 2: Test setup for wood imaging: (a) the spectral camera and (b) the conveyer belt for sample movement.
Table 1: )e random positions of specimens from naturally seasoned and kiln-dried specimens.
Cross-sectional images Samples to the left Samples to the right Type of surface
Naturally seasoned Kiln-dried Fine-sawn
Kiln-dried Naturally seasoned Fine-sawn
Kiln-dried Naturally seasoned + stain fungus Fine-sawn
Naturally seasoned Naturally seasoned Rough-sawn
4 Journal of Spectroscopy
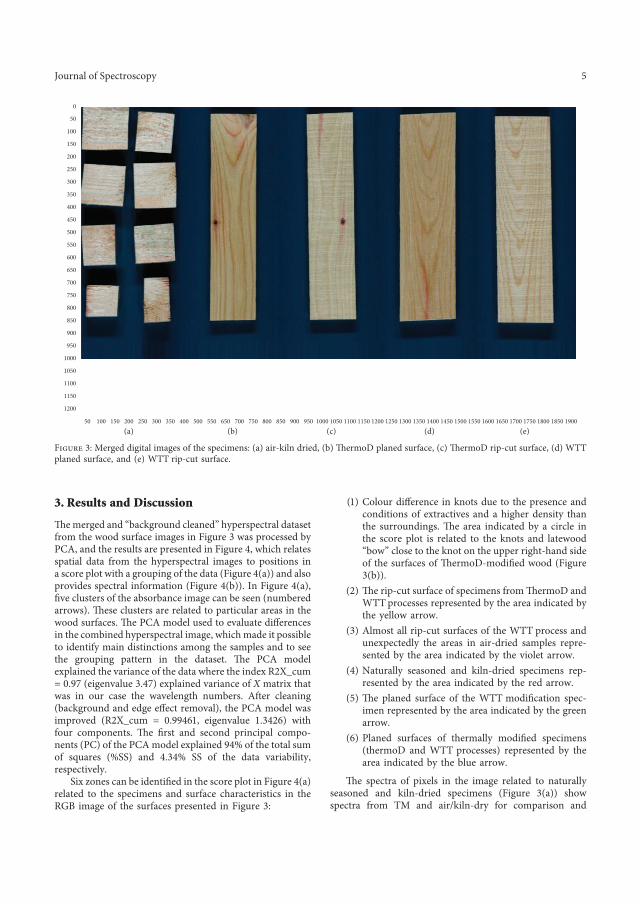
3. Results and Discussion
)emerged and “background cleaned” hyperspectral datasetfrom the wood surface images in Figure 3 was processed byPCA, and the results are presented in Figure 4, which relatesspatial data from the hyperspectral images to positions ina score plot with a grouping of the data (Figure 4(a)) and alsoprovides spectral information (Figure 4(b)). In Figure 4(a),five clusters of the absorbance image can be seen (numberedarrows). )ese clusters are related to particular areas in thewood surfaces. )e PCA model used to evaluate differencesin the combined hyperspectral image, whichmade it possibleto identify main distinctions among the samples and to seethe grouping pattern in the dataset. )e PCA modelexplained the variance of the data where the index R2X_cum� 0.97 (eigenvalue 3.47) explained variance of X matrix thatwas in our case the wavelength numbers. After cleaning(background and edge effect removal), the PCA model wasimproved (R2X_cum � 0.99461, eigenvalue 1.3426) withfour components. )e first and second principal compo-nents (PC) of the PCAmodel explained 94% of the total sumof squares (%SS) and 4.34% SS of the data variability,respectively.
Six zones can be identified in the score plot in Figure 4(a)related to the specimens and surface characteristics in theRGB image of the surfaces presented in Figure 3:
(1) Colour difference in knots due to the presence andconditions of extractives and a higher density thanthe surroundings. )e area indicated by a circle inthe score plot is related to the knots and latewood“bow” close to the knot on the upper right-hand sideof the surfaces of )ermoD-modified wood (Figure3(b)).
(2) )e rip-cut surface of specimens from)ermoD andWTTprocesses represented by the area indicated bythe yellow arrow.
(3) Almost all rip-cut surfaces of the WTT process andunexpectedly the areas in air-dried samples repre-sented by the area indicated by the violet arrow.
(4) Naturally seasoned and kiln-dried specimens rep-resented by the area indicated by the red arrow.
(5) )e planed surface of the WTT modification spec-imen represented by the area indicated by the greenarrow.
(6) Planed surfaces of thermally modified specimens(thermoD and WTT processes) represented by thearea indicated by the blue arrow.
)e spectra of pixels in the image related to naturallyseasoned and kiln-dried specimens (Figure 3(a)) showspectra from TM and air/kiln-dry for comparison and
0
50
100
150
200
250
300
350
400
450
500
550
600
650
700
750
800
850
900
950
1000
1050
1100
1150
1200
(a) (b) (c) (d) (e)50 100 150 200 250 300 350 400 500 550 650 700 750 800 850 900 950 1000 1050 1100 1150 1200 1250 1300 1350 1400 1450 1500 1550 1600 1650 1700 1750 1800 19001850
Figure 3: Merged digital images of the specimens: (a) air-kiln dried, (b) )ermoD planed surface, (c) )ermoD rip-cut surface, (d) WTTplaned surface, and (e) WTT rip-cut surface.
Journal of Spectroscopy 5
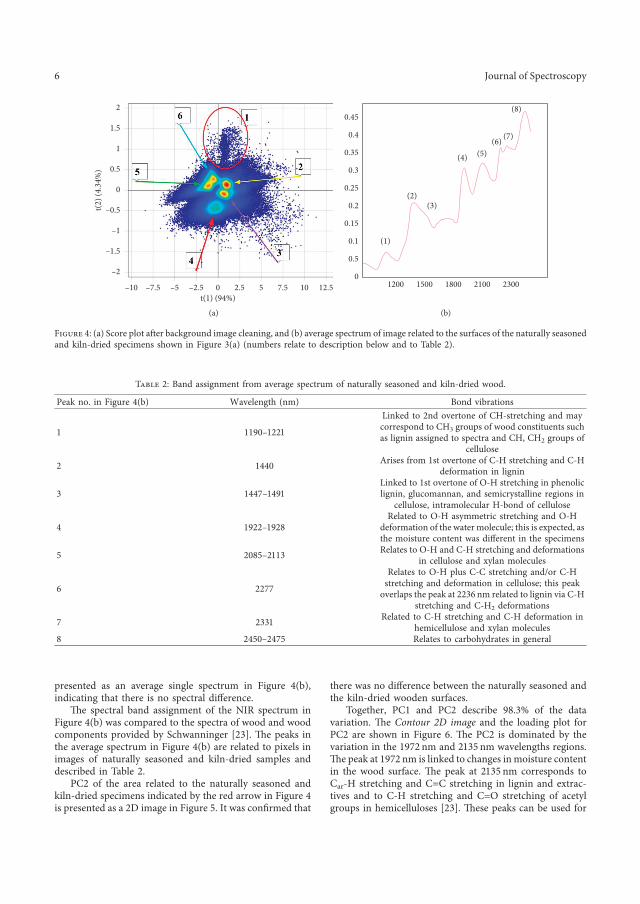
presented as an average single spectrum in Figure 4(b),indicating that there is no spectral difference.
)e spectral band assignment of the NIR spectrum inFigure 4(b) was compared to the spectra of wood and woodcomponents provided by Schwanninger [23]. )e peaks inthe average spectrum in Figure 4(b) are related to pixels inimages of naturally seasoned and kiln-dried samples anddescribed in Table 2.
PC2 of the area related to the naturally seasoned andkiln-dried specimens indicated by the red arrow in Figure 4is presented as a 2D image in Figure 5. It was confirmed that
there was no difference between the naturally seasoned andthe kiln-dried wooden surfaces.
Together, PC1 and PC2 describe 98.3% of the datavariation. )e Contour 2D image and the loading plot forPC2 are shown in Figure 6. )e PC2 is dominated by thevariation in the 1972 nm and 2135 nm wavelengths regions.)e peak at 1972 nm is linked to changes inmoisture contentin the wood surface. )e peak at 2135 nm corresponds toCar-H stretching and C�C stretching in lignin and extrac-tives and to C-H stretching and C�O stretching of acetylgroups in hemicelluloses [23]. )ese peaks can be used for
Table 2: Band assignment from average spectrum of naturally seasoned and kiln-dried wood.
Peak no. in Figure 4(b) Wavelength (nm) Bond vibrations
1 1190–1221
Linked to 2nd overtone of CH-stretching and maycorrespond to CH3 groups of wood constituents suchas lignin assigned to spectra and CH, CH2 groups of
cellulose
2 1440 Arises from 1st overtone of C-H stretching and C-Hdeformation in lignin
3 1447–1491Linked to 1st overtone of O-H stretching in phenoliclignin, glucomannan, and semicrystalline regions in
cellulose, intramolecular H-bond of cellulose
4 1922–1928Related to O-H asymmetric stretching and O-H
deformation of the water molecule; this is expected, asthe moisture content was different in the specimens
5 2085–2113 Relates to O-H and C-H stretching and deformationsin cellulose and xylan molecules
6 2277
Relates to O-H plus C-C stretching and/or C-Hstretching and deformation in cellulose; this peakoverlaps the peak at 2236 nm related to lignin via C-H
stretching and C-H2 deformations
7 2331 Related to C-H stretching and C-H deformation inhemicellulose and xylan molecules
8 2450–2475 Relates to carbohydrates in general
2
1.5
1
0.5
t(2) (
4.34
%)
t(1) (94%)
0
–1
–0.5
–1.5
–2
–10 –7.5 –5 –2.5 0 2.5 5 7.5 10 12.5
(a)
0.4
0.45
0.35
0.3
0.25
0.2
0.5
0.15
01200 1500 1800 2100 2300
0.1 (1)
(2)(3)
(4) (5)(6) (7)
(8)
(b)
Figure 4: (a) Score plot after background image cleaning, and (b) average spectrum of image related to the surfaces of the naturally seasonedand kiln-dried specimens shown in Figure 3(a) (numbers relate to description below and to Table 2).
6 Journal of Spectroscopy
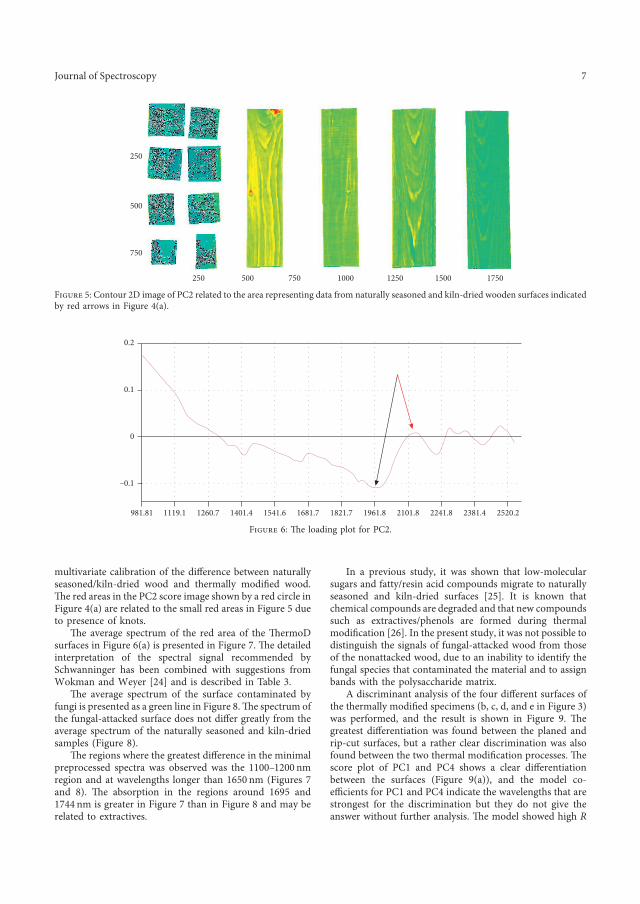
multivariate calibration of the difference between naturallyseasoned/kiln-dried wood and thermally modified wood.)e red areas in the PC2 score image shown by a red circle inFigure 4(a) are related to the small red areas in Figure 5 dueto presence of knots.
)e average spectrum of the red area of the )ermoDsurfaces in Figure 6(a) is presented in Figure 7. )e detailedinterpretation of the spectral signal recommended bySchwanninger has been combined with suggestions fromWokman and Weyer [24] and is described in Table 3.
)e average spectrum of the surface contaminated byfungi is presented as a green line in Figure 8.)e spectrum ofthe fungal-attacked surface does not differ greatly from theaverage spectrum of the naturally seasoned and kiln-driedsamples (Figure 8).
)e regions where the greatest difference in the minimalpreprocessed spectra was observed was the 1100–1200 nmregion and at wavelengths longer than 1650 nm (Figures 7and 8). )e absorption in the regions around 1695 and1744 nm is greater in Figure 7 than in Figure 8 and may berelated to extractives.
In a previous study, it was shown that low-molecularsugars and fatty/resin acid compounds migrate to naturallyseasoned and kiln-dried surfaces [25]. It is known thatchemical compounds are degraded and that new compoundssuch as extractives/phenols are formed during thermalmodification [26]. In the present study, it was not possible todistinguish the signals of fungal-attacked wood from thoseof the nonattacked wood, due to an inability to identify thefungal species that contaminated the material and to assignbands with the polysaccharide matrix.
A discriminant analysis of the four different surfaces ofthe thermally modified specimens (b, c, d, and e in Figure 3)was performed, and the result is shown in Figure 9. )egreatest differentiation was found between the planed andrip-cut surfaces, but a rather clear discrimination was alsofound between the two thermal modification processes. )escore plot of PC1 and PC4 shows a clear differentiationbetween the surfaces (Figure 9(a)), and the model co-efficients for PC1 and PC4 indicate the wavelengths that arestrongest for the discrimination but they do not give theanswer without further analysis. )e model showed high R
250
250 500 750 1000 1250 1500 1750
500
750
Figure 5: Contour 2D image of PC2 related to the area representing data from naturally seasoned and kiln-dried wooden surfaces indicatedby red arrows in Figure 4(a).
0.2
0.1
0
–0.1
981.81 1119.1 1260.7 1401.4 1541.6 1681.7 1821.7 1961.8 2101.8 2241.8 2520.22381.4
Figure 6: )e loading plot for PC2.
Journal of Spectroscopy 7
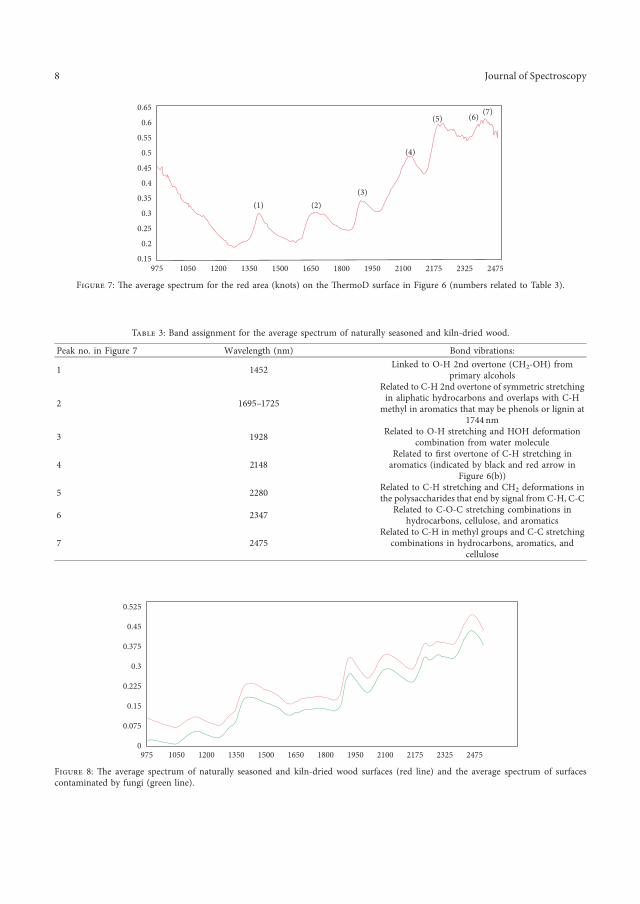
Table 3: Band assignment for the average spectrum of naturally seasoned and kiln-dried wood.
Peak no. in Figure 7 Wavelength (nm) Bond vibrations:
1 1452 Linked to O-H 2nd overtone (CH2-OH) fromprimary alcohols
2 1695–1725
Related to C-H 2nd overtone of symmetric stretchingin aliphatic hydrocarbons and overlaps with C-H
methyl in aromatics that may be phenols or lignin at1744 nm
3 1928 Related to O-H stretching and HOH deformationcombination from water molecule
4 2148Related to first overtone of C-H stretching inaromatics (indicated by black and red arrow in
Figure 6(b))
5 2280 Related to C-H stretching and CH2 deformations inthe polysaccharides that end by signal from C-H, C-C
6 2347 Related to C-O-C stretching combinations inhydrocarbons, cellulose, and aromatics
7 2475Related to C-H in methyl groups and C-C stretching
combinations in hydrocarbons, aromatics, andcellulose
0.45
0.525
0.375
0.3
0.225
0.15
0.075
0975 1050 1200 1350 1500 1650 1800 1950 2100 2175 2325 2475
Figure 8: )e average spectrum of naturally seasoned and kiln-dried wood surfaces (red line) and the average spectrum of surfacescontaminated by fungi (green line).
0.65
0.6
0.55
0.5
0.45
0.4
0.35
0.3
0.25
0.15975 1050 1200 1350
(1) (2)(3)
(4)
(5)(7)(6)
1500 1650 1800 1950 2100 2175 2325 2475
0.2
Figure 7: )e average spectrum for the red area (knots) on the )ermoD surface in Figure 6 (numbers related to Table 3).
8 Journal of Spectroscopy
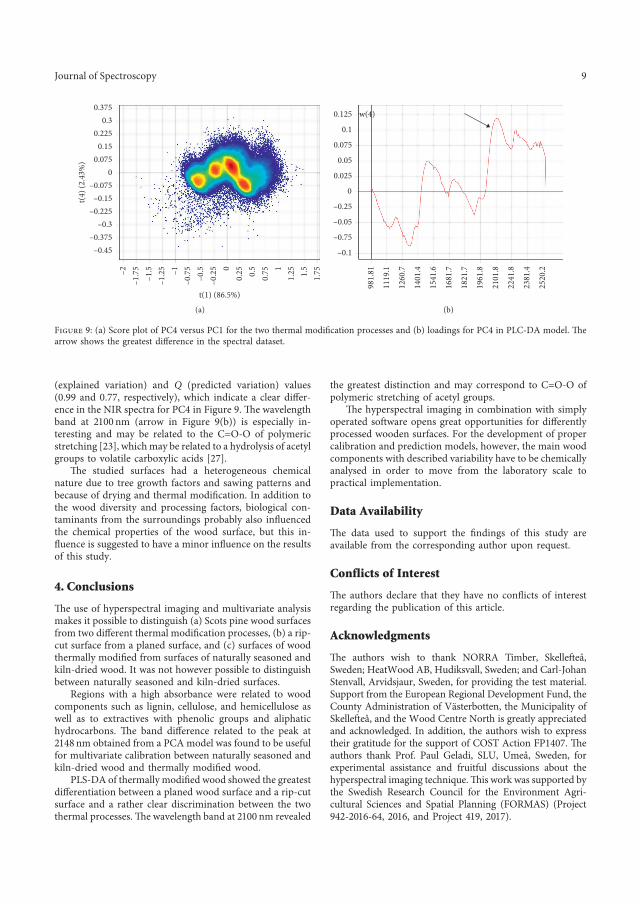
(explained variation) and Q (predicted variation) values(0.99 and 0.77, respectively), which indicate a clear differ-ence in the NIR spectra for PC4 in Figure 9. )e wavelengthband at 2100 nm (arrow in Figure 9(b)) is especially in-teresting and may be related to the C�O-O of polymericstretching [23], whichmay be related to a hydrolysis of acetylgroups to volatile carboxylic acids [27].
)e studied surfaces had a heterogeneous chemicalnature due to tree growth factors and sawing patterns andbecause of drying and thermal modification. In addition tothe wood diversity and processing factors, biological con-taminants from the surroundings probably also influencedthe chemical properties of the wood surface, but this in-fluence is suggested to have a minor influence on the resultsof this study.
4. Conclusions
)e use of hyperspectral imaging and multivariate analysismakes it possible to distinguish (a) Scots pine wood surfacesfrom two different thermal modification processes, (b) a rip-cut surface from a planed surface, and (c) surfaces of woodthermally modified from surfaces of naturally seasoned andkiln-dried wood. It was not however possible to distinguishbetween naturally seasoned and kiln-dried surfaces.
Regions with a high absorbance were related to woodcomponents such as lignin, cellulose, and hemicellulose aswell as to extractives with phenolic groups and aliphatichydrocarbons. )e band difference related to the peak at2148 nm obtained from a PCA model was found to be usefulfor multivariate calibration between naturally seasoned andkiln-dried wood and thermally modified wood.
PLS-DA of thermally modified wood showed the greatestdifferentiation between a planed wood surface and a rip-cutsurface and a rather clear discrimination between the twothermal processes.)e wavelength band at 2100 nm revealed
the greatest distinction and may correspond to C�O-O ofpolymeric stretching of acetyl groups.
)e hyperspectral imaging in combination with simplyoperated software opens great opportunities for differentlyprocessed wooden surfaces. For the development of propercalibration and prediction models, however, the main woodcomponents with described variability have to be chemicallyanalysed in order to move from the laboratory scale topractical implementation.
Data Availability
)e data used to support the findings of this study areavailable from the corresponding author upon request.
Conflicts of Interest
)e authors declare that they have no conflicts of interestregarding the publication of this article.
Acknowledgments
)e authors wish to thank NORRA Timber, Skelleftea,Sweden; HeatWood AB, Hudiksvall, Sweden; and Carl-JohanStenvall, Arvidsjaur, Sweden, for providing the test material.Support from the European Regional Development Fund, theCounty Administration of Vasterbotten, the Municipality ofSkelleftea, and the Wood Centre North is greatly appreciatedand acknowledged. In addition, the authors wish to expresstheir gratitude for the support of COST Action FP1407. )eauthors thank Prof. Paul Geladi, SLU, Umea, Sweden, forexperimental assistance and fruitful discussions about thehyperspectral imaging technique.)is work was supported bythe Swedish Research Council for the Environment Agri-cultural Sciences and Spatial Planning (FORMAS) (Project942-2016-64, 2016, and Project 419, 2017).
0.3750.3
0.2250.15
0.0750
–0.075
t(4) (
2.43
%)
t(1) (86.5%)
–0.15–0.225
–0.3–0.375
–0.45
–2
–1.5
–1.2
5
0.5
0.75–1 1.25
–1.7
5
0.25
–0.2
5–0
.5 0
–0.7
5
1.5
1.751
(a)
0.125 w(4)
0.1
0.075
0.05
0.025
0
–0.25
–0.05
–0.75
–0.1
981.
81
1260
.7
1401
.4
2241
.8
2381
.4
1541
.6
1119
.1
2101
.8
1821
.7
1961
.8
1681
.7
2520
.2
(b)
Figure 9: (a) Score plot of PC4 versus PC1 for the two thermal modification processes and (b) loadings for PC4 in PLC-DA model. )earrow shows the greatest difference in the spectral dataset.
Journal of Spectroscopy 9
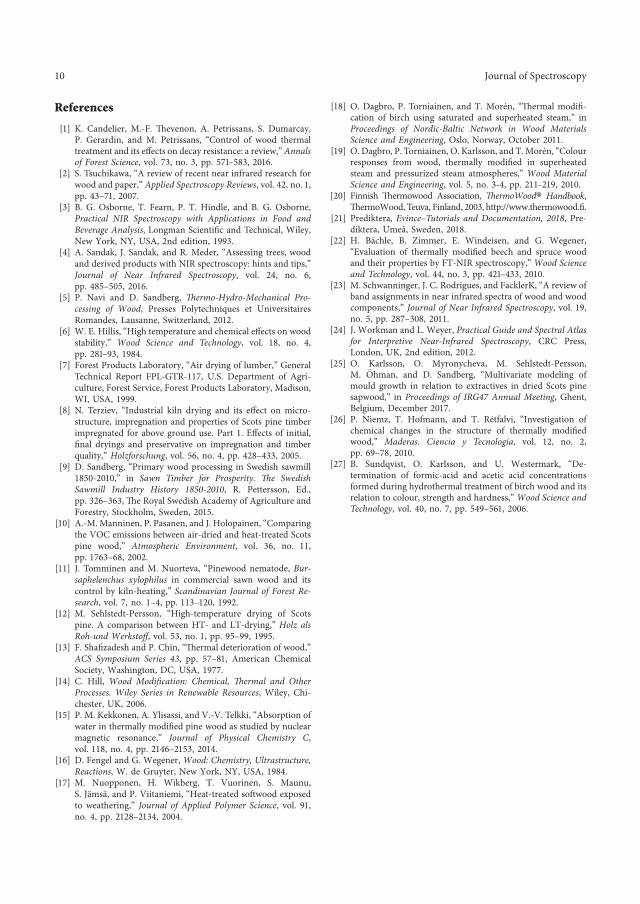
References
[1] K. Candelier, M.-F. )evenon, A. Petrissans, S. Dumarcay,P. Gerardin, and M. Petrissans, “Control of wood thermaltreatment and its effects on decay resistance: a review,”Annalsof Forest Science, vol. 73, no. 3, pp. 571–583, 2016.
[2] S. Tsuchikawa, “A review of recent near infrared research forwood and paper,” Applied Spectroscopy Reviews, vol. 42, no. 1,pp. 43–71, 2007.
[3] B. G. Osborne, T. Fearn, P. T. Hindle, and B. G. Osborne,Practical NIR Spectroscopy with Applications in Food andBeverage Analysis, Longman Scientific and Technical, Wiley,New York, NY, USA, 2nd edition, 1993.
[4] A. Sandak, J. Sandak, and R. Meder, “Assessing trees, woodand derived products with NIR spectroscopy: hints and tips,”Journal of Near Infrared Spectroscopy, vol. 24, no. 6,pp. 485–505, 2016.
[5] P. Navi and D. Sandberg, 5ermo-Hydro-Mechanical Pro-cessing of Wood, Presses Polytechniques et UniversitairesRomandes, Lausanne, Switzerland, 2012.
[6] W. E. Hillis, “High temperature and chemical effects on woodstability,” Wood Science and Technology, vol. 18, no. 4,pp. 281–93, 1984.
[7] Forest Products Laboratory, “Air drying of lumber,” GeneralTechnical Report FPL-GTR-117, U.S. Department of Agri-culture, Forest Service, Forest Products Laboratory, Madison,WI, USA, 1999.
[8] N. Terziev, “Industrial kiln drying and its effect on micro-structure, impregnation and properties of Scots pine timberimpregnated for above ground use. Part 1. Effects of initial,final dryings and preservative on impregnation and timberquality,” Holzforschung, vol. 56, no. 4, pp. 428–433, 2005.
[9] D. Sandberg, “Primary wood processing in Swedish sawmill1850-2010,” in Sawn Timber for Prosperity. 5e SwedishSawmill Industry History 1850-2010, R. Pettersson, Ed.,pp. 326–363, )e Royal Swedish Academy of Agriculture andForestry, Stockholm, Sweden, 2015.
[10] A.-M. Manninen, P. Pasanen, and J. Holopainen, “Comparingthe VOC emissions between air-dried and heat-treated Scotspine wood,” Atmospheric Environment, vol. 36, no. 11,pp. 1763–68, 2002.
[11] J. Tomminen and M. Nuorteva, “Pinewood nematode, Bur-saphelenchus xylophilus in commercial sawn wood and itscontrol by kiln-heating,” Scandinavian Journal of Forest Re-search, vol. 7, no. 1–4, pp. 113–120, 1992.
[12] M. Sehlstedt-Persson, “High-temperature drying of Scotspine. A comparison between HT- and LT-drying,” Holz alsRoh-und Werkstoff, vol. 53, no. 1, pp. 95–99, 1995.
[13] F. Shafizadesh and P. Chin, “)ermal deterioration of wood,”ACS Symposium Series 43, pp. 57–81, American ChemicalSociety, Washington, DC, USA, 1977.
[14] C. Hill, Wood Modification: Chemical, 5ermal and OtherProcesses. Wiley Series in Renewable Resources, Wiley, Chi-chester, UK, 2006.
[15] P. M. Kekkonen, A. Ylisassi, and V.-V. Telkki, “Absorption ofwater in thermally modified pine wood as studied by nuclearmagnetic resonance,” Journal of Physical Chemistry C,vol. 118, no. 4, pp. 2146–2153, 2014.
[16] D. Fengel and G. Wegener, Wood: Chemistry, Ultrastructure,Reactions, W. de Gruyter, New York, NY, USA, 1984.
[17] M. Nuopponen, H. Wikberg, T. Vuorinen, S. Maunu,S. Jamsa, and P. Viitaniemi, “Heat-treated softwood exposedto weathering,” Journal of Applied Polymer Science, vol. 91,no. 4, pp. 2128–2134, 2004.
[18] O. Dagbro, P. Torniainen, and T. Moren, “)ermal modifi-cation of birch using saturated and superheated steam,” inProceedings of Nordic-Baltic Network in Wood MaterialsScience and Engineering, Oslo, Norway, October 2011.
[19] O. Dagbro, P. Torniainen, O. Karlsson, and T.Moren, “Colourresponses from wood, thermally modified in superheatedsteam and pressurized steam atmospheres,” Wood MaterialScience and Engineering, vol. 5, no. 3-4, pp. 211–219, 2010.
[20] Finnish )ermowood Association, 5ermoWood® Handbook,)ermoWood, Teuva, Finland, 2003, http://www.thermowood.fi.
[21] Prediktera, Evince–Tutorials and Documentation, 2018, Pre-diktera, Umea, Sweden, 2018.
[22] H. Bachle, B. Zimmer, E. Windeisen, and G. Wegener,“Evaluation of thermally modified beech and spruce woodand their properties by FT-NIR spectroscopy,” Wood Scienceand Technology, vol. 44, no. 3, pp. 421–433, 2010.
[23] M. Schwanninger, J. C. Rodrigues, and FacklerK, “A review ofband assignments in near infrared spectra of wood and woodcomponents,” Journal of Near Infrared Spectroscopy, vol. 19,no. 5, pp. 287–308, 2011.
[24] J. Workman and L. Weyer, Practical Guide and Spectral Atlasfor Interpretive Near-Infrared Spectroscopy, CRC Press,London, UK, 2nd edition, 2012.
[25] O. Karlsson, O. Myronycheva, M. Sehlstedt-Persson,M. Ohman, and D. Sandberg, “Multivariate modeling ofmould growth in relation to extractives in dried Scots pinesapwood,” in Proceedings of IRG47 Annual Meeting, Ghent,Belgium, December 2017.
[26] P. Niemz, T. Hofmann, and T. Retfalvi, “Investigation ofchemical changes in the structure of thermally modifiedwood,” Maderas. Ciencia y Tecnologıa, vol. 12, no. 2,pp. 69–78, 2010.
[27] B. Sundqvist, O. Karlsson, and U. Westermark, “De-termination of formic-acid and acetic acid concentrationsformed during hydrothermal treatment of birch wood and itsrelation to colour, strength and hardness,” Wood Science andTechnology, vol. 40, no. 7, pp. 549–561, 2006.
10 Journal of Spectroscopy

Paper XI

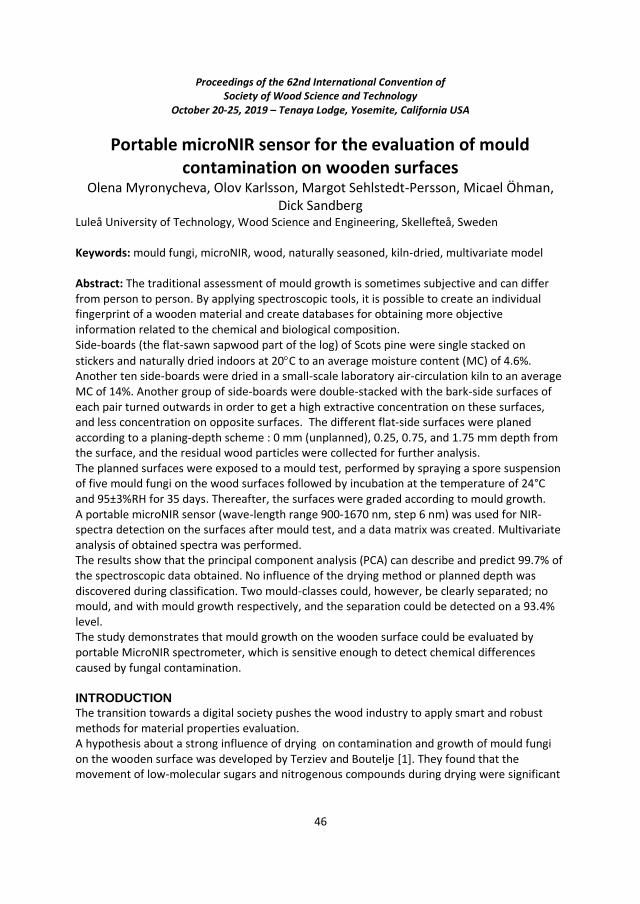
Proceedings of the 62nd International Convention of Society of Wood Science and Technology
October 20-25, 2019 – Tenaya Lodge, Yosemite, California USA
46
Portable microNIR sensor for the evaluation of mould contamination on wooden surfaces
Olena Myronycheva, Olov Karlsson, Margot Sehlstedt-Persson, Micael Öhman, Dick Sandberg
Luleå University of Technology, Wood Science and Engineering, Skellefteå, Sweden Keywords: mould fungi, microNIR, wood, naturally seasoned, kiln-dried, multivariate model Abstract: The traditional assessment of mould growth is sometimes subjective and can differ from person to person. By applying spectroscopic tools, it is possible to create an individual fingerprint of a wooden material and create databases for obtaining more objective information related to the chemical and biological composition. Side-boards (the flat-sawn sapwood part of the log) of Scots pine were single stacked on
stickers and naturally dried indoors at 20C to an average moisture content (MC) of 4.6%. Another ten side-boards were dried in a small-scale laboratory air-circulation kiln to an average MC of 14%. Another group of side-boards were double-stacked with the bark-side surfaces of each pair turned outwards in order to get a high extractive concentration on these surfaces, and less concentration on opposite surfaces. The different flat-side surfaces were planed according to a planing-depth scheme : 0 mm (unplanned), 0.25, 0.75, and 1.75 mm depth from the surface, and the residual wood particles were collected for further analysis. The planned surfaces were exposed to a mould test, performed by spraying a spore suspension of five mould fungi on the wood surfaces followed by incubation at the temperature of 24°C and 95±3%RH for 35 days. Thereafter, the surfaces were graded according to mould growth. A portable microNIR sensor (wave-length range 900-1670 nm, step 6 nm) was used for NIR-spectra detection on the surfaces after mould test, and a data matrix was created. Multivariate analysis of obtained spectra was performed. The results show that the principal component analysis (PCA) can describe and predict 99.7% of the spectroscopic data obtained. No influence of the drying method or planned depth was discovered during classification. Two mould-classes could, however, be clearly separated; no mould, and with mould growth respectively, and the separation could be detected on a 93.4% level. The study demonstrates that mould growth on the wooden surface could be evaluated by portable MicroNIR spectrometer, which is sensitive enough to detect chemical differences caused by fungal contamination. INTRODUCTION The transition towards a digital society pushes the wood industry to apply smart and robust methods for material properties evaluation. A hypothesis about a strong influence of drying on contamination and growth of mould fungi on the wooden surface was developed by Terziev and Boutelje [1]. They found that the movement of low-molecular sugars and nitrogenous compounds during drying were significant
Proceedings of the 62nd International Convention of Society of Wood Science and Technology
October 20-25, 2019 – Tenaya Lodge, Yosemite, California USA
47
and related to type of drying [2]. Later studies found that not only sugars but also acetone soluble extractives migrates during drying and influence the degree of mould attack on the wooden surfaces [3, 4]. The wet chemistry these studies [3, 4] are tedious and it is hard to make fast and reliable conclusion about wooden properties and its relation on mould fungi growth, especially when also the degree mould contamination must be judged by visual assessment by the human eye, which is a subjective method. Therefore, researchers are looking for different non-destructive methods that allow detecting changes in wooden surfaces with high accuracy and precision, e.g. for the detection of mould. By applying spectroscopic tools, it is possible to create an individual fingerprint of a material and create databases for obtaining more objective information related to the chemical and biological composition [5–7]. This study aimed at exploring near-infrared (NIR) portable spectrometer for the detection of differences in mould growth on the surface of the Scots pine side-boards. To study the influence of mould contamination, drying type and planning-depth variables on the multivariate-model efficiency was the objective of the study. MATERIALS AND METHODS Ten Side-boards (the flat-sawn sapwood part of the log) of Scots pine were single stacked on
stickers and naturally dried indoors at 20C to an average moisture content (MC) of 4.6%. after drying for 30 days. Another ten side-boards were dried in a small-scale laboratory air-circulation kiln. The boards were double-stacked with the bark-side surfaces (the surface of the boards oriented to the bark-side of the tree) in each pair oriented outwards in order to get a high flow of moisture from the inner part of the boards towards the bark-side surfaces. In this way, extractives could migrate with the water transport during drying and accumulate on the wood surfaces. The total drying time was 44 hours of which 1.7 hours was a heating regime, and the cycle ended with a 5-hour cooling regime giving a final moisture content of 14%. No conditioning regime was applied in order to prevent the influence of re-distribution of extractives after drying. The side-boards were preapred to specimens for further studies (Table 1).
Table 1. Test groups
No. Drying Planning depth (mm) Mould No. of specimens 1 Seasoned 0
0.25 0.75 1.75
No 10 10 10 10
2 Kiln 0 0.25 0.75 1.75
No 10 10 10 10
3 Seasoned 0 0.25 0.75 1.75
Yes 10 10 10 10
4 Kiln 0 0.25 0.75
Yes 10 10 10
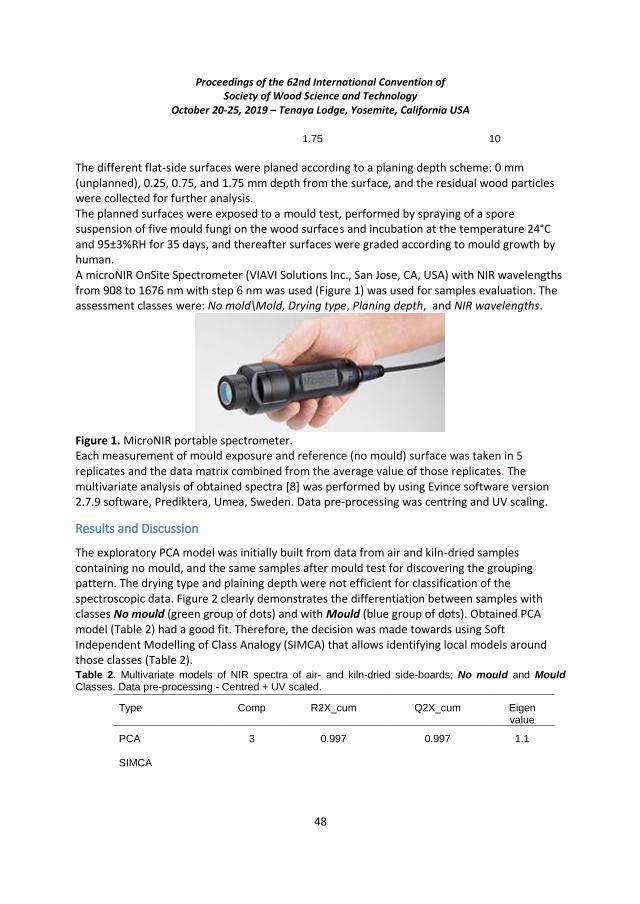
Proceedings of the 62nd International Convention of Society of Wood Science and Technology
October 20-25, 2019 – Tenaya Lodge, Yosemite, California USA
48
1.75 10
The different flat-side surfaces were planed according to a planing depth scheme: 0 mm (unplanned), 0.25, 0.75, and 1.75 mm depth from the surface, and the residual wood particles were collected for further analysis. The planned surfaces were exposed to a mould test, performed by spraying of a spore suspension of five mould fungi on the wood surfaces and incubation at the temperature 24°C and 95±3%RH for 35 days, and thereafter surfaces were graded according to mould growth by human. A microNIR OnSite Spectrometer (VIAVI Solutions Inc., San Jose, CA, USA) with NIR wavelengths from 908 to 1676 nm with step 6 nm was used (Figure 1) was used for samples evaluation. The assessment classes were: No mold\Mold, Drying type, Planing depth, and NIR wavelengths.
Figure 1. MicroNIR portable spectrometer. Each measurement of mould exposure and reference (no mould) surface was taken in 5 replicates and the data matrix combined from the average value of those replicates. The multivariate analysis of obtained spectra [8] was performed by using Evince software version 2.7.9 software, Prediktera, Umea, Sweden. Data pre-processing was centring and UV scaling.
Results and Discussion
The exploratory PCA model was initially built from data from air and kiln-dried samples containing no mould, and the same samples after mould test for discovering the grouping pattern. The drying type and plaining depth were not efficient for classification of the spectroscopic data. Figure 2 clearly demonstrates the differentiation between samples with classes No mould (green group of dots) and with Mould (blue group of dots). Obtained PCA model (Table 2) had a good fit. Therefore, the decision was made towards using Soft Independent Modelling of Class Analogy (SIMCA) that allows identifying local models around those classes (Table 2). Table 2. Multivariate models of NIR spectra of air- and kiln-dried side-boards; No mould and Mould Classes. Data pre-processing - Centred + UV scaled.
Type Comp R2X_cum Q2X_cum Eigen value
PCA 3 0.997 0.997 1.1
SIMCA
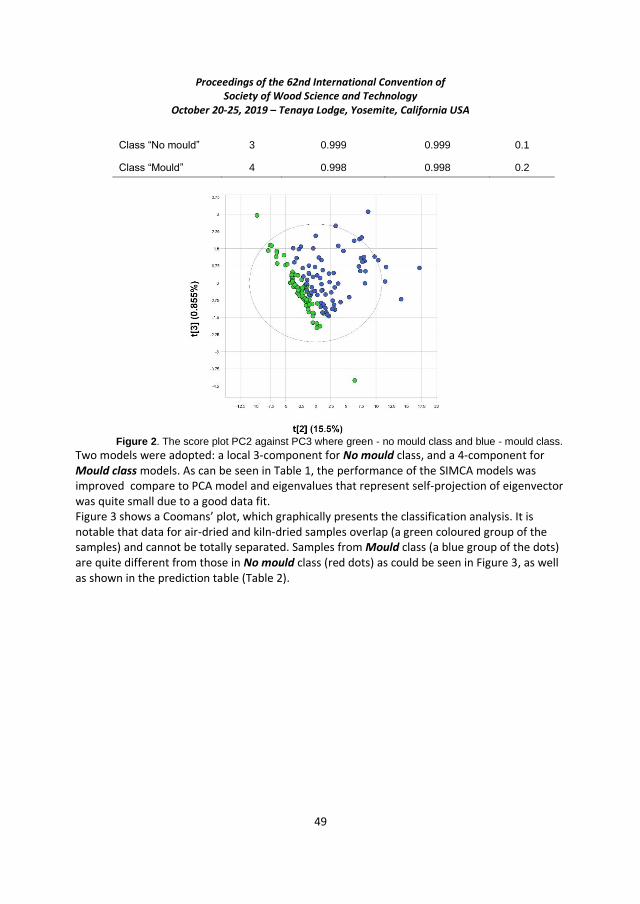
Proceedings of the 62nd International Convention of Society of Wood Science and Technology
October 20-25, 2019 – Tenaya Lodge, Yosemite, California USA
49
Class “No mould” 3 0.999 0.999 0.1
Class “Mould” 4 0.998 0.998 0.2
Figure 2. The score plot PC2 against PC3 where green - no mould class and blue - mould class.
Two models were adopted: a local 3-component for No mould class, and a 4-component for Mould class models. As can be seen in Table 1, the performance of the SIMCA models was improved compare to PCA model and eigenvalues that represent self-projection of eigenvector was quite small due to a good data fit. Figure 3 shows a Coomans’ plot, which graphically presents the classification analysis. It is notable that data for air-dried and kiln-dried samples overlap (a green coloured group of the samples) and cannot be totally separated. Samples from Mould class (a blue group of the dots) are quite different from those in No mould class (red dots) as could be seen in Figure 3, as well as shown in the prediction table (Table 2).
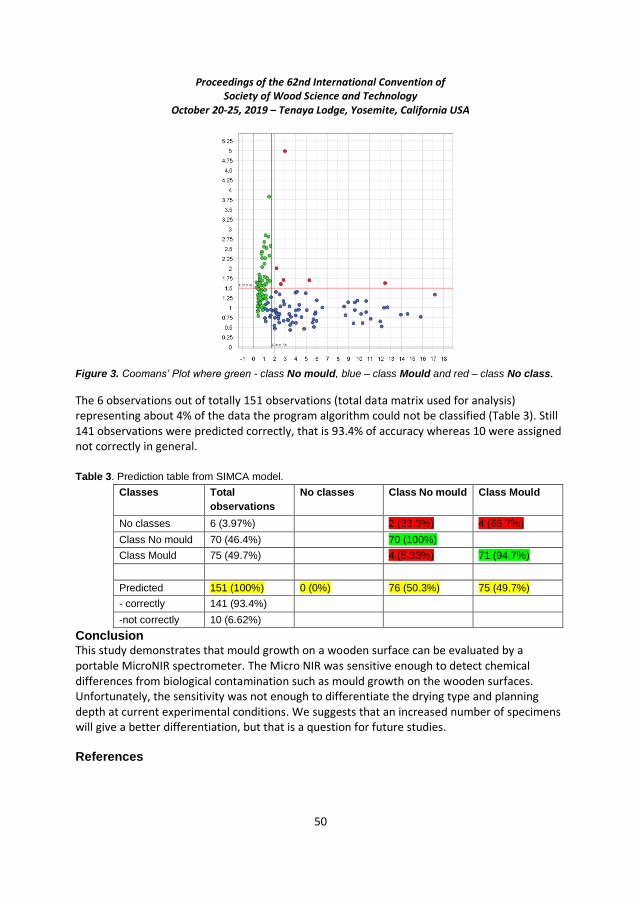
Proceedings of the 62nd International Convention of Society of Wood Science and Technology
October 20-25, 2019 – Tenaya Lodge, Yosemite, California USA
50
Figure 3. Coomans’ Plot where green - class No mould, blue – class Mould and red – class No class.
The 6 observations out of totally 151 observations (total data matrix used for analysis) representing about 4% of the data the program algorithm could not be classified (Table 3). Still 141 observations were predicted correctly, that is 93.4% of accuracy whereas 10 were assigned not correctly in general. Table 3. Prediction table from SIMCA model.
Classes Total
observations
No classes Class No mould Class Mould
No classes 6 (3.97%) 2 (33.3%) 4 (66.7%)
Class No mould 70 (46.4%) 70 (100%)
Class Mould 75 (49.7%) 4 (5.33%) 71 (94.7%)
Predicted 151 (100%) 0 (0%) 76 (50.3%) 75 (49.7%)
- correctly 141 (93.4%)
-not correctly 10 (6.62%)
Conclusion This study demonstrates that mould growth on a wooden surface can be evaluated by a portable MicroNIR spectrometer. The Micro NIR was sensitive enough to detect chemical differences from biological contamination such as mould growth on the wooden surfaces. Unfortunately, the sensitivity was not enough to differentiate the drying type and planning depth at current experimental conditions. We suggests that an increased number of specimens will give a better differentiation, but that is a question for future studies. References
Proceedings of the 62nd International Convention of Society of Wood Science and Technology
October 20-25, 2019 – Tenaya Lodge, Yosemite, California USA
51
1. Terziev, N.; Boutelje, J. Effect of Felling Time and Kiln-Drying on Color and Susceptibility of Wood to Mold and Fungal Stain During an Above-Ground Field Test. Wood Fiber Sci. 2007, 30, 360–367. 2. Terziev, N. Migration of Low-Molecular Sugars and Nitrogenous Compounds in Pinus sylvestris L. During Kiln and Air Drying. Holzforsch. - Int. J. Biol. Chem. Phys. Technol. Wood 2009, 49, 565–574. 3. Myronycheva, O.; Karlsson, O.; Sehlstedt-Persson, M.; Öhman, M.; Sandberg, D. Distribution of low-molecular lipophilic extractives beneath the surface of air- and kiln-dried Scots pine sapwood boards. PLOS ONE 2018, 13, e0204212. 4. Karlsson, O.; Myronycheva, O.; Sehlstedt-Persson, M.; Öhman, M.; Sandberg, D. Multivariate modeling of mould growth in relation to extractives in dried Scots pine sapwood. In Proceedings of the 48th Conference of the International Research Group on Wood Protection, IRG48; Ghent, Belgium, 2017. 5. Thumm, A.; Riddell, M.; Nanayakkara, B.; Harrington, J.; Meder, R. Mapping Within-Stem Variation of Chemical Composition by near Infrared Hyperspectral Imaging. J. Infrared Spectrosc. 2016, 24, 605–616. 6. Williams, P.J.; Geladi, P.; Britz, T.J.; Manley, M. Near-infrared (NIR) hyperspectral imaging and multivariate image analysis to study growth characteristics and differences between species and strains of members of the genus Fusarium. Anal. Bioanal. Chem. 2012, 404, 1759–1769. 7. Via, B.K.; Eckhardt, L.G.; So, C.-L.; Shupe, T.F.; Groom, L.H.; Stine, M. The Response of Visible/Near Infrared Absorbance to Wood-Staining Fungi. Wood Fiber Sci. 2007, 38, 717–726. 8. Eriksson, L.; Byrne, T.; Johansson, E.; Trygg, J.; Vikström, C. Multi- and megavariate data analysis: basic principles and applications; 2013; ISBN 978-91-973730-5-0.
Proceedings of the
2019
Society of Wood Science and
Technology
International Convention
Convention Theme: Renewable
Materials and the Wood-based
Bioeconomy
Edited by Susan LeVan-Green
Overall General Chair: Eve Haviarova,
Purdue University, USA
October 20-25, 2019
Tenaya Lodge
Yosemite National Park, California, USA

Paper XII

Proceedings of the 2020 Society of Wood Science and Technology International Convention
“Renewable Resources for a Sustainable and Healthy Future”
Edited by Susan LeVan-Green
Overall General Chair: Andreja Kutnar, InnoRenew CoE and University of Primorska, Slovenia
July 12-15, 2020
2020 INTERNATIONAL CONVENTION, VIRTUAL CONFERENCE – (FORMERLY HOTEL BERNARDIN), PORTOROŽ, SLOVENIA
Proceedings of the 2020 Society of Wood Science and Technology International Convention
57
SPECTROSCOPIC CHARACTERISATION OF WOOD TREATED BY DIFFERENT
COATINGS AFTER WEATHERING IN SUBARCTIC CONDITIONS
Olena Myronycheva1, Alona Sekan1, Injeong Kim1, Olov Karlsson1, Peter Jacobsson2, Margot
Sehlstedt-Persson1, Dick Sandberg1
1 Wood Science and Engineering, Luleå University of Technology, Skellefteå, Sweden
2 Martinsons Byggsystem AB, Skelleftea, Sweden
Abstract
Weathering of wood is a complex natural phenomenon that is influenced by factors both in macro-
and micro-scale. The degradation by weathering constitutes of complex physical-chemical changes
influenced by environmental factors such as moisture, sunlight, temperature, chemical compounds,
wind, and biological organisms and their related agents. The aim of our study was the evaluation
of MIR and NIR spectroscopic technique for characterisation of wood treated by commercial
coatings contained different biocidal treatments after weathering in subarctic conditions.
Tangential and radial surfaces of the Scots pine and Norway spruce were treated with coatings
containing various biocides. Treatment was in the form of fairly transparent wood oil (T), while
the two others were coatings that had more of a non-transparent character (H and P). Treated
specimens and control were placed in various directions on racks outdoor for natural weathering.
The measurement of the NIR spectra of specimens that were not exposed, after weathering and
dried after weathering, was done by the point-based microNIR portable sensor. Multivariate
statistical analysis (MSA) showed that data from types of exposure contributed less compared to
surface treatments in the 3D principal component analysis model (PCA). Grouping pattern around
treatments H and P could be obtained as the two individual groups more or less fully separated.
From the treatment T and non-treated specimens, no individual grouping behaviour could be
observed, however, more intense exposed seemed to be clustered in a different way than mildly
exposed ones. A more extensive weather exposure gave also a more degraded surface for T-treated
specimens. The NIR portable spectrometer may be used for assessment of the extent of weathering,
but the treatment P followed by treatment H had minimal changes. Coefficients Plot in the PLS-
DA model for different types of exposure for those treatments showed the influence of the NIR
wavelengths in classes related to exposure type. The changes caused by weathering phenomenon
was evaluated by using multivariate methods in which resulting multivariate model parameters for
prediction of the changes were determined. Analysis of the chemical structure of coatings after
weathering analysed by mid-infrared spectroscopy gave support to the lower stability of T-
treatment during weathering.
Keywords: wood, treatment, natural weathering, infrared, near-infrared, spectroscopy
INTRODUCTION
The measurement by electromagnetic radiation such as mid-infrared (MIR) and near-infrared
spectroscopy (NIR) is non-destructive analytical techniques providing an individual chemical
fingerprint of the sample. The non-destructive nature of the technique made it quite popular in
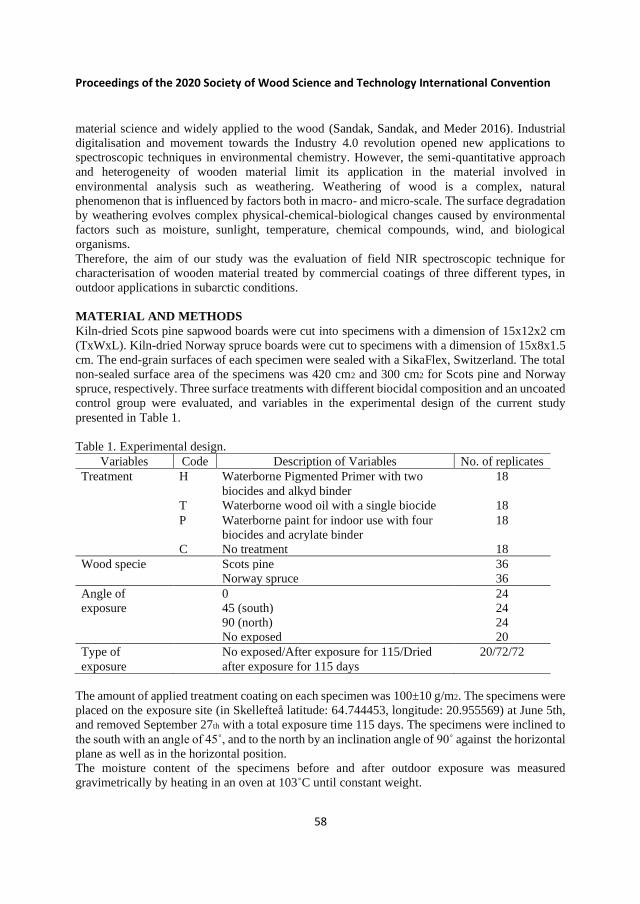
Proceedings of the 2020 Society of Wood Science and Technology International Convention
58
material science and widely applied to the wood (Sandak, Sandak, and Meder 2016). Industrial
digitalisation and movement towards the Industry 4.0 revolution opened new applications to
spectroscopic techniques in environmental chemistry. However, the semi-quantitative approach
and heterogeneity of wooden material limit its application in the material involved in
environmental analysis such as weathering. Weathering of wood is a complex, natural
phenomenon that is influenced by factors both in macro- and micro-scale. The surface degradation
by weathering evolves complex physical-chemical-biological changes caused by environmental
factors such as moisture, sunlight, temperature, chemical compounds, wind, and biological
organisms.
Therefore, the aim of our study was the evaluation of field NIR spectroscopic technique for
characterisation of wooden material treated by commercial coatings of three different types, in
outdoor applications in subarctic conditions.
MATERIAL AND METHODS
Kiln-dried Scots pine sapwood boards were cut into specimens with a dimension of 15x12x2 cm
(TxWxL). Kiln-dried Norway spruce boards were cut to specimens with a dimension of 15x8x1.5
cm. The end-grain surfaces of each specimen were sealed with a SikaFlex, Switzerland. The total
non-sealed surface area of the specimens was 420 cm2 and 300 cm2 for Scots pine and Norway
spruce, respectively. Three surface treatments with different biocidal composition and an uncoated
control group were evaluated, and variables in the experimental design of the current study
presented in Table 1.
Table 1. Experimental design.
Variables Code Description of Variables No. of replicates
Treatment H
Waterborne Pigmented Primer with two
biocides and alkyd binder
18
T Waterborne wood oil with a single biocide 18
P Waterborne paint for indoor use with four
biocides and acrylate binder
18
C No treatment 18
Wood specie Scots pine 36
Norway spruce 36
Angle of
exposure
0 24
45 (south) 24
90 (north)
No exposed
24
20
Type of
exposure
No exposed/After exposure for 115/Dried
after exposure for 115 days
20/72/72
The amount of applied treatment coating on each specimen was 100±10 g/m2. The specimens were
placed on the exposure site (in Skellefteå latitude: 64.744453, longitude: 20.955569) at June 5th,
and removed September 27th with a total exposure time 115 days. The specimens were inclined to
the south with an angle of 45˚, and to the north by an inclination angle of 90˚ against the horizontal
plane as well as in the horizontal position.
The moisture content of the specimens before and after outdoor exposure was measured
gravimetrically by heating in an oven at 103˚C until constant weight.
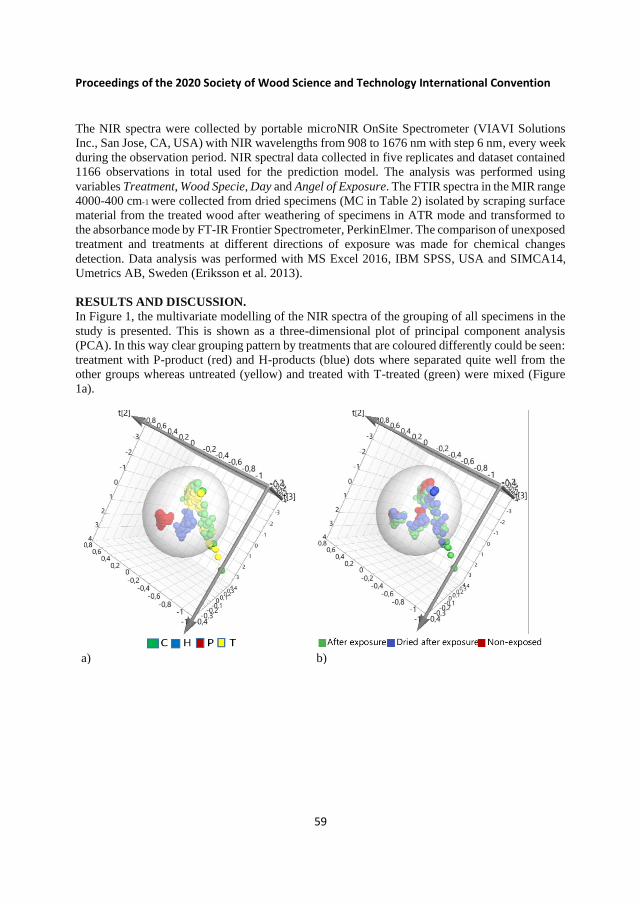
Proceedings of the 2020 Society of Wood Science and Technology International Convention
59
The NIR spectra were collected by portable microNIR OnSite Spectrometer (VIAVI Solutions
Inc., San Jose, CA, USA) with NIR wavelengths from 908 to 1676 nm with step 6 nm, every week
during the observation period. NIR spectral data collected in five replicates and dataset contained
1166 observations in total used for the prediction model. The analysis was performed using
variables Treatment, Wood Specie, Day and Angel of Exposure. The FTIR spectra in the MIR range
4000-400 cm-1 were collected from dried specimens (MC in Table 2) isolated by scraping surface
material from the treated wood after weathering of specimens in ATR mode and transformed to
the absorbance mode by FT-IR Frontier Spectrometer, PerkinElmer. The comparison of unexposed
treatment and treatments at different directions of exposure was made for chemical changes
detection. Data analysis was performed with MS Excel 2016, IBM SPSS, USA and SIMCA14,
Umetrics AB, Sweden (Eriksson et al. 2013).
RESULTS AND DISCUSSION.
In Figure 1, the multivariate modelling of the NIR spectra of the grouping of all specimens in the
study is presented. This is shown as a three-dimensional plot of principal component analysis
(PCA). In this way clear grouping pattern by treatments that are coloured differently could be seen:
treatment with P-product (red) and H-products (blue) dots where separated quite well from the
other groups whereas untreated (yellow) and treated with T-treated (green) were mixed (Figure
1a).
a) b)
Proceedings of the 2020 Society of Wood Science and Technology International Convention
60
c) d)
Figure 1. The 3D PCA model of NIR spectra overview with legends coloured by: a) coating
treatment, b) type of exposure, c) wood species, d) angle of exposure (0 – non exposure
specimens)
Already in the non-exposed specimens (red dots in Figure 1b), such separation between treatment
H and P was seen whereas for T-treatment mixing with uncoated specimens were obvious. Also,
after the weathering exposure, such separation of specimens related to the various treatments could
be observed (green dots in Figure 1b). Furthermore, the weathered specimens in treatment H and
P (green dots in Figure 1b) were clustered at somewhat different position in the plot than the
corresponding non-exposed specimens (red dots in Figure 1b). Moisture is a frequent contributor
in NIR spectra, and H- and P-dried weathered specimens (green dots in Figure 1b) were also
clustered at somewhat different positions than the dried weathered specimens (blue dots in Figure
1b). This indicated that also, other factors than moisture contributes to the separations of groups
in the PCA-plot as the treatment itself played a dominant role in the separation in the multivariate
plot of weathered specimens.
From visual inspection, T treatment was found to be more vulnerable to weathering conditions
than treatment H and especially treatment P (Table 2).
Table 2. The final pictures of the treated Scots pine boards after 115 days of exposure before drying
Angle H T P C
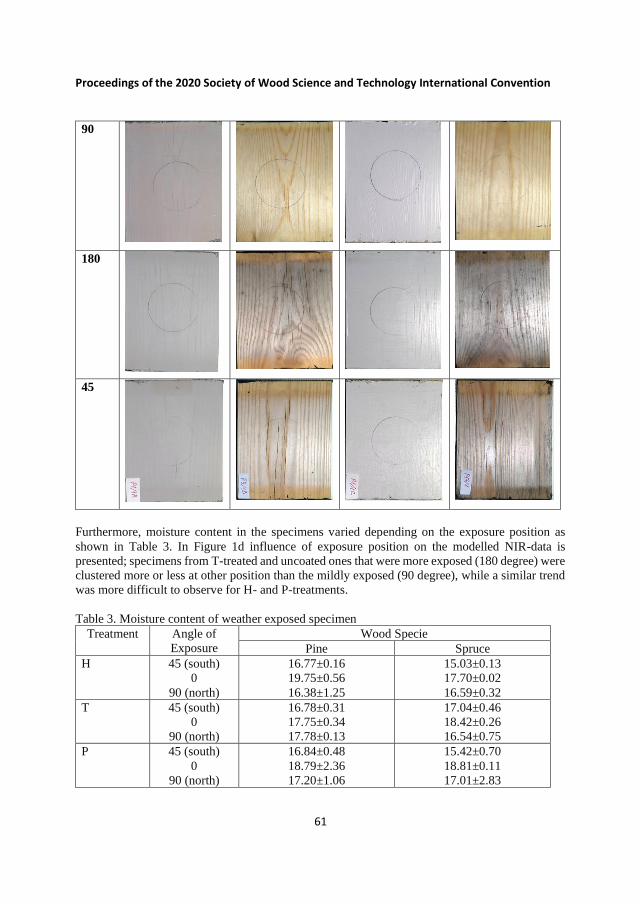
Proceedings of the 2020 Society of Wood Science and Technology International Convention
61
90
180
45
Furthermore, moisture content in the specimens varied depending on the exposure position as
shown in Table 3. In Figure 1d influence of exposure position on the modelled NIR-data is
presented; specimens from T-treated and uncoated ones that were more exposed (180 degree) were
clustered more or less at other position than the mildly exposed (90 degree), while a similar trend
was more difficult to observe for H- and P-treatments.
Table 3. Moisture content of weather exposed specimen
Treatment Angle of
Exposure
Wood Specie
Pine Spruce
H 45 (south)
0
90 (north)
16.77±0.16
19.75±0.56
16.38±1.25
15.03±0.13
17.70±0.02
16.59±0.32
T 45 (south)
0
90 (north)
16.78±0.31
17.75±0.34
17.78±0.13
17.04±0.46
18.42±0.26
16.54±0.75
P 45 (south)
0
90 (north)
16.84±0.48
18.79±2.36
17.20±1.06
15.42±0.70
18.81±0.11
17.01±2.83
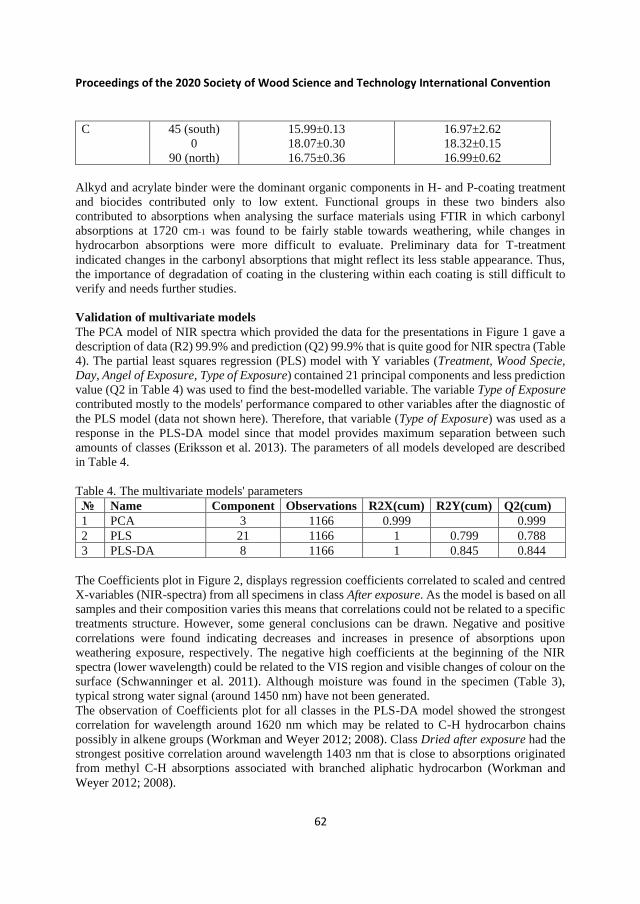
Proceedings of the 2020 Society of Wood Science and Technology International Convention
62
C 45 (south)
0
90 (north)
15.99±0.13
18.07±0.30
16.75±0.36
16.97±2.62
18.32±0.15
16.99±0.62
Alkyd and acrylate binder were the dominant organic components in H- and P-coating treatment
and biocides contributed only to low extent. Functional groups in these two binders also
contributed to absorptions when analysing the surface materials using FTIR in which carbonyl
absorptions at 1720 cm-1 was found to be fairly stable towards weathering, while changes in
hydrocarbon absorptions were more difficult to evaluate. Preliminary data for T-treatment
indicated changes in the carbonyl absorptions that might reflect its less stable appearance. Thus,
the importance of degradation of coating in the clustering within each coating is still difficult to
verify and needs further studies.
Validation of multivariate models
The PCA model of NIR spectra which provided the data for the presentations in Figure 1 gave a
description of data (R2) 99.9% and prediction (Q2) 99.9% that is quite good for NIR spectra (Table
4). The partial least squares regression (PLS) model with Y variables (Treatment, Wood Specie,
Day, Angel of Exposure, Type of Exposure) contained 21 principal components and less prediction
value (Q2 in Table 4) was used to find the best-modelled variable. The variable Type of Exposure
contributed mostly to the models' performance compared to other variables after the diagnostic of
the PLS model (data not shown here). Therefore, that variable (Type of Exposure) was used as a
response in the PLS-DA model since that model provides maximum separation between such
amounts of classes (Eriksson et al. 2013). The parameters of all models developed are described
in Table 4.
Table 4. The multivariate models' parameters
№ Name Component Observations R2X(cum) R2Y(cum) Q2(cum)
1 PCA 3 1166 0.999 0.999
2 PLS 21 1166 1 0.799 0.788
3 PLS-DA 8 1166 1 0.845 0.844
The Coefficients plot in Figure 2, displays regression coefficients correlated to scaled and centred
X-variables (NIR-spectra) from all specimens in class After exposure. As the model is based on all
samples and their composition varies this means that correlations could not be related to a specific
treatments structure. However, some general conclusions can be drawn. Negative and positive
correlations were found indicating decreases and increases in presence of absorptions upon
weathering exposure, respectively. The negative high coefficients at the beginning of the NIR
spectra (lower wavelength) could be related to the VIS region and visible changes of colour on the
surface (Schwanninger et al. 2011). Although moisture was found in the specimen (Table 3),
typical strong water signal (around 1450 nm) have not been generated.
The observation of Coefficients plot for all classes in the PLS-DA model showed the strongest
correlation for wavelength around 1620 nm which may be related to C-H hydrocarbon chains
possibly in alkene groups (Workman and Weyer 2012; 2008). Class Dried after exposure had the
strongest positive correlation around wavelength 1403 nm that is close to absorptions originated
from methyl C-H absorptions associated with branched aliphatic hydrocarbon (Workman and
Weyer 2012; 2008).
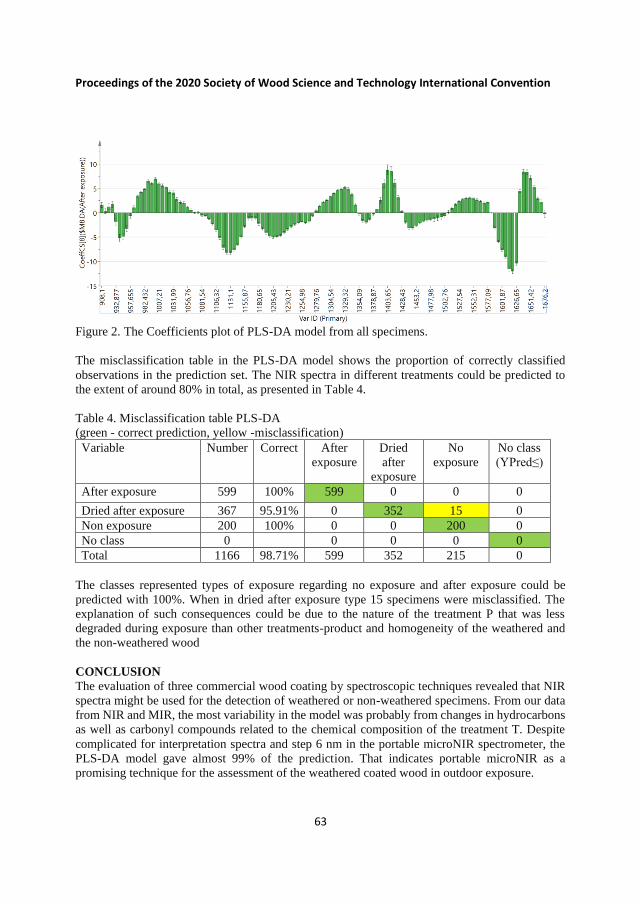
Proceedings of the 2020 Society of Wood Science and Technology International Convention
63
Figure 2. The Coefficients plot of PLS-DA model from all specimens.
The misclassification table in the PLS-DA model shows the proportion of correctly classified
observations in the prediction set. The NIR spectra in different treatments could be predicted to
the extent of around 80% in total, as presented in Table 4.
Table 4. Misclassification table PLS-DA
(green - correct prediction, yellow -misclassification)
Variable Number Correct After
exposure
Dried
after
exposure
No
exposure
No class
(YPred≤)
After exposure 599 100% 599 0 0 0
Dried after exposure 367 95.91% 0 352 15 0
Non exposure 200 100% 0 0 200 0
No class 0 0 0 0 0
Total 1166 98.71% 599 352 215 0
The classes represented types of exposure regarding no exposure and after exposure could be
predicted with 100%. When in dried after exposure type 15 specimens were misclassified. The
explanation of such consequences could be due to the nature of the treatment P that was less
degraded during exposure than other treatments-product and homogeneity of the weathered and
the non-weathered wood
CONCLUSION
The evaluation of three commercial wood coating by spectroscopic techniques revealed that NIR
spectra might be used for the detection of weathered or non-weathered specimens. From our data
from NIR and MIR, the most variability in the model was probably from changes in hydrocarbons
as well as carbonyl compounds related to the chemical composition of the treatment T. Despite
complicated for interpretation spectra and step 6 nm in the portable microNIR spectrometer, the
PLS-DA model gave almost 99% of the prediction. That indicates portable microNIR as a
promising technique for the assessment of the weathered coated wood in outdoor exposure.
Proceedings of the 2020 Society of Wood Science and Technology International Convention
64
ACKNOWLEDGEMENT
The acknowledgement by authors provided to the Swedish Research Council for the Environment
Agricultural Sciences and Spatial Planning, FORMAS (project number 419, 2017) and IPOS DP2
Vinnova for funding our research. Kempe foundation is gratefully acknowledged for financial
support.
REFERENCE
Eriksson, L, T Byrne, E Johansson, J Trygg, and C Vikström. 2013. Multi- and Megavariate
Data Analysis: Basic Principles and Applications.
Sandak, Anna, Jakub Sandak, and Roger Meder. 2016. 'Tutorial: Assessing Trees, Wood and
Derived Products with near Infrared Spectroscopy: Hints and Tips'. Journal of Near Infrared
Spectroscopy 24 (6): 485. https://doi.org/10.1255/jnirs.1255.
Schwanninger, Manfrred, José Rodrigues, Carlos, and Karin Fackler. 2011. 'A Review
of Band Assignments in near Infrared Spectra of Wood and Wood Components'. Journal of Near
Infrared Spectroscopy 19 (5): 287–308. https://doi.org/10.1255/jnirs.955.
Workman, Jerry, and Lois Weyer. 2008. Practical Guide to Interpretive Near-Infrared
Spectroscopy. Boca Raton: Taylor & Francis.
———. 2012. Practical Guide and Spectral Atlas for Interpretive Near-Infrared Spectroscopy.
2nd ed. Boca Raton ; London: CRC Press.
Biography

Department of Engineering Science and MathematicsDivision of Wood Science and Engineering
ISSN 1402-1544ISBN 978-91-7790-960-6 (print)ISBN 978-91-7790-961-3 (pdf )
Luleå University of Technology 2021SV
ANENMÄRKET
Trycksak3041 3042
Print: Lenanders Grafiska, 4570330