Effective population sizes and migration rates in fragmented populations of an endangered insect...
11
Journal of Animal Ecology 2007 76, 790–800 © 2007 The Authors. Journal compilation © 2007 British Ecological Society Blackwell Publishing Ltd Effective population sizes and migration rates in fragmented populations of an endangered insect (Coenagrion mercuriale: Odonata) PHILLIP C. WATTS, ILIK J. SACCHERI, STEPHEN J. KEMP and DAVID J. THOMPSON School of Biological Sciences, University of Liverpool, Liverpool, L69 7ZB, UK Summary 1. Effective population sizes (N e ) and migration rates (m) are critical evolutionary parameters that impact on population survival and determine the relative influence of selection and genetic drift. While the parameter m is well-studied in animal populations, N e remains challenging to measure and consequently is only rarely estimated, particularly in insect taxa. 2. We used demographic and genetic methods to estimate N e and m in a fragmented population of the endangered damselfly Coenagrion mercuriale to better understand the contrast between genetic and field estimates of these parameters and also to identify the spatial scale over which populations may become locally adapted. 3. We found a contrast between demographic- and genetic-based estimates of these parameters, with the former apparently providing overestimates of N e , owing to substantial underestimation of the variance in reproductive success, and the latter overestimating m, because spatial genetic structure is weak. 4. The overall N e of sites within the population network at Beaulieu Heath, the largest C. mercuriale site in the UK, was estimated to vary between approximately 60 and 2700. 5. While N e was not correlated with either the total numbers of adults (N) or the area of habitat, this parameter was always less than N, because of substantial variance in reproductive success. The ratio N e /N varied between 0·006 and 0·42 and was generally larger in smaller populations, possibly representing some ‘genetic compensation’. 6. From a simple genetic model and these data on N e and m, it seems that populations of C. mercuriale have the potential to respond to localized spatial variation in selection and this would need to be considered for future genetic management of this endangered species. Key-words: capture–mark–recapture, conservation, genetic drift, migration, N e . Journal of Animal Ecology (2007) 76, 790–800 doi: 10.1111/j.1365-2656.2007.01249.x Introduction Effective population sizes (N e ) and dispersal rates are fundamental evolutionary parameters that determine the spatial variation in allele frequencies as well as the efficacy of selection in shaping genomic architecture (Slatkin 1973, 1985; Nagylaki & Lucier 1980; Adkison 1995). Migration permits gene flow and re-colonization following local extinction and, accordingly, quantifying dispersal rates has received widespread attention (Slatkin 1985; Clobert et al . 2001; Hanski 2003), but field estimates of N e , the focus of this study, have been largely neglected. The concept of N e was introduced by Wright (1931) to predict the genetic properties of a finite population that meets the assumptions of random mating, constant population size and nonoverlapping generations (the Wright–Fisher model) (Fisher 1930; Wright 1931). In the absence of significant migration, selection or mutation, the allele frequencies of this ‘idealized’ population will vary among generations due Correspondence: Phill Watts, Marine and Freshwater Biology Research Group, The Biosciences Building, School of Biological Sciences, Liverpool University, Crown Street, Liverpool, L69 7ZB, UK. Tel.: +44(0)151 7954384. Fax: +44(0)151 7954404. E-mail: [email protected]
Transcript of Effective population sizes and migration rates in fragmented populations of an endangered insect...
Journal of Animal Ecology
2007
76
, 790–800
© 2007 The Authors.Journal compilation© 2007 British Ecological Society
Blackwell Publishing Ltd
Effective population sizes and migration rates in fragmented populations of an endangered insect (
Coenagrion mercuriale
: Odonata)
PHILLIP C. WATTS, ILIK J. SACCHERI, STEPHEN J. KEMP and DAVID J. THOMPSON
School of Biological Sciences, University of Liverpool, Liverpool, L69 7ZB, UK
Summary
1.
Effective population sizes (
N
e
) and migration rates (
m
) are critical evolutionaryparameters that impact on population survival and determine the relative influence ofselection and genetic drift. While the parameter
m
is well-studied in animal populations,
N
e
remains challenging to measure and consequently is only rarely estimated, particularlyin insect taxa.
2.
We used demographic and genetic methods to estimate
N
e
and
m
in a fragmentedpopulation of the endangered damselfly
Coenagrion mercuriale
to better understand thecontrast between genetic and field estimates of these parameters and also to identify thespatial scale over which populations may become locally adapted.
3.
We found a contrast between demographic- and genetic-based estimates of theseparameters, with the former apparently providing overestimates of
N
e
, owing to substantialunderestimation of the variance in reproductive success, and the latter overestimating
m
, because spatial genetic structure is weak.
4.
The overall
N
e
of sites within the population network at Beaulieu Heath, the largest
C. mercuriale
site in the UK, was estimated to vary between approximately 60 and 2700.
5.
While
N
e
was not correlated with either the total numbers of adults (
N
) or the areaof habitat, this parameter was always less than
N
, because of substantial variance inreproductive success. The ratio
N
e
/
N
varied between 0·006 and 0·42 and was generallylarger in smaller populations, possibly representing some ‘genetic compensation’.
6.
From a simple genetic model and these data on
N
e
and
m
, it seems that populationsof
C. mercuriale
have the potential to respond to localized spatial variation in selectionand this would need to be considered for future genetic management of this endangeredspecies.
Key-words
: capture–mark–recapture, conservation, genetic drift, migration,
N
e
.
Journal of Animal Ecology
(2007)
76
, 790–800 doi: 10.1111/j.1365-2656.2007.01249.x
Introduction
Effective population sizes (
N
e
) and dispersal rates arefundamental evolutionary parameters that determinethe spatial variation in allele frequencies as well asthe efficacy of selection in shaping genomic architecture(Slatkin 1973, 1985; Nagylaki & Lucier 1980; Adkison
1995). Migration permits gene flow and re-colonizationfollowing local extinction and, accordingly, quantifyingdispersal rates has received widespread attention(Slatkin 1985; Clobert
et al
. 2001; Hanski 2003), butfield estimates of
N
e
, the focus of this study, have beenlargely neglected. The concept of
N
e
was introduced byWright (1931) to predict the genetic properties of afinite population that meets the assumptions of randommating, constant population size and nonoverlappinggenerations (the Wright–Fisher model) (Fisher 1930;Wright 1931). In the absence of significant migration,selection or mutation, the allele frequencies of this‘idealized’ population will vary among generations due
Correspondence: Phill Watts, Marine and Freshwater BiologyResearch Group, The Biosciences Building, School of BiologicalSciences, Liverpool University, Crown Street, Liverpool, L697ZB, UK. Tel.: +44(0)151 7954384. Fax: +44(0)151 7954404.E-mail: [email protected]
791
Effective population size of Coenagrion mercuriale
© 2007 The Authors.Journal compilation© 2007 British Ecological Society,
Journal of Animal Ecology
,
76
, 790–800
to random sampling of gametes during reproduction;the amount of this genetic drift being inversely pro-portional to population size. Natural populationsseldom conform to the Wright–Fisher model and variousfactors reduce the number of reproductively successfulindividuals (i.e.
N
e
) below that of the total adult census(
N
) (Frankham 1995). This has widely recognizedconsequences for species’ conservation because it is
N
e
and not
N
that determines levels of inbreeding and therate of loss of genetic diversity, which are importantcorrelates of population persistence (Saccheri
et al
.1998; Spielman, Brook & Frankham 2004) and futureevolutionary potential (Franklin 1980).
Numerous demographic- and genetic-based methodshave been developed to calculate
N
e
(reviewed byNunney & Elam 1994; Wang & Caballero 1999; Wang2005) yet it remains challenging to quantify. For example,there are manifest difficulties associated with acquiringaccurate estimates of population fluctuations, sex ratioand variance in mating success (VMS), which are theprincipal factors that determine
N
e
. The corollary isthat most estimates of
N
e
are based on the frequenciesof genetic markers in populations, as these are aretrospective measure of all processes that determinethe successful breeders (but not the relative significanceof each demographic factor). Of the genetic methodsformulated to estimate
N
e
, such as the extent of temporalvariation in allele frequencies (Nei & Tajima 1981;Waples 1989; and others), linkage disequilibrium (Hill1981) or heterozygote excess (Pudovkin, Zaykin &Hedgecock 1996), the first is believed to have the greatestprecision and is the most frequently employed.
For species existing as a dynamic network of partiallyconnected patches (captured by the metapopulationparadigm, see Hanski 2003 for review) several issuesmay complicate estimation of
N
e
. First, the originalgenetic methods developed to calculate
N
e
assumethat populations are closed and this is often invalid;migration limits genetic divergence and this biasesestimates of
N
e
if not taken into account. For thisreason, new techniques have been derived that are ableto jointly estimate
N
e
and immigration rates (
m
)(Vitalis & Couvet 2001; Wang & Whitlock 2003) andthere are now several examples of the application ofthese techniques to characterize vertebrate populations(Wilson, Hutchings & Ferguson 2004; Jehle
et al
. 2005).Second, the effect of spatial genetic structure should beexamined, as the
N
e
of a structured population is afunction of the amount of subdivision. For instance,under an island model (populations exchange equalnumbers of migrants)
N
e
=
nN
eS
/(1 –
F
ST
), where
n
isthe number of subpopulations,
N
eS
is the effectivepopulation size of the subpopulations and
F
ST
is thestandardized variance in gene frequencies amongpopulations (Wright 1943; Wang & Caballero 1999).Accordingly, with increasing spatial structure it ispossible for the
N
e
of a metapopulation to be greaterthan that of a random mating population of equivalenttotal size (Nichols, Bruford & Groombridge 2001). The
alternative view that subdivision can reduce
N
e
(Whitlock & Barton 1997) highlights the point that theoverall
N
e
of a structured population depends on theparticular metapopulation dynamics.
With increasing population fragmentation throughanthropogenic habitat modification, predicting the long-term population viability of poorly known species fromtheir life history and other ecological characteristicsis clearly important. The parameters
N
e
and
m
certainlyimpact on population survival
per se
; however, theyalso inform on the relative influence of random geneticdrift, gene flow and selection (Slatkin 1973, 1985; Nagylaki& Lucier 1980; Adkison 1995). Hence, their quantifica-tion can be indicative of the potential for adaptivedivergence among populations, an understanding ofwhich affords a better practice of species’ conservationthat is able to recreate contemporary evolutionarypatterns and processes that is preferable to staticpreservation (Crandall
et al
. 2000; Stockwell, Hendry& Kinnison 2003). Invertebrates in particular arepoorly studied, and this is particularly true for analysesof
N
e
in insect populations (see also Thompson, Watts& Saccheri 2007). This deficiency is alarming as theyform a dominant functional group in many ecosystems,and some 800 species are in the IUCN (2006) red listdata book (excluding the least concern category).
In this paper we (1) quantify adult population sizes(
N
),
N
e
and
m
in a fragmented population matrix of theendangered damselfly
Coenagrion mercuriale
(Charpentier,1840) (Odonata: Zygoptera). We (2) contrast geneticand demographic methods of estimating the latter twoparameters, (3) examine whether there are simplecorrelates of
N
e
, such as habitat size or the numbers ofadults
per se
, and (4) use estimates of
N
e
and
m
to assesswhether local
C. mercuriale
populations are more likelyto be influenced by the action of selection or geneticdrift. We find that
N
e
is always less than the populationcensus (
N
), likely because of variance in family size,and that the ratio
N
e
/
N
varies considerably withpopulation size. Making accurate estimates of
m
inweakly differentiated systems remains challenging.These results are discussed with respect to conservationof
C. mercuriale
.
Materials and methods
Coenagrion mercuriale
is one of Europe’s most threat-ened damselflies, listed on Annex II of the EC HabitatsDirective and Appendix II of the Bern Convention andprotected within Europe as a whole and by specificlegislation in several countries. Within the UK a com-bination of poor dispersal capability (Hunger & Röske2001; Purse
et al
. 2003; Watts
et al
. 2004a, 2007;Rouquette & Thompson 2007a) and loss and fragmen-tation of its specific habitat has caused extinction ofmany populations, perhaps as many as 38% over thelast 21 years (Purse 2001). Nevertheless, several large
792
P. C. Watts
et al.
© 2007 The Authors.Journal compilation© 2007 British Ecological Society,
Journal of Animal Ecology
,
76
, 790–800
populations of this species remain in the UK, includingone on Beaulieu Heath where habitat management hasprevented population decline so far.
C. mercuriale
was sampled from Beaulieu Heath(50
°
47·8
′
N, 01
°
29·9
′
W) in southern England, UK. Thissite (4·6
×
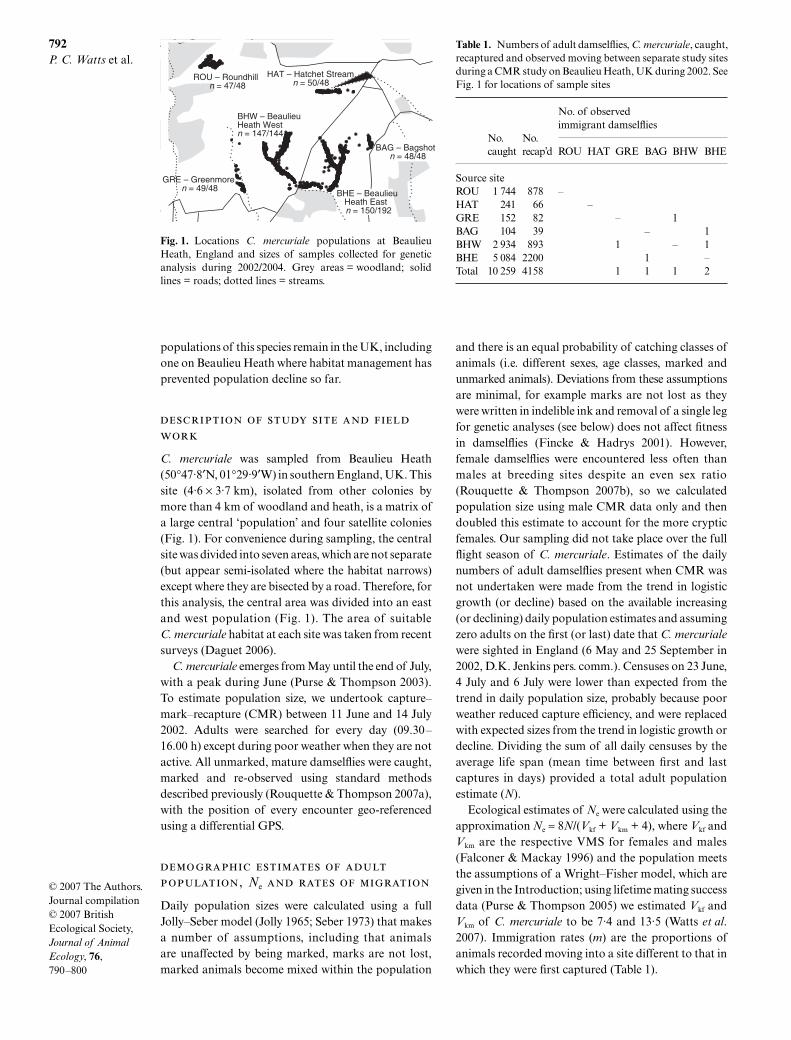
3·7 km), isolated from other colonies bymore than 4 km of woodland and heath, is a matrix ofa large central ‘population’ and four satellite colonies(Fig. 1). For convenience during sampling, the centralsite was divided into seven areas, which are not separate(but appear semi-isolated where the habitat narrows)except where they are bisected by a road. Therefore, forthis analysis, the central area was divided into an eastand west population (Fig. 1). The area of suitable
C. mercuriale
habitat at each site was taken from recentsurveys (Daguet 2006).
C. mercuriale
emerges from May until the end of July,with a peak during June (Purse & Thompson 2003).To estimate population size, we undertook capture–mark–recapture (CMR) between 11 June and 14 July2002. Adults were searched for every day (09.30–16.00 h) except during poor weather when they are notactive. All unmarked, mature damselflies were caught,marked and re-observed using standard methodsdescribed previously (Rouquette & Thompson 2007a),with the position of every encounter geo-referencedusing a differential GPS.
,
N
e
Daily population sizes were calculated using a fullJolly–Seber model (Jolly 1965; Seber 1973) that makesa number of assumptions, including that animalsare unaffected by being marked, marks are not lost,marked animals become mixed within the population
and there is an equal probability of catching classes ofanimals (i.e. different sexes, age classes, marked andunmarked animals). Deviations from these assumptionsare minimal, for example marks are not lost as theywere written in indelible ink and removal of a single legfor genetic analyses (see below) does not affect fitnessin damselflies (Fincke & Hadrys 2001). However,female damselflies were encountered less often thanmales at breeding sites despite an even sex ratio(Rouquette & Thompson 2007b), so we calculatedpopulation size using male CMR data only and thendoubled this estimate to account for the more crypticfemales. Our sampling did not take place over the fullflight season of
C. mercuriale
. Estimates of the dailynumbers of adult damselflies present when CMR wasnot undertaken were made from the trend in logisticgrowth (or decline) based on the available increasing(or declining) daily population estimates and assumingzero adults on the first (or last) date that
C. mercuriale
were sighted in England (6 May and 25 September in2002, D.K. Jenkins pers. comm.). Censuses on 23 June,4 July and 6 July were lower than expected from thetrend in daily population size, probably because poorweather reduced capture efficiency, and were replacedwith expected sizes from the trend in logistic growth ordecline. Dividing the sum of all daily censuses by theaverage life span (mean time between first and lastcaptures in days) provided a total adult populationestimate (
N
).Ecological estimates of
N
e
were calculated using theapproximation
N
e
≈
8
N
/(
V
kf
+ Vkm + 4), where Vkf andVkm are the respective VMS for females and males(Falconer & Mackay 1996) and the population meetsthe assumptions of a Wright–Fisher model, which aregiven in the Introduction; using lifetime mating successdata (Purse & Thompson 2005) we estimated Vkf andVkm of C. mercuriale to be 7·4 and 13·5 (Watts et al.2007). Immigration rates (m) are the proportions ofanimals recorded moving into a site different to that inwhich they were first captured (Table 1).
Fig. 1. Locations C. mercuriale populations at BeaulieuHeath, England and sizes of samples collected for geneticanalysis during 2002/2004. Grey areas = woodland; solidlines = roads; dotted lines = streams.
Table 1. Numbers of adult damselflies, C. mercuriale, caught,recaptured and observed moving between separate study sitesduring a CMR study on Beaulieu Heath, UK during 2002. SeeFig. 1 for locations of sample sites
No. caught
No. recap’d
No. of observed immigrant damselflies
ROU HAT GRE BAG BHW BHE
Source siteROU 1 744 878 –HAT 241 66 –GRE 152 82 – 1BAG 104 39 – 1BHW 2 934 893 1 – 1BHE 5 084 2200 1 –Total 10 259 4158 1 1 1 2
793Effective population size of Coenagrion mercuriale
© 2007 The Authors.Journal compilation© 2007 British Ecological Society, Journal of Animal Ecology, 76, 790–800
Full details of DNA extraction and genotyping aredescribed elsewhere (Watts et al. 2004a). DNA wasextracted from single legs that were removed frombetween 47 and 192 damselflies per sample during 2002and 2004 (Fig. 1), which represents a single generationinterval as C. mercuriale is semivoltine in the UK. Weobserved no significant effect of our sampling uponrecapture rate (D.J. Thompson unpublished). Everyindividual was genotyped at 14 unlinked microsatelliteloci: LIST4-002, LIST4-024, LIST4-034, LIST4-037,LIST4-062, LIST4-063, LIST4-023, LIST4-030, LIST4-031, LIST4-035, LIST4-042, LIST4-060, LIST4-066and LIST4-067 (Watts et al. 2004c; Watts, Thompson& Kemp 2004b).
Every population and the entire sample was tested fordeparture from expected Hardy–Weinberg equilibrium(HWE) conditions using the randomization procedure(5000 randomizations) implemented by ver. 2·9·3(Goudet 1995). This software was used to calculateexpected heterozygosities (He) and the level of geneticdifferentiation, FST (Weir & Cockerham 1984), throughoutthe study area, with 95% confidence intervals (95% CI)for FST made by bootstrapping over loci.
Temporal methods to estimate Ne are based on thepremise that the magnitude of temporal fluctuations inallele frequencies is directly related to Ne. Recentstatistical improvements on the original temporalmethods (e.g. Berthier et al. 2002; Wang & Whitlock2003) present a variety of techniques with which Ne
may be estimated. It is beyond the scope of this paper toexamine all of these, so we compared (1) Waples’s (1989)original method with (2) moment and (3) maximum-likelihood (ML) estimators derived by Wang & Whitlock(2003) as the former is still widely used and the lattertwo methods were developed to estimate Ne andimmigration rate (m) jointly, but may be applied tocalculate Ne of a closed population (note that Waples’method assumes that the population is isolated, acondition which is not met in this study; Table 1). Wang& Whitlock’s methods estimate Ne and m of a focalpopulation under the assumption that immigrants areprovided by an infinitely large source, but are robust todeviations from this model and may be applied to asource comprising one or more finite subpopulations.Here, source populations consisted of the pooled BeaulieuHeath genotypes after those of the focal populationhad been removed. NE ver. 1·3 (Peel, Ovenden& Peel 2004) was used to calculate Ne according toWaples (1989) and MN ver. 2·3 (Wang & Whitlock2003) was used to calculate Ne according to themoment and maximum-likelihood estimators of Wang& Whitlock. Ninety-five per cent confidence intervalsare calculated for the moment and ML methods ofWaples (1989) and Wang & Whitlock (2003), respectively.
Because many studies are limited to a single samplingseason, estimates of Ne were made using Hill’s (1981)LD method, implemented by NE (Peel et al.
2004), to provide some guide to its reliability. Nonrandomassociations between alleles at different loci (linkagedisequilibrium, LD) may arise through selection,migration, assortative mating and genetic drift. At neutralloci the degree of LD within an isolated Wright–Fisherpopulation is determined by genetic drift, such thatthe extent of association between alleles provides anestimate of Ne (Hill 1981).
Under a stepping-stone model of dispersal, whichis appropriate for C. mercuriale (Watts et al. 2004a,2007), several models of gene flow and selection(Slatkin 1973; Nagylaki & Lucier 1980; and others,reviewed by Slatkin 1985; Adkison 1995) can be used toassess the potential for local population adaptation.Briefly, adaptation is expected when two conditions arefulfilled. First, there is a ‘characteristic length’ ofspatial variation in allele frequencies due to gene flowand selection (lc) that is defined by lc = σ/√s, where σ isthe standard deviation of dispersal distances and s isthe strength of selection, and local adaptation cannotoccur if the direction of selection varies at distances lessthan lc (Slatkin 1973, 1985). Second, Nagylaki & Lucier(1980) demonstrated that the relative importance ofselection and genetic drift can be captured by the singleparameter where m is the migrationrate, s is the strength of selection and Ne is the effectivepopulation size. If the first condition is met, then localadaptation occurs when β >> 1, but not if β << 1 asselection is overwhelmed by the effects of geneticdrift. This approach is discussed in detail by Adkison(1995). We estimated lc using demographic and geneticestimates of dispersal distances (σ = 118 and 176 m,respectively, Watts et al. 2004a) and β, again using demo-graphic- and genetic-based estimates of Ne and m[calculated using Wang & Whitlock’s (2003) maximum-likelihood method]. Both lc and β were calculated fora range of selection coefficients (s) that varied from 0·1to 0·0001 to describe the influence of strong to weakselective pressure.
Results
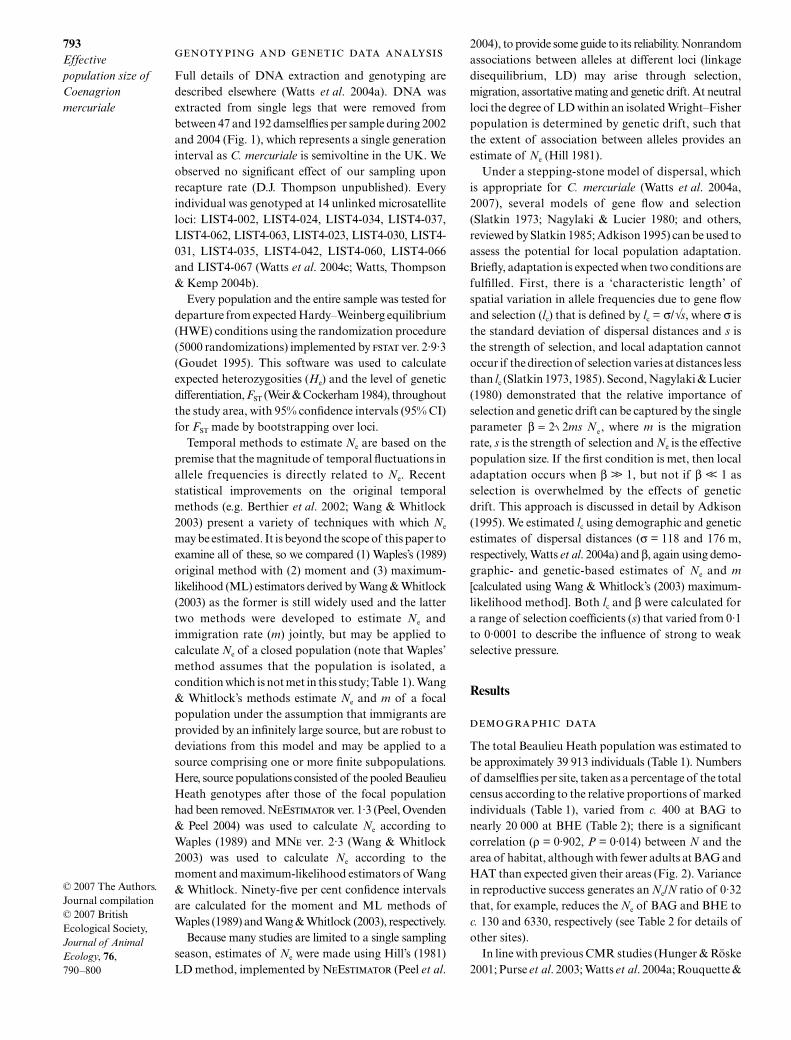
The total Beaulieu Heath population was estimated tobe approximately 39 913 individuals (Table 1). Numbersof damselflies per site, taken as a percentage of the totalcensus according to the relative proportions of markedindividuals (Table 1), varied from c. 400 at BAG tonearly 20 000 at BHE (Table 2); there is a significantcorrelation (ρ = 0·902, P = 0·014) between N and thearea of habitat, although with fewer adults at BAG andHAT than expected given their areas (Fig. 2). Variancein reproductive success generates an Ne/N ratio of 0·32that, for example, reduces the Ne of BAG and BHE toc. 130 and 6330, respectively (see Table 2 for details ofother sites).
In line with previous CMR studies (Hunger & Röske2001; Purse et al. 2003; Watts et al. 2004a; Rouquette &
β ,= 2 2ms Ne
794P. C. Watts et al.
© 2007 The Authors.Journal compilation© 2007 British Ecological Society, Journal of Animal Ecology, 76, 790–800
Thompson 2007a), C. mercuriale are sedentary, withjust over 75% of adults moving less than 100 m and95% of adults found within 300 m of their initial markposition (cumulative distance moved over all recaptures).The rate of intersite dispersal is low, involving just fiveindividuals (< 0·12% of the recaptures) that all movedto neighbouring areas. No immigration or emigrationwas recorded at ROU or HAT (Table 1) that are 2·2 and1·2 km from BHW, respectively. Thus, immigrationrates vary from zero (ROU, HAT) up to a maximumof c. 0·01 at the smallest site BAG where the singleimmigrant has a large influence on this parameter(Table 3).
Ten of the 168 sample-locus comparisons had asignificant heterozygote deficiency compared withexpected HWE conditions (P < 0·05 with a sequential
Bonferroni correction applied for k = 14 multiple testsper site, Rice 1989) (data not shown); four (LIST4-037,LIST4-042, LIST4-060 and LIST4-067) of these werepresent in the large BHE (2004) sample, while three(LIST4-034, LIST4-060 and LIST4-066) deficienciesoccurred in the small GRE (2004) sample. Threelocus-sample combinations had a significant (P < 0·05,k = 14) excess of heterozygotes. Departure fromrandom mating within sites is minimal and all loci wereretained for the analyses. The total Beaulieu Heathsample significantly deviates from expected HWE(P = 0·0002) and is therefore subdivided, consistentwith low migration rates. Average He was similar overall samples, varying from 0·55 (GRE, both samples) upto 0·58 (BHE 2004). While the level of genetic differen-tiation among populations is weak (FST = 0·005), theCIs exclude zero (±95% CI = 0·002, 0·009).
Full details of the estimates of Ne using the differentmethods are presented in Tables 2 and 3. Under the
Table 2. Estimates of the total numbers of adults (N) and effective population sizes (Ne) (±95% CI) of C. mercuriale at six siteson Beaulieu Heath, assuming that each population is isolated. Ne was estimated using several methods: E, ecological data onvariance in reproductive success (Falconer & Mackay 1996); L(WW), likelihood (Wang & Whitlock 2003); M(WW), moment (Wang& Whitlock 2003); LD, linkage disequilibrium (Hill 1981); M(Wp), moment (Waples 1989). Estimates of Ne were made for 2002(above) and 2004 (below) samples separately using the LD method (see Methods for details)
Site N
Ne
E L(WW) M(WW) LD M(Wp)
ROU 6 785 2171 ∞ (113–∞) ∞ 246 (117–∞) ∞ (102–∞)244 (115–∞)
HAT 938 300 146 (56–∞) 42 188 (100–936) 38 (17–135)85 (61–133)
GRE 591 189 ∞ (90–∞) 142 95 (65–162) 250 (38–∞)182 (97–950)
BAG 405 130 81 (39–2971) 81 8 (389–∞) 86 (25–∞)41 (32–53)
BHW 11 415 3653 236 (114–3892) 138 219 (168–307) 127 (58–447)2869 (613–∞)
BHE 19 779 6329 372 (168–∞) 122 1205 (501–∞) 321 (107–∞)4490 (839–∞)
Fig. 2. Variation in adult census size (N) (open circles) andeffective population size (Ne) (filled circles) with the area ofhabitat for six populations of C. mercuriale at Beaulieu Heath,England. Ne was estimated using the likelihood methodof Wang & Whitlock (2003) that jointly estimates Ne andimmigration rate (m).
Table 3. Joint estimates of the effective population sizes (Ne)and immigration rates (m) of six C. mercuriale populationscalculated using several methods: E, direct ecological obser-vations; L(WW), likelihood (Wang & Whitlock 2003); M(WW),moment (Wang & Whitlock 2003)
Site E L(WW) (±95% CI) M(WW)
ROU Ne 2171 2709 (89–∞) ∞m 0·0000 0·0058 (< 0·001–0·1945) 0·19
HAT Ne 300 59 (38–114) ∞m 0·0000 0·6199 (0·2677–1·0000) 0·76
GRE Ne 189 235 (66–∞) 1030m 0·0066 0·0902 (< 0·001–0·4248) 0·4581
BAG Ne 130 74 (38–405) –m 0·0096 0·7587 (0·1037–1·0000) –
BHW Ne 3653 101 (69–167) 749m 0·0003 0·3729 (0·1882–0·6262) 0·4566
BHE Ne 6329 123 (88–202) 322m 0·0004 0·3452 (0·1666–0·5924) 0·4062
795Effective population size of Coenagrion mercuriale
© 2007 The Authors.Journal compilation© 2007 British Ecological Society, Journal of Animal Ecology, 76, 790–800
assumption of a single population, Ne could not bederived using genetic data for some samples, notablyROU where only the LD method (Hill 1981) provideda finite value (Table 2). Total population sizes (N) andecological estimates of Ne were always greater thanthe corresponding genetic estimates of Ne. In manyinstances, larger populations tend to have correspondinglylarger Ne, but there are exceptions such as the HATpopulation that has a smaller Ne than GRE. Alltemporal genetic methods produced reasonably similarestimates of Ne for each population, which varied fromc.40 at BAG up to 372 at BHE (although only twosamples per method had finite upper 95% CIs). Estimatesof Ne made using the LD method were mostly similarbetween generations within site (except at BAG andBHW) and demonstrated a moderate agreement withthe temporal methods, but with the LD method alwaysgenerating larger estimates of Ne; this discrepancyincreases with N. LD-derived estimates of Ne variedfrom c.40 at BAG up to several thousand at BHE, withhalf of these estimates having finite upper CIs (Table 2).
For joint estimation of Ne and m, the values of Ne
produced by the ML estimator (Wang & Whitlock
2003) yielded similar, but always lower, results to thosemade assuming population isolation. Moreover, theML method generated estimates of Ne for all sixpopulations, with narrower CIs (and finite upper CIsfor four populations). All ML estimates of Ne are lessthan 250 except at ROU, which is an order of magnitudegreater (Ne = 2709). It appears therefore that when Ne
and m are jointly estimated the ML method outperformsthe moment estimator, which either produced (apparently)inflated estimates of Ne (which at GRE was larger thanN) or did not resolve a value for this parameter (threepopulations) (Table 3). There was no correspondencebetween any of the genetic or ecologically derived ratesof immigration (m), with the former tending to be veryhigh and with wide CIs (possibly except at ROU) andthe latter very low (Table 3).
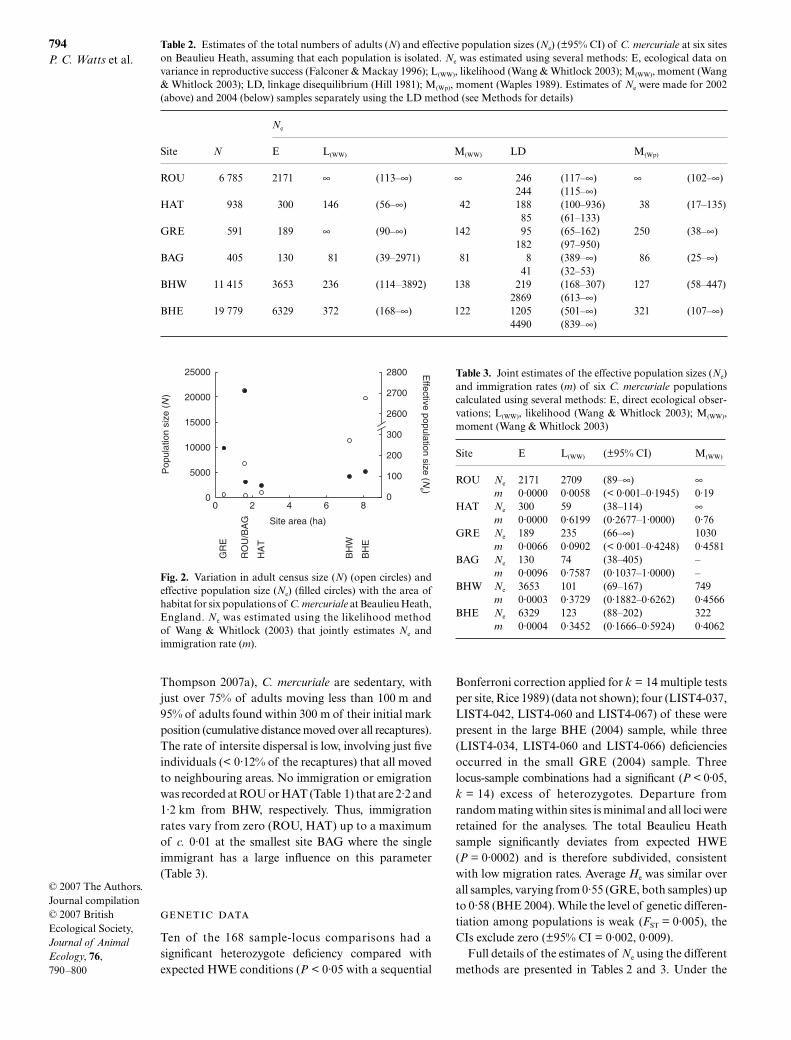
Except at ROU, the Ne/N ratios are all less than 1.When these values are plotted against population size,two features are evident. First, the ratio Ne/N tends todecline as N increases (where Ne was estimated using thelikelihood method of Wang & Whitlock (2003) that jointlyestimates Ne and m). Second, there is greater variabilityto these ratios in smaller populations (Fig. 3). Thus, Ne/N in small C. mercuriale populations falls between 0·04and 0·42 and in the two large colonies (c. 20 000 indi-viduals) from 0·006 up to 0·018. Consequently, there isno general relationship between genetically derivedestimates of Ne and either N or the habitable area (Fig. 2).
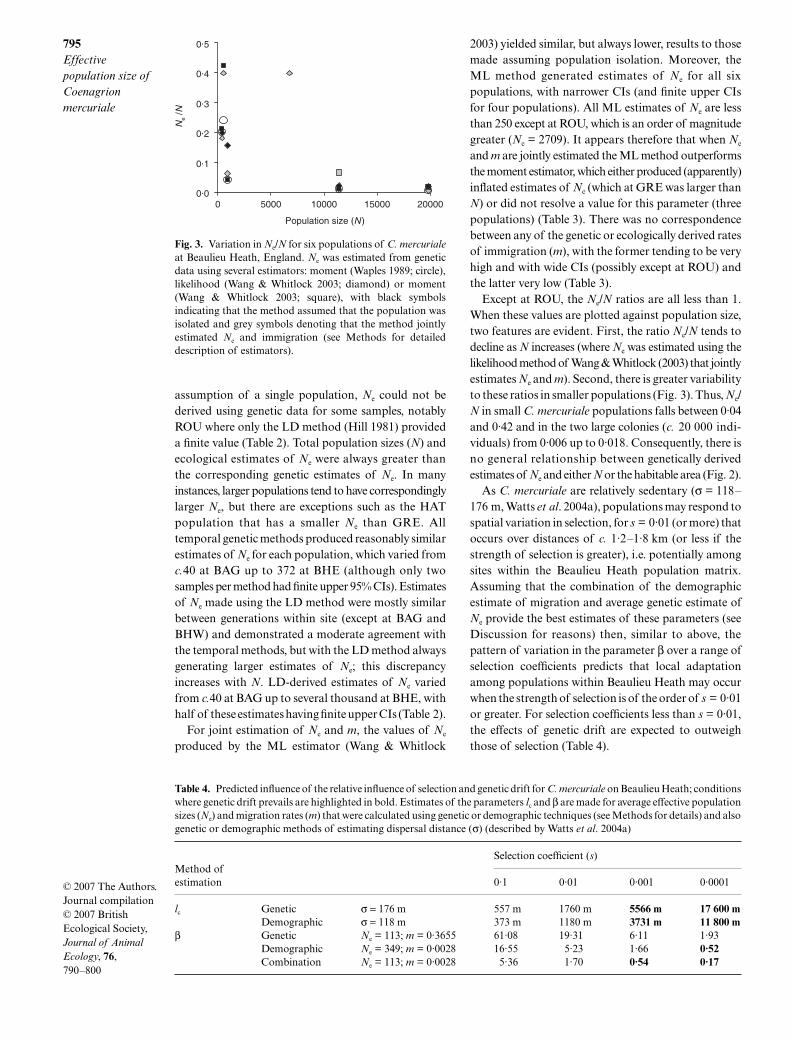
As C. mercuriale are relatively sedentary (σ = 118–176 m, Watts et al. 2004a), populations may respond tospatial variation in selection, for s = 0·01 (or more) thatoccurs over distances of c. 1·2–1·8 km (or less if thestrength of selection is greater), i.e. potentially amongsites within the Beaulieu Heath population matrix.Assuming that the combination of the demographicestimate of migration and average genetic estimate ofNe provide the best estimates of these parameters (seeDiscussion for reasons) then, similar to above, thepattern of variation in the parameter β over a range ofselection coefficients predicts that local adaptationamong populations within Beaulieu Heath may occurwhen the strength of selection is of the order of s = 0·01or greater. For selection coefficients less than s = 0·01,the effects of genetic drift are expected to outweighthose of selection (Table 4).
Fig. 3. Variation in Ne/N for six populations of C. mercurialeat Beaulieu Heath, England. Ne was estimated from geneticdata using several estimators: moment (Waples 1989; circle),likelihood (Wang & Whitlock 2003; diamond) or moment(Wang & Whitlock 2003; square), with black symbolsindicating that the method assumed that the population wasisolated and grey symbols denoting that the method jointlyestimated Ne and immigration (see Methods for detaileddescription of estimators).
Table 4. Predicted influence of the relative influence of selection and genetic drift for C. mercuriale on Beaulieu Heath; conditionswhere genetic drift prevails are highlighted in bold. Estimates of the parameters lc and β are made for average effective populationsizes (Ne) and migration rates (m) that were calculated using genetic or demographic techniques (see Methods for details) and alsogenetic or demographic methods of estimating dispersal distance (σ) (described by Watts et al. 2004a)
Method ofestimation
Selection coefficient (s)
0·1 0·01 0·001 0·0001
lc Genetic σ = 176 m 557 m 1760 m 5566 m 17 600 mDemographic σ = 118 m 373 m 1180 m 3731 m 11 800 m
β Genetic Ne = 113; m = 0·3655 61·08 19·31 6·11 1·93Demographic Ne = 349; m = 0·0028 16·55 5·23 1·66 0·52Combination Ne = 113; m = 0·0028 5·36 1·70 0·54 0·17
796P. C. Watts et al.
© 2007 The Authors.Journal compilation© 2007 British Ecological Society, Journal of Animal Ecology, 76, 790–800
Discussion
Despite its evolutionary significance there are still fewdemographic estimates of Ne in animal populations,and fewer studies that jointly estimate Ne and m. Weemploy ecological and genetic methods to provide thefirst estimates of Ne and m in an endangered insect. Themain results of this study are (1) substantial discrepanciesbetween methods of estimating of Ne; (2) Ne is lowerthan the adult census, particularly in large populations;and (3) C. mercuriale populations are potentially ableto respond to selection at small spatial scales.
Ne is a convenient summary parameter that linksdemographic and population genetic processes. Demo-graphic estimates of Ne are expected to be imprecisedue to the inherent difficulties associated with fieldworkand also because they are based on predicted conse-quences of complex population processes. Like manyother studies our ecological estimates of Ne incorporatedone factor (VMS) only, so it is not surprising that theyare greater than genetic estimates of Ne (Table 2). Ouranalysis indicates that VMS is an important determinantof Ne, reducing Ne to a third that of the adult popula-tion; examination of Banks & Thompson’s (1985) datain the congener Coenagrion puella produces a similarNe/N ratio of 0·26. These values may be typical forother odonates, where substantial variation in matingsuccess is common (Fincke 1982; Michiels & Dhondt1991; Stoks 2000; Fincke & Hadrys 2001). CaptiveBicyclus anynana (Lepidoptera) populations had anNe/N ratio of c. 0·6 (Brakefield et al. 2001), twice thatestimated for Coenagrion sp., but we can only speculatewhether this discrepancy reflects taxonomic differencesor a contrast between natural and artificial environments.As genetic estimates of Ne encompass all factors affectingreproductive success they should provide more accu-rate estimates than demographic ones. However, manyof the genetic-based estimates of Ne did not have a finiteupper 95% CI, so it is possible that the genetic pointestimates of Ne are not precise. A potential source ofimprecision for this and many studies may be the smallsampling interval (here, a single generation), such thatthere is a greater effect of sampling relative to drift.None the less, if we accept there is a consistent differencebetween genetic and ecological estimates of Ne, then itis relevant to ask: what processes reduce the geneticestimates Ne below their ecological counterparts?Rouquette & Thompson (2007b) uncovered an equalsex ratio in C. mercuriale populations and our samplingcovered a single generation, so the principal factormust be greater VMS than predicted. This is intuitiveas VMS was estimated from one component of overallVMS, lifetime mating success (Purse & Thompson2005), and other factors, such as variation in fecundityand egg viability, sperm competition and survivorshipof offspring (Fincke & Hadrys 2001), will increase
VMS further; this discrepancy was observed also innatterjack toads (Rowe & Beebee 2004). To providecontext to the magnitude of these processes, variance infamily size (Vk, averaged over both sexes) would have tobe at least an order of magnitude greater to make ourdemographic and genetic estimates of Ne comparable(Vk between c. 100 and 660 to generate Ne/N ratios of0·06–0·006, respectively). Disentangling the importanceof these processes remains a nontrivial, but significantchallenge to understanding components of fitness.
Few studies estimate Ne using single generationsamples, possibly because of a perceived imprecisionassociated with the LD method (e.g. Frankham 1995;Ardren & Kapuscinski 2003). England et al. (2006)found that the LD method was biased when samplesizes were smaller than the Ne, likely because of linkagedisequilibrium caused during sampling. With this inmind we note that while the LD and temporal estimateswere reasonably congruent, they were not significantlycorrelated. To some extent this is expected as alternativemethods of estimating Ne determine this parameterover different time-scales: the LD method infers short- tomedium-term (depending on the extent of linkage amongmarkers) mean Ne, and temporal methods estimatean average over the sampling period. Encouragingly,the LD method provided estimates of Ne that were con-sistent among generations within sites, with narrow CIsin the small populations. However, the method wasimprecise (compared with temporal methods) at thelarger sites, presumably because the signal of LD isgenuinely weaker or larger sample sizes reduced samplingeffects (see England et al. 2006). Further evaluations ofthe LD method would be useful as it has the clear benefitof providing single generation estimates of Ne.
Estimates of Ne differed between temporal methods,similar to other studies (e.g. Rowe & Beebee 2004).Simulations suggest that moment-based estimates arebiased upwards, particularly when genetic drift isstrong (Berthier et al. 2002; Tallmon, Luikart & Beau-mont 2004). This was not observed when populationswere assumed to be isolated (Table 2) but was evidentunder the more appropriate model that estimated Ne
and m jointly (Table 3). In the absence of methods tojointly estimate Ne and m, there were two pragmaticoptions to meet the assumption of closed populationswhen estimating Ne: (1) consider a particularly isolatedsite, or (2) assume that migration is unimportant.Given the former, estimates of Ne may reflect thedemographics of atypical populations rather than thedynamic processes characteristic of most populations.With respect to the latter, we find that using an unbiasedML estimator and the model that (appropriately)accounts for immigration generated consistently lowervalues of Ne with narrower 95% CIs (cf. Tables 2 and 3),compatible with increased precision. Although the MLestimates do not differ significantly between models ofisolation and immigration (they possess overlappingCIs) it is evident that overlooking the effect of migrationupwardly biases estimates of Ne, which is consistent
797Effective population size of Coenagrion mercuriale
© 2007 The Authors.Journal compilation© 2007 British Ecological Society, Journal of Animal Ecology, 76, 790–800
with the predicted short-term consequences of geneflow (Wang 2005).
Principally following Frankham’s (1995) reviewthere has been substantial interest in quantifying therange of Ne/N across taxa and under different demo-graphic and environmental conditions. In C. mercuriale,this ratio varies from 0·006 to 0·4 that is lower thanmost values reported by Frankham (1995) for insects(17 studies), except the seaweed fly Coelopa frigida (Ne/N = 0·0047 and 0·0009); subsequent estimates of Ne/Nin insect populations varied between 0·098 and 0·491(mean = 0·21) for a beetle (Ingvarsson & Olsson 1997).Thus, there are still too few data to evaluate whethercertain insect taxa or life histories have characteristicNe/N ratios. Frankham (1995) reported a mean Ne/N of0·1 for animals and this value has become a ‘rule ofthumb’ to predict population genetic properties in theabsence of specific data. Although the extent to whichthis value is an artefact is unclear (e.g. Waples 2002),our data indicate that the general use of this value willbe misleading as the ratio Ne/N varies substantiallyamong populations within a species (Fig. 3). Thispattern, also reported for vertebrates (Ardren &Kapuscinski 2003; Rowe & Beebee 2004; Jehle et al.2005), is indicative of heterogeneity in the factors thatdetermine the successful breeding population thatleads to a reduction in the rate of genetic erosion insmaller populations termed ‘genetic compensation’.Ardren & Kapuscinski (2003) suggested this to be aconsequence of a reduction in VMS in smaller popu-lations, though we are not aware of any ecologicalstudies that have tested this hypothesis.
A feature of population structure is its effect on Ne
compared with a panmictic population of equivalentsize. For example, if all subpopulations contributeequally to the next generation then the overall metap-opulation Ne may be increased by a factor of 1/(1 – FST)(Wright 1943; Wang & Caballero 1999). Two commentsare appropriate. First, the level of population subdivi-sion at Beaulieu Heath is weak (FST = 0·005, seeResults), implying that it has little impact on Ne.Second, this (island) model may be inappropriate asthere are substantial differences in size and immigra-tion rates among sites. None the less, using a differentapproach, Nichols et al. (2001) concluded thatpopulation subdivision may help retain diversity. Con-versely, Whitlock & Barton (1997) argued that patternsof extinction–recolonization and interpopulationreproductive variance will tend to increase the loss ofgenetic diversity in metapopulations. On the one hand,substantial reproductive variance among BeaulieuHeath subpopulations points to an overall reductionin Ne, yet this variance among sites (Fig. 3) can beinterpreted as implying that fewer individuals in thelarge populations would be ‘wasted’ if they existed insmaller subpopulations.
Ecological estimates of dispersal may be biased down-wards because of limited spatio-temporal sampling(Koenig, van Vuren & Hooge 1996) or movement byunsampled life stages (Mallet 1986; Wilson et al. 2004).Conversely, field surveys will overestimate gene flowwhen immigrants fail to reproduce. Our data apparentlyare in line with the former (Table 3), but it should beemphasized that: (1) the CMR fieldwork was intensive;(2) pre-reproductive movement by C. mercuriale isconsidered unlikely (Watts et al. 2004a); and (3) studiesat other sites confirm that the dispersal capability ofadult C. mercuriale is less than the spatial scale of theBeaulieu Heath metapopulation (Hunger & Röske2001; Purse et al. 2003; Watts et al. 2004a; Rouquette &Thompson 2007a). We cannot exclude the possibilityof ‘temporal’ migration, whereby larvae delay meta-morphosis for a year and recruit to a different cohort(i.e. one that is not its own generation) (see Watts et al.2005), nor some unrecognized movement. However,the discrepancy between demographic- and genetic-basedestimates of m arises because the latter method pro-duces estimates that are far too large to be realistic.Inflated estimates of migration rates using this andrelated methods have been observed by other studiesthat jointly estimated Ne and m (Wilson et al. 2004;Jehle et al. 2005) and are a likely consequence of weakspatial genetic structure (Wang & Whitlock 2003).
C. mercuriale populations are liable to fine-scalegenetic differentiation (Watts et al. 2004a, 2005, 2006).While high values of FST are relatively easy to interpretin terms of barriers to dispersal, where spatial structureis weak it can be difficult to disentangle contemporarygene flow from the residual historic component. Lowvalues of FST among the Beaulieu Heath sites mayindicate high reproductive success of the few migrants(failure to breed would accelerate population diver-gence) or episodic migration that was not observedduring the temporal confines of our single season ofCMR. Clearly, the former is speculative; however, non-equilibrium genetic structure is commonly suggestedto confound analyses of spatial genetic structure. Here,nonequilibrium conditions seem likely, as the numberof effective migrants (Nem) estimated from Wright’s(1931) approximation FST ≈ 1/(4Nem + 1) is at least anorder of magnitude greater than that calculated usinggenetic and demographic estimates of the parametersNe and m (cf. Table 3).
Present conservation policy for C. mercuriale in theUK is based on habitat restoration and subsequentmanagement, but will this be sufficient to ensurelong-term viability? An adult census at BeaulieuHeath, a reasonable indicator of population health(O’Grady et al. 2004), reveals a large and presumablyvigorous population, yet Ne is substantially less than
798P. C. Watts et al.
© 2007 The Authors.Journal compilation© 2007 British Ecological Society, Journal of Animal Ecology, 76, 790–800
this. Quantifying Ne is important as it determinesthe rate of loss of genetic diversity. As it is difficult tomeasure, identification of factors that influenceor correlate with Ne, such as the habitat area (e.g.Shrimpton & Heath 2003 for salmonids), would beuseful for conservation management. However, at leastfor C. mercuriale on Beaulieu Heath, Ne is not a simplefunction of either N or the area of suitable habitat(Fig. 2). We did observe that sites varied by an orderof magnitude in their population densities fromc. 4200 ha–1 at ROU down to c. 240 and 380 ha–1 at BAGand HAT, the two sites with the lowest Ne. While thisindicates that these latter two sites are suboptimal,there is presently no significant reduction in genediversity (He) at present. Projecting forward, theisolated ROU site should be capable of maintainingreasonable levels of variability because of its large Ne.By contrast, there should be some concern for the otherisolated colony HAT which has the lowest Ne (= 59)and the highest rate of genetic erosion. Connectivitybetween BAG, GRE, BHE and BHW may limit loss ofdiversity, depending upon the reproductive successesof migrants. Guidelines to maintain Ne > 50 tominimize the immediate effects of inbreeding andensure short-term survival and Ne > 500–5000 topermit adaptation to future environmental conditions(Franklin 1980; Lande 1995), apparently raise concernfor the long-term survival of the Beaulieu Heathmetapopulation (see Table 3) and, moreover, as it is thestrongest C. mercuriale population in the UK, theremaining other UK colonies that almost certainlyhave lower Ne.
Certain insect populations may persist in the face ofextremely low genetic diversity (e.g. Joyce & Pullin2003), including C. mercuriale (Watts et al. 2006), so itis possible that in some species typified by generally lowNe/N ratios, a lack of genetic diversity per se has lessimpact on population survival than extrinsic factorssuch as habitat loss and environmental fluctuations.Alternatively, these studies may simply serve to high-light the lack of correspondence between diversity atneutral genetic markers and adaptive traits (Reed &Frankham 2001). An increasing number of studieshave uncovered inbreeding in wild populations (Keller& Waller 2002), but for most natural populations wecan only speculate on whether low Ne has led toinbreeding depression. Where inbreeding is suspectedsome type of genetic augmentation may be advised, butan uncritical addition of migrants may reduce fitnessthrough hybridization of genomes that are adaptedto different conditions. Thus, in any attempt to limitdiversity loss in small C. mercuriale populations bytranslocations, a key issue would be to identify thepotential for local adaptation. With this in mind, asimple model predicts that populations of C. mercurialeseparated by as little as 1·8 km (or less, depending uponthe strength of selection) could be locally adapted inresponse to spatial variation in selection coefficients ofs = 0·01. While this may seem counter intuitive – small
Ne should limit effectiveness of selection – a rapidresponse to selection has been demonstrated in aspecies with small Ne (Koskinen, Haugen & Primmer).Of course, this is conjecture at present, as we haveneither characterized any adaptive traits, nor spatialvariation in strength and direction of selection. Withoutquantifying fitness components we cannot predict forhow long a population will remain viable or indeedwhether it would benefit from introduction of newgenetic material. Habitat management is undoubtedlya key component of population survival for insects, butwe must further examine the relationship between Ne
and m and fitness components in natural populations ifwe are to do more than speculate about the possiblebenefits or costs of genetic restoration for insectpopulations with low genetic diversities.
Acknowledgements
C. mercuriale is protected under Schedule 5 of theWildlife & Countryside Act (1981). All work wascarried out under licence from English Nature. Weare grateful to the NERC (grant no. NER/A/S/2000/01322) who provided the funds which enabled the workto proceed. We thank all those involved in the CMRstudies for their help. Ian Harvey wrote the programthat performed the scaling procedure that estimatedthe VMS.
References
Adkison, M.D. (1995) Population differentiation in Pacificsalmon: local adaptation, genetic drift, or the environment?Canadian Journal of Fisheries and Aquatic Sciences, 52,2762–2777.
Ardren, W. & Kapuscinski, A.R. (2003) Demographic andgenetic estimates of effective population size (Ne) revealsgenetic compensation in steelhead trout. MolecularEcology, 12, 35–49.
Banks, M.J. & Thompson, D.J. (1985) Lifetime matingsuccess in the damselfly Coenagrion puella. Animal Behaviour,33, 1175–1183.
Berthier, P., Beaumont, M.A., Cornuet, J.-M. & Luikart, G.(2002) Likelihood-based estimation of the effective popu-lation size using temporal changes in allele frequencies: agenealogical approach. Genetics, 160, 741–751.
Brakefield, P.M., El Filali, E., Van der Laan, R., Breuker, C.J.,Saccheri, I.J. & Zwaan, B. (2001) Effective population size,reproductive success and sperm precedence, the butterfly,Bicyclus anynana, in captivity. Journal of EvolutionaryBiology, 14, 148–156.
Clobert, J., Danchin, E., Dhondt, A.A. & Nichols, J.D. (2001)Dispersal. Oxford University Press, New York.
Crandall, K.A., Bininda-Emonds, O.R.P., Mace, G.M. &Wayne, R.K. (2000) Considering evolutionary processes inconservation biology. Trends in Ecology and Evolution, 15,290–295.
Daguet, C. (2006) Condition Assessment of the SouthernDamselfly. Coenagrion mercuriale feature on Special Areasof Conservation (SACs) and Sites of Special ScientificInterest (SSSIs) in England, Vol. 1: Main Report. EnglishNature, Shrewsbury.
England, P.R., Cornuet, J.M., Berthier, P., Tallmon, D.A. &Luikart, G. (2006) Estimating effective population size

799Effective population size of Coenagrion mercuriale
© 2007 The Authors.Journal compilation© 2007 British Ecological Society, Journal of Animal Ecology, 76, 790–800
from linkage disequilibrium: severe bias in small samples.Conservation Genetics, 7, 303–308.
Falconer, D.S. & Mackay, T.F.C. (1996) Introduction toQuantitative Genetics, 4th edn. Longman, Harlow.
Fincke, O.M. (1982) Lifetime mating success in a naturalpopulation of the damselfly, Enallagma hageni (Walsh)(Odonata, Coenagrionidae). Behavioral Ecology and Socio-biology, 10, 293–302.
Fincke, O.M. & Hadrys, H. (2001) Unpredictable offspringsurvivorship in the damselfly, Megaloprepus coerulatus,shapes parental behavior, constrains sexual selection, andchallenges traditional fitness estimates. Evolution, 55, 762–772.
Fisher, R.A. (1930) The Genetical Theory of Natural Selection.Clarendon Press, Oxford.
Frankham, R. (1995) Effective population size/adult populationsize ratios in wildlife: a review. Genetical Research, 66, 95–107.
Franklin, I.R. (1980) Evolutionary change in small popu-lations. Conservation Biology: an Evolutionary-EcologicalPerspective (eds M.E. Soulé & B.A. Wilcox), pp. 135–149.Sinauer, Sunderland, MA.
Goudet, J. (1995) FSTAT, Version 1·2: a computer program tocalculate F-statistics. Journal of Heredity, 86, 485–486.
Hanski, I. (2003) Metapopulation Ecology. Oxford UniversityPress, Oxford.
Hill, W.G. (1981) Estimation of effective population size fromdata on linkage disequilibrium. Genetical Research, 38,209–216.
Hunger, H. & Röske, W. (2001) Short-range dispersal of thesouthern damselfly (Coenagrion mercuriale: Odonata)defined experimentally using UV fluorescent ink. ZeitschriftFur Okologie und Naturshutz, 9, 181–187.
Ingvarsson, P.K. & Olsson, K. (1997) Hierarchical geneticstructure and effective population sizes in Phalacrussubstriatus. Heredity, 79, 153–161.
IUCN (2006) www.iucnredlist.orgJehle, R., Wilson, G.A., Arntzen, J.W. & Burke, T. (2005)
Contemporary gene flow and the spatio-temporal geneticstructure of subdivided newt populations (Triturus cristatus,T. marmoratus). Journal of Evolutionary Biology, 18, 619–628.
Jolly, G.M. (1965) Explicit estimates from capture–recapturedata with both death and immigration – stochastic model.Biometrika, 52, 225–247.
Joyce, D.A. & Pullin, A.S. (2003) Conservation implicationsof the distribution of genetic diversity at different scales: acase study using the marsh fritillary butterfly (Euphydryasaurinia). Biological Conservation, 114, 453–461.
Keller, L.F. & Waller, D.M. (2002) Inbreeding effects in wildpopulations. Trends in Ecology and Evolution, 17, 230–241.
Koenig, W.D., van Vuren, D. & Hooge, P.N. (1996)Detectability, philopatry and the distribution of dispersaldistances in vertebrates. Trends in Ecology and Evolution,11, 514–517.
Koskinen, M.T., Haugen, T.O. & Primmer, C.R. (2002)Contemporary fisherian life-history evolution in smallsalmonid populations. Nature, 419, 826–830.
Lande, R. (1995) Mutation and conservation. ConservationBiology, 9, 782–791.
Mallet, J. (1986) Dispersal and gene flow in a butterfly withhome range behaviour: Heliconis erato (Lepidoptera:Nymphalidae). Oecologia, 68, 210–217.
Michiels, N.K. & Dhondt, A.A. (1991) Sources of variation inmale mating success and female oviposition rate in a non-territorial dragonfly. Behavioural Ecology and Sociobiology, 29,17–25.
Nagylaki, T. & Lucier, B. (1980) Numerical analysis ofrandom drift in a cline. Genetics, 94, 497–517.
Nei, M. & Tajima, F. (1981) Genetic drift and estimation ofeffective population size. Genetics, 98, 625–640.
Nichols, R.A., Bruford, M.W. & Groombridge, J.J. (2001)Sustaining genetic variation in a small population: evidencefrom the Mauritius kestrel. Molecular Ecology, 10, 593–602.
Nunney, L. & Elam, D.R. (1994) Estimating the effectivepopulation size of conserved populations. ConservationBiology, 8, 175–184.
O’Grady, J., Reed, D.H., Brook, B.W. & Frankham, R. (2004)What are the best correlates of predicted extinction risk?Biological Conservation, 118, 513–520.
Peel, D., Ovenden, J.R. & Peel, S.L. (2004) Neestimator:Software for Estimating Effective Population Size, Version1·3. Queensland Government, Department of PrimaryIndustries and Fisheries.
Pudovkin, A.I., Zaykin, D.V. & Hedgecock, D. (1996) On thepotential for estimating the effective number of breedersfrom heterozygote-excess in progeny. Genetics, 144, 383–387.
Purse, B.V. (2001) The ecology and conservation of theSouthern Damselfly (Coenagrion mercuriale). PhD Thesis,University of Liverpool. Liverpool.
Purse, B.V. & Thompson, D.J. (2003) Emergence of the dam-selfies Coenagrion mercuriale (charpentier) and Ceriagriontenellum (villers) (Odonata: Coenagrionidae) at theirnorthern range margins in Britain. European Journal ofEntomology, 100, 93–99.
Purse, B.V. & Thompson, D.J. (2005) Lifetime mating successin a marginal population of a damselfly, Coenagrionmercuriale. Animal Behaviour, 69, 1303–1315.
Purse, B.V., Hopkins, G.W., Day, K.J. & Thompson, D.J.(2003) Dispersal characteristics and management of a raredamselfly. Journal of Applied Ecology, 40, 716–728.
Reed, D.H. & Frankham, R. (2001) How closely correlatedare molecular and quantitative measures of geneticvariation? A meta-analysis. Evolution, 55, 1095–1103.
Rice, W.R. (1989) Analyzing tables of statistical tests.Evolution, 43, 223–225.
Rouquette, J.R. & Thompson, D.J. (2007a) Patterns ofmovement and dispersal in an endangered damselfly.Journal of Applied Ecology, 44, 692–701.
Rouquette, J.R. & Thompson, D.J. (2007b) Roosting siteselection in the endangered damselfly, Coenagrion mercuriale,and implications for habitat design. Journal of InsectConservation, 11, 187–193.
Rowe, G. & Beebee, T.J.C. (2004) Reconciling genetic anddemographic estimators of effective population size in theanuran amphibian Bufo calamita. Conservation Genetics, 5,287–298.
Saccheri, I., Kuussaari, M., Kankare, M., Vikman, P.,Fortelius, W. & Hanski, I. (1998) Inbreeding and extinctionin a butterfly metapopulation. Nature, 392, 491–494.
Seber, G.A.F. (1973) The Estimation of Animal Abundance andRelated Parameters. Griffin, London.
Shrimpton, J.M. & Heath, D.D. (2003) Census vs. effectivepopulation size in chinook salmon: large- and small-scaleenvironmental perturbation effects. Molecular Ecology, 12,2571–2583.
Slatkin, M. (1973) Gene flow and selection in a cline. Genetics,75, 733–756.
Slatkin, M. (1985) Gene flow in natural populations. AnnualReview of Ecology and Systematics, 16, 393–430.
Spielman, D., Brook, B.W. & Frankham, R. (2004) Mostspecies are not driven to extinction before genetic factorsimpact them. Proceedings of the National Academy of Sciences,USA, 101, 15261–15264.
Stockwell, C.A., Hendry, A.P. & Kinnison, M.T. (2003)Contemporary evolution meets conservation biology.Trends in Ecology and Evolution, 18, 94–101.
Stoks, R. (2000) Components of lifetime mating success andbody size in males of a scrambling damselfly. AnimalBehaviour, 59, 339–348.
800P. C. Watts et al.
© 2007 The Authors.Journal compilation© 2007 British Ecological Society, Journal of Animal Ecology, 76, 790–800
Tallmon, D.A., Luikart, G. & Beaumont, M.A. (2004)Comparative evaluation of a new effective population sizeestimator based on approximate Bayesian computation.Genetics, 167, 977–988.
Thompson, D.J., Watts, P.C. & Saccheri, I.J. (2007) Con-servation genetics for insects. Insect Conservation Biology(eds A.J.A. Stewart, T.R. New & O.T. Lewis), pp. 280–300.CABI Publishing, Wallingford.
Vitalis, R. & Couvet, D. (2001) Estimation of effectivepopulation size and migration rate from one- and two-locusidentity measures. Genetics, 157, 911–925.
Wang, J.L. (2005) Estimation of effective population sizesfrom data on genetic markers. Philosophical Transactions ofthe Royal Society of London, B, 360, 1395–1409.
Wang, J.L. & Caballero, A. (1999) Developments in predictingthe effective size of subdivided populations. Heredity, 82,212–226.
Wang, J.L. & Whitlock, M.C. (2003) Estimating effectivepopulation size and migration rates from genetic samplesover space and time. Genetics, 163, 429–446.
Waples, R.S. (1989) A generalised approach for estimatingeffective population size from temporal changes in allelefrequency. Genetics, 121, 379–391.
Waples, R.S. (2002) Definition and estimation of effectivepopulation size in the conservation of endangered species.Population Viability Analysis (eds S.R. Beissinger & D.R.McCullough), pp. 147–168. University of Chicago Press,Chicago, IL.
Watts, P.C., Rouquette, J.R., Saccheri, I.J., Kemp, S.J. &Thompson, D.J. (2004a) Molecular and ecological evidencefor small-scale isolation by distance in an endangereddamselfly, Coenagrion mercuriale. Molecular Ecology, 13,2931–2945.
Watts, P.C., Thompson, D.J. & Kemp, S.J. (2004b) Cross-species amplification of microsatellite loci in some European
zygopteran species (Odonata: Coenagrionidae). InternationalJournal of Odonatology, 7, 87–96.
Watts, P.C., Wu, J.H., Westgarth, C., Thompson, D.J. &Kemp, S.J. (2004c) A panel of microsatellite loci for theSouthern Damselfly, Coenagrion mercuriale (Odonata:Coenagrionidae). Conservation Genetics, 5, 117–119.
Watts, P.C., Kemp, S.J., Saccheri, I.J. & Thompson, D.J.(2005) Conservation implications of genetic variationbetween spatially and temporally distinct colonies of thedamselfly Coenagrion mercuriale. Ecological Entomology,30, 541–547.
Watts, P.C., Saccheri, I.J., Kemp, S.J. & Thompson, D.J. (2006)Impact of regional and local habitat isolation upon geneticdiversity of the endangered damselfly Coenagrion mercuriale(Odonata: Zygoptera). Freshwater Biology, 51, 193–205.
Watts, P.C., Rousset, F., Saccheri, I.J., Leblois, R., Kemp, S.J.& Thompson, D.J. (2007) Compatible genetic and ecolog-ical estimates of dispersal rates in insect (Coenagrionmercuriale: Odonata: Zygoptera) populations: analysis of‘neighbourhood size’ using a more precise estimator.Molecular Ecology, 16, 737–751.
Weir, B.S. & Cockerham, C.C. (1984) Estimating F-statisticsfor the analysis of population structure. Evolution, 38,1358–1370.
Whitlock, M.C. & Barton, N.H. (1997) The effective size of asubdivided population. Genetics, 163, 1177–1191.
Wilson, A.J., Hutchings, J.A. & Ferguson, M.M. (2004)Dispersal in a stream dwelling salmonid: inferences fromtagging and microsatellite studies. Conservation Genetics, 5,25–37.
Wright, S. (1931) Evolution in Mendelian populations.Genetics, 28, 114–138.
Wright, S. (1943) Isolation by distance. Genetics, 28, 114–138.
Received 20 November 2006; accepted 19 March 2007