Effective Identification of Technological Opportunities ... - MDPI
24
Citation: Yang, W.; Cao, G.; Peng, Q.; Zhang, J.; He, C. Effective Identification of Technological Opportunities for Radical Inventions Using International Patent Classification: Application of Patent Data Mining. Appl. Sci. 2022, 12, 6755. https://doi.org/10.3390/app12136755 Academic Editor: José Salvador Sánchez Garreta Received: 14 June 2022 Accepted: 27 June 2022 Published: 3 July 2022 Publisher’s Note: MDPI stays neutral with regard to jurisdictional claims in published maps and institutional affil- iations. Copyright: © 2022 by the authors. Licensee MDPI, Basel, Switzerland. This article is an open access article distributed under the terms and conditions of the Creative Commons Attribution (CC BY) license (https:// creativecommons.org/licenses/by/ 4.0/). applied sciences Article Effective Identification of Technological Opportunities for Radical Inventions Using International Patent Classification: Application of Patent Data Mining Wendan Yang 1,2 , Guozhong Cao 1,2, *, Qingjin Peng 3 , Junlei Zhang 2,4 and Chuan He 1,2 1 School of Mechanical Engineering, Hebei University of Technology, Tianjin 300401, China; [email protected] (W.Y.); [email protected] (C.H.) 2 National Engineering Research Center for Technological Innovation Method and Tool, Tianjin 300401, China; [email protected] 3 Department of Mechanical Engineering, University of Manitoba, Winnipeg, MB R3T 5V6, Canada; [email protected] 4 School of Economics and Management, Hebei University of Technology, Tianjin 300401, China * Correspondence: [email protected] Abstract: Identifying technological opportunities early on is critical for the development of radical inventions (RIs). Patents are recognized as one of the most reliable resources for identifying technolog- ical opportunities. In line with this, this study aimed to suggest a novel approach for the identification of technological opportunities for RIs, based on the International Patent Classification (IPC), whose design knowledge has not been fully utilized. In this approach, technological opportunities for RIs are identified by measuring the value of technological novelty (VON) of each technology manifested in a patent set, and the value of difficulty (VOD) of each R&D theme contained in the patent set. Specifically, VONs are calculated through a novel map of technological changes over time, based on structured data from the patent set; and VODs are determined using natural language processing, K-means cluster analysis, and complex network analysis of the unstructured data from the patent set. The feasibility and operability of the proposed approach are verified in a case study of unmanned aerial vehicles. The proposed approach can help designers maximize the use of designs and expert knowledge in patent libraries, to formulate technical strategies for RIs. Keywords: technological opportunities identification; radical invention; international patent clas- sification; natural language processing; K-means clustering; complex network analysis; unmanned aerial vehicles 1. Introduction Radical inventions (RIs) can boost a company’s market position, by improving prod- uct competitiveness in the marketplace [1]. However, companies are more inclined to carry out incremental inventions that conform to a continual process of checking with optimization [2]. This is because the technological opportunities of incremental inventions can be directly identified from the problems of existing products [3], while the technological opportunities of RIs are manifested in the emergence of a distinctly different technology [4]. Hence, designers need to pay special attention to the identification of technological oppor- tunities for RIs. Previous studies made attempts at combining the knowledge/technology of different domains [5,6], creating markets [7], and developing criteria [8], to search for technologi- cal opportunities for RIs. However, these studies were mostly derived from innovation management strategies. Little is known about the effective identification of technological opportunities for RIs from technical information, and research based on patents for RIs is rarely discussed. Hence, further identification methods of technological opportunities for RIs need to be studied. Appl. Sci. 2022, 12, 6755. https://doi.org/10.3390/app12136755 https://www.mdpi.com/journal/applsci
-
Upload
khangminh22 -
Category
Documents
-
view
3 -
download
0
Transcript of Effective Identification of Technological Opportunities ... - MDPI

Citation: Yang, W.; Cao, G.; Peng, Q.;
Zhang, J.; He, C. Effective
Identification of Technological
Opportunities for Radical Inventions
Using International Patent
Classification: Application of Patent
Data Mining. Appl. Sci. 2022, 12, 6755.
https://doi.org/10.3390/app12136755
Academic Editor: José Salvador
Sánchez Garreta
Received: 14 June 2022
Accepted: 27 June 2022
Published: 3 July 2022
Publisher’s Note: MDPI stays neutral
with regard to jurisdictional claims in
published maps and institutional affil-
iations.
Copyright: © 2022 by the authors.
Licensee MDPI, Basel, Switzerland.
This article is an open access article
distributed under the terms and
conditions of the Creative Commons
Attribution (CC BY) license (https://
creativecommons.org/licenses/by/
4.0/).
applied sciences
Article
Effective Identification of Technological Opportunities forRadical Inventions Using International Patent Classification:Application of Patent Data MiningWendan Yang 1,2, Guozhong Cao 1,2,*, Qingjin Peng 3 , Junlei Zhang 2,4 and Chuan He 1,2
1 School of Mechanical Engineering, Hebei University of Technology, Tianjin 300401, China;[email protected] (W.Y.); [email protected] (C.H.)
2 National Engineering Research Center for Technological Innovation Method and Tool, Tianjin 300401, China;[email protected]
3 Department of Mechanical Engineering, University of Manitoba, Winnipeg, MB R3T 5V6, Canada;[email protected]
4 School of Economics and Management, Hebei University of Technology, Tianjin 300401, China* Correspondence: [email protected]
Abstract: Identifying technological opportunities early on is critical for the development of radicalinventions (RIs). Patents are recognized as one of the most reliable resources for identifying technolog-ical opportunities. In line with this, this study aimed to suggest a novel approach for the identificationof technological opportunities for RIs, based on the International Patent Classification (IPC), whosedesign knowledge has not been fully utilized. In this approach, technological opportunities for RIsare identified by measuring the value of technological novelty (VON) of each technology manifestedin a patent set, and the value of difficulty (VOD) of each R&D theme contained in the patent set.Specifically, VONs are calculated through a novel map of technological changes over time, based onstructured data from the patent set; and VODs are determined using natural language processing,K-means cluster analysis, and complex network analysis of the unstructured data from the patent set.The feasibility and operability of the proposed approach are verified in a case study of unmannedaerial vehicles. The proposed approach can help designers maximize the use of designs and expertknowledge in patent libraries, to formulate technical strategies for RIs.
Keywords: technological opportunities identification; radical invention; international patent clas-sification; natural language processing; K-means clustering; complex network analysis; unmannedaerial vehicles
1. Introduction
Radical inventions (RIs) can boost a company’s market position, by improving prod-uct competitiveness in the marketplace [1]. However, companies are more inclined tocarry out incremental inventions that conform to a continual process of checking withoptimization [2]. This is because the technological opportunities of incremental inventionscan be directly identified from the problems of existing products [3], while the technologicalopportunities of RIs are manifested in the emergence of a distinctly different technology [4].Hence, designers need to pay special attention to the identification of technological oppor-tunities for RIs.
Previous studies made attempts at combining the knowledge/technology of differentdomains [5,6], creating markets [7], and developing criteria [8], to search for technologi-cal opportunities for RIs. However, these studies were mostly derived from innovationmanagement strategies. Little is known about the effective identification of technologicalopportunities for RIs from technical information, and research based on patents for RIs israrely discussed. Hence, further identification methods of technological opportunities forRIs need to be studied.
Appl. Sci. 2022, 12, 6755. https://doi.org/10.3390/app12136755 https://www.mdpi.com/journal/applsci

Appl. Sci. 2022, 12, 6755 2 of 24
Patents are considered one of the most reliable data resources for technological oppor-tunity identification [9–11], due to their integrity of technical information, standardizationof document management, and availability of data. Studies have suggested methodsof identifying technological opportunities through drawing patent citation networks, toidentify core patents as technological opportunities [12–14], establishing a morphologicalmatrix to identify prioritized combinations of patents as technological opportunities [15],and constructing semantic patent maps, to identify patents hotspots and outlier patentsas technological opportunities [16–18]. In recent years, with the development of naturallanguage processing technology, innovative designs based on patent semantic informationhave received much attention [19–21]. However, the valuable information contained in theInternational Patent Classification (IPC) has been underestimated.
The IPC is systematic and hierarchical, and the theme represented by each IPC sym-bol is mainly based on the function and structure of inventions, supplemented by theapplication of inventions [22]. Most previous studies have used the IPC as a patentclassification/search tool, or further developed an IPC co-occurrence matrix, to mea-sure technological distance [23]. Nevertheless, little effort has been made to investigatethese features of the IPC system as a basis for developing a tool with which to identifytechnological opportunities.
Having recognized these gaps, this paper proposes a method for identifying techno-logical opportunities for RIs based on the IPC. For identifying technological opportunitiesfor RIs, it is necessary to distinguish these from general technological opportunities basedon the characteristics of RIs. RIs show a differentiated creativity, because they come fromsolving inventive problems using new technology. Thus, the value of difficulty (VOD) ofthe problems solved and the value of technological novelty (VON) of the new technologyare applied to distinguish technological opportunities for RIs from others. Using IPCsymbols and the order of filing dates of the patent set, technology manifested in a patentset with higher VONs is searched using a map of technological changes over time. Usingthe unstructured patent data, R&D themes of a patent set are decided by natural languageprocessing and K-means clustering, and analyzed using complex network analysis to deter-mine the VOD of each R&D theme. Finally, patents of technological opportunities for RIsare identified using an IPC-based coordinate system, based on VOC and VOD.
The rest of this paper is structured as follows: In Section 2, previous studies ontechnological opportunity identification for radical inventions and patent-based identi-fication methods for technological opportunities are reviewed. Section 3 introduces atwo-dimensional coordinate system, along with a framework for identifying technologicalopportunities for radical inventions. The proposed approach is applied to analyze patentsgranted to Dajiang Innovation (DJI), to verify its feasibility and operability in Section 4,followed by a discussion of the contributions of this research in Section 5. In Section 6, theconclusions of this research are used to give possible directions for future studies.
2. Related Works2.1. Technological Opportunities Identification for Radical Inventions
According to McDermott and O’Connor [24], radical inventions (RIs) provide a morethan five-times improvement in product performance, or more than 30% reduction inproduct cost. A more abstract concept explains that RI-based products have a major effect onmarkets and the economic activities surrounding them [25]. Such an explanation is suitablefor research on the market effect of RIs, but not for analysis of the formation mechanismof RIs. To this end, some scholars have introduced an S-shaped path of technologicalevolution, to analyze the inherent features of RIs. Specifically, RIs are repeated climbsand jumps between S-curves of technology/product evolution, which distinguish themfrom incremental inventions, depicted as a lengthened single S-curve [26]. This descriptioncoincides with the definition of RIs proposed by later scholars. Dahlin and Behrens [27]considered that RIs are novel, unique, and related to future technology. Sood and Tellis [4]

Appl. Sci. 2022, 12, 6755 3 of 24
stated that RIs are accompanied by the emergence of a distinctly different technology.Liu et al. [28] put forward that RIs provide a significant difference from existing designs.
Based on these concepts, scholars have investigated the technological opportunitiesof RIs, as well as the design process of RIs [29]; barriers [30,31] and stimulations [32] toRIs; and evaluation methods for technological opportunities of RIs [28]. Vergragt andBrown [33] stated that a “possibility space” represented by “vision” has the power to createRIs. In terms of patent analysis, Schoenmakers and Duysters [5] found that the main sourceof the technology applied in RIs is the reorganization of existing knowledge in differentfields. Later, Maine et al. [6] confirmed that the confluence of technology in distinct fieldscan trigger technological opportunities for RIs. O’Connor and Rice [7] proved that activemarket creation can seize technological opportunities for RIs more proactively than passiveidentification methods. More recently, Herrmann et al. [8] designed a scale consistingof four dimensions: markets, team members, users, and companies, to identify ideas astechnological opportunities in the early phases of RIs. However, these studies were mostlyderived from innovation management strategies and consider little about the characteristicsof the technology applied in RIs. Hence, further identification methods for technologicalopportunities for RIs need to be studied.
2.2. Patent-Based Identification Methods for Technological Opportunities
Schwartz [34] first proposed the term “technology innovation opportunity” as a tech-nology that activates innovative activities in industry or causes a huge turn in the R&D ofindustry. Two decades later, Porter and Detampel [35] developed a technology opportunityanalysis software for knowledge mining, based on patent libraries and computer-aided tech-nology. From that point on, technological opportunity identification entered a growth era.
To extract more design knowledge from patents, a large number of scholars haveexpanded their targeted objects from the structured information of patents, such as annualapplication numbers, inventors, citations network, etc., to unstructured information ofpatents; that is, text data. Kim et al. [36] used keywords from patents, the earliest filing dateof the keywords, and their frequency, to create patent maps for presenting the evolution oftechnology and identifying emerging technology. Geum and Kim [37] identified infrequenttrends within patents, based on Keygraph with words other than high-frequency keywords.Kim et al. [14] combined textual data with citation networks of the patent collection to findpatent pairs for converging on a new invention.
To obtain deeper semantic information on patents, Yoon and Kim [13] extracted keyconcepts of patents using a subject–action–object (SAO) structure, to construct a patentmap of the up-to-date status of a given technology. Park et al. [38] extracted inventivefindings of patents using this method, to identify technology trends, significant patents,potential infringements, and novel technology. Yang et al. [19] extracted the technicalprocess, operation method, and functions of patents’ SAO structures, to identify core tech-nological components, which proved useful in monitoring and forecasting new technology.Similarly, Lee et al. [39] suggested a two-stage method for identifying technology oppor-tunities customized to small and medium enterprises, including identifying action-object(AOs) basic opportunities and exploring non-traditional opportunities. To refine SAOxfor an in-depth semantic examination, Kim et al. [20] extracted the purpose and effectof patents from the “for” and “to” phrases in patent sentences. Moreover, he introduced39 engineering parameters from TRIZ to match technology-designative terms, for exploringtechnology opportunities.
Previous research found that selecting helpful patent information and learning fromit provided technological opportunities for designers to develop products. However, thedesign knowledge contained in the IPC (International Patent Classification) is underesti-mated. Song et al. [40] extracted the characteristics of each of the technologies present inpatents from the descriptions of their classification symbols. These features are classifiedinto “purpose”, “function”, “structure”, “material”, “methods”, “processing and operationprocedure” and “control means”, and they considered that the technical attributes that

Appl. Sci. 2022, 12, 6755 4 of 24
have not been used in target products but are commonly used in the other products couldbe helpful to detect new technological opportunities. However, the classification symbolsthey used were F-term, not IPC. Once applied for, patents must be submitted through theJapan Patent Office (JPO), which limits the applicability of this method. Given that theInternational Patent Classification (IPC) is more authoritative and universal, IPC-basedidentification methods are more suitable for promotion and application. The IPC can beused, not only as a classification basis for patents, but also as a criterion for evaluating thevalue of a patent [41], measuring the proximity of inter-domain knowledge bases and thepossibility of cross-domain diversification [23]. Moreover, Liu et al. [22] believed that thefunction, effect, and structure of an invention can be obtained from the title and descrip-tion of IPC symbols. Much less is known, however, about whether the IPC is helpful foridentifying technological opportunities for radical inventions. This research will addressthe above research gaps.
3. Proposed Method3.1. A Two-Dimensional Coordinate System for Classifying Different Technological Opportunities
The problem-oriented process for innovative designs states that solving simple prob-lems and solving inventive problems use different techniques for generating solutions [42].As a result, inventions show a differentiated creativity, depending on whether they are pro-duced by creative methods or not. To control costs or respond quickly to market changes,designers are asked to solve simple problems by optimizing present technologies. This taskcan utilize personal experience or company internal knowledge. Therefore, this type ofdesign activity leads to technological opportunities for lower inventions.
The TRIZ (theory of inventive problem solving) defines inventive problems as technicalproblems that are difficult to clarify, analyze, and solve [42]. It is often said that an accuratedefinition of a problem solves 90 percent of problems. Scholars have suggested listing asmany attributes of a product as possible, as the plausible root causes of product problemsusing a problem explorer [43], function/attribute analysis [44], ideal final result [45], andthe Cynefin framework [46]. Since the studies above suggest leaps and intuitive thinkingrather than a synthetic methodology, and recommend using fewer resources or existingtechnology to solve difficult problems, the quality of the creative ideas looked for isuneven. Hence, inventions created from these types of design activities cannot reach a highinnovation level effectively, and they are more in line with the technological opportunitiesfor incremental innovation.
According to Christensen [47], disruptive inventions come from markets where main-stream products have not maintained innovation. Rafii and Kampas [48] pointed out that adisruptive invention is a technology, product, or process that typically offers lower perfor-mance and less functionality. Guo et al. [49] generated disruptive inventions by achievinga different package of function and performance features from the existing product. Thus,the introduction of new technology is the main means of facilitating disruptive inventions.Since disruptive inventions are initially developed for low-end customer needs, which canbe acquired from market research and observation, a problem-oriented approaches aremore in line with the features of the simple problems. Therefore, using new technology tocope with simple problems leads to technological opportunities for disruptive inventions.
This research studies another high-creativity invention, which aims to improve productperformance greatly [50]. In the problem definition of radical inventions (RIs), what dauntsboth designers and entrepreneurs is whether a product and the timing is suitable for RIs,which product performance improvement has the potential to disrupt the current market,and whether there is room for substantial improvement [51]. Thus, RIs face inventiveproblems [42]. The design process for RIs based on innovation knowledge managementemphasizes that technology that has been developed in other fields but not applied inthe current field is the best option for use as innovative knowledge to solve inventiveproblems [52]. Therefore, technological opportunities produced by relatively new andcross-domain technology focusing on inventive problems are considered for RIs.

Appl. Sci. 2022, 12, 6755 5 of 24
In general, there are two important indicators to distinguish technological opportu-nities for RIs. The first is the value of difficulty (VOD) of the problems solved, and theother is the value of technological novelty (VON) of the new technology applied. Hence,technological opportunities are categorized in a two-dimensional coordinate system in thisresearch, with the y-axis representing VOD and the x-axis representing VON, as shownin Figure 1. Technological opportunities in quadrant I appear when dealing with simpleproblems using optimized present technology. Technological opportunities in quadrant IIarise when using new technology to cope with simple problems. Technological opportu-nities in quadrant III emerge when using present technology for difficult problems, andtechnological opportunities in quadrant IV arise when using new technology to implementdifficult problems. Hence, technological opportunities in quadrant IV are more likely tolead to RIs. Section 3.2 describes how technological opportunities for RIs can be identifiedbased on the IPC.
Appl. Sci. 2022, 12, x FOR PEER REVIEW 5 of 25
oriented approaches are more in line with the features of the simple problems. Therefore, using new technology to cope with simple problems leads to technological opportunities for disruptive inventions.
This research studies another high-creativity invention, which aims to improve product performance greatly [50]. In the problem definition of radical inventions (RIs), what daunts both designers and entrepreneurs is whether a product and the timing is suitable for RIs, which product performance improvement has the potential to disrupt the current market, and whether there is room for substantial improvement [51]. Thus, RIs face inventive problems [42]. The design process for RIs based on innovation knowledge management emphasizes that technology that has been developed in other fields but not applied in the current field is the best option for use as innovative knowledge to solve inventive problems [52]. Therefore, technological opportunities produced by relatively new and cross-domain technology focusing on inventive problems are considered for RIs.
In general, there are two important indicators to distinguish technological opportunities for RIs. The first is the value of difficulty (VOD) of the problems solved, and the other is the value of technological novelty (VON) of the new technology applied. Hence, technological opportunities are categorized in a two-dimensional coordinate system in this research, with the y-axis representing VOD and the x-axis representing VON, as shown in Figure 1. Technological opportunities in quadrant I appear when dealing with simple problems using optimized present technology. Technological opportunities in quadrant II arise when using new technology to cope with simple problems. Technological opportunities in quadrant III emerge when using present technology for difficult problems, and technological opportunities in quadrant IV arise when using new technology to implement difficult problems. Hence, technological opportunities in quadrant IV are more likely to lead to RIs. Section 3.2 describes how technological opportunities for RIs can be identified based on the IPC.
Ⅰ:Technological opportunities for lower level invention
Ⅱ:Technological opportunities for disruptive innovation
Ⅲ:Technological opportunities for incremental innovation
Ⅳ:Technological opportunities for radical innovation
The
valu
e of
diff
icul
ty (V
OD
) of
the
tech
nica
l pro
blem
solv
ed b
y in
vent
ions
The value of technological changes (VOC) of technologies manifested inventions
Figure 1. Two-dimensional coordinate system for classifying different technological opportunities.
3.2. Overall Procedure The overall flow of the proposed identification approach based on the IPC is shown
in Figure 2. First, a search query is used to find a patent set from the patent databases. Second, structured data of the patents, such as the IPC symbols and application dates, are gathered for the determination of the value of technological novelty (VON) of each
Figure 1. Two-dimensional coordinate system for classifying different technological opportunities.
3.2. Overall Procedure
The overall flow of the proposed identification approach based on the IPC is shown inFigure 2. First, a search query is used to find a patent set from the patent databases. Second,structured data of the patents, such as the IPC symbols and application dates, are gatheredfor the determination of the value of technological novelty (VON) of each technologymanifested in the patent set. In this step, bifurcation and the hierarchical features of theIPC system are used to find difference of the IPC symbols, which determines the noveltyof technical features among patents after attaching time attributes. Third, R&D themesand their values of difficulty (VOD) are decided, by analyzing the unstructured data ofindividuals in the patent set. In this step, features of a complex network composed of IPCsymbols are used as the value of difficulty. Then, an IPC-based coordinate system is builtbased on VON and VOD, to identify technological opportunities for radical inventions.The details of these steps are as follows:

Appl. Sci. 2022, 12, 6755 6 of 24
Appl. Sci. 2022, 12, x FOR PEER REVIEW 6 of 25
technology manifested in the patent set. In this step, bifurcation and the hierarchical features of the IPC system are used to find difference of the IPC symbols, which determines the novelty of technical features among patents after attaching time attributes. Third, R&D themes and their values of difficulty (VOD) are decided, by analyzing the unstructured data of individuals in the patent set. In this step, features of a complex network composed of IPC symbols are used as the value of difficulty. Then, an IPC-based coordinate system is built based on VON and VOD, to identify technological opportunities for radical inventions. The details of these steps are as follows:
Figure 2. Framework for identifying technological opportunities of radical inventions.
3.2.1. Patent Retrieval To ensure the accuracy of data, patent data are retrieved from online databases
managed by national offices or authoritative enterprises, such as the United States Patents and Trademark Office (USPTO), Derwent Innovations IndexSM, State Intellectual Property Office of PRC (SIPO), China Intellectual Property Right Net (CNIPR), etc. In addition, inventions, differently from utility models and designs, have to undergo a strict examination for novelty and creativity, referring to lots of technical documents. Accordingly, they are assumed as appropriate data sources for this study. Then, the application dates, IPC symbols, and description sections of the patents are collected.
Figure 3 shows the standard description section of a Chinese invention. The description section of a patent contains the technical field, technical problems, technical characteristics, and advantageous effects of the invention, etc. Since the background section is a detailed description of the current state of the patented technology field and explains the problems of existing products, this research recommends choosing it as the research object for the subsequent unstructured data analysis.
Figure 2. Framework for identifying technological opportunities of radical inventions.
3.2.1. Patent Retrieval
To ensure the accuracy of data, patent data are retrieved from online databases man-aged by national offices or authoritative enterprises, such as the United States Patentsand Trademark Office (USPTO), Derwent Innovations IndexSM, State Intellectual PropertyOffice of PRC (SIPO), China Intellectual Property Right Net (CNIPR), etc. In addition,inventions, differently from utility models and designs, have to undergo a strict examina-tion for novelty and creativity, referring to lots of technical documents. Accordingly, theyare assumed as appropriate data sources for this study. Then, the application dates, IPCsymbols, and description sections of the patents are collected.
Figure 3 shows the standard description section of a Chinese invention. The de-scription section of a patent contains the technical field, technical problems, technicalcharacteristics, and advantageous effects of the invention, etc. Since the background sectionis a detailed description of the current state of the patented technology field and explainsthe problems of existing products, this research recommends choosing it as the researchobject for the subsequent unstructured data analysis.
3.2.2. Structured Data Analysis
The values of the technological novelty (VON) of a technology manifested in a patentare determined using a novel map of technology changes over time, based on structureddata of the patent set, as shown in Figure 4. This reveals the emergence of new technologies.A three-step process is introduced to draw a map for calculating VON, as follows:

Appl. Sci. 2022, 12, 6755 7 of 24Appl. Sci. 2022, 12, x FOR PEER REVIEW 7 of 26
Figure 3. Structure of the description section of a Chinese invention.
3.2.2. Structured Data Analysis The values of the technological novelty (VON) of a technology manifested in a patent
are determined using a novel map of technology changes over time, based on structured data of the patent set, as shown in Figure 4. This reveals the emergence of new technologies. A three-step process is introduced to draw a map for calculating VON, as follows:
Figure 3. Structure of the description section of a Chinese invention.
Appl. Sci. 2022, 12, x FOR PEER REVIEW 7 of 25
Figure 3. Structure of the description section of a Chinese invention.
3.2.2. Structured Data Analysis The values of the technological novelty (VON) of a technology manifested in a patent
are determined using a novel map of technology changes over time, based on structured data of the patent set, as shown in Figure 4. This reveals the emergence of new technologies. A three-step process is introduced to draw a map for calculating VON, as follows:
G01C
F16M
G03B
No new symbol appear
The first year2010
F16F
The second year2011
The third year2012
The forth year2013
Nd1=Y1+D1=1+1=2
Nd2=Y2+D2(2×1)=2+4=6
Nd3=Y4+min{D3(3×1),D3(3×2)}=4+min{4,3}=4+3=7
Nd4=Y4+min{D4(4×1),D4(4×2)}=4+min{4,2}=4+2=6
Y1=1
Y4=4
Y2=2
Figure 4. A map of technological changes over time.
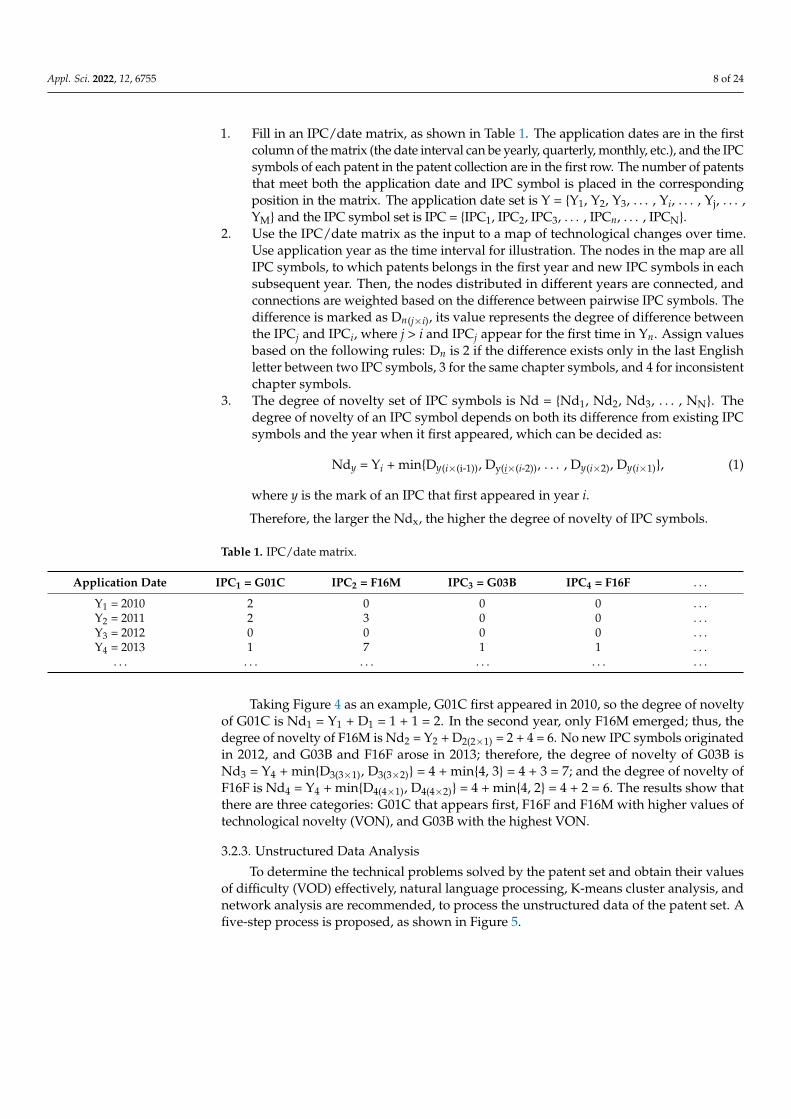
1. Fill in an IPC/date matrix, as shown in Table 1. The application dates are in the first column of the matrix (the date interval can be yearly, quarterly, monthly, etc.), and the IPC symbols of each patent in the patent collection are in the first row. The number of patents that meet both the application date and IPC symbol is placed in the corresponding position in the matrix. The application date set is Y = {Y1, Y2, Y3,
Figure 4. A map of technological changes over time.
Appl. Sci. 2022, 12, 6755 8 of 24
1. Fill in an IPC/date matrix, as shown in Table 1. The application dates are in the firstcolumn of the matrix (the date interval can be yearly, quarterly, monthly, etc.), and the IPCsymbols of each patent in the patent collection are in the first row. The number of patentsthat meet both the application date and IPC symbol is placed in the correspondingposition in the matrix. The application date set is Y = {Y1, Y2, Y3, . . . , Yi, . . . , Yj, . . . ,YM} and the IPC symbol set is IPC = {IPC1, IPC2, IPC3, . . . , IPCn, . . . , IPCN}.
2. Use the IPC/date matrix as the input to a map of technological changes over time.Use application year as the time interval for illustration. The nodes in the map are allIPC symbols, to which patents belongs in the first year and new IPC symbols in eachsubsequent year. Then, the nodes distributed in different years are connected, andconnections are weighted based on the difference between pairwise IPC symbols. Thedifference is marked as Dn(j×i), its value represents the degree of difference betweenthe IPCj and IPCi, where j > i and IPCj appear for the first time in Yn. Assign valuesbased on the following rules: Dn is 2 if the difference exists only in the last Englishletter between two IPC symbols, 3 for the same chapter symbols, and 4 for inconsistentchapter symbols.
3. The degree of novelty set of IPC symbols is Nd = {Nd1, Nd2, Nd3, . . . , NN}. Thedegree of novelty of an IPC symbol depends on both its difference from existing IPCsymbols and the year when it first appeared, which can be decided as:
Ndy = Yi + min{Dy(i×(i-1)), Dy(i×(i-2)), . . . , Dy(i×2), Dy(i×1)}, (1)
where y is the mark of an IPC that first appeared in year i.
Therefore, the larger the Ndx, the higher the degree of novelty of IPC symbols.
Table 1. IPC/date matrix.
Application Date IPC1 = G01C IPC2 = F16M IPC3 = G03B IPC4 = F16F . . .
Y1 = 2010 2 0 0 0 . . .Y2 = 2011 2 3 0 0 . . .Y3 = 2012 0 0 0 0 . . .Y4 = 2013 1 7 1 1 . . .
. . . . . . . . . . . . . . . . . .
Taking Figure 4 as an example, G01C first appeared in 2010, so the degree of noveltyof G01C is Nd1 = Y1 + D1 = 1 + 1 = 2. In the second year, only F16M emerged; thus, thedegree of novelty of F16M is Nd2 = Y2 + D2(2×1) = 2 + 4 = 6. No new IPC symbols originatedin 2012, and G03B and F16F arose in 2013; therefore, the degree of novelty of G03B isNd3 = Y4 + min{D3(3×1), D3(3×2)} = 4 + min{4, 3} = 4 + 3 = 7; and the degree of novelty ofF16F is Nd4 = Y4 + min{D4(4×1), D4(4×2)} = 4 + min{4, 2} = 4 + 2 = 6. The results show thatthere are three categories: G01C that appears first, F16F and F16M with higher values oftechnological novelty (VON), and G03B with the highest VON.
3.2.3. Unstructured Data Analysis
To determine the technical problems solved by the patent set and obtain their valuesof difficulty (VOD) effectively, natural language processing, K-means cluster analysis, andnetwork analysis are recommended, to process the unstructured data of the patent set. Afive-step process is proposed, as shown in Figure 5.

Appl. Sci. 2022, 12, 6755 9 of 24Appl. Sci. 2022, 12, x FOR PEER REVIEW 9 of 25
3. Calculate similarity degrees
1. Data collection and preprocessingNatural Language Processing
2. Extract text features
Tokenized corpus
R&D themes
method Process Result
TF-IDFCharacteristic matrix
Cosine Similarity Distance matrix
4. Cluster analysisK-meansMultidimensional scale
5. Calculate centrality of R&D themes
Social network analysis
The values of difficulty (VOD) of R&D themes
Figure 5. Workflow of the natural language process and cluster analysis of patent specifications.
The details are as follows: 1. Data collection and preprocessing: This includes loading a user dictionary, removing
stop words and text segmentation (used to indicate boundaries of words, such as Chinese and Japanese, etc. those languages without any spaces between words), and tagging words, etc., to obtain a tokenized patent corpus. Nltk (or jieba, to segment a Chinese sentence) in Python is used to implement preprocessing, with the aim of simplifying the process and improving the analysis results.
2. Text feature extraction: This uses term frequency–inverse document frequency (TF–IDF) [53] to highlight words that differ greatly from one patent to another, to extract the technical features of a patent. The proprietary technical features of the patent reflect its R&D theme, which to a certain extent is the technical problem solved by the patent. Each patent is represented by a vector, which is constructed from the TF-IDF value of each keyword. Then, the vector normalization features of all the patents are built in a characteristic matrix.
3. Calculation of degree of similarity: The cosine similarity is decided between patents and constructed using a cosine distance matrix.
4. Cluster analysis: K-means clustering is used to obtain the classified R&D themes of the patent set. The number of clusters should be determined before using the K-means clustering. The latent Dirichlet allocation’s perplexity is selected, to estimate the appropriate number of clusters, since it is the most extensively used and well-developed process. Scikit-learn in Python is used to implement the K-means cluster analysis, with the aim of simplifying the process and improving the analysis results. Figure 6 shows the Python implementation codes for the previous four steps.
Figure 5. Workflow of the natural language process and cluster analysis of patent specifications.
The details are as follows:
1. Data collection and preprocessing: This includes loading a user dictionary, removingstop words and text segmentation (used to indicate boundaries of words, such asChinese and Japanese, etc. those languages without any spaces between words), andtagging words, etc., to obtain a tokenized patent corpus. Nltk (or jieba, to segmenta Chinese sentence) in Python is used to implement preprocessing, with the aim ofsimplifying the process and improving the analysis results.
2. Text feature extraction: This uses term frequency–inverse document frequency(TF–IDF) [53] to highlight words that differ greatly from one patent to another, toextract the technical features of a patent. The proprietary technical features of thepatent reflect its R&D theme, which to a certain extent is the technical problem solvedby the patent. Each patent is represented by a vector, which is constructed from theTF-IDF value of each keyword. Then, the vector normalization features of all thepatents are built in a characteristic matrix.
3. Calculation of degree of similarity: The cosine similarity is decided between patentsand constructed using a cosine distance matrix.
4. Cluster analysis: K-means clustering is used to obtain the classified R&D themesof the patent set. The number of clusters should be determined before using theK-means clustering. The latent Dirichlet allocation’s perplexity is selected, to estimatethe appropriate number of clusters, since it is the most extensively used and well-developed process. Scikit-learn in Python is used to implement the K-means clusteranalysis, with the aim of simplifying the process and improving the analysis results.Figure 6 shows the Python implementation codes for the previous four steps.

Appl. Sci. 2022, 12, 6755 10 of 24Appl. Sci. 2022, 12, x FOR PEER REVIEW 10 of 25
import jiebafrom sklearn.cluster import Kmeansfrom sklearn.feature_extraction.text import TfidfVectorizerfrom sklearn.manifold import MDS jieba.load_userdict(dictdoc)jieba.analyse.set_stop_words(stopwordsdoc)totalvocab_tokenized= jieba.analyse.textrank(text,topK)tfidf_vectorizer=TfidfVectorizer(max_df,min_df,max_features)tfidf_matrix=tfidf_vectorizer.fit_transform(totalvocab_tokenized)dist=1-cosine_similarity(tfidf_matrix)km=Kmeans(n_clusters)mds=MDS(n_components)mds.fit_transform(dist)
Figure 6. Python implementation code for natural language processing and K-means clustering.
5. Calculating the centrality of R&D themes: An IPC network is built to measure the value of difficulty (VOD) of R&D themes. This research developed an IPC and R&D theme matrix, as shown in Figure 7, and used this matrix as the input to the IPC network analysis.
IPC1 IPC2 … IPCN
R&D theme 2
11 12 1
21 22
1
N
X XN
t t tt t
t t
⋅ ⋅ ⋅ ⋅ ⋅ ⋅ ⋅ ⋅ ⋅ ⋅ ⋅ ⋅ ⋅ ⋅ ⋅ ⋅ ⋅ ⋅ ⋅ ⋅ ⋅ ⋅ ⋅ ⋅ ⋅ ⋅ ⋅
R&D theme 1
…
R&D theme N
R&D theme 1
IPC2 IPCNIPC1 IPC3
R&D theme 2 ...
…
Figure 7. Network analysis using based on IPC nodes and R&D theme nodes.
As shown in Figure 7, the nodes represent each IPC and R&D theme of the patent set. More IPC symbols connected to a R&D theme node means that the technology used to solve the problem is more inclined to cross-domain characteristics. For each R&D theme node, network indicators are calculated. The degree of centrality represents the sum of the R&D theme nodes connected to IPC nodes. That is, the bigger the centrality of a R&D theme node, the higher the VOD of the R&D theme. In this way, R&D themes are finally sorted by difficulty. The degree of centrality of R&D theme p in the IPC network can be measured as: 𝐷𝑒𝑛 𝑇 = ∑ 𝑎(𝑡 , 𝑡 )N X , (2)
3.2.4. IPC-based Coordinate System In this paper, technological opportunities for RIs are defined as “patents using higher
VOC technology to solve higher VOD problems”. For technological opportunities for RIs, this research constructed an IPC-based coordinate system based on VON and VOD. First, IPC symbols obtained in Section 3.2.2 are arranged on the x-axis direction of a coordinate system according to the VON, and the R&D themes are arranged on the y-axis direction, according to VOD. Patents that meet both the x and y values are then placed at the
Figure 6. Python implementation code for natural language processing and K-means clustering.
5. Calculating the centrality of R&D themes: An IPC network is built to measure thevalue of difficulty (VOD) of R&D themes. This research developed an IPC and R&Dtheme matrix, as shown in Figure 7, and used this matrix as the input to the IPCnetwork analysis.
Appl. Sci. 2022, 12, x FOR PEER REVIEW 10 of 25
import jiebafrom sklearn.cluster import Kmeansfrom sklearn.feature_extraction.text import TfidfVectorizerfrom sklearn.manifold import MDS jieba.load_userdict(dictdoc)jieba.analyse.set_stop_words(stopwordsdoc)totalvocab_tokenized= jieba.analyse.textrank(text,topK)tfidf_vectorizer=TfidfVectorizer(max_df,min_df,max_features)tfidf_matrix=tfidf_vectorizer.fit_transform(totalvocab_tokenized)dist=1-cosine_similarity(tfidf_matrix)km=Kmeans(n_clusters)mds=MDS(n_components)mds.fit_transform(dist)
Figure 6. Python implementation code for natural language processing and K-means clustering.
5. Calculating the centrality of R&D themes: An IPC network is built to measure the value of difficulty (VOD) of R&D themes. This research developed an IPC and R&D theme matrix, as shown in Figure 7, and used this matrix as the input to the IPC network analysis.
IPC1 IPC2 … IPCN
R&D theme 2
11 12 1
21 22
1
N
X XN
t t tt t
t t
⋅ ⋅ ⋅ ⋅ ⋅ ⋅ ⋅ ⋅ ⋅ ⋅ ⋅ ⋅ ⋅ ⋅ ⋅ ⋅ ⋅ ⋅ ⋅ ⋅ ⋅ ⋅ ⋅ ⋅ ⋅ ⋅ ⋅
R&D theme 1
…
R&D theme N
R&D theme 1
IPC2 IPCNIPC1 IPC3
R&D theme 2 ...
…
Figure 7. Network analysis using based on IPC nodes and R&D theme nodes.
As shown in Figure 7, the nodes represent each IPC and R&D theme of the patent set. More IPC symbols connected to a R&D theme node means that the technology used to solve the problem is more inclined to cross-domain characteristics. For each R&D theme node, network indicators are calculated. The degree of centrality represents the sum of the R&D theme nodes connected to IPC nodes. That is, the bigger the centrality of a R&D theme node, the higher the VOD of the R&D theme. In this way, R&D themes are finally sorted by difficulty. The degree of centrality of R&D theme p in the IPC network can be measured as: 𝐷𝑒𝑛 𝑇 = ∑ 𝑎(𝑡 , 𝑡 )N X , (2)
3.2.4. IPC-based Coordinate System In this paper, technological opportunities for RIs are defined as “patents using higher
VOC technology to solve higher VOD problems”. For technological opportunities for RIs, this research constructed an IPC-based coordinate system based on VON and VOD. First, IPC symbols obtained in Section 3.2.2 are arranged on the x-axis direction of a coordinate system according to the VON, and the R&D themes are arranged on the y-axis direction, according to VOD. Patents that meet both the x and y values are then placed at the
Figure 7. Network analysis using based on IPC nodes and R&D theme nodes.
As shown in Figure 7, the nodes represent each IPC and R&D theme of the patent set.More IPC symbols connected to a R&D theme node means that the technology used tosolve the problem is more inclined to cross-domain characteristics. For each R&D themenode, network indicators are calculated. The degree of centrality represents the sum ofthe R&D theme nodes connected to IPC nodes. That is, the bigger the centrality of a R&Dtheme node, the higher the VOD of the R&D theme. In this way, R&D themes are finallysorted by difficulty. The degree of centrality of R&D theme p in the IPC network can bemeasured as:
DenCen(Tp
)= ∑N+X
k=1 a(tp, tk
), (2)
3.2.4. IPC-Based Coordinate System
In this paper, technological opportunities for RIs are defined as “patents using higherVOC technology to solve higher VOD problems”. For technological opportunities forRIs, this research constructed an IPC-based coordinate system based on VON and VOD.First, IPC symbols obtained in Section 3.2.2 are arranged on the x-axis direction of acoordinate system according to the VON, and the R&D themes are arranged on the y-axisdirection, according to VOD. Patents that meet both the x and y values are then placed at

Appl. Sci. 2022, 12, 6755 11 of 24
the intersection of values x and y. Thus, patents farther from the coordinate origin are morein line with the characteristics of technological opportunities for RIs, and the blank spacearound these patents or the use of the newest technology applied in R&D themes fartheraway from the x-axis are also more likely to produce radical inventions.
4. Case Study
To illustrate the effectiveness and efficiency of our proposed method, we presentidentification results using patents related to unmanned aerial vehicles (UAVs). UAVs arewidely used in military, transportation, agroforestry, and contemporary disaster-relief work,to perform tasks such as investigation, transport, and filming, due to their advantages oflight weight, flexible maneuverability, and user-friendly control. In recent years, more andmore companies have invested in the development of UAVs. A total of 19235 patents weregathered from Patsnap (https://analytics.zhihuiya.com, accessed on 12 November 2019) us-ing the search query “DESC: (“unmanned aerial vehicle” OR “UAV”) AND PATENT_TYPE:(granted) AND APD: [20000101 TO 20191112]” (date: 12 November 2019).
Figure 8 illustrates the statistics of the granted patents retrieved. In general, the yearlyfiling number of UAV patents increased moderately from 2000 to 2010, which indicates thatUAV technology was developing slowly during that time. After 2010, the patent numberwitnessed a significant growth and reached at its peak in 2016, as shown in Figure 8a. Thisshows that UAV technology has been constantly adapting to market demand and constantlybeing upgraded. The patent numbers from 2017 to 2019 were slightly decreased becauseof incomplete data, due to the invention review process. Figure 8b shows the annualfiling number of UAV patents for each geographical authority. The United States Patentand Trademark Office (USPTO) and China National Intellectual Property Administration(CNIPA) have the most patents applied. In particular, the growth of annual filing of UAVpatents in CNIPA has kept pace with the progress of global technology. Although the initialdevelopment was slow, it has moved rapidly since 2013, and surpassed the USPTO in 2016,becoming the competitive center of UAV technology. Boeing, Dajiang Innovation (DJI), andRaytheon were the top three companies in terms of the total number and share of filedUAV patents, as shown in Figure 8c. DJI has gradually become a leading enterprise in UAVtechnology, since 2014 (Figure 8d).
Appl. Sci. 2022, 12, x FOR PEER REVIEW 11 of 25
intersection of values x and y. Thus, patents farther from the coordinate origin are more in line with the characteristics of technological opportunities for RIs, and the blank space around these patents or the use of the newest technology applied in R&D themes farther away from the x-axis are also more likely to produce radical inventions.
4. Case Study To illustrate the effectiveness and efficiency of our proposed method, we present
identification results using patents related to unmanned aerial vehicles (UAVs). UAVs are widely used in military, transportation, agroforestry, and contemporary disaster-relief work, to perform tasks such as investigation, transport, and filming, due to their advantages of light weight, flexible maneuverability, and user-friendly control. In recent years, more and more companies have invested in the development of UAVs. A total of 19235 patents were gathered from Patsnap (https://analytics.zhihuiya.com, accessed on 12 November 2019) using the search query “DESC: (“unmanned aerial vehicle” OR “UAV”) AND PATENT_TYPE: (granted) AND APD: [20000101 TO 20191112]” (date: 12 November 2019).
Figure 8 illustrates the statistics of the granted patents retrieved. In general, the yearly filing number of UAV patents increased moderately from 2000 to 2010, which indicates that UAV technology was developing slowly during that time. After 2010, the patent number witnessed a significant growth and reached at its peak in 2016, as shown in Figure 8a. This shows that UAV technology has been constantly adapting to market demand and constantly being upgraded. The patent numbers from 2017 to 2019 were slightly decreased because of incomplete data, due to the invention review process. Figure 8b shows the annual filing number of UAV patents for each geographical authority. The United States Patent and Trademark Office (USPTO) and China National Intellectual Property Administration (CNIPA) have the most patents applied. In particular, the growth of annual filing of UAV patents in CNIPA has kept pace with the progress of global technology. Although the initial development was slow, it has moved rapidly since 2013, and surpassed the USPTO in 2016, becoming the competitive center of UAV technology. Boeing, Dajiang Innovation (DJI), and Raytheon were the top three companies in terms of the total number and share of filed UAV patents, as shown in Figure 8c. DJI has gradually become a leading enterprise in UAV technology, since 2014 (Figure 8d).
(a)
59
592
4053
0
500
1000
1500
2000
2500
3000
3500
4000
4500
num
ber o
f pat
ents
filing date
Figure 8. Cont.

Appl. Sci. 2022, 12, 6755 12 of 24Appl. Sci. 2022, 12, x FOR PEER REVIEW 12 of 25
(b)
(c)
0
250
500
750
1000
1250
1500
1750
2000
2250
num
ber o
f pat
ents
filing date
USPTO
CNIPA
EPO
JPO
Others
5.85%
3.99%
2.14%
0.00%
1.00%
2.00%
3.00%
4.00%
5.00%
6.00%
7.00%
8.00%
0
200
400
600
800
1000
1200
num
ber o
f pat
ents
Applicant
Appl. Sci. 2022, 12, x FOR PEER REVIEW 13 of 25
(d)
Figure 8. (a) Yearly filing number of UAV patents; (b) Annual filing number of UAV patents for different geographical authorities; (c) Total number and share of patents granted to and owned by the top ten companies; (d) Yearly filing number of patents applied for by DJI, BOEING, and RAYTHEON.
Figure 9 shows the evolution of DJI’s UAV series products. In terms of market performance, DJI’s global sales climbed about 160-fold from 2011 to 2016 [54]. In 2017, DJI was listed as one of 50 smartest companies by the MIT Technology Review. In addition, it was selected as the “2019 Forbes China Most Innovative company”. Considering its excellent technological competence and market performance, DJI has achieved radical inventions in UAVs [55]. Therefore, DJI’s patents were further selected as experimental data to demonstrate the proposed method more clearly.
Figure 9. DJI’s unmanned aerial vehicle series products.
4.1. Patent Retrieval and Data Collection Patents belong to DJI were gathered from the SIPO using the search query “Inventor
= (Shenzhen Dajiang Innovation) AND DESC = (“unmanned aerial vehicle” OR “UAV” OR “camera drone”) AND Invention_Type = (Invention) AND Application_Date ≤ (20220622)” (date: 23 June 2022), and 720 patents were collected.
Figure 10 illustrates the number of inventions about UAV DJI applied for patents for from 2010 to 2022. As presented in the graph, the number of applications for UAV inventions from 2010 to 2013 was only 1, 0, 3, and 3, respectively. However, there was a substantial growth in the number of inventions DJI applied for; 50 in 2014, and 56 in 2015. The change in the number of inventions in 2013 and 2014 matches the fact that DJI first
86
154
201171
157
259
0
50
100
150
200
250
300
num
ber o
f pat
ents
filing date
DJI
BOEING
RAYTHEON
Figure 8. (a) Yearly filing number of UAV patents; (b) Annual filing number of UAV patents fordifferent geographical authorities; (c) Total number and share of patents granted to and owned by thetop ten companies; (d) Yearly filing number of patents applied for by DJI, BOEING, and RAYTHEON.

Appl. Sci. 2022, 12, 6755 13 of 24
Figure 9 shows the evolution of DJI’s UAV series products. In terms of market per-formance, DJI’s global sales climbed about 160-fold from 2011 to 2016 [54]. In 2017, DJIwas listed as one of 50 smartest companies by the MIT Technology Review. In addition,it was selected as the “2019 Forbes China Most Innovative company”. Considering itsexcellent technological competence and market performance, DJI has achieved radicalinventions in UAVs [55]. Therefore, DJI’s patents were further selected as experimentaldata to demonstrate the proposed method more clearly.
Appl. Sci. 2022, 12, x FOR PEER REVIEW 13 of 25
(d)
Figure 8. (a) Yearly filing number of UAV patents; (b) Annual filing number of UAV patents for different geographical authorities; (c) Total number and share of patents granted to and owned by the top ten companies; (d) Yearly filing number of patents applied for by DJI, BOEING, and RAYTHEON.
Figure 9 shows the evolution of DJI’s UAV series products. In terms of market performance, DJI’s global sales climbed about 160-fold from 2011 to 2016 [54]. In 2017, DJI was listed as one of 50 smartest companies by the MIT Technology Review. In addition, it was selected as the “2019 Forbes China Most Innovative company”. Considering its excellent technological competence and market performance, DJI has achieved radical inventions in UAVs [55]. Therefore, DJI’s patents were further selected as experimental data to demonstrate the proposed method more clearly.
Figure 9. DJI’s unmanned aerial vehicle series products.
4.1. Patent Retrieval and Data Collection Patents belong to DJI were gathered from the SIPO using the search query “Inventor
= (Shenzhen Dajiang Innovation) AND DESC = (“unmanned aerial vehicle” OR “UAV” OR “camera drone”) AND Invention_Type = (Invention) AND Application_Date ≤ (20220622)” (date: 23 June 2022), and 720 patents were collected.
Figure 10 illustrates the number of inventions about UAV DJI applied for patents for from 2010 to 2022. As presented in the graph, the number of applications for UAV inventions from 2010 to 2013 was only 1, 0, 3, and 3, respectively. However, there was a substantial growth in the number of inventions DJI applied for; 50 in 2014, and 56 in 2015. The change in the number of inventions in 2013 and 2014 matches the fact that DJI first
86
154
201171
157
259
0
50
100
150
200
250
300
num
ber o
f pat
ents
filing date
DJI
BOEING
RAYTHEON
Figure 9. DJI’s unmanned aerial vehicle series products.
4.1. Patent Retrieval and Data Collection
Patents belong to DJI were gathered from the SIPO using the search query“Inventor = (Shenzhen Dajiang Innovation) AND DESC = (“unmanned aerial vehicle”OR “UAV” OR “camera drone”) AND Invention_Type = (Invention) AND Application_Date ≤ (20220622)” (date: 23 June 2022), and 720 patents were collected.
Figure 10 illustrates the number of inventions about UAV DJI applied for patentsfor from 2010 to 2022. As presented in the graph, the number of applications for UAVinventions from 2010 to 2013 was only 1, 0, 3, and 3, respectively. However, there was asubstantial growth in the number of inventions DJI applied for; 50 in 2014, and 56 in 2015.The change in the number of inventions in 2013 and 2014 matches the fact that DJI firstlaunched a drone named “Phantom” in early 2013 and “Inspire” in 2014, followed by the“Spark” series and “Mavic” series in the following years. It is clear from the data that thenumber of annual applications remained high for the next two years (197 inventions in 2016and 250 inventions in 2017). In other words, DJI continued to maintain and even enhanceits innovation capabilities. In addition, the number of filed patents in 2021 and 2022 shownin the figure are zero, which does not mean that DJI applied for no patents in these twoyears. It is more likely that the patents filed by DJI in 2021 and 2022 have not been grantedyet, as it takes about 2 years for Chinese patents to be granted after the initial disclosure.Likewise, the downward trend in the number of patents shown in the graph from 2018 to2020 does not reflect a recent lack of innovation at DJI, as there may have been patents filedduring this period not yet granted.
Finally, 720 inventions for UAVs constitute a patent set. Their application dates, IPCsymbols, and description sections were extracted.
4.2. Structured Data Analysis
Figure 11 is a visualization of the IPC/data matrix constructed from the patent setselected in the previous step. The analysis excluded IPC symbols that were related toonly one patent during these years and used contingency. For example, the descriptionof A63H is toys, e.g., tops, dolls, hoops, or building blocks; B63H is marine propulsion orsteering; G08G is traffic control system; and H04R is loudspeakers, which are far away fromUAVs. The matrix shows that the range of technology concerned in the patents DJI appliedfor became more extensive from 2010 to 2020. Between 2010 and 2013, it mainly focusedon three technologies, since DJI applied for few patents: (1) measuring distances, levels,or bearings (G01C); (2) aerolanes; helicopters (B64C); (3) radio direction-finding; radionavigation; determining distance or velocity by use of radio waves; locating or presence-detecting by use of the reflection or reradiation of radio waves; analogous arrangements

Appl. Sci. 2022, 12, 6755 14 of 24
using other waves (G01S). These are for the inertia measuring model (navigation system),the overall system, and remote control equipment of a UAV. In the next three years, DJIapplied for many patents and also became involved in more technical domains, such asapparatus for taking photographs or viewing them (G03B), dynamo-electric machines(H01M and H02K), and wireless communication networks (H04N and H04W). These areshown in Figure 11 as patents with larger dots.
Appl. Sci. 2022, 12, x FOR PEER REVIEW 14 of 25
launched a drone named “Phantom” in early 2013 and “Inspire” in 2014, followed by the “Spark” series and “Mavic” series in the following years. It is clear from the data that the number of annual applications remained high for the next two years (197 inventions in 2016 and 250 inventions in 2017). In other words, DJI continued to maintain and even enhance its innovation capabilities. In addition, the number of filed patents in 2021 and 2022 shown in the figure are zero, which does not mean that DJI applied for no patents in these two years. It is more likely that the patents filed by DJI in 2021 and 2022 have not been granted yet, as it takes about 2 years for Chinese patents to be granted after the initial disclosure. Likewise, the downward trend in the number of patents shown in the graph from 2018 to 2020 does not reflect a recent lack of innovation at DJI, as there may have been patents filed during this period not yet granted.
Figure 10. UAV inventions that DJI applied for patents for from 1 January 2010 to 22 June 2022.
Finally, 720 inventions for UAVs constitute a patent set. Their application dates, IPC symbols, and description sections were extracted.
4.2. Structured Data Analysis Figure 11 is a visualization of the IPC/data matrix constructed from the patent set
selected in the previous step. The analysis excluded IPC symbols that were related to only one patent during these years and used contingency. For example, the description of A63H is toys, e.g., tops, dolls, hoops, or building blocks; B63H is marine propulsion or steering; G08G is traffic control system; and H04R is loudspeakers, which are far away from UAVs. The matrix shows that the range of technology concerned in the patents DJI applied for became more extensive from 2010 to 2020. Between 2010 and 2013, it mainly focused on three technologies, since DJI applied for few patents: (1) measuring distances, levels, or bearings (G01C); (2) aerolanes; helicopters (B64C); (3) radio direction-finding; radio navigation; determining distance or velocity by use of radio waves; locating or presence-detecting by use of the reflection or reradiation of radio waves; analogous arrangements using other waves (G01S). These are for the inertia measuring model (navigation system), the overall system, and remote control equipment of a UAV. In the next three years, DJI applied for many patents and also became involved in more technical domains, such as apparatus for taking photographs or viewing them (G03B), dynamo-electric machines (H01M and H02K), and wireless communication networks (H04N and H04W). These are shown in Figure 11 as patents with larger dots.
1 0 3 3
50 56
197
250
109
47
4 0 00
50
100
150
200
250
300
2010 2012 2014 2016 2018 2020 2022
num
ber o
f inv
entio
ns
filing date
Figure 10. UAV inventions that DJI applied for patents for from 1 January 2010 to 22 June 2022.
A technology change map was then built using the rules discussed in Section 3.2.3, todecide the value of technological novelty of each IPC symbol, according to Equation (1);the results are shown in Table 2.
4.3. Unstructured Data Analysis
In this step, Spyder was used as an auxiliary tool. Spyder provides an interactivePython language development environment, and it has advanced editing, interactivetesting, debugging, and introspection features [56]. Due to the standard structure of aChinese patent, Regular Expression “re.findall(r’background(.+)contents’,text)” was usedto extract each patent’s background section. Then, a maximum of 200 verbs or nounswere extracted from each background section using TextRank. Here, the frequency ofkeywords in TF-IDF was set from 10 to 90%. Next, a coherence model in Gensim wasused to estimate the appropriate number of clusters. The perplexity for different clusters isshown in Figure 12. It shows that a smaller perplexity value indicates a more appropriatenumber of clusters. The cluster K value was thus set to 12.
Table 3 lists the final 12 classifications with 10 keywords (the closest to each center).Figure 13 shows the clustering results. The rightmost blue dot area is composed of fourclassifications. According to the keywords, they can be summed up as a “shoot or processimage”, corresponding to the execution system of a UAV under the law of system integrity.The orange dot area is composed of two categories, they can be summed up as “control orflight”, according to the keywords, corresponding to the control system of a UAV under thelaw of system integrity. The leftmost green area is composed of three categories, and theyall relate to “telecontrol”, according to their keywords. The red dot area above contains twocategories. According to their keywords, they can be summed up as “engine or structures”,corresponding to the energy system and transmission system of an UAV under the law ofsystem integrity. The last category of gray dots can be summed up as “communication”based on the keywords. Together, the patent set was regrouped into six patent classifications.Based on these proprietary technical features, six R&D themes were summarized, as in thelast column of Table 3. They are the problem areas of existing products.

Appl. Sci. 2022, 12, 6755 15 of 24Appl. Sci. 2022, 12, x FOR PEER REVIEW 15 of 25
Figure 11. Visualization of the IPC/date matrix based on patents DJI applied for from 2010 to 2020.
A technology change map was then built using the rules discussed in Section 3.2.3, to decide the value of technological novelty of each IPC symbol, according to Equation (1); the results are shown in Table 2.
Figure 11. Visualization of the IPC/date matrix based on patents DJI applied for from 2010 to 2020.
Table 2. IPCs and their value of technological novelty.
IPC VON IPC VON IPC VON IPC VON IPC VON IPC VON
G01C 2 G01P 7 G03B 7 H02G 8 H04W 8 H05K 8G01R 6 H02P 7 B64D 7 G01B 8 G08C 8 G06F 8G01S 6 F16F 7 H01R 7 H04M 8 H01Q 8 H01M 8F16M 6 G05B 7 H04B 8 G05G 8 H04L 8 H04N 8G05D 6 H02K 7 G02B 8 G06T 8 H02J 8 B64C 8

Appl. Sci. 2022, 12, 6755 16 of 24
Appl. Sci. 2022, 12, x FOR PEER REVIEW 16 of 25
Table 2. IPCs and their value of technological novelty.
IPC VON IPC VON IPC VON IPC VON IPC VON IPC VON G01C 2 G01P 7 G03B 7 H02G 8 H04W 8 H05K 8 G01R 6 H02P 7 B64D 7 G01B 8 G08C 8 G06F 8 G01S 6 F16F 7 H01R 7 H04M 8 H01Q 8 H01M 8 F16M 6 G05B 7 H04B 8 G05G 8 H04L 8 H04N 8 G05D 6 H02K 7 G02B 8 G06T 8 H02J 8 B64C 8
4.3. Unstructured Data Analysis In this step, Spyder was used as an auxiliary tool. Spyder provides an interactive
Python language development environment, and it has advanced editing, interactive testing, debugging, and introspection features [56]. Due to the standard structure of a Chinese patent, Regular Expression “re.findall(r’background(.+)contents’,text)” was used to extract each patent’s background section. Then, a maximum of 200 verbs or nouns were extracted from each background section using TextRank. Here, the frequency of keywords in TF-IDF was set from 10 to 90%. Next, a coherence model in Gensim was used to estimate the appropriate number of clusters. The perplexity for different clusters is shown in Figure 12. It shows that a smaller perplexity value indicates a more appropriate number of clusters. The cluster K value was thus set to 12.
Figure 12. The perplexity for each number of clusters.
Table 3 lists the final 12 classifications with 10 keywords (the closest to each center). Figure 13 shows the clustering results. The rightmost blue dot area is composed of four classifications. According to the keywords, they can be summed up as a “shoot or process image”, corresponding to the execution system of a UAV under the law of system integrity. The orange dot area is composed of two categories, they can be summed up as “control or flight”, according to the keywords, corresponding to the control system of a UAV under the law of system integrity. The leftmost green area is composed of three categories, and they all relate to “telecontrol”, according to their keywords. The red dot area above contains two categories. According to their keywords, they can be summed up as “engine or structures”, corresponding to the energy system and transmission system of an UAV under the law of system integrity. The last category of gray dots can be summed up as “communication” based on the keywords. Together, the patent set was regrouped into six patent classifications. Based on these proprietary technical features, six R&D
0.3
0.31
0.32
0.33
0.34
0.35
0.36
0.37
0.38
0.39
0.4
1 2 3 4 5 6 7 8 9 10 11 12 13 14 15 16 17 18 19 20
Perp
lexity
number of clusters
Figure 12. The perplexity for each number of clusters.
Table 3. Top 10 keywords of the 12 clusters, and the possibility distribution of six R&D themes.
Cluster Top 10 Keywords Function of UVA R&D Themes
1 direction, adjust, posture, implement, carry, shoot, osmo, engine, camera, rotate ShootExecution system2 machine, shoot, requirement, support, cost, aerial, need, flight, structure, develop Shoot
3 adjust, camera, adjust, lens, support, structure, install, osmo, use, cause Camera4 scope, image, shoot, sensor, made, cannot, machine, osmo, requirement, reduce Process Image
5 mission, perform, do, control, flight, apply, can, situation, field, requirement Control Control system6 make, control, flight, perform, do, position, lead, state, influence, tradition Flight
7 user, cannot, perform, flight, state, develop, apply, telecontrol, provide, situation TelecontrolOthers8 function, user, way, time, requirement, use, perform, apply, machine Telecontrol
9 become, perform, use, requirement, field, apply, influence, machine, device, make Telecontrol
10 rotate, connect, engine, lead, motor, exist, process, happen, become, provide Engine Energy system
11 increase, volume, lead, install, cannot, time, exist, happen, lens, requirement Structure Transmission system
12 claim, field, design, influence, develop, signal, requirement, restrict, apply, need Communication Communication system
Appl. Sci. 2022, 12, x FOR PEER REVIEW 17 of 25
themes were summarized, as in the last column of Table 3. They are the problem areas of existing products.
Figure 13. Result of K-means clustering.
Table 3. Top 10 keywords of the 12 clusters, and the possibility distribution of six R&D themes.
Cluster Top 10 Keywords Function of UVA R&D Themes 1 direction, adjust, posture, implement, carry, shoot, osmo, engine, camera, rotate Shoot
Execution system 2 machine, shoot, requirement, support, cost, aerial, need, flight, structure, develop Shoot 3 adjust, camera, adjust, lens, support, structure, install, osmo, use, cause Camera 4 scope, image, shoot, sensor, made, cannot, machine, osmo, requirement, reduce Process Image 5 mission, perform, do, control, flight, apply, can, situation, field, requirement Control
Control system 6 make, control, flight, perform, do, position, lead, state, influence, tradition Flight 7 user, cannot, perform, flight, state, develop, apply, telecontrol, provide, situation Telecontrol
Others 8 function, user, way, time, requirement, use, perform, apply, machine Telecontrol 9 become, perform, use, requirement, field, apply, influence, machine, device, make Telecontrol 10 rotate, connect, engine, lead, motor, exist, process, happen, become, provide Engine Energy system 11 increase, volume, lead, install, cannot, time, exist, happen, lens, requirement Structure Transmission system 12 claim, field, design, influence, develop, signal, requirement, restrict, apply, need Communication Communication system
NetworkX [57] was used to draw an IPC network, as shown in Figure 14. NetworkX is a python package for the creation, manipulation, and study of the structure, dynamics, and functions of complex networks. The degree of centrality of each R&D theme node was calculated according to Equation (2), and the results are shown in Table 4. Note that the value of the degree of each R&D theme node was obtained using the NetworkX. By comparison, the most difficult R&D theme was the “control system relating to flight”, the second most difficult was the “execution system relating to shoot and process image”, then the “telecontrol and communication system”, and finally the “energy system and the transmission system”.
Figure 13. Result of K-means clustering.

Appl. Sci. 2022, 12, 6755 17 of 24
NetworkX [57] was used to draw an IPC network, as shown in Figure 14. NetworkXis a python package for the creation, manipulation, and study of the structure, dynamics,and functions of complex networks. The degree of centrality of each R&D theme nodewas calculated according to Equation (2), and the results are shown in Table 4. Note thatthe value of the degree of each R&D theme node was obtained using the NetworkX. Bycomparison, the most difficult R&D theme was the “control system relating to flight”, thesecond most difficult was the “execution system relating to shoot and process image”,then the “telecontrol and communication system”, and finally the “energy system and thetransmission system”.
Appl. Sci. 2022, 12, x FOR PEER REVIEW 18 of 25
Figure 14. IPC network.
Table 4. Degree of centrality of the six R&D themes’ nodes in the IPC network.
Execution System (Shoot/Image Process)
Transmission System
(Structure)
Energy System (Engine)
Control System (Flight)
Communication System
Others (Customer/Manipulatio
n) 26 14 16 29 20 27
4.4. IPC-Based Coordinate System and Opportunity Identification An IPC-based coordination system of DJI’s patents was formed according to Section
3.2.4, and the results are shown in Figure 15. Patents in the region where the value of technological novelty is 8, which belongs to the top two most difficult domains, are technological opportunities with radial invention features, found at the upper right corner of Figure 15.
Figure 14. IPC network.
Table 4. Degree of centrality of the six R&D themes’ nodes in the IPC network.
Execution System(Shoot/Image Process)
TransmissionSystem
(Structure)Energy System
(Engine)Control System
(Flight)Communication
SystemOthers
(Customer/Manipulation)
26 14 16 29 20 27
4.4. IPC-Based Coordinate System and Opportunity Identification
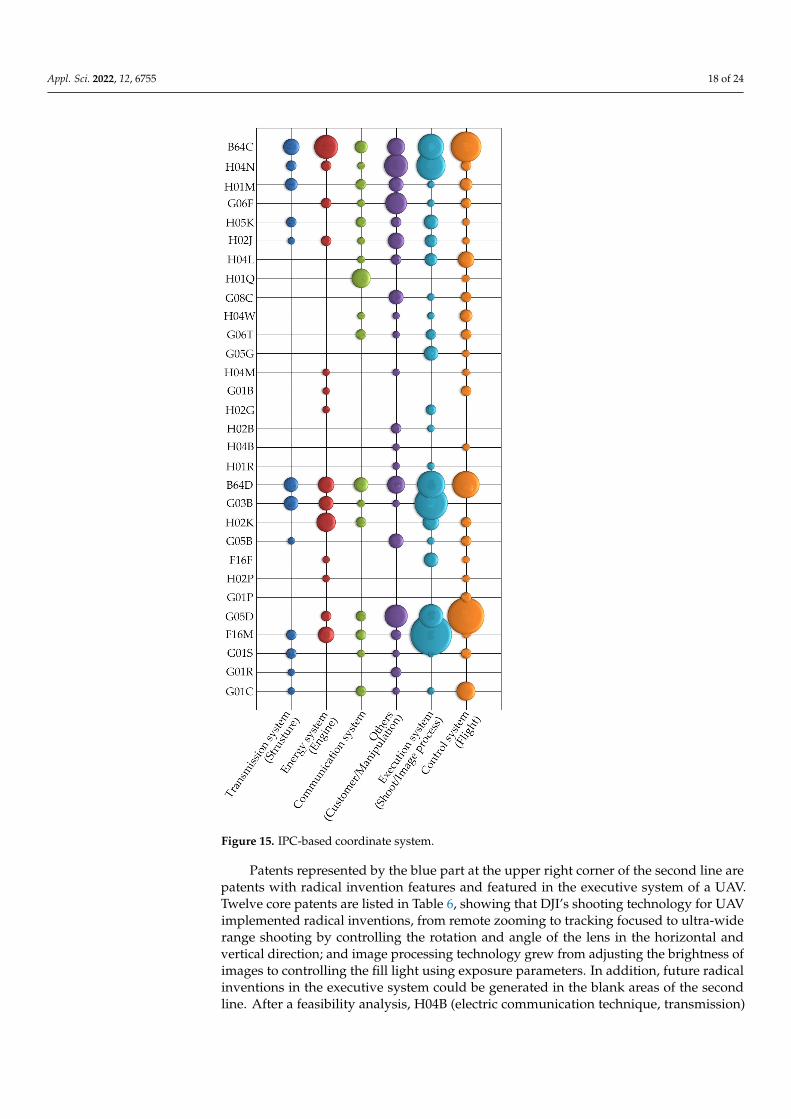
An IPC-based coordination system of DJI’s patents was formed according toSection 3.2.4, and the results are shown in Figure 15. Patents in the region where thevalue of technological novelty is 8, which belongs to the top two most difficult domains,are technological opportunities with radial invention features, found at the upper rightcorner of Figure 15.
Patents represented by the orange part in the upper right corner are patents withradical invention features, mainly in the “control system” of a UAV. Eight core patents arelisted in Table 5. This illustrates that DJI’s flight technology for a UAV implemented radicalinventions, from smooth flight controlled by a throttle, to flight position controlled bydistance, and angle to hover controlled by error and its error contribution rate. In addition,future radical inventions for the control system could be generated in the empty spacesof the first line. After a feasibility analysis, G02B (optical elements) could be used foradding interactive virtual content and guidance (AR) to assist flight control. This claimwas confirmed by patent CN108700741B, titled “Headsets and Video Glasses for UAV”,published on 21 August 2021.
Appl. Sci. 2022, 12, 6755 18 of 24Appl. Sci. 2022, 12, x FOR PEER REVIEW 19 of 25
Figure 15. IPC-based coordinate system. Figure 15. IPC-based coordinate system.
Patents represented by the blue part at the upper right corner of the second line arepatents with radical invention features and featured in the executive system of a UAV.Twelve core patents are listed in Table 6, showing that DJI’s shooting technology for UAVimplemented radical inventions, from remote zooming to tracking focused to ultra-widerange shooting by controlling the rotation and angle of the lens in the horizontal andvertical direction; and image processing technology grew from adjusting the brightness ofimages to controlling the fill light using exposure parameters. In addition, future radicalinventions in the executive system could be generated in the blank areas of the secondline. After a feasibility analysis, H04B (electric communication technique, transmission)

Appl. Sci. 2022, 12, 6755 19 of 24
can be used for designing a synchronous shooting system, having multiple cameras forthree-dimensional images.
Table 5. Patents with radical invention features for the control system of UAVs.
Patent Number Application Date Title Description
CN103935508B 9 April 2014
Auxiliary control method andauxiliary control system fordescending of unmanned
aerial vehicle
A method to improve the descendingstability of UAV, by adjusting throttle
outputs of the engine based on thedifference between the virtual and
actual altitude
CN105793792B 25 December 2014
Flight auxiliary method andsystem of unmanned aerialvehicle, unmanned aerial
vehicle, and mobile terminal
A method for long-range flight control,by defining the forward direction of a
UAV based on the positions of thetargeted destination and UAV
CN106104203B 13 July 2015A distance detecting method
and a device for a movingobject and an aircraft
A method for precise control of a UAV’sflight position, based on the actual
distance between the moving UAV andthe targeted position and on the virtual
distance and angle between them
CN106170676B 14 July 2015Method, device, and system
for determining movement ofmobile platform
A method for precise hover control of aUAV, by estimating the position errorbased on the correlation between the
error and its contribution
CN107000830B 10 November 2016 UAV descent controllingmethod and device and UAV
A method for smooth descent of a UAV,to mitigate the horizontal airflow by
adjusting the horizontal speed of UAV, sothat the drone can obtain a large descent
speed without sway
CN107108023B 22 December 2016 Unmanned aerial vehicle andcontrol method for same
Converting tasks into control instructionsto achieve autonomous cruising.
CN108780322B 24 May 2017 Method, device, and systemfor controlling UAV
An efficient UAV launching process andits control operation, based on the
throwing action
CN109074168B 23 January 2018 Control method,device and UAV
Control the flight of the drone based onthe position information of the user’s
hand in the captured image
Finally, future technological opportunities of radical inventions are predicted for UAVs.As drones spread to different industries, the boundaries of “civilian” and “industrial” UAVsare unclear. A growing number of applications use mission-driven UAVs with powerfulcomputing capabilities. Therefore, G06Q (data processing system or methods, speciallyadapted for supervisory of forecasting purposes) can be applied to implement the flightfunction in the control system. This technology has not been used in UAVs before. Thefirst attempts at the control system of UAVs use different technology to implement difficultfunctional elements. After the feasibility analysis, a flight control intelligent data analysisand decision support system could be achieved to confirm the safety of the flight control,monitor the real-time flight data, and forecast future operational states. In addition, thefuture sales of UAVs depend on the demand for video creation in the film and televisionindustry and entertainment market. G11B (recording, storing, or playback of information)can be applied to implement image processing functions in the execution system. Thefunctions of aided shooting and aided editing, as well as planning video content in advancecan be attached to UAVs. These functions will enable both professionals and amateurs toefficiently create professional videos using UAVs.

Appl. Sci. 2022, 12, 6755 20 of 24
Table 6. Patents with radical invention features in the executive system of UAVs.
Patent Number Application Date Title Description
CN103869442B 1 April 2014 Focusing device, shootingdevice and air vehicle
A method to remotely controlcamera zoom, for adapting
multi-scene shooting
CN103973941B 14 May 2014Method and system for
adjusting dynamic contrast ofdigital image or video
A method for high-qualitydigital image or video, to
dynamically adjust the imagecontrast by calculating the
conditional distributionfunction of the pixel
brightness of the image
CN104168403B 27 June 2014
High dynamic range videorecording method and device
based on Bayercolor filtering array
High dynamic range videorecording method using aBayer color filter array toeliminate the image blur
caused by high-speed motionand to reduce the frame rate
caused by high-speedcontinuous shooting
CN105793892B 9 December 2014Image processing method and
apparatus andphotographing device
Correct camera distortion ofwide-angle lenses
CN105874779B 31 March 2015
An image forming apparatus,a light filling control method
thereof, a system, and amovable object
A supplementary light filingcontrol method using the
imaging system’sexposure parameters
CN105519093B 29 April 2015Follow focus, remote control
follow focus system withsame and aircraft
Dynamic adjustment andtracking of the focus during
mobile shooting
CN107113376B 31 July 2015 Image processing method,device and camera
A method for anti-shaking,using the shake angle
CN105554480B 1 March 2016
Unmanned aerial vehicleimage shooting control
method and device, userdevice and
unmanned aerial vehicle
A method to improve theflexibility of shooting, by
dynamically adjusting theposition of the target on the
tracking screen
CN107079104B 24 August 2016
Wide angle photographshooting method, apparatus,
holder, unmanned aerialvehicle and robot
A method forultra-wide-range shooting bycontrolling the rotation and
angle of the lens in horizontaland vertical directions
CN110313174B 15 May 2019 Shooting controlmethod and device
The control information isdetected from the voiceinformation, to meet the
automation and intelligentneeds of user shooting control
CN112106341B 30 August 2019 Shooting method, device andshooting equipment
Quickly respond to shutteropening information to more
accurately recordshooting moments
CN112513731B 28 February 2020
Exposure unit, lens assembly,photographing equipment,
and method of assembling theexposure unit
Partially block the lightentrance, to adjust
exposure parameters

Appl. Sci. 2022, 12, 6755 21 of 24
5. Discussion
A framework for identifying technological opportunities for radical inventions (RIs) isestablished in a novel way. Previous studies did not demonstrate a clear understandingof the conditions under which radical inventions (RIs) form, usually identifying a largenumber of general technological opportunities before screening them out. This kindof post-screening is costly, with limited guidance for improving the effectiveness of theidentification process. The method proposed in this study considers the characteristics ofRIs at an early stage, and uses the value of difficulty (VOD) of the problems solved andthe value of technological novelty (VON) of new technology applied to directly identifytechnological opportunities for RIs, without extra costs in processing noisy data. Thisis helpful for managers and designers to quickly and accurately identify technologicalopportunities for RIs.
Patent maps were developed for evaluating the technological novelty of patents. Previ-ous studies have tended to utilize technical details in patent texts. However, after extractinga large number of micro-technical details from the patent text, it is still necessary to sum-marize this information into macro-technical points, to represent the patent technology,which is not only time-consuming but also misleading. In comparison, using patent filingdates and international patent classification codes (IC), we built a novel patent map todetermine the VON of patent technology. This method allows innovation managers toquickly locate novel patents based on the high VON of IC, to determine the novelty ofpatents classified under the IC. At the same time, this method can help industrial firms toimprove the utilization of structured patent data.
The use of natural language processing, K-means clustering, and complex networkanalysis in unstructured patent data has been applied to various tasks. Natural languageprocessing pre-processes unstructured patent data into structured data, and combines theanalysis results of K-means clustering and complex network analysis to obtain the desiredinformation intelligently. In this study, we used the intelligent computation of VOD foreach patent. With the spread of artificial intelligence, theoretical research and the practicalapplication of intelligent technological opportunity analysis using patent data mining arecontinuously being developed. This will reduce the difficulty of technology developmentand encourage more firms into radical innovation.
6. Conclusions
A plethora of studies have suggested methods for discovering technological oppor-tunities based on patents. The motivation of this study was similar, but the scope of ourresearch extended to the identification of technological opportunities for radical inventions,providing specific guidelines for creating new technological ideas for radical inventions.Generally, previous studies applied innovation management strategies to investigate tech-nological opportunities for radical inventions. However, this paper proposed an IPC-based,natural language processing, K-means cluster analysis and complex network analysis-aidedapproach, to effectively identify technological opportunities of radical inventions.
This research employed a coordination system based on the values of the technologicalnovelty (VON) of each technology manifested in a patent set and the values of difficulty(VOD) of each R&D theme developed by a patent set, to distinguish potential technologicalopportunities for radical inventions. As a result, technological opportunities with both ahigher VON of technology manifested in patents, and a higher VOD of technical problemssolved by patents, seem more likely to result in radical inventions. Moreover, the expertknowledge in the IPC system was further investigated, as well as keywords being extractedfrom patent documents. Methods of determining VON and VOD were proposed based onthe bifurcation and hierarchical features of the IPC system, distribution characteristics ofthe IPC symbols, and keywords in a patent set.
There are also several limitations of the proposed approach. Although the featuresof the IPC system can reflect the difference between technologies, the results are still ap-proximate for analyzing sophisticated cutting-edge technology. In future studies, semantic

Appl. Sci. 2022, 12, 6755 22 of 24
analysis will be applied to investigate the titles of IPC symbols, for further measurementof technological distance. In addition, natural language processing was used to extractmeaningful keywords from the background section of patents, but the results containedsome noisy data. In future, methods to facilitate the extraction of features and reduce noisewill be introduced, by adding updated natural language processing technology and usingdeep learning algorithms, such as subject–action–object analysis, dependency parsing, andstructure topic models. To achieve better analysis results, we will also add multi-criteria toinput variables and run a post-analysis on the results, such as a MANOVA test. Last butnot the least, here we focused on one Chinese firm’s UAV patenting, and in future studieswe will evaluate this approach on multiple datasets, to check its generalizability, such aswith other UAV firms’ patents, semiconductors, and drug patents, etc.
Author Contributions: Conceptualization, W.Y. and G.C.; methodology, W.Y. and J.Z.; writing—originaldraft preparation, W.Y.; writing—review and editing, Q.P. and C.H.; visualization, W.Y.; supervision,G.C.; funding acquisition, G.C. All authors have read and agreed to the published version of themanuscript.
Funding: This research was funded by the National Science Foundation of China, grant number51805142, the National Innovation Method Work Special Project of China, grant number 2019IM020200,the Hebei Province Innovative Ability Uplifting Project of China, grant number 21567657H.
Institutional Review Board Statement: Not applicable.
Informed Consent Statement: Not applicable.
Data Availability Statement: The data that support the findings of this study are available in[Patsnap] at [https://analytics.zhihuiya.com] (accessed on 12 June 2022).
Conflicts of Interest: The authors declare that there are no conflict of interest regarding the publica-tion of this paper.
References1. Zhang, J.; Tan, R. Radical concept generation inspired by cross–domain knowledge. Appl. Sci. 2022, 12, 4929. [CrossRef]2. Escrig-Tena, A.B.; Segarra-Cipres, M.; Beatriz-Juan, B. Incremental and radical product innovation capabilities in a quality
management context: Exploring the moderating effects of control mechanisms. Int. J. Prod. Econ. 2021, 232, 107994. [CrossRef]3. Coccia, M. Sources of technological innovation: Radical and incremental innovation problem–driven to support competitive
advantage of firms. Technol. Anal. Strateg. Manag. 2017, 29, 1048–1061. [CrossRef]4. Sood, A.; Tellis, G.R. Technological evolution and radical innovation. J. Mark. 2005, 69, 152–168. [CrossRef]5. Schoenmakers, W.; Duysters, G. The technological origins of radical inventions. Res. Policy 2010, 39, 1051–1059. [CrossRef]6. Maine, E.; Thomas, V.J.; Utterback, J. Radical innovation from the confluence of technology: Innovation management strategies
for the emerging nanobiotechnology industry. J. Eng. Technol. Manag. 2014, 32, 1–25. [CrossRef]7. O’Connor, G.C.; Rice, M.P. New market creation for breakthrough innovations: Enabling and constraining mechanisms. J. Prod.
Innov. Manag. 2012, 30, 209–227. [CrossRef]8. Herrmann, T.; Roth, D.; Binz, H. Approach for identifying and initially assessing radical product ideas. In Proceedings of the 2018
IEEE International Conference on Engineering, Technology and Innovation (ICE/ITMC), Stuttgart, Germany, 17–20 June 2018.9. Yang, X.; Liu, X.; Song, J. A study on technology competition of graphene biomedical technology based on patent analysis. Appl.
Sci. 2019, 9, 2613. [CrossRef]10. Lee, M.T.; Su, W.N. Search for the developing trend by patent analysis: A case study of lithium–lon battery electrolytes. Appl. Sci.
2020, 10, 952. [CrossRef]11. Park, S.; Jun, S. Patent analysis using Bayesian data analysis and network modeling. Appl. Sci. 2022, 12, 1423. [CrossRef]12. Tseng, C.Y. Technology development and knowledge spillover in Africa: Evidence using patent and citation data. Int. J. Technol.
Manag. 2009, 45, 50–61. [CrossRef]13. Yoon, J.; Kim, K. Identifying rapidly evolving technological trends for R&D planning using SAO–based semantic patent networks.
Scientometrics 2011, 88, 213–228.14. Kim, B.; Gazzola, G.; Lee, J.M.; Kim, D.; Kim, K.; Jeong, M.K. Inter–cluster connectivity analysis for technology opportunity
discovery. Scientometrics 2014, 98, 1811–1825. [CrossRef]15. Wang, X.F.; Ma, P.P.; Huang, Y.; Guo, J.F.; Zhu, D.H.; Porter, A.L.; Wang, Z.N. Combining SAO semantic analysis and morphology
analysis to identify technology opportunities. Scientometrics 2017, 111, 3–24. [CrossRef]16. Lee, S.; Kim, M.S.; Park, Y.; Kim, C. Identification of a technological chance in product–service system using KeyGraph and text
mining on business method patents. Int. J. Technol. Manag. 2016, 70, 239–256. [CrossRef]

Appl. Sci. 2022, 12, 6755 23 of 24
17. Li, X.; Zhou, Y.; Xue, L.; Huang, L.C. Roadmapping for industrial emergence and innovation gaps to catch–up: A patent–basedanalysis of OLED industry in China. Int. J. Technol. Manag. 2016, 72, 105–143. [CrossRef]
18. Feng, L.; Niu, Y.; Wang, J. Development of morphology analysis–based technology roadmap considering layer expansion paths:Application of TRIZ and text mining. Appl. Sci. 2020, 10, 8498. [CrossRef]
19. Yang, C.; Zhu, D.H.; Wang, X.F.; Zhang, Y.; Zhang, G.Q.; Lu, J. Requirement–oriented core technological components’ identificationbased on SAO analysis. Scientometrics 2017, 112, 1229–1248. [CrossRef]
20. Kim, K.; Park, K.; Lee, S. Investigating technology opportunities: The use of SAOx analysis. Scientometrics 2018, 118, 45–70.[CrossRef]
21. Liu, L.F.; Li, Y.; Xiong, Y.; Cavallucci, D. A new function–based patent knowledge retrieval tool for conceptual design of innovativeproducts. Comput. Ind. 2020, 115, 103154. [CrossRef]
22. Liu, H.; Li, W.; Li, Y. A new computational method for acquiring effect knowledge to support product innovation. Knowl. BasedSyst. 2021, 231, 107410. [CrossRef]
23. Yan, B.W.; Luo, J.X. Measuring technological distance for patent mapping. J. Assoc. Inf. Sci. Technol. 2016, 68, 423–437. [CrossRef]24. McDermott, C.M.; O’Connor, G.C. Managing radical innovation: An overview of emergent strategy issues. J. Prod. Innov. Manag.
2002, 19, 424–438. [CrossRef]25. Penker, M.; Khoh, S.B. Cultivating growth and radical innovation success in the fourth industrial revolution with big data
analytics. In Proceedings of the 2018 IEEE International Conference on Industrial Engineering and Engineering Management(IEEM), Bangkok, Thailand, 16–19 December 2018.
26. Asthana, P. Jumping the technology s–curve. IEEE Spectr. 1995, 32, 49–54. [CrossRef]27. Dahlin, K.B.; Behrens, D.M. When is an invention really radical? Defining and measuring technological radicalness. Res. Policy
2005, 34, 717–737. [CrossRef]28. Liu, W.; Tan, R.H.; Cao, G.Z.; Zhang, Z.Y.; Huang, S.Y.; Liu, L.M. A proposed radicality evaluation method for design ideas at
conceptual design stage. Comput. Ind. Eng. 2019, 132, 141–152. [CrossRef]29. Lecossier, A.; Pallot, M. UX–FFE model: An experimentation of a new innovation process dedicated to a mature industrial
company. In Proceedings of the 2017 International Conference on Engineering, Technology and Innovation (ICE/ITMC), Madeira,Portugal, 27–29 June 2017.
30. Story, V.M.; Daniels, K.; Zolkiewski, J.; Dainty, A.R.J. The barriers and consequences of radical innovations: Introduction to theissue. Ind. Mark. Manag. 2014, 43, 1271–1277. [CrossRef]
31. De Bont, C.; Liu, S.X. Breakthrough innovation through design education: Perspectives of design–led innovators. Des. Issues 2017,33, 18–30. [CrossRef]
32. Saliminamin, S.; Becattini, N.; Cascini, G. Sources of creativity stimulation for designing the next generation of technical systems:Correlations with R&D designers’ performance. Res. Eng. Des. 2019, 30, 133–153.
33. Vergragt, P.J.; Brown, H.S. Sustainable mobility: From technological innovation to societal learning. J. Clean. Prod. 2007,15, 1104–1115. [CrossRef]
34. Schwartz, P. Technological innovation opportunities. Comput. People 1974, 23, 33.35. Porter, A.L.; Detampel, M.J. Technology opportunities analysis. Technol. Forecast. Soc. Chang. 1995, 49, 237–255. [CrossRef]36. Kim, Y.G.; Suh, J.H.; Park, S.C. Visualization of patent analysis for emerging technology. Expert Syst. Appl. 2008, 34, 1804–1812.
[CrossRef]37. Geum, Y.; Kim, M. How to identify promising chances for technological innovation: Keygraph–based patent analysis. Adv. Eng.
Inform. 2019, 46, 101155. [CrossRef]38. Park, H.; Kim, K.; Choi, S.; Yoon, J. A patent intelligence system for strategic technology planning. Expert Syst. Appl. 2013,
40, 2373–2390. [CrossRef]39. Lee, Y.; Kim, S.Y.; Song, I.; Park, Y.; Shin, J. Technology opportunity identification customized to the technological capability of
SMEs through two–stage patent analysis. Scientometrics 2014, 100, 227–244. [CrossRef]40. Song, K.; Kim, K.S.; Lee, S. Discovering new technology opportunities based on patents: Text–mining and F–term analysis.
Technovation 2017, 60–61, 1–14. [CrossRef]41. Altuntas, S.; Dereli, T.; Kusiak, A. Forecasting technology success based on patent data. Technol. Forecast. Soc. Chang. 2015,
20, 202–214. [CrossRef]42. Problem Solving Methodology for Innovation: TRIZ/USIT, Its Philosophy, Methods, Knowledge Bases, and Software Tools. Avail-
able online: https://the-trizjournal.com/problem-solving-methodology-innovation-trizusit-philosophy-methods-knowledge-bases-software-tools/ (accessed on 25 March 2021).
43. Overall Dataflow Structure Creative Problem Solving TRIZ/USIT. Available online: https://the-trizjournal.com/overall-dataflow-structure-creative-problem-solving-trizusit/ (accessed on 25 March 2021).
44. Tool, Object, Product (TOP) Function Analysis. Available online: https://the-trizjournal.com/tool-object-product-top-function-analysis/ (accessed on 25 March 2021).
45. Using the Ideal Final Result to Define the Problem to Be Solve. Available online: https://the-trizjournal.com/using-ideal-final-result-define-problem-solved/ (accessed on 25 March 2021).
46. Shao, P.; Tan, R.; Peng, Q.; Zhang, L.; Wang, K.; Dong, Y. Problem–solving in product innovation based on the Cynefinframework–Aided TRIZ. Appl. Sci. 2022, 12, 4157. [CrossRef]

Appl. Sci. 2022, 12, 6755 24 of 24
47. Christensen, C.M. The ongoing process of building a theory of disruption. J. Prod. Innov. Manag. 2006, 23, 39–55. [CrossRef]48. Rafii, F.; Kampas, P.J. How to identify your enemies before they destroy you. Harv. Bus. Rev. 2002, 80, 115–134.49. Guo, J.; Tan, R.H.; Sun, J.G.; Cao, G.Z.; Zhang, L. An approach for generating design Scheme of new market disruptive products
driven by function differentiation. Comput. Ind. Eng. 2016, 102, 302–315. [CrossRef]50. O’Connor, G.C.; Rice, M.P. A comprehensive model of uncertainty associated with radical innovation. J. Prod. Innov. Manag. 2013,
30, 2–18. [CrossRef]51. Radical Innovation and Design Research. Available online: https://the-trizjournal.com/radical-innovation-design-research/
(accessed on 25 March 2021).52. Liu, W.; Tan, R.H.; Cao, G.Z.; Yu, F.; Li, H. Creative design through knowledge clustering and case–based reasoning. Eng. Comput.
2020, 36, 527–541. [CrossRef]53. Salton, G.; Yang, C.S.; Yu, C.T. A theory of term importance in automatic text analysis. J. Am. Soc. Inf. Sci. 1975, 26, 33–44.
[CrossRef]54. Dialogue DJI’s CEO Luo Zhenhua: How Did DJI Open up Overseas Markets. Available online: https://www.thepaper.cn/
newsDetail_forward_2795499 (accessed on 25 March 2021).55. Sze, H.C.; Chun, Y.S.; Yau, K.Y.; Zhang, Y.F. Da Jiang Innovation, DJI: The future of possible. Acad. Asian Bus. Rev. 2017, 3, 83–109.56. Spyder. Available online: https://www.spyder--ide.org (accessed on 25 March 2021).57. NetworkX. Available online: https://networkx.org/documentation/stable/install.html (accessed on 25 March 2021).