Effective dose from natural background radiation in Keffi and Akwanga towns, central Nigeria
6
International Journal of Radiation Research, January 2014 Volume 12, No 1 Effective dose from natural background radiation in Keffi and Akwanga towns, central Nigeria INTRODUCTION Human is exposed to radiation in their environment with or without their consent; and the exposure to natural background radiation is an unpreventable event on earth. Atomic radiation has no boundaries; and the injuries and clinical symptoms induced by exposure to ionizing radiation include; direct chromosomal transformation, indirect free‐radical formation, radiation cataractogenesis, cancer induction, bone necrosis, etc. (1) . The practice has been to ensure that human exposure to radiation is as low as reasonably achievable known as the ALARA principle. The main sources of natural radiation are; cosmic rays, primordial radionuclides in the earth's crust, ingested radionuclides and lung irradiation due to radon ( 222 Rn) and thoron ( 220 Rn) in air; which are classiϐied into external and internal sourcese (2‐4) . Man's exposure to natural radiation exceeds that from all technologies put together (5) ; and the International Atomic Energy Agency (IAEA) estimate of the dose contribution to the environment shows that, over 85% of background radiation received by man is derived from natural radio‐nuclides, while the remaining 15% is from cosmic rays and nuclear process (6) . Previous studies have shown that areas with high background radiation are found in Yangjiang, China; Kerele, India; and Ramsar, Iran (7) ; and in Asia, maximum outdoor measurement was recorded in Malaysia and the maximum indoor measurement was recorded in Hong A. Termizi Ramli 1 , A.S. Aliyu 1* , E.H. Agba 2 , M.A. Saleh 1 1 Department of Physics, Faculty of science, University Technology Malaysia 2 Department of Physics, Faculty of Science Benue State University Makurdi, Nigeria ABSTRACT Background: Human is exposed to radiaƟon in their environment with or without their consent; and the exposure to natural background radiaƟon is an unpreventable event on earth. Materials and Methods: An in situ assessment of the indoor and outdoor background radiaƟon in Akwanga and Keffi towns of Nasarawa state Nigeria was carried out using a halogen‐quenched Geiger Muller (GM) detector (Inspector alert Nuclear radiaƟon monitor SN: 3544). Each of these towns was divided into at least 20 sampling areas where at least ten readings were taken in order to have a reliable data. Results: The mean indoor and outdoor annual effecƟve dose of Akwanga were 1.29± 0.13mSv/yr and 0.31±0.04 mSv/yr respecƟvely; and that of Keffi were 1.08± 0.15mSv/yr and 0.25±0.04 mSv/yr respecƟvely. The radiaƟon levels in both highly populated towns were found to be within the safe limit for areas of normal background set by UNSCEAR (2.4 mSv/yr). Conclusion: These results would serve as a baseline upon which other exposures would be assessed and in the future, serve as reference for dosimetry and decontaminaƟon in situaƟons of radiaƟon poisoning of these towns. Keywords: Indoor, outdoor, background radiation, effective dose, Keffi. * Corresponding author: Dr. Abubakar Sadiq Aliyu, Fax: +60 655 66162 E‐mail:[email protected] Submitted: Oct. 2012 Accepted: June 2013 Int. J. Radiat. Res., January 2014; 12(1): 47-52 ► Original article
-
Upload
nsukonline -
Category
Documents
-
view
0 -
download
0
Transcript of Effective dose from natural background radiation in Keffi and Akwanga towns, central Nigeria
International Journal of Radiation Research, January 2014 Volume 12, No 1
Effective dose from natural background radiation in Keffi and Akwanga towns, central Nigeria
INTRODUCTION
Human is exposed to radiation in theirenvironmentwithorwithouttheirconsent;andtheexposuretonaturalbackgroundradiationisan unpreventable event on earth. Atomicradiation has no boundaries; and the injuriesand clinical symptoms induced by exposure toionizing radiation include; direct chromosomaltransformation, indirect free‐radical formation,radiation cataractogenesis, cancer induction,bone necrosis, etc. (1). The practice has been toensure that human exposure to radiation is aslow as reasonably achievable known as theALARAprinciple.The main sources of natural radiation are;
cosmic rays, primordial radionuclides in theearth's crust, ingested radionuclides and lung
irradiation due to radon (222Rn) and thoron(220Rn)inair;whichareclassi iedintoexternalandinternalsourcese(2‐4).Man's exposure to natural radiation exceeds
that from all technologies put together(5); andthe International Atomic EnergyAgency (IAEA)estimate of the dose contribution to theenvironment shows that, over 85% ofbackground radiation received by man isderived from natural radio‐nuclides, while theremaining15%isfromcosmicraysandnuclearprocess(6).Previousstudieshaveshown thatareaswith
high background radiation are found inYangjiang,China;Kerele,India;andRamsar,Iran(7);andinAsia,maximumoutdoormeasurementwas recorded in Malaysia and the maximumindoor measurement was recorded in Hong
A. Termizi Ramli1, A.S. Aliyu 1*, E.H. Agba 2, M.A. Saleh1
1DepartmentofPhysics,Facultyofscience,UniversityTechnologyMalaysia
2DepartmentofPhysics,FacultyofScienceBenueStateUniversityMakurdi,Nigeria
ABSTRACT
Background: Human is exposed to radia on in their environment with or without their consent; and the exposure to natural background radia on is an unpreventable event on earth. Materials and Methods: An in situ assessment of the indoor and outdoor background radia on in Akwanga and Keffi towns of Nasarawa state Nigeria was carried out using a halogen‐quenched Geiger Muller (GM) detector (Inspector alert Nuclear radia on monitor SN: 3544). Each of these towns was divided into at least 20 sampling areas where at least ten readings were taken in order to have a reliable data. Results: The mean indoor and outdoor annual effec ve dose of Akwanga were 1.29± 0.13mSv/yr and 0.31±0.04 mSv/yr respec vely; and that of Keffi were 1.08± 0.15mSv/yr and 0.25±0.04 mSv/yr respec vely. The radia on levels in both highly populated towns were found to be within the safe limit for areas of normal background set by UNSCEAR (2.4 mSv/yr). Conclusion: These results would serve as a baseline upon which other exposures would be assessed and in the future, serve as reference for dosimetry and decontamina on in situa ons of radia on poisoning of these towns. Keywords: Indoor, outdoor, background radiation, effective dose, Keffi.
*Correspondingauthor:Dr.AbubakarSadiqAliyu,Fax:+6065566162E‐mail:[email protected]
Submitted: Oct. 2012 Accepted: June 2013
Int. J. Radiat. Res., January 2014; 12(1): 47-52
► Original article
Termizi Ramli et al. / Effective dose from natural background radiation
KongandIran(8).In Nigeria, studies have been conducted in
differentareastomeasurethenaturalradiationlevelintheareas.Forinstance,itisreportedthattheequivalentdosedue tooutdoorexposuretoradiationinAbeakuta,Nigeriarangedfrom0.19to1.64mSv/ywiththemeanof0.45mSv/y(9).AnationwidestudyoftheterrestrialradiationinNigeria indicatesthatthemeanannualeffectivedoseequivalentis0.27mSv/y(10),Sadiqetal.(11)measuredthebackgroundradiationintheminesofNasarawastate;resultsindicatedthatAlizagaQuarry has the maximum reading of 2.60mSv/y.WhiletheeffectivedoseequivalentattheMaloney Hill Quarry in Kef i is 1.75 mSv /y. Asurvey of gamma terrestrial radiation inNigerian coal mine indicated mean outdoorreadingsof10.4nGy/hand11.7nGy/hfortheOkabaandOkparaminesrespectively(12).Table 1 shows the natural radiation dose in
some Nigerian towns. These readings wereobtainedbypilotmeasurementof theabsorbeddoserate.
The present work aims at extending thesurveytomeasurethedoseequivalentfortownsin the northern region of Nigeria; especiallyareas that are marked for mining of solidminerals (inNasarawa state). The result of thissurveywould serveasbase linedata for futurereferences.
Studyarea
Geographically,Kef i is locatedatLatitude80
Int. J. Radiat. Res., Vol. 12 No. 1, January 2014 48
Table 1. Natural radia on in some Nigerian ci es(4) *.
City Dose Equivalent (μSv /y)
Lagos 943.2±35.9
Ijebu Ode 1279.0±14.0
Ibadan 1146.9±20.1
Awka 976.0±42.7
Benin city 1249.8±78.8
Oweri 1009.8±28.1
Port‐Harcourt 1073.6±39.1
Enugu 1026.6±148.6
*This table only accounts for ci es in Southern Nigeria.
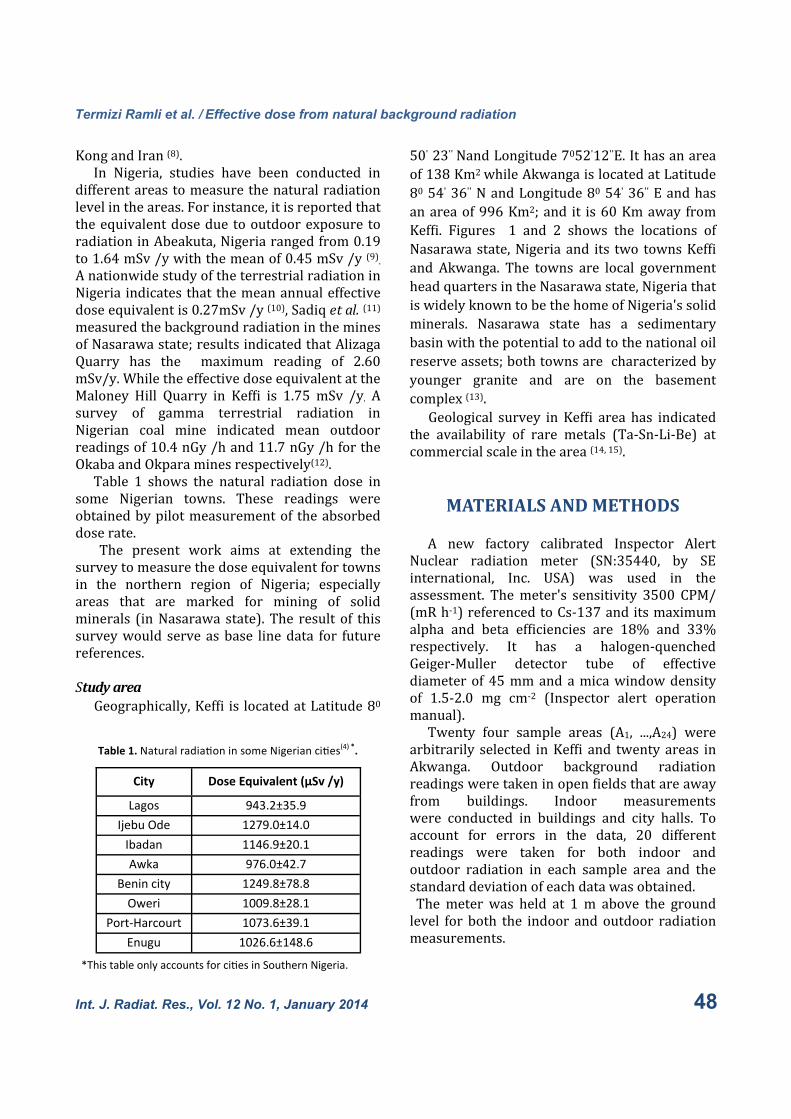
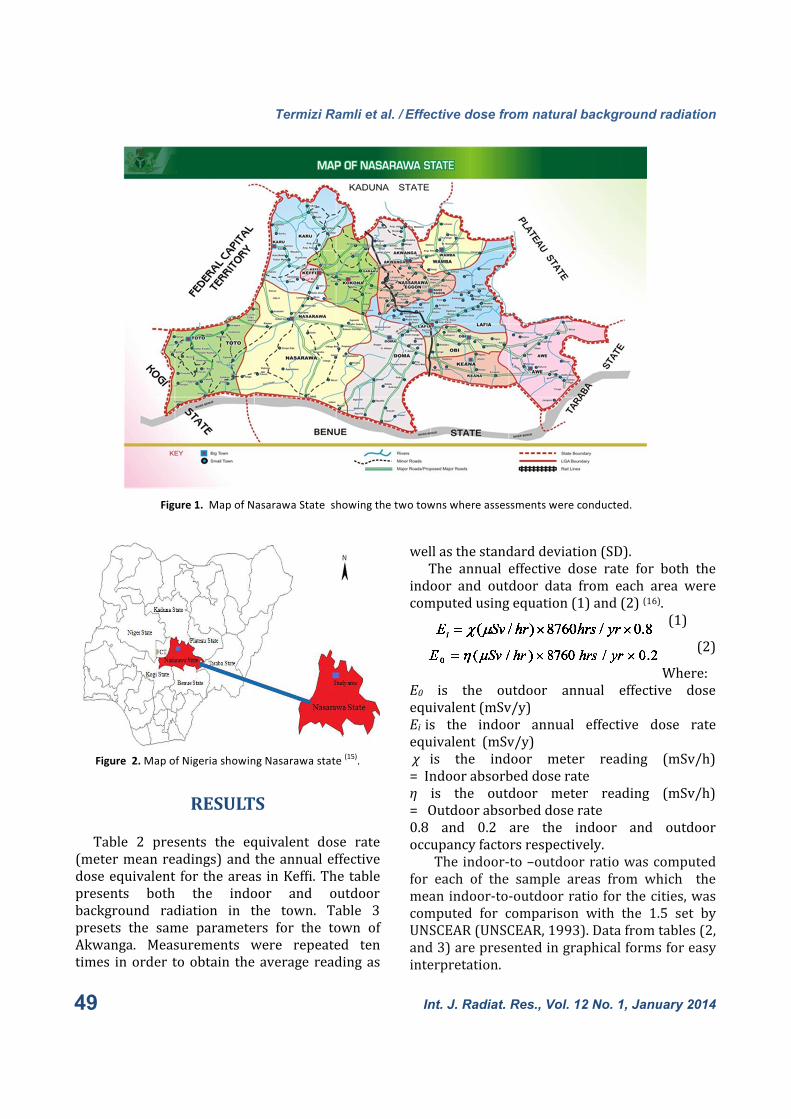
50'23''NandLongitude7052'12''E.Ithasanareaof138Km2whileAkwangaislocatedatLatitude8054'36''NandLongitude8054'36''Eandhasanareaof996Km2;and it is60Kmaway fromKef i. Figures 1 and 2 shows the locations ofNasarawastate,Nigeria and its two townsKef iand Akwanga. The towns are local governmentheadquartersintheNasarawastate,NigeriathatiswidelyknowntobethehomeofNigeria'ssolidminerals. Nasarawa state has a sedimentarybasinwiththepotentialtoaddtothenationaloilreserveassets;bothtownsarecharacterizedbyyounger granite and are on the basementcomplex(13).
Geological survey in Kef i area has indicatedthe availability of rare metals (Ta‐Sn‐Li‐Be) atcommercialscaleinthearea(14,15).
MATERIALSANDMETHODS
A new factory calibrated Inspector Alert
Nuclear radiation meter (SN:35440, by SEinternational, Inc. USA) was used in theassessment. Themeter's sensitivity 3500 CPM/(mRh‐1)referencedtoCs‐137anditsmaximumalpha and beta ef iciencies are 18% and 33%respectively. It has a halogen‐quenchedGeiger‐Muller detector tube of effectivediameterof45mmandamicawindowdensityof 1.5‐2.0 mg cm‐2 (Inspector alert operationmanual).Twenty four sample areas (A1, ...,A24) were
arbitrarily selected inKef i and twentyareas inAkwanga. Outdoor background radiationreadingsweretakeninopen ieldsthatareawayfrom buildings. Indoor measurementswere conducted in buildings and city halls. Toaccount for errors in the data, 20 differentreadings were taken for both indoor andoutdoor radiation in each sample area and thestandarddeviationofeachdatawasobtained.Themeter was held at 1m above the groundlevel for both the indoor andoutdoor radiationmeasurements.
Termizi Ramli et al. / Effective dose from natural background radiation
49
Figure 2. Map of Nigeria showing Nasarawa state (15).
Figure 1. Map of Nasarawa State showing the two towns where assessments were conducted.
RESULTS
Table 2 presents the equivalent dose rate(metermeanreadings)andtheannualeffectivedoseequivalent for theareas inKef i.Thetablepresents both the indoor and outdoorbackground radiation in the town. Table 3presets the same parameters for the town ofAkwanga. Measurements were repeated tentimes inorder toobtain theaverage readingas
wellasthestandarddeviation(SD).The annual effective dose rate for both the
indoor and outdoor data from each area werecomputedusingequation(1)and(2)(16).
(1)
(2)
Where:E0 is the outdoor annual effective doseequivalent(mSv/y)Ei is the indoor annual effective dose rateequivalent(mSv/y)χ is the indoor meter reading (mSv/h)=Indoorabsorbeddoserateη is the outdoor meter reading (mSv/h)=Outdoorabsorbeddoserate0.8 and 0.2 are the indoor and outdooroccupancyfactorsrespectively.
The indoor‐to–outdoorratiowascomputedfor each of the sample areas from which themeanindoor‐to‐outdoorratio forthecities,wascomputed for comparison with the 1.5 set byUNSCEAR(UNSCEAR,1993).Datafromtables(2,and3)arepresentedingraphicalformsforeasyinterpretation.
Int. J. Radiat. Res., Vol. 12 No. 1, January 2014
Termizi Ramli et al. / Effective dose from natural background radiation
50
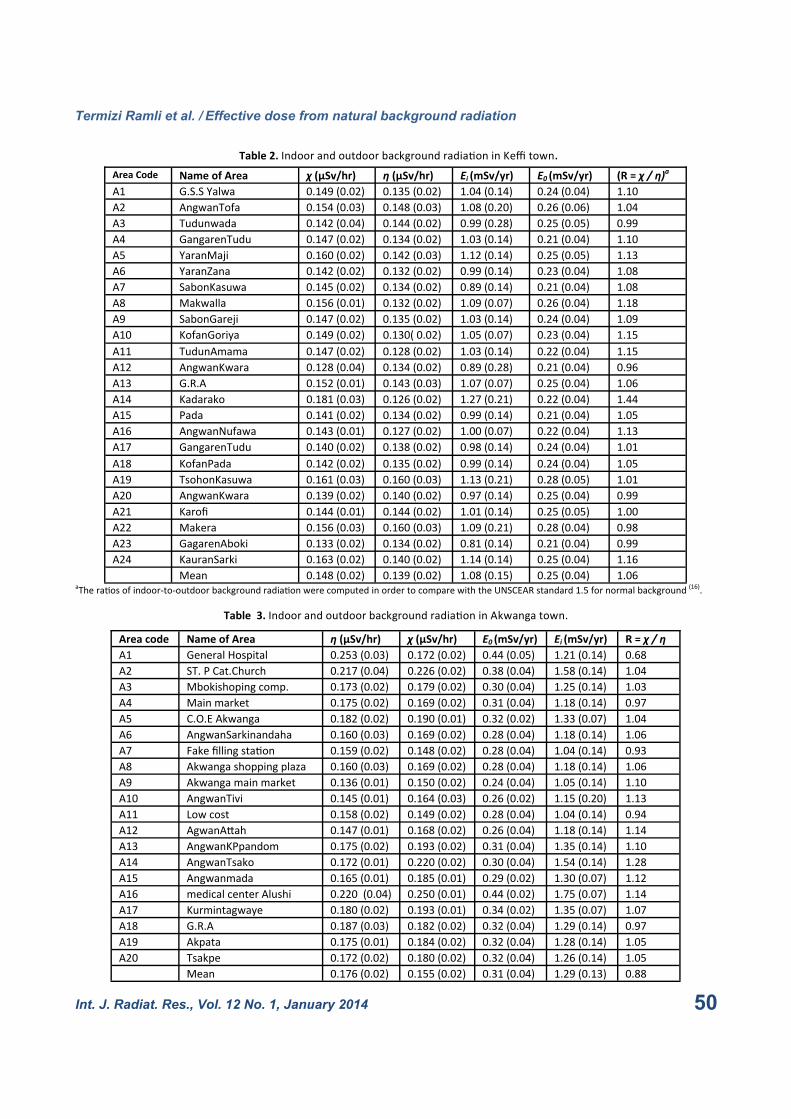
Table 2. Indoor and outdoor background radia on in Keffi town.
Area Code Name of Area χ (μSv/hr) η (μSv/hr) Ei (mSv/yr) E0 (mSv/yr) (R = χ / η)a
A1 G.S.S Yalwa 0.149 (0.02) 0.135 (0.02) 1.04 (0.14) 0.24 (0.04) 1.10
A2 AngwanTofa 0.154 (0.03) 0.148 (0.03) 1.08 (0.20) 0.26 (0.06) 1.04
A3 Tudunwada 0.142 (0.04) 0.144 (0.02) 0.99 (0.28) 0.25 (0.05) 0.99
A4 GangarenTudu 0.147 (0.02) 0.134 (0.02) 1.03 (0.14) 0.21 (0.04) 1.10
A5 YaranMaji 0.160 (0.02) 0.142 (0.03) 1.12 (0.14) 0.25 (0.05) 1.13
A6 YaranZana 0.142 (0.02) 0.132 (0.02) 0.99 (0.14) 0.23 (0.04) 1.08
A7 SabonKasuwa 0.145 (0.02) 0.134 (0.02) 0.89 (0.14) 0.21 (0.04) 1.08
A8 Makwalla 0.156 (0.01) 0.132 (0.02) 1.09 (0.07) 0.26 (0.04) 1.18
A9 SabonGareji 0.147 (0.02) 0.135 (0.02) 1.03 (0.14) 0.24 (0.04) 1.09
A10 KofanGoriya 0.149 (0.02) 0.130( 0.02) 1.05 (0.07) 0.23 (0.04) 1.15
A11 TudunAmama 0.147 (0.02) 0.128 (0.02) 1.03 (0.14) 0.22 (0.04) 1.15
A12 AngwanKwara 0.128 (0.04) 0.134 (0.02) 0.89 (0.28) 0.21 (0.04) 0.96
A13 G.R.A 0.152 (0.01) 0.143 (0.03) 1.07 (0.07) 0.25 (0.04) 1.06
A14 Kadarako 0.181 (0.03) 0.126 (0.02) 1.27 (0.21) 0.22 (0.04) 1.44
A15 Pada 0.141 (0.02) 0.134 (0.02) 0.99 (0.14) 0.21 (0.04) 1.05
A16 AngwanNufawa 0.143 (0.01) 0.127 (0.02) 1.00 (0.07) 0.22 (0.04) 1.13
A17 GangarenTudu 0.140 (0.02) 0.138 (0.02) 0.98 (0.14) 0.24 (0.04) 1.01
A18 KofanPada 0.142 (0.02) 0.135 (0.02) 0.99 (0.14) 0.24 (0.04) 1.05
A19 TsohonKasuwa 0.161 (0.03) 0.160 (0.03) 1.13 (0.21) 0.28 (0.05) 1.01
A20 AngwanKwara 0.139 (0.02) 0.140 (0.02) 0.97 (0.14) 0.25 (0.04) 0.99
A21 Karofi 0.144 (0.01) 0.144 (0.02) 1.01 (0.14) 0.25 (0.05) 1.00
A22 Makera 0.156 (0.03) 0.160 (0.03) 1.09 (0.21) 0.28 (0.04) 0.98
A23 GagarenAboki 0.133 (0.02) 0.134 (0.02) 0.81 (0.14) 0.21 (0.04) 0.99
A24 KauranSarki 0.163 (0.02) 0.140 (0.02) 1.14 (0.14) 0.25 (0.04) 1.16
Mean 0.148 (0.02) 0.139 (0.02) 1.08 (0.15) 0.25 (0.04) 1.06 aThe ra os of indoor‐to‐outdoor background radia on were computed in order to compare with the UNSCEAR standard 1.5 for normal background (16).
Area code Name of Area η (μSv/hr) χ (μSv/hr) E0 (mSv/yr) Ei (mSv/yr) R = χ / η
A1 General Hospital 0.253 (0.03) 0.172 (0.02) 0.44 (0.05) 1.21 (0.14) 0.68 A2 ST. P Cat.Church 0.217 (0.04) 0.226 (0.02) 0.38 (0.04) 1.58 (0.14) 1.04 A3 Mbokishoping comp. 0.173 (0.02) 0.179 (0.02) 0.30 (0.04) 1.25 (0.14) 1.03 A4 Main market 0.175 (0.02) 0.169 (0.02) 0.31 (0.04) 1.18 (0.14) 0.97 A5 C.O.E Akwanga 0.182 (0.02) 0.190 (0.01) 0.32 (0.02) 1.33 (0.07) 1.04 A6 AngwanSarkinandaha 0.160 (0.03) 0.169 (0.02) 0.28 (0.04) 1.18 (0.14) 1.06 A7 Fake filling sta on 0.159 (0.02) 0.148 (0.02) 0.28 (0.04) 1.04 (0.14) 0.93 A8 Akwanga shopping plaza 0.160 (0.03) 0.169 (0.02) 0.28 (0.04) 1.18 (0.14) 1.06 A9 Akwanga main market 0.136 (0.01) 0.150 (0.02) 0.24 (0.04) 1.05 (0.14) 1.10 A10 AngwanTivi 0.145 (0.01) 0.164 (0.03) 0.26 (0.02) 1.15 (0.20) 1.13 A11 Low cost 0.158 (0.02) 0.149 (0.02) 0.28 (0.04) 1.04 (0.14) 0.94 A12 AgwanA ah 0.147 (0.01) 0.168 (0.02) 0.26 (0.04) 1.18 (0.14) 1.14 A13 AngwanKPpandom 0.175 (0.02) 0.193 (0.02) 0.31 (0.04) 1.35 (0.14) 1.10 A14 AngwanTsako 0.172 (0.01) 0.220 (0.02) 0.30 (0.04) 1.54 (0.14) 1.28 A15 Angwanmada 0.165 (0.01) 0.185 (0.01) 0.29 (0.02) 1.30 (0.07) 1.12 A16 medical center Alushi 0.220 (0.04) 0.250 (0.01) 0.44 (0.02) 1.75 (0.07) 1.14 A17 Kurmintagwaye 0.180 (0.02) 0.193 (0.01) 0.34 (0.02) 1.35 (0.07) 1.07 A18 G.R.A 0.187 (0.03) 0.182 (0.02) 0.32 (0.04) 1.29 (0.14) 0.97 A19 Akpata 0.175 (0.01) 0.184 (0.02) 0.32 (0.04) 1.28 (0.14) 1.05 A20 Tsakpe 0.172 (0.02) 0.180 (0.02) 0.32 (0.04) 1.26 (0.14) 1.05 Mean 0.176 (0.02) 0.155 (0.02) 0.31 (0.04) 1.29 (0.13) 0.88
Table 3. Indoor and outdoor background radia on in Akwanga town.
Int. J. Radiat. Res., Vol. 12 No. 1, January 2014
Termizi Ramli et al. / Effective dose from natural background radiation
Int. J. Radiat. Res., Vol. 12 No. 1, January 2014 51
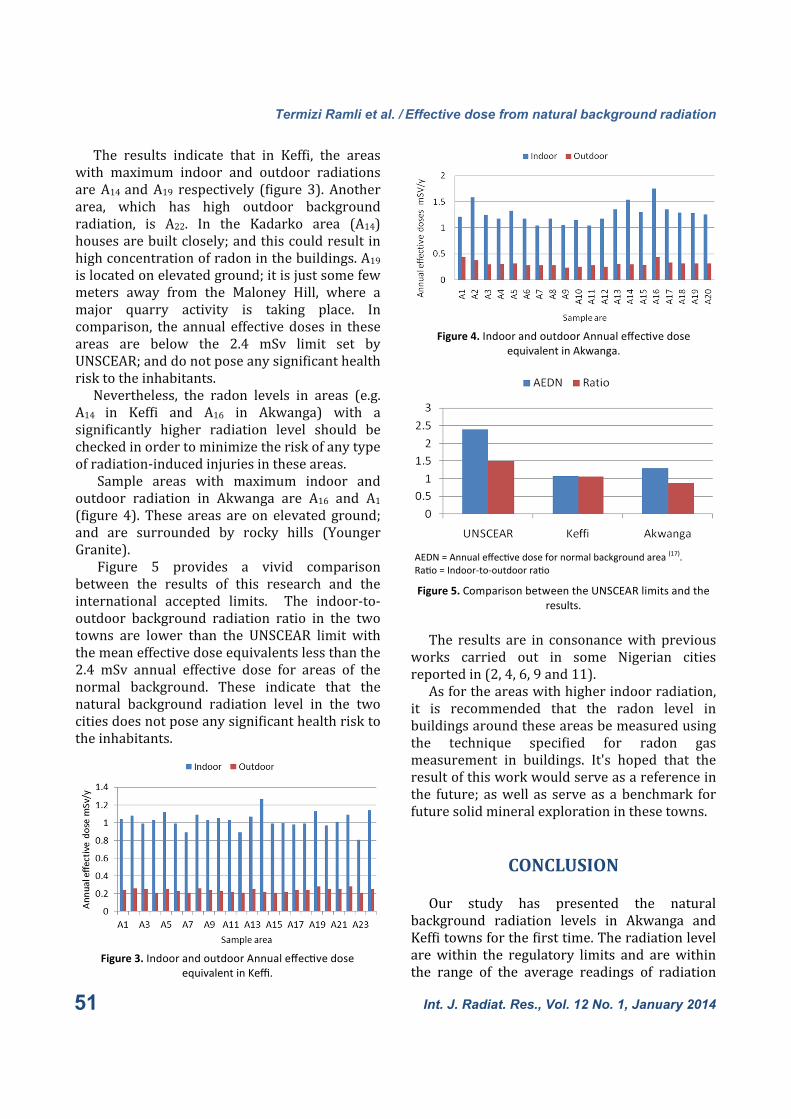
The results indicate that in Kef i, the areaswith maximum indoor and outdoor radiationsareA14 andA19 respectively ( igure 3). Anotherarea, which has high outdoor backgroundradiation, is A22. In the Kadarko area (A14)housesarebuiltclosely;andthiscouldresultinhighconcentrationofradoninthebuildings.A19islocatedonelevatedground;itisjustsomefewmeters away from the Maloney Hill, where amajor quarry activity is taking place. Incomparison, the annual effectivedoses in theseareas are below the 2.4 mSv limit set byUNSCEAR;anddonotposeanysigni icanthealthrisktotheinhabitants.Nevertheless, the radon levels in areas (e.g.
A14 in Kef i and A16 in Akwanga) with asigni icantly higher radiation level should becheckedinordertominimizetheriskofanytypeofradiation‐inducedinjuriesintheseareas.
Sample areas with maximum indoor andoutdoor radiation in Akwanga are A16 and A1( igure 4). These areas are on elevated ground;and are surrounded by rocky hills (YoungerGranite).
Figure 5 provides a vivid comparisonbetween the results of this research and theinternational accepted limits. The indoor‐to‐outdoor background radiation ratio in the twotowns are lower than the UNSCEAR limit withthemeaneffectivedoseequivalentslessthanthe2.4 mSv annual effective dose for areas of thenormal background. These indicate that thenatural background radiation level in the twocitiesdoesnotposeanysigni icanthealthrisktotheinhabitants.
The results are in consonancewith previousworks carried out in some Nigerian citiesreportedin(2,4,6,9and11).Asfortheareaswithhigherindoorradiation,
it is recommended that the radon level inbuildingsaroundtheseareasbemeasuredusingthe technique speci ied for radon gasmeasurement in buildings. It's hoped that theresultofthisworkwouldserveasareferenceinthe future; aswell as serve as a benchmark forfuturesolidmineralexplorationinthesetowns.
CONCLUSION
Our study has presented the naturalbackground radiation levels in Akwanga andKef itownsforthe irsttime.Theradiationlevelarewithin the regulatory limits and arewithinthe range of the average readings of radiation
Figure 3. Indoor and outdoor Annual effec ve dose equivalent in Keffi.
Figure 4. Indoor and outdoor Annual effec ve dose equivalent in Akwanga.
AEDN = Annual effec ve dose for normal background area (17). Ra o = Indoor‐to‐outdoor ra o
Figure 5. Comparison between the UNSCEAR limits and the results.
Termizi Ramli et al. / Effective dose from natural background radiation
52
limits reported in literatures (2, 4, 6, 9,11) cities inthe southern Nigeria. The average equivalentdoseratesforbothindoorandoutdoorradiationexposureinAkwangaandKef itownshavebeenmeasured using a halogen‐quenched GMdetector. These results provide the essentialbaseline information for the assessment of anyenvironmentalradioactivecontaminationof theareainforeseeablefuture.
AKNOWLEDGEMETS
The corresponding author appreciates theDepartment of Physics Nasarawa StateUniversity, Nigeria for providing him with theequipment used for this work and our sincereappreciation goes to the Malaysian Ministry ofHigher educationand theUniversityTechnologyMalaysia for providing a research grant(GUP‐Q.J.130000.7126.00H70)fromwhichpartofthisworkissupported.
REFERENCES
1. Norman EB (2008) Review of common occupa onal hazards and safely concerns for nuclear medicine technologist. Journal of Nuclear Med Tech, 36: 11‐17.
2. Sadiq AA and Agba EH (2011) Background radia on in Akwanga, Nigeria. Working and Living environmental Protec on, 8: 7‐11.
3. War SA, Nongkynrih P, Khathing DT, Iongwai PS (2009) Assessment of indoor radia on level in environs of the uranium deposit area of West Khasi Hills District, Meghalaya, India. Journal of Environmental Radioac vity, 100: 965‐969.
4. Obioha FI and Okwonkwo PO (2001) Background gamma radia on in Nigerian Environment. West Afri Radiol, 8: 16‐19.
5. United Na ons Scien fic Commi ee on the Effects of
atomic Radia on. Sources and effects of ionizing radia on. UNSCERAR 2010 report to General Assembly, with annexes. New York: United Na ons; 2010.
6. Agba EH, Onjefu SA, Ugwuani JU (2006) Preliminary inves ga on of ambient radia on levels of the of mining sites in Benue State, Nigeria. Nig Journ Phys, 18: 219‐222.
7. Ghiassi‐nejad M, Mortazavi SMJ, Cameron JR, Niroomand‐rad A, Karam PA (2002) Very high background radia on areas of Ramsar, Iran: Preliminary Biological studies. Heath Physics, 82: 87‐93.
8. Gholami M, Mirzael S, Jomehzadeh A (2011) Gamma background radia on measurement in Lorestan Province, Iran. Iran J Radiat Res, 9: 89‐93.
9. Farai IP and Vicent UE (2006) Outdoor radia on level measurement in Abeokuta, Nigeria. The rmoluminescent Dosimetry. Nig Journ Phys, 18: 121‐126.
10. Farai IP and Jibri NN (2000) Baseline studies of terrestrial outdoor gamma dose rate levels, in Nigeria. Radiat Prot Dosim, 88: 247‐254.
11.Sadiq AA, Liman MS, Agba EH, Abdullahi E, Lawal Z, Ibrahim U, Gurku MU(2010) Assessment of exposure to ionizing radia on in selected mining sites of Nasarawa state, Nigeia. Intergrated Journal of Science and Engineering,9: 46‐51.
12. Mokobia CE and Balogun FA (2004) Background gamma terrestrial dose rate in Nigeria func onal coal mines. Radiat Prot Dosim, 108: 169‐173.
13. Obaje NG (2000)Geology and mineral resources of Nigeria. Springer. London.
14. Olugbenga A and Onesimus OO (2009) Raremetal (Ta‐Sn‐Li‐Be) distribu on in Precambrian Pegma es of Keffi area, Central Nigeria. Nature and Science, 90‐99.
15. Anudu GK, Essien BI, Onuba LN, Ikpokone AE (2011) Liment analysis and interpreta on for assessment of groundwater poten al of Wamba and Adjoining areas, Nasarawa State, North Central Nigeria. J Appl Sci Tech Environ Sanit, 1: 185‐198.
16. United Na ons Scien fic commi ee on the effects of atomic radia on (1988) Source, effects and risk of ionizing radia on. UNSCEAR 1988 report to General Assembly, with annexes. New York: United Na ons.
17. United Na ons Scien fic Commi ee on the Effects of atomic Radia on (1993) Sources and effects of ionizing radia on. UNSCERAR 1993 report to General Assembly, with annexes. New York: United Na ons .
Int. J. Radiat. Res., Vol. 12 No. 1, January 2014