Central Region Small and Medium Towns Development Project
520
Project Number: TA 4485 July 2006 Socialist Republic of Viet Nam: Central Region Small and Medium Towns Development Project (Financed by the Japan Special Fund) Volume I Prepared by Dr. Joji Reyes GHK International Hanoi, Viet Nam For the Ministry of Construction Management Board of Urban Technical Infrastructure Development Projects This consultant’s report does not necessarily reflect the views of ADB or the Government concerned, and ADB and the Government cannot be held liable for its contents. All the views expressed herein may not be incorporated into the proposed project’s design. Technical Assistance Consultant’s Report
-
Upload
khangminh22 -
Category
Documents
-
view
0 -
download
0
Transcript of Central Region Small and Medium Towns Development Project

Project Number: TA 4485 July 2006
Socialist Republic of Viet Nam: Central Region Small and Medium Towns Development Project (Financed by the Japan Special Fund) Volume I
Prepared by Dr. Joji Reyes
GHK International
Hanoi, Viet Nam
For the Ministry of Construction Management Board of Urban Technical Infrastructure Development Projects
This consultant’s report does not necessarily reflect the views of ADB or the Government concerned, and ADB and the Government cannot be held liable for its contents. All the views expressed herein may not be incorporated into the proposed project’s design.
Technical Assistance Consultant’s Report

TA 4485 – VIET NAM Central Region Small and Medium Towns Development Project: Final Report
June 2006
Page i
TABLE OF CONTENTS
Page VOLUME I EXECUTIVE SUMMARY viii 1. INTRODUCTION 1 2. BACKGROUND 1 2.1 Macroeconomic Context 1 2.2 Urban Water Supply and Sanitation Sector 5 2.3 External Assistance to the Sector 9 2.4 Lessons Learned 9 2.5 ADB’s Sector Strategy 11 2.6 Institutional and Policy Reform Context 11 3. PROJECT RATIONALE 12 3.1 Origin, Legal, Policy and Technical Basis of the Project 12 4. THE PROJECT AREA 18 4.1 Project Provinces 18 4.2 Location of Candidate Towns 19 4.3 Status and Characteristics of Candidate Towns 19 5. PRIORITIZATION PROCESS OF THE CANDIDATE TOWNS 19 5.1 Need for Assistance 23 5.2 Commitment and Capacity of the PPC 23 5.3 Existence of a Master Plan 23 5.4 Previous ADB Assistance in WSS 23 5.5 Economic Justification 24 5.6 Poverty Reduction Focus 24 5.7 Beneficiaries’ Willingness-to-Pay 25 5.8 Resettlement Impact 25 5.9 Environmental Impact 26 5.10 Government Development Needs and Priorities 26 6. SOCIOECONOMIC AND COMMUNITY HEALTH CONDITIONS 26

TA 4485 – VIET NAM Central Region Small and Medium Towns Development Project: Final Report
June 2006
Page ii
7. SECTOR OPPORTUNITIES AND CHALLENGES IN THE PROJECT TOWNS 32 8. MASTER PLANS, DESIGN AND TECHNICAL CONSIDERATIONS 32 8.1 Status of Master Plans 32 8.2 Design Philosophy 34 8.3 Planning and Design Criteria 35 8.4 Technology and Technical Consideration 38 9. THE PROPOSED PROJECT 42 9.1 Goal and Objective 42 9.2 Proposed Components and Subcomponents by the Provinces 42 9.3 Proposed Project Components and Subcomponents 44 10. PROJECT COST ESTIMATES AND FINANCIAL PLAN 52 10.1 Cost Estimates 53 10.2 Project Financing Plan 54 11. IMPLEMENTATION ARRANGEMENTS 55 11.1 Evolution of Institutional Arrangements 55 11.2 Proposed Implementation Arrangements 56 11.3 Implementation Schedule 57 11.4 Procurement and Bidding Plan 58 11.5 Consulting Services 61 11.6 Disbursement Arrangements 62 11.7 Accounting, Auditing, and Reporting 63 11.8 Project Performance Monitoring and Evaluation 63 11.9 Project Review 64 12. SOCIAL AND POVERTY ASSESSMENT 64 12.1 Socioeconomic Surveys and Consultations 64 12.2 Socioeconomic and Community Health Conditions in the Towns 65 12.3 Poverty and Social Analysis 66 12.4 Stakeholders Analysis 67 12.5 Ethnic Minority Analysis and Development Plan 69 12.6 Gender Analysis and Action Plan 70 13. PROJECT ECONOMIC ANALYSIS 72 13.1 Approach and Methodology 72 13.2 Water Supply Development and Expansion 72 13.3 Drainage and Wastewater Management 74

TA 4485 – VIET NAM Central Region Small and Medium Towns Development Project: Final Report
June 2006
Page iii
13.4 Overall Economic Rate of Return 13.5 Other Nonquantified Benefits
13.6 Benefit Distribution and Poverty Impact Analyses
75 76 76
14. PROJECT FINANCIAL ANALYSIS 77 14.1 Financial Analysis Methodology 77 14.2 Cost Recovery and Preliminary Tariff Calculations 77 14.3 Affordability and Willingness to Pay 78 14.4 Financial Internal Rates of Return and Sensitivity Analysis 81 14.5 Assessment of Financial Capacity 81 15. LAND ACQUISITION AND RESETTLEMENTS 81 16. ENVIRONMENTAL ASSESSMENT 84 16.1 Environmental Assessment Process and Procedures 84 16.2 GOV Regulations and Classification 84 16.3 State of the Environment in the Subproject Areas 84 16.4 Environmental Impacts 85 16.5 Mitigation Measures 87 16.6 Environmental Management and Monitoring
16.7 Public Consultation 87 89
17. MANAGEMENT AND O&M OF URBAN WSS SERVICES 90 17.1 Existing Management of Urban WSS Services in Project Towns 90 17.2 Management Models for Urban WSS Services 91 17.3 Training and Capacity Building Program 96 17.4 O&M of Subproject Facilities 97 18. PROJECT BENEFITS, IMPACTS AND RISKS 98 18.1 Benefits and Impacts 98 18.2 Risks 98 19. CONCLUSIONS AND RECOMMENDATIONS 99 19.1 Conclusions 99 19.2 Recommendation 99

TA 4485 – VIET NAM Central Region Small and Medium Towns Development Project: Final Report
June 2006
Page iv
VOLUME II APPENDICES Appendix 1 External Assistance to the Urban Sector (1993 – 2003) Appendix 2 Socioeconomic Development Plans of Participating Provinces Appendix 3 Social Survey Methodology and Findings Appendix 4 Urban Water Supply and Sanitation Sector Analysis Appendix 5 Policy and Institutional Reform Agenda Appendix 6 Design and Monitoring Framework Appendix 7 Infrastructure Subproject and Component Descriptions Appendix 8 General Layout of Proposed Water Supply and Sanitation Systems Appendix 9 Detailed Cost Estimates and Financing Plan Appendix 10 Detailed Cost Estimates and Financing Plan (Option 2) Appendix 11 Outline Terms of Reference for Consulting Services Appendix 12 Benefit Monitoring and Evaluation Framework Appendix 13 Social, Gender and Poverty Analysis Appendix 14 Participation Strategy Appendix 15 Enthnic Minority Development Plan Appendix 16
Appendix 17 Appendix 18 Appendix 19 Appendix 20 Appendix 21 Appendix 22
Gender Analysis, Strategy and Action Plan Project Economic Analysis Project Financial Analysis Financial Assessment of Participating Provinces Financial Analysis of Potential Project Operating Entities Summary Assessment of Land Acquisition and Resettlment Summary Initial Environmental Assessment
VOLUME III
SUPPLEMENTARY APPENDCES: RESETTLEMENT PLAN VOLUME IV
SUPPLEMENTARY APPENDICES: INITIAL ENVIRONMENTAL EXAMINATIONS

TA 4485 – VIET NAM Central Region Small and Medium Towns Development Project: Final Report
June 2006
Page v
ABBREVIATIONS
ADB Asian Development Bank
AFD Agence Francaise De Developpement
AIEC Average Incremental Economic Cost
AIFC Average Incremental Financial Cost
AP Affected Persons
ATP Ability To Pay
BME Benefit Monitoring And Evaluation
CPC Commune Peoples’ Committee
CPRGS Comprehensive Poverty Reduction And Growth Strategy (Gov)
CPSC Central Project Steering Committee
CRUEIP Central Region Urban Environmental Improvement Project
CSMT Central Region Small And Medium Towns Development Project
DANIDA Danish International Development Agency
DFR Draft Final Report (For Adb)
DOC Department Of Construction
DOF Provincial Level Department Of Finance
DOH Provincial Level Department Of Health
DONRE Provincial Level Department Of Natural Resources And Environment
DPC District People’s Committee
DPI Provincial Level Department Of Planning And Investment
DWM Drainage And Wastewater Management
EA Executing Agency
EIA Environmental Impact Assessment
EIRR Economic Internal Rate Of Return
EMDP Ethnic Minority Development Plan
EMP Environmental Management Plan
EOCC Economic Opportunity Cost Of Capital
FIRR Financial Internal Rate Of Return
FS Feasibility Study
GHK Ghk International, Ltd. (The Lead Consultant)
GOV Government Of Vietnam
HCMC Ho Chi Minh City
HSBC Hygiene And Sanitation Behavioral Change
HH Households
ICB International Competitive Bidding
IEE Initial Environmental Examination

TA 4485 – VIET NAM Central Region Small and Medium Towns Development Project: Final Report
June 2006
Page vi
IRS International Resettlement Specialist
LAR Land Acquisition And Resettlement
LCB Local Competitive Bidding
LPCD Liters Per Capita Per Day
MABUTIP Management Board For Urban Technical Infrastructure Development Projects
MDG Millennium Development Goals
MOC Ministry Of Construction
MOF Ministry Of Finance
MONRE Ministry Of Natural Resources And Environment
MPI Ministry Of Planning And Investment
NRM Non-Revenue Water
O&M Operation And Maintenance
ODA Overseas Development Assistance
PAH Project Affected Households
PCU Project Coordination Unit
PIR Poverty Impact Ratio
PMU Project Management Unit
PPC Provincial Peoples’ Committee
PPMU Provincial Project Management Unit
PPU Project Preparation Unit
PPTA Project Preparatory Technical Assistance
PRE-FS Pre-Feasibility Study
PSC Project Steering Committee
PSP Private Sector Participation
PWC Public Works Company
PWSC Provincial Water Supply Company
RAP Resettlement Action Plan
RP Resettlement Plan
RRP Report And Recommendations To The President (Adb Report)
ROW Right Of Way
SES Socioeconomic Survey
SIEE Summary Initial Environmental Examination
STP Sewage Treatment Plant
SWM Solid Waste Management
TA Technical Assistance
TAR Technical Assistance Report
TOR Terms Of Reference
TPC Town People’s Committee

TA 4485 – VIET NAM Central Region Small and Medium Towns Development Project: Final Report
June 2006
Page vii
TWU Town Women’s Union
UFW Unaccounted For Water
UPWC Urban Public Works Company
URENCO Urban Environmental Company
USD Us Dollar
VDG Vietnam Development Goals
VND Viet Nam Dong
VWU Vietnam Women’s Union
WACC Weighted Average Cost Of Capital
WELI Water And Environmental Consultants, Ltd. (Ppta Subcontractor)
WS Water Supply
WSC Water Supply Company
WSP Wastewater Stabilization Pond
WSS Water Supply And Sanitation
WQ Water Quality
WTP Water Treatment Plant
WTP Willingness To Pay

TA 4485 – VIET NAM Central Region Small and Medium Towns Development Project: Final Report
June 2006
Page 1

TA 4485 – VIET NAM Central Region Small and Medium Towns Development Project: Final Report Page 21
June 2006
Figure 1. Location Map of Candidate Project Towns

TA 4485 – VIET NAM Central Region Small and Medium Towns Development Project: Final Report viii
June 2006
EXECUTIVE SUMMARY
Project Rationale Over the last three decades, Viet Nam has managed to transform itself from being one of the poorest countries in the world into one of the fastest growing in the Asia region. The country’s sustained economic growth has created jobs for the unemployed and has helped to reduce its number of poor households. The Government is targeting an annual average GDP growth rate of 7.5-8.0 percent for the period 2006-2010. Under its proposed socioeconomic development plan, the GDP share of the agriculture sector will become smaller at about 16 percent, industry and construction’s share will increase slightly to 43 percent, while the services sector’s share will climb to 41 percent. However, growing urbanization will be a fundamental aftermath of Viet Nam’s economic transformation from an agriculture economy to an industrialized economy. The Ministry of Construction (MOC) forecasts that the country will be 45 percent urbanized by 2020 mainly due to the continued rural-to-urban migration caused by greater farm mechanization in the rural areas and perceived higher incomes in the urban growth centers. Higher population densities triggered by rapid urbanization will put additional pressures on the already inadequate infrastructure services, including water supply and sanitation, in Viet Nam’s urban areas. In response, the Government’s orientation plans for water supply and sanitation services target that by 2010, 80-90 percent of the urban population will have access to clean water; 40 percent of urban areas and 70 percent of industrial zones will be equipped with centralized wastewater treatment systems; 80-90 percent of solid waste will be collected, and over 60 percent of hazardous waste and 100 percent of medical waste will be treated. Viet Nam’s Central Region, comprising the northern central, central coastal, and central highland provinces, contributes the lowest share to the country’s GDP. It is also the poorest, accounting for 38.2 percent of the country’s total poverty. Viet Nam’s socioeconomic development plan targets growth in the Central Region to accelerate and become more dynamic, enabling it to catch up with the other regions. Growth in the region will be stimulated through the industry and services sectors, with the share of agriculture projected to decline and follow the trends in other parts of the country. Coastal economic zones will be developed based on the areas’ potentials and competitive advantages for tourism, fishery, maritime industries, and oil refinery. As a consequence, the Central Region, will also experience higher levels of urbanization, increasing the demand for infrastructure including water supply and sanitation, in the region’s rapidly developing urban centers comprising the small and medium towns. The Project was designed to reduce poverty by supporting economic growth in the region’s urban centers. It was also envisioned to improve the quality of life of the urban population in the Central Region of Viet Nam through sustainable improvement in water supply and sanitation, given the increasing pressures of urbanization resulting from the region’s anticipated acceleration in its economic growth.
Project Objective The primary objective of the Project is to improve public health and urban
environmental conditions in the selected project towns.
Project Components and
Outputs
The Project will have five major interrelated components consisting of the following: (i) community environmental sanitation and awareness; (ii) water supply development and expansion; (iii) drainage and wastewater systems; (iv) solid waste management; and (v) project management and institutional strengthening.

TA 4485 – VIET NAM Central Region Small and Medium Towns Development Project: Final Report ix
June 2006
Part A: Community Environmental Sanitation and Awareness.
Building on the success of previous ADB projects in Viet Nam, the proposed component will consist of (i) a hygiene and sanitation awareness program; and (ii) community-based sanitation microfinance. The hygiene and sanitation awareness subcomponent will develop information, education, and communication (IEC) mechanisms to promote environmental sanitation awareness among community residents in selected sites and to provide overall support the implementation of the Project.The community-based sanitation microfinance will primarily assist poor households in subproject towns to access microcredit aimed at enabling them to connect to piped WSS services. It will also facilitate the provision of social safety nets and livelihood opportunities for households affected by the Project, particularly the wastepickers. Under the subcomponent, social intermediation will be undertaken through the Viet Nam’s Women Union (VWU) which has considerable experience in working effectively and efficiently at the community level. Through appropriate social intermediation activities such as community training-workshops and meetings, the poor households in the communities will acquire the knowledge, values, and skills they need to access livelihood microfinance and connect to piped water supply and sanitation (WSS) services as part of their home improvement activities.
Part B: Water Supply Development and Expansion. The Project will develop, expand or improve piped water supply in eight of the Project towns. The existing water supply systems in Ninh Hoa, Van Gia, Tan Son and Gia Nghia will be expanded from 7,000 m3/day to 30,500 m3/day combined capacity. New water supply systems with combined capacities of 10,000 m3/day will be developed in Ea T’Ling, Dak Mam, and Quang Khe. About 160 km of new transmission and distribution pipes will be installed and an estimated 18,000 new connections will be added. The Project will procure mechanical and electrical equipment as well as equipment for construction, operation and maintenance of the water supply systems. In the four towns with existing water supply systems, corroded or leaky pipes will be rehabilitated or replaced, and UFW programs will be carried out to identify the main sources of technical and commercial losses, provide equipment and training for leak detection, and reduce UFW to optimum levels based on cost-benefit analyses.
Part C: Drainage and Wastewater Management. Part C has three subcomponents, namely: (i) complete drainage and wastewater systems for Class III and Class IV cities and towns; (ii) small scale drainage works for Class V towns, and; (iii) public sanitation works. The Project will develop complete, integrated stormwater drainage, wastewater collection and wastewater management systems in the five Class III and Class IV towns of Tuy Hoa, Cam Ranh, Thap Cham, Phan Thiet and Gia Nghia. It will also introduce centralized wastewater treatment systems in the towns, where justified and affordable. The objectives are to (i) rapidly convey stormwater to the nearest rivers or streams; (ii) reduce flooding and ponding; and (iii) ensure that wastewater is removed from urban areas and treated to appropriate standards prior to discharge to the environment. The small-scale drainage works subcomponent will develop, and improve the combined drainage systems in four towns, namely Song Cau, Ea T’ling, Dak Mam and Quang Khe which have few or no drains at present. The drains are designed to relieve flooding and ponding in selected areas and complement the proposed water supply development by removing wastewater from densely populated areas. The public sanitation subcomponent aims to improve public health, and reduce pollution in the urban areas. It will introduce a septic tank management system; improve sanitation facilities in public areas such as markets,

TA 4485 – VIET NAM Central Region Small and Medium Towns Development Project: Final Report x
June 2006
primary and secondary schools, bus stations, cultural centers, parks and health clinics, and supply O&M equipment for sanitation.
Part D: Solid Waste Management. The Project will improve solid waste management in five towns, namely Song Cau, Cam Ranh, Ninh Hoa, Van Gia, and Gia Nghia. The existing waste collection and transport systems will be expanded and re-equipped to increase collection coverage, sanitary landfills will be developed for waste disposal, and new equipment will be procured for waste transport and landfill operation.
Part E: Project Management and Institutional Strengthening. Under this component, assistance will be provided to the Project Coordination Units (PCU), Provincial Project Management Units (PPMUs), concerned WSS service providers, and VWU to enhance project management, thereby ensuring a smooth and well-coordinated project implementation. The project management subcomponent will provide operating costs for day-to-day administration, consultancy services to assist the PCU and the PPMUs in implementing the Project, and survey costs to develop a detailed project design. Consultancy services will also be provided through an institutional strengthening subcomponent that will help to implement a policy and institutional reform action plan agreed with the Government for improved and sustained delivery of WSS services in the towns. The subcomponent will support cost recovery efforts and reduce the reliance of WSS sector institutions on government subsidies by assisting in government initiatives to (i) develop alternative schemes for making tariffs more affordable to the poor, (ii) prepare mechanisms to appropriately value WSS assets; (iii) corporatize and equitize WSS service providers; and (iv) expand the participation of private cooperatives in solid waste management through viable contracting modalities.
Cost Estimates The Project is expected to cost about $96.94 million equivalent, comprising
about $46.66 million equivalent (48.1 percent) in foreign currency and $50.278 million equivalent (51.9 percent) in local currency.
Component Estimated Amount (in US$ Million)
A. Community Environmental Sanitation and Awareness
0.54
B. Water Supply Development and Expansion 19.31 C. Drainage and Wastewater Management 48.27 D. Solid Waste Management 4.10 E. Project Management and Institutional Strengthening 10.61 Total Base Costs 82.80 Contingencies 12.50 Interest and Service Charges 1.64 Total Project Costs 96.94
ADB Loan Amount and
Terms
ADB will provide a loan of $50.0 million equivalent from its Special Funds resources to cover 51.6 percent of the total project cost, including $19.8 million equivalent of local currency cost. ADB financing of the local currency cost is justified by the tight fiscal situation confronting the Provincial People’s Committees (PPCs), which will be responsible for providing the counterpart funds and the debt servicing of the subsidiary loans under the Project. The ADB loan will have a maturity of 32 years with a grace period of 8 years, and an interest rate of 1 percent per annum during the grace period, and 1.5 percent thereafter.
Cofinancing AFD will provide a loan of $27.0 million to co-finance, on a parallel basis, 27.8

TA 4485 – VIET NAM Central Region Small and Medium Towns Development Project: Final Report xi
June 2006
percent of the total project cost, including $10.6 million equivalent of the local currency cost. The AFD loan will have a maturity of 20 years with a grace period of 7 years, and an interest rate of 2.5 percent for the entire term of the loan.
Financing Plan
Project Financing Plan (in US$ Million) Fund Source
Foreign Exchange
Local Currency
Total
Percent
Asian Development Bank 30.219 19.781 50.000 51.6 Agence Francaise de Developpement 16.441 10.559 27.000 27.8 Provincial People’s Committees 0.000 19.938 19.938 20.6 Total 46.660 50.278 96.938 100.0
Financing Flows, Relending and
Onlending
Part of the loan funds from ADB and AFD will be relent by the Government to PPCs, which will then on-lend the funds to Project Operating Entities (POEs), including water supply and drainage companies and urban public works companies, through subsidiary loans in either foreign or domestic currency. The subsidiary loans will be used to finance revenue-generating subcomponents such as water supply and solid waste management. The terms and conditions of the subsidiary loans will be based on current regulations provided in Circular 40/2005/BTC, dated 25 May 2005, of the Ministry of Finance (MOF) and other prevailing regulations relevant to onlending. The subsidiary loan to a PPC for water supply subcomponents will have a term of up to 25 years, including an 8-year grace period, at interest rates that range from zero to 5 percent, depending on the town classification and the currency of subsidiary loan availment. A service fee of 0.3 percent will also be charged. For Class V towns, the subsidiary loan will have a zero interest rate. For higher than Class V towns, the subsidiary loan will have an interest rate of 2 percent per annum if the availment is in US Dollar, or 5 percent per annum if the availment is in Vietnamese Dong. For the solid waste management subcomponents, the terms of the subsidiary loan will depend on the repayment capacity of the borrowing town and will be decided by the MOF and the borrower at the time of the loan signing between ADB and the Government.
Implementation Arrangements
The five PPCs of the participating provinces will serve as Executing Agencies of the Project. The PPC in each Province will establish a Provincial Steering Committee (PSC) which will be responsible for overall subproject implementation and policy guidance. The PSC will be chaired by the PPC Vice Chairman, and will include representatives from the Department of Construction (DOC), Department of Planning and Investment (DPI), Department of Finance (DOF), Department of Natural Resources and Environment (DONRE), VWU, and other agencies or entities that may be recommended by the PPC. A PPMU will be established within in each province to manage and monitor all day-to-day project implementation activities. The VWU in each province will be responsible for managing Component A, with assistance from consultants and nongovernment organizations (NGOs). Its representative will also be a member of the PSC. The VWU will report to the PPMU, which will disburse the funds for Component A activities. The Central Project Steering Committee (CPSC) will be responsible for monitoring overall project implementation progress, dealing with issues such as the scope of investment, project policies and procedures. The CSPC will convene annually or at other times as required by its members. It will be chaired by the Vice Minister of MOC and other members will include Chairmen of the participating PPCs and representatives from MOC, Ministry of Planning and Investment (MPI), Ministry of Finance (MOF), Ministry of Natural Resources and Environment (MONRE), State Bank of Viet Nam (SBV) and PCU. Within the Ministry of Construction, a PCU will be established in Hanoi under the Management Board for Urban Technical

TA 4485 – VIET NAM Central Region Small and Medium Towns Development Project: Final Report xii
June 2006
Infrastructure Projects (MABUTIP) to support the CPSC. The PCU will be responsible for overall project coordination, and will assist the PPMUs with project implementation and training. The PCU will select and manage the Project Implementation Consultants in terms of personnel and work plans; prepare consolidated reports to submit to ADB, AFD and CPSC; monitor disbursement of funds; recruit and engage training and auditing consultants.
Implementation Schedule
It is estimated that the Project will be implemented over 5 years, commencing in the second half of 2007. To minimize delays, it will be necessary to establish the PPMUs and to recruit the Project Consultants by the first quarter of 2007. Detailed design is scheduled for completion by mid-2008, and construction is expected to commence in the latter half of 2008. Land acquisition and resettlement activities will be conducted prior to commencement of construction. The subprojects are scheduled for completion between 2010 and 2011. The water supply, small scale drainage schemes, and the solid waste management components are scheduled for completion in 2010.
Project Benefits and Beneficiaries
The Project will improve the quality of life of the country’s urban population, specifically those living in the Central Region, through sustainable improvements in water supply and sanitation. More specifically, the Project will lead to enhanced community health in the selected towns through better access by residents to clean water and new or improved drainage and wastewater management systems, and solid waste management facilities and services. The water supply development and expansion works will (i) increase security for uninterrupted access to improved drinking water quality, (ii) reduce the risk of exposure to water-borne and water-related pathogens in delivered tap water, (iii) improve water distribution efficiency, and (iv) reduce losses from nonrevenue water in eight towns in the Central Region. About 18,000 households will benefit from the proposed works. The drainage and wastewater management works proposed in five towns will generate (i) health benefits that would accrue to the residents, (ii) savings from reduced flood damages and losses, and (iii) incremental increased in land values. An estimated 80,000 households in the 40 wards comprising nine Project towns will benefit from the proposed drainage and wastewater management subcomponents. The health benefits anticipated from the Project will result from the residents’ improved personal hygiene, public health and environmental conditions, and reduced medical expenses associated with water-borne and water-related diseases such as diarrhea, dysentery, cholera, and typhoid. These health benefits will be especially critical for infants, women, and the elderly who spend most of their time at home. In addition, there are anticipated indirect benefits arising from the proposed drainage and wastewater management works that include improvements in the aquatic environment and reduced risks of transboundary aquatic pollution in the affected coastal towns. The introduction of a solid waste management services and facilities will pave the way for substantially cleaner town environments. The community environmental and sanitation awareness provides targeted, pro-poor interventions to improve the health condition of the town communities in a more sustainable manner by enabling the urban poor households in the selected towns to access small scale water and supply sanitation through sustainable social intermediation activities. The Project will also improve the sustainability of water supply and sanitation services in the selected towns by strengthening institutional capacity and enabling the appropriate policy reforms, specifically those that promote full cost recovery, the privatized provision of services, and cost-effective O&M.

TA 4485 – VIET NAM Central Region Small and Medium Towns Development Project: Final Report Page 1
June 2006
1. INTRODUCTION In December 2004, the Asian Development Bank (ADB) approved a project preparation technical assistance (PPTA) to help prepare the proposed Central Region Small and Medium Towns Development Project (the Project). Following approval of the PPTA in April 2005 by the Government of Viet Nam (the Government), through Document No. 601/QD-BXD, GHK International and its associate firms were engaged by the ADB to assist the Management Board for Urban Technical Infrastructure Projects (MABUTIP) of the Ministry of Construction (MOC), in its capacity as executing agency (EA), to formulate the proposed Project.1 The objectives of the PPTA were as follows: (i) identify gaps in urban infrastructure provision , in particular, water supply, drainage, sanitation, and solid waste management (WSS) in the candidate Project towns; (ii) assess managerial, technical, and financial capacity of WSS providers as well as potentials for broad-based participation; (iii) ensure that social and environmental safeguards of the proposed Project are met; and (iv) prepare a project design and WSS investments for small and medium town environments in five contiguous provinces in the Southern Central Region. GHK and its associate firms (the Consultants) mobilized to implement the PPTA on 17 May 2005.2 This report constitutes the Consultants’ Final Report mainly aimed at summarizing the design features of the proposed Project, its rationale, goal, objectives, envisioned scope and outputs, and anticipated benefits as well as impacts on the selected towns and provinces. The report confirms the overall viability of the proposed Project which was prepared in close collaboration with MOC and the PPCs, as well as other project stakeholders in the five selected provinces, namely: Phu Yen, Khanh Hoa, Ninh Thuan, Binh Thuan, and Dak Nong. In the process, consultations, meetings, and workshops were also held with various other government ministries concerned including the Ministry of Finance (MOF), Ministry of Planning and Investment (MPI), State Bank of Viet Nam (SBV), and Ministry of Natural Resources and Environment (MONRE). 2. BACKGROUND
2.1 Macroeconomic Context
Over the last three decades, Viet Nam has managed to transform itself from being one of the poorest countries in the world into one of the fastest growing in the Asia region. From a modest annual growth rate of 4.2 percent in the 1980s prior to the Government’s decision to transition from centralized economic planning to a regulated market economy, Viet Nam’s Gross Domestic Product (GDP) has grown by an annual average of 6.9 percent during the period 1996 to 2000, further accelerating to about 7.7 percent per annum by 2004. Valued at VND 713 thousand billion ($45.2 billion) in 2004, the country’s GDP has been stimulated mainly by the buoyant consumption spending of the private sector and the expansionary public spending of the Government, as well as increased local and foreign direct investments due to an improved investment climate. Escalating world prices for oil and commodities was a boon for Viet Nam in 2004, helping boost total export revenues by 30.3 percent to $26.0 billion. In addition to crude oil, the
1 On 7 March 2005, the Prime Minister of Viet Nam approved the proposed technical assistance project through Decision No.
226/TTg-QHQT, assigning MOC to cooperate with the Provincial People’s Committees (PPCs) of Phu Yen, Khanh Hoa, Ninh Thuan, Binh Thuan, and Dak Nong to implement the project in accordance with Decree No. 17/2001/ND-CP.
2 The Consultants comprise GHK International (United Kingdom), Halcrow (United Kingdom), and WELI (Viet Nam and CRP (Viet Nam).

TA 4485 – VIET NAM Central Region Small and Medium Towns Development Project: Final Report Page 2
June 2006
country has become a significant exporter of rice, coffee, rubber, pepper, cashew nuts, and tea which all benefited from stronger global prices. However, despite its robust export performance, Viet Nam’s current account continues to be weighed down by the steeper world prices of its key imports, particularly refined petroleum products, fertilizer, and steel. On the supply side, much of the country’s economic growth has been fuelled by the industry and construction sector which has a 40.1 percent share of GDP and continues to grow rapidly at an annual average rate of 10.2 percent. The services sector has a 38.2 percent share of GDP with a 7.5 percent annual growth rate. Together, the industry and services sectors account for nearly 80 percent of GDP, affirming the diminishing share and decelerating rate of growth of the agriculture sector in the country’s economic structure (Table 1).
Table 1. Viet Nam’s Key Economic Indicators, 2000-2004 Year Indicator
2000 2001 2002 2003 2004 GDP (current prices, Bn VND) 441646 481295 535762 613443 713072 GDP per Capita (current prices, ‘000 VND) 5689 6117 6720 7583 8694 GDP per Capita (current prices, $) 402 428 440 489 551 GDP Growth (%, in constant prices) 6.8 6.9 7.1 7.3 7.7 a. Agriculture 4.6 3.0 4.2 3.6 3.5 b. Industry and Construction 10.1 10.4 9.5 10.5 10.2 c. Services 5.3 6.1 6.5 6.5 7.5 Structure of Output (% of GDP, current prices) a. Agriculture 24.5 23.2 23.0 22.5 21.8 b. Industry and Construction 36.7 38.1 38.5 39.5 40.1 c. Services 38.7 38.6 38.5 38.0 38.2 Structure of Demand (% of GDP, current prices) a. Private Consumption 66.5 64.9 65.1 66.3 65.3 b. Government Consumption 6.4 6.3 6.2 6.3 6.4 c. Gross Domestic Capital Formation 29.5 31.2 33.2 33.8 35.5 d. Exports of Goods and Services 55.0 54.6 56.8 60.0 67.1 e. Imports of Goods and Services 57.5 56.9 62.0 67.0 74.9
Source: ADB, Asian Development Outlook, 2005. The country’s sustained economic growth has created jobs for the unemployed, estimated at 1.4 million in 2004, and has helped to reduce the number of poor households by 300,000 to 1.4 million. In the last ten years, Viet Nam has recorded remarkable achievements in poverty reduction. Poverty incidence in the country has declined from 58.1 percent in 1993 to 24.1 percent in 2004.3 The Government remains committed to ensuring high growth and accelerated poverty reduction. It is in the process of completing the Five-Year Socioeconomic Development Plan (SEDP) 2006-2010, envisaged to be the country’s new national strategy for poverty reduction and growth, incorporating the fundamentals of its Comprehensive Poverty Reduction and Growth strategy (CPRGS),4 2002 development goals, and Poverty Reduction Partnership Agreement5 with the ADB. 3 According to the household living standards surveys, the poverty rate was around 58 percent in 1993, 37 percent in 1998, and 29
percent in 2002 (see ADB, Country Strategy and Program Update (2006-2008): Viet Nam, 2005). 4 The Comprehensive Poverty Reduction and Growth Strategy (CPRGS) is an action program that translates the Government’s 10-
year socioeconomic development strategy, 5-year socioeconomic development plan, and other sectoral development plans into concrete measures with well-defined road maps for implementation. It is an action program to achieve the Government’s economic growth and poverty reduction objectives.
5 The Poverty Reduction Partnership Agreement was signed by the ADB and the Government of Viet Nam on 25 February 2002 and covers a subset of the objectives set out in the CPRGS.

TA 4485 – VIET NAM Central Region Small and Medium Towns Development Project: Final Report Page 3
June 2006
The Government wants to ensure that the economic growth realized is both socially inclusive and environmentally sustainable. The proposed SEDP targets an annual average GDP growth rate of 7.5-8.0 percent. Under the plan, the GDP share of the agriculture sector will become smaller at about 16 percent, industry and construction’s share will increase slightly to 43 percent, while the services sector’s share will climb to 41 percent. GDP or annual income per capita will reach $950-$1000 by 2010 and the poverty rate will be reduced significantly to 15-16 percent. By 2010, 95 percent of the urban population and 75 percent of the rural population will have access to clean water. Forty percent of urban areas and 70 percent of industrial zones will be equipped with centralized wastewater treatment systems, 80-90 percent of solid waste will be collected, and over 60 percent of hazardous waste and 100 percent of medical waste will be treated. Viet Nam’s transformation from a predominantly agriculture to a rapidly industrializing and modernizing country is reflected in its six economic regions. In all six regions, the share of agriculture to GDP has been declining in the last seven years, at rates ranging from 4.6 to 15.5 percent. Industry and construction’s share has been steadily increasing, at rates varying from 3.2 to 15.0 percent, particularly in the Red River Delta and the South-Eastern regions where the two major cities of Hanoi and Ho Chi Minh are located, respectively. The share of services to GDP has also been rising on the average, but has actually declined in regions where a notable increase in industry and construction has occurred such as the South-Eastern Region (Table 2). Table 2. Growth and Structural Transformation of Viet Nam’s Economic Regions
% Share of Region’s GDP Agriculture Industry Services Economic Region
% Share
of GDP 1995 2002 1995 2002 1995 2002
Northern Midland & Mountainous Region 5.5 53.0 46.0 18.6 21.8 28.4 37.6 Red River Delta 22.8 30.7 20.1 26.6 36.0 42.7 43.9 Northern Central & Central Coastal Region 13.0 42.2 34.4 19.1 28.2 38.7 37.4 Central Highlands Region 1.1 66.1 51.6 11.5 17.8 22.4 30.6 South-Eastern Region 39.3 10.8 6.2 44.3 59.3 44.9 34.5 Mekong River Delta 15.2 62.1 50.9 14.1 19.8 23.8 29.3
Source: Ministry of Planning and Investment, 2005. The SEDP aims to strengthen coordinated development planning among these regions, propelling each region to maximize its contribution to sustainable and socially inclusive economic growth in the next five years by: (i) focusing the socioeconomic development of the region on its competitive advantages and resource endowments; (ii) improving the effectiveness of existing industrial and export processing zones; (iii) developing new industrial and export processing zones and industrial clusters; (iv) ensuring adequate infrastructure to support the planned growth and development, particularly in the areas of transport, water and electricity; (v) establishing medium and small urban centers with potential for economic development; (vi) investing in appropriate technology and human resource development; (vii) gradually narrowing and ultimately eliminating the disparity and social development gaps among regions; and (viii) intensifying environmental protection. The Central Region, comprising the Northern Central, Central Coastal, and Central Highland provinces, contributes the lowest share to GDP, along with the Northern Midland and Mountainous Region. Growth rate in the region is still highly dependent on agriculture despite the growing proportion of the industry and construction and service sectors in the region’s economy. The Central Region’s share of poverty is also the highest in Viet Nam, accounting for 38.2 percent of the country’s total poverty (Table 3). Factors cited for the slow economic growth in the region include (i) the difficult terrain

TA 4485 – VIET NAM Central Region Small and Medium Towns Development Project: Final Report Page 4
June 2006
which limits economic opportunities and investments, (ii) the lack of infrastructure, market facilities, technology development, and skilled human resources, and (iii) susceptibility to natural disasters. Local ethnic minorities, women with low literacy, landless people, and ethnic minority migrants are among the poorest and most vulnerable groups in the region.
Table 3. Comparison of Poverty Indicators Across Regions in Viet Nam
Year Region Share of Poverty (%)
Share of Population (%)
Poverty Incidence (%)
1993 Viet Nam 100.0 100.0 58.1 Red River Delta 25.5 23.7 62.7 North East and North West 18.9 13.5 81.5 North Central Coast 16.4 12.8 71.8 South Central Coast 7.7 9.4 47.2 Central Highlands 3.8 3.2 70.0 South East 9.6 15.1 37.0 Mekong Delta River 18.1 22.4 47.1 2002 Viet Nam 100.0 100.0 28.9 Red River Delta 17.1 21.9 22.4 North East and North West 22.2 14.8 43.9 North Central Coast 20.4 13.4 44.4 South Central Coast 7.4 8.5 25.2 Central Highlands 10.4 5.8 51.8 South East 5.3 14.6 10.6 Mekong Delta River 17.2 21.3 23.4
Source: DSI in collaboration with ADB, How to Accelerate Socioeconomic Development in the Central Region, April 2005. The SEDP targets growth in the Central Region to accelerate and become more dynamic, enabling it to catch up with the other regions. Led by the industry and construction sector and services sectors, GDP in the Northern Central and the Central Coastal areas will be stimulated to grow at the rate of 8-9 percent per annum. The economic structure of these areas will shift, as follows: (i) agriculture share to GDP, 19 percent; (ii) industry and construction share to GDP, 39 percent, and (iii) services share to GDP, 42 percent. Coastal economic zones will be developed based on the areas’ potentials and competitive advantages for tourism, fishery, maritime industries, and oil refinery. Appropriate infrastructure, including WSS facilities, to support the planned economic growth in a socially inclusive and environmentally sustainable manner will be essential in the next five years. In the Central Highlands, the target GDP growth rate is almost the same as that of the other areas in the Central Region at 8-8.5 percent. The intended economic structure is as follows: (i) agriculture share to GDP, 35.5 percent; (ii) industry and construction share to GDP, 29.5 percent; and (iii) services share to GDP, 35 percent. The production of forest and industrial crops such as coffee, tea, rubber, cashew, pepper and cotton will be intensified and combined with agroprocessing. New market hubs and commercial centers will be gradually built in cities and towns to promote trading activities. Tourist centers and ecotourism resorts in the region will also be developed. Attention will also be given to the hydroelectric and hydropower industries. To support the planned economic growth, regional roads and the roads to Laos and Cambodia will be developed. Key national and provincial roads will be linked to remote communes to facilitate rural-urban linkages, particularly in support of agricultural production, processing, and marketing. To address the needs of the growing industries and services in the region and to improve the living standards of the local people, especially the ethnic minorities and other vulnerable groups living in the remote areas, the construction of water supply systems in all towns of the region will be completed.

TA 4485 – VIET NAM Central Region Small and Medium Towns Development Project: Final Report Page 5
June 2006
2.12.2 Urban Water Supply and Sanitation Sector
2.2.1 Performance Indicators It is estimated that about 25 percent of Viet Nam’s total population live in urban areas, a level of urbanization that is still relatively low compared to other Asian countries (Table 4). However, growing urbanization will be a fundamental aftermath of Viet Nam’s economic transformation from being primarily an agriculture economy to an industrialized economy.
Table 4. Comparative Urbanization Indicators of Selected Asian Countries
Country/Region Urban Population
(in millions) % of Total Population
Average Annual Growth (%) (1990-2003)
China 498.0 39 3.6 Malaysia 14.7 59 3.7 Indonesia 94.7 44 4.2 Philippines 49.7 61 3.9 Thailand 12.7 20 1.5 Viet Nam 20.7 25 3.3
Source: World Bank, World Development Indicators, 2005. The MOC forecasts that the country will be 45 percent urbanized by 2020 mainly due to the continued rural-to-urban migration caused by greater farm mechanization in the rural areas and perceived higher incomes in the urban growth centers. Higher population densities triggered by rapid urbanization will put additional pressures on the already inadequate infrastructure services, including WSS, in Viet Nam’s urban areas. Urban water supply systems in the country are unable to cope with the demand of the country’s growing urban population for clean water. Estimates indicate that piped water supply is available to 50 percent of the urban population on the average but with significant variations among towns. The largest cities with populations exceeding one million have coverage of 67 percent, while the smallest towns, which comprise 35 percent of the urban population, have coverage of only 11 percent. 6 This confirms the unmet significant demand for improved water services across the urban sector as a whole, and particularly in the small and medium towns. Shortages of water and intermittent supply, usually 6-18 hours per day, are common in the urban areas. Many residents purchase water for drinking and cooking from vendors or from residents connected to public water supplies, at extremely high prices, often 5–20 times the existing tariffs for public water supply. The physical conditions of existing urban water supply systems in the country remain generally poor due to inadequate maintenance. Many water treatment plants are inappropriately designed and constructed. Some urban centers have no treatment facilities, thus, in these instances, raw water is pumped directly to the distribution network despite the presence of suspended solids, iron, or high levels of contamination. Water supply companies (WSCs),7 particularly in the small and medium towns, are usually unable to meet design and construction standards due to the lack of appropriate equipment, high quality materials, skilled human resources, and adequate financing.
6 World Bank, Project Appraisal Document to the Socialist Republic of Vietnam for the Urban Water Supply Development Project,
November 2004. 7 In this report, water supply companies is a generic term used to refer to the various types of companies that manage, operate
and maintain public piped water supply services in the urban areas.

TA 4485 – VIET NAM Central Region Small and Medium Towns Development Project: Final Report Page 6
June 2006
Consequently, the existing water supply systems are often unreliable and inefficient. A 2001 benchmark survey by the Viet Nam Water & Sanitation Association (VWSA) revealed that unaccounted for water (UFW) is high, at 38.5 percent on the average, with a minimum of 13.6 percent and a maximum of 75 percent. Apart from piped water supply, many urban residents, particularly in the poorer regions of the country, rely on untreated water from shallow wells, rainwater collection, streams, canals or ponds. Most of these sources are typically polluted and therefore, present a major health risk to the urban population. Water pollution has become a major problem in Viet Nam, the chief source of which is human waste (Table 5). The percentage of urban households with sanitary latrines is only 44 percent on the average for the country as whole, with regional variations ranging from approximately 10-75 percent and the lowest proportions found in the North West, Central Highlands, and Mekong Delta regions. Only a small proportion of these septic tanks are connected to sewers or drains. Thus, in many urban areas, septic tank effluent has the potential to contaminate the groundwater table in areas where water from wells is used widely for drinking. The situation is exacerbated by agricultural waste from the upstream rural areas. Factories using outdated, heavily polluting production processes and technologies, often located in the core urban areas, discharge untreated wastes into water bodies. 8
Table 5. Water Quality in Viet Nam Rivers Region
Upstream Downstream Groundwater Coastal
Waters Issues
Northwest Region - - Northeast Region Urban pollution, saline
intrusion, marine transport pollution risks
Red River Delta Urban and industrial pollution, saline intrusion, agrochemical pollution, transport pollution risks
North Central Coast Urban pollution, saline intrusion
South Central Coast Urban pollution, saline intrusion
Central Highlands - - Northeast of Mekong Urban and industrial
pollution, saline intrusion Mekong River Delta Saline intrusion, low pH in
rivers, agrochemical pollution, transport
pollution risks Source: Viet Nam Environment Monitor: Water, 2003. Legend: Highest Score (indicates water is abundant and of good quality); Lowest Score (indicates water is scarce or water quality is unacceptable. Sanitation seriously lags behind water. The urban centers discharge wastewater and storm water through combined systems to nearby water courses, usually without treatment. Extensive sections of these combined networks, constructed decades ago, need major rehabilitation due to lack of regular and proper maintenance. The incidence of flooding is high in many small and medium town urban centers in the wake of heavy rainfalls and the severe lack of appropriate drainage systems. Silted or deficient drains overflow during the storms, spreading excrete and garbage on the surface ground. Worse, these drains were built without adequate grades for self-cleansing, often without provisions for odor control, especially during the dry weather. There are few wastewater treatment plants in Viet Nam, hence, untreated sewage and industrial wastewater are
8 World Bank, Issues and Dynamics: Urban Systems in Developing East Asia – Vietnam, 2005.

TA 4485 – VIET NAM Central Region Small and Medium Towns Development Project: Final Report Page 7
June 2006
discharged directly into water bodies and streams in the surrounding areas, jeopardizing the country’s fragile aquatic ecosystems. The urban centers of Viet Nam are major generators of municipal waste. They contain only 25 percent of the country’s population but produce over 6 million tons of waste each year or 50 percent of the country’s total municipal waste (Table 6). The average urban dweller in Viet Nam produces over two-thirds of a kilogram of waste each day, about twice the amount produced by people in the rural areas. Viet Nam’s increasing level of urbanization, thus, poses a number of challenges for more efficient and sustainable solid waste management in the country’s urban areas.
Table 6. Waste Generation in Viet Nam Waste Generation (tons/yr) Category Sources Types
Urban Rural Total Municipal Waste
Residential and Commercial Markets
Kitchen waste, plastic, paper, glass
6,400,000 6,400,000 12,800,000
Industrial Non-Hazardous Waste
Industries
Metals, wood
1,740,000 770,000 2,510,000
Industrial Hazardous Waste
Industries
Fuel oil waste, sludge organic chemicals
126,600 2,400 128,400
Hazardous Healthcare Waste
Hospitals
Tissue samples, blood, syringes
- - 21,500
Total (Non-Agricultural Waste) 8,266,000 7,172,400 15,459,900 Agricultural Cultivation
and Livestock Plant matter NA 64,560,000 64,560,000
Source: Viet Nam Environment Monitor: Solid Waste, 2004. The national average collection of municipal waste in urban areas rose from 65 percent to 71 percent from 2000 to 2003. Collection rates are typically higher in the larger cities and range from 45 percent to 95 percent. In the small and medium towns, the collection rate varies from 15 percent to 70 percent. In most urban areas, service coverage is often lacking in the settlement and temporary housing areas, and the city outskirts which are generally occupied by poor households. Collected solid waste is brought to landfills which usually operate as mere dumpsites. Typically, these landfills are unlined and present a high risk of leaking into the groundwater aquifers. There is a serious deficiency in the country for facilities to dispose hospital and toxic wastes which pose high health and environmental risks.
2.2.2 Sector Opportunities and Constraints Viet Nam’s sustained economic growth and accelerating rate of urbanization have stimulated unprecedented demand for increased and improved WSS services throughout the country. In response, the Government has been enacting policies and reforms to enable a more responsive WSS sector. Some objectives embodied in the CPRGS are directly relevant to the needs of Viet Nam’s WSS sector, such as (i) providing essential infrastructure, especially water supply and sanitation, to the poor households in the country’s established and emerging urban centers; (ii) improving socioeconomic development planning to include both country-wide and inter-region dimensions; (iii) integrating infrastructure sectoral plans into master plans and land-use plans; (iv) intensifying links between growth centers and their adjoining areas to ensure a more geographically balanced growth; (v) introducing appropriate public governance reforms

TA 4485 – VIET NAM Central Region Small and Medium Towns Development Project: Final Report Page 8
June 2006
to support the devolved planning and implementation of infrastructure projects; (vi) mobilizing the resources for adequate operation and maintenance (O&M); and (vii) enhancing cost recovery of infrastructure investments by setting and collecting appropriate tariffs and fees. Government sector policy and strategy are set out in separate Orientation Plans for urban water supply, drainage and solid waste management, approved by the Prime Minister in 1998 and 1999. The Orientation Plans provide sector targets (in terms of coverage and service levels), and present Government reforms that aim to: decentralize responsibility for urban WSS services to provincial governments, strengthen sector institutions, increase cost-recovery through user charges, and gradually eliminate government subsidies. However, the legal documents and mechanisms required to achieve these aims have been slow to evolve, some have not been fully implemented or have proven to be impractical. Key problems that need to be addressed in the short to medium term are: inadequate investment in the sector, WSS service providers’ lack of autonomy and business focus, unsustainable tariffs, poor operation and maintenance of infrastructure systems, lack of management capacity, and weak sector regulation. Provincial governments are responsible for urban WSS services in the provinces. However, administrative arrangements for urban WSS are gradually changing under the Government’s Enterprise Reform Program, which aims to separate WSS service providers from government administration through a process of corporatization and equitization. In the Project towns, WSS service providers include: (i) provincial companies that manage water supply, and in some cases, drainage and other municipal services in urban centers throughout the province; (ii) city level companies that manage drainage, solid waste and other municipal services in one city, and; (iii) urban environment companies, operating at district and town levels, which are responsible for WSS (including water supply, drainage, solid waste management) and other municipal services in the district or town. The majority of WSS service providers in the Project towns are State Owned Enterprises (SOEs), lacking commercial focus and having limited managerial autonomy. They require people’s committee approvals for most of their key management and operating decisions. However, four of the WSS service providers in the Project towns have recently transformed to One Member Limited Liability Companies (OMLLCs) or Joint Stock Companies (JSCs), with the aim of giving them greater business focus and autonomy, and several others are in the process of transforming. Private cooperatives operating in partnership with private companies also participate in solid waste management in several Project towns. The Government’s State Enterprise Reform Program aims to equitize SOEs by converting them gradually to shareholding companies (JSCs) with 49-100 percent public ownership. Under the new Enterprise Law, 2005, all SOEs will be converted gradually into limited liability companies (LLCs) or JSCs by 2010. SOEs in the WSS sector which cannot be equitized in the short term will first be converted to One Member LLCs (OMLLCs) operating under the (Unified) Enterprise Law, giving them greater autonomy in business decisions, staff remuneration, and capital raising, and; separating them from government administration, allowing for gradual reduction of subsidies from the State Budget. When the LLCs become profitable and financially capable, they will be gradually equitized by selling shares to the public. In terms of sector financing, the Government’s policy is to: (i) adopt full cost recovery tariffs for water supply; (ii) introduce drainage charges, incorporated into water tariff structures; (iii) apply drainage and solid waste tariffs that are sufficient to cover operation and maintenance costs, and; (iv) gradually increase tariffs to cover capital investment requirements, and reduce the need for government subsidies. While the authority to set

TA 4485 – VIET NAM Central Region Small and Medium Towns Development Project: Final Report Page 9
June 2006
WSS tariffs continues to be held by the PPCs, the tariff guidelines issued initially in 1999 and the new 2004 guidelines (Directive 04/2004), provide the framework and methodology for use by the PPCs in establishing these tariffs. However, the guidelines give no time frame for applying the tariffs, do not provide a specific method for calculating the required level of cost recovery, and lack suitable mechanisms for valuing assets and calculating depreciation, representing a major constraint to full cost recovery and eventual company equitization. Seven years after the initial guidelines were introduced, few provinces in the country apply full cost recovery tariffs for water supply or apply drainage and solid waste charges that cover O&M costs. In general, drainage fees and subsidies cover only 30-70 percent of O&M costs, while solid waste fees only cover about 30-50 percent of O&M costs for waste collection, transport and disposal. Tariffs and budget allocations are generally set at levels insufficient to provide adequate levels of service. WSS tariffs are set well below the maximum levels that are affordable to the large majority of households, and well within their willingness to pay. Overall, the major constraints confronting the WSS sector of Viet Nam include (i) inadequacy of capital investment in meeting the escalating demand in the urban centers for drainage, wastewater, sanitation, and solid waste systems as a result of faster paced economic growth throughout the country, mainly through industrialization and increasing urbanization; (ii) limited capacity of the central, provincial, and city governments for efficient and effective management and O&M; (iii) slow implementation of policy reforms at the provincial level and an incomplete legal framework; (iv) weak institutions and relatively ambiguous institutional arrangements particularly for urban drainage, wastewater, sanitation and solid waste services; (v) insufficient cost recovery and generally low tariffs to mobilize the financial resources for capital investment and proper O&M; (vi) minimal private sector participation, and (vii) lack of community awareness and participation to ensure cost-effective planning and management of WSS services. The proposed Project will help to address these constraints by investing in the appropriate WSS-related interventions and accompanying policy and institutional reforms, particularly in the small and medium towns of the Central Region where the demand-supply gap in the WSS services and facilities are more acutely felt. The planned economic growth of the Central Region provinces, which will be more rapid and industry-driven in the coming 5-10 years, put additional pressures for increased, improved, and sustainable facilities in these small and medium towns.
2.12.3 External Assistance to the Sector External assistance has been a major source of funding for the rehabilitation and expansion of the country’s urban WSS. Since the mid-1980s, external funding agencies have provided loans of more than $700 million for developing drainage, sanitation, and solid waste projects in Viet Nam. Approximately 65 percent of this amount has financed environmental improvement projects in Ho Chi Minh City ($308 million) and Hanoi ($156 million). In provincial towns, external assistance has focused on water supply systems, but investment in drainage, sanitation, and solid waste improvements in the towns has been relatively small, particularly in the Central Region (Table 7). Appendix 1 provides a comprehensive list of external assistance to the urban sector of Viet Nam, including WSS.
2.4 Lessons Learned Some major lessons have been learned from implementing WSS projects in Viet Nam and ADB urban sector interventions in other countries. A critical lesson is that projects

TA 4485 – VIET NAM Central Region Small and Medium Towns Development Project: Final Report Page 10
June 2006
are often delayed in establishing project management units (PMU), selecting consultants, acquiring land, resettling people, awarding contracts, and making disbursements. These delays have increased project costs and frustrated both local authorities and beneficiaries. There is a need for (i) greater delegation of authority to lower-level government agencies for implementation, with central Government ministries acting as facilitators and enablers; (ii) intensive assistance to the executing agencies in project planning and management early in the implementation, if not during the period prior to implementation; (iii) advance action for recruiting consultants; (iv) establishment of PMUs during project preparation; and (v) timely preparation for land acquisition and resettlement. Early and systematic training in Government and ADB procedures for all project stakeholders—including provincial agencies, consultants, counterpart staff, and representatives of community groups—is essential in minimizing delays.
Table 7. List of Ongoing ODA-funded WSS Projects in the Central Region Program/Project ODA
Partner Duration Amount
(USD million)
Location
Investment For Water Supply In Nam Phuoc Town
Japan 2004-2005 0.94 Quang Nam
Duc Pho Water Supply Japan 2003-2004 0.46 Quang Ngai Quang Ngai Town Water Supply Italy 2002-2005 2.27 Quang Ngai Quy Nhon City Water Supply And Sanitation
ADB 1998-2004 12.87 Binh Dinh
Provincial Towns Water Supply And Sanitation (Tuy Hoa, La Hai, Chi Thanh – Cofinanced By ADB And Norad)
ADB 2002-2007 17.2 Phu Yen
Rural Water Supply UNICEF 2001-2005 0.13 Phu Yen Phu Hoa Water Station Japan 2003 0.60 Phu Yen Phan Rang Water Supply And Sanitation (Cofinanced By ADB And NORAD)
ADB 2002-2007 17.39 Ninh Thuan
Rural Clean Water Program UNICEF 1993-2005 1.60 Binh Thuan Clean Water To 5 Towns, Villages Japan 2003-2005 0.50 Thanh Hoa Nghe An’s Town Water Supply ADB 1998-2004 16.01 Nghe An Improvement Of Drainage And Sanitation In Vinh City
Germany 1997-2005 7.14 Nghe An
Drainage And Waste Treatment In Vinh City
Germany 2003-2008 14.28 Nghe An
Rural Water Supply And Sanitation In Nghe An
Denmark 2000-2005 6.71 Nghe An
Waste Water Drainage In Cua Lo Town Belgium 2002-2006 2.90 Nghe An Rural Water Supply And Sanitation In Ha Tinh
Denmark 2004-2007 0.73 Ha Tinh
Ca River Water Management Demark 2004-2007 0.73 Ha Tinh Dong Hoi District Water Supply – Drainage and Sanitation
ADB 1998-2005 9.26 Quang Binh
Rural Clean Water and Environment UNICEF 2001-2005 1.80 Quang Binh Quy Dat Town Water Supply Japan 2001-2004 0.65 Quang Binh Quang Tri’s Town Water Supply ADB 1998-2004 9.47 Quang Tri Phu Bai Water Supply Japan 2003 1.10 Thua Thien Hue Da Nang City Water Supply – Phase II France 1998-2004 4.14 Da Nang Central Region Urban Environmental Improvement (Co-financed by ADB and AFD)
ADB 2005-2009 31.25 Dong Ha, Ha Tinh, Lang Co, Quang
Ngai, Tam Ky, and Thanh Hoa
Previous projects provide additional lessons as well. These are (i) communities must decide their own priorities and technology choices to suit their capacity and financial means; (ii) transparency in funds transfers from the project and local government to the community for micro level activities and awareness campaigns is essential to generate community support and trust; (iii) the Viet Nam Women’s Union (WVU) has the

TA 4485 – VIET NAM Central Region Small and Medium Towns Development Project: Final Report Page 11
June 2006
network, experience, and mandate to work effectively at the grassroots level in environmental health improvement; (iv) community motivators must be paid as an incentive to carry out awareness activities; (v) WSCs must be involved in community activities, particularly public health awareness, early in the project as they have valuable technical information needed by the communities; (vi) PPCs need to be involved in community development activities as they control the budget and approve the work of lower levels agencies; and (vii) public health awareness activities need to coincide with the construction of major physical infrastructure.
2.5 ADB’s Sector Strategy ADB’s operational strategy for Viet Nam is to support the Government’s twin goals of economic growth and poverty reduction. To this end, ADB is supporting activities in the five strategic priorities agreed with the Government. These priorities include (i) sustainable growth; (ii) inclusive social development; (iii) good governance; (iv) geographic focus on the Central region; and (v) regional cooperation in the Greater Mekong Subregion (GMS). In accordance with these priorities, ADB’s strategy in the urban water and sanitation sector will focus on (i) supporting the rehabilitation, upgrading, and expansion of water supply and sanitation in the urban centers to improve the investment environment; (ii) ensuring equitable access to safe water supply and sanitation facilities and improve the health profile of the urban residents; and (iii) encouraging policy changes and institutional reforms at central and provincial levels to enable sustainable development. The immediate sectoral objective of ADB is to make WSCs financially viable through adequate cost recovery. In the medium-term, ADB is seeking full financial autonomy of WSCs in financial and operational management, and the establishment of a suitable regulatory framework. The long-term objective of ADB is to increase private sector participation, in the process minimizing the dominance of SOEs in the sector. Geographically, ADB’s assistance will shift from large cities to small and medium towns, particularly to those located in the Central Region where urban poverty reduction remains high and there is growing unmet demand for improved WSS due to increasing industrialization and higher levels of urbanization.
2.6 Institutional and Policy Reform Context Policy dialogue with the Government has been carried out since the first ADB-assisted WSS project in the country in 1995. One important aspect of the dialogue relates to the transition of WSCs from subsidized entities, operating in a planned environment, to commercial companies operating in a market economy. WSCs were envisioned to self-finance their capital expansion and O&M through user charges and to be accountable to their owners and consumers. The dialogue has led to the Government’s permission for WSCs to retain funds accumulated through depreciation that were previously submitted to the PPCs. The dialogue, and ADB assistance, also enabled MOC to issue national water tariff guidelines based on the principle of full cost recovery. However, while Government policies support the autonomy of WSCs and full cost recovery for water supply, and the MOC tariff guidelines set out the methodology for achieving this objective, the existing tariff levels for virtually all WSCs are not sufficient for long-term financially sustainable operations. WSCs are generally under budgeted for adequate O&M, have no provisions for debt service, and make no allowance for income generation other than through depreciation. Apart from reducing necessary expenditures on O&M, WSCs have also had to resort to engaging in the construction business to supplement their revenues from water sales. This distorts the real cost of water production and sales, and creates excessive demand for water supply.

TA 4485 – VIET NAM Central Region Small and Medium Towns Development Project: Final Report Page 12
June 2006
The dialogue with the PPCs and WSCs has been focusing on the need to improve water tariff structure and increase the tariffs to a sustainable level. 9 The dialogue also aims at improving WSCs’ financial management, and separating water supply operations from the construction business to make transparent the cost of water supply and subsidies. More recently, the policy dialogue has focused on the following: (i) strengthening autonomy as well as managerial and technical capacity of the urban environmental companies (URENCOs); (ii) improving capacity of urban management divisions in TPCs to monitor the performance of URENCOs and other public and private sector service providers and to coordinate urban planning and management more efficiently; (iii) strengthening national urban management and tariff policies to assist PPCs, TPCs, and URENCOs in achieving sustainable management of urban environmental infrastructure and services; (iv) developing appropriate financial mechanisms to ensure the sustainability of urban environmental services and reduce government subsidy for drainage, wastewater sanitation and solid waste by assisting URENCOs to generate more internally-generated revenues; (v) improving awareness and community participation of communities in planning and managing urban services; and (vi) increasing participation by women in project planning, design, implementation, and O&M of urban services. 10 Under the proposed Project, the dialogue will continue to emphasize policy and institutional reforms designed to expand the WSS sector, particularly in the small and medium towns of the Central Region where a more rapid rate of economic growth is vital to enable the provinces in these regions to catch up with the pace of development and poverty reduction in most areas of the country. The dialogue with PPCs and WSCs will reiterate the need for water tariff rates that more accurately reflect the real cost of water production and sales. Government policies and guidelines supportive of autonomous WSCs and full cost recovery for water supply will have to be carried out at the provincial level in order to mobilize sufficient financial resources for the proper management, O&M, improvement, and expansion of water supply systems in the small and medium towns. For sewerage and drainage, the dialogue will underscore streamlining the various types of institutions involved⎯for example, companies handling only sewerage and drainage as opposed to water supply and sewerage companies and municipal administration companies⎯for more efficient and effective planning, management, and O&M in the small and medium towns. Policy reforms to mobilize additional resources to meet the growing capital and operational budgetary requirements of these companies will be key to the dialogue. In this regard, sewerage and drainage fees that enable these companies to recover O&M and depreciation costs, at the minimum, will be encouraged. The dialogue will also promote models and mechanisms for more competitive private sector participation in the provision of sewerage and drainage services. Similar areas of policy and institutional reforms will be discussed for urban solid waste management. 3. PROJECT RATIONALE
3.1 Origin, Legal, Policy and Technical Basis of the Project
9 ADB, Report and Recommendation of the President to the Board of Directors on a Proposed Loan to the Socialist Republic of
Viet Nam for the Third Provincial Towns Water Supply and Sanitation Project, November 2001. 10 ADB, Report and Recommendation of the President to the Board of Directors on a Proposal Loan to the Socialist Republic of Viet
Nam for the Central Region Urban Environmental Improvement Project, November 2003.

TA 4485 – VIET NAM Central Region Small and Medium Towns Development Project: Final Report Page 13
June 2006
3.1.1 Origin The Central Region is among the least developed areas of Viet Nam, and home to many ethnic minority groups, especially in the highland areas. The southern part of the Central Region is characterized by narrow coastal areas, short rivers with highly variable seasonal flow rates, and a monsoon climate which is very dry in the dry season but produces frequent flooding during the wet season. While many of the urban areas experience water shortages in the dry season, the wet season floods have both environmental and socioeconomic adverse impacts. Improved urban infrastructure for water supply, drainage and wastewater management, and solid waste management will help to significantly improve environmental, socioeconomic and community health conditions, thereby supporting sustainable development in the region. Sustainable development and improved living conditions in the small and medium towns of the Central Region will also help reduce migration pressures in the larger urban areas of the country. As one of the major donors financing Viet Nam’s development, ADB has implemented three major projects to improve water supply and environmental sanitation in Viet Nam. The Project will be the fourth and will incorporate lessons learned from the previous three projects. Following the Government’s policy of incremental development of urban infrastructure, which assigns water supply the highest priority, followed by environmental sanitation (i.e., drainage and wastewater management, and solid waste management), the Project aims to provide: (i) new or expanded water supply in towns without adequate piped water; (ii) drainage and wastewater management (using technical and financially appropriate waste stabilization ponds) in towns with existing adequate water supplies (some financed from previous ADB projects); and (iii) solid waste management, where this is deemed a priority by the local authorities. Appropriate institutional capacity strengthening for the management of the new facilities, coupled with a targeted program of community environmental and sanitation awareness, will help maximize the socioeconomic and community health impacts of the Project.
3.1.2 Legal Basis The Government is committed to allocating the resources required to improve the socioeconomic conditions of its people, as well as to reduce poverty and improve social equality. In May 2002, the Government adopted the CPRGS (approved by the Prime Minister as Document No. 2685/VPCP-QHQT, 21 May 2002) which translates the Government’s 10-year socioeconomic development strategy, 5-year socioeconomic development plan, and other sectoral development plans into concrete measures with well-defined road maps for implementation. The CPRGS is the Government’s action program to achieve its economic growth and poverty reduction objectives. It is carried out at the provincial, district, and commune levels so that local priorities and expenditures are consistent with the national development goals. The CPRGS objectives particularly relevant to the Project include:
Ensure that 80 percent of urban and 60 percent of rural population will have access to clean and safe water by 2005; 85 percent of rural population to have access to safe water by 2010;
Ensure that 100 percent of all wastewater is treated in towns and cities by 2010; Establish in cities and towns public environmental protection projects such as
garbage waste treatment, wastewater treatment; Advise and provide guidance to mountainous ethnic people about healthy and
hygienic practices;

TA 4485 – VIET NAM Central Region Small and Medium Towns Development Project: Final Report Page 14
June 2006
Focus on infrastructure development, expanding water supply and drainage in urban areas, especially for the poor households in the Central Highlands;
By 2005, air and water pollution must attain national water and air quality standards, measured at least in part by the percentages of poor households with hygienic latrines, and access to hygienic water supplies;
Develop infrastructure and create opportunities for the poor to access public services, and implement policies to ensure essential infrastructure, especially water supply and environmental sanitation for poor areas, poor communes and poor quarters in cities and towns;
Promote the use of local labor for implementing infrastructure projects, and strengthen the participation of local people in planning, implementation and maintenance of local infrastructure projects.
The total CPRGS budget for urban infrastructure improvement is about VND 4.5 thousand billion, including VND 0.2 thousand billion of recurrent expenditure and VND 4.3 thousand billion of capital expenditure for improving housing, water supply system, electricity supply in the poor urban areas. The Project, with proposed funding from the ADB and the Agence Francaise de Developpement (AFD), will contribute substantially to the achievement of many of these objectives in the five Central Regions provinces where it will be implemented. According to the CPRGS, the Government aims to “ensure that the urban poor have equal access to resources, public services and basic social services”, and to “improve the access of migrants, especially their children, to these resources and services”. Viet Nam’s Millennium Development Goals (MDGs) are a part of the CPRGS. A comparison of the global and Vietnamese MDGs (VDGs) related to water supply and sanitation is shown in Table 8.
Table 8. Comparison of MDGs and Viet Nam’s Development Goals in WSS
Goal Code Definition of Goals MDG 7 Halve, by 2015, the proportion of people without sustainable access to safe drinking water VDG 7 Ensure environmental sustainability by:
• Extending forest cover to 43 percent by 2010. • Ensuring that 60 percent of the rural population has access to clean and safe water by
2005 and 85 percent by 2010. This should be the case for 80 percent of urban people by 2005.
• Ensuring there are no slums and temporary houses in all towns and cities by 2010. • Ensuring that all wastewater in towns and cities is treated by 2010. • Ensuring that solid waste is collected and safely disposed of in all towns and cities by
2010. • Air and water pollution levels must meet national standards by 2005.
The ADB in its Country Strategy and Program (CSP) Update (2006-2008) for Viet Nam has assessed that Target 10 (“Halve, by 2015, the proportion of people without sustainable access to safe drinking water”) is feasible. It noted that in 2002, only 56 percent of the population had access to clean and safe water supply (compared to 48 percent in 1990), while only 47 percent had access to improved sanitation (compared to 29 percent in 1990). The ADB recognized these as substantial achievements but concluded that much remains to be done to meet the Government’s goal of 85 percent overall safe water coverage by 2010 and 100 percent coverage by 2020. The Project will have a direct impact on the ability of the Government to attain these goals. ADB’s CSP update also indicated that while poverty incidence in the Central Coast provinces such as Phu Yen, Khanh Hoa, Ninh Thuan and Binh Thuan is 25.2 percent, it is 51.8 percent in the Central Highlands (which includes the province of Dak Nong), the highest poverty rate in all of the seven regions of the country. This relatively high level of

TA 4485 – VIET NAM Central Region Small and Medium Towns Development Project: Final Report Page 15
June 2006
poverty, combined with the fact that Dak Nong is a recently created province from Dak Lak, justifies the Government’s policy of providing strong financial support to new provinces such as Dak Nong, where the Project will invest to improve water and sanitation infrastructure and services.
3.1.3 Policy and Technical Basis Government policy and strategies for the development of the WSS sector are described in the orientation plans for urban water supply, urban drainage, and solid waste management in urban areas and industrial zones, which were approved by the Prime Minister in 1998 and 1999. The Orientation Plan for Urban Water Supply Development to 2020, Decision No. 63/1998/QD-TTg, aims to: (i) rapidly increase water supply coverage in urban areas to 80-90 percent by 2010 and, where feasible, to 100 percent by 2020; (ii) achieve greater commercialization of the water sector; (iii) modernize water technology and equipment; (iv) improve protection of water resources and the environment; (vi) develop human resources in the water industry; and (vii) mobilize all sectors of the economy and community to contribute to develop and improve water supply services. The Orientation Plan for Urban Drainage to 2020, Decision No. 35/1999/QD/TTg, proposes to improve drainage and wastewater systems on an incremental basis. Its key objectives are to: (i) reduce flooding in urban areas; (ii) rehabilitate existing networks and facilities; (iii) expand drainage coverage to 80-90 percent by 2020; (iv) eliminate pit latrines in urban areas; (v) introduce wastewater treatment as resources permit; (vi) promote market oriented approaches to service provision; (vii) develop through public education a better awareness of the impact of sanitation on public health, environmental sustainability and economic development; and (viii) gradually replace subsidies with user charges for drainage services. The National Urban and Industrial Zones Solid Waste Management Strategy to Year 2020, Decision No: 152/1999/QD-TTg, was designed to: (i) to close uncontrolled dumps and replace them with engineered or sanitary landfills; (ii) increase solid waste collection step-by-step in urban and industrial areas to 80-95 percent coverage by 2020; and (iii) strengthen institutions and the legal framework for solid waste management. The Project will support the Government’s strategy for water supply, drainage and wastewater management and solid waste management, as follows:
• Water Supply: The Project will develop, expand or improve piped water supply systems with individual household connections in eight Project towns. It will (i) rapidly increase coverage of safe piped water supply; (ii) ensure access to safe, affordable water supply for the urban poor and; (iii) strengthen the capacity of the water supply companies to manage the new or improved water supply systems in ways that are financially and environmentally sustainable.
• Drainage and Wastewater Management: The Project will develop, expand or
improve combined drainage and wastewater management systems in nine Project towns. It will (i) reduce the incidence of flooding; (ii) separate wastewater from stormwater, construct wastewater collection systems and introduce wastewater treatment in selected Class III and Class IV towns; (iii) increase the coverage of septic tanks through sanitation credit schemes; (iv) increase community sanitation awareness through awareness programs; and (v) strengthen the capacity and capability of urban utilities to sustain the improvements made.

TA 4485 – VIET NAM Central Region Small and Medium Towns Development Project: Final Report Page 16
June 2006
• Solid Waste Management: The Project will improve the full cycle of solid waste
management in five Project towns. It will: (i) increase the coverage of solid waste collection from the urban areas of the towns; (ii) remove solid waste from urban areas; (iii) ensure safe disposal of solid waste in engineered landfills with leachate collection and treatment; (iv) close existing unsanitary dumps; and (v) strengthen the capacity and capability of solid waste management companies.
Furthermore, the positive impacts to be generated by the Project’s proposed infrastructure development components will be increased significantly by the inclusion of the community environmental sanitation and awareness component and project management and institutional training. It has been demonstrated consistently that the positive community health and socioeconomic impacts of providing improved WSS infrastructure can be significantly increased by helping the customers of these improved water and environmental sanitation services improve their hygiene behavior. The consequent reduction in diarrhea and other water borne diseases can provide substantial socioeconomic benefits, especially in areas such as Cam Ranh where malaria and dengue fever are common. Institutional capacity strengthening will also be a vital feature of the Project to take full advantage of newly developed infrastructure. While some of the Provincial WSCs and URENCOs (where applicable) have benefited from previous and ongoing ADB projects in terms of developing their management and technical capacity and capability to plan, operate and maintain WSS infrastructure, other provinces have not been able to participate in such training. For such provinces, and those without prior sectoral development projects, targeted training support will be provided under the Project. Provincial participatory workshops conducted under the ADB PPTA confirmed the need for training in the following: (i) procurement using ADB and Government regulations and procedures; (ii) financial management and accounting; (iii) promoting community environmental sanitation and awareness (especially for VWU’s cadres); and (iv) O&M for drainage, waste stabilization ponds, and solid waste management.
a. Water Supply
The development targets relevant to the Project are: By 2015, ensure that 85 percent of the urban population in Class IV towns, and 80
percent of the urban population in Class V towns is supplied with safe piped water at the rates of 120 lpcd and 100 lpcd, respectively;
By 2020, ensure that 95 percent of the urban population in Class IV towns and 90 percent of the urban population in Class V towns is supplied with safe piped water at the rates of 135 lpcd and 120 lpcd, respectively; and
Where urban water supply systems already supply nearby communes, ensure that 60 percent of the commune population is supplied with clean piped water at 80 lpcd by 2015 and 70 percent at 100 lpcd by 2020.
The water supply subcomponents of the Project will aim to provide: (i) piped water of potable quality meeting the Ministry of Health Drinking Water Standards, Decision No. 09/2005/QD-BYT; (ii) 24-hour continuous supply; and (iii) adequate pressure (8m minimum) in the distribution network. Long-term planning (including land acquisition) for the water supply systems is based on planned development and water demand forecasts for 2020. In general, water intakes, raw water transmission systems and civil works for pumping stations have been

TA 4485 – VIET NAM Central Region Small and Medium Towns Development Project: Final Report Page 17
June 2006
designed for 2020 water demand. To avoid overinvestment, water treatment plants, pumping stations equipment and reservoirs have been designed for 2015 demand projection with provision for future expansion. Distribution and reticulation pipelines have been designed for 2015 or 2020 demand (depending on least-cost considerations), and their scope will depend on the actual development of the towns in 2010 when the Project is scheduled for implementation. Water demand forecasts were based on separate projections of each component of demand, including: (i) domestic use calculated from per capita consumption, coverage targets and population projections; (ii) public and service use estimated at 5 percent of domestic demand; (iii) handicraft and small industry use, taken as 10 percent of domestic demand; (iv) industrial zone demand calculated on a case-by-case basis; and (v) unaccounted for water at 25 percent of water production. Daily peak coefficient K1=1.2 and peak hour coefficient K2=1.5 were likewise used.
b. Drainage and Wastewater Management The development targets relevant to the Project are: By 2015, eliminate flooding in the core and high density urban areas arising from 1 in
5 year storm (together with high tide in coastal towns) for Class III and Class IV towns, and 1 in 2 year storm for Class V towns;
By 2015, collect and treat 80 percent of wastewater generated in the core and high density urban areas of the Class III and selected Class IV towns, using appropriate solutions;
• By 2015, increase septic tank coverage and eliminate non-hygienic latrines in the urban areas of Class III and Class IV towns;
• By 2020, eliminate flooding in the urban areas arising from 1 in 5 year storm (together with high tide in coastal towns) for Class III and Class IV towns, and 1 in 2 year storm for Class V towns; and
• By 2020, collect and treat 80 percent wastewater generated in the urban areas of the Class III and selected Class IV towns, using appropriate solutions.
Long-term planning (including land acquisition) for the drainage and wastewater systems is based on planned development, forecast flows and pollution loads for 2020. In general, primary drains have been designed to meet planned development and forecast flows for 2020. Secondary and tertiary drains were designed for 2015 or 2020 flows (depending on least-cost considerations), and their scope were based on the actual development of the towns’ roads in 2010 when the Project is scheduled for implementation. Wastewater treatment facilities, interceptor sewers, wastewater pumping station civil works, pumping mains and trunk sewers have been designed for 2020 flows and pollution loads. The design criteria for stormwater drainage include (i) rainfall return periods of 5 years for primary drains and 1-2 years for secondary and tertiary drains in Class III towns (together with high tide in coastal areas); and (ii) rainfall return periods of 2 years for primary drains and 1 year for secondary and tertiary drains in Class IV and Class V towns (together with high tide in coastal areas). The design criteria for wastewater include: (i) wastewater flows calculated as the product of drainage coverage and 70 percent of water consumption; (ii) BOD5 loading based on 30 grams per capita day after reduction in septic tank; and (iii) capacity of wastewater interceptors designed for two times the average dry weather wastewater flow, plus allowance for infiltration.

TA 4485 – VIET NAM Central Region Small and Medium Towns Development Project: Final Report Page 18
June 2006
c. Solid Waste Management The design of the Project’s solid waste management component is consistent with the objectives and targets of the National Urban and Industrial Zones Solid Waste Management Strategy to year 2020, Decision No. 152/1999/QD-TTg. The objectives of the strategy are (i) to close uncontrolled dumps and replace them with engineered or sanitary landfills; (ii) increase solid waste collection step-by-step in urban and industrial areas to 80-95 percent coverage by 2020; and (iii) strengthen institutions and the legal framework for solid waste management. The development targets relevant to the Project are: • Ensure that at least 80 percent of urban solid waste will be collected and disposed in
engineered landfills by 2015; • Ensure that 75 percent of medical solid waste and industrial waste from the Class IV
Project towns will be collected and disposed in dedicated, secure hazardous waste cells at the landfills by 2015;
• Ensure that 90 percent of urban solid waste will be collected and disposed in engineered landfills by 2020.
Landfill infrastructure and local storage stations in the towns have been designed and constructed to meet the requirements of 2020. Solid waste collection, transport and landfill equipment and landfill cell capacity will meet the urban solid waste requirements in 2015, based on the following criteria: • Urban solid waste generated: 0.75 kg/capita/day. • Density of solid waste inside handcart or storage bin: 300-350 kg/m3. • Density of solid waste inside compactor truck: 500 kg/m3. • Density of solid waste in landfill after compaction: 700 kg/m3 without machine
compaction and 850 kg/m3 with dozer compaction. The design criteria for solid waste components were based on MOC Circular No. 5/2002/TT-BXD, dated 30 December 2002, on introducing cost estimation and management of urban services. 4. THE PROJECT AREA
4.1 Project Provinces The PPTA focused initially on a long list of 18 candidate towns in five adjacent provinces in the Central Region. Four of the Project provinces⎯Phu Yen, Khanh Hoa, Ninh Thuan, Binh Thuan and their 14 candidate towns⎯are located in the South Central Coast Region. The fifth project province, Dak Nong, and its four candidate towns are located on the Dak Lak Plateau in the Central Highlands. The province of Dak Nong is new, recently established in 2003 when it was separated from the province of Dak Lak. The five project provinces have a combined population of about 4.2 million, ranging from 0.4 million in Dak Nong to 1.2 million in Khanh Hoa. The urban population of the five provinces was estimated at 1.4 million in 2004 and is growing at an average annual rate of 2.3 percent.

TA 4485 – VIET NAM Central Region Small and Medium Towns Development Project: Final Report Page 19
June 2006
4.2 Location of Candidate Towns The 14 candidate towns from the South Central Coast Region are located between 190 and 615 km by road from Ho Chi Minh City (HCMC). These 14 towns lie on a coastal plain which is less than 100 km wide, and transected by many small to medium rivers flowing eastward to the East Sea. Twelve of the towns lie on National Highway No. 1A, while the others are located within 20 km of the highway. The topography and monsoon climate of the South Central Coast Region cause extreme seasonal variability of river flows. During the wet season, the Project towns experience intense storms which cause frequent flooding in its the urban areas. Low river flows during the dry season cause shortages of water for both household and agricultural use. Saline intrusion of rivers, wells, and bores also occurs in the urban areas of the five towns located near the sea. The 4 candidate towns in the province of Dak Nong lie in hilly to mountainous terrain at 340 m to 670 m elevation. They are about 260 km to 335 km by road from HCMC. Two of the towns lie on National No. 14 which links HCMC and Buon Ma Thuot. The provincial and district capitals in Dak Nong are undergoing rapid urbanization as a result of the province’s separation from Dak Lak⎯mainly due to the change in their administrative status and the surge in Government’s investments in these towns following the separation. This pattern is most evident in the former district town of Gia Nghia which was elevated to provincial town status, and the former commune Quang Khe, which became the capital of the newly formed Dak Glong District in 2005. Dak Nong experiences severe water shortages in the dry season. Urban residents and ethnic minority groups have limited access to physical infrastructure and basic services and there are few off-farm employment opportunities in the province. Figure 1 provides a location map of the candidate towns.
4.3 Status and Characteristics of Candidate Towns The candidate Project towns include two Class III cities, three Class IV provincial towns, 12 Class V district towns, and one commune center (Table 9). Together, they have an estimated population of about 1,006,000 in 2004, ranging from 3,500 to 215,800. The three largest of these are the cities of Tuy Hoa (population of 162,300), Phan Thiet (population of 207,000 population), and Cam Ranh provincial town (population of 215,800). The rest comprise the provincial towns of Phan Rang-Thap Cham (population of 160,800), Gia Nghia (population of 35,600), 12 small towns, and one commune center. The candidate towns are mainly provincial capitals and district towns that serve as economic growth centers for their surrounding rural hinterlands or fishing communities. They provide most of the non-agricultural employment in their respective provinces. Table 10 summarizes the key features of the candidate Project towns and the coverage of their urban services. 5. PRIORITIZATION PROCESS OF THE CANDIDATE TOWNS
The proposed Project used a demand-driven approach to prioritize towns and subcomponents. The prioritization process for the town subprojects and subcomponents followed a two-phased approach:
In the first phase, candidate towns and their proposed Project subcomponents were screened according to the selection criteria agreed between the Government and ADB. Towns that met the selection criteria and had the highest priority for development according to the Government’s development plans, policies, and strategies were included in the Project.

TA 4485 – VIET NAM Central Region Small and Medium Towns Development Project: Final Report Page 20
June 2006
In the second phase, preliminary design of the proposed subcomponents was undertaken with the help of the Consultants and MOC. The technical, social, economic, financial, and environmental viability of each candidate town’s proposed subcomponents was appraised using the relevant policies and guidelines of the Government and the ADB. Modifications were incorporated into the preliminary design, as and when necessary, based on the results of the initial technical, social, economic, financial, resettlement, and environmental assessment conducted.
The prioritization process, described above, produced a list of the candidate towns and their subcomponents⎯evaluated as feasible with respect to the technical, social, economic, financial, resettlement and environmental aspects in accordance with the relevant guidelines of the Government and the ADB⎯and ranked according to the Government’s development plans, strategies and priorities.
Table 9. System of Town Classification in Viet Nam
The ADB's Technical Assistance Report (TAR: VIE 30286, December 2004) and Aide Memoire for the PPTA Inception Mission (17 June 2005) provided the agreed criteria with the Government for evaluating and prioritizing the candidate towns and their proposed subcomponents. The criteria are as follows:
Need for assistance; Commitment and capacity of the PPC; Existence of a Master Plan; No previous ADB assistance in the WSS sector; Economic justification; Poverty-focused, preferably with a minimum 20 percent poverty rate in the
proposed service areas; Willingness-to-pay of beneficiaries; Resettlement impacts, preferably insignificant at 200 or less per town; Environmental impact (preferably Category "B" under the ADB system); and Consistency with the Government’s development needs and priorities.
These criteria and their application to the evaluation of the candidate towns are discussed briefly in the ensuing paragraphs below.
Town Class Type Comments
I National centers. Very large cities which play an important role in national development. Population not less than 1 million.
Includes Hai Phong, Hanoi and Ho Chi Minh City.
II Regional centers. Large cities that play an important role in regional development. Population from 350,000 to 1 million.
Includes Can Tho, Da Nang and Hue. Da Nang is managed by central authorities.
III Provincial cities. Large-medium size towns that play an important role in development of a province or sector in a region. Population from 100,000 to 350,000.
Managed by provincial authorities. Includes Tuy Hoa and Phan Thiet.
IV Provincial towns. Small to medium size towns that play an important role in development of a province. Population from 30,000 to 100,000.
Managed by provincial authorities. Includes Cam Ranh, Thap Cham and Gia Nghia.
V District towns. Small towns that play an important role in development of a district. Population from 4,000 to 30,000.
Managed by district authorities. Includes Song Cau, Ninh Hoa, Van Gia, Tan Son, Ea Tling, Dak Mam, and Quang Khe.
Others District towns and clusters. See Table 9.

TA 4485 – VIET NAM Central Region Small and Medium Towns Development Project: Final Report Page 21
June 2006
Figure 1. Location Map of Selected Provinces and Candidate Towns
HERE INSERT FIGURE 1!!!

TA 4485 – VIET NAM Central Region Small and Medium Towns Development Project: Final Report Page 22
June 2006
Table 10. Key Features of Candidate Project Towns
Y2004 Population** Coverage of Urban Services Province & Town Class Town/City Status District Name Poor
%HH* Town No. Urban No. WS %HH Drains m/capita
SWM %HH
Septic Tanks %HH
Phu Yen 1 Tuy Hoa III City (P) - 9.09 162,278 135,000 28 0.2 89 85 2 Song Cau V Small Town (D) Song Cau 11.2 18,470 18,470 61 0.2 35 70 Khanh Hoa 3 Cam Rah IV Town - 18.0 215,822 90,897 62 0.2 69 62 4 Ninh Hoa V Small Town (D) Ninh Hoa 18.0 117,033 22,014 60 0.6 40-50 70 5 Van Gia V Small Town (D) Van Ninh 5.0 77,359 20,764 60 0.2 61 62 6 Tu Bong V Small Town Van Ninh - 52,046 29,970 0 0.1 40 80 Ninh Thuan 7 Thap Cham IV Part of Town (P) - 10.0 160,781 37,467 68 0.6 90 80 8 Khanh Hai V Small Town (D) Ninh Hoa - 13,738 13,200 70 0.1 50 60 9 Tan Son V Small Town (D) Ninh Son 8.3 38,432 11,432 60 0.0 20 46 10 Phuoc Dan V Small Town (D) Ninh Phuoc 10.0 23,701 23,701 60 0.1 30 60 11 Ca Na - Commune Ctr Ninh Phuoc 10.4 18,451 18,451 0 0.0 16 56 Binh Thuan 12 Phan Thiet III City (P) - 3.0 20,964 183,132 66 0.4 <80 77 13 Cho Lau V Small Town (D) Bac Binh 5.0 151,593 50,703 43/33 0.0 <70 60 14 La Gi V Small Town (D) Ham Tan 8.0 165,711 39,492 42 0.6 - 70 Dak Nong 15 Gia Nghia IV Town (P) - 18.3 35,559 24,811 33 0.2 85 20 16 Ea Tling V Small Town (D) Cu Jut 44.89 27,527 14,527 0 0.2 30 10 17 Dak Mam V Small Town (D) Krong No 36.0 8,972 6,372 0 0.6 25 15 18 Quang Khe V Small Town (D) Dac Nong 55.0 5,214 3,514 0 0.0 0 6
TOTALS 962,800 696,000 47 0.3 65 76 * Based on the new MOLISA Standard (2004). ** These figures are based on meetings and discussions with the PPCs and MABUTIP, surveys conducted by the Consultant’s engineering and socioeconomic group, town statistics books, and existing master plans.

TA 4485 – VIET NAM Central Region Small and Medium Towns Development Project: Final Report Page 23
June 2006
5.1 Need for Assistance Present development trends in the 18 candidate Project towns point to increased urbanization, growing rural-to-urban migration, and expanding industrial and tourism sectors, all of which are expected to lead to more WSS-related environmental problems in the towns in the near future. At present, urban WSS infrastructure in the 18 towns is already grossly inadequate because of lack of investment and poor maintenance. Low coverage and the poor condition of WSS services pose severe environmental and health risks and constrain the socioeconomic development of the towns. The PPTA confirmed that all 18 towns have substantial need for WSS investments.
5.2 Commitment and Capacity of the PPC During the PPTA interim workshop in early November 2005 and subsequent provincial participatory workshops, representatives of the PPCs confirmed their commitment to the Project and indicated their willingness, in principle, to support the Project’s cost recovery objectives and institutional reforms.11 In the final workshop held in early January 2006, representatives from the PPCs of Phu Yen, Khanh Hoa, Ninh Thuan, Binh Thuan, and Dak Nong reiterated their commitment to the proposed Project and confirmed their intention to provide the required counterpart funding. The four provinces located in the South Central Coast Region (Phu Yen, Khanh Hoa, Ninh Thuan and Binh Thuan) have received previous external assistance from ADB and other donors, and their provincial agencies have experience implementing ODA projects. Dak Nong is a relatively new province and its agencies have limited prior experience in implementing ODA projects. Hence, it will require more technical advisory services in the form of consultants and training, compared to the other provinces, to strengthen its project implementation and infrastructure management capacities.
5.3 Existence of a Master Plan All 18 towns have urban master plans in various forms. At least 5 of these plans are 5-13 years old and outdated. New master plans for Ea Tling and Tu Bong have been prepared, but have not yet been approved by the PPCs. The master plan for Van Gia was prepared in 1992 and consists of a written report that covers only the town center, and two outdated master plan drawings. The master plans for Tan Son are more than ten years old. The master plans for Van Gia and Phuoc Dan may not adequately provide a sound basis for detailed subproject preparation. The master plans for Song Cau (1995), Cam Ranh (1999), and Phan Rang-Thap Cham (1999) require updating. Hence, while all the candidate towns have urban master plans, as required, many of them are either being updated or require updating
5.4 Previous ADB Assistance in WSS Four candidate towns have received previous ADB assistance in the WSS Sector. The Provincial Towns WSS Project, more commonly known as ADB-1 (1995-2003), improved water supply, sanitation and drainage infrastructure in Phan Thiet and other towns throughout the country. The Second Provincial Towns Project, (ADB-2, 1997-2006) is developing water supply and drainage schemes in seven provincial capital towns, including Phan Thiet. The Third Provincial Towns WSS Project (ADB-3, 2001-2008) is
11 These constitute agreements in principle. Detailed mechanisms for effecting cost recovery and institutional reforms will have to
be worked out and agreed during the detailed Project design phase.

TA 4485 – VIET NAM Central Region Small and Medium Towns Development Project: Final Report Page 24
June 2006
improving water supply, sanitation and drainage in Tuy Hoa (Phu Yen Province), Phan Rang-Thap Cham and Khanh Hai (both in Ninh Thuan Province) and other towns throughout central and southern Viet Nam. The two most recent projects focused on water supply development and improvement, with drainage as a minor component, representing only about 10-15 percent of the total project cost. Under the proposed Project, these four towns proposed drainage and wastewater management subcomponents to complement the water supply systems developed in previous ADB assistance. Since the drainage works provided under the previous ADB projects were relatively minor, the drainage subcomponents for these four towns were considered eligible under the Project.
5.5 Economic Justification Government policy focuses on achieving high economic growth as the key to narrowing the development gap between Viet Nam and other countries in the Asia region, while at the same time generating sufficient resources to raise living standards, reduce poverty, and achieve social equity in an environmentally sustainable manner. The candidate towns mainly constitute the provincial capitals and district towns that serve as economic growth centers in their surrounding rural hinterlands or fishing communities. The towns comprise a growing number of urban centers, collectively envisioned, to spur the economic growth and development of the Central Region. Appendix 2 summarizes the provincial socioeconomic development plans propelling the growth of the candidate towns for the period 2006-2010. External assistance to the WSS sector over the past decade, amounting to about $1.3 billion, has focused primarily on the major cities and provincial capitals. The resulting underinvestment in the secondary towns has jeopardized their ability to realize their full potential to support the accelerated but equitable growth of Viet Nam. Hence, the economic justification for the Project is premised on the Government’s focus on equitable development for all regions of the country and poverty reduction through economic growth, stimulated by investment in the following:
• Medium-sized cities and provincial towns (e.g., Phan Thiet, Tuy Hoa, Cam Ranh and Phan Rang-Thap Cham and Gia Nghia) which serve as satellite growth centers. Investing in these areas will accelerate regional economic growth and generate budget revenues in the large towns which can be used to subsidize development and address poverty in less dynamic areas;
• Provincial and district towns in poor provinces or less developed areas (e.g., Gia Nghia, Ea Tling, Dak Mam, Quang Khe). Investing in these towns will produce geographic equity in social infrastructure provision, support rural development, and generate economic development in the towns and their surrounding areas.
• Medium and small district towns (e.g., Ninh Hoa). Investing in these areas will help smaller towns keep apace with the growing demand for urban services due to increasing urbanization, and will promote economic development in the towns and their adjoining rural areas.
5.6 Poverty Reduction Focus
Viet Nam has made rapid achievements in poverty reduction in recent years, from 58 percent in 1993, 37 percent in 1998, 29 percent in 2002 and 8 percent in 2004 (based on the old MOLISA criteria). Poverty remains most severe in the rural areas where over 90 percent of the country’s poor live. Poverty is also relatively high in the upland, remote and isolated areas and ethnic minority areas such as the Central Highlands.

TA 4485 – VIET NAM Central Region Small and Medium Towns Development Project: Final Report Page 25
June 2006
The Central Region is one of the poorest areas in Viet Nam. The provinces where the Project will be implemented rank from the 47th poorest province in Viet Nam (Khanh Hoa) to the 11th poorest (Ninh Thuan). However, urban poverty rates are higher in Binh Thuan (at 24 percent, the second least poor province), and Ninh Thuan (21 percent) than in the other three provinces. Binh Thuan and Ha Giang Province (ranked the second poorest in Viet Nam) have the highest rates of urban poverty in Viet Nam. In addition, urban poverty has other dimensions that are present in the candidate towns. These include lack of access to adequate infrastructure, credit, livelihood opportunities, and human capital. The urban poor in the Project towns live in underserved areas where there is almost no piped water, drainage is dysfunctional or nonexistent, flooding is frequent, access to solid waste collection is limited, sanitation is inadequate, and the environment is polluted because of poor toilet and septic tank facilities. There are also some households that reside just above the poverty line and they are equally susceptible to shortage of clean water, poor sanitation, and floods, all of which weaken their human capital, especially their health.
5.7 Beneficiaries’ Willingness-to-Pay Social surveys elicit information that enable assessment of the prospective beneficiaries’ willingness and ability to pay for the urban infrastructure and services to be financed by the Project. Socioeconomic surveys were undertaken in 14 of the 18 candidate towns, including Tuy Hoa, Cam Ranh, Gia Nghia, Phan Thiet, Song Cau, Ninh Hoa, Ca Na, Tan Son, Ea T’ling, Dak Mam, Quang Khe, Van Gia, Khanh Hai, Thap Cham, and La Gi.12 The results of these surveys confirm the experience in other projects in Viet Nam which indicates that, in general, households have a higher willingness to pay for water supply, but lower willingness to pay for drainage and wastewater services, partly because of low environmental awareness and a lack of appreciation for the linkages between sanitation and health. Moreover, the affordable limits of urban residents are higher in the larger towns due to their higher incomes (Appendix 3). Willingness to pay for solid waste management is relatively high in the large, densely populated towns, but much lower in the low density small towns, where residents have more access to space for burying or disposing their waste. This situation creates a disincentive for them to pay for solid waste collection, transport and disposal. Willingness to charge for urban services is a common problem in Viet Nam and in many other countries. As PPCs are legally responsible for setting water tariffs, an important aspect of their commitment will be their willingness to impose tariffs at levels adequate to ensure the financial sustainability of WSS service providers who will also be responsible for managing the infrastructure financed by the Project.
5.8 Resettlement Impact
The resettlement impact of the Project should not be significant, with preferably 200 or less Affected Persons (APs) per town. ADB and the Government have agreed that the Project will not include subprojects or subcomponents that would result in significant resettlement. People are considered severely affected when they are: (i) physically
12 It was decided, given the budget constraints of the PPTA, that socioeconomic surveys will not be conducted in candidate towns,
whose priority ranking indicated they will not be included in the Project given the $97 million budget approved by the Government for the Project.

TA 4485 – VIET NAM Central Region Small and Medium Towns Development Project: Final Report Page 26
June 2006
relocated, and/or (ii) lose 10 percent or more of their total productive assets. Resettlement and inventory of loss surveys are required to assess resettlement impact. Preliminary analysis indicates that only the drainage and wastewater management subcomponents in the large towns of Tuy Hoa, Cam Ranh, Phan Rang-Thap Cham and Phan Thiet may affect more than 200 persons. The feasibility study phase of the proposed Project will review these proposed subcomponents to reduce the service areas, or exclude certain areas that otherwise may involve significant resettlement.
5.9 Environmental Impact The ADB has classified the Project as a Category “B” undertaking, indicating that it is expected that implementation of all subproject components will generally be minor, or moderate. Measures to mitigate these impacts can be provided and instituted without difficulty. In this regard, it was agreed between the Government and the ADB that mechanical wastewater treatment plants will not be included in the Project. However, the Project will finance the development of waste stabilization ponds for biological wastewater management.
5.10 Government Development Needs and Priorities Government policies for urban development emphasize four priority areas: (i) economic growth; (ii) poverty reduction; (iii) balanced and sustainable growth between the regions; and (iv) provision of essential infrastructure to poor areas in cities and towns. All of the PPCs involved in the Project have given higher priority to developing their provincial capitals and towns than the small district towns. Investment in the large provincial cities and provincial towns of the South Central Coast (Tuy Hoa, Cam Ranh, Phan Rang-Thap Cham and Phan Thiet) and the Highlands areas (Gia Nghia) will provide the greatest benefits to the Central Region’s economy and will have the greatest overall beneficial impact on the region’s poverty. Investment in these five towns will likely be more economically efficient and sustainable because of larger investment multiplier effects, economies of scale, and higher population densities compared to the smaller towns. Accordingly, these five towns were considered to have the highest development priority in terms of meeting the Government’s policies for urban development which support the SEDS (2001-2010), the SEDP (2006-2010), and the CPRGS. Experience in Viet Nam and other countries in Asia shows that the establishment of economically efficient and financially sustainable WSS systems in the provincial centers is an essential first step to constructing and operating complete systems in the smaller towns. Budget revenues derived from efficient urban services in the larger towns can be used directly or indirectly to subsidize services in the smaller towns which lack economies of scale and financial resources. Similarly, the management and technical capacity developed by urban services companies in the larger towns can support urban services in the smaller towns where such capacity is often lacking.
6. SOCIOECONOMIC AND COMMUNITY HEALTH CONDITIONS The proposed towns are located in five Central Region provinces, namely Phu Yen, Khan Hoa, Binh Thuan and Ninh Thuan in the South Central Coast region, and Dak Nong in the Central Highlands region. Annual economic growth in these five provinces during the period 2000 to 2005 has ranged from 9.2 to 12.1 percent (Table 11). Thus, the candidate towns are exhibiting relatively faster economic growth and urbanization resulting from their increasing transformation into industrialized economies.

TA 4485 – VIET NAM Central Region Small and Medium Towns Development Project: Final Report Page 27
June 2006
Viet Nam’s poverty line is defined as the minimum income required to meet the food requirements and other non-food basic needs of a typical household.13 There are other aspects of urban poverty, however, that are evident in the quality of life lived by the residents of the candidate towns such as lack of access to employment, adequate housing and infrastructure, social protection, health and education, and personal security. The increasing industrialization of candidate towns is leading to labor shedding, making the living conditions of redundant state employees more difficult. Many have been forced to shift to the non-state sector and have had to accept lower salaries or wages. Those unable to find a job have joined the ranks of the unemployed. The socioeconomic profiles of the candidate towns surveyed under the PPTA are summarized in Table 12. The social survey methodology used and findings are detailed in Appendix 3.
Table 11. Economic Structure of Selected Provinces
Contribution to GDP in 2005 Contribution to GDP in 2010* Province
Average Annual GDP Growth Rate
(%)
Agriculture (%)
Industry (%)
Services (%)
Agriculture (%)
Industry (%)
Services (%)
GDP ($
million) 2005
GDP/capita ($ million)
2005
Phu Yen 10.8 33.6 30.7 35.7 21.4 43.3 35.3 311 384 Khan Hoa 10.0 18.0 40.9 41.1 14.0 44.0 42.0 783 730 Binh Thuan 12.1 37.6 28.6 33.8 20.0 35.0 45.0 460 398 Dak Nong 9.2 72.6 10.0 17.4 55.6 22.0 22.4 132 280 Ninh Thuan 9.5 42.0 21.0 37.0 30.0 35.0 35.0 123 290 * Based on a review of the 2001-2005 and 2006-2010 socioeconomic development plans of each province.
The processes of industrialization and urbanization in the Project towns have also increased the inflow of unregistered migrants from the rural areas. These migrants usually find it difficult to secure permanent registration and, consequently, encounter many difficulties in getting stable jobs with stable incomes. They are confronted with even more severe limitations than registered residents in accessing social services. Thus, the urban poor in the Project towns are increasing at rates faster than the official urban poverty incidence indicators reveal. A growing number of people live in areas where basic WSS services such as safe water, hygienic and sanitary environment, adequate drainage, and solid waste management are inadequate or nonexistent. These living conditions make them more susceptible to water-related diseases such as cholera and typhoid fever, water-washed diseases such as trachoma, water-based diseases such as schistosomiasis, water-related vector-borne diseases such as malaria, filariasis and dengue, and water-dispersed infections such as legionellosis. Figure 2 provides a summary of the WSS condition in the candidate towns.
13 The basic non-food needs cover non-food expenditure items comprising the total household expenditures as indicated in family
income and expenditure surveys.

TA 4485 – VIET NAM Central Region Small and Medium Towns Development Project: Final Report Page 28
June 2006
Table 12. Summary Socioeconomic Survey Findings of Candidate Towns
Town No. Province Selected
Towns
Estimated Population of Urban
Area (FY2005)
% of HHs w/ Woman as HH Head
% of HH w/ Improved Latrines
% of HH w/Access to Piped Water
WTP for HH Latrine
Loan (%)
WTP for Improved
Drainage (%)
Average Monthly
Income/HH) (VND 000)
Amount Spent on
Water/HH* (VND)
Urban Poor HHs as % of Estimated
Urban Population
1 Tuy Hoa 135,000 36 12 39.6 71.2 54.1 500- 700 10,500 9.0 2
Phu Yen Song Cau 18,470 31.5 25 65.8 43.5 72.2 350- 400 12,500 11.2
3 Cam Ranh 90,897 22 25 44 46 49 300- 350 43,300 18.0 4 Ninh Hoa 22,014 29 25 22.2 66.7 36.1 400- 500 20,400 18.0 5
Khanh Hoa Van Gia 20,764 24 25 35 92 98 250-300 2,400 5.0
6 Tan Son 11,432 23.7 38 50.1 71.7 48.9 500-600 6,000 8.3 7 Ca Na 18,451 39.8 30 5.5 61.1 60.2 600- 700 77,000 10.4 8 Thap Cham 37,467 41 50 70 55 88 400-500 31,400 23 9
Ninh Thuan
Phan Thiet 183,132 24.3 20 71.6 42.2 75.2 600- 700 27,300 3.0 10 Binh Thuan Gia Nghia 24,811 19.3 50 5.5 52.3 67 300- 400 12,200 18.3 11 Ea T’ling 14,527 30.6 60 27.8 64.8 80.6 300- 400 8,500 44.9 12 Dak Mam 6,372 8.0 20 0 67.3 77 350-450 0 36.0 13
Dak Nong Quang Khe 3,514 15.5 0 0 92.9 85.4 250-350 0 55.0
HH = households; WTP = willingness to pay. * In Ea T’ling, poverty level is defined as income of VND 260,000/person/month. All the other towns use the MOLISA standard amount of VND 250,000/person/month, except in Cam Ranh and Ninh Hoa, where they use
the Khanh Hoa standard of VND 300,000/person//month.

TA 4485 – VIET NAM Central Region Small and Medium Towns Development Project: Final Report Page 29
June 2006
Figure 2. Water Supply and Sanitation Condition in the Candidate Project Towns
Water Supply 1. Some towns do not have
access to water supply systems.
2. Water supply systems in some towns operate below capacity due to limited water sources and water treatment plants.
3. Some towns have low
water coverage and low supply of potable water.
4. There is a lack of distribution network and services in some towns.
Tu Bong
Ea Tling
Quang Khe
Ca Na
Ea Tling
Ninh Hoa
Van Gia Tan Son
Gia Nghia Dak Mam
Ca Na
Ninh Hoa
Dak Mam
Ca Na

TA 4485 – VIET NAM Central Region Small and Medium Towns Development Project: Final Report Page 30
June 2006
Drainage
1. Some towns have no drainage system. In towns with drainage, it is usually a combined system that is usually simple and sometimes even obsolete.
2. In some towns there is limited drainage coverage.
3. Flooding occurs frequently during rainy seasons.
4. The drainage system in some towns performs poorly; drains are frequently filled with sludge.
5. The drainage in some towns suffer from a lack of proper maintenance.
Tuy Hoa
Cam Ranh
Thap Cham
Phan Tiet
Phuoc Dan
Khan Hai
Gi Nghia Dak Mam
Cam Ranh
Tuy Hoa Thap Cham
Thap Cham Khan Hai
Phuoc Dan
Cam Ranh
Khan Hai Phan Tiet

TA 4485 – VIET NAM Central Region Small and Medium Towns Development Project: Final Report Page 31
June 2006
Solid Waste Management
1. Most current landfills are left open and are often not well-designed.
2. Solid waste is frequently dumped in unsanitary landfills in the urban areas.
3. In many small towns, there are no established systems for collecting and treating waste.
4. The capacity and facilities of solid waste management entities to collect solid waste are limited and insufficient to meet the demand.
Van Gia
Cam Ranh Ninh Hoa
Cam Ranh
Song Cau
Song Cau
Cam Ranh
Ninh Hoa

TA 4485 – VIET NAM Central Region Small and Medium Towns Development Project: Final Report Page 32
June 2006
7. SECTOR OPPORTUNITIES AND CHALLENGES IN THE PROJECT TOWNS
Particularly in the dry (Binh Thuan and Ninh Thuan) and mountainous (Dak Nong) provinces where the Project will be implemented, demand for improved water and environmental sanitation services is generally high. Especially where improved piped water supply is not yet available (e.g., Ca Na), or where existing coverage remains quite limited, willingness to pay for improved access to higher quality water is very high. People pay as much as VND 50,000/m3 for water trucked into Ca Na, compared to the Ninh Thuan PWSC tariff of VND 2,800/m3 for the first 15 m3. In very dry Ninh Thuan, people are willing to pay for access to reliable, good quality water service. In other provinces, the history of the local authorities providing subsidies and considering water as a social (but not economic) good has suppressed willingness to pay. In addition, poor quality of services by some providers has undermined willingness to pay for improved services. Flooding is a major problem in large towns such as Tuy Hoa and Phan Thiet, and small towns such as Song Cau. Based on visits to the proposed Project towns and discussions with prospective customers, local authorities, and water and environmental sanitation services providers, particularly during the provincial participatory workshops, there is strong support for the Project, specifically among people living in towns characterized by high incidence of flooding, which reduces the value of their land and has adverse community health and other socioeconomic impacts. Socioeconomic surveys show that people are willing to pay a fee of 10 percent or more of their water tariff for access to improved drainage in their areas. However, many people continue to be reluctant to commit to paying higher than previous water and drainage tariffs without clear evidence of higher quality service provision. Hence, the key challenges to the WSS sector in the candidate towns include:
• Ensuring full cost recovery tariffs for the proposed water supply schemes; • Charging adequate fees at a percentage of the water tariff to partially cover
drainage and wastewater management costs; • Charging tariffs for solid waste management that at least cover the O&M costs of
operating the landfills; and • Strengthening the capacity of all relevant urban institutions involved for planning,
implementing, and O&M of WSS systems and facilities in the candidate towns. Appendix 4 presents a comprehensive analysis of the WSS sector in Viet Nam as they relate to the proposed Project. Appendix 5 summarizes the proposed policy and institutional reform agenda for the Project based on the WSS sector analysis conducted. 8. MASTER PLANS, DESIGN AND TECHNICAL CONSIDERATIONS
8.1 Status of Master Plans
Urban development in the Project provinces is guided by three types of plans: (i) socioeconomic plans for which the Ministry of Planning and Investment is responsible; (ii) spatial plans (also termed master, physical or construction plans) for which the Ministry of Construction is responsible; and (iii) sector plans for which the respective line ministries are responsible. The Project towns have approved Master Plans with two stages of development: 1st Stage to 2010, and 2nd Stage to 2020 (Table 13).

TA 4485 – VIET NAM Central Region Small and Medium Towns Development Project: Final Report Page 33
June 2006
Table 13. Status of Master Plans in the Project Cities and Towns
No Province City or Town Year of Master Plan
Year of Adjustment Approved by
1 Phu Yen Tuy Hoa 1998 2004 MOC 2 Song Cau 2000 2005 PPC 3 Khanh Hoa Cam Ranh 1998 2005 PPC 4 Ninh Hoa 1992 1999-2005 PPC 5 Van Gia 1998 2005 PPC 7 Ninh Thuan Phan Rang-Thap Cham 1994 2000 MOC 9 Tan Son 1994 - PPC
11 Ca Na 2000 - PPC 12 Binh Thuan Phan Thiet 1992 2000 MOC 15 Dak Nong Gia Nghia 2003 - MOC 16 Ea T’ling 1998 2004 PPC 17 Dak Mam 2000 2004 PPC 18 Quang Khe 2005 - PPC
Note: MOC = Ministry of Construction; PPC = Provincial People’s Committee
8.1.1 Adjustment of Master Plans In general, physical development of roads and other infrastructure in the 14 Project towns is proceeding in accordance with the Master Plans. However, the pace of Master Plan implementation in each town depends primarily on the town’s actual economic development and production, and the amount of Government or ODA investment. The original Master Plans in several towns have been adjusted to take account of changes in socioeconomic conditions or changes in infrastructure plans. Recent or proposed adjustments include the following:
Ninh Hoa: The town will be expanded eastwards to the coast and will incorporate two new residential areas, namely, Ninh Thuy and Ninh Phuoc. The Ninh Hoa water supply subcomponent will extend water supply to these two areas.
Cam Ranh: A major land reclamation project is proposed in the south of Cam Ranh, which will expand the town by about 100-500 m along the bay foreshore. The new Master Plan shows that a future wastewater treatment plant for the town will be located on the reclaimed area near the port. The proposed Cam Ranh subproject will develop waste stabilization ponds on the site proposed in the new Master Plan.
Phan Rang: An additional 365 ha residential area and 10 ha regulating lake will be constructed to the north of Thap Cham. The regulating lake will be a central feature of the proposed Thap Cham drainage and wastewater management subproject.
Ca Na: The Master Plan for the future town of Ca Na has been completed and approved by the PPC. The plan covers a strip of land on the eastern side of Highway 1A, which includes future offices, industries and residential areas. Construction of infrastructure has commenced from the west of the town in Ca Na industrial zone.
8.1.2 Compliance of Project Designs with Master Plans Planning and design of the Project will comply with the approved urban Master Plan for each town, and will follow the Master Plan’s orientation of spatial development. Foundation levels, road levels and road alignments for design of Project facilities such as water supply and drainage conduits will be based on the Master Plans. The proposed locations of major Project facilities such as water intakes, water treatment plants, access roads, reservoirs, pumping stations, wastewater treatment facilities and landfills have been discussed and agreed with the five Project PPMUs and provincial

TA 4485 – VIET NAM Central Region Small and Medium Towns Development Project: Final Report Page 34
June 2006
agencies. The general locations of those facilities comply in most cases with the approved Master Plans, but in other cases it will be necessary for the PPCs to make formal adjustments to the Master Plans before the Pre-Feasibility Study is submitted to the Prime Minister for approval.
8.2 Design Philosophy
8.2.1 Orientation Plans for Water Supply and Sanitation Government policy and strategy for the water and sanitation sector are set out in the Orientation Plans for urban water supply, drainage and solid waste management, approved by the Prime Minister in 1998 and 1999. The key objectives of the Orientation Plan for Urban Water Supply Development to 2020, Decision No. 63/1998/QD-TTg, are to (i) rapidly increase water supply coverage in urban areas to 80-90 percent by 2010 and, where feasible, to 100 percent by 2020; (ii) achieve greater commercialization of the water sector; (iii) modernize water technology and equipment; (iv) improve protection of water resources and the environment; (vi) develop human resources in the water industry; and (vii) mobilize all sectors of the economy and community to contribute to develop and improve water supply services. The Orientation Plan for Urban Drainage to 2020, Decision No. 35/1999/QD/TTg, proposes that drainage and wastewater systems will be improved step-by-step. The key objectives are to (i) reduce flooding in urban areas; (ii) rehabilitate existing networks and facilities; (iii) expand drainage coverage to 80-90 percent by 2020; (iv) eliminate pit latrines in urban areas; (v) introduce wastewater treatment as resources permit; (vi) promote market oriented approaches to service provision; (vii) develop through public education a better awareness of the impact of sanitation on public health, environmental sustainability and economic development; and (viii) gradually replace subsidies with user charges for drainage services. The objectives of the National Urban and Industrial Zones Solid Waste Management Strategy to year 2020, Decision No. 152/1999/QD-TTg, are to (i) close uncontrolled dumps and replace them with engineered or sanitary landfills; (ii) increase solid waste collection step-by-step in urban and industrial areas to 80-95 percent coverage by 2020; and (iii) strengthen institutions and the legal framework for solid waste management.
8.2.2 Design Philosophy and Development Targets The proposed Project will follow the objectives and principles of the Government’s Orientation Plans for the WSS sector. The Project’s development targets are set out below. The targets are based on actual socioeconomic and physical conditions in the Project towns.
a. Water Supply By 2015, aim to achieve water supply coverage and consumption as follows: • 85 percent coverage for urban population in Class IV towns at 120 lpcd; • 80 percent coverage or urban population in Class V towns at 100 lpcd; and • 60 percent coverage for population in nearby communes at 80 lpcd.

TA 4485 – VIET NAM Central Region Small and Medium Towns Development Project: Final Report Page 35
June 2006
By 2020, aim to achieve water supply coverage and consumption as follows: • 95 percent coverage for urban population in Class IV towns at 135 lpcd; • 90 percent coverage for urban population in Class V towns at 120 lpcd; and • 70 percent coverage for population in nearby communes at 100 lpcd.
b. Drainage and Wastewater Management By 2015, for Class III cities and Class IV towns, aim to: • Eliminate flooding in the high density urban areas for 1 in 5 year storm (+ high tide); • Increase drainage coverage to 40-70 percent in urban wards; • Collect and treat 40-70 percent of wastewater generated in high density urban areas
using appropriate solutions, if economically justified and affordable; and • Increase septic tank coverage to >90 percent in urban wards. By 2020, for Class III cities and Class IV towns, aim to: • Eliminate flooding in urban areas for 1 in 5 year storm (+ high tide); • Increase drainage coverage to 80 percent in urban wards; • Collect and treat 80 percent of wastewater generated in urban areas, using
appropriate solutions; and • Increase septic tank coverage to >90 percent in urban wards and suburban
communes. By 2015, for Class V towns, aim to: • Construct small scale drainage works to (i) relieve flooding in densely populated
areas and in areas where flooding is most severe, and (ii) control wastewater and pollution in the most densely populated urban areas; and
• Increase septic tank coverage to >70 percent.
c. Solid Waste Management
By 2015 for Class IV and Class V Project towns, aim to: • Collect >80 percent of municipal solid waste, and safely dispose of the waste in
sanitary landfills; and • Collect >75 percent of medical solid waste in Class IV towns and safely dispose in
secure hazardous waste cells at the landfills;
By 2020 for Class IV towns, aim to: • Collect >90 percent of municipal solid waste and dispose safely in sanitary landfills.
8.3 Planning and Design Criteria
8.3.1 Water Supply
The water supply subcomponents will be designed to provide (i) piped water of potable quality meeting the Ministry of Health Drinking Water Standards, Decision 09/2005/QD-BYT; (ii) 24-hour continuous supply; and (iii) adequate pressure (8m minimum) in the distribution network.

TA 4485 – VIET NAM Central Region Small and Medium Towns Development Project: Final Report Page 36
June 2006
Long term planning and land acquisition for the water supply systems will be based on the Master Plan development and water demand forecasts in 2020. In general, civil works for water intakes, raw water transmission systems and pumping stations will be designed for Y2020 water demands. To avoid overinvestment, water treatment plants, pumping station plant (e.g. pumps) and reservoirs will be designed for 2015 demands with provision for future expansion. Distribution and reticulation pipelines will be designed for 2015 or 2020 demands (depending on least cost considerations), and their extent will depend on the actual development of the towns in 2010 when the Project is scheduled to be implemented. Water demand forecasts will be based on separate projections of each component of demand, including: (i) domestic use calculated from target coverage per capita consumption, and population projections; (ii) public and service use estimated as 5 percent of domestic demand; (iii) handicraft and small industry use taken as 10 percent of domestic demand; (iv) industrial zone demand calculated on a case-by-case basis, and; (v) unaccounted-for water at 20 percent14 of water production. Design criteria for water supply include: (i) daily peak coefficient K1=1.2 and peak hour coefficient K2=1.5; and (ii) 8m-60m working head and 90m test head for the water supply transmission and distribution network.
8.3.2 Drainage and Wastewater Long term planning and land acquisition for the proposed drainage and wastewater systems will be based on the Master Plan development, forecast flows and pollution loads in 2020. In general, primary, secondary and tertiary drains will be designed to meet planned development and forecast flows in 2020, and their extent will depend on the actual development of the towns’ roads in 2010 when the Project is scheduled for implementation. Wastewater pumping station civil works will be designed for 2020 flows. Design of civil works for 2015 flows is not recommended because of the difficulty and cost of future expansion in densely populated urban areas. Wastewater treatment facilities, interceptor sewers, wastewater pumping station plant and equipment (e.g., pumps), pumping mains and trunk sewers will be designed for 2015 flows and pollution loads, with provision for expansion. Design of wastewater facilities for 2020 flows is not recommended because oversizing of wastewater facilities inevitably results in problems with solids deposition and odor generation. The following criteria apply for the design of drainage and wastewater systems: Combined Drainage Systems:
• Class III city– design primary drains for 1 in 5 year storm; secondary and tertiary drains for 1 in 2 year storm;
• Class IV and Class V towns – design primary drains for 1 in 5 year storm; secondary and tertiary drains for 1 in 1 year storm;
• The hydrologic design follows Standard VN Practices, including: (i) storm intensity-duration-frequency relationship developed by the Weather and Hydrology institute for the closest available town; (ii) runoff coefficients based on
14 Levels of unaccounted-for-water in most towns throughout the country currently exceed 20 percent. Ministry of Construction
recommends the use of 20 percent UFW as a target for this Project.

TA 4485 – VIET NAM Central Region Small and Medium Towns Development Project: Final Report Page 37
June 2006
the Design Standards for Urban Drainage Systems, MOC, 1984; and (iii) all other criteria are according to Viet Nam standard 20 TCN 5984;
• Storm water flows are calculated using the Rational Method, using the following runoff coefficients, ϕ: (i) for built-up areas, ϕ = 0.8 – 0.9; for areas with medium construction density: ϕ = 0.5 – 0.8; for areas with low construction density: ϕ= 0.4 – 0.5; for green areas, vacant areas: ϕ = 0.1 – 0.3.
• The hydraulic design of drains is based on Manning’s equation, using Manning friction coefficient "n" = 0.013 for concrete pipes and culverts, and n=0.02 to 0.03 for open trenches. Additional head losses are taken into account for flow through pits; and
• The minimum gradient of any pipe in a combined system is determined by the 1/D rule.
Wastewater Systems:
• Wastewater flows are calculated from population projections, target drainage coverage and the estimated proportion of water consumption contributing to wastewater, based on consideration of specific socioeconomic and natural conditions in the concerned Project towns;
• Large industries located in industrial zones will be required to provide on-site wastewater treatment, while small-medium industries within the urban areas will be required to pretreat their wastewater to prescribed standards prior to discharge to the combined drainage system;
• Waste stabilization ponds are designed to produce effluent meeting relevant Vietnamese standards. For the relatively hot climates prevailing in the Project towns, wastewater will need to be retained in the ponds for about 15 days to meet the required standards;
• BOD5 loadings are based on 30 grams per capita day after reduction in septic tank;
• Capacities of wastewater interceptors are designed for two times the average dry weather wastewater flow plus allowance for infiltration;
• Interceptor sewers and trunk sewers are designed with self-cleansing grades.
8.3.3 Solid Waste Management
Landfill infrastructure, access roads and local storage stations in the towns will be designed and constructed for 2020 requirements. Solid waste collection, transport and landfill equipment will be designed for solid waste forecasts in 201215. Landfill cell capacity will meet the urban solid waste requirements for the four year period 2011-2014, based on the following criteria:
• Urban solid waste generated: 0.75 kg/capita/day; • Density of solid waste inside handcart or storage bin: 300-350 kg/m3. • Density of solid waste inside compactor truck: 500 kg/m3. • Density of solid waste in landfill after compaction: 700 kg/m3 without machine
compaction and 850 kg/m3 with dozer compaction. Design criteria for solid waste components are based on MOC Circular No. 5/2002/TT-BXD, dated 30 December 2002, on introduction of cost estimation and management of urban services.
15 Landfills are scheduled for completion at end of 2010.

TA 4485 – VIET NAM Central Region Small and Medium Towns Development Project: Final Report Page 38
June 2006
8.4 Technology and Technical Considerations
8.4.1 Appropriate Technology The Project is technically sound. It draws on appropriate technology, proven water supply and sanitary engineering practices and design criteria in combination with low-cost technology and simple operation.
8.4.2 Water Supply The Project will expand or develop water supply systems for eight Project towns. Alternative water sources were considered for all water supply schemes. The selected surface sources are the least cost, feasible sources in the vicinity of the service areas. Available groundwater investigations and local enquiries revealed that groundwater would not be viable option for Ca Na or any of the schemes in Dak Nong, because of limited yield. Similarly, groundwater for the two systems in Khanh Hoa province has limited yield and poor quality. Water treatment processes are expected to include: (i) continued use of slow sand filters in Van Gia; (ii) coagulation, two stage filtration and chlorination for water supply systems using raw water from lakes and shallow groundwater16 (i.e. Ninh Hoa, Van Gia, Dak Mam and Quang Khe); and (iii) full treatment including coagulation, sedimentation, rapid filtration and chlorination for the other systems that have relatively high levels of sediment and turbidity in the wet season. The proposed treatment processes are relatively straightforward technically, and are widely used throughout Viet Nam, and the Project provinces. Specific measures to protect water sources are recommended for implementation under the Project. These include (i) monitoring of water quality and quantity; (ii) introduction of legislation to prevent development and polluting activities in the vicinity of surface intakes and wells; (iii) control and monitoring of activities in the catchment upstream of water supply intakes and wells; and (iv) enforcement of regulations for treatment and discharge of industrial wastewater. All pumping stations will be equipped with optimally sized duty and standby pumps. In general, fixed speed pumps will be used for raw water pumping systems which operate over a narrow range of heads. For treated water pumps, variable frequency drives will be used in combination with fixed speed pumps to minimize electricity consumption and avoid the need to construct costly, elevated reservoirs. Small storage reservoirs will be provided at booster pumping stations to facilitate pump control and provide a reserve of water in the event of disruption to supply. A rechlorination facility will be provided for the 32 km long Ca Na transmission main, to ensure that safe water with adequate chlorine residual is supplied to customers. Three levels will be adopted in the distribution network ⎯ primary, secondary and tertiary pipes. Households will connect to tertiary pipes only. Pipe materials will be chosen on the basis of least cost considerations and quality. Although various pipe materials could be used for the anticipated range of pressures and flows, in practice, the choice is dictated largely by capital cost and experience in Viet Nam with the various pipe types and sizes. Generally, ductile iron pipes with cement mortar lining and rubber ring joints will be used for pipes of DN ≥200mm. For pipes 200>DN ≥80, PVC pipes with rubber ring joints will be used, and for pipes≤DN50 PVC pipes with rubber ring or solvent 16 These sources have relatively low turbidity, organic and iron content.

TA 4485 – VIET NAM Central Region Small and Medium Towns Development Project: Final Report Page 39
June 2006
welded joints will be employed. Polyethylene (HDPE or MDPE) pipes are emerging as a competitor to PVC pipes, and cost benefit analyses will be required at the implementation stage to determine the optimum pipe choice. At present, large diameter HDPE or PE pipes must be imported and are not cost competitive with locally produced alternatives.
8.4.3 Drainage and Wastewater Management Combined vs. Separate Systems: Currently, Tuy Hoa, Cam Ranh, Thap Cham, Phan Thiet and Gia Nghia have low or very low coverage of combined drains that discharge through outfalls to rivers, streams, canals or bays. Table 14 compares three options for future drainage and wastewater management, namely: (i) combined systems; (ii) combined systems with wastewater interceptors; and (iii) separate systems. For all subprojects, a separate system was rejected as an alternative to combined systems with interceptor sewers, because (i) separate sewers are substantially more costly in terms of capital and O&M costs; (ii) it is difficult to control the quality of sewer connections and prevent stormwater entry to the separate sewers; and (iii) separate sewerage systems are not well suited to stepwise development. Analyses of the three alternatives show that combined system with interceptors is the least cost, environmentally acceptable solution. Combined systems with interceptor sewers and wastewater treatment systems are recommended for the Class III and Class IV Project towns, and combined drainage systems are recommended as a first step in the drainage development plans for the Class V towns.
Table 14. Comparison of Combined and Separate Systems
Item Combined System
Combined System with Wastewater Interceptor
Separate System
Potential for Odors X X XXXX Potential for Blockage by Solid Waste XX XX XXXX Release of Wastewater to Environment XX XXX XXXX Capital Cost XXXX XXX X Operation and Maintenance Costs XXX XX X Simple Operation XXXX XXX XX Skilled Operators Required XXXX XX XX Resettlement Required XXX XX X Energy Demand XXXX XXX XX Householder Costs and Fees XXX XX X Cost and Need for Septic Tanks X XX XXXX Affordability XXXX XXX X Financial Sustainability XXX XXX X Compulsory Connection Required XXXX XXXX X Step-by-step Development XXXX XXXX X
Notes: XXXX = excellent; XXX = good; XX = fair; X = poor. Sewage Treatment and Disposal: Simple, low cost waste stabilization ponds will be constructed in Tuy Hoa, Cam Ranh, Thap Cham and Phan Thiet to improve environmental conditions, minimize potential for pollution of beaches and protect fishing and shrimp farming industries which are growing sources of revenue for all four towns. Provision of treatment facilities in Gia Nghia is not proposed for this initial stage of development because of financial and affordability constraints. However, provision of interceptor sewers, screened overflows and more extensive coverage septic tanks through Component 1 will minimize potential for pollution of the central lakes in Gia Nghia.
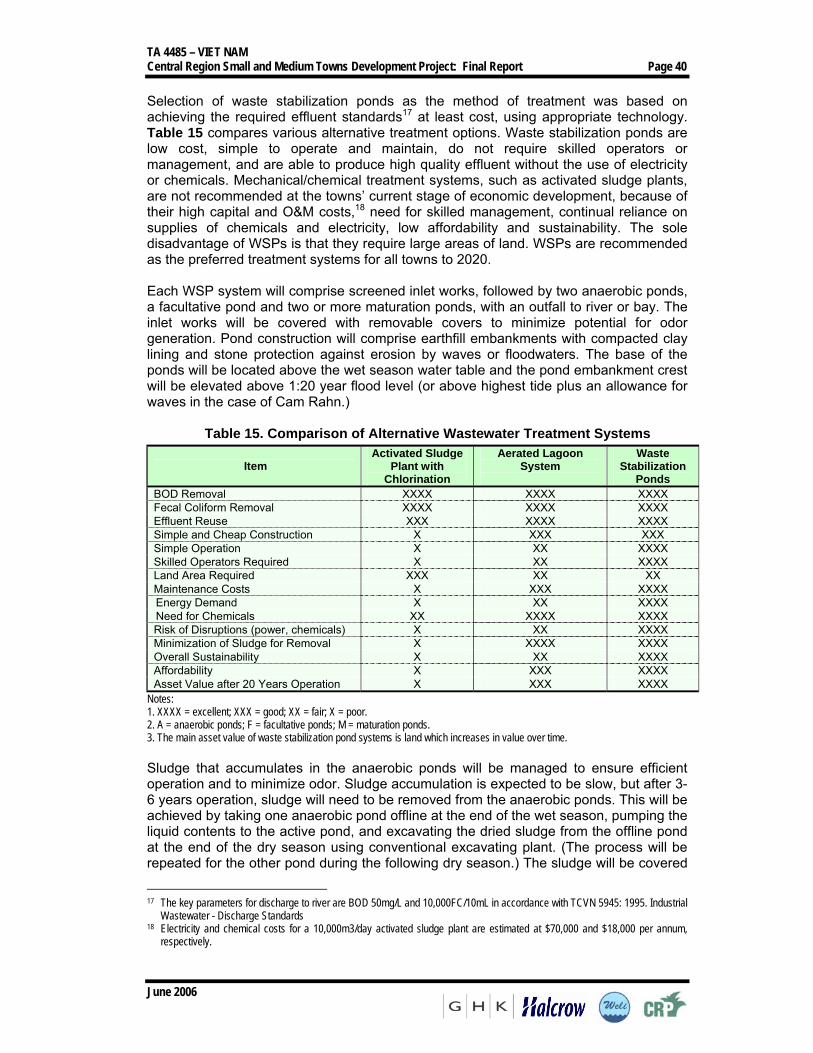
TA 4485 – VIET NAM Central Region Small and Medium Towns Development Project: Final Report Page 40
June 2006
Selection of waste stabilization ponds as the method of treatment was based on achieving the required effluent standards17 at least cost, using appropriate technology. Table 15 compares various alternative treatment options. Waste stabilization ponds are low cost, simple to operate and maintain, do not require skilled operators or management, and are able to produce high quality effluent without the use of electricity or chemicals. Mechanical/chemical treatment systems, such as activated sludge plants, are not recommended at the towns’ current stage of economic development, because of their high capital and O&M costs,18 need for skilled management, continual reliance on supplies of chemicals and electricity, low affordability and sustainability. The sole disadvantage of WSPs is that they require large areas of land. WSPs are recommended as the preferred treatment systems for all towns to 2020. Each WSP system will comprise screened inlet works, followed by two anaerobic ponds, a facultative pond and two or more maturation ponds, with an outfall to river or bay. The inlet works will be covered with removable covers to minimize potential for odor generation. Pond construction will comprise earthfill embankments with compacted clay lining and stone protection against erosion by waves or floodwaters. The base of the ponds will be located above the wet season water table and the pond embankment crest will be elevated above 1:20 year flood level (or above highest tide plus an allowance for waves in the case of Cam Rahn.)
Table 15. Comparison of Alternative Wastewater Treatment Systems
Item Activated Sludge
Plant with Chlorination
Aerated Lagoon System
Waste Stabilization
Ponds BOD Removal XXXX XXXX XXXX Fecal Coliform Removal XXXX XXXX XXXX Effluent Reuse XXX XXXX XXXX Simple and Cheap Construction X XXX XXX Simple Operation X XX XXXX Skilled Operators Required X XX XXXX Land Area Required XXX XX XX Maintenance Costs X XXX XXXX Energy Demand X XX XXXX Need for Chemicals XX XXXX XXXX Risk of Disruptions (power, chemicals) X XX XXXX Minimization of Sludge for Removal X XXXX XXXX Overall Sustainability X XX XXXX Affordability X XXX XXXX Asset Value after 20 Years Operation X XXX XXXX
Notes: 1. XXXX = excellent; XXX = good; XX = fair; X = poor. 2. A = anaerobic ponds; F = facultative ponds; M = maturation ponds. 3. The main asset value of waste stabilization pond systems is land which increases in value over time. Sludge that accumulates in the anaerobic ponds will be managed to ensure efficient operation and to minimize odor. Sludge accumulation is expected to be slow, but after 3-6 years operation, sludge will need to be removed from the anaerobic ponds. This will be achieved by taking one anaerobic pond offline at the end of the wet season, pumping the liquid contents to the active pond, and excavating the dried sludge from the offline pond at the end of the dry season using conventional excavating plant. (The process will be repeated for the other pond during the following dry season.) The sludge will be covered
17 The key parameters for discharge to river are BOD 50mg/L and 10,000FC/10mL in accordance with TCVN 5945: 1995. Industrial
Wastewater - Discharge Standards 18 Electricity and chemical costs for a 10,000m3/day activated sludge plant are estimated at $70,000 and $18,000 per annum,
respectively.

TA 4485 – VIET NAM Central Region Small and Medium Towns Development Project: Final Report Page 41
June 2006
and retained on site at the treatment facility for 6-12 months until all pathogens have been destroyed. After testing, final disposal may be on agricultural land, where the dried sludge can be applied as a fertilizer. Alternatively it may be transported to a composting facility for processing or to the town’s landfill for disposal.
8.4.4 Solid Waste Management The proposed solid waste management components in all towns will use simple, appropriate and low cost technology. The least cost method for waste collection is direct pickup by compactor trucks from storage bins. However, this is not possible in all areas of the towns because of local conditions, such as narrow lanes, road and pavement conditions. Collection of solid waste in narrow streets and alleys will be carried out using locally fabricated handcarts, which will deliver the waste to temporary waste storage stations. The choice of collection and transport equipment is based on life cycle costs and least cost analyses. The expanded solid waste collection systems are expected to improve health and environment in the towns and also reduce drain blockages arising from unauthorized dumping of garbage. Waste from the five towns will be transported and disposed in four sanitary landfills. Van Gia and Ninh Hoa will share a regional landfill. The landfills will be located on well-drained, flood free land, and a 25 m buffer zone will be provided around each landfill site. The site will be fenced to prevent unauthorized access and to trap windblown litter. Separate municipal and hazardous waste cells will be provided in Cam Ranh, Van Gia and Gia Nghia. The hazardous cells will be used for clinical and other low hazard waste, and will be fenced off from the remainder of the site to prevent unauthorized access. Gravity leachate collection systems will be incorporated in the waste cells, and leachate treatment will be carried out in simple biological ponds with provision for pumped recirculation. Septic tank sludge will be dewatered in separate ponds located at the landfills and the sludge will be disposed to the landfills. The waste cells, leachate and septage ponds will be lined with a compacted clay layer (>600mm thick) having permeability not greater than 10-7 cm/sec. The base of the waste cells and ponds will be at least 1m above the wet season water table. Subject to results of further investigations and favorable hydrogeology, a "disperse and attenuate" design will be adopted for the landfills. This will involve controlled release of leachate to the environment, either by discharging from ponds to streams in the wet season or by slow seepage through the base of the landfill cells. No leachate will be discharged to streams unless it meets National Standards (Criteria B). Boreholes will be installed for groundwater monitoring. Site drainage will be constructed to divert stormwater around the landfill cells and minimize leachate generation. Silt ponds will be constructed to settle out silt prior to discharge of stormwater to the environment. The landfills in Cam Ranh, Van Gia and Gia Nghia will be equipped with weighbridges to monitor and regulate waste disposal activities. Operational practices at all four landfills will include registration and controlled placement of incoming waste, spreading and compacting waste in layers, and covering waste with soil to control insects and vermin. A loader/dozer will be procured for the large landfill sites in Cam Ranh, Gia Nghia and for Van Gia/Ninh Hoa to assist in compacting and spreading the waste and soil cover. Manual labor will be used to cover the waste with soil in Song Cau.

TA 4485- VIE: Central Region Small and Medium Towns Development Project FINAL REPORT Appendix 19, page 1
June 2006
FINANCIAL ASSESSMENT OF PARTICIPATING PROVINCES
1. INTRODUCTION
This document reviews the financial position of the Provincial Governments (PGs) for each of the five project provinces over the period up to 2004 to assess the financial capacity of each PG in counterpart funding contribution to implement the ADB-funded Central Region Small and Medium Town Development Project. This Report will be used as a supplementary tool for Project Financial Analysis.
The Report is structured as follows: Section 2 provides a review of the State Budget preparation process to facilitate understanding of the State Budget system in Viet Nam; Section 3 presents a summary of the findings of the analysis. Sections 4 – 8 conducts a review of the financial position and assessment of project affordability for each of the five project PGs, including Section 4 – Ninh Thuan Province, Section 5 – Binh Thuan Province, Section 6 – Phu Yen Province, Section 7 – Khanh Hoa Province, and Section 8 – Dak Nong Province.
2. REVIEW OF STATE BUDGET PREPARATION PROCESS
The 2002 State Budget Law defines the role and responsibility of different agencies involved in budget preparation and implementation. At the central level, there is a close working relationship within the Ministry of Finance (MOF) and the Ministry of Planning and Investment (MPI) regarding budgetary expenditure levels.
The MOF has the primary role in the formulation of the State Budget, which includes the operating budget of the Government, its ministries, agencies and State-owned enterprises (SOEs), and expenditure allocated to lower levels of governments.
The MPI is responsible for: (i) submitting to the Government the draft plan on socioeconomic development of the whole country and the major balances of the national economy, particularly the situation regarding financial, monetary and investment aspects, to serve as a basis for elaboration of financial and budgetary plans; (ii) cooperating with the MOF in drafting State budget plans with State Budget (SB) allocations within its jurisdiction; and (iii) cooperating with the MOF and concerned line ministries and branches in examining and evaluating the efficiency of public investment through implementing investment projects.
The State Bank of Vietnam (SBV) cooperates with the MOF in establishing SB estimates for government borrowing to cover the SB deficit and to make advance payments to the SB in order to handle temporary deficits of SB funds as decided by the Prime Minister.
The line ministries are requested to cooperate with the MOF and the PGs in preparing the budget under their jurisdiction, and allocating it to different branches and areas under their jurisdiction, in monitoring and implementing the budgets of the branches under their charge, and; in reporting the results to the respective authorities as required. Also, they cooperate with the MOF in establishing regimes, criteria, and SB levels of spending of branches and areas under their jurisdiction.
Based on the Prime Minister’s decision on the socioeconomic plan for the ensuing year, and the forecast of revenues and expenditure, the MOF provides guidelines for

TA 4485- VIE: Central Region Small and Medium Towns Development Project FINAL REPORT Appendix 19, page 2
June 2006
preparing the budgets to each of the spending departments and provinces in the budget circular. It also provides indicative targets of recurrent expenditure for each of the central ministries and provinces. The provinces in turn prepare indicative targets for districts and the latter to the communes. At each level, spending agencies prepare their draft budgets and submits them to the Finance and Pricing agency at that level, which, after consolidation, submits them to the People’s Committee. The latter finalizes the draft budget and submits it to the People’s Council for approval and simultaneously communicates the draft budget to the Finance and Pricing Department at the higher level (“Department” at the provincial level and “Section” at lower levels).
The 1996 State Budget law also defines the responsibilities and sources of revenue of different levels of government. Most public services are assigned concurrently to different administrative levels, in accordance with the principle of geographical spread of benefits, size of the projects and volume of spending. The operation and maintenance of large projects is a central responsibility, with the relevant local governments undertaking projects benefiting their respective jurisdictions. Each jurisdiction is responsible for its administration and internal security and have designated functions pertaining to national defenses as well. Education and Health are concurrent subjects but there is a functional division of responsibility between different levels of government. School education is a local responsibility and the center has to look after training (higher education). Large hospitals are in the central domain, the provinces administer provincial hospitals, the districts administer health centers, and communes look after health stations.
At each local administrative level, the budget is composed of its own budget (revenue and expenditure) and a supplement from a higher level. In implementation, all budget allocations are spent according to legal regulations. Peoples’ Councils at the local level have to analyze the draft budget of local governments and ratify draft budget accounts. They are also required to make decisions on the policies and measures to implement the budget at their respective levels.
At the end of the fiscal year, the Government rewards central cities and provinces that achieve revenue collection in excess of the budget plan for some specific items (export taxes and import duties; excises on some locally made goods and services). Rewards are used for financing the construction of socioeconomic and infrastructure projects, and are accounted in the budget of the following year.
3. SUMMARY FINDINGS 3.1. Financial Positions (2000-2004)
Available financial data provided by the five project PGs in Dak Nong, Ninh Thuan, Binh Thuan, Phu Yen and Khanh Hoa were analyzed for the 2000-2004 period, except for Khanh Hoa where data was only available for the 2002-2004 period and Ninh Thuan for 2001-2004. Due to the inconsistency in the information systems of these Project provinces, data cannot be provided in identical formats. Given this, the data was formulated in the most readable formats, taking into account the final objectives of assessing whether the PGs are in the surplus or deficit position, as well as how affordable the PGs are if the ADB loan for Small and Medium Towns Development is approved.

TA 4485- VIE: Central Region Small and Medium Towns Development Project FINAL REPORT Appendix 19, page 3
June 2006
Key findings from such analysis include: • A review of the financial positions of the five project PGs show significant growth in
their total level of financial activity, sources of funding, and the allocation of these funds to specific expenditure items. These changes are observed to be attributed to i) economic growth; ii) decentralization in State Budget management; iii) tax reforms; and iv) regional equity.
• Table A19-1 provides a summary of receipts and expenditure from the per capita
perspective. It was observed that receipts per capita of the Project provinces are in the range of VND773,000 to VND2.5 million with Binh Thuan being the lowest and Ninh Thuan the highest. The expenditure per capita ranges between VND652,000 and VND2.7 million. As indicated in Table A19-1, the per capita expenditure is at equal level with per capita receipts, indicating that there is little or no savings on the budget receipts even after incorporating transfers from the Central Government Budget. Further, it was observed that about over half of per capita expenditure has been used for capital construction, which suggests that this expenditure item has been considered priority of these provinces.
Table A19-1. Summary of Receipts and Expenditure (2004)
Budget Receipts Budget Expenditures Construction Expenditure Provinces Population
(‘000 pers) Total (VND mil.)
Per capita (VND thous.)
Total (VND mil.)
Per capita (VND thous.)
Total (VND mil.)
Per capita (VND thous.)
Dak Nong 385.8 667,128 1,729 559,260 1,450 228,779 593 Ninh Thuan 554.7 1,393,922 2,513 1,480,252 2,669 620,261 1,118 Binh Thuan 1,135.9 877,936 773 740,833 652 332,845 293 Phu Yen 848.9 899,160 1,059 946,383 1,115 323,804 381 Khanh Hoa 1,111.3 2,612,701 2,351 2,005,150 1,804 732,957 660
• All five PGs are net recipients of the Central Government Budget, indicating that
total in-province income of these provinces is not sufficient to cover all expenditure items under the PGs' responsibilities. Table 15.2 outlines the average level of Central Government subsidies to the five provinces. From the average figures for the 2000-2004 period, it indicates that the subsidy level ranges between 13.4 percent to 62.1 percent of total Budget receipts, with Khanh Hoa being the least subsidized and Dak Nong being the most heavily subsidized as it is a newly established province inheriting all poor districts from Dak Lak province. Khanh Hoa, on the other hand , has a profitable and low leverage tourism industry. Binh Thuan, Phu Yen and Ninh Thuan have also been heavily subsidized, with transfers from the Central Budget being 44.5 percent, 43.4 percent, and 37.8 percent respectively. Also, it is important to note that since the five provinces are dominated by agricultural production, total in-province income of all six provinces is composed largely by agriculture-related income.
Table A19-2. Average Level of Subsidies from the Central Budget (2000-2004)
Provinces Transfers from the Central Budget as % of Total Budget Receipts
Dak Nong 62.1% Ninh Thuan 37.8% Binh Thuan 44.5% Phu Yen 43.4% Khanh Hoa 13.4%
• Total expenditure of the five Project provinces is dominated by the construction
expenditure. In all these provinces, this expenditure item has a tendency to

TA 4485- VIE: Central Region Small and Medium Towns Development Project FINAL REPORT Appendix 19, page 4
June 2006
increase significantly over the examined period, suggesting there is a great demand for capital/infrastructure construction (Table A19-3). For Dak Nong, Binh Thuan and Ninh Thuan, construction expenditure grew at the rate of 112 percent, 75 percent, and 51 percent per annum, respectively, during the 2000-2004 period. Except for Ninh Thuan where the same growth rate of receipts and expenditure was observed, total expenditure increased at a significantly higher rate than total receipts in the corresponding period. This deficit position indicated that there is a tendency to apply for further Central Government Budget subsidies.
Table A19-3. Growth in Receipts and Expenditure (2000-2004)
Provinces Receipts Budget Expenditure
Construction Expenditure
Dak Nong 73.0% 67.0% 112.4% Ninh Thuan 23.4% 24.0% 50.9% Binh Thuan 20.0% 29.3% 75.1% Phu Yen 11.5% 17.8% 28.2% Khanh Hoa 23.7% 30.8% 46.2%
• In summary, if these Project provinces aim to further improve their infrastructure,
deficits need to be financed through subsidies from the Central Government Budget, from ODA sources, and issuance of municipal bonds.
3.2. Future Financial Implications and Affordability
Based on the current regulations, the PGs are supposed to allocate counterpart funding from their own sources. Depending on the level and amount of the funding requirement, all the five PGs may face some difficulties in allocating counterpart funding as their total in-province receipts cannot cover all expenditure items. To finance the remaining deficit, the PGs have to apply for annual Central Government Budget allocations, which will presumably continue in the next 7-10 years.
Given that the deficit positions of these provinces will continue beyond 2005, it is recommended that all the five PGs:
• produce realistic annual projections with regard to the counterpart funding for the
ADB funded Central Region Small and Medium Town Development; • submit the projections to the respective Provincial People's Councils for advance
endorsement in order to facilitate the final approval by the National Assembly and ensure that the counterpart funding requirements are allocated in the annual provincial budget; and
• formulate a clear strategy to reduce Budget subsidies for utility services such as
waste water, solid waste, as well as water supply, and at the same time increase user payment revenue to ease the Budget financial burden.

TA 4485- VIE: Central Region Small and Medium Towns Development Project FINAL REPORT Appendix 19, page 5
June 2006
4. NINH THUAN PROVINCE
The Ninh Thuan Provincial Government budget receipt amounted to VND1,393 billion as of 31 December 2004 with 34.1 percent (or VND475 billion) was allocated by the Central Government as a percent of subsidy. The average subsidy proportion over the 2001-2004 period was 37.8 percent and it is observed that the subsidy has been reduced from 52.3 percent in 2001 to 34.1 percent at year end 2004 (Table A19-4). However, in absolute number the subsidy from the Central Government increased from VND393 billion in 2001 to VND475 billion in late 2004. The major reasons for applying for the subsidy are that: (i) in-province income has not been sufficient to cover expenses under the responsibilities of the PGs; (ii) there has been more demand for funds to finance capital construction than the receipts; and (iii) cost recovery by way of user-pays revenue from major capital construction works has almost been negligible.
Table A19-4. Ninh Thuan PG Budget: Level of Subsidies from the Central
Government Budget, VND million (2001-2004)
Year Budget Receipts
Transfer from the Central Budget
Transfers as % of Budget Receipt
2001 752,910 393,933 52.3% 2002 805,541 411,545 51.1% 2003 1,094,287 561,441 51.3% 2004 1,393,922 474,922 34.1%
Average 37.8%
Table A19-5 shows that the total in-province income (i.e. excluding Central Government subsidies) has grown significantly at an average rate of 39.2 percent per annum, from 9.8 percent in 2001 to 72.5 percent in 2004. This is due to the rapid development of services and non-agriculture sectors. Incorporating transfers from the Central Government, total receipts of Ninh Thuan grew at an aggregate rate of 23.4 percent per annum during the 2000-2004 period. Total expenditure grew at 24 percent per annum on average, while capital construction expenditure increased at a doubled rate of 50.9 percent per annum, indicating that this expenditure has been on the high priority list of Ninh Thuan PG.
Table A19-5. Ninh Thuan PG Budget: Growth of Main Indicators
Indicators 2000 2001 2002 2003 2004 Average
Total in-province income NA Base 9.8% 35.2% 72.5% 39.2% Total current year receipts NA Base 7.0% 35.8% 27.4% 23.4% Construction expenditures NA Base -38.3% 114.3% 76.7% 50.9% Total expenditures NA Base -0.8% 29.8% 43.2% 24.0% Transfers from Central Budget NA Base 4.5% 36.4% -15.4% 8.5%
Detailed data on the revenue and expenditure profile of Ninh Thuan PG are outlined in Table A19-6. From this financial profile and the above analysis, the following observations can be made:
• Ninh Thuan is a net recipient from the Central Government Budget during the
2000-2004 period, i.e. there are more transfers from the Central Government Budget. The net subsidy amounted to 37.8 percent of the total PG receipts;
• Without continued support from the Central Government Budget, Ninh Thuan PG will not be able to increase further funding for capital construction in the utility sector such as water supply, drainage and waste water, as well as solid waste,

TA 4485- VIE: Central Region Small and Medium Towns Development Project FINAL REPORT Appendix 19, page 6
June 2006
because alternative funding sources such as municipal bonds have yet received approval from the Central Government;
• If Ninh Thuan is to provide counterpart funding for this Project, it needs to make realistic funding projections for the next 7-10 years for the Provincial People's Council to endorse well before the yearly meeting of the National Assembly. This is to ensure funding for project implementation; and
• The current deficit position is unlikely to change given Ninh Thuan’s fiscal performance from 2000-2004. The Provincial Government of Ninh Thuan needs to have a specific strategy to increase user pays revenue from utility services such as water supply, drainage and waste water, as well as solid waste; and at the same time proportionally reduce the subsidy to cost recoverable utility services to ease the financial burden and develop a sustainable utility sector.
Table A19-6. Ninh Thuan - Income and Expenditures (VND million in current prices)
Provincial Government of Ninh Thuan: Income and Expenditures (VND million in current prices)
Indicators 2001 2002 2003 2004
I. Receipts 1. Receipts from central enterprises located in Ninh Thuan 21,218 28,751 51,146 48,000 2. Receipts from local economy 328,424 360,553 474,271 861,500 3. Receipts from foreign invested economic sector 9,335 4,692 7,429 9,500 4. In-province receipts (sum of 1 to 3) 358,977 393,996 532,846 919,000 5. Central government transfers 393,933 411,545 561,441 474,922
Total receipts (4+5) 752,910 805,541 1,094,287 1,393,922
II. Expenditures 1. Current expenditures 441,115 486,078 602,900 704,886
Economic works 52,223 61,958 66,695 111,733 Education and training 161,188 169,312 242,606 269,436 Health 57,292 63,752 73,775 86,521 Social safety net 32,871 37,916 44,128 87,580 Administration 64,333 71,840 79,732 108,871 Other expenditure 73,208 81,300 95,964 40,745
2. Development Investment Expenditures 301,588 198,206 374,579 635,261 Capital construction 265,347 163,815 351,088 620,261 Other development investment expenditure 36,241 34,391 23,491 15,000
3. Other expenditures 60,593 112,188 56,358 140,105
Total expenditure (1+2+3) 803,296 796,472 1,033,837 1,480,252
In-province budget surplus (deficit) -444,319 -402,476 -500,991 -561,252 Source: Nihn Thuan Statistical Year Book 2004 and Financial Analyst estimates.

TA 4485- VIE: Central Region Small and Medium Towns Development Project FINAL REPORT Appendix 19, page 7
June 2006
5. BINH THUAN PROVINCE
The Binh Thuan PG receipts and expenditure statements indicated an average annual growth rate on total in-province income of 51.5 percent over the 2000-2004 period, or from VND170 billion in 2000 to VND624 billion at year end 2004. Total receipts have grown, on average, 20 percent per annum, i.e., from VND435 billion in 2000 to VND878 billion in 2004. Total expenditure and construction expenditure increased at an annual rate of 29.3 percent and 75.1 percent, respectively during the same period. The high growth rate of income amounting to 51.5 percent on the in-province is remarkable for a Central Region province like Binh Thuan but is overshadowed by the higher growth rate of construction expenditure. Similar to Ninh Thuan, suggests that the demand for funding in capital construction is also very high in the province of Binh Thuan (see Table A19-7). This also implies that there is a huge funding demand for construction of physical works such as water supply, drainage and waste water, as well as solid waste.
Table A19-7. Binh Thuan PG Budget: Growth of Main Indicators
Indicator 2000 2001 2002 2003 2004 Average
Total in-province income Base 34.7% -16.1% 23.0% 164.4% 51.5% Total current year receipts Base 34.7% -1.4% 20.3% 26.4% 20.0% Construction expenditures Base 199.3% -17.3% 37.6% 80.7% 75.1% Total expenditures Base 65.5% 4.5% 29.2% 17.9% 29.3% Transfers from Central Budget Base 34.6% 8.0% 18.9% -44.6% 4.2%
Table A19-8 outlines the level of subsidies that Binh Thuan has applied from the Central Government Budget. In 2000, the subsidy was VND265 billion, accounting for 61 percent of total budget receipts; the corresponding proportions for 2001-204 were 61 percent, 66.8 percent, 66 percent, and 29 percent, respectively. During the 2000-2004 period, Binh Thuan obtained about 44.5 percent of its total budget receipts per annum by way of subsidies from the Central Government. These records indicate very high levels of subsidies. This can be attributed to, among others: (i) in-province income has not been sufficient to cover expenditure; and (ii) cost recovery from user-pays revenue for major public utility works has been insignificant or negligible.
Table A19-8. Binh Thuan PPC Budget: Level of Subsidies from the Central
Government Budget, VND million (2001-2004)
Year Budget Receipts Transfer from the Central Budget
Transfers as % of Budget Receipts
2000 434,979 265,282 61.0% 2001 585,741 357,081 61.0% 2002 577,616 385,785 66.8% 2003 694,725 458,804 66.0% 2004 877,936 254,190 29.0%
Average 44.5%
Table A19-9 presents the revenue and expenditure profile in detail. From this financial profile and the above analysis, it is observed that:
• Binh Thuan is a net recipient from the Central Government Budget during the 2000-2004 period, i.e., there are more transfers from the Central Government Budget than vice versa. The net subsidy amounted to 44.5 percent of the total PG receipts;
• Without continued support from the Central Government budget, the Binh Thuan PG will find it difficult to increase investments in capital construction for the utility sector such as water supply, drainage and waste water, as well as solid waste,

TA 4485- VIE: Central Region Small and Medium Towns Development Project FINAL REPORT Appendix 19, page 8
June 2006
while alternative funding sources such as municipal bonds have not been made possible by existing regulations. In particular, local finance mobilization from municipal bonds and other market instruments are those of long-term implementation rather than short-term;
• To ensure that Binh Thuan province is capable of providing counterpart funding to this Project, it needs to make realistic funding projections for the next 7-10 years for the Provincial People's Council to endorse well before the annual National Assembly meeting; and,
• The analysis revealed that the current deficit position will continue. Therefore, it is essential for the Binh Thuan PG to formulate clear strategies to ease the budget burden by increasing the use-pays revenue from utility services such as water supply, drainage and waste water, as well as solid waste; and at the same time proportionally reduce the subsidy to cost recoverable utility services and develop a sustainable utility sector.
Table A19-9. Binh Thuan – Income and Expenditures (VND million in current prices)
Provincial Government of Binh Thuan: Income and Expenditures (VND million in current prices)
Indicators 2000 2001 2002 2003 2004
I. Receipts 1. Receipts from central enterprises located in
Bihn Thuan 6,112 8,716 12,457 31,814 34,716
2. Receipts from local economy 93,527 99,481 107,343 144,646 488,032 3. Receipts from foreign invested economic
sector 507 872 1,012 1,171 1,507
4. Surplus (deficit) from previous year 69,551 119,591 71,019 58,290 99,491 4. In-province receipts (sum of 1 to 4) 169,697 228,660 191,831 235,921 623,746 5. Central government transfers 265,282 357,081 385,785 458,804 254,190
Total receipts (5+6) 434,979 585,741 577,616 694,725 877,936
II. Expenditures 1. Current expenditures 202,582 269,722 285,710 321,486 352,393
Economic works 28,849 60,449 59,246 60,340 52,675 Education and training 71,285 87,260 91,345 119,053 127,197 Health 20,709 24,040 32,014 31,435 36,126 Science and technology 3,467 3,496 4,039 5,301 7,059 Culture, information, and sports 4,806 12,160 11,915 13,503 16,990 Social safety net 8,655 7,899 12,027 17,245 15,962 Administration 43,735 55,355 58,187 59,941 74,693 Security and national defenses 6,694 8,846 9,043 11,390 11,678 Other expenditure 14,382 10,217 7,894 3,278 10,013
2. Development Investment Expenditures 78,727 195,917 200,744 306,823 388,440 Capital construction 54,040 161,731 133,803 184,161 332,845 Other expenditure 24,687 34,186 66,941 122,662 55,595
Total expenditure (1+2) 281,309 465,639 486,454 628,309 740,833
In-province budget surplus (deficit) -111,612 -236,979 -294,623 -392,388 -117,087
Source: Binh Thuan Statistical Year Book 2004 and Financial Analyst estimates.

TA 4485- VIE: Central Region Small and Medium Towns Development Project FINAL REPORT Appendix 19, page 9
June 2006
6. PHU YEN PROVINCE
The income and expenditures statement of Phu Yen PG (Table A19-10) indicates that by year end 2004, total budget receipts amounted to VND899 billion, of which in-province income amounted to VND540 billion and a Central Government Budget subsidy of VND359 billion. Total expenditure on the same year is VND946 billion. Out of the total expenditures, current expenditures accounted for VND572.5 billion and development investment expenditure VND373.8 billion. Majority of the expenditures was attributed to financing capital construction (VND323.8 billion). A budget deficit of VND406 billion was observed before accounting for the subsidy from the Central Government.
Table A19-10. Phu Yen – Income and Expenditures (VND million in current prices)
Provincial Government of Phu Yen: Income and Expenditures (VND million in current prices)
Indicators 2000 2001 2002 2003 2004 I. Receipts 1. Receipts from central enterprises located in
Phu Yen 16,022 20,750 20,027 42,879 33,408
2. Receipts from local economy 248,496 265,016 320,721 353,014 497,755 3. Receipts from foreign invested economic
Sector 5,336 3,502 4,842 8,196 9,156
4. In-province receipts (sum of 1 to 3) 269,854 289,268 345,590 404,089 540,319 5. Central government transfers 324,647 464,909 483,173 536,956 358,841
Total receipts (4+5) 594,501 754,177 828,763 941,045 899,160
II. Expenditures 1. Current expenditures 300,844 422,654 457,442 594,227 572,579
Economic works 48,061 51,833 67,346 74,951 66,210 Education and training 106,541 139,137 155,603 207,525 210,491 Health 28,569 44,381 46,187 40,476 33,552 Social safety net 8,225 23,692 18,150 16,872 19,086 Administration 67,522 75,266 94,343 120,092 137,877 Other expenditure 41,926 88,345 75,813 134,311 105,363
2. Development Investment Expenditures 197,872 255,265 291,414 236,464 373,804 Capital construction 145,619 154,245 255,122 197,260 323,804 Other development investment expenditure 52,253 101,020 36,292 39,204 50,000
Total expenditure (1+2) 498,716 677,919 748,856 830,691 946,383
In-province budget surplus (deficit) -228,862 -388,651 -403,266 -426,602 -406,064
Source: Phu Yen Statistical Year Book 2004 and Financial Analyst estimates.
In terms of development trends, total in-province income grew at an average of 19.3 percent per annum, and total receipts (i.e. including transfers from the Central Government Budget) increased at an annual rate of 11.5 percent. Total expenditure grew at 17.8 percent per annum, 6 percent higher than that of total receipts, suggesting a deficit position if the trend continues. Construction expenditure grew at a rate of 28.2 percent per annum, which indicates that constructing infrastructure has been on the high priority list of the PG. This also shows that there will be a huge demand for funding in this regard. Transfers from the Central Government Budget (subsidy) grew to 43.2 percent in 2001, but decreased to 33.2 percent between 2003 and 2004. The average annual growth rate of the transfers during the 2000-2004 period is 6.3 percent per annum (Table A19-11).

TA 4485- VIE: Central Region Small and Medium Towns Development Project FINAL REPORT Appendix 19, page 10
June 2006
Table A19-11. Phu Yen PG Budget: Growth of Main Indicators
Indicator 2000 2001 2002 2003 2004 Average
Total in-province income Base 7.2% 19.5% 16.9% 33.7% 19.3% Total current year receipts Base 26.9% 9.9% 13.5% -4.5% 11.5% Construction expenditures Base 5.9% 65.4% -22.7% 64.2% 28.2% Total expenditures Base 35.9% 10.5% 10.9% 13.9% 17.8% Transfers from Central Budget Base 43.2% 3.9% 11.1% -33.2% 6.3%
Although the average annual growth rate of subsidies was low and declining, the absolute figures indicated that the average subsidy from the Central Government Budget accounted for 43.4 percent of total receipts for the 2000-2004 period (Table A19-12), suggesting that Phu Yen is still considered among one of the heavily subsidized provinces by the Central Government Budget.
Table A19-12. Phu Yen PPC Budget: Level of Subsidies from the Central Government
Budget, VND million (2000-2004)
Year Budget Receipts Transfer from the Central Budget
Transfers as % of Budget Receipts
2000 594,501 324,647 54.6% 2001 754,177 464,909 61.6% 2002 828,763 483,173 58.3% 2003 941,045 536,956 57.1% 2004 899,160 358,841 39.9%
Average 43.4%
Based on the above analysis, the following observations could be made:
• Phu Yen is a net recipient province as far as the PG Budget is concerned. Although the level of subsidies declined in relation to total receipts, the proportion is high by national standards.
• There has been and will be a huge demand for capital construction in the next few
years. If there are no alternative funding sources to finance these developments, transfers from the Central Government Budget is required.
• Given the above scenario, it is recommended that Phu Yen PG prepare a budget
projection related to the ADB-funded Central Region Small and Medium Town Development and submit to the Provincial People's Council for endorsement as soon as possible. This will facilitate the final approval by the National Assembly and ensure funding for the implementation of this Project.

TA 4485- VIE: Central Region Small and Medium Towns Development Project FINAL REPORT Appendix 19, page 11
June 2006
7. KHANH HOA PROVINCE
Total Budget receipts of Khanh Hoa province (including subsidies) amounted to VND2.612 billion by year end 2004, growing at an annual rate of 23.7 percent during the 2002-2004 period, i.e. increasing from VND1.710 billion in 2002. Total in-province income has increased from VND1.234 billion in 2002 to VND2.302 billion at year end 2004, growing at an average rate of 36.7 percent per annum. Total expenditure has increased approximately 31 percent while the subsidy growth rate was declining about 11 percent per annum during this same period (Table A19-13).
Table A19-13. Khanh Hoa PPC Budget: Growth of Main Indicators
Indicator 2000 2001 2002 2003 2004 Average
Total in-province income NA NA Base 30.9% 42.5% 36.7% Total current year receipts NA NA Base 29.8% 17.7% 23.7% Construction expenditures NA NA Base 23.7% 68.7% 46.2% Total expenditures NA NA Base 8.5% 53.1% 30.8% Transfers from Central Budget NA NA Base 27.0% -48.7% -10.9%
Table A19-14 presents the level of subsidies from the Central Budget during the 2002-2004 period. It is observed that on average Khanh Hoa PG obtained about 13.4 percent of total Budget receipts by way of Central Government subsidies, i.e., VND476 billion in 2002, VND604 billion in 2003, and VND310 billion in 2004. However, the level declined during that same period, suggesting that Khanh Hoa will be able to sustain on its own in-province income in the course of the next few years.
Table A19-14. Khanh Hoa PPC Budget: Level of Subsidies from the Central
Government Budget, VND million (2002-2004)
Year Budget Receipts Transfer from the Central Budget
Transfers as % of Budget Receipts
2002 1,710,322 476,361 27.9% 2003 2,220,516 604,975 27.2% 2004 2,612,701 310,350 11.9%
Average 13.4%
Table A19-15 presents detailed data for Khanh Hoa PG Budget receipts and expenditure. Based on these and the earlier analyses, the following observations can be made:
• Like all other provinces in the project areas, Khanh Hoa is currently a net recipient from the Central Budget. It has a higher chance of getting out of the net recipient status than all other Project provinces due to a highly profitable and low leverage tourism industry;
• In the course of the next few years (during project implementation), Khanh Hoa PG still needs to submit a Budget projection to the Provincial People's Council to ensure funding is available for the purpose of counterpart funding contribution;
• Like all other Project provinces, Khanh Hoa also needs to formulate a strategy to reduce subsidies on utility services such as water supply, solid waste and waste water. This should be done through increasing user pays revenue.

TA 4485- VIE: Central Region Small and Medium Towns Development Project FINAL REPORT Appendix 19, page 12
June 2006
Table A19-15. Khanh Hoa – Income and Expenditures (VND million in current prices) Provincial Government of Khanh Hoa: Income and Expenditures (VND million in current prices)
Indicators 2002 2003 2004 I. Receipts 1. Receipts from SOEs 690,694 1,008,557 1,268,103
Central SOEs located in Khanh Hoa 60,068 78,626 101,624 Local SOEs 601,541 892,767 1,124,921 Lottory 29,085 37,164 41,558
2. Receipts from foreign invested economic sector 44,502 78,455 141,704 3. Receipts from private sector taxation 118,942 158,086 201,848 4. Fees and charges 75,932 76,170 81,031 5. Receipts from import export taxes, VAT, and special
consumption taxes 550,660 686,019 784,715
6. Other local receipts 303,891 294,273 609,665 7. In-province receipts (sum of 1 to 6) 1,233,961 1,615,541 2,302,351 8. Central government transfers 476,361 604,975 310,350
Total receipts (7+8) 1,710,322 2,220,516 2,612,701
II. Expenditures 1. Current expenditures 705,737 730,828 1,001,100
Economic works 64,089 67,721 101,260 Socio-culture, health, education and training 284,117 363,160 398,990 Subsidies (social safety net) 2,488 5,356 7,950 Administration 129,182 147,683 145,800 Loan repayment (principle and interest) 102,500 73,500 213,500 Support to enterprise development 52,643 16,000 50,500 Other expenditure 70,718 57,408 83,100
2. Development Investment Expenditures 501,583 579,295 1,004,050 Capital construction 351,108 434,471 732,957 Other development investment expenditure 150,475 144,824 271,094
Total expenditure (1+2) 1,207,320 1,310,123 2,005,150
In-province budget surplus (deficit) 26,641 305,418 297,201
Source: Khanh Hoa PPC Data and Financial Analyst’s estimates.

TA 4485- VIE: Central Region Small and Medium Towns Development Project FINAL REPORT Appendix 19, page 13
June 2006
8. DAK NONG PROVINCE
Dak Nong province was established in 2004 by way of separation from Dak Lak province. It inherited all the poor districts from Dak Lak. It is observed that in the long-run revenue collection conditions are not favorable, if not to say difficult. Table A19-16 indicates that Dak Nong has a growth rate of in-province income of 62.7 percent per annum during the 2000-2004 in (VND81 billion in 2000 and VND667 billion in 2004). On the expenditure side, total expenditure has increased on average 67 percent per annum (from VND79.8 billion in 2000 to VND599 billion in 2004), and construction expenditure has been up about 122 percent per annum (from VND19.5 billion in 2000 to VND228.8 billion in 2004) during the 2000-2004 period. Transfers from the Central Government budget have grown at 86.1 percent per annum during this same period to cover a major part of the growing expenditure, particularly construction expenditure.
Table A19-16. Dak Nong PPC Budget: Growth of Main Indicators
Indicator 2000 2001 2002 2003 2004 Average
Total in-province income Base 76.7% 7.8% 50.3% 116.0% 62.7% Total current year receipts Base 54.8% 64.9% 35.4% 137.0% 73.0% Construction expenditures Base 94.2% -18.8% 97.4% 276.7% 112.4% Total expenditures Base 49.1% 41.9% 39.1% 137.8% 67.0% Transfers from Central Budget Base 52.2% 111.8% 38.5% 142.0% 86.1%
The level of subsidies that Dak Nong province obtained from the Central Government Budget is outlined in Table A19-17. It indicates that the percentage of transfers from the Central Budget over total Budget receipts increased from 53 percent in 2000 (or from VND43 billion to VND 81 billion) to around 70 percent in 2004 (or from VND466 billion to VND667 billion). The high growth rate of expenditure (especially construction expenditure) and subsidies can be easily justified by the fact that (i) Dak Nong was a recently established province; and (ii) revenue collection is not sufficient to cover expenditure while there is a huge demand for constructing and/or improving the infrastructure system, particularly in urban areas.
Table A19-17. Dak Nong PPC Budget: Level of Subsidies from the Central
Government Budget, VND million (2000-2004)
Year Budget Receipts Transfer from the Central Budget
Transfers as % of Budget Receipts
2000 81,438 43,198 53.0% 2001 126,040 65,747 52.2% 2002 207,870 139,237 67.0% 2003 281,456 192,805 68.5% 2004 667,128 466,529 69.9%
Average 62.1%
From the above analysis and detailed data provided in Table A19-18, the following observations can be made:
• Dak Nong is in a deficit situation as far as the State Budget revenue is concerned.
This is largely due to the fact that it was recently established, inheriting all poor districts from Dak Lak province;
• There is a huge demand as well as an urgent need for the province to construct
and improve the infrastructure, particularly those in the urban areas;

TA 4485- VIE: Central Region Small and Medium Towns Development Project FINAL REPORT Appendix 19, page 14
June 2006
• The Budget deficit position will not alter soon therefore the subsidies from the
Central Government Budget will be essential in the next 7-10 years;
• If the province wants to ensure funding availability to contribute counterpart funding for project implementation, it needs to plan and submit a projection for the next 7-10 years to the Provincial People's Council to facilitate submission to the National Assembly prior to annual its meeting for this purpose; and
• In the long-term, it is essential that provincial level subsidies to utility services
should be reduced and cost recovery from the users should be gradually increased to ease the financial burden of the PG. Also, it is recommended that the province prioritize carefully to maximize the investment.
Table A19-18. Dak Nong - Income and Expenditures (VND million in current prices)
Provincial Government of Dak Nong: Income and Expenditures (VND million in current prices)
Indicators 2000 2001 2002 2003 2004 I. Receipts 1. Receipts from non state-owned enterprises
(SOEs) 4,629 9,036 11,438 21,728 48,864
2. Receipts from agricultural land use tax 5,462 3,746 3,016 653 866 3. Receipts from land and house tax 769 770 747 510 906 4. Receipts from land lease 139 232 113 217 221 5. Fees, charges and duties 1,022 4,841 995 1,380 2,694 6. Receipts from land use tax 1,720 1,827 11,329 2,419 8,100 7. Receipts from land transfer tax 258 257 230 965 635 8. Other receipts 13,335 27,581 24,188 50,359 106,654 9. Total in-province income 27,334 48,290 52,056 78,231 168,940 II. Central government transfers 43,198 65,747 139,237 192,805 466,529 III. Surplus (deficit) from previous year 4,012 5,876 10,735 6,127 26,570 IV. Other receipts 6,894 6,127 5,842 4,293 5,089
Total receipts 81,438 126,040 207,870 281,456 667,128
V. Expenditures 1. Economic works 3,202 4,922 5,183 6,474 29,562 2. Socio-cultural, health, and education 23,652 32,433 72,148 94,284 138,021 3. Administration 21,270 29,664 39,179 43,649 127,374 4. Budget allocation to communes and wards 12,258 14,222 21,723 30,001 35,524 5. Capital construction expenditures 19,515 37,891 30,774 30,001 35,524 6. Total expenditure 79,897 119,132 169,007 235,145 559,260
In-province budget surplus (deficit) -52,563 -70,842 -116,951 -156,914 -390,320 Source: Dak Nong Statistical Year Book 2004 and Financial Analyst’s estimates.

TA 4485-VIE: Central Region Small and Medium Towns Development Project FINAL REPORT Appendix 18, page 1
June 2006
PROJECT FINANCIAL ANALYSIS
1. FINANCIAL ANALYSIS METHODOLOGY The financial analysis per province was undertaken for all infrastructure
subcomponents proposed. The objective of the financial analysis was to ensure that individual components, and the Project as a whole, were financially viable generating sufficient revenues to cover capital and operating costs and a rate of return that meets or exceeds the weighted average cost of capital (WACC) used to finance the subprojects. Revenues were those derived from water, drainage and wastewater, and solid waste tariffs that are directly attributable to the subprojects. The calculated rate of return is expressed as the financial internal rate of return (FIRR). The FIRRs are rates of return which equalize the present values of incremental component costs to the present values of incremental revenue. The subproject components are, thus, considered financially viable if the FIRRs are equal to, or greater than, the WACC. In order to identify factors posing the greatest risk to the financial viability of the components, analyses of the sensitivity of FIRRs to adverse changes for selected key variables are undertaken.
The financial analysis focused on the estimation of the average tariff required to
achieve full cost recovery of proposed subcomponents. The average tariff was calculated for all subcomponents by calculating the average incremental financial cost (AIFC). The AIFCs are the present values of capital and operating costs, at financial prices, divided by the present value of the volume of water sold in the case of water supply and drainage and wastewater subcomponents and by the present value of the volume of solid waste collected in the case of solid waste component, for each year over the life of the respective components. The present values are calculated by discounting all cash flows, using the WACC. The AIFCs are the minimum tariff required for the recovery of capital and operating costs. Full cost recovery is achieved when tariff revenues are sufficient to recover the full capital and operating costs of the respective subcomponents over their entire operating life.
Major Assumptions. The methodology employed in the financial analysis was
consistent with the Guidelines for the Financial Governance and Management of Investment Project Financed by the Asian Development Bank. The main assumptions employed in the financial analysis are as follows:
(i) Scope - The financial analysis considers only the incremental revenues and
costs directly associated with the components.
(ii) Forecast Period - The FIRRs and AIFCs were calculated over a 14-year period, from 2007 to 2020, which incorporates the preparation, construction, and operating periods of the respective components.
(iii) Price basis - All revenues and costs were expressed in Vietnamese Dong on an incremental basis in constant 2006 prices, i.e. they do not incorporate projected inflation over the forecast period. The VND/USD exchange rate applied in the financial analysis is VND 15,800/ USD 1.0.
(iv) Discount rate - The discount rate (or WACC) was based on the cost of on-lending from the MOF to the PPCs, which is at 2.0 percent per annum for subsidiary loans denominated in the US dollar.

TA 4485-VIE: Central Region Small and Medium Towns Development Project FINAL REPORT Appendix 18, page 2
June 2006
(v) Incremental costs - The FIRRs and AIFCs were calculated using the incremental capital costs and operating costs of the respective components.
(vi) Incremental revenues - This was calculated as the projected incremental volume of water sold multiplied by the average water tariffs by user group for the water supply subcomponents, drainage and wastewater tariffs or surcharges by user group for the drainage and wastewater subcomponents, and the incremental volume of solid waste collected multiplied by the average solid waste tariffs by user group for the solid waste subcomponents.
2. PROJECT AVERAGE INCREMENTAL FINANCIAL COSTS (AIFCS)
2.1. Water Supply Service AIFCs
Eight water supply development and expansion (WSD) components were proposed for Gia Nghia, Ea T'Ling, Dak Mam and Quang Khe (Dak Nong province), Tan Son and Ca Na (Ninh Thuan province), Ninh Hoa and Van Gia (Khanh Hoa province). Table A18-1 summarizes the AIFCs for WSD in these Project towns. As shown in Table A18-1, the AIFCs for each of the WSD component of the elected towns range between VND3,500-6,213/m3 of water sold, with Gia Nghia being the lowest and Ca Na the highest. In particular, the AIFCs are VND3,500/m3 of water sold for Gia Nghia, VND5,209/m3 for Ea T'Ling, VND4,781/m3 for Dak Mam, VND3,546/m3 for Quang Khe, VND3,665/m3 for Tan Son, VND6,213/m3 for Ca Na, VND6,115/m3 for Ninh Hoa, and VND6,003/m3 for Van Gia. In terms of cost breakdown, capital costs for all towns account, on average, for 73 percent of the AIFCs. Except for Van Gia, the capital costs account for just 40 percent of the corresponding AIFC and the O&M costs due to the operation and maintenance of the existing systems flexibility. In general, project investment AIFCs are observed to be lower than the allowable tariff of VND8,000/m3, which was consistent with the existing tariff regulation by the Ministry of Finance (Decision 38/2005/QD-BTC dated 30 June 2005). Thus, there is account for 71percent for water tariffs to be adjusted upwards by the Project towns for sustainability purpose, if needed. Recommended tariffs and cost recovery proposals are presented in Section 5.
2.2. Drainage and Wastewater Service AIFCs
Nine drainage and wastewater management (DWW) components were proposed for Gia Nghia, Ea T'Ling, Dak Mam, and Quang Khe (Dak Nong province), Phan Thiet (Binh Thuan province), Thap Cham (Ninh Thuan province), Cam Ranh (Khanh Hoa province), Tuy Hoa and Song Cau (Phu Yen province). Table A18-2 summarizes the AIFCs for DWW components in the key Project towns. The AIFCs for the DWW components of each of the towns range between VND565-8,471/m3 of water sales equivalent, with Ea T'Ling being the lowest and Thap Cham the highest. In particular, the AIFCs are VND2,714/m3 for Gia Nghia, VND565/m3 for Ea T'Ling, VND1,156/m3 for Dak Mam, VND700/m3 for Quang Khe, VND4,543/m3 for Phan Thiet, VND8,471/m3 for Thap Cham, VND6,474/m3 for Cam Ranh, VND6,025/m3 for Tuy Hoa, and VND5,971/m3 for Song Cau. The AIFC breakdown indicated that capital costs for all towns account between 82 percent to 92 percent of total AIFCs. Note, however, that only small-scale drainage systems were proposed for Ea T’Ling and Quang Khe, which translates to a low AIFC thereby making it affordable to user groups, particularly the domestic users.

TA 4485-VIE: Central Region Small and Medium Towns Development Project FINAL REPORT Appendix 18, page 3
June 2006
Table A18-1. Summary AIFC for WSD Component by Project Town
Dak Nong Ninh Thuan Khanh Hoa
Gia Nghia Ea T'Ling Dak Mam Quang Khe Tan Son Ca Na Ninh Hoa Van Gia Cost breakdown VND/m3 % VND/m3 % VND/m3 % VND/m3 % VND/m3 % VND/m3 % VND/m3 % VND/m3 % Capital costs 2,579 74% 3,978 76% 3,550 74% 2,566 72% 2,512 69% 5,544 89% 5,339 87% 2,383 40% O&M costs 921 26% 1,231 24% 1,231 26% 980 28% 1,153 31% 669 11% 776 13% 3,619 60% Total costs 3,500 100% 5,209 100% 4,781 100% 3,546 100% 3,665 100% 6,213 100% 6,115 100% 6,003 100%
Source: Financial Analyst’s estimates.
Table A18-2. Summary AIFC for DWW Component by Project Town
Dak Nong Binh Thuan Ninh Thuan Khanh Hoa Phu Yen
Gia Nghia Ea T'Ling Dak Mam Quang Khe Phan Thiet Thap Cham Cam Ranh Tuy Hoa Song Cau Cost breakdown VND/m3 % VND/m3 % VND/m3 % VND/m3 % VND/m3 % VND/m3 % VND/m3 % VND/m3 % VND/m3 %
Capital costs 2,462 91% 465 82% 1,024 89% 594 85% 4,254 94% 7,896 93% 5,968 92% 5,471 91% 5,665 95% O&M costs 252 9% 100 18% 132 11% 106 15% 289 6% 575 7% 506 8% 554 9% 306 5% Total costs 2,714 100% 565 100% 1,156 100% 700 100% 4,543 100% 8,471 100% 6,474 100% 6,025 100% 5,971 100%
N.B: VND/m3 is based on m3 of water sales equivalent. Source: Financial Analyst's estimates.

TA 4485-VIE: Central Region Small and Medium Towns Development Project FINAL REPORT Appendix 18, page 4
June 2006
Given the AIFC profile and current situation in Viet Nam in terms of DWW tariff revenue collection, it is observed that it is difficult to recover full costs for the DWW components. Only Ea T'Ling and Quang Khe, where only small-scale drainage works were proposed, were an exception. It is more viable to recover O&M costs and a small proportion of capital costs from users to ensure frequent system maintenance and drain clean-up as well as to finance costs associated to small capital replacements during the useful life of the assets. Most of the capital costs were needed to be recovered by the PPC through grants/subsidy from the annual budget. In this regard, by way of transparent subsidy, local authorities (PPCs or TPCs/DPCs) needed to finance the capital costs identified by the AIFCs capital cost component outlined in Table A18-2. Recommended tariffs and cost recovery proposals are presented in Section 5.
2.3. Solid Waste Service AIFCs
Five solid waste management (SWM) components were proposed for Gia Nghia (Dak Nong province), Cam Ranh, Ninh Hoa (Khanh Hoa province), and Song Cau (Phu Yen province). Table A18-3 summarizes the AIFCs for SWM components in the selected Project towns.
Table A18-3. Summary AIFC for SWM Component by Project Town Dak Nong Khanh Hoa Phu Yen
Gia Nghia Cam Ranh Ninh Hoa Van Gia Song Cau Cost breakdown VND/tonne % VND/tonne % VND/tonne % VND/tonne % VND/tonne %
Capital costs 96,488 54% 49,246 41% 9,176 5% 62,522 59% 59,851 35% O&M costs 82,643 46% 71,387 59% 171,850 95% 43,041 41% 111,236 65% Total costs 179,130 100% 120,633 100% 181,026 100% 105,563 100% 171,087 100%
Source: Financial Analyst's estimates.
The AIFCs for the SWM components of the towns presented above range between VND105,000 -180,000/tonne of solid waste collected and disposed, with Van Gia being the lowest and Ninh Hoa the highest. In particular, the AIFCs are VND179,130/tonne for Gia Nghia, VND120,633/tonne for Cam Ranh, VND181,026/tonne for Ninh Hoa, VND105,563/tonne for Van Gia, and VND171,087/tonne for Song Cau. The AIFC levels are all observed to be higher than the current levels of VND80,000 - 120,000/tonne in the respective project towns. However, the current levels are not sufficient to adequately collect and dispose solid waste as far as environmental protection is concerned. The project investment AIFC levels are appropriate to ensure adequate collection and disposal of solid waste. Recommended tariffs and cost recovery proposals are presented in Section 5.
3. AFFORDABILITY ANALYSIS
The study indicated that the willingness to pay, in all towns are generally low, reflecting the potential beneficiaries reservations on the capacity of the Project Operating Entities (POEs), i.e., water supply and drainage companies and urban public works companies, to deliver quality and cost-effective services, and a lack of understanding of the impact of the Project on their lives. As such, applying the affordability levels of 6.5percent of average monthly household income for domestic users, and 10percent of monthly average enterprise revenue for commercial and industrial users is more feasible. It was noted that this 10percent level is typical for those enterprises using the services. The consultation with commercial and industrial users indicated a willingness to pay for delivery of quality services.

TA 4485-VIE: Central Region Small and Medium Towns Development Project FINAL REPORT Appendix 18, page 5
June 2006
Table A18-4 outlines the affordability analysis for water, DWW, and SW services by user groups. For domestic users, households in all towns (including those with income at the poverty line of VND1,024,000 per month) were observed to be willing to pay for the services as the tariffs are within the targeted percentage of the average monthly household income of 6.5 percent. However, households living below the poverty line (VND800,000/household/month) find the tariffs 2 percent higher than the maximum affordability benchmarks. This suggests that the PPCs/TPCs may have to support these household groups through price subsidy mechanisms. One of the measures is for PPCs/TPCs to pay for the non-revenue and public-use through-puts at higher tariffs to enable the POEs to recover the tariff revenue as scheduled. The affordability analysis also indicated that commercial/institutional users can afford the recommended drainage/wastewater tariffs, as the proposed measures were all below the maximum affordability benchmarks of 10percent of average monthly enterprise revenue. In the short run, it is more feasible to delay increasing tariffs for these user groups until commercial and industrial activities are more developed in all Project towns.
4. PPC/TPC COMMUNITY SERVICES OBLIGATION PAYMENTS (Transparent Subsidies)
The water supply, drainage/wastewater and solid waste services include non-revenue and public use through inputs. It was recommended for the non-revenue water, drainage/wastewater and solid waste generated by the public to be paid for by the PPCs/TPCs to cover the cost of processing these throughputs. Payments should be in the form of community service obligation determined by the specific tariff study during and after the implementation phase. It was further recommended that the PPCs/TPCs in all towns should enter into service agreements with POEs for the direct annual transfers of such payments to these accounts to ensure their financial sustainability. For DWW components, PPCs/TPCs are recommended to pay for the capital costs identified in Table A18-2 by way of transparent subsidy.
5. RECOMMENDED TARIFFS
Separate tariffs have been calculated for three main users groups (domestic, commercial, and industrial) as each have different service demands, usage patterns and ability to pay for such services. Domestic users refer to households; commercial users refer to business premises (both registered and unregistered) and established institutions including schools, hospitals, and Government administrative offices, and; industrial users are defined as those involved in medium- and large-scale production of commercial commodities. It was noted that these were not sole service user group. In this regard, tariffs for specific users that cannot be categorized into groups should be defined on a case-by-case basis and may vary from one town to the other. Recommended phased tariff schedules for water, DWW, and SW services for all Project towns are outlined in Table A18-5. It was noted that these tariff schedules were based on the affordability analysis derived from the results of the socio-economic surveys in each of the Project towns. For the DWW component, a full 10percent surcharge on water tariffs was recommended to be put in place within 12 months after loan effectiveness.

TA 4485-VIE: Central Region Small and Medium Towns Development Project FINAL REPORT Appendix 18, page 6
June 2006
It is, however, noted that the tariff schedule should be re-examined during the implementation period to reflect changes between the dates of this Report and actual construction of the civil works.
6. FIRR AND SENSITIVITY ANALYSIS
Financial evaluations were based on indications of affordability and willingness to pay for improved services as determined during the socio-economic survey of households and discussions with local stakeholders. The financial internal rate of return (FIRR) of the WSD and SWM components were estimated on the basis of tariffs outlined in Table A18-5. There was no need to estimate the FIRRs for the DWW component given that no positive return can be achieved due to the low cost recovery capacity. Tables A18-6 and A18-7 presents the FIRRs and sensitivity analysis for the WSD and SWM components. As shown in the tables, the base-case and case-sensitive FIRRs are mostly above the WACC of 2.0 percent. The sensitivity analysis was conducted to test the robustness of the model. The FIRRs were identified to be most sensitive to the revenue reduction of 10 percent and revenue delay (1 year). As such, it was recommended that the PPCs/TPCs and POEs strictly follow the recommended tariffs and implementation schedules. It further implied that the factors delaying project implementation should be well under control and minimized to ensure project financial viability.

TA 4485-VIE: Central Region Small and Medium Towns Development Project FINAL REPORT Appendix 18, page 7
June 2006
Table A18-4. Affordability Profile by Project Town
User Group Gia Nghia Ea T’Ling Dak Mam Quang Khe Phan Thiet Thap Cham Tan son Ca Na Cam Ranh Ninh Hoa Van Gia Tuy Hoa Song Cau
Domestic Users
Average Monthly Household Income (VND)/a 1,500,000 1,400,000 1,400,000 1,350,000 1,600,000 1,700,000 1,500,000 1,400,000 1,400,000 1,450,000 1,300,000 1,600,000 1,300,000 Poverty Line Monthly Household Income (VND)/b 1,040,000 1,040,000 1,040,000 1,040,000 1,040,000 1,040,000 1,040,000 1,040,000 1,040,000 1,040,000 1,040,000 1,040,000 1,040,000
Below Poverty Line Monthly Household Income (VND) 800,000 800,000 800,000 800,000 800,000 800,000 800,000 800,000
800,000 800,000 800,000 800,000 800,000
Average Water Tariff (VND per month) 50,000 50,000 50,000 50,000 50,000 50,000 50,000 50,000 50,000 50,000 50,000 50,000 50,000 Average DWW Tariff (VND per month) 5,000 5,000 5,000 5,000 5,000 5,000 5,000 5,000 5,000 5,000 5,000 5,000 5,000 Average SW Tariff (VND per month) 12,000 12,000 12,000 12,000 12,000 12,000 12,000 12,000 12,000 12,000 12,000 12,000 12,000 Total payable tariff (VND per month) (*) 67,000 67,000 67,000 67,000 67,000 67,000 67,000 67,000 67,000 67,000 67,000 67,000 67,000 (*) as % Average Monthly Household Income 4.5% 4.8% 4.8% 5.0% 4.2% 3.9% 4.5% 4.8% 4.8% 4.6% 5.2% 4.2% 5.2% (*) as % Poverty Line Monthly Household Income 6.4% 6.4% 6.4% 6.4% 6.4% 6.4% 6.4% 6.4% 6.4% 6.4% 6.4% 6.4% 6.4%
(*) as % Below Poverty Line Monthly Household Income 8.4% 8.4% 8.4% 8.4% 8.4% 8.4% 8.4% 8.4%
8.4% 8.4% 8.4% 8.4% 8.4%
Commercial/Institutional Users
Average Water, Drainage, SW Tariffs (VND per month) (**) 5,000,000 5,000,000 5,000,000 5,000,000 5,000,000 5,000,000 5,000,000 5,000,000 5,000,000 5,000,000 5,000,000 5,000,000 5,000,000
Average Monthly Enterprise Revenue (VND)/c 70,000,000 70,000,000 70,000,000 70,000,000 80,000,000 80,000,000 80,000,000 80,000,000 75,000,000 70,000,000 70,000,000 85,000,000 70,000,000 (**) % Average Monthly Enterprise Revenue 7.1% 7.1% 7.1% 7.1% 6.3% 6.3% 6.3% 6.3% 6.7% 7.1% 7.1% 5.9% 7.1% Industrial Users
Average Water, Drainage, SW Tariffs (VND per month) (***) 8,000,000 8,000,000 8,000,000 8,000,000 8,000,000 8,000,000 8,000,000 8,000,000 8,000,000 8,000,000 8,000,000 8,000,000 8,000,000
Average Monthly Enterprise Revenue (VND)/c 90,000,000 90,000,000 90,000,000 90,000,000 100,000,000 100,000,000 100,000,000 100,000,000 90,000,000 80,000,000 80,000,000 90,000,000 80,000,000 (***) % Average Monthly Enterprise Revenue 8.9% 8.9% 8.9% 8.9% 8.0% 8.0% 8.0% 8.0% 8.9% 10.0% 10.0% 8.9% 10.0%
/a Based on socio-economic survey results. /b Based on 2005 MOLISA criteria. /c Based on GSO data and discussions with local stakeholders.

TA 4485-VIE: Central Region Small and Medium Towns Development Project FINAL REPORT Appendix 18, page 8
June 2006
Table A18-5. Recommended Tariff Schedule
Phasing of Water Tariff Schedule t: VND/m3 Unit: VND/m3 Gia Nghia Ea T'Ling Dak Mam Quang Khe Tan Son Ca Na Ninh Hoa Van Gia
User groups At Loan Effectiveness
12 Months After Loan
Effectiveness At Loan
Effectiveness 12 Months After Loan
Effectiveness At Loan
Effectiveness 12 Months After Loan
Effectiveness At Loan
Effectiveness 12 Months After Loan
Effectiveness At Loan
Effectiveness 12 Months After Loan
Effectiveness At Loan
Effectiveness 12 Months After Loan
Effectiveness At Loan
Effectiveness 12 Months After Loan
Effectiveness At Loan
Effectiveness 12 Months After Loan
Effectiveness Domestic users 3,600 4,000 3,600 4,000 3,600 4,000 3,600 4,000 3,600 4,000 3,600 4,000 3,600 4,000 3,600 4,000 Commercial users 7,200 8,000 7,200 8,000 7,200 8,000 7,200 8,000 5,400 6,000 5,400 6,000 7,200 8,000 7,200 8,000
Industrial users 5,400 6,000 5,400 6,000 5,400 6,000 5,400 6,000 4,500 5,000 4,500 5,000 5,400 6,000 5,400 6,000 Source: Consultant’s estimate. Phasing of DWW Tariff Schedule
Unit: VND/m3
Gia Nghia Ea T’Ling Dak Mam Quang Khe Phan Thiet Thap Cham Cam Ranh Tuy Hoa
User groups At Loan Effectiveness
12 Months After Loan
Effectiveness At Loan
Effectiveness 12 Months After Loan
Effectiveness At Loan
Effectiveness 12 Months After Loan
Effectiveness At Loan
Effectiveness 12 Months After Loan
Effectiveness At Loan
Effectiveness 12 Months After Loan
Effectiveness At Loan
Effectiveness 12 Months After Loan
Effectiveness At Loan
Effectiveness 12 Months After Loan
Effectiveness At Loan
Effectiveness 12 Months After Loan
Effectiveness Domestic users 360 400 360 400 360 400 360 400 360 400 450 500 315 350 225 250 Commercial users 720 800 720 800 720 800 720 800 468 520 684 760 450 500 315 350
Industrial users 540 600 540 600 540 600 540 600 648 720 468 520 315 350 450 500 Source: Consultant’s estimates. Phasing of SWM Tariff Schedule
Unit: VND
Gia Nghia Cam Ranh Ninh Hoa Van Gia Song Cau
User groups At Loan Effectiveness
12 Months After Loan
Effectiveness At Loan
Effectiveness 12 Months After Loan
Effectiveness At Loan
Effectiveness 12 Months After Loan
Effectiveness At Loan
Effectiveness 12 Months After Loan
Effectiveness At Loan
Effectiveness 12 Months After Loan
Effectiveness Domestic users* 10,800 12,000 10,800 12,000 10,800 12,000 10,800 12,000 10,800 12,000 Commercial users** 108,000 120,000 108,000 120,000 108,000 120,000 108,000 120,000 108,000 120,000
Industrial users*** 513,000 570,000 513,000 570,000 513,000 570,000 513,000 570,000 513,000 570,000
Source: Consultant’s estimates. * calculated as VND per house/month ** calculated as VND per bin/month *** calculated as VND per

TA 4485-VIE: Central Region Small and Medium Towns Development Project FINAL REPORT Appendix 18, page 9
June 2006
Table A18-6. FIRRs for WSD Component by Project Town Capital costs increase +10% O&M costs increase 10% Revenue decreases 10% Revenue delays 1 year
FIRR Base Case FIRR SI (FNPV) SV (FNPV) FIRR SI (FNPV) SV (FNPV) FIRR SI (FNPV) SV (FNPV) FIRR SI (FNPV) SV (FNPV)
Whole WSD 4.0% 3.1% 3.9 23.4% 3.8% 1.2 80.7% 2.8% 6.1 16.3% 2.3% 6.1 FNPV = 84.9% Lower Gia Nghia 6.8% 5.8% 1.6 62.1% 6.6% 0.6 173.8% 5.4% 3.2 31.4% 4.5% 3.2 FNPV = 48.4% Lower Ea T'Ling 3.1% 2.2% 8.0 12.5% 2.8% 2.5 40.5% 1.8% 11.5 8.7% 1.5% 11.5 FNPV = 148.2% Lower Dak Mam 4.3% 3.3% 3.7 26.8% 4.0% 1.3 77.1% 2.9% 6.0 16.6% 2.5% 6.0 FNPV = 79.4% Lower Quang Khe 7.7% 6.6% 1.3 75.9% 7.5% 0.5 198.7% 6.3% 2.8 35.5% 5.3% 2.8 FNPV = 42.9% Lower Tan Son 6.4% 5.4% 1.8 54.8% 6.1% 0.8 119.4% 4.9% 3.7 27.3% 4.1% 3.7 FNPV = 51.5% Lower Ca Na 0.6% 0.0% 5.5 18.1% 0.5% 0.7 150.2% -0.2% 5.2 19.3% -0.4% 5.2 FNPV = 68.5% Lower Ninh Hoa 0.4% -0.1% 4.5 22.3% 0.3% 0.7 153.3% -0.3% 4.1 24.1% -0.3% 4.1 FNPV = 44.9% Lower Van Gia 0.4% -0.4% 5.6 17.9% -1.1% 8.5 11.8% -1.9% 13.1 7.7% -1.9% 13.1 FNPV = 152.7% Lower
WSD = Water Supply Development and Expansion; NFC = Net Cash Flows; FIRR = Finnancial Internal Rate of Return; FNPV = Financial Net Present Value SI = Sensitivity Indicator, the ratio that compares percentage change in FNPV with a percentage change in a variable SV = Switching Value; the percentage change in a variable sufficient to reduce FNPV to zero. Source: Financial Analyst's estimates.
Table A18-7. FIRRs for SWM Component by Project Town
Capital costs increase +10% O&M costs increase 10% Revenue decreases 10% Revenue delays 1 year FIRR Base
Case FIRR SI (FNPV) SV (FNPV) FIRR SI (FNPV) SV (FNPV) FIRR SI (FNPV) SV (FNPV) FIRR SI (FNPV) SV (FNPV)
Whole SWM 3.5% 2.5% 6.3 14.4% 2.2% 8.4 11.9% 1.1% 15.7 6.3% 1.3% 15.7 FNPV = 154.9% Lower Gia Nghia 1.8% 1.0% 60.3 1.7% 1.1% 51.6 1.9% 0.2% 110.9 0.9% 0.4% 110.9 FNPV = 1,018% Lower Cam Ranh 3.5% 2.6% 5.4 18.5% 2.3% 7.8 12.8% 1.4% 14.2 7.0% 1.4% 14.2 FNPV = 143.4% Lower Ninh Hoa 4.7% 3.0% 5.5 18.1% -13.2% 103.4 1.0% -14.3% 109.9 0.9% -7.9% 109.9 FNPV = 1,068% Lower Van Gia 6.1% 4.7% 2.7 37.6% 5.4% 1.8 54.7% 3.9% 5.5 18.2% 3.8% 5.5 FNPV = 52.5% Lower Song Cau 2.5% 1.5% 20.8 4.8% 0.5% 38.6 2.6% -0.6% 60.4 1.7% -0.6% 60.4 FNPV = 662.3% Lower
SWM = Solid Waste Management; NFC = Net Cash Flows; FIRR = Finnancial Internal Rate of Return; FNPV = Financial Net Present Value SI = Sensitivity Indicator, the ratio that compares percentage change in FNPV with a percentage change in a variable SV = Switching Value; the percentage change in a variable sufficient to reduce FNPV to zero. Source: Financial Analyst's estimates.

TA 4485- VIE: Central Region Small and Medium Towns Development Project FINAL REPORT Appendix 17, page 1
June 2006
PROJECT ECONOMIC ANALYSIS
Economic analysis under the PPTA was conducted in accordance with the ADB’s Guidelines for the Economic Analysis of Projects, Handbook for the Economic Analysis of Water Supply Projects, Framework for the Economic and Financial Appraisal of Urban Development Sector Projects, Handbook for Integrating Poverty Impact Assessment in the Economic Analysis of Projects, and Handbook for Integrating Risk Analysis in the Economic Analysis of Projects.
1. Approach and Methodology
In accordance with the ADB’s Framework for the Economic and Financial Appraisal of Urban Development Sector Projects, small subproject components scattered throughout the participating Project towns such as solid waste management and community environmental sanitation and awareness were not subjected to a detailed economic analysis, but were examined using the cost-effectiveness criteria. The proposed solid waste management components in all towns will use simple, appropriate and low-cost technology. The least-cost method identified for waste collection in the towns was direct pick-up by compactor trucks from storage bins. However, this was not possible for all areas of the subproject towns because of local conditions such as narrow lanes, road and pavement conditions. Collection of solid waste in narrow streets and alleys will be undertaken using locally fabricated handcarts which will deliver the waste to temporary waste storage stations.The accumulated waste will eventually be transported and disposed in the sanitary landfills to be constructed under the Project. Th proposed solid waste collection systems in Cam Ranh, Gian Nghia, and Song Cau are expected to improve health and environment in the subproject towns and will also reduce drain blockages arising from the unauthorized dumping of garbage. The community environmental sanitation and awareness component, on the other hand, is expected to generate significant pro-poor benefits in the form of improved hygiene and sanitation practices through better awareness of, and access to, water supply and sanitation facilities.
The estimated costs and benefits of major subprojects were valued at their economic prices using the domestic price numeraire, which adjusts border price equivalent values to their equivalent domestic prices and entails the application of shadow price adjustments to convert the estimated financial costs to their equivalent. The shadow price adjustment factors used were: (i) foreign costs, 1.10, (ii) unskilled labor, 0.60, (iii) skilled labor, 2.00, and (iv) local materials, 1.00. Capital and recurrent costs, inclusive of physical contingencies, in constant 2006 prices were converted into economic costs by subtracting all transfer payments, including taxes and duties, and applying the appropriate shadow price adjustment factors.1
2. Water Supply Development and Expansion
The Project aims to develop or expand piped water supply in eight subproject towns. The capacity of the existing water supply systems in Ninh Hoa, Van Gia, Tan Son, and Gia Nghia will be expanded from a combined 7,000 m3/day to 30,500 m3/day in response to the projected additional demand in these towns as a result of accelerated economic growth by 2015. In addition, new water supply systems with a combined capacity of 10,000 m3/day will 1 These adjustment factors are consistent with those used in other ADB-funded Projects of a similar nature in Viet Nam such as the
Third Provincial Water Supply Project and Central Region Urban Environment Improvement project.

TA 4485- VIE: Central Region Small and Medium Towns Development Project FINAL REPORT Appendix 17, page 2
June 2006
be developed in Ca Na, Ea T’Ling, Dak Mam, and Quang Khe. A total of about 160 km of new transmission and distribution pipes will be installed and an estimated 18,000 new connections will be added. More than 6,800 ha of service area will be involved with approximately 20,000 households benefiting from the proposed works (Table A17-1).
Table A17-1. Water Supply and Demand Analysis in Subproject Towns Existing Water Supply Projected Demand for Water to 2015 After Project
Town Service Area
Pop’n
Coverage % of HH
WS Capacity m3/day
Service Area Pop’n
Coverage % of HH
Cons lpcd
Required Capacity m3/day
Added Capacity m3/day
Total Capacity m3/day
Ninh Hoa 37,000 60 2,500 45,700 80 100 4,000 5,000 5,000Van Gia 20,800 60 2,000 25,700 80 100 3,900 2,000 4,000 Tan Son 10,200 60 1,000 12,200 80 100 3,200 4,000 5,000 Ca Na 18,500 0 0 21,500 80 100 3,300 2,000 2,000 Gia Nghia 24,800 33 1,500 84,200 85 120 16,500 15,000 16,500 Ea Tling 14,500 0 0 20,800 80 100 3,200 4,000 4,000 Dak Mam 6,400 0 0 15,100 80 100 2,300 2,000 2,000 Quang Khe 3,500 0 0 13,500 80 100 1,900 2,000 2,000 Totals 135,700 29 7,000 238,700 78 36,100 36,000 40,500
PPTA Consultants’ Estimates. Pop’n = population; HH = households;WS=water supply; Cons = consumption
Alternative water sources were considered for all water supply schemes. The selected surface sources represented the least-cost feasible options in the vicinity of the service areas. Available groundwater investigations and local enquiries revealed that groundwater will not be a viable option, particularly for Gia Nghia because of limited yield. In the case of Gia Nghia, the least-cost analysis evaluated two options: (i) Option A which was based on a 12,000 m3/day pumped supply from the Dak Tik River, and (ii) Option B which required a 5,000 m3/day temporary pumped supply from the Dak Tik River, followed by a 12,000 m3/day pumped supply from the future Dak Nong Hydro Scheme, which will be available within two years of completion of the subproject. The least-cost analysis showed that Option B should be preferred because it entailed lower capital cost, lower operation and maintenance (O&M) cost, and provided more security in terms of water supply yield and source protection. Three levels will be used in the distribution network: primary, secondary and tertiary pipes. Households will connect only to the tertiary pipes. Pipe materials will also be chosen on the basis of least-cost considerations and quality. The economic evaluation of the water supply subproject components was based on the capital and O&M costs of these least-cost alternatives as indicated by the calculated average incremental economic costs (AIECs) which ranged from VND 2,049/m3 to VND7,936/m3. Increasing the supply of water in the subproject towns will greatly enhance the economic well-being of the residents. The major benefits quantified included (i) the resource cost savings on the nonincremental water consumed due to the switch from alternative sources such as tubewells, surface wells, rivers, water vendors or even households with piped supply to the new water supply, and (ii) the household’s valuation or willingness to pay for incremental water supply. Valuation of the nonincremental benefits accruing to the town residents was estimated using the average supply price of all alternative sources in the without-project situation. The average supply price was used as the proxy for consumers’ willingness to pay which is difficult to quantify and tends to be understated by the residents when surveys are conducted. The prices for tube well supplies, surface wells, and river sources, as well as water purchased year-round or during the dry-season from water vendors or other households with piped supply were considered in estimating the average supply price. Incremental sales were valued at the proposed financial tariffs. The derivation of economic costs for all eight water supply development and expansion subprojects are in supplementary Tables SA17-1 to SA17-8 which are presented at the end of this appendix. The economic project resource statements which detail the calculation of the subproject

TA 4485- VIE: Central Region Small and Medium Towns Development Project FINAL REPORT Appendix 17, page 3
June 2006
benefits and costs on an annual basis are provided in supplementary Tables SA17-9 to SA17-16. The major indicators of economic viability of the proposed water supply works in the selected subproject towns are summarized in Table A17-2. All base case EIRRs, ranging from 12.09 percent to 17.09 percent exceeded the economic opportunity cost of capital (EOCC), which was assumed at 12 percent, confirming the economic robustness of the proposed subproject town components. The sensitivity of the proposed water supply subprojects was tested against likely adverse changes in key variables that include: (i) increases in capital costs arising from inflationary pressures; (ii) increases in O&M costs potentially due to increase in labor or petroleum costs; (iii) reductions in benefits as measured by the willingness to pay based on anticipated resource cost savings; (iv) combination of increases in capital costs and O&M and reductions in benefits; and (v) delays in the realization of anticipated project benefits possibly due to delay in subproject implementation or failure to set up the required PPMU in a timely manner. Table A17-2 which also summarizes the switching values and sensitivity indicators for the scenarios tested shows that the proposed water supply subprojects are most sensitive to reductions in willingness to pay which may occur when implementation is perceived to be of poor quality by the targeted beneficiaries or when they are unable to connect to the tertiary pipes. Tables SA17-17 to SA17-24 provide the detailed EIRR calculation and sensitivity analysis conducted for each subproject. Table A17-2. Economic Evaluation of Water Supply Development and Expansion
Ninh Hoa Van Gia Tan Son Ca Na Gia Nghia Ea T'ling Dak Mam Quang Khe
Financial Cost 83,194 6,754 24,482 53,047 94,150 31,117 20,722 14,725(VND Million)
Net Present Value 589 1,700 9,529 1,413 11,208 576 8,489 9,872(VND Million)
Average Incremental Economic Cost (AIEC) 3,830 2,049 2,330 7,936 3,311 3,905 2,879 2,755(VND/m3)
Base Case EIRR (%) 12.09% 14.37% 16.51% 12.36% 13.39% 12.24% 16.49% 17.09%Sensitivity Tests:Case 1: Capital Cost + 10%
EIRR 11.03% 13.48% 15.31% 11.25% 12.37% 11.17% 15.34% 15.93%Switching Value 0.88 26.55 37.48 3.26 13.62 2.27 39.08 43.81Sensitivity Indicator 113.80 3.77 2.67 30.72 7.34 44.03 2.56 2.28
Case 2: O & M Cost + 10% EIRR 11.96% 14.14% 16.27% 12.22% 13.28% 12.06% 16.34% 16.95%Switching Value 6.88 101.14 186.56 25.97 124.67 13.46 304.76 355.31Sensitivity Indicator 14.54 0.99 0.54 3.85 0.80 7.43 0.33 0.28
Case 3: Benefits - 10% EIRR 10.78% 13.14% 14.93% 10.99% 12.14% 10.87% 15.07% 15.66%Switching Value 0.71 19.31 28.50 2.63 11.16 1.77 31.57 35.54Sensitivity Indicator 140.94 5.18 3.51 37.96 8.96 56.49 3.17 2.81
Case 4: Capital Cost & OM + 10% & Benefits -10%EIRR 9.62% 12.06% 13.54% 9.80% 11.04% 9.66% 13.82% 14.40%NPV (VND Million) (15,394) 44 3,308 (8,898) (7,846) (5,659) 3,516 4,760% Change in NPV (2,715.8) (97.4) (65.3) (193.4) (182.3) (159.4) (63.1) (50.0)
Case 5: Benefits delayed by one yearEIRR 10.06% 12.28% 14.06% 10.41% 11.57% 10.40% 13.98% 14.53%NPV (VND Million) (12,103) 194 4,454 (6,275) (3,449) (3,849) 3,685 4,831% Drop in NPV 2,156.5 (88.6) (53.3) (165.9) (136.2) (140.4) (61.3) (49.3)
Base Case/Sensitivity Scenarios
3. Drainage and Wastewater Management The Project will develop complete, integrated stormwater drainage, wastewater collection and wastewater treatment systems in the six cities or towns of Cam Ranh, Tuy Hoa, Phan Thiet, Thap Cham, Gia Nghia, and Song Cau. Drainage and wastewater works constitute approximately 40 percent of the estimated Project cost. More than 23,000 ha of service area will be involved. About 80,000 households in the 40 wards comprising six subproject towns will benefit from the proposed works (Table A17-3)

TA 4485- VIE: Central Region Small and Medium Towns Development Project FINAL REPORT Appendix 17, page 4
June 2006
Three options were compared for the proposed drainage and wastewater management in the subproject towns, namely: (i) combined systems; (ii) combined systems with wastewater interceptors; and (iii) separate systems. For all the subprojects towns, the option of a separate system was rejected as an alternative to combined systems with interceptor sewers, because (i) separate sewers were found to be substantially more costly in terms of capital and O&M costs; (ii) it was concluded that it will be difficult to control the quality of sewer connections and prevent stormwater entry to the separate sewers; and (iii) separate sewerage systems were deemed to be inappropriate for stepwise development. The analysis further showed that of the three alternatives, the combined system with interceptors is the least-cost, environmentally acceptable solution. Combined systems with interceptor sewers and wastewater treatment systems were recommended for Class III and Class IV subproject towns, while combined drainage systems were proposed as the first step in the drainage development planned for the Class V subproject towns.
Table A17-3. Drainage and Wastewater Management in Subproject Towns
The drainage and wastewater management subcomponents in each town will contribute significantly to the improved economic welfare of the residents. Anticipated economic benefits were quantified by estimating the annualized incremental increase in the values of affected land. In the absence of sales data or regular property valuation procedures in Viet Nam, officials in the subproject towns were surveyed for their assessment of the probable increase in land valuation. The results of this survey yielded land valuation increases ranging from 20 to 30 percent, on base values which were estimated at VND 200 thousand to VND 800 thousand per square meter. The resulting incremental increases in land values were annualized using the surveyed rent-to-capital value ratio of 7 percent. Health benefits will also potentially redound to the residents of some of the subproject towns as a result or improved personal hygiene, public health and environmental conditions, and reduced medical expenses associated with water-borne and water-related diseases. These health benefits are particularly critical for infants, women, and the elderly who spend most of their time at home. Savings from reduced flooding will not be significant considering that most of the subproject towns are not flood-prone areas but the proposed works will help protect road networks and other related infrastructure. The analysis assumed that the potential reduction in health benefits and the benefits to the town’s infrastructure system were incorporated in the increased land values used. The derivation of economic costs for all six drainage and wastewater treatment subprojects are shown in supplementary Tables SA17-25 to SA17-30. The calculation of annualized economic benefits from the proposed subprojects are presented in Table SA17-31. The major indicators of economic viability of the proposed drainage and wastewater management works in the participating towns are summarized in Table A17-4. Base case EIRRs calculated varied from 19.68 percent to 26.80 percent exceeded the ADB’s EOCC, estimated at 12 percent, validating the economic viability of the proposed subproject components. The results of the sensitivity analysis conducted on changes in the key
Capacity in 2005 Capacity by 2015
Towns Urban Population in Service Area
Existing Coverage (m/capita)
Projected Urban Population in Service Area
Proposed Coverage (m/capita)
Coverage after Project
( percent of Households)
Tuy Hoa 135,000 0.20 158,000 0.60 70 percent Song Cau 19,000 0.20 35,000 0.40 40 percent Cam Ranh 90,000 0.20 106,000 0.60 45 percent Thap Cham 36,000 0.60 52,000 1.10 65 percent Phan Thiet 158,000 0.40 162,000 1.00 70 percent Gia Nghia 25,000 0.20 84,000 0.60 60 percent Total 463,000 597,000

TA 4485- VIE: Central Region Small and Medium Towns Development Project FINAL REPORT Appendix 17, page 5
June 2006
variables, also shown in Table A17-4, indicate that the proposed drainage and management subprojects are most vulnerable to delays in the realization of improvements to land values which in the analysis also capture the expected health benefits and improvements to the town’s infrastructure system. Tables SA17-32 to SA17-43 provide the detailed EIRR calculation and sensitivity analysis conducted for each subproject.
Table A17-4. Economic Evaluation of Drainage and Wastewater Management Cam Ranh Tuy Hoa Phan Thiet Thap Cham Gia Nghia Song Cau
Financial Cost 128,377 164,438 228,626 95,289 84,000 33,120(VND Million)
Net Present Value 100,849 226,981 219,831 60,837 125,373 22,307(VND Million)
Base Case EIRR (%) 21.08% 25.97% 22.65% 19.68% 26.80% 20.03%Sensitivity Tests:Case 1: Capital Cost + 10%
EIRR 19.77% 24.50% 21.28% 18.41% 25.30% 18.74%Switching Value 69.05 95.04 78.04 60.36 98.80 62.54Sensitivity Indicator 1.45 1.05 1.28 1.66 1.01 1.60
Case 2: O & M Cost + 10% EIRR 21.05% 25.94% 22.62% 19.66% 26.77% 20.00%Switching Value 2,795.79 4,274.67 4,202.60 2,586.97 6,576.00 2,867.45Sensitivity Indicator 0.04 0.02 0.02 0.04 0.02 0.03
Case 3: Benefits - 10% EIRR 19.60% 24.31% 21.12% 18.25% 25.12% 18.59%Switching Value 61.16 84.37 69.50 53.55 88.35 55.69Sensitivity Indicator 1.64 1.19 1.44 1.87 1.13 1.80
Case 4: Capital Cost & OM + 10% & Benefits -10%EIRR 18.29% 22.86% 19.77% 16.99% 23.65% 17.31%NPV (VND Million) 70,938 178,653 162,795 40,125 99,940 15,000% Drop in NPV (29.7) (21.3) (25.9) (34.0) (20.3) (32.8)
Case 5: Benefits delayed by one yearEIRR 18.22% 22.41% 19.58% 17.00% 23.13% 17.30%NPV (VND Million) 68,961 170,354 156,831 39,473 95,100 14,703% Change in NPV (31.6) (24.9) (28.7) (35.1) (24.1) (34.1)
Base Case/Sensitivity Scenarios
4. Overall Economic Rate of Return The quantified economic costs and benefits from the proposed subprojects were aggregated to calculate an overall EIRR for the water supply development and expansion and drainage and wastewater treatment components of the Project, and for the entire Project. Estimation of the overall EIRR reaffirmed the robustness of the proposed Project. The base case EIRR for the Project, calculated at 20.25 percent, is above the EOCC. A summary of the EIRRs calculated for the water supply and development component, the drainage and wastewater management component, and the overall Project is shown in Table A17-5. The sensitivity analysis conducted also demonstrated that the overall EIRR is most sensitive to the actual values of the realized benefits and to delays in the receipt of such benefits. The aggregated benefits and costs as well as detailed EIRR caculations and sensitivity analysis are presented in supplementary Tables SA17-44 to SA17-50.
5. Other Nonquantified Benefits The Project will generate considerable economic benefits that have not been quantified mainly due to data and technical constraints. The community environmental and sanitation awareness provides targeted, pro-poor interventions to improve the health condition of the town communities in a more sustainable manner. The water supply development and expansion works will (i) increase the security of uninterrupted access to improved drinking water quality, (ii) reduced the risk of exposure to water-borne pathogens in delivered tap water, (iii) improve water distribution efficiency, and (iv) reduce losses from nonrevenue water. The drainage and wastewater management works will (i) further reduce personal

TA 4485- VIE: Central Region Small and Medium Towns Development Project FINAL REPORT Appendix 17, page 6
June 2006
income losses due to employment disruption, and (ii) will bring about environmental and health improvements, particularly as a result of the elimination of flooded and muddy streets during the wet season. There are also indirect benefits that include improved aquatic environment and reduced risk of transboundary aquatic pollution in the affected coastal towns. The introduction of a solid waste management services and facilities will pave the way for substantially cleaner town environments.
Table A17-5. Overall Economic Evaluation of the Project
Water Supply Drainage & OverallDev & Expansion Wastewater Mgmt Project
Net Present Value 43,375 756,178 799,553(VND Million)
Base Case EIRR (%) 13.58% 23.23% 20.25%Sensitivity Tests:Case 1: Capital Cost + 10%
EIRR 12.51% 21.85% 18.98%Switching Value 14.72 81.22 6.32Sensitivity Indicator 6.79 1.23 15.81
Case 2: O & M Cost + 10% EIRR 13.44% 23.20% 20.19%Switching Value 109.71 3,949.36 5.94Sensitivity Indicator 0.91 0.03 16.82
Case 3: Benefits - 10% EIRR 12.24% 21.67% 18.78%Switching Value 11.82 72.16 6.39Sensitivity Indicator 8.46 0.00 15.65
Case 4: Capital Cost & OM + 10% & Benefits -10%EIRR 11.07% 20.31% 17.50%NPV (VND Million) (26,168) 567,451 541,283% Drop in NPV (160.3) (25.0) (32.3)
Case 5: Benefits delayed by one yearEIRR 11.54% 20.08% 17.50%NPV (VND Million) (12,512) 545,423 532,911% Drop in NPV (128.8) (27.9) (33.3)
Base Case/Sensitivity Scenarios
On a broader perspective, the Project will provide some of the critical urban-rural linkages required to ensure that the benefits of economic growth permeate all sectors of the participating provinces—particularly the vulnerable urban poor groups who remain isolated due to both physical and social barriers. As the Viet Nam economy continues to grow at an accelerated pace, the urban centers in the Central Region, particularly those in the subproject towns will play an increasingly pivotal role in the economic development of the entire region. These benefits which constitute significant positive externalities typically result in underproduction by the private sector, thus, justifying the public sector financing proposed by the Project. 6. Benefits Distribution and Poverty Impact Analyses The quantified benefits of the Project were distributed among the following: (i) the consumers, who will benefit from the increased water supply and improved drainage and wastewater management in the subproject towns; (ii) the Government and the economy, who will lose when the economic costs exceed the financial costs; (iii) the labor sector, who stands to gain when the financial cost of labor exceeds its opportunity cost; and (iv) the WSS providers, who will potentially lose because the proposed tariffs are less than the economic benefits. The distribution of net economic benefits of the proposed Project, calculated at the discount rate of 12 pecent, is shown in Table A17-6. The poverty impact ratio, defined as the proportion of the total net economic benefits of the Project accruing to poor and calculated at 31.08 percent, indicates the pro-poor thrust of the Project since it is above 12.6 percent, the estimated poor’s share in the GDP of Viet Nam.

TA 4485- VIE: Central Region Small and Medium Towns Development Project FINAL REPORT Appendix 17, page 7
June 2006
Table A17-6. Distribution of Net Benefits and Poverty Impact Ratio
A. Distribution of Financial Economic Difference WSS Economy/ Labor Consumers TotalProject Effects Returns Returns Providers Government
(1) (2) (2) - (1)
Output 268,951 1,691,129 1,422,178 1,422,178 1,422,178Capital costs 805,116 828,040 22,923 (41,262) 18,339 (22,923)Operating costs 60,521 63,536 3,016 (3,769) 754 (3,016)Total costs 865,637 891,576 25,939Net Benefits (596,686) 799,553 1,396,239 (596,686) (596,686)
B. Poverty Impact WSS Economy/ Labor Consumers TotalRatio Calculation Providers Government
Gains/(Losses) (596,686) (45,032) 19,093 1,422,178 799,553Percentage of Poor 12.6 12.6 75.0 22.2Gains/Losses to the Poor (75,182) (5,674) 14,319 315,012 248,475 Poverty Impact Ratio 31.08%

TA 4485- VIE: Central Region Small and Medium Towns Development Project FINAL REPORT Appendix 17, page 8
June 2006
Table SA17-1. Calculation of Economic Costs, Ninh Hoa Water Supply Development and Expansion Subproject
INVESTMENT COSTS (Constant 2006 Prices---VND Millions)FINANCIAL TOTAL
TOTAL WITHOUT Foreign Costs ECONOMICPROJECT COST ITEM FINANCIAL TAX % Total % Total % Total % Total COSTS
A. Water Supply Development & Expansion1. Civil Works 73,585 66,896 15% 10,034 15% 10034 10% 6,690 60% 40137 76,9302. Equipment 4,086 4,086 15% 613 15% 613 3% 123 67% 2738 4,7283. Land Acquisition 80 80 0% 0 0% 0 100% 80 0% 0 80
Subtotal Infrastructure Works 77,751 71,061 15% 10,647 15% 10,647 10% 6,892 60% 42,875 81,737Total BASELINE COSTS 77,751 71,061 15% 10,647 15% 10,647 10% 6,892 60% 42,875 81,737 Physical Contingencies 7% 5,443 4,974 15% 745 15% 745 10% 482 49% 2,444 4,313TOTAL SUB-PROJECT COSTS 83,194 76,036 15% 11,393 15% 11,393 10% 7,374 60% 45,319 86,050
RECURRENT COSTS (VND Millions)FINANCIAL TOTAL
TOTAL WITHOUT Foreign Costs ECONOMICPROJECT COST ITEM FINANCIAL TAX % Total % Total % Total % Total COSTS
A. Operations & Maintenance 828 753 15% 113 15% 113 10% 75 60% 452 866
SHADOW PRICING INDICES
0.602.001.001.1
10%Taxes and Duties
Unskilled Labor Shadow IndexSkilled Labor Shadow IndexLocal Materials Shadow IndexForeign Exchange Cost Shadow Index
FINANCIAL COSTS EXCLUDING TAXUnskilled Labor Skilled Labor Local Materials
Unskilled Labor Skilled Labor Local MaterialsFINANCIAL COSTS EXCLUDING TAX

TA 4485- VIE: Central Region Small and Medium Towns Development Project FINAL REPORT Appendix 17, page 9
June 2006
Table SA17-2. Calculation of Economic Costs, Van Gia Water Supply Development and Expansion Subproject
INVESTMENT COSTS (Constant 2006 Prices---VND Millions)FINANCIAL TOTAL
TOTAL WITHOUT Foreign Costs ECONOMICPROJECT COST ITEM FINANCIAL TAX % Total % Total % Total % Total COSTS
A. Water Supply Development & Expansion1. Civil Works 5,231 4,756 15% 713 15% 713 10% 476 60% 2853 5,4692. Equipment 1,081 983 15% 147 15% 147 10% 98 60% 590 1,1303. Land Acquisition - 0 0% 0 0% 0 100% 0 0% 0 0
Subtotal Infrastructure Works 6,312 5,738 15% 861 15% 861 10% 574 60% 3,443 6,599Total BASELINE COSTS 6,312 5,738 15% 861 15% 861 10% 574 60% 3,443 6,599 Physical Contingencies 7% 442 402 15% 60 15% 60 10% 40 60% 241 398TOTAL SUB-PROJECT COSTS 6,754 6,140 15% 921 15% 921 10% 614 60% 3,684 6,997
RECURRENT COSTS (VND Millions)FINANCIAL TOTAL
TOTAL WITHOUT Foreign Costs ECONOMICPROJECT COST ITEM FINANCIAL TAX % Total % Total % Total % Total COSTS
A. Operations & Maintenance 273 248 15% 37 15% 37 10% 25 60% 149 285
SHADOW PRICING INDICES
0.602.001.001.1
10%
Unskilled Labor Skilled Labor Local MaterialsFINANCIAL COSTS EXCLUDING TAX
FINANCIAL COSTS EXCLUDING TAXUnskilled Labor Skilled Labor Local Materials
Taxes and Duties
Unskilled Labor Shadow IndexSkilled Labor Shadow IndexLocal Materials Shadow IndexForeign Exchange Cost Shadow Index

TA 4485- VIE: Central Region Small and Medium Towns Development Project FINAL REPORT Appendix 17, page 10
June 2006
Table SA17-3. Calculation of Economic Costs, Tan Son Water Supply Development and Expansion Subproject
INVESTMENT COSTS (Constant 2006 Prices---VND Millions)FINANCIAL TOTAL
TOTAL WITHOUT Foreign Costs ECONOMICPROJECT COST ITEM FINANCIAL TAX % Total % Total % Total % Total COSTS
A. Water Supply Development & Expansion1. Civil Works 18,985 17,259 15% 2,589 15% 2589 10% 1,726 60% 10355 19,8482. Equipment 3,450 3,137 15% 470 15% 470 10% 314 60% 1882 3,6073. Land Acquisition 445 445 0% 0 0% 0 100% 445 0% 0 445
Subtotal Infrastructure Works 22,880 20,841 15% 3,059 15% 3,059 12% 2,485 59% 12,237 23,900Total BASELINE COSTS 22,880 20,841 15% 3,059 15% 3,059 12% 2,485 59% 12,237 23,900 Physical Contingencies 7% 1,602 1,459 15% 214 15% 214 12% 174 59% 857 1,446TOTAL SUB-PROJECT COSTS 24,482 22,299 15% 3,273 15% 3,273 12% 2,659 59% 13,094 25,346
RECURRENT COSTS (VND Millions)FINANCIAL TOTAL
TOTAL WITHOUT Foreign Costs ECONOMICPROJECT COST ITEM FINANCIAL TAX % Total % Total % Total % Total COSTS
A. Operations & Maintenance 523 476 15% 71 15% 71 10% 48 60% 285 547
SHADOW PRICING INDICES
0.602.001.001.1
10%Taxes and Duties
Unskilled Labor Shadow IndexSkilled Labor Shadow IndexLocal Materials Shadow IndexForeign Exchange Cost Shadow Index
FINANCIAL COSTS EXCLUDING TAXUnskilled Labor Skilled Labor Local Materials
Unskilled Labor Skilled Labor Local MaterialsFINANCIAL COSTS EXCLUDING TAX

TA 4485- VIE: Central Region Small and Medium Towns Development Project FINAL REPORT Appendix 17, page 11
June 2006
Table SA17-4. Calculation of Economic Costs, Ca Na Water Supply Development and Expansion Subproject
INVESTMENT COSTS (Constant 2006 Prices---VND Millions)FINANCIAL TOTAL
TOTAL WITHOUT Foreign Costs ECONOMICPROJECT COST ITEM FINANCIAL TAX % Total % Total % Total % Total COSTS
A. Water Supply Development & Expansion1. Civil Works 48,002 43,638 15% 6,546 15% 6546 10% 4,364 60% 26183 50,1842. Equipment 1,574 1,431 15% 215 15% 215 10% 143 60% 859 1,6463. Land Acquisition - 0 0% 0 0% 0 100% 0 0% 0 0
Subtotal Infrastructure Works 49,576 45,069 15% 6,760 15% 6,760 10% 4,507 60% 27,042 51,830Total BASELINE COSTS 49,576 45,069 15% 6,760 15% 6,760 10% 4,507 60% 27,042 51,830 Physical Contingencies 7% 3,470 3,155 15% 473 15% 473 10% 315 60% 1,893 3,126TOTAL SUB-PROJECT COSTS 53,047 48,224 15% 7,234 15% 7,234 10% 4,822 60% 28,934 54,956
RE RECURRENT COSTS (VND Millions)FINANCIAL TOTAL
TOTAL WITHOUT Foreign Costs ECONOMICPROJECT COST ITEM FINANCIAL TAX % Total % Total % Total % Total COSTS
A. Operations & Maintenance 529 481 15% 72 15% 72 10% 48 60% 288 553
SHADOW PRICING INDICES
0.602.001.001.1
10%
Unskilled Labor Skilled Labor Local MaterialsFINANCIAL COSTS EXCLUDING TAX
FINANCIAL COSTS EXCLUDING TAXUnskilled Labor Skilled Labor Local Materials
Taxes and Duties
Unskilled Labor Shadow IndexSkilled Labor Shadow IndexLocal Materials Shadow IndexForeign Exchange Cost Shadow Index

TA 4485- VIE: Central Region Small and Medium Towns Development Project FINAL REPORT Appendix 17, page 12
June 2006
Table SA17-5. Calculation of Economic Costs, Gia Nghia Water Supply Development and Expansion Subproject
INVESTMENT COSTS (Constant 2006 Prices---VND Millions)FINANCIAL TOTAL
TOTAL WITHOUT Foreign Costs ECONOMICPROJECT COST ITEM FINANCIAL TAX % Total % Total % Total % Total COSTS
A. Water Supply Development & Expansion1. Civil Works 80,565 73,241 15% 10,986 15% 10986 10% 7,324 60% 43945 84,2272. Equipment 5,692 5,175 15% 776 15% 776 10% 517 60% 3105 5,9513. Land Acquisition 1,733 1,733 0% 0 0% 0 100% 1,733 0% 0 1,733
Subtotal Infrastructure Works 87,991 80,149 15% 11,762 15% 11,762 12% 9,575 59% 47,050 91,911Total BASELINE COSTS 87,991 80,149 15% 11,762 15% 11,762 12% 9,575 59% 47,050 91,911 Physical Contingencies 7% 6,159 5,610 15% 823 15% 823 12% 670 59% 3,293 5,561TOTAL SUB-PROJECT COSTS 94,150 85,759 15% 12,586 15% 12,586 12% 10,245 59% 50,343 97,472
RECURRENT COSTS (VND Millions)FINANCIAL TOTAL
TOTAL WITHOUT Foreign Costs ECONOMICPROJECT COST ITEM FINANCIAL TAX % Total % Total % Total % Total COSTS
A. Operations & Maintenance 887 807 15% 121 15% 121 10% 81 60% 484 928
SHADOW PRICING INDICES
0.602.001.001.1
10%Taxes and Duties
Unskilled Labor Shadow IndexSkilled Labor Shadow IndexLocal Materials Shadow IndexForeign Exchange Cost Shadow Index
FINANCIAL COSTS EXCLUDING TAXUnskilled Labor Skilled Labor Local Materials
Unskilled Labor Skilled Labor Local MaterialsFINANCIAL COSTS EXCLUDING TAX

TA 4485- VIE: Central Region Small and Medium Towns Development Project FINAL REPORT Appendix 17, page 13
June 2006
Table SA17-6. Calculation of Economic Costs, Ea Tling Water Supply Development and Expansion Subproject
INVESTMENT COSTS (Constant 2006 Prices---VND Millions)FINANCIAL TOTAL
TOTAL WITHOUT Foreign Costs ECONOMICPROJECT COST ITEM FINANCIAL TAX % Total % Total % Total % Total COSTS
A. Water Supply Development & Expansion1. Civil Works 24,756 22,506 15% 3,376 15% 3376 10% 2,251 60% 13503 25,8822. Equipment 3,641 3,310 15% 497 15% 497 10% 331 60% 1986 3,8073. Land Acquisition 684 684 0% 0 0% 0 100% 684 0% 0 684
Subtotal Infrastructure Works 29,081 26,500 15% 3,872 15% 3,872 12% 3,265 58% 15,489 30,372Total BASELINE COSTS 29,081 26,500 15% 3,872 15% 3,872 12% 3,265 58% 15,489 30,372 Physical Contingencies 7% 2,036 1,855 15% 271 15% 271 12% 229 58% 1,084 1,839TOTAL SUB-PROJECT COSTS 31,117 28,354 15% 4,143 15% 4,143 12% 3,494 58% 16,574 32,211
RECURRENT COSTS (VND Millions)FINANCIAL TOTAL
TOTAL WITHOUT Foreign Costs ECONOMICPROJECT COST ITEM FINANCIAL TAX % Total % Total % Total % Total COSTS
A. Operations & Maintenance 414 377 15% 57 15% 57 10% 38 60% 226 433
SHADOW PRICING INDICES
0.602.001.001.1
10%
Unskilled Labor Skilled Labor Local MaterialsFINANCIAL COSTS EXCLUDING TAX
FINANCIAL COSTS EXCLUDING TAXUnskilled Labor Skilled Labor Local Materials
Taxes and Duties
Unskilled Labor Shadow IndexSkilled Labor Shadow IndexLocal Materials Shadow IndexForeign Exchange Cost Shadow Index

TA 4485- VIE: Central Region Small and Medium Towns Development Project FINAL REPORT Appendix 17, page 14
June 2006
Table SA17-7. Calculation of Economic Costs, Dak Mam Water Supply Development and Expansion Subproject
INVESTMENT COSTS (Constant 2006 Prices---VND Millions)FINANCIAL TOTAL
TOTAL WITHOUT Foreign Costs ECONOMICPROJECT COST ITEM FINANCIAL TAX % Total % Total % Total % Total COSTS
A. Water Supply Development & Expansion1. Civil Works 16,011 14,556 15% 2,183 15% 2183 10% 1,456 60% 8733 16,7392. Equipment 2,465 2,240 15% 336 15% 336 10% 224 60% 1344 2,5773. Land Acquisition 890 890 0% 0 0% 0 100% 890 0% 0 890
Subtotal Infrastructure Works 19,366 17,687 14% 2,519 14% 2,519 15% 2,570 57% 10,078 20,206Total BASELINE COSTS 19,366 17,687 14% 2,519 14% 2,519 15% 2,570 57% 10,078 20,206 Physical Contingencies 7% 1,356 1,238 14% 176 14% 176 15% 180 57% 705 1,227TOTAL SUB-PROJECT COSTS 20,722 18,925 14% 2,696 14% 2,696 15% 2,750 57% 10,783 21,433
RECURRENT COSTS (VND Millions)FINANCIAL TOTAL
TOTAL WITHOUT Foreign Costs ECONOMICPROJECT COST ITEM FINANCIAL TAX % Total % Total % Total % Total COSTS
A. Operations & Maintenance 283 257 15% 39 15% 39 10% 26 60% 154 295
SHADOW PRICING INDICES
0.602.001.001.1
10%Taxes and Duties
Unskilled Labor Shadow IndexSkilled Labor Shadow IndexLocal Materials Shadow IndexForeign Exchange Cost Shadow Index
FINANCIAL COSTS EXCLUDING TAXUnskilled Labor Skilled Labor Local Materials
Unskilled Labor Skilled Labor Local MaterialsFINANCIAL COSTS EXCLUDING TAX

TA 4485- VIE: Central Region Small and Medium Towns Development Project FINAL REPORT Appendix 17, page 15
June 2006
Table SA17-8. Calculation of Economic Costs, Quang Khe Water Supply Development and Expansion Subproject
INVESTMENT COSTS (Constant 2006 Prices---VND Millions)FINANCIAL TOTAL
TOTAL WITHOUT Foreign Costs ECONOMICPROJECT COST ITEM FINANCIAL TAX % Total % Total % Total % Total COSTS
A. Water Supply Development & Expansion1. Civil Works 10,446 9,497 15% 1,424 15% 1424 10% 950 60% 5698 10,9212. Equipment 3,307 3,007 15% 451 15% 451 10% 301 60% 1804 3,4583. Land Acquisition 270 270 0% 0 0% 0 100% 270 0% 0 270
Subtotal Infrastructure Works 14,024 12,773 1,875 1,875 1,521 7,502 14,649Total BASELINE COSTS 14,024 12,773 15% 1,875 15% 1,875 12% 1,521 59% 7,502 14,649 Physical Contingencies 7% 701 639 15% 94 15% 94 12% 76 59% 375 633TOTAL SUB-PROJECT COSTS 14,725 13,412 15% 1,969 15% 1,969 12% 1,597 59% 7,877 15,282
RECURRENT COSTS (VND Millions)FINANCIAL TOTAL
TOTAL WITHOUT Foreign Costs ECONOMICPROJECT COST ITEM FINANCIAL TAX % Total % Total % Total % Total COSTS
A. Operations & Maintenance 254 231 15% 35 15% 35 10% 23 60% 139 266
SHADOW PRICING INDICES
0.602.001.001.1
10%
Unskilled Labor Skilled Labor Local MaterialsFINANCIAL COSTS EXCLUDING TAX
FINANCIAL COSTS EXCLUDING TAXUnskilled Labor Skilled Labor Local Materials
Taxes and Duties
Unskilled Labor Shadow IndexSkilled Labor Shadow IndexLocal Materials Shadow IndexForeign Exchange Cost Shadow Index

TA 4485- VIE: Central Region Small and Medium Towns Development Project FINAL REPORT Appendix 17, page 16
June 2006
Table SA17-9. Economic Project Resource Statement, Ninh Hoa Water Supply Development and Expansion Subproject
Total Total Non- Incr. Total NTL TL Total Water Water Non Incr. NTL Total Invest- O&M OCW Total incr. Prod. Cons. incr. Benefit ment Cost
'000m3 '000m3 '000m3 '000m3 '000m3 '000m3 '000m3 '000m3
A B C D=B+C E F G=E+F H=D+G I=D+E J K L M=J+K+L N O P Q=N+O+P R=M-Q2007 600 0 600 60 60 120 720 660 0 0 0 0 25,815 0 0 25,815 -25,8152008 660 0 660 66 66 132 792 726 0 0 0 0 60,235 0 0 60,235 -60,2352009 726 308 1,034 103 103 207 1,240 1,137 3,060 1,230 413 4,703 0 866 0 866 3,8382010 799 294 1,093 109 109 219 1,311 1,202 3,366 1,177 437 4,980 0 952 0 952 4,0282011 878 911 1,789 179 179 358 2,147 1,968 3,703 3,643 716 8,061 0 1,047 0 1,047 7,0142012 966 1,328 2,294 229 229 459 2,753 2,523 4,073 5,311 918 10,301 0 1,152 0 1,152 9,1492013 1,063 1,579 2,642 264 264 528 3,170 2,906 4,480 6,315 1,057 11,852 0 1,267 0 1,267 10,5852014 1,169 1,847 3,016 302 302 603 3,619 3,318 4,928 7,387 1,206 13,522 0 1,394 0 1,394 12,1272015 1,286 2,185 3,471 347 347 694 4,165 3,818 5,421 8,738 1,388 15,548 0 1,534 0 1,534 14,0142016 1,415 2,081 3,495 350 350 699 4,194 3,845 5,963 8,322 1,398 15,683 0 1,687 0 1,687 13,9962017 1,556 2,081 3,637 364 364 727 4,364 4,000 6,560 8,322 1,455 16,336 0 1,856 0 1,856 14,4812018 1,712 2,081 3,792 379 379 758 4,551 4,172 7,216 8,322 1,517 17,054 0 2,041 0 2,041 15,0132019 1,883 2,081 3,964 396 396 793 4,756 4,360 7,937 8,322 1,585 17,845 0 2,245 0 2,245 15,5992020 2,071 2,081 4,152 415 415 830 4,982 4,567 8,731 8,322 1,661 18,714 0 2,245 0 2,245 16,4682021 2,278 2,497 4,775 478 478 955 5,730 5,253 9,604 9,986 1,910 21,500 0 2,245 0 2,245 19,2552022 2,506 2,996 5,502 550 550 1,100 6,603 6,052 10,564 11,984 2,201 24,749 0 2,245 0 2,245 22,5042023 2,757 3,595 6,352 635 635 1,270 7,623 6,987 11,621 14,380 2,541 28,542 0 2,245 0 2,245 26,2972024 3,033 4,314 7,347 735 735 1,469 8,816 8,081 12,783 17,256 2,939 32,978 0 2,245 0 2,245 30,7332025 3,336 5,177 8,513 851 851 1,703 10,215 9,364 14,061 20,708 3,405 38,174 0 2,245 0 2,245 35,9292026 3,670 6,212 9,882 988 988 1,976 11,858 10,870 15,467 24,849 3,953 44,269 0 2,245 0 2,245 42,024NPV 9,077 9,822 18,899 1,890 1,890 3,780 22,679 20,789 33,786 39,288 7,135 80,209 71,068 8,552 0 79,620 589@
12%
Per m3 consumed 1.63 1.89 0.34 3.86 3.418486 0.411363 0 3.8298487 0.028308082
3,830 12.09%
Non-incr. = Nonincremental; Incr. = Incremental; UFWs = unaccounted for water; NTL = nontechnical losses; TL = technical losses; O&M = operation & maintenance; OCW = opportunity cost of water
Resource CostsEconomic Project Resource Statement
YearNet
Economic Benefits
EIRR =AIEC =
Water Sold UFW Gross Benefits
(in VND miIlions) (in VND miIlions)
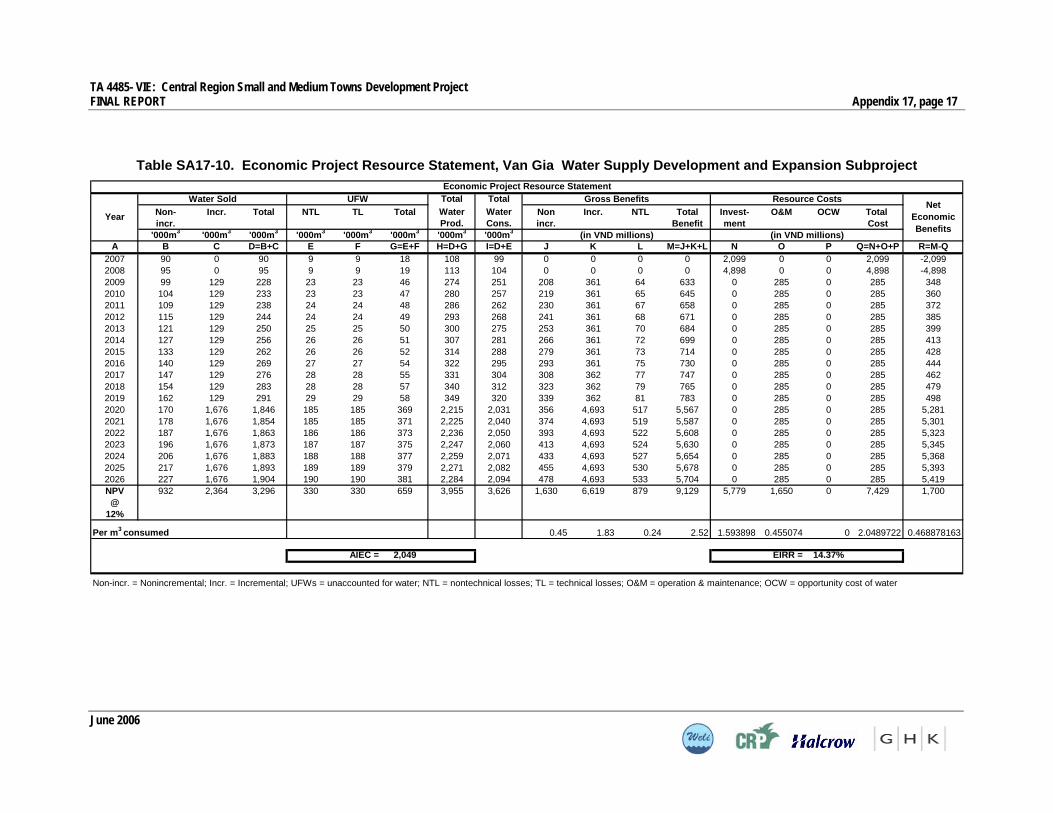
TA 4485- VIE: Central Region Small and Medium Towns Development Project FINAL REPORT Appendix 17, page 17
June 2006
Table SA17-10. Economic Project Resource Statement, Van Gia Water Supply Development and Expansion Subproject
Total Total Non- Incr. Total NTL TL Total Water Water Non Incr. NTL Total Invest- O&M OCW Total incr. Prod. Cons. incr. Benefit ment Cost
'000m3 '000m3 '000m3 '000m3 '000m3 '000m3 '000m3 '000m3
A B C D=B+C E F G=E+F H=D+G I=D+E J K L M=J+K+L N O P Q=N+O+P R=M-Q2007 90 0 90 9 9 18 108 99 0 0 0 0 2,099 0 0 2,099 -2,0992008 95 0 95 9 9 19 113 104 0 0 0 0 4,898 0 0 4,898 -4,8982009 99 129 228 23 23 46 274 251 208 361 64 633 0 285 0 285 3482010 104 129 233 23 23 47 280 257 219 361 65 645 0 285 0 285 3602011 109 129 238 24 24 48 286 262 230 361 67 658 0 285 0 285 3722012 115 129 244 24 24 49 293 268 241 361 68 671 0 285 0 285 3852013 121 129 250 25 25 50 300 275 253 361 70 684 0 285 0 285 3992014 127 129 256 26 26 51 307 281 266 361 72 699 0 285 0 285 4132015 133 129 262 26 26 52 314 288 279 361 73 714 0 285 0 285 4282016 140 129 269 27 27 54 322 295 293 361 75 730 0 285 0 285 4442017 147 129 276 28 28 55 331 304 308 362 77 747 0 285 0 285 4622018 154 129 283 28 28 57 340 312 323 362 79 765 0 285 0 285 4792019 162 129 291 29 29 58 349 320 339 362 81 783 0 285 0 285 4982020 170 1,676 1,846 185 185 369 2,215 2,031 356 4,693 517 5,567 0 285 0 285 5,2812021 178 1,676 1,854 185 185 371 2,225 2,040 374 4,693 519 5,587 0 285 0 285 5,3012022 187 1,676 1,863 186 186 373 2,236 2,050 393 4,693 522 5,608 0 285 0 285 5,3232023 196 1,676 1,873 187 187 375 2,247 2,060 413 4,693 524 5,630 0 285 0 285 5,3452024 206 1,676 1,883 188 188 377 2,259 2,071 433 4,693 527 5,654 0 285 0 285 5,3682025 217 1,676 1,893 189 189 379 2,271 2,082 455 4,693 530 5,678 0 285 0 285 5,3932026 227 1,676 1,904 190 190 381 2,284 2,094 478 4,693 533 5,704 0 285 0 285 5,419NPV 932 2,364 3,296 330 330 659 3,955 3,626 1,630 6,619 879 9,129 5,779 1,650 0 7,429 1,700@
12%
Per m3 consumed 0.45 1.83 0.24 2.52 1.593898 0.455074 0 2.0489722 0.468878163
2,049 14.37%
Non-incr. = Nonincremental; Incr. = Incremental; UFWs = unaccounted for water; NTL = nontechnical losses; TL = technical losses; O&M = operation & maintenance; OCW = opportunity cost of water
Net Economic Benefits
Resource CostsEconomic Project Resource Statement
Year
EIRR =AIEC =
Water Sold UFW Gross Benefits
(in VND miIlions) (in VND miIlions)

TA 4485- VIE: Central Region Small and Medium Towns Development Project FINAL REPORT Appendix 17, page 18
June 2006
Table SA17-11. Economic Project Resource Statement, Tan Son Water Supply Development and Expansion Subproject
Total Total Non- Incr. Total NTL TL Total Water Water Non Incr. NTL Total Invest- O&M OCW Total incr. Prod. Cons. incr. Benefit ment Cost
'000m3 '000m3 '000m3 '000m3 '000m3 '000m3 '000m3 '000m3
A B C D=B+C E F G=E+F H=D+G I=D+E J K L M=J+K+L N O P Q=N+O+P R=M-Q2007 520 0 520 52 52 104 624 572 0 0 0 0 7,604 0 0 7,604 -7,6042008 546 0 546 55 55 109 655 601 0 0 0 0 17,742 0 0 17,742 -17,7422009 573 66 639 64 64 128 767 703 1,605 264 256 2,125 0 547 0 547 1,5782010 602 59 661 66 66 132 794 728 1,686 238 265 2,188 0 602 0 602 1,5862011 632 257 889 89 89 178 1,067 978 1,770 1,028 356 3,153 0 662 0 662 2,4912012 664 435 1,098 110 110 220 1,318 1,208 1,858 1,739 439 4,037 0 728 0 728 3,3092013 697 614 1,311 131 131 262 1,573 1,442 1,951 2,456 524 4,931 0 801 0 801 4,1302014 732 794 1,526 153 153 305 1,831 1,679 2,049 3,178 610 5,837 0 881 0 881 4,9562015 768 960 1,728 173 173 346 2,073 1,901 2,151 3,838 691 6,681 0 969 0 969 5,7122016 807 1,109 1,915 192 192 383 2,298 2,107 2,259 4,434 766 7,459 0 1,066 0 1,066 6,3932017 847 1,258 2,105 210 210 421 2,525 2,315 2,372 5,030 842 8,244 0 1,173 0 1,173 7,0712018 889 1,258 2,147 215 215 429 2,576 2,362 2,490 5,030 859 8,379 0 1,290 0 1,290 7,0892019 934 1,258 2,191 219 219 438 2,630 2,411 2,615 5,030 877 8,521 0 1,419 0 1,419 7,1022020 981 2,069 3,050 305 305 610 3,660 3,355 2,746 8,278 1,220 12,243 0 1,419 0 1,419 10,8242021 1,030 2,069 3,099 310 310 620 3,719 3,409 2,883 8,278 1,240 12,400 0 1,419 0 1,419 10,9812022 1,081 2,069 3,150 315 315 630 3,781 3,465 3,027 8,278 1,260 12,565 0 1,419 0 1,419 11,1462023 1,135 2,069 3,204 320 320 641 3,845 3,525 3,178 8,278 1,282 12,738 0 1,419 0 1,419 11,3192024 1,192 2,069 3,261 326 326 652 3,913 3,587 3,337 8,278 1,304 12,919 0 1,419 0 1,419 11,5002025 1,251 2,069 3,321 332 332 664 3,985 3,653 3,504 8,278 1,328 13,110 0 1,419 0 1,419 11,6912026 1,314 2,069 3,383 338 338 677 4,060 3,722 3,679 8,278 1,353 13,310 0 1,419 0 1,419 11,891NPV 5,385 4,889 10,274 1,027 1,027 2,055 12,329 11,302 12,560 19,557 3,750 35,867 20,933 5,405 0 26,338 9,529@
12%
Per m3 consumed 1.11 1.73 0.33 3.17 1.852168 0.478216 0 2.3303847 0.843123244
2,330 16.51%
Non-incr. = Nonincremental; Incr. = Incremental; UFWs = unaccounted for water; NTL = nontechnical losses; TL = technical losses; O&M = operation & maintenance; OCW = opportunity cost of water
Net Economic Benefits
Resource CostsEconomic Project Resource Statement
Year
EIRR =AIEC =
Water Sold UFW Gross Benefits
(in VND miIlions) (in VND miIlions)

TA 4485- VIE: Central Region Small and Medium Towns Development Project FINAL REPORT Appendix 17, page 19
June 2006
Table SA17-12. Economic Project Resource Statement, Ca Na Water Supply Development and Expansion Subproject
Total Total Non- Incr. Total NTL TL Total Water Water Non Incr. NTL Total Invest- O&M OCW Total incr. Prod. Cons. incr. Benefit ment Cost
'000m3 '000m3 '000m3 '000m3 '000m3 '000m3 '000m3 '000m3
A B C D=B+C E F G=E+F H=D+G I=D+E J K L M=J+K+L N O P Q=N+O+P R=M-Q2007 210 0 210 21 21 42 252 231 0 0 0 0 16,487 0 0 16,487 -16,4872008 231 0 231 23 23 46 277 254 0 0 0 0 38,469 0 0 38,469 -38,4692009 254 0 254 25 25 51 305 280 3,570 0 155 3,725 0 553 0 553 3,1722010 280 0 280 28 28 56 335 307 3,927 0 171 4,098 0 608 0 608 3,4892011 307 286 594 59 59 119 712 653 4,320 1,144 237 5,702 0 669 0 669 5,0332012 338 354 692 69 69 138 830 761 4,752 1,415 277 6,443 0 736 0 736 5,7072013 372 426 798 80 80 160 958 878 5,227 1,705 319 7,251 0 810 0 810 6,4412014 409 504 913 91 91 183 1,095 1,004 5,750 2,015 365 8,130 0 891 0 891 7,2392015 450 586 1,037 104 104 207 1,244 1,140 6,325 2,345 415 9,085 0 980 0 980 8,1052016 495 651 1,146 115 115 229 1,376 1,261 6,957 2,605 459 10,021 0 1,078 0 1,078 8,9432017 545 694 1,238 124 124 248 1,486 1,362 7,653 2,774 495 10,922 0 1,185 0 1,185 9,7372018 599 694 1,293 129 129 259 1,551 1,422 8,418 2,774 517 11,709 0 1,304 0 1,304 10,4052019 659 694 1,353 135 135 271 1,623 1,488 9,260 2,774 541 12,575 0 1,434 0 1,434 11,1412020 725 911 1,636 164 164 327 1,963 1,799 10,186 3,643 654 14,483 0 1,434 0 1,434 13,0492021 797 911 1,708 171 171 342 2,050 1,879 11,205 3,643 683 15,530 0 1,434 0 1,434 14,0962022 877 911 1,788 179 179 358 2,145 1,967 12,325 3,643 715 16,683 0 1,434 0 1,434 15,2492023 965 911 1,876 188 188 375 2,251 2,063 13,557 3,643 750 17,950 0 1,434 0 1,434 16,5162024 1,061 911 1,972 197 197 394 2,367 2,169 14,913 3,643 789 19,345 0 1,434 0 1,434 17,9112025 1,168 911 2,078 208 208 416 2,494 2,286 16,405 3,643 831 20,879 0 1,434 0 1,434 19,4442026 1,284 911 2,195 220 220 439 2,634 2,415 18,045 3,643 878 22,566 0 1,434 0 1,434 21,132NPV 3,177 2,648 5,825 582 582 1,165 6,990 6,407 39,417 10,590 2,257 52,264 45,388 5,463 0 50,851 1,413@
12%
Per m3 consumed 6.15 1.65 0.35 8.16 7.083883 0.852585 0 7.9364682 0.220551891
7,936 12.36%
Non-incr. = Nonincremental; Incr. = Incremental; UFWs = unaccounted for water; NTL = nontechnical losses; TL = technical losses; O&M = operation & maintenance; OCW = opportunity cost of water
Net Economic Benefits
Resource CostsEconomic Project Resource Statement
Year
EIRR =AIEC =
Water Sold UFW Gross Benefits
(in VND miIlions) (in VND miIlions)

TA 4485- VIE: Central Region Small and Medium Towns Development Project FINAL REPORT Appendix 17, page 20
June 2006
Table SA17-13. Economic Project Resource Statement, Gia Nghia Water Supply Development and Expansion Subproject
Total Total Non- Incr. Total NTL TL Total Water Water Non Incr. NTL Total Invest- O&M OCW Total incr. Prod. Cons. incr. Benefit ment Cost
'000m3 '000m3 '000m3 '000m3 '000m3 '000m3 '000m3 '000m3
A B C D=B+C E F G=E+F H=D+G I=D+E J K L M=J+K+L N O P Q=N+O+P R=M-Q2007 460 0 460 46 46 92 552 506 0 0 0 0 29,242 0 0 29,242 -29,2422008 506 0 506 51 51 101 607 557 0 0 0 0 68,231 0 0 68,231 -68,2312009 557 27 584 58 58 117 701 642 1,892 110 105 2,107 0 928 0 928 1,1792010 612 27 640 64 64 128 768 704 2,082 110 115 2,306 0 1,021 0 1,021 1,2862011 673 701 1,375 137 137 275 1,650 1,512 2,290 2,805 550 5,645 0 1,123 0 1,123 4,5232012 741 1,370 2,110 211 211 422 2,532 2,321 2,519 5,478 844 8,841 0 1,235 0 1,235 7,6062013 815 2,164 2,979 298 298 596 3,575 3,277 2,771 8,657 1,192 12,619 0 1,358 0 1,358 11,2612014 896 3,091 3,987 399 399 797 4,785 4,386 3,048 12,363 1,595 17,006 0 1,494 0 1,494 15,5122015 986 4,155 5,141 514 514 1,028 6,169 5,655 3,353 16,619 2,056 22,027 0 1,644 0 1,644 20,3842016 1,085 4,619 5,703 570 570 1,141 6,844 6,274 3,688 18,474 2,281 24,443 0 1,808 0 1,808 22,6352017 1,193 5,082 6,276 628 628 1,255 7,531 6,903 4,057 20,330 2,510 26,897 0 1,989 0 1,989 24,9082018 1,312 5,174 6,486 649 649 1,297 7,784 7,135 4,462 20,696 2,595 27,752 0 2,188 0 2,188 25,5652019 1,444 5,174 6,618 662 662 1,324 7,941 7,279 4,909 20,696 2,647 28,251 0 2,406 0 2,406 25,8452020 1,588 7,022 8,610 861 861 1,722 10,332 9,471 5,399 28,087 3,444 36,930 0 2,406 0 2,406 34,5242021 1,747 7,022 8,769 877 877 1,754 10,522 9,645 5,939 28,087 3,507 37,533 0 2,406 0 2,406 35,1272022 1,922 7,022 8,943 894 894 1,789 10,732 9,838 6,533 28,087 3,577 38,197 0 2,406 0 2,406 35,7912023 2,114 7,022 9,135 914 914 1,827 10,962 10,049 7,187 28,087 3,654 38,927 0 2,406 0 2,406 36,5212024 2,325 7,022 9,347 935 935 1,869 11,216 10,281 7,905 28,087 3,739 39,731 0 2,406 0 2,406 37,3242025 2,558 7,022 9,579 958 958 1,916 11,495 10,537 8,696 28,087 3,832 40,614 0 2,406 0 2,406 38,2082026 2,813 7,022 9,835 984 984 1,967 11,802 10,819 9,565 28,087 3,934 41,586 0 2,406 0 2,406 39,180NPV 6,959 17,660 24,619 2,462 2,462 4,924 29,543 27,081 20,894 70,640 9,341 100,875 80,502 9,166 0 89,667 11,208@
12%
Per m3 consumed 0.77 2.61 0.34 3.72 2.972595 0.338448 0 3.3110425 0.413857776
3,311 13.39%
Non-incr. = Nonincremental; Incr. = Incremental; UFWs = unaccounted for water; NTL = nontechnical losses; TL = technical losses; O&M = operation & maintenance; OCW = opportunity cost of water
Net Economic Benefits
Resource CostsEconomic Project Resource Statement
Year
EIRR =AIEC =
Water Sold UFW Gross Benefits
(in VND miIlions) (in VND miIlions)

TA 4485- VIE: Central Region Small and Medium Towns Development Project FINAL REPORT Appendix 17, page 21
June 2006
Table SA17-14. Economic Project Resource Statement, Ea Tling Water Supply Development and Expansion Subproject
Total Total Non- Incr. Total NTL TL Total Water Water Non Incr. NTL Total Invest- O&M OCW Total incr. Prod. Cons. incr. Benefit ment Cost
'000m3 '000m3 '000m3 '000m3 '000m3 '000m3 '000m3 '000m3
A B C D=B+C E F G=E+F H=D+G I=D+E J K L M=J+K+L N O P Q=N+O+P R=M-Q2007 180 0 180 18 18 36 216 198 0 0 0 0 9,663 0 0 9,663 -9,6632008 198 0 198 20 20 40 238 218 0 0 0 0 22,547 0 0 22,547 -22,5472009 218 0 218 22 22 44 261 240 893 0 61 954 0 433 0 433 5212010 240 0 240 24 24 48 287 264 982 0 67 1,049 0 477 0 477 5732011 264 438 702 70 70 140 842 772 1,081 1,841 295 3,216 0 524 0 524 2,6922012 290 575 864 86 86 173 1,037 951 1,189 2,413 363 3,965 0 577 0 577 3,3882013 319 724 1,043 104 104 209 1,251 1,147 1,307 3,040 438 4,785 0 634 0 634 4,1512014 351 886 1,237 124 124 247 1,485 1,361 1,438 3,723 520 5,681 0 698 0 698 4,9832015 386 1,063 1,449 145 145 290 1,739 1,594 1,582 4,466 609 6,656 0 768 0 768 5,8892016 424 1,164 1,588 159 159 318 1,906 1,747 1,740 4,889 667 7,296 0 844 0 844 6,4522017 467 1,265 1,732 173 173 346 2,078 1,905 1,914 5,312 727 7,953 0 929 0 929 7,0242018 514 1,365 1,879 188 188 376 2,255 2,067 2,106 5,735 789 8,630 0 1,022 0 1,022 7,6082019 565 1,387 1,952 195 195 390 2,342 2,147 2,316 5,825 820 8,961 0 1,124 0 1,124 7,8382020 621 1,387 2,008 201 201 402 2,410 2,209 2,548 5,825 844 9,217 0 1,124 0 1,124 8,0932021 684 1,387 2,071 207 207 414 2,485 2,278 2,803 5,825 870 9,498 0 1,124 0 1,124 8,3742022 752 1,387 2,139 214 214 428 2,567 2,353 3,083 5,825 898 9,807 0 1,124 0 1,124 8,6832023 827 1,387 2,214 221 221 443 2,657 2,436 3,391 5,825 930 10,146 0 1,124 0 1,124 9,0232024 910 1,387 2,297 230 230 459 2,756 2,526 3,730 5,825 965 10,520 0 1,124 0 1,124 9,3962025 1,001 1,387 2,388 239 239 478 2,865 2,627 4,103 5,825 1,003 10,931 0 1,124 0 1,124 9,8082026 1,101 1,387 2,488 249 249 498 2,985 2,737 4,514 5,825 1,045 11,384 0 1,124 0 1,124 10,260NPV 2,723 4,466 7,189 719 719 1,438 8,627 7,908 9,859 18,757 2,843 31,459 26,602 4,281 0 30,883 576@
12%
Per m3 consumed 1.25 2.37 0.36 3.98 3.363944 0.541308 0 3.9052521 0.072795369
3,905 12.24%
Non-incr. = Nonincremental; Incr. = Incremental; UFWs = unaccounted for water; NTL = nontechnical losses; TL = technical losses; O&M = operation & maintenance; OCW = opportunity cost of water
Net Economic Benefits
Resource CostsEconomic Project Resource Statement
Year
EIRR =AIEC =
Water Sold UFW Gross Benefits
(in VND miIlions) (in VND miIlions)

TA 4485- VIE: Central Region Small and Medium Towns Development Project FINAL REPORT Appendix 17, page 22
June 2006
Table SA17-15. Economic Project Resource Statement, Dak Mam Water Supply Development and Expansion Subproject
Total Total Non- Incr. Total NTL TL Total Water Water Non Incr. NTL Total Invest- O&M OCW Total incr. Prod. Cons. incr. Benefit ment Cost
'000m3 '000m3 '000m3 '000m3 '000m3 '000m3 '000m3 '000m3
A B C D=B+C E F G=E+F H=D+G I=D+E J K L M=J+K+L N O P Q=N+O+P R=M-Q2007 160 0 160 16 16 32 192 176 0 0 0 0 6,430 0 0 6,430 -6,4302008 176 0 176 18 18 35 211 194 0 0 0 0 15,003 0 0 15,003 -15,0032009 194 0 194 19 19 39 232 213 929 0 77 1,007 0 295 0 295 7112010 213 0 213 21 21 43 256 234 1,022 0 85 1,107 0 325 0 325 7822011 234 378 612 61 61 122 735 674 1,124 1,512 245 2,882 0 357 0 357 2,5242012 258 510 768 77 77 154 922 845 1,237 2,041 307 3,585 0 393 0 393 3,1922013 283 657 941 94 94 188 1,129 1,035 1,361 2,630 376 4,367 0 432 0 432 3,9342014 312 821 1,133 113 113 227 1,359 1,246 1,497 3,283 453 5,233 0 476 0 476 4,7572015 343 832 1,175 118 118 235 1,410 1,293 1,646 3,329 470 5,445 0 523 0 523 4,9222016 377 832 1,209 121 121 242 1,451 1,330 1,811 3,329 484 5,623 0 576 0 576 5,0482017 415 832 1,247 125 125 249 1,497 1,372 1,992 3,329 499 5,820 0 633 0 633 5,1862018 456 832 1,289 129 129 258 1,546 1,418 2,191 3,329 515 6,035 0 697 0 697 5,3392019 502 832 1,334 133 133 267 1,601 1,468 2,410 3,329 534 6,273 0 766 0 766 5,5072020 552 999 1,551 155 155 310 1,861 1,706 2,651 3,995 620 7,266 0 766 0 766 6,5002021 608 1,198 1,806 181 181 361 2,167 1,987 2,916 4,793 722 8,432 0 766 0 766 7,6662022 668 1,438 2,106 211 211 421 2,528 2,317 3,208 5,752 843 9,803 0 766 0 766 9,0372023 735 1,726 2,461 246 246 492 2,953 2,707 3,529 6,903 984 11,416 0 766 0 766 10,6502024 809 2,071 2,879 288 288 576 3,455 3,167 3,882 8,283 1,152 13,317 0 766 0 766 12,5512025 890 2,485 3,375 337 337 675 4,049 3,712 4,270 9,940 1,350 15,560 0 766 0 766 14,7932026 979 2,982 3,960 396 396 792 4,753 4,357 4,697 11,928 1,584 18,209 0 766 0 766 17,443NPV 2,421 4,090 6,510 651 651 1,302 7,812 7,161 10,260 16,359 2,491 29,110 17,702 2,918 0 20,620 8,489@
12%
Per m3 consumed 1.43 2.28 0.35 4.06 2.471833 0.40752 0 2.8793531 1.185449238
2,879 16.49%
Non-incr. = Nonincremental; Incr. = Incremental; UFWs = unaccounted for water; NTL = nontechnical losses; TL = technical losses; O&M = operation & maintenance; OCW = opportunity cost of water
Net Economic Benefits
Resource CostsEconomic Project Resource Statement
Year
EIRR =AIEC =
Water Sold UFW Gross Benefits
(in VND miIlions) (in VND miIlions)

TA 4485- VIE: Central Region Small and Medium Towns Development Project FINAL REPORT Appendix 17, page 23
June 2006
Table SA17-16. Economic Project Resource Statement, Quang Khe Water Supply Development and Expansion Subproject
Total Total Non- Incr. Total NTL TL Total Water Water Non Incr. NTL Total Invest- O&M OCW Total incr. Prod. Cons. incr. Benefit ment Cost
'000m3 '000m3 '000m3 '000m3 '000m3 '000m3 '000m3 '000m3
A B C D=B+C E F G=E+F H=D+G I=D+E J K L M=J+K+L N O P Q=N+O+P R=M-Q2007 190 0 190 19 19 38 228 209 0 0 0 0 6,430 0 0 6,430 -6,4302008 209 0 209 21 21 42 251 230 0 0 0 0 15,003 0 0 15,003 -15,0032009 230 0 230 23 23 46 276 253 1,104 0 92 1,195 0 295 0 295 9002010 253 0 253 25 25 51 303 278 1,214 0 101 1,315 0 325 0 325 9902011 278 301 579 58 58 116 695 637 1,335 1,203 232 2,770 0 357 0 357 2,4122012 306 426 732 73 73 146 879 806 1,469 1,705 293 3,467 0 393 0 393 3,0742013 337 571 908 91 91 182 1,089 999 1,616 2,285 363 4,263 0 432 0 432 3,8312014 370 737 1,107 111 111 221 1,328 1,217 1,777 2,946 443 5,166 0 476 0 476 4,6902015 407 832 1,239 124 124 248 1,487 1,363 1,955 3,329 496 5,780 0 523 0 523 5,2562016 448 832 1,280 128 128 256 1,536 1,408 2,150 3,329 512 5,991 0 576 0 576 5,4162017 493 832 1,325 133 133 265 1,590 1,458 2,365 3,329 530 6,224 0 633 0 633 5,5912018 542 832 1,374 137 137 275 1,649 1,512 2,602 3,329 550 6,481 0 697 0 697 5,7842019 596 832 1,429 143 143 286 1,714 1,571 2,862 3,329 571 6,762 0 766 0 766 5,9962020 656 999 1,655 165 165 331 1,985 1,820 3,148 3,995 662 7,805 0 766 0 766 7,0392021 722 1,198 1,920 192 192 384 2,304 2,112 3,463 4,793 768 9,025 0 766 0 766 8,2592022 794 1,438 2,232 223 223 446 2,678 2,455 3,810 5,752 893 10,455 0 766 0 766 9,6882023 873 1,726 2,599 260 260 520 3,118 2,859 4,191 6,903 1,039 12,133 0 766 0 766 11,3662024 960 2,071 3,031 303 303 606 3,637 3,334 4,610 8,283 1,212 14,105 0 766 0 766 13,3392025 1,056 2,485 3,541 354 354 708 4,250 3,895 5,071 9,940 1,417 16,427 0 766 0 766 15,6612026 1,162 2,982 4,144 414 414 829 4,973 4,558 5,578 11,928 1,658 19,163 0 766 0 766 18,397NPV 2,875 3,930 6,805 680 680 1,361 8,166 7,485 12,184 15,721 2,587 30,492 17,702 2,918 0 20,620 9,872@
12%
Per m3 consumed 1.63 2.10 0.35 4.07 2.364905 0.389891 0 2.7547957 1.318828201
2,755 17.09%
Non-incr. = Nonincremental; Incr. = Incremental; UFWs = unaccounted for water; NTL = nontechnical losses; TL = technical losses; O&M = operation & maintenance; OCW = opportunity cost of water
Net Economic Benefits
Resource CostsEconomic Project Resource Statement
Year
EIRR =AIEC =
Water Sold UFW Gross Benefits
(in VND miIlions) (in VND miIlions)

TA 4485- VIE: Central Region Small and Medium Towns Development Project FINAL REPORT Appendix 17, page 24
June 2006
Table SA17-17. EIRR Calculation and Sensitivity Analysis, Ninh Hoa Water Supply Development and Expansion Subproject
Sensitivity Analysis Scenarios
Case 1: 10% Increase in Capital CostCase 2: 10% Increase in O & MCase 3: 10 % decrease in benefitsCase 4: 10 % increase in capital costs + O&M; 10 % decrease in benefitsCase 5: delay in project benefits by one year
Yr Base Case Case 1 Case 2 Case 3 Case 4 Case 5
2007 -25,815 -28,397 -25,815 -25,815 -28,397 -25,8152008 -60,235 -66,259 -60,235 -60,235 -66,259 -60,2352009 3,838 3,838 3,751 3,368 3,281 -8662010 4,028 4,028 3,933 3,530 3,435 3,7512011 7,014 7,014 6,909 6,208 6,103 3,9332012 9,149 9,149 9,034 8,119 8,004 6,9092013 10,585 10,585 10,458 9,400 9,273 9,0342014 12,127 12,127 11,988 10,775 10,636 10,4582015 14,014 14,014 13,861 12,459 12,306 11,9882016 13,996 13,996 13,828 12,428 12,259 13,8612017 14,481 14,481 14,295 12,847 12,662 13,8282018 15,013 15,013 14,809 13,308 13,104 14,2952019 15,599 15,599 15,375 13,815 13,590 14,8092020 16,468 16,468 16,244 14,597 14,372 15,5992021 19,255 19,255 19,031 17,105 16,881 16,4682022 22,504 22,504 22,279 20,029 19,804 19,2552023 26,297 26,297 26,072 23,443 23,218 22,5042024 30,733 30,733 30,508 27,435 27,210 26,2972025 35,929 35,929 35,704 32,111 31,887 30,7332026 42,024 42,024 41,799 37,597 37,373 35,929
EIRR 12.09% 11.03% 11.96% 10.78% 9.62% 10.06%NPV 589 (6,518) (267) (7,432) (15,394) (12,103)
SV 0.88 6.88 0.71SI 113.80 14.54 140.94
NET BENEFITS (in VND millions)

TA 4485- VIE: Central Region Small and Medium Towns Development Project FINAL REPORT Appendix 17, page 25
June 2006
Table SA17-18. EIRR Calculation and Sensitivity Analysis, Van Gia Water Supply Development and Expansion Subproject
Sensitivity Analysis Scenarios
Case 1: 10% Increase in Capital CostCase 2: 10% Increase in O & MCase 3: 10 % decrease in benefitsCase 4: 10 % increase in capital costs + O&M; 10 % decrease in benefitsCase 5: delay in project benefits by one year
Yr Base Case Case 1 Case 2 Case 3 Case 4 Case 5
2007 -2,099 -2,309 -2,099 -2,099 -2,309 -2,0992008 -4,898 -5,388 -4,898 -4,898 -5,388 -4,8982009 348 348 319 285 256 -2852010 360 360 331 295 267 3482011 372 372 344 306 278 3602012 385 385 357 318 290 3722013 399 399 370 330 302 3852014 413 413 385 343 315 3992015 428 428 400 357 328 4132016 444 444 416 371 343 4282017 462 462 433 387 358 4442018 479 479 451 403 374 4622019 498 498 469 419 391 4792020 5,281 5,281 5,253 4,725 4,696 4982021 5,301 5,301 5,273 4,743 4,714 5,2812022 5,323 5,323 5,294 4,762 4,733 5,3012023 5,345 5,345 5,316 4,782 4,753 5,3232024 5,368 5,368 5,340 4,803 4,774 5,3452025 5,393 5,393 5,364 4,825 4,796 5,3682026 5,419 5,419 5,390 4,848 4,820 5,393
EIRR 14.37% 13.48% 14.14% 13.14% 12.06% 12.28%NPV 1,700 1,122 1,535 787 44 194
SV 26.55 101.14 19.31SI 3.77 0.99 5.18
NET BENEFITS (in VND millions)

TA 4485- VIE: Central Region Small and Medium Towns Development Project FINAL REPORT Appendix 17, page 26
June 2006
Table SA17-19. EIRR Calculation and Sensitivity Analysis, Tan Son Water Supply Development and Expansion Subproject
Sensitivity Analysis Scenarios
Case 1: 10% Increase in Capital CostCase 2: 10% Increase in O & MCase 3: 10 % decrease in benefitsCase 4: 10 % increase in capital costs + O&M; 10 % decrease in benefitsCase 5: delay in project benefits by one year
Yr Base Case Case 1 Case 2 Case 3 Case 4 Case 5
2007 -7,604 -8,364 -7,604 -7,604 -8,364 -7,6042008 -17,742 -19,516 -17,742 -17,742 -19,516 -17,7422009 1,578 1,578 1,523 1,365 1,311 -5472010 1,586 1,586 1,526 1,367 1,307 1,5232011 2,491 2,491 2,425 2,176 2,110 1,5262012 3,309 3,309 3,236 2,905 2,832 2,4252013 4,130 4,130 4,050 3,637 3,557 3,2362014 4,956 4,956 4,868 4,372 4,284 4,0502015 5,712 5,712 5,615 5,044 4,947 4,8682016 6,393 6,393 6,286 5,647 5,541 5,6152017 7,071 7,071 6,954 6,247 6,129 6,2862018 7,089 7,089 6,960 6,251 6,122 6,9542019 7,102 7,102 6,961 6,250 6,108 6,9602020 10,824 10,824 10,682 9,600 9,458 7,1022021 10,981 10,981 10,839 9,741 9,599 10,8242022 11,146 11,146 11,004 9,889 9,747 10,9812023 11,319 11,319 11,177 10,045 9,903 11,1462024 11,500 11,500 11,358 10,208 10,066 11,3192025 11,691 11,691 11,549 10,380 10,238 11,5002026 11,891 11,891 11,749 10,560 10,418 11,691
EIRR 16.51% 15.31% 16.27% 14.93% 13.54% 14.06%NPV 9,529 7,436 8,988 5,942 3,308 4,454
SV 37.48 186.56 28.50SI 2.67 0.54 3.51
NET BENEFITS (in VND millions)

TA 4485- VIE: Central Region Small and Medium Towns Development Project FINAL REPORT Appendix 17, page 27
June 2006
Table SA17-20. EIRR Calculation and Sensitivity Analysis, Ca Na Water Supply Development and Expansion Subproject
Sensitivity Analysis Scenarios
Case 1: 10% Increase in Capital CostCase 2: 10% Increase in O & MCase 3: 10 % decrease in benefitsCase 4: 10 % increase in capital costs + O&M; 10 % decrease in benefitsCase 5: delay in project benefits by one year
Yr Base Case Case 1 Case 2 Case 3 Case 4 Case 5
2007 -16,487 -18,136 -16,487 -16,487 -18,136 -16,4872008 -38,469 -42,316 -38,469 -38,469 -42,316 -38,4692009 3,172 3,172 3,117 2,800 2,744 -5532010 3,489 3,489 3,429 3,080 3,019 3,1172011 5,033 5,033 4,966 4,462 4,396 3,4292012 5,707 5,707 5,634 5,063 4,989 4,9662013 6,441 6,441 6,360 5,716 5,635 5,6342014 7,239 7,239 7,150 6,426 6,337 6,3602015 8,105 8,105 8,007 7,197 7,099 7,1502016 8,943 8,943 8,835 7,941 7,833 8,0072017 9,737 9,737 9,618 8,645 8,526 8,8352018 10,405 10,405 10,275 9,234 9,104 9,6182019 11,141 11,141 10,997 9,883 9,740 10,2752020 13,049 13,049 12,905 11,600 11,457 11,1412021 14,096 14,096 13,953 12,543 12,400 13,0492022 15,249 15,249 15,105 13,580 13,437 14,0962023 16,516 16,516 16,373 14,721 14,578 15,2492024 17,911 17,911 17,767 15,976 15,833 16,5162025 19,444 19,444 19,301 17,357 17,213 17,9112026 21,132 21,132 20,988 18,875 18,732 19,444
EIRR 12.36% 11.25% 12.22% 10.99% 9.80% 10.41%NPV 1,413 (3,126) 867 (3,813) (8,898) (6,275)
SV 3.26 25.97 2.63SI 30.72 3.85 37.96
NET BENEFITS (in VND millions)

TA 4485- VIE: Central Region Small and Medium Towns Development Project FINAL REPORT Appendix 17, page 28
June 2006
Table SA17-21. EIRR Calculation and Sensitivity Analysis, Gia Nghia Water Supply Development and Expansion Subproject
Sensitivity Analysis Scenarios
Case 1: 10% Increase in Capital CostCase 2: 10% Increase in O & MCase 3: 10 % decrease in benefitsCase 4: 10 % increase in capital costs + O&M; 10 % decrease in benefitsCase 5: delay in project benefits by one year
Yr Base Case Case 1 Case 2 Case 3 Case 4 Case 5
2007 -29,242 -32,166 -29,242 -29,242 -32,166 -29,2422008 -68,231 -75,054 -68,231 -68,231 -75,054 -68,2312009 1,179 1,179 1,087 969 876 -9282010 1,286 1,286 1,184 1,055 953 1,0872011 4,523 4,523 4,410 3,958 3,846 1,1842012 7,606 7,606 7,483 6,722 6,599 4,4102013 11,261 11,261 11,125 9,999 9,863 7,4832014 15,512 15,512 15,362 13,811 13,662 11,1252015 20,384 20,384 20,220 18,181 18,017 15,3622016 22,635 22,635 22,455 20,191 20,010 20,2202017 24,908 24,908 24,709 22,218 22,019 22,4552018 25,565 25,565 25,346 22,789 22,571 24,7092019 25,845 25,845 25,604 23,020 22,779 25,3462020 34,524 34,524 34,283 30,831 30,590 25,8452021 35,127 35,127 34,886 31,374 31,133 34,5242022 35,791 35,791 35,550 31,971 31,731 35,1272023 36,521 36,521 36,280 32,628 32,388 35,7912024 37,324 37,324 37,084 33,351 33,111 36,5212025 38,208 38,208 37,967 34,146 33,906 37,3242026 39,180 39,180 38,939 35,021 34,780 38,208
EIRR 13.39% 12.37% 13.28% 12.14% 11.04% 11.57%NPV 11,208 3,158 10,291 1,120 (7,846) (3,449)
SV 13.62 124.67 11.16SI 7.34 0.80 8.96
NET BENEFITS (in VND millions)

TA 4485- VIE: Central Region Small and Medium Towns Development Project FINAL REPORT Appendix 17, page 29
June 2006
Table SA17-22. EIRR Calculation and Sensitivity Analysis, Ea TLing Water Supply Development and Expansion Subproject
Sensitivity Analysis Scenarios
Case 1: 10% Increase in Capital CostCase 2: 10% Increase in O & MCase 3: 10 % decrease in benefitsCase 4: 10 % increase in capital costs + O&M; 10 % decrease in benefitsCase 5: delay in project benefits by one year
Yr Base Case Case 1 Case 2 Case 3 Case 4 Case 5
2007 -9,663 -10,629 -9,663 -9,663 -10,629 -9,6632008 -22,547 -24,802 -22,547 -22,547 -24,802 -22,5472009 521 521 477 425 382 -4332010 573 573 525 468 420 4772011 2,692 2,692 2,640 2,370 2,318 5252012 3,388 3,388 3,331 2,992 2,934 2,6402013 4,151 4,151 4,087 3,672 3,609 3,3312014 4,983 4,983 4,913 4,415 4,345 4,0872015 5,889 5,889 5,812 5,223 5,146 4,9132016 6,452 6,452 6,367 5,722 5,638 5,8122017 7,024 7,024 6,932 6,229 6,136 6,3672018 7,608 7,608 7,506 6,745 6,643 6,9322019 7,838 7,838 7,725 6,941 6,829 7,5062020 8,093 8,093 7,980 7,171 7,059 7,8382021 8,374 8,374 8,261 7,424 7,312 8,0932022 8,683 8,683 8,570 7,702 7,590 8,3742023 9,023 9,023 8,910 8,008 7,896 8,6832024 9,396 9,396 9,284 8,344 8,232 9,0232025 9,808 9,808 9,695 8,714 8,602 9,3962026 10,260 10,260 10,148 9,122 9,009 9,808
EIRR 12.24% 11.17% 12.06% 10.87% 9.66% 10.40%NPV 576 (2,085) 148 (2,570) (5,659) (3,849)
SV 2.27 13.46 1.77SI 44.03 7.43 56.49
NET BENEFITS (in VND millions)

TA 4485- VIE: Central Region Small and Medium Towns Development Project FINAL REPORT Appendix 17, page 30
June 2006
Table SA17-23. EIRR Calculation and Sensitivity Analysis, Dak Mam Water Supply Development and Expansion Subproject
Sensitivity Analysis Scenarios
Case 1: 10% Increase in Capital CostCase 2: 10% Increase in O & MCase 3: 10 % decrease in benefitsCase 4: 10 % increase in capital costs + O&M; 10 % decrease in benefitsCase 5: delay in project benefits by one year
Yr Base Case Case 1 Case 2 Case 3 Case 4 Case 5
2007 -6,430 -7,073 -6,430 -6,430 -7,073 -6,4302008 -15,003 -16,504 -15,003 -15,003 -16,504 -15,0032009 711 711 682 611 581 -2952010 782 782 750 672 639 6822011 2,524 2,524 2,489 2,236 2,200 7502012 3,192 3,192 3,153 2,833 2,794 2,4892013 3,934 3,934 3,891 3,498 3,454 3,1532014 4,757 4,757 4,710 4,234 4,186 3,8912015 4,922 4,922 4,869 4,377 4,325 4,7102016 5,048 5,048 4,990 4,485 4,428 4,8692017 5,186 5,186 5,123 4,604 4,541 4,9902018 5,339 5,339 5,269 4,735 4,666 5,1232019 5,507 5,507 5,430 4,879 4,803 5,2692020 6,500 6,500 6,423 5,773 5,697 5,5072021 7,666 7,666 7,590 6,823 6,746 6,5002022 9,037 9,037 8,960 8,056 7,980 7,6662023 10,650 10,650 10,573 9,508 9,431 9,0372024 12,551 12,551 12,474 11,219 11,142 10,6502025 14,793 14,793 14,717 13,237 13,161 12,5512026 17,443 17,443 17,366 15,622 15,545 14,793
EIRR 16.49% 15.34% 16.34% 15.07% 13.82% 13.98%NPV 8,489 6,719 8,198 5,579 3,516 3,685
SV 39.08 304.76 31.57SI 2.56 0.33 3.17
NET BENEFITS (in VND millions)

TA 4485- VIE: Central Region Small and Medium Towns Development Project FINAL REPORT Appendix 17, page 31
June 2006
Table SA17-24. EIRR Calculation and Sensitivity Analysis, Quang Khe Water Supply Development and Expansion Subproject
Sensitivity Analysis Scenarios
Case 1: 10% Increase in Capital CostCase 2: 10% Increase in O & MCase 3: 10 % decrease in benefitsCase 4: 10 % increase in capital costs + O&M; 10 % decrease in benefitsCase 5: delay in project benefits by one year
Yr Base Case Case 1 Case 2 Case 3 Case 4 Case 5
2007 -6,430 -7,073 -6,430 -6,430 -7,073 -6,4302008 -15,003 -16,504 -15,003 -15,003 -16,504 -15,0032009 900 900 871 781 751 -2952010 990 990 958 859 826 8712011 2,412 2,412 2,376 2,135 2,099 9582012 3,074 3,074 3,035 2,727 2,688 2,3762013 3,831 3,831 3,788 3,404 3,361 3,0352014 4,690 4,690 4,643 4,174 4,126 3,7882015 5,256 5,256 5,204 4,678 4,626 4,6432016 5,416 5,416 5,358 4,817 4,759 5,2042017 5,591 5,591 5,528 4,969 4,905 5,3582018 5,784 5,784 5,714 5,136 5,066 5,5282019 5,996 5,996 5,920 5,320 5,243 5,7142020 7,039 7,039 6,962 6,258 6,182 5,9962021 8,259 8,259 8,182 7,356 7,279 7,0392022 9,688 9,688 9,612 8,643 8,566 8,2592023 11,366 11,366 11,290 10,153 10,077 9,6882024 13,339 13,339 13,262 11,929 11,852 11,3662025 15,661 15,661 15,584 14,018 13,941 13,3392026 18,397 18,397 18,320 16,480 16,404 15,661
EIRR 17.09% 15.93% 16.95% 15.66% 14.40% 14.53%NPV 9,872 8,102 9,580 6,822 4,760 4,831
SV 43.81 355.31 35.54SI 2.28 0.28 2.81
NET BENEFITS (in VND millions)

TA 4485- VIE: Central Region Small and Medium Towns Development Project FINAL REPORT Appendix 17, page 32
June 2006
Table SA17-25. Calculation of Economic Costs, Cam Ranh Drainage and Wastewater Management Subproject
INVESTMENT COSTS (Constant 2006 Prices---VND million)
FINANCIAL TOTALTOTAL WITHOUT Foreign Costs ECONOMIC
PROJECT COST ITEM FINANCIAL TAX % Total % Total % Total % Total COSTS
Drainage and Wastewater managementBasecost 128,377 116,706 15% 17,506 15% 17506 45% 52,518 25% 29,177 130,127
TOTAL SUB-PROJECT COSTS 128,377 116,706 130,127
RECURRENT COSTS (VND Million)FINANCIAL TOTAL
TOTAL WITHOUT Foreign Costs ECONOMICPROJECT COST ITEM FINANCIAL TAX % Total % Total % Total % Total COSTS
Operations & Maintenance 834 759 15% 114 15% 114 45% 341 25% 190 846
SHADOW PRICING INDICES
0.602.001.001.1
10%
FINANCIAL COSTS EXCLUDING TAXUnskilled Labor Skilled Labor Local Materials
FINANCIAL COSTS EXCLUDING TAXUnskilled Labor
Taxes and Duties
Skilled Labor Local Materials
Unskilled Labor Shadow IndexSkilled Labor Shadow IndexLocal Materials Shadow IndexForeign Exchange Cost Shadow Index

TA 4485- VIE: Central Region Small and Medium Towns Development Project FINAL REPORT Appendix 17, page 33
June 2006
Table SA17-26. Calculation of Economic Costs, Tuy Hoa Drainage and Wastewater Management Subproject
INVESTMENT COSTS (Constant 2006 Prices---VND million)
FINANCIAL TOTALTOTAL WITHOUT Foreign Costs ECONOMIC
PROJECT COST ITEM FINANCIAL TAX % Total % Total % Total % Total COSTS
Drainage and Wastewater managementBasecost 164,438 149,489 15% 22,423 15% 22423 45% 67,270 25% 37,372 166,680
TOTAL SUB-PROJECT COSTS 164,438 149,489 166,680
RECURRENT COSTS (VND Million)FINANCIAL TOTAL
TOTAL WITHOUT Foreign Costs ECONOMICPROJECT COST ITEM FINANCIAL TAX % Total % Total % Total % Total COSTS
Operations & Maintenance 1,299 1,181 15% 177 15% 177 45% 531 25% 295 1,317
Assumption
SHADOW PRICING INDICES
0.602.001.001.1
10%
Local Materials Shadow IndexForeign Exchange Cost Shadow Index
Taxes and Duties
Skilled Labor Local Materials
Unskilled Labor Shadow IndexSkilled Labor Shadow Index
FINANCIAL COSTS EXCLUDING TAXUnskilled Labor Skilled Labor Local Materials
FINANCIAL COSTS EXCLUDING TAXUnskilled Labor

TA 4485- VIE: Central Region Small and Medium Towns Development Project FINAL REPORT Appendix 17, page 34
June 2006
Table SA17-27. Calculation of Economic Costs, Phan Thiet Drainage and Wastewater Management Subproject
INVESTMENT COSTS (Constant 2006 Prices---VND million)
FINANCIAL TOTALTOTAL WITHOUT Foreign Costs ECONOMIC
PROJECT COST ITEM FINANCIAL TAX % Total % Total % Total % Total COSTS
Drainage and Wastewater managementBasecost 228,626 207,842 15% 31,176 15% 31176 45% 93,529 25% 51,960 231,744
TOTAL SUB-PROJECT COSTS 228,626 207,842 231,744
RECURRENT COSTS (VND Million)FINANCIAL TOTAL
TOTAL WITHOUT Foreign Costs ECONOMICPROJECT COST ITEM FINANCIAL TAX % Total % Total % Total % Total COSTS
Operations & Maintenance 1,235 1,122 15% 168 15% 168 45% 505 25% 281 1,251
SHADOW PRICING INDICES
0.602.001.001.1
10%
FINANCIAL COSTS EXCLUDING TAXUnskilled Labor Skilled Labor Local Materials
FINANCIAL COSTS EXCLUDING TAXUnskilled Labor
Taxes and Duties
Skilled Labor Local Materials
Unskilled Labor Shadow IndexSkilled Labor Shadow IndexLocal Materials Shadow IndexForeign Exchange Cost Shadow Index

TA 4485- VIE: Central Region Small and Medium Towns Development Project FINAL REPORT Appendix 17, page 35
June 2006
Table SA17-28. Calculation of Economic Costs, Thap Cham Drainage and Wastewater Management Subproject
INVESTMENT COSTS (Constant 2006 Prices---VND million)
FINANCIAL TOTALTOTAL WITHOUT Foreign Costs ECONOMIC
PROJECT COST ITEM FINANCIAL TAX % Total % Total % Total % Total COSTS
Drainage and Wastewater managementBasecost 95,289 86,626 15% 12,994 15% 12994 45% 38,982 25% 21,657 96,588
TOTAL SUB-PROJECT COSTS 95,289 86,626 96,588
RECURRENT COSTS (VND Million)FINANCIAL TOTAL
TOTAL WITHOUT Foreign Costs ECONOMICPROJECT COST ITEM FINANCIAL TAX % Total % Total % Total % Total COSTS
Operations & Maintenance 534 485 15% 73 15% 73 45% 218 25% 121 541
SHADOW PRICING INDICES
0.602.001.001.1
10%
Local Materials Shadow IndexForeign Exchange Cost Shadow Index
Taxes and Duties
Skilled Labor Local Materials
Unskilled Labor Shadow IndexSkilled Labor Shadow Index
FINANCIAL COSTS EXCLUDING TAXUnskilled Labor Skilled Labor Local Materials
FINANCIAL COSTS EXCLUDING TAXUnskilled Labor

TA 4485- VIE: Central Region Small and Medium Towns Development Project FINAL REPORT Appendix 17, page 36
June 2006
Table SA17-29. Calculation of Economic Costs, Gia Nghia Drainage and Wastewater Management Subproject
INVESTMENT COSTS (Constant 2006 Prices---VND million)
FINANCIAL TOTALTOTAL WITHOUT Foreign Costs ECONOMIC
PROJECT COST ITEM FINANCIAL TAX % Total % Total % Total % Total COSTS
Drainage and Wastewater managementBasecost 84,000 76,363 15% 11,455 15% 11455 45% 34,364 25% 19,091 85,145
TOTAL SUB-PROJECT COSTS 84,000 76,363 85,145
RECURRENT COSTS (VND Million)FINANCIAL TOTAL
TOTAL WITHOUT Foreign Costs ECONOMICPROJECT COST ITEM FINANCIAL TAX % Total % Total % Total % Total COSTS
Operations & Maintenance 470 428 15% 64 15% 64 45% 192 25% 107 477
SHADOW PRICING INDICES
0.602.001.001.1
10%
FINANCIAL COSTS EXCLUDING TAXUnskilled Labor Skilled Labor Local Materials
FINANCIAL COSTS EXCLUDING TAXUnskilled Labor
Taxes and Duties
Skilled Labor Local Materials
Unskilled Labor Shadow IndexSkilled Labor Shadow IndexLocal Materials Shadow IndexForeign Exchange Cost Shadow Index

TA 4485- VIE: Central Region Small and Medium Towns Development Project FINAL REPORT Appendix 17, page 37
June 2006
Table SA17-30. Calculation of Economic Costs, Song Cau Drainage and Wastewater Management Subproject
INVESTMENT COSTS (Constant 2006 Prices---VND million)
FINANCIAL TOTALTOTAL WITHOUT Foreign Costs ECONOMIC
PROJECT COST ITEM FINANCIAL TAX % Total % Total % Total % Total COSTS
Drainage and Wastewater managementBasecost 33,120 30,109 15% 4,516 15% 4516 45% 13,549 25% 7,527 33,571
TOTAL SUB-PROJECT COSTS 33,120 30,109 33,571
RECURRENT COSTS (VND Million)FINANCIAL TOTAL
TOTAL WITHOUT Foreign Costs ECONOMICPROJECT COST ITEM FINANCIAL TAX % Total % Total % Total % Total COSTS
Operations & Maintenance 185 161 15% 24 15% 24 45% 73 25% 40 180
SHADOW PRICING INDICES
0.602.001.001.1
10%
Local Materials Shadow IndexForeign Exchange Cost Shadow Index
Taxes and Duties
Skilled Labor Local Materials
Unskilled Labor Shadow IndexSkilled Labor Shadow Index
FINANCIAL COSTS EXCLUDING TAXUnskilled Labor Skilled Labor Local Materials
FINANCIAL COSTS EXCLUDING TAXUnskilled Labor

TA 4485- VIE: Central Region Small and Medium Towns Development Project FINAL REPORT Appendix 17, page 38
June 2006
Table SA17-31. Summary of Benefit Estimation for the Drainage and Wastewater Treatment Subprojects
Key assumptions 1 2 3 4 5 6Unit CAM RANH TUY HOA PHAN THIET THAP CHAM GIA NGHIA SONG CAU
No of households HH 18,179 27,007 26,324 7,332 4,962 3,694Total urban land area of service area VND/ha 5,669 3,872 2,000 3,984 6,407 1,545Land price without project thousand VND 300 500 800 200 300 170Average drainage coverage % 50% 65% 70% 65% 70% 50%Impact on urban land improvement % 20% 30% 30% 25% 20% 25%Effective for beneficiaries = C12 x C13 10% 20% 21% 16% 14% 13%
Percentage of land value attributed to Project % 25% 25% 25% 20% 15% 25%
Unit CAM RANH TUY HOA PHAN THIET THAP CHAM GIA NGHIA SONG CAU
Land value
Estimate of land value without project thousand dong/m2 300 400 800 220 300 210Estimate of land value with project thousand dong/m2 375 500 1000 264 345 262.5Total Urban Land Area Improved ha 5669 3872 2000 3984 6407 1545Total Incremental Increase in urban land value million dong 4,251,750 3,872,000 4,000,000 1,752,960 2,883,150 811,125Rental value as % of capital value % 7% 7% 7% 7% 7% 7%Total Incremental Increase in Urban Land Value million dong 297,623 271,040 280,000 122,707 201,821 56,779Total Attributable to Project million dong 29,762 52,853 58,800 19,940 28,255 7,097
Estimated Annual Benefits million dong 29,762 52,853 58,800 19,940 28,255 7,097

TA 4485- VIE: Central Region Small and Medium Towns Development Project FINAL REPORT Appendix 17, page 39
June 2006
Table SA17-32. EIRR Calculation, Cam Ranh Drainage and Wastewater Management Subproject
Project Incremental Project Net Costs O & M Benefit Benefits
Yr Cost
2007 6,506 - - (6,506)2008 52,051 - - (52,051)2009 39,038 - - (39,038)2010 19,519 - - (19,519)2011 13,013 - - (13,013)2012 - 846 29,762 28,9162013 - 888 32,738 31,8502014 - 933 36,012 35,0802015 - 979 39,614 38,6342016 - 1028 43,575 42,5472017 - 1080 47,932 46,8532018 - 1133 52,726 51,5922019 - 1190 57,998 56,8082020 - 1250 63,798 62,5482021 - 1312 70,178 68,8662022 - 1378 77,196 75,8182023 - 1447 84,915 83,4692024 - 1519 93,407 91,8882025 - 1595 102,747 101,1522026 - 1675 113,022 111,347
21.08%EIRR =

TA 4485- VIE: Central Region Small and Medium Towns Development Project FINAL REPORT Appendix 17, page 40
June 2006
Table SA17-33. Economic Sensitivity Analysis, Cam Ranh Drainage and Wastewater Management Subproject
Sensitivity Analysis ScenariosCase 1: 10% Increase in Capital CostCase 2: 10% Increase in O & MCase 3: 10 % decrease in benefitsCase 4: 10 % increase in capital costs + O&M; 10 % decrease in benefitsCase 5: delay in project benefits by one year
Yr Base Case Case 1 Case 2 Case 3 Case 4 Case 5
2007 (6,506) (7,157) (6,506) (6,504) (7,157) (6,506) 2008 (52,051) (57,256) (52,051) (52,051) (57,256) (52,051) 2009 (39,038) (42,942) (39,038) (39,038) (42,942) (39,038) 2010 (19,519) (21,471) (19,519) (19,517) (21,471) (19,519) 2011 (13,013) (14,314) (13,013) (13,011) (14,314) (13,013) 2012 28,916 28,916 28,832 25,942 25,856 (846) 2013 31,850 31,850 31,762 28,579 28,488 28,874 2014 35,080 35,080 34,987 31,481 31,385 31,806 2015 38,634 38,634 38,536 34,675 34,575 35,033 2016 42,547 42,547 42,444 38,191 38,087 38,585 2017 46,853 46,853 46,745 42,062 41,952 42,495 2018 51,592 51,592 51,479 46,322 46,206 46,799 2019 56,808 56,808 56,689 51,010 50,889 51,535 2020 62,548 62,548 62,423 56,171 56,044 56,749 2021 68,866 68,866 68,734 61,850 61,717 62,486 2022 75,818 75,818 75,680 68,100 67,961 68,800 2023 83,469 83,469 83,324 74,979 74,832 75,749 2024 91,888 91,888 91,736 82,549 82,395 83,396 2025 101,152 101,152 100,993 90,880 90,718 91,812 2026 111,347 111,347 111,180 100,047 99,878 101,073
EIRR 21.08% 19.77% 21.05% 19.60% 18.29% 18.22%NPV 100,849 91,361 100,424 80,863 70,938 68,961
SV 69.05 2795.79 61.16SI 1.45 0.04 1.64
NET BENEFITS (VND MILLION)

TA 4485- VIE: Central Region Small and Medium Towns Development Project FINAL REPORT Appendix 17, page 41
June 2006
Table SA17-34. EIRR Calculation, Tuy Hoa Drainage and Wastewater Management Subproject
Project Incremental Project Net Costs O & M Benefit Benefits
Yr Cost
2007 8,334 - - (8,334)2008 66,672 - - (66,672)2009 50,004 - - (50,004)2010 25,002 - - (25,002)2011 16,668 - - (16,668)2012 - 1317 52,853 51,5362013 - 1383 58,138 56,7552014 - 1452 63,952 62,5002015 - 1524 70,347 68,8232016 - 1601 77,382 75,7812017 - 1681 85,120 83,4392018 - 1765 93,632 91,8672019 - 1853 102,995 101,1422020 - 1945 113,295 111,3492021 - 2043 124,624 122,5812022 - 2145 137,087 134,9422023 - 2252 150,795 148,5432024 - 2365 165,875 163,5102025 - 2483 182,462 179,9792026 - 2607 200,708 198,101
25.97%EIRR =

TA 4485- VIE: Central Region Small and Medium Towns Development Project FINAL REPORT Appendix 17, page 42
June 2006
Table SA17-35. Economic Sensitivity Analysis, Tuy Hoa Drainage and Wastewater Management Subproject
Sensitivity Analysis ScenariosCase 1: 10% Increase in Capital CostCase 2: 10% Increase in O & MCase 3: 10 % decrease in benefitsCase 4: 10 % increase in capital costs + O&M; 10 % decrease in benefitsCase 5: delay in project benefits by one year
Yr Base Case Case 1 Case 2 Case 3 Case 4 Case 5
2007 (8,334) (9,167) (8,334) (8,332) (9,167) (8,334) 2008 (66,672) (73,339) (66,672) (66,672) (73,339) (66,672) 2009 (50,004) (55,004) (50,004) (50,004) (55,004) (50,004) 2010 (25,002) (27,502) (25,002) (25,000) (27,502) (25,002) 2011 (16,668) (18,335) (16,668) (16,666) (18,335) (16,668) 2012 51,536 51,536 51,404 46,253 46,119 (1,317) 2013 56,755 56,755 56,617 50,944 50,803 51,470 2014 62,500 62,500 62,355 56,107 55,960 56,686 2015 68,823 68,823 68,670 61,790 61,636 62,428 2016 75,781 75,781 75,621 68,045 67,883 68,747 2017 83,439 83,439 83,271 74,929 74,759 75,701 2018 91,867 91,867 91,691 82,506 82,328 83,355 2019 101,142 101,142 100,957 90,845 90,658 91,779 2020 111,349 111,349 111,155 100,022 99,825 101,050 2021 122,581 122,581 122,377 110,121 109,915 111,252 2022 134,942 134,942 134,727 121,235 121,019 122,479 2023 148,543 148,543 148,318 133,466 133,238 134,834 2024 163,510 163,510 163,274 146,925 146,686 148,430 2025 179,979 179,979 179,731 161,735 161,485 163,392 2026 198,101 198,101 197,841 178,032 177,770 179,855
EIRR 25.97% 24.50% 25.94% 24.31% 22.86% 22.41%NPV 226,981 214,828 226,319 191,480 178,653 170,354
SV 95.04 4274.67 84.37SI 1.05 0.02 1.19
NET BENEFITS (VND MILLION)

TA 4485- VIE: Central Region Small and Medium Towns Development Project FINAL REPORT Appendix 17, page 43
June 2006
Table SA17-36. EIRR Calculation, Phan Thiet Drainage and Wastewater Management Subproject
Project Incremental Project Net Costs O & M Benefit Benefits
Yr Cost
2007 11,587 - - (11,587)2008 92,697 - - (92,697)2009 69,523 - - (69,523)2010 34,762 - - (34,762)2011 23,174 - - (23,174)2012 - 1251 58,800 57,5492013 - 1314 64,680 63,3662014 - 1380 71,148 69,7682015 - 1449 78,263 76,8142016 - 1521 86,089 84,5682017 - 1597 94,698 93,1012018 - 1677 104,168 102,4912019 - 1761 114,585 112,8242020 - 1849 126,043 124,1942021 - 1941 138,647 136,7062022 - 2038 152,512 150,4742023 - 2140 167,763 165,6232024 - 2247 184,540 182,2922025 - 2360 202,994 200,6342026 - 2478 223,293 220,815
22.65%EIRR =

TA 4485- VIE: Central Region Small and Medium Towns Development Project FINAL REPORT Appendix 17, page 44
June 2006
Table SA17-37. Economic Sensitivity Analysis, Phan Thiet Drainage and Wastewater Management Subproject
Sensitivity Analysis ScenariosCase 1: 10% Increase in Capital CostCase 2: 10% Increase in O & MCase 3: 10 % decrease in benefitsCase 4: 10 % increase in capital costs + O&M; 10 % decrease in benefitsCase 5: delay in project benefits by one year
Yr Base Case Case 1 Case 2 Case 3 Case 4 Case 5
2007 (11,587) (12,746) (11,587) (11,585) (12,746) (11,587) 2008 (92,697) (101,967) (92,697) (92,697) (101,967) (92,697) 2009 (69,523) (76,475) (69,523) (69,523) (76,475) (69,523) 2010 (34,762) (38,238) (34,762) (34,760) (38,238) (34,762) 2011 (23,174) (25,492) (23,174) (23,172) (25,492) (23,174) 2012 57,549 57,549 57,423 51,671 51,543 (1,251) 2013 63,366 63,366 63,235 56,900 56,767 57,486 2014 69,768 69,768 69,630 62,656 62,516 63,300 2015 76,814 76,814 76,669 68,990 68,843 69,699 2016 84,568 84,568 84,416 75,961 75,807 76,742 2017 93,101 93,101 92,941 83,633 83,471 84,492 2018 102,491 102,491 102,323 92,076 91,906 93,021 2019 112,824 112,824 112,648 101,367 101,189 102,407 2020 124,194 124,194 124,009 111,592 111,405 112,736 2021 136,706 136,706 136,512 122,843 122,647 124,102 2022 150,474 150,474 150,270 135,224 135,019 136,609 2023 165,623 165,623 165,409 148,849 148,633 150,372 2024 182,292 182,292 182,067 163,840 163,614 165,516 2025 200,634 200,634 200,398 180,336 180,098 182,180 2026 220,815 220,815 220,567 198,488 198,238 200,516
EIRR 22.65% 21.28% 22.62% 21.12% 19.77% 19.58%NPV 219,831 202,934 219,202 180,333 162,795 156,831
SV 78.04 4202.60 69.50SI 1.28 0.02 1.44
NET BENEFITS (VND MILLION)

TA 4485- VIE: Central Region Small and Medium Towns Development Project FINAL REPORT Appendix 17, page 45
June 2006
Table SA17-38. EIRR Calculation, Thap Cham Drainage and Wastewater Management Subproject
Project Incremental Project Net Costs O & M Benefit Benefits
Yr Cost
2007 4,829 - - (4,829)2008 38,635 - - (38,635)2009 28,976 - - (28,976)2010 14,488 - - (14,488)2011 9,659 - - (9,659)2012 - 541 19,940 19,3992013 - 568 21,934 21,3662014 - 596 24,127 23,5312015 - 626 26,540 25,9142016 - 657 29,194 28,5372017 - 690 32,113 31,4232018 - 725 35,325 34,6002019 - 761 38,857 38,0962020 - 799 42,743 41,9442021 - 839 47,017 46,1782022 - 881 51,719 50,8382023 - 925 56,891 55,9662024 - 971 62,580 61,6092025 - 1020 68,838 67,8182026 - 1071 75,722 74,651
19.68%EIRR =

TA 4485- VIE: Central Region Small and Medium Towns Development Project FINAL REPORT Appendix 17, page 46
June 2006
Table SA17-39. Economic Sensitivity Analysis, Thap Cham Drainage and Wastewater Management Subproject
Sensitivity Analysis ScenariosCase 1: 10% Increase in Capital CostCase 2: 10% Increase in O & MCase 3: 10 % decrease in benefitsCase 4: 10 % increase in capital costs + O&M; 10 % decrease in benefitsCase 5: delay in project benefits by one year
Yr Base Case Case 1 Case 2 Case 3 Case 4 Case 5
2007 (4,829) (5,312) (4,829) (4,827) (5,312) (4,829) 2008 (38,635) (42,499) (38,635) (38,635) (42,499) (38,635) 2009 (28,976) (31,874) (28,976) (28,976) (31,874) (28,976) 2010 (14,488) (15,937) (14,488) (14,486) (15,937) (14,488) 2011 (9,659) (10,625) (9,659) (9,657) (10,625) (9,659) 2012 19,399 19,399 19,345 17,407 17,351 (541) 2013 21,366 21,366 21,309 19,175 19,116 19,372 2014 23,531 23,531 23,471 21,120 21,059 21,338 2015 25,914 25,914 25,851 23,262 23,197 23,501 2016 28,537 28,537 28,471 25,619 25,551 25,883 2017 31,423 31,423 31,354 28,214 28,143 28,504 2018 34,600 34,600 34,527 31,069 30,995 31,389 2019 38,096 38,096 38,020 34,212 34,134 34,564 2020 41,944 41,944 41,864 37,672 37,590 38,058 2021 46,178 46,178 46,094 41,478 41,393 41,904 2022 50,838 50,838 50,750 45,668 45,578 46,136 2023 55,966 55,966 55,873 50,279 50,184 50,794 2024 61,609 61,609 61,512 55,353 55,254 55,920 2025 67,818 67,818 67,716 60,936 60,832 61,560 2026 74,651 74,651 74,544 67,081 66,972 67,767
EIRR 19.68% 18.41% 19.66% 18.25% 16.99% 17.00%NPV 60,837 53,795 60,565 47,451 40,125 39,473
SV 60.36 2586.97 53.55SI 1.66 0.04 1.87
NET BENEFITS (VND MILLION)

TA 4485- VIE: Central Region Small and Medium Towns Development Project FINAL REPORT Appendix 17, page 47
June 2006
Table SA17-40. EIRR Calculation, Gia Nghia Drainage and Wastewater Management Subproject
Project Incremental Project Net Costs O & M Benefit Benefits
Yr Cost
2007 4,257 - - (4,257)2008 34,058 - - (34,058)2009 25,544 - - (25,544)2010 12,772 - - (12,772)2011 8,515 - - (8,515)2012 - 477 28,255 27,7782013 - 501 31,080 30,5802014 - 526 34,188 33,6632015 - 552 37,607 37,0552016 - 580 41,368 40,7882017 - 609 45,505 44,8962018 - 639 50,055 49,4162019 - 671 55,061 54,3902020 - 704 60,567 59,8622021 - 740 66,624 65,8842022 - 777 73,286 72,5092023 - 816 80,614 79,7992024 - 856 88,676 87,8202025 - 899 97,543 96,6442026 - 944 107,298 106,354
26.80%EIRR =

TA 4485- VIE: Central Region Small and Medium Towns Development Project FINAL REPORT Appendix 17, page 48
June 2006
Table SA17-41. Economic Sensitivity Analysis, Gia Nghia Drainage and Wastewater Management Subproject
Sensitivity Analysis ScenariosCase 1: 10% Increase in Capital CostCase 2: 10% Increase in O & MCase 3: 10 % decrease in benefitsCase 4: 10 % increase in capital costs + O&M; 10 % decrease in benefitsCase 5: delay in project benefits by one year
Yr Base Case Case 1 Case 2 Case 3 Case 4 Case 5
2007 (4,257) (4,683) (4,257) (4,255) (4,683) (4,257) 2008 (34,058) (37,464) (34,058) (34,058) (37,464) (34,058) 2009 (25,544) (28,098) (25,544) (25,544) (28,098) (25,544) 2010 (12,772) (14,049) (12,772) (12,770) (14,049) (12,772) 2011 (8,515) (9,366) (8,515) (8,513) (9,366) (8,515) 2012 27,778 27,778 27,730 24,955 24,905 (477) 2013 30,580 30,580 30,530 27,474 27,422 27,754 2014 33,663 33,663 33,610 30,246 30,191 30,555 2015 37,055 37,055 37,000 33,297 33,239 33,636 2016 40,788 40,788 40,730 36,654 36,594 37,028 2017 44,896 44,896 44,835 40,348 40,285 40,759 2018 49,416 49,416 49,352 44,413 44,347 44,866 2019 54,390 54,390 54,323 48,886 48,817 49,384 2020 59,862 59,862 59,792 53,808 53,735 54,356 2021 65,884 65,884 65,810 59,223 59,147 59,827 2022 72,509 72,509 72,432 65,183 65,103 65,847 2023 79,799 79,799 79,717 71,739 71,656 72,470 2024 87,820 87,820 87,734 78,954 78,866 79,758 2025 96,644 96,644 96,554 86,892 86,800 87,777 2026 106,354 106,354 106,259 95,626 95,530 96,599
EIRR 26.80% 25.30% 26.77% 25.12% 23.65% 23.13%NPV 125,373 119,165 125,133 106,400 99,940 95,100
SV 98.80 6576.00 88.35SI 1.01 0.02 1.13
NET BENEFITS (VND MILLION)

TA 4485- VIE: Central Region Small and Medium Towns Development Project FINAL REPORT Appendix 17, page 49
June 2006
Table SA17-42. EIRR Calculation, Song Cau Drainage and Wastewater Management Subproject
Project Incremental Project Net Costs O & M Benefit Benefits
Yr Cost
2007 1,679 - - (1,679)2008 13,429 - - (13,429)2009 10,071 - - (10,071)2010 5,036 - - (5,036)2011 3,357 - - (3,357)2012 - 180 7,097 6,9182013 - 189 7,807 7,6182014 - 198 8,588 8,3902015 - 208 9,447 9,2382016 - 219 10,391 10,1732017 - 230 11,430 11,2012018 - 241 12,573 12,3322019 - 253 13,831 13,5782020 - 266 15,214 14,9482021 - 279 16,735 16,4562022 - 293 18,409 18,1162023 - 308 20,250 19,9422024 - 323 22,275 21,9522025 - 339 24,502 24,1632026 - 356 26,952 26,596
20.03%EIRR =

TA 4485- VIE: Central Region Small and Medium Towns Development Project FINAL REPORT Appendix 17, page 50
June 2006
Table SA17-43. Economic Sensitivity Analysis, Song Cau Drainage and Wastewater Management Subproject
Sensitivity Analysis ScenariosCase 1: 10% Increase in Capital CostCase 2: 10% Increase in O & MCase 3: 10 % decrease in benefitsCase 4: 10 % increase in capital costs + O&M; 10 % decrease in benefitsCase 5: delay in project benefits by one year
Yr Base Case Case 1 Case 2 Case 3 Case 4 Case 5
2007 (1,679) (1,846) (1,679) (1,677) (1,846) (1,679) 2008 (13,429) (14,771) (13,429) (13,429) (14,771) (13,429) 2009 (10,071) (11,079) (10,071) (10,071) (11,079) (10,071) 2010 (5,036) (5,539) (5,036) (5,034) (5,539) (5,036) 2011 (3,357) (3,693) (3,357) (3,355) (3,693) (3,357) 2012 6,918 6,918 6,900 6,210 6,190 (180) 2013 7,618 7,618 7,599 6,840 6,819 6,909 2014 8,390 8,390 8,370 7,533 7,511 7,609 2015 9,238 9,238 9,218 8,296 8,273 8,380 2016 10,173 10,173 10,151 9,136 9,112 9,228 2017 11,201 11,201 11,178 10,060 10,035 10,162 2018 12,332 12,332 12,308 11,077 11,051 11,189 2019 13,578 13,578 13,552 12,197 12,169 12,320 2020 14,948 14,948 14,922 13,429 13,400 13,565 2021 16,456 16,456 16,428 14,785 14,755 14,935 2022 18,116 18,116 18,086 16,277 16,246 16,442 2023 19,942 19,942 19,911 17,919 17,886 18,101 2024 21,952 21,952 21,919 19,726 19,692 19,927 2025 24,163 24,163 24,129 21,715 21,679 21,935 2026 26,596 26,596 26,561 23,903 23,865 24,146
EIRR 20.03% 18.74% 20.00% 18.59% 17.31% 17.30%NPV 22,307 19,859 22,217 17,550 15,000 14,703
SV 62.54 2867.45 55.69SI 1.60 0.03 1.80
NET BENEFITS (VND MILLION)

TA 4485- VIE: Central Region Small and Medium Towns Development Project FINAL REPORT Appendix 17, page 51
June 2006
Table SA17-44. Aggregation of Benefits, Water Supply Development and Expansion Component
Ninh Hoa Van Gia Tan Son Ca Na Gia Nghia Eat Tling Dak Mam Quang Khe Total2007 0 0 0 0 0 0 0 0 02008 0 0 0 0 0 0 0 0 02009 4,703 633 2,125 3,725 2,107 954 1,007 1,195 16,4502010 4,980 645 2,188 4,098 2,306 1,049 1,107 1,315 17,6892011 8,061 658 3,153 5,702 5,645 3,216 2,882 2,770 32,0872012 10,301 671 4,037 6,443 8,841 3,965 3,585 3,467 41,3102013 11,852 684 4,931 7,251 12,619 4,785 4,367 4,263 50,7532014 13,522 699 5,837 8,130 17,006 5,681 5,233 5,166 61,2722015 15,548 714 6,681 9,085 22,027 6,656 5,445 5,780 71,9352016 15,683 730 7,459 10,021 24,443 7,296 5,623 5,991 77,2472017 16,336 747 8,244 10,922 26,897 7,953 5,820 6,224 83,1432018 17,054 765 8,379 11,709 27,752 8,630 6,035 6,481 86,8062019 17,845 783 8,521 12,575 28,251 8,961 6,273 6,762 89,9722020 18,714 5,567 12,243 14,483 36,930 9,217 7,266 7,805 112,2242021 21,500 5,587 12,400 15,530 37,533 9,498 8,432 9,025 119,5062022 24,749 5,608 12,565 16,683 38,197 9,807 9,803 10,455 127,8662023 28,542 5,630 12,738 17,950 38,927 10,146 11,416 12,133 137,4832024 32,978 5,654 12,919 19,345 39,731 10,520 13,317 14,105 148,5692025 38,174 5,678 13,110 20,879 40,614 10,931 15,560 16,427 161,3732026 44,269 5,704 13,310 22,566 41,586 11,384 18,209 19,163 176,191
Year Total Economic Benefits (VND Millions)

TA 4485- VIE: Central Region Small and Medium Towns Development Project FINAL REPORT Appendix 17, page 52
June 2006
Table SA17-45. Aggregation of Costs, Water Supply Development and Expansion Component
Ninh Hoa Van Gia Tan Son Ca Na Gia Nghia Eat Tling Dak Mam Quang Khe Total2007 25,815 2,099 7,604 16,487 29,242 9,663 6,430 6,430 103,7702008 60,235 4,898 17,742 38,469 68,231 22,547 15,003 15,003 242,1302009 866 285 547 553 928 433 295 295 4,2032010 952 285 602 608 1,021 477 325 325 4,5952011 1,047 285 662 669 1,123 524 357 357 5,0262012 1,152 285 728 736 1,235 577 393 393 5,5002013 1,267 285 801 810 1,358 634 432 432 6,0212014 1,394 285 881 891 1,494 698 476 476 6,5952015 1,534 285 969 980 1,644 768 523 523 7,2262016 1,687 285 1,066 1,078 1,808 844 576 576 7,9202017 1,856 285 1,173 1,185 1,989 929 633 633 8,6832018 2,041 285 1,290 1,304 2,188 1,022 697 697 9,5232019 2,245 285 1,419 1,434 2,406 1,124 766 766 10,4462020 2,245 285 1,419 1,434 2,406 1,124 766 766 10,4462021 2,245 285 1,419 1,434 2,406 1,124 766 766 10,4462022 2,245 285 1,419 1,434 2,406 1,124 766 766 10,4462023 2,245 285 1,419 1,434 2,406 1,124 766 766 10,4462024 2,245 285 1,419 1,434 2,406 1,124 766 766 10,4462025 2,245 285 1,419 1,434 2,406 1,124 766 766 10,4462026 2,245 285 1,419 1,434 2,406 1,124 766 766 10,446
Total Resource Costs (VND Millions)Year

TA 4485- VIE: Central Region Small and Medium Towns Development Project FINAL REPORT Appendix 17, page 53
June 2006
Table SA17-46. EIRR Calculation and Sensitivity Analysis, Water Supply Development and Expansion Component
Sensitivity Analysis Scenarios
Case 1: 10% Increase in Capital CostCase 2: 10% Increase in O & MCase 3: 10 % decrease in benefitsCase 4: 10 % increase in capital costs + O&M; 10 % decrease in benefitsCase 5: delay in project benefits by one year
Year Base Case Case 1 Case 2 Case 3 Case 4 Case 5
2007 -103,770 -114,147 -103,770 -103,770 -114,147 -103,7702008 -242,130 -266,343 -242,130 -242,130 -266,343 -242,1302009 12,247 12,247 11,827 10,602 10,182 -4,2032010 13,094 13,094 12,634 11,325 10,866 11,8552011 27,061 27,061 26,559 23,852 23,350 12,6632012 35,810 35,810 35,260 31,679 31,129 26,5872013 44,732 44,732 44,130 39,656 39,054 35,2892014 54,678 54,678 54,018 48,550 47,891 44,1582015 64,710 64,710 63,987 57,516 56,794 54,0472016 69,327 69,327 68,535 61,603 60,811 64,0162017 74,460 74,460 73,592 66,146 65,278 68,5642018 77,283 77,283 76,331 68,602 67,650 73,6202019 79,525 79,525 78,481 70,528 69,483 76,3592020 101,778 101,778 100,733 90,555 89,511 79,5252021 109,059 109,059 108,015 97,109 96,064 101,7782022 117,419 117,419 116,374 104,633 103,588 109,0592023 127,036 127,036 125,992 113,288 112,243 117,4192024 138,122 138,122 137,078 123,265 122,221 127,0362025 150,926 150,926 149,882 134,789 133,744 138,1222026 165,744 165,744 164,700 148,125 147,081 150,926
EIRR 13.58% 12.51% 13.44% 12.24% 11.07% 11.54%NPV 43,375 14,808 39,340 6,435 (26,168) (12,512)
SV 14.72 109.71 11.82SI 6.79 0.91 8.46
NET BENEFITS (VD MILLION)

TA 4485- VIE: Central Region Small and Medium Towns Development Project FINAL REPORT Appendix 17, page 54
June 2006
Table SA17-47. Aggregation of Benefits and Costs, Drainage and Wastewter Management Component
Cam Ranh Tuy Hoa Phan Thiet Thap Cham Gia Nghia Song Cau Total Cam Ranh Tuy Hoa Phan ThietThap Cham Gia Nghia Song Cau Total2007 0 0 0 0 0 0 0 6,506 8,334 11,587 4,829 4,257 1,679 37,1932008 0 0 0 0 0 0 0 52,051 66,672 92,697 38,635 34,058 13,429 297,5422009 0 0 0 0 0 0 0 39,038 50,004 69,523 28,976 25,544 10,071 223,1572010 0 0 0 0 0 0 0 19,519 25,002 34,762 14,488 12,772 5,036 111,5782011 0 0 0 0 0 0 0 13,013 16,668 23,174 9,659 8,515 3,357 74,3862012 29,762 52,853 58,800 19,940 28,255 7,097 196,707 0 0 0 0 0 0 02013 32,738 58,138 64,680 21,934 31,080 7,807 216,378 0 0 0 0 0 0 02014 36,012 63,952 71,148 24,127 34,188 8,588 238,016 0 0 0 0 0 0 02015 39,614 70,347 78,263 26,540 37,607 9,447 261,817 0 0 0 0 0 0 02016 43,575 77,382 86,089 29,194 41,368 10,391 287,999 0 0 0 0 0 0 02017 47,932 85,120 94,698 32,113 45,505 11,430 316,799 0 0 0 0 0 0 02018 52,726 93,632 104,168 35,325 50,055 12,573 348,479 0 0 0 0 0 0 02019 57,998 102,995 114,585 38,857 55,061 13,831 383,327 0 0 0 0 0 0 02020 63,798 113,295 126,043 42,743 60,567 15,214 421,659 0 0 0 0 0 0 02021 70,178 124,624 138,647 47,017 66,624 16,735 463,825 0 0 0 0 0 0 02022 77,196 137,087 152,512 51,719 73,286 18,409 510,208 0 0 0 0 0 0 02023 84,915 150,795 167,763 56,891 80,614 20,250 561,229 0 0 0 0 0 0 02024 93,407 165,875 184,540 62,580 88,676 22,275 617,351 0 0 0 0 0 0 02025 102,747 182,462 202,994 68,838 97,543 24,502 679,087 0 0 0 0 0 0 02026 113,022 200,708 223,293 75,722 107,298 26,952 746,995 0 0 0 0 0 0 0
Cam Ranh Tuy Hoa Phan Thiet Thap Cham Gia Nghia Song Cau Total Cam Ranh Tuy Hoa Phan ThietThap Cham Gia Nghia Song Cau Total2007 0 0 0 0 0 0 0 6,506 8,334 11,587 4,829 4,257 1,679 37,1932008 0 0 0 0 0 0 0 52,051 66,672 92,697 38,635 34,058 13,429 297,5422009 0 0 0 0 0 0 0 39,038 50,004 69,523 28,976 25,544 10,071 223,1572010 0 0 0 0 0 0 0 19,519 25,002 34,762 14,488 12,772 5,036 111,5782011 0 0 0 0 0 0 0 13,013 16,668 23,174 9,659 8,515 3,357 74,3862012 846 1,317 1,251 541 477 180 4,612 846 1,317 1,251 541 477 180 4,6122013 888 1,383 1,314 568 501 189 4,842 888 1,383 1,314 568 501 189 4,8422014 933 1,452 1,380 596 526 198 5,084 933 1,452 1,380 596 526 198 5,0842015 979 1,524 1,449 626 552 208 5,338 979 1,524 1,449 626 552 208 5,3382016 1,028 1,601 1,521 657 580 219 5,605 1,028 1,601 1,521 657 580 219 5,6052017 1,080 1,681 1,597 690 609 230 5,886 1,080 1,681 1,597 690 609 230 5,8862018 1,133 1,765 1,677 725 639 241 6,180 1,133 1,765 1,677 725 639 241 6,1802019 1,190 1,853 1,761 761 671 253 6,489 1,190 1,853 1,761 761 671 253 6,4892020 1,250 1,945 1,849 799 704 266 6,813 1,250 1,945 1,849 799 704 266 6,8132021 1,312 2,043 1,941 839 740 279 7,154 1,312 2,043 1,941 839 740 279 7,1542022 1,378 2,145 2,038 881 777 293 7,512 1,378 2,145 2,038 881 777 293 7,5122023 1,447 2,252 2,140 925 816 308 7,887 1,447 2,252 2,140 925 816 308 7,8872024 1,519 2,365 2,247 971 856 323 8,282 1,519 2,365 2,247 971 856 323 8,2822025 1,595 2,483 2,360 1,020 899 339 8,696 1,595 2,483 2,360 1,020 899 339 8,6962026 1,675 2,607 2,478 1,071 944 356 9,131 1,675 2,607 2,478 1,071 944 356 9,131
Economic Benefits (VND Millions) Investment Costs (VND Millions)
Operation & Maintenance Costs (VND Millions) Total Costs (VND Millions)

TA 4485- VIE: Central Region Small and Medium Towns Development Project FINAL REPORT Appendix 17, page 55
June 2006
Table SA17-48. EIRR Calculation and Sensitivity Analysis, Drainage and Wastewter Management Component
Sensitivity Analysis ScenariosCase 1: 10% Increase in Capital CostCase 2: 10% Increase in O & MCase 3: 10 % decrease in benefitsCase 4: 10 % increase in capital costs + O&M; 10 % decrease in benefitsCase 5: Delay in project benefits by one year
Yr Base Case Case 1 Case 2 Case 3 Case 4 Case 5
2007 -37,193 -40,912 -37,193 -37,193 -40,912 -37,1932008 -297,542 -327,296 -297,542 -297,542 -327,296 -297,5422009 -223,157 -245,472 -223,157 -223,157 -245,472 -223,1572010 -111,578 -122,736 -111,578 -111,578 -122,736 -111,5782011 -74,386 -81,824 -74,386 -74,386 -81,824 -74,3862012 192,096 192,096 191,634 172,425 171,964 -4,6122013 211,536 211,536 211,052 189,898 189,414 191,8652014 232,931 232,931 232,423 209,130 208,621 211,2942015 256,479 256,479 255,945 230,297 229,763 232,6772016 282,394 282,394 281,833 253,594 253,033 256,2122017 310,913 310,913 310,325 279,233 278,645 282,1132018 342,299 342,299 341,681 307,451 306,833 310,6192019 376,838 376,838 376,189 338,505 337,856 341,9902020 414,846 414,846 414,165 372,680 371,999 376,5132021 456,671 456,671 455,956 410,289 409,573 414,5052022 502,696 502,696 501,945 451,675 450,924 456,3142023 553,341 553,341 552,553 497,218 496,430 502,3202024 609,070 609,070 608,242 547,335 546,506 552,9472025 670,391 670,391 669,521 602,482 601,613 608,6562026 737,865 737,865 736,952 663,165 662,252 669,956
EIRR 23.23% 21.85% 23.20% 21.67% 20.31% 20.08%NPV 756,178 701,942 753,860 624,005 567,451 545,423
SV 81.22 3949.36 72.16SI 1.23 0.03 1.39
NET BENEFITS (VND Millions)

TA 4485- VIE: Central Region Small and Medium Towns Development Project FINAL REPORT Appendix 17, page 56
June 2006
Table SA17-49. Aggregation of Overall Economic Benefits and Costs
Benefits Invstmnts O&M TotalCost
2007 0 140,963 0 140,9632008 0 539,672 0 539,6722009 16,450 223,157 4,203 227,3602010 17,689 111,578 4,595 116,1732011 32,087 74,386 5,026 79,4112012 238,017 0 10,111 10,1112013 267,131 0 10,863 10,8632014 299,288 0 11,679 11,6792015 333,752 0 12,564 12,5642016 365,246 0 13,525 13,5252017 399,942 0 14,569 14,5692018 435,284 0 15,703 15,7032019 473,298 0 16,935 16,9352020 533,883 0 17,260 17,2602021 583,331 0 17,600 17,6002022 638,073 0 17,958 17,9582023 698,711 0 18,334 18,3342024 765,920 0 18,728 18,7282025 840,459 0 19,142 19,1422026 923,186 0 19,577 19,577
NPV 1,691,129 828,040 63,536 891,576(@ 12%)
(VND Millions)Year

TA 4485- VIE: Central Region Small and Medium Towns Development Project FINAL REPORT Appendix 17, page 57
June 2006
Table SA17-50. Calculation of Overall EIRR and Sensitivity Analysis
Sensitivity Analysis ScenariosCase 1: 10% Increase in Capital CostCase 2: 10% Increase in O & MCase 3: 10 % decrease in benefitsCase 4: 10 % increase in capital costs + O&M; 10 % decrease in benefitsCase 5: Delay in project benefits by one year
Yr Base Case Case 1 Case 2 Case 3 Case 4 Case 5
2007 -140,963 -155,059 -140,963 -140,963 -155,059 -140,9632008 -539,672 -593,639 -539,672 -539,672 -593,639 -539,6722009 -210,910 -233,225 -211,330 -212,555 -235,290 -227,3602010 -98,484 -109,642 -98,944 -100,253 -111,871 -99,7232011 -47,324 -54,763 -47,827 -50,533 -58,474 -61,7232012 227,906 227,906 226,895 204,104 203,093 21,9762013 256,268 256,268 255,181 229,554 228,468 227,1542014 287,609 287,609 286,441 257,680 256,512 255,4522015 321,188 321,188 319,932 287,813 286,557 286,7242016 351,721 351,721 350,368 315,196 313,844 320,2282017 385,373 385,373 383,917 345,379 343,922 350,6772018 419,582 419,582 418,011 376,053 374,483 384,2392019 456,363 456,363 454,669 409,033 407,340 418,3492020 516,624 516,624 514,898 463,235 461,509 456,0382021 565,730 565,730 563,970 507,397 505,637 516,2832022 620,115 620,115 618,319 556,308 554,512 565,3732023 680,378 680,378 678,544 610,506 608,673 619,7402024 747,192 747,192 745,319 670,600 668,727 679,9832025 821,317 821,317 819,403 737,271 735,357 746,7782026 903,609 903,609 901,651 811,291 809,333 820,882
EIRR 20.25% 18.98% 20.19% 18.78% 17.50% 17.50%NPV 799,553 716,749 793,199 630,440 541,283 532,911
SV 6.32 5.94 6.39SI 15.81 16.82 15.65
NET BENEFITS (VND millions)

TA 4485-VIE: Central Region Small and Medium Towns Development Project FINAL REPORT Appendix 16, page 1
June 2006
GENDER ANALYSIS, STRATEGY AND ACTION PLAN A. INTRODUCTION
Women in the project towns are central to the procurement, utilization and management of water and WSS related activities in both home and community life. Their patterns of access, use and control of water and WSS related activities are invariably related to their status position in their families, ethnic groups/clans, and communities. In turn, the status positions of women are related to their access and control of resources like education, gainful occupation, land and other livelihood sources. These positions also shape their patterns of participation in WSS activities in the community. These gender-based patterns can be seen in the socio-economic survey results below.
Female-Headed Households
About three fourths of the households in the project towns are headed by males, which follow national trends. Compared to other Asian countries, Vietnam has a relatively high percentage (about 28 percent) of female-headed households because of its particular history. This pattern is consistently followed in most of the project towns except in Phan Tiet (45 percent), Tap Cham (41 percent) and Ca Na (39 percent). Field inquiries reveal that the relatively high percentage of female-headed households in these towns is due to high labor migration among males to urban centers to augment their rural-based livelihood sources. It must also be noted that the towns of Phan Tiet and Ca Na suffer from water-related problems like shortage of water supply and flooding. Other towns in the highlands like Dak Mam (8 percent), Gia Nghia (19 percent), Quang Khe (16 percent) seem to have lower incidence of female-headed households.
Ethnicity of Women
In terms of ethnicity, most of the household heads belong to the majority Kinh ethnic group. Notable exceptions are those from Eatling (18 percent) and Gia Nghia (9 percent) where quite a number of households belong to ethnic minority groups like the Ma and Edde, where women hold slightly higher status positions. But these towns suffer from shortage of WSS resources and women, children and other vulnerable members from poor and ethnic households experience these scarcities more, especially during the dry season.
Educational Attainment
More women (78 percent) in these project towns have low education1 compared to men (71 percent). Some towns like Ca Na (92 percent), Ninh Hoa (89 percent), Ninh Tuan (88 percent), and Quang Khe (85 percent) have unusually high percentage of women with lower education. Meanwhile, in Dak Mam the percentage of highly educated women is equal to those with low education.2 In terms of occupation, about a third of the households derive their livelihood from their farms, other agricultural sources in coastal towns from fishing activities. Other sources of household income are
1 Low education means women have reached some years of secondary education. 2 This could be a function of sampling.

TA 4485-VIE: Central Region Small and Medium Towns Development Project FINAL REPORT Appendix 16, page 2
June 2006
employment from the government, business, and formal/informal labor market. It is interesting to note that in the survey population, quite a high number of women derive their employment and livelihood from the business and service/domestic sectors. Women are likewise employed in companies involved in solid waste management where they take on varied roles like waste collection and street sweeping. One account even put the number of women employed in solid waste companies at about 98%, which indicate that it is likely that there are women occupying management positions in said companies.
Monthly Income
In terms of monthly income per capita, female households head earn lower (VND 298,000) than male household heads (VND 326,000). With the exception of Ca Na (200 percent less for females) and Eatling, Gia Nghia and Dak Mam (female household heads’ incomes are slightly higher) the income differentials among male and female household heads follow this pattern. It should be noted that the latter highland towns have high percentage of ethnic households where women occupy higher status positions compared to their coastal or lowland counterparts.
The survey also showed the wide gaps between low and high income households. The income per capita of the household head from the highest income stratum is VND 682,000 or almost seven times more than that of the lowest stratum (VND 97,000). With the exceptions of Cam Ranh, Dak Mam, Eatling, Gia Nghia and Phan Tiet, which have less than 20 percent of their households coming from the lowest income group, most of the project towns have 20-30 percent households coming from this stratum (very poor).
Household Related Activities
The division of labor in the household follow along traditional gender lines where women mostly procure water, prepare food, take care of feeding and bathing of children and teaching them hygienic practices, cleaning the house, washing laundry and taking care of the sick and the elderly members while husbands mainly take care of the building and maintaining wells and water pumps. Sharing of household tasks between husbands and wives or between males and females can be observed in decisions regarding health care and services for sick children and in the purchase of water. Husbands and children also help out in fetching water and cleaning their houses and yards.
Source of Water
The women, especially those from the lower-income strata households, have a hard time coping with their WSS-related needs and activities. Women from Ca Na (96 Percent), Cam Ranh (50 percent), Eatling, Ninh Thuan (both 23 percent), Dak Mam and Tan Son (both 20 percent) purchase their drinking water from vendors, especially during dry season. With the exception of Phan Tiet, which have high percentage of households with indoor connections, most of the households surveyed obtain their water from stand posts, boreholes, open dug wells, rainwater, ponds, rivers and open canals. A sizeable number of households from Ca Na, Cam Ranh and Eatling purchase their water for drinking and for laundry purposes as well, especially during dry season.

TA 4485-VIE: Central Region Small and Medium Towns Development Project FINAL REPORT Appendix 16, page 3
June 2006
Time Spent for Getting Water
Women and men from lower income households spend more time (20 minutes or more daily) in collecting water compared to those from higher income households (16 minutes or less). Higher income households consume more water and paid an average of VND 34,000 per month compared to those in the lower income strata (VND 17,000).
Acceptability and Willingness to Pay for Improvements
While majority are willing to pay for improvements in water supply services, quite a proportion of women from Cam Ranh (25 percent), Ninh Hoa (45 percent), Phan Tiet (56 percent) and Tuy Hoa (44 percent) are unwilling to pay for these improvements. While improvements in WSS-related services may ease their physical burden, it may also increase their burden of managing scarce resources in the household. But interestingly, when asked how much are they willing to pay per cubic meter, an overwhelming majority (95 percent) are willing to pay VND 5,000-VND 7,000 per cubic meter. The above patterns can be observed in almost all of project towns, with the exception of some households in Ca Na, Cam Ranh, Eatling, Gia Nghia and Ninh Hoa who were willing to pay VND 8,000 per cubic meter as water in these areas are really hard to procure, especially during dry season.
Sanitation and Waste Disposal
In terms of sanitation and waste disposal, majority of women from the lowest income stratum do not have toilets (60 percent). This is almost double that of the whole population (37 percent) in the project towns who do not have toilets. Women in about two-thirds of the households are responsible for disposing human excreta in buckets to farmers, fish pond owners or to the nearest stream, pond or canals. Only a third of the households have their trash collected by a waste management company while the rest find the women disposing them through burning, burying in the ground, scattering them outside or throwing them into canals, ponds and rivers. Most of them (58 percent) also dispose of their waste water to the garden, empty lots, open canals, etc. The proportion of the households who also do not want to connect waste water pipes to the public drainage system is also consistent with this pattern. But most of them, with the exception of those from Song Cau and Tan Son are willing to pay one-time fee for water connection. At the community level, majority of the waste pickers are women (alongside with some of their children) who work long hours (average of 10-12 hours) and get lower pay/earnings compared to their male counterparts. They are exposed to pollution, unhygienic conditions and practices. They also lack access to proper equipment/tools such as push carts, disposal containers, hygienic masks, gloves, boots and facilities for washing/ablutions. These women also assume crucial economic roles in their families and households propelling them to work in these unhygienic and difficult conditions.
Access to Credit Financing
While a majority of the women are willing to access credit funds for WSS-related improvements, almost a third (31 percent) do not want to access them because of the paper requirements which often times they cannot fulfill. With the exception of Cam Ranh, Song Cau and Tan Son, the Women’s Union is the most approved institution for managing credit funds for support in construction and upgrading of WSS facilities.

TA 4485-VIE: Central Region Small and Medium Towns Development Project FINAL REPORT Appendix 16, page 4
June 2006
Land Ownership
In terms of certificate of land ownership, majority of these are still in the name of the male household head. In most cases, only properties acquired after 1999 have the names of the husband and wife reflected in the certificate. The resettlement compensation package should ensure that women rights to compensation are recognized.
Participation in Community Activities
With regards to women’s roles in the public sphere, it is interesting to note that less than one-fifth (16 percent) decide on their own to participate in community activities. The rest always have to confer with their husbands, sons and other members of the household. Participation in community activities and membership in development/community-based organizations are related to income and education levels of the women. Moreover, participation in community activities means that they are able to make alternative arrangements for their household duties and roles – often possible for women with more labor and economic resources to mobilize. Women have had a defining political presence in Viet Nam through their large membership base in the Women’s Union and have become more influential in the investment decision-making of WSS-related activities and programs. It was noted that several women have already been occupying important positions in political and administrative structures (PPC, TPC) as well as among WSS service providers (PPMU, UPWC). In fact, during the PPTA, these women played major roles in project planning and design. They are expected to continue to be fully involved in subsequent activities in relation to the Project. To summarize, women are central to the provision of water-related services in the household and are mainly responsible for maintaining sanitation practices. This role however, goes beyond the household and extends to the community (to some extent even to the town and province) not only in relation to employment (as water collectors and street sweepers) but due to the fact that women are increasingly occupying important positions in the politico-administrative sphere and in companies involved in the provision of WSS services and facilities.
B. GENDER STRATEGIES AND ACTION PLAN
As shown in the above gender analysis, women play crucial roles in domestic WSS-related activities but their status, participation and decision-making roles in the public sphere, are still quite limited but emerging, given the evident participation of several women in some public organizations. This project will ensure that the roles and participation of women, especially those from resource poor areas/households and ethnic minority groups, are enhanced and their participation in decision-making activities related to WSS is maximized. This can be done by increasing their access to training and capability building programs, providing support for enhancing their livelihood sources through savings and loan activities, strengthening of WSS-related institutions, and resource/credit mobilization programs. In the process, the project becomes an instrument for social inclusion, poverty reduction and community self-reliance. Below is a summary of the key elements of gender strategies and action plan designed to achieve higher gender parity and sensitivity in the project. In particular, government institutions need to build their capabilities to become more sensitive to the needs and

TA 4485-VIE: Central Region Small and Medium Towns Development Project FINAL REPORT Appendix 16, page 5
June 2006
concerns of women, poor households and ethnic minorities, where applicable. Training and capability building programs shall develop sensitivity among male/female government officials and technical staff towards the specific WSS needs and concerns of these groups.
C. GENDER STRATEGIES IN WSS HAS THE FOLLOWING KEY ELEMENTS
• Women are crucial partners in mobilizing and organizing the community to
participate in the design, implementation, operation and management of WSS project.
• Women’s roles, perceptions and attitudes towards WSS-related activities are integrated into the design (including the soft aspects of design such as project cycle, timing and sensitivity to women’s activities) and implementation of the project.
• Consultation and participation must be sought from women of all income and ethnic groups, taking into account their differential access to resource and livelihood bases, so that it can pay attention to the special needs of poor, ethnic women and those from female-headed households. The project must ensure that their barriers to participation are minimized and that their access to water and sanitation resources is greatly improved.
• Efforts must be exerted to increase the participation and representation of women in WSS-related decision-making structures and processes at all institutional levels as survey data show that they are dominant in the domestic sphere but not in the public sphere.
• Women, especially those from female-headed, poorer and ethnic minority households are given equal, if not better/preferential, opportunities to access WSS-related services, credit support, training and capability-building activities and employment. This should be given particular attention in resource poor areas with sizeable population of ethnic minorities like Dak Nong province.
• Related to the above elements, it is important that the project make deliberate efforts to increase men’s participation in domestic WSS-related activities while increasing women’s participation in the public sphere.
• A pro-poor, gender- and ethnic minority-sensitive monitoring and assessment system must be installed along with the operation and management of community-driven WSS system.
D. SUMMARY OF GENDER ACTION PLAN AND IMPLEMENTATION
ARRANGEMENTS
The summary gender action plan (GAP) details the ways that the Project will benefit both men and women, especially those from vulnerable households, and how it will address gender, ethnic and resource disparities in the urban water supply and sanitation (UWSS) sector. The plan should decrease disparities in access to WSS resources, especially for women and other vulnerable groups (ethnic minorities, female-headed, children and the elderly, etc.). It should lower the morbidity incidence of water-borne diseases among these groups as well as increase their participation and involvement in the UWSS project.

TA 4485-VIE: Central Region Small and Medium Towns Development Project FINAL REPORT Appendix 16, page 6
June 2006
The implementation of this plan hinges on the close collaboration of the Vietnam Women’s Union (VWU) with technical assistance from an NGO with track record in UWSS, provincial and local officials, and the UWSS service providers. This section of the report focusing on how to address the specific needs of poor, elderly and ethnic minority women closely dovetails the section on community driven WSS (Component A). The following are the key strategies and activities for addressing gender needs in UWSS.
E. COMMUNITY ORGANIZATION AND MOBILIZATION FOR HEALTH AND
SANITATION
This phase involves mobilizing and organizing the community to increase their awareness regarding water supply, sanitation and health. It shall also pave the way for mobilizing resources for the support of WSS system in the community. It involves the following programs and activities: • Awareness Campaign on Project Objectives, Implementation, and Operation
and Management Systems. In this phase, the project technical and field staff together with VWU introduce the project to the relevant institutions at the provincial, town and community levels.
• Community health awareness and environmental sanitation programs and campaigns. During the propaganda period or prior to the start of the infrastructure installation, the community will be prepared to demand for better access WSS resources and services. In this phase, project staff, representatives of the government (i.e., People’s Committee, etc.) introduce the project to city/ward representatives as well as create appropriate implementation structures at this level, suitable for organizing the orientation and training activities. The project staff should ensure that at least 50 percent of the awareness campaign team is female and that participants in community meetings and campaign activities shall include both men and women, paying special attention to those coming from vulnerable areas and households. Consultations with potential water users (both men and women, especially from vulnerable households like female-headed, children, elderly, ethnic minorities and resource-poor) on their participation in the planning process, implementation, financing and contribution levels of households (HHs), and the operation and management of community water supply. During this phase, the following aspects should be paid attention to by the project staff/holders:
► Identify the priorities of water and sanitation users by gender in the service area.
► Encourage women’s participation at city/ward meetings (e.g., gender disaggregated focus groups and meetings held at a time conducive to women’s attendance).
► Different technical and design options of WSS should be explained to both women and men, especially those with low educational levels and resource capacities, prior to the actual installation of the system.
► Consider specific gender impacts on land acquisition (e.g., compensation) and environmental concerns (e.g., flooding and sanitation).
► Information and data-base used by the project (including project documentation) should be disaggregated by gender, income and ethnicity, if relevant.

TA 4485-VIE: Central Region Small and Medium Towns Development Project FINAL REPORT Appendix 16, page 7
June 2006
► Training materials shall be sensitive to the needs of both men and women from different income or resource groups. If relevant, distinct patterns of ethnic or indigenous use of water and sanitation practices shall be considered.
► The specific needs of waste pickers who are mostly women and children shall also be addressed as well as those of water collectors/fetchers who may be affected by the sub-project.
► Awareness of the links between access to potable water and diseases among men and women of different income levels shall be noted.
► Increase the participation of men in hygiene and sanitation education workshops to at least 40%.
► Environmental sanitation campaign will include household/domestic and community sanitation (e.g., schools, markets, public assembly places, tourist-frequented areas, etc.) and hygiene promotion shall emphasize roles of men and women through formal and informal structures/processes.
► Different socio-economic and ethnic groups shall be targeted in the city/ward awareness campaign and the different sanitation and hygiene needs of men and women shall be addressed.
F. CAPACITY-BUILDING AND SKILLS DEVELOPMENT
This aspect addresses the need to build the capacities of project staff/holders, local officials, water-related institutions and other relevant groups to address the needs of poor men and women and other vulnerable sectors of the population.
• Both men and women have equal access to information for participation and
opportunities for training and other capacity-building programs as well as of potential WSS-related employment opportunities through public announcements and focus groups (either joint or disaggregated by gender).
• Very poor, ethnic and females should be targeted for capacity building (increase skills to participate in WSS-related activities, e.g., health and sanitation awareness campaigns and related activities, installation, construction, and O & M of latrines, dug wells, etc.)
• About 50% of relevant capacity building opportunities/slots shall be reserved for women.
G. RESOURCE MOBILIZATION TO SUPPORT THE COMMUNITY’S DEMAND FOR
WSS SERVICES • The VWU (provided with technical assistance by an appropriate NGO, henceforth,
technical partner) shall build the capacities of men and women from resource poor households (e.g., female-headed, ethnic minorities, etc.) to mobilize and organize savings and loan groups.
• The VWU and technical partners (to include project staff) shall organize savings and loan activities and shall install functioning O & M systems.
• Special attention should be given to the needs and priorities of resource poor and vulnerable groups (waste pickers, female-headed, ethnic minorities, water collectors, etc.).

TA 4485-VIE: Central Region Small and Medium Towns Development Project FINAL REPORT Appendix 16, page 8
June 2006
H. REHABILITATION AND UPGRADING WSS SYSTEM
• Gender concerns (e.g., child safety in operation and management of WSS system, issues of affordability and access) shall be addressed prior to actual rehabilitation and upgrading of the system.
• FHHs will receive equal compensation and allowances according to the land acquisition and resettlement framework.
• Address waste pickers’ needs for capacity-building and their need for hygiene facilities for washing and ablutions in the work site. Credit and savings mobilization for the women to support their need for push carts, containers or baskets, gloves, masks, and boots or shoes. Training and other capability-building programs for the women and children in this sector.
I. CONSTRUCTION AND REHABILITATION OF LATRINES/DUG WELLS
• Specific issues that affect females (e.g., issues of privacy like separate public toilet/latrine facilities; issues of safety and access for dug wells, etc.).
• City/Town water authorities will link resource groups to private sector during preparation of contracts. Trained women resource groups shall be equally considered to certify completion of physical works, assist contractors, and provide construction services to households that are willing to pay but unable to construct/maintain latrines.
• FHHs will receive equal compensation and allowances for land acquisition and resettlement.
J. INSTITUTION BUILDING/STRENGTHENING AND SUPPORT
• Link the project to the initiatives of the gender unit within the Ministry and the VWU, the administrative levels and the People’s Committees below. Create/support appropriate unit within each institution to create institutional support and capability for addressing gender needs in UWSS.
• Gender specific UWSS needs (e.g., equal opportunity of women for opportunities for training) shall be taken into consideration
• Integrating gender sensitivity training of staff at all levels into the capability building programs for them
• Women and men shall have equal access to training and employment opportunities generated by the Project
• Gender sensitivity of private sectoral groups participating in the Project shall be considered.
• UWSS indicators should contribute to the national database on WSS and shall be disaggregated by gender, by ethnicity, and income levels where appropriate

TA 4485-VIE: Central Region Small and Medium Towns Development Project FINAL REPORT Appendix 16, page 9
June 2006
K. SUPPORT FOR UWSS POLICY AND GUIDELINES
• The MOC Gender Unit shall make sure that the national guidelines on mainstreaming gender in urban water supply and sanitation sector is observed by the Project/Project Staff and other related actors.
• Update guidelines on water use and hygiene education to reflect gender, ethnic and other concerns of vulnerable HHs in this project.
• Guidelines on community participation in UWSS will include ways to encourage women’s participation (e.g., gender-disaggregated focus groups, meeting/assembly times conducive to women’s schedules).
L. PROJECT IMPLEMENTATION ARRANGEMENTS
Since there is a gender unit in each ministry which coordinates with the Women’s Union at different political and administrative levels, these implementation arrangements is just an affirmation of the articulation of this structure at the provincial, district, town and community levels. The project staff in coordination with Women’s Union shall identify appropriate existing structures or create a new structure or 7committee that will focus on WSS and health needs and the mobilization of appropriate institutions and resources for gender and ethnic concerns, if relevant. • At least 2 members of the Provincial Project Management Unit (PPMU) shall come
from the Women’s Union and the Health Welfare Division of the government.
• At least, 1 member of the PPMU is responsible for gender-related issues.
• At least 1 member of the town people’s committee is responsible for gender/women-related issues.
• Engage gender-related consulting services during implementation to mainstream gender needs and concerns in project activities to work alongside People’s Committees and partner institutions/groups.
M. MONITORING AND EVALUATION SYSTEM
• There shall be a representative for gender concerns in the project
monitoring/assessment team or committee.
• Participatory guidelines on gender-responsive monitoring and evaluation in this project shall include gender disaggregated indicators and measures.
• Monitor project impacts and benefits using gender-disaggregated data and indicators. Survey respondents, participation, and awareness training shall also be disaggregated by gender, ethnicity and income categories, where appropriate.
• Updates on project submitted to MOC and ADB shall include gender-related concerns/issues.
• M & E specialist monitoring the project implementation shall include gender issues/concerns

TA 4485-VIE: Central Region Small and Medium Towns Development Project FINAL REPORT Appendix 15, page 1
June 2006
ETHNIC MINORITY DEVELOPMENT PLAN 1. INTRODUCTION
This Ethnic Minority Development Plan (EMDP) for the ADB Financed Central Region Small and Medium Towns Development (CSMT) Project has been prepared by project stakeholders from a variety of different ethnic minority backgrounds in the project area, local township officials, and development/community-based organizations (specifically the Vietnam Women’s Union). This endeavor has been facilitated by the Management Board for Urban Technical Infrastructure Development (MABUTIP) of the Ministry of Construction (MOC), which is the Executing Agency for the Preparatory Project of Technical Assistance (PPTA), together with both domestic and international PPTA consultants. Design of this EMDP follows a series of participatory consultations with different ethnic minority groups, especially poorer women and other vulnerable groups, such as during the PPTA financed Socioeconomic Survey facilitated from September to October 2005. In addition, a Participatory Stakeholder Workshop (PSP) was conducted in the province of Dak Nong where significant ethnic minority groups can be found in the CSMT Project towns of Dak Mam, Ea T’Ling, Quang Khe, and Gia Nghia. At the PSP, women from the different ethnic minority groups (EMG) were active in contributing to the actual preparation of this EMDP, and even where non-EMG women were involved, they stressed the importance of reaching out to all EMG as well, especially women. It was agreed at this PSP that the Project must reach out to ethnic minority groups including those who do not live in the proposed service area, if it is to effectively contribute to reducing poverty through Water Supply and Sanitation (WSS) related livelihood improvements. However, it was agreed at the PSP that the EMDP would not cover non-Project related activities. It would recognize that there are also some poor non-ethnic minority groups living in the Project towns that also need to be targeted, and it would not differentiate between EMG indigenous to the Central Highlands (Ba’Na, M’nong, Ma, Gia-rai and E-de) and those EMG exogenous to the Central Highlands (Muong, Tay, Thai, H’mong and Nung), which can also be found in some of these towns. Per the social analysis of ethnicity undertaken for this PPTA and reported on Appendix 9 of the PPTA Draft Final Report, the EMDP does recognize differences between these groups but the purpose of the EMDP is to ensure that all EMG benefit from the Project.
2. SITUATIONAL ANALYSIS
A detailed social, gender and poverty situational analysis of EMG in Dak Nong is presented in Appendix 9. The main points of this situational analysis of relevance to WSS related livelihood improvements are as follows:
• Poverty rates among EMG, especially those indigenous to Dak Nong, are
considerably higher than for non EMG1 and it is even higher if a Water Poverty Index (WPI) is utilized rather than just MOLISA criteria. Explanations for this
1 In the peri-urban ward of Bon Dru in Dak Mam town the MOLISA poverty rate is 82% compared to 2.9% in the least poor urban ward of
the same town.

TA 4485-VIE: Central Region Small and Medium Towns Development Project FINAL REPORT Appendix 15, page 2
June 2006
include the fact that EMG are less likely to be generating income in the non-agricultural sector;
• EMG are more likely to be living outside the currently defined service areas of the Project and if the Project does not address their differential needs and priorities2 it simply contributes to further levels of inequality, especially in relation to non EMG, and defeats one of the major justifications for the actual Project;
• EMG women and girls face similar burdens to their non EMG counterparts in terms of managing household-based WSS activities. However, the former are more vulnerable to seasonal variations resultant from very limited access to water suitable for human consumption. Moreover, because of lower household incomes, the opportunity cost of caring for household members affected by waterborne illnesses (especially diarrhea) among EMG proves to be proportionately greater than for non EMG women (e.g. opportunity cost of VND 45,000 per day is estimated when women have to care for sick household members);
• Improved hygiene and sanitation would improve the livelihoods of EMG. In the past, these were not major issues when EMG resided in forested areas and derived their livelihoods from forest based or upland agricultural based activities. They have become more of an issue when EMG have been absorbed into towns, albeit residing in peri-urban areas as against urban areas, although it is important to recognize this varies among the project towns (e.g. Quang Khe is more “rural” than either Dak Mam or Ea T’Ling);
• EMG women and men are able and willing to pay for WSS related activities that they consider will improve their livelihoods (e.g. can finance dug wells via savings mobilized through locally based savings and credit groups of “village banks”) but they want a menu of options they can work with in a demand driven context rather than options limited by a supply driven process.
3. COMPONENTS OF THE EMDP
The EMDP bases its sub-components on Component A – Community Driven Water Supply and Sanitation Program and through a process of community based social mobilization would facilitate the types of participation that will ensure the involvement of poorer and vulnerable EMG, especially women and girls, in the EMDP. The basis for participation is stated in the Participation Strategy/Plan designed for the overall Project (see Appendix 10 of the PPTA Draft Final Report) and for the specific participation of women and girls in the Gender Action Plan (see Appendix 12 of the PPTA Draft Final Report), both of which the PPC of Dak Nong concurs with. It has been accepted at the PSP that EMG women and girls have to be at the center of the EMDP because of the critical role they play in managing household-based WSS services. Meanwhile, it is recognized that males would also have to be targeted for the EMDP to be successful. The sub-components that this EMDP agrees upon as socially and technically realistic and viable for EMG in the four Project towns of Dak Nong are as follows:
a. Culturally Appropriate Hygiene and Sanitation Awareness Program (CAHSAP)
aims to develop a propaganda mechanism to promote environmental sanitation awareness among community residents of selected sites.
2 For instance, dug wells during the wet season because “natural” water is also the expressed cultural preference and a combination of
dug wells and storage tanks so water can be purchased in bulk in the dry season.

TA 4485-VIE: Central Region Small and Medium Towns Development Project FINAL REPORT Appendix 15, page 3
June 2006
Using a participatory approach, a community awareness plan (CAP) in each site shall be formulated. This will lay out the propaganda activities that would be carried out in the concerned community. Community residents here pertain to adults (both gender), children and the ethnic minority groups (EMG). It is important to recognize that EMG peoples have a range of indigenous beliefs relevant to water and sanitation, which need to take into account traditional habitats and ancestral territories that are not of major concern to “migrants”.
b. Community Based Sanitation Finance (CBSF) will facilitate the financing of the
propaganda activities and the WSS program identified by the community residents under the CAHSAP. Some of these interventions, such as affordable tap connections and septic tanks, are more relevant to EMG peoples living in or in very close proximity to the service area (e.g. in Ea T’ling compared to Quang Khe).
c. Demand Driven WSS Related Livelihood Improvements (DDLI) aims to assist
the urban poor access increased WSS-related livelihood opportunities particularly among EMG. These interventions would, however, be demand-driven and would therefore vary from site to site. Community discussions and agreements among EMG relating to livelihood would be incorporated in the CAP as part of the action plan.
4. SOURCES OF FINANCE
Limited loan finance (approximately US$200,000 is currently earmarked for the Project’s Component 1) will be allocated to cover the costs associated with Sub-Component 1 but this also has to cover costs for non EMG peoples in each of the four Project towns. Project towns will need to design programs within this budgetary limitation although it might be possible to leverage other sources (e.g. the private sector such as Lever and Proctor and Gamble) to provide additional financing on a philanthropic basis (i.e., similar to grant financing). To assist with the costs of social mobilization, the processes of which are described elsewhere in this EMDP, and to achieve pro-poor objectives associated with Sub-Component 3, the Provincial People’s Committee of Dak Nong will explore other sources of financing. This includes leveraging of existing government programs and the Japan Fund For Poverty Reduction (JFPR) facility, while it intends to seek consultation with the ADB in relation to the JFPR. It is anticipated that up to US$1.5 million will be sought for this purpose. This importantly is a Dak Nong initiative rather that of MABITUP. However, it also needs to be noted that non EMG peoples living in the four towns would also be targeted via this initiative. EMG Consumers will pay all investment costs for tap connections, latrines, storage tanks and dug wells from savings that they would mobilize. Poorer and more vulnerable households will be provided with support via small-scale community programs (savings and credits) to make the savings necessary to invest. No loan finance will be used for this Sub-Component 2, except to cover the costs of targeting poor and vulnerable households estimated at VND 65,000 per household.
5. IMPLEMENTATION PARTNERS
As per the Participation Strategy, a number of stakeholders will be actively involved as implementation partners. The social assessment undertaken as part of the Social, Gender and Poverty Analysis by the PPTA Consultants (Appendix 9) clearly suggests

TA 4485-VIE: Central Region Small and Medium Towns Development Project FINAL REPORT Appendix 15, page 4
June 2006
that if local EMG peoples are not involved, the EMDP will not generate the necessary livelihood improvement outputs. This will involve at least the ward head in each town where there are significant concentration of EMG peoples or the village head in the peri-urban areas. However, to ensure the active participation of women (not a problem in Quang Khe where all village heads where the ethnic Ma group are found are headed by women but more of a problem in the largest town of Gia Nghia) it has been agreed that the male head will delegate this responsibility to a nominated village woman or group of woman to achieve the necessary synergies with the EMDP. The Vietnam Women’s Union (VWU) will work with a non-government organization (NGO) possessing expertise to socially market WSS related interventions including among EMG peoples3. It will be necessary for both VWU and NGO to demonstrate how they have actively engaged EMG peoples and ensured that the latter claim ownership for interventions. Since much of the EMDP is being underwritten by a demand driven approach to WSS related livelihood improvements, this should not pose too much of a problem. It is also at this level that the private sector will be involved via the supply of and construction of individual household-financed activities such as tap connections, septic tanks, storage tanks, dug wells, and latrines. The Town People’s Committee (TPC) in each of the four Project towns will be involved. Given the higher percentage of EMG in Quang Khe, the TPC in this town is expected to assume a greater role than in a town such as Dak Mam. The TPC, as well as the Commune People’s Committee, are part of the Community Management Committee in each town that is in charge of implementing Component A activities. This would ensure that the interests of the EMG will be represented. At the provincial level the Provincial People’s Committee (PPC), as part of the Provincial Project Management Unit (PPMU), will broadly oversee the implementation of the EMDP. Provincial level organizations that will be directly or indirectly involved include the Committee of Ethnic Minorities and Mountainous Areas (CEMMA), Department of Health (DOH), and the Department of Education.
6. TIMING OF IMPLEMENTATION
This component will only be effective if preparations for its implementation are made 8 to 12 months prior to the laying of pipes for water supply, relevant drainage systems and solid waste collection. This period we can refer to as the mobilization or propaganda period. Stakeholders are aware that such an approach has worked elsewhere in Viet Nam and feel it necessary to have a series of horizontal exchanges with towns and communes where this has worked to render the EMDP less abstract and more concrete. Concurrently the VWU and NGO(s) will work with poorer and more vulnerable households to mobilize savings on a regular basis so that by the time civil works are completed these poorer and vulnerable EMG households will be in a position to pay for the cost of tap installation or storage tanks and dug wells. During the actual implementation period of from 16 to 36 months it is anticipated that households will make investments in affordable latrines. Demand driven interventions would also be implemented during this period but by their very nature should be expected to be a continuing endeavor. It is also during this period that propaganda
3 The NGO should likewise be adept with effective use of participatory tools and techniques in Viet Nam developmental contexts.

TA 4485-VIE: Central Region Small and Medium Towns Development Project FINAL REPORT Appendix 15, page 5
June 2006
activities will be continued with schools playing a leading role because good practices from elsewhere in Viet Nam demonstrate that if younger people are targeted they find it easier to make changes to existing hygiene and sanitation behavior.
7. SUSTAINABLE OUTCOMES
There are a range of sustainable outcomes that all stakeholders have agreed upon that can also be used to monitor and evaluate the success or otherwise of this EMDP. These are as follows:
• EMG peoples improve their access to water supply via dug wells or similar facilities
the wet season and a combination of dug wells and town-based water supply during the dry season (EMG peoples will have to pay for this water at agreed upon tariffs). This is especially important for women and girls who are the effective managers of access to water at the household level;
• Improved hygiene and sanitation awareness among EMG peoples leads to a reduction in waterborne diseases and the opportunity to invest what money is spent on healthcare (and the opportunity cost of caring for ill household members) on other livelihood based activities. This is also especially important for women because it is they (especially in EMG households in Dak Nong) who typically have to manage household finances;
• Market-driven demand for latrines and water tanks (or other WSS related interventions) leads to the development of specific construction skills and business development skills among EMG peoples that do not exist at present thereby enhancing the entrepreneurial skills of EMGP. If developed in ways that also included women, this could foster a greater level of entrepreneurship;
• EMG women and girls spend less time collecting water, which is also sometimes a hazardous activity during the wet season in some of the towns, and a time consuming process during the dry season; and women and girls spend less time having to provide care for other household members suffering from waterborne diseases. This would have accorded them with time to spend for more productive pursuits.
8. MANAGING POSSIBLE RISKS
The major risk is that the innovative public-civil society partnership built into the EMDP does not prove very effective. EMDP stakeholders are aware that this is a new approach in the Central Highlands. It also very difficult for infrastructure driven public agencies to fully embrace such an approach but the PPC in Dak Nong wants to see the approach work but needs to understand what “cultural” changes are necessary. To this end this is why horizontal study tours to other areas of Viet Nam where at least one NGO (International Development Enterprise) has successfully implemented a number of sustainable projects will need to be supported. The VWU has primarily functioned as a guarantor of small loans to local women and has little experience in the approaches being delegated to it in this EMDP. However, an important underlying bias of this EMDP is the experiential approach to learning it will adopt. Dak Nong is Viet Nam’s newest province and VWU representatives (including EMG office bearers) appear especially keen to embrace creative and innovative

TA 4485-VIE: Central Region Small and Medium Towns Development Project FINAL REPORT Appendix 15, page 6
June 2006
approaches to livelihood improvement. An NGO such as IDE has been working with VWU on a variety of joint investment projects including the sustainable provision of sanitation technologies and services for improved hygiene in Central Viet Nam. The challenge for this EMDP is to adapt this successful approach to EMG in Dak Nong. There is some concern that EMG peoples will not accept the approaches being advocated in this EMDP even though they were said to have agreed in principle to accept the approaches. This means that for instance the 100 percent total sanitation approach being proposed will be less than effective. However, the EMDP has been prepared based on EMG people’s needs and priorities while the social marketing approach is designed to generate demand driven outcomes. The important principle underlying this EMDP is that it is based on generating sustainable livelihood outcomes for EMG peoples living in the four Project towns. The PPC and other Project stakeholders are not seeking the financing of interventions that neither government nor local EMG communities cannot afford to largely self-finance. Loan and grant financing sought as part of this EMDP are largely for enabling purposes only. All household-based WSS services will be met by EMG peoples because they need to be grounded in what the latter prioritize. In this respect, the EMG peoples become consumers rather than beneficiaries.

TA 4485-VIE: Central Region Small and Medium Towns Development Project FINAL REPORT Appendix 14, page 1
June 2006
PARTICIPATION STRATEGY
I. INTRODUCTION
The principle of participation is being espoused in many, if not all, development projects particularly those that are community based. This is for the fact that participatory planning, implementation, monitoring, and indeed, project management, leads to sustainable projects as ownership and incentive issues are addressed and perspectives from all angles that matter get heard. Outlining who should be involved, in what manner, how the benefits of participation can be assessed, the level of stakeholder commitment, and what resources are required for achieving project objectives comprise the Participation Strategy. Said document is aimed at promoting transparency, success, sustainability; prevent delays; and manage conflicts. Stakeholder analysis and a close examination of the context and institutions involved to create a systematic plan of action for each phase of the Project is necessary. A successful participation strategy must enable stakeholders to not just come to an agreement, but to become meaningfully committed. This Participation Strategy will identify each stakeholder group ranging from the central ministry responsible for disbursing loan and grant finance (Ministry of Finance) to possibly poorer and vulnerable groups in the smaller towns. The Participation Strategy will outline the reasons why each of these stakeholder groups is included. It will identify the type of participation ranging from the superficial processes associated with information-sharing, consultation and subsequent feedback, to the deeper processes associated with collaborative/joint decision-making and empowerment/shared control. It will then look at the types of participation methods being suggested ranging from participatory rapid assessment (PRA) to workshops and meetings, and who will be responsible for generating the participatory outcomes using these methods. The Participation Strategy will also need to be time-bound with a definitive starting date and definitive completion date consistent with the activities associated with design, implementation and evaluation of this project. Implementing the participation strategy entails cost and such estimates should likewise be incorporated into the overall financing package of the project. It needs to be noted that this Participation Strategy builds upon TA-based activities. The socio-economic criteria includes minimum poverty levels, beneficiary willingness to pay, resettlement impacts, and the Government of Vietnam’s development needs and priorities as they relate to poverty and social-based issues for urban infrastructure projects of this nature. The timeline for developing the Participation Strategy revolved around activities leading up to the Interim Workshop in early November 2005. It was at this stage that stakeholders other than the central, provincial and township based agencies, especially beneficiaries such as poorer and vulnerable groups (women, elderly, disabled, unregistered rural migrants, and ethnic minority people) were included in the core foci of this Participation Strategy. Importantly, the Government via the Comprehensive Poverty Reduction and Growth Strategy (CPRGS) has advocated a number of important approaches that assisted in the formulation of this Participation Strategy. The CPRGS argues inter alia that it is necessary to enhance “grassroots democracy” and ensure that people will be provided with adequate information about economic activities, planned targets, and financial resources for development projects and programs in their localities. The CPRGS further argues that people are entitled to comment and contribute to the development of these

TA 4485-VIE: Central Region Small and Medium Towns Development Project FINAL REPORT Appendix 14, page 2
June 2006
projects and programs, to take part in its implementation, operations and maintenance, contribute their labor to these projects and programs, and express their ownership with a view to increasing their responsibilities in utilizing and managing the projects. The CPRGS’ “participation strategy” is also premised on two-way information supply and exchange between the government and people through the application of measures such as the mass media, door-to-door communication, direct approaches, community radio, television and videos. Local authorities are implored to listen to, receive, and act upon people’s views and comments. The CPRGS’ “participation strategy” notes that particular attention must be given to vulnerable groups (women, elderly, disabled and ethnic minorities) and mechanisms must be established to ensure they are able to voice their opinions and make known their priorities. It is clear that Vietnam’s existing political culture is supportive of information-sharing and consultation/feedback approaches which, while better than a non-participatory political culture, is still at the shallower end of the continuum in relation to depth of participation. It is therefore, the purpose of this Participation Strategy to develop a workable approach where synergies can be achieved given the underlying context where it has to operate.
II. IDENTIFICATION OF AND OBJECTIVE OF INTERVENTION BY STAKEHOLDER GROUPS
A. National Level
At the national level, the Government has designated the Ministry of Construction (MOC) as the Executing Agency, which authorized the Management Board of Urban Technical Infrastructure Development Projects (MABUTIP) to manage the implementation phase of the PPTA. It is intended that once the loan is approved and becomes effective, management of the ensuing loan project will be vested in provincial and township authorities. A Central Project Steering Committee (CPSC) will be established to which the Project Coordination Unit (PCU) of MABUTIP will act as secretariat, coordinating and facilitating Project implementation. Similarly, the Ministry of Finance (MOF) as the primary agency in charge of overseeing the utilization of ODA has the task of disbursing loan monies to the imprest accounts at the township level. The MOF will also promote and safeguard accountability and transparency at this branch.
B. Provincial Level
The Provincial People’s Committee (PPC) is the decision-making and directive body at the provincial level. It is here that the Class IV provincial towns of Gia Nghia and Cam Ranh and the Class III cities of Tuy Hoa, Phan Thiet, and Phan Rang-Thap Cham are located. The PPC has authorized the Provincial Project Management Units (PPMUs) to manage the implementation activities of the Project. The PPMUs and the Project Preparation Units (PPUs) assisted the PPTA consultants undertake the technical work necessary for project design. The Department of Planning and Investment, Department of Construction, Department of Health, Department of Finance, and Department of Environment and Natural Resources have been asked to render assistance within their mandated brief and

TA 4485-VIE: Central Region Small and Medium Towns Development Project FINAL REPORT Appendix 14, page 3
June 2006
sphere of competency by the Project. These departments are likely to be represented on the Provincial Steering Committee. In relation to the management of water supply, drainage/wastewater, and solid waste, operating entities such as the Water Supply Companies, Public Works Companies, and Urban Environmental Companies are in charge of providing services to the 11 small towns. These entities are not considered to be semi-autonomous because all operational decisions are made at the provincial level. Depending on the water supply and sanitation (WSS) related services and facilities that will be constructed based on the demand of the residents of the project sites themselves, it is planned that subproject design, implementation and O&M will be managed community groups with the assistance of NGOs and People’s Committees. However, another option is for the utility companies to also assume management of the subprojects. In Dak Nong, where there are significant upland indigenous ethnic minority groups, a Committee for Ethnic Minorities and Mountainous Areas (CEMMA) maintains an office in the area, but it is focused on ethnic minorities in the rural areas rather than in the urban and peri-urban areas of Dak Nong. It is unclear as to what role it would play in a project of this nature but given the increasing tendency of cyclical migration to urban areas an argument exists for its inclusion on at least the Provincial Steering Committee in the province of Dak Nong. Development organizations at the provincial level include the Veteran’s Association and the Vietnam Women’s Union, which are organized under the Fatherland Front. These organizations have not made any input into the actual PPTA, except on an informal basis. Nevertheless, the VWU has been consulted at the provincial level, district and township level and there are ongoing discussions as to its more active involvement in the subproject design, implementation and OM of various WSS interventions, including the propaganda program and the livelihood-related WSS Micro-Finance Program (Component A: Community-Driven Water Supply and Sanitation Program).
C. District Level
The District People’s Committee (DPC) is the decision-making and directive body at the district level. It is typically located in the largest town or township of the district making it the center of administrative and political power at this level. These towns/townships (small towns) range in size from 3,500 persons (Quang Khe in Dak Man District of Dak Nong Province) to 32,800 persons (La Gi in Ham Tan District of Binh Thuan Province) and are administered by its respective Township People’s Committee (TPC) which, in turn, is under the DPC. There will be one (1) Provincial PMU per province (PPMU), but it will include at least one representative from the DPC/TPC or its WSS company. Each DPC/TPC will also have at least one member represented in the Provincial Steering Committee.
D. Township or Commune Level
The Township People’s Committee (TPC) or the Commune People’s Committee (CPC) is the decision-making and directive body at the township and commune level, respectively. This Project is generally targeted at urban wards within the three (3) Class III cities (“Thanh Pho”) and two (2) Class IV provincial towns (“Thixa”) as well as the 12 small towns identified as part of the scope of services for the PPTA. For Component A of this Project, a Community Management Committee (CMC) shall be created in each towns covered by the Project to be in charge of the component’s overall management

TA 4485-VIE: Central Region Small and Medium Towns Development Project FINAL REPORT Appendix 14, page 4
June 2006
and implementation. The CMC shall be coordinated by the senior member of the provincial VWU. Representatives from the PPMU and URENCO will be additional members of the CMC.
E. Development/Community-Based Organizations
Typically, the development organization identified as being most effective to work with on projects of this nature is the Vietnam Women’s Union. This is due to its leading role in mobilizing women to leverage a range of services including improved reproductive health approaches, access to microfinance to some extent and in the context of this project, improved environmental health and household-based sanitation. The VWU has an office at the provincial level, a much smaller office at the district level, and might normally only have 1 or 2 full-time/part-time officials at the township or commune level. However, it has mass-based membership at the commune level as borne out by the socioeconomic survey in project sites. Thus, it is likely that this project would be working with the VWU at all levels because many of the interventions are locality specific, to take advantage of its years of development and organizing experience and its membership base. Still it is recognized that some services under the Project require specialized expertise that certain non-governmental organizations (NGOs) may have the comparative advantage over the VWU. The Project is being designed therefore, particularly Component A, to involve NGOs with the expertise required under specific sub-components to work with the VWU.
F. Beneficiary Stakeholders
This is the most important stakeholder group in terms of benefits to be derived from the actual project. This group will consist of all men and women, boys and girls, poor and vulnerable groups (especially poorer women, unregistered migrants in the three provincial cities of the project area, the elderly, physically and intellectually impaired, unemployed and under-employed, and ethnic minority groups) to the extent possible as the scope and resources of the Project would allow. The social assessment is likely to reveal that many of these groups are unorganized (many women in the communes are members of the local chapter of the VWU) and to make the project work for them it will be necessary to facilitate participatory strategies associated with social mobilization to demonstrate the practical livelihood improvement outcomes of being involved in the project.
III. TYPE OF PARTICIPATION BY EACH STAKEHOLDER GROUP A. National Level
MABUTIP has played an important role in managing the overall implementation of the PPTA and will assume an important consultation role during project implementation. A PCU will be set up in MABUTIP to facilitate and coordinate Project implementation. This is consistent with past ADB and other ODA-financed projects of a similar nature and is consistent with Government policies associated with decentralization to the lowest practical or politically acceptable unit of implementation, which for the most part means either the district or possibly the township level, and in rarer instances the commune level.

TA 4485-VIE: Central Region Small and Medium Towns Development Project FINAL REPORT Appendix 14, page 5
June 2006
The participation of the MOF is qualitatively different to that of the MABUTIP due to the former’s indirect involvement in the Project. Meanwhile, the PPMU will have some control over the funds coming from the MOF.
B. Provincial Level
The PPMU will be created in each of the five provinces and it will be at this level that loan monies will be disbursed to the subprojects at the city and town levels as well as township/commune levels. It will be at the PPMU where the imprest account is maintained although this might or should vary for non-loan based financing such as grant finance if it is to be disbursed for community-based interventions. However, the PPMU will need to have representatives of both the districts and townships and relevant development organizations (typically the VWU) involved in decision-making relating to implementation processes including the timely disbursement of loan monies. In Dak Nong, CEMMA should also be represented in the PPMU if the social assessment demonstrates there are ethnic minority groups in the town of Gia Nghia and smaller towns of Ea Tling, Dak Mam, and Quang Khe. The participation of CEMMA ranges from information-sharing through joint decision-making. In terms of the depth of participation, this involves cities/ towns/ districts/ townships/ communes and development organizations in a collaborative/joint decision making process and even a form of shared control. In as much as the DPC/TPC/CPC and VWU is representative of stakeholders (DPC/TPC/CPC of party members elected or appointed to their positions and VWU appointed or elected by local women) it is possible to depict this as a form of empowerment of sub-provincial administrative and political agencies and mass organizations.
C. District Level
The DPC as per above will exercise forms of collaboration/joint decision making and empowerment/shared control but it also has to be noted that in terms of technical expertise for all but minor interventions this capacity is unlikely to exist in most towns, especially the smaller towns. However, one of the underlying rationale for projects of this nature is that by developing urban infrastructure in larger urban centers first there is supposed to be a flow on effect to smaller towns. Hence, if this project is to facilitate greater empowerment of township based technical officials, then it is necessary to provide as much hands-on experience for these officials as is possible without compromising technical quality.
D. Township/Commune Level
The TPC/CPC will need to be represented on the PPMU. Even more so than the DPC – except where the DPC might be located in one of the district towns targeted by this project – it is most unlikely that the technical capacity to implement the more technical interventions associated with engineering design and construction will reside at this level. Collaboration/joint decision making and empowerment/shared control participation strategies exist ipso facto because the TPC/CPC will also be represented on the PPMU and can ensure that loan monies allocated to subprojects in their towns/communes are actually disbursed. It also needs to be noted that the People’s Inspection Committee plays an important role in ensuring accountability and transparency at the

TA 4485-VIE: Central Region Small and Medium Towns Development Project FINAL REPORT Appendix 14, page 6
June 2006
township/commune level and often undertakes this activity jointly with the Fatherland Front and the Veteran’s Organization.
E. Development/Community-Based Organizations
The VWU will be the major development organization involved although as noted above the Fatherland Front and Veteran’s Organization have a role to play in the inspection of public infrastructure development financed via Government sources. It will play a leading role in Component A because of its demonstrated capacity to reach out to women (a possible exception is to ethnic minority women but in the context of the towns in Dak Nong this needs to be further assessed). VWU will also be represented on the PPU. However, based on past opposition by PPC in other loan projects of a similar nature it is unlikely if the MOF will agree to directly disburse loan monies directly to the VWU. Whether this also applies to grant financing is another question even though it is strongly recommended that a reassessment of the capacity of the WWU in each province (where several districts will be involved) and at the district and commune level be undertaken. Specialist NGOs will work jointly with the VWU in operationalizing Component A.
F. Beneficiary Stakeholders
Sub-groups of beneficiary stakeholders will not be directly represented in the PPU so are not able to directly control or influence the disbursement of loan monies. To achieve effective shared responsibility and control, representatives of these sub-groups should be directly represented on the PPU. However, in Vietnam’s present political context, this is still not the norm. At the very most, such stakeholders are likely to be informed on the subprojects that are likely to begin in their locality via public announcements and through the Project’s community awareness programs and activities. However, sub-groups of beneficiary stakeholders should be able to exercise greater forms of control and empower themselves if the project designs a series of interventions, particularly in relation to simple construction work like street tertiary drains of less than 600 mm and footpaths. These sub-groups could be involved in latrine construction, although stakeholder acceptance of communal toilets especially in the smaller towns is not likely to be very high. Similarly, these sub-groups could be contracted by WSC or their equivalent to provide periodic maintenance of WSS facilities. Ideally, poorer and vulnerable groups should be targeted via an intervention of this nature because it provides possible sustainable livelihood outcomes that do not exist at present. This is in addition to their involvement as members of local WUs and sub-project committees that may be created for purposes of implementing/managing sub-projects. If one of the major demands from the surveys emerges that beneficiary stakeholders are very interested in improving household based sanitation facilities (notably indoor bathroom/latrines), it might be possible to secure access to affordable sources of credit via the providers of microfinance. For flexibility and more rapid disbursement, the control of such finance should not rest with the PPMU but rather with a development organization such as the VWU, which may purchase bulk-funds at discounted rates and provide easier access to microfinance based on considerations other than physical asset collateral (e.g. social collateral). This does not empower sub-groups of poor and vulnerable women seeking access to microfinance but it at least does not result in poor and vulnerable women being further disempowered because they cannot successfully access existing providers of microfinance services.

TA 4485-VIE: Central Region Small and Medium Towns Development Project FINAL REPORT Appendix 14, page 7
June 2006
Alternatively or as a complementary activity to that described above, grant funding that applies the principles of revolving fund financing for a range of WSS-related livelihood activities driven by community-based demands, would facilitate greater levels of participation in the Project. Such funding, if targeted specifically at poorer and more vulnerable groups, especially women given their central role in managing household-based WSS, would not only be pro-poor in nature but would improve the livelihoods of women and their other household members. It is likely based on past experience that the VWU would play a leading role in jointly managing such a grant funding program with local women but the possibility of other civil society involvement should not be ruled out.
There are precedents from other ODA-financed projects in Vietnam (e.g. the International NGO International Development Enterprises that has been working with 54,000 rural households in Thanh Hoa and Quang Nam) involving towns of similar size to those in this project: the difference being they have been classified as rural towns or communes and are included in projects that were designed under MARD rather than MOC management. However, it also needs to be noted that NGOs treats the rural poor (or would treat the urban poor similarly) as customers rather than beneficiaries because its approach is based on being fully market-driven, offering customers no capital cost subsidies and using external resources for catalyzing improvements for sanitation and promotion of improved hygiene behaviors. The section outlining Component A presents implementing arrangements for the three sub-components, which include community-based financing options that more or less capture the above principles.
IV. PARTICIPATION METHODS A. National Level
The Government via any specific assurances that form part of the loan covenant will exercise control typical of loans negotiated with the ADB. The MOF, SBV, and MPI play a key role in actual loan negotiations with the ADB. However, once the loan is effective, the MOF will have an important role to play because it disburses loan finance to the PPMU or its equivalent. The MOC will also play an equally important tole in coordinating and monitoring the Project outcomes. This will require periodic visits to the Project Towns and participation in meetings as agreed upon as part of the implementation schedule.
B. Provincial Level
The PPC in each of the five provinces will be the EA for the Project but the PPMU in each of these Project Provinces will play a key role in managing both the finances and technical components of the loan. Such activities will include the recruitment of international and domestic consultants as per the agreed upon requirements, procurement in accordance with both Government and ADB requirements, ensuring that disbursement of project finances is timely and in accordance with the agreed upon schedule for civil works and other related activities (e.g., this applies if grant funds are available for one or more project components), and project monitoring and evaluation. Other agencies involved at the provincial level are likely to include the Provincial Department of Health, which will assist in the monitoring and evaluation of Component A

TA 4485-VIE: Central Region Small and Medium Towns Development Project FINAL REPORT Appendix 14, page 8
June 2006
as well as in Dak Nong. Because of ethnic minorities, CEMMA will be asked to ensure that the Project-specific EMDP that has been prepared for each town is implemented in accordance with these agreed upon provisions and it will also play an active role in monitoring and evaluation of the EMDP. Even though the VWU is more likely to be active at the district and sub-district level (towns and communes), there is no reason why it cannot be involved in the monitoring and evaluation of the project-specific Gender Plan to ensure targets agreed upon are met. Additionally, it will have a major role in the implementation of Component A and to ensure that the outcomes actually benefit women living in the Project Towns. Hence, apart from the PPMU which will play a key role in the day-to-day implementation of the Project, the aforementioned stakeholders will play more of a quality assurance role via participation in monitoring and evaluation activities.
D. District Level
The DPC will play a role in monitoring and evaluation of the Project and in the day-to-day implementation of the Project. In the case of Ca Na, the Ninh Phuoc DPC is likely to be required to play a more direct role than in the larger Class IV and V towns (e.g. Gia Nghia or La Gi). The small towns in Dak Nong are a special case because this province was only established in 2003 and is unlikely to possess the same institutional capacity as the other provinces. The three smaller towns in Dak Nong (Ea Tling, Dak Mam and Quang Khe) are actually smaller than the rural commune of Ca Na so the participation of the DPC in each of these towns will need to be carefully assessed. However, as a guiding principle the Project should also via Component E (Project Management and Institutional Strengthening) seek to develop the capacity of each of the provincial companies and joint stock companies under provincial towns or districts.
E. Township/Commune Level
The physical implementation of the Project Subcomponents will take place at the city and town level, and township/commune level. The TPC/CPC has a very important role in ensuring that all scheduled activities are actually implemented. It is also at this level that the VWU and other mass organizations (if they are to be involved) also need to be involved. As part of project design the TPC/CPC and ward/village heads have been involved in data collection activities (socioeconomic survey), limited aspects of technical design, and provincial level participatory workshops. They have especially contributed to the design of Component A, this actual Participation Strategy, the EMDP and GAP.
F. Development/Community-Based Organizations
The VWU will be represented in the Provincial Steering Committee in each of the five provinces and it is likely that the Fatherland Front will form part of the Inspection Committee to ensure that the civil works are carried out according to the actual Project design and in accordance with Government regulations. However, the VWU will not just be involved in these activities, which are more of a controlling nature, but also as facilitators of Component A (even if this is also undertaken in conjunction with other NGOs). Hence, it can be stated that the VWU has and will participate in the Project at all levels of intensity from basic information sharing to empowerment and shared control. Empowerment is very important because the major beneficiary stakeholder group or customers, if the paradigm of women as the paying customers for some of the subcomponents is central to the long term sustainability of Project investments, is actually women even if all household members benefit.

TA 4485-VIE: Central Region Small and Medium Towns Development Project FINAL REPORT Appendix 14, page 9
June 2006
At this level, the participation methods will need to be more stakeholder-based with the use of tools and techniques commonly used in PRA –focus group discussions (FGD) but also wealth ranking exercises, vulnerability indices, and seasonality in relation to IGA and other activities such as cultural and religious activities. FGDs have been used as part of the Provincial-based Participatory Workshops where stakeholder groups from each of the Project sites participated following the Interim Workshop but these were truncated consultations because of time and financial constraints and would need to be more township-based during actual project implementation.
G. Beneficiary Stakeholder Groups
Via the Provincial-based Participatory Workshops, a small number of women and men have participated in aspects of Project design although their capacity to influence the actual technically-based infrastructural aspects of the subcomponents has been very limited. Where this small group has played a more participatory role has been in the collaborative design of Component A and in safeguards relating to resettlement and land acquisition issues in the larger towns, preparation of the GAP and EMDP. Ideally, the involvement of beneficiary stakeholder groups should have been both quantitatively and qualitatively greater and deeper than it was but there are the technical realities of ADB-financed PPTA and the political culture of Vietnam that have to be realistically factored into such an assessment.
Nevertheless, because the Participation Strategy incorporates a customer-oriented approach to some aspects of the Project, an international NGO with local partners is being tasked with facilitating a social marketing approach to improved and sustainable sanitation outcomes that will be based on a series of activities. These activities will include: (i) situational assessments; (ii) market assessments; (iii) formulation of marketable solutions; (iv) building of local supply network for low-cost sanitation; (v) development of an advertising and promotion campaign; (vi) linkage of supply and demand; (vii) implementation of promotion activities; and, (viii) broadcast communication campaign. Approaches such as those associated with Sustainable Livelihoods for Urban Areas, Appreciative Inquiry, and Future Search Conferencing will be utilized. These approaches are more consistent which emphasizes the discourses of empowerment among stakeholder groups, especially among the poor and vulnerable, because they focus on strengths and people’s own ideas on how they would like to improve on their existing livelihoods: people speak for themselves rather than just governments speaking on their behalf. It will be as customers that beneficiary stakeholders will enjoy the greatest level of empowerment. This is attributed to the fact that they will largely finance their own interventions, which will be demand-driven in ways not possible with conventional projects albeit via a social marketing approach that stimulates demand for increasing the sanitation access rate – especially for poor and vulnerable households – in the Project Towns and Communes. This approach rejects a standardization of models, decision-making by external agencies, and a focus on infrastructure targets and centralized service provision. The goal of “total sanitation” is a socially derived output goal that requires the active participation of all stakeholders/customers, especially poorer and vulnerable groups who are not actively included in activities to design more conventional projects.

TA 4485-VIE: Central Region Small and Medium Towns Development Project FINAL REPORT Appendix 14, page 10
June 2006
V. TIMELINES
Activities that are associated with project design were facilitated during the participatory workshops in the second and third weeks of November following the Interim Workshop. Initially, it was intended that a series of participatory exercises would be facilitated in each of the designated project towns but this proved to be impracticable due to time, logistical and financial restraints. Nevertheless, the workshops were able to utilize a series of tools and techniques that were broadly participatory in nature and ensured that community-based stakeholders including representatives of poor and vulnerable groups that were identified during the initial socioeconomic surveys and by the mass organizations, especially the VWU that the TA Team has been working with.
An exception to the above has been the consultations with ethnic minority groups in the towns of Dak Nong Province. In special recognition of the perceived greater levels of vulnerability and lesser social inclusion of ethnic minority groups, the TA Team spent 8 working days with these groups to develop town specific EMDP. A broad range of participatory tools including those associated with AI were utilized to enable these ethnic minority groups to look at how they would conceive of worthwhile WSS interventions, which ownership could be developed with iterative forms of participatory social mobilization. To develop the range of low cost sanitation options that are likely to interest and benefit urban stakeholders (or consumers if a market-based approach is adopted) associated with Component A, it is necessary to spend up to eight months in actual project preparation. This will include steps such as identifying and standardizing a range of options to potential consumers, increasing where necessary the availability and capacity of low cost service providers, gaining an understanding of consumer behavior and drivers of consumer demand, developing, testing and delivering the market campaign, mobilizing the community for behavior change, linking market players, monitoring the quality and cost through competition will involve a timeframe of approximately 24 months: 8 months for project implementation and 16 months for project implementation. This will need to be pilot tested in one of the towns or several of the towns first before it is up-scaled but it is envisaged that this type of activity would continue for the duration of overall Project implementation period. Other Project related activities, especially monitoring and evaluation, are iterative processes that will need to be actively carried out during the actual life of the Project. The design of the Beneficiary Monitoring and Evaluation System per Appendix 8 (keeping in mind the emphasis on consumers rather than simply beneficiaries) has been designed to ensure that such processes materialize. A very important indicator of participation will be the extent to which the stakeholders are able and willing to actively monitor and evaluate the outcomes of all sub-project components and the extent to which lessons learned can be applied to similar projects in Vietnam.

TA 4485-VIE: Central Region Small and Medium Towns Development Project FINAL REPORT Appendix 13, page 1
June 2006
SOCIAL, GENDER AND POVERTY ANALYSIS
I. INTRODUCTION
ADB loans (and where applicable grant) relating to urban (including peri-urban) water supply and sanitation projects are required to address a number of critical issues that necessitate an understanding of specific social, gender and poverty concerns as they impact on specific project localities. At the core of the social analysis is the centrality of gender and its intersection with poverty and sustainable livelihood issues and in a number of project towns, ethnicity. Typically, as will be demonstrated by the gender analysis, it is women who are currently responsible for most WSS-related activities at the household level. This means in practical terms that women in each household, especially those that do not have access to tap water, have to ensure that enough water is available for drinking, cooking and washing purposes. Generally this does not involve women (or girls) having to work great distances to fetch water, as is sometimes the case in rural areas. Instead it means that women have to estimate how much water will be required, especially if they lack access to storage tanks that typically store from 2 to 5 cubic meters, on a daily basis. This is an important activity when during the dry season the price of water per cubic meter is very high in some of the towns. More importantly it is women who are the caregivers if household members fall ill as a result of waterborne diseases such as diarrhea and dengue, which not only adds to their domestic labor but diminishes their opportunities to pursue other livelihood-based activities. There are few reports of girls missing school to provide care for household members who are ill if their mother cannot afford to take time off work and/or the household depends on her activities. However, if it does occur, it is more likely among poorer and more vulnerable households headed by women (defined in this context as households where there are no male adult members or they are absent from the household). This is not surprising because in Vietnamese cultures (includes majority Kinh and ethnic minority groups), it is expected that women will manage household-based activities whether it be ensuring that enough clean water is available to caring for the sick or paying for water that is purchased. In Viet Nam, women generally manage household finances but any decision as to whether an outlay on sanitary improvements, such as investment in a flush latrine are to be made, is normally a joint decision because of the substantial cash outlay (up to VND 4 million). Women, except those closely associated with the VWU, have limited opportunities to directly influence the outcome of public decision-making processes in the Project Towns. This especially applies to poorer and more vulnerable women (e.g. those living in poverty or not legally entitled to reside in a specific town) and to ethnic minority women who cannot speak the Kinh language very well. Gender is a variable that limits public participation but poverty and ethnicity are also important variables. Better off women from the Kinh ethnic majority group are more likely to be in a position to influence public decision-makers (who might often be their spouses, relatives or socially connected via existing networks), albeit on an “informal” basis than poorer men. The analysis undertaken for this PPTA demonstrates that women have actively participated and contributed to investment decisions at the non-household level in relation to WSS-related services – and this includes the actual technical design of the project. Some of the proposed Executing Agencies (EA) and other public/private utility entities (e.g. Water Supply Companies and Urban Environmental Waste

TA 4485-VIE: Central Region Small and Medium Towns Development Project FINAL REPORT Appendix 13, page 2
June 2006
Companies) have women occupying significant positions in these organizations. Active participation of women in the project areas is through the Viet Nam Women’s Union (VWU) but its capacity to influence the final outcome of the technical design interventions has been rather limited. However, there are questions as to how effectively VWU can reach out to marginalized women -- whether they are “non-registered” migrants in the coastal project towns or ethnic minority women in the Central Highland’s project towns.
Nevertheless, the gender analysis will indicate how the VWU working with other civil society organizations (including those able to partner public-private sector linkages) can facilitate greater empowerment opportunities (such as being treated as “consumers” rather than “beneficiaries”) for women living in the project towns. Additionally, the gender analysis suggests approaches that also require the active involvement of men in household (men have to understand how to value the opportunity cost of women’s care-giving services in relation to household members affected by water-borne illnesses) and community-based WSS interventions (behavioral change for improved public health and sanitation outcomes is not gender neutral). Hence, women are not being left to assume responsibility for livelihood improvements based on WSS interventions: men also have to claim ownership and shared responsibility.
The social analysis will demonstrate that the people of the project towns are not homogenous. There are key socioeconomic disparities based on differences in incomes, social status, ethnicity, and residential status. The differences in incomes are obvious enough and will indicate whether potential users have the capacity not only to pay for proposed tariffs for water (which actually are considerably less than most user groups irrespective of income currently pay) but of equal importance for the household-based tap connections. For the very poor as the poverty analysis will demonstrate it remains a big concern whether such households could afford to pay a one-off connection. Hence, a series of interventions, including innovative approaches based on the incremental mobilization of savings is being proposed. For some groups, most notably ethnic minority groups living in the peri-urban areas of the Central Highland project towns there is a marked reluctance to pay for treated water because the cultural preference is for natural spring water. However, the social analysis demonstrates there are circumstances under which even this group might pay for water (during the dry season months) if they can truly understand the real opportunity cost of using untreated water. There are also other marginalized or vulnerable groups, especially migrants to coastal towns (also a problem in the Central Highlands), for whom problematic residential status results in lack of certainty vis-à-vis any sustainable investment strategy. Underpinning the poverty analysis is the construction of a Water Poverty Index (WPI) that provides a somewhat more subtle criterion for poverty than that provided by the official MOLISA criteria. The real advantage of this WPI is that it includes water as a non-food item to more fully encapsulate vulnerability and seasonality in the lives of people living in the project towns. Using the WPI is not designed to identify poverty where it does not exist and hence justify the project on poverty grounds alone. Indeed if the technical approaches of the engineering design TA consultants, especially in relation to the water supply interventions were to be considered in isolation from the rest of the project this would be quite a difficult project to justify on poverty reduction grounds. Rather the WPI is designed to be used to demonstrate how access to safe and affordable household water would improve the livelihoods of people living in the project towns.

TA 4485-VIE: Central Region Small and Medium Towns Development Project FINAL REPORT Appendix 13, page 3
June 2006
In addition to the WPI, the poverty analysis is more spatially inclusive and is influenced by both technical arguments and those more closely related to equity issues. Clearly, the investment costs of the project can be more readily recouped if as many users as possible are paying commercial tariffs for water in the project towns. In the peri-urban areas, at least in the Central Highland’s project towns, few households want to pay for treated water during the wet season: they prefer dug well water. However, in the absence of good, clean “natural” water during the dry season, such households might be prepared to pay for water. Given the topography of some of the project towns in the Central Highlands, the results of the social analysis points towards more community-based water supply arrangements (e.g. water carts, stand-pipes or similar). If no attempt is made to target peri-urban households in the project towns, spatial inequalities will only exacerbate existing levels of inequality. At yet another level the project needs to encompass both urban and peri-urban groups because improved health and sanitation outcomes for all households depends on synergies being achieved between both urban and peri-urban groups. It is important to recognize that while the project has as its major investment focus, that is, improvements to the existing water supply system, such improvements cannot be conceived of in isolation. Most of the stakeholders prioritize access to clean and affordable water as their major priority, which is understandable because this is an immediate livelihood need on a daily basis. In the larger towns (a misnomer actually because they are more “cities” than “towns” both sociologically and economically), there is some emphasis on improved drainage and solid waste collection, especially by households that already have access to clean and affordable water. Such interventions also go a long way to improving public health, but it has to be ensured that the Project design should be socially and environmentally sound. This emphasizes the fact that improvements to public health and sanitation are not just based on the network of users connected to an existing water supply system or potentially connected to an improved water supply system but to all households.
This social analysis then focuses on what actual demand exists in each of the project towns for the range of project interventions being proposed, the ability and willingness of households to pay for these interventions, and the impact of these interventions on overall sustainable livelihood improvements. The analysis is based on the socioeconomic survey undertaken as part of the TA project design, a series of stakeholder-based consultations facilitated by the TA team, and a review of existing good practices elsewhere in Viet Nam. Building upon the social analysis, it is argued that there are a range of interventions that rely on either loan or grant financing but that can be leveraged via the actual project to improve people’s overall livelihoods.
II. SCOPE AND METHODOLOGY
The Socioeconomic Survey was developed by the TA Team specifically to develop a socioeconomic profile of each town. This necessitated the collection and collation of official socioeconomic indicators relating to population, labor force participation, economic indicators (including GDP, per capita income and poverty levels), health indicators, education indicators, and migration patterns at the township level. The importance of the Survey has been to provide a composite picture of similarities and differences between the towns that were initially considered to be candidates for the Project and also to capture similarities and differences within these towns (including

TA 4485-VIE: Central Region Small and Medium Towns Development Project FINAL REPORT Appendix 13, page 4
June 2006
the peri-urban areas). The actual questionnaire developed for the Socioeconomic Survey and approved by the ADB is included as Annex 1 in Appendix 3.
At the ward (and village level) level, detailed population data disaggregated by gender and ethnicity was designed to be included in the survey. Unfortunately, data disaggregated by age was not possible to obtain (this is a common feature throughout Viet Nam at the township level). Household poverty data was also included in the survey, including a focus on female-headed households. However, it was not possible to collect data via quantitative means on what could be that most vulnerable of groups: non-registered migrants without legal residential status. Said status is defined as being in possession of ID cards stating place of residence and being in possession of household residence in the Project towns. It was agreed that the methodology to be adopted would be structured household interviews with the sampling technique aimed at selecting every fifth household in the ward or village to be surveyed to participate in the survey. The actual survey was under the supervision of a provincial-based enumerator who was also tasked with providing training in simple interviewing and enumeration techniques to locally engaged enumerators from each of the wards or villages being surveyed. The raw data was sent to an institution in Hanoi for tabulation, with the analysis being undertaken by the TA consultants. The second component of the Socioeconomic Survey focused on access to WSS-related services, including most importantly, water sources (taps, vendors, wells, lakes, ponds and rivers) during both the dry and wet season. This is very important in order to capture seasonality and understand how access to water is more problematic during the dry season as well as its impact on the livelihoods of especially the poorer and more vulnerable households. This varies from town to town but basically the problems in the coastal towns related to saline intrusion (a feature of water supply the year round) whereas in the Central Highlands there are marked differences between water quality during the wet season and dry season (insufficient water of good quality from dug wells and poor quality dry season water from streams and ponds). Similarly, the Survey focused on access or non-access to toilets including the different types of toilets, and whether individual households were connected to existing drainage networks. To undertake these surveys it was necessary to first secure permission from the PPC in each of the Project provinces. This has not proved difficult for the actual surveys and proved even less difficult for the design of the EMDP in Dak Nong (indeed the PPC and TPC were very collaborative), and preparation of the Gender Action Plan (GAP). Embedded in the Participation Strategy has been the actual survey, the participatory workshops and EMDP and GAP. Once the necessary protocol was observed at the provincial level, it was necessary to visit the District People’s Committee, which then arranged meetings for the survey team with the Town People’s Committee (Commune People’s Committee) who in turn arranged for meetings with Ward/Village leaders. Hence, before the surveys could commence, it was necessary to meet with all four layers of governmental administration at the provincial level and below. Once this protocol had been observed, it was possible to begin the actual surveys which began at the beginning of August 2005 and completed by the end of September 2005. In terms of consultations, the Survey Team explained the purpose of the Project or at the least the survey, when called upon to do so. However, in terms of participatory-based consultations with stakeholder groups, there was considerable

TA 4485-VIE: Central Region Small and Medium Towns Development Project FINAL REPORT Appendix 13, page 5
June 2006
information sharing with a range of public sector officials and informal consultations with a range of local community members including poorer and vulnerable groups. These informal consultations have enabled the TA to develop qualitative insights into issues germane to this Project. Examples include being able to explore the opportunity cost of waterborne diseases on women and their households and what type of interventions would work in peri-urban areas to ensure that people outside the designated water supply area would also benefit.
What the Socioeconomic Survey was not able to effectively gather was differentiated poverty data by ward and commune in some of the Project towns despite repeated requests made by each TPC or CPC to provide such data. This limits the effectiveness of the poverty analysis – at least in identifying how the Project will target households living in poverty – and, as suggested in the Poverty Analysis below, will be one of the data gaps that will need to be filled prior to Project implementation.
III. SOCIAL AND ECONOMIC CHARACTERISTICS OF PROJECT TOWNS
There are some important social and economic characteristics between the towns, both the larger towns in the Central Coastal Region and its smaller towns, and the towns of the Central Highlands that are included in this Project.
A. Ethnic Minorities The towns of the Central Highlands are largely peopled by the more numerous Kinh people. As recently as 1943 (admittedly a long timeframe for the ADB but not indigenous peoples), less than 5 percent of the Central Highlands was peopled by the ethnic Kinh people, and most of these people came from the Southern Region of Viet Nam where cultural traditions were somewhat different to those in the Northern Region. By 1975, less than one-third of the population were indigenous peoples and despite higher growth rates among most of the indigenous groups, the massive in-migration of Kinh people and other ethnic minorities has rendered the indigenous people of this region minorities within their own territory. This, of course includes Dak Nong where there are few if any of the indigenous ethnic minority groups living within areas of each of the towns that would benefit from investments in the piped water supply system. By way of contrast, the coastal towns have been peopled by Kinh people for a much longer period, beginning in the mid-fifteenth century (although few of these towns can claim a historical lineage that dates back this far), and were integrated into both the pre-colonial, colonial and post-colonial administrative and political structures of the Vietnamese state. Prior to 1975, these towns were administered by the Government of the Republic of Viet Nam (South Viet Nam) and were administered somewhat differently to towns in the Democratic Republic of Viet Nam (North Viet Nam) but because they were coastal towns they endured less damage than towns and hamlets in the countryside in the Mekong Delta. It is not necessary to provide an in-depth account of the historical sociology of these towns – an impossible task anyway given the paucity of focused studies on these towns by anyone resembling a social scientist – but by wielding broad brushstrokes it is plausible to generalize that for the most part the cultural characteristics of these towns, including for the most part the towns of Dak Nong (with the exception of the peri-urban areas), are very Kinh in nature. In a nutshell we are for the most part

TA 4485-VIE: Central Region Small and Medium Towns Development Project FINAL REPORT Appendix 13, page 6
June 2006
looking at ethnic Kinh a.k.a. Vietnamese towns. The ethnic minorities that predated the Kinh with the possible exception of the Cham and Ra-glai (who derived a part of their livelihoods from coastal based activities) were rural peoples. The original Kinh settlers were administrators with their organic roots in the imperial state but of course as the Kinh consolidated its hegemony and ultimately authority over the Central Coastal Region of modern Viet Nam, they also sought to derive a portion of their livelihoods in agrarian-based activities, even though historically and contemporaneously this region of Viet Nam has never been a major surplus producer of agrarian foodstuffs. Linking socio-cultural history with political economy the towns of the Central Coastal Region functioned to some extent in the same ways that small towns did in the long-settled Red River Basin of the Northern Region and the more recently settled (relatively speaking because the focus is on the eighteenth and nineteenth centuries) Mekong Delta in the Southern Region.
Hence, the focus of social and political structures in the towns of the Central Coastal Region is for the most part on Kinh social structures. Such range from the close kindred nature of social relations embedded in the traditional kinship system (attenuated to some extent because of the urban nature of these towns), which to a large extent are horizontal in nature although they are impacted upon by age and gender hierarchies, and community-based relations embedded in a range of institutions (e.g. temple and church). In turn, these are even more impacted upon by age and gender hierarchies. The public face is male but indirectly there is a complex ensemble of social relations where women at least play a more important role than they do publicly. Imposed upon these social structures has been the creation of urban wards in the towns, and in the peri-urban areas of these towns, communes, which effectively is the lowest level of government and administration. These political institutions for the most part are quite vertical in nature although theoretically in Viet Nam’s political system it is at the ward and commune level that ordinary people vote in their own representatives to the People’s Committees. These in principle provide the representatives who in turn decide who will represent both the Government and Party at all levels right up to cabinet and central committee level. In practical terms of relevance to this Project, every attempt was made to access households at both the ward and commune level, whether via community-based consultations, via the sampling procedures of the socioeconomic survey, or during the stakeholder participatory workshops. Often the TA Team had to be content to deal with a development or community-based organization such as the Women’s Union1, representatives of the ward and commune committees, and via a series of ad hoc consultations. To ensure that local communities in each of the Project towns will have more rather than less opportunities to ensure that Project benefits are not squandered by some local officials, a Participation Strategy (See Appendix 10) has been developed. However, of equal importance is the fact that the enabling environment is better facilitated via an approach that treats people in local communities as “consumers” or “investors” rather than simply “beneficiaries”: this approach has it roots in a demand driven rather than supply driven approach. Therefore, irrespective of the existing social and political structures in each of the Project towns, the mobilization processes being argued for in this social analysis and incorporated into aspects of overall Project design, are contingent on a
1 As indicated in the Gender Analysis, the VWU does not always represent all groups of women but is generally the most popular of
development/community-based organizations. Actual membership rates of women vary from a high of 82.4% in Tan Son to a low of 19% in Song Cau.

TA 4485-VIE: Central Region Small and Medium Towns Development Project FINAL REPORT Appendix 13, page 7
June 2006
somewhat different approach to that utilized in previous ADB-financed Projects of a similar nature. The same logic of course applies to the Central Highlands Project towns in Dak Nong. The rationale for this approach is discussed more fully in other Project related outputs including Component A (Community-Driven Water Supply and Sanitation Program), Gender Action Plan and for Dak Nong the Ethnic Minority Development Plan.
B. Economic Activities The economic base of Central Coastal Region towns relies to a large extent on coastal-related economic activities whether it be off-shore fishing, on-shore value adding activities (especially the manufacture of fish sauce or processing of dried fish) in-land shrimp farming, and tourism related goods and services. There is limited agriculture in the hinterlands although over one-third of males (37.2%) and one-quarter of females (26.1%) are directly involved in agriculture. Agricultural-based activities include the cultivation of rice2, livestock production3, and fruit production (especially dragon fruit and grapes which are primarily the preserve of better-off rural households). Urban-based activities include the provision of a typical range of goods and services with the larger towns (Tuy Hoa, Cam Ranh and Phan Thiet) providing a wider range at generally lower prices than the smaller towns and consequently also providing a menu of income-generation activities (constitutes 21.1% of females and 5.7% of males). In the public sector 16.9% of the workforce is male and 15.8% is female. Meanwhile, of the private sector wage and salaried workforce 33.3% is male compared to 19.9% of females. As the Gender Analysis will demonstrate the per capita income of females is 91.4% of that of males.
C. Labor Force There is little direct foreign investment in the towns of the Central Coastal Region because investors prefer to locate joint ventures in either the Hanoi-Haiphong Growth Corridor in Northern Viet Nam or Ho Chi Minh in Southern Viet Nam because of superior infrastructure and more highly skilled workforce. This does not mean that some towns in the Central Coastal Region do not have the potential to more fully develop their infrastructure (e.g. Cam Ranh has the largest deepwater harbor in Mainland Southeast Asia) nor does it mean that these towns do not attract migrant labor. However, the migrant labor they attract is typically poorly educated and relatively unskilled coming from the rural hinterland or other areas of the Northern Coastal Region and very rarely from the more dynamic Mekong Delta Region. As a very broad generalization, the better educated and more highly skilled workers do not look upon the Project towns of the Central Coastal Region (Phan Thiet and perhaps Tuy Hoa being the possible exception) as places they either want to stay in or relocate to. It would take more than a Project of this nature to make most of the
2 Often just for household-based consumption because the ecology limits effective cropping technologies that could expand and
intensify rice production. 3 With emphasis on cattle, pigs and chickens. Although with the advent of Avian Flu, this has had a major impact on the poultry
industry, which is a major source of income for poorer females in peri-urban areas and is also a critical factor that must also be considered in the community-driven water supply and sanitation program as well as the traditional concerns associated with waterborne illnesses.

TA 4485-VIE: Central Region Small and Medium Towns Development Project FINAL REPORT Appendix 13, page 8
June 2006
Project towns in the Central Coastal Region more attractive places to live in or migrate to. Nevertheless, the Project does represent a building block in improving the physical quality of life in these towns, which is also an important component of growth with development.
D. Agricultural Sector In the Central Highlands, it is the substantial investments in industrial crop production, especially coffee and rubber, which has ushered in a sustained period of economic growth despite the very low prices for coffee and rubber in the late 1990s for the Project towns. To a much greater extent than in the Project towns of the Central Coastal Region, the economy is underpinned by the agricultural sector. The economy of these towns is dependant on the goods and services provided to the agricultural sector, including value adding to primarily the harvested coffee (some of the roasting is done in the Central Highlands but much of it is done in Ho Chi Minh City). There is little non-agricultural related economic activities in these towns apart from in the public sector where the Government has targeted Dak Nong as an area where subsequent growth needs to take place. Consequently, the public sector is considerably larger than in all the Central Coastal Region Project towns as the Government is attempting to provide a conducive environment for rapid population growth, which must have a multiplier effect on economic development, to take place. Of the 13 Project towns, Gia Nghia is forecast to grow 23.1% over the next five years and the smaller towns ranging from 3.7% in Ea T’ling, 11% in Dak Mam, and 15% in Quang Khe compared to growth forecasts in the range of 1.6% to 2.2% for all other Project towns with the exception of the 7.2% growth forecast for the small town of Song Cau. Viewed from the perspective of providing effective WSS-related services, this projected population growth will prove a challenge. From a social development perspective, the important question is where the additional population will come from. As suggested in the section on ethnic minority development issues, this is likely to have some important ramifications for upland ethnic minority groups living in the peri-urban areas of the Project towns. Now linking these social and economic characteristics of the Project towns to water, drainage and solid waste disposal, it is possible to compare and contrast the different characteristics of each town. The Social Analysis then links to the specific social and economic backgrounds of different households within each of these towns that were included in the Socioeconomic Survey.
E. Access to Water To understand existing access to water sources in each of the Project towns, it is necessary to differentiate between the wet season and the dry season, the length of each season varying depending on whether coastal or highland and further complicated by a series of extended dry seasons over the past decade. Of the largest towns, Phan Thiet is the best off with 71.6% of households having pipe connections year round while Tuy Hoa, the largest of the Project towns, has only 39.6% of its households in a similar position. The other large town of Cam Ranh has 44% of household with pipe connections. Several of the smaller towns (Ninh Hoa: 72.2%, Song Cau: 57.1%, and Tan Son: 63%) are much better off than either Tuy

TA 4485-VIE: Central Region Small and Medium Towns Development Project FINAL REPORT Appendix 13, page 9
June 2006
Hoa or Cam Ranh in this respect but Van Gia has only 7.3% of its households in a similar position while Ca Na is similar to Ea T'ling, Quang Khe and Dak Mam in the Central Highlands where no household is actually connected via indoor tapped pipe connections.
During the wet season most households try to avoid purchasing water for bathing and laundry purposes but in Ca Na, 40.7% of households are forced to do so compared to 1% in Tan Son. Of the largest towns 10.2% of households in Cam Ranh need to purchase water. Households in six of the Central Coastal Region Project Towns do not purchase water for such purposes during the wet season although in the Central Highlands a small percentage of households in two of the towns (3.8% in Ea T’ling and 1% in Dak Mam) are forced to do so. The situation is somewhat different in the dry season with households in one additional town (8.3% in Gia Nghia) being forced to purchase water for such purposes. Other towns with the exception of Ca Na, where the need is constant irrespective of seasonality, there is a 40% increase in the number of households in Cam Ranh and a 90% increase in Quang Khe during the dry season. In terms of scale, the impact can be ascertained to be much greater in Cam Ranh than in Quang Khe but being forced to purchase water at high prices – at least in the Central Coastal Region Project Towns – add to the vulnerability of households where there is a high WPI. The only Project town that can rely on rainwater to any large extent is the very small town of Quang Khe (service population circa 3,500) in Dak Nong where 50% of households rely on rainwater collected in storage tanks during the wet season and 48.9% during the dry season. However, storage tanks for the very poorest households are not a viable financial option (as also are dug wells) without outright grants or as being suggested via this Project, design the enabling environment to mobilize savings. This was confirmed when the TA Social Development Specialists visited Quang Khe at the tail-end of the wet season in early November. Hence, even though a town like Quang Khe in the Central Highlands is well situated because of its topography (at a higher altitude and able to harvest rainfall over a longer period than in all of the coastal towns) to use rainwater for drinking and cooking purposes it cannot be argued that it is a reliable source of water supply for households with very limited financial capital.
F. Water Connections Given that households with indoor-tapped pipe connections pay far less for their water per cubic meter than households without it ranging from a high of VND 43,000 in Cam Ranh during the dry season to a low of VND 10,500 in Tuy Hoa, there are very good reasons why over the longer-run it is beneficial to be connected. In Phan Thiet, the cost of not being connected during the dry season averages VND 27,300 per cubic meter. Only in Van Gia, where there is a relatively high MOLISA assessed incidence of poverty (13.6% of households) is the cost of not being connected cheaper for the time being costing only VND 2,400 per cubic meter. Its WPI is significantly lower in relation to the MOLISA poverty estimates than in other Project towns. The explanation for this is that the River Ro is located close to Van Gia and provides higher quality water than the existing sources of water for the other Project towns. Another reason is outside of the Central Highlands Towns of Dak Mam (91%), Gia Nghia (76.1%), and Ea T'ling (75.9%), over half (53.1%) of households in Van Gia rely on dug wells. The quality of water in dug wells in other towns is rather poor and hence fewer households can rely on such a source for access to

TA 4485-VIE: Central Region Small and Medium Towns Development Project FINAL REPORT Appendix 13, page 10
June 2006
water. Another issue is having the more populous towns relying on dug wells even when water quality is satisfactory is not a realistic option.
G. Cost of Water It also needs to be noted that in those towns where significant numbers of households need to purchase water off water vendors (ranging from a high of 96.3% of households in Ca Na to 16% of households in Ninh Hoa), households have to spend much more than in towns where generally fewer households (exception is Phan Thiet) have to procure water from vendors. An additional problem in Ca Na is that the poorest households – often non-registered migrants – argue that they cannot afford to purchase water in bulk because they do not have water storage tanks able to store up to 3 cubic meters of water. Due to this, they are forced to purchase water on a daily basis. This is one of the reasons why water costs as much as VND 77,000 per cubic meter when purchased from water vendors. The other reason for this high cost is that water is transported at a distance of 25 kilometers from the district center. However, in the dry season significantly higher numbers of households in most Project towns including those in the Central Highlands need to purchase water off water vendors. As noted in the section on ability and willingness to pay, households who do not need to purchase water during the wet season are more reluctant both culturally and financially to pay for a resource they currently access free-of-charge but these same households would be prepared to pay lower fees for water during the dry season, the possible exception being upland ethnic minority groups if they can access traditional sources of water (e.g. springs or water-holes).
H. Waste Disposal And Sanitation Facility
The disposal of human waste varies from town-to-town and has a differential impact on environmental health. In a town such as Ca Na nearly all human waste (97.6%) is disposed of in the sea (either on the foreshore where people defecate or the inland waterways that many houses back on to). Other towns that lack a sanitary facility or have one but inadequate – even if some/many households have access to improved latrines – include the coastal towns of Phan Thiet (92.3%), Song Cau (64.3%) and Tuy Hoa (52.6%). Quang Khe (89.2%) in the Central Highlands is in a similar position. The difference though is one of scale. Towns like Phan Thiet and Tuy Hoa are large Class III cities, not smaller towns.
In the Central Highland towns of Dak Mam (81.4%), Gia Nghia (60.9%), and Eat’ ling (31.5%), and in the Central Coastal towns of Tan Son (67.9%), Van Gia (45%), Song Chau (28.6%), and Tuy Hoa (21.1%) human waste is used to fertilize home or kitchen gardens. This is certainly a sustainable use of human waste and contributes to overall household food security. This implies, however, that garden crops have to be thoroughly washed before being used for human consumption. There is no evidence that using human waste for such purposes – based on the incidence of illnesses such as diarrhea – undermines sustainable livelihoods in such households. Similarly in towns where saltwater fish farming is quite important – Van Gia (38.3%), Tan Son (28.6%), Tuy Hoa (10.5%) and in Ea T’Ling (7.4%) where freshwater fish farming is relatively important ― human waste via bucket collection is applied to commercial fish farms. This likewise, is likely to contribute to sustainable livelihoods although environmental health considerations with commercial fish farming (especially shrimp farming) are of more concern than home or kitchen utilization of human waste.

TA 4485-VIE: Central Region Small and Medium Towns Development Project FINAL REPORT Appendix 13, page 11
June 2006
In terms of solid waste, its disposition depends on a number of factors. In Tuy Hoa the majority of households (89.2%) rely on a solid waste management company to collect their garbage whereas in three towns – Quang Khe, Dak Mam and Tan Son – no such service exists. Central Coastal Region towns are generally better off in this respect than Central Highland Region towns. In the latter, solid waste is more likely to be burned, buried or simply scattered than in the former but in a town such as Ca Na a substantial minority of households (30.2%) state they dispose of solid waste by methods other than burning, burying or scattering. However, a visual inspection of a town such as Ca Na suggests that much of the solid waste is simply scattered into the inland waterways and along the coast. It needs to be stated that there is less willingness to pay for the disposal of solid waste than for tap connections to a reliable water supply system or even willingness to invest in improved latrines. The Community-Driven Water Supply and Sanitation Program will need to address this problem as part of its systemic approach to 100 percent or total sanitation in the Project area.
IV. DIFFERENTIAL CHARACTERISTICS OF POVERTY IN PROJECT TOWNS
Urban poverty in the cities and towns of most developing countries is characterized by some similar indicators. The cities and towns in the Central Coastal Region of Viet Nam are no exception to the rule. Some of these characteristics are as follows:
• Majority of the poor work in the informal or non-formal sector with unstable jobs
and unstable incomes, being the most poorly educated (formally and vocationally) of the urban labor force and while possessing the coping strategies to effect short-term responses, lack the adaptive strategies to effect long-term changes;
• Downsizing of the public sector – and this has been occurring in all Central Coastal Region towns (though not in the towns of the Central Highlands) – has often forced former workers to accept lower salaries and wages and those unable to find suitable alternative employment have joined the ranks of the unemployed or under-employed;
• Majority of the urban poor live in areas where infrastructure is poor and access to basic services (safe water, hygienic and sanitary environment, adequate water and drainage, lighting and garbage collection) is very limited. Said areas often being at the periphery of towns in the peri-urban areas;
• The urban poor are vulnerable because of their dependence on cash income and usually have no or only limited ability to save. They typically encounter many difficulties in accessing loans to create income-generating activities because they often lack the social networks that would ensure even social collateral;
• Unregistered migrants (working age and children) find it difficult to secure permanent registration or registration of long-term temporary residence, consequently, encountering many difficulties securing a stable job with stable income. They also have limited access to social services and end up paying more because they are not provided with effective access to basic public social services, and;

TA 4485-VIE: Central Region Small and Medium Towns Development Project FINAL REPORT Appendix 13, page 12
June 2006
• Poverty rate is usually higher among other socially–targeted groups such as the unemployed, homeless, and those who fall prey to social ills including illegal drug use, petty levels of criminality and HIV/AIDS.
It is sometimes considered that poor people living in the urban areas of towns in the Central Coastal Region of Viet Nam have the option to return to rural areas from where they first originated, as is often the case in some of the other urban areas of countries elsewhere in Southeast Asia. However, the political economy of Viet Nam since the end of the war in 1975 has largely negated this option because of how whole rural communities were transformed in the central and southern regions of the country. But more important, the poor in urban areas of the Central Coastal Region are probably better off in terms of physical capital when it comes to public infrastructure, although this needs to be qualified because the most vulnerable of these urban poor (e.g. those residing in illegal or unrecognized dwellings) are not necessarily better off. It should also be noted that in the Central Highlands urban dwellers or at least those residing in the peri-urban areas have a few more options – especially if upland ethnic minority – of accessing livelihood-based opportunities in non-urban areas (e.g. although technically illegal, it is possible to derive a limited although no longer sustainable livelihood from upland shifting agriculture).
The Government in the preparation of its Millennium Development Goals (MDG) stated that by 2005 over 80 percent of the urban population would have access to clean water with an average daily supply of 50 liters per capita. None of the Project towns reached the target percentage on the given milestone, though it should be fair to note that to some extent, by means of the opportunity to use water from the piped water supply system some gains had been made. This is an important MDG because in the broadest livelihood context food security cannot simply be defined as the access of all people at all times to sufficient, nutritionally adequate, and safe food. It also needs to include such non-food inputs such as clean water, sanitation and health care. The MOLISA poverty data on which the official poverty data provided by the TPC is based does not explicitly use criteria that address these non-food inputs, particularly in relation to clean water and sanitation. Hence, it is proposed to develop a WPI to complement existing MOLISA poverty data in each of the Project towns. This WPI will enable a sharper focus on water-related poverty issues relevant to the Project. It might be possible to construct a sanitation related poverty index as well but it has been decided in the context of this Project to restrict the non-food input to water because it is easier to quantify. The WPI is not the complicated WPI that has been constructed internationally to provide a non-disaggregated WPI that includes factors such as water sources, access to water, use of water, capacity of households to invest in water-related investments, and environmental issues. However, these issues are addressed either directly or indirectly in the overall project design and are included in the social, poverty and gender analysis. What has been constructed for this project is a very simple WPI that highlights the fact that access to safe and affordable water is a major livelihood issue and even a simple WPI adds value to the somewhat diverse poverty dimensions of the project towns. The WPI formula that has been prepared for this Project is based on a weight system of 1.25 percent for each VND 1,000 in excess of the typical water usage tariff prevailing in each of the Project towns where a town water supply system currently exists. Typically, it will be based on those months of the year in which households need to purchase water for drinking and cooking purposes. Therefore

TA 4485-VIE: Central Region Small and Medium Towns Development Project FINAL REPORT Appendix 13, page 13
June 2006
the WPI will enable the project to capture differences between upland and coastal towns (water quality is a major issue in most coastal towns year round) or between the major ethnic group and ethnic minorities (latter prefer “natural” or “spring” water for well-defined cultural reasons). In towns where there is no existing water supply system, the formula is based on what the Provincial Water Supply charges for the year round supply of water in those towns that it supplies water to.
This is not a precise method but it serves to illustrate how water related poverty issues need to be incorporated with any real estimate of poverty. It should not be viewed simply as a statistical exercise to satisfy ADB or any other external criteria. However, the WPI can serve as a useful benchmark for measuring the impact of the project on improved livelihoods of people living in the project towns. To illustrate the formula the small coastal town of Ca Na in Ninh Thuan Province is used as the example.
• According to the Socioeconomic Survey, nearly half of all households in this
town have to purchase water the whole year round for drinking and cooking purposes. The average household use 263 liters per day or 7.89 cubic meters per month during the rainy season and 250 liters per day or 7.50 cubic meters during the dry season. The dry season typically lasts for at least six months although in 2004/5 it lasted 7.5 months.
• During the dry season households can pay up to the equivalent of VND 70,000 per cubic meter for water transported from the district center of Phuoc Dan, where water can be purchased from the Provincial Water Supply Company for VND 3,850 per cubic meter. During the wet season, water can be purchased for the equivalent of VND 20,000 per cubic meter.
• Typical total water purchases over a 12-month period amount to approximately 94.34 cubic meters and the average cost of purchasing water over this period is VND 10,069.95 per cubic meter or VND 79,166.66 per month compared to VND 3,850 per cubic meter from the Provincial Water Supply Company in other towns, which would amount to VND 30,267.41 per month or 61.76 percent less than is currently being paid by households in Ca Na that have to purchase water.
• The difference between the official tariff of VND 3,850 and the average rate being paid in Ca Na of VND 10,069.95 is VND 7,219.95, which if the above formula is applied (VND 7,219.95 x a ratio of 1.25) the WPI adds an additional 9 percent to the official MOLISA poverty rate for Ca Na. This provides a WPI of 18.1 percent.
Using this formula, the following table demonstrates the WPI for each of the project towns and adds the official MOLISA poverty data to arrive at the effective water based poverty rate for each of the project towns.
Table A13-1 MOLISA Poverty Rate and Water Poverty Index Town Average
Amount Spent on Water
(VND)
Access to Tap Water
(%)
Latrine Installed in
House (%)
Percentage of Poor
Households (MOLISA)
Water Poverty Index
Tuy Hoa 10,500 39.6 91.0 9.1 17.4 Song Cau 12,500 65.8 54.6 11.2 22.0 Cam Ranh 43,300 44.0 60.0 16.5 67.3

TA 4485-VIE: Central Region Small and Medium Towns Development Project FINAL REPORT Appendix 13, page 14
June 2006
Town Average Amount Spent
on Water (VND)
Access to Tap Water
(%)
Latrine Installed in
House (%)
Percentage of Poor
Households (MOLISA)
Water Poverty Index
Ninh Hoa 20,400 22.2 40.7 17.4 38.8 Van Gia 2,400 35.0 71.7 13.6 3.2 Tan Son 10,200 60.0 20.0 8.3 16.2 Ca Na 10,069 5.5 40.7 10.4 18.1 Thap Cham 31,400 70.0 50.0 10.97 30.9 Phan Thiet 27,300 71.6 78.9 3.0 32.3 Gia Nghia 12,200 5.5 81.7 17 28.7 Ea T’ling 8,500 27.8 94.4 44.9 50.7 Dak Mam 6,400 10.5 70.2 36.0 39.1 Quang Khe 7,250 0.5 25.2 54.41 58.4
Source: Official MOLISA Poverty Data and TA Socioeconomic Survey, 2005.
In fact, while Ca Na appears to be one of the worst towns in that very few households have access to tap water, the average amount spent on water is lower than most other towns except during the dry season where, as noted above, households pay up to VND 77,000 per cubic meter for the water they use. It is actually in the large town of Cam Ranh where MOLISA poverty rates are quite high for a town of this size but, more importantly, because the average amount spent on water per household is 55.4% higher than in Ca Na wherein the actual WPI is 49.3% higher. This does not contradict the conventional argument that access to tap water is statistically a significant predictor of poverty in the urban areas of Viet Nam 4 . The data presented in the above table corroborates this finding but additionally the WPI focuses more sharply on why households that have to pay for water in some of the Project towns are likely to be worse off using the WPI than households in some of the other towns. It should be reasonably expected that the higher the fee that is paid, the greater willingness there is to pay higher fees for water in each of the towns. As the data used in the section on the ability and willingness to pay demonstrates the argument is not quite so straightforward. It is also necessary to understand that the spatial dimensions of poverty within each of the Project towns and the scope and methodology of the Socioeconomic Survey (Appendix 3) was designed to capture such dimensions by encouraging the EA in each of the Project towns to provide poverty data disaggregated by ward and commune (gender and ethnic variables were also sought but this proved very difficult), which as the table in Annex 1 indicate, proved to be impossible in some of the Project towns. Without such data it really is impossible to sharpen the focus on targeting households living in poverty. Such data needs to be provided prior to loan implementation in order for the VWU and local NGO to assist poorer households mobilize savings to finance the necessary household-based WSS-related investments. Similarly, there is supposed to be a correlation between improved latrines (typically defined as flush toilets rather than pit latrines) and lack of poverty, which is corroborated to a large extent by the data presented in the above table. Nevertheless, there are some towns such as the larger Cam Ranh and the smaller Van Gia where significant numbers of households report they have an improved latrine 5 but do not have access to piped water. The stated priorities of all
4 See, Nicholas Minot, Bob Baulch and Michael Epprecht (2003), Poverty and Inequality in Viet Nam, Hanoi: International Food
Policy Research Institute, pp.21-22. 5 We are assuming that people interviewed for the survey actually had such latrines though it is also possible that some households
reported they had such latrines because they did not wish to appear less “modern” than other households. If this is not the case, it is still likely to be an indicator that the concept is relatively easy to market.

TA 4485-VIE: Central Region Small and Medium Towns Development Project FINAL REPORT Appendix 13, page 15
June 2006
households surveyed attached a greater priority to piped water than improved latrines. Still the actual data indicates that households are willing to invest in improved latrines. However, it can also be noted that installing an improved latrine – while costly – is easier than accessing piped water when a piped water supply system is non-existent.
Educational levels, especially of economically active household members, are a rather important indicator of poverty or the lack thereof. Overall in the Project towns, males (29.2%) are more likely than females (21.6%) to have completed secondary education. Meanwhile, the completion rates for primary school education for males was 70.8% and for females 78.4%. However, there are some quite significant differentials between the educational levels of males and females in specific Project towns. In Tuy Hoa, one of the least poor of the Project towns (using both MOLISA and WPI), slightly more males (38.2%) completed secondary schooling compared to females (35.7%), which is substantially in excess of the Project town average. In Van Gia, which is one of the least poorest of the Project towns using MOLISA criteria but the sixth poorest using the WPI, 18.7% of males and 18.4% of females completed secondary schooling. However, Van Gia is also more closely linked to the rural hinterland than some of the other Central Coastal Region towns and has not experienced the same influx of urban educated workers from elsewhere. Ironically, apart from the small town of Quang Khe in the Central Highlands Province of Dak Nong, the other three Project towns (Ea T’ling: M-45.6%, F-32.9%; Gia Nghia: M-40.9%, F-30.2%; and Dak Mam: M-66.7%, F-50%) have higher completed secondary schooling rates than nearly all of the Central Coastal Region Project Towns. One of the major reasons for this has been the influx of public sector officials as part of a concerted program by the Government to accelerate the development and integration of the Central Highlands into the wider political and economic frameworks of Vietnamese society. Yet it also has to be stressed that in the peri-urban areas of these upland towns, which were not targeted by the Socioeconomic Survey, the educational levels of both males and females are likely to be lower than in the actual urban wards not because of distance but primarily because households in these peri-urban areas are generally poorer, while older people, especially women, are not likely to be very competent in the use of the Vietnamese language. The average income per capita is VND 318,000 per month (VND 326,000 for males; VND 298,000 for females) in the Project area. Phan Thiet is the least poor town (by MOLISA criteria but not by WPI criteria because of the high cost of water with an average income per capita of VND 410,000 per month (VND 431,000 for males and VND 375,000 for females), with the highest per capita per month of VND 441,000 in Dak Mam (VND 441,000 for males and VND 445,000 for females). Actually the average per income per capita is higher in all Central Highland Project Towns – with the exception of Quang Khe - than those in the Central Coastal Region. Cam Ranh is the poorest town based on the WPI with an average income per capita of VND 307,000 per month (but with VND 309,000 for males and VND 308,000 for females the gender differential is the least among all areas). However, it is the town of Tan Son with an average income per capita of VND 245,000 (VND 251,000 for males and VND 224,000 for females)6 that has the lowest average income per capita of the towns in the Project areas. Explanations for the towns of the Central Highlands
6 It has been suggested that the vestiges of matriarchy account for the higher per capita incomes of females in these Central
Highland towns but this needs to be evaluated critically via detailed intra-household study of livelihood assets, which was not attempted as part of this TA.

TA 4485-VIE: Central Region Small and Medium Towns Development Project FINAL REPORT Appendix 13, page 16
June 2006
having higher per capita incomes include the influx of public sector financed programs, the exponential growth in demand for goods and services, and the performance of coffee and rubber industrial crops. Tan Son, although located on the Phan Rang-Dalat Highway, is a small town with little investment by either the public or private sector and there is not a great deal of sustained economic activity.
Taking a stratified approach to monthly average income per capita, it can be seen that the lowest quintile has an average of VND 97,100 per month, the second lowest quintile VND 188,700 per month, the middle quintile VND 267,600 per month, the second highest quintile VND 377,700 per month, the highest quintile VND 662,000 per month. However, to understand indices of inequality without resorting to either the Gini coefficient or Thiel index of inequality, the following table illustrates the quite substantial differences in income structures among the Project towns:
Table A13-2 Income Structures in Project Town Quintile 1 Quintile 2 Quintile 3 Quintile 4 Quintile 5 Ca Na 18.5 27.8 13.0 20.4 20.4 Cam Ranh 12.0 26.0 23.0 21.0 18.0 Ea T’ling 8.3 9.3 14.8 29.6 38.0 Gia Nghia 11.9 9.2 14.8 29.6 36.0 Ninh Hoa 38.9 16.7 16.7 15.7 12.0 Ninh Thuan 34.3 26.9 28.7 8.3 1.9 Phan Thiet 11.9 11.0 22.9 22.0 32.1 Song Cau 24.1 25.9 15.7 24.1 10.2 Tuy Hoa 18.0 19.8 25.2 18.9 18.0 Quang Khe 32.4 25.5 17.6 12.7 11.8 Dak Mam 1.0 8.1 21.2 32.3 37.4 Tan Son 22.4 25.5 25.5 19.4 7.1 Van Gia 24.5 34.7 15.3 16.3 9.2
Source: TA Socioeconomic Survey, 2005 The three most “unequal” towns in the Project area are the Central Highland towns of Ea T’ling, Gia Nghia, and Dak Mam and none of these towns rank very high on the WPI. The most likely explanation for the disproportionate share of income that households in Quintile 4 and 5 are related to the factors mentioned above. Public sector remuneration packages and sources of both formal and non-formal income with households deriving most of their income from the private sector (actually many public sector officials also supplement their income from private sector-based activities) coupled with substantial investment activity in the two years since Dak Nong was designated as a separate province in the Central Highlands, is the most plausible explanation. The very low share of Quintile 1 in Dak Mam or even Quintile 2 in the same town (9.1% of total income share) defies rational explanation at this juncture although it is possible that peri-urban households were also included in the household-based surveys (as of course they should be in a WSS that links urban with peri-urban spaces in towns) and such households have lower cash incomes but greater financial households (land and livestock especially) so there is a need to be careful when assessing inequalities based on income differences. Putting a human face to poverty and vulnerability in the Project towns is not that difficult. In the Central Coastal Region Project Towns, households that require at least one economically active person (or potentially economically active person) to forego livelihood opportunities (typically a married woman and to a lesser extent older daughters) to care for household members rendered ill from some waterborne illness such as diarrhea or worse such as dengue fever are in a problematic livelihood position. The Socioeconomic Survey demonstrated that the poorest

TA 4485-VIE: Central Region Small and Medium Towns Development Project FINAL REPORT Appendix 13, page 17
June 2006
quintile spends slightly more of its income on health related expenditure than other quintiles (VND 5,923.1 per month) compared to the middle quintile (VND 16,056 per month) or the highest quintile (VND 32,442.9 per month). This, however, means that better off households can afford greater expenditure to invest in their wellness. The individual socioeconomic profiles prepared for each of the project towns quantifies this on a disaggregated basis.
Table A13-3 Percentage of Monthly Expenditure
Food Water Healthcare Education Clothing Leisure Public
Utilities Tuy Hoa 64.3 0.9 8.8 14.4 7.4 4.2 Song Cau 63.6 1.6 4.6 7.5 6.7 9.0 5.5 Cam Ranh 55.8 2.3 4.1 15.0 7.8 2.7 3.3 Ninh Hoa 52.8 1.3 4.2 13.8 7.8 11.7 6.4 Van Gia 65.0 1.9 7.7 8.6 4.9 0.9 9.3 Tan Son 61.6 2.0 4.0 14.2 5.5 0.5 6.9 Ca Na 59.2 15.6 14.7 15.5 3.0 5.8 4.0 Thap Cham 67.1 2.9 3.8 10.4 5.2 5.6 4.7 Phan Thiet 55.7 1.9 7.3 1.3 5.5 8.5 7.8 Gia Nghia 62.9 0.5 5.4 11.0 6.9 8.1 4.9 Ea T’Ling 62.8 0.0 2.4 15.4 6.1 4.7 4.3 Dak Mam 62.2 0.0 3.7 11.6 9.9 7.7 4.6 Quang Khe 76.7 0.0 4.5 6.8 4.2 3.6 3.8
Source: TA Socioeconomic Survey 2005 (where percentages do not equal 100% expenditure could not be categorized)
If we add expenditure on foodstuffs (include payments for water) to this calculation the lowest quintile in the poorest WPI town (Van Gia) would spend VND 91,290 per month (which is nearly the average of VND 97,100 per capita per month) but in the least poor town (Tuy Hoa) a similar household would spend VND 77,790.3 per month (hence nominally VND 13,500 per month or VND 162,000 per year better off). By way of contrast, a household in the middle quintile using the same examples would spend VND 241,177 per month per capita in Van Gia and VND 182,031 in Tuy Hoa (nominally VND 59,146 per month or VND 709,755 per year better off). For the highest quintile, once again using the same examples, households in this quintile would spend VND 419,273 per month per capita in Van Gia and VND 405,777 per month per capita in Tuy Hoa (nominally 13,495 per month or VND 161,948 per year better off). The relevant point that is being made here is that it is not really an issue of what percentage of household expenditure per se is allocated to different expenditure categories but the fact that better off households can spend more of their monthly income on better foodstuffs (and this includes more water for drinking and cooking purposes) than poorer households. Moreover, what is being spent on health-related services is not simply “band-aid” expenditure (e.g. antibiotics for waterborne illnesses when often oral re-hydration salts is all that is needed) but also on preventive healthcare (e.g. this might include antiseptic cleansing liquids) unlike poorer households when sent from clinics (supposedly providing services free-of-charge but in fact often indirectly charging for both services and more importantly medicines) is an issue that needs to be understood. Water-related illnesses have an immediacy that many other illnesses do not have and immediate remedial treatment is necessary. However, there is an issue related to ability and willingness to pay – and also considerations linked to demand driven interventions – of how the real cost of poor WSS impacts upon poorer households in ways that are often overlooked, including by the poor households themselves.

TA 4485-VIE: Central Region Small and Medium Towns Development Project FINAL REPORT Appendix 13, page 18
June 2006
A waterborne illness such as a serious case of diarrhea during the dry season – most common time of the year in all towns for this type of illness7 – is a costly affair for most households but more so to the poorest and most vulnerable households. Typically diarrhea in younger children or older people can last up to five days if it is a serious case. In most instances this requires a caregiver (usually female members of the household) to provide the necessary care. Common enough in most parts of the developing world but in households that are also dependent on the income generating activities of females (including waged employment), the opportunity cost of such waterborne illnesses adds considerably more to what it costs households to cope with members suffering from waterborne diseases than would otherwise be so. Typically, the opportunity cost of one case of serious diarrhea is in excess of VND 225,000 based on five days of forgone earnings (typically estimated at VND 35,000 per day) and over VND 50,000 in antibiotics dispensed by drug stores. Poorer households in most of the Project towns report on average 1 to 3 cases of serious diarrhea per dry season – hence up to VND 675,000 per annum – which could be invested in WSS – related interventions that could offset the “hidden” opportunity costs of more serious waterborne diseases. Targeting the poor and treating them as “consumers” rather than simply “beneficiaries” as will be argued elsewhere in this Social Analysis is something the EA may well buy into particularly since it would translate to a win-win outcome for all stakeholders. However, unregistered migrants are more difficult to target because they are not considered by ward and commune authorities (or indeed the Viet Nam Women’s Union which is important for the role the VWU is mooted to play in Project implementation) to be “permanent” residents of the wards or communes they currently reside in. In each of the Project towns it proved difficult to access this group but the TA Team estimate that at least 10% of the local population can be placed in this category and generally this group contains some of the poorer and more vulnerable people living in Project towns. In the Gender Analysis, the social and economic impact on unregistered migrant women will be analyzed. However, it is noted that many of these unregistered migrants come from poorer areas in the Northern Coastal Region where there are fewer livelihood opportunities available but this in no way negates designing a WSS-related Project that also targets this group. Improving livelihoods in ways that benefit all residents of towns and peri-urban areas, irrespective of their legal residential status is imperative because WSS-related livelihood improvements need to target everyone. However, this is not always understood by all TPC officials in the project towns. The story from Ca Na (see Box A13-1) reflects more extreme contexts than are likely to be found in most of the other Project towns but the issues raised in relation to lack of permanent registration apply to all other unregistered migrants. Via the Participation Strategy and this Social Analysis) a series of interventions are designed to target this group joint activities initiated by the VWU and a suitable NGO, a series of interventions are designed to target this group.
7 In Van Gia during the last dry season, all males under the age of 5 had at least one bout of diarrhea as well as 77.8% of females
but rates vary widely with lowest rates in the Central Highlands that can be seen in the individual Socioeconomic Profiles for each of the project towns

TA 4485-VIE: Central Region Small and Medium Towns Development Project FINAL REPORT Appendix 13, page 19
June 2006
Box A13-1 A Story from Ca Na
During the TA Team visit to Ca Na, it was requested of the Commune People’s Committee that it identify unregistered migrants for the TA Team or at least provide it with an indication of possible numbers (including on a seasonal basis). The CPC stated that unregistered migrants lived in Ca Na but no specific measures were adopted to target them and the VWU representative stated that it would prove difficult for her organization to target such people because they lacked any form of collateral including social collateral for microfinancing purposes. However, during an interview with a female health worker, the local head of the Public Security Bureau dropped by to listen to the interview (not an unusual practice) and he unreservedly told the TA Team that he had records on unregistered migrants and he would take us to see a few households or would at least direct the CPC to facilitate such a meeting. This turned out to be a very straightforward process because a group of more than 35 households were living behind a chest-high wall at the back of the CPC office. What transpired is very interesting. To physically reach the households, the TA Team was required to literally climb over a wall because the CPC had told these unregistered migrants that they could occupy this area on a temporary basis but they could not knock a hole in the concrete wall as they would not be able to occupy this land on a permanent basis (it was learned that many of these households have been here for over two decades). On inspecting WSS-related facilities, it was found that (a) households normally have to buy water for cooking and drinking purposes on a daily basis (typically in 40 liter plastic containers); (b) for defecation purpose, people normally defecated in simple toilets over the inland salt-waterway; and (c) for the most part, solid waste is simply disposed of in the inland salt-waterway (salt is harvested in this town by local residents although not for human consumption). On the face of it, what the TA Team was able to witness among this group of unregistered migrants were WSS contexts that would benefit from interventions planned by this Project, but without specific targeting, this group would not benefit. Household members were asked what it was like to be an unregistered migrant living in Ca Na. It comes as little surprise that the TA Team was told that local officials did not harass them (actually the Head of the PSB in Ca Na appeared to be quite reasonable) but being unregistered, this posed some problems in terms of accessing free health and education services. Although more importantly, it was impossible for them to access any services offered by organizations such as the VWU because they are not considered permanent residents and have not been able to even initiate steps towards permanent registration (this involves the CPC accepting such people as permanent residents, ensuring that notations on ID cards are made, and issuance of the Family Registration Book). Unregistered migrants that the TA Team interviewed said their real priority was to secure permanent registration because that would enable them to access the same range of services as other people in Ca Na with permanent registration. These same people said their lives would improve if they could pay less for water. In the present context, they are unable to improve their latrines because they could not finance such WSS-related investments. It was obvious to the TA Team that this group needs to regularize its residential status concurrently with any Project-related interventions.
Source: TA Socioeconomic Survey, 2005.
V. ETHNIC MINORITY DEVELOPMENT ISSUES IN PROJECT TOWNS
During field-based studies undertaken for this TA, it was asserted – sometimes rather vigorously – by spokespersons for the EA in some of the project towns that all or most of the population consists only of the more numerous ethnic Kinh people. It is not in dispute that the majority of the people in each of the project towns, although not necessarily in all of the wards (especially those in the peri-urban areas that are more closely akin to rural communes), are from the more numerous ethnic Kinh group. However, even in the coastal town groups of Cham (also known as Chiem Thanh, Hoi and Hroi) are found in the provinces of Phu Yen, Binh Thuan, and Ninh Thuan. It is inconceivable that such an ethnic group is not to be found in the project towns of these three provinces, the central coastal region of Viet Nam being after all

TA 4485-VIE: Central Region Small and Medium Towns Development Project FINAL REPORT Appendix 13, page 20
June 2006
the center of Champa until it was absorbed by the Nguyen Dynasty beginning circa the Fifteenth Century. Similarly another Malay-Polynesian socio-linguistic group – the Rag Lia and probably the original indigenous ethnic group of the central coastal region – are found in very small numbers in Ninh Thuan, Binh Thuan and Khanh Hoa.
Another significant ethnic minority group in the central coastal region is the Hoa (or Sino-Vietnamese) who, like the Kinh, migrated to this region. In the post-1975 period significant numbers of the Hoa left Viet Nam because they were considered to be undermining the socialist revolution. Although in the post Doi Moi period circa 1989 some of this number have returned to Viet Nam including to the towns of the central coastal region. The exact numbers of Hoa residing in the project towns of Binh Thuan is unknown, or at least unknown by the EA, but the observations of the TA Team suggest that Hoa can now be found in all towns of the central coastal region. Of the ethnic minority groups, the Hoa are more likely than not to be urban in nature and culturally–speaking. While from a different ethno-linguistic group (Han) than the Kinh (Viet-Muong) in terms of social organization, cultural beliefs, and religious practices, they are much closer to the Kinh (often vigorously denied in the recent past because of the animosity between China and Viet Nam especially in the initial post Viet Nam war period) than to either the Cham or Rag Lia. The subtleties of these ethnic differences are typically not considered by central government agencies tasked with overseeing the provision of public sector infrastructure in each of the project towns. For the most part, it is of no consequence because the ethnic minority groups are embedded in the project towns of the central coastal region in ways that make it impossible to target these groups as a discrete sub-group. Spatial residential patterns influenced by proximity of close kindred might mean that several households or even several families within one household can be found in close proximity to each other but the situation is unalike that which prevails in some of the peri-urban areas of project towns in the Central Highlands. Stated simply, the actual reality is that there is no need to design an EMDP to cover some of the project towns. Poor and vulnerable groups, including individual ethnic minority households, will be targeted by a more sensitive approach (at the centerpiece of this approach is the demand–driven rather than supply–driven approach) to WSS–related livelihood improvements that facilitates the enabling environment (e.g. mobilization of savings) to enjoy the benefits that this project will bring to people via relevant WSS–related investments. It is the project towns of Dak Nong province in the Central Highlands that more attention has to be devoted in this analysis of ethnicity. Ethnic minorities in the four project towns account for 17.6 percent of the total population ranging from a high of 62.6 percent in the small town of Quang Khe to a low of 9.9 percent in Dak Mam another. Some of the groups residing in the peri-urban areas of project towns in the Central Highlands should strictly be classified as indigenous peoples rather than ethnic minorities as they have resided in these areas long before the inward migration of the lowland Kinh and other upland ethnic minorities from elsewhere in Viet Nam. However, because the Government of Viet Nam feels very uncomfortable with the use of the term indigenous peoples, the ADB and other providers of ODA have acceded to its request to refer to all non-Kinh groups as ethnic minorities. This is not satisfactory from an ethnographical perspective and assemblies of indigenous peoples the world over are highly critical of such conceptualizations but this social analysis needs to be structured in contexts that the Government will claim ownership over the findings of the analysis – necessary for the development of an

TA 4485-VIE: Central Region Small and Medium Towns Development Project FINAL REPORT Appendix 13, page 21
June 2006
Ethnic Minority Development Plan (an ADB statutory requirement) – and not find reasons to reject any recommendations that are made.8 Basically most of the upland ethnic minority groups are found in the peri-urban areas of the project towns. Either these people resided here or in close proximity to the newer urban settlements on a historical basis, were attracted here more recently because of greater access to a range of public goods and services, or as part of the Government sedentarization policies in the post-1975 period that in part have been linked to the development of industrial crops (notably coffee, tea, rubber and pepper). The stories told about integration of the Central Highlands into the broader political economy and socio-cultural structures of Viet Nam are considerably more complex than this though and some brief background information is necessary to contextualize the existing situation in the project towns bearing in mind that this is not an anthropological exercise.9 That the upland peoples of the Central Highlands are culturally different to the lowland Kinh is not in dispute. Neither is there any dispute over the fact that most of these upland peoples are culturally different to either other upland peoples from the northern mountainous areas of Viet Nam or the lowland ethnic minority groups of central and southern Viet Nam. In fact, official discourses in Viet Nam celebrate this difference and unlike some other DMC indigenous or ethnic minority peoples, Viet Nam accords full citizenship status to all ethnic groups. The ethnicity of each Vietnamese citizen is recorded on their official identification card to symbolize this recognition of difference, even if ethnographers argue that such a practice forces people to declare or have declared for them an ethnic identity that they must persist with. Hence, at this level the principle of social inclusion rather than social exclusion operates and must be considered to be very positive within the political culture of Viet Nam. However, there are other discourses also in existence that are less socially inclusive or at least are based on the cultural “superiority” of Kinh discourses. Such discourses are premised on the notion that the culturally superior groups know what is best for supposedly inferior groups. People belonging to the latter if they wish to partake of the concrete benefits of modernity, albeit broadly defined, are required to give up “backward” and “harmful” practices ranging from attempts to derive their livelihoods from shifting cultivation, communal notions of solidarity, traditional birthing practices, and spiritual or mystical approaches to the use of and conservation of natural resources.10 By embracing dominant cultural and economic beliefs and practices, the ethnic minority peoples in Viet Nam join the mainstream with the more numerous cultural group. Ethnicity in such discursive practices becomes a commodity that ethnic minority groups can leverage to add value to their
8 For a fairly balanced perspective on issues related to ethnicity in the Central Highlands see: A. Terry Rambo (2003), Viet Nam in
Colin Mackerras (ed), Ethnicity in Asia, London and New York: Routledge/Curzon, pp 108-35. 9 There are several outstanding anthropological studies of minorities in the Central Highlands. These include: Georges Condominas
(1997), We Have Eaten The Forest: The Story of a Montagnard Village in the Central Highlands of Viet Nam, New York: Hill and Wang; George Hickey (1982), Fire in the Forest: Ethnohistory of the Vietnamese Central Highlands, 1954-1976, New Haven: Yale University Press; and, Oscar Salemik (1991), Mois and maquis: The invention and appropriation of Viet Nam’s Montagnards from Sabatier to the CIA, in George Stocking (ed), Essays on the Contextualization of Ethnographic Knowledge, History of Anthropology, Vol. 7, Madison: University of Wisconsin Press, pp. 245-84.
10 See, Nguyen Thi Hang (2001), Van de noa doi giam ngheo va thuc hien chinh sach nguoi co cong voi cach mang o vung dan toc thieu so (Problems of hunger eradication and reduction of poverty and realization of policies for revolutionary workers in the ethnic minority regions), in Can dan tuc thieu so Viet nam the ky XX (Viet Nam’s Ethnic Minorities in the Twentieth Century), Hanoi: Nha xuat ban chinh tri quoc gi, pp. 195-205.

TA 4485-VIE: Central Region Small and Medium Towns Development Project FINAL REPORT Appendix 13, page 22
June 2006
sentinel existence. In this context, ethnic minority groups are more likely to be assimilated rather than integrated with other groups in society.
Such discourses are not unique to Viet Nam but they do presage the approach the project needs to take if it is to address the concerns of ethnic minority peoples living mostly in the peri-urban areas of the project towns. If the project buys into the dominant cultural discourses then the interventions it plans, especially in the fields of improved sanitation and hygiene behavior, relegate ethnic minority peoples to a category where others know what is best for them. Via the series of participatory consultations undertaken as part of the TA and the subsequent EMDP, every attempt has been made to avoid such an outcome but it also has to be recognized that local attitudes do not change overnight. Realistically most of the technical specialists who will be involved in the implementation of the actual loan project will find it quite hard to jettison existing biases and prejudices. Fortunately in Dak Nong the indigenous ethnic minority groups, notably the Mnong and Ma (Mon-Khmer ethno linguistic groups) 11 while subject to some of the practices associated with resettlement programs, including most importantly the dissolution of the long-houses (basic unit of habitation on a traditional basis and which housed a range of extended households and sub-groups made up of inter-generational families), have not had to bear the brunt of government suspicions concerning their religious beliefs. Unlike the Ede and Gia-rai, two ethnic minority groups (Malayo-Polynesian ethno linguistic groups and historically closer to the Cham in the coastal regions) that embraced forms of evangelical Protestantism, the Mnong and Ma largely escaped being sucked into this vortex. Few Mnong and Ma are Protestants, most being Vietnamese Catholics in a religious organization that is more comfortable with the government than the Protestant religious groups in the Central Highlands. This is of necessity, painting a broad brush but one that is necessary to understand the historical political economy of the Central Highlands. However, in many other respects there are common themes that run through all the histories of upland ethnic minority peoples living in the Central Highlands and Dak Nong is no exception to the rule. In the post 1975 period, the influx of migrants from elsewhere in Viet Nam – including the mountainous areas of Northern Viet Nam – resulted in arable land having to be shared with both indigenous and migrant peoples as both groups were formed into cooperatives. When the cooperatives were dissolved and land allocated to the cooperative members all households in the putative interests of equity were allocated land. It was claimed at that time that there was more than enough land to go around but in actual fact, not all of this land was suitable for the industrial cash cropping regime being actively promoted and lowland Kinh were better placed to receive much of the good land. This is not simply a claim made by indigenous peoples but is corroborated by a closer analysis of the land allocation processes. To make matters worse, indigenous people in the name of conserving the forests were denied access to forests and were actively discouraged from engaging in shifting agriculture. While there are now moves afoot to return portions of the forests back to indigenous people much of the existing forestland has been rendered non-productive through extensive logging.
Now of what relevance is this to ethnic minority peoples living in the peri-urban areas of the project towns? The answer is that there is much of relevance to understanding present day livelihood dynamics. Despite a sorry history of
11 See, Dang Nghiem Van, Chu Thai Son and Luu Hung (2000), Ethnic Minorities in Viet Nam, Hanoi: The Gioi Publishers, pp. 58-62,
88-91, and 198-220 and Khong Dien (2002), Population and Ethno-Demography in Viet Nam, Chiang Mai: Silkworm, pp. 28-68.

TA 4485-VIE: Central Region Small and Medium Towns Development Project FINAL REPORT Appendix 13, page 23
June 2006
dispossession and alienation for a significant number of upland ethnic minority peoples in the Central Highlands not all of these people were the “victims of progress”. Some households were able to leverage their closer relations with the Kinh authorities or were co-opted by the Government and party12. Households in such villages, especially on the fertile red soil plateaus, grew rich because they were able to cultivate industrial crops, practice sericulture, adapt new cereal cropping technologies, and raise livestock for the market. These households initially used the cooperatives to acquire seedlings, credit, and technical assistance. They also planted cash crops in their home gardens (including coffee when prices were very high on the world market). In the process, traditional wooden two-story pile houses were replaced with Vietnamese style single-story ferro-cement houses. Into these houses went all the trappings of consumerism (CD/DVD/TV, furniture, motorcycles and more recently mobile phones which are owned in greater numbers than in the Central Coastal Region Towns according to the TA Socioeconomic Survey) and by the late 1990s it was very difficult to differentiate such indigenous peoples from the migrants, except by physical characteristics. This type of indigenous person did not completely jettison their ethnic identity but by then they were every much a Kinh as they were Mnong or Ma. It was this type of indigenous person that Vietnamese developmental discourses could point to as evidence that ethnic minority peoples could change their ways if they wanted to. In relation to a resource such as water, both the M’nong and Ma traditionally hold a variety of beliefs and myths that link communities to the earth, mountains, forests and rivers. A sophisticated ensemble of folk songs, folk tales and ritualized epics express the attachment of the M’nong and Ma to their indigenous land and provide a series of meta-level narratives that relate the creation of the world. These indigenous beliefs and practices still provide a strong sense of meaning to most Mnong and Ma people, including those who in many respects have become somewhat bicultural as they have embraced some of the more important aspects of the Kinh culture (not simply becoming effectively bi-lingual). Of relevance to a project of this nature, both the Mnong and the Ma have a clearly stated cultural preference for water they can extract from rivers and ponds during the wet season (and during the dry season small waterholes are dug in the river-bed where possible) and natural springs (an important source of water during the dry season and considered the best quality water of all by both groups) or dug wells (which often dry up during the later part of the dry season). It is not simply an issue of paying for water (which is important for poorer Mnong and Ma) but also the clearly stated preference that does not exist among the Kinh (of course they too would prefer not to pay for water if they could access it free-of-charge). As the Mnong and Ma have a different cultural understanding of water than the Kinh, the same applies to issues associated with environmental sanitation and awareness. In times prior to inward migration such issues were of little consequence for upland ethnic groups because they were not subject to over-crowding in the upland valleys where most of the villages were located and spaces surrounding houses and discrete villages were more environmentally sound than they are today. This is not some figment of the ethnographer’s imagination but something older informants from both groups related to the TA Team. However, today as many households have resettled (not always voluntarily) to the peri-urban areas of the Project towns in the Central Highlands. They have faced problems adapting to change in ways that are not problems for Kinh and other ethnic minority inward migrants. Typically, the
12 During the actual war in Viet Nam there were indigenous peoples from the Central Highlands fighting on both sides although those mobilized by US Special Forces achieved the most notoriety.

TA 4485-VIE: Central Region Small and Medium Towns Development Project FINAL REPORT Appendix 13, page 24
June 2006
A Ma Villager and His Pigs in Quang Khe
On a wet day in late October 2005, the TA Team visited a group of ethnic Ma households on the outskirts of Quang Khe after being informed by the VWU leader (herself an ethnic Ma woman) that such a visit would enable a better understanding of why the proposed Project design might not work for all households in Quang Khe. The man in his late 50s was looking after grandchildren playing in the mud (and having fun) while his marital spouse was away working on their swidden land some six hours distance on foot higher in the uplands (without shifting agriculture even this household could not derive a sustainable livelihood because shifting agriculture is important for food security). He told the TA Team that his primary responsibility was to look after the grandchildren and make sure the pigs (also had some chickens but he was not sure where they were at the time of our visit) were fed and the pens they were housed in kept clean. Admittedly it was raining but the TA Team observed or rather sat in this pleasant man’s house that had a earth floor with the pungent smell of pig waste only too evident. He was asked why he did not locate the pig pen to the south of his house to avoid this problem – principally run-off from the pen caused by the rain – to which he replied he had not thought of this solution. It was observed that other households were in a similar position: a simple intervention would improve environmental sanitation in this peri-urban settlement overnight. The TA Team were then invited to inspect the source of drinking water: a stream some 800 meters down the slope from the village in the valley but where on the western slope coffee was being cultivated (by better-off villagers he said). One of the TA Team members casually enquired where one goes to the toilet. His reply was in the bushes just of the track, to which the TA Team Member replied what happens at night and he laughed as he replied not down here unless one wants to be bitten by a snake. As the TA Team got closer to the source of water – a small dug well close to the stream – it was realized that if all or at least a lot of villagers used the bushes on the way to the stream (and many stated they did) then questions would have to be raised about water quality (during the dry season the informant told the TA Team that his grandchildren are always sick). Additionally, the TA Team enquired about pesticide use and possible residual run-off from the coffee being cultivated on the western slope. The informant told the TA Team that coffee-growers were not permitted to use pesticides during the dry season (but entomologically this is when pesticides need to be used) and consequently there was no problem. The WSS–related livelihood issues are somewhat different here than in the actual urban wards but as this peri-urban village is part of one of the Project towns it makes little sense to address such livelihood issues simply where the engineers have designated the piped water supply system is technically and financially viable.
Mnong and Ma are now raising pigs and chickens in close proximity to their living quarters (these are of course very important livelihood based activities for such households including especially women) but on the steep inclines of some of the peri-urban settlements the livestock are literally being penned in spaces above the houses on the slopes. Health-related environmental conditions in such households, where people and livestock live in very close proximity to each other, are less than satisfactory. Adding to this concern is the persistence of reports that the Avian flu might prove to be more than an epidemic if people are not careful. The TA Team found that the overall health conditions of household members were generally poorer than non-indigenous ethnic groups living in the same peri-urban centers. However, it was difficult to disaggregate this data by ethnicity during the actual TA Socioeconomic Survey.
The EMDP has been broadly designed to deal with the above specific cultural issues in ways that will enable the Mnong and Ma to improve their WSS–related livelihood outcomes in ways that treat both groups (and any other ethnic minority groups) with dignity and respect. Via participatory consultations with the Mnong and Ma and TPC officials, an enabling environment will be facilitated to ensure that ethnic minority groups in the Central Highlands are able to claim ownership of WSS–related livelihood improvements. Recognizing and celebrating difference is part of the empowerment process (best achieved by local stakeholders designing
TA 4485-VIE: Central Region Small and Medium Towns Development Project FINAL REPORT Appendix 13, page 25
June 2006
their own awareness materials to suit locality specific cultural contexts) but so are processes that are grounded in existing realities (important to grasp synergies between traditional livelihoods and those derived from growth in the modern export-orientated economy). It also needs to be noted that while the EMDP is primarily targeted at upland ethnic groups indigenous to the Central Highlands because it is also likely to be linked to a JFPR grant financed intervention (suggested details elsewhere in this Social Analysis) other upland ethnic minority groups from the Northern Mountainous Region (notably the Tay, Thai, Nung, San Chay and Hmong) will also be targeted if assessed as living in poverty. Similarly, poorer Kinh in the same category as upland ethnic minority groups will also be targeted. This in part is at the request of the TPC in each of the four Project towns in Dak Nong, but also a reflection of one of the important objectives of this Project as embodied in the Community-Driven Water Supply and Sanitation Program.
VI. ABILITY AND WILLINGNESS TO PAY
There clearly is a willingness to pay for access to improved water supply if individual households can afford to pay for tap connections in most of the project towns. The only possible exceptions are in the smaller project towns of the Central Highlands Region where there are also cultural issues that have to be taken into account. However, even here where people perceive they lack access to water for drinking and cooking purposes during the dry season there is some willingness to pay for it although not necessarily tap water supply. At present, two of these towns – Dak Mam and Quang Khe – see very few households that purchase water during the dry season, especially among ethnic minority groups. But what the incomplete data do not show is that most of the households the TA Team interviewed during fieldwork stated that waterborne diseases (notably diarrhea) were a major livelihood problem during the dry season: more so than in the past. Apart from these two towns, there is only one other town – Van Gia which actually has a lower WPI than actual MOLISA poverty rate because people pay less for water than average tariff – where people might be not be willing to pay for access to an improved water supply. Yet in the dry season diarrhea rates are the highest of all project towns and the second highest in the wet season. As pointed out in the Socioeconomic Profile for this town that applies to all towns as well, is the need to assist the poorer households afford tap connections. The interventions discussed below address this problem. Hence, it can be assumed for the most part people will pay what they can to afford access to safe water for drinking and cooking (and also where possible washing) purposes. That the existing household access to piped water varies from a high of 71.6 percent of households to no households in either Dak Mam or Quang Khe also reflects the fact that there is no piped water system in either town. Willingness to pay for improved drainage varies reaching as high as 96.2 percent in Quang Khe (just ahead of Van Gia). However, it is also likely in actual reality people in towns like Quang Khe would be quite reluctant to pay for such improvements out of their own pockets. What people try and do is ensure that water does not flow into their houses during heavy downpours and they dig very small temporary drains to rid areas surrounding the housing compound of water. This is not a long-term solution but a coping strategy in the absence of the appropriate drainage system. The same applies to the disposal of solid waste. In the larger

TA 4485-VIE: Central Region Small and Medium Towns Development Project FINAL REPORT Appendix 13, page 26
June 2006
towns this is more of an environmental health problem than in the smaller towns but perhaps the best way to illustrate the livelihood priorities of people surveyed is to examine the following table, which produces quite variable priorities.
Table A13-4 Livelihood Priorities in the Project Towns
Food Security
Adequate Healthcare
Income Generation Activities
Easy Access to Affordable
Micro-Finance
Children’s Education
Household Improvement
WSS-related Improvement
Tuy Hoa 37.0 36.1 13.0 0.9 1.9 2.8 8.3 Song Cau 38.0 16.7 5.6 22.2 0.0 14.8 2.8 Cam Ranh
16.3 15.3 23.5 15.0 5.1 13.3 11.2
Ninh Hoa 13.0 29.6 13.0 6.5 2.8 13.0 22.2 Van Gia 28.3 10.1 31.3 0.0 8.1 16.2 7.0 Tan Son 28.7 9.6 21.3 16.0 5.3 3.2 14.9 Ca Na 30.2 15.5 22.1 12.5 4.8 14.9 35.0 Thap Cham
17.5 24.7 43.3 1.0 6.2 0.0 7.2
Phan Thiet
10.1 11.9 29.4 10.1 0.9 9.2 28.4
Gia Nghia 21.1 41.3 12.8 1.8 4.6 2.8 15.6 Ea T’Ling 5.6 21.5 11.2 11.1 6.5 2.8 44.1 Dak Mam 2.0 59.0 0.0 4.0 0.0 0.0 30.0 Quang Khe
44.6 15.8 15.8 2.0 3.0 5.0 10.9
Source: TA Socioeconomic Survey 2005
Meanwhile, willingness to finance improved latrines ranges from a high of 92.9 percent in Quang Khe to a low of 42.2 percent in Phan Thiet. However, 78.9 percent of households in Phan Thiet already have access to improved latrines compared to “nil” households (according to the TA Socioeconomic Survey although the TA Team during participatory consultations came across some households with such latrines). The enabling context has been built into the Community-Driven Water Supply and Sanitation Program. While this component has been designed to add value to the other Project components – especially improved water supply, drainage and wastewater management, and solid waste management – it has also been designed to ensure that more people in each of the towns (including poor and vulnerable groups and ethnic minority groups where relevant) and those not covered by the service area can enjoy the benefits of more affordable access to WSS activities. It will build upon successes of previous ADB–financed WSS projects in Viet Nam and also use insights that can be gleaned from similar programs that have been successfully implemented by the government, including those with support from other ODA sources and civil society groups (e.g. International Development Enterprise). It will treat WSS users as customers or consumers rather than beneficiaries, as it attempts to develop a program that works in participatory ways with local communities. In the context of improved livelihood outcomes, it is deemed that such an approach while enhancing the ability of customers or consumers to pay for WSS–related livelihood improvements thereby reducing expenditure on WSS–related illnesses will also empower local people by enabling them to have more self-esteem than if merely treated as beneficiaries. An incremental approach rather than a “total sanitation approach” may be more appropriate in WSS service provision wherein services and facilities are initially provided to a certain segment of the

TA 4485-VIE: Central Region Small and Medium Towns Development Project FINAL REPORT Appendix 13, page 27
June 2006
population (i.e. most densely populated areas) then gradually expand to “customers” in outlying areas when economic and affordable. Though the Project may focus on the urban areas of particular sites and towns, the entire population would in fact benefit through various means such as improved road access to markets and other town facilities resulting from drainage improvements, reduced pollution in rivers, lakes, etc. Moreover, the Project would include measures specifically targeting the poor and disadvantaged communities residing in the proximity, but outside, the service areas.
The Viet Nam Women’s Union will work with a suitable NGO (the criteria being one with a successful track record elsewhere in Viet Nam) at the community level but at the provincial level, the Department of Health will also be actively involved. However, it has to be noted that few of the TA Socioeconomic Survey respondents consider that local health centers could not be very effective nor schools, group meetings or the workplace. By way of contrast, peer groups in some towns (especially Van Gia, Ca Na and Phan Thiet) were considered to be very effective. The most effective means of dissemination in nearly all towns is considered to be the mass media. Interestingly for schools where it is necessary to use an entry point for such a program, this is to be completely ineffective. However, it needs to be noted that this is a “reactive” response to how such programs should be implemented and the Project does not have this in mind but rather a “proactive” approach via a consumer driven approach. Loud speakers and billboards and posters that extort people to uphold the values of Vietnamese society might be a useful nation-building exercise but belong to a different genre to what is being proposed by the Project. The sub-components of this component are as follows:
a. The Hygiene and Sanitation Awareness Program (HSAP) aims to develop a
propaganda mechanism to promote environmental sanitation awareness among community residents of selected sites. Community residents here pertain to adults (both gender) and children. The relationships between water, sanitation, health, and livelihood will form the substantive aspect of the Program’s content. More than a mechanism for information dissemination, the program shall produce a community-driven action plan indicating needs for WSS services in each select community. Improving hygiene and sanitation outcomes for peri-urban households will benefit both urban and peri-urban communities.
Using a participatory approach, a community awareness plan (CAP) in each site shall be formulated. This will lay out the propaganda activities that would be carried out in the concerned community.
b. The Community-based Sanitation Finance (CBSF) will facilitate the financing of
the propaganda activities and the WSS program identified by the community residents under the HSAP. Financing of these interventions primarily focuses on (i) achieving full capital cost recovery from users; (ii) organizing community-based financing schemes and organizations to implement them; and, (iii) working with diversified service providers. The social marketing campaign is designed to create and add to the latent demand for such WSS–related facilities using a range of innovative techniques such as helping people calculate the “opportunity cost” of WSS–related illnesses. Via the series of participatory consultations that were facilitated it was found that people are very interested in applying such techniques and understanding the impact on their livelihoods that the calculations reveal. This applies almost as equally to the ethnic minority

TA 4485-VIE: Central Region Small and Medium Towns Development Project FINAL REPORT Appendix 13, page 28
June 2006
groups as it does to the Kinh and hence should not be considered an “ethnocentric” approach.
c. The Demand-driven Livelihood Improvements (DDLI) aims to assist the urban
poor access increased WSS–related livelihood opportunities. These interventions would, however, be demand-driven and would therefore vary from site to site. Community discussions and agreements relating to livelihood would be incorporated in the CAP as part of the action plan. As with the other sub-components, existing community groups such as the local WUs will also be tapped to help identify, design and implement livelihood interventions. Technical assistance will be provided by the VWU at the town and provincial level and an NGO experienced in livelihood development at the community level, which may or may not be involved in the other sub-components.
Some of the more important priorities in the selected towns are listed in the following table:
Table A13-5 Most Important Priorities in the Project Towns
Improved Roads and
Streets
Improved Water
Quality, Quantity
and Service
Better Housing
Improved Sanitary
and Environme
ntal Conditions
Access to Markets
Flood Protection
Improved Drainage
Tuy Hoa 38.5 26.6 6.4 8.3 1.8 3.7 14.7 Song Cau 22.5 9.8 3.9 23.5 2.9 4.9 32.4 Cam Ranh 50.6 5.4 11.8 12.9 12.9 3.2 3.2 Ninh Hoa 21.3 32.4 13.9 16.7 4.6 0.9 10.2 Van Gia 6.1 51.5 15.2 26.3 1.0 0.0 0.0 Tan Son 55.9 21.5 1.1 19.4 1.1 0.0 1.1 Ca Na 18.5 85.5 2.5 15.0 0.3 1.5 0.9 Thap Cham 5.1 3.0 4.0 39.4 4.0 6.1 38.4 Phan Thiet 13.0 2.8 3.7 38.3 1.9 0.9 44.4 Gia Nghia 47.2 22.2 6.5 13.0 9.3 0.0 1.9 Ea T’ling 22.2 42.6 8.3 22.2 0.0 0.0 4.6 Dak Mam 17.2 77.8 0.0 5.1 0.0 0.0 0.0 Quang Khe 5.0 48.0 17.0 1.0 29.0 0.0 0.0
Source: TA Socioeconomic Survey 2005
Limited loan finance of up to US$2.58 million will be available for the awareness program and costs incurred by the NGO selected to support the VWU. This is based on a per capita mobilization cost of approximately US$3.50. Because the VWU will incur costs over and above their normal operating costs, a formula to ensure that the VWU is compensated for additional costs is also necessary. It is totally unrealistic to expect the VWU to be providing support to an NGO where it is incurring additional costs. However, because of the innovative nature of the approach and possibilities for up-scaling financing could also be sought via the JFPR. Self-financing for the tap connections, dug wells, storage tanks, latrines and septic tanks will come through savings by local households that can be mobilized via existing or to be created savings and credit groups or similar. Some reservations were expressed during local participatory consultations by poorer households as to whether they could afford to invest in these facilities at existing market-based prices. However, it was also noted that most of the existing products available on the market – including services associated with digging wells – if they could be provided

TA 4485-VIE: Central Region Small and Medium Towns Development Project FINAL REPORT Appendix 13, page 29
June 2006
at more affordable price levels then self-financing would be more realistic. Based on experiences elsewhere in Viet Nam where the market-driven demand for such WSS–related services resulted in more competition and hence lower prices to the consumers, it is argued here that the with a well designed social marketing campaign the same or similar is likely to occur in the project towns.
Demand–driven WSS–related livelihood improvements will need to be self-financed by local communities. The basis of this approach is that if the local community really wants such improvements, it will find ways to mobilize the finance to do so. In this respect, the most important priorities at the ward/commune level identified during the TA Socioeconomic Survey should be raised again with local communities as part of the participatory processes. Of course there are problems with poorer wards and communes in the project towns and this is perhaps where the JFPR or similar grant financing can be mobilized to provide matching grants to these poorer wards and communes. It is mistaken assumption that poorer communities are not interested in financing WSS–related livelihood improvements if it can be demonstrated they will actually improve livelihoods. This was made quite clear in a number of TA facilitated consultations but the synergies are with a participatory based hygiene and sanitation awareness program. This component will begin 8-12 months prior to the laying of pipes for water supply and where relevant drainage systems and solid waste collection. The rationale for this is that even poorer and more vulnerable households via savings mobilized will be able to finance tap connections (and where relevant storage tanks). An additional 18-36 months will be used to further facilitate the demand–driven financing of other WSS–investments, especially in latrines/bathrooms, at the household level, and other WSS–related livelihood improvements at the community level. However, consultations with a range of poorer and more vulnerable groups suggest that a flexible approach needs to be adopted. It is suggested that a study tour of representatives of poorer and vulnerable groups together with local TPC and VWU representatives be made to those areas in Viet Nam where such approaches have worked very well in recent times. Financing of such a study tour could be via a small portion of the US$2.58 million allocated to the awareness program or it could be included in grant financing from the JFPR if a decision is made to use this source of grant financing to support project interventions.
VII. LIVELIHOOD IMPROVEMENTS
Seasonal vulnerability induced by problematic access to water, especially during the dry season and of course varying from town to town as indicated in the specific socioeconomic profiles of each town should be reduced to a large extent. Full household food security is of course the major livelihood priority for all households in the project towns but this obviously varies from a town like Quang Khe where even before water poverty issues are factored in the official MOLISA poverty rate is 55 percent to the much larger town of Phan Thiet where the official MOLISA poverty rate is much lower at 3 percent but the Project is not financing improved water supply development and expansion in Phan Thiet. Hence, it cannot be argued that linking livelihood improvements to full household food security (which also includes access to potable water for drinking, cooking and bathing purposes) can be claimed for a town such as Phan Thiet. Rather Phan Thiet’s livelihood improvements rest with other interventions such as improved drainage and gains derived from hygiene and awareness program that should result in a decreasing incidence of dengue fever, which is the highest in the project towns. Of the project towns, despite the

TA 4485-VIE: Central Region Small and Medium Towns Development Project FINAL REPORT Appendix 13, page 30
June 2006
rather low WPI, it is Ca Na that is likely to benefit the most because access to potable water year round would clearly result in a decrease in diarrhea which is very high for children five aged five and under. Van Gia town, where the incidence of diarrhea is even higher than in Ca Na will not benefit from improved water supply because as argued elsewhere this component will not be financed in Van Gia. Improved drainage in some of the project towns (Phan Thiet as mentioned above and the other larger towns of Cam Ranh and Ninh Hoa and smaller towns of Song Cau, Tuy Hoa and Van Gia) will mitigate the worst aspects of seasonal flooding (even if only seemingly of relatively short duration in some instances) that have an impact on waterborne diseases, loss of income-generation activities, disruptions to schooling, and damage to houses, shops and public infrastructure. It should be possible to quantify these losses town-by-town (e.g. flooding in Phan Thiet affects up to 3,200 households numbering some 15,900 people up to 15 times per year). However, there are also seemingly more aesthetic values that can also be factored into this livelihood equation and these include how towns physically improve and their residents take greater civic pride in these improved towns than they would otherwise. Aggregating self-esteem on a community-wide basis needs to be considered as a qualitative livelihood improvement. While the gender aspects of these livelihood improvements have been addressed in the gender analysis and incorporated into each of the socioeconomic profiles of the project towns, it is important to note here that improvements to water supply not only afford women the real possibility of accessing potable water for domestic purposes that have a range of multiplier effects. Not only is time spent collecting water (perhaps not an issue in the larger towns) reduced thereby freeing women (and girls) to attend to other activities but if waterborne diseases can be reduced women (and to some extent girls) as the primary caregivers will spend less time providing care to household members that fall ill. In addition, given the high opportunity cost of such illnesses, the WSS–related livelihood improvements would benefit both women and their households. Women not having to worry about their children (or other household members or even themselves) falling ill from diarrhea or dengue fever must induce a degree of both economic and socio-psycho security that is often lacking when WSS is less satisfactory than it should be. The demand–driven interventions should also further develop local entrepreneurship, especially in smaller towns, as households exercise their choice not only on the menu of options they are seeking but on what prices they are prepared to pay. This should lead to the greater development of a market economy grounded in existing and potential livelihood possibilities. However, of equal importance if these demand driven interventions can work – and they have elsewhere in Viet Nam – and an effective public-private sector partnership can be established stakeholders in the project towns (especially the poor and vulnerable) would no longer be conceived as “recipients of charity” or even “stakeholder beneficiaries” and instead as potential customers, producers and entrepreneurs. There is a qualitatively different approach to sustainable livelihood outcomes. In such contexts, these demand driven interventions grounded in WSS-related activities transcend the limited technical and social approaches of earlier generation WSS–designed projects.
Livelihood improvements that this Project will engender are also importantly embedded in project design to involve all of the population in an incremental approach to hygiene and sanitation. The specific sub-component focusing on

TA 4485-VIE: Central Region Small and Medium Towns Development Project FINAL REPORT Appendix 13, page 31
June 2006
awareness–based issues is not only designed to improve the physical health of all people living in each of the project towns but also to empower local people by actively involving them in the design of the actual program by means other than exhorting people to participate via conventional means of political mobilization in Viet Nam. For towns to function effectively while diversity is what differentiates most urban centers from rural areas a sense of purpose and unity (or civic pride) is necessary for the social and cultural development of these towns. As an increasing number of Vietnamese are migrating on a permanent basis from rural hinterlands to towns, urban development issues will become even more important: WSS-related livelihood improvements such as those envisaged by this Project are core urban development issues.
VIII. CONCLUSION
Underlying the social analysis is the assumption that synergies will be achieved between the technical interventions that the Project will provide and the social development issues that arises from the Project. The synergies that can be achieved are those related to both the community focus of components other than those associated with the development and expansion of water supply and a more “market” rather than “beneficiary” based approach to livelihood improvements to be generated as a result of the Project. This is easier stated in the abstract and esoteric sense because most of the technical specialists and even township/commune officials have a traditional approach to supply of goods and services by the public sector. It will not be easy to affect the type of cultural changes necessary by simply relying on the public sector and hence the rationale for involving civil society groups with a greater cultural willingness to embrace creative and innovative approaches to the financing of WSS–related livelihood improvements. However, even with the active involvement of civil society groups because of the partnership arrangements envisaged – most notably with the Viet Nam Women’s Union but not to the exclusion of Township Committees (e.g. the EMDP is contingent on such involvement) – there are some caveats that are necessary to make at this juncture. The VWU has a very good track record in implementing a range of small-scale development initiatives targeted at women including, to some extent, the management of micro-finance programs on behalf of financial providers (that include financing some WSS-related initiatives). However, the VWU excludes poor and vulnerable women who lack the necessary social collateral (most notably “unregistered” urban migrants) because it takes a naturally cautious approach based on its determination to ensure very high levels of repayment (which is generally achieves). While it is important to recognize that there are variations in how the VWU functions in different project towns, it will be necessary for the VWU in each of the project towns to affirm that it will work closely with a suitable civil society group, approaching women as potential customers, producers and entrepreneurs rather than how they have approached women in the past. This is the critical issue underlying the social development approach underlying this Project. Process-based indicators need to demonstrate that local communities are able to leverage the Project to improve their livelihoods. The Participation Strategy is premised on not simple quantitative indicators of participation (e.g. people participating in awareness programs) but qualitative indicators (e.g. to what extent local people are able to design such programs). Such process-based indicators need to be linked to actual outcomes: measuring the breadth and depth of

TA 4485-VIE: Central Region Small and Medium Towns Development Project FINAL REPORT Appendix 13, page 32
June 2006
participation lacks meaning unless such participation can also demonstrate how increased awareness is translated into actual changes in behavior that improve health and hygiene. It needs to be demonstrated how preventable diseases such as dengue fever are eliminated or reduced or if an outbreak occurs, like the avian flu, are quickly managed. However, the processes of managing such outbreaks if a participatory based awareness approach is going to be viable would need to be of a different order to approaches currently utilized. The TA consultations with local communities – as truncated as they were – indicate that “top-down” approaches are not held in high regard by most people.
The TA Socioeconomic Survey has generated a range of baseline indicators ranging from updated population numbers and where possible disaggregated by ward/commune, poverty, gender and ethnicity, strategic economic growth and development indicators, household expenditure and income data, access to WSS–related facilities, and, if no access, willingness to pay for such access. Nevertheless, as indicated in this Social Analysis there are gaps in the existing database (for reasons beyond the control of the TA Team) that need to be rectified. Additionally, it is necessary to focus more on intra-household dynamics in the context of individual households and both intra and inter ward/commune dynamics on a community-wide basis. It is strongly suggested that an additional socioeconomic survey be undertaken as part of project implementation: not well into the implementation period but prior to the commencement of civil works. Finally, and by way of a conclusion, this Project has the real potential to improve the livelihoods of all or most people in the project towns in ways that would not be possible if the Project were not to be implemented. The Social Analysis has demonstrated how these improvements would materialize in ways that would also benefit the poorest and most vulnerable groups in each of the project towns and to some extent, even beyond. However, given the socioeconomic variations of the different project towns it cannot be expected that the impact will be of the same magnitude for each of the towns. In these towns are TPC/CPCs with different levels of capacity and willingness to learn. It is considered that the last attribute is more important than the former for the Project to be also successful from a livelihood perspective.

TA 4485-VIE: Central Region Small and Medium Towns Development Project FINAL REPORT Appendix 13, page 33
June 2006
Annex 1 Population and Poverty Data for Project Towns
Khanh Hoa Province
Towns Wards Population No. HHs Poverty (%) Ethnic Minorities
Male Female Total Cam Ranh Cam Nghia 6645 6692 13337 2798 14.09 0
Cam Phuc Bac 7053 6438 13491 2825 13.56 0 cam Phuc Nam 3254 3332 6586 1421 22.27 0 Cam Phu 3434 3536 6970 1449 20.60 0 Cam Thuan 4406 4588 8994 1845 24.80 0 Cam Loc 3442 3553 6995 1745 11.08 0 Cam Loi 5099 5312 10411 1972 18.79 0 Cam Linh 5778 5394 11172 2086 18.56 0 Ba Ngoi 6100 6321 12421 2481 16.54 0
45211 45166 90377 18622 0
Towns Wards Population No. HHs Poverty (%) Ethnic Minorities
Male Female Total Ninh Hoa Ninh Hoa 10918 11096 22014 4230 0
Ninh Ha 3774 3892 7666 1446 19.87 0 Ninh Quang 5824 5968 11792 2097 10.48 0 Ninh Da 4762 4857 9619 1979 12.62 0 Ninh Binh 5099 5208 10307 2084 12.57 0 Ninh Giang 4001 4192 8193 1596 17.18 0 Ninh An 6250 6722 12972 2678 14.85 0 Ninh Phung 5823 6137 11960 2097 8.08 0 Ninh Dong 2890 2982 5872 1129 27.19 0
Total 49341 51054 100395 19336 0
Towns Wards Population No. HHs Poverty (%) Ethnic Minorities
Male Female Total Van Gia Unit 1 1726 1950 3676 762 1.31 0
Unit 2 1410 2231 3641 686 1.46 0 Unit 3 1198 1227 2425 459 2.18 0 Unit 4 1850 2130 3980 697 0.86 0 Unit 5 976 1101 2077 423 NA 0 Unit 6 1185 868 2053 346 0.87 0 Luong Hai 1481 1644 3125 637 4.40 0 Total 9826 11151 20977 4010 0
Phu Yen Province
Towns Wards Population No. HHs Poverty (%) Ethnic Minorities
Male Female Total Tuy Hoa 1 3792 3868 7660 1553 3.93 0
2 4996 5227 10223 2153 13.93 0 3 3379 3646 7025 1193 9.89 0 4 5050 5130 10180 1848 8.60 0 5 5229 5249 10478 2454 11.82 0 6 4305 4507 8812 1759 11.20 0 7 4444 4502 8946 2044 1.27 0 8 4001 4038 8039 1748 7.95 0 9 5964 5834 11798 3246 4.99 Phu Lam 15860 14864 30724 6213 9.08 Binh Ngoc 2541 2598 5139 1057 14.10

TA 4485-VIE: Central Region Small and Medium Towns Development Project FINAL REPORT Appendix 13, page 34
June 2006
Towns Wards Population No. HHs Poverty (%) Ethnic Minorities
Binh Kien 3241 3342 6583 1520 8.49 Hoa Kien 3889 3908 7797 1745 11.06 An Phu 3834 3900 7734 1776 15.20
Total 70525 70613 141138 30309
Towns Wards Population No. HHs Poverty (%) Ethnic Minorities
Male Female Total Song Cau Long Hai Nam 1521 1919 3440 794 11.71 0
Long Hai Bac 1348 1647 2995 735 10.07 0 Long Phuoc Dong 788 962 1750 250 12.80 0
Phuoc Ly 825 1008 1833 453 7.51 0 Dan Phuoc 1185 1448 2633 503 12.72 0 Van Phuoc 1237 1510 2747 545 11.01 0 Long Binh 1310 1600 2910 703 4.98 0
Total 8214 10094 18308 3983 Dak Nong Province
Towns Wards Population No. HHs Poverty (%) Ethnic Minorities
Male Female Total Gia Nghia Nghia Trung 3452 3409 6861 1034 5.13 745
Nghia Tan 1834 1810 3644 806 7.20 661 Nghia Thanh 4019 4021 8040 1040 3.08 10 Nghia Duc 1968 1958 3926 555 6.13 277 Nghia Phu 1172 1168 2340 530 6.23 6 Quang Thanh 981 1003 1984 398 5.78 0 Dak Nia 2375 2344 4719 910 21.43 2736 Dak Moan 1999 2046 4045 835 8.98 280 Total 17800 17759 35559 6108 4715
Towns Wards Population No. HHs Poverty (%) Ethnic
Minorities Male Female Total
Eatling Wards 1 410 482 892 179 79.00 65 Wards 2 635 650 1285 242 44.90 20 Wards 3 420 465 885 185 29.00 23 Wards 4 688 643 1331 285 27.00 209 Wards 5 465 500 965 189 36.80 5 Wards 6 397 420 817 160 57.40 97 Wards 7 500 518 1018 207 65.70 430 Wards 8 381 343 724 146 43.40 0 Wards 9 322 415 737 155 14.20 25 Wards 10 635 700 1335 299 60.30 534 Wards 11 550 650 1200 258 44.70 96 Wards 12 712 750 1462 240 35.50 437 Wards 13 437 518 955 255 48.60 332
Total 6552 7054 13606 2800 44.89 2273 Male Female Total
Quang Khe Quang Khe 2569 2284 4853 919 54.41 3040
Towns Wards Population No. HHs Poverty (%) Ethnic Minorities
Male Female Total Dak Mam Wards 1 N/A N/A 571 162 14.70
Wards 2 N/A N/A 455 132 28.90 Wards 3 N/A N/A 606 113 35.60

TA 4485-VIE: Central Region Small and Medium Towns Development Project FINAL REPORT Appendix 13, page 35
June 2006
Towns Wards Population No. HHs Poverty (%) Ethnic Minorities
Wards 4 N/A N/A 492 173 2.90 Wards 5 N/A N/A 680 108 17.90 Wards 6 N/A N/A 695 113 21.00 Wards 7 N/A N/A 516 116 39.50 Dak Vuong N/A N/A 540 91 43.00 Dak Ha N/A N/A 581 118 27.00 Bon Dru N/A N/A 343 75 82.00 278 Bon Yok Linh N/A N/A 367 91 28.00 121 Bon Broih N/A N/A 526 124 69.00 271
Total 6372 1416 670 Ninh Thuan Province
Towns Wards Population No. HHs Poverty (%) Ethnic Minorities
Male Female Total Khanh Hai Ca Du 382 386 768 166 3.01
Khanh Son 1202 1086 2288 521 3.84 Khanh Giang 801 853 1654 330 10.91 Khanh Tan 935 1019 1954 401 6.73 Khanh Chu 1 842 951 1793 357 7.56 Khanh Chu 2 597 550 1147 231 9.96 Khanh Hiep 350 334 684 274 0.00 Ninh Chu 1 1050 1133 2183 445 8.31 Ninh Chu 2 889 864 1753 364 57.69
Total 7048 7176 14224 3089
Towns Wards Population No. HHs Poverty (%) Ethnic Minorities
Male Female Total Ca Na Thuong Diem 1746 1854 3600 389 18.25
Lac Nghiep 1 1203 1261 2464 367 9.26 Lac Nghiep 2 1225 1381 2606 433 6.24 Lac Son 1253 1253 2506 412 8.50 Lac Tan 1 1718 1787 3505 565 12.57 Lac Tan 2 2224 2361 4585 828 7.49
Total 9369 9897 19266 2994
Towns Wards Population No. HHs Poverty (%) Ethnic Minorities
Male Female Total Tan Son Living Block 1 N/A N/A 1688 278 6.47 0
Living Block 2 N/A N/A 1735 261 5.75 0 Living Block 3 N/A N/A 2436 386 6.74 0 Living Block 4 N/A N/A 1776 291 9.62 0 Living Block 5 N/A N/A 1335 233 8.15 0 Living Block 6 N/A N/A 1972 328 9.45 0 Living Block 7 N/A N/A 1863 304 5.92 0 Living Block 8 N/A N/A 2161 335 14.03 0 Total 7252 7714 14966 2416 8.36 0
Rate (%) 48.46 51.54 100.00

TA 4485-VIE: Central Region Small and Medium Towns Development Project FINAL REPORT Appendix 13, page 36
June 2006
Binh Thuan Province Towns Wards Population No. HHs Poverty (%) Ethnic
Minorities Male Female Total
Phan Thiet Duc Thang 5649 6119 11768 2159 0.42 0 Phu Trinh 10423 8025 18448 0.60 0 Phu Thuy 9046 8761 17807 2.58 0 Thanh Hai 3826 4018 7844 1.23 0 Lac Dao 6513 7168 13681 3.07 0 Duc Long 7733 8883 16616 0.71 0 Duc Nghia 5148 6401 11549 1.19 0 Phu Tai 3558 4044 7602 0.17 0 Binh Hung 7348 7158 14506 2901 2.40 0 Xuan An 2278 2371 4649 0.99 0 Hung Long 6420 6167 12587 2.45 0
Total 67942 69115 137057 5060 Source: MOLISA Poverty Data Provided by Either TPC or CPC, October 2005

TA 4485-VIE: Central Region Small and Medium Towns Development Project FINAL REPORT Appendix 12, page 1
June 2006
BENEFIT MONITORING AND EVALUATION FRAMEWORK The Project Coordination Unit (PCU) of MOC will ensure that a comprehensive program for project performance monitoring and evaluation (PPME) acceptable to ADB and the co-financer is carried out during implementation and subsequent operation to (i) examine the Project’s technical performance; (ii) evaluate the delivery of the planned facilities; (iii) assess the achievement of the Project’s objectives; and (iv) measure the Project’s social, economic, financial, and institutional impacts. At the start of the project implementation, the Provincial Project Management Units (PPMUs) with the PCU’s and Consultant’s support and in consultation with local communities will develop a set of PPME indicators based on the agreed design and monitoring framework with the ADB. The socioeconomic data will be reviewed and disaggregated by gender and by ethnic group when possible. The PPMU in each province will be responsible for carrying out the PPME activities, including pre-project and post-project physical and socioeconomic surveys, data collection and analysis. Each PPMU will establish a PPME baseline based on the pre-project surveys and data. Annual PPME reports will be prepared by each PPMU, and consolidated by the PCU for submission to ADB. An external monitor (NGO or academia) will undertake independent monitoring and evaluation of resettlement. The PCU will ensure that each PPMU submits a detailed PPME implementation plan for ADB’s review and concurrence within 6 months of loan effectiveness. Table A12-1 provides indicative monitoring and evaluation Indicators for the Project. These indicators will be reviewed and revised, if necessary, following agreement on the design and monitoring framework between the Government and ADB.

TA 4485-VIE: Central Region Small and Medium Towns Development Project FINAL REPORT Appendix 12, page 2
June 2006
Table A12-1. Indicative Monitoring and Evaluation Indicators
Outputs for Each Component Activity Indicator Monitoring Mechanism
1. Community Environmental Sanitation & Awareness Reduced risk to public
health resulting from poor quality water supply, wastewater discharges and ponding
• Implement community education and awareness program to improve knowledge of WSS services and encourage people to connect to water supply, drains and improve HH sanitation facilities
• HH awareness and knowledge of program (# of HH)
• New sanitation connections (#)
• Expenditure on community awareness programs
• PPMU reports and expenditure records
• Implement community sanitation improvement scheme to increase coverage of septic tanks in urban areas and pit latrines in low density areas
• No of septic tanks constructed and approved
• No of pit latrines constructed and approved
• Septic tank standards in place
• Household surveys • VWU records and reports
on sanitation improvements scheme
2. Water Supply Development & Expansion Improved access to
sustainable, clean, piped water supply
• Increase water treatment and distribution capacity by constructing or expanding water supply schemes
• Rehabilitate existing water supply facilities
• Increase water supply coverage
• Increase distribution network pressure to maintain water quality
• No of connections in different user categories (#)
• Treatment plant and pumping station operating hours (hours)
• Water production and sales (m3)
• UFW levels (%) • Distribution network
pressure (m) • Customer complaints (#)
• Plant records • PWSC records • Customer complaints
records • Customer surveys
Improved effectiveness and efficiency of water supply services
• Improve O&M of water supply facilities, plant & equipment by implementing O&M plans and procedures to reduce number of breaks and supply disruptions
• Availability of plant & equipment (No of hours/day)
• UFW (%) • Reported breaks and
leaks (#) • Response time to breaks
or disruptions (hours)
• Plant records • PWSC records • Customer complaints
records • Customer surveys • Leak repair reports
3. Drainage & Wastewater Management Improved urban
environment and living conditions
• Expand and upgrade combined drainage systems to reduce flooding and ponding and remove wastewater from urban areas
• Length of constructed drains (m)
• Length of rehabilitated drains (m)
• No of drainage connections (#)
• Coverage of drains (m/capita)
• PPMU reports • WSS company records • Groundwater monitoring
records • DONRE monitoring
reports
• Reduce potential for pollution of rivers, lakes and bays by constructing interceptor sewerage systems and waste stabilization ponds
• Introduce and enforce regulations to prevent industries from discharging untreated or partially treated wastewater to environment
• Water quality in rivers, lakes and bays (BOD, SS, FC) Length of constructed sewers
• No of pumping stations constructed and operating (No)
• Volume of wastewater treated by waste stabilization pond system (m3)
• Quality of treated effluent (BOD, SS, FC)
• PPMU reports • Results of environmental
monitoring programs • WSS reports • DONRE monitoring
reports, records and state of environment reports
• Customer complaints records

TA 4485-VIE: Central Region Small and Medium Towns Development Project FINAL REPORT Appendix 12, page 3
June 2006
Outputs for Each Component Activity Indicator Monitoring Mechanism
• No of wastewater overflows to rivers (#)
• No of industries discharging wastewater that does not comply with wastewater standards (#)
• Customer complaints (#)
4. Solid Waste Management Improved urban
environment and living conditions
• Increase solid waste collection coverage to remove solid waste from urban areas and prevent blockage of drains
• Construct sanitary landfill fro environmentally sustainable waste disposal
• Collection coverage (#of HH)
• Quantity of solid waste delivered to landfill (t)
• Quality of groundwater at landfill (BOD, SS, FC, metals)
• Weighbridge records at landfill
• Waste registration records at landfill
• Groundwater monitoring records
• DONRE monitoring reports, records and state of environment reports
5. Project Management & Institutional Strengthening Improved capacities of
PPMUs and urban WSS companies for project management
• Provide training for PPMU and WSS company staff
• Training courses attended by various categories of staff (#)
• Staff training (person-days)
• Project management and accounting systems in place in PPMU
• PPMU and urban services companies’ training records and reports
Improved capacities of urban services companies for O&M
• Provide training for WSS company staff
• Supply O&M equipment • Undertake UFW reduction
programs • Prepare O&M plans,
manuals, budgets, MIS forms
• Prepare staff schedules, duty statements
• Implement septic tank management system
• Training courses attended by various categories of staff (#)
• Staff training (person-days)
• UFW level • O&M teams established
and operating • O&M plan, manuals,
schedules and budgets in place
• MIS data prepared and published on monthly basis
• Asset inventories prepared
• No of septic tanks registered and entered in database (#)
• No of septic tanks emptied with sludge properly disposed
• WSS companies’ training records and reports
• MIS data • WSS company budgets
and expenditure records • Septic tank management
report adn records • Landfill waste delivery
register records
Improved autonomy, managerial and technical capacities of WSS companies
• Increase managerial and technical capacity of WSS staff through training
• Implement efficient financial and MIS systems
• Develop capacity of WSS companies to prepare O&M plans, manuals and budgets through training and consultant support
• Financial and MIS systems in place
• O&M plans and manuals in place and being used correctly
• Job descriptions and organization charts in place
• WSS company organization charts and staff records
• Job descriptions and training plans
• Project progress reports • Financial and MIS reports • O&M documents and
facility inspections • Customer complaints
Appropriate cost recovery mechanisms adopted to ensure sustainability of WSS services
• Implement full cost-recovery tariffs for water supply services
• Implement drainage and
• Water tariffs (VND/m3) • Drainage and wastewater
surcharge (VND/m3) • Solid waste user charge
• Tariff schedule increases • Revenue collected • Billing statistics • Financial systems and

TA 4485-VIE: Central Region Small and Medium Towns Development Project FINAL REPORT Appendix 12, page 4
June 2006
Outputs for Each Component Activity Indicator Monitoring Mechanism
wastewater surcharge on water bill with progressive increase to recover at least full O&M costs and equipment replacement costs
• Implement solid waste user charges, with progressive increase to recover at least full O&M and equipment replacement costs
(VND/HH/mth) • Revenues as a % of debt
service and O&M costs (%)
MIS reports

TA 4485-VIE: Central Region Small and Medium Towns Development Project FINAL REPORT Appendix 11, page 1
June 2006
OUTLINE TERMS OF REFERENCE FOR CONSULTING SERVICES INTERNATIONAL CONSULTANTS
1. Team Leader and WSS Engineering Specialist (International, 36 person-months)
The Team Leader and WSS Engineering Specialist will assist the Project Coordination Unit (PCU) established by MABUTIP to: (i) plan and coordinate all Project activities, (ii) assist the PPMUs in the areas of project management, administration, and technical support, (iii) prepare annual budget estimates in coordination with Provincial Steering Committees (PSC), (iv) work with PPMUs to ensure quality control of project financed infrastructure, (v) make regular visits to the five provinces to monitor overall project progress, (vi) manage consultant inputs to ensure effective and efficient use of consulting services, (vii) facilitate preparation of project progress reports (quarterly and annual) required by the GOV and ADB.
2. Procurement and Contract Management Specialist (International, 6 person-months)
The international Procurement and Contract Management Specialist will work closely with the Team Leader and the domestic Procurement and Contract Specialist to: (i) ensure that all project procurement and contracting strictly follows appropriate GOV and ADB procedures for open and transparent procurement, (ii) be accountable for ensuring that procurement procedures reflect the highest degree of probity, transparency, economy and efficiency, (iii) help PPMUs prepare initial detailed RFPs and required supporting documentation (e.g., TORs, budget estimates, bidding documents) to be sent to short-listed firms, (iv) prepare proposal evaluation guidelines and scoring sheets, and train relevant PPMU staff in their use before proposal evaluation, (v) work with PPMUs to develop draft and final contracts that meet ADB and GOV requirements, (vi) where required, work with PPMUs to identify, hire and train additional staff required for procurement and contracting tasks, with the goal of accelerating the process of procurement and contracting, which has often been a source of protracted delays in project implementation.
3. Water/Environmental Sanitation Design Engineer (International, 12 person-months)
The international Water / Environmental Sanitation Design Engineer will work closely with the Team Leader, Contract and Procurement Specialist, Water Treatment Plant Operation and Maintenance Engineer to: (i) prepare/ finalize the detailed engineering design of water supply and wastewater treatment projects, (ii) prepare the technical specifications of water supply and wastewater treatment project,(iii) prepare finalized project cost estimates, (iv) assist in the preparation of bid documents and provide assistance in the evaluation of bids related water supply and sanitation projects (v) provide assistance in the supervision of construction works (vi) provide assistance in preparing and conducting training related to water and sanitation.
4. Construction Supervision, Inspection & QA/QC Specialist (International, 12 person-months)
The international Construction Supervision, Inspection & QA/QC Specialist will work closely Civil and Construction Engineer and the Construction Supervisors to: (i) ensure that the construction works are undertaken in accordance with approved plans,

TA 4485-VIE: Central Region Small and Medium Towns Development Project FINAL REPORT Appendix 11, page 2
June 2006
specifications and schedule, (ii) act on contractors’ request for any variation in the construction plan and contract agreement, and recommend approval by concerned authorities, (iii) supervise the conduct of material testing and evaluation of the quality of work done by civil works contractors, (iv) evaluate contractors’ claims for progress payments and recommend approval for the progress payments.
5. Solid Waste Management Engineer (International, 12 person-months)
The international Solid Waste Management Engineer will work closely with the international Geotechnical Engineer, and Community Environmental Sanitation and Gender Specialist, and the domestic Community Environmental Awareness / Propaganda Specialist, Solid Waste Management Engineer, and the domestic and international Contract and Procurement Specialists to: (i) finalize the detailed engineering design of sanitary landfills, (ii) finalize the list of solid waste collection equipment to be purchased, (iii) prepare technical specifications for the construction of the sanitary landfill and technical specifications of equipment for the solid waste project, (iv) participate in consultation meetings with local residents likely to be affected by the project and local authorities, (v) participate in the community environmental sanitation and awareness activities, (v) prepare a sanitary landfill operations and maintenance manual, (vi) assist in the construction supervision of landfill subcomponents, (vii) assist in securing clearances and other government requirements prior to the operation of the landfills.
6. Mechanical and Electrical Engineers (International, 6 person-months)
The short-term international Mechanical and Electrical Engineer will work closely with the international Water and Environmental Sanitation Design Engineer, the domestic Mechanical and Electrical Engineer, the domestic Water Treatment Plant Operation and Maintenance Engineer to: (i) assist in the finalization of the mechanical and electrical aspects of the detailed engineering design of water treatment plants, wastewater pumping facilities, water stabilization ponds, sanitary landfill facilities and selection of solid waste collection equipment, (ii) assist in the preparation operations and maintenance manuals.
7. Geotechnical Engineer (International, 6 person-months)
The International Geotechnical Engineer will work closely with the Water and Environmental Sanitation Engineer and the Solid Waste Management Engineer to: (i) Evaluate the results of the geotechnical investigations, and (ii) Based on the evaluation results, recommend to the Specialists involved in the design works appropriate measures to assure structural /technical soundness of the infrastructure design.
8. Environmental Monitoring and Resettlement Specialist (International, 10 person-months)
The international Environmental Monitoring and Resettlement Specialist will work closely with the international and domestic water and environmental sanitation engineers, the domestic Environmental Monitoring Specialist, and international Community Environmental Sanitation and Gender Specialist to: (i) prepare a detailed Environmental Monitoring Plan (EMP, including mitigation measures and monitoring procedures) that incorporates guidelines in the Summary Initial Environmental Examination (SIEE) prepared during the PPTA, (ii) Suitably modify those guidelines to be fully responsive to all relevant laws, regulations and directives pertaining to environmental monitoring, (iii) Work with the Procurement and Contracting Specialists

TA 4485-VIE: Central Region Small and Medium Towns Development Project FINAL REPORT Appendix 11, page 3
June 2006
to ensure that guidelines specified in the EMP are suitably reflected in Project bidding documents, TORs and contracts financed under the Project, (iv) Describe in detail the required training and institutional strengthening required to empower local authorities to carry out the EMP, (v) Assess the land acquisition and resettlement (LAR) plans prepared during Project Preparation, and update them as necessary to reflect the current situation in the subproject areas, (vi) prepare detailed plans to carry out LAR implementation plans for project affected persons, assets and income sources, compensation costs, impact on subproject budgets, reflecting the polices and procedures specified in the ADB Handbook on Resettlement and relevant GOV regulations and procedures.
9. Community Environmental Sanitation and Gender Specialist (International, 6 person-months)
The international Community Environmental Sanitation and Gender Specialist will work closely with the domestic Environmental Monitoring Specialist and Community Environmental Sanitation Awareness and Propaganda Specialist mainly to carry out the tasks under Component One, namely to: (i) Through the hygiene and sanitation awareness program (HSAP), develop and implement culturally appropriate community hygiene and sanitation awareness plans in each subproject town; (ii) work with the Vietnam Women’s Union to facilitate financing of hygiene and sanitation needs of urban poor communities particularly for water supply house connections, hygienic family latrines and septic tanks, water storage tanks, and dug wells (where families are unable or do not wish to connect to piped water, and (iii) facilitate financing of demand-driven livelihood improvements (DDLI), such as rehabilitation of community drainage to minimize flooding, community solid waste management, and improved management of small livestock.
10. Financial Analyst and Accounting Specialist (International, 6 person-months)
The international Financial Analyst and Accounting Specialist will work closely with the domestic Financial Management and Accounting Specialist to support the PCU and PPMUs to: (i) establish standard procedures for orderly keeping of project accounts, (ii) develop and establish within the PCU and PPMUs proper financial management and planning procedures, (iii) develop budgets and schedules for project activities, based on annual work plans, (iv) where required, provide training in accounting and financial management to PPMU staff, (v) calculate appropriate tariffs for urban services (water supply, drainage and wastewater management, and solid waste management) that reflect existing GOV and ADB policies and procedures for cost recovery and financially sustainable tariffs to ensure long term sustainability of urban WSS service providers.
DOMESTIC CONSULTANTS
1. Project Management/WSS Engineering Specialist (Deputy Team Leader) (Domestic, 60 person-months)
The domestic Project Management/WSS Engineering Specialist will work closely with the international Team Leader to: (i) ensure that all planning, coordination, and implementation of Project activities are carried out according to plan, and reflect the relevant policies, procedures and guidelines of GOV and ADB, (ii) serve as liaison between the Project and PSCs and PPMUs, (iii) monitor the progress of all project activities and advise the Team Leader of any potential discrepancies between planning

TA 4485-VIE: Central Region Small and Medium Towns Development Project FINAL REPORT Appendix 11, page 4
June 2006
and implementation, and (iv) Work with the Team Leader and relevant consultants to prepare quarterly and annual reports meeting the requirements of GOV and the Bank.
2. Financial Management and Accounting Specialist (Domestic, 60 person-months)
The domestic Financial Management and Accounting Specialist will work closely with the international Financial and Contract Management Specialist, Contracts Specialist, PCU and the PPMUs to: (i) establish standard procedures for orderly keeping of project accounts, (ii) develop and establish within PCU and PPMUs proper financial management and planning procedures, (iii) develop budgets and schedules for project activities, based on annual work plans, (iv) prepare quarterly and annual financial reports in the required GOV and ADB formats, and (v) where required, provide training in accounting and financial management to PPMU staff.
3. Contract and Procurement Specialist (Domestic, 30 person-months)
The domestic Contract and Procurement Specialist will work closely with the international Contract Management and Procurement Specialist to: (i) ensure that all project procurement and contracting strictly follows appropriate GOV and ADB procedures for open and transparent procurement, (ii) be accountable for ensuring that procurement procedures reflect the highest degree of probity, transparency, economy and efficiency, (iii) help PPMUs prepare initial detailed RFPs and required supporting documentation (e.g., TORs, budget estimates, bidding documents) to be sent to short-listed firms, (iv) prepare proposal evaluation guidelines and scoring sheets, and train relevant PPMU staff in their use before proposal evaluation, (v) work with PPMUs to develop draft and final contracts that meet ADB and GOV requirements, (vi) where required, work with PPMUs to identify, hire and train additional staff required for procurement and contracting tasks, with the goal of accelerating the process of procurement and contracting, which has often been a source of protracted delays in project implementation.
4. Community Finance Specialist (Domestic, 12 person-months)
The domestic Community Finance Specialist will: (i) review policies supportive of microfinance best practice and how these can be incorporated in the Project context; (ii) design and supervise a diagnostic survey regarding microfinance service provision in the key towns and provinces; (iii) design pilot investment component projects to enhance the communities’ access to finance and other microfinance-related projects, and; (iv) conduct discussions and workshops with relevant stakeholders to build consensus on the Project activities.
5. Financial Analyst / Economist (Domestic, 60 person-months)
The domestic Financial Analyst/Economist will: (i) draft the frameworks especially covering the financial and investment components of the Project; (ii) evaluate the current status of fiscal management, counterpart fund availability, and mechanisms to finance O&M costs; (iii) prepare a poverty impact assessment for sample subprojects, including a distributional analysis of the impacts; (iv) update and finalize the project cost estimates and financing plans; and (v) assess the financial management capacity of institutions that are relevant to project implementation, and evaluate the financial affordability and sustainability of proposed project activities.

TA 4485-VIE: Central Region Small and Medium Towns Development Project FINAL REPORT Appendix 11, page 5
June 2006
6. Monitoring and Evaluation and MIS Specialist (Domestic, 18 person-months)
The domestic Monitoring and Evaluation Specialist will: (i) Work with the PCU and the five PPMUs to determine information needs for project progress monitoring; (ii) Establish monitoring parameters of project related activities; (iii) With direction from the Team Leader and deputy Team Leader, establish a comprehensive monitoring database to meet both the management and reporting requirements of GOV and ADB; (iv) Develop monitoring procedures for towns (subprojects), provinces (PPMU) and the PCU; (v) Orient and train relevant PPMU staff in monitoring procedures; (vi) Manage the monitoring and evaluation activities, and prepare quarterly monitoring reports based on information collected at the province and subproject levels; (vii) With inputs from other PCU consultants, determine specific project evaluation requirements, developing terms of reference for independent evaluations (e.g. Midterm Project Report) as needed; and (viii) Manage project component evaluations, and reviewing and approving any independent evaluations contract out.
7. Water and Sanitation Design Engineer (Domestic, 20 person-months)
The domestic Water and Sanitation Design Engineer will work closely with the Team Leader, Contract and Procurement Specialist, Water Treatment Plant Operation and Maintenance Engineer to: (i) prepare/ finalize the detailed engineering design of water supply and wastewater treatment projects, (ii) prepare the technical specifications of water supply and wastewater treatment project,(iii) prepare finalized project cost estimates, (iv) assist in the preparation of bid documents and provide assistance in the evaluation of bids related water supply and sanitation projects (v) provide assistance in the supervision of construction works (vi) provide assistance in the preparation and conduct of trainings related to water and sanitation.
8. Water Treatment Plant Operation & Maintenance Engineer (Domestic, 15 person-months)
The domestic Water Treatment Plant Operation & Maintenance Engineer will work closely with the Team Leader, and the international and domestic Mechanical and Electrical Engineer, Water and Sanitation Design Engineer to: (i) assist in finalizing the detailed engineering design, particularly in the aspect of identifying the most appropriate design for minimizing operation and maintenance costs, (ii) prepare operation and maintenance manuals, (iii) assist in the preparation of annual operation and maintenance budgets, and (iv) assist in the conduct of trainings related to water treatment plant operation and maintenance.
9. Drainage and Wastewater Management Engineer (Domestic, 15 person-months)
The domestic Drainage and Wastewater Management Engineer will work closely with the Team Leader, Contract and Procurement Specialist, and Water and Sanitation Design Engineer to : (i) finalize the detailed engineering design of drainage and waste water facilities, i.e., drainage canals , drainage crossings and other appurtenant drainage infrastructure (ii) finalize drainage project cost ( iii) assist in the preparation of technical specifications and bid documents for the project (iv) Assist in the construction supervision of drainage projects (v) prepare guidelines for the maintenance of drainage and waste water management (vi) Assist in the conduct of training related to design preparation and operation and maintenance of drainage and waste water facilities.

TA 4485-VIE: Central Region Small and Medium Towns Development Project FINAL REPORT Appendix 11, page 6
June 2006
10. Solid Waste Management Engineer (Domestic, 15 person-months)
The domestic Solid Waste Management Engineer will work closely with the Team Leader, Geotechnical Engineer, Community Environ, Sanitation Awareness/ Propaganda Specialist, Drainage and Waste Water Management Engineer, Mechanical and Electrical Engineer, Contract Specialist and Procurement Specialist to: (i) finalize the detailed engineering design of sanitary landfills and finalize the list of solid waste collection equipment to be purchased (ii) prepare technical specifications for the construction of the sanitary landfill and technical specifications of equipment for the solid waste project. (iii) participate in the consultation meeting with the residents to be affected by the project, and local government officials and participate in the community environmental sanitation and awareness activities, (iv) prepare sanitary landfill operations and maintenance manual, (v) assist in the construction supervision of landfill projects (vi) assist in securing clearances and other government requirements prior to the operation of the landfills.
11. Mechanical and Electrical Engineer (Domestic, 6 person-months)
The domestic Mechanical and Electrical Engineer will work closely with the Water Treatment Plant Operation and Maintenance Engineer, Solid Waste Management Engineer to (i) assist in the finalization of the detailed engineering design of sanitary landfill facilities and selection of solid waste collection equipment, (ii) assist in the preparation operations and maintenance manuals.
12. Geotechnical Engineer (Domestic, 6 person-months)
The domestic Geotechnical Engineer will work closely with the International Geotechnical Engineer, the Water/ Environmental Sanitation Design Engineer, and the Solid Waste Management Engineers (international and domestic) to (i) evaluate the results of the geotechnical investigations, and (ii) based on the evaluation results, recommend to the Specialists involved in the design works appropriate measures to assure structural /technical soundness of the infrastructure design.
13. Civil and Construction Engineer (Domestic, 36 person-months)
The domestic Civil and Construction Engineer will work closely with the Construction Supervisors to: (i) closely monitor the day-to-day progress of the civil works construction and ensure that the works are undertaken in accordance with approved plans and specifications, (ii) inspect materials delivered on the site to determine if they are in accordance to the required technical standards, (iii) take samples of materials used in construction to be tested in the materials testing laboratory, (iv) measure the amount of work done by civil works contractors to determine if they are consistent with claims for progress payments, ( v) evaluate contractors’ requests for changes or variations in the contract plans and specifications, and (vi) ensure safety of personnel and materials at the subproject sites.
14. Construction Supervisors (Domestic, 36 person-months)
The domestic Construction Supervisors will assist the Civil and Construction Engineers in undertaking their on-site construction and supervision activities, in particular to ensure that: (i) all project-financed construction is done strictly according to plans, contracts and accepted engineering construction practice in Vietnam, (ii) all relevant GOV and ADB guidelines for quality control and quality assurance are applied, (iii) full records of all assets being built are properly maintained (e.g., daily reports of contractor

TA 4485-VIE: Central Region Small and Medium Towns Development Project FINAL REPORT Appendix 11, page 7
June 2006
activities, quantities of goods and materials used, work progress, important progress milestones), and operations are smoothly carried out to the satisfaction of the client(s).
15. Community Environmental Sanitation Awareness/Propaganda Specialist (Domestic, 30 person-months)
The domestic Community Environmental Sanitation Awareness/Propaganda Specialist will work closely with the international Community Environmental Sanitation and Gender Specialist to carry out the tasks under Component One, namely to: (i) Through the hygiene and sanitation awareness program (HSAP), develop and implement culturally appropriate community hygiene and sanitation awareness plans in each subproject town; (ii) work with the Vietnam Women’s Union to facilitate financing of hygiene and sanitation needs of urban poor communities particularly for water supply house connections, hygienic family latrines and septic tanks, water storage tanks, and dug wells (where families are unable or do not wish to connect to piped water, and (iii) facilitate financing of demand-driven livelihood improvements (DDLI), such as rehabilitation of community drainage to minimize flooding, community solid waste management, and improved management of small livestock.
16. Environmental Monitoring Specialist (Domestic, 60 person-months)
The domestic Environmental Monitoring Specialist will work together with the international Environmental Monitoring and Resettlement Specialist, the various engineers, and the Community Environmental Sanitation Awareness and Propaganda Specialist to: (i) prepare a detailed Environmental Monitoring Plan (EMP, including mitigation measures and monitoring procedures) that incorporates guidelines in the Summary Initial Environmental Examination (SIEE) prepared during the PPTA, (ii) suitably modify those guidelines to be fully responsive to all relevant laws, regulations and directives pertaining to environmental monitoring, (iii) Work with the Procurement and Contracting Specialists to ensure that guidelines specified in the EMP are suitably reflected in Project bidding documents, TORs and contracts financed under the Project, and (iv) Describe in detail the required training and institutional strengthening required to empower local authorities to carry out the EMP.
17. Resettlement Specialist (Domestic, 60 person-months)
The domestic Resettlement Specialist will work closely with the international Environmental Monitoring and Resettlement Specialist to: (i) assess the land acquisition and resettlement (LAR) plans prepared during Project Preparation, (ii) update them as necessary to reflect the current situation in the subproject areas, (iii) prepare detailed procedures to carry out LAR implementation plans for project affected persons, considering their assets and income sources, compensation costs, and impact on subproject budgets, and (iv) ensure that these tasks are in full accordance with the polices and procedures specified in the ADB Handbook on Resettlement and relevant GOV regulations and procedures.
18. Training and Institutional Development Specialist (Domestic, 60 person-months)
The domestic Training and Institutional Development Specialist will work under the direction of the Deputy Team Leader to develop a targeted training and institutional capacity strengthening program for counterpart staff involved in project implementation. To reflect the special near term need for significant strengthening of institutional capacity and capability in Dak Nong, project resources will be focused on that province initially. The Training and Institutional Development Specialist will: (i) work closely with

TA 4485-VIE: Central Region Small and Medium Towns Development Project FINAL REPORT Appendix 11, page 8
June 2006
PPMUs and other local authorities and community organizations (in support of Component 1) to better define training needs of counterpart staff, (ii) coordinate the project’s extensive training and capacity building program, (iii) develop a training planning framework, schedule and management plan for training and capacity building activities for all project components; (iv) advise on how to best tailor training needs assessments and training mechanisms to take into account social and cultural differences in each Project province and town, (v) develop lists of experienced and qualified trainers for outsourcing training and capacity building activities (including private organizations, academic institutions (e.g., Water Resources University and other existing local training centers within MOC and other relevant agencies); (vi) with the Contracts Specialist, prepare budgets and TORs, and manage the tendering, selection, contracting and performance assessment of external training providers; (v) Provide logistical and operational support to all institutional training activities; (v) Make regular and frequent visits to the Project provinces and subprojects to assess the results of provincial and subproject level training activities and provide recommendations for follow-up training, if required.
COST ESTIMATES AND FINANCING PLAN ($’000)
ItemForeign
Exchange Local Currency Total CostADB Financing
1 Consultantsa. International
i Remuneration 2,166.0 2,166.0 ii Per Diem 252.0 252.0
b. Domestici Remuneration 1,884.0 1,884.0 ii Per Diem 529.2 529.2
c. International Travel /1 68.9 68.9 d. Local Travel 50.0 50.0
2 Office Equipment /2 20.0 20.0 3 Surveys 10.0 10.0 4 Reports and Publication 5.1 5.1 5 Workshops 40.0 40.0 6 Administration Support Costs /3 217.5 217.5 7 Contingencies 254.4 271.9 526.3
Total 2,766.4 3,002.6 5,769.0 Government Financing
1 Base cost - - 2 Physical Contingencies - -
Total - - Grand Total 2,766.4 3,002.6 5,769.0
/1 International air fares and miscellaneous travel expenses.
/2 Office equipment to include laptop computers, desktop computers, necessary software, colored and black/white printers, plotter, audio/visual equipment, and office furniture.
/3 Provides for a research associate, translators/interpreters, an office manager, project accountant, secretaries and a messenger/utility person. Also includes costs covering communications, land transportation & vehicle rental, translation services, and office rental.

TA 4485-VIE: Central Region Small and Medium Towns Development Project FINAL REPORT Appendix 10, page 1
June 2006
DETAILED PROJECT COST ESTIMATES AND FINANCING PLAN: OPTION 21
Table A10-1. Estimated Project Cost (U$’000)
Component Total Costexcl. tax
Taxes Foreign
Exchange Local
Currency Total Cost
incl. tax A. Community env. sanitation & awareness 1 Community awareness 383 - 230 153 383 2 HHs sanitation improvement - - - - - Sub-total A 383 - 230 153 383
B. Water Supply Development 3 Civil works 8,668 1,029 5,818 3,879 9,697 4 Equipment 582 35 582 35 617 5 Land acquisition and compensation 115 - - 115 115 Sub-total B 9,365 1,064 6,400 4,028 10,428
C. Drainage & wastewater management 6 Civil works 31,613 3,119 20,839 31,613 34,732 7 Equipment 1,256 63 1,256 1,256 1,318 8 Land acquisition & compensation 1,553 - - 1,553 1,553 Sub-total C 34,422 3,182 22,095 34,422 37,603
D. Solid waste management 9 Civil works 1,199 124 - 1,323 1,323
10 Equipment 283 14 - 297 297 11 Land acquisition & compensation 141 - - 141 141 Sub-total D 1,624 138 - 1,762 1,762
E. Project management & insti strengthening 12 Consulting Service 3,633 363 2,997 999 3,996 13 Project management cost 1,862 186 - 2,048 2,048 14 Engineering survey and investigation 636 64 - 699 699 15 Training and capacity building 276 28 182 121 303 Sub-total E 6,406 641 3,179 3,868 7,046 Base Cost 52,199 5,024 31,904 25,320 57,223 Contingencies
16 Physical Contingencies 3,654 365 2,240 1,779 4,019 17 Price Contingencies 4,176 418 2,560 2,033 4,593 Total Contingencies 7,830 783 4,801 3,812 8,613
18 Bank fee 804 80 804 80 884 Total 60,832 5,888 37,508 29,212 66,720
* Totals may not add due to rounding.
Table A10-2. Project Financing Plan (US$’000)
Source Foreign Exchange
Local Currency Total Cost Percent
Asian Development Bank 29,549 20,491 50,040 75.00%Counterpart Funds 0 16,680 16,680 25.00%
Total 29,549 37,171 66,720 100.00%Percent 44.29% 55.71% 100.00%
Source: Consultants' estimates.
1 Option 2 refers to the scenario where only ADB funds will be available to finance the Project and as a consequence, only 8 towns will
be selected to participate in the Project.

TA 4485-VIE: Central Region Small and Medium Towns Development Project FINAL REPORT Appendix 10, page 2
June 2006
A. PROJECT COST SUMMARY TABLES
Table A10-3. Project Cost Summary, by Town and by Component (US$’000)
Priority
City or Town
Community Env.
Sanitation & Awareness
Water Supply Development
Drainage & Wastewater Management
Solid Waste Management
Project Management &
Inst Strengthening
Base Cost
Contingencies
Total Estimated
Cost
Cumulative Cost
1 Tuy Hoa 70 - 10,276 - 1,449 11,795 1,782 13,755 13,755
2 Song Cau 32 - 1,235 216 203 1,687 254 1,961 24,088
3 Cam Ranh 90 - 5,508 698 879 7,174 1,088 8,372 22,127
4 Ninh Hoa 30 2,958 - - 404 3,391 498 3,939 28,027
5 Thap Cham 26 - 4,073 - 576 4,675 708 5,481 33,508
6 Ca Na 20 2,235 - - 302 2,556 372 2,965 36,473
7 Phan Thiet 80 - 11,984 1,687 13,752 2,074 16,033 52,506
8 Gia Nghia 35 5,236 4,527 848 1,546 12,193 1,837 14,214 66720
Total 383 10,428 37,603 1762 7,046 57,223 8,613 66,720 Source: Consultants’ estimates.

TA 4485-VIE: Central Region Small and Medium Towns Development Project FINAL REPORT Appendix 10, page 3
June 2006
Table A10-4. Project Cost Summary, by Town and by Subcomponent (US$’000)
Description All Towns
Tuy Hoa
Song Cau
Cam Ranh
Ninh Hoa
Thap Cham
Ca Na
Phan Thiet
Gia Nghia
A. Community Env Sanitation & Awareness 1 Community Awareness 383 70 32 90 30 26 20 80 35 2 HHs sanitation improvement - - - - - - - - - Sub-Total A 383 70 32 90 30 26 20 80 35
B. Water Supply Development 3 Civil works 9,697 - - - 2,764 - 2,164 - 4,769 4 Equipment 617 - - - 187 - 71 - 358 5 Land acquisition and compensation 115 - - - 5 - - - 109 Sub-total B 10,428 - - - 2,958 - 2,235 - 5,236
C. Drainage & Wastewater Management 6 Civil works 34,732 9,086 1,235 4,788 - 4,003 - 11,226 4,393 7 Equipment 1,318 882 - 138 - 70 - 154 75 8 Land acquisition and compensation 1,553 309 - 582 - - - 605 58 Sub-total C 37,603 10,276 1,235 5,508 - 4,073 - 11,984 4,526
D. Solid Waste Management 9 Civil works 1,323 - 195 620 - - - - 509
10 Equipment 297 - 21 - - - - - 276 11 Land acquisition and compensation 141 - - 78 - - - - 64 Sub-total D 1,762 - 216 698 - - - - 848
E. Project Management & Inst Strengthening 12 Consulting Services 3,996 828 29 502 231 330 172 964 853 13 Project management cost 2,048 424 59 257 118 169 88 494 437 14 Engineering survey and investigation 699 145 20 88 40 58 30 169 149 15 Training and capacity building 303 52 3 31 14 21 11 60 107 Sub-total E 7,046 1,449 112 879 404 576 302 1,687 1,546 Base Cost 57,223 11,759 835 7,174 3,391 4,675 2,556 13,752 12,193 Contingencies
16 Physical Contingencies 4,019 831 59 508 232 330 174 968 857 17 Price Contingencies 4,593 950 67 580 266 378 198 1,106 980 Total Contingencies 8,613 1,781 126 1,088 498 708 372 2,074 1,837
18 Bank Fee 884 178 2 109 50 98 37 207 184 Total 66,720 13,755 1,961 8,372 3,939 5,481 2,965 16,033 14,214 TOTAL ESTIMATED COST BY PROVINCE 15,716 12,311 8,446 16,033 14,214 PHU YEN KHANH HOA NINH THUAN BINH THUAN DAK NONG
Source: Consultant’s estimates.

TA 4485-VIE: Central Region Small and Medium Towns Development Project FINAL REPORT Appendix 10, page 4
June 2006
B. COST ESTIMATES AND FINANCING PLAN FOR DAK NONG PROVINCE
Table A10-5. Cost Estimates for Gia Nghia Town, Dak Nong Province (US$’000) Component Total Cost
excl. tax Taxes Foreign Exchange
Local Currency
Total Cost incl. tax
A. Community env sanitation & awareness 1 Community Awareness 35 - 14 35 2 HHs sanitation improvement - - - - Sub-total A 35 - 14 35
B. Water supply development 3 Civil works 4,336 434 2,862 1,908 4,769 4 Equipment 341 17 341 17 358 5 Land acquisition and compensation 109 - - 109 109 Sub-total B 4,786 451 3,202 2,034 109
C. Drainage & wastewater management 6 Civil works 3,994 399 2,636 1,757 4,393 7 Equipment 72 4 72 4 75 8 Land acquisition and compensation 58 - - 58 58 Sub-total C 4,124 403 2,708 1,819 4,526
D. Solid waste management 9 Civil works 459 50 - 509 509 10 Equipment 263 13 - 276 276 11 Land acquisition and compensation 64 - - 64 64 Sub-total D 786 63 - 849 848
E. Project management & inst strengthening 12 Consulting Service 776 76 640 213 853 13 Project management cost 397 40 - 437 437 14 Engineering survey and investigation 136 14 - 149 149 15 Training and capacity building 97 10 64 43 107 Sub-total E 1,406 141 704 842 1,546 Base Cost 11,135 1,058 6,635 5,558 12,193 Contingencies
16 Physical Contingencies 779 78 467 391 857 17 Price Contingencies 891 89 533 447 980 Total Contingencies 1,670 167 1,000 838 1,837
18 Bank fee 1,67 17 167 17 184 Total 12,972 1,242 7,802 6,412 14,214
Source: Consultants’ estimates.
Table A10-6. Financing Plan for Town in Dak Nong Province (US$’000)
Source Foreign Exchange
Local Currency Total Cost Percent
Asian Development Bank 8,528 2,132 10,661 75.00% Counterpart Funds 0 3,554 3,554 25.00%
Total 8.528 5,686 14,214 100.00% Percent 60.00% 40.00% 100.00%
Source: Consultants' estimates.

TA 4485-VIE: Central Region Small and Medium Towns Development Project FINAL REPORT Appendix 10, page 5
June 2006
C. COST ESTIMATES AND FINANCING PLAN FOR BINH THUAN PROVINCE
Table A10-7. Cost Estimates for Phan Thiet Town, Binh Thuan Province (US$’000) Component Total Cost
excl. tax Taxes Foreign Exchange
Local Currency
Total Costincl. tax
A. Community envi. sanitation & awareness 1 Community awareness 80 - 48 32 80 2 HHs sanitation improvement - - - - - Sub-total A 80 - 48 32 80
B. Water Supply Development 3 Civil works - - - - - 4 Equipment - - - - - 5 Land acquisition and compensation - - - - - Sub-total B - - - - -
C. Drainage & Wastewater Management 6 Civil works 10,205 1,020 6,735 4,490 11,226 7 Equipment 147 7 147 7 154 8 Land acquisition and compensation 605 - - 605 605 Sub-total C 10,957 1,027 6,882 5,103 11,984
D. Solid Waste Management 9 Civil works - - - - -
10 Equipment - - - - - 11 Land acquisition and compensation - - - - - Sub-total D - - - - -
E. Project Management & Inst Strengthening 12 Consulting Services 877 88 723 241 964 13 Project management cost 449 45 - 494 494 14 Engineering survey and investigation 153 15 - 169 169 15 Training and capacity building 55 5 36 24 60 Sub-total E 1534 153 759 928 1,687 Base cost 12,570 1,181 7,689 6,063 13,752 Contingencies
16 Physical Contingencies 880 88 541 427 968 17 Price Contingencies 1,006 101 619 488 1,106 Total Contingencies 1,886 189 1,160 915 2,074
18 Bank fee 189 19 189 19 207 TOTAL 14,645 1,389 9,037 6,996 16,033
Source: Consultants' estimates.. Note: Only Phan Thiet in Binh Thuan is selected for Bank financing.
Table A10-8. Financing Plan for Town in Binh Thuan Province (US$’000)
Source Foreign Exchange
Local Currency Total Cost Percent
Asian Development Bank 7,215 4,810 12,025 75.00% Counterpart Funds 0 4,008 4,008 25.00%
Total 7,215 8,818 16,033 100.00% Percent 45.00% 55.00% 100.00%
Sources: Consultants' estimates.

TA 4485-VIE: Central Region Small and Medium Towns Development Project FINAL REPORT Appendix 10, page 6
June 2006
D. COST ESTIMATES AND FINANCING PLAN FOR NINH THUAN PROVINCE
Table A10-9. Cost Estimates for Towns in Ninh Thuan Province (US$’000)
Component Total Costexcl. tax Taxes Foreign
Exchange Local
Currency Total Cost
incl. tax A. Community envi. sanitation & awareness 1 Community awareness 46 - 28 18 46 2 HHs sanitation improvement - - - - - Sub-total A 46 - 28 18 46
B. Water Supply Development 3 Civil works 1,893 270 1,298 865 2,164 4 Equipment 66 5 66 5 71 5 Land acquisition and compensation - - - - Sub-total B 1,959 276 1,364 871 2,235
C. Drainage & Wastewater Management 6 Civil works 3,676 328 2,402 1,601 4,003 7 Equipment 66 3 66 3 70 8 Land acquisition and compensation - - - - - Sub-total C 3,742 331 2,468 1,604 4,073
D. Solid Waste Management 9 Civil works - - - - - 10 Equipment - - - - - 11 Land acquisition and compensation - - - - - Sub-total D - - - - -
E. Project Management & Inst Strengthening 12 Consulting Services 456 46 377 125 501 13 Project management cost 233 23 - 257 257 14 Engineering survey and investigation 79 8 - 88 88 15 Training and capacity building 29 3 18 12 32 Sub-total E 797 80 395 482 878 Base cost 6,545 686 4,255 2,976 7,231 Contingencies
16 Physical Contingencies 458 46 297 208 504 17 Price Contingencies 523 52 339 237 576 Total Contingencies 982 98 636 445 1,080
18 Bank fee 123 12 123 12 135 TOTAL 7,650 796 5,012 3,434 8,446
Source: Consultants' estimates.

TA 4485-VIE: Central Region Small and Medium Towns Development Project FINAL REPORT Appendix 10, page 7
June 2006
Table A10-10. Cost Estimates for Thap Cham Town, Ninh Thuan Province (US$’000)
Component Total Costexcl. tax Taxes Foreign
Exchange Local
Currency Total Cost
incl. tax A. Community envi. sanitation & awareness 1 Community awareness 26 - 16 10 26 2 HHs sanitation improvement - - - - - Sub-total A 26 - 16 10 26
B. Water Supply Development 3 Civil works - - - - - 4 Equipment - - - - - 5 Land acquisition and compensation - - - - - Sub-total B - - - - -
C. Drainage & Wastewater Management 6 Civil works 3,676 328 328 1,601 4,003 7 Equipment 66 3 3 3 70 8 Land acquisition and compensation - - - - - Sub-total C 3,742 331 331 1,605 4,073
D. Solid Waste Management 9 Civil works - - - - - 10 Equipment - - - - - 11 Land acquisition and compensation - - - - - Sub-total D - - - - -
E. Project Management & Inst Strengthening 12 Consulting Services 299 30 247 82 329 13 Project management cost 153 15 - 169 169 14 Engineering survey and investigation 52 5 - 58 58 15 Training and capacity building 19 2 12 8 21 Sub-total E 524 52 259 317 576 Base cost 4,292 383 2,743 1,932 4,675 Contingencies
16 Physical Contingencies 300 30 194 137 330 17 Price Contingencies 343 34 222 156 378 Total Contingencies 644 64 416 293 708
18 Bank fee 89 9 89 9 98 TOTAL 5,025 456 3,247 2,234 5,481
Source: Consultants' estimates.

TA 4485-VIE: Central Region Small and Medium Towns Development Project FINAL REPORT Appendix 10, page 8
June 2006
Table A10-11. Cost Estimates for Ca Na Town, Ninh Thuan Province (US$’000)
Component Total Costexcl. tax Taxes Foreign
Exchange Local
Currency Total Cost
incl. tax A. Community envi. sanitation & awareness 1 Community awareness 20 - 12 8 20 2 HHs sanitation improvement - - - - - Sub-total A 20 - 12 8 20
B. Water Supply Development 3 Civil works 1,893 270 1,298 865 2,164 4 Equipment 66 5 66 5 71 5 Land acquisition and compensation - - - - - Sub-total B - 276 1,364 871 2,235
C. Drainage & Wastewater Management 6 Civil works - - - - - 7 Equipment - - - - - 8 Land acquisition and compensation - - - - - Sub-total C - - - - -
D. Solid Waste Management 9 Civil works - - - - - 10 Equipment - - - - - 11 Land acquisition and compensation - - - - - Sub-total D - - - - -
E. Project Management & Inst Strengthening 12 Consulting Services 157 16 129 43 172 13 Project management cost 80 8 - 88 88 14 Engineering survey and investigation 27 3 - 30 30 15 Training and capacity building 10 1 6 4 11 Sub-total E 274 27 136 166 302 Base cost 2,253 303 1,512 1,044 2,556 Contingencies
16 Physical Contingencies 158 16 103 71 174 17 Price Contingencies 180 18 117 81 198 Total Contingencies 338 34 220 152 372
18 Bank fee 34 3 34 3 37 TOTAL 2,625 340 1,765 1,200 2,965
Source: Consultants' estimates.
Table A10-12. Financing Plan for Towns in Ninh Thuan Province (US$’000)
Source Foreign Exchange
Local Currency Total Cost Percent
Asian Development Bank 3,041 3,294 6,336 75.00% Counterpart Funds 0 2,112 2,112 25.00%
Total 3,041 5,405 8,446 100.00% Percent 35.00% 65.00% 100.00%
Source: Consultants' estimates.

TA 4485-VIE: Central Region Small and Medium Towns Development Project FINAL REPORT Appendix 10, page 9
June 2006
E. COST ESTIMATES AND FINANCING PLAN FOR KHANH HOA PROVINCE
Table A10-13. Cost Estimates for Towns in Khanh Hoa Province (US$’000)
Component Total Costexcl. tax Taxes Foreign
Exchange Local
Currency Total Cost
incl. tax A. Community envi. sanitation & awareness 1 Community awareness 120 - 72 48 120 2 HHs sanitation improvement - - - - - Sub-total A 120 - 72 48 120
B. Water Supply Development 3 Civil works 2,439 325 1,659 1,106 2,764 4 Equipment 176 12 176 12 188 5 Land acquisition and compensation 5 - - 5 5 Sub-total B 2,620 337 1,834 1,123 2,958
C. Drainage & Wastewater Management 6 Civil works 4,353 435 2,873 1,915 4,788 7 Equipment 131 7 131 7 138 8 Land acquisition and compensation 582 - - 582 582 Sub-total C 5,066 442 3,004 2,504 5,508
D. Solid Waste Management 9 Civil works 563 56 - 620 620 10 Equipment - - - - - 11 Land acquisition and compensation 78 - - 78 78 Sub-total D 641 56 - 698 698
E. Project Management & Inst Strengthening 12 Consulting Services 667 67 550 184 733 13 Project management cost 341 34 - 375 375 14 Engineering survey and investigation 117 12 - 128 128 15 Training and capacity building 42 4 28 18 46 Sub-total E 1,167 117 578 705 1,282 Base cost 9,613 952 5,488 5,078 10,566 Contingencies
16 Physical Contingencies 673 67 384 356 740 17 Price Contingencies 769 77 438 407 846 Total Contingencies 1,442 144 822 763 1,586
18 Bank fee 144 14 144 14 159 TOTAL 11,200 1,111 6,455 5,856 12,311
Source: Consultants' estimates.

TA 4485-VIE: Central Region Small and Medium Towns Development Project FINAL REPORT Appendix 10, page 10
June 2006
Table A10-14. Cost Estimates for Cam Ranh Town, Khanh Hoa Province (US$’000)
Component Total Costexcl. tax Taxes Foreign
Exchange Local
Currency Total Cost
incl. tax A. Community envi. sanitation & awareness 1 Community awareness 90 - 54 36 90 2 HHs sanitation improvement - - - - - Sub-total A 90 54 36 90
B. Water Supply Development 3 Civil works - - - - - 4 Equipment - - - - - 5 Land acquisition and compensation - - - - - Sub-total B - - - - -
C. Drainage & Wastewater Management 6 Civil works 4,353 435 2,873 1,915 4,788 7 Equipment 131 7 131 7 138 8 Land acquisition and compensation 582 - - 582 582 Sub-total C 5,066 442 3,004 2,504 5,508
D. Solid Waste Management 9 Civil works 563 56 - 620 620 10 Equipment - - - - - 11 Land acquisition and compensation 78 - - 78 78 Sub-total D 641 56 - 698 698
E. Project Management & Inst Strengthening 12 Consulting Services 457 46 377 126 502 13 Project management cost 234 23 - 257 257 14 Engineering survey and investigation 80 8 - 88 88 15 Training and capacity building 29 3 19 13 31 Sub-total E 799 80 396 483 879 Base cost 6,596 578 3,454 3,721 7,174 Contingencies
16 Physical Contingencies 462 46 245 263 508 17 Price Contingencies 528 53 279 301 580 Total Contingencies 989 99 524 564 1,088
18 Bank fee 99 10 99 10 209 TOTAL 7,685 687 4,077 4,295 8,372
Source: Consultants' estimates.

TA 4485-VIE: Central Region Small and Medium Towns Development Project FINAL REPORT Appendix 10, page 11
June 2006
Table A10-15. Cost Estimates for Ninh Hoa Town, Khanh Hoa Province (US$’000) Component Total Cost
excl. tax Taxes Foreign Exchange
Local Currency
Total Costincl. tax
A. Community envi. sanitation & awareness 1 Community awareness 30 - 18 12 30 2 HHs sanitation improvement - - - - - Sub-total A 30 - 18 12 30
B. Water Supply Development 3 Civil works 2,439 325 1,659 1,106 2,764 4 Equipment 176 12 176 12 188 5 Land acquisition and compensation 5 - - 5 5 Sub-total B 2,620 337 1,834 1,123 2,958
C. Drainage & Wastewater Management 6 Civil works - - - - - 7 Equipment - - - - - 8 Land acquisition and compensation - - - - - Sub-total C - - - - -
D. Solid Waste Management 9 Civil works - - - - - 10 Equipment - - - - - 11 Land acquisition and compensation - - - - - Sub-total D - - - - -
E. Project Management & Inst Strengthening 12 Consulting Services 210 21 173 58 231 13 Project management cost 107 11 - 118 118 14 Engineering survey and investigation 37 4 - 40 40 15 Training and capacity building 13 1 9 6 14 Sub-total E 367 37 182 222 404 Base cost 3,017 374 2,034 1,357 3,391 Contingencies
16 Physical Contingencies 211 21 139 93 232 17 Price Contingencies 241 24 159 106 266 Total Contingencies 453 45 299 199 498
18 Bank fee 45 5 45 5 50 TOTAL 3,515 424 2,378 1,561 3,939
Source: Consultants' estimates.
Table A10-16. Financing Plan for Towns in Khanh Hoa Province (US$’000)
Source Foreign Exchange
Local Currency Total Cost Percent
Asian Development Bank 3,693 5,540 9,233 75.00% Counterpart Funds 0 3,078 3,078 25.00%
Total 3,693 8,618 12,311 100.00% Percent 30.00% 70.00% 100.00%
Source: Consultants' estimates.

TA 4485-VIE: Central Region Small and Medium Towns Development Project FINAL REPORT Appendix 10, page 12
June 2006
F. COST ESTIMATES AND FINANCING PLANS FOR PHU YEN PROVINCE
Table A10-17. Cost Estimates for Towns in Phu Yen Province (US$’000) Component Total Cost
excl. tax Taxes Foreign Exchange
Local Currency
Total Costincl. tax
A. Community envi. sanitation & awareness 1 Community awareness 102 - 61 41 102- 2 HHs sanitation improvement - - - - - Sub-total A 102 - 61 41 102
B. Water Supply Development 3 Civil works - - - - - 4 Equipment - - - - - 5 Land acquisition and compensation - - - - - Sub-total B - - - - -
C. Drainage & Wastewater Management 6 Civil works 9,385 936 6,193 4,129 10,321 7 Equipment 840 42 840 42 882 8 Land acquisition and compensation 309 - - 309 309 Sub-total C 10,533 978 7,032 4,479 11,512
D. Solid Waste Management 9 Civil works 177 18 - 195 195 10 Equipment 20 1 - 21 21 11 Land acquisition and compensation - - - - - Sub-total D 197 19 - 216 216
E. Project Management & Inst Strengthening 12 Consulting Services 859 86 708 236 944 13 Project management cost 440 44 - 484 484 14 Engineering survey and investigation 150 15 - 165 165 15 Training and capacity building 54 5 35 24 59 Sub-total E 1,502 150 744 909 1,652 Base cost 12,335 1,147 7,837 5,645 13,482 Contingencies
16 Physical Contingencies 863 86 552 398 950 17 Price Contingencies 987 99 631 454 1,085 Total Contingencies 1,850 185 1,183 852 2,035
18 Bank fee 181 18 181 18 199 TOTAL 14,366 1,350 9,202 6,515 15,716
Source: Consultants' estimates.

TA 4485-VIE: Central Region Small and Medium Towns Development Project FINAL REPORT Appendix 10, page 13
June 2006
Table A10-18. Cost Estimates for Tuy Hoa Town, Phu Yen Province (US$’000)
Component
Total Cost
excl. taxTaxes Foreign
Exchange Local
Currency Total Cost
incl. tax
A. Community envi. sanitation & awareness 1 Community awareness 70 - 42 28 70 2 HHs sanitation improvement - - - - - Sub-total A 70 - 42 28 70
B. Water Supply Development 3 Civil works - - - - - 4 Equipment - - - - - 5 Land acquisition and compensation - - - - - Sub-total B - - - - -
C. Drainage & Wastewater Management 6 Civil works 8,262 824 5,452 3,634 9,086 7 Equipment 840 42 840 42 882 8 Land acquisition and compensation 301 - - 309 309 Sub-total C 9,410 866 6,291 3,985 10,276
D. Solid Waste Management 9 Civil works - - - - - 10 Equipment - - - - - 11 Land acquisition and compensation - - - - - Sub-total D - - - - -
E. Project Management & Inst Strengthening 12 Consulting Services 753 75 621 207 828 13 Project management cost 386 39 - 424 424 14 Engineering survey and investigation 132 13 - 145 145 15 Training and capacity building 47 5 31 21 52 Sub-total E 1,317 132 652 797 1449 Base cost 10,798 997 6,985 4,810 11,795 Contingencies
16 Physical Contingencies 756 76 492 339 831 17 Price Contingencies 863 86 563 387 950 Total Contingencies 1,620 162 1,055 727 1,782
18 Bank fee 162 16 162 16 178 TOTAL 12,579 1,176 8,202 5,553 13,755
Source: Consultants' estimates.

TA 4485-VIE: Central Region Small and Medium Towns Development Project FINAL REPORT Appendix 10, page 14
June 2006
Table A10-19. Cost Estimates for Song Cau Town, Phu Yen Province (US$’000) Component Total Cost
excl. tax Taxes Foreign Exchange
Local Currency
Total Costincl. tax
A. Community envi. sanitation & awareness 1 Community awareness 32 - 19 13 32 2 HHs sanitation improvement - - - - - Sub-total A 32 - 19 13 32
B. Water Supply Development 3 Civil works - - - - - 4 Equipment - - - - - 5 Land acquisition and compensation - - - - - Sub-total B - - - - -
C. Drainage & Wastewater Management 6 Civil works 1,123 112 741 494 1,235 7 Equipment - - - - - 8 Land acquisition and compensation - - - - - Sub-total C 1,123 112 741 494 1,235
D. Solid Waste Management 9 Civil works 177 18 - 195 195 10 Equipment 20 1 - 21 21 11 Land acquisition and compensation - - - - - Sub-total D 197 19 - 216 216
E. Project Management & Inst Strengthening 12 Consulting Services 106 11 87 29 116 13 Project management cost 54 5 - 60 60 14 Engineering survey and investigation 18 2 - 20 20 15 Training and capacity building 7 1 4 3 7 Sub-total E 185 18 91 112 203 Base cost 1,537 150 852 835 1,687 Contingencies
16 Physical Contingencies 108 11 60 59 118 17 Price Contingencies 123 12 68 67 135 Total Contingencies 231 23 128 126 253
18 Bank fee 19 2 19 2 21 TOTAL 1,787 174 999 962 1,961
Source: Consultants' estimates.
Table A10-20. Financing Plan for Towns in Phu Yen Province (US$’000)
Source Foreign Exchange
Local Currency Total Cost Percent
Asian Development Bank 7,072 4,715 11,787 75.00% Counterpart Funds 0 3,929 3,929 25.00%
Total 7,072 8,644 15,716 100.00 Percent 45.00% 55.00% 100.00%
Source: Consultants' estimates.

TA 4485-VIE: Central Region Small and Medium Towns Development Project FINAL REPORT Appendix 9, page 1
June 2006
DETAILED COST ESTIMATES AND FINANCING PLAN
This section summarizes the cost estimates and financing plan for the proposed Project. All calculations in this report were based on January 2006 base cost estimates. 1. COST ESTIMATES
1.1. Basis of Cost Estimates
The total project cost was calculated as the sum of the base costs, physical contingencies, price contingencies and interest and service charges during construction. The base costs were prepared by estimating the quantities for main items of physical work and services using preliminary designs approved for each Project town and multiplying the resulting quantities with standard unit costs derived from suppliers’ rates and historical rates as they apply to previous ODA and domestic projects in Viet Nam. The base cost estimates assumed the use of high quality materials and construction standards that are necessary to ensure the sustainability of the proposed investments. The unit costs used also took into account the likely country of origin of contractors and suppliers. For specialized equipment, it was deemed likely that procurement will involve international sources, while for pipes and peripheral equipment, the analysis assumed that both local and international sources will be used.
1.2. Project Cost Estimates
The preliminary cost estimates for the Project is summarized in Table A9-1. The Project is estimated to cost $96.94 million. The preliminary cost estimates presented in this report have been developed for the purpose of preliminary budgeting, and are based on recent similar project pricing, budget quotes for some equipment items, industry unit rates and experience. The scope and quality of the works are subject to change based on the availability of more accurate information; a ± 10 percent change is expected as detailed design for proposed subcomponents become available.
Table A9-1. Estimated Project Cost (US$’000’)
Component Total Costexcl. tax
Taxes Foreign
Exchange Local
CurrencyTotal Cost
incl. tax A. Community env. sanitation & awareness 1 Community awareness 272 0 163 109 272 2 Community Environmental Sanitation 272 0 163 109 272 Sub-Total A 544 0 326 218 544
B. Water Supply Development 3 Civil works 15,871 1,587 10,474 6,983 17,457 4 Equipment 1,518 73 1,518 73 1,590 5 Land acquisition and compensation 256 3 - 258 258 Sub-total B 17,644 1,662 11,992 7,314 19,306
C. Drainage & wastewater management - - - - - 6 Civil works 40,741 4,032 26,864 17,909 44,773 7 Equipment 1,478 74 1,478 74 1,552 8 Land acquisition and compensation 1,943 - - 1,943 1,943 Sub-total C 44,161 4,105 28,341 19,926 48,267
D. Solid waste management - - - - - 9 Civil works 2,527 257 - 2,784 2,784 10 Equipment 1,053 55 - 1,108 1,108 11 Land acquisition and compensation 172 - - 172 172 Sub-total D 3,752 312 - 4,064, 4,064

TA 4485-VIE: Central Region Small and Medium Towns Development Project FINAL REPORT Appendix 9, page 2
June 2006
Component Total Costexcl. tax
Taxes Foreign
Exchange Local
CurrencyTotal Cost
incl. tax E. Project management & insti strengthening 0 - - - - 12 Consulting Service 5,245 524 4,327 1,442 5,769 13 Project management cost 2,688 269 - 2,957 2,957 14 Engineering survey and investigation 918 92 - 1,010 1,010 15 Training and capacity building 798 80 527 351 878 Sub-total E 9,649 965 4,854 5,760 10,613 Base Cost 75,750 7,044 45,513 37,281 82,794 Contingencies - - - - -
16 Physical Contingencies 5,303 530 3,206 2,627 5,833 17 Price Contingencies 6,060 606 3,664 3,002 6,666 Total Contingencies 11,363 1,136 6,870 5,628 12,499
18 Interest and Service Charges 1,495 150 1,495 150 1,645 Total 88,608 8,330 53,879 43,059 96,938
* Totals may not add due to rounding. 2. PROJECT FINANCING PLAN
It is proposed that ADB will provide a loan of $50.0 million equivalent from its Special Funds resources to cover 51.6 percent of the total project cost, including $19.8 million equivalent of local currency cost. ADB financing of the local currency cost is justified by the tight fiscal situation confronting the Provincial People’s Committees (PPCs), which will be responsible for providing the counterpart funds and the debt servicing of the subloans under the Project. The ADB loan will have a maturity of 32 years with a grace period of 8 years, and an interest rate of 1 percent per annum during the grace period, and 1.5 percent thereafter.
AFD will provide a loan of $27 million to co-finance, on a parallel basis, 27.8 percent of the total project cost, including $10.56 million equivalent of the local currency cost. The AFD loan will have a maturity of 20 years with a grace period of 7 years, and an interest rate of 2.5 percent for the entire term of the loan. The participating PPCs will contribute counterpart funding from its own budget, for a combined total of $19.9 million or 20.6 percent of the total project cost. The proposed financing plan is summarized in Table A9-2.
Part of the loan funds from ADB and AFD will be relent by the Government to PPCs, which will then on-lend the funds to Project Operating Entities (POEs), including water supply and drainage companies, and urban public works companies, through subsidiary loans in either foreign or domestic currency. The subsidiary loans will be used to finance revenue-generating subcomponents such as water supply and solid waste management. The terms and conditions of the subsidiary loans will be based on current regulations provided in Circular 40/2005/BTC dated 25 May 2005 of the Ministry of Finance (MOF), and other prevailing regulations relevant to onlending.
Depending on the town classification and the currency of subsidiary loan availment1 the subsidiary loan to a PPC for water supply subcomponents will have a term of up to 25 years, including an 8-year grace period, at interest rates ranging from zero to 5 percent. In addition, a service fee of 0.3 percent will be charged. For the solid waste management subcomponent, the terms of the subsidiary loan will depend on the repayment capacity of
1 For Class V towns, the subsidiary loan will have a zero interest rate. For higher than Class V towns, the subsidiary loan will have an
interest rate of 2 percent per annum if the availment is in US Dollar or 5 percent per annum if the availment is in Vietnamese Dong.

TA 4485-VIE: Central Region Small and Medium Towns Development Project FINAL REPORT Appendix 9, page 3
June 2006
the borrowing town and will be decided by the MOF and the borrower at the time of the loan signing between the ADB and the Government2.
Table A9-2. Proposed Project Financing Plan (US$’000)
Source Foreign Exchange
Local Currency Total Cost Percent
Asian Development Bank 30,219 19,781 50,000 51.6%Agence Française de Devéloppement 16,441 10,559 27,000 27.8%Counterpart Funds 0 19,938 19,938 20.6%
Total 46,660 50,278 96,938 100.0%Percent 48.13% 51.87% 100.0%
Source: Consultants' estimates.
Detailed cost estimates and financing plans per town and provinces are presented in Tables A9-3 to A9-26.
2 Under the ADB-funded Central Region Urban Environmental Improvement Project, loan proceeds were relent to URENCOs to cover
the cost of O&M equipment for solid waste subcomponents through subsidiary loans with the following terms: maturities of 20 years, grace periods of 6 years, and fixed interest rates at 5.4 percent.

TA 4485-VIE: Central Region Small and Medium Towns Development Project FINAL REPORT Appendix 9, page 4
June 2006
A. PROJECT COST SUMMARY TABLES
Table A9-3. Project Cost Summary, by Town and by Component (US$’000)
Priority
City or Town
Community Env.
Sanitation & Awareness
Water Supply Development
Drainage & Wastewater Management
Solid Waste Management
Project Management &
Inst Strengthening
Base Cost
Contingencies
Total Estimated
Cost
Cumulative Cost
1 Tuy Hoa 74 11,692 1,707 13,474 2,035 15,789 15,789 2 Cam Ranh 96 - 8,074 1,357 1,381 10,908 1,652 12,788 28,577 3 Gia Nghia 50 5,534 5,283 1,303 1,827 13,996 2,109 16,316 44,893 4 Phan Thiet 78 - 14,379 - 2,168 16,625 2,506 19,478 64,371 5 Song Cau 32 - 2,083 357 354 2,826 425 3,310 67,681 6 Ninh Hoa 30 4,890 - 49 718 5,687 855 6,661 74,342 7 Ca Na 20 3,118 - - 453 3,591 540 4,204 78,547 8 Tan Son 30 1,438 - - 210 1,679 254 1,967 80,513 9 Ea T'Ling 20 1,829 214 16 311 2,390 361 2,801 83,314
10 Dak Mam 22 1,218 347 15 240 1,841 280 2,159 85,473 11 Quang Khe 14 882 202 - 164 1,262 191 1,480 86,953 12 Van Gia 26 397 - 967 200 1,590 241 1,864 88,817 13 Thap Cham 52 - 5,993 - 880 6,925 1,051 8,120 96,938
Total 544 19,306 48,267 4,064 10,613 82,794 12,499 96,938
Source: Consultants’ estimates. Notes: 1. The cost of the regional landfill for Ninh Hoa and Van Gia is included in the cost estimate for Van Gia Subproject. 2. The 18 subprojects were prioritized based on selection criteria agreed between ADB and Government of Viet Nam, which were confirmed at the Inception Workshop on 15 June 2005. 3. Cost of CESA Component is based on Y2010 population and unit cost of $0.5/capita for Tuy Hoa, Phan Thiet and Thap Cham (which received previous assistance for CESA), and $1/capita for Cam Ranh and
Gia Nghia, and $2/capita for the small towns.

TA 4485-VIE: Central Region Small and Medium Towns Development Project FINAL REPORT Appendix 9, page 5
June 2006
Table A9-4. Project Cost Summary, by Town and by Subcomponent (US$’000)
Description All Towns
Tuy Hoa
Song Cau
Cam Ranh
Ninh Hoa
Van Gia
Thap Cham
Tan Son
Ca Na
Phan Thiet
Gia Nghia
Ea T'Ling
Dak Mam
Quang Khe
A. Community Env Sanitation & Awareness 1 Community Awareness 544 74 32 96 30 26 52 30 20 78 50 20 22 14 2 HHs sanitation improvement Sub-Total A 544 74 32 96 30 26 52 30 20 78 50 20 22 14
B. Water Supply Development 3 Civil works 17,457 - - - 4,628 329 - 1,193 3,019 - 5,067 1,557 1,007 657 4 Equipment 1,590 - - - 257 68 - 217 99 - 358 229 155 208 5 Land acquisition and compensation 258 - - - 5 - - 28 - - 109 43 56 17 Sub-total B 19,306 - - - 4,890 397 - 1,438 3,118 - 5,534 1,829 1,218 882
C. Drainage & Wastewater Management 6 Civil works 44,773 10,341 2,083 7,338 - - 5,607 - - 13,525 5,150 198 340 190 7 Equipment 1,552 1,042 - 153 - - 85 - - 170 75 12 7 7 8 Land acquisition and compensation 1,943 309 - 582 - - 301 - - 685 58 4 - 5 Sub-total C 48,267 11,692 2,083 8,074 - - 5,993 - - 14,379 5,283 214 347 202
D. Solid Waste Management 9 Civil works 2,784 - 313 863 6 784 - - - - 819 - - -
10 Equipment 1,108 - 44 417 43 153 - - - - 420 16 15 - 11 Land acquisition and compensation 172 - - 78 - 31 - - - - 64 - - -
Sub-total D 4,064 - 357 1,357 49 967 - - - - 1,303 16 15 - E. Project Management & Inst Strengthening 12 Consulting Services 5,679 942 195 762 396 110 485 116 250 1,156 974 166 128 88 13 Project management cost 2,957 483 100 391 203 56 248 59 128 593 499 85 66 45 14 Engineering survey and investigation 1,010 165 34 133 69 19 85 20 44 202 170 29 22 15 15 Training and capacity building 88 118 24 95 50 14 61 14 31 217 183 31 24 16
Sub-total E 10,613 1,707 354 1,381 718 200 880 210 453 2,168 1,827 311 240 164 Base Cost 82,794 13,474 2,826 10,908 5,687 1,590 6,295 1679 3,591 16,625 13,996 2,390 1,841 1,262 Contingencies
16 Physical Contingencies 5,833 949 198 771 399 112 490 118 252 1,170 984 169 130 89 17 Price Contingencies 6,666 1,085 227 881 456 128 560 135 288 1,337 1,125 193 149 102
Total Contingencies 12,499 2,035 425 1652 855 241 1,051 254 540 2,506 2,109 361 280 191 18 Bank Fee 1,645 281 59 228 118 33 145 35 74 346 211 50 39 26
Total 96,938 15,789 3,310 12,788 6,661 1,864 8,120 1,967 4,204 19,478 16,316 2,801 2,159 1,480 ESTIMATED COST BY PROVINCE 19,099 21,313 14,292 19,478 22,756
PHU YEN KHANH HOA NINH THUAN BINH THUAN DAK NONG
Source: Consultant’s estimates.

TA 4485-VIE: Central Region Small and Medium Towns Development Project FINAL REPORT Appendix 9, page 6
June 2006
B. COST ESTIMATES AND FINANCING PLAN FOR DAK NONG PROVINCE
Table A9-5. Cost Estimates for All Participating Towns in Dak Nong Province (US$’000)
Component Total Cost
excl. tax Taxes Foreign Exchange
Local Currency
Total Costincl. tax
A. Community env sanitation & awareness 1 Community Awareness 106 63 43 106 2 HHs sanitation improvement Sub-total A 106 - 63 43 106
B. Water supply development 3 Civil works 7535 755 4972 3316 8288 4 Equipment 910 40 910 40 950 5 Land acquisition and compensation 225 - - 225 225 Sub-total B 8,670 795 5,882 3,581 9,463
C. Drainage & wastewater management 6 Civil works 5343 534 3527 2351 5878 7 Equipment 97 5 97 5 102 8 Land acquisition and compensation 67 - - 67 67 Sub-total C 5,506 539 3,624 2,423 6,046
D. Solid waste management 9 Civil works 740 78 - 819 819 10 Equipment 436 21 - 451 451 11 Land acquisition and compensation 64 - 64 64 Sub-total D 1,240 99 - 1,334 1334
E. Project management & inst strengthening 12 Consulting Service 1233 124 1,018 340 1,356 13 Project management cost 632 63 695 695 14 Engineering survey and investigation 215 22 236 236 15 Training and capacity building 231 23 153 102 254 Sub-total E 2,311 232 1,171 1373 2542 Base Cost 17,833 1,665 9,677 8711 19385 Contingencies
16 Physical Contingencies 1248 124 755 616 1,372 17 Price Contingencies 1,427 143 863 705 1,569 Total Contingencies 2,675 267 1618 1321 2,941
18 Bank fee 296 30 296 30 326 Total 20,781 1,961 12,625 10,101 22,756
Source: Consultants’ estimates.

TA 4485-VIE: Central Region Small and Medium Towns Development Project FINAL REPORT Appendix 9, page 7
June 2006
Table A9-6. Cost Estimate for Gia Nghia Town, Dak Nong Province (US$’000) Component Total Cost
excl. tax Taxes Foreign
Exchange Local
Currency Total Cost
incl. tax A. Community env sanitation & awareness 1 Community Awareness 50 30 20 50 2 HHs sanitation improvement Sub-total A 50 30 20 50
B. Water supply development 3 Civil works 4,606 461 3,040 2,027 5,067 4 Equipment 341 17 341 17 358 5 Land acquisition and compensation 109 110 109 Sub-total B 5,056 478 3,381 2,153 5,534
C. Drainage & wastewater management 6 Civil works 4,681 468 3,090 2,060 5,150 7 Equipment 72 4 72 3 75 8 Land acquisition and compensation 58 58 58 Sub-total C 4,811 472 3,162 2,121 5,283
D. Solid waste management 9 Civil works 740 78 819 818 10 Equipment 400 20 420 420 11 Land acquisition and compensation 64 64 64 Sub-total D 1,204 98 - 1,303 1,303
E. Project management & inst strengthening 12 Consulting Service 886 89 731 244 974 13 Project management cost 454 45 499 499 14 Engineering survey and investigation 155 16 170 170 15 Training and capacity building 166 17 110 73 183 Sub-total E 1,661 166 840 986 1,827 Base Cost 12,782 1,214 7,412 6,584 13,996 Contingencies
16 Physical Contingencies 895 89 521 463 984 17 Price Contingencies 1,023 102 595 529 1,125 Total Contingencies 1,917 192 1,117 992 2,109
18 Bank fee 192 19 192 19 211 Total 14,891 1,425 8,721 7,595 16,316
Source: Consultants’ estimates.

TA 4485-VIE: Central Region Small and Medium Towns Development Project FINAL REPORT Appendix 9, page 8
June 2006
Table A9-7. Cost Estimates for Ea T'Ling Town, Dak Nong Province (US$’000)
Component Total Cost excl. tax Taxes
Foreign Exchange
Local Currency
Total Costincl. tax
A. Community env sanitation & awareness 1 Community awareness 20 - 12 8 20 2 HHs sanitation improvement Sub-total A 20 - 12 8 20
B. Water supply development 3 Civil works 1,416 142 934 623 1,557 4 Equipment 218 11 218 11 229 5 Land acquisition and compensation 43 43 43 Sub-total B 1,676 153 1.152 677 1,829
C. Drainage & wastewater management 6 Civil works 180 18 119 79 198 7 Equipment 11 1 11 1 12 8 Land acquisition and compensation 4 - - 4 4 Sub-total C 195 19 130 84 214
D. Solid waste management 9 Civil works - - - - -
10 Equipment 15 0.571 - 16 16 11 Land acquisition and compensation - - - - - Sub-total D 15 0.571 - 16 16
E. Project Management & Inst Strengthening 12 Consulting Service 151 15 125 42 166 13 Project management cost 77 8 - 85 85 14 Engineering survey and investigation 26 3 - 29 29 15 Training and capacity building 28 3 19 12 31 Sub-total E 283 28 143 168 311 Base Cost 2,190 200 1,437 953 2,390 Contingencies
16 Physical Contingencies 153 15 101 67 169 17 Price Contingencies 175 18 116 77 193 Total Contingencies 328 33 217 144 361
18 Bank fee 45 5 45 5 50 TOTAL 2,549 238 1,670 1,101 2,801
Source: Consultants’ estimates.

TA 4485-VIE: Central Region Small and Medium Towns Development Project FINAL REPORT Appendix 9, page 9
June 2006
Table A9-8. Cost Estimates for Dak Mam Town, Dak Nong Province (US$’000) Component Total Cost
excl. tax Taxes Foreign Exchange
Local Currency
Total Costincl. tax
A. Community envi. sanitation & awareness 1 Community awareness 22 - 13 9 22 2 HHs sanitation improvement - Sub-total A 22 - 13 9 22
B. Water Supply Development 3 Civil works 916 92 604 403 1,007 4 Equipment 153 2 153 2 155 5 Land acquisition and compensation 56 - - 56 56 Sub-total B 1,124 93 757 460 1,217
C. Drainage & Wastewater Management 6 Civil works 309 31 204 136 340 7 Equipment 7 0.333 7 0.333 7 8 Land acquisition and compensation - - - - - Sub-total C 315 31 210 136 347
D. Solid Waste Management 9 Civil works - - - - - 10 Equipment 14 0.713 - 15 15 11 Land acquisition and compensation - - - - - Sub-total D 14 0.713 - - 15
E. Project Management & Inst Strengthening 12 Consulting Services 116 12 96 32 128 13 Project management cost 60 6 - 66 66 14 Engineering survey and investigation 20 2 - 22 22 15 Training and capacity building 22 2 14 10 24 Sub-total E 218 22 110 130 240 Base cost 1,694 147 1,091 750 1,841 Contingencies
16 Physical Contingencies 119 12 77 53 130 17 Price Contingencies 136 14 88 61 149 Total Contingencies 254 25 166 114 280
18 Bank fee 35 4 35 4 39 TOTAL 1,983 176 1,292 867 2,159
Source: Consultants’ estimates.

TA 4485-VIE: Central Region Small and Medium Towns Development Project FINAL REPORT Appendix 9, page 10
June 2006
Table A9-9. Cost Estimates for Quang Khe Town, Dak Nong Province (US$’000)
Component Total Costexcl. tax Taxes Foreign
Exchange Local
Currency Total Cost
incl. tax A. Community envi. sanitation & awareness 1 Community awareness 14 - 8 6 14 2 HHs sanitation improvement - Sub-total A 14 - 8 6 14
B. Water Supply Development 3 Civil works 597 60 394 263 657 4 Equipment 198 10 198 10 208 5 Land acquisition and compensation 17 - - 17 17 Sub-total B 812 70 592 290 882
C. Drainage & Wastewater Management 6 Civil works 173 17 114 76 190 7 Equipment 7 0.333 7 0.333 7 8 Land acquisition and compensation 5 - - 5 5 Sub-total C 184 18 121 81 202
D. Solid Waste Management 9 Civil works - - - - - 10 Equipment - - - - - 11 Land acquisition and compensation - - Sub-total D - - - - -
E. Project Management & Inst Strengthening 12 Consulting Services 80 8 66 22 88 13 Project management cost 41 4 - 45 45 14 Engineering survey and investigation 14 1 - 15 15 15 Training and capacity building 15 1 10 7 16 Sub-total E 149 15 76 89 164 Base cost 1,160 103 797 465 1,262 Contingencies
16 Physical Contingencies 81 8 56 33 89 17 Price Contingencies 93 9 64 38 102 Total Contingencies 174 17 121 71 191
18 Bank fee 24 2 24 2 26 TOTAL 1,358 122 942 538 1,480
Source: Consultants' estimates. Table A9-10. Financing Plan for All Participating Towns, Dak Nong Province
(US$’000) Source Foreign
Exchange Local
Currency Total Cost Percent
Asian Development Bank 5,358 331 5,689 25.0% Agence Française de Devéloppement 5,542 6,177 11,719 55.0% Counterpart Funds 0 5,348 5,348 20.0%
Total 10,900 11,856 22,756 100.0% Percent 47.90% 52.10% 100.0%
Source: Consultants' estimates.

TA 4485-VIE: Central Region Small and Medium Towns Development Project FINAL REPORT Appendix 9, page 11
June 2006
C. COST ESTIMATES AND FINANCING PLAN FOR BINH THUAN PROVINCE
Table A9-11. Cost Estimates for Phan Thiet Town, Binh Thuan Province (US$’000) Component Total Cost
excl. tax Taxes Foreign Exchange
Local Currency
Total Costincl. tax
A. Community envi. sanitation & awareness 1 Community awareness 78 - 47 31 78 2 HHs sanitation improvement Sub-total A 78 - 47 47 94
B. Water Supply Development 3 Civil works - - - - - 4 Equipment - - - - - 5 Land acquisition and compensation - - - - - Sub-total B - - - - -
C. Drainage & Wastewater Management 6 Civil works 12,295 1,229 8,115 5,410 13,525 7 Equipment 162 8 162 8 170 8 Land acquisition and compensation 685 - - 685 685 Sub-total C 13,142 1,238 8,276 6,103 14,380
D. Solid Waste Management 9 Civil works - - - - -
10 Equipment - - - - - 11 Land acquisition and compensation - - - - - Sub-total D - - - - -
E. Project Management & Inst Strengthening 12 Consulting Services 1,051 105 867 289 1,156 13 Project management cost 539 54 - 593 593 14 Engineering survey and investigation 184 18 - 202 202 15 Training and capacity building 197 20 130 87 217 Sub-total E 1,971 197 997 1,171 2,168 Base cost 15,191 1,435 9,321 7,305 16,625 Contingencies
16 Physical Contingencies 1,063 106 156 514 1,170 17 Price Contingencies 1,215 122 749 587 1,337 Total Contingencies 2,278 228 905 1,101 2,507
18 Bank fee 314 31 314 31 346 TOTAL 17,784 1,694 11,040 8,437 19,478
Source: Consultants' estimates.. Note: Only Phan Thiet in Binh Thuan is selected for Bank financing.
Table A9-12. Financing Plan for all Participating Towns in Binh Thuan Province (US$’000)
Source Foreign Exchange
Local Currency Total Cost Percent
Asian Development Bank 9,349 6,233 15,582 80.0% Agence Francaise de Developpement 0 0 0 0.0% Counterpart Funds 0 3,896 3,896 20.0%
Total 9,349 10,129 19,478 100.00% Percent 48.00% 52.00% 100.00%
Sources: Consultants' estimates.

TA 4485-VIE: Central Region Small and Medium Towns Development Project FINAL REPORT Appendix 9, page 12
June 2006
D. COST ESTIMATES AND FINANCING PLAN FOR NINH THUAN PROVINCE
Table A9-13. Cost Estimates for All Participating Towns in Ninh Thuan Province (US$’000)
Component Total Costexcl. tax Taxes Foreign
Exchange Local
Currency Total Cost
incl. tax A. Community envi. sanitation & awareness 1 Community awareness 102 61 41 102 2 HHs sanitation improvement - - - Sub-total A 102 61 41 102
B. Water Supply Development 3 Civil works 3,829 383 2,527 1,684 4,212 4 Equipment 300 16 300 16 316 5 Land acquisition and compensation 26 2 - 28 28 Sub-total B 3,615 401 2,827 1,728 4,556
C. Drainage & Wastewater Management 6 Civil works 5134 473 3,364 2,243 5,607 7 Equipment 80 4 80 5 85 8 Land acquisition and compensation 301 301 301 Sub-total C 5,515 477 3,444 2,549 5,993
D. Solid Waste Management 9 Civil works - - - - - 10 Equipment - - - - - 11 Land acquisition and compensation - - - - - Sub-total D - - - - -
E. Project Management & Inst Strengthening 12 Consulting Services 773 78 638 213 851 13 Project management cost 396 39 0 436 435 14 Engineering survey and investigation 136 13 0 149 149 15 Training and capacity building 97 9 64 42 106 Sub-total E 1,402 139 702 840 1,541 Base cost 10,634 1,017 7,034 5,158 12,192 Contingencies
16 Physical Contingencies 783 78 496 364 860 17 Price Contingencies 894 89 568 417 985 Total Contingencies 1,676 167 1,064 781 1845
18 Bank fee 232 23 232 23 254 TOTAL 12,542 1,207 8,330 5,962 14,292
Source: Consultants' estimates.

TA 4485-VIE: Central Region Small and Medium Towns Development Project FINAL REPORT Appendix 9, page 13
June 2006
Table A9-14. Cost Estimates for Thap Cham Town, Ninh Thuan Province (US$’000)
Component Total Cost excl. tax Taxes Foreign
Exchange Local
Currency Total Cost
incl. tax A. Community envi. sanitation & awareness 1 Community awareness 52 31 21 52 2 HHs sanitation improvement Sub-total A 52 - 31 21 52
B. Water Supply Development 3 Civil works - - 4 Equipment - - 5 Land acquisition and compensation - Sub-total B - - -
C. Drainage & Wastewater Management 6 Civil works 5,134 473 3,364 2,243 5,607 7 Equipment 80 4 80 4 85 8 Land acquisition and compensation 301 301 301 Sub-total C 5,516 477 3,444 2,548 5,993
D. Solid Waste Management 9 Civil works - - 10 Equipment - - 11 Land acquisition and compensation - - Sub-total D - -
E. Project Management & Inst Strengthening 12 Consulting Services 441 44 36 121 485 13 Project management cost 226 23 249 249 14 Engineering survey and investigation 77 8 85 85 15 Training and capacity building 55 6 36 24 61 Sub-total E 800 80 400 479 880 Base cost 6,367 557 3,877 3,048 6,925 Contingencies
16 Physical Contingencies 446 45 274 216 490 17 Price Contingencies 509 51 314 247 560 Total Contingencies 955 96 588 462 1,051
18 Bank fee 132 13 132 13 145 TOTAL 7,454 666 4,596 3,524 8,120
Source: Consultants' estimates.

TA 4485-VIE: Central Region Small and Medium Towns Development Project FINAL REPORT Appendix 9, page 14
June 2006
Table A9-15. Cost Estimates for Tan Son Town, Ninh Thuan Province (US$’000)
Component Total Cost excl. tax Taxes Foreign
Exchange Local
Currency Total Cost
incl. tax A. Community envi. sanitation & awareness 1 Community awareness 30 - 18 12 30 2 HHs sanitation improvement - - Sub-total A 30 - 18 12 30
B. Water Supply Development 3 Civil works 1,085 108 716 477 1,193 4 Equipment 206 11 206 11 217 5 Land acquisition and compensation 26 3 28 28 Sub-total B 1,317 121 922 516 1,438
C. Drainage & Wastewater Management 6 Civil works - - - 7 Equipment - - - 8 Land acquisition and compensation - - Sub-total C - - -
D. Solid Waste Management 9 Civil works - - 10 Equipment - - 11 Land acquisition and compensation - - Sub-total D - - -
E. Project Management & Inst Strengthening 12 Consulting Services 105 11 87 29 116 13 Project management cost 54 5 59 59 14 Engineering survey and investigation 18 2 20 20 15 Training and capacity building 13 1 9 6 14 Sub-total E 191 19 96 114 210 Base cost 1,538 140 1,036 643 1,679 Contingencies
16 Physical Contingencies 108 11 73 45 118 17 Price Contingencies 123 12 84 52 135 Total Contingencies 231 23 157 97 254
18 Bank fee 32 3 32 3 35 TOTAL 1,801 167 1,224 743 1,967
Source: Consultants' estimates.

TA 4485-VIE: Central Region Small and Medium Towns Development Project FINAL REPORT Appendix 9, page 15
June 2006
Table A9-16. Cost Estimates for Ca Na Town, Ninh Thuan Province (US$’000)
Component Total Costexcl. tax Taxes Foreign
Exchange Local
Currency Total Cost
incl. tax A. Community envi. sanitation & awareness 1 Community awareness 20 - 12 8 20 2 HHs sanitation improvement - Sub-total A 20 - 12 8 20
B. Water Supply Development 3 Civil works 2,744 274 1,811 1,207 3,019 4 Equipment 94 5 94 6 99 5 Land acquisition and compensation - - Sub-total B 2,838 280 1,905 1,213 3,118
C. Drainage & Wastewater Management 6 Civil works - - - 7 Equipment - - - 8 Land acquisition and compensation - - Sub-total C - - -
D. Solid Waste Management 9 Civil works - - 10 Equipment - - 11 Land acquisition and compensation - - Sub-total D - - -
E. Project Management & Inst Strengthening 12 Consulting Services 227 23 187 62 250 13 Project management cost 116 12 128 128 14 Engineering survey and investigation 40 4 44 44 15 Training and capacity building 28 3 19 12 31 Sub-total E 412 41 206 247 452 Base cost 3,270 321 2,123 1,467 3,591 Contingencies
16 Physical Contingencies 229 23 149 103 252 17 Price Contingencies 262 26 170 118 288 Total Contingencies 490 49 319 220 540
18 Bank fee 68 7 68 7 74 TOTAL 3,828 376 2,510 1,694 4,204
Source: Consultants' estimates.
Table A9-17. Financing Plan for All Participating Towns in Ninh Thuan Province (US$’000)
Source Foreign Exchange
Local Currency Total Cost Percent
Asian Development Bank 3,341 3,619 6,960 48.70% Agence Française de Devéloppement 3,519 954 4,473 31.30% Counterpart Funds 0 2,858 2,858 20.00%
Total 6,860 7,432 14,292 100.00% Percent 48.00% 52.00% 100.00%
Source: Consultants' estimates.

TA 4485-VIE: Central Region Small and Medium Towns Development Project FINAL REPORT Appendix 9, page 16
June 2006
E. COST ESTIMATES AND FINANCING PLAN FOR KHANH HOA PROVINCE
Table A9-18. Cost Estimates for All Participating Towns in Khanh Hoa Province (US$’000)
Component Total Costexcl. tax Taxes Foreign
Exchange Local
Currency Total Cost
incl. tax A. Community envi. sanitation & awareness 1 Community awareness 152 53 152 2 HHs sanitation improvement Sub-total A 152 53 152
B. Water Supply Development 3 Civil works 4,506 451 2,974 1,983 4,957 4 Equipment 308 17 300 17 325 5 Land acquisition and compensation 5 5 5 Sub-total B 4,819 468 3,274 2,005 5,287
C. Drainage & Wastewater Management 6 Civil works 6,671 667 4,403 2,935 7,338 7 Equipment 146 7 146 7 154 8 Land acquisition and compensation 582 - 582 582 Sub-total C 7,399 674 4,549 3,524 8,074
D. Solid Waste Management 9 Civil works 1,502 150 1,653 1,653 10 Equipment 582 32 613 613 11 Land acquisition and compensation 109 109 109 Sub-total D 2,193 182 2,375 2,375
E. Project Management & Inst Strengthening 12 Consulting Services 1,153 115 951 317 1,268 13 Project management cost 591 59 594 650 14 Engineering survey and investigation 202 19 221 221 15 Training and capacity building 145 15 95 64 159 Sub-total E 2,091 208 1,046 1,196 2,298 Base cost 16,654 1,611 8,869 9,153 18,166 Contingencies
16 Physical Contingencies 1,166 116 632 647 1,282 17 Price Contingencies 1,333 133 722 743 1,465 Total Contingencies 2,499 249 1354 1390 2748
18 Bank fee 344 35 344 35 379 TOTAL 19,497 1,815 10,669 10,643 21,313
Source: Consultants' estimates.

TA 4485-VIE: Central Region Small and Medium Towns Development Project FINAL REPORT Appendix 9, page 17
June 2006
Table A9-19. Cost Estimates for Cam Ranh Town, Khanh Hoa Province (US$’000)
Component Total Costexcl. tax Taxes Foreign
Exchange Local
Currency Total Cost
incl. tax A. Community envi. sanitation & awareness 1 Community awareness 96 58 38 96 2 HHs sanitation improvement Sub-total A 96 - 58 38 96
B. Water Supply Development 3 Civil works - - 4 Equipment - - 5 Land acquisition and compensation - - Sub-total B - -
C. Drainage & Wastewater Management 6 Civil works 6,671 667 4,403 2,935 7,338 7 Equipment 146 7 146 7 154 8 Land acquisition and compensation 582 - 582 582 Sub-total C 7,399 674 4,549 3,524 8,074
D. Solid Waste Management 9 Civil works 784 78 863 863 10 Equipment 397 20 417 417 11 Land acquisition and compensation 78 - 78 78 Sub-total D 1,259 98 - 1,357 1,357
E. Project Management & Inst Strengthening 12 Consulting Services 693 69 571 190 762 13 Project management cost 355 36 391 391 14 Engineering survey and investigation 121 12 133 133 15 Training and capacity building 87 9 57 38 95 Sub-total E 1,255 126 629 752 1,381 Base cost 10,010 898 5,236 5,673 10,908 Contingencies
16 Physical Contingencies 701 70 370 401 771 17 Price Contingencies 801 80 422 458 881 Total Contingencies 1,501 150 793 859 1,652
18 Bank fee 207 21 207 21 228 TOTAL 11,719 1069 6,236 6,552 12,788
Source: Consultants' estimates.

TA 4485-VIE: Central Region Small and Medium Towns Development Project FINAL REPORT Appendix 9, page 18
June 2006
Table A9-20. Cost Estimates for Ninh Hoa Town, Khanh Hoa Province (US$’000) Component Total Cost
excl. tax Taxes Foreign Exchange
Local Currency
Total Costincl. tax
A. Community envi. sanitation & awareness 1 Community awareness 30 18 12 30 2 HHs sanitation improvement - Sub-total A 30 - 18 12 30
B. Water Supply Development 3 Civil works 4,207 421 2,777 1,851 4,628 4 Equipment 244 13 244 13 257 5 Land acquisition and compensation 5 5 5 Sub-total B 4,457 433 3,021 1,869 4,890
C. Drainage & Wastewater Management 6 Civil works - - - - - 7 Equipment - - - - - 8 Land acquisition and compensation - - - Sub-total C - - - - -
D. Solid Waste Management 9 Civil works 5 0.500 6 6 10 Equipment 40 4 43 43 11 Land acquisition and compensation - - - Sub-total D 45 4 - 49 49
E. Project Management & Inst Strengthening 12 Consulting Services 360 36 297 99 396 13 Project management cost 185 18 203 203 14 Engineering survey and investigation 63 6 69 69 15 Training and capacity building 45 5 30 20 50 Sub-total E 653 65 327 391 718 Base cost 5,184 503 3,366 2,321 5,687 Contingencies
16 Physical Contingencies 363 36 236 163 399 17 Price Contingencies 415 41 270 186 456 Total Contingencies 778 78 506 349 855
18 Bank fee 11 11 107 11 118 TOTAL 6,069 591 3,979 2,681 6,661
Source: Consultants' estimates.

TA 4485-VIE: Central Region Small and Medium Towns Development Project FINAL REPORT Appendix 9, page 19
June 2006
Table A9.-21. Cost Estimates for Van Gia Town, Khanh Hoa Province (US$’000)
Component Total Costexcl. tax Taxes Foreign
Exchange Local
CurrencyTotal Cost
incl. tax A. Community envi. sanitation & awareness 1 Community awareness 26 16 10 26 2 HHs sanitation improvement - Sub-total A 26 - 16 10 26
B. Water Supply Development 3 Civil works 299 30 197 132 329 4 Equipment 64 4 64 4 68 5 Land acquisition and compensation - - Sub-total B 363 34 262 135 397
C. Drainage & Wastewater Management 6 Civil works - - - - 7 Equipment - - - - - 8 Land acquisition and compensation - - - Sub-total C - - - - -
D. Solid Waste Management 9 Civil works 713 71 784 784
10 Equipment 145 8 153 153 11 Land acquisition and compensation 31 - 31 31 Sub-total D 889 79 - 967 967
E. Project Management & Inst Strengthening 12 Consulting Services 100 10 83 28 110 13 Project management cost 51 5 56 56 14 Engineering survey and investigation 18 2 19 19 15 Training and capacity building 13 1 8 6 14 Sub-total E 182 18 91 109 200 Base cost 1,460 130 368 1,221 1,590 Contingencies
16 Physical Contingencies 102 10 26 83 112 17 Price Contingencies 117 12 30 99 128 Total Contingencies 219 22 56 185 241
18 Bank fee 30 3 30 3 33 TOTAL 1,709 155 454 1,410 1,864
Source: Consultants' estimates.
Table A9-22. Financing Plan for All Participating Towns in Khanh Hoa Province (US$’000)
Source Foreign Exchange
Local Currency Total Cost Percent
Asian Development Bank 3,500 3,792 7,292 34.21% Agence Française de Devéloppement 6,730 3,428 10,158 47.66% Counterpart Funds 0 3,863 3,863 18.13%
Total 10,230 11,083 21,313 100.00% Percent 48.00% 52.00% 100.00%
Source: Consultants' estimates.

TA 4485-VIE: Central Region Small and Medium Towns Development Project FINAL REPORT Appendix 9, page 20
June 2006
F. COST ESTIMATES AND FINANCING PLAN FOR PHU YEN PROVINCE Table A9-23. Cost Estimates for All Participating Towns, Phu Yen Province (US$’000) Component Total Cost
excl. tax Taxes Foreign Exchange
Local Currency
Total Costincl. tax
A. Community envi. sanitation & awareness 1 Community awareness 106 63 43 106 2 HHs sanitation improvement Sub-total A 106 63 43 106
B. Water Supply Development 3 Civil works 4 Equipment 5 Land acquisition and compensation Sub-total B - - - - -
C. Drainage & Wastewater Management 6 Civil works 11,297 1,127 7,456 4,970 12,425 7 Equipment 993 50 993 50 1,042 8 Land acquisition and compensation 309 309 309 Sub-total C 12,599 1,177 8,449 5,329 13,776
D. Solid Waste Management 9 Civil works 285 28 313 313 10 Equipment 41 2 44 44 11 Land acquisition and compensation - - Sub-total D 326 31 - 357 357
E. Project Management & Inst Strengthening 12 Consulting Services 1,034 104 854 285 1,137 13 Project management cost 530 53 0 583 583 14 Engineering survey and investigation 181 18 0 199 199 15 Training and capacity building 129 13 86 57 142 Sub-total E 1,874 188 940 1124 2,061 Base cost 14,905 1,395 9,449 6851 16,300 Contingencies
16 Physical Contingencies 1,043 104 665 482 1,147 17 Price Contingencies 1,192 120 721 551 1,312 Total Contingencies 2,236 223 1,426 1,034 2,460
18 Bank fee 308 31 308 31 340 TOTAL 17,450 1,649 11,184 7,915 19,099
Source: Consultants' estimates.

TA 4485-VIE: Central Region Small and Medium Towns Development Project FINAL REPORT Appendix 9, page 21
June 2006
Table A9-24. Cost Estimates for Tuy Hoa Town, Phu Yen Province (US$’000)
Component
Total Cost
excl. taxTaxes Foreign
Exchange Local
Currency Total Cost
incl. tax
A. Community envi. sanitation & awareness 1 Community awareness 74 44 30 74 2 HHs sanitation improvement - Sub-total A 74 - 44 30 74
B. Water Supply Development 3 Civil works - - - 4 Equipment - - - 5 Land acquisition and compensation - - - - Sub-total B - - - - -
C. Drainage & Wastewater Management 6 Civil works 9,403 938 6,205 4,137 10,342 7 Equipment 993 50 993 50 1,042 8 Land acquisition and compensation 309 309 309 Sub-total C 10,705 988 7,198 4,495 11,692
D. Solid Waste Management 9 Civil works - - - - 10 Equipment - - 11 Land acquisition and compensation - - - - Sub-total D - - - -
E. Project Management & Inst Strengthening 12 Consulting Services 856 86 707 236 942 13 Project management cost 439 44 483 483 14 Engineering survey and investigation 150 15 165 165 15 Training and capacity building 107 11 71 47 118 Sub-total E 1,552 155 777 930 1,707 Base cost 12,331 1,143 8,019 5,455 13,474 Contingencies
16 Physical Contingencies 863 86 565 384 949 17 Price Contingencies 986 99 646 439 1,085 Total Contingencies 1,850 185 1,211 824 2,035
18 Bank fee 255 26 255 26 281 TOTAL 14,436 1,353 9,485 6,304 15,789
Source: Consultants' estimates.

TA 4485-VIE: Central Region Small and Medium Towns Development Project FINAL REPORT Appendix 9, page 22
June 2006
Table A9-25. Cost Estimates for Song Cau Town, Phu Yen Province (US$’000) Component Total Cost
excl. tax Taxes Foreign Exchange
Local Currency
Total Costincl. tax
A. Community envi. sanitation & awareness 1 Community awareness 32 19 13 32 2 HHs sanitation improvement Sub-total A 32 19 13 32
B. Water Supply Development 3 Civil works - - - 4 Equipment - - - 5 Land acquisition and compensation - - Sub-total B - - -
C. Drainage & Wastewater Management 6 Civil works 1,894 189 1,250 833 2,083 7 Equipment - - - - - 8 Land acquisition and compensation - - Sub-total C 1,894 189 1,250 833 2,083
D. Solid Waste Management 9 Civil works 285 28 313 313 10 Equipment 41 2 44 44 11 Land acquisition and compensation - - Sub-total D 326 31 - 357 357
E. Project Management & Inst Strengthening 12 Consulting Services 178 18 147 49 195 13 Project management cost 91 9 100 100 14 Engineering survey and investigation 31 3 34 34 15 Training and capacity building 22 2 15 10 24 Sub-total E 322 32 161 193 354 Base cost 2,574 252 1,430 1,396 2,826 Contingencies
16 Physical Contingencies 180 18 100 98 198 17 Price Contingencies 206 21 115 112 227 Total Contingencies 386 38 215 210 425
18 Bank fee 53 5 53 5 59 TOTAL 3,014 296 1,699 1,611 3,310
Source: Consultants' estimates.
Table A9-26. Financing Plan for All Participating Towns in Phu Yen Province (US$’000)
Source Foreign Exchange
Local Currency Total Cost Percent
Asian Development Bank 8,671 5,806 14,477 75.80% Agence Française de Devéloppement 649 0 649 3.40% Counterpart Funds 0 3,973 3,973 20.80%
Total 9,320 9,779 19,099 100.00% Percent 48.80% 51.20% 100.00%
Source: Consultants' estimates.

TA 4485- VIE: Central Region Small and Medium Towns Development FINAL REPORT Appendix 8
June 2006
GENERAL LAYOUT OF PROPOSED WATER SUPPLY AND SANITATION SYSTEMS

TA 4485-VIE: Central Region Small and Medium Towns Development Project FINAL REPORT Appendix 7, page 1
June 2006
INFRASTRUCTURE SUBPROJECT AND COMPONENT DESCRIPTIONS
I. INTRODUCTION A. Project Description
The Project will develop, expand or improve water supply, drainage, wastewater management and solid waste management systems in 10-20 towns in five Central Region provinces of Phu Yen, Khanh Hoa, Ninh Thuan, Binh Thuan and Dak Nong. It will consist of five components, namely: (i) Community Environmental Sanitation and Awareness; (ii) Water Supply Development and Expansion; (iii) Drainage and Wastewater Management; (iv) Solid Waste Management, and; (v) Project Management and Institutional Strengthening.
B. Development Priorities
In early 2005, the five Provincial People’s Committees (PPCs) registered 18 candidate towns for the Project with the Ministry of Construction. The PPCs confirmed development priorities at the Inception Workshop on 15 June 2005, some PPCs modified their priorities during subsequent town visits by the consultant’s engineering team, and several subcomponents were reprioritized following the Interim Workshop. The final provincial priority list of 27 subcomponents in 18 towns included 11 water supply, 11 drainage and wastewater management, and 5 solid waste management subcomponents.
C. Subproject Descriptions
This report presents the preliminary descriptions for the 18 candidate subprojects, based on the status of preliminary engineering designs as of 11 January 2006. This Appendix presents descriptions for the proposed infrastructure components only. The engineering designs and cost estimates will be revised for the Pre-Feasibility and Feasibility Studies which are scheduled to be undertaken from December 2005-March 2006. Table A7-1 summarizes the proposed subcomponents in each town and associated cost estimates as of 11 January 2006.
Table A7-1. Summary of Proposed Subcomponents and Cost Estimates
City or Final Priorities Summary of Cost Estimates in US$ Millions Town WS DWM SWM CESA WS DWM SWM PMIS Other Total
1 Phu Yen Tuy Hoa 1 0.07 0.00 10.64 0.00 1.29 2.60 14.60 2 Song Cau 1 2 0.32 0.00 1.83 0.28 0..29 0.51 2.95 3 Khanh Hoa Cam Ranh 1 2 0.10 0.00 8.09 1.38 1.09 2.26 12.96 4 Ninh Hoa 1 3 0.03 4.84 0.00 0.05 0.57 1.17 6.67 5 Van Gia 2 3 0.03 0.25 0.00 1.06 0.19 0.33 1.86 6 Tu Bong 1 0.04 2.25 0.00 0.00 0.33 0.56 3.19 7 Ninh Thuan Thap Cham 1 0.05 0.00 5.75 0.00 0.66 1.38 7.87 8 Khanh Hai 1 0.03 0.00 0.87 0.00 0.11 0.22 1.23 9 Tan Son 1 0.03 1.45 0.00 0.00 0.17 0.35 2.00 10 Phuoc Dan 1 0.05 0.00 .74 0.00 0.08 0..28 1.07 11 Ca Na 1 0.02 3.10 0.00 0.00 0.39 0.75 4.27 12 Binh Thuan Phan Thiet 1 0.08 0.00 13.06 0.00 1.53 3.15 17.83 13 Cho Lau 1 0.09 5.22 0.00 0.00 0.71 1.31 7.35 14 La Gi 1 0.09 6.50 0.00 0.00 0.82 1.61 9.04

TA 4485-VIE: Central Region Small and Medium Towns Development Project FINAL REPORT Appendix 7, page 2
June 2006
City or Final Priorities Summary of Cost Estimates in US$ Millions Town WS DWM SWM CESA WS DWM SWM PMIS Other Total
15 Dak Nong Gia Nghia 1 2 3 0.05 6.21 6.03 1.38 1.76 3.32 18.78 16 Ea Tling 1 2 3 0.02 1.82 0.15 0.02 0.29 0.49 2.79 17 Dak Mam 1 2 3 0.02 1.22 0.42 0.02 0.24 0.40 2.33 18 Quang Khe 1 2 0.01 1.07 .16 0.00 0.19 0.30 1.75 TOTAL 11 11 5 0.852 33.97 47.77 4.19 10.75 21.05 118.60
Legend: CESA = Community Environmental Sanitation & Awareness; DR =stormwater drainage; DWM = drainage & wastewater management; PMIS = Project management and institutional strengthening; SWM = solid waste management; WS = water supply. Note: 1. “Other includes physical and price contingencies and service charges. 2. Cost of Van Gia/Ninh Hoa regional landfill is included in Van Gia cost estimate. D. Project Towns
Table A7-2 presents the features of the Project towns and coverage of urban services.
Table A7-2. Features of Project Towns Y2004 Population** Coverage of Urban Services Province &
Town Class Town/City Status
District Name
Poor %HH* Town No. Urban
No. WS
%HH Drains
m/capita SWM %HH
Septic Tanks %HH
Phu Yen 1 Tuy Hoa III City (P) - 9.09 162,278 135,000 28 0.2 89 85 2 Song Cau V Small Town (D) Song Cau 11.2 18,470 18,470 61 0.2 35 70 Khanh Hoa 3 Cam Rah IV Town - 18.0 215,822 90,897 62 0.2 69 62 4 Ninh Hoa V Small Town (D) Ninh Hoa 18.0 117,033 22,014 60 0.6 40-50 70 5 Van Gia V Small Town (D) Van Ninh 5.0 77,359 20,764 60 0.2 61 62 6 Tu Bong V Small Town Van Ninh - 52,046 29,970 0 0.1 40 80 Ninh Thuan 7 Thap Cham IV Part of Town (P) - 10.0 160,781 37,467 68 0.6 90 80 8 Khanh Hai V Small Town (D) Ninh Hoa - 13,738 13,200 70 0.1 50 60 9 Tan Son V Small Town (D) Ninh Son 8.3 38,432 11,432 60 0.0 20 46 10 Phuoc Dan V Small Town (D) Ninh Phuoc 10.0 23,701 23,701 60 0.1 30 60 11 Ca Na - Commune Ctr Ninh Phuoc 10.4 18,451 18,451 0 0.0 16 56 Binh Thuan 12 Phan Thiet III City (P) - 3.0 20,964 183,132 66 0.4 <80 77 13 Cho Lau V Small Town (D) Bac Binh 5.0 151,593 50,703 43/33 0.0 <70 60 14 La Gi V Small Town (D) Ham Tan 8.0 165,711 39,492 42 0.6 - 70 Dak Nong 15 Gia Nghia IV Town (P) - 18.3 35,559 24,811 33 0.2 85 20 16 Ea Tling V Small Town (D) Cu Jut 44.89 27,527 14,527 0 0.2 30 10 17 Dak Mam V Small Town (D) Krong No 36.0 8,972 6,372 0 0.6 25 15 18 Quang Khe V Small Town (D) Dac Nong 55.0 5,214 3,514 0 0.0 0 6
TOTALS 962,800 696,000 47 0.3 65 76 * Based on the new MOLISA Standard (2004). ** These figures are based on meetings and discussions with the PPCs and MABUTIP, surveys conducted by the Consultants’ engineering and socioeconomic group, town statistics books, and existing master plans.

TA 4485-VIE: Central Region Small and Medium Towns Development Project FINAL REPORT Appendix 7, page 3
June 2006
PHU YEN PROVINCE
There are two proposed candidate towns in Phu Yen Province, Tuy Hoa and Song Cau. Both the proposed subprojects in Tuy Hoa and Song Cau involve a Drainage and Wastewater Management subcomponent. For Song Cau, there is an additional Solid Waste Management subcomponent.
I. TUY HOA CITY SUBPROJECT A. Town Profile
Tuy Hoa City is a Class III City and provincial capital of Phu Yen Province. It is located on Highway 1A, about 120 km north of Nha Trang City and 560km from Ho Chi Minh City. Tuy Hoa City includes ten wards and four communes. Nine urban wards are located on the north side of Da Rang River, while Phu Lam ward is on the south side. The city’s population in 2004 was 162,278.
B. Proposed Tuy Hoa Subproject The Tuy Hoa Subproject has one major subcomponent, namely Drainage and Wastewater Management.
C. Management of Urban Services The Phu Yen Provincial Water Supply and Drainage Company manages water supply, drainage and wastewater in Tuy Hoa City and in other towns throughout the province.
D. Existing Drainage and Wastewater System The existing drainage network comprises about 34km of D400-1250 drains and box culverts, in main roads. The drainage system is concentrated on the four central urban wards (Wards 1-4), which lie on the north bank of the Da Rang River. These drains discharge stormwater and wastewater to the Da Rang River. The Third Provincial Towns WSS Project will construct a small quantity of additional drains in Wards 1, 2, 3 and 4. The Department of Agriculture and Rural Development (DARD) has recently constructed a flood dyke and collector drain along the north bank of the Da Rang River which diverts stormwater and wastewater to a small basin with flood gates near the downstream end of Bo Ha canal. DARD’s original design concept includes a stormwater pumping station at this location to pump stormwater over the dyke system when Da Rang River is in flood; however, the need for the stormwater pumping station is being reviewed. Flooding occurs throughout the urban areas during the wet season because of the limited extent and capacity of the drainage system. The PPU and local consultants report that Tuy Hoa experiences moderate flooding in the rainy season. About 7% of the area of the urban wards is subject to flooding each year. Minor flooding only occurs in wards 2, 3, 9 and 10. Flooding is most severe in wards 1 and 4-8, with 17-40% of the ward areas affected. Most wards are flooded two times each year to depths of 0.3-1.5m (average 1.0m), for periods of 5-72hours (average 11 hours). About 9,500 people (1,875 households) are affected by the flooding which causes damage to houses, business premises, property, crops, loss of access to schools and public services, damage to roads, disruption to traffic and adverse health

TA 4485-VIE: Central Region Small and Medium Towns Development Project FINAL REPORT Appendix 7, page 4
June 2006
impacts. The causes of flooding include lack of drainage in all wards, low ground levels, and river flooding in three wards.
E. Proposed Tuy Hoa Drainage & Wastewater Management Subcomponent 1. Scope The proposed Drainage and Wastewater Management Subcomponent includes: (i) stormwater drainage system; (ii) wastewater collection system, and; (iii) wastewater treatment. The proposed subproject will develop the first stage of a complete, integrated stormwater drainage, wastewater collection and wastewater treatment system for the City. It will expand, upgrade and improve the combined stormwater and wastewater systems in the urban wards in order to: (i) rapidly convey stormwater to the nearest rivers or streams; (ii) reduce flooding and ponding, and; (iii) ensure that wastewater is removed from core urban areas and treated to appropriate standards prior to discharge to the environment. It will also develop wastewater interceptors, pumping stations, trunk sewers and centralized wastewater treatment systems. 2. Service Area The subproject’s service area for drainage and wastewater management includes all nine urban wards to the north of Da Rang River and Phu Lam ward on the south side of Da Rang River, with Y2015 populations of 123,800 and 33,700 respectively. 3. Wastewater Flows Table A7-3 shows the forecast wastewater flows for Tuy Hoa’s urban wards, based on the subproject’s design criteria and development targets. 12,500m3/day and 3,500m3/day wastewater treatment stations are proposed for the nine northern wards and Phu Lam wards respectively by 2020.
Table A7-3. Forecast Wastewater Flows
Urban Urban Water Drainage WW Flow Total Flow Total Flow Year Population Population Consumption Coverage % of WS 9 Wards Phu Lam
9 Wards Phu Lam lpcd % m3/day m3/day 2015 123,800 33,700 120 70 70 8,740 2,380 2020 133,800 35,000 135 80 70 12,140 3,180
Note: The total wastewater flow is based on average dry weather flow and includes 20% for industrial wastewater and other non-domestic wastewater flows.
4. Options The Master Plan for Tuy Hoa proposes two stages of development: 1st Stage to 2010 and 2nd Stage to 2020. The proposed CSMT Project corresponds to Stage 1 of the Master Plan. It will develop a drainage and wastewater management system for existing developed urban areas and for those areas in which permanent roads will be constructed prior to 2010, when the Project is scheduled for implementation. Two options were considered for the long term development of the drainage and wastewater systems in Tuy Hoa: Option 1 - separate drainage and wastewater systems, and; Option 2 - combined drainage system with interceptor sewers. Considering the topography of Tuy Hoa City and Da Rang river level, the combined drainage system is

TA 4485-VIE: Central Region Small and Medium Towns Development Project FINAL REPORT Appendix 7, page 5
June 2006
recommended because it is least cost, more sustainable, and more flexible for staged development. 5. Development Plan for Drainage and Wastewater Systems The City’s long term plan for urban drainage and wastewater is to develop two complete stormwater drainage, wastewater collection, and wastewater treatment systems in the urban areas – one on the north side of Da Rang River serving Wards 1-9, and the other on the south side of the river, serving Phu Lam ward. Each system will comprise a combined drainage system with interceptor sewers, wastewater pumping stations and wastewater treatment facilities. The northern system will comprise primary, secondary and tertiary drains with outfalls to Bo Ha Canal and Da Rang River. A small part of the urban area to the west of the National Railway will discharge to paddy fields. Interceptor chambers will be constructed on the combined drains close to their outfalls to divert wastewater into a system of interceptor sewers, pump stations and pressure mains which will convey wastewater to a 12,500m3/day capacity wastewater treatment facility in ward 2, about 3km west of the City center. The wastewater treatment facility will consist of wastewater stabilization ponds (WSPs), which will produce effluent meeting Vietnamese wastewater discharge standards. Treated effluent will be discharged to Bo River, a tributary of Da Rang River. The location of the WSPs is compatible with the Master Plan. It will be located in a rice field, adjacent to an existing power transmission line, and will require about 25ha of land, plus buffer zone. The Master Plan will need to define the required size of the buffer zone and appropriate land use within the buffer zone. The southern system will consist of primary, secondary and tertiary drains with outfalls to Phu Lam’s central canal and lakes which drain to Da Rang River. Stormwater drains from a small area to the south of Phu Lam will discharge to rice fields. A wastewater interceptor system, comprising sewers, pumping stations and pressure mains, will divert wastewater to a 3,500m3/day capacity waste stabilization pond system located inside the existing dyke, about 2km south west of the center of Phu Lam ward. About 9ha of land plus buffer zone will be required for the wastewater treatment facility. Treated effluent will be discharged to Da Rang River. 6. Description of Proposed Tuy Hoa Subproject The proposed Tuy Hoa Subproject represents Stage 1 of the City’s drainage and wastewater development plan. It will develop stormwater drainage for all ten wards, and wastewater interceptor and wastewater treatment systems for the nine northern wards only. It consists of the following works:
a. 43km of primary and secondary drains, D600-2000 and 24km of tertiary drains in ten urban wards;
b. 8km of wastewater interceptors D400-800, 4 wastewater pumping stations and
4km of DN150-350 pressure mains in the nine northern wards;
c. 8,000m3/day waste stabilization pond (WSP) system in ward 2, serving the nine northern urban wards. Adequate land will be acquired in Stage 1 to enable the WSP system to be upgraded to 12,500m3/day capacity in future.

TA 4485-VIE: Central Region Small and Medium Towns Development Project FINAL REPORT Appendix 7, page 6
June 2006
7. Proposals for Stage 2 – Future Project (2020) Stage 2 of the City’s drainage and wastewater development plan will be implemented through a future project. It will expand the stormwater systems in all ten urban wards, expand the wastewater collection system in the nine northern urban wards; expand the capacity of the Stage 1 WSP; and develop the wastewater collection and treatment system in Phu Lam ward. Stage 2 includes the following works:
a. 53km of primary and secondary drains D600-2000 and complementary tertiary drains in all ten urban wards;
b. Improvements to the 9ha regulating lake on Bo Ha canal; c. Construction of a 2x5m3/s stormwater pumping station at the downstream end of
Bo Ha canal; d. 11km of wastewater interceptors D400-800, an additional 7 wastewater pumping
stations, augmentation of 4 Stage 1 pumping stations, and 5km of DN150-350 pressure mains;
e. 4,500m3/day capacity expansion of the WSP system in ward 2; f. 3,500m3/day capacity WSP system for Phu Lam ward.
II. SONG CAU SMALL TOWN SUBPROJECT A. Town Profile
Song Cau is a Class V small town in Phu Yen Province. It is located on Highway 1A, about 55km north of Tuy Hoa City. The town is expected to become a Class IV provincial town in the near future. The town’s economy is based on commerce, fishing and tourism. The town lies on a narrow coastal plain which is crossed by three main rivers, the Thi Thac, Luc Khau and Tam Giang. The town’s 2004 population was 18,470. Most people live in the coastal strip, close to the old National Highway.
B. Proposed Song Cau Subproject
The proposed Song Cau Subproject consists of two main subcomponents, namely: (i) Drainage and Wastewater Management, and; (ii) Solid Waste Management.
C. Management of Urban Services
The Phu Yen Provincial Water Supply and Drainage Company are responsible for managing water supply, drainage and wastewater in Song Cau small town. A solid waste management unit, attached to the Song Cau Town Peoples’ Committee (TPC), is responsible for managing solid waste services in the town.
D. Existing Drainage and Solid Waste Management
1. Drainage
The existing drainage network in Song Cau comprises about 4km of B600x600 drains along the main road. Flooding occurs in several areas of the town during the wet season. This flooding is caused by several factors; including flooding from the Tam

TA 4485-VIE: Central Region Small and Medium Towns Development Project FINAL REPORT Appendix 7, page 7
June 2006
Giang River, low ground levels in the western part of the town, and lack of drains near the fishing port area. 2. Solid Waste Management The solid waste unit collects about 5t/day of solid waste from the town, which represents about 38% coverage. The unit employs some seven workers including waste pickers. The unit has a relatively new 2.5t compactor truck. Collected solid waste is transported to Xuan Lam landfill, where the waste is segregated, burnt and partly buried.
E. Proposed Drainage Subcomponent
1. Scope and Service Area
The proposed drainage subcomponent in Song Cau will develop small-scale drainage works to relieve flooding in several areas of the town and support the town’s economic development. The drainage subcomponent in Song Cau will include about 11km of new drains and culverts, D600-2000. The drains will be constructed in existing roads and in roads to be constructed prior to 2010, mainly in the most densely populated urban area between the new National Highway bypass and the sea. 2. Proposed Solid Waste Management Subcomponent
The existing waste collection and transport systems will be expanded and re-equipped to provide 80% collection coverage by 2015, and a sanitary landfill will be developed for waste disposal. Table A7-4 shows the solid waste forecasts for Song Cau, based on expected waste generation rates and the subproject’s collection coverage targets in 2015 and 2020.
Table A7-4. Forecast Solid Waste Quantities
Waste Solid Waste Generated Municipal Waste Year Forecast Gen/capita Municipal Industry Total Coverage Collected
Population Kg/day t/day t/day t/day % t/day 2015 32,300 0.75 24.2 2.4 26.6 80 19.4 2020 39,900 0.80 31.9 3.2 35.1 90 28.7
The proposed landfill will be located near Binh Thanh Nam Hamlet, Xuan Binh Commune, 9km from the town center. This area is hilly, with few trees. The province has agreed to upgrade 5km of existing dirt roads and to construct 2km of new road leading to the landfill site prior to implementation of the Song Cau Subproject. This road will provide improved access to communes in the area, facilitating their socioeconomic development. The landfill site (20ha) has adequate capacity for more than 20 years operation. The proposed solid waste management subcomponent will include the following:
a. A sanitary landfill with leachate collection and treatment, and separate ponds for septic tank sludge disposal. The initial landfill development will include two clay-lined municipal waste cells Waste will be placed in designated areas, buried and covered with soil.

TA 4485-VIE: Central Region Small and Medium Towns Development Project FINAL REPORT Appendix 7, page 8
June 2006
b. Landfill infrastructure including administration building, water supply, electricity supply, internal roads, stormwater diversion drains, silt ponds, fencing, garage/workshop, toilet and washing facilities for staff and waste pickers.
c. Equipment for solid waste collection and transport, including three compactor trucks of 4m3 capacity, 14 handcarts (800L and 400L), and 57 storage bins (660L and 220L).
An area of land will be set aside at the landfill site to allow future development of composting and recycling facilities, although these facilities will not be constructed under the proposed subproject.
KHANH HOA PROVINCE
The proposed candidate towns in Khanh Hoa Province are Cam Ranh, Ninh Hoa, Van Gia and Tu Bong. A Solid Waste Management subcomponent is included in the proposed subprojects in Cam Ranh, Ninh Hoa and Van Gia while Water Supply Development and Expansion is proposed in Ninh Hoa and Van Gia, and Drainage and Wastewater Management in Cam Ranh. The proposed subproject in Tu Bong involves a Water Supply Development subcomponent.
I. CAM RANH TOWN SUBPROJECT A. Town Profile
Cam Ranh Town is a Class IV provincial town of Khanh Hoa Province. It lies on National Highway 1A, about 35 km south of Nha Trang City and 379km from Ho Chi Minh City. The main part of the town lies on a narrow coastal plain to the west of Cam Ranh Bay. The town’s 2004 population was 215,822, including 90,897 in nine urban wards and 124,925 in 18 suburban communes. The urban wards lie along either side of the Highway and occupy an area of 5,669ha.
B. Management of Urban Services
The Urban Public Works Joint-Stock Company, operating under the Town People’s Committee, is responsible for management of drainage, wastewater and solid waste collection, transport and disposal in Cam Ranh Town, covering seven (out of nine) urban wards and Cam Tanh Bac commune. Ward cooperatives are responsible for solid waste collection and transport from the densely populated Ba Ngoi and Cam Loi wards.
C. Proposed Cam Ranh Subproject
The proposed Cam Ranh Subproject consists of two major subcomponents, namely: (i) Drainage and Wastewater Management, and; (ii) Solid Waste Management.

TA 4485-VIE: Central Region Small and Medium Towns Development Project FINAL REPORT Appendix 7, page 9
June 2006
D. Existing Drainage, Wastewater and Solid Waste Management
1. Existing Drainage and Wastewater System Existing drainage in Cam Ranh’s urban wards includes an old wastewater system in Ba Ngoi and combined drainage system along the main roads in the urban wards. The system includes the following elements:
a. Gravity fibrocement pipe; D100-300- 5,000m length (old system);
b. Drainage: Concrete pipe; D1000-4,000m; D800-1,000m;
c. Box culvert 1600x2000-1,000m;
d. Natural open channel-total 8,500m.
Annual flooding occurs in the wet season over 7-20% of four urban wards, namely Ba Ngoi, Cam Phu, Cam Phuc Bac and Cam Nghia, affecting an estimated 126 households. Each year there are about 25 flooding days, with flood duration of about 2-3 hours and flood depth of 0.2-0.6m. 2. Existing Solid Waste System About 47 tons/day of solid waste is collected in Cam Ranh town (70% coverage). Equipment includes two trucks of 5t capacity and one truck of 2.5t capacity. The Urban Public Works Company has about 93 solid waste workers. The existing disposal area (3ha) is a simple dump site where the solid waste is segregated by waste pickers; the residue is burnt and partly buried. The dump site is located near Doc San cemetery in Cam Thinh Dong Commune, 7km from the town center.
E. Proposed Drainage and Wastewater Subcomponent
The Drainage and Wastewater Management Subcomponent includes: (i) stormwater drainage system; (ii) wastewater collection system; (iii) wastewater treatment. The subproject will develop the first stage of a complete, integrated stormwater drainage, wastewater collection and wastewater treatment system for the core urban area. It will expand, upgrade and improve the combined stormwater and wastewater systems in the central urban wards in order to: (i) rapidly convey stormwater to the nearest rivers or streams; (ii) reduce flooding and ponding, and; (iii) ensure that wastewater is removed from core urban areas and treated to appropriate standards prior to discharge to the environment. It will also develop wastewater interceptors, pumping stations, trunk sewers and centralized wastewater treatment systems. 1. Service Area and Drainage Coverage The drainage and wastewater management subcomponent will focus on the seven central urban wards where population densities are highest. Population of the seven central urban wards in 2005 was 63,700 covering an area of 2,783ha. The remaining two urban wards in the north of the urban area have low population densities, and population concentrates mainly along two sides of Highway 1A. Although these two urban wards are not included in the proposed Cam Ranh Subproject, the drainage and wastewater system will be designed so that they may be added in future.

TA 4485-VIE: Central Region Small and Medium Towns Development Project FINAL REPORT Appendix 7, page 10
June 2006
The town’s Master Plan proposes to develop the urban area, reclaim the foreshore of Cam Ranh Bay and develop an extensive network of new roads by 2020, but it is likely to be many years before this construction is realized. The drainage and wastewater coverage that can be achieved by 2010 will be limited by the extent of Master Plan development at that time. The proposed subcomponent will construct drains in existing roads, in roads that are likely to be constructed by 2010, and along existing drain alignments. Drainage coverage for the nine urban wards is expected reach only 40% by 2015 and 55% by 2020. Based on actual conditions in Cam Ranh, wastewater flows are low or non-existent in many drains throughout the town in the dry season. The reasons are: (i) the sandy soils which absorb most of eth wastewater; (ii) low coverage of drains, and; (iii) householders’ common practice of disposing of sullage water in their gardens or yards. As a result, the subproject’s wastewater flows are likely to be around only 50% of water consumption. 2. Wastewater Flows
Table A7-5 shows the forecast wastewater flows for Cam Ranh’s urban wards, based on the subproject’s design criteria and development targets. Wastewater treatment facilities with 5,000m3/day capacity will be required by 2020.
Table A7-5. Forecast Wastewater Flows Urban Water Drainage WW Flow Total
Year Population Consumption Coverage % of WS WW Flow All 9 Wards Lpcd % m3/day
2015 105,900 120 40 40 2,3002020 115,800 135 55 50 4,950
Note: The total wastewater flow is based on average dry weather flow and includes 20% for industrial wastewater and other non-domestic wastewater flows.
3. Options Three following options were evaluated for Cam Ranh’s drainage and wastewater systems:
Option 1: Separate Drainage and Wastewater Systems This option involves separate stormwater drainage and wastewater systems with two wastewater treatment facilities. It includes:
1. Stormwater drainage system with 23.0km of D600-B1600 x 2000 drains and seven outfalls to Cam Ranh Bay.
2. Wastewater collection system with 24.8km of gravity sewers and pressure pipes, three pumping stations and two wastewater treatment facilities (WWTP).
One wastewater treatment facility with the capacity of 4,000 m3/day would be located near Ba Ngoi port. The second plant is an existing facility with 1,000m3/day capacity, located in the west of Ba Ngoi ward; it would discharge effluent into a shallow bay in the west of Ba Ngoi. The plant’s location in a populated urban area and its discharge point to a shallow bay with poor circulation are likely to have significant adverse environmental impacts. The original plant was built in 1965 but has not been used since 1975, and needs to be repaired and improved. Method of treatment for the 4,000 m3/day facility is by simple wastewater stabilization ponds, and for the 1,000 m3/day facility is by the

TA 4485-VIE: Central Region Small and Medium Towns Development Project FINAL REPORT Appendix 7, page 11
June 2006
existing or new mechanical wastewater treatment plant which requires the use of electricity and chemicals.
Option 2: Combined Drainage System with Interceptor Sewers. This option comprises a combined system with interceptor sewers and two wastewater treatment facilities. Interceptor chambers would be constructed on the combined drains close to their outfalls to divert wastewater to a system of interceptor sewers, pumping stations and gravity trunk sewers which will convey wastewater to the wastewater treatment facilities. This system includes 36.0km of pipes and drains, and 4 pumping stations with the capacity of 500m3/day to 3000 m3/day. This option also has two WWTPs as for Option 1. Option 3: Combined Drainage System with Interceptor Sewers (one WWTP) This option is similar to Option 2, but has only one wastewater treatment facility of 5,000m3/day capacity near Ba Ngoi port. All wastewater would be diverted through a series of interceptor sewers, lift pumping stations and pressure mains to the new WWTP site. Compared to Options 1 and 2, this option has lower capital, operation and maintenance costs for the wastewater treatment facility and a more favorable discharge point to Cam Ranh Bay. i.e. the outfall will discharge treated effluent into >4m depth of water, with adequate current velocities to assist in dispersing the treated effluent. Table A7-6 compares the capital costs of the three options (including tax).
Table A7-6. General Capital Cost Estimate in US$ millions
Option Option 1 Option 2 Option 3 Separate stormwater drainage system 8.45 Separate wastewater system 1.78 Combined drainage system 5.88 5.88 Wastewater interceptors & pressure mains 1.44 1.44 Pumping stations 0.12 0.16 0.16 Wastewater treatment plant 1.55 1.55 1.38 Tertiary drains 0.95 0.88 0.88 Total $12.85m $9.91m $9.74m
4. Recommendation Option 3 is recommended because it is least cost, more sustainable and more flexible for staged development. 5. Drainage and Wastewater Subcomponent Description The subcomponent includes:
1. 16km of B600x600-B2000x2000 box culverts;
2. 12km of primary and secondary drains D400-1000, and 22km of tertiary drains;
3. 5km of D500-1000 interceptor sewers;
4. 6 wastewater pumping stations and 3km of DN100-300 pressure mains;
5. A 5,000m3/day wastewater treatment facility on reclaimed land near Ba Ngoi port.
The wastewater treatment facility’s location is in accord with the new urban Master Plan. Wastewater stabilization ponds (anaerobic, facultative and maturation ponds) are the recommended forms of wastewater treatment. Treated effluent will be discharged

TA 4485-VIE: Central Region Small and Medium Towns Development Project FINAL REPORT Appendix 7, page 12
June 2006
through a short outfall into at least 4m of water in Cam Ranh Bay. About 10ha of land plus buffer zone will be required for the ponds and associated works. The Master Plan will need to define the required size of the buffer zone and appropriate land use within the buffer zone.
F. Proposed Solid Waste Management Subcomponent
1. Scope and Service Area The solid waste management subcomponent will develop a complete solid waste system for Cam Ranh, covering waste collection, transport and disposal. It will procure solid waste equipment, develop a new sanitary landfill and close the existing dump. The service area for solid waste collection includes all nine urban wards with 105,900 population in the design year 2015. The subcomponent aims to increase collection coverage to 80% by 2015. In accordance with the Master Plan, the new landfill will be in Cam Thinh Dong Commune, 9km from the town center. Table A7-7 shows the solid waste forecasts for Cam Ranh urban area, based on expected waste generation rates and the subproject’s collection coverage targets in 2015 and 2020.
Table A7-7. Forecast Solid Waste Quantities
Forecast Waste Solid Waste Generated Municipal Waste Year Population Gen/capita Municipal Industry Total Coverage Collected
(9 wards) kg/day t/day t/day t/day % t/day 2015 105,900 0.75 79.4 11.9 91.3 80 63.5 2020 115,800 0.80 92.6 13.9 106.5 90 83.4
The proposed solid waste management subcomponent will include the following:
1. A sanitary landfill with leachate collection and treatment, and separate ponds for
septic tank sludge disposal. About 35 ha of land are available at the landfill site, which is sufficient for at least 20 years solid waste disposal from Cam Ranh urban area. The initial landfill development will include two clay-lined municipal cells. Waste will be placed in designated areas, buried and covered with soil.
2. Equipment for solid waste collection and transport, including 4 compactor trucks of 8m3 capacity, 44 handcarts (800L and 400L), and 182 storage bins (660L and 220L).
3. Equipment for the sanitary landfill, including: (i) weighbridge for weighing solid waste; (ii) bulldozer or loader for compacting, leveling and covering the waste with soil; (iii) tip truck for transporting soil cover; (iv) truck for transporting medical waste.
4. Landfill infrastructure including administration building, water supply, electricity supply, internal roads, stormwater diversion drains, silt ponds, fencing, garage/workshop, toilet and washing facilities for staff and waste pickers.
An area of land will be set aside at the landfill site to allow future development of composting and recycling facilities, although these facilities will not be constructed under the proposed subproject. Khanh Hoa province will have an incinerator for treating medical waste from selected hospitals in the province.

TA 4485-VIE: Central Region Small and Medium Towns Development Project FINAL REPORT Appendix 7, page 13
June 2006
II. NINH HOA SMALL TOWN SUBPROJECT A. Town Profile
Ninh Hoa small town is a class V small town, at the center of Ninh Hoa district, 35 km north of Nha Trang City. It is located at the T-junction of National Highway 1A and Highway 26 to Buon Ma Thuot, Dak Lak province. According to the 2004 Master Plan adjustment, two new residential areas, Ninh Thuy and Ninh Phuoc, will be added to Ninh Hoa small town in the near future. The town’s population (2004) is 117,033.
B. Proposed Ninh Hoa Subproject
The Ninh Hoa Subproject includes two main subcomponents, namely: (i) Water Supply Development and Expansion, and; (ii) Solid Waste Management. Although the provincial and district governments requested a Drainage and Wastewater Management subcomponent for Ninh Hoa, this was not included because of funding and affordability constraints and concerns over economic efficiency of drainage investments in Class V towns.
C. Management of Urban Services Ninh Hoa Urban Joint-stock Company, operating under the District People’s Committee, is responsible for managing water supply, drainage and solid waste in Ninh Hoa small town.
D. Existing WSS Infrastructure in Ninh Hoa Small Town
1. Existing Water Supply The existing water supply system in Ninh Hoa includes a water treatment plant (WTP) with 2500m3/day design capacity and 7km of DN100-200 distribution network. The raw water source is Dinh River, which is supplied from Da Ban Lake, 20km north of the town. The 20km river section which runs from Da Ban Lake to the WTP (located in the town) crosses some rural and residential areas, so the water is polluted, with high bacterial levels, organic matter and iron content. Although the theoretical capacity of the WTP is 2,500m3/day, actual production is only 1,500m3/day due to following two reasons: 1. Da Ban lake is often closed when it is not being used for irrigation or when irrigation
channels are under repair; 2. The water intake uses shallow collection wells which have limited capacity.
In addition, the WTP is located on a congested site, surrounded by houses, and cannot be easily expanded. A new water source and water treatment plant is needed urgently. 2. Existing Solid Waste Management The district Public Works Company (PWC) collects about 17 t/day of solid waste in Ninh Hoa small town. (85% coverage). The company has two trucks to transport waste (one is 5m3 capacity and the other is 11 m3). The existing disposal area (1ha) is a simple dump

TA 4485-VIE: Central Region Small and Medium Towns Development Project FINAL REPORT Appendix 7, page 14
June 2006
site in Ninh Ich village, Ninh An commune, where the waste is segregated, burnt and partly buried. About 101 employees are engaged in solid waste management, parks, public lights and cemetery services.
E. Proposed Water Supply Subcomponent 1. Scope and Service Area The proposed subproject will develop a new water source, construct a new water treatment plant (WTP), and expand the water supply transmission and distribution network to meet growing demand, which is forecast to reach twice the existing supply capacity by 2015. The proposed service area for the water supply subcomponent includes Ninh Hoa small town and the future town extension areas of Ninh Thuy and Ninh Phuc near the coast, with forecast population of 45,700 in 2015. Table A7-8 summarizes the forecast water demand and the WTP capacity additions required to meet the subproject’s coverage and consumption targets for 2015 and 2020. The proposed Ninh Hoa Subproject will include a new 5,000m3/day capacity WTP to meet the forecast water demand in 2015. Civil works for the intake and raw water system will be designed to meet 2020 demands.
Table A7-8. Water Demand Forecasts Water Water Average Required Added Total
Year Area Population Coverage Consumption Demand Capacity Capacity Capacity % Lpcd m3/day m3/day m3/day m3/day
2015 Ninh Hoa town 27,200 80 100 3,300 4,000 5,000 5,000
2015 Ninh Thuy/Ninh Phuoc 18,500 60 100 1,830 2,200
2020 Ninh Hoa town 30,000 90 120 4,950 5,900 5,000 10,000
2020 Ninh Thuy/Ninh Phuoc 20,400 90 120 3,530 4,200
Note: Existing 2,500m3/day capacity WTP to be closed. 2. Subproject Description A new 5,000m3/day capacity raw water pumping station will be constructed at Da Ban Lake. It will use submersible pumps inside Da Ban Lake, at the existing irrigation intake structure. A D300 transmission pipeline about 8km long will convey raw water from raw water pumping station to the WTP. A new 5,000m3/day WTP will be constructed at Hon Hau Hill near Lac Hoa village, Ninh An commune, Ninh Hoa district. The WTP requires about 2ha of land, and an additional 1ha is needed for the 500m access road. Two options for source and water treatment plant will be studied at the Feasibility Stage: (i) low pressure pump at Da Ban Lake, WTP located at low level, with a treated water pumping station supplying water to the distribution network, and; (ii) a high pressure pump at Dan Ban Lake, high level WTP and gravity supply to the distribution network. The water treatment plant units will include: (i) Sedimentation tank; (ii) Filters; (iii) Reservoir. The plant will use coagulants such as alum and lime, and chlorine gas for disinfection. Treated water will be supplied from the WTP to Ninh Hoa small town and the two new development areas Ninh Thuy, Ninh Phuoc. Total length of transmission and distribution pipeline is: 45 km of DN75-300, including 24km for Ninh Hoa small town and 20km for Ninh Thuy and Ninh Phuoc (7.9km DN150; 12.8 km DN100).

TA 4485-VIE: Central Region Small and Medium Towns Development Project FINAL REPORT Appendix 7, page 15
June 2006
F. Proposed Solid Waste Management Subcomponent The existing waste collection and transport systems will be expanded and re-equipped to provide 85% collection coverage by 2015, and a sanitary landfill will be developed for waste disposal. The service area for solid waste collection includes the existing Ninh Hoa town area, with 27,200 population in the design year 2015. Table A7-9 shows the solid waste forecasts for Ninh Hoa, based on expected waste generation rates and the subproject’s collection coverage targets in 2015 and 2020.
Table A7-9. Forecast Solid Waste Quantities
Waste Solid Waste Generated Municipal Waste Year Forecast Gen/capita Municipal Industry Total Coverage Collected
Population kg/day t/day t/day t/day % t/day 2015 27,200 0.75 20.4 2.0 22.4 85 17.3 2020 30,000 0.80 24.0 2.4 26.4 90 21.6
The Khanh Hoa PPC proposes to develop a regional sanitary landfill serving Ninh Hoa and Van Gia small towns. The proposed landfill site is in Dong Ba Cheo area, Van Hung commune, Van Ninh district, 17km from Ninh Hoa small town and 11km from Van Gia small town. The area of the landfill is 25ha which is sufficient for 20 years solid waste disposal from the two towns. The subproject will procure collection and transport equipment for Ninh Hoa small town, including five 4m3 capacity trucks, 14 handcarts (400L and 800L) and 51 storage bins (660L and 220L).
III. VAN GIA SMALL TOWN SUBPROJECT A. Town Profile
Van Gia is a district town of Van Ninh District, Khanh Hoa Province. Its location is 30 km north of Ninh Hoa and 65km north of Nha Trang along National Road 1A. The town’s urban area has developed mainly along National Road 1A and between National Road 1A and the sea. The town’s population (2004) is 77,359.
B. Van Gia Subproject
The Van Gia Subproject includes two main subcomponents, namely: (i) Water Supply Development and Expansion, and; (ii) Solid Waste Management. Although the provincial and district governments requested a Drainage and Wastewater Management subcomponent for Van Gia, this was not included because of funding and affordability constraints and concerns over economic efficiency of drainage investments in Class V towns.
C. Management of Urban Services
The Van Ninh Urban Joint-stock Company, operating under the District People’s Committee, is responsible for managing water supply, drainage and solid waste in Van Gia small town, Tu Bong small town and the surrounding district.

TA 4485-VIE: Central Region Small and Medium Towns Development Project FINAL REPORT Appendix 7, page 16
June 2006
D. Existing WSS Infrastructure in Van Gia 1. Existing Water Supply The existing water source for Van Gia town is the Ro River, near Hon Dua Mountain in Van Phu Commune. The existing 2,500m3/day capacity water treatment plant, located at Khe Hoc Chim, comprises:
1. three sedimentation units: 4 x 25 x 3 = 900 m3. Sedimentation time: 6 hours 40 minutes;
2. six slow sand filter units, with surface area of: 10 x 3 x 6 = 180 m2, and filtration speed: 0.57m/hour;
3. one reservoir with capacity: 12 x 10 x 2.5 = 300 m3, representing 12.5% of domestic daily water demand (3 hours storage);
4. a DN250 gravity pipeline, about 8km long, supplies water from the water treatment plant to the town;
5. distribution network, comprising about 17.6km of DN80 to DN200 pipeline, including 2.5km of DN150 pipeline serving Van Thang Commune.
2. Existing Solid Waste System The PWC collects about 20t/day of solid waste, including 15 t/day from Van Gia (90% coverage) and 5t/day from part of Tu Bong (40% coverage). The company has four trucks, one truck of 5t capacity and three of 2.5t capacity. Waste is transported to the 0.8ha disposal site in Doc Ke area, about 8km from the town center. The existing disposal area (1ha) is a simple dump site, where the waste is segregated, burnt and partly buried.
E. Proposed Water Supply Subcomponent 1. Service Area and Demand Forecast Van Ninh district has two district towns, Van Gia and Tu Bong, located to the north of Van Gia near the Van Phong Economic Zone. The construction plan of Van Ninh District aims to modernize Tu Bong and Dam Mon areas of Van Ninh district, separately from Van Gia Town. Therefore, Van Gia’s water supply system will focus on supplying Van Gia town with a population of 25,700 in 2015, and a small commune to the south. Table A7-10 summarizes the forecast water demand in 2015 and 2020, based on the Project’s coverage and consumption targets:
Table A7-10. Water Demand Forecasts
Water Water Average Required Added TotalYear Population Coverage Consumption Demand Capacity Capacity Capacity
% Lpcd m3/day m3/day m3/day m3/day2015 25,700 80 100 3,230 3,900 0 4,000 2020 28,400 90 120 4,910 5,900 4,000 8,000
Note: The nominal capacity of the existing water treatment plant is 2,500m3/day. In fact it can be operated at 4,000m3/day capacity and will meet forecast water demand until 2015.

TA 4485-VIE: Central Region Small and Medium Towns Development Project FINAL REPORT Appendix 7, page 17
June 2006
2. Assessment of Existing System The existing water treatment plant in Van Gia has a nominal capacity of 2,500m3/day, but in fact it can be operated at a higher throughput of 4,000 m3/day (166 m3/hour) and can meet the water demand for the 2015 period. At 4,000m3/day capacity, the sedimentation time reduces to 5 hours 25 minutes and filtration speed becomes 0.92 m/hour, which are within the design standards. Considering the high water quality of Ro River, it is expected that the slow speed filters can meet the water quality standard until at least 2015. The DN250 transmission pipeline from Ro River to the town has 5,000m3/day transmission capacity. Therefore the existing water treatment plant and transmission main can also serve for many years. The distribution network in Van Gia is extensive and is in good condition. The PPC of Khanh Hoa is considering the construction of Dong Dien Nam Dam and Reservoir in the future. When constructed, this reservoir will submerge the existing water treatment plant, so a new WTP will need to be constructed in future. 3. Water Supply Subcomponent Description Based on the above assessment, it is considered that there is no need to expand or improve the water treatment plant, transmission main or the distribution network within the town. The proposed water supply subcomponent in Van Gia would expand the water supply system to supply Van Hung Commune to the south, by constructing: 1. a 2km long pipeline; 1.0km of DN150 and 1.0km of DN100); and 2. a booster pumping station near Van Phu Post Office (total area 0.5ha), including: (i)
a 1,000 m3 capacity reservoir; (ii) pumping station with 2 pumps x 200 m3/hour capacity; (iii) 180kVA transformer, and; (iv) one building for management and laboratory.
F. Proposed Solid Waste Management Subcomponent
The existing waste collection and transport systems will be expanded and re-equipped to maintain 90% collection coverage in 2015, and a sanitary landfill will be developed for waste disposal. The service area for solid waste collection includes the existing Van Gia town area, with 28,400 population in the design year 2015. Table A7-11 shows the solid waste forecasts for Van Gia, based on expected waste generation rates and the subproject’s collection coverage targets in 2015 and 2020.
Table A7-11. Forecast Solid Waste Quantities
Waste Solid Waste Generated Municipal Waste Year Forecast Gen/capita Municipal Industry Total Coverage Collected
Population kg/day t/day t/day t/day % t/day 2015 25,700 0.75 19.3 1.9 21.2 90 17.3 2020 28,400 0.80 22.7 2.3 25.0 90 20.4
The Khanh Hoa PPC proposes to develop a regional sanitary landfill serving Ninh Hoa and Van Gia small towns. The proposed landfill will be developed in Dong Ba Cheo area, Van Hung commune. The regional landfill site is about 17km from Ninh Hoa small town and 11km from Van Gia small town. The area of the landfill is 25ha which is adequate for 20 years of solid waste disposal from the two towns.

TA 4485-VIE: Central Region Small and Medium Towns Development Project FINAL REPORT Appendix 7, page 18
June 2006
The proposed solid waste management subcomponent will include the following:
1. A sanitary landfill with leachate collection and treatment, and separate ponds for septic tank sludge disposal. The initial landfill development will include two clay-lined municipal cells. Waste will be placed in designated areas, buried and covered with soil.
2. Equipment for solid waste collection and transport, namely four 4m3 capacity compactor trucks, 15 handcarts (800L and 400L), and 51 storage bins (660L and 220L).
3. Equipment for the sanitary landfill, includes: a weighbridge for weighing solid waste; a bulldozer or loader for compacting, leveling and covering the waste with soil, and a 5t truck for transporting soil cover
4. Landfill infrastructure including administration building, water supply, electricity supply, internal roads, stormwater diversion drains, silt ponds, fencing, garage/workshop, toilet and washing facilities for staff and waste pickers.
IV. TU BONG SMALL TOWN SUBPROJECT A. Town Profile
Tu Bong small town was established in 2005 by merging three communes of Van Khanh, Van Long and Van Phuoc. The town is located in Van Ninh District, Khanh Hoa province, about 21km north of Van Gia and 86km north of Nha Trang City. The small town has an approved Master Plan, but its implementation has not yet begun. The town’s population (2004) is 52,046.
B. Proposed Tu Bong Subproject The proposed Tu Bong Subproject includes one main subcomponent, namely: Water Supply Development. Currently there is no water supply or drainage network in Tu Bong.
C. Management of Urban Services The Van Ninh Urban Joint-stock Company, operating under the District People’s Committee, is responsible for managing water supply, drainage and solid waste in Van Gia small town, Tu Bong small town and the surrounding district.
D. Proposed Water Supply Subcomponent 1. Scope and Service Area The proposed Tu Bong Subproject will develop a complete new water supply system for Tu Bong small town, including water intake, water treatment plant, transmission, and distribution network. Table A7-12 summarizes the forecast water demand and the WTP capacity additions required to meet the subproject’s coverage and consumption targets for 2015 and 2020. The proposed Tu Bong Subproject will include a new 5,000m3/day capacity WTP to meet the forecast water demand in 2015. Civil works for the intake and raw water system will be designed to meet 2020 demands.

TA 4485-VIE: Central Region Small and Medium Towns Development Project FINAL REPORT Appendix 7, page 19
June 2006
Table A7-12. Water Demand Forecasts
Water Water Average Required New WTP Total
Year Area Population Coverage Consumption Demand Capacity Capacity Capacity % lpcd m3/day m3/day m3/day m3/day
2015 Tu Bong town 22,200 80 100 2,810 3,400 5,000 5,000 2020 Tu Bong town 24,500 90 120 4,190 5,000 0 5,000
2. Water Supply Subcomponent Description Khanh Hoa PPC plans to construct Hoa Son Dam and Reservoir in the period 2006-2008 to serve Tu Bong town, Van Phong Economic Zone and adjacent areas. The dam will be funded by the Ministry of Agriculture and Rural Development (143 billion VND) and will have 30million m3 storage capacity. The dam site is 2km north of Tu Bong small town. The proposed Tu Bong water supply subcomponent will include: 1. Raw water intake in Hoa Son Dam, and 1.3km long DN400 gravity transmission
main between the dam and water treatment plant site; 2. 5,000m3/day capacity water treatment plant at 10m elevation, about 800m
downstream of the right dam abutment (viewed downstream). Site area: 0.7ha; 3. Distribution network: 25.8km of DN80-250.
NINH THUAN PROVINCE SUBPROJECT
There are five candidate towns in the participating province of Ninh Thuan: Thap Cham, Khan Hai, Tan Son, Phuoc Dan and Ca Na. Drainage and Wastewater Management is proposed for Thap Cham, Khan Hai and Phuoc Dan towns while Water Supply Development and Expansion is proposed for Ca Na and Tan Son.
I. THAP CHAM TOWN SUBPROJECT A. Town Profile
Phan-Rang -Thap Cham is a Class III city and capital of Ninh Thuan province. It is located on Highway 1A, about 334km from Ho Chi Minh City and 120km south of Nha Trang City. Thap Cham comprises three urban wards of Phan Rang-Thap Cham town, namely Do Vinh, Bao An and Phuoc My wards, which occupy an area of about 3,964ha on the north side of the Dinh River. This area includes Thanh Son airport and Do Van Mountain, and the actual urban area is only 1,130ha. (including 360ha which has been developed since the preparation of the original Master Plan). Thap Cham is located about 3-6km northwest of the town center, on the western side of National Highway 1A.
The town’s 2004 population was 160,781. Its population density is about 33person/ha, excluding the airport and mountainous area.
B. Proposed Thap Cham Subproject The Thap Cham Subproject has one major subcomponent, namely Drainage and Wastewater Management.

TA 4485-VIE: Central Region Small and Medium Towns Development Project FINAL REPORT Appendix 7, page 20
June 2006
C. Management of Urban Services The Phan Rang-Thap Cham City URENCO is responsible for managing drainage and wastewater in the city.
D. Existing Drainage and Wastewater System Phan Rang – Thap Cham City has a combined drainage system, with about 19.5km of drains, mostly discharging through outfalls to the Dinh River. The majority of drains are located in Phan Rang, and there are only a few drains in Thap Cham, near the railway station. A Finland-funded drainage and wastewater project (including wastewater treatment) is planned for Phan Rang town; it will cover the urban wards between National Highway 1A and the sea, but does not consider stormwater runoff or wastewater flows from Thap Cham area.
The PPC has developed a 10km long dyke along the north bank of Dinh River to prevent flooding of the urban areas by the Dinh River. The dyke commences from Dao Long Bridge I (adjacent to Thap Cham) and runs to the second bridge, well downstream of Thap Cham, which is partly protected by the dyke, but it does not provide complete protection to Bao An and Phuoc My wards. The dyke crest has been constructed to +6.2m elevation. Thap Cham’s topography slopes from north to south (towards the Dinh River) and from west to east towards Highway 1A. Currently, stormwater and wastewater from Thap Cham area is diverted though a series of open canals and culverts to Phan Rang area on the eastern side of National Highway 1A, then to regulating basins and finally to the sea or Dinh River. The Dinh River water level is affected by floods from the upstream catchments and by tides; the river level varies from a maximum of: + 6.05 m to a minimum of +2.05 m. The ground elevation in Phan Rang is +3.5. to + 5.74, while Thap Cham ground level is generally higher at +5.0 to +6.0m. Two lakes have been constructed in Phan Rang area, to act as flood regulating basins when the Dinh River level is higher than the town. These are: the 10ha Central Basin which connects to the Dinh River by Cha La Canal, and; the 1ha Park Basin which also serves as a recreational lake. A stormwater pumping station is proposed to pump stormwater from Cha La Canal the Dinh River during periods when the Dinh River is in flood. 1. Flooding in Thap Cham According to information from the PPU and local consultants, Thap Cham experiences severe flooding in the rainy season. About 32% of the urban area is flooded 40-60 times each year to 0.5-0.8m depth, for periods of 18-36hours. About 16,770 people (3,300 households) are affected by the flooding which causes damage to houses, property, crops, loss of access to schools and public services, damage to roads, disruption to traffic and adverse health impacts. The causes of flooding include lack of drainage in all three wards, low ground elevation (Do Vinh ward), and river flooding in Bao An and Phuoc My wards which are only partly protected by the dyke.

TA 4485-VIE: Central Region Small and Medium Towns Development Project FINAL REPORT Appendix 7, page 21
June 2006
2. Drainage Master Plan The Y2005 adjusted Master Plan for Phan Rang-Thap Cham area, proposes the development of independent drainage and wastewater systems for Phan Rang to the east of Highway 1A and for Thap Cham to the west of the highway. Development of the drainage and wastewater system in Phan Rang has been allocated for funding by Finland, while the drainage and wastewater system for Thap Cham is a candidate for the CSMT Project. The Master Plan proposes to develop a new regulating basin in Thap Cham, in the north of Phuoc My ward, in order to reduce the loading on the existing two regulating basins and provide a scenic lake within Thap Cham. The proposed Thap Cham regulating basin would be 2.5-3.0m deep, and would occupy about 9ha of land, encompassed by: North: Phan Dang Luu St.; South: Hoang Van Thu St.; West: Dong Dau St.; East: Pinang Tac St. The regulating basin will be constructed by the province and does not form part of the CSMT Project.
E. Proposed Drainage and Wastewater Management Subcomponent 1. Scope and Service Area This subcomponent includes: (i) stormwater drainage system; (ii) wastewater collection system, and; (iii) wastewater treatment. The subproject’s service area for drainage and wastewater management includes the three urban wards of Thap Cham, with forecast Y2015 population of 52,200. 2. Wastewater Flows Table A7-13 shows the forecast wastewater flows for Thap Cham, based on the subproject’s design criteria and development targets. A 5,000m3/day wastewater treatment facility is proposed for Thap Cham by 2020.
Table A7-13. Forecast Wastewater Flows Thap Cham Water Drainage WW Flow Total WW
Year Population Consumption Coverage % of WS Flow 3 Wards lpcd % m3/day
2015 52,200 120 65 60 2,900 2020 59,600 135 70 70 4,700
Note: Total wastewater flow is based on average dry weather flow and includes 20% for industrial wastewater and other non-domestic wastewater flows.
3. Design Concept and Options for Drainage and Wastewater The Thap Cham Subproject will follow the town’s Master Plan by developing an independent drainage and wastewater system for the Thap Cham area. The proposed regulating lake in Phuoc My ward is a central feature of the stormwater drainage system. The Thap Cham area will have two main drainage catchments. The western catchment, adjacent to the National Railway will cover about 25% of the Thap Cham area and will discharge stormwater to the Dinh River through a D2000 outfall with automatic flap gate. The eastern catchment covers the remaining 75% of the Thap Cham area. Stormwater from this area will drain to the regulating lake in Phuoc My ward. A 0.7km long box culvert, B3000xB3000 will convey stormwater from the regulating lake to the Dinh River though a gated outfall.

TA 4485-VIE: Central Region Small and Medium Towns Development Project FINAL REPORT Appendix 7, page 22
June 2006
The consultants assessed the following two options for drainage and wastewater management in Thap Cham: Option 1 – Separate Stormwater Drainage and Wastewater Systems This option involves separate stormwater drainage and wastewater systems with two wastewater treatment facilities. It includes:
1. Stormwater drainage system with 35 km of drains, 0.7km box culvert between the Phuoc My regulating basin and Dinh River and associated tertiary drains.
2. Separate sewerage system with 37km of gravity sewers and associated sewerage reticulation, 7km of pressure mains and three pumping stations to deliver wastewater to the wastewater treatment facility.
3. 7,000m3/day wastewater treatment facility discharging treated effluent to Dinh River.
Option 2 – Combined Drainage System with Interceptor Sewers This option comprises a combined system with interceptor sewers. It includes:
1. 37km of combined drains and a 0.7km box culvert between the Phuoc My regulating basin and Dinh River;
2. Interceptor sewerage system comprising a system of interceptor chambers, interceptor sewers, three pumping stations and 3km of pressure mains;
3. 7,000m3/day wastewater treatment facility discharging treated effluent to Dinh River.
Table A7-14 compares the capital costs of the two options.
Table A7-14. General Capital Cost Estimate in US$ millions Option Option 1 Option 2
Separate stormwater drainage system 8.41 Separate wastewater system 2.09 Combined drainage system 8.41 Wastewater interceptors and pressure mains 0.35 Pumping stations 0.10 0.10 Wastewater treatment plant 1.54 1.54 Tertiary drains 1.26 1.26 Total $13.40 $11.66
4. Recommendation The combined drainage system with interceptor sewers, Option 2, is recommended because it is least cost, more sustainable and more flexible for staged development. 5. Drainage and Wastewater Subcomponent Description The subcomponent includes: 1. 2 km of box culverts with sizes ranging from B2500xB2500 to B3000xB3000,
including 0.7km culvert between the Phuoc My regulating basin and Dinh River, with gated outfall;
2. 10km of primary and secondary drains, D600-2000 and 14km of tertiary drains;
3. Four outfalls to Dinh River (western catchment) and Phuoc My regulating lake (eastern catchment);

TA 4485-VIE: Central Region Small and Medium Towns Development Project FINAL REPORT Appendix 7, page 23
June 2006
4. 2km of D400 interceptor sewers comprising interceptor chambers on the outfalls to Dinh River and Phuoc My regulating lake. The sewers which will divert wastewater to the wastewater treatment facility using three pumping stations and 1.2km of DN150-350pressure mains;
5. 3,500m3/day waste stabilization pond treatment system discharging treated effluent to Dinh River. The WSP system will be designed for expansion to 5,000m3/day in a future development stage.
The 3,500m3/day capacity wastewater treatment facility will be constructed in Phuoc My ward, adjacent to the dyke along the north bank of Dinh River. The wastewater treatment facility’s location agrees with the new Master Plan. It will consist of wastewater stabilization ponds (anaerobic, facultative and maturation ponds), which will produce effluent meeting Vietnamese wastewater discharge standards. Treated effluent will be discharged through a short outfall with flap gate into Dinh River. About 14ha of land plus buffer zone will be required for the ponds and associated works. The Master Plan will need to define the required size of the buffer zone and appropriate land use within the buffer zone. The waste stabilization pond will be encompassed by August 28th St., Yet Kieu St, Luong The Vinh St and Ly Cong Uan St.
II. KHANH HAI SMALL TOWN SUBPROJECT A. Town Profile
Khanh Hai is a small town of Ninh Hai District, Ninh Thuan Province. It is located on the coast, at the northeast boundary of Phan Rang-Thap-Cham town. Khanh Hai’s administrative boundaries include the East Sea, Tri Thuy River and Phan Rang-Thap Cham town. The small town obtains its water supply from the Phan Rang-Thap Cham water supply system. The town’s 2004 population was 13,738.
B. Proposed Khanh Hai Subproject
The proposed Khanh Hai Subproject includes one main subcomponent, namely Drainage and Wastewater Management.
C. Management of Urban Services
Currently, no entity manages drainage and wastewater in Khanh Hai.
D. Existing Drainage System
The existing drainage system is limited to about 500m of covered B600xB600 concrete drains at the market and in a small residential area. The drains discharge to Tri Thuy River, but are blocked with solid waste and produce foul odors. The market area is poorly drained and unsanitary. Only 60% of households have septic tanks with soak ways; the remainder use pit latrines or discharge wastewater from toilets to roads. Generally, residents dispose of sullage water in yards or on dirt roads. Improper disposal of wastewater and sullage water in Khanh Hao poses a health risk to residents.
According to information from the PPU and local consultants, Khanh Hai experiences severe flooding in the rainy season. About 40% of the town area is flooded 90 times each year to 0.8m depth, for periods of 12 hours. About 5,840 people (1,360 households) are affected by the flooding which causes damage to houses, business

TA 4485-VIE: Central Region Small and Medium Towns Development Project FINAL REPORT Appendix 7, page 24
June 2006
premises, property, crops, loss of access to schools and public services, damage to roads, disruption to traffic and adverse health impacts. The causes of flooding include lack of drainage, low ground elevation and stormwater runoff to depressed areas, river flooding and embankment construction causing stagnant water after heavy rain.
E. Proposed Drainage Component Investments in drainage in the Class V towns, will be limited to small scale works only, because of funding and affordability constraints and concerns regarding economic efficiency. The small-scale drainage works will be designed to relieve flooding in the town center and in areas where flooding is most severe, remove wastewater from the central urban areas, and support economic development of the town. The drainage subcomponent in Khanh Hai will consist of small-scale drainage works in the market area, in existing main roads and in roads that are planned for construction prior to 2010. About 8.7km of drains are proposed including: 1. 8km of covered box culverts B400xB600 to B800xB800;
2. 0.7km of D600 concrete drains;
3. Tertiary drains;
4. Four outfalls to Tri Thuy River. III. TAN SON SMALL TOWN SUB-PROJECT A. Town Profile
Tan Son is a district town of Ninh Son District, Ninh Thuan Province. The small town is located about 35 km northwest of Phan Rang–Thap Cham Town on Phan Rang to Da Lat National Road No 27. Da Nhim hydropower station is situated about 16km from Tan Son. According to the province’s Master Plan, in the near future Tan Son small town will expand to the northwest and south east along National Road no 27 to include Quang Son and Luong Son communes, and Industrial Zone No 9, adjacent to Quang Son. The town’s 2004 population was 38,432.
B. Proposed Tan Son Subproject
The proposed Tan Son Subproject includes one main subcomponent, namely Water Supply Development and Expansion.
C. Management of Urban Services
The Ninh Thuan Provincial Water Supply Company is responsible for water supply in Tan Son and other towns in Ninh Thuan province.
D. Existing Water Supply System in Tan Son
The existing 1000m3/day water supply system in Tan Son is sourced from the Ong River, downstream of Da Nhim Hydropower Scheme. The water supply system includes:

TA 4485-VIE: Central Region Small and Medium Towns Development Project FINAL REPORT Appendix 7, page 25
June 2006
1. An intake channel and raw water pumping station on the Ong River;
2. 1,000m3/day water treatment plant within the town, including sedimentation tanks, rapid gravity filters, gas chlorination, 200m3 treated water storage reservoir;
3. Two elevated tanks have been constructed inside the WTP complex. One is 15m high with 40 m3 storage. The other 25m high 100m3 tank was built in 2001 but is not used;
4. Distribution network comprising 3km of DN40-200 pipelines.
E. Proposed Water Supply Subcomponent
1. Subproject Scope and Service Area The proposed Tan Son Subproject will expand the existing raw water system, water treatment plant, transmission and distribution system to meet growing demand, which is forecast to reach five times the existing supply capacity by 2015. The proposed service area will include Tan Son small town, the future town extension areas of Quang Son and Luong Son communes and Industrial Zone 9. Table A7-15 summarizes the forecast water demand and the WTP capacity additions required to meet the subproject’s coverage and consumption targets for 2015 and 2020. The Tan Son Subproject will expand the existing 1,000m3/day WTP by 5,000m3/day to meet the forecast water demand in 2015. Civil works for the intake and raw water system will be designed to meet 2020 demands.
Table A7-15. Water Demand Forecasts
Water Water Average Required Added Total Year Area Population Coverage Consumption Demand Capacity Capacity Capacity
% lpcd m3/day m3/day m3/day m3/day 2015 Tan Son 12,200 80 100 2,640 3,200 5,000 6,000
2015 Quang Son, Luong Son 23,300 45 80 2,430 2,900
2020 Tan Son 13,500 90 120 4,150 5,000 5,000 11,000
2020 Quang Son, Luong Son 25,700 50 100 3,890 4,700
Note: Existing WTP capacity 1,000m3/day.
2. Subproject Description The Tan Son Subproject includes the following works:
1. Expand the existing 1,000m3/day water treatment plant by 5,000m3/day;
2. Expand the existing raw water pumping station and intake;
3. Expand the distribution network by constructing 12km of DN50-200 pipeline.

TA 4485-VIE: Central Region Small and Medium Towns Development Project FINAL REPORT Appendix 7, page 26
June 2006
IV. PHUOC DAN SMALL TOWN SUB-PROJECT A. Town Profile
Phuoc Dan is a small town of Ninh Phuoc district, Ninh Thuan province. The town is located on National Highway 1A, about 10km south of Phan Rang-Thap Cham. The town’s 2004 population is 23,701.
B. Proposed Phuoc Dan Subproject
The proposed Phuoc Dan Subproject includes one main subcomponent, namely Drainage and Wastewater Management.
C. Management of Urban Services
A small unit under Phuoc Dan TPC is responsible for managing the town’s drainage system.
D. Existing Drainage System The existing drainage system comprises about 2.8km of covered box culverts B400xB600 to B600 xB800 along the main roads and National Highway 1A. The town is surrounded by Lu River and its branches. According to information from the PPU and local consultants, Phuoc Dan experiences severe flooding in the rainy season. About 70% of the town area is flooded 40 times each year to a maximum of 1.5m depth, for periods up to 36 hours. About 19,040 people (3,800 households) are affected by the flooding which causes damage to houses, business premises, property, crops, loss of access to schools and public services, damage to roads, disruption to traffic and adverse health impacts. The causes of flooding include lack of drainage, stormwater runoff to depressed areas and river flooding.
E. Proposed Drainage Subcomponent Investments in drainage in the Class V towns, will be limited to small scale works only, because of funding and affordability constraints and concerns regarding economic efficiency. The small-scale drainage works will be designed to relieve flooding in the town center and in areas where flooding is most severe, remove wastewater from the central urban areas, and support economic development of the town. The drainage subcomponent in Phuoc Dan will consist of small-scale drainage works in existing roads and in roads that will be constructed prior to 2010, mainly on the eastern side of Highway 1A. The proposed works will:
1. Improve 0.5km of existing box culverts;
2. Construct 6.9km of box culverts and three outfalls.

TA 4485-VIE: Central Region Small and Medium Towns Development Project FINAL REPORT Appendix 7, page 27
June 2006
V. CA NA SMALL TOWN SUBPROJECT A. Town Profile
Ca Na is a newly established town which was formerly part of Phuoc Diem Commune, Ninh Phuc District, Ninh Thuan Province. The small town is located on National Highway 1A, about 28km south of Phan Rang-Thap Cham and 18 km south of Phuoc Dan small town. The town lies on a narrow strip of land between Highway 1A and the coast. It has a fishing port, ship repair facility, fish sauce factory, fish processing factory, and a small tourist area with several hotels along the highway. The town’s 2004 population is 18,451.
B. Proposed Ca Na Subproject The proposed Ca Na Subproject includes one main subcomponent, namely Water Supply Development and Expansion.
C. Management of Urban Services The Ninh Thuan Provincial Water Supply Company is responsible for water supply in Ca Na and other towns in Ninh Thuan province.
D. Existing Water Supply Ca Na does not have a piped water supply system at present. Most householders use shallow wells for washing and general purposes and purchase water from vendors for cooking and drinking at prices that are 10-15 times the piped water tariff paid by residents in Phan Rang-Thap Cham. The well water is salty and potentially polluted by wastewater from households. The industries and hotels in Ca Na generally use salty groundwater, take water from springs which dry up, or purchase water from vendors. The ADB’s Third Provincial Towns WSS Project (ADB3), scheduled for completion in 2008-9, will expand the Phan Rang WTP by 4,000m3/day to meet the forecast Y2015 demand of Ca Na and Quan The. It will also construct a 10km DN400 treated water transmission pipeline from Phan Rang-Thap Cham to Phuoc Dan and a booster pumping station at Phuoc Dan to supply Quan The and Ca Na areas. 1. Scope and Service Area The Ca Na Subproject will develop a new water supply system for Ca Na by extending the existing treated water transmission main and constructing two booster pumping stations between Phuoc Dan and Ca Na. The proposed service area includes Ca Na urban and industrial areas. The treated water transmission main will also supply Quan The area which is located between Phuoc Dan and Ca Na. Table A7-16 summarizes the water demand forecast for Ca Na in 2015 and 2020, based on the subproject’s coverage and consumption targets. The Ca Na Subproject will be designed and constructed to supply 2000m3/day of treated water to Ca Na and 2,000m3/day to Quan The by 2015.

TA 4485-VIE: Central Region Small and Medium Towns Development Project FINAL REPORT Appendix 7, page 28
June 2006
Table A7-16. Forecast Water Demands for Ca Na Water Water Average
Year Population Coverage Consumption Demand % lpcd m3/day
2015 21,500 60 80 1,710 2020 23,000 70 100 2,660
2. Description of Ca Na Water Supply Subcomponent The Ca Na Subproject includes construction of the following works: 1. 18km of DN300 treated water transmission main between the Phuoc Dan booster
station and Ca Na.
2. Quan The booster PS (9 km south of Phuoc Dan ), including 1,000 m3 storage reservoir and 4,000 m3/ day booster pumping station with pump house, access road, fence and gate.
3. Ca Na booster PS, including 1,000 m3 storage reservoir and 2,000 m3/ day booster pumping station with pump house, access road, fence and gate, management house and small laboratory.
4. Distribution network at Ca Na, including 7.6km of DN50-200 pipeline.
BINH THUAN PROVINCE The proposed candidate towns in Bin Thuan Province are Phan Thiet, Cho Lau and La Gi. Drainage and Wastewater Management is proposed for Phan Thiet while Water Supply Development is the major subcomponent of the Cho Lau and La Gi subprojects.
I. PHAN THIET CITY SUBPROJECT A. City Profile
Phan Thiet is a Class III city and capital of Binh Thuan province located on National Highway 1A about 190km east of Ho Chi Minh City. Phan Thiet is the economic, administrative, political and industrial center of the province. Its main industries include seafood faring and processing, commerce and tourism services. The city lies on the coast and is transected by two main rivers, namely, the Cau Ke in the east of the city and the Ca Ty in the southwest. These rivers run in a general southeast direction and enter the sea at Phan Thiet. Phan Thiet has fourteen urban wards and four communes. The city’s 2004 population is 206,964. About 76% of the city’s urban population resides in 11 inner urban wards located to the west of Cau Ke River. The other three urban wards are located to the east of Cau Ke River, namely: Phu Hai, Ham Tien and Mui Ne wards, the latter being a popular tourist area about 22km east of Phan Thiet.
B. Proposed Phan Thiet Subproject The Phan Thiet Subproject has one major subcomponent, namely Drainage and Wastewater Management.

TA 4485-VIE: Central Region Small and Medium Towns Development Project FINAL REPORT Appendix 7, page 29
June 2006
C. Management of Urban Services The Binh Thuan Provincial Water Supply and Drainage Company is responsible for managing water supply, drainage and wastewater in Phan Thiet City. It also manages water supply in other towns throughout the province.
D. Existing Drainage System The existing drainage network comprises about 22km of drains D400-1500 and 18km of box culverts B600xB600 to B800XB1000. The drains are mainly located in the commercial center to the south of Ca Ty River and in the wards immediately to the north and northeast of the Ca Ty River. Most of the drains discharge through outfalls to the Ca Ty River. According to information from the PPU and local consultants, Phan Thiet experiences moderate flooding in the rainy season. About 6% of the 11 central urban wards are flooded 1-15 times per year (average 10 times) to depths of 0.2-1.6m (average 0.5m), for periods of 1-24hours (average 9 hours). About 15,900 people (3,200 households) are affected by the flooding which causes damage to houses, business premises, property, crops, loss of access to schools and public services, damage to roads, disruption to traffic and adverse health impacts. The causes of flooding include lack of drainage in all wards, low ground levels in nine wards (which require filling), river flooding in three wards, lack of tide gates in three wards and embankment construction causing stagnant water in two wards. The most severe flooding occurs in the wards to the north of Ca Ty River; the main cause is low ground levels.
E. Proposed Drainage and Wastewater Management Subcomponent 1. Scope and Service Area The proposed Drainage and Wastewater Management Subcomponent includes: (i) stormwater drainage system; (ii) wastewater collection system, and; (iii) wastewater treatment. The proposed subproject will develop the first stage of a complete, integrated stormwater drainage, wastewater collection and wastewater treatment system for the City. It will expand, upgrade and improve the combined stormwater and wastewater systems in the urban wards in order to: (i) rapidly convey stormwater to the nearest rivers or streams; (ii) reduce flooding and ponding, and; (iii) ensure that wastewater is removed from core urban areas and treated to appropriate standards prior to discharge to the environment. It will also develop wastewater interceptors, pumping stations, trunk sewers and centralized wastewater treatment systems. The subproject’s service area for drainage and wastewater management includes all 11 inner urban wards, with Y2015 population of 162,200. 2. Wastewater Flows Table A7-17 shows the forecast wastewater flows for Phan Thiet’s inner urban wards, based on the subproject’s design criteria and development targets. Total wastewater treatment capacity of about 20,000m3/day is required by 2020.

TA 4485-VIE: Central Region Small and Medium Towns Development Project FINAL REPORT Appendix 7, page 30
June 2006
Table A7-17. Forecast Wastewater Flows Urban Water Drainage WW Flow Total
Year Population Consumption Coverage % of WS WW Flow 11 Inner Wards lpcd % m3/day
2015 162,200 135 70 70 12,800 2020 173,000 150 80 70 17,400
Note: The total wastewater flow is based on average dry weather flow and includes 20% for industrial wastewater and other non-domestic wastewater flows.
3. Options Two options were considered for the long term development of the drainage and wastewater systems in Phan Thiet, namely: separate drainage and wastewater systems, and; combined drainage system with interceptor sewers. The combined drainage system is recommended because it is least cost, more sustainable, and more flexible for staged development. 4. Development Concept The Master Plan for Phan Thiet proposes two stages of development: 1st Stage to 2010 and 2nd Stage to 2020. The proposed CSMT Project corresponds to Stage 1 of the Master Plan. It will develop a drainage and wastewater management system for existing developed urban areas and for those areas that will be constructed prior to 2010, when the Project is scheduled for implementation. The consultant team studied the Master Plan and prepared a long term development plan for drainage and wastewater management for the City, covering the 11 inner urban wards. The stormwater drainage system will improve and expand the existing stormwater drainage system on the south and north side of the Ca Ty River. It will include primary, secondary and tertiary drains, together with outfalls (fitted with flap gates) discharging to the Ca Ty and Cau Ke Rivers. In the west of the city, stormwater drains will discharge through outfalls to the canal connecting Phu Hai regulating lake to Cau Ke River. . The wastewater system will include interceptor sewers on the north and south banks of Ca Ty River, and on the south bank of Ca Ke River, together with wastewater pumping stations and gravity trunk mains to divert wastewater to centralized wastewater treatment facilities. Two options were considered for the wastewater system: (i) Option 1 –with a single wastewater treatment facility in Than Hai ward, about 4km east of the city center, and; (ii) Option 2 – having two wastewater treatment facilities – one in Thanh Hai ward (same location as Option 1) and the other in Tien Loi commune, on the west bank of the Ca Ty River, about 2km west of the city center. Option 2 comprising two wastewater treatment systems is recommended because: it has lower capital and O&M costs for the wastewater collection and pumping system, least cost overall, and is more flexible for staged development. The wastewater treatment facilities will comprise simple waste stabilization ponds (WSP), which will discharge treated effluent to Ca Ty and Cau Ke Rivers. The pond systems will consist of anaerobic, facultative and maturation ponds providing at least 15 days detention. They will be designed to meet Vietnamese effluent discharge standards.

TA 4485-VIE: Central Region Small and Medium Towns Development Project FINAL REPORT Appendix 7, page 31
June 2006
5. Description of Proposed Phan Thiet Subproject The proposed Phan Thiet Subproject consists of the following works: 1. 7km of box culverts B800xB800 to B2000xB2200;
2. 24km of primary and secondary drains D800-D1800;
3. 32km of tertiary drains;
4. 5km of D300-800 wastewater Interceptors;
5. 2km of DN150-350 wastewater pressure mains;
6. Four wastewater pumping stations;
7. 8,000 m3/day waste stabilization pond (WSP) system in Tien Loi commune in the west of the city. The proposed WSP will treat wastewater from seven urban wards. Adequate land will be acquired in Stage 1 to enable the WSP system to be upgraded to 11,000m3/day capacity in future.
The location of the WSP has been confirmed by the PPMU. It will require about 15ha of land, plus buffer zone. The Master Plan will need to define the required size of the buffer zone and appropriate land use within the buffer zone. 6. Proposals for Stage 2 – Future Project (2020) The future Stage 2 includes the following works: 1. 35km of primary and secondary drains D600-B1800xB2000 and associated tertiary
drains;
2. Wastewater Interceptors, 7km of D400-1000;
3. Wastewater pressure mains, 3km of DN100-350;
4. Seven wastewater pumping stations;
5. Expansion of Tien Loi WSP to 11,000m3/day capacity;
6. 11,000 m3/day waste stabilization pond system in Thanh Hai ward, with an area of 15ha plus buffer zone.
II. CHO LAU SUBPROJECT A. Town Profile
Cho Lau is the district town of Bac Binh district, Binh Thuan province. It is located on National Road 1A, about 60 km northeast of Phan Thiet. Bac Binh water treatment plant is situated about 2km north of Cho Lau town center. The WTP supplies: (i) Cho Lau small town; (ii) Phan Ri Cua small town in the neighboring district of Tuy Phong, and (iii) three communes in Bac Binh district, namely Hai Ninh, Phan Ri Thanh and Hong Thai. Phan Ri Cua is a coastal small town which is expected to become a provincial town in the near future. Phan Ri Cua is located about 12km southeast of Cho Lau. The existing populations of Cho Lau small town, Phan Ri Cua

TA 4485-VIE: Central Region Small and Medium Towns Development Project FINAL REPORT Appendix 7, page 32
June 2006
small town and the 17 communes (Y2004) are 13,350, 37,353 and 106,890, respectively.
B. Proposed Cho Lau Subproject The proposed Cho Lau Subproject includes one main subcomponent, namely: Water Supply Development.
C. Management of Urban Services The Binh Thuan Provincial Water Supply and Drainage Company is responsible for water supply in Bac Binh district, Cho Lau small town and other towns in Binh Thuan province. The PWSC sells bulk water to Tuy Phong district, which in turn distributes and on-sells the water to consumers in Phan Ri Cua. The Public Works Company under Tuy Phong DPC is responsible for managing the water supply system in Phan Ri Cua. A Belgian-funded project is expected to expand and improve the water distribution network in Phan Ri Cua within the next few years.
D. Existing Water Supply System The existing water supply system for Cho Lau, includes the 4,000m3/day Bac Binh WTP and 45km of DN60-250 transmission and distribution pipelines. The Luy River is the raw water source. In the dry season, the natural flows in Luy River are supplemented by releases from Ca Giay Lake, located 22km north of the WTP. A raw water pumping station on the Luy River pumps water via a 3km long canal to a raw water reservoir adjacent to the 4,000m3/day Bac Binh WTP, which is situated 3km north of Cho Lau town center. From the WTP, treated water is pumped to the distribution networks of Cho Lau, and Phan Ri Thanh Commune (7km from the north of Cho Lau), Hai Ninh, Hong Thai Communes (south of the town) and Phan Ri Cua. A booster pumping station delivers water through a transmission main to Phan Ri Cua.
E. Proposed Water Supply Subcomponent 1. Scope and Service Area The proposed Cho Lau Subproject will expand and improve the existing raw water system, water treatment plant, transmission, and distribution network to meet growing demand, which is forecast to reach three times the existing supply capacity by 2015. The subproject’s service area includes Cho Lau, the three communes and Phan Ri Cua town, which are expected to have combined population of 104,900 by 2015. However, the subproject will not include the distribution network in Phan Ri Cua which will be improved under a separate project, funded by Belgium. Table A7-18 summarizes the forecast water demand and the WTP capacity additions required to meet the subproject’s coverage and consumption targets for 2015 and 2020. The proposed Cho Lau Subproject will expand the existing 4,000m3/day WTP by 10,000m3/day to meet the forecast water demand in 2015. Civil works for the intake and raw water system will be designed to meet 2020 demands.

TA 4485-VIE: Central Region Small and Medium Towns Development Project FINAL REPORT Appendix 7, page 33
June 2006
Table A7-18. Water Demand Forecasts Water Water Average Required Added Total
Year Area Population Coverage Consumption Demand Capacity Capacity Capacity % lpcd m3/day m3/day m3/day m3/day
2015 Cho Lau, Phan Ri 63,700 80 100 8,510 10,200 10,000 14,000 2015 3 Communes 41,200 60 80 3,310 4,000 2020 Cho Lau, Phan Ri 71,400 90 120 12,850 15,400 10,000 24,000 2020 3 Communes 43,900 70 100 5,120 6,100
2. Description of Proposed Water Supply Subcomponent The proposed water supply subcomponent will include the following works: 1. Expand the existing 4,000m3/day plant by 10,000m3/day to a total capacity of
14,000m3/day. The treatment processes comprise coagulation with alum and lime, sedimentation, rapid gravity filtration and disinfection using chlorine gas. The new treatment units will be constructed on about 1ha of relatively flat land in front of the existing WTP;
2. Construct a raw water pumping station to pump from the raw water reservoir to the WTP inlet works;
3. Expand the transmission and distribution network by installing 18km of DN75-50DN pipeline;
4. Expand the existing booster pumping station (about 6km from the WTP) to supply 3,000m3/day of treated water to Phan Ri Cua small town.
III. LA GI SMALL TOWN SUBPROJECT A. Town Profile
La Gi is a Class V small town, in Ham Tan District, Binh Thuan Province. The small town is located on the coast, about 60km southwest of Phan Thiet. La Gi is expected to become a provincial town in the near future. Ham Tan water treatment plant is situated in the north of La Gi town. The WTP supplies La Gi small town and three communes in Ham Tan district, namely Tan An, Tan Thien, Tan Binh and Tan Hai. The 2004 population of La Gi small town and the eleven communes is 32,754 and 126,219 respectively. Tan Ninh town has an estimated population of 6,740.
B. Proposed La Gi Subproject The proposed La Gi Subproject includes one main subcomponent, namely: Water Supply Development.
C. Management of Urban Services The Binh Thuan Provincial Water Supply and Drainage Company is responsible for water supply in Bac Binh district, Cho Lau small town and other towns in Binh Thuan province.

TA 4485-VIE: Central Region Small and Medium Towns Development Project FINAL REPORT Appendix 7, page 34
June 2006
D. Existing Water Supply System The existing water supply system for La Gi includes the 6,000m3/day Ham Tan WTP and 48km of DN60-300 transmission and distribution pipelines. The Dinh River is the raw water source. In the dry season, the natural flows in Dinh River are supplemented by releases from Nui Dat lake, located 10km north of the WTP. The PWSC plans to construct a 10km long stone-lined canal from Nui Dat lake to the WTP. The WTP is located on the right bank of the Dinh River, upstream of a concrete dam which forms the raw water reservoir for the WTP.
E. Proposed Water Supply Subcomponent 1. Scope and Service Area The proposed La Gi Subproject will expand and improve the existing raw water system, water treatment plant, transmission, and distribution network to meet growing demand, which is forecast to reach twice the existing supply capacity by 2015. The subproject’s service area includes La Gi small town and the four communes, which are expected to have combined population of 100,000 by 2015. Table A7-19 summarizes the forecast water demand and the WTP capacity additions required to meet the subproject’s coverage and consumption targets for 2015 and 2020. The proposed La Gi Subproject will expand the existing 6,000m3/day WTP by 10,000m3/day to meet the forecast water demand in 2015. Civil works for the intake and raw water system will be designed to meet 2020 demands.
Table A7-19. Water Demand Forecasts
Water Water Average Required Added Total Year Area Population Coverage Consumption Demand Capacity Capacity Capacity
% Lpcd m3/day m3/day m3/day m3/day 2015 La Gi 40,600 80 100 6,410 7,700 10,000 16,000 2015 4 Communes 59,400 60 80 4,750 5,700 2020 La Gi 44,800 90 120 9,270 11,100 10,000 26,000 2020 4 Communes 63,600 70 100 7,410 8,900
Note: Existing WTP capacity 6,000m3/day.
2. Description of Proposed Water Supply Subcomponent The proposed water supply subcomponent will include the following works: 1. Expand the existing 6,000m3/day plant by 10,000m3/day to a total capacity of
16,000m3/day. The treatment processes comprise coagulation with alum and lime, sedimentation, rapid gravity filtration and disinfection using chlorine gas. The new treatment units will be constructed on relatively flat land adjacent to the existing WTP. The required land area is 1.2 ha, including 0.8ha for the WTP expansion and 0.4ha for the buffer zone. This area contains a class 4 house, which is occupied by employees of the PWSC;
2. Construct a 16,000m3/day capacity raw water pumping station to pump from the raw
water reservoir to the WTP inlet works. The pumping station civil works will be designed and constructed for 25,000m3/day capacity;
3. Construct 76km of DN75-400 transmission and distribution pipelines.

TA 4485-VIE: Central Region Small and Medium Towns Development Project FINAL REPORT Appendix 7, page 35
June 2006
DAK NONG PROVINCE Dak Nong Province covers the following four proposed candidate towns: Gia Nghia, Ea Tling, Dak Mam and Quang Khe. Water Supply Development and Expansion and Drainage and Wastewater Management are proposed for Gia Nghia, Ea Tling, Dak Man and Quang Khe. A Solid Waste Management subcomponent is also proposed for the subproject in Gia Nghia.
I. GIA NGHIA SUBPROJECT
B. Town Profile Prior to 2005, Gia Nghia was the capital of Dak Nong district in Dak Lak province. However, in July 2005, Gia Nghia was elevated to Class IV provincial town status and capital of Dak Nong province, following the province’s separation from Dak Lak. Gia Nghia provincial town lies on National Road 14, about 260km from Ho Chi Minh City and 120km from Buon Ma Thuot. The town is undergoing rapid development as a result of its changed administrative status and Government investment. Several new residential areas and roads are under construction and the PPC plans to complete main roads 1, 2 and 3 in the near future. The town’s 2004 population is 35,559. The town’s population is expected to triple by 2015.
B. Subcomponents The Dak Nong Provincial Peoples Committee registered three main subcomponents for Gia Nghia, namely: Water Supply Development and Expansion, Drainage and Wastewater Management and Solid Waste Management.
C. Management of Urban Services The Dak Nong Provincial Water Supply Company is responsible for water supply, drainage wastewater management and solid waste management in Gia Nghia and other towns of Dak Nong province.
D. Existing Water Supply System The existing water supply system in Gia Nghia includes a borefield with seven bores, 1,500m3/day water treatment plant, and 7km of DN100-150 distribution network. The WTP is located about 0.5km northeast of the town center. A 5,000 m3/day water treatment plant is being constructed about 2km southwest of the town center. The General Construction Constrexim Company, Ministry of Construction, is constructing the WTP and associated distribution network, under a finance and build contract. Under the contract, the PPC is required to repay the investment capital of 32 billion VND within 3 years (20, 30, 50% payments). About 10 billion VND of WTP civil works has been completed, but construction has ceased because of a lack of funds. The remaining works include supply and installation of WTP equipment, and expansion of the distribution network. The proposed source of raw water supply for this plant is the future Dak Nong Hydroelectric Scheme reservoir, which will be constructed about 2km from the WTP site. General Construction Company No.1, Ministry of Construction, is the investor for the 141MW Hydroelectric Scheme, which is scheduled for construction in the period 2006-09.

TA 4485-VIE: Central Region Small and Medium Towns Development Project FINAL REPORT Appendix 7, page 36
June 2006
E. Existing Drainage System The existing drainage system in Gia Nghia consists of 4.5km of drains along main roads in the central urban area. Flooding is not a serious problem in Gia Nghia, because of the steep topography. However, stormwater erosion of some open drains in steep areas causes damage to roads and the resulting deep holes represent a safety hazard to vehicles and pedestrians.
F. Existing Solid Waste Management A private company, Nghia Ha Co. Ltd has a contract with the PPC for solid waste collection, transport and disposal. The company collects about 17.5t/day of solid waste from the town, which represents about 85% coverage. The company employs about 63 people. Its solid waste equipment includes two trucks, one 11t capacity and the other 2.5t. Collected solid waste is transported to a 1.5ha landfill at Nghia Thanh, where the waste is segregated, burnt and partly buried.
G. Proposed Water Supply Subcomponent
1. Scope and Service Area The proposed Gia Nghia Subproject will develop the raw water source, complete the existing 5,000m3/day WTP, construct a new 10,000m3/day WTP on an adjacent site and expand the transmission and distribution network to meet the rapidly growing water demand which is expected to reach ten times existing supply capacity by 2015. The subproject’s service area includes Gia Nghia’s five urban wards, with forecast population of 84,200 by 2015. Table A7-20 summarizes the forecast water demand and the WTP capacity additions required to meet the subproject’s coverage and consumption targets for 2015 and 2020.
Table A7-20. Water Demand Forecasts Water Water Average Required Added Total
Year Population Coverage Consumption Demand Capacity Capacity Capacity % Lpcd m3/day m3/day m3/day m3/day
2015 84,200 85 120 13,750 16,500 10,000+5,000 16,500 2020 100,000 95 135 20,530 24,600 10,000 26,500
Note: Existing WTP capacity 6,500m3/day, including partly completed 5,000m3/day plant that requires equipment.
2. Description of Gia Nghia Water Supply Subcomponent The proposed water supply subcomponent includes the following: 1. Complete the existing 5,000m3/day WTP, including supply and installation of
equipment;
2. Construct a 10,000 m3/day WTP adjacent to the existing 5,000 m3/day The existing WTP area occupies about 2ha; an additional 3ha of land will be required for the second plant;
3. Construct a raw water pumping station on the future canal that will link Dak Nong Hydroelectric Lake No.2 to Lake No.4. This pumping station would pump raw water through a 1.7km long raw water pipeline to the WTP. If the Hydroelectric Lake

TA 4485-VIE: Central Region Small and Medium Towns Development Project FINAL REPORT Appendix 7, page 37
June 2006
cannot be constructed prior to the construction of the CSMT subproject, a temporary pumping station will be constructed at Dak Tik bridge on Dak Tik River, to convey raw water to the WTP through a 7km long temporary pipeline. The pipeline will be constructed with flexible joints so that it may be dismantled and reused in the distribution network in future;
4. Construct 51km of DN75-600 transmission and distribution network.
H. Gia Nghia Drainage Subcomponent 1. Long Term Drainage and Wastewater Plan The consultant prepared a long term drainage and wastewater development plan for Gia Nghia. The long term plan is based on the town’s approved Master Plan and will be implemented in two stages. Stage 1 will be implemented under the CSMT Project, and will be tailored to meet the expected town development (roads, residential areas and lakes) to 2010. Stage 2 will be developed as part of a future project by 2020.
Gia Nghia’s topography is steep and mountainous. According to the Master Plan, the town will be developed around a series of lakes, including a scenic central lake in the town center; Dak Nong Hydro Scheme lakes 3-6km southwest of the town center; and two smaller lake systems to the south west and southeast of the town center. A combined drainage system is recommended for Gia Nghia because it is least cost and most suitable for step-by-step development. A series of primary, secondary and tertiary drains will be constructed along roads in the urban wards to convey stormwater to the planned lakes. Stormwater from the most densely populated urban wards will drain to the lakes in the town center and in the south east. To avoid pollution of the central and southeast lakes, interceptor chambers will be constructed on the primary drains close to their outfalls to divert wastewater through interceptor sewers, wastewater pumping stations and pressure mains to wastewater treatment facilities. Three wastewater treatment facilities, with combined capacities of 4,500m3/day are proposed fro construction in the south of the town in a future development stage. These will be simple waste stabilization ponds providing 15-20 days detention, and discharging treated effluent to the rivers downstream of the lakes. 2. Description of Proposed Drainage Subcomponent The proposed drainage and wastewater subcomponent will develop new combined drainage in all urban wards, focusing on the most densely populated town center area and the southeast area. It will also include a wastewater interceptor, wastewater pumping stations and pressure mains to convey wastewater to discharge points downstream of the lake system, thereby minimizing potential for pollution of the lakes. Wastewater treatment facilities would be constructed in a future Stage 2 project.
The proposed drainage and wastewater subcomponent will include:
1. 32km of primary and secondary combined drains D400 to D2200;
2. 8km of tertiary drains;
3. 4km of D400 interceptor sewers along the shoreline of the central and southeast lakes;

TA 4485-VIE: Central Region Small and Medium Towns Development Project FINAL REPORT Appendix 7, page 38
June 2006
4. Seven wastewater pumping stations and 5km of DN100-200 pressure mains with river outfalls.
3. Proposed Solid Waste Management Subcomponent 4. Scope and Service Area The solid waste management subcomponent will develop a complete solid waste system for Gia Nghia covering waste collection, transport and disposal. It will procure solid waste equipment and develop a new sanitary landfill. The service area for solid waste collection includes all five urban wards with 84,200 population in the design year 2015. The subcomponent aims to achieve 80% collection coverage by 2015.
Table A7-21 shows the solid waste forecasts for Gia Nghia urban area, based on expected waste generation rates and the subproject’s collection coverage targets in 2015 and 2020.
Table A7-21. Forecast Solid Waste Quantities
Existing & Waste Solid Waste Generated Municipal Waste Year Forecast Gen/capita Municipal Industry Total Coverage Collected
Population kg/day t/day t/day t/day % t/day 2015 84,200 0.75 63.2 9.5 72.6 80 50.5 2020 100,000 0.80 80.0 12.0 92.0 90 72.0
The proposed solid waste management subcomponent will include the following:
1. A sanitary landfill with leachate collection and treatment, and separate ponds for
septic tank sludge disposal. In accordance with the Master Plan, the new landfill will be in Dak Nia Commune, 9 km northeast of the town center. About 90 ha of land are available at the landfill site, which is sufficient for at least 20 years solid waste disposal from Gia Nghia town. The initial landfill development will include two clay-lined municipal cells. Waste will be placed in designated areas, buried and covered with soil.
2. Equipment for solid waste collection and transport, including 3 compactor trucks of 8m3 capacity, 2 compactor trucks of 4m3 capacity, 54 handcarts (800L and 400L), and 145 bins (660L and 220L).
3. Equipment for the sanitary landfill, including: (i) weighbridge for weighing solid waste; (ii) bulldozer or loader for compacting, leveling and covering the waste with soil; (iii) tip truck for transporting soil cover; (iv) truck for transporting medical waste.
4. Landfill infrastructure including administration building, water supply, electricity supply, internal roads, stormwater diversion drains, silt ponds, fencing, garage/workshop, toilet and washing facilities for staff and waste pickers.
5. About 2km of access road from the existing road system to the landfill.

TA 4485-VIE: Central Region Small and Medium Towns Development Project FINAL REPORT Appendix 7, page 39
June 2006
II. EA T’LING SMALL TOWN SUBPROJECT A. Town Profile
Ea T’Ling is a small town in Cu Jut district, Dak Nong province. The town is located on Highway No 14, 20 km from Buon Ma Thuot City. The Serepok River passes within 2km of the town center and scenic waterfalls near the town are tourist attractions. The Tam Thang industrial park is situated about 2km northeast of the town center. The town’s existing population (2004) is 27,527 (including Tam Thang industrial park).
B. Proposed Ea T’Ling Subproject The Ea T’ling Subproject includes two main subcomponents, namely: (i) Water Supply Development and Expansion, and; (ii) Drainage and Wastewater Management Although the provincial and district governments requested a Solid Waste Management subcomponent for Ea T’Ling, only the purchase of equipment is proposed because of funding and affordability constraints and concerns over economic efficiency of solid waste management investments in Class V towns.
C. Management of Urban Services The Dak Nong Provincial Water Supply Company is responsible for water supply, drainage wastewater management and solid waste management in Ea T’ling.
D. Existing Water Supply in Ea T’Ling Ea T’ling does not have a piped water supply system. Over 75% of residents obtain water from shallow wells, about 10% use deep boreholes with pumps, and about 20% purchase water from vendors in the dry season. Many of the shallow wells and boreholes dry up in the dry season, groundwater quality is poor, and it is becoming very difficult to develop bore with adequate yield.
E. Existing Drainage System The existing drainage system comprises about 4km of B1000xB1000 culverts along both sides of Highway No 14 which crosses the town. The drains discharge to fields to the west of the town. Minor flooding occurs in the town in the wet season in two areas. Residents reported that the flooding occurs 1-2 times each year, with a maximum depth of about 100mm for up to 10 hours duration.
F. Existing Solid Waste Management The Goods Transport and Environment Sanitation Co-operative collects, transports and disposes of about 3 t/day of solid waste (30% coverage) from the market and town center. The cooperative has 10 workers, and a 2.5t capacity Hyundai truck to transport waste to the disposal site in Ngan Phuong commune, 2km from the town center. The existing disposal area (1ha) is a simple dump site, where the waste is segregated, burnt and partly buried.

TA 4485-VIE: Central Region Small and Medium Towns Development Project FINAL REPORT Appendix 7, page 40
June 2006
G. Proposed Water Supply Subcomponent
1. Scope and Service Area The proposed Ea T’Ling Subproject will develop a complete new water supply system for Ea T’Ling small town, including water intake, water treatment plant, transmission and distribution network. The subproject’s service area includes Ea T’Ling’s urban area and Tam Thang industrial park, with forecast population of 20,800 by 2015. Table A7-22 summarizes the forecast water demand and the WTP capacity additions required to meet the subproject’s coverage and consumption targets for 2015 and 2020. Based on industry and tourism growth prospects for the town, the proposed Ea T’Ling Subproject will develop a new WTP to meet the forecast water demand in 2020. Civil works for the intake and raw water system will also be designed to meet 2020 demands.
Table A7-22. Water Demand Forecasts
Water Water Average Required Added Total Year Population Coverage Consumption Demand Capacity Capacity Capacity
% Lpcd m3/day m3/day m3/day m3/day 2015 20,800 80 100 3,200 4,000 6,000 6,000 2020 24,700 90 120 5,000 6,000 0 6,000
Note: the forecast demands include Tam Thang industrial park. 2. Water Supply Subcomponent Description The proposed Ea T’Ling water supply subcomponent will develop the following facilities: 1. A 4,000m3/day capacity raw water pumping station on the Serepok River, about 3km
south of the town center on the way to Krong No. This source has adequate flow, water quality, and a good protection zone upstream of the intake;
2. A 4,000m3/day capacity WTP at a site near the raw water pumping station. Two options are being considered for the WTP: Option 1: on the strip of land between the provincial road and the river bank, where there are no houses; Option 2: on the hill 500m north of the river intake, opposite the location proposed in Option 1;
3. The distribution network for Ea T’Ling small town and Tam Thang industrial park, including 11km of DN50-300 pipelines.
H. Proposed Drainage Subcomponent in Ea T’Ling
Investments in drainage in the Class V towns, will be limited to small scale works only, because of funding and affordability constraints and concerns regarding economic efficiency. The small-scale drainage works will be designed to relieve flooding in the town center and in areas where flooding is most severe, remove wastewater from the central urban areas, and support economic development of the town. The proposed drainage subcomponent will rehabilitate the existing 0.6km of culverts and construct an additional 2km of D400-600 drains.
I. Proposed Solid Waste Management Subcomponent The proposed solid waste management component includes the purchase of 8 handcarts, 27 garbage bins and a compactor truck. This will improve the solid waste collection services in the area which will minimize the clogging of drainage due to the wastes thrown to the canals.

TA 4485-VIE: Central Region Small and Medium Towns Development Project FINAL REPORT Appendix 7, page 41
June 2006
III. DAK MAM SMALL TOWN SUBPROJECT A. Town Profile
Dak Mam is a district town of Krong No district, Dak Nong province. It lies on Provincial Road No. 693, about 35km south of Ea T’ling small town and 85km northeast of Gia Nghia town. Most of Dak Mam’s residents live close to the provincial road. A central lake is a feature of the town. The existing population (Y2004) of Dam Mam small town is 8,972.
B. Proposed Dak Mam Subproject The Ea T’ling Subproject includes two main subcomponents, namely: (i) Water Supply Development and Expansion, and; (ii) Drainage and Wastewater Management. Although the provincial and district governments requested a Solid Waste Management subcomponent for Dak Mam, only the purchase of equipment is proposed because of funding and affordability constraints and concerns over economic efficiency of solid waste management investments in Class V towns.
C. Management of Urban Services The Dak Nong Provincial Water Supply Company is responsible for water supply, drainage wastewater management and solid waste management in Dak Mam.
D. Existing Water Supply in Dak Mam Dak Mam does not have a piped water supply system. Most residents obtain water from shallow wells, some have deep boreholes with pumps. During the dry season, residents purchase water from vendors because many wells and some boreholes dry up. Groundwater quality is poor, and it is becoming very difficult to develop bores with adequate yield.
E. Existing Drainage System The existing drainage system comprises about 4km of D800 drains along the main roads. Minor flooding occurs in the town in the wet season.
F. Existing Solid Waste Management The Dak Mam Service Co-operative collects, transports and disposes of about 1 t/day of solid waste (25% coverage) from the market and town center. The cooperative transports the solid waste by tractor to the 0.1ha disposal site in No. 3 commune. The disposal site is a simple dump site, where the waste is segregated, burnt and partly buried.
G. Proposed Water Supply Subcomponent 1. Scope and Service Area The proposed Dak Mam Subproject will develop a complete new water supply system for Dak Mam small town, including water intake, water treatment plant, transmission and

TA 4485-VIE: Central Region Small and Medium Towns Development Project FINAL REPORT Appendix 7, page 42
June 2006
distribution network. The subproject’s service area includes Dak Mam’s town area, with forecast population of 15,100 by 2015. Table A7-23 summarizes the forecast water demand and the WTP capacity additions required to meet the subproject’s coverage and consumption targets for 2015 and 2020. The proposed Dak Mam Subproject will develop a new 3,000m3/day capacity WTP to meet the forecast water demand in 2015. Civil works for the intake and raw water system will be designed to meet 2020 demands.
Table A7-23. Water Demand Forecasts Water Water Average Required Added Total
Year Population Coverage Consumption Demand Capacity Capacity Capacity % lpcd m3/day m3/day m3/day m3/day
2015 15,100 80 100 1,930 2,300 2,000 2,000 2020 18,400 90 120 3,190 3,800 2,000 4,000
2. Water Supply Subcomponent Description The Dak Nong PPC plans to construct the Dak Ro Dam and Reservoir, on Dak Ro river, about 3km southwest of the town. The reservoir will have a dual function for Dak Mam small town water supply and for irrigation. The proposed Dak Mam water supply subcomponent will develop the following facilities: 1. A 4,000m3/day capacity raw water intake in Dak Ro Dam, and 2km long DN300 raw
water transmission main between the dam and WTP; 2. A 2,000m3/day capacity WTP, about 1km south of the town center, and 2km from
Dak Ro Dam. 2ha of land will be required for the WTP site; 3. Distribution network, including 8km of DN50-200 pipeline.
H. Proposed Drainage Subcomponent in Dak Mam Investments in drainage in the Class V towns, will be limited to small scale works only, because of funding and affordability constraints and concerns regarding economic efficiency. The small-scale drainage works will be designed to relieve flooding in the town center and in areas where flooding is most severe, remove wastewater from the central urban areas, and support economic development of the town. Wastewater collection and treatment will be introduced in a future project when resources permit. This approach aims to ensure that the investment will be economically efficient, and sustainable in terms of cost recovery and operation and maintenance (O&M). The proposed drainage subcomponent will construct 3km of D400 drains and B500xB700 culverts.
I. Proposed Solid Waste Management Subcomponent The proposed subcomponent will be the purchase of 8-800L handcarts, 27 garbage bins and 1 compactor truck, to augment the existing solid waste management collection equipment and facilities.

TA 4485-VIE: Central Region Small and Medium Towns Development Project FINAL REPORT Appendix 7, page 43
June 2006
IV. QUANG KHE SMALL TOWN SUBPROJECT A. Town Profile
Following the separation of Dak Nong province from Dak Lak, the former commune of Quang Khe was elevated to Class V district town status and became the capital of the newly formed Dak Glong district. Quang Khe small town is undergoing rapid development and urbanization resulting from the change in its administrative status and associated Government investment. The small town’s existing population (Y2004) is 5,214 but the population is expected to double by 2010.
B. Subcomponents The Dak Nong PPC has registered two main subcomponents in Quang Khe, namely: Water Supply Development and Expansion, and Drainage and Wastewater Management.
C. Management of Urban Services The Dak Nong Provincial Water Supply Company is responsible for water supply, drainage wastewater management and solid waste management in Quang Khe.
D. Existing WSS Infrastructure in Quang Khe Quang Khe does not have a piped water supply system. Most residents obtain water from shallow wells, which are liable to contamination from household wastewater in the more densely populated areas. The small town does not have a formal drainage system. However, flooding and ponding is minor, because of the small town’s relatively steep topography. Stormwater and wastewater from most of the town area drains to Quang Khe Lake in the north of the town.
E. Proposed Water Supply Subcomponent 1. Scope and Service Area The proposed Quang Khe Subproject will develop a complete new water supply system for the small town, including raw water system, water treatment plant, transmission and distribution network. The subproject’s service area includes Quang Khe’s urban area, with forecast population of 13,500 by 2015. Table A7-24 summarizes the forecast water demand and the WTP capacity additions required to meet the subproject’s coverage and consumption targets for 2015 and 2020. The proposed Quang Khe Subproject will develop a new 3,000m3/day capacity WTP to meet the forecast water demand in 2015. Civil works for the intake and raw water system will be designed to meet 2020 demands.
Table A7-24. Water Demand Forecasts
Water Water Average Required Added Total Year Population Coverage Consumption Demand Capacity Capacity Capacity
% lpcd m3/day m3/day m3/day m3/day 2015 13,500 80 100 1,590 1,900 2,000 2,000 2020 21,700 90 120 3,430 4,100 2,000 4,000

TA 4485-VIE: Central Region Small and Medium Towns Development Project FINAL REPORT Appendix 7, page 44
June 2006
2. Water Supply Subcomponent Description The proposed Quang Khe water supply subcomponent will develop the following facilities: 1. A 2,000m3/day capacity shallow well and submersible pumping system, taking
underground water from alluvial deposits downstream of the existing Quang Khe Dam and Reservoir;
2. 100m long DN200 raw water transmission main between the dam and WTP;
3. A 2,000m3/day capacity WTP, located on a ridge at the northern end of the town. About 1ha of land will be required for the WTP site;
4. Distribution network, including 10km of DN50-200 pipeline.
F. Proposed Drainage Subcomponent in Quang Khe
Investments in drainage in the Class V towns, will be limited to small scale works only, because of funding and affordability constraints and concerns regarding economic efficiency. The small-scale drainage works will be designed to relieve flooding in the town center and in areas where flooding is most severe, remove wastewater from the central urban areas, and support economic development of the town. The proposed drainage subcomponent will construct 2km of D400-800 combined drains, which will discharge stormwater and wastewater to an outfall located downstream of the water supply source.

TA 4485-VIE: Central Region Small and Medium Towns Development Project FINAL REPORT Appendix 6, page 1
June 2006
DESIGN AND MONITORING FRAMEWORK
Design Summary
Performance Targets/Indicators
Data Sources/Reporting Mechanisms
Assumptions and Risks
Impact Improved quality of life, sustained economic growth and reduced poverty for residents in subproject towns
By end of Project (2011) Increased water supply and sanitation service quality and coverage, economic output, and income levels. Reduced risks to public health due to improved environmental sanitation and hygiene.
Government reports; socio-economic statistics; poverty impact assessment; environmental monitoring reports; household and customer surveys; Project Completion Report.
Assumption • Full commitment of
and support from the Government, PPCs, WSS service providers, and beneficiaries
Outcome Improved access to safe and sustainable water supply Improved drainage and lower incidence of flooding Improved functional solid waste management systems in place Attitudinal change towards environmental hygiene and sanitation Sustainable management and delivery capacities of WSS service providers
By end of Project (2011): 95% water supply coverage; uninterrupted 24-hour water supply; average UFW of less than 30% 85% drainage coverage; reduced flooding and ponding; reduced wastewater discharge to rivers/ waterways 90% solid waste collection coverage; fully operational SWM management systems Septic tank coverage of 60% in all 8 subproject towns; reduced risks to public health Improved staff ratio, adequate and timely tariff adjustments for water supply; improved collection; improved cost recovery mechanisms
Government reports; socioeconomic statistics; plant records/ water production and sales figures; customer surveys; water quality tests; groundwater monitoring data; account statements; DONRE monitoring reports Financial reports of solid waste collectors Household surveys; VWU records and reports on sanitation PWSC reports; performance audit reports; billing statistics
Assumptions • Adequate and
timely provision of resources needed for project completion from the Government, ADB and other stakeholders
• Ability and will of the Government and PPCs to undertake necessary policy and institutional reforms
• Active participation and sense of ownership from Project beneficiaries
Risks • Lack of
understanding of project objectives from stakeholders concerned
• Resistance to change on part of existing WSS service providers
Outputs Part A: Water Supply Development Construction and rehabilitation of existing headworks Construction of water treatment plants and pumping stations
Mid 2008 – end 2010 12 km of raw water pipelines from source to WTPs for Gia Nghia, Ninh Hoa, Tan Son, Ea’Tling,Dak Mam, and Quang Khe 6 WTPs with a combined 24,000 m3 capacity per day to agreed design standards in Ca Na, Gia Nghia, Ninh
PPMU and consultant reports; mission findings Quarterly progress reports Quarterly progress reports
Assumptions • Implementation of
suggested cost recovery mechanisms and needed tariff adjustments
• Support for the Project from PPCs, WSS providers, communities, and other stakeholders
• Provision of

TA 4485-VIE: Central Region Small and Medium Towns Development Project FINAL REPORT Appendix 6, page 2
June 2006
Design Summary
Performance Targets/Indicators
Data Sources/Reporting Mechanisms
Assumptions and Risks
Construction, rehabilitation, and improvements of water distribution networks Installation of new piped connections and rehabilitation of existing connections Part B: Drainage and Wastewater Treatment Construction of drainage networks Construction of interceptor sewers for the above towns Construction of wastewater stabilization ponds for Tuy Hoa, Cam Ranh, Thap Cham, Gia Nghia, and Phan Thiet Part C: Solid Waste Management Construction and rehabilitation of landfill sites for Cam Ranh, Song Cau, Gia Nghia, Ninh Hoa, and Van Gia Procurement of solid waste equipment; establishment of SWM management systems
Hoa, Tan Son, Ea’Tling,Dak Mam, and Quang Khe 142,843 km of water supply distribution networks, pipes to agreed design standards in Ca Na, Gia Nghia, Ea’Tling, Dak Mam, Quang Khe, Ninh Hoa, Van Gia, Tan Son, and Ca Na; 18 km treated water pipes extended to Ca Na 18,000 new pipe connections and rehabilitation of obsolete connections in Ca Na, Gia Nghia, and Ninh Hoa Mid 2008 – end 2011 144 km primary and secondary drains, 100 km tertiary drains and 14 km pressure mains in Cam Ranh, Gia Nghia, Phan Thiet, Thap Cham, Song Cau, Ea’Tling, Dak Mam, Quang Khe, and Tuy Hoa 33,360 km of interceptor sewers equipped with 24 pumping stations 9 wastewater stabilization ponds, total treatment capacity 27,500 m3/day Mid 2008 – end 2009 New sanitary landfills, including buffer zones, and landfill infrastructure for Gia Nghia, Song Cau, Van Gia, and Cam Ranh, each covering 6 ha; 3.5 landfill site improvement for Song Cau Compactor trucks, bulldozers, handcarts, and storage bins
Quarterly progress reports Quarterly progress reports PPMU and consultant progress reports; mission findings Quarterly progress reports Quarterly progress reports Quarterly progress reports PPMU and consultant progress reports; mission findings Quarterly progress reports Quarterly progress reports
qualified personnel for PCU, PPMUs, and necessary counterpart staff
• Implementation of environmental, social, and resettlement requirements
• Timely recruitment of competent consultants
Risks • Cumbersome
processes may inhibit timely approval and disbursements
• Lack of capacity of people’s committees, WSS service providers
• Lack of familiarity with ADB and Government procurement and disbursement procedures

TA 4485-VIE: Central Region Small and Medium Towns Development Project FINAL REPORT Appendix 6, page 3
June 2006
Design Summary
Performance Targets/Indicators
Data Sources/Reporting Mechanisms
Assumptions and Risks
Establishment of SWM management systems Part D: Community Environmental and Sanitation Awareness Public awareness on the importance of good environmental hygiene and sanitation Improved access to sanitation services for the poor Improved environmental conditions in poor communities Part E: Project Management and Institutional Support Improved capacity of WSS personnel, accounting practices Greater managerial autonomy and operational efficiency of WSS providers Improved tariff structure for WSS services for financial sustainability O&M manuals, established accounting systems, corporate plan for WSS service providers
Functioning SWM management systems in Gia Nghia, Song Cau, and Thap Cham Early 2007 – end 2008 Evidence of community participation; increased use of septic tanks Number of poor households able to acquire septic tanks and drainage connections Evidence of cleanliness as verified through visual inspections Early 2007 – end 2011 (Full duration of the Project) Number of personnel trained in management, technical and administrative expertise in PWSCs and other POEs Issuance of Government/PPC operational decree on autonomy and other necessary reform Conformity to tariff schedule Publication and utilization of guidelines and manuals
Quarterly progress reports PPMU and consultant progress reports; mission findings Quarterly progress reports Quarterly progress reports Quarterly progress reports PPMU and consultant progress reports; mission findings Quarterly progress reports Quarterly progress reports Quarterly progress reports Quarterly progress reports
Assumptions • Implementation of
suggested cost recovery mechanisms and needed tariff adjustments
• Support for the Project from PPCs, WSS providers, communities, and other stakeholders
• Provision of qualified personnel for PCU, PPMUs, and necessary counterpart staff
Risks • Cumbersome
processes may inhibit timely approval and disbursements
• Lack of capacity of people’s committees, WSS service providers
Activities Milestones Inputs ($ millions) 1. Project Start-up and Implementation
1.1 Establishment of PCU and PPMUs 1.2 Consultant recruitment
2. Water Supply Development and
Expansion 3.1 Development of headworks 3.2 Construction/rehabilitation of WTPs 3.3 Transmission and distribution pipes 3.4 Land acquisition and resettlement
End 2006 End 2006 Early 2009 Early 2009 2009 – 2010 Mid 2008
Civil Works Materials and Equipment Land Acquisition/ Resettlement Surveys
$ 76.06
$ 4.94
$ 2.80
$ 1.15

TA 4485-VIE: Central Region Small and Medium Towns Development Project FINAL REPORT Appendix 6, page 4
June 2006
Activities Milestones Inputs ($ millions) 3. Drainage and Sanitation Improvements
4.1 Pipe layout and refurbishment 4.2 Public sanitation improvements 4.3 Solid waste systems improvements 4.4 Landfill development/improvements 4.5 Land acquisition and resettlement
4. Community Environmental Sanitation
and Awareness 4.1 Public awareness campaigns 4.2 Community sanitation improvement
schemes for poor communities 5. Project Management and Implementation
Assistance
5.1 Incremental project management 5.2 Training and institutional strengthening 5.3 Institutional/policy reforms
2009 – 2011 Early 2010 Mid 2009 Mid 2009 – 2010 End 2008 2006 – 2007 2007 - 2008 Full duration 2008 – 2010 End 2007 - 2010
Training and Workshops/ Community Awareness Consulting Services Project Management Total
$1.70
$ 6.76
$ 3.53
$ 96.94
DONRE = Provincial Department of Natural Resources and the Environment, O&M = operation and maintenance, PPC = provincial people’s committee, PPMU = provincial project management unit, PWSC = Provincial Water Supply Company, SWM = solid waste management, VWU = Viet Nam Women’s Union, WSS = water supply and sanitation, WTP = water treatment plant. Source: ADB staff estimates.

TA 4485- VIE: Central Region Small and Medium Towns Development Project FINAL REPORT Appendix 5, page 1
June 2006
POLICY AND INSTITUTIONAL REFORM AGENDA
No Policy Objective Present Situation Action Needed Agencies Time Frame
1 To strengthen national tariff policies and develop mechanisms necessary for financial sustainability of the WSS sector, and support equitization of WSS companies.
While the authority to set WSS tariffs continues to be held by the PPCs, the tariff guidelines issued in 1999 and 2004, provide the framework and methodology for use by the PPCs in establishing these tariffs. However, the guidelines do not provide a specific method for calculating the required level of cost recovery, and lack suitable mechanisms for valuing assets and calculating depreciation, posing a major constraint to full cost recovery and eventual WSS company equitization.
Prepare guidelines for asset valuation and depreciation, involving surveys of current WSS asset valuation and management procedures; national workshops; preparation of methodology for asset registers, asset valuation, calculation of asset depreciation, delineation of asset ownership between PCs and WSS companies, and recommendations to GOV.
Prepare affordability guidelines for WSS tariffs, involving targeted studies, affordability analyses and case studies, national workshops, and recommendations to GOV.
MOC, MOF, PPCs, CPCs, TPCs, VWSA, WSS service providers,
Within 24 months of loan effectiveness
2 To strengthen the role of CPC/DPC/TPCs as “clients” of WSS service providers and improve the capacity of the PCs’ urban management divisions to plan, coordinate and monitor urban WSS services
CPC/DPC/TPCs are responsible for administering cities, districts and towns in the provinces. In line with Government policy, these people’s committees (PCs) are in the process of relinquishing administration of WSS service providers which are being corporatized and equitized as separate entities. Although the PCs have established urban management divisions (or their equivalents), the divisions lack the capacity to carry out their new functions due to scarce human resources, training and management systems.
At present, CPC/DPC/TPCs do not establish formal agreements with WSS service providers on performance standards and service delivery.
The PPCs will ensure that CPCs, DPCs, and TPCs will:
Provide urban management divisions with sufficient human resources, systems and guidelines to undertake effective urban planning and management in the city, district or town in coordination with the DOC;
Establish performance standards for service delivery, after consultation with communities; and
Prepare, implement and supervise service performance contracts with WSS companies and/or private urban service providers.
PPCs, CPCs, DPCs, TPCs with assistance of consultants
Within 18 months of loan effectiveness
3 To assist Project PCs with the transformation and corporate restructuring of WSS service providers into autonomous and
Most WSS service providers are SOEs with limited autonomy and accountability. PPC approval is required for most key management and operating decisions including service levels, staff salary and benefits, and major expenditures. Excessive dependence on PPCs decisions limits significantly the capacity of WSS service providers to deliver urban services efficiently based on commercial principles.
Develop provincial action plans to: (a) corporatize or WSS service providers, and (b) achieve economies of scale in WSS service provision;
Assist PCs to corporatize or equitize the WS companies, (through training and developing guidelines) by adopting the most appropriate corporate structure, and assist the WSS
WSS service providers with support from MOC, SCERD, MOF, other line ministries and PPCs
Within 12 months of loan effectiveness

TA 4485- VIE: Central Region Small and Medium Towns Development Project FINAL REPORT Appendix 5, page 2
June 2006
No Policy Objective Present Situation Action Needed Agencies Time Frame
efficient, business-oriented companies operating under the (Unified) Enterprise Law.
Government’s SOE Reform Program aims to separate WSS service providers from PC administration through a process of corporatization and equitization, under the (Unified) Enterprise Law, giving them greater autonomy in business decisions, staff remuneration, and capital raising, and; separating them from government administration, allowing for gradual reduction of subsidies from the State Budget. At 1 March 2006, four WSS service providers in the Project provinces had transformed and several others were in the process of transforming.
companies in the legal and financial techniques required for selling shares to the public (initial public offerings - IPOs).
4 Strengthen autonomy, management and technical capacity of WSS companies responsible for managing urban water supply, drainage, wastewater and solid waste systems.
While WSS service providers allocate sufficient staff numbers to undertake their duties, they suffer from a lack of capital and equipment, and lack of specific sector training. In general, financial management and asset management capacities are weak.
Many of the managers in control of WSS companies are engineers by training, and often lack business and management skills, resulting in poor attention to financial management, markets and customers’ needs.
Current accounting and financial reporting procedures lack transparency and are inadequate for the operation of an autonomous WSS business entity.
The involvement of WSS service providers in construction activities diverts the attention of management and employees from their core functions and responsibilities as managers of urban services.
Regulations and institutional capability to implement Vietnam’s environmental policy framework are lacking at the operational level, and regulations are not effectively enforced. The regulation of solid waste and wastewater management suffers from weak enforcement and supervision, largely due to limited human resources, unclear mandates, fragmented and overlapping roles between government agencies. This has resulted in inadequate investment and improper operations of waste and wastewater treatment facilities by municipal agencies, industry, and hospitals, and has allowed low cost, unsafe methods of waste disposal to proliferate.
PPCs will ensure that WSS service providers will:
Develop action plans and guidelines on new employment policies, hiring practices, and performance based remuneration;
Develop operator certification and training programs to improve staff capabilities, enhance transparency in hiring practices and provide staff incentives.
Change the focus of WSS companies to management, and O&M of WSS infrastructure, by setting up separate accounts and organization structure for construction activities;
Implement programs to create cost centers, separate budgets, and functional accounting systems following Vietnamese Accounting Standards for each of their main activities, distinguishing between:
(a) water supply; (b) drainage and wastewater; (c) solid waste management; (d) other municipal services, and
(e) new construction activities;
Adopt and implement efficient and effective asset management procedures, covering asset valuation and depreciation, O&M plans, manuals and procedures;
PPCs, CPCs, DPCs, TPCs, WSS service providers
Within 24 months of loan effectiveness

TA 4485- VIE: Central Region Small and Medium Towns Development Project FINAL REPORT Appendix 5, page 3
June 2006
No Policy Objective Present Situation Action Needed Agencies Time Frame
Improve business management, financial management and financial planning capacities of key staff, implement efficient Financial and Management Information Systems, and adopt modern management methods to provide a more commercial focus, including preparing business plans, and improving customer relations skills;
Calculate, recommend, and justify appropriate fees for water supply, drainage, wastewater, and solid waste to clients and PCs, and agree on appropriate service levels with PCs, after consulting with communities;
Own WSS assets and accumulate sufficient funds for asset depreciation and repayment of loans;
Implement improved sanitation regulations and policies which: mandate wastewater connection to municipal drains, and impose penalties on people who do not pay for services received, cause environmental pollution, or destroy urban infrastructure.
Collect WSS fees and retain all revenues in separate functional accounts and used them solely for O&M of the respective water supply, drainage, wastewater, and solid waste systems.
5 To develop appropriate financial mechanisms, cost recovery principles and business strategies to ensure sustainability of WSS services and reduce government
In 2004, to accelerate cost recovery, Government issued Directive 04/2004 requiring all WSCs to set water supply tariffs based on full and accurate inclusion of all O&M costs, depreciation, debt payment and return on investment. Charges for drainage are recommended by the MOC and the Government Pricing Committee in Circular No.03/1999/TTLT/BXD-BVGCP to be 10% of the total water production cost as a minimum and to be gradually increased to cover operation and maintenance (O&M) costs.
Currently none of the Project provinces apply full cost recovery tariffs for water supply. Although several WSS service providers have adopted the methodology for calculating full
The PPCs will ensure that WSS service providers:
Develop and implement action plans for improving WSS sustainability by expanding WSS coverage and reducing operating costs (e.g. NRW reduction, meter management, energy and pressure management);
Adopt tariffs that provide full cost recovery in the case of water supply, and recover sufficient costs to cover debt service, full O&M costs and depreciation of plant and equipment in the case of drainage, wastewater and solid waste
PPCs, CPCs, DPCs, TPCs and WSS service providers
Within 24 months of loan effectiveness

TA 4485- VIE: Central Region Small and Medium Towns Development Project FINAL REPORT Appendix 5, page 4
June 2006
No Policy Objective Present Situation Action Needed Agencies Time Frame
subsidy for water supply, drainage, wastewater, sanitation and solid waste by assisting WSS service providers to generate more revenue from their own sources.
cost recovery tariffs (Directive 04/2004), the mechanisms for asset valuation, calculating depreciation and assessing affordability are lacking.
Four Project provinces (excluding Dak Nong) currently apply a drainage fee which ranges from about 3% to 10% of the water tariff, and all provinces apply solid waste charges which are recovered directly from users.
Drainage and solid waste management charges are set at unsustainable levels, which are unrelated to the cost of the services and do not meet basic O&M costs. Drainage and solid waste management services rely on budget subsidies, which, together with user charges, only cover about 30-70% of O&M costs for drainage and about 30-50% of O&M costs for solid waste services.
Tariffs and budget allocations are generally set at levels insufficient to provide adequate levels of service. In all cases, WSS tariffs are set well below the maximum levels that are affordable to the large majority of households, and well within their willingness to pay.
management services;
Calculate, recommend and justify appropriate fees for drainage, wastewater and solid waste to the PCs based on proper calculation of asset depreciation and affordability, and agree on appropriate service levels with PCs after consulting customers;
The water tariff surcharge for drainage and sewerage is increased to 20%.
The current solid waste tariff is increased, at least, by 50% for all user groups.
Adopt policies to assist poor households to connect to the piped water supply system, including deferred payment systems for new water connections.
Facilitate grants to help poor households construct septic tanks and make wastewater connections to municipal drainage systems
6 To improve awareness and community participation of communities in the planning and management of urban services
Lack of community awareness of the links between water, sanitation, hygiene practices and health has resulted in the deterioration of the health profile of the local urban population.
Lack of occupational health awareness of WSS service provider employees, including waste pickers at landfill sites has also increased their health risks.
Lack of awareness and participation in the protection and conservation of WSS infrastructure has led to destruction of the infrastructure.
Lack of awareness on the benefits of paying for urban services and connecting to the systems have decreased motivation of households to connect and pay for environmental sanitation services
The PCs will ensure that:
Representatives of the women’s union (WU), work in consultation with PPMU, PCs and WSS service providers in implementing Component A in each Project city, district and town. The PPC will ensure timely disbursement of funds from the PPMU to the city, district or town’s WU for all activities under Component A, including awareness campaigns.
WSS service providers in consultation with PCs and the WU will implement a process of consultation and community participation for planning, design and O&M of urban WSS services and selecting appropriate WSS service levels.
Through the health awareness program, the public will be made aware of (i) the links between
PPCs, CPCs, DPCs, TPCs, PPMUs and WSS service providers
Within 6 months of loan effectiveness
Within 12 months of loan effectiveness

TA 4485- VIE: Central Region Small and Medium Towns Development Project FINAL REPORT Appendix 5, page 5
June 2006
No Policy Objective Present Situation Action Needed Agencies Time Frame
clean water supply, household sanitation and public health; the negative impacts of improper waste management practices, and; (iii) their accountability in paying for improved WSS services.
Provide OH&S training, health checks and immunization and issue uniforms and protective clothing to staff and workers
7 To improve the welfare and protect the jobs of waste pickers who work at existing dump sites in several of the Project Towns
Currently, waste pickers (mainly poor women and children) are engaged in solid waste recycling activities at dump sites in several of the Project towns. They frequently live near the dump sites and work at the dump sites where they are exposed to environmental and safety hazards. About 9% of waste pickers are children who work at the dump sites with parents rather than attend school.
PPCs will ensure that WSS service providers will:
Introduce measures to ensure that the livelihoods of waste pickers are not adversely affected by the Project, by providing employment opportunities in the URENCO/UPWC or enabling them to continue waste picking activities at the new landfills;
Improve safety and hygiene for waste pickers, including: (i) register waste pickers; (ii) provide them with protective clothing and boots; (ii) provide OH&S training, health checks and immunization; (iii) limit access to times when there are no trucks operating; (iv) provide washing and toilet facilities for them at the landfill sites; (v) ban children from waste picking activities.
PPCs, CPCs, DPCs, TPCs and WSS service providers
Within 36 months of loan effectiveness
8 To increase participation by communities and the private sector in solid waste management.
Communities, private groups, private cooperatives and private companies are involved currently in solid waste management activities in Song Cau, Cam Ranh, Phan Rang-Thap Cham and several towns in Dak Nong province. However, their roles are limited, and there are concerns of job losses if the waste management systems are expanded and taken over by URENCOs or UPWCs.
Operation of landfills by URENCOs limits the use of proprietary technology for waste treatment and reuse which can reduce the overall cost of solid waste management, reduce environmental impact and minimize land requirements for waste disposal.
The PPCs will ensure that WSS service providers will:
Maintain and, where possible, expand the participation of private cooperatives and private companies in solid waste management in the Project towns. e.g. Adopt the solid waste management model in Phan Rang-Thap Cham.
With assistance of consultants, prepare standard service contracts and guidelines for solid waste management activities by private cooperatives and private companies.
PPCs, CPCs, DPCs, TPCs and WSS service providers
Within 24 months of loan effectiveness

TA 4485- VIE: Central Region Small and Medium Towns Development Project FINAL REPORT Appendix 5, page 6
June 2006
No Policy Objective Present Situation Action Needed Agencies Time Frame
In Phan Rang-Thap Cham, ward cooperatives carry out solid waste collection, and a private company is responsible for transporting, treating and disposing of solid waste in a sanitary landfill under contract to the CPC. PCs and WSS service providers should consider the adoption of this model in the Project towns.
9 To increase participation by women in Project planning, design, implementation and O&M of WSS services
Females make up more than 50% of the total population in the five Project provinces. They are responsible for a variety of tasks relating to WSS at both the family and community levels.
Although women have a large membership base in the women’s union and represent the majority of solid waste collectors and street sweepers, they are underrepresented in management positions in most WSS service providers. It is necessary to raise gender awareness and representation within the WSS service providers.
PPCs will ensure that:
At least 25% of PSCs will consist of women
The WU will implement Component A - community awareness and community sanitation improvements;
WSS service providers will develop an implement policies to increase the number of women engaged in WSS services, particularly in management positions
PPCs, PPMUs, WSS service providers, WUs
Within 3 months of loan effectiveness (PSC)
Within 12 months of loan effectiveness
10 To develop regional landfills, in support of Government policy
Government policy supports the development of regional landfills which offer: (i) economies of scale in construction and O&M; (ii) opportunities for enhanced management and environmental protection; compared to scattered dump sites that currently exist throughout the districts.
Under the Project, a regional sanitary landfill will be developed for Ninh Hoa and Van Gia towns. It will also serve surrounding areas of Ninh Hoa and Van Ninh districts.
Prepare guidelines for developing and operating regional landfills;
Prepare model contracts between districts participating in the regional landfill, covering cost sharing arrangements for landfill development, management and O&M;
Prepare model contract between Van Ninh DPC, Ninh Hoa DPC, TPCs, UPWCs and private sector for landfill management, O&M
PPC, DPCs, TPCs, WSS service providers, private cooperatives, and private companies
Within 12 months of loan effectiveness

TA 4485- VIE: Central Region Small and Medium Towns Development Project FINAL REPORT Appendix 4, page 1
June 2006
URBAN WATER SUPPLY AND SANITATION SECTOR ANALYSIS
1. INTRODUCTION
1.1 Government Policy for Urban Development The Government of Viet Nam’s (GOV) policy for urban development1 is to provide urban areas with modern infrastructure and a healthy environment, thereby enabling them to contribute actively to the socio-economic development of the country. The policy emphasizes developing urban centers and industrial zones as economic growth centers, developing and modernizing technical and social infrastructure to attract investment and improve living standards, and addressing imbalanced economic development and living standards between the major cities and the provinces. GOV recognizes that improvements in water and sanitation (WSS) services are essential to support continued economic growth and social development, and to address environmental problems associated with increased urbanization, rural to urban migration and expanding industrial and tourism sectors.
1.2 WSS Sector Development Over the past decade, with financial support from international lending agencies and donors, over US$1 billon has been invested in urban water supply and sanitation infrastructure, leading to the development of new water production capacity, and increased coverage of drainage and solid waste management facilities in the major cities and provincial centers. Since 1990, the GOV has also introduced a number of policies and reforms to improve the sustainability of the water, drainage and sanitation sector. These reforms aim to decentralize2 responsibility for water supply and sanitation services to the provinces, increase cost-recovery through user charges, and gradually eliminate central government subsidies. Despite impressive achievements in sector development, serious concerns remain about the capacity of WSS service providers to meet the needs of rapidly growing urban populations and expanding industrial and commercial sectors. While Government’s Enterprise Reform Program aims to transform WSS service providers to commercially-oriented enterprises, the current policy environment and legal framework do not support the development of financially autonomous WSS service providers, nor the sustained participation of the private sector in WSS services. Although Government has developed the basic WSS sector policies and legal framework, the necessary supporting legal documents and mechanisms have been slow to evolve, resources and institutional capacity to implement policy are lacking, and regulations are not effectively enforced in the provinces.
1.3 Classification of Urban Centers Urban areas in Viet Nam comprise centrally administered cities, provincial cities and towns, and district towns. These urban areas are classified by: (i) administrative units, and; (ii) a
1 Orientation Plan for Urban Development to 2020, Ministry of Construction (1998) and Socio-economic Development Plan 2001-2010. 2 The formal legal and administrative basis for decentralization includes the Law on Organization (1994), Ordinance on Concrete Tasks
(1996), Budget Law (1998), and revised Budget Law (2002), which assign functions and resources to subnational governments.

TA 4485- VIE: Central Region Small and Medium Towns Development Project FINAL REPORT Appendix 4, page 2
June 2006
hierarchy of urban classes based on population, percent of labor force in non-agricultural occupations, population density, level of infrastructure, administrative role and position of urban centers within regions. Urban centers are divided into five classes (Table A4-1). In 2001, there were 633 urban centers in the country, including fourteen centrally governed cities, 72 provincial cities and towns, and 547 other urban townships.
1.4 Administrative Structure in Urban Areas Viet Nam’s Constitution (1992) provides for four levels of State Administration, namely: (i) Central Government; (ii) the provinces and the 14 cities (Class 1 and Class 2) under direct administration of Central Government; (iii) provincial government; and (iv) local government. The administrative structure determines how budgetary resources are allocated to the different levels of government. Each level of government receives resource allocations from the immediately higher administrative level. For example, the 61 provinces and centrally administered cities receive revenue allocations directly from central government, while provincial cities and towns receive allocations from the province. This hierarchy of administrative units also provides an informal basis for allocating resources within the same level of government.
Table A4-1. Classification of Urban Centers
Class Type No of
Cities or Towns
Comment
I National centers. Very large cities, which play an important role in national development. Population >1.5 million in case of Special City and >50,000 for Class I City. Average population density >120-150persons/ha.
2 Under Central Government administration. Includes Hanoi and Ho Chi Minh City, which is classified as a Special City.
II Regional centers. Large cities, which play an important role in development of a territory. Population >25,000. Average population density >100 persons/ha.
12 Under provincial administration. Includes Hai Phong, Nam Dinh and Thai Nguyen; Vinh, Hue, Da Nang, Quy Nhon, Nha Trang; Da Lat ; Bien Hoa, Vung Tau; and Can Tho.
III Provincial cities or towns. Large-medium size towns, which play an important role in development of a province or sector in a territory. Population >10,000. Average population density >80 persons/ha.
15 Under provincial administration. Includes Tuy Hoa, Phan Rang-Thap Cham and Phan Thiet.
IV Provincial towns. Small-medium size towns, which play an important role in development of a province. Population >5,000. Average population density >80 persons/ha.
57 Under provincial administration. Includes Cam Ranh and Gia Nghia.
V District towns. Small towns, which play an important role in development of a district. Population>4,000. Average population density >20 persons/ha.
547 Under district administration. Includes Song Cau, Ninh Hoa, Van Gia, Tan Son, Ea T’Ling, Dak Mam, Quang Khe.
Source: Decree No 72/2001/ND-CP. Urban Classification and Level of Urban Management. Provincial capitals are either Class III cities (“Thanh Pho”) or Class IV provincial towns (“Thixa”) and district capitals are Class V small towns (“Thi Tran”). The thirteen shortlisted Project towns include three Class III cities, namely Tuy Hoa, Phan Rang-Thap Cham and Phan Thiet; two Class IV provincial towns, Cam Ranh and Gia Nghia; seven Class V district towns, namely Song Cau, Ninh Hoa, Van Gia, Tan Son, Ea T’Ling, Dak Mam and Quang Khe. The thirteenth “town” is Ca Na, which is currently the center of a commune, which may be upgraded to a Class V district town in future.

TA 4485- VIE: Central Region Small and Medium Towns Development Project FINAL REPORT Appendix 4, page 3
June 2006
2. WSS SECTOR PROFILE
2.1 Water Supply Over the past decade, there have been substantial improvements in provision of urban water supply services. Much of the US$1 bilion in official development assistance (ODA) has focused on developing new water production and distribution facilities, and there are now about 200 water treatment plants operating throughout the country. Production capacity increased from an estimated 1.95 million m3/day in 1990 to 2.7 million m3/day in 2000 and most provincial centers and about 40 district towns have benefited from ODA. The sector has been expanding at a rapid rate since 1997, and over 50 percent of the country’s distribution network has been constructed within the past eight years.
Despite these achievements, overall urban water supply coverage of the country remains low at 50 percent3, ranging from 67 percent in the larger cities to about 11 percent in the smaller towns, well below Government’s sector target of ensuring that 100 percent of the urban population has access to clean water by 2020. Low coverage is exacerbated by overinvestment in production capacity, which exceeds the capacity of the distribution network. Water supply companies are operating at 78 percent of production capacity in the large cities and towns, while in smaller towns the level is close to 60 percent (Table A4-2).
Table A4-2. Urban Water Supply Service Coverage
Category of Town Class I Class II Class III Class IV Class V
Water Supply Coverage percent
67 58 31 32 11
Source: Benchmarking the Urban Water Sector Viet Nam. Volume 1: Main Report. The World Bank, Hanoi, June 2002. Financial performance of the water sector is inadequate, given the low level of tariff relative to incomes, and the need for substantial investment to expand coverage. Most water supply companies recover at least operation and maintenance costs, with an average working ratio close to 0.7. However, few if any companies achieve full cost recovery, based on properly calculated depreciation levels. The average collection period (less than 30 days) and metering practices (95 percent) are very good. However, much of the distribution system is in poor condition; low water tariffs and lack of accountability have provided little incentive to maintain the distribution network, resulting in high UFW losses. However, a concerted program has succeeded in reducing UFW from 38.5 percent in 2000 down to 34 percent in 2004. So far, ten water supply companies have NRW of less than 20 percent. Many small water supply systems provide intermittent supply, averaging 17 hours of service per day.
2.2 Drainage and Wastewater External assistance for the water and sanitation sector over the past decade has focused on water supply. Fifty-nine cities and provincial towns in the 61 provinces of the country have received external funding for water supply, but investment in drainage, sanitation and solid waste improvements in provincial towns and district towns has been relatively small. To date, expansion and rehabilitation of the drainage and sanitation in provincial and district towns has relied primarily on allocation of limited budgets from central or local governments and some ODA funds for drainage and sanitation to complement water supply development. To date, most investment in the drainage and wastewater subsector has focused on developing drainage infrastructure to reduce flooding in the major cities. As a result, the drainage and sanitation systems in the provincial and district towns are incomplete. GOV 3 Regional Assessment Survey and Workshop on Full Cost Recovery for Water Utilities in Southeast Asia: Sharing International
Experience and Best Practices. USAID, SEAWUN, US-AEP and OECD. 2005.

TA 4485- VIE: Central Region Small and Medium Towns Development Project FINAL REPORT Appendix 4, page 4
June 2006
and international agencies recognize this problem and are now providing additional investment funds for development of drainage, wastewater, and sanitation in provincial towns4. Most urban areas in Viet Nam have "combined" drainage systems, which carry wastewater and storm water in common conduits and discharge them to rivers or other watercourses. Coverage of the drainage systems in urban areas is very low, ranging from less than 0.1m/capita in district towns to around 0.2-0.4 m/capita in the major cities and provincial capitals, well below the drainage coverage of 1.0-2.5m/capita found in more developed Asian cities. In provincial and district towns, drains are usually limited to the highways and main roads. The combined drainage systems in most urban areas throughout the country are inadequate. Coverage of drains is low and where drains exist, they are generally in poor condition or incomplete as a result of lack of maintenance, lack of investment, ad hoc development and poor design and construction standards. Silted or inadequate drains overflow during storms, spreading excreta and garbage over the ground5. On average, about 75 percent of households in provincial towns and 25-50 percent in district towns have septic tanks, but only a small portion of these is connected to sewers or drains. Some households lack basic toilet facilities and use open ground, local drains, and watercourses for disposal of excreta and wastewater. In many urban areas, septic tanks provide only partial treatment of wastewater, because they are not constructed to suitable standards and are not emptied on a regular basis. As a result, septic tank effluent or seepage pollutes surface water and groundwater in populated areas. Several of the major cities have wastewater treatment systems that provide partial treatment of wastewater from central areas. Around 75 industrial and processing zones generate about 500-700,000 cu m per day of wastewater while an additional 200-300,000 cu m per day is discharged by enterprises outside these zones. However, 75-80 percent of industrial wastewater is untreated; the remainder is treated, but only 2-3 percent meets international environmental standards.6 Only a few provincial centers have municipal wastewater treatment plants, which cover only part of the city/town area e.g. Da Nang and Buon Ma Thuot. In most cities, towns and small towns, untreated sewage and industrial wastewater is discharged directly into water bodies and streams in urban areas or adjacent areas, posing high risks to public health and aquatic ecosystems.
2.3 Solid Waste Management Throughout Viet Nam, about 15 million tonnes of solid waste is generated each year, with municipal waste accounting for 80 percent and industrial waste nearly 20 percent, including about 1 percent of hazardous waste. Urban solid waste makes up about 50 percent of all household waste. Within the next ten year, the urban population is expected to double, leading to a 50 percent increase in the national total solid waste to 22 million tonnes/year.
Impressive progress has been made with collection of waste from urban areas, with about 75 percent collected and the rate is continuing to increase. Collection coverage ranges from 70-90 percent in large provincial and district centers to 0-30 percent in small towns. However, solid waste is threatening the environment, despite some improvement in waste treatment. Of the country’s total of about 100 dumps and landfills, only 20 percent are of
4 For example, ADB’s Central Region Urban Environmental Improvement Project, scheduled for 2006-2010, will expand and improve
drainage, wastewater and solid waste management systems in six Central Region towns. 5 Central Region Urban Environmental Improvement Project Feasibility Study. GHD Pty Ltd. 2003. 6 Industrial Wastewater Training Course Held. Viet Nam News. Environment. February 22, 2006.

TA 4485- VIE: Central Region Small and Medium Towns Development Project FINAL REPORT Appendix 4, page 5
June 2006
adequate sanitary quality. The rest cause environmental pollution and are a threat to people’s health and to surface and groundwater systems. Hazardous waste incineration systems are lacking, and hazardous wastes generated by industry are usually disposed of with other general wastes. There is better incineration capacity for hospital waste, with sanitary treatment facilities in 32 provinces. Reuse and recycling are common in Viet Nam and mainly carried out by households. The high proportion of organic waste in municipal waste gives it good potential for production of organic fertilizer. There are many examples of good practices, but they have not yet spread widely7. 3. WSS SECTOR POLICY Since 1990, the GOV has introduced a number of policies and reforms to improve the sustainability of the urban water and sanitation sector. Government sector policy and strategy are set out in three separate Orientation Plans for urban water supply, drainage and solid waste management, approved by the Prime Minister in 1998 and 1999. Key objectives of the Orientation Plan for Urban Water Supply Development to 2020, Decision No.63/1998/QD-TTg, are to: (i) rapidly increase water supply coverage in urban areas to 80-90 percent by 2010 and, where feasible, to 100 percent by 2020; (ii) achieve greater commercialization of the water sector; (iii) modernize water technology and equipment; (iv) improve protection of water resources and the environment; (vi) develop human resources in the water industry; (vii) mobilize all sectors of the economy and community to contribute to develop and improve water supply services, and; (viii) increase cost-recovery through user charges, and gradually eliminate government subsidies. The Orientation Plan for Urban Drainage to 2020, Decision No 35/1999/QD/TTg, proposes that drainage and wastewater systems will be improved step-by-step. The key objectives are to: (i) reduce flooding in urban areas; (ii) rehabilitate existing networks and facilities; (iii) expand drainage coverage to 80-90 percent by 2020; (iv) eliminate pit latrines in urban areas; (v) introduce wastewater treatment as resources permit; (vi) promote market oriented approaches to service provision; (vii) develop through public education a better awareness of the impact of sanitation on public health, environmental sustainability and economic development, and; (viii) gradually replace subsidies with user charges for drainage services. The objectives of the National Urban and Industrial Zones Solid Waste Management Strategy to year 2020, Decision No: 152/1999/QD-TTg, are to: (i) close uncontrolled dumps and replace them with engineered or sanitary landfills; (ii) increase solid waste collection step-by-step in urban and industrial areas to 80-95 percent coverage by 2020, and; (iii) strengthen institutions and the legal framework for solid waste management; (iv) completing the legal framework to complement the Law on Environmental Protection (EPL); (v) promoting awareness and strengthening training in solid waste management and environmental protection; (vi) reforming cost recovery systems to ensure that fees charged to organizations and households are sufficient to cover O&M costs; (vii) encourage cleaner production; reuse and recycling; corporatization and private sector participation in solid waste management; (viii) provide appropriate wages and conditions for waste workers and private sector, and; (ix) propose reasonable penalties and rewards for violation of the EPL. 4. SECTOR REGULATION The existence of a sound regulatory framework is an essential part of a sustainable WSS sector designed to support commercially viable service providers and to attract private sector investment. Regulation is necessary because WSS services for any consumer are provided 7 Viet Nam Environment Monitor 2004. Solid Waste. World Bank, MONRE and CIDA.

TA 4485- VIE: Central Region Small and Medium Towns Development Project FINAL REPORT Appendix 4, page 6
June 2006
by one company, without little or no competition. If WSS service providers are not financially viable, it will be difficult to attract private participation to the sector and, more generally, to fund the investments needed to extend coverage (and it is mainly the poor who currently lack coverage). User prices below cost recovery thus call for a subsidy from either central or local government. The role of regulation is to ensure that tariffs and charges are set at levels that are fair and efficient, that service levels are adequate, that lower income groups have access to the services, and that consumers rights are protected. Annex 2 lists the main documents relating to regulation of the WSS sector. In Viet Nam, government bodies or the WSS service providers themselves provide the regulatory functions relating to tariffs, service quality, water and wastewater quality, environmental standards and licensing. The Viet Nam Water Supply Association8 also plays a key role in advising Government on institutional and policy reform in the WSS sector, providing regulatory oversight and benchmarking WSS service providers. The adoption of sound regulatory frameworks, facilitating cost recovery and promoting competition, could also help attract private participation in infrastructure and improve the efficiency and sustainability of the water sector. Facilitating the private sector is not only about mobilizing private finance, but also about fostering competition, bringing in better business practices and increasing the customer focus of infrastructure services. There have been some promising initiatives in terms of increasing competition among suppliers, but most business participants are still State Owned Enterprises (SOEs). The owner of the WSS infrastructure (the public sector) has an enormous advantage over potential entrants, and can abuse its monopoly power. Substantial fixed costs are associated with WSS infrastructure development, and recovering those costs through user charges could make infrastructure services more expensive than is socially or politically desirable. Ideally, user fees should equal the cost of providing the service, and this cost is very low once the infrastructure investments have been made. 5. SECTOR INSTITUTIONS
5.1 General During the past 10-15 years, there has been a marked shift in Viet Nam from a centrally planned economy to a more market-based economy with increased decentralization. The country’s decentralization is part of a gradual process of market and public sector reform which has taken place since the mid-1990s. Nevertheless, sector responsibilities for urban services and urban management involve central, provincial and local government agencies. The Central Government agencies are mainly responsible for policymaking, regulations, standards, sector planning, and coordinating ODA.
5.2 Central Government “The Ministry of Construction (MOC) is mainly responsible for (i) urban and rural planning and policies; (ii) construction standards, rules and regulations; (iii) technical and financial guidelines for evaluating construction projects and for managing urban infrastructure; (iv) research and education for urban infrastructure; and (v) human resource development for urban infrastructure investment and maintenance. MOC is also involved in monitoring and administering major urban development projects. Other key organizations related to the sector include the (i) Ministry of Planning and Investment, which is responsible for advising the Government on investment planning and the utilization of externally funded assistance 8 The Viet Nam Water Supply Association is an NGO which is funded by contributions from its member water supply companies, private
water companies and consultants and international agencies.

TA 4485- VIE: Central Region Small and Medium Towns Development Project FINAL REPORT Appendix 4, page 7
June 2006
and direct foreign investment; (ii) Ministry of Finance (MOF), which prepares and administers the budget and is responsible for the disbursement of externally funded projects; (iii) Ministry of Natural Resources and Environment (MONRE) which is responsible for environmental protection, as well as coordination and state management function for solid waste; (iv) Ministry of Health, which is responsible for promoting environmental health education and for water quality testing, and; (v) Viet Nam Women’s Union (VWU), which is a Government-funded mass organization with central, provincial, and district level offices, and plays a major role in community mobilization and health education.”9
5.3 Provincial and Municipal Governments At the provincial level, the provincial people’s committee exercises executive authority over all provincial functions. The line ministries have their corresponding departments in the structure of the provincial government. Provincial governments (PPCs) are responsible for urban WSS services in the provinces, and, in the past, have assigned the state management function for urban infrastructure and services to the provincial department of construction (DOC) or to people’s committees at lower levels. People’s committees at city, district or town levels are responsible for administering cities, districts or towns. The city, district or town people’s committees (CPC, DPC or TPC) are each supported by various professional units (divisions, offices or companies), which assist the PC to carry out its state management functions, providing continuity in administration and management from the central to community level. The divisions or companies operate under the direction and management of the PC with regard to staffing, organization and performance.
5.4 WSS Service Providers
5.4.1 Water Supply The PPC in each province has set up provincial water supply companies to provide urban water supply services to provincial capitals and large urban centers in the provinces; many of them are also responsible for drainage and wastewater services. Companies under provincial, city, district or town administration provide water supply services to provincial towns and district towns. The main function of the water supply companies is to manage the provision, operation, and maintenance of piped water supply, including billing customers and collecting revenue. However, many water supply companies are involved in a range of other activities to meet local needs or supplement company income, including: drainage system operation (26 percent of companies); consulting services such as project preparation and design (41 percent); water supply constriction (73 percent); trading of water supply equipment and material (39 percent), and manufacture of water equipment and materials (5 percent). Twenty-four percent of water supply companies in the North, 6 percent in the Central Region, and 30 percent in the South perform work (mainly in construction and equipment trading) outside their province.10 Although the companies charge for water supply services supplies, tariffs are set below full cost recovery levels, and the companies rely on the PPC for direct or indirect subsidies from PPC budgets for their operations, and investment capital from PPCs for system expansion. In the past, these companies were all State Owned Enterprises, operating under the administration of DOC, but they are now being transformed under the Government’s Reform Program which aims to corporatize and equitize these companies, and in the process, separate them from state administration. 9 ADB 2003. Central Region Urban Environmental Improvement. Report and Recommendation to President. Supplementary Appendix.
Urban Sector Analysis. 10 Benchmarking the Urban Water Sector Viet Nam, World Bank, Hanoi, June 2002.

TA 4485- VIE: Central Region Small and Medium Towns Development Project FINAL REPORT Appendix 4, page 8
June 2006
5.4.2 Drainage, Wastewater and Solid Waste Management
Autonomous drainage and wastewater companies have been established in the major cities of Hanoi, Hai Phong and Da Nang. In the remaining provinces, provincial water supply and drainage companies (WSDC), municipal urban environmental companies or urban pubic works companies (UPWCs) provide drainage and wastewater services in the urban centers. Most of the companies are SOEs under city, district or town administration. In a few provinces, provincial urban environmental companies (URENCOs) have been established by PPCs to provide urban environmental services throughout the province. Many of the URENCOs and UPWCs are also responsible for solid waste management services and other public services in their city, district or town. Private cooperatives and private sector companies also participate in solid waste management activities in provincial and district towns. URENCOs and UPWCs are essentially self-accounting State Owned Enterprises operating in accordance with Decree 56 (1996) and the Law on State Enterprises (LSE) (2003). They lack commercial orientation and rely largely on subsidies from people’s committees to fund operation and maintenance of the drainage, wastewater, solid waste and other public services. They supply public services in compliance with policies, plans, prices, price frames or fees stipulated by the State, and operate mostly on a non-profit basis.
The PPC decision establishing the URENCO or UPWC sets out (i) its registered capital and working capital; (ii) its mode of operation i.e. as an independent self-accounting company with its own legal status, stamp and bank accounts, and; (iii) its functions, which generally include: (a) public sanitation: collection, transport and disposal of solid waste, drainage and wastewater; (b) maintenance of public infrastructure; (c) construction of small and medium urban environmental and sanitation works, and; (d) installation and management of public lighting, parks, funeral and cemetery services. The PPC’s decision establishing URENCOs or UPWCs also assigns administrative responsibility to the relevant PC for supervision of URENCOs. The concerned PC assigns the annual plan for URENCO or UPWC including: (i) the quantity and quality of public services supplied; (ii) the time and place of services delivery; (iii) the unit price and price subsidy for public services, and; (iv) budgets. The PPC guarantees URENCOs or UPWCs financial sustainability in case revenues do not cover reasonable expenditures.
5.4.3 Administrative Arrangements in the Project Provinces
The institutional arrangements for managing WSS services vary widely between provinces. In the Project towns (Table A4-3), WSS service providers include provincial companies that manage water supply, and in some cases, drainage and other municipal services in urban centers of Phu Yen, Ninh Thuan, Binh Thuan and Dak Nong provinces; city level companies that manage drainage, solid waste and other municipal services in Phan Rang-Thap Cham11 and Phan Thiet cities; urban environment companies which are responsible for WSS (including water supply, drainage, solid waste management) and other municipal services throughout Cam Ranh town, Ninh Hoa district and Van Ninh district respectively, and; a private solid waste unit in Song Cau, managed by the TPC. Currently, the majority of WSS service providers in the Project towns are State Owned Enterprises (SOEs), lacking commercial focus and having limited managerial autonomy, or
11 Phan Rang-Thap Cham URENCO does not manage solid waste services which are provided by ward cooperatives and a private
company.

TA 4485- VIE: Central Region Small and Medium Towns Development Project FINAL REPORT Appendix 4, page 9
June 2006
accountability for budgeting and meeting service standards. The requirement for people’s committee approvals extends to most of their key management and operating decisions, including investment decisions, setting tariff levels, determining overall service levels, staff salary and benefit levels, major maintenance expenditures, capital expenditures, and senior staff appointments.
Table A4-3. Existing Management of Urban Services in the Project Towns Existing WSS Service Provider
Province City or Town Class Water Supply Drainage &
Wastewater Solid Waste
Phu Yen Tuy Hoa III WSDC (OMLLC) WSDC URENCO under CPC Song Cau V WSCD None Unit under TPC
Khanh Hoa Cam Ranh IV URENCO (JSC) URENCO (JSC) URENCO (JSC). Cooperatives & private companies
Ninh Hoa V UPWC (JSC) UPWC (JSC) UPWC (JSC) Van Gia UPWC (JSC) UPWC (JSC) UPWC (JSC)
Ninh Thuan Thap Cham III WSC UPWC under CPC Ward cooperatives & private company
Tan Son V WSC None None Ca Na Na WSC None None Binh Thuan Phan Thiet III WSDC UPWC under CPC UPWC under CPC Dak Nong Gia Nghia IV WSD&UPWC None Cooperative and JSC Ea T'ling V WSD&UPWC WSD&UPWC Cooperative Dak Mam V WSD&UPWC WSD&UPWC Cooperative Quang Khe V WSD&UPWC WSD&UPWC None
Notes: CPC = City People’s Committee; DPC = District People’s Committee; JSC = Joint Stock Company; OMLLC = One Member Limited Liability Company; TPC = Town People’s Committee; UPWC = Urban Public Works Company; URENCO = Urban Environmental Company; WSC = Provincial Water Supply Company; WSDC = Provincial Water Supply and Drainage Company; WSDC&UPWC = Provincial Water Supply, Drainage and Urban Public Works Company. However, administrative arrangements for urban WSS in the provinces are gradually changing under Government’s Enterprise Reform Program, which aims to separate WSS service providers from government administration through a process of corporatization and equitization (privatization). Several of the WSS service providers in the Project provinces have already transformed to shareholding companies, separating them from state administration and reducing PC control. By March 2006, four of the WSS service providers in the Project towns had transformed to One Member Limited Liability Companies (OMLLCs) or Joint Stock Companies (JSCs), giving them enhanced business focus and autonomy. Private cooperatives operating in conjunction with private companies12 also participate in solid waste management in several Project towns. Annex 3 provides profiles of the Project’s WSS service providers. 6. SOE REFORM
6.1 Enterprise Law
In 2003, about 110 State Owned Companies reportedly13 operated in the field of urban WSS in 67 provinces and centrally administered cities. These included 32 provincial water supply companies (WSCs), 34 provincial water supply and drainage companies (WSDCs), six
12 The Nam Thanh Environmental Company in Phan Rang-Thap Cham is a Limited Liability Company, 100 percent private, with no capital
share from the State. The solid waste company in Gia Nghia is a real private sector limited liability company, which was transformed from a cooperative; it has no State capital.
13 Dr Pham Viet Muon. National Steering Committee for Enterprise Reform and Development. Renovation of Management of Enterprises Operating the Field of Water Supply and Drainage. October 2003.

TA 4485- VIE: Central Region Small and Medium Towns Development Project FINAL REPORT Appendix 4, page 10
June 2006
drainage companies and 40 municipal urban public works (UPWCs) or urban environmental companies. The administrative level, geographical jurisdiction, functions and capacity of these organizations vary widely. Some of these SOEs have already transformed to One Member Limited Liability Companies or Joint Stock Companies and others plan to do so by the end of 2006. The SEL (2003) removed the classification of SOEs into two types: commercial and public utility14, and defined them as economic entities whose charter capital is fully owned by Government or where Government has controlling shares or capital. SOEs take the form of state owned company, Joint Stock Company or Limited Liability Company.
6.2 State Enterprise Reform Government’s State Enterprise Reform Program, which commenced in 1995, aims to equitize SOEs by converting them gradually to shareholding companies with 49-100 percent private ownership. In November 2005, the National Assembly passed the new (Unified) Enterprise Law under which all SOEs will be gradually converted into limited liability companies (LLCs) or joint stock companies15 by 2010. SOEs in the WSS sector which cannot be equitized in the short term will follow a bridging approach i.e. first, they will be converted from pure SOEs to One Member LLCs (OMLLCs) operating under the (Unified) Enterprise Law, not the SOE law, so that they will be more autonomous in business decision and capital raising and able to provide incentives to management and staff via a more flexible remuneration system based on profit earned (which cannot be achieved under the SOE Law). The bridging approach will be used to gradually reduce the reliance of SOEs on subsidies from the State Budget. After the bridging period, the LLCs (still owned by the State) will be equitized and become JSCs if they are profitable, financially capable and well perceived by the public. The transformation of SOEs is “organized around the ownership transformation process, which involves “equitizing” or divesting some of the state capital to the private sector. Until quite recently, those acquiring the divested capital were mainly workers and directors of the SOEs, making equitization resemble an “insider privatization…Many of the SOE managers gaining control through this process are engineers by training, with a specialization in their particular industry”16. This professional background enables them to master new technology, manage WSS projects and manage production processes, however, they “often lack business education and management skills, which results in poor attention to markets and customers’ needs. Their background also limits the capacity of SOEs to engage in fundamental management change, including the reorganization of work processes and the delegation of decision-making authority.” The WSDC in Phu Yen became an OMLLC in 2005, and the three WSS service providers in Khanh Hoa province are JSCs. The WSC and WSDC in Ninh Thuan and Binh Thuan are expected to transform to OMLLCs in 2006. In Song Cau, a private solid waste management unit under TPC management is responsible for managing solid waste collection, transport
14 Prior to 2003, water supply companies were classed as commercially oriented business enterprises, while URENCOs and UPWCs
were classed as public service utilities. 15 A Joint Stock Company (or shareholding company) is a company in which the charter capital is divided into shares and shareholders
are liable for the debts and other obligations of the company up to the amount of capital they have contributed or are liable to contribute to the company. Limited Liability Companies may be One Member Companies or Companies with Two Members or More (up to 50 members); a member may be an individual or an organization.
16 Viet Nam Development Report. Business 2006. Joint Donor Report to the Viet Nam Consultative Group Meeting, Hanoi. December 2005.

TA 4485- VIE: Central Region Small and Medium Towns Development Project FINAL REPORT Appendix 4, page 11
June 2006
and disposal. All other WSS service providers are “pure” SOEs, and currently do not have firm plans to corporatize. 7. COST RECOVERY In terms of sector financing, the Government’s short-term objective is to reduce subsidies by corporatizing WSS service providers, and increasing cost recovery levels. Over the longer term, the sector is to establish financial mechanisms to ensure the sustainability of the WSS enterprises and systems. Key policy elements are (i) adopting full cost recovery tariffs for water supply; (ii) introducing drainage charges, incorporated into water tariff structures; (iii) applying drainage and solid waste tariffs that are sufficient to cover operation and maintenance costs and gradually increase tariffs to cover capital investment requirements, thus reducing the need for government subsidies. In 1999, MOC issued Guidelines for setting water supply and drainage tariffs; however the guidelines gave no time frame for applying the tariffs, nor a specific method for calculating the level of cost recovery required. As a result, seven years after the release of the MOC guidelines, few provinces in the country apply full cost recovery tariffs for water supply; and few provinces apply drainage charges that meet even basic O&M costs. In 2004, to accelerate cost recovery, Government issued Directive 04/2004 requiring all WSCs to set tariffs based on full and accurate inclusion of all O&M costs, depreciation, debt payment and return on investment. To the end of 2005, about 28 provinces and cities under central administration had issued the decision to calculate water tariffs based on the new method, but the lack of suitable mechanisms for asset valuation and calculating depreciation is a major constraint to full cost recovery and eventual company equitization. Provinces using ODA funding to invest in water supply systems, have not included full depreciation cost and debt service in water tariff calculations because of concerns that the tariffs will not be affordable. While the authority to set WSS tariffs continues to be held by the PPCs, the guidelines provide a framework and methodology for use by the PPCs in establishing these tariffs. In the Project provinces, four provinces (excluding Ninh Thuan) have already adopted the new method for calculating water tariffs. According to the 1999 Guidelines, the drainage charge is to be set at a minimum level of 10 percent of the total water production cost. However, few provinces in the country apply the full drainage fee and rely on additional budget allocations which generally cover only 30-70 percent of O&M costs. Four Project provinces (excluding Dak Nong) currently apply a drainage fee which ranges from about 3 percent to 10 percent17 of the water tariff. Fees for solid waste management in the Project provinces are also set at unsustainable levels and only cover about 50 percent of O&M costs for waste collection, transport and disposal18.
In June 2003, MOF issued Decree No 67 specifying and regulating the use of environmental protection fees for domestic and industrial wastewater discharge. MOF and MONRE are responsible for executing the decree. For domestic wastewater, the environmental protection fee is calculated as a surcharge on water tariff of not more than 10 percent of water tariff. For industrial wastewater, the environmental protection fee is calculated in accordance with each item of pollutant. The revenue derived from the environmental protection fee will be used as follows: (i) the entity that collects the fee will receive a small portion to cover its costs; (ii) the central budget will receive 50 percent (of the remaining part) to complete the
17 Drainage fees are 10 percent of water tariff in Phu Yen and Ninh Thuan and 165 and 100 VND/m3 in Khanh Hoa and Binh Thuan
respectively. The fees are charged throughout the province in areas where piped water is provided. 18 Solid waste charges in the Project towns vary from 3,000 VND/HH/month for small alleys to 5,000-6,000 VND/HH/month along streets,
and 8,000-10,000 VND/HH/month for business HH.

TA 4485- VIE: Central Region Small and Medium Towns Development Project FINAL REPORT Appendix 4, page 12
June 2006
operation of the Viet Nam Environmental Protection Fund; (iii) local budgets will receive the other 50 percent to serve environmental protection, new investment, pipe/channel dredging, and maintenance of local sewerage/drainage systems. The decree gives tax agencies the responsibility for While the environment protection fee was intended to be an additional wastewater charge to pay for environment protection, some governments have assumed that it replaces the drainage charge that was previously collected for purposes of funding O&M of the drainage system. Inter-Ministerial Circular 125/2003 confirmed that Decree 67 replaces set out in MOC Circular No 3, and effectively the drainage fee has been reduced from a minimum of 10 percent of the water production cost to a maximum of 5 percent of the water tariff, representing a backward step for financial sustainability of the drainage and wastewater subsector.
A clear legal framework for drainage and wastewater charges is essential for sustainability of the subsector, but the introduction of the environment protection fee through Decree 67 without a clear and realistic mechanism for recovering drainage and wastewater costs is bound to cause further confusion at the provincial and local government levels. 8. THE PRIVATE SECTOR IN WSS In the past, Government has encouraged a relatively modest amount of foreign private sector participation in the WSS sector, which has focused on Build Operate and Transfer (BOT) projects. In December 1992, the Government amended the Law on Foreign Investment to allow for foreign investors to undertake BOT construction projects, and subsequently supporting regulations were enacted by Government Decree. More recently, the Unified Enterprise Law (November 2005) was enacted to replace the Enterprise Law 1999, the Law on State Owned Enterprises 2003 (which will apply to remaining SOEs until 2010), and certain provisions on organization and operation of enterprises contained in the law on Foreign Investment (1996). The new Enterprise Law (2005) provides for establishment of limited liability companies, joint stock companies, partnerships and private enterprises in all economic sectors, including enterprise established by foreign parties. In future, foreign investors will be treated equally to domestic investors in terms of enterprise establishment. To date, there have been only a few foreign investments in infrastructure in Viet Nam, which include the 100,000 m3/day Binh An Water Treatment Plant, and several BOT projects in the power and road sectors. Several other foreign invested BOT water supply projects have been considered in Ho Chi Minh City and Hanoi but have failed. Potential foreign investors have been discouraged by long lead times for negotiations (typically 2-3 years), difficulty and uncertainty with land acquisition, excessive bureaucracy, and the lack of a clear, transparent regulatory and legal framework. Concerns regarding the problems experienced on the early BOT projects have led government and water supply and drainage companies throughout Viet Nam to assume a generally negative position on the foreign-invested BOT model. Currently there is no foreign private sector involvement in water supply distribution and considerable resistance exists to involving private operators in this field. Low tariffs make private sector participation (PSP) in the WSS sector unattractive. Clearly, no private provider would be interested in delivering services below their cost. Maximum tariffs are set by the State Price Committee and typically cover operating expenses only, not maintenance or investment costs. Apart from the early BOT projects, PSP in the WSS sectors remains limited.

TA 4485- VIE: Central Region Small and Medium Towns Development Project FINAL REPORT Appendix 4, page 13
June 2006
Local private enterprises have also started to participate in provision of infrastructure services. Examples include a small water supply project on the Da River in Tien Giang, solid waste management in Lang Son and Bac Giang towns, solid waste management and wastewater management in some urban and industrial zone, and some water supply schemes in small towns. However, local private sector participation has been limited because local private investors lack capital and have low ability to raise loans. The contracting out of urban solid waste services could also be used to increase efficiency and promote an emerging private sector in poor areas. In the Project towns, private cooperatives and private solid waste contractors involved in solid waste collection, transport and disposal in Cam Ranh, Phan Rang-Thap Cham and in several towns of Dak Nong province. Private contractors also participate in septic tank desludging, vehicle repair and maintenance for WSS service providers, water carting, and supply of materials for construction projects in the Project towns. While public procurement has become increasingly transparent in Viet Nam, SOEs continue to dominate WSS infrastructure contracts, as relatively few private enterprises operate in large-scale construction activities. SOEs are increasingly competing with each other, and bidding for projects away from their own provinces. But reliance on standard cost norms, and occasional outright collusion, reduce the efficiency of public markets. 9. MANAGING URBAN WSS SERVICES
9.1 Management Models for Urban Services The institutional arrangements for managing WSS services vary widely between provinces, depending on historical, geographical, political and other factors. For example, five different management models apply in the five Project provinces. Table A4-4 lists and evaluates various alternative management models for urban WSS services. In general, no single management model is emerging as a standard for the sector, and in the short to medium term, people’s committees will continue to select the model that they perceive to best suit local conditions. In the long term, the WSS sector will be shaped by Government’s vision for the corporate sector, namely that, in future, governments at various levels will no longer administer or intervene in WSS companies but will only monitor them by Law. As companies are corporatized and subsequently equitized, market forces and economies of scale will be major factors in determining how the WSS sector will develop.
Table A4-4. Alternative Management Models
Model Description Advantages/Disadvantages Comments
Location: Provincial Capitals A. Provincial WSC
responsible for water supply. City URENCO responsible for drainage, wastewater, sanitation, solid waste and other municipal services.
Advantages: WSC has clear focus and high potential for profitability, autonomy, cost recovery and equitization. Disadvantages: URENCO lacks focus and has wide responsibilities for drainage, wastewater, solid waste management and municipal services, all of which require Government subsidies in the medium to long term. The company has low potential for cost recovery and profitability, and few economies of scale or synergies are available between the various functions. It would be difficult for the company to introduce performance-based remuneration system, improve service levels or become a business enterprise in the medium term.
This is similar to the management model in Ninh Thuan province. There are few synergies between drainage and solid waste services and no compelling reason for combining these two functions in one company, i.e. URENCO.

TA 4485- VIE: Central Region Small and Medium Towns Development Project FINAL REPORT Appendix 4, page 14
June 2006
Model Description Advantages/Disadvantages Comments B. Provincial WSDC
responsible for water supply, drainage, wastewater. City URENCO responsible for solid waste, sanitation and other municipal services.
Advantages: Overall economies of scale and lower overall costs in water supply, drainage, and wastewater functions with regard enterprise management, accounting, planning, engineering, construction, billing, O&M, and staff training. WSDC has medium to high potential for profitability, autonomy, cost recovery and equitization. Compared to Model A, the URENCO has narrower management focus and could concentrate on solid waste management, which has good potential for cost recovery. Disadvantages: Combines water supply which has a high potential for full cost recovery and profitability, with drainage and wastewater which has low potential for cost recovery, relying on government subsidy for some years to come. The combination of water supply and subsidized drainage in a single entity could adversely affect company autonomy, and delay company equitization.
This model takes advantage of the synergies that exist between water supply, drainage and wastewater services, which allow economies of scale. The potential disadvantage mentioned could be overcome if water and drainage services are separately accounted and the drainage services are provided through service contracts between the WSDC and PPC, based on MOC guidelines that stipulate work norms, required service standards and performance indicators.
Location: Provincial Towns and District Towns C. Provincial WSC
responsible for water supply, (and, in some cases, drainage) in the towns through branch offices. Small companies, cooperatives, units or work groups under the town people’s committee responsible for managing (drainage,) solid waste and other municipal services in the town.
Advantages: Overall economies of scale and lower overall costs in water supply, (drainage, and wastewater functions) with regard enterprise management, accounting, planning, engineering, construction, billing, O&M, and staff training. WSDC has medium to high potential for profitability, autonomy, cost recovery and equitization, more efficient services and higher service levels and lower tariffs. WSC can apply higher management capacity and more modern technology to urban centers than is possible if separate company is established in the town or district. Disadvantages: The WSC operates as monopoly water provider in the province, with little incentive to minimize costs and maximize efficiency. WSC may be less responsive to local needs and demands than a local company. The WSC decides when or if water supply services are developed or improved in the district town, and urgent needs may remain unmet. The WSC may be reluctant to take over the town’s water services if it perceives that it cannot operate profitably or if water facilities in the town are of unsatisfactory standard.
This is similar to the management model in Phu Yen and Binh Thuan provinces. Eventually, parts of the small companies, cooperatives or units in the towns or districts may be upgraded to LLCs and, when profitable, subsequently equitized or taken over by WSC, URENCO or private companies operating though “mother and daughter company” or head office and branch office arrangements.
D. URENCOs or UPWCs responsible for all urban WSS services and other municipal services in the town or district.
Advantages: Local companies are likely to be responsive to local needs and demands. Disadvantages: Lacks economies of scale. Management capacity and technology may be limited because of scale to urban centers than is possible if separate company is established in the town or district. The URENCO or UPWC has wide responsibilities for all urban WSS and municipal services. Combines water supply which has a high potential for full cost recovery
This is similar to the management models in: Cam Ranh, Ninh Hoa and Van Ninh, where the three local companies are Joint Stock Companies, and Tuy Phong district in Binh Thuan province, where the UPWC is a pure SOE. Eventually, parts of the small companies, cooperatives or

TA 4485- VIE: Central Region Small and Medium Towns Development Project FINAL REPORT Appendix 4, page 15
June 2006
Model Description Advantages/Disadvantages Comments and profitability, with drainage and other municipal services which have low or no potential for cost recovery. The combination of water supply and subsidized drainage and there municipal services in a single entity could adversely affect company autonomy, and delay company equitization.
units in the towns or districts may be upgraded to LLCs and, when profitable, subsequently equitized or taken over by provincial WSC, URENCO or private companies operating though “mother and daughter company” or head office and branch office arrangements.
Location: Region E. Establish WSC,
URENCO or other WSS authority with regional coverage i.e. basin-wide water catchment or drainage area which covers two or more towns, to coordinate total catchment management.
Advantages: Potentially enables greater economies of scale and efficiency in water supply development and urban drainage, wastewater and flood management. This is already the basic geographical an administrative unit for water resources management planning. Disadvantages: Potential administrative difficulties where regional or natural boundaries are not consistent with provincial boundaries. Not substantially different from provincial ownership of WSS companies.
Models for Solid Waste Management F. URENCO or UPWC
in city, town or district responsible for solid waste collection, transport and disposal
Advantages: One enterprise responsible for entire solid waste cycle. Disadvantages: The company has low potential for cost recovery and profitability in medium term, and few economies of scale are available between waste collection, transport and disposal functions. Collection coverage is based on URENCO perception of demand for services. Continued reliance on Government subsidy and lack of competition in solid waste services may result in low efficiency and high cost services. Low participation of communities in solid waste collection has potentially adverse impact on coverage and low willingness to pay for waste services.
G. Ward, commune or residential group cooperatives responsible for collection, private sector company responsible for transport and disposal
Advantages: Minimizes state management function and mobilizes the resources of private citizens and private companies Peer pressure at community level maximizes collection coverage and ensures high revenue collection efficiency. Revenues can be progressively increased to cover part of transport and disposal costs. The service is demand driven. Contract for solid waste transport and disposal is based on competitive bidding. Proprietary technology for recycling can be applied to solid waste treatment and is TPC subsidy is clearly identified. Disadvantages: Private company selects the solid waste collection areas to minimize its costs and may exclude the poor.
This is similar to the management model in Phan Rang-Thap Cham, whereby ward cooperatives collect the waste and gather revenue from HH, (which used for wages, uniforms and equipment) and TPC pays the private sector o transport and dispose of solid waste a fixed rate/tonne, based on weighbridge measure at landfill. The service contract between TPC and private company should ensure that poor areas are covered.

TA 4485- VIE: Central Region Small and Medium Towns Development Project FINAL REPORT Appendix 4, page 16
June 2006
9.2 Preferred Model for Managing Solid Waste Currently, the Project towns manage solid waste by various methods. These include: collection, transport and disposal by URENCO or UPWC; collection by cooperatives, transport by private company, and treatment/disposal by private company, and; a mix of these two methods. The solid waste management model used in Phan Rang-Thap Cham is recommended for consideration by all of the Project towns. The model involves: (a) solid waste collection and revenue collection by ward cooperatives, and; (b) waste transport and disposal by private company, under service contract to the TPC, based on an agreed price/tonne of waste disposed. This model has several advantages over centralized management, O&M of all solid waste activities by a URENCO or UPWC, including:
• Mobilizing community participation in solid waste collection to maximize collection coverage and revenue collection through community pride and peer pressure;
• Avoiding job losses for employees of existing cooperatives and private companies (that operate in several of the towns) if all SW activities are taken over by the URENCO or UPWC;
• Introducing competition (bidding between private companies) for waste transport and landfill management activities;
• Clearly identifying government subsidies; • Providing increased opportunity for use of private sector proprietary technology for
solid waste treatment, recycling and disposal, with potential cost savings and reduction in land area requirements for waste disposal, and;
• Using the management expertise and resources of the private sector, rather than establishing and building up new solid waste organizations in remote areas where it is difficult to recruit and retain qualified personnel.
Under this model, the Project could procure handcarts and trucks for solid waste management which for leaseback to the cooperatives and private companies. Where URENCOs or UPWCs already provide solid waste services in a town or district, these companies could continue to operate alongside the private sector companies. The use of private cooperatives to collect solid waste is common throughout Viet Nam; there are few if any advantages to be gained by centralizing this function, because of limited economies of scale in waste collection activities. 9.3 Recommended Management Arrangements for Project WSS Service
Providers Table A4-5 below describes the existing status of the various WSS service providers and presents the Consultant’s proposed institutional arrangements for managing the WSS infrastructure created by the Project. The arrangements will need to be reviewed by the Project PPCs and revised to incorporate their comments. The arrangements are summarized as follows. It is proposed that:
• In Phu Yen, the WSDC will manage drainage and wastewater in Tuy Hoa City and drainage in Song Cau through its existing branch office. In Song Cau, cooperatives and private companies will undertake solid waste collection, transport and landfill operation;
• The Cam Ranh URENCO will continue to manage all urban services in Cam Ranh town, together with solid waste cooperatives and private companies for solid waste collection, transport and landfill operation. The UPWCs in Ninh Hoa and Van Ninh

TA 4485- VIE: Central Region Small and Medium Towns Development Project FINAL REPORT Appendix 4, page 17
June 2006
will continue to operate all urban services throughout the two districts, with private sector operation of the new regional landfill;
• Ninh Thuan WSC will manage water supply in Tan Son and Ca Na through its branch offices, and the Phan Rang-Thap Cham will manage drainage and wastewater in Thap Cham;
• In Phan Thiet, the Binh Thuan WSD will take over Phan Thiet City’s drainage assets and drainage staff, and will manage the drainage and wastewater facilities constructed by the Project;
• The Dak Nong WSD&UPWC will manage the water supply, drainage and wastewater in Gia Nghia, and water supply and drainage in the other three Project towns in Dak Nong province. In Gia Nghia, cooperatives and private companies will be contracted to undertake solid waste collection, transport and landfill operation, under supervision of the WSDC&UPWC.
• Except in Song Cau, all Project WSS service providers will transform to OMLLCs or JSCs by 2010, with increased business focus and autonomy, and independence from state administration. They will enter into service contracts for provision of WSS services with the concerned TPCs.
10. INSTITUTIONAL AND POLICY REFORMS
Appendix 5 presents the proposed agenda for policy and institutional reforms to support sector sustainability and enhance the capacities of WSS service providers to manage, operate and maintain the completed Project facilities.
Table A4-5. Existing and Proposed Management of Urban WSS Services in the
Project Provinces
Province Existing Entity and Status Existing Function Future Entity
and Status Recommendations for Future Management, O&M of Project
Facilities Phu Yen Phu Yen WSCD.
(OMLLC since December 2005).
Manages water supply in Tuy Hoa City and in nine towns of Phu Yen province through branch offices (including Song Cau). Manages drainage in Tuy Hoa City.
No change in short-medium term. WSDC may be equitized in future.
WSDC to manage expanded drainage and wastewater systems in Tuy Hoa City and new drainage system in Song Cau through branch office; and enter into service contracts for drainage (and wastewater) management with Tuy Hoa CPC and Song Cau TPC.
Song Cau – private solid waste unit under TPC management
Undertakes solid waste collection, transport and disposal in Song Cau town.
Upgrade SW unit to (private) cooperative.
TPC to engage private cooperatives to undertake expanded SW collection; and enter into contracts with private company or cooperative to undertake waste transport and landfill operation. TPC to lease back SW equipment (procured through Project) to cooperatives or private company.
Khanh Hoa
Cam Ranh URENCO (JSC since late 2005)
Manages water supply, drainage, solid waste and other municipal services such as lighting, parks and gardens, cemetery and funeral services in Cam Ranh town. Private cooperatives collect solid waste in two wards, and private companies transport that waste to dump site.
No change in short-medium term. URENCO may be further equitized in future.
URENCO to manage expanded drainage, wastewater and solid waste systems in Cam Ranh town and; enter into service contracts with Cam Ranh TPC. Cooperatives and private companies continue to collect and transport solid waste, together with URENCO. Recommended private company operation of landfill, possibly using of proprietary technology for waste treatment and recycling.

TA 4485- VIE: Central Region Small and Medium Towns Development Project FINAL REPORT Appendix 4, page 18
June 2006
Province Existing Entity and Status Existing Function Future Entity
and Status Recommendations for Future Management, O&M of Project
Facilities Ninh Hoa UPWC
(JSC since early 2005)
Manages water supply, drainage, solid waste and other municipal services such as lighting, parks and gardens, cemetery and funeral services in Ninh Hoa town and throughout Ninh Hoa district.
No change in short-medium term. UPWC may be further equitized in future.
UPWC to continue to manage expanded water supply and solid waste systems. SW from Ninh Hoa will be transported to regional landfill in Van Ninh district for disposal.
Van Ninh UPWC (JSC since early 2005)
Manages water supply, drainage, solid waste and other municipal services such as lighting, parks and gardens, cemetery and funeral services in Van Gia town and throughout Van Ninh district.
No change in short-medium term. UPWC may be further equitized in future.
UPWC to continue to manage expanded water supply and solid waste systems. A regional landfill will be developed in Van Ninh district. Recommended private company operation of landfill, possibly using of proprietary technology for waste treatment and recycling. Van Ninh DPC will enter into contract with Ninh Hoa DPC and private company for joint landfill.
Ninh Thuan
Ninh Thuan WSC (State owned company under DOC administration)
Manages water supply in Phan Rang-Thap Cham City and in several district towns of Ninh Thuan province through branch offices (including Tan Son).
WSC expected to transform to OMLLC in 2006. May be equitized in future.
WSC to manage water supply in Tan Son and Ca Na through branch offices; and enter into service contracts for water supply management with Tan Son TPC and Ninh Phuoc DPC. (or future Ca Na TPC).
Phan Rang - Thap Cham UPWC (State owned company under City PC administration)
Manages drainage, sanitation and other municipal services such as lighting, parks and gardens, cemetery and funeral services in PR-TC City.
UPWC expected to transform to OMLLC in medium term. It may be equitized in future.
UPWC to manage drainage and wastewater in Phan Rang-Thap Cham City, and; enter into service contract for drainage and wastewater management with Phan Rang-Thap Cham CPC.
Binh Thuan
Binh Thuan WSDC (State owned company under DOC administration).
Manages water supply in Phan Thiet City and in several district towns of Binh Thuan province through branch offices (including La Gi, Cho Lau)
WSDC expected to transform to OMLLC in 2006 (Currently awaiting confirmation). It may be equitized in future.
WSDC to expand its functions to include managing drainage and wastewater in Phan Thiet City. WSDC to take over City UPWC’s drainage assets, drainage staff and equipment, and; enter into service contract for drainage and wastewater management with Phan Thiet CPC.
Phan Thiet UPWC (State owned company under City PC administration)
Manages drainage, solid waste, sanitation and other municipal services such as lighting, parks and gardens, cemetery and funeral in City
No plans for UPWC to transform to OMLLC.
Transfer drainage assets, drainage staff and resources to WSDC.
Dak Nong Dak Nong WSDC&UPWC (State owned company under DOC administration).
Manages water supply in Gia Nghia town only at present. Responsible for managing all urban services in province, including WSS services and other municipal services. Cooperatives collect solid waste in Gia Nghia and other small
No plans for WSD&UPWC to transform to OMLLC.
WSDC&UPWC to manage water supply, drainage, wastewater and solid waste in Gia Nghia, and water supply and drainage in Ea T’Ling, Dak Mam and Quang Khe through branch offices; an enter into service contracts with the concerned TPCs. Recommended that cooperatives and private companies to continue and expand

TA 4485- VIE: Central Region Small and Medium Towns Development Project FINAL REPORT Appendix 4, page 19
June 2006
Province Existing Entity and Status Existing Function Future Entity
and Status Recommendations for Future Management, O&M of Project
Facilities towns; private companies or cooperatives transport waste to dump sites.
solid waste collection and transport in Gia Nghia, and private company operation of landfill, possibly using of proprietary technology for waste treatment and recycling.

TA 4485- VIE: Central Region Small and Medium Towns Development Project FINAL REPORT Appendix 4, page 20
June 2006
Table A4-6. Documents Related to WSS Regulatory Framework in Viet Nam Sub-sector Related Level Focus Type of Regulation
No. Description Issued by Date Documents Codes
Wat
er S
uppl
y
Drain
age
Was
tewa
ter
Sani
tatio
n
Solid
Was
te
NA/G
oV./P
M
Mini
stry
PPC
Urba
n
Small
Tow
ns
SOE
Refo
rm
Law
Ordi
nanc
e
Decr
ee/D
ecisi
on
Circ
ular
Polic
y
Regu
latio
n
Stra
tegy
1 Decree on Urban Classification and Level of Urban Management. GoV 5-Oct-01 72/2001/ND-CP ● ● ● ●
2 Prime Minister Decision Ratifying the Orientation Plan for Urban Development to 2020. PM 23-Jan-98 10/1998/QD-TTg ● ● ● ● ● ●
3 Prime Minister Decision Ratifying the Orientation for the Development of National Urban Water Supply Systems to 2020.
PM 18-Mar-98 63/1998/QD-TTg ● ● ● ● ● ● ●
4 Prime Minister Decision Ratifying the Orientation for the Development of National Urban Drainage to 2020. PM 5-Mar-99 35/1999/QD-TTg ● ● ● ● ● ● ● ● ●
5 Prime Minister Decision Ratifying the National Urban and Industrial Zones Solid Waste Management Strategy to year 2020.
PM 1999 152/1999/QD-TTg ● ● ● ● ● ●
6 Inter-Ministerial Circular on Guidelines on Methods for Pricing and Jurisdiction on Defining Clean Water Tariffs for Urban Areas, Industrial Zones and Rural Residential Centers (superseded by Circular 104/2004).
MOC/SPC Jun-99 03/1999/BXD-BVGCP ● ● ● ● ● ●
7 MOH Decision on Drinking Water Standards MOH Apr-02 1329/2002/BYT/QD ● ● ● ● 8 Prime Minister Directive on Management Enhancement
Over Clean Water Supply and Consumption PM 20-Jan-04 04/2004/CT-TTg ● ● ● ● ●
9 Decree on Environmental Protection Fees for Wastewater Discharges GoV 13-Jun-03 67/2003/ND-CP ● ● ● ● ● ●
10 Inter-Ministerial Circular on Environmental Protection Fees for Wastewater Discharge MOF/MONRE 18-Dec-03 125/2003/TTLB-BTC-
BTNMN ● ● ● ● ● ●
11 Law on State Owned Enterprises (to be superseded by Law 60/2005) NA 26-Nov-03 14/2003/QH10
12 Enterprise Law (Unified) NA 29-Nov-05 60/2005/QH11 ● ● ● 13 Environment Protection Law NA 27-Dec-93 29L/CTN ● ● ● ● ● ● ● ● ●
14 Circular on Guiding the Financial Mechanism Applicable for Clean Water Projects funded by ODA Capital Sources
MOF 25-May-05 40/2005/TT-BTC ● ● ●
15 Circular on the Tariff Framework for Clean Water Supply MOF 30-Jun-05 38/2005/QD-BTC ● ● ● 16 Ordinance on Pricing NA 26-Apr-02 40/PL-UBTVQH10 ● ● ● ● ● ● ● ●

TA 4485- VIE: Central Region Small and Medium Towns Development Project FINAL REPORT Appendix 4, page 21
June 2006
Sub-sector Related Level Focus Type of Regulation
No. Description Issued by Date Documents Codes
Wat
er S
uppl
y
Drain
age
Was
tewa
ter
Sani
tatio
n
Solid
Was
te
NA/G
oV./P
M
Mini
stry
PPC
Urba
n
Small
Tow
ns
SOE
Refo
rm
Law
Ordi
nanc
e
Decr
ee/D
ecisi
on
Circ
ular
Polic
y
Regu
latio
n
Stra
tegy
17 Decree on Guidelines for the Implementation of Ordinance on Pricing GoV 25-Dec-03 17/2003/ND-CP ● ● ● ● ● ● ● ● ●
18 Inter-Mnisterial Circular on Guidelines on Methods for Pricing and Jurisdiction on Defining Clean Water Tariffs for Urban Areas, Industrial Zones and Rural Residential Centers
MOF-MOC 8-Nov-04 104/2004/TTLT-BTC-BXD ● ● ● ●
19 Circular on Financial Mechanisms Applicable for Environmental Sanitation Project Utilizing ODA Fund Sources
MOF 7-Nov-03 108/2003/TT-BTC ● ● ● ● ● ● ● ●
20 Decree on Management of Construction Investment Projects GoV 7-Feb-05 16/2005/ND-CP ● ● ● ● ● ● ● ● ●
Legend: GoV – Government; MOC – Ministry of Construction; MOF - Ministry of Finance; MOH – Ministry of Health; MONRE – Ministry of Natural Resources and Environment; NA – National Assembly; PM – Prime Minister.

TA 4485- VIE: Central Region Small and Medium Towns Development Project FINAL REPORT Appendix 4, page 22
June 2006
Table A4-7. Profiles of WSS Service Providers19
Province: Phu Yen Subproject: The Phu Yen Subproject includes drainage and wastewater management in Tuy Hoa City and drainage and solid waste management in Song Cau small town. Concerned WSS service providers are Phu Yen Water Supply and Drainage Company and a solid waste unit under Song Cau TPC – see below. Name of Entity: Phu Yen Water Supply and Drainage Company Type of Entity: One Member Limited Liability Company Jurisdiction: All urban centers in Phu Yen province Functions: Urban water supply, drainage and wastewater management Existing Situation: The provincial WSDC is responsible for water supply and drainage in Tuy Hoa City and urban centers throughout the province. Currently it manages, operates and maintains water supply in Tuy Hoa and nine other urban centers (including Song Cau) through its head office in Tuy Hoa and branches in other urban centers. It also manages, operates and maintains the drainage system in Tuy Hoa City, but its annual work program is severely restricted by the limited funds allocated from the PPC budget. Currently, it does not operate and maintain the relatively small drainage systems in other urban centers, which receive little or no maintenance. The urban environmental company under administration of Tuy Hoa City is responsible for managing solid waste and other municipal services (green parks, cemetery services, lighting) in the city. During the PPTA, discussions were held with representatives of the company to determine whether it might be upgraded to a provincial level organization to manage solid waste services in Song Cau and other urban centers. The company considered that it dos not have the resources to become a provincial company and has no plan to do so. Recommended Roadmap: Transform the Phu Yen WSDC to a One Member LLC in the short term, to give it greater autonomy and business focus, and separate it from State administration. Gradually expand its drainage operations and maintenance to cover district towns, by attaching dedicated drainage staff to the water supply branch office. Focus on reducing operating costs (UFW reduction, meter management, energy and pressure management), strengthen its management capacity, and adopt modern management methods and systems (e.g. MIS, financial planning and financial management, asset management, business plans, staff certification). Develop customer relations and adopt strategies to rapidly expand customer base. Adopt method for calculating water tariff according to Directive 04/2004, progressively adopt full cost recovery for water supply and eliminate subsidy. Apply drainage and wastewater charges as a surcharge on the water tariff, starting at 20 percent of water tariff, to cover, as a minimum, full O&M costs and replacement of plant and equipment. (According to MOC guidelines on work norms and unit prices). Ensure that revenue is retained by the WSDC and used for O&M of the drainage systems. Enter into service contracts with concerned PPCs, DPCs and TPCs. Required Capacity Building for Ongoing WSS Management: The WSDC has little experience in O&M of drainage or wastewater. Capacity building will focus on: (i) asset management including upgrading asset register, proper valuation of assets and calculation of depreciation; (ii) financial management and planning; (iii) improved accounting systems including separation of water supply, drainage, wastewater and other functions with separate cost centers for branch operations; (iv) O&M of water supply, drainage and wastewater systems, including restructuring work teams, developing work plans, budgeting, O&M plans and procedures; (v) implement specific programs for UFW reduction, meter management, energy and pressure management; (vi) improve customer relations skills in head office and branches to improve customer focus and help to expand the customer base.
Name of Entity: Song Cau solid waste unit under Song Cau TPC
Description: Currently, a solid waste unit or group attached to Song Cau TPC undertakes collection, transport and disposal of solid waste from Song Cau town. It has seven employees.
19 This profile is indicative and should be completed under subsequent technical assistance to prepare and implement the Project.

TA 4485- VIE: Central Region Small and Medium Towns Development Project FINAL REPORT Appendix 4, page 23
June 2006
Recommended Roadmap: Song Cau is a Class V district town, with about 19,000 people It will be upgraded to Class IV I the near future.
Required Capacity Building for Ongoing WSS Management.
Capacity to Implement the Project: The ADB-funded Third Provincial Towns WSS Project (TPTWSS) is being implemented in Phu Yen province. It will expand and improve water supply and sanitation in Tuy Hoa City and two district towns of La Hai and Chi Thanh. The PMU is located in the provincial WSC. Construction of the project has not yet commenced and is likely to overlap the CSMT Project. The PMU will gain substantial experience in project management, accounting, reporting and ADB procedures and will develop management systems that will be directly relevant to the CSMT Project. As a result of this previous experience, the WSC is expected to have adequate capacity to implement the Project. Some staff may be transferred from the TPTWSS PMU to the CSMT PMU and there will be exchange of experience, knowledge and systems between the two PPMUs.

TA 4485-VIE: Central Region Small and Medium Towns Development Project FINAL REPORT Appendix 3 – Annex 1, page 73
June 2006
BASIC INFORMATION of HOUSEHOLD SANITATION PRACTICES AND WASTE DISPOSAL2. Is it your own or rented house?
a.Own b.Rented c.Staying free of charge 14 What sanitary facility does your household use?3. Do you have a land use certificate? a dry pit or vault latrine a. Yes b. No b pour-flush toilet4. Is the certificate in the name of: c open air a Male name d neighbor's or public latrine b Female e flush toilet c Both5. What type of house do you live in? 15 The wastewater from your house goes to:a. permanent house a. Drains into the street and/or canal b. semi permanent house of mixed construction b. To a septic tank, then seepage pit c. temporary house c. To a septic tank, then a sewer d. others (specify) d. Pond, river or lake
e. Garden or empty lot WATER SUPPLY f. Directly to a sewer
6. What is your household's main source of drinking and cooking water? g. Don't Know Wet Dry
a Indoor connection from the Water Supply Company 16 Are you interested in borrowing money for a septic tank toilet from b Standpost or connection shared with others a sanitation credit fund with appropriate terms and conditions? c Private borehole with electric pump Yes No d Open dug well with hand pump a. If yes, who do you think should manage the loan funds?: e Rainwater tank Women Union f Pond, river, canals Bank g Purchase water from vender Other (specify):_____________________
b. How much could you afford to pay back each month for loan 7. What is your water source for bathing and laundry ? Wet Dry repayments (including interest) for a loan of up to two years? a Indoor connection from the Water Supply Company b Standpost or connection shared with others 50000 ; 60000 ; 70000 ; 80000 c Private borehole with electric pump d Open dug well with hand pump 17 Would you be willing to connect waste water pipes from the septic e Rainwater tank tank, toilet, washing areas in your household to the public f Pond, river, canals drainage system?
Yes No 8. How much time do you spend collecting fresh water everyday?a in the wet season ______ minutes 18 If yes, would you be willing to pay a one-off fee to connect your b in the dry season ______ minutes waste water pipes to the public drainage (outside of your property)?
Yes No 9 How much water does your HH use each day? a in the wet season ________ m3 or ______ litres 19 If yes, how much would you be willing to pay for a one-off b in the dry season ________ m3 or ______ litres connection fee? (VND)
10 How much do you pay for water each month? 20 Where is your toilet (latrine)?a in the wet season ______ VND a _______________________________m. from water sources
b. _______________________________m. from well11. Do you have a business in this location that uses water? a Yes ______(kind of business and who uses)_______________ 21 How often do you empty it? b. No a. Once every _________ years
b. Never 12 Are you willing to pay more if piped water supply services are
improved or there is new water supply system? 22 How do you dispose of human waste? a. Yes b. No a. bucket collection to farmers or fish ponds
b. fertilizer for garden13 If yes, how much (VND per m3): c. nearest river, lake or channel
8000; 7000 ; 6000; 5000 ; 4000; 3000; 2000 23 What do you do with your garbage?a. burnb. buryc scatter outside d collected by waste management company
SOCIOECONOMIC SURVEY QUESTIONNAIRE

TA 4485-VIE: Central Region Small and Medium Towns Development Project FINAL REPORT Appendix 3 – Annex 1, page 74
June 2006
STORMWATER DRAINAGE AND FLOOD HEALTH AND SANITATION24 How often does flooding occur in the road outside your house? 38 Are there open drains close to your house ?a. never a. Yes b. No Child b. some years 39 How many members of your family got sick of <5c. every year (how many time does flooding occur each year?) following diseases in the last dry season M F M F
a. dengue fever25 How often does flood water enter your house? b. diarrheaa. never c. Cholerab. some years d. malariac. every year (how many time each year?) e. skin disease
f. worms26 If flooding occurs every year, during the worst flood each year, g. gynaecology (women disease)
what is ? h. eyes diseasea. Depth of water in road (m) _____________________b. Duration of flood water in road (h) __________________ Child c. Depth of flood water in house (m) __________________________ 40 How many members of your family got sick of <5d. Duration of flood water in house (h) _________________________ following diseases in the last wet season: M F M F
a. dengue fever27 What is the impact of flooding on your household? b. diarrheaa. Ill health c. Cholerab. Transport difficulties c. malariac. Loss of security d. skin diseased. Loss of life e. wormse. Financial losses f. gynaecology (women disease)g. Less productivity at workplace g. eyes diseaseh. Loss of employment Male Female
41 Did your HH have any medical costs due to the illness?28 a. Yes b. No
cost you? and When? ________ How much the cost of medical (estimate)? __________ VNDa. Repairs to buildings, funiture ______________________ VNDb. Cleaning costs ________________________________ VND 42 Did your HH lose any days of work? ___________ daysc. Need to buy water ______________________________ VND Male _________ days Female _____ daysd. Repairs to vehicle ______________________________ VNDe. Extra transport costs __________________________ VND 43 Do you keep water for hand washing at/beside f. Health costs eg. medicines & treatment _______________ VND the toilet/latrine? OR Total _______________VND a. Yes b. No
29 How many days labour did you lose last year due to flooding? 44 Do you keep soap for hand washing at/beside
Male ____________ Female __________ the toilet/latrine?a. Yes b. No
30 What is the main cause of flooding in your area?a. low land 45 What is the most useful way for you to receive information b. bad drainage system improving your family’s health?c. no drainage system a. Talking to friends, relatives, neighbours d. bad dyke system b. From your place of work e. no dyke system c. Media eg. tv, radiog. big storm water d. Billboards, postersh. other (specify) e. Loud speaker
M F f. Group meetings31 Who currently cleans the small drains in alleyways? g. Health centre32 Who currently cleans the larger street drains? h. School33 Who should be responsible for keeping drains clean?34 Would you be prepared to pay a fee each month to improve 46 Have you ever participated in voluntary community activities
drainage of wastewater and stormwater in your neighbourhood? to improve sanitation and health in your area?a. Yes b. No35 How much would you be willing to pay each month to improve
and maintain drainage? ______________________ VND
When the lates flood season, how much have repairs for flood damage

TA 4485-VIE: Central Region Small and Medium Towns Development Project FINAL REPORT Appendix 3 – Annex 1, page 75
June 2006
36 How should this fee be collected? ___________________ WATER QUALITY AND POLLUTIONa. Water bill 47 Are any of these near your location?b. Solid waste bill a. Large industryc. Other (specify) _____________________________ b. Hospital37 Would you be willing to participate in a community c. Village handicraft industries
activity to improve drainage in your neighbourhood d. Farms with unprocessed liquid pesticide waste(eg. building new drains, cleaning existing drains)? e. Mining operations
a. Yes b. No f. I don't knowc. no improvement necessary
48 Do you think the quality of your water source is: Wet Dry
50 What is the worst impact of polluted water from pesticide a. Always safeand animal waste runoff b. Generally safe
a. Animals get sick/die c. Polluted b. Fish die d. I don't know c. Crops don't grow properly d. Bad tastes, smell, color 49 Do you boil your water for drinking? e. Health problem (specify) a. Yes b. No
51 What do you think is the main cause of water pollution here? INSTITUTIONAL ASPECTS a. Industrial waste into canals and rivers 59 What government entity has a procedure to make b. Unsanitary human waste disposal upstream a water quality complaint or concern? c. Pesticide and animal waste runoff a Provincial Water Supply Company d. Saltwater intrusion into groundwater b District Water Supply Company e. other (specify) __________________________ c Provincial People's Committee
d CPCECONOMICS AND FINANCE e. DARD
f DONRE52 Does your household have any of the following assets? g DOHa. Bicycle h DOCb. Radio l Other (specify) or I don't knowc. B/W TV 60 Do you know any Government policy or programd. Electric fan about water supply and sanitatione. Motorbike a. Yes (What?)____________________________ No f. Rice cookerg. Cellphone GENDER ASPECTSh Bathroom 61 Who in the family does the following: M F S Di Colour TV a. Collects/stores water from outside the housej Telephone, b. Builds the well and sanitation facilitiesk gas cooker c. Teaches children about hygienel air conditioner d. Cleans sanitary facilitiesm Refrigerator e. Pays water or sanitation feesn Truck or car f. Feeds and bathes children
g. Maintains well and pump53 How much is spent on a average monthly basis on the following? h. Makes decisions in the case of sick childa. Food __________________________________ (VND) I. Makes decisions about design and purchaseb. Medicine _______________________________ (VND) of water and sanitation fixturesc. Clothes _______________________________ (VND) k. Participates in community activities to d. Cost of education ________________________ (VND) improvement of sanitation and healthe. Visiting or touristing _____________________ (VND) q. Earns the biggest income in the household f. other (specify) __________________________ (VND)g. Total: __________________________________ (VND)

TA 4485-VIE: Central Region Small and Medium Towns Development Project FINAL REPORT Appendix 3 – Annex 1, page 76
June 2006
c. How much do you currently pay for urban services and utilities per month? PRIORITIESa. Water Supply ___________________________ (VND) 62 What is one most important priority for your family?b. Electricity _____________________________ (VND) a. Enough food to survivec. Solid waste fees ________________________ (VND) b. Health care for familyd. Drainage ______________________________ (VND) c. More employment and incomee. Security fees ___________________________ (VND) d. Education for childrenf. Land use tax ___________________________ (VND) e. Credit of household economic developmentg. Total: __________________________________ (VND) f. Better housing
g. Enough water to utilizing55 If you have a piped water connection, how much did you pay h. Training to improve awareness of environment
for one m3 of water? _____________ (VND) i. Safe water and environmental sanitationk. Others (specify)63 What environmental problem bothers your the most?
56 Do you usually have any savings from monthly income a. air pollutionafter expenses are paid? b. noise
a. c. water quality d. water quantity
57 How much to estimate your monthly savings? ______________VND e. dust f. bad smell
58 Is your household registered as poor? g. other (specify)a. Yes b. No 64 What is one most important priority for your ward/village?
a. improve roads and streets b. improve water quality and quantity and service c. better housing d. better sanitary and environmental conditions e. access to markets f. Protection from flooding g. Improve drainage in waterlogging h. other (specify) ___________________________

TA 4485-VIE: Central Region Small and Medium Towns Development Project FINAL REPORT Appendix 3, page 1
June 2006
SOCIAL SURVEY METHODOLOGY AND FINDINGS
1. THE SOCIOECONOMIC SURVEY: SCOPE AND OBJECTIVES
The proposed Project used a demand-driven approach to prioritize towns and subcomponents, and after undergoing a two-phased selection process, produced a list of candidate towns and their subcomponents ⎯ evaluated as feasible with respect to the technical, social, economic, financial, resettlement and environmental aspects in accordance with the relevant guidelines of the Government and ADB ⎯ and ranked according to the Government’s development plans, strategies and priorities. Based on the Government’s approved budget of $97 million, the first 13 towns coming from the 5 provinces of Phu Yen, Khanh Hoa, Ninh Thuan, Binh Thuan, and Dak Nong were included in the Project. To further ascertain the characteristics of the selected towns and provide baseline data on present social and economic situation, the socioeconomic profile of each town was subsequently developed. Data for said profile were primarily derived from a socioeconomic survey conducted by the PPTA team as well as from secondary sources namely official statistics from the Statistical Yearbook, poverty statistics, participatory meetings and discussions, among others.
The socioeconomic survey covered such data as population; labor force participation; economic (including GDP, per capita income and poverty levels), health and education indicators; and, migration patterns at the township level. The survey was intended to present a composite picture of similarities and differences between the towns that were initially considered to be candidates for the Project, as well as within these towns (including the peri-urban areas).
The socioeconomic survey likewise focused on access to WSS related services, including water sources (taps, vendors, wells, lakes, ponds and rivers) during both the dry and wet season. This captured seasonality and enabled understanding of how and when access to water was more problematic. The survey was also vital in determining the impact of access to WSS-related services on livelihood, especially on the poorer and more vulnerable households. In addition, the survey looked at access or non-access to toilets including the different types of toilets, and whether individual households were connected to existing drainage networks.
1.1 Methodology
The methodology adopted by the PPTA Team comprised structured household interviews, drawing samples from wards and villages subscribing to the criteria that they come from service areas and are affected by problems such as water shortage, water logging and lack of wastewater system.
The total sample in each town was 108 households, utilizing a clustered random sampling technique that selected every fifth household in the ward or village to be surveyed. The survey instrument used was a questionnaire, developed and customized for the Project and translated into Vietnamese. (See Annex 1 for a copy of the survey questionnaire in English version.)
Actual fielding of questionnaires was conducted by locally engaged enumerators under the supervision of a province-based enumerator who provided orientation and training on interviewing and enumeration techniques. The resulting raw data was sent to Hanoi

TA 4485-VIE: Central Region Small and Medium Towns Development Project FINAL REPORT Appendix 3, page 2
June 2006
for tabulation and processing, while analyses were undertaken by the PPTA consultants.
1.2 Survey Procedure
Prior to the actual survey, it was necessary to observe protocol and confer with all four layers of governmental structure from the provincial level down to the village level. Permission had to be secured from the PPC in each of the Project provinces, followed by a visit to the District People’s Committee. The latter arranged meetings for the survey team with the Town People’s Committee (Commune People’s Committee) who in turn arranged meetings with Ward/Village leaders. Parallel to these meetings, consultations with the Provincial, Town and Ward Women Unions were conducted in order to ensure that the gender component was similarly being pursued.
Once this protocol was observed, it was, thus, possible to commence the actual surveys which began in the early part of August and completed by the end of September, with the exception of one town (Thap Cham) whose priority ranking rose in November after a more careful examination of its needs, priorities, and ODA funding sources.
1.3 Unstructured Interviews and Consultations
The survey team was called upon to explain the purpose of the survey from time to time. There was also considerable information sharing with public sector officials and informal consultations with stakeholders including local community members representing poorer and vulnerable groups. These informal consultations enabled the PPTA Consultants to develop qualitative insights into issues germane to the Project such as the opportunity cost of waterborne diseases on women and their households and the type of interventions that would be effective in peri-urban areas to ensure that people outside the designated water supply area would also benefit.
1.4 Limitations of the Survey
Although detailed population data, disaggregated by gender and ethnicity, was designed to be included in the survey, it was not possible to obtain disaggregated by age (this is a common feature throughout Vietnam at the township level). Meanwhile, the survey was unable to effectively gather differentiated poverty data by ward and commune in some of the Project towns despite repeated requests made by each TPC or CPC to provide such data. This limits the effectiveness of the poverty analysis ⎯ at least in identifying how the Project will target households living in poverty ⎯ and as suggested in the poverty analysis under the PPTA will be one of the data gaps that will need to be filled prior to project implementation.
2. THE SOCIOECONOMIC PROFILE OF PROJECT SELECTED TOWNS
The succeeding section provides the socioeconomic profiles of selected towns under the Project drawn from discussions with the Town People’s Committees, secondary data sources, and from the results of the survey.
2.1 Summary Findings from the Survey

TA 4485-VIE: Central Region Small and Medium Towns Development Project FINAL REPORT Appendix 3, page 3
June 2006
The socioeconomic surveys were conducted in the 13 priority towns coming from 5 provinces in Vietnam. These towns included Tuy Hoa and Song Cau from the province of Phu Yen; Cam Ranh, Ninh Hoa and Van Gia from Khanh Hoa; Tan Son, Ca Na and Thap Cham1 from Ninh Thuan; Phan Thiet from the province of Binh Thuan; Gia Nghia, Ea T’ling, Dak Mam, and Quang Khe from Dak Nong.
2.1.1 Demographic Profile
Of the thirteen provinces, Cam Ranh had the largest total estimated population with 215,822, followed by Phan Thiet and Tuy Hoa with 206,964 and 162,278, respectively. There are no significant gaps or differences when estimated household population was disaggregated by gender in all thirteen towns.
When it comes to presence of ethnic minorities, the survey noted that they actually dominate in Quang Khe from Dak Nong province comprising about 63% of total population. Their presence is likewise largely felt in Gia Nghia, also from Dak Nong province, comprising 35% of the population. There are also significant percentages of ethnic minorities composing the population of the other two towns in the province of Dak Nong.
In terms of the labor force, Cam Ranh from the province of Khanh Hoa has the largest number at 119,826, followed by Phan Thiet with 119,181 and Ninh Hoa with 108,638. This result is somewhat expected considering that these towns (except Ninh Hoa) have the largest estimated population among the thirteen. An examination of the composition of the labor force reveals that the agriculture sector dominates in almost all of the towns except for Tuy Hoa, Phan Thiet, and Ea T’ling. In these towns, majority of the labor force are from the business/services sector.
2.1.2 Income
Two of thirteen towns, Ca Na and Phan Thiet, have the highest per capita average monthly income ranging from VND600,000 to 700,000. The town of Tuy Hoa meanwhile came out with an average monthly income per capita of between VND500,000 to 700,000.
2.1.3 Poverty Incidence
Using the new standard set by MOLISA in 2004, the survey results show that Quang Khe from Dak Nong province has the highest incidence of poverty at 54.41%. Ea T’ling, also from Dak Nong, follows with a poverty rate of around 45%. Dak Mam from the same province has 36% of its population considered poor. The rest of the towns have poverty rates not exceeding 20% of their respective population.
1 Thap Cham is a town whose priority ranking rose after a joint discussion between the Government and the ADB in November 2005.

TA 4485-VIE: Central Region Small and Medium Towns Development Project FINAL REPORT Appendix 3, page 4
June 2006
2.1.4 Education
Owing to the policy of compulsory education for primary level children and the presence of skilled and competent teaching staff and the availability of school buildings, the literacy rate in all thirteen towns are very high. Six of the towns have literacy rate of 99% while only one town, Quang Khe, had a rate below 90% (at 85%).
2.1.5 Health
When it comes to health conditions in all thirteen provinces, the survey made use of seven indicators for assessment purposes. The results indicate that malnutrition among children under 5 was most prevalent in Phan Thiet among six towns with data in absolute figures. In terms of percentages, malnutrition was found to be most prevalent in two towns in the province of Dak Nong, namely, Dak Mam and Quang Khe.
Data on infant mortality was available only for four towns, with two of them providing absolute figures based on 1,000 live births per year and the rest in percentages. Cam Ranh had the highest incidence of infant mortality at slightly more than 9%. In terms of maternal mortality, only Cam Ranh had available figure at 26 per 10,000 live births. Cases of malaria in 2004 were more prevalent on Gia Nghia, while Phan Thiet had the most cases of dengue fever in 2005. Meanwhile, tuberculosis was most prevalent on Phan Thiet among the nine towns that provided data. With regard to cases of HIV/AIDS in 2004, only four towns provided data, out of which Phan Thiet was found to have the most number of cases.
2.1.6 Access to Water Supply
It turned out from the survey that drill well is the primary source of water supply in at least five towns, while tap water is the main source for two towns. In Song Cau, the respondents were equally divided between tap water and drill well. In Gia Nghia, the primary water supply sources are rivers and ponds, and purchased water. Cam Ranh follows closely with 50% of respondents indicating the same.
2.1.7 Environmental Sanitation and Practices
Septic tank is available in almost all of the thirteen provinces except for Quang Khe, albeit in varying levels of availability among their respective population. For instance, Tuy Hoa has the highest percentage (85%) of its population with septic tank, while Ea T’ling posted the lowest (10%). However, the latter town has the highest percentage of latrine accessibility at 60%. Almost all of the towns ascribe to sanitary practices such as boiling water for drinking and washing hands after flushing the toilet. Out of the twelve towns where data was available (not available for Quang Khe), Dak Mam was found to be the town with the most number of respondents with temporary or without toilet.
In the ensuing pages, an overview of the socioeconomic profile and summary findings of the socioeconomic survey for each priority town are presented.

TA 4485-VIE: Central Region Small and Medium Towns Development Project FINAL REPORT Appendix 3, page 5
June 2006
SOCIOECONOMIC PROFILE OF TUY HOA TOWN: OVERVIEW
A. Population, FY2004: Total Population2: 162,278
- Male: 75,716 - Female: 86,562
B. Labor Force: Total Labor: 80,187
- Agriculture Sector: 20% - Business, Service Sectors: 65% - Other Sector: 15%
C. Ethnic Minorities: None. D. Average Monthly Income (per person): VND 500,000 – 700,000 E. Poverty Rate: 9.09%3 F. Educational Situation:
- 99.0% of the children go to school. - compulsory general education at the primary level. - teaching staff skilled and knowledgeable; sufficient school buildings
G. Health Care Situation4: - Cases of malnutrition under 5s per year: 29.2% (2004) - New cases of Tuberculosis: 108 (2003) - New cases of HIV/AIDS: 14/93
H. Domestic Water Supply Situation (Percentage of HH Using Water) Tap Water: 35% Drill Well: 65%
I. Solid Waste/Wastewater System: Insufficient wastewater system in Tuy Hoa City. 89.2% solid waste is collected by a solid waster management company J. Environmental Sanitation and Awareness:
Septic Tank: 85% Latrine: 12% Temporary/No Toilet: 3% Boil Water for Drinking: 100% Sanitation Practices5: 90%
Note: This preliminary profile is based on a series of participatory meetings of the Project Team in each town.
2 This figure is based on meetings and discussions with the PPCs and MABUTIP, the surveys conducted by the Consultant’s engineering
and socioeconomic group, towns statistics books and existing master plans. 3 MOLISA poverty line, 2005. 4 Statistics were provided by the Tuy Hoa Health Care Center. 5 Specific question asked of the respondents was whether they washed their hands after using the toilet.

TA 4485-VIE: Central Region Small and Medium Towns Development Project FINAL REPORT Appendix 3, page 6
June 2006
SOCIOECONOMIC SURVEY OF TUY HOA: SUMMARY FINDINGS
1. BACKGROUND ON THE AREA
As a provincial city Phu Yen provides a range of goods and services not typically available in other towns of the province. It is the administrative center of government at the provincial level, political center of the Communist Party, and the trading and financial center of the private sector. Phu Yen not only services the rural hinterland but all towns and communes in the province as well.
Tuy Hoa is a Class 111 city and it is the provincial capital of Phu Yen Province. It is located on National Highway 1A, approximately 120 kilometers north of Nha Trang City and 560 kilometers north of Ho Chi Minh City. A distinguishing feature of this town is that it is intersected by the Da Rang River and there are urban wards on both sides of the river.
2. ECONOMY
Phu Yen is too small to attract the types of direct and indirect foreign investment that cities such as Ho Chi Minh are able to attract although its ethnic Hoa population appears able to mobilize quite substantial capital inflows but not for large-scale industrial or commercial activity. Distance from markets in Ho Chi Minh are a problem although with the upgrading of the National Highway this situation will improve somewhat. The Master Plan is very modest and forecasts that the urban population will grow by 1.7 percent over the next five years and 1.4% for the subsequent ten years. Existing economic based activities are likely to be able to support that level of growth.
3. DEMOGRAPHIC PROFILE
Tuy Hoa has a total population of 162,278 comprised of 75,716 males and 86,562 females. According to the TPC only ethnic Kinh live in the town6.
3.1 Urban Population
Unlike towns in the Central Highlands, the existing and forecast urban population growth rate is not highly significant being close to the national average and similar to other provincial capitals in the Central Coastal Region. Hence this town is not likely to see the rapid social and economic development and attendant problems of the Central Highlands towns in this Project.
3.1.1 Labor Force and Employment
Based on the survey, total workforce in Tuy Hoa was found at 80,187. Waged workers in the business and service sector account for 65 percent of the workforce, farmers and agricultural workers 20 percent and other sector 15 percent. In the Project area, there are fewer farmers but more people involved in small and medium enterprises. It
6 Actually they constitute 75.1 percent of the population. The major ethnic minority group is the Hoa or Sino-Vietnamese though while not
indigenous to the region in a similar way as the Kinh, they have lived in the region as long as the Kinh. In the rural communes there are also some other ethnic minorities (most notably the Cham) but the actual numbers were not documented during the actual data collection exercises.

TA 4485-VIE: Central Region Small and Medium Towns Development Project FINAL REPORT Appendix 3, page 7
June 2006
is in this sector that the ethnic Hoa are more likely to be found and are able to leverage their contacts with Hoa business people elsewhere in Vietnam, especially in Ho Chi Minh City.
3.1.2 Income
The residents of Tuy Hoa receive an average monthly income between VND 500,000 -700,000.
3.1.3 Education
Survey results show that 99 percent of children in Thuy Hoa attend school. This may be attributable to the fact that general education at the primary level is compulsory. Meanwhile, the teaching staff were found to be skilled and knowledgeable and there is presence of sufficient school buildings.
3.1.4 Health
Cases of malnutrition for children under 5 years in Thuy Hoa town was pegged at 29.2% in 2004. Cases of malaria reached 24 per 1,000 people during the same year. New cases of tuberculosis reached 108 in 2003 and new cases of HIV/AIDS were 14 and 93, respectively.
4. POVERTY AND VULNERABILITY
The MOLISA poverty rate is 9.1 percent with the highest poverty rate being in the “rural” ward of An Phu (15.2%) and lowest in the urban Ward 7 (1.3%). The Water Poverty Index is 19.8 percent and this is based on the average price that 59.4 percent of households pay for water. This is one of the lower WPI in the Project area but because water supply development and expansion is not being financed as part of this Project in Phu Yen, other pro-poor arguments have to be used. The pro-poor argument will need to be that preventing flooding and general improvements to the drainage system coupled with improvements to solid waste management and improved community environmental sanitation (especially for 29.8% of households without access to improved latrines) will contribute to an overall improvement in WSS related livelihood improvements.
The characteristics of poverty and inequality include poorer people working in the informal or non-formal sector, fewer opportunities in the public sector because of downsizing, living in those wards where urban infrastructure (including drainage and solid waste management is poor), and there are a number of unregistered migrants. There is some poverty among recently arrived migrants, especially those who are unregistered and find it difficult to access health and educational services available to registered migrants.
5. GENDER
The surveyed households of Tuy Hoa showed a slightly higher proportion (36 percent) of female-headed households (FHHS) compared to the national figure of 30 percent. Aside from the usual households headed by widows and separated women, quite a number of households send their male members to work in urban centers to supplement their meager incomes. The FHHS’ monthly per capita income (VND 272,000) is lower than those headed by males (VND 327,000). Moreover, when we

TA 4485-VIE: Central Region Small and Medium Towns Development Project FINAL REPORT Appendix 3, page 8
June 2006
examine the incomes of both men and women by occupation, women always earn lower than their counterparts. For example, among hired workers males get an average of VND 1,064,000 per month, more than double earned by females (VND469,000). In the same vein, among teachers, males earn VND 1,325,000 per month, higher than those received by females (VND765,000).
Women, in general, take care of WSS-related activities at the household level such as cooking, washing, cleaning, taking care of children, the sick and the elderly and disposing of human wastes and garbage. Doing these tasks pose quite a challenge for the women in Ninh Hoa as only 36 percent have access to piped water. The majority obtain their water from dug wells (37 percent), boreholes (21 percent) or they share with others (6 percent). A small number (2 percent) purchase their drinking water from vendors. On the average, women spend an average of 25-30 minutes per day collecting water, depending on the season. During the rainy/typhoon season, about 80 percent of the households experience flooding. As a result, both men and women in these households suffer from illnesses (especially the children), financial losses and loss of employment and productivity due to flooding several times a year. In terms of sanitation, a large proportion (90 percent) of the households have access to toilet and other sanitary facilities. As a result, only a small portion of the women (15 percent) dispose of the human waste to fishponds, farms or to the nearest water channel. A large majority (89 percent) of them also have their garbage collected by the waste management company while the remainder burn or bury their trash.
Majority of those households surveyed do not possess certificates of land use (77 percent). Of those who have certificates, majority (three-fourths) were registered in the husband’s name. In terms of community participation, women are very visible in the Women’s Union and the Elder Union but have lower visibility in the town/provincial committees. At most, their participation in the latter committees, is about 20 percent or less. Because women manage WSS-related activities, they are very eager for support in upgrading their water facilities. They want credit support for water connection, improvement of their drainage system and waste disposal as they have very low access to credit for these needs. Understandably, they trust the Women’s Union more to manage this type of credit.
6. INTERVENTIONS TO SUPPORT THE PROJECT
A culturally appropriate community environmental sanitation and awareness program that the TPC, VWU and NGO will help develop in conjunction with the local communities (inputs from local women will be a feature of this approach based on the premise that it is women who will be the driving force for improved environmental sanitation). It is via this program that some of the more inappropriate practices adopted by households used to urban living (e.g. using inland waterways to dispose of human waste) can be modified. Additionally those 9 percent of households without access to latrines and 59.4 percent of households without access to piped water will be supported via demand driven interventions where people as “consumers” rather than “beneficiaries” will decide what menu of options they are willing to finance.
7. LIVELIHOOD IMPROVEMENTS

TA 4485-VIE: Central Region Small and Medium Towns Development Project FINAL REPORT Appendix 3, page 9
June 2006
The demand driven interventions should also further develop local entrepreneurship as households exercise their choice not only on the menu of options they are seeking but on what prices they are prepared to pay (hence the development of a market economy grounded in existing and potential livelihood possibilities). This is especially relevant for poorer households, most of who are to be found in the rural wards of Phu Yen.
Of equal importance by attempts to involve all of the population in a “total” or “100 percent” approach to environmental sanitation (proposed interventions benefit whole communities not just individual households) not only does such an approach improve health but also empowers the local people of Phu Yen by actively involving them in the design of the program but also develops a sense of unity and purpose among different groups living in the same ward but also on an inter-ward basis. Developing civic pride in a provincial city such as Phu Yen, which is not always easy given the social complexities of larger urban centers, is a practical livelihood issue related to levels of greater self-esteem.
8. ACCESS TO WATER SUPPLY
Based on the survey, 35% of households use tap water for their domestic needs, while 65% make use of drill well as source of water supply.
Improved water supply development and expansion will not be financed in Phu Yen and households in this town are more likely (91%) to have access to improved latrines than in many of the other Project towns. The interesting point here is that access to improved latrines nearly tallies with the official MOLISA incidence of poverty and it can be reasonably inferred that in most instances all but poor households have access to improved latrines. This probably means in terms of improved sanitation there is considerable scope for mobilizing poorer households via demand driven approaches in wards with higher incidence of poverty (e.g. Wards 2, 5 and 6 and An Phu, Binh Ngoc, and Hoa Kien).
9. SOLID WASTE MANAGEMENT
An overwhelming majority (89.2%) of households dispose of solid waste that is collected by a solid waste management company. There appears to be some correlation between household socioeconomic status and both ability and willingness to pay for solid waste to be collected. However, it is also necessary to differentiate between the urban and rural wards in Phu Yen.
10. DRAINAGE AND FLOODING INCIDENCE
Improved drainage in several of the wards (some such as Ward 1 not being especially poor but others such as Phu Lam being relatively poor) is designed to mitigate flooding that affects up to 1,875 households (9,500 people) two times per year up to depths averaging 1 meter and lasting an average of 11 hours. Damage to roads and possibly adverse health impacts are two areas that improved drainage can mitigate.

TA 4485-VIE: Central Region Small and Medium Towns Development Project FINAL REPORT Appendix 3, page 10
June 2006
11. ENVIRONMENTAL SANITATION AND AWARENESS
Survey results show that 90% of respondents in Tuy Hoa were found to have adopted certain sanitation practices like washing hands after using the toilet and boiling of water (100%). About 85% has septic tank, 12% use the latrine and only 3% has temporary or no toilet.

TA 4485-VIE: Central Region Small and Medium Towns Development Project FINAL REPORT Appendix 3, page 11
June 2006
SOCIOECONOMIC PROFILE OF SONG CAU TOWN: OVERVIEW A. Population, FY2004:
Total Population7: 18,470 - Male: 8,312 - Female: 10,158
B. Labor Force: Total Labor: 13,890
- Agriculture Sector: 65% - Business/Service Sector: 25% - Industrial Sector: 10%
C. Ethnic Minorities: None D. Average Monthly Income (per person): VND 350,000 – 400,000 E. Poverty Rate:
- 5.67% (Old standard of MOLISA, 2004) - 11.20%8 (New standard of MOLISA, 2004)
F. Educational Situation: - 98.0% of the children go to school. - compulsory general education at the primary level. - teaching staff skilled and knowledgeable; sufficient school buildings.
G. Health Care Situation9: - Cases of malnutrition under 5s per year: 26% (2004) - Cases of Malaria: 23 (2004) - New cases of Tuberculosis: 30 (2003) - New cases of HIV/AIDS: 1
H. Domestic Water Supply Situation (Percentage of HH Using Water) Tap Water: 50% Drill Well: 50% Dug Well: 15% Purchase Water/Rivers & Ponds: 0%
I. Solid Waste/Wastewater System: - 1 sanitation collection group with 7 employees; 1 truck. - no wastewater system in the town.
J. Environmental Sanitation and Awareness: Septic Tank: 70% Latrine: 25% Temporary/No Toilet: 5% Boil Water for Drinking: 100% Sanitation Practices10: 90%
Note: This preliminary profile is based on a series of participatory meetings of the Project Team in each town.
7 This figure is based on meetings and discussions with the PPCs and MABUTIP, the surveys conducted by the Consultant’s engineering
and socioeconomic group, towns statistics books and existing master plans. 8 Poverty rate based on MOLISA poverty line 2005. 9 Statistics were provided by the Song Cau Health Care Center. 10 Specific question asked of the respondents was whether they washed their hands after using the toilet.

TA 4485-VIE: Central Region Small and Medium Towns Development Project FINAL REPORT Appendix 3, page 12
June 2006
SOCIOECONOMIC SURVEY OF SONG CAU: SUMMARY FINDINGS
1. BACKGROUND ON THE AREA
As a provincial city, Phu Yen provides a range of goods and services not typically available in other towns of the province. It is the administrative center of government at the provincial level, political center of the Communist Party, and the trading and financial center of the private sector. Phu Yen not only services the rural hinterland but all towns and communes in the province as well.
Song Cau is a Class V provincial town in Phu Yen Province. It is located on National Highway 1A, approximately 55 kilometers north of the provincial capital Tuy Hoa. The town lies on a narrow coastal plain and is crossed by three main rivers, the Thi Thach, Luc Khau and Tam Giang. As a small provincial town Song Chau provides a range of goods and services to the rural hinterland. Though it boasts of an economy based on fishing and tourism, per capita incomes (as only 94.3% of the Project area average) do not suggest it is a very prosperous town. There are plans to promote more rapid population growth in the town than in the larger provincial center of Tuy Hoa. However, perhaps this is a function of smaller towns more closely linked to the rural hinterland (in this case coastal hinterland) than the larger provincial centers.
Song Cau has a reasonably diverse economy. Its reliance on fishing however, renders the town vulnerable to issues of sustainable fishing. Fortunately, it also relies on tourism to buttress such problems.
2. ECONOMY
Song Cau has a reasonably diverse economy although having to rely on fishing renders it vulnerable to issues of sustainable fish catches as is typical of towns that rely to an important extent on fishing. However, it also has tourism that is able to buttress such problems. The Master Plan forecasts that the town’s population will grow by 7.2% and 4.3% thereafter. It is assumed that most of this growth will come from the rural hinterland.
3. DEMOGRAPHIC PROFILE
Song Cau has a total population of 18,470 comprised of 8,312 males and 10,158 females. According to the TPC all people living in Song Cau are ethnic Kinh so it must be assumed that no ethnic minority development issues need to be considered.
The Master Plan forecasts that the town’s population will grow by 7.2% and 4.3% thereafter. It is assumed that most of this growth will come from the rural hinterland.
3.1 Labor Force and Employment
Based on the survey, workers in the business and service sector of Song Cau account for 25 percent of the workforce while industrial sector 10 percent, and farmers and agricultural workers 65 percent. There are fewer public sector workers because this is a small town but there is a substantial number of waged workers due to employment opportunities in fishing (normally processing) and to some extent in tourism.

TA 4485-VIE: Central Region Small and Medium Towns Development Project FINAL REPORT Appendix 3, page 13
June 2006
3.2 Income
The residents of Song Cau receive an average monthly income between VND 350,000 - 400,000.
3.3 Education
Survey results show that 98 percent of children in Song Cau attend school. This may be attributable to the fact that general education at the primary level is compulsory. Meanwhile, the teaching staff was found to be skilled and knowledgeable and there is a sufficient number of school buildings.
3.4 Health
Cases of malnutrition for children under 5 years in Song Cau town were pegged at 26% in 2004. Cases of malaria reached 23 per 1,000 people during the same year. New cases of tuberculosis reached 30 in 2003 and new cases of HIV/AIDS was only 1.
3.5 Land Ownership
Majority of those surveyed do not have certificates of land use (96 percent) to their home lot. Of those who have certificates, almost all of them were registered under their husband’s name.
4. POVERTY AND VULNERABILITY
The MOLISA poverty rate is 11.2 percent with the highest incidence being in the ward of Long Phuoc Dong (12.8%) and lowest in the ward of Long Binh (4.98%). The Water Poverty Index is 21.7 percent based on the average price of VND 12,500, the amount paid for by 6 percent of households. This is one of the medium WPIs in the Project area though involving a small number of households as the survey reveals that 65.8 percent of households have access to piped water.
There is significant percentage of waged workers in the private sector in Song Cau who must be vulnerable to cyclical trends in Vietnam’s economy. As a small town there are few public sector opportunities. While it was impossible to determine the number of “unregistered” migrants (including from rural communes in the hinterland) this group is very likely to be in a vulnerable position because it is difficult to access existing health and educational services.
5. GENDER
The surveyed households in Song Cau showed a slightly higher proportion (32 percent) of female-headed households (FHHS) compared to the national figure of 30 percent. Perhaps, this is due to the high number of households who have male members supplementing their incomes with work in urban centers. The FHHS’ monthly per capita income (VND 259,000) is slightly lower than those headed by males (VND 300,000). This is expected as females in this town have lower educational levels than their male counterparts. When we examine their incomes according to their occupation, the women get lower than the males. For example, among hired workers males get an average of VND618,000 per month, almost double than that of females (VND390,000).

TA 4485-VIE: Central Region Small and Medium Towns Development Project FINAL REPORT Appendix 3, page 14
June 2006
Women, in general, take care of WSS-related activities at the household level such as cooking, washing, cleaning, taking care of children, the sick and the elderly and disposing of human wastes and garbage. The women in almost half (45 percent) of the surveyed households have to obtain their water for drinking, cooking and washing from nearby stand post or connection, boreholes, open dug wells or purchase water from vendors. They spend an average of 24 minutes (wet season) or 27 minutes (dry season) a day in collecting water. This is a little bit longer compared to the time spent by other women in fetching water in other towns. During the wet season, almost three-fourths (72 percent) of the households suffer from flooding. As a result of these floods, both men and women suffer from illnesses (especially the children), financial losses and loss of employment and productivity due to flooding several times a year. In terms of sanitation, women in about 40 percent of the surveyed households throw their human waste into the nearest river, water channel or put into buckets to feed the fish in the fishponds or to fertilize gardens/farms. About 62 percent of the households have their garbage collected while the rest have it burned, buried or scattered it outside their homes.
Majority of those surveyed do not have certificates of land use (96 percent) to their home lot. Of those who have certificates, almost all of them have it registered under their husband’s name. In terms of community participation, women are very visible in the Women’s Union and the Elder Union but have lower visibility in the town/provincial committees. At most, their participation in the latter committees, is about 20 percent or less. Because women manage WSS-related activities, they are very eager for support in upgrading their water facilities. They want credit support for water connection, improvement of their drainage system and waste disposal as they have very low access to credit for these needs. Understandably, they trust the Women’s Union more to manage this type of credit.
6. INTERVENTIONS TO SUPPORT THE PROJECT
A culturally appropriate community environmental sanitation and awareness program that the TPC, VWU and NGO will help develop in conjunction with the local communities (inputs from local women will be a feature of this approach based on the premise that it is women who will be the driving force for improved environmental sanitation). It is via this program that some of the more inappropriate practices adopted by households used to urban living (e.g. using waterways to dispose of human waste which are under-stated in the TA Socioeconomic Survey) can be modified. Additionally those 34.2 percent of households without access to latrines and 45.4 percent of households without access to piped water will be supported via demand driven interventions where people as “consumers” rather than “beneficiaries” will decide what menu of options they are willing to finance.
7. LIVELIHOOD IMPROVEMENTS
The demand driven interventions should also further develop local entrepreneurship as households exercise their choice not only on the menu of options they are seeking but on what prices they are prepared to pay (hence the development of a market economy grounded in existing and potential livelihood possibilities).
Of equal importance by attempts to involve all of the population in a “total” or “100 percent” approach to environmental sanitation (proposed interventions benefit whole communities not just individual households) not only does such an approach improve health but also empowers the local people of Song Cau by actively involving them in

TA 4485-VIE: Central Region Small and Medium Towns Development Project FINAL REPORT Appendix 3, page 15
June 2006
the design of the program but also develops a sense of unity and purpose among different groups living in the same ward but also on an inter-ward basis. Developing civic pride in a small town such as Song Cau is important because its economy relies to an important extent on tourism and there needs to be a local consensus as to what should constitute a “clean” town otherwise Song Cau will find other small towns in a similar position able to mobilize their populations will be in a better position.
8. ACCESS TO WATER SUPPLY
Based on the survey, 50% of households in Song Cau use tap water for their domestic needs, while another 50% make use of drill well as source of water supply. About 15% likewise utilize dug well as another water supply source.
9. SOLID WASTE MANAGEMENT
A majority (64.9%) of households dispose of solid waste either by burning, burying or scattering on the ground. Only 35.2% of households dispose of solid waste that is collected by a solid waste management company.
10. ENVIRONMENTAL SANITATION AND AWARENESS
Survey results show that 90% of respondents in Song Cau were found to have adapted certain sanitation practices like washing hands after using the toilet and boiling of water for drinking (100%). About 70% has septic tank, 25% uses the latrine and only 5% has temporary or no toilet.

TA 4485-VIE: Central Region Small and Medium Towns Development Project FINAL REPORT Appendix 3, page 16
June 2006
SOCIOECONOMIC PROFILE OF CAM RANH TOWN: OVERVIEW
A. Population, FY2004: Total Population11: 215,822 - Male: 107,833 - Female: 107,989
B. Labor Force: Total Labor: 119,826
- Agriculture/Aquaculture Sector: 65% - Industrial Sector: 12% - Business/Service Sector: 23%
C. Ethnic Minorities: There are a few individual ethnic minority households living in the service area. D. Average Monthly Income (per person): VND 300,000 – 350,000 E. Poverty Rate:
- 3.7% (Old standard of MOLISA, 2005) - 16.5% (New standard of MOLISA, 2005)
F. Educational Situation: - 99.0% of the children go to school. - compulsory general education at the primary level. - teaching staff skilled and knowledgeable; sufficient school buildings.
G. Health Care Situation12: - Cases of malnutrition under 5s per year: 21.05% (2004) - Infant mortality (per 1,000 live births, per year): 9.27% (2004) - Maternal mortality ratio (per 10,000 live births, per year): 26 (2003) - Cases of Malaria: 306 (2004) - Cases of Dengue Fever: 424 (up to 2005) - New cases of Tuberculosis: 172 (2004) - New cases of HIV/AIDS: 31 (2004)
H. Domestic Water Supply Situation (Percentage of HH Using Water) Tap Water: 8% (only in Can Thuan and Cam Linh wards) Drill Well/Dug Well: 40% Purchase Water/Rivers and Ponds: 50%
I. Solid Waste/Wastewater System: - 60-70% of the solid waste of HH in wards and towns are being collected by trucks of the sanitation center. - inadequate wastewater systems in the town causes flooding by a depth of as much as 30-50cm during the
rainy season. J. Environmental Sanitation and Awareness:
Septic Tank: 62% Latrine: 25% Temporary/No Toilet: 13% Boil Water for Drinking: 100% Sanitation Practices13: 80%
Note: This preliminary profile is based on a series of participatory meetings of the Project Team in each town.
11 This figure is based on meetings and discussions with the PPCs and MABUTIP, the surveys conducted by the Consultant’s engineering
and socioeconomic group, towns statistics books and existing master plans. 12 Statistics were provided by the Cam Ranh Health Care Center. 13 Specific question asked of the respondents was whether they washed their hands after using the toilet.

TA 4485-VIE: Central Region Small and Medium Towns Development Project FINAL REPORT Appendix 3, page 17
June 2006
SOCIOECONOMIC SURVEY OF CAM RANH: SUMMARY FINDINGS
1. BACKGROUND ON THE AREA
Cam Ranh is a large-sized Central Coastal IV town in the province of Khan Hoa. It is located on National Highway 1A, approximately 35 kilometers south of Nha Trang City and 379 kilometers north of Hio Chi Minh City. Like most other towns in the Central Region it lays on a narrow coastal plain and a prominent feature of Cam Ranh is that it is the site of Mainland Southeast Asia’s deepest harbor.
Can Ranh is an important town in its own right and many of the goods and services produced are for local consumption in the town but Cam Ranh also services the narrow rural hinterland. In particular, it provides a range of health and educational services not typically available in the smaller towns or communes.
Cam Ranh lies outside the dynamic tourist-driven economic development of the provincial capital Nha Trang and it is to small to attract the types of direct and indirect foreign investment that cities such as Ho Chi Minh are able to attract. Without the investment by the public sector, especially in defense related activities, Cam Ranh is likely to lack some of the dynamic variables (e.g. close proximity to markets and good development.)
2. ECONOMY
Cam Ranh lies outside the dynamic tourist-driven economic development of the provincial capital Nha Trang and it is too small to attract the types of direct and indirect foreign investment that cities such as Ho Chi Minh are able to attract. Without the investment by the public sector, especially in defense related activities, Cam Ranh is likely to lack some of the dynamic variables (e.g. close proximity to markets and good transport infrastructure) that are necessary for the private sector to drive rapid economic development. The Master Plan is very modest and forecasts that the urban population will grow by 1.8 percent over the next fifteen years. Existing economic based activities are likely to be able to support that level of growth.
3. DEMOGRAPHIC PROFILE
Cam Ranh has a total population of 215,822 persons. According to TPC and Ward records not only ethnic Kinh live in Cam Ranh but some other ethnic minorities (including the ethnic Hoa). Some of the ethnic Kinh have migrated here in the post-1975 period - when there was a large Soviet naval presence – but Cam Ranh was a relatively important town prior to 1975 when significant numbers of South Vietnamese troops and their US advisors were located here. The Master Plan is very modest and forecasts that the urban population will grow 1.8 percent over the next fifteen years. Existing economic based activities are likely to be able to support that level of growth.
3.1 Labor Force and Employment
According to the TA Socioeconomic Survey the total labor force is 119,826 of which the majority (65%) comes from the agricultural/aquacultural sector, 12% from the industrial sector and 23% from the business and service sector.

TA 4485-VIE: Central Region Small and Medium Towns Development Project FINAL REPORT Appendix 3, page 18
June 2006
3.2 Income
The average per capita monthly income is VND300,000 - 350,000.
4. POVERTY AND VULNERABILITY
The MOLISA poverty rate is 16.5 percent with the highest poverty rate being in Cam Thuan Ward (24.8%) and lowest in Cam Loc (11%). However, because people in Cam Ranh pay the highest average water price in the Project area of VND 43,300 the Water Poverty Index takes the WPI to 66.6 percent.
5. GENDER
Cam Ranh has a lower number of female-headed households (FHHS) (22 percent) compared to the national average of 30 percent. This town does not seem to have a high proportion of male labor migrants to other urban centers compared to other towns. Moreover, the FHHS’ monthly per capita income is almost equal to those headed by males (VND 307,000). This is perhaps due to the fact that females here in this town do not suffer so much educational disparities from the males. In fact, the proportion of illiterate women is quite small (3 percent), not much higher than that of males (2 percent). But when we examine their incomes according to their occupation, the women get lower than the males. For example, among hired workers males get an average of VND624,000 per month compared to females (VND440,000).
Women, in general, take care of WSS-related activities at the household level such as cooking, washing, cleaning, taking care of children, the sick and the elderly and disposing of human wastes and garbage. The women in almost three-fourths of the surveyed households have to obtain their water for drinking, cooking and washing from nearby stand post or connection, boreholes, open dug wells or purchase water from vendors (45 percent). They spend an average of 15 minutes (wet season) or 20 minutes (dry season) a day in collecting water. During the wet season, about 28 percent of the households suffer from flooding. As a result of these floods, both men and women suffer from illness (especially the children), financial losses and loss of employment and productivity due to flooding several times a year. In terms of sanitation, majority of households (87 percent) throw their human wastes to the river, sea or channel. About 55 percent of the households have their garbage collected while the rest have it burned, buried or scattered it outside their homes.
Majority of those surveyed do not have certificates of land use (94 percent) to their home lot. Of those who have certificates, almost all of them have it registered under their husband’s name. In terms of community participation, women are very visible in the Women’s Union and the Elder Union but have lower visibility in the town/provincial committees. At most, their participation in the latter committees, is about 20 percent or less. Because women manage WSS-related activities, they are very eager for support in upgrading their water facilities. They want credit support for water connection, improvement of their drainage system and waste disposal as they have very low access to credit for these needs. Understandably, they trust the Women’s Union more to manage this type of credit.

TA 4485-VIE: Central Region Small and Medium Towns Development Project FINAL REPORT Appendix 3, page 19
June 2006
6. INTERVENTIONS TO SUPPORT THE PROJECT
A culturally appropriate community environmental sanitation and awareness program that the TPC, VWU and NGO will help develop in conjunction with the local communities (inputs from local women will be a feature of this approach based on the premise that it is women who will be the driving force for improved environmental sanitation). It is via this program that some of the more inappropriate practices adopted by households used to urban living (e.g. using harbor foreshore for disposal of human waste) can be modified. Additionally those 40 percent of households without access to latrines and 36 percent of households without access to piped water will be supported via demand driven interventions where people as “consumers” rather than “beneficiaries” will decide what menu of options they are willing to finance.
7. LIVELIHOOD IMPROVEMENTS
The demand driven interventions should also further develop local entrepreneurship as households exercise their choice not only on the menu of options they are seeking but on what prices they are prepared to pay (hence the development of a market economy grounded in existing and potential livelihood possibilities). This is important in a town where the public sector plays a prominent role and serves as a counter-weight to the traditional culture of the public sector.
Of equal importance by attempts to involve all of the population in a “total” or “100 percent” approach to environmental sanitation (proposed interventions benefit whole communities not just individual households) not only does such an approach improve health but also empowers the local people of Cam Ranh by actively involving them in the design of the program but also develops a sense of unity and purpose among different groups living in the same ward but also on an inter-ward basis. Developing civic pride in a large town such as Cam Ranh is a practical livelihood issue related to levels of greater self-esteem.
8. ACCESS TO WATER SUPPLY
Forty-four percent of households have access to piped water but 50 percent of households in the dry season need to purchase water from vendors. Other households rely on a combination of dug wells and rainwater storage tanks.
9. SOLID WASTE MANAGEMENT
Sixty percent of households dispose of solid waste that is collected by a solid waste management company. Other households burn (30.3%), bury (3%) or scatter (2%) their solid waste. Most of the households interviewed would be willing to pay for the sustainable disposal of solid waste.
10. ENVIRONMENTAL SANITATION AND AWARENESS
Some 25 percent of households have access to improved latrines. Around 49 percent of households stated that they are willing to pay for improved drainage.

TA 4485-VIE: Central Region Small and Medium Towns Development Project FINAL REPORT Appendix 3, page 20
June 2006
SOCIOECONOMIC PROFILE OF NINH HOA TOWN: OVERVIEW
A. Population, FY 2004:
Total Population14: 117,033 B. Labor Force: Total Labor: 108,638
- Agriculture/Aquaculture Sector: 72% - Business/Service Sector: 14% - Industrial Sector: 14%
C. Ethnic Minorities: There are only a few individual ethnic minority HH living in the service area. D. Average Monthly Income (per person): VND 400,000 – 500,000 E. Poverty Rate:
- 3.0% (Old standard of MOLISA, 2005) - 17.4% (New standard of MOLISA, 2005)
F. Educational Situation: - 99.0% of the children go to school. - compulsory general education at the primary level. - teaching staff skilled and knowledgeable; sufficient school buildings.
G. Health Care Situation15: - Cases of malnutrition under 5s per year: 2,575 (2004) - Cases of Malaria: 35 (2004) - Cases of Dengue Fever: about 100 (2005) - New cases of Tuberculosis: 45 (2004) - New cases of HIV/AIDS: 0
H. Domestic Water Supply Situation (Percentage of HH Using Water) Tap Water: 15% Drill Well/Dug Well: 70% Rivers & Ponds: 15%
I. Solid Waste/Wastewater System: - 40-50% of HH solid waste is collected by trucks of the sanitation center. - inadequate wastewater system in the town. - only 180 HH located east of No. 1 National Road has drainage/wastewater systems.
J. Environmental Sanitation and Awareness: Septic Tank: 70% Latrine: 25% Temporary/No Toilet: 5% Boil Water for Drinking: 95% Sanitation Practices16: 80%
Note: This preliminary profile is based on a series of participatory meetings of the Project Team in each town.
14 This figure is based on meetings and discussions with the PPCs and MABUTIP, the surveys conducted by the Consultant’s engineering
and socioeconomic group, towns statistics books and existing master plans. 15 Statistics were provided by the Ninh Hoa Health Care Center. 16 Specific question asked of the respondents was whether they washed their hands after using the toilet.

TA 4485-VIE: Central Region Small and Medium Towns Development Project FINAL REPORT Appendix 3, page 21
June 2006
SOCIOECONOMIC SURVEY OF NINH HOA: SUMMARY FINDINGS
1. BACKGROUND ON THE AREA
Ninh Hoa is a Class V small town at the center of Ninh Hoa district. It is located at the T-junction of National Highway 1A and Highway 26 to Buon Ma Thuot, approximately 35 kilometers north of the provincial capital of Nha Trang in Khanh Hoa province. As a small district town, Ninh Hoa provides a range of goods and services to the rural hinterland, which is an important distribution channel owing to its location at the junction of the highway to Buon Ma Thuot and Nha Trang where products from the Central Highlands normally pass through.
Ninh Hoa is a typical rural service town in the Central Coastal Region of Vietnam except its strategic location at the junction of this region and the Central Highlands generates greater opportunities for the movement of goods and services between and through both regions.
2. ECONOMY
Ninh Hoa is a typical rural service town in the Central Coastal Region of Vietnam except its strategic location at the junction of this region and the Central Highlands generates greater opportunities for the movement of goods and services between and through both regions. The Master Plan forecasts that the town’s population will grow by 2.2% to 2010, 2.1% to 2015 and 2% to 2020. This growth is likely to come not only from the rural hinterland but with migrants seeking livelihood-based opportunities providing goods and services between the coast and highlands.
3. DEMOGRAPHIC PROFILE
Ninh Hoa has a total population of 117,033. According to the 2004 Master Plan, two new residential areas namely Ninh Thuy and Ninh Phuoc are expected to provide an additional 15,000 people to Ninh Hoa based on the existing population levels. The Master Plan forecasts that the town’s population will grow by 2.2% to 2010, 2.1% to 2015 and 2% to 2020. This growth is likely to come not only from the rural hinterland but with migrants seeking livelihood-based opportunities providing goods and services between the coast and highlands.
There are only a few individual ethnic minority households living in the area.
3.1 Labor Force and Employment
Based on the survey, total labor force reached 108,638 wherein 72% work in the agriculture/aquaculture sector, 14% in the business/services sector and 14% in the industrial sector. Since it is a small town, there are fewer public sector workers but have substantial number of waged workers due to presence of employment opportunities in transport and farming related activities.

TA 4485-VIE: Central Region Small and Medium Towns Development Project FINAL REPORT Appendix 3, page 22
June 2006
3.2 Income
The residents of Ninh Hoa receive an average monthly income between VND 400,000 - 500,000.
3.3 Education
Survey results show that 99 percent of children in Song Cau attend school. This may be attributable to the fact that general education at the primary level is compulsory. Meanwhile, the teaching staff was found to be skilled and knowledgeable and there is presence of sufficient school buildings.
3.4 Health
Cases of malnutrition for children under 5 years in Ninh Hoa town was pegged at 2,575 in 2004. Cases of malaria reached 35 per 1,000 people during the same year. New cases of tuberculosis reached 45 in 2004 and cases of dengue fever reached about 100 in 2005.
3.5 Land Ownership
Majority of those surveyed said they have certificates of land use 70% to their home lot. Of those who have certificates, majority (three-fourths) were registered in the husband’s name.
4. POVERTY AND VULNERABILITY
The MOLISA poverty rate is 17.4 percent, with the highest poverty rate being in the ward of Ninh Dong (27.1%) and lowest in the ward of Ninh Phung (8.08%). The Water Poverty Index is 43.0 percent and this is based on the average price of VND 20,400 that 16.7 percent of households pay for water. This is one of the highest WPIs in the Project area but involves a small number of households. The TA socioeconomic survey reveals that 77.8 percent of households do not have access to piped water. There is little problem identifying the pro-poor approach of the Project because water supply development and expansion will be supported along with the other components. Also, improved community environmental sanitation (especially for 45.4% of households without access to improved latrines) will contribute to an overall improvement in WSS related livelihood outcomes.
5. GENDER
The surveyed households in Ninh Hoa showed a slightly lower proportion (28 percent) of female-headed households (FHHS) compared to the national figure of 30 percent. Aside from the usual households headed by widows and separated women, quite a number of households send their male members to work in urban centers to supplement their meager incomes. But in this town, the FHHS’ monthly per capita income (VND 270,000) is slightly higher than those headed by males (VND 240,000). Perhaps, this is because there were more women-headed households engaged in business or entrepreneurial activities. But, the household incomes of both types of households are lower than those of other towns. Perhaps, this is because both men and women have low education as less than 1 percent have reached college. When we examine the incomes of both men and women by occupation, women always earn

TA 4485-VIE: Central Region Small and Medium Towns Development Project FINAL REPORT Appendix 3, page 23
June 2006
lower than their counterparts. For example, among hired workers males get an average of VND682,000 per month, double than that of females (VND320,000).
Women, in general, take care of WSS-related activities at the household level such as cooking, washing, cleaning, taking care of children, the sick and the elderly and disposing of human wastes and garbage. Doing these tasks pose a challenge for the women because in Ninh Hoa, majority (89 percent) obtain their water from stand post or water connection shared with neighbors, boreholes, dug well while about 17 percent purchase it from water vendors. Women spend an average of 18-20 minutes per day collecting. During wet season, about 65 percent of the households experience flooding. As a result, both men and women in these households suffer from illnesses (especially the children), financial losses and loss of employment and productivity due to flooding several times a year. In terms of sanitation, a large proportion (64 percent) of the households do not have access to toilet facilities and defecate in their gardens/fields and dispose it to the nearest river/water channels. About 15 percent have their garbage collected while 80 percent burn them and the rest have it buried or scattered outside their homes.
Majority of those surveyed said they have certificates of land use (70 percent) to their home lot. Of those who have certificates, majority (three-fourths) were registered in the husband’s name. In terms of community participation, women are very visible in the Women’s Union and the Elder Union but have lower visibility in the town/provincial committees. At most, their participation in the latter committees, is about 20 percent or less. Because women manage WSS-related activities, they are very eager for support in upgrading their water facilities. They want credit support for water connection, improvement of their drainage system and waste disposal as they have very low access to credit for these needs. Understandably, they trust the Women’s Union more to manage this type of credit.
6. INTERVENTIONS TO SUPPORT THE PROJECT
A culturally appropriate community environmental sanitation and awareness program that the TPC, VWU and NGO will help develop in conjunction with the local communities (inputs from local women will be a feature of this approach based on the premise that it is women who will be the driving force for improved environmental sanitation). It is via this program that some of the more inappropriate practices adopted by households used to urban living (people were reluctant to state how they disposed of human waste) can be modified. Additionally those 59.3 percent of households without access to latrines and 77.8 percent of households without access to piped water will be supported via demand driven interventions where people as “consumers” rather than “beneficiaries” will decide what menu of options they are willing to finance.
7. LIVELIHOOD IMPROVEMENTS
The demand driven interventions should also further develop local entrepreneurship as households exercise their choice not only on the menu of options they are seeking but on what prices they are prepared to pay (hence the development of a market economy grounded in existing and potential livelihood possibilities within Ninh Hoa rather than having to rely on its strategic location between the coast and uplands).
Of equal importance by attempts to involve all of the population in a “total” or “100 percent” approach to environmental sanitation (proposed interventions benefit whole communities not just individual households) not only does such an approach improve

TA 4485-VIE: Central Region Small and Medium Towns Development Project FINAL REPORT Appendix 3, page 24
June 2006
health but also empowers the local people of Ninh Ho by actively involving them in the design of the program but also develops a sense of unity and purpose among different groups living in the same ward but also on an inter-ward basis. It will also be important as the urban population of Ninh Ho is set to increase by 40 percent when the population of Ninh Thuy and Ninh Phuoc are included.
8. ACCESS TO WATER SUPPLY
Improved water supply development and expansion will be financed in Ninh Hoa, which is important because the existing water treatment plant can often only supply 60 percent of Ninh Hoa’s current capacity. Hence even existing demand for treated water in Ninh Hoa cannot be met.
Meanwhile, based on the survey, 15% of households in Ninh Hoa use tap water for their domestic needs, while another 700% make use of drill well or dug well as source of water supply. About 15% likewise utilize rivers and ponds as another water supply source.
9. SOLID WASTE MANAGEMENT
About 40 to 50 percent of households dispose of solid waste that is collected by trucks of the sanitation center. The rest of the households dispose of solid waste either by burning, burying or scattering on the ground.
10. FLOODING INCIDENCE
During wet season, about 65 percent of the households experience flooding. As a result, both men and women in these households suffer from illnesses (especially the children), financial losses and loss of employment and productivity due to flooding several times a year. In terms of sanitation, a large proportion (64 percent) of the households does not have access to toilet facilities, using their gardens/fields instead, then disposing the waste to the nearest river/water channels.
11. ENVIRONMENTAL SANITATION AND AWARENESS
Survey results show that 80% of respondents in Ninh Hoa were found to have adapted certain sanitation practices like washing hands after using the toilet and boiling of water for drinking (95%). About 70% has septic tank, 25% uses the latrine and only 5% has temporary or no toilet.

TA 4485-VIE: Central Region Small and Medium Towns Development Project FINAL REPORT Appendix 3, page 25
June 2006
SOCIOECONOMIC PROFILE OF VAN GIA TOWN: OVERVIEW
A. Population, FY2004: Total Population17: 77,359
B. Labor Force: - Agriculture: 38.7% - Industrial Sector: 48.1% - Business/Service Sector: 27.3% - Public Sector: 8.9%
C. Ethnic Minorities: Kinh (99.8%); Minority (0.2%). D. Average Monthly Income (per person): VND 250,000 – 300,000 E. Poverty Rate:
- 13.6% (New standard of MOLISA, 2005) F. Educational Situation:
- 99.0% of the children go to school. - compulsory general education at the primary level. - teaching staff skilled and knowledgeable; sufficient school buildings.
G. Domestic Water Supply Situation (Percentage of HH Using Water) Tap Water: 7.1% Drill Well: 15.3% Dug Well: 50% Purchase Water: 2%
H. Solid Waste/Wastewater System: - 15% of human waste is thrown out to nearest river, lake or channel, while 38.3% is collected to farmers and
45% is treated as fertilizer for garden. The local waste management company collected 61% of garbage, while the rest was treated as burned (21%), buried (16%), scattered outside (1%).
I. Environmental Sanitation and Awareness: Septic Tank: 62% Latrine: 25% Temporary/No Toilet: 15% Boil Water for Drinking: 100% Sanitation Practices18: 80%
Note: This preliminary profile is based on a series of participatory meetings of the Project Team in each town.
17 This figure is based on meetings and discussions with the PPCs and MABUTIP, the surveys conducted by the Consultant’s engineering
and socioeconomic group, towns statistics books and existing master plans. 18 Specific question asked of the respondents was whether they washed their hands after using the toilet.

TA 4485-VIE: Central Region Small and Medium Towns Development Project FINAL REPORT Appendix 3, page 26
June 2006
SOCIOECONOMIC SURVEY OF VAN GIA: SUMMARY FINDINGS 1. BACKGROUND ON THE AREA
Van Gia is a district town of Van Ninh District, Khanh Hoa Province. It is located along National Highway 1A, approximately 30 kilometers north of Ninh Hoa and 65 kilometers north of Nha Trang.
Van Gia is typical small town in the Central Coastal Region. Goods and services being supplied along the National Highway are probably enough to induce a reasonable level of sustainable growth, as are improvements to agricultural technologies in the rural hinterland served by Van Gia.
2. ECONOMY
Van Gia is typical small town in the Central Coastal Region. The Master Plan forecasts that the town’s population will grow by 2.2% to 2010, 2.1% to 2015 and 2% to 2020, which are above average growth rates for the country as a whole but within the range of forecasts for most other small towns in this region. Goods and services being supplied along the National Highway are probably enough to induce a reasonable level of sustainable growth, as are improvements to agricultural technologies in the rural hinterland served by Van Gia.
3. DEMOGRAPHIC PROFILE
Van Gia has a population of 77,359. The Master Plan forecasts that the town’s population will grow by 2.2% to 2010, 2.1% to 2015 and 2% to 2020, which are above average growth rates for the country as a whole but within the range of forecasts for most other small towns in this region.
3.1 Labor Force and Employment
According to the TA Socioeconomic Survey in Van Gia waged workers in the private sector account for 48.1 percent of the workforce, owners of small and medium enterprises 27.3%, agricultural and farm workers 15.5 percent 23.2 percent, and public sector workers account for 8.9 percent of the workforce. There are fewer public sector workers because this is a small town but substantial number of waged workers exist because of employment opportunities in transport-related activities.
3.2 Income
The average per capita monthly income is VND 262,000 (for males VND 271,000 and females VND 224,000), which is 17.6 percent lower than the average for all Project towns.
3.3 Land Ownership
None of those surveyed households possess certificate of land use and majority of their housing structures are either temporary (25%) or semi-permanent (67%).

TA 4485-VIE: Central Region Small and Medium Towns Development Project FINAL REPORT Appendix 3, page 27
June 2006
4. POVERTY AND VULNERABILITY
The MOLISA poverty rate is 13.6 percent, with the highest poverty rate being in the ward of Luong Hai (4.4%) and lowest in the ward of Unit 4 (0.8%). The Water Poverty Index is 30.4 percent and this is based on the average price of VND 20,800 that only 2 percent of households pay for water, which is among the lowest rate in the Project area. The TA socioeconomic survey reveals that 65 percent of households do not have access to piped water. There is little problem identifying the pro-poor approach of the Project because water supply development and expansion will be supported along with the other components. Also, improved community environmental sanitation (especially for 28.3% of households without access to improved latrines) will contribute to an overall improvement in WSS related livelihood outcomes.
5. GENDER
The surveyed households in Van Gia showed a much lower proportion (21 percent) of female-headed households (FHHS) compared to the national figure of 30 percent. The FHHS’ monthly per capita income (VND 224,000) is slightly lower than those headed by males (VND 271,000). In general, the household incomes of both types of households are lower than those of other towns. Perhaps, this is because majority (81 percent) of both men and women have only reached secondary education. But there seems to be parity here in terms of education because the proportion of low educated females (81.6 percent) is almost equal to those of males (81.3 percent). But when we look at the incomes of both men and women by occupation, women always earn lower than their counterparts. For example, among teachers, males get an average of VND1,525,000 per month, more than double than that of females (VND633,000). The same pattern holds among farmers, where males get VND 637,000 per month, quite higher compared to those of females (VND 271,000). Among hired workers, the gap is not much with males earning VND 395,00 per month compared to those of females (VND 304,000).
Women, in general, take care of WSS-related activities at the household level such as cooking, washing, cleaning, taking care of children, the sick and the elderly and disposing of human wastes and garbage. Half of the households collect their water from dug wells (50 percent), shared with neighbors (27 percent) and boreholes. Women spend an average of 10-16 minutes per day collecting water, depending on the season. During wet season, more than half (52 percent) of the households, experience flooding. As a result, both men and women in these households suffer from water-borne illnesses (especially the children), financial losses and loss of employment and productivity due to flooding several times a year. In terms of sanitation, about half (50 percent) of the households dispose their human wastes as fertilizer for gardens/farms and fish ponds while 40 percent bury it and the remainder dispose it to the nearest river or water channel. About 61 percent have their garbage collected while the remainder have it burned (21 percent) or bury it in the ground.
None of those surveyed households possess certificate of land use and majority of their house structures are either temporary (25 percent) or semi-permanent (67 percent). In terms of community participation, women are very visible in the Women’s Union and the Elder Union but have lower visibility in the town/provincial committees. At most, their participation in the latter committees, is about 20 percent or less. Because women manage WSS-related activities, they are very eager for support in upgrading their water facilities. They want credit support for water connection, improvement of their drainage system and waste disposal as they have very low

TA 4485-VIE: Central Region Small and Medium Towns Development Project FINAL REPORT Appendix 3, page 28
June 2006
access to credit for these needs. Understandably, they trust the Women’s Union more to manage this type of credit.
6. INTERVENTIONS TO SUPPORT THE PROJECT
A culturally appropriate community environmental sanitation and awareness program that the TPC, VWU and NGO will help develop in conjunction with the local communities (inputs from local women will be a feature of this approach based on the premise that it is women who will be the driving force for improved environmental sanitation). It is via this program that some of the more inappropriate practices adopted by households used to urban living (people were reluctant to state how they disposed of human waste) can be modified. Additionally those 28.3 percent of households without access to latrines and 65 percent of households without access to piped water will be supported via demand driven interventions where people as “consumers” rather than “beneficiaries” will decide what menu of options they are willing to finance.
7. LIVELIHOOD IMPROVEMENTS
The demand driven interventions should also further develop local entrepreneurship as households exercise their choice not only on the menu of options they are seeking but on what prices they are prepared to pay (hence the development of a market economy grounded in existing and potential livelihood possibilities within Van Gia rather than having to rely on its strategic location between the coast and uplands).
Of equal importance by attempts to involve all of the population in a “total” or “100 percent” approach to environmental sanitation (proposed interventions benefit whole communities not just individual households) not only does such an approach improve health but also empowers the local people of Van Gia by actively involving them in the design of the program but also develops a sense of unity and purpose among different groups living in the same ward but also on an inter-ward basis.
8. ACCESS TO WATER SUPPLY
Improved water supply development and expansion will be financed in Ninh Hoa, which is important because existing water treatment plant can often only supply 60 percent of Ninh Hoa’s current capacity. Hence even existing demand for treated water in Ninh Hoa cannot be met.
Meanwhile, based on the survey, 15% of households in Ninh Hoa use tap water for their domestic needs, while another 70% make use of drill well or dug well as source of water supply. About 15% likewise utilize rivers and ponds as another water supply source.
9. SOLID WASTE MANAGEMENT
About 40 to 50 percent of households dispose of solid waste that is collected by trucks of the sanitation center. The rest of the households dispose of solid waste either by burning, burying or scattering on the ground.

TA 4485-VIE: Central Region Small and Medium Towns Development Project FINAL REPORT Appendix 3, page 29
June 2006
10. FLOODING INCIDENCE
During the wet season, more than half (52%) of the households experience flooding. As a result, both men and women in these households suffer from water-borne illnesses (especially the children), financial losses and loss of employment and productivity due to flooding several times a year.
11. ENVIRONMENTAL SANITATION AND AWARENESS
In terms of sanitation, about half (50%) of the households dispose their human wastes as fertilizer for gardens/farms and fish ponds while 40 percent bury it and the remainder dispose it to the nearest river or water channel. About 61 percent have their garbage collected while the remainder have it burned (21%) or bury it in the ground.

TA 4485-VIE: Central Region Small and Medium Towns Development Project FINAL REPORT Appendix 3, page 30
June 2006
SOCIOECONOMIC PROFILE OF TAN SON TOWN: SUMMARY
A. Population, FY2004:
Total Population19: 38,432 B. Labor Force: Total Labor: 6,734
- Agriculture/Aquaculture Sector: 45% - Industrial Sector: 20% - Business/Service Sector: 35%
C. Ethnic Minorities: None. D. Average Monthly Income (per person): VND 500,000 – 600,000 E. Poverty Rate:
- about 8.3% (New standard of MOLISA, 2005) F. Educational Situation:
- 99.0% of the children go to school. - compulsory general education at the primary level. - teaching staff skilled and knowledgeable; sufficient school buildings.
G. Health Care Situation20: - Cases of malnutrition under 5s per year: 264 (2004) - Cases of Malaria: 317 (2004) - New cases of Tuberculosis: 121 (2004) - New cases of HIV/AIDS: 0
H. Domestic Water Supply Situation (Percentage of HH Using Water) Tap Water: 50% Drill Well: 0% Dug Well: 25% Purchase Water: 0%
I. Solid Waste/Wastewater System: - lacks wastewater system.
J. Environmental Sanitation and Awareness: Septic Tank: 46% Latrine: 38% Temporary/No Toilet: 15% Boil Water for Drinking: 100% Sanitation Practices21: 90%
Note: This preliminary profile is based on a series of participatory meetings of the Project Team in each town.
19 This figure is based on meetings and discussions with the PPCs and MABUTIP, the surveys conducted by the Consultant’s engineering
and socioeconomic group, towns statistics books and existing master plans. 20 Statistics were based on the yearly report of the Health Care Center. 21 Specific question asked of the respondents was whether they washed their hands after using the toilet.

TA 4485-VIE: Central Region Small and Medium Towns Development Project FINAL REPORT Appendix 3, page 31
June 2006
SOCIOECONOMIC SURVEY OF TAN SON: SUMMARY FINDINGS
1. BACKGROUND ON THE AREA
Tan Son is a Class V district town of Ninh Son District, Ninh Thuan Province. It is located approximately 35 kilometers northwest of Phan Rang – Thap Cham Town on National Road No. 27 to Dalat Province in the Central Highlands. As a district town it offers a range of goods and services to the rural hinterland but as important is its relatively important route connecting the lower Central Highlands to the Central Coastal Region is strategically located.
Tan Son is a rather typical small town located on a relatively strategic link between the coast and highlands in the Central Coastal Region. Goods and services being supplied along the National Highway are probably enough to induce a reasonable level of sustainable growth, as are improvements to agricultural technologies in the rural hinterland served by Tan Son. However, the Da Nhim hydropower plant located approximately 16 kilometers from Tan Son is mooted to provide a source of electricity to non-agricultural based investors in a region where there is a current shortage of electricity for non-domestic purposes.
2. ECONOMY
Tan Son is a rather typical small town located on a relatively strategic link between the coast and highlands in the Central Coastal Region. The Master Plan forecasts that the town’s population will grow by 1.7% to 2010, 1.9% to 2015 and 2% to 2020, which are above average growth rates for the country as a whole but within the range of forecasts for most other small towns in this region. Goods and services being supplied along the National Highway are probably enough to induce a reasonable level of sustainable growth, as are improvements to agricultural technologies in the rural hinterland served by Tan Son. However, the Da Nhim hydropower plant located approximately 16 kilometers from Tan Son is mooted to provide a source of electricity to non-agricultural based investors in a region where there is a current shortage of electricity for non-domestic purposes.
3. DEMOGRAPHIC PROFILE
Tan Son has a total population of 38,432 but the town will expand to include the communes of Quang Son and Luong Son, and Industrial Zone No. 9, adjacent to Quang Son. The Master Plan forecasts that the town’s population will grow by 1.7% to 2010, 1.9% to 2015 and 2% to 2020, which are above average growth rates for the country as a whole but within the range of forecasts for most other small towns in this region.
According to the TPC all people living in Tan Son are ethnic Kinh so it must be assumed that no ethnic minority development issues need to be considered.
3.1 Labor Force and Employment
Based on the survey, total labor force reached 6,734 wherein 45% work in the agriculture/aquaculture sector, 35% in the business/services sector and 20% in the industrial sector.

TA 4485-VIE: Central Region Small and Medium Towns Development Project FINAL REPORT Appendix 3, page 32
June 2006
3.2 Income
The residents of Ninh Hoa receive an average monthly income between VND 500,000 - 600,000.
3.3 Education
Survey results show that 99 percent of children in Tan Son attend school. This may be attributable to the fact that general education at the primary level is compulsory. Meanwhile, the teaching staff was found to be skilled and knowledgeable and there is presence of sufficient school buildings.
3.4 Health
Cases of malnutrition for children under 5 years in Tan Son town was pegged at 264 in 2004. Cases of malaria reached 317 during the same year. New cases of tuberculosis reached 121 in 2004.
3.5 Land Ownership
Majority (61%) of the surveyed households possess certificate of land use and more than half of them are registered in the name of the husband.
4. POVERTY AND VULNERABILITY
The MOLISA poverty rate is 8.3 percent, with the highest poverty rate being in the ward of Living Block (14%) and lowest in the ward of Living Block 2 (5.7%). The Water Poverty Index is 17.8 percent and this is based on the average price of VND 10,200 that 16 percent of households pay for water in the dry season and 14 percent in the wet season. The TA Socioeconomic Survey reveals that 49.9 percent of households do not have access to piped water. There is little problem identifying the pro-poor approach of the Project because water supply development and expansion will be supported along with the other components. Also, improved community environmental sanitation (especially for 62% of households without access to improved latrines) will contribute to an overall improvement in WSS related livelihood outcomes.
5. GENDER
The surveyed households in Tan Son have a lower proportion (24 percent) of female-headed households (FHHS) compared to the national figure of 30 percent. The FHHS’ monthly per capita income (VND 224,000) is slightly lower than those headed by males (VND 251,000). In general, the household incomes of both types of households are lower than those of other towns. Almost half (48 percent) of the surveyed households have monthly income per capita lower than VND 189,000. Almost 10 percent (9 percent for females, 8 percent for males) of those surveyed were illiterate. When we examine the incomes of both men and women by occupation, women always earn lower than their counterparts. For example, among teachers, males get an average of VND1,075,000 per month, three times than that of females (VND360,000). The same pattern holds among farmers, where males get VND 515,000 per month, quite higher compared to those of females (VND 308,000). Among hired workers, males earn VND 528,00 per month compared to those of females (VND 300,000).

TA 4485-VIE: Central Region Small and Medium Towns Development Project FINAL REPORT Appendix 3, page 33
June 2006
Women, in general, take care of WSS-related activities at the household level such as cooking, washing, cleaning, taking care of children, the sick and the elderly and disposing of human wastes and garbage. More than half of the surveyed households have water connections while 20 percent purchase water from vendors and the remainder share with their neighbors or from dug wells and rainwater tanks. Women spend an average of 12-16 minutes per day collecting water, depending on the season. Only a few 917 percent) reported having experienced flooding in their homes. In terms of sanitation, only 27 percent of the households dispose their human wastes as fertilizer for gardens/farms and fish ponds. Almost everyone (99 percent) said they burn their garbage.
Majority (61 percent) of the surveyed households possess certificate of land use and more than half of them are registered in the name of the husband. In terms of community participation, women are very visible in the Women’s Union and the Elder Union but have lower visibility in the town/provincial committees. At most, their participation in the latter committees, is about 20 percent or less. Because women manage WSS-related activities, they are very eager for support in upgrading their water facilities. They want credit support for water connection, improvement of their drainage system and waste disposal as they have very low access to credit for these needs. Understandably, they trust the Women’s Union more to manage this type of credit.
6. INTERVENTIONS TO SUPPORT THE PROJECT
A culturally appropriate community environmental sanitation and awareness program that the TPC, VWU and NGO will help develop in conjunction with the local communities (inputs from local women will be a feature of this approach based on the premise that it is women who will be the driving force for improved environmental sanitation). It is via this program that some of the more inappropriate practices adopted by households used to urban living (people were reluctant to state how they disposed of human waste) can be modified. Additionally households without access to latrines and piped water will be supported via demand driven interventions where people as “consumers” rather than “beneficiaries” will decide what menu of options they are willing to finance.
7. LIVELIHOOD IMPROVEMENTS
The demand driven interventions should also further develop local entrepreneurship as households exercise their choice not only on the menu of options they are seeking but on what prices they are prepared to pay (hence the development of a market economy grounded in existing and potential livelihood possibilities within Tan Son rather than having to rely on its strategic location between the coast and uplands).
Of equal importance by attempts to involve all of the population in a “total” or “100 percent” approach to environmental sanitation (proposed interventions benefit whole communities not just individual households) not only does such an approach improve health but also empowers the local people of Tan Son by actively involving them in the design of the program but also develops a sense of unity and purpose among different groups living in the same ward but also on an inter-ward basis.

TA 4485-VIE: Central Region Small and Medium Towns Development Project FINAL REPORT Appendix 3, page 34
June 2006
8. ACCESS TO WATER SUPPLY
Based on the survey, 50% of households in Tan Son use tap water for their domestic needs, while another 25% make use of dug well as source of water supply.
9. SOLID WASTE MANAGEMENT
All household either disposes of solid waste by burning or burying it. There are no arrangements for the collection of solid waste in Tan Son. Because of its elevated location there are not problems with drainage and flooding in this town.
10. ENVIRONMENTAL SANITATION AND AWARENESS
Survey results show that 90% of respondents in Tan Son were found to have adapted certain sanitation practices like washing hands after using the toilet and boiling of water for drinking (100%). About 46% has septic tank, 38% uses the latrine and only 15% has temporary or no toilet.

TA 4485-VIE: Central Region Small and Medium Towns Development Project FINAL REPORT Appendix 3, page 35
June 2006
SOCIOECONOMIC PROFILE OF CA NA TOWN: OVERVIEW
A. Population, FY2004:
Total Population22: 18,452 - Male: 9,069 - Female: 9,383
B. Labor Force: Total Labor: 6,873
- Agriculture/Aquaculture Sector: 45% - Industrial Sector: 32% - Business/Service Sector: 23%
C. Ethnic Minorities: None. D. Average Monthly Income (per person): VND 600,000 – 700,000 E. Poverty Rate:
- about 10.4% (New standard of MOLISA, 2005) F. Educational Situation:
- 99.0% of the children go to school. - compulsory general education at the primary level. - teaching staff skilled and knowledgeable; sufficient school buildings.
G. Health Care Situation23: - Cases of malnutrition under 5s per year: 428 (2004) - Infant mortality (per 1,000 live births, per year): 0 (2004) - Maternal mortality ratio (per 10,000 live births, per year): 0 - Cases of Malaria: 0 (2004) - New cases of Tuberculosis: 18 (2004) - New cases of HIV/AIDS: 0
H. Domestic Water Supply Situation (Percentage of HH Using Water) Tap Water: 0% Drill Well: 99% Dug Well: 1% Purchase Water: 99%
I. Solid Waste/Wastewater System: - lacks wastewater system.
J. Environmental Sanitation and Awareness: Septic Tank: 56% Latrine: 30% Temporary/No Toilet: 14% Boil Water for Drinking: 100% Sanitation Practices24: 90%
Note: This preliminary profile is based on a series of participatory meetings of the Project Team in each town.
22 This figure is based on meetings and discussions with the PPCs and MABUTIP, the surveys conducted by the Consultant’s engineering
and socioeconomic group, towns statistics books and existing master plans. 23 Statistics were provided by the Phuoc Diem Health Care Center. 24 Specific question asked of the respondents was whether they washed their hands after using the toilet.

TA 4485-VIE: Central Region Small and Medium Towns Development Project FINAL REPORT Appendix 3, page 36
June 2006
SOCIOECONOMIC SURVEY OF CA NA: SUMMARY FINDINGS
1. BACKGROUND ON THE AREA
Ca Na is a newly established town, which was formerly part of Phuc Diem Commune, Ninh Phuc District, Ninh Thuan Province. It lies on a narrow strip of land between National Highway 1A and the coast, approximately 28 kilometers south of Phang Rang-Thap Cham and 18 kilometers south of the small town of Phuoc Dan. It is characterized by some spectacular landscapes that produce aesthetic qualities not readily seen elsewhere.
According to the TA socioeconomic survey all of the Ede are males and do not consider themselves to be permanent residents of Ca Na but whether they should also be targeted via the EMDP is an issue yet to be resolved. As a newly created town it is yet to offer a range of goods and services to the rural hinterland but unlike some of the other small towns in the Central Coastal Region it has a viable fishing port, small boat repair facility, fish sauce factory, fish processing factory, and a small tourist area with several inexpensive hotels along the highway.
Ca Na is not a typical town in the Central Coastal Region resembling more a fishing village than either a town servicing the rural hinterland or a town where land-based agricultural activities (many households do raise pigs and chickens though). There are real limits to growth in Ca Na both spatially and economically. Fishing is likely to decline or at least not increase to any great extent and while the landscapes surrounding Ca Na are spectacular they are not likely to be spectacular enough to attract tourists (especially domestic) because there are other preferred destinations in close proximity.
2. ECONOMY
Ca Na is not a typical town in the Central Coastal Region resembling more a fishing village than either a town servicing the rural hinterland or a town where land-based agricultural activities (many households do raise pigs and chickens though). The Master Plan forecasts that the town’s population will grow by 1.6% to 2010, 1.5% to 2015 and 1.4% to 2020. There are real limits to growth in Ca Na both spatially and economically. Fishing is likely to decline or at least not increase to any great extent and while the landscapes surrounding Ca Na are spectacular they are not likely to be spectacular enough to attract tourists (especially domestic) because there are other preferred destinations in close proximity.
3. DEMOGRAPHIC PROFILE
Ca Na has a total population of 18,452 comprised of 9,069 males and 9,383 females. The Master Plan forecasts that the town’s population will grow by 1.6% to 2010, 1.5% to 2015 and 1.4% to 2020.
According to the TPC most of the people living in Ca Na are ethnic Kinh (97.3%) and there are a small number of Ede (2.3%) from the Central Highlands and an even smaller number of Hoa (0.4%).

TA 4485-VIE: Central Region Small and Medium Towns Development Project FINAL REPORT Appendix 3, page 37
June 2006
3.1 Labor Force and Employment
Based on the survey, total labor force reached 6,873 wherein 45% work in the agriculture/aquaculture sector, 32% in the business/services sector and 23% in the industrial sector.
3.2 Income
The residents of Ca Na receive an average monthly income between VND 600,000 -700,000.
3.3 Education
Survey results show that 99 percent of children in Ca Na attend school. This may be attributable to the fact that general education at the primary level is compulsory. Meanwhile, the teaching staff was found to be skilled and knowledgeable and there is presence of sufficient school buildings.
3.4 Health
Cases of malnutrition for children under 5 years in Ca Na town was pegged at 428 in 2004. New cases of tuberculosis reached 18 in the same reference period.
3.5 Land Ownership
Majority of those surveyed do not have certificates of land use (94%) to their home lot. Of those who have certificates, about half of them are registered under the husband’s name.
4. POVERTY AND VULNERABILITY
The MOLISA poverty rate is 10.4 percent with the highest poverty rate being in the ward/commune of Thoung Diem (18.25%) and lowest in the ward/commune of Lac Nghiep 2 (6.24%). The Water Poverty Index is 19.6 percent and this is based on the average price of VND 10,069 that 95.4 percent of households pay for water. However, this average masks the reality that people in Ca Na pay up to VND 70,000 per cubic meter (and more for the 83.6% of households that do not have access to storage tanks) during the height of the dry season. Indeed during the dry season Ca Na faces the most serious drinking water shortages of any of the towns in the Project area. The TA Socioeconomic Survey reveals that 94.5 percent of households do not have access to piped water. There is little problem identifying the pro-poor approach of the Project because water supply development and expansion will be supported along with the other components. Also, improved community environmental sanitation (especially for 59.3% of households without access to improved latrines) will contribute to an overall improvement in WSS related livelihood outcomes.
5. GENDER
The surveyed households in Song Cau showed a high proportion (39 percent) of female-headed households (FHHS) compared to the national figure of 30 percent. Aside from the usual households headed by widows and separated women, quite a number of households send their male members to work in urban centers in order to

TA 4485-VIE: Central Region Small and Medium Towns Development Project FINAL REPORT Appendix 3, page 38
June 2006
supplement their meager incomes. The FHHS’ monthly per capita income (VND 205,000) is almost half than those headed by males (VND 397,000). This is expected as females in this town have lower educational levels than their male counterparts. In general, only a small portion of both men (13 percent) and women (8 percent) have reached high education (college). When we examine their incomes according to their occupation, the women get lower than the males. For example, among hired workers males get an average of VND701,000 per month, almost double than that of females (VND397,000).
Women, in general, take care of WSS-related activities at the household level such as cooking, washing, cleaning, taking care of children, the sick and the elderly and disposing of human wastes and garbage. Doing these tasks constitute a big challenge for the women because Ca Na is one of the driest place in Vietnam. Almost all the women (95 percent) among the surveyed households have to purchase their water for drinking and cooking from water vendors. Meanwhile, almost half (49 percent) of the households have to purchase their water for washing and laundry while the rest have to obtain it from stand post or connection, boreholes or open dug wells. They spend an average of 13 minutes a day in collecting water. This is a little bit shorter compared to the time spent by other women in fetching water in other towns. During the wet season, almost one-fifth (20 percent) of the households suffer from flooding. As a result, both men and women in these households suffer from illnesses (especially the children), financial losses and loss of employment and productivity due to flooding several times a year. In terms of sanitation, a large proportion (60 percent) of the households does not have access to toilet facilities and defecate in their gardens/fields and dispose it to the nearest river/water channels. About 51 percent have their garbage collected but the rest have it burned, buried or scattered outside their homes.
Majority of those surveyed do not have certificates of land use (94 percent) to their home lot. Of those who have certificates, about half of them are registered under the husband’s name. In terms of community participation, women are very visible in the Women’s Union and the Elder Union but have lower visibility in the town/provincial committees. At most, their participation in the latter committees, is about 20 percent or less. Because women manage WSS-related activities, they are very eager for support in upgrading their water facilities. They want credit support for water connection, improvement of their drainage system and waste disposal as they have very low access to credit for these needs. Understandably, they trust the Women’s Union more to manage this type of credit.
6. INTERVENTIONS TO SUPPORT THE PROJECT
A culturally appropriate community environmental sanitation and awareness program that the TPC, VWU and NGO will help develop in conjunction with the local communities (inputs from local women will be a feature of this approach based on the premise that it is women who will be the driving force for improved environmental sanitation). It is via this program that some of the more inappropriate practices adopted by households used to urban living (such as disposing of human waste in the waterways surrounding Ca Na) can be modified. Additionally those 59.3 percent of households without access to latrines and 94.5 percent of households without access to piped water will be supported via demand driven interventions where people as “consumers” rather than “beneficiaries” will decide what menu of options they are willing to finance.
7. LIVELIHOOD IMPROVEMENTS

TA 4485-VIE: Central Region Small and Medium Towns Development Project FINAL REPORT Appendix 3, page 39
June 2006
The demand driven interventions should also further develop local entrepreneurship as households exercise their choice not only on the menu of options they are seeking but on what prices they are prepared to pay. Forms of entrepreneurship already exist in Ca Na but most are related to the repair of fishing boats and investment in value-added fish processing.
Of equal importance by attempts to involve all of the population in a “total” or “100 percent” approach to environmental sanitation (proposed interventions benefit whole communities not just individual households) not only does such an approach improve health but also empowers the local people of Ca Na by actively involving them in the design of the program but also develops a sense of unity and purpose among different groups living in the same ward but also on an inter-ward basis that is able to cope with different stresses and strains that urban or semi-urban lifestyles bring to a community more accustomed to living as a fishing community.
8. ACCESS TO WATER SUPPLY
Based on the survey, none of the households in Ca Na use tap water for their domestic needs, instead 99% rely on drill well as source of water supply.
9. SOLID WASTE MANAGEMENT
A small majority (51.4%) of households dispose of solid waste by paying a fee for it to be collected by a waste management company. The rest burn, bury or scatter it on the ground. Such households are likely to continue with these practices unless an affordable and reliable system of collection is established, and even here many of these households are yet to be convinced that they should pay such a fee.
10. FLOODING INCIDENCE
During the wet season, almost one-fifth (20%) of the households suffer from flooding. As a result, both men and women in these households suffer from illnesses (especially the children), financial losses and loss of employment and productivity due to flooding several times a year.
11. ENVIRONMENTAL SANITATION AND AWARENESS
Survey results show that 90% of respondents in Ca Na were found to have adapted certain sanitation practices like washing hands after using the toilet and boiling of water for drinking (100%). About 56% has septic tank, 30% uses the latrine and about 14% has temporary or no toilet.

TA 4485-VIE: Central Region Small and Medium Towns Development Project FINAL REPORT Appendix 3, page 40
June 2006
SOCIOECONOMIC PROFILE OF PHAN RANG-THAP CHAM TOWN: OVERVIEW
A. Population, FY2004: Total Population25: 160,781
B. Labor Force: Total Labor: 80,000
- Agriculture/Aquaculture Sector: 56.2% - Industrial Sector: 12.7% - Business/Service Sector: 31.1%
C. Ethnic Minorities: About 1.2% is ethnic minority (mainly Cham, Tay groups) D. Average Monthly Income (per person): VND 400,000 – 500,000 E. Poverty Rate:
- about 10.97% (New standard of MOLISA, 2005) F. Educational Situation:
- 100% of the children go to school. - teaching staff skilled and knowledgeable; sufficient school buildings.
G. Health Care Situation26: - Cases of malnutrition under 5s per year: 15% (2004) - Infant mortality (per 1,000 live births, per year): 1 case (2004) - Cases of Malaria: 2 (2004) - Cases of Dengue Fever: 2% (2004) - New cases of Tuberculosis: 82 (2004) - New cases of HIV/AIDS: 4
H. Domestic Water Supply Situation (Percentage of HH Using Water) Tap Water: 70% Drill Well: 25% Dug Well: 20% Purchase Water: 5%
I. Solid Waste/Wastewater System: - lack of drainage system.
J. Environmental Sanitation and Awareness: Septic Tank: 30% Latrine: 50% Temporary/No Toilet: 20% Boil Water for Drinking: 90% Sanitation Practices27: 50%
Note: This preliminary profile is based on a series of participatory meetings of the Project Team in each town.
25 This figure is based on meetings and discussions with the PPCs and MABUTIP, the surveys conducted by the Consultant’s engineering
and socioeconomic group, towns statistics books and existing master plans. 26 Statistics were based on the yearly report of the Health Care Center. 27 Specific question asked of the respondents was whether they washed their hands after using the toilet.

TA 4485-VIE: Central Region Small and Medium Towns Development Project FINAL REPORT Appendix 3, page 41
June 2006
SOCIOECONOMIC SURVEY OF PHAN-RANG-THAP CHAM: SUMMARY FINDINGS 1. BACKGROUND ON THE AREA
Thap Cham is a provincial town in the town chain of Thap Cham – Phan Rang located to the right of the National Highway 1 from the North to the South, on the road to Da Lat city. Thap Cham is a semi-agricultural provincial town supplying many goods and services to the urban and rural residents. These goods include technical inputs for cash crops as well as many household commodities (92% of urban households own color TVs, 80% own electrical fans, and 56% have motorbikes). Services such as health services and basic education and part of financial services for the private sector are also provided (even though the poor do not have sufficient collateral to take advantage of such services.)
2. DEMOGRAPHIC PROFILE
Thap Cham’s total population is 160,781. It is forecasted in the master plan that the urban population will grow at 15% until 2010, and 8% until 2015 and at a lower rate of 5% after that.
Small villages surrounding Thap Cham is now home to the Cham people (minority peoples in Ninh Thuan and Binh Thuan) who account for 1.2% of the population. They live with the Kinh people, and therefore, their lifestyle is not so much different from the Kinh.
In the urban areas that are considered technically-easible for the proposed water supply project, the Kinh people will account for 100% of the population.
2.1 Labor Force and Employment
The population is 80,000 in which 50% works in the agricultural/aquacultural sector, 31% works in the commercial/service sector and 12.7% works in the industrial sector. About 15% of the households have either husbands or wives in their middle ages who come to the cities to work as housemaids, street vendors or construction workers.
2.2 Income
The residents of Thap Cham receive an average monthly income between VND 400,000 - 500,000.
2.3 Education
Survey results shows that 100% children in Thap Cham go to school. This may be attributable to the fact that general education at the primary level is compulsory. Meanwhile, the teaching staff was found to be skilled and knowledgeable and there is presence of sufficient school buildings.

TA 4485-VIE: Central Region Small and Medium Towns Development Project FINAL REPORT Appendix 3, page 42
June 2006
2.4 Health
In 2004, about 15% of children under the age of 5 suffer from malnutrition. Water-related diseases such as dengue fever (10% among adults), and diarrhea occur frequently in the region – among 20% of adult and 40% of children. About 20% suffer from skin-related diseases and 10% of adults suffer from eye sores. Health infrastructure in the area is considerably good compared to other towns in the province because Thap Cham is going to be upgraded to a Class II city of Binh Thuan. However, severe cases were sent to hospitals in HCM City. Further attention is paid to the health staff and many are sent out for further training.
3. POVERTY AND VULNERABILITY
The MOLISA Poverty rate is 10.97%.
Poverty in Thap Cham is mostly present among big families who have little access to education and lack land owndership for agriculture activities as well as other manufacturing materials. Temporary housing and run-down housing are being established through the Government’s program and Program 134. The Women’s Union has established a credit scheme to support poor women households in developing household economies.
4. GENDER
Compared to other towns, Thap Cham has a high number of female-headed households (FHHS) (41 percent). Aside from usual households headed by widows and separated women, a number of households have their male members working in other urban centers such as HCM, Hanoi or other regional centers. Interestingly, both males and females in this town almost enjoy parity in their education levels. Women seem to be dominant in the small business activities while men have higher proportion of them working in the state sector. But in terms of their earnings in different occupational category, gender seems to be a key operative variable as females always earn lower than their male counterparts. For example, among teachers, female teachers seem to get, on the average, half of what their male counterparts were getting (VND1500,000) per month.
Women, in general, take care of WSS-related activities at the household level such as cooking, washing, cleaning, taking care of children, the sick and the elderly and disposing of human wastes and garbage. The women in half of the households surveyed have to fetch water from nearby stand post or connection or dug well, spending an average of 12-15 minutes a day, especially during dry season. During the wet season, almost half of the households (49 percent) suffer from illness (especially the children), financial losses and loss of productivity due to flooding. In terms of sanitation, about 15 percent threw their human waste to the nearest canal or water channel, or use it in processing biogas (18 percent) while the rest bury it use it in their gardens (67 percent). Majority (71 percent) of the households have their garbage collected by a waste management company while the rest burn, bury or scatter their garbage outside their homes.
Majority of those surveyed do not have certificates of land use (88 percent) to their home lot. Of those who have certificates, only 5 percent registered it under the name of both husband and wife while another 5 percent have it registered under the name of the husband and only one was in the name of the wife/woman. In terms of community

TA 4485-VIE: Central Region Small and Medium Towns Development Project FINAL REPORT Appendix 3, page 43
June 2006
participation, women are very visible in the Women’s Union and the Elder Union but have lesser visibility in the town/provincial committees. At most, their participation in the latter committees, is about 20 percent or less. Because women manage WSS-related activities, they are very eager for support in upgrading their water facilities. They want credit support for water connection, improvement of their drainage system and waste disposal as they have very low access to credit for these needs. Understandably, they trust the Women’s Union more to manage this type of credit.
5. ACCESS TO WATER SUPPLY
70% of Thap Cham people have access to piped water supply. Some households still use distilled and dug wells (as this area is among the driest areas of Vietnam, the annual average rainfall is 700mm), therefore, the people are in the habit of storing water in their own reservoirs.
According to survey results, 64% of the people interviewed wanted to upgrade their water supply system and 85.9% are able to afford water at the monthly rate of 3,000 VND.
6. SOLID WASTE MANAGEMENT
Currently, about 70% - 80% of the households use the waste collection system. Others burn, bury and even litter wastes around their houses.
The drainage system for the Phan Rang – Thap Cham area was completed under the Third Provincial Towns Development Project of the ADB. But 3 wards including Do Vinh, Bao An and Phuoc My of Thap Cham still lacks sufficient drainage system that meets the city’s standard. Survey results show that 88% of the people desires to have a hygenic wastewater drainge system and 96.9% are willing to pay for the connection to the wastewater system (one payment at the price of 300,000).
7. ENVIRONMENT SANITATION AND AWARENESS
Survey results show that 50% of people interviewed in Thap Cham have adopted sanitation practices such as washing of hands after using the toilet and drinking boiled water (90%). About 30% have flush toilets, 50% make use of hygenic toilets, and 20% of the households do not have toilet or own very simple facilities.
Sanitation of the area needs to be improved by methods such as training and promoting public awareness, especially in classes for the young generations.

TA 4485-VIE: Central Region Small and Medium Towns Development Project FINAL REPORT Appendix 3, page 44
June 2006
SOCIOECONOMIC PROFILE OF PHAN THIET TOWN: OVERVIEW
A. Population, FY2004:
Total Population28: 206,964 B. Labor Force: Total Labor: 119,181
- Agriculture Sector: 12% - Industrial Sector: 31% - Business/Service Sector: 57%
C. Ethnic Minorities: None. D. Average Monthly Income (per person): VND 600,000 – 700,000 E. Poverty Rate:
- 3% (New standard of MOLISA, 2005) F. Educational Situation:
- 99.0% of the children go to school. - compulsory general education at the primary level. - teaching staff skilled and knowledgeable; sufficient school buildings.
G. Health Care Situation29: - Cases of malnutrition under 5s per year: 2,603 (2004) - Infant mortality (per 1,000 live births, per year): 7 (2004) - Maternal mortality ratio (per 10,000 live births, per year): 0 - Cases of Malaria: 2 (2004) - Cases of Dengue Fever: 630 - New cases of Tuberculosis: 350 (2004) - New cases of HIV/AIDS: 218
H. Domestic Water Supply Situation (Percentage of HH Using Water) Tap Water: 80% Drill Well/Dug Well: 20% Purchase Water/Rivers and Ponds: 0%
I. Solid Waste/Wastewater System: - Lack of wastewater systems in the town.
J. Environmental Sanitation and Awareness: Septic Tank: 77% Latrine: 20% Temporary/No Toilet: 3% Boil Water for Drinking: 100% Sanitation Practices30: 90%
Note: This preliminary profile is based on a series of participatory meetings of the Project Team in each town.
28 This figure is based on meetings and discussions with the PPCs and MABUTIP, the surveys conducted by the Consultant’s engineering
and socioeconomic group, towns statistics books and existing master plans. 29 Statistics were provided by the Phan Thiet Health Care Center. 30 Specific question asked of the respondents was whether they washed their hands after using the toilet.

TA 4485-VIE: Central Region Small and Medium Towns Development Project FINAL REPORT Appendix 3, page 45
June 2006
SOCIOECONOMIC SURVEY OF PHAN THIET: SUMMARY FINDINGS
1. BACKGROUND ON THE AREA
Phan Thiet is a Class 111 city is the capital of Binh Thuan Province. It is located on National Highway 1A, approximately 190 kilometers east of Ho Chi Minh Cinh. A distinguishing feature of this town is that it is intersected by two main rivers, the Ca Ty River in the east, and the Ca Ty in the southwest. Both rivers run in a general southeast direction and enter the sea at Phan Thiet. As a provincial city, Phan Thiet provides a range of goods and services not typically available in other towns of the province. It is the administrative center of government at the provincial level, political center of the Communist Party, and the trading and financial center of the private sector. Phan Thiet not only services the rural hinterland but all towns and communes in the province.
Phan Thiet is such a small town to attract the types of direct and indirect foreign investment that cities such as Ho Chi Minh are able to attract and being in close proximity to Ho Chi Minh it is likely to be overshadowed by this city. Existing economic based activities are likely to be able to support that level of growth. However, as one of the important economic bases for Phan Thiet is the catching and processing of fish its fortunes are to some extent linked to sustainable fish catches. This is rather problematic for any economy dependent on fishing although Phan Thiet also relies on tourism, which is one the growth sectors in Vietnam so perhaps this will offset likely losses in the fishing industry.
2. ECONOMY
Phan Thiet is a little small to attract the types of direct and indirect foreign investment that cities such as Ho Chi Minh are able to attract and being in close proximity to Ho Chi Minh it is likely to be overshadowed by this city. The Master Plan is very modest and forecasts that the urban population will grow by 1.6% over the next five years, 1.5% for the next five years and 1.3% for the subsequent ten years. Existing economic based activities are likely to be able to support that level of growth. However, as one of the important economic bases for Phan Thiet is the catching and processing of fish its fortunes are to some extent linked to sustainable fish catches. This is rather problematic for any economy dependent on fishing although Phan Thiet also relies on tourism, which is one the growth sectors in Vietnam so perhaps this will offset likely losses in the fishing industry.
3. DEMOGRAPHIC PROFILE
Phan Thiet has a total population of 206,964. The Master Plan is very modest and forecasts that the urban population will grow by 1.6% over the next five years, 1.5% for the next five years and 1.3% for the subsequent ten years.
According to the TPC, majority of those who live in Phan Thiet is ethnic Kinh (99.6%) with a very small number of Tay (0.4%) from the Northern Uplands of Vietnam. There might also be some other smaller ethnic minority groups such as the Ra-glai but they do not show up in Ward population data provided to the Project.

TA 4485-VIE: Central Region Small and Medium Towns Development Project FINAL REPORT Appendix 3, page 46
June 2006
3.1 Labor Force and Employment
According to the TA socioeconomic survey, 57 percent of the total workforce of 119,181 is from the business/service sector, 31 percent from the industrial sector and 12 percent from the agriculture sector. This occupational structure is not typical for the Project area – being more similar to a provincial capital such as Tuy Hoa - because there are fewer farmers (these are primarily found in the four communes included under the jurisdiction of Phan Thiet) but more people involved in small and medium enterprises. This is not surprising because Phan Thiet is a major center for fishing (including value adding) and tourism (both domestic and foreign).
3.2 Income
The residents of Phan Thiet receive an average monthly income between VND 600,000 -700,000.
3.3 Education
Survey results show that 99 percent of children in Phan Thiet attend school. This may be attributable to the fact that general education at the primary level is compulsory. Meanwhile, the teaching staff was found to be skilled and knowledgeable and there is presence of sufficient school buildings.
3.4 Health
Cases of malnutrition for children under 5 years in Phan Thiet town was pegged at 2,603 in 2004. Cases of dengue fever reached 630, while new cases of tuberculosis reached 350 in the same reference period. New cases of HIV/AIDS were pegged at 218.
3.5 Land Ownership
Majority of those surveyed do not have certificates of land use (94%) to their home lot. Of those who have certificates, about half of them are registered under the husband’s name.
4. POVERTY AND VULNERABILITY
The MOLISA poverty rate is 3 percent – the lowest among the 13 towns – with the highest poverty rate being in the ward of Phu Thuy (2.5%) and lowest in the ward of Phu Tai (0.1%). The Water Poverty Index is 38.1 percent and this is based on the average price that 4.6 percent of households pay for water. This is one of the highest WPI in the Project area but involves a small number of households even thought the TA Socioeconomic Survey reveals that 80 percent of households have access to piped water (lower than Tuy Hoa). However, the pro-poor argument will need to be that the storm water drainage system will prevent flooding in some wards for up to 15 days of the year, the wastewater collection system and its subsequent treatment will improve overall environmental health: everyone benefits with such outcomes. Also, improved community environmental sanitation (especially for 80% of households without access to improved latrines) will contribute to an overall improvement in WSS related livelihood outcomes.

TA 4485-VIE: Central Region Small and Medium Towns Development Project FINAL REPORT Appendix 3, page 47
June 2006
5. GENDER
Compared to other towns, Phan Thiet has a high number of female-headed households (FHHS) (45 percent). Aside from usual households headed by widows and separated women, a number of households have their male members working in other urban centers such as HCM, Hanoi or other regional centers. These FHHS have lower monthly per capita income (VND 331,000) compared to male-headed households (VND 410,000). This is to be expected as there are more females (74 percent) with lower education than males (66 percent). In fact, the proportion of illiterate women is almost double (11 percent) compared to the number of illiterate men (6 percent).
Women, in general, take care of WSS-related activities at the household level such as cooking, washing, cleaning, taking care of children, the sick and the elderly and disposing of human wastes and garbage. The women in half of the households surveyed have to fetch water from nearby stand post or connection or dug well, spending an average of 18-20 minutes a day, especially during dry season. During the wet season, both men and women suffer from illness (especially the children), financial losses and loss of employment and productivity due to flooding several times a year. In terms of sanitation, majority of households (92 percent) throw their human wastes to the river, lake or channel. About 70 percent of the households have their garbage collected burn, bury or scatter it outside their homes.
Majority of those surveyed do not have certificates of land use (62 percent) to their home lot. Of those who have certificates, only 16 percent registered it under the name of both husband and wife. In terms of community participation, women are very visible in the Women’s Union and the Elder Union but have lower visibility in the town/provincial committees. At most, their participation in the latter committees, is about 20 percent or less. Because women manage WSS-related activities, they are very eager for support in upgrading their water facilities. They want credit support for water connection, improvement of their drainage system and waste disposal as they have very low access to credit for these needs. Understandably, they trust the Women’s Union more to manage this type of credit.
6. INTERVENTIONS TO SUPPORT THE PROJECT
A culturally appropriate community environmental sanitation and awareness program that the TPC, VWU and NGO will help develop in conjunction with the local communities (inputs from local women will be a feature of this approach based on the premise that it is women who will be the driving force for improved environmental sanitation). It is via this program that some of the more inappropriate practices adopted by households used to urban living (e.g. using inland waterways to dispose of human waste) can be modified. Additionally those 21.1 percent of households without access to latrines and 28.4 percent of households without access to piped water will be supported via demand driven interventions where people as “consumers” rather than “beneficiaries” will decide what menu of options they are willing to finance.
7. LIVELIHOOD IMPROVEMENTS
The demand driven interventions should also further develop local entrepreneurship as households exercise their choice not only on the menu of options they are seeking but on what prices they are prepared to pay (hence the development of a market economy grounded in existing and potential livelihood possibilities). This is especially relevant for at least 1,000 households (5,060 people) who are currently living in poverty.

TA 4485-VIE: Central Region Small and Medium Towns Development Project FINAL REPORT Appendix 3, page 48
June 2006
Of equal importance by attempts to involve all of the population in a “total” or “100 percent” approach to environmental sanitation (proposed interventions benefit whole communities not just individual households) not only does such an approach improve health but also empowers the local people of Phan Thiet by actively involving them in the design of the program but also develops a sense of unity and purpose among different groups living in the same ward but also on an inter-ward basis. Developing civic pride in a provincial city such as Phan Thiet, which is not always easy given the social complexities of larger urban centers, is a practical livelihood issue related to levels of greater self-esteem. Also, in the context of Phan Thiet because its economy relies to an important extent on tourism there needs to be a local consensus as to what should constitute a “clean” city otherwise Phan Thiet will lose business to other centers of tourism in Vietnam that have forged a more workable consensus.
8. ACCESS TO WATER SUPPLY
Based on the survey, none of the households in Ca Na use tap water for their domestic needs, instead 99 % rely on drill well as source of water supply.
9. SOLID WASTE MANAGEMENT
A majority (70.4%) of households dispose of solid waste that is collected by a solid waste management company. Most other households dispose of solid waste through burning, burying it, or simply scattering it around the place. Such households are likely to continue with these practices unless an affordable and reliable system of collection is established.
10. FLOODING INCIDENCE
During the wet season, almost one-fifth (20%) of the households suffer from flooding. As a result, both men and women in these households suffer from illnesses (especially the children), financial losses and loss of employment and productivity due to flooding several times a year.
11. ENVIRONMENTAL SANITATION AND AWARENESS
Survey results show that 90% of respondents in Phan Thiet were found to have adapted certain sanitation practices like washing hands after using the toilet and boiling of water for drinking (100%). About 77% has septic tank, 20% uses the latrine and about 3% has temporary or no toilet.
SOCIOECONOMIC PROFILE OF GIA NGHIA TOWN: OVERVIEW

TA 4485-VIE: Central Region Small and Medium Towns Development Project FINAL REPORT Appendix 3, page 49
June 2006
A. Population, FY2004:
Total Population31: 35,559 - Male: 17,800 - Female: 17,759
B. Labor Force: Total Labor: 15,459
- Agriculture Sector: 62% - Business/Service Sector: 35% - Other Sector: 3%
C. Ethnic Minorities: 4,715 ethnic minorities or 35.25% of total population comprising of Tay, Nung, M’Nong, Cao Lan, Muong, Hoa D. Average Monthly Income (per person): VND 300,000 – 400,000 E. Poverty Rate:
- 17% (New standard of MOLISA, 2005) F. Educational Situation:
- 96.0% of the children go to school. - compulsory general education at the primary level. - teaching staff skilled and knowledgeable; sufficient school buildings.
G. Health Care Situation32: - Cases of malnutrition under 5s per year: 151 (2004) - Infant mortality (per 1,000 live births, per year): 0 (2004) - Maternal mortality ratio (per 10,000 live births, per year): 0 - Cases of Malaria: 657 (2004) - New cases of Tuberculosis: 5 (2004) - New cases of HIV/AIDS: 0
H. Domestic Water Supply Situation (Percentage of HH Using Water) Tap Water: 0% Drill Well: 96% Dug Well: 4% Purchase Water/Rivers & Ponds: 60%
I. Solid Waste/Wastewater System: - inadequate solid waste collection and landfill sites. - no wastewater system in the town.
J. Environmental Sanitation and Awareness: Septic Tank: 20% Latrine: 50% Temporary/No Toilet: 5% Boil Water for Drinking: 95% Sanitation Practices33: 80%
Note: This preliminary profile is based on a series of participatory meetings of the Project Team in each town.
31 This figure is based on meetings and discussions with the PPCs and MABUTIP, the surveys conducted by the Consultant’s engineering
and socioeconomic group, towns statistics books and existing master plans. 32 Statistics were provided by the Gia Nghia Health Care Center. 33 Specific question asked of the respondents was whether they washed their hands after using the toilet.

TA 4485-VIE: Central Region Small and Medium Towns Development Project FINAL REPORT Appendix 3, page 50
June 2006
SOCIOECONOMIC SURVEY FOR GIA NGHIA: SUMMARY FINDINGS
1. BACKGROUND ON THE AREA
Gia Nghia is a medium sized Central Highlands Class IV provincial town in the recently created province (2004) of Dak Nong. It is located approximately 120 kilometers south of the provincial capital of Buon Ma Thuot on National Road 14 and approximately 280 kilometers northeast of Ho Chi Minh.
Gia Nghia is rapidly transforming itself into a provincial administrative and trading center providing a diverse range of goods and services not only to the public sector (many have been required to relocate from Buon Ma Thuot), the burgeoning private sector, and the rural hinterland. These goods include a wide range of construction goods to support the construction boom and consumer durables to meet growing demand in the town, technical inputs for cash cropping but also increasingly include a range of household consumables that until recently were not widely used in rural areas, especially among the Ma. Services include technical support for cash cropping (e.g. coffee growers are primarily linked with market in Ho Chi Minh although some value adding in rubber occur in Gia Nghia) but increasingly more sophisticated health and educational services are also being provided in line with Gia Nghia’s new status. Politically Gia Nghia is linked to Hanoi but economically it is largely linked to Ho Chi Minh.
2. Economy
Gia Nghia is rapidly transforming itself into a provincial administrative and trading center providing a diverse range of goods and services not only to the public sector (many have been required to relocate from Buon Ma Thuot), the burgeoning private sector, and the rural hinterland. These goods include a wide range of construction goods to support the construction boom and consumer durables to meet growing demand in the town, technical inputs for cash cropping but also increasingly include a range of household consumables that until recently were not widely used in rural areas, especially among the Ma. Services include technical support for cash cropping (e.g. coffee growers are primarily linked with market in Ho Chi Minh although some value adding in rubber occur in Gia Nghia) but increasingly more sophisticated health and educational services are also being provided in line with Gia Nghia’s new status. The Master Plan forecasts that the urban population will grow by 23.1% to 2010 and at a much slower rate of 3.8% thereafter. Existing economic based activities are likely to be able to support that level of growth because of more emphasis being placed on value-added activities now undertaken downstream in Ho Chi Minh. Politically Gia Nghia is linked to Hanoi but economically it is largely linked to Ho Chi Minh.
3. DEMOGRAPHIC PROFILE
Gia Nghia has a total population of 35,559 comprised of 17,800 males and 17,759 females. The Master Plan forecasts that the urban population will grow by 23.1% to 2010 and at a much slower rate of 3.8% thereafter. Existing economic based activities are likely to be able to support that level of growth because of more emphasis being placed on value-added activities now undertaken downstream in Ho Chi Minh.
Historically, the small hamlets that surrounded present day Mnong were the primary habitat of the Ma, a Mon-Khmer upland ethnic minority. This group constitutes 13.25

TA 4485-VIE: Central Region Small and Medium Towns Development Project FINAL REPORT Appendix 3, page 51
June 2006
percent of the total population but 57.9 percent of the population in the ward of Dak Nia, 18.1 percent of the population in Nghia Tan, and smaller populations in all other wards with the exception of Quang Trang, where no ethnic minority groups can be found. Their livelihoods depended primarily on shifting cultivation (especially the cultivation of upland rice for subsistence purposes). However, in recent times better-off Ma households have developed coffee, tea, rubber, pepper and tobacco market-based cropping livelihood-based strategies. The problem is that such commodities have experienced quite severe fluctuations on the world market (especially coffee) and the economic boom of the late 1980s and early 1990s experienced a downturn during the late 1990s forcing households to ensure that their livelihood strategies are not simply based on market demand for coffee, tea, rubber, pepper and tobacco.
Of people living in those areas of the town that have been identified as technically feasible for the proposed water supply system, the ethnic Kinh group constitute 86.7 percent of the population system and in the hamlets on slopes and valleys contiguous with the actual town almost all people are Mnong. Gia Nghia has experienced a lot of inward migration since the end of the Vietnam War in 1975 and as in other Central Highland towns where high growth rates are projected it is assumed that much of this population increase will come from the inward migration of Kinh.
3.1 Labor Force and Employment
Based on the survey, total labor force reached 15,459 wherein 62% work in the agriculture/aquaculture sector, 35% in the business/services sector and 3% in the other sector.
3.2 Income
The residents of Gia Nghia receive an average monthly income between VND 300,000 - 400,000.
3.3 Education
Survey results show that 96 percent of children in Gia Nghia attend school. This may be attributable to the fact that general education at the primary level is compulsory. Meanwhile, the teaching staff was found to be skilled and knowledgeable and there is presence of sufficient school buildings.
3.4 Health
Cases of malnutrition for children under 5 years in Gia Nghia town was pegged at 151 in 2004. New cases of tuberculosis reached 5 in the same reference period while cases of malaria reached 657.
3.5 Land Ownership
Majority of those surveyed do not have certificates of land use (94%) to their home lot. Of those who have certificates, about half of them are registered under the husband’s name.
4. POVERTY AND VULNERABILITY

TA 4485-VIE: Central Region Small and Medium Towns Development Project FINAL REPORT Appendix 3, page 52
June 2006
The MOLISA poverty rate is 17 percent but the highest poverty rates occur in Dak Nia (21.4%), which is also where the greatest concentration of the ethnic Mnong is found so there is a correlation between poverty and ethnicity. Gia Nghia is the least poor of the Central Highlands project towns but its Water Poverty Index (18.1%) is the highest relatively speaking of these towns (gap between MOLISA and WPI is what is being referred to here) because people pay more for water during the dry season than elsewhere (VND 12,200). The average per capita monthly income is VND 300,000 – 400,000. This reflects the rapid investment in public-sector services by the GOVN in the last two years. However, this is quite an unequal town with the lowest quintile only having 11.9 percent of the income compared to the top quintile with 38.5 percent, the highest in the Project area.
Nevertheless, the characteristics of poverty in Gia Nghia are somewhat different to that of people living in poverty in the Central Coastal Region Towns. Because poorer people in Gia Nghia have some opportunities (more limited than in Qiang Khe because of the rapid expansion of industrial crops such as rubber) to derive a portion of their livelihoods from upland shifting agriculture (theoretically outlawed and local authorities do try and enforce such a ban) they do not have to rely on the informal or non-formal urban sector to the same extent as poorer urban people elsewhere. In fact it is more correct to depict most of the poor in Gia Nghia as being more “rural” in nature than “urban” although there are some examples of very poor and vulnerable households in this town (children suffer from high incidence of waterborne illnesses during the dry season and there are some problems with full household food security although nutrient deficiencies appear to be the major problem).
5. GENDER
The proportion of female-headed households (FHHS) in Gia Nghia is a bit lower (19 percent) compared to the national pattern of 30 percent. Perhaps, this is because this capital town is recipient to many male migrants looking for job opportunities in the city or nearby coffee/tea plantations. Moreover, the FHHS’ monthly per capita income (VND 476,000) is a bit higher than those headed by males (VND 423,000). This is perhaps due to the presence of ethnic minority households in this area where women have considerable influence in their households. But when we compare the incomes of men and women in different occupational categories, women get lower incomes than the males. For example, among farmers, males get an average of VND961,000 per month, much higher compared to that of females (VND752,000).
Women, in general, take care of WSS-related activities at the household level such as cooking, washing, cleaning, taking care of children, the sick and the elderly and disposing of human wastes and garbage. Like other highland towns, most women here obtain their water for drinking, cooking and washing from dug wells (74 percent), boreholes (10 percent) while the rest share with others, purchase water from vendors or get it from rain water tanks and boreholes. Women spend an average of 20-22 minutes a day collecting water, depending on the season. Less than half (43 percent) of the households dispose their human waste as fertilizer for their gardens/farms. Only 28 percent of the households have their trash collected while the burn (51 percent), bury or throw it outside their homes.
Almost three-fourths (71 percent) of the surveyed household possess certificates of land use and majority of them were registered in the husband’s name. Only a third of them were in the woman’s name. In terms of community participation, women are very visible in the Women’s Union and the Elder Union but have lower visibility in the

TA 4485-VIE: Central Region Small and Medium Towns Development Project FINAL REPORT Appendix 3, page 53
June 2006
town/provincial committees. At the ward level, however, quite a number of leaders are women but their representation decreases as we go higher in the political administrative hierarchy. Because women manage WSS-related activities, they are very eager for support in upgrading their water facilities. They want credit support for water connection, improvement of their drainage system and waste disposal as they have very low access to credit for these needs. Understandably, they trust the Women’s Union more to manage this type of credit.
6. INTERVENTIONS TO SUPPORT THE PROJECT
The Ethnic Minority Development Plan included in Annex xx was designed in conjunction with representatives of various Gia Nghia stakeholder groups. It will ensure that those households willing to leverage the benefits of this Project will be assisted via a public-private partnership involving the TPC, VWU and suitable NGO to finance demand as against supply driven interventions based on a “consumer” rather than a “beneficiary” approach. The demand for year round access to suitable water for drinking and cooking purposes is the major priority for most households and it is anticipated that a scheme to mobilize savings (e.g. savings and credit groups) will be utilized. However, because this approach is new to upland ethnic minority groups (and also to township authorities) creative and innovative approaches will need to be trailed.
This will be linked to a culturally appropriate community environmental sanitation and awareness program that the TPC, VWU and NGO will help develop in conjunction with the local communities (inputs from local women will be a feature of this approach based on the premise that it is women who will be the driving force for improved environmental sanitation). It is via this program that some of the more inappropriate practices adopted by households used to rural living (e.g. locating livestock pens upstream of both housing and water sources) can be modified.
7. LIVELIHOOD IMPROVEMENTS
Seasonal vulnerability induced by problematic access to water, especially during the height of the dry season, should be reduced to a large extent. Manifestations of this vulnerability including the opportunity costs of waterborne illnesses (estimated to be in excess of VND 275,000 per household member illness) or savings in time spent by primarily women and girls collecting water will not only improve household incomes but mitigate to some extent the domestic burden of women and girls.
The demand driven interventions should also further develop local entrepreneurship as households exercise their choice not only on the menu of options they are seeking but on what prices they are prepared to pay (hence the development of a market economy grounded in existing and potential livelihood possibilities).
Interventions this Project is going to support will enable public sector officials who are currently domiciled in Buon Ma Thout to make that all important move to Gia Nghia, which many are reluctant to finalize at present because of limited WSS related infrastructure. This can only auger well for the consolidation of public sector activities grounded in Gia Nghia and not in the neighboring province.
Finally, of equal importance by attempts to involve all of the population in a “total” or “100 percent” approach to environmental sanitation not only does such an approach improve health but also empowers the local people of Gia Nghia by actively involving them in the design of the program but also develops a sense of unity and purpose

TA 4485-VIE: Central Region Small and Medium Towns Development Project FINAL REPORT Appendix 3, page 54
June 2006
among different groups. This is an important social development issue in a town such as Gia Nghia that is growing very rapidly.
8. ACCESS TO WATER SUPPLY
Based on the survey, none of the households in Gia Nghia use tap water for their domestic needs, instead of 96% rely on drill well as source of water supply while 4% rely on the dug well and the remaining 60% purchase water/river and ponds.
9. SOLID WASTE MANAGEMENT
A small majority (51.4%) of households dispose of solid waste by paying a fee for it to be collected by a waste management company. The rest burn, bury or scatter it on the ground. There was inadequate solid waste collection and landfill sites.
10. ENVIRONMENTAL SANITATION AND AWARENESS
Survey results show that 80% of respondents in Gia Nghia were found to have adapted certain sanitation practices like washing hands after using the toilet and boiling of water for drinking (95%). About 20% has septic tank, 50% uses the latrine and only about 5% has temporary or no toilet.

TA 4485-VIE: Central Region Small and Medium Towns Development Project FINAL REPORT Appendix 3, page 55
June 2006
SOCIOECONOMIC PROFILE OF EA T’LING TOWN: OVERVIEW
A. Population, Household, FY 2004:
Total Population34: 27,527 B. Labor Force: Total Labor: 9,212
- Agriculture Sector: 42% - Business/Service Sector: 53% - Other Sector: 5%
C. Ethnic Minorities: 1,542 ethnic minorities comprising of E de, Bana, Gia Rai, M’Nong D. Average Monthly Income (per person): VND 300,000 – 400,000 E. Poverty Rate:
- 44.89% (New standard of MOLISA, 2005) F. Educational Situation:
- 97.0% of the children go to school. - compulsory general education at the primary level. - teaching staff skilled and knowledgeable; sufficient school buildings.
G. Health Care Situation35: - Cases of malnutrition under 5s per year: 538 (2004) - Infant mortality (per 1,000 live births, per year): 2 - Maternal mortality ratio (per 10,000 live births, per year): 0 - Cases of Malaria: 76 (2004) - New cases of Tuberculosis: 7 (2004) - New cases of HIV/AIDS: 0
H. Domestic Water Supply Situation (Percentage of HH Using Water) Tap Water: 10% Drill Well: 76% Dug Well: 24% Purchase Water/Rivers & Ponds: 7%
I. Solid Waste/Wastewater System: - lack of solid waste collection and landfill. - there is no wastewater system in the town.
J. Environmental Sanitation and Awareness: Septic Tank: 10% Latrine: 60% Temporary/No Toilet: 30% Boil Water for Drinking: 98% Sanitation Practices36: 85%
Note: This preliminary profile is based on a series of participatory meetings of the Project Team in each town.
34 This figure is based on meetings and discussions with the PPCs and MABUTIP, the surveys conducted by the Consultant’s engineering
and socioeconomic group, towns statistics books and existing master plans. 35 Statistics were provided by the Ea T’ling Health Care Center. 36 Specific question asked of the respondents was whether they washed their hands after using the toilet.

TA 4485-VIE: Central Region Small and Medium Towns Development Project FINAL REPORT Appendix 3, page 56
June 2006
SOCIOECONOMIC SURVEY OF EA T’LING: SUMMARY FINDINGS
1. BACKGROUND ON THE AREA
Ea T’ling is another small Central Highlands Class V town in Cu Jut District in the recently created province (2004) of Dak Nong. It is located approximately 20 kilometers south of the provincial capital of Buon Ma Thuot on National Road 14 and a prominent geographical feature is the Serepok River.
Ea T’ling is trying to transforming itself into a trading center for the rural hinterland providing a diverse range of goods and services. These goods include a wide range of technical inputs to support the ongoing commercialization of agriculture and consumer durables to meet growing demand in the town and the rural hinterland including among the Mnong and to some extent the Ede, who until very recently were less interested in the trapping of consumerism (88.9% own a motorcycle and 77.8% a mobile phone although the very poor are unlikely to own either). Services include technical support for cash cropping (e.g. coffee growers are primarily linked with the market in Buon Ma Thuot ) and this is unlikely to change much in the foreseeable future because of its close proximity to Buon Ma Thuot although an industrial park has been established in an attempt to attract investment from elsewhere in Vietnam and possibly abroad.
2. ECONOMY
Ea T’ling is trying to transforming itself into a trading center for the rural hinterland providing a diverse range of goods and services. These goods include a wide range of technical inputs to support the ongoing commercialization of agriculture and consumer durables to meet growing demand in the town and the rural hinterland including among the Mnong and to some extent the Ede, who until very recently were less interested in the trapping of consumerism (88.9% own a motorcycle and 77.8% a mobile phone although the very poor are unlikely to own either). Services include technical support for cash cropping (e.g. coffee growers are primarily linked with the market in Buon Ma Thuot ) and this is unlikely to change much in the foreseeable future because of its close proximity to Buon Ma Thuot although an industrial park has been established in an attempt to attract investment from elsewhere in Vietnam and possibly abroad. The Master Plan forecasts that the urban population will grow by 3.7% to 2010, 3.6% to 2015, and 3.5% thereafter.
3. DEMOGRAPHIC PROFILE
Ea T’ling has a total population of 27,527. The Master Plan forecasts that the urban population will grow by 3.7% to 2010, 3.6% to 2015, and 3.5% thereafter.
Historically, the small hamlets that surrounded present day Ea T’ling were the primary habitat of the Mnong, a Mon-Khmer upland ethnic minority, and to a lesser extent the Ede a Malayo-Polynesian upland ethnic minority. Two other ethnic minority groups, the Tay and Nung from the Northern Uplands, and who migrated to this town during the 1980s constitute the other ethnic minority groups in the town. Ethnic minorities constitute 16.7 percent of the total population but excluding the Tay and Nung the two indigenous upland groups constitute approximately 11.9 percent of the population so in this town upland ethnic minority groups from elsewhere in Vietnam are more numerous than in the other Project towns.

TA 4485-VIE: Central Region Small and Medium Towns Development Project FINAL REPORT Appendix 3, page 57
June 2006
However, in Ward 7 the Mnong constitute a significant minority (42.2%), similarly in Ward 10 (40%), Ward 13 (34.7%), Ward 12 (29.8%) and Ward 4 (27.8%). Their livelihoods depended primarily on a mixture of market-based agricultural activities (especially coffee, pepper, tobacco), valley-based subsistence activities including the cultivation of rice and rearing of livestock and shifting cultivation (especially the cultivation of upland rice and other cereal crops such as corn for subsistence purposes). Better-off Mnong households have developed coffee, pepper and tobacco market-based cropping livelihood-based strategies.
Of people living in those areas of the town that have been identified as technically feasible for the proposed water supply system, the ethnic Kinh group constitute 82.2 percent of the population system. Ea T’ling has experienced a lot of inward migration since the end of the Vietnam War in 1975 but unlike other Central Highland project towns where high growth rates are projected it is assumed that population growth will be lower although higher than in most of the Central Coastal Region project towns.
3.1 Labor Force and Employment
Ea T’ling’s labor force reached 9,212 wherein 42% work in the agriculture/aquaculture sector, 53% in the business/services sector and 5% in the other sector.
3.2 Income
The residents of Gia Nghia receive an average monthly income between VND 300,000 - 400,000.
3.3 Education
Survey results show that 97 percent of children in Ea T’ling attend school. This may be attributable to the fact that general education at the primary level is compulsory. Meanwhile, the teaching staff was found to be skilled and knowledgeable and there is presence of sufficient school buildings.
3.4 Health
Cases of malnutrition for children under 5 years in Ea T’ling town was pegged at 538 in 2004. New cases of tuberculosis reached 7 in the same reference period while cases of malaria reached 76.
4. POVERTY AND VULNERABILITY
The MOLISA poverty rate is 44.89 percent but the highest poverty rates occur in wards where very few ethnic minority persons are found (e.g. the very poorest wards notably Ward 1 where 79% of the population are considered poor or Ward 10 where 60.3% of the population are in a similar position) although Ward 7 (where there are significant numbers of Mnong) the poverty rate (65.7%) is the second highest. Hence ethnicity per se is not the only variable impacting upon poverty in Ea T’ling. Quang Khe is the second poorest (by MOLISA estimates) in the Project area but the Water Poverty Index is 50.7 percent based on the average water fee of VND 8,500 households are obliged to pay. The average per capita monthly income is VND 417,000 (for males VND 482,000 and females VND 437,000), which is 23.7 percent higher than the average for all Project towns. This reflects its rather close proximity to the most prosperous

TA 4485-VIE: Central Region Small and Medium Towns Development Project FINAL REPORT Appendix 3, page 58
June 2006
provincial capital in the Central Highlands. However, like Gia Nghia this is quite an unequal town with the lowest quintile only having 8.3 percent of the income compared to the top quintile with 38 percent, the second highest in the Project area.
There is some poverty among recently arrived migrants, especially those who are unregistered and find it difficult to access health and educational services available to registered migrants. These migrants have little knowledge of traditional upland livelihood systems, with the exception of both the Tay and Nung, although because they are primarily from the Kinh ethnic group and have some experience in non-rural based livelihood activities.
5. GENDER
The gender profile of household heads in Eatling almost correspond to that of the national pattern. Female-headed households (FHHS) comprise 31 percent while the remainder is headed by males. There seem to be a lower proportion of male labor migrants to other urban centers. Perhaps the employment opportunities offered by nearby coffee/tea plantations has stemmed the tide of male migration to cities, in search of livelihood opportunities. Moreover, the FHHS’ monthly per capita income (VND 482,000) is a bit higher than those headed by males (VND 417,000). This is perhaps due to the presence of ethnic minority households in this area where women have considerable influence in their households. But when we compare the incomes of men and women in different occupational categories, women get lower incomes than the males. For example, among farmers, males get an average of VND990,000 per month, much higher compared to that of females (VND678,000).
Women, in general, take care of WSS-related activities at the household level such as cooking, washing, cleaning, taking care of children, the sick and the elderly and disposing of human wastes and garbage. Like other highland towns, most women here obtain their water for drinking, cooking and washing from open dug wells (55 percent), water vendors (24 percent) and the rest share with others or from rain water tanks and boreholes. Women spend an average of 5-10 minutes a day collecting water, depending on the season. Almost half of the households dispose their human waste fertilizer for their gardens/farms or food supply to fishponds. Majority of the households (73 percent) burn their garbage or have it collected (23 percent).
More than half (57 percent) of the surveyed household possess certificates of land use and majority were registered in the husband’s name. In terms of community participation, women are very visible in the Women’s Union and the Elder Union but have lower visibility in the town/provincial committees. At the ward level, however, quite a number of leaders are women but their representation decreases as we go higher in the political administrative hierarchy. Because women manage WSS-related activities, they are very eager for support in upgrading their water facilities. They want credit support for water connection, improvement of their drainage system and waste disposal as they have very low access to credit for these needs. Understandably, they trust the Women’s Union more to manage this type of credit.

TA 4485-VIE: Central Region Small and Medium Towns Development Project FINAL REPORT Appendix 3, page 59
June 2006
6. INTERVENTIONS TO SUPPORT THE PROJECT
The Ethnic Minority Development Plan included in Annex xx was designed in conjunction with representatives of various Ea T’ling stakeholder groups. It will ensure that those households willing to leverage the benefits of this Project will be assisted via a public-private partnership involving the TPC, VWU and suitable NGO to finance demand as against supply driven interventions based on a “consumer” rather than a “beneficiary” approach. The demand for year round access to suitable water for drinking and cooking purposes is the major priority for most households and it is anticipated that a scheme to mobilize savings (e.g. savings and credit groups) will be utilized. However, because this approach is new to upland ethnic minority groups (and also to township authorities) creative and innovative approaches will need to be trailed.
This will be linked to a culturally appropriate community environmental sanitation and awareness program that the TPC, VWU and NGO will help develop in conjunction with the local communities (inputs from local women will be a feature of this approach based on the premise that it is women who will be the driving force for improved environmental sanitation). It is via this program that some of the more inappropriate practices adopted by households used to rural living (e.g. locating livestock pens upstream of both housing and water sources) can be modified.
7. LIVELIHOOD IMPROVEMENTS
Seasonal vulnerability induced by problematic access to water, especially during the height of the dry season, should be reduced to a large extent. Manifestations of this vulnerability including the opportunity costs of waterborne illnesses (estimated to be in excess of VND 275,000 per household member illness) or savings in time spent by primarily women and girls collecting water will not only improve household incomes but mitigate to some extent the domestic burden of women and girls.
The demand driven interventions should also further develop local entrepreneurship as households exercise their choice not only on the menu of options they are seeking but on what prices they are prepared to pay (hence the development of a market economy grounded in existing and potential livelihood possibilities).
Finally, of equal importance by attempts to involve all of the population in a “total” or “100 percent” approach to environmental sanitation not only does such an approach improve health but also empowers the local people of Ea T’ling by actively involving them in the design of the program in ways that perhaps previous development interventions have not.
8. ACCESS TO WATER SUPPLY
Based on the survey, 10% of the households in Ea T’ling use tap water for their domestic needs, 76% rely on drill well as source of water supply while 24% make use of dug well. It was likewise found that 7% either purchase water or source their water from rivers and ponds.
9. SOLID WASTE MANAGEMENT
At Ea T’ling, solid waste collection and landfill are lacking and there is no wastewater system in the town.

TA 4485-VIE: Central Region Small and Medium Towns Development Project FINAL REPORT Appendix 3, page 60
June 2006
10. ENVIRONMENTAL SANITATION AND AWARENESS
Survey results show that 85% of respondents in Ea T’ling were found to have adapted certain sanitation practices like washing hands after using the toilet and boiling of water for drinking (98%). About 10% has septic tank, 60% uses the latrine and about 30% has temporary or no toilet.

TA 4485-VIE: Central Region Small and Medium Towns Development Project FINAL REPORT Appendix 3, page 61
June 2006
SOCIOECONOMIC PROFILE OF DAK MAM TOWN: OVERVIEW
A. Population, FY2004:
Total Population37: 8,972 B. Labor Force: Total Labor: 2,150
- Agriculture Sector: 75% - Industrial Sector: 3% - Business/Service Sector: 12% - Unemployment: 10%
C. Ethnic Minorities: - Ede: 10.5%
D. Average Monthly Income (per person): VND 350,000 – 450,000 E. Poverty Rate:
- about 36% (New standard of MOLISA, 2005) F. Educational Situation:
- 95.0% of the children go to school. - 90% of the make-shift schools teach up to Grade IV. - 10% of concrete/brick school buildings have a second floor level. - teaching staff skilled and knowledgeable; sufficient school buildings.
G. Health Care Situation38: - Cases of malnutrition under 5s per year: 30% (2004) - New cases of HIV/AIDS: 0
H. Domestic Water Supply Situation (Percentage of HH Using Water) Tap Water: 0% Drill Well: 20% Dug Well: 70% Purchase Water: 10%
I. Solid Waste/Wastewater System: - no drainage system; no landfill site.
J. Environmental Sanitation and Awareness: Septic Tank: 15% Latrine: 20% Temporary/No Toilet: 58% Boil Water for Drinking: 95% Sanitation Practices39: 90%
Note: This preliminary profile is based on a series of participatory meetings of the Project Team in each town.
37 This figure is based on meetings and discussions with the PPCs and MABUTIP, the surveys conducted by the Consultant’s engineering
and socioeconomic group, towns statistics books and existing master plans. 38 Statistics were based on the yearly report of the Health Care Center. 39 Specific question asked of the respondents was whether they washed their hands after using the toilet.

TA 4485-VIE: Central Region Small and Medium Towns Development Project FINAL REPORT Appendix 3, page 62
June 2006
SOCIOECONOMIC SURVEY OF DAK MAM: SUMMARY FINDINGS 1. BACKGROUND ON THE AREA
Dak Mam is a relatively small Central Highlands Class V district town in the recently created province (2004) of Dak Nong. It is located approximately 35 kilometers south of Ea T’ling town and 85 kilometers northeast of the provincial capital of Gia Nghia.
Dak Mam is primarily a semi-rural town that provides a range of goods and services to both the urban and rural populations. These goods include technical inputs for cash cropping but also increasingly include a range of household consumables (91% of the urban households own mobile phones and 97% motorbikes). Services including basic health and education are also provided and to some extent private sector financial services as well (although the poor lack the collateral to take advantage of such services). Dak Mam is in a similar position to other small towns in the Central Highlands and whether it can maintain sustainable growth patterns largely depends on how much value can be captured from commodities sourced locally.
2. ECONOMY
Dak Mam is primarily a semi-rural town that provides a range of goods and services to both the urban and rural populations. These goods include technical inputs for cash cropping but also increasingly include a range of household consumables (91% of the urban households own mobile phones and 97% motorbikes). Services including basic health and education are also provided and to some extent private sector financial services as well (although the poor lack the collateral to take advantage of such services). The Master Plan forecasts that the urban population will grow by 11% to 2010, 7% to 2015 and at a slower rate of 4% thereafter. Dak Mam is in a similar position to other small towns in the Central Highlands and whether it can maintain sustainable growth patterns largely depends on how much value can be captured from commodities sourced locally.
3. DEMOGRAPHIC PROFILE
Dak Mam has a total population of 8,972. The Master Plan forecasts that the urban population will grow by 11% to 2010, 7% to 2015 and at a slower rate of 4% thereafter.
Historically, the small hamlets that surrounded present day Dak Mam were the primary habitat of the Ede (second largest ethnic group in the Central Highlands), a Malayo-Polynesian upland ethnic minority. This group constitutes 10.5 percent of the total population but 51.5 percent of the population in Bon Brioh, 47.8 percent of the population in Bon Dru, 32.9 percent of the population in Bon Yok Linh. Their livelihoods depended primarily on shifting cultivation (especially the cultivation of upland rice for subsistence purposes). However, in recent times better-off Ede households have developed small-scale coffee plantations as part of their market-based cropping livelihood-based strategies. The problem is that coffee experienced quite severe fluctuations on the world market for much of the late 1990s.
Of people living in those areas of the town that have been identified as technically feasible for the proposed water supply system, the ethnic Kinh group constitute nearly 100 percent of the population system. In the hamlets on slopes and valleys contiguous with the actual town the majority of people are Ede. Dak Mam has experienced a lot of

TA 4485-VIE: Central Region Small and Medium Towns Development Project FINAL REPORT Appendix 3, page 63
June 2006
inward migration since the end of the Vietnam War in 1975 and as in other Central Highland towns where quite high growth rates are projected it is assumed that much of this population increase will come from the inward migration of Kinh.
3.1 Labor Force and Employment
Dak Mam’s labor force reached 2,150 wherein 75% work in the agriculture/aquaculture sector, 12% in the business/services sector and 3% in the industrial sector.
3.2 Income
The residents of Gia Nghia receive an average monthly income between VND 350,000 - 450,000.
3.3 Education
Survey results show that 95 percent of children in Ea T’ling attend school. This may be attributable to the fact that general education at the primary level is compulsory. Meanwhile, the teaching staff was found to be skilled and knowledgeable and there is presence of sufficient school buildings.
3.4 Health
Cases of malnutrition for children under 5 years in Dak Mamtown was said to be 30% in 2004.
4. POVERTY AND VULNERABILITY
The MOLISA poverty rate is 36 percent but the highest poverty rates occur in Bon Dru (82%), Bon Broih (69%) – two wards or rather communes where there are substantial ethnic minority groups – and Dak Voung (43%) and Ward 7 (39.5%) where no ethnic minorities can be found. Hence there is not simply a correlation between ethnicity in Dak Mam and poverty (and this is one of the reasons why the PPC is concerned that the Project also target poor ethnic Kinh as well in these Central Highland towns). The Water Poverty Index only adds 3.1 percent to the poverty index (WPI of 29.8%) because the average price paid for water is VND 6,400. Dak Mam is also the most unequal town in the project area with the lowest quintile receiving only 1 percent of the income compared to the top two quintiles that receive over 69.9 of the income. Dak Mam has not been very good at ensuring that its poorest and most vulnerable households are included in the economic development that has clearly benefited upwards of 40 percent of the population but not necessarily the rest.
Nevertheless, the characteristics of poverty in Dak Mam are somewhat different to that of people living in poverty in the Central Coastal Region Towns. Because poorer people in Dak Mam have some opportunities (increasingly limited because of coffee expansion and deforestation) to derive a portion of their livelihoods from upland shifting agriculture (theoretically outlawed and local authorities do try and enforce such a ban) they do not have to rely on the informal or non-formal urban sector to the same extent as poorer urban people elsewhere. In fact it is more correct to depict most of the poor in Dak Mam as being more “rural” in nature than “urban” in ways similar to people living on the outskirts of Quang Khe.

TA 4485-VIE: Central Region Small and Medium Towns Development Project FINAL REPORT Appendix 3, page 64
June 2006
There is some poverty among recently arrived migrants, especially those who are unregistered and find it difficult to access health and educational services available to registered migrants. These migrants have little knowledge of traditional upland livelihood systems although because they are primarily from the Kinh ethnic group and have some experience in non-rural based livelihood activities.
5. GENDER
The town of Dak Mam has a much lower proportion (8 percent) of female-headed households (FHHS) compared to the national figure of 30 percent. This town does not seem to have a high proportion of male labor migrants to other urban centers. Perhaps the employment opportunities offered by nearby coffee/tea plantations has stemmed the tide of male migration to cities, in search of livelihood opportunities. Moreover, the FHHS’ monthly per capita income (VND 445,000) is almost at par, if not better, compared to those headed by males (VND 441,000). This is perhaps due to the presence of ethnic minority households in this area where women have considerable influence in their households. But the poverty incidence of this town (36 percent) is a little bit higher than the national average, so both males and females suffer from lower living standards, especially those in the peri-urban area who do not have access to good quality of water. But compared to other towns, the people in Dak Mam seem to earn higher incomes. But when we compares the incomes of men and women in different occupational categories, women get lower incomes than the males. For example, among farmers, males get an average of VND734,000 per month, higher compared to that of females (VND577,000).
Women, in general, take care of WSS-related activities at the household level such as cooking, washing, cleaning, taking care of children, the sick and the elderly and disposing of human wastes and garbage. Most women in this town obtain their water for drinking, cooking and washing from open dug wells (78 percent), water vendors (20 percent) and the rest from rain water tanks or nearby boreholes. Women spend an average of 15-20 minutes a day collecting water, depending on the season. A high proportion of households (57 percent) dispose of human wastes as fertilizer for their gardens/farms while the rest bury it or utilize it for making biogas. About 90 percent burn their garbage while the rest bury it.
An overwhelming 97 percent of the surveyed possessed certificates of land use and majority (93 percent) were registered in the husband’s name. In terms of community participation, women are very visible in the Women’s Union and the Elder Union but have lower visibility in the town/provincial committees. At the ward level, however, majority of the leaders are women but their representation decreases as we go higher in the political administrative hierarchy. Because women manage WSS-related activities, they are very eager for support in upgrading their water facilities. They want credit support for water connection, improvement of their drainage system and waste disposal as they have very low access to credit for these needs. Understandably, they trust the Women’s Union more to manage this type of credit.
6. INTERVENTIONS TO SUPPORT THE PROJECT
The Ethnic Minority Development Plan included in Annex xx was designed in conjunction with representatives of various stakeholder groups, although representatives in Dak Mam noted they thought MARD via the DANIDA financed RWSS Project should assume responsibility for poorer ethnic minority households in the wards/communes with a higher incidence of poverty: this is cautioned against

TA 4485-VIE: Central Region Small and Medium Towns Development Project FINAL REPORT Appendix 3, page 65
June 2006
because of the high cost of DANIDA interventions and the fact that the poor despite very good project design are not being targeted. It will ensure that those households willing to leverage the benefits of this Project will be assisted via a public-private partnership involving the TPC, VWU and suitable NGO to finance demand as against supply driven interventions based on a “consumer” rather than a “beneficiary” approach. The demand for year round access to suitable water for drinking and cooking purposes is the major priority for most households and it is anticipated that a scheme to mobilize savings (e.g. savings and credit groups) will be utilized. However, because this approach is new to upland ethnic minority groups (and also to township authorities) creative and innovative approaches will need to be trailed.
This will be linked to a culturally appropriate community environmental sanitation and awareness program that the TPC, VWU and NGO will help develop in conjunction with the local communities (inputs from local women will be a feature of this approach based on the premise that it is women who will be the driving force for improved environmental sanitation).
7. LIVELIHOOD IMPROVEMENTS
Seasonal vulnerability induced by problematic access to water, especially during the height of the dry season, should be reduced to a large extent. Manifestations of this vulnerability including the opportunity costs of waterborne illnesses (estimated to be in excess of VND 275,000 per household member illness) or savings in time spent by primarily women and girls collecting water will not only improve household incomes but mitigate to some extent the domestic burden of women and girls.
The demand driven interventions should also further develop local entrepreneurship as households exercise their choice not only on the menu of options they are seeking but on what prices they are prepared to pay (hence the development of a market economy grounded in existing and potential livelihood possibilities). However, given the very poor profile of the major ethnic minority group in Dak Mam additional safeguards will be necessary to ensure potential entrepreneurs from amongst this group are included in any business development program.
Finally, of equal importance by attempts to involve all of the population in a “total” or “100 percent” approach to environmental sanitation not only does such an approach improve health but also empowers the local people of Gia Nghia by actively involving them in the design of the program but also develops a sense of unity and purpose among different groups. This is an important social development issue in a town such as Gia Nghia that is growing very rapidly.
8. ACCESS TO WATER SUPPLY
None of the households have access to tap water. Most of the people in this town rely on drill wells (20%) to supply water during the wet season and for part of the dry season. A much smaller number rely on rainwater storage tanks (9%) but when water levels in these wells gets very low during the height of the dry season they need to either buy water. Meanwhile, 70% utilize dug well and 10% purchase water.
In the peri-urban areas where most of the ethnic Ede reside they would prefer to rely on dug wells during the wet season (that they could finance with some assistance) and a combination of dug wells and piped water via standpipes or water delivery vehicle during the height of the dry season. Town supply water would be used for purposes

TA 4485-VIE: Central Region Small and Medium Towns Development Project FINAL REPORT Appendix 3, page 66
June 2006
other than drinking or cooking, hence keeping intact the cultural preferences of the ethnic Ede, which is a similar approach to that adopted by other upland ethnic minority groups in the Central Highlands.
9. SOLID WASTE MANAGEMENT
Little priority is paid to the disposal of solid waste (at least human waste) in Dak Mam at present because most households use this waste to fertilize their gardens, which of course is a source of livelihood to ensure household food security.
10. ENVIRONMENTAL SANITATION AND AWARENESS
Survey results show that 90% of respondents in Dak Mam were found to have adapted certain sanitation practices like washing hands after using the toilet and boiling of water for drinking (95%). About 15% has septic tank, 20% uses the latrine and a significant 58% has temporary or no toilet.
As in other Central Highlands towns, most households in the the peri-urban hamlets of Dak Mam currently use the bushes close to houses and also sometimes water sources for their personal hygiene needs.

TA 4485-VIE: Central Region Small and Medium Towns Development Project FINAL REPORT Appendix 3, page 67
June 2006
SOCIOECONOMIC PROFILE OF QUANG KHE TOWN: OVERVIEW
A. Population, FY2004:
Total Population40: 5,214 B. Labor Force: Total Labor: 2,090
- Agriculture Sector: 92% - Industrial Sector: 1.2% - Business/Service Sector: 5.9%
C. Ethnic Minorities: About 62.65% is ethnic minority (mainly Ma and M’Nong groups) D. Average Monthly Income (per person): VND 250,000 – 350,000 E. Poverty Rate:
- about 54.41% (New standard of MOLISA, 2005) F. Educational Situation:
- 85.0% of the children go to school. - compulsory general education at the primary level. - teaching staff skilled and knowledgeable; sufficient school buildings.
G. Health Care Situation41: - Cases of malnutrition under 5s per year: 30% (2004) - Infant mortality (per 1,000 live births, per year): NA - Maternal mortality ratio (per 10,000 live births, per year): NA - Cases of Malaria: 35% (2004) - Cases of Dengue Fever: NA - New cases of Tuberculosis: NA - New cases of HIV/AIDS: NA
H. Domestic Water Supply Situation (Percentage of HH Using Water) Tap Water: 0.5% Drill Well: 212 wells Dug Well: 4 wells Purchase Water: 0%
I. Solid Waste/Wastewater System: - no inundation; no landfill site; no drainage system.
J. Environmental Sanitation and Awareness: Septic Tank: 0% Latrine: NA Temporary/No Toilet: NA Boil Water for Drinking: NA Sanitation Practices42: 0%
Note: This preliminary profile is based on a series of participatory meetings of the Project Team in each town.
40 This figure is based on meetings and discussions with the PPCs and MABUTIP, the surveys conducted by the Consultant’s engineering
and socioeconomic group, towns statistics books and existing master plans. 41 Statistics were provided by the Quang Khe Health Care Center. 42 Specific question asked of the respondents was whether they washed their hands after using the toilet.

TA 4485-VIE: Central Region Small and Medium Towns Development Project FINAL REPORT Appendix 3, page 68
June 2006
SOCIOECONOMIC SURVEY OF QUANG KHE: SUMMARY FINDINGS
1. BACKGROUND ON THE AREA
Quang Khe is a small Central Highlands Class V town in the recently created province (2004) of Dak Nong. It is located approximately 35 kilometers south of the provincial capital of Gia Nghia on a road that eventually leads to Ho Chi Minh.
Quang Khe is primarily a semi-rural town that provides a range of goods and services to rural villages. These goods include technical inputs for cash cropping but also increasingly include a range of household consumables that until recently were not widely used in rural areas, especially among the Ma. Services include technical support for cash cropping (e.g. coffee growers are primarily linked with market in Ho Chi Minh and little by way of value adding occurs in Quang Khe) but increasingly health and educational services are also being provided from Quang Khe.
2. ECONOMY
Quang Khe is primarily a semi-rural town that provides a range of goods and services to rural villages. These goods include technical inputs for cash cropping but also increasingly include a range of household consumables that until recently were not widely used in rural areas, especially among the Ma. Services include technical support for cash cropping (e.g. coffee growers are primarily linked with market in Ho Chi Minh and little by way of value adding occurs in Quang Khe) but increasingly health and educational services are also being provided from Quang Khe. The Master Plan forecasts that the urban population will grow by 15% to 2010, 14% to 2015, and 10% to 2020. Existing economic based activities could not support that level of growth without more emphasis on value-added activities now undertaken downstream being undertaken in Quang Khe.
3. DEMOGRAPHIC PROFILE
Quang Khe has a total population of 5,214. The Master Plan forecasts that the urban population will grow by 15% to 2010, 14% to 2015, and 10% to 2020. Existing economic based activities could not support that level of growth without more emphasis on value-added activities now undertaken downstream being undertaken in Quang Khe.
Historically the very small hamlets that surrounded present day Quang Khe were the primary habitat of the Ma, a Mon-Khmer upland ethnic minority. This group constitutes 62.6 percent of the total population. Their livelihoods depended primarily on shifting cultivation (especially the cultivation of upland rice for subsistence purposes). However, in recent times better-off Ma households have developed coffee, pepper, and tobacco market-based cropping livelihood-based strategies. The problem is that such commodities have experienced quite severe fluctuations on the world market (especially coffee) and the economic boom of the late 1980s and early 1990s experienced a downturn during the late 1990s forcing households to ensure that their livelihood strategies are not simply based on market demand for coffee, pepper and tobacco.
Of people living in those areas of the town that have been identified as technically feasible for the proposed water supply system, the Ma constitute 67.4 percent of the

TA 4485-VIE: Central Region Small and Medium Towns Development Project FINAL REPORT Appendix 3, page 69
June 2006
population system and in the hamlets on slopes and valleys contiguous with the actual town almost all people are Ma. Hence Quang Khe is unlike the other three Project towns of Dak Nong, where in these areas most of the population is ethnic Kinh that have migrated from other areas in Vietnam including the Northern Coastal Region. However, if Quang Khe is to grow as is being strongly advocated by both central and provincial government it must be assumed that migrants from outside the Central Highlands will make up a sizable proportion of this population growth.
3.1 Labor Force and Employment
Quang Khe’s labor force reached 2,090 wherein 92% work in the agriculture/aquaculture sector, 5.9% in the business/services sector and 1,2% in the Industrial sector.
3.2 Income
The residents of Quang Khe receive an average monthly income between VND 250,000 - 350,000.
3.3 Education
Survey results show that 85 percent of children in Quang Khe attend school. This may be attributable to the fact that general education at the primary level is compulsory. Meanwhile, the teaching staff was found to be skilled and knowledgeable and there is presence of sufficient school buildings.
3.4 Health
Cases of malnutrition for children under 5 years in Quang Khe town was said to be 30% in 2004, while cases of malaria waspegged at 35% in the same referenceperiod.
4. POVERTY AND VULNERABILITY
The MOLISA poverty rate is 54.41 percent and it is estimated locally that nearly all people living in poverty are from the Ma ethnic group. This is the highest MOLISA poverty rate of any of the Project towns but the Water Poverty Index is the second highest at 58.6 percent (after Cam Ranh) reflecting the lower amount households pay for water during the dry season (estimated at approximately VND 7,250) compared to most of the Central Coastal Region Towns.
Nevertheless, the characteristics of poverty in Quang Khe are somewhat different to those of people living in poverty in the Central Coastal Region Towns. Because Quang Khe is more rural and there are some opportunities for poorer Ma to derive a portion of their livelihoods from upland shifting agriculture (theoretically outlawed but local authorities cannot afford to rigorously enforce such a ban) they do not have to rely on the informal or non-formal urban sector to the same extent as poorer urban people elsewhere. In fact it is more correct to depict most of the poor in Quang Khe as being more “rural” in nature than “urban” although there are some examples of very poor and vulnerable households in this town (children suffer from high incidence of waterborne illnesses during the dry season and there are some problems with full household food security although nutrient deficiencies appear to be the major problem).

TA 4485-VIE: Central Region Small and Medium Towns Development Project FINAL REPORT Appendix 3, page 70
June 2006
There is some poverty among recently arrived migrants, especially those who are unregistered and find it difficult to access health and educational services available to registered migrants. These migrants have little knowledge of traditional upland livelihood systems although because they are primarily from the Kinh ethnic group and have some experience in non-rural based livelihood activities they are in a better position to provide a range of services to other better-off Kinh and even the Ma.
5. GENDER
The town of Quang Khe has a much lower proportion (16 percent) of female-headed households (FHHS) compared to the national figure of 30 percent. This town does not seem to have a high proportion of male labor migrants to other urban centers. Perhaps, the employment opportunities offered by nearby coffee/tea plantations has stemmed the tide of male migration to cities in search of livelihood opportunities. Moreover, the FHHS’ monthly per capita income (VND 231,000) is not very far from those headed by males (VND 255,000). This is perhaps due to the presence of ethnic minority households in this area where women have considerable influence in their households. But because the poverty incidence of this town (55 percent) is quite high and income levels quite low compared to other towns, both males and females suffer from lower living standards, especially poor quality of water. Survey data reveal that 58 percent of the households earn less than VND 189,000 per month. While the proportion of illiterate women is quite small (3 percent) and not much higher than that of males (2 percent), when we examine their incomes according to their occupation, the women get lower than the males. For example, among hired workers, males get an average of VND557,000 per month higher compared to that of females (VND440,000).
Women, in general, take care of WSS-related activities at the household level such as cooking, washing, cleaning, taking care of children, the sick and the elderly and disposing of human wastes and garbage. Most women in this town obtain their water for drinking, cooking and washing from rainwater tanks (49 percent) or nearby boreholes (37 percent), open dug wells (12 percent), while a small portion purchase water from vendors (2 percent). They spend an average of 30 minutes (wet season) to 35 minutes (dry season) a day in collecting water. Because of the scarcity of good quality water, the residents of Quang Khe, especially the low-income ethnic minorities in the peri-urban areas suffer from diseases like diarrhea, dengue fever, and cholera. About 78 percent bury their human wastes while the rest dispose it to the nearest river, lake, watr channel or use it as fertilizer for their gardens/farms. Owing to the topography of the town, quite a proportion (28 percent) have expressed concern about water run-off from pesticides and animal/human wastes.
Three-fourths of those surveyed possessed certificates of land use and majority (88 percent) were registered in the husband’s name. In terms of community participation, women are very visible in the Women’s Union and the Elder Union but have lower visibility in the town/provincial committees. At the ward level, however, majority of the leaders are women but their representation decreases as we go higher in the political administrative hierarchy. Because women manage WSS-related activities, they are very eager for support in upgrading their water facilities. They want credit support for water connection, improvement of their drainage system and waste disposal as they have very low access to credit for these needs. Understandably, they trust the Women’s Union more to manage this type of credit.
6. INTERVENTIONS TO SUPPORT THE PROJECT

TA 4485-VIE: Central Region Small and Medium Towns Development Project FINAL REPORT Appendix 3, page 71
June 2006
The Ethnic Minority Development Plan included in Annex xx was designed in conjunction with representatives of various Quang Khe stakeholder groups. It will ensure that those households willing to leverage the benefits of this Project will be assisted via a public-private partnership involving the TPC, VWU and suitable NGO to finance demand as against supply driven interventions based on a “consumer” rather than a “beneficiary” approach. The demand for year round access to suitable water for drinking and cooking purposes is the major priority for most households and it is anticipated that a scheme to mobilize savings (e.g. savings and credit groups) will be utilized. However, because this approach is new to upland ethnic minority groups (and also to township authorities) creative and innovative approaches will need to be trailed.
This will be linked to a culturally appropriate community environmental sanitation and awareness program that the TPC, VWU and NGO will help develop in conjunction with the local communities (inputs from local women will be a feature of this approach based on the premise that it is women who will be the driving force for improved environmental sanitation). It is via this program that some of the more inappropriate practices adopted by households used to rural living (e.g. locating livestock pens upstream of both housing and water sources) can be modified.
7. LIVELIHOOD IMPROVEMENTS
Seasonal vulnerability induced by problematic access to water, especially during the height of the dry season, should be reduced to a large extent. Manifestations of this vulnerability including the opportunity costs of waterborne illnesses (estimated to be in excess of VND 275,000 per household member illness) or savings in time spent by primarily women and girls collecting water will not only improve household incomes but mitigate to some extent the domestic burden of women and girls.
The demand driven interventions should also further develop local entrepreneurship as households exercise their choice not only on the menu of options they are seeking but on what prices they are prepared to pay (hence the development of a market economy grounded in existing and potential livelihood possibilities).
Finally, of equal importance by attempts to involve all of the population in a “total” or “100 percent” approach to environmental sanitation not only does such an approach improve health but also empowers the local people of Quang Khe by actively involving them in the design of the program but also develops a sense of unity and purpose among different groups. This is an important social development issue in a town such as Quang Khe that is mooted to grow quite rapidly over the next 15 years.
8. ACCESS TO WATER SUPPLY
Less than 1 percent (0.5%) of households has access to tap water. Many of the people in this town rely on dug wells (4 wells) or drill wells (212 wells) to supply water during the wet season and for part of the dry season. While a slightly smaller number rely on rainwater storage tanks but when water levels in these wells gets very low during the height of the dry season they need to either buy water – which for cultural reasons (does not taste sweet and not from natural sources) the ethnic Ma try and avoid – or to collect water from streams and ponds surrounding the town (water quality in the ponds and to some extent in the streams is even of problematic quality during the wet season). Other households lying outside the proposed technical intervention rely on a combination of dug wells (too expensive for households living in poverty) and of course the streams and ponds.

TA 4485-VIE: Central Region Small and Medium Towns Development Project FINAL REPORT Appendix 3, page 72
June 2006
Households in the center of the town – which really at present is a cluster of houses along the main road and close to the market – are quite willing to pay for access to piped water if the tariffs are lower than what they have to pay for water at present or the costs associated with accessing water are less than those associated with existing sources. There appears to be little difference between the ethnic Kinh and Ma in this respect insofar as the latter are living in the center of town. However, in areas away from the market the ethnic Ma – which constitute the overwhelming majority – would prefer to rely on dug wells during the wet season (that they could finance with some assistance) and a combination of dug wells and piped water via standpipes or water delivery vehicle during the height of the dry season. Town supply water would be used for purposes other than drinking or cooking, hence keeping intact the cultural preferences of the ethnic Ma.
9. SOLID WASTE MANAGEMENT
Little priority is paid to the disposal of solid waste or drainage related issues in Quang Khe at present, not least of all because of its relatively un-crowded nature and a perception by local people that it is still little more than a village despite its upgrading to a Class V Town.

TA 4485-VIE: Central Region Small and Medium Towns Development Project FINAL REPORT Appendix 2, page 1
June 2006
SOCIOECONOMIC DEVELOPMENT PLANS OF PARTICIPATING PROVINCES
1. PHU YEN PROVINCE
The annual average GDP of Phu Yen grew by 10.8 percent for the period 2001 to 2005, exceeding the targeted rate of 10 to 10.5 percent. This economic growth rate is significantly higher than the 7.4 percent economic growth rate for the country as whole for the same period. The average GDP per capita of Phu Yen was estimated at VND5.76 million/person, equivalent to USD 384/person, comprising 65.7 percent of the national target of USD 584.
GDP growth is reflecting the increasing industrialization of Phu Yen with the contribution of the agriculture, forestry, and fisheries sectors gradually declining each year. By 2005, the industry and construction sectors will be contributing as much as 30.7 percent to GDP, while the agriculture, forestry and fishery sectors share will be reduced to 33.6 percent. The service and other sectors of the province will account for 35.7 percent of the GDP.
Phu Yen’s total revenue has increased considerably. For the period 2001 to 2005, the estimated total provincial revenue reached VND 2,152 billion or USD 143 million. By 2005, it is anticipated that the provincial revenue will equal VND 505 billion, constituting 136 percent of the targeted total revenue of VND 370 billion. Total investment in development by the province will reach almost VND 9,000 billion or USD 600 million, accounting for 33 percent of Phu Yen’s GDP. Of this total investment, the province directly contributed 45 percent or VND 4,000 billion or USD 266 million. Investment in development mobilized from external sources, including the ministries, central agencies and outside enterprises increased to VND 3,700 billion or USD 247 million.
An average of 22,000 jobs has been generated annually. Phu Yen has implemented several programs and projects to facilitate access by the poor to social services such as health care, education, culture and social affairs. Efforts to upgrade basic infrastructure are ongoing. The poverty rate in the province has been reduced from 26, 377 households to 10,079, equivalent to 5.2 percent which is higher than the target of 4 percent.
While the economy of Phu Yen continues to grow, concerns about the sustainability of its economic development persist. Achieving efficiency and competitiveness remains a key issue for the province in order to stimulate increased investment and revenues. Urban infrastructure is still insufficient, unable to keep apace the growing demand of the province. ODA-funded projects in the province have been delayed in the past resulting in inadequate achievements. Limited funds sourced from the central agencies have not been used in an effective way. In addition, while poverty incidence in the province has been declining, many households continue to be vulnerable from a lack of access to basic infrastructure services, health care, education, and livelihood, as well as income generating activities and financing.
In the coming five years, Phu Yen aims to quickly adopt the government’s national development policies in a suitable manner to suit its specific conditions. The province will mobilize and make the most use of domestic and external fund sources, especially ODA funds for the development of the agriculture, tourism, handicraft, and other

TA 4485-VIE: Central Region Small and Medium Towns Development Project FINAL REPORT Appendix 2, page 2
June 2006
industrial sectors deemed more competitive than the rest. Provision of adequate infrastructure to support economic growth will be a priority. Phu Yen targets growth in its key economic sectors, as follows: (i) from a GDP share of 30.7 percent for its industrial sector in 2005, to 43.3 percent in 2010; (ii) from a GDP share of 33.7 percent for its agriculture, fisheries, and forestry sectors in 2005, to 21.4 percent in 2010. It is estimated that the GDP share of its service and other sectors will be maintained at around 35 percent.
Given the projected rapid growth in its industry and service sectors, Phu Yen’s rate of urbanization is expected to grow at a faster rate. The urban sector of Phu Yen comprises one city (Tuy Hoa), one provincial town (Song Cau) and 7 district towns. Tuy Hoa will be promoted as a commercial, service, and international transactions center for the province. It will also be the transportation focal point for the coastal southern center and highland areas, with a seaport, railway station, international airport, trans-Vietnam road and a triangle border area. Financial, banking, stock exchange, telecommunication, education, training, and technology centers will also be established in Tuy Hoa. Song Cau will also become a key urban center with a projected total population of 15,000 to 20,000. There are plans for the town to be developed into an economic, cultural, and technical center for northern Phu Yen.
Construction and rehabilitation of infrastructure, including water supply and sanitation, to facilitate the planned economic growth and development of the province will be among the key priority investments of Phu Yen.
2. KHANH HOA PROVINCE
The GDP growth rate of Khanh Hoa has averaged at least 10 percent per annum in the last five years, exceeding the target growth rate of the province. In 2005, GDP per capita is estimated to have increased to VND 10.95 million/person or USD 730/person. Khanh Hoa’s rate of economic restructuring away from agriculture appears to be progressing faster than most of the other provinces in the Central Region. This pattern is evident from the increasing share in GDP of its industrial sector, from 35.3 percent in 2000, to an estimated 40.9 percent in 2005. Khanh Hoa’s service sector is exhibiting the same growth trend, estimated to contribute approximately 41.1 percent in 2005, up from 37.8 percent in 2000. As result of the provincial economy’s growing industrialization, Khanh Hoa’s agriculture sector has been contributing at a relatively decelerating rate to the provincial GDP, from 26.9 percent in 2000, to an estimated 18 percent in 2005.
Part of Khanh Hoa’s relatively fast economic growth in the last five years can be traced to its rapidly growing private sector. Statistics show that the non-state sector in Khanh Hoa has increased to 67 percent and that by 2005, the number of non-state enterprises operating in the province has grown to 1, 200. It is estimated that Khanh Hoa’s total revenue has increased by almost three times from its 2000 level to VND 3,300 billion or USD 220 million in 2005, accounting for 24.6 percent of the provincial GDP. As a result, Khanh Hoa has been able to finance its key development programs for its planned socio-economic development.
Calculations show that Khanh Hoa’s fund for development in the coming 5-year period will reach over VND14, 000 billion or USD 933 million. The fund had a total of VND 10,871 billion or USD 725 million during the period of 2001 to 2004, registering an annual average growth rate of 18.2 percent. However, while the provincial Investment fund has been dramatically increasing, total financing sourced from the state budget for

TA 4485-VIE: Central Region Small and Medium Towns Development Project FINAL REPORT Appendix 2, page 3
June 2006
investment in development has not been able to meet the growing demand for socio-economic development.
To address poverty, Khanh Hoa launched the “Day for Poor People” campaign to establish a fund for poor people, particularly to encourage pro-poor enterprises and institutions. As of the year 2004, the number of poor households in the province was estimated at 8,040, equivalent to 3.75 percent of the urban population. This relatively low level of poverty incidence in Khanh Hoa can partly be traced to the low rate of unemployment in the province, estimated at only 4.5 percent of the total urban population. Khanh Hoa reports that each year, a total of 22,000 to 25,000 jobs are generated in the province.
Land use and urban development planning in Khanh Hoa’s economic zones has been more efficient in the previous years. However, given its rapid rate of urbanization, new demands posing new development challenges, particularly in the design and implementation of the province’s various development projects, are being encountered.
In the coming five years, the annual average target GDP growth rate is 11.5 percent. The planned GDP per capita by 2010 ranges from VND 16.5 million/person to VND 18.0 million or USD 1,100/person to 1,200/person. Khanh Hoa is envisioning growth in its key economic sectors as follows: (i) agriculture sector’s share to GDP, 14 percent; (ii) industrial sector’s share to GDP, 44 percent; and (iii) service sector’s share to GDP, 42 percent. It is estimated that Khanh Hoa’s social fund will have to increase to 35 percent of GDP, to VND 31,000 billion or USD 2,066 million for the period 2006 to 2010 to cope with the increased demand for investment in development. Foreign investment will account for about 30 percent of this increase in the social fund.
It is projected that Khanh Hoa’s rate of urbanization will increase to 60 to 70 percent by 2010. Land use planning and development of urban areas and economic zones will be carried out by the province. The formation and development of economic zones in Khanh Hoa will be a priority to promote the industrialization and modernization process of the central region and of the whole country. Economic zones are areas where new institutions and policies will be applied, creating a favorable investment environment consistent with international rules and standards. With its proposed economic zones, Khanh Hoa aims to encourage both domestic and foreign businesses to operate in the province, in the process speeding up Vietnam’s economic integration into the Asia region and the rest of the world.
In 2010, the city of Nha Trang will be developed further to the west and expanded to Dien Khanh which will become a coastal city and one of the centers in the central region with a population of about 600,000. The Nha Trang-Dien Khanh economic zone will be the tourism and commercial center of the central region, an important transportation focal point, a financial, banking, stock and telecommunication center; one of the centers of culture, education and training, science and technology; and one of most important areas of national security and defense in the central region and nationwide.
The Van Phong economic zone will also be developed. Van Phong as an economic zone will stimulate trade through its planned port and production facilities. Apart from the two economic zones, other urban centers such as Cam Ranh, Ninh Hoa and Van Ninh will also be developed.
3. BINH THUAN PROVINCE

TA 4485-VIE: Central Region Small and Medium Towns Development Project FINAL REPORT Appendix 2, page 4
June 2006
Binh Thuan’s GDP increased by 10.4 percent in 2001, 11 percent in 2002, 12.2 percent in 2003, and 13.1 percent in 2004. In 2005, its GDP expected to grow at a rate ranging from 13.7 percent to 13.9 percent. Given these growth rates, Binh Thuan’s GDP has been growing at an average rate of 12.05 percent in the last 5-year period.
Despite the relatively good economic performance of Binh Thuan, its economy remains highly dependent on agriculture. In 2000, the agriculture sector’s share of GDP was 41.9 percent. While this share is projected to decline to 37.6 percent by 2005, agriculture continues to be the largest sector of the province’s economy. The industrial sector contributed 22.6 percent in 2000 and its share of GDP is expected to increase to 28.6 percent in 2005, surpassing the target of 26 percent.
An average of 30 percent of the provincial budget was spent on investments in development. Binh Thuan’s implementation of its poverty reduction and hunger elimination program has been fairly good. In the period 2003 to 2004, the investment fund for these activities amounted to VND 210 billion or USD 14 million. The number of poor households in the province has decreased to 9,377. This is shown by the lower poverty incidence reported for the province, down from 11.96 percent in 2000 to 4.4 percent in 2005. Infrastructure in poor and very poor communes is being improved, creating more opportunities for poor people and households to access, and benefit from, social services.
There has been an improvement in Binh Thuan’s employment generation. Every year, about 19,000 jobs are generated reducing the number of households unemployed. This is mainly due to the effectiveness of the province’s credit provision programs which have helped to ensure that job creation in Binh Thuan is integrated into its socio-economic development programs.
In the coming five years, the target GDP growth rate of the province is 13 percent to 13.5 percent. Its target annual growth rates for its key economic sectors are as follows: (i) agriculture, forestry, and aquaculture, 3.5 percent to 4 percent; (ii) industry and construction, 18.5 percent to 19 percent; and (iii) service sector, 17 percent to 17.5 percent. During the period 2006 to 2010, Binh Thuan envisions a faster shift in its economic structure away from agriculture. By 2010, the planned share of the industrial sector to the provincial GDP is 35 percent; the services sector, 45 percent, and the agricultural sector, 20 percent. The target GDP per capita in 2010 is VND 12.8 million/person to 15.0 million/person or USD 850/person to USD 1000/person.
External economic activities will be strengthened and enhanced. Favorable conditions will be created for foreign enterprises to invest in the province. Both ODA and NGO funds will be encouraged to support the socio-economic development programs of the province. Internal and external resources for financing, technology, and management will be mobilized and used more effectively to support the growing production activities and infrastructure requirements of the province stemming from its increasing level of urbanization.

TA 4485-VIE: Central Region Small and Medium Towns Development Project FINAL REPORT Appendix 2, page 5
June 2006
4. DAK NONG PROVINCE
The province of Dak Nong has grown at an average annual rate of 9.2 percent in the last five years. The industry and construction sector accounts for the highest growth in the province, increasing by 32.3 percent per annum, surpassing the target growth rate of 20 percent. The service sector has also been growing fast at 24.6 per annum, well above the target of 12 percent. The agriculture sector, indicative of the rising level of industrialization and urbanization of the province is slowing down, growing at a decelerating rate at 5.2 percent which is markedly below the target of 8 percent. A more careful examination of the economic growth trends of Dak Nong indicates, however, that while its industrial sector has grown at a faster rate in the last five years, it continues to be the smallest segment of the provincial economy with a share of just over 10 percent in Dak Nong’s GDP. The sector is characterized by small scale production, poor materials facilities, and outdated technology. The service sector’s share in the provincial GDP is relatively higher at 17 percent. The agriculture sector dominates the provincial economy, contributing about 72.6 percent to GDP in 2005 from a high of 86.6 percent in 2000. More recently, foreign investors have launched survey missions in Dak Nong to explore opportunities for investment in bauxite exploitation, aluminum production, and hydroelectricity development. It is hoped that these industries will play a vital role in accelerating Dak Nong’s industrialization and urbanization.
Estimates suggest that the provincial budget revenue of Dak Nong in 2005 will be approximately VND 145 billion, or about US 10 million, representing an increase of 11 percent from its 2004 budget level. Despite this increase, Dak Nong’s provincial revenue can only finance 17 percent of its projected spending, putting pressure on the central government to provide funding support for as much as 83 percent of its budgetary requirements. Dak Nong’s limited ability to mobilize revenues arises mainly from the fact that SOEs in the area are mostly state-owned forestry enterprises and that there are only small-scale private sector enterprises in the province.
Analysis shows that investment in development in Dak Nong has increased sharply, especially during the period 2004 to 2005. The value of its development fund during the period 2000 to 2005 climbed to VND 3,235 billion (or USD 216 million). The fund is sourced from the private sector, with a contribution of as much as 51.5 percent; the state budget, accounting for 22 percent. 4 percent of the total investment is from ministries and other sectors 10.4 percent; the SOEs contribute 5.7 percent; and the ODA sector contributes about 6.1 percent.
In 2004, the total population of Dak Nong was estimated at 400,000 with a 14 percent level of urbanization. The province has a diversified structure of ethnic minorities, including 31 ethnic groups. The majority of ethnic minorities belong to the Kinh, M’nong, E De, Nung, Tay and Thai groups. The Kinhs account for more than half, comprising 65.5 percent of the ethnic minorities in the province. Thus, an important development challenge in the province of Dak Nong is how to integrate the various ethnic groups in its population into the mainstream of the planned socio-economic development for the province.
The province has made significant strides in its efforts to reduce poverty and increase employment. As of 2004, the number of households considered poor has dropped to 9.95 percent of the total population. However, the rate of poor households among the ethnic groups is high, accounting for 40 percent of the total number of poor households in Dak Nong.

TA 4485-VIE: Central Region Small and Medium Towns Development Project FINAL REPORT Appendix 2, page 6
June 2006
For the period 2006 to 2010, Dak Nong aims to achieve a GDP growth rate of about 10 percent to 10.5 percent. The pattern of this growth will be dictated by the industrial sector, targeted to grow at an annual rate by 25 percent to 25.5 percent; followed by the service sector, by 18 percent to 18.3 percent. Given this trend, the projected annual growth rate for the agriculture, aquaculture and forestry sector will grow at a much slower rate, estimated to range from 4.5 to 5 percent. At these growth rates, Dak Nong’s growth estimates for each key economic sector for the period 2006 to 2010 are as follows: (i) a GDP share of 55.6 percent for the agriculture, aquaculture and forestry sector; (ii) a GDP share of 22 percent for the industrial sector; and (iii) a GDP share of 22.4 percent for the service sector.
Dak Nong’s transition to a more industrialized and urbanized province indicates that it will have to cope with the emerging need for a comprehensive development of infrastructure. It will be necessary to enlarge and upgrade the transportation system, electricity network, irrigation, and water supply systems in the province. Planning for urban development will need to be undertaken for the proposed economic nuclei of the province, particularly the town of Gia Nghia and the district towns. Gia Nghia is planned for development as the provincial urban center.
5. NINH THUAN PROVINCE
The province of Ninh Thuan is located in the driest area of Vietnam where drought and flood occur regularly. The province is far from the big economic centers and has a small scale economy, poor socio-economic infrastructure, and limited human resource.
During the period 2001 to 2005, Ninh Thuan’s GDP grew at an annual average rate of 9.5 percent. Its key economic sectors contributed the following to the provincial GDP: (i) agriculture and forestry, 26 percent; (ii) aquaculture, 16 percent; (iii) industry and construction, 21 percent; and ((iv) service sector, 37 percent. Following a trend similar to that of the other provinces in the Central Region, Ninh Thuan’s industry and construction sector is growing at the fastest rate, at 21 percent per annum. The aquaculture sector’s annual growth rate is 14. 6 percent; the service sectors, 10.1 percent; and agriculture and forestry, 4 percent.
The total budget revenue of the province in the last five years and in 2005 are VND 897 billion or USD 59.8 million, and VND 252 billion or USD 16.8 million, respectively. The average increase of the provincial budget revenue is 20.3 percent per annum. During the period 2000 to 2005, Ninh Thuan’s total investment in development programs amounted to VND 5,015 billion or USD 334 million, exceeding the amount recorded for the period 1996 to 2000 by more than 350 percent.
The rate of economic growth of Ninh Thuan is relatively high but not sufficiently broad-based to make it sustainable. Agriculture and aquaculture production is heavily dependent on the weather. The estimated average income per capita of the province in 2005 is VND 4.35 million/person or USD 290/person, which is equivalent to 52 percent of the average income per capita of the whole country.
The target GDP growth rate for the period 2006 to 2010 is 11 percent to 12 percent, enabling the GDP per capita to reach VND 8.25million/person to 9 million/person or USD 550/person to 600/person. The projected structure of the provincial economy by 2010 can be summarized, as follows: (i) the GDP share of the agriculture, forestry and aquaculture sector will be 30 percent; (ii) industry and construction sector, 35 percent; and (iii) service sector, 35 percent.

TA 4485-VIE: Central Region Small and Medium Towns Development Project FINAL REPORT Appendix 2, page 7
June 2006
The growing industrialization and increasing urbanization Ninh Thuan suggest an emerging demand for improved urban infrastructure, including water supply and drainage. This is particularly true for the Phan Rang-Thap Cham town, which is envisioned to become a city before 2010.

TA 4485-VIE: Central Region Small and Medium Towns Development Project FINAL REPORT Appendix 1, page 1
June 2006
EXTERNAL ASSISTANCE TO THE URBAN SECTOR (1993-2003)

TA 4485-VIE: Central Region Small and Medium Towns Development Project FINAL REPORT Appendix 1, page 2
June 2006

TA 4485-VIE: Central Region Small and Medium Towns Development Project FINAL REPORT Appendix 1, page 3
June 2006
Project Year Amount ($ million)
E ODA-funded WSS projects in the Central Region 1 Investment for Water Supply in Nam Phuoc Town Japan 2004 0.94 2 Duc Pho Water Supply Japan 2003 0.46 3 Quang Ngai Town Water Supply Italy 2002 2.27 4 Quy Nhon Water Supply and Sanitation ADB 1998 12.87 5 Provincial Towns Water Supply and Sanitation (Tuy Hoa, La
Hai, Chi Thanh – Co-financed by ADB and NORAD) ADB 2002 17.2
6 Rural Water Supply UNICEF 2001 0.13 7 Phu Hoa Water Station Japan 2003 0.60 8 Phan Rang Water Supply and Sanitation (Co-financed by ADB
and NORAD) ADB 2002 17.39
9 Rural Clean Water Program UNICEF 1993 1.60 10 Clean Water to 5 Towns, Villages Japan 2003 0.50 11 Nghe An Town Water Supply ADB 1998 16.01 12 Improvement of Drainage and Sanitation in Vinh City Germany 1997 7.14 13 Drainage and Waste Treatment in Vinh City Germany 2003 14.28 14 Rural Water Supply and Sanitation in Nghe An Denmark 2000 6.71 15 Waste Water Drainage in Cua Lo Town Belgium 2002 2.90 16 Rural Water Supply and Sanitation in Ha Tinh Denmark 2004 0.73 17 Ca River Water Management Denmark 2004 0.73 18 Dong Hoi District Water Supply – Drainage and Sanitation ADB 1998 9.26 19 Rural Clean Water and Environment UNICEF 2001 1.80 20 Quy Dat Town Water Supply Japan 2001 0.65 21 Quang Tri Town Water Supply ADB 1998 9.47 22 Phu Bai Water Supply Japan 2003 1.10 23 Da Nang City Water Supply - Phase II France 1998 4.14
Subtotal 128.88

TA 4485- VIE: Central Region Small and Medium Towns Development FINAL REPORT Appendix 20, page 1
June 2006
FINANCIAL ANALYSIS OF POTENTIAL PROJECT OPERATING ENTITIES 1. OVERVIEW OF PROJECT TOWNS AND POTENTIAL PROJECT OPERATING
ENTITIES
1.1 Overview of User Charging in Project Towns
As user charging for public utility services in Project towns is in its infancy, substantial subsidies are observed, though tariffs have been applied for some services such as water supply and solid waste. For drainage/wastewater and solid waste services, the Government has been providing a significant amount of subsidy. Cost recovery for these services has been extremely difficult due to reasons that rest with both sides - the users and the service providers.
On the user side, there have been long periods in which utility services were either priced at low tariffs or given for free. Users, therefore, have a perception that such services as drainage/wastewater and solid waste must be fully financed by the Government and hence willingness to pay has been low in spite of sound ability to pay according to income figures. Even now that the demand for service quality is higher, the willingness to pay is still at a minimum due to the poor performance of and low quality services delivered by service providers, in this case, urban public works companies (UPWCs) or urban environmental companies (URENCOs). This implies that the users wish to receive quality services before being willing to pay.
On the service provider side, the legal authority to charge users for services is not clearly defined as these are operating mainly as budget spending units under the local government (provincial people’s committees/town peoples’ committees) rather than autonomous business units/enterprises. This simply implies that they provide services based on the budget allocated. The current financing mechanism de-incentivizes the service providers to conduct community consultation, service costing, and pricing for sustainable operation, and hence, to improve service delivery accordingly. As the urban public works companies (UWPCs) are not independent in operation and management, they are not able to adopt appropriate pricing strategies, retain tariff revenue collected, apply an effective and efficient collection system, improve/monitor the organizational performance, and train skilled staff. Similar analysis can be applied to water supply and drainage companies (WSDC), except that cost recovery from user payments is better. Besides, it is observed that most UPWCs management do not have the desire to transform themselves into independent enterprises due to the fact that they have been very much used to the former central planning practices, in which all details are designed by the central or provincial government. More importantly, another factor that slows down the transformation is the local government's fear of losing control over UPWCs in spite of the central government effort in reducing the budget burden.
It is also observed that in a number of Project towns, private sector companies have been contracted to collect and dispose solid waste (e.g. in Phan Rang of Ninh Thuan, and Gia Nghia of Dak Nong). These companies sign contracts with TPCs based on per tonne cost estimated at the beginning of each year. Tariff collection is done by wards and relevant agents to replenish the town budget. This, in a way, reflects a good practice of private sector participation. However, separation of service delivery and tariff collection is not a sustainable solution, because this

TA 4485- VIE: Central Region Small and Medium Towns Development FINAL REPORT Appendix 20, page 2
June 2006
practice will de-incentivize the service provider from improving their services in the long run.
The above analyses indicate that there is no serious appreciation of need for user payments on either side. It is certain that the adoption of best practices will take time and effort and require an efficient transformation process. Annex 1 outlines a summary of user charging best practices for reference in reorganizing the utility sector in Project towns.
1.2 Project Towns and Proposed Investment Items
Based on the expressions of interest submitted by the Project provinces (Ninh Thuan, Binh Thuan, Phu Yen, Khanh Hoa, and Dak Nong), the proposed Project investment falls into three categories: (i) water supply development (12 towns); (ii) drainage/waste water (14 towns); and (iii) solid waste (9 towns). Table A20-1, presents a summary of the investments originally proposed by the 18 candidate towns.
Table A20-1. Candidate Project Towns and Proposed Bank Investment
Proposed Bank Investment No. Province/Town
Water Supply Drainage/ Wastewater Solid Waste
I Phu Yen Province 1 Tuy Hoa City No Yes No 2 Song Cau No Yes Yes II Khanh Hoa Province 3 Cam Ranh Yes Yes Yes 4 Ninh Hoa Yes Yes Yes 5 Van Gia Yes Yes Yes 6 Tu Bong Yes Yes Yes III Ninh Thuan Province 7 Thap Cham No Yes No 8 Khanh Hai No Yes No 9 Tan Son Yes No No 10 Phuoc Dan No Yes No 11 Ca Na Yes No No IV Binh Thuan Province 12 Phan Thiet City No Yes No 13 Cho Lau Yes No No 14 La Gi Yes No No V Dak Nong Province 15 Gia Nghia Yes Yes Yes 16 Ea Tling Yes Yes Yes 17 Dak Mam Yes Yes Yes 18 Quang Khe Yes Yes Yes
Note: Yes means investment item proposed by Project provinces and No means otherwise.
Table A20-2 outlines a matrix of entities responsible for managing, operating & maintaining urban utility services in the proposed service areas. Some of them are identified as potential project operating entities. It was observed that there is a mix of institutional models in these Project towns. Though varied between towns and provinces, the following generalizations can be made as far as urban utility services are concerned:

TA 4485- VIE: Central Region Small and Medium Towns Development FINAL REPORT Appendix 20, page 3
June 2006
• Water supply and drainage companies (usually provincial level organization) are in charge of water supply services and in some cases drainage/wastewater. Drainage and wastewater services are observed to receive the least attention in the Project towns. These companies are independent entities, but being fairly dependent on the PPCs in terms of tariff setting;
• Urban public works companies are responsible for solid waste collection and disposals, greening of parks, street lighting, funeral services, septic tank desludging and in some cases, cleaning up drains. A major part of their services is operated on TPC/DPC budget subsidies;
• In smaller towns, units under TPCs/DPCs take charge of water supply services, drain cleanup, solid waste and relevant public works. These units are dependent Budget spending units under TPCs/DPCs, operating based on annual budget allocations from TPCs/DPCs rather than independent companies. These units cannot be considered sustainable entities;
• Private sector participation is observed to be present in some Project towns. However, it is insignificant and is more on contractual basis with TPCs/DPCs than private sector companies being pure service providers; and
• In a large number of Project towns, no entity is observed to be providing services proposed for Bank investment. Therefore, there are critical concerns about the sustainability of the proposed Bank investment if institutional arrangements are not available and/or inappropriate.
Table A20-2. Entities Responsible for Managing, Operating & Maintaining Urban
Utility Services in Service Areas Entity Responsible for Managing, Operating Urban Services in the
Service Area Province No. Town Class District Name
Water Supply Drainage/ Wastewater Solid Waste
Phu Yen Province
1 2
Tuy Hoa City Song Cau
III V
- Song Cau
PWSC PWSC
PWSC PWSC (but no drainage system)
URENCO under CPC Solid waste unit under TPC
Khan Hoa Province
3 4 5 6
Cam Ranh Ninh Hoa Van Gia Tu Bong
IV V
V
- Ninh Hoa Van Ninh Van Ninh
URENCO under TPC UPWC under DPC UPWC under DPC
None
URENCO under TPC None None None
URENCO under TPC UPWC under DPC UPWC under DPC
None
Ninh Thuan Province
7 8 9
10 11
Thap Cham Khanh Hao Tan Son Phuoc Dan Ca Na
IV VV V V na
- Ninh Hai Ninh Son
Ninh Phuoc Ninh Phuoc
PWSC PWSC
PWSC & commune (2 systems)PWSC PWSC
UPWC under TPC None None
Drainage unit under TPC(PMU) None
Wards and private company. Solid waste unit under TPC
None Solid waste unit under TPC
None
Binh Thuan Province
12 13 14
Phan Thiet City Cho Lau La Gi
III V V
- Bac Binnh Ham Tan
PWSC PWSC PWSC
UPWC under CPC (future:PWSC) PWMU PWMU
UPWC under CPC PWMU PWMU
Dak Nong Province
15
16 17 18
Gia Nhia Ea Tling Dak Mam Quang Khe
IV
V V V
-
Cu Jut Krong No Dak Glong
PWSC
PWSC PWSC PWSC
None-PWSC in future
None-PWSC in future None-PWSC in future None-PWSC in future
Private company collects and transports to dumpsite.
Cooperative Cooperative
None TOTALS
Note: 1. (P) = provincial capital; (D) district capital. 2. CPCC – City People’s Committee; DPC = District People’s Committee; PWSC = Provincial Water Supply company; TPC =
Town People’s Committee; UPWC = Urban Public Works Company; URENCO = Urban Environmental Company; PMU = Project Management Unit; PWMU = Public Works Management Unit.
3. Thap Cham comprises 3 wards of Phan Rang-Tap Cham town.
A practical observation from a financial perspective is that if Project towns are to develop the urban utility sector, it is important that there should be (i) sustainable

TA 4485- VIE: Central Region Small and Medium Towns Development FINAL REPORT Appendix 20, page 4
June 2006
entities in charge of managing, operating & maintaining (O&M) urban services in service areas, and "sustainable" should be understood as being both institutionally and financially sustainable; (ii) promotions for a high willingness to pay for services to ensure that revenues from user payments are at least sufficient to cover the O&M costs and the depreciation of capital investment; and (iii) surpluses to cover replacement costs of capital investment in the medium and long term.
This Report looked at selected potential project operating entities from the financial angle. All these entities are water supply companies. The objective was to (i) assess the financial capacity of these entities as recipients of the proposed ADB loan proceeds; and (ii) ensure financial sustainability if they are appointed as project entities in the context of the ADB funded Central Region Small and Medium Town Development Project (CRSMTDP). As far as the proposed investment in solid waste system, the analysis of project operating entities was included in the overall Project analysis.
The Report is structured as follows: Section 2 analyzes the financial positions of the identified entities by province; Section 3 summarizes the financial analysis and recommends financing mechanisms for the proposed Bank investment; and Section 4 provides the supporting annexes.

TA 4485- VIE: Central Region Small and Medium Towns Development FINAL REPORT Appendix 20, page 5
June 2006
2. FINANCIAL ANALYSIS OF WATER SUPPLY AND DRAINAGE COMPANIES
2.1. Ninh Thuan WSDC
Ninh Thuan WSDC was incorporated at the provincial level with a mandate to provide water supply service in major urban areas of the province. From 2001-2004, it produced a total of 5.1 billion m3 of clean water (Table A20-3). Water sales increased from 2.6 billion m3 in 2001 to 3.8 billion m3 in 2004. The non-revenue water ratio declined from 29 percent in 2001 to 26 percent in 2004, in line with prevailing MOC requirements of below 30 percent for non-revenue water. However, if the company is to increase tariff revenue, this ratio should be minimized/ controlled.
Table A20-3. Ninh Thuan WSDC - Key Performance Indicators: 2001-2004
Indicators 2001 2002 2003 2004 Operating Data Water Production (000 m3/year) 5,110 5,110 5,110 5,110 Water Sales (000 m3/year) 2,653 3,2,32 3,522 3,856 Water Sales (m3/year) 7,268 8,855 9,649 10,564 Non –Revenue Water (% leakage) 29% 29% 28% 26% Cost Recovery Water Supply Services: 6.3% 9.8% 6.3% 3.7% Operating Income/Net Operating Revenue 1.2% 1.5% 2.7% 3.9% Income Before Tax/Net Operating Revenue Consolidated: Operating Income/Net Operating Revenue 13.2% 14.0% 11.1% 7.0% Income Before Tax/Net Operating Revenue 4.5% 5.1% 4.9% 4.6% Net Income/Net Operating Revenue 3.1% 3.5% 3.3% 3.1% Water Supply Gross Revenues/Consolidated Gross Revenues 51.3% 69.8% 73.9% 79.4% Cost Efficiency & Effectiveness (VND/ m3 water sold) Operations & Maintenance 3,022 2,056 2,233 1,993 Enterprise Management 401 300 264 176 Depreciation 1,401 1,157 1,543 1,724 Total 4,832 3,512 4,041 3,894 Weighted Average Tariff Liquidity Profile Current Ratio 131% 247% 224% 425% Quick Ratio 87% 201% 177% 360%
As to cost recovery, consolidated operating income as percentage of net operating revenue was 7.0 percent in 2004, declining from 13.2 percent in 2001. On average, this ratio was 11.3 percent during the 2001-2004 period. Average income before tax and net income over net operating revenue were 4.7 percent and 3.2 percent, respectively, during this same period, all showing declining trends and suggesting that costs must be held under tighter control.
It is noted that the revenue of the company comes from different sources including water sales, equipment sales, installation and construction services, among others. Water supply services is the main business line and the share of revenue had been on the rise during the 2001-2004 period. In 2001, the share of water supply gross revenue was 51.3 percent of consolidated gross revenue while for 2004 it was 79.4 percent. This implies that the company has paid due attention to the expansion of its water supply business.

TA 4485- VIE: Central Region Small and Medium Towns Development FINAL REPORT Appendix 20, page 6
June 2006
In terms of unit cost structure, there was a tendency for the average unit cost to decline. Particularly, the 2001 unit cost was VND4,832/m3 of water sold, but this level was only VND3,894/m3 of water sold, indicating a reduction of VND939/m3 of water sold or 19 percent. This demonstrated a great effort of the company management in cost control. The composition of the cost structure also changed significantly during this period. Notably, O&M costs were reduced from 62.5 percent in 2001 to 51.2 percent in 2004, enterprise management costs declined to 4.5 percent in 2004 from 8.3 percent in 2001, while depreciation costs (cumulative) increased from 29.2 percent in 2001 to 44.3 percent in 2004. In absolute figures, 2004 unit cost showed an O&M cost of VND1,993 (51.2 percent), an enterprise management cost of VND176 (4.5 percent), and a depreciation cost of VND1,724 (44.3 percent). All together, average unit cost in 2004 was VND3,894 while the weighted average water tariff (with no drainage surcharge included) was VND3,277/m3 of water sold. This means that the company is operating the water supply services at a loss, and the company will face increased losses if new revenue sources will not be developed.
Table A20-4 summarizes financial statement indicators for the period 2001-2004. Total assets of the company at 31 December 2004 was VND44.9 billion, paid-in capital VND42.5 billion, and total owner's equity VND43 billion. All these indicators experienced slight declines during the 2001-2004 period.
Table A20-4. Ninh Thuan WSDC - Summary Financial Statements: 2001-2004
Balance Sheet Item (VNDD million) 2001 2002 2003 2004 Total Assets 46,000 45,979 46,379 44,923 Current Assets 2,447 3,914 3,756 7,109 Current Liabilities 1,864 1,583 1,674 1,671 Paid-in Capital 43,723 43,806 44,056 42,574 Total Owner’s Equity 44,136 44,396 44,700 43,247
Annual Percentage Changes 2001 2002 2003 2004 Total Assets Base 0.0% 0.9% -3.1% Current Assets Base 60.0% -4.0% 89.3% Current Liabilities Base -15.1% 5.7% -0.2% Paid-in Capital Base 0.2% 0.6% -3.4% Total Owner’s Equity Base 0.6% 0.7% -3.3% Consolidated Income Statement Items (VND million) Net Operating Revenues 13,361 11,877 14,708 15,155 Operating Expenses 11,595 10,311 13,071 14,091 Operating Income 1,766 1,666 1,637 1,064 Income Before Tax 604 605 722 701 Net Income 411 411 491 471 Annual Percentage Changes Net Operating Revenues Base -11.1% 23.8% 3.0% Operating Expenses Base -11.9% 28.0% 7.8% Operating Income Base -5.7% -1.7% -35.0% Income Before Tax Base 0.2% 19.3% -2.9% Income Base 0.0% 19.5% -4.1%
From the above analyses, the following observations could be made:
• Ninh Thuan WSDC is a going concern entity. The company has authority to charge tariff to users in service areas. However, it should be given more authority in tariff setting and pricing of its products and services. This would also

TA 4485- VIE: Central Region Small and Medium Towns Development FINAL REPORT Appendix 20, page 7
June 2006
involve the power to decide on strategic and financial planning, autonomy in decision making process.
• Current weighted average water tariff is much lower than breakeven cost level, implying a real loss profile in the water supply services. In the short term, measures to minimize O&M costs and increase efficiency in utilizing assets during their useful life cycle should be set by the company.
• In the medium and long term, increasing water tariffs should be considered as a key component in the revenue maximization strategy. This should be the prerequisite to ensure the company's ability to take on another loan from the ADB and strengthen its capacity to repay principal and accrued interest.
(Full details of the financial statements are presented in Annex 2.)
2.2. Binh Thuan WSDC
Binh Thuan WSDC was established as a provincial level company, mandated to provide water supply services in major urban areas in the province. By year end 2004, the company assets were VND164 billion, increased from VND84 billion at 31 December 2001 or an average annual growth rate of 25.9 percent during the 2001-2004 period (Table A20-5). Total owners' equity was observed to grow 9 percent per annum on average during the last four years, from VND21 billion in 2001 to VND40 billion in 2004, growing faster at the end of this period or 15.2 percent from 2003-2004. The majority of the equity balance was sourced back to paid-in capital, i.e., the capital allocated to the company by Binh Thuan PPC mainly by way of assigning physical works.
Table A20-5. Binh Thuan WSDC - Summary Financial Statements: 2001-2004
Balance Sheet Item ( VNDD million) 2001 2002 2003 2004 Total Assets 84,436 110,490 157,246 164,335 Current Assets 16,514 19,230 31,032 34,478 Current Liabilities 3,291 4,310 2,521 3,410 Paid-in Capital 28,489 29,311 30,737 35,469 Total Owner’s Equity 21,173 32,694 34,891 40,207
Annual Percentage Changes 2001 2002 2003 2004 Total Assets Base 30.9% 42.3% 4.5% Current Assets Base 16.4% 61.4% 11.1% Current Liabilities Base 31.0% -41.5% 35.2% Paid-in Capital Base 2.9% 4.9% 15.4% Total Owner’s Equity Base 4.9% 6.7% 15.2% Consolidated Income Statement Items (VND million) 2001 2002 2003 2004 Net Operating Revenues 22,651 23,016 23,918 31,711 Operating Expenses 18,267 18,133 19,344 25,774 Operating Income 4,384 4,882 4,574 5,937 Income Before Tax 2,511 2,917 2,247 1,978 Net Income 1,749 1,983 1,528 1,424
Annual Percentage Changes Net Operating Revenues Base 1.6% 3.9% 32.6% Operating Expenses Base -0.7% 6.7% 33.2% Operating Income Base 11.4% -6.3% 29.8% Income Before Tax Base 16.2% -22.9% -12.0% Income Base 13.4% -22.9% -6.8%

TA 4485- VIE: Central Region Small and Medium Towns Development FINAL REPORT Appendix 20, page 8
June 2006
Table A20-5 also indicates that by year end 2004, the company registered net operating revenues of VND31.7 billion increasing 32.6 percent compared to 2003, with net operating revenues defined as gross revenue minus deductions, returns of sold services/goods, and VAT taxes. Operating expenses grew at an annual rate of 12.9 percent from 2001-2004, while operating income increased at 11.6 percent during the same period. The consolidated net income (after tax) was VND1.4 billion at 31 December 2004, declining at an average rate of 5.3 percent per annum during the examined period, or from VND1.7 billion in 2001. Liquidity profile during this period was extremely good with liquid assets being well over the current liabilities, measured by both current ratio and quick ratios (Table A20-5). From this financial analysis with key financial indicators on the growth path, the company can be evaluated as a going concern entity and can continue to grow other things, all things being equal.
Table A20-6 outlines key performance indicators of Binh Thuan WSDC during the 2001-2004 period. Water sales increased from 4.6 million m3 per annum in 2001 to 7.7 million m3 in 2004, growing on average 18.5 percent per annum. The percentage of non-revenue water decreased marginally from 27 percent in 2001 to 26 percent in 2004. This actual ratio respects MOC requirements for non-revenue water (leakage) of below 30 percent of total water produced.
Table A20-6. Binh Thuan WSDC - Key Performance Indicators: 2001-2004
Indicators 2001 2002 2003 2004 Operating Data Water Production (000 m3/year) 6,365 7,293 8,789 10,499 Water Sales (000 m3/year) 4,639 5,366 6,465 7,727 Water Sales (m3/year) 12,709 14,702 17,711 21,170 Non –Revenue Water (% leakage) 27% 26% 26% 26% Cost Recovery Water Supply Services: Operating Income/Net Operating Revenue 26% 17.9% 22.1% 15.0% Income Before Tax/Net Operating Revenue 13.1% 5.0% 9.9% -5.1% Consolidated: Operating Income/Net Operating Revenue 19.4% 21.2% 19.1% 18.7% Income Before Tax/Net Operating Revenue 11.1% 12.7% 9.4% 6.2& Net Income/Net Operating Revenue 7.7% 8.6% 6.4% 4.5% Water Supply Gross Revenues/Consolidated Gross Revenues 56.8% 64.8% 75.6% 67.9% Cost Efficiency & Effectiveness (VND/ m3 water sold) Operations & Maintenance 3,107 2,478 2,113 2,341 Enterprise Management 261 279 272 282 Depreciation 1,108 1,067 1,033 1,133 Total 4,385 3,825 3,417 3,755 Weighted Average Tariff 3,788 Liquidity Profile Current Ratio 502% 446% 1231% 1011% Quick Ratio 431% 393% 893% 762%
As far as cost recovery is concerned, the company registered an operating income of 15 percent of net operating revenue, decreasing from 26 percent in 2001. This means that operating revenue decreased while operating costs increased at an incremental rate. On the average, the operating income/net operating revenue was 19.6 percent during the 2001-2004 period. Accordingly, it is observed that income before tax and net income as percentages of net operating revenue decreased during this period; particularly, income before tax over net operating income

TA 4485- VIE: Central Region Small and Medium Towns Development FINAL REPORT Appendix 20, page 9
June 2006
declined from 11.1 percent in 2001 to 6.2 percent in 2004, and net income over net operating income was reduced to 4.5 percent in 2004 from 7.7 percent in 2001. (Similar trends were prevailing if corresponding ratios for water supply services are taken into consideration.)
However, it is noted that the share of gross revenues from water supply services was on the rise during the period. In 2001, water supply gross revenue accounted for 57 percent of consolidated gross revenue, and this share increased to 68 percent in 2004, indicating that the company paid more attention to expand the water supply services rather than other supplementary services to increase short term revenue. It is noted for information that revenue of WSDC is composed of revenue from water tariff, revenue from installation and construction services, and revenue from equipment sales such as meters and pipes.
In terms of cost efficiency and effectiveness, total cost per m3 water sold was VND4,385 in 2001 and this unit cost figure was reduced to VND3,755 in 2004, with weighted average water tariff1 at VND3,778/m3. This suggests that the company is still marginally profitable if water supply services continue to be the sole source for the company. However, if VND100/m3 is subtracted as drainage surcharge, the pure water tariff would be VND3,678 m3 and in this case, water tariff would be VND77/m3 lower than total average unit cost. This would suggest that the company is rendering services at a loss. Table 2.4 outlines that unit costs are composed of O&M, enterprise management, and depreciation costs. In 2004, the cost structure was as follows: O&M cost 62.3 percent (VND2,341/m3), enterprise management 7.5 percent (VND282/m3), and depreciation 30.2 percent (VND1,133/m3). There is no sector benchmark to evaluate this cost structure, but for the time being it is recommended that the company minimize its O&M cost to ensure higher profit margins in the future.
In a nutshell, the analysis in this section could be summarized as follows:
• Binh Thuan WSDC is currently operating as a going concern entity, based on the initial capital assignment from the PPC and has authority to charge tariff to users in service areas. If it is to be more financially sustainable, it should be given more authority in tariff setting and pricing of its products and services. This would also involve the power to decide on strategic and financial planning, autonomy in decision making process.
• Current weighted average water tariff is marginally lower than breakeven cost level if the drainage surcharge is excluded. Although there are constraints in increasing tariffs, the short term measure for the company is to minimize O&M costs and increase efficiency in utilizing assets during their useful life cycle.
• In the medium and long term, a combination of increased water tariff and minimized O&M costs should be considered as coordinated parts of the revenue maximization strategy. This will be the prerequisite for ensuring the ability to take on the ADB loan proceeds.
(Full details of the financial statements are presented in Annex 3)
~~~~~~~~~~~~~~~~~~~~~~~~~~~~~~~~
1 Weighted average tariff is calculated using bracket tariffs for residential, institutional, industrial, and commercial user groups multiplied by % of water consumption by bracket as weights.

TA 4485- VIE: Central Region Small and Medium Towns Development FINAL REPORT Appendix 20, page 10
June 2006
2.3. Phu Yen WSDC
Phu Yen WSDC was incorporated as a provincial level company, with business function in the urban water supply service sector. By year end 2004, the company assets were VND79 billion, increased from VND55.7 billion at 31 December 2001 or an average annual growth rate of 13.3 percent during the 2001-2004 period (see Table A20-7).
Total owners' equity grew 13.7 percent per annum on average during the last four years, from VND53.8 billion in 2001 to VND77.2 billion in 2004. The equity growth rate increased faster at the end of this period, 34.4 percent from 2003 to 2004. The majority of the equity balance was sourced back to paid-in capital allocated to the company by the Phu Yen PPC.
Table A20-7. Phu Yen WSDC - Summary Financial Statements: 2001-2004
Balance Sheet Item ( VNDD million) 2001 2002 2003 2004 Total Assets 55,763 56,495 59,004 79,258 Current Assets 7,631 8,772 9,497 12,427 Current Liabilities 1,955 1,367 1,522 1,931 Paid-in Capital 52,856 54,600 56,968 76,638 Total Owner’s Equity 53,808 55,125 57,480 77,275
Annual Percentage Changes 2001 2002 2003 2004 Total Assets Base 1.3% 4.4% 3.34% Current Assets Base 15.0% 8.3% 30.9% Current Liabilities Base -30.1% 11.3% 26.9% Paid-in Capital Base 3.3% 4.3% 34.5% Total Owner’s Equity Base 2.4% 4.3% 34.4% Consolidated Income Statement Items (VND million) Net Operating Revenues 7514 8401 9685 10325 Operating Expenses 6204 7307 8138 8310 Operating Income 1310 1094 1547 2015 Income Before Tax 429 328 340 337 Net Income 292 223 231 229
Annual Percentage Changes Net Operating Revenues Base 11.8% 15.3% 6.6% Operating Expenses Base 17.8% 11.4% 2.1% Operating Income Base -16.5% 41.4% 30.3% Income Before Tax Base -23.5% 3.7% -0.9% Income Base -23.5% 3.7% -0.9%
It is also outlined in Table A20-7 that at year end 2004 the company had net operating revenues of VND10.3 billion increasing 6.6 percent compared to 2003, with net operating revenues defined as gross revenue minus deductions, returns of sold services/goods and VAT. Operating expenses grew at an annual rate of 8.8 percent for the 2001-2004 period, while operating income increased at 18.4 percent during this same period. The consolidated net income (after tax) was VND229 million at 31 December 2004, declining at an average rate of 6.9 percent per annum during the examined period or from VND292 million in 2001.
Liquidity profile during this period was extremely good with liquid assets being well over the current liabilities, measured by both current ratio and quick ratios (Table 2.6). However, too much liquidity in this case also means that company assets are not earning well.

TA 4485- VIE: Central Region Small and Medium Towns Development FINAL REPORT Appendix 20, page 11
June 2006
Table A20-8 outlines key performance indicators of Phu Yen WSDC during the 2001-2004 period. Water sales increased from 3.3 million m3 per annum in 2001 to 5.2 million m3 in 2004, growing on average 14.6 percent per annum during this period. The percentage of non-revenue was around 30 percent in 2004. This indicator respects MOC requirements for non-revenue water (leakage), but needs to be reduced further in the coming years to increase revenue from tariff collection.
Table A20-8. Phu Yen WSDC - Key Performance Indicators: 2001-2004
Indicators 2001 2002 2003 2004 Operating Data Water Production (000 m3/year) 3,337 3,875 4,562 5,243 Water Sales (000 m3/year) 2,436 2,751 3,239 3,670 Water Sales (m3/year) 6,674 7,537 8,874 10,054 Non –Revenue Water (% leakage) 27% 29% 29% 30% Cost Recovery Water Supply Services: Operating Income/Net Operating Revenue 18.3% 10.6% 11.5% 19.0% Income Before Tax/Net Operating Revenue 1.6% -2.6% -6.7% -1.8% Consolidated: Operating Income/Net Operating Revenue 17.4% 13.0% 16.0% 19.5% Income Before Tax/Net Operating Revenue 5.7% 3.9% 3.5% 3.3% Net Income/Net Operating Revenue 3.9% 2.7% 2.4% 2.2% Water Supply Gross Revenues/Consolidated Gross Revenues 54.2% 60.5% 62.8% 69.7% Cost Efficiency & Effectiveness (VND/ m3 water sold) Operations & Maintenance 1,942 1,963 1,839 1,493 Enterprise Management 370 354 420 436 Depreciation 622 710 693 825 Total 2,933 3,077 2,951 2,754 Weighted Average Tariff 2,203 Liquidity Profile Current Ratio 390% 632% 624% 644% Quick Ratio 340% 570% 577% 601%
In terms of profitability and cost recovery, the company in 2004 earned an operating income of 19.5 percent of net operating revenue, increasing from 17.4 percent in 2001. On average, the operating income/net operating revenue was 16.4 percent for the 2001-2004 period. However, it was observed that income before tax and net income as percentages of net operating revenue decreased during this period; particularly, income before tax over net operating income declined from 5.7 percent in 2001 to 3.3 percent in 2004, and net income over net operating income was reduced to 2.2 percent in 2004 from 3.9 percent in 2001. These suggest that cost items other than O&M costs (e.g. enterprise management) increased over the examined period.
It was positively noted that the share of gross revenues from water supply services rose during this same period. In 2001, water supply gross revenue accounted for 54.2 percent of consolidated gross revenue, and this share increased to 69.7 percent in 2004. This indicates that the company paid due attention to expand the water supply services, as well as other revenue sources. It is worth noting that the revenue of Phu Yen WSDC is composed of revenue from water tariff, installation and construction services, as well as revenue from equipment sales such as meters and pipes.
With regard to cost efficiency and effectiveness, total cost per m3 water sold was VND2,933 in 2001 and this unit cost figure was reduced to VND2,754 while

TA 4485- VIE: Central Region Small and Medium Towns Development FINAL REPORT Appendix 20, page 12
June 2006
weighted average water tariff1 in 2004 was VND2,203, suggesting that the company is operating at a loss before subtracting the 10 percent built-in surcharge for drainage. Table 2.6 outlines that unit costs are composed of O&M, enterprise management and depreciation costs. The 2004 cost structure included O&M cost 54.2 percent (VND1,493/m3), enterprise management 15.8 percent (VND436/m3), and depreciation 30 percent (VND825/m3). There is no sector benchmark to evaluate this cost structure, but for the time being it is recommended that the company should minimize the O&M cost to ensure the profit margin while tariff increases take time.
To summarize, the following observations were made:
• Phu Yen WSDC can be evaluated as a going concern entity. The company has an equity fund assigned by the PPC and has authority to charge tariff to users in service areas.
• If it is to be more financially sustainable, it should be given more authority in tariff setting and pricing of its products and services. This would also involve the power to decide on strategic and financial planning, autonomy in decision making process.
• Current weighted average water tariff is much lower than breakeven cost level if the drainage surcharge of 10 percent is excluded. For the time being, the measure for the company is to minimize unit cost per m3 of water sold including O&M, enterprise management and increase efficiency in utilizing assets during their useful life cycle.
• In the medium and long term, increasing water tariff is a must in the company's revenue maximization strategy. This will also help ensure that the company will be capable to receive another loan from the ADB loan proceed and ultimately be able to pay principal and accrued interest.
(Full details of the financial statements are presented in Annex 4.)
2.4. Khanh Hoa WSDC
Khanh Hoa WSDC was established as a provincial level company, mandated to provide water supply service in major urban areas of the province. In 2004, it produced a total of 21.7 billion m3 of clean water (Table A20-9) up from 14.9 billion m3 in 2001, growing at annual rate of 14.2 percent per annum during the 2001-2004 period. Water sales increased from 10.8 billion m3 in 2001 to 16.5 billion m3 in 2004. The non-revenue water ratio declined from 28 percent in 2001 to 24 percent in 2004, in line with prevailing MOC requirements for the non-revenue water ratio of below 30 percent. It is noted that this ratio in 2003 was 31 percent and a great effort had been made to reduce this to 24 percent in 2004.
~~~~~~~~~~~~~~~~~~~~~~~~~~~~~~~~ 1 Weighted average tariff is calculated using bracket tariffs for residential, institutional, industrial, and commercial user groups multiplied by % of water consumption by bracket as weights.

TA 4485- VIE: Central Region Small and Medium Towns Development FINAL REPORT Appendix 20, page 13
June 2006
Table A20-9. Khanh Hoa WSDC - Key Performance Indicators: 2001-2004
Indicators 2001 2002 2003 2004 Operating Data Water Production (000 m3/year) 14,911 14,979 20,169 21,666 Water Sales (000 m3/year) 10,783 11,703 14,032 16,523 Water Sales (m3/year) 29,953 32,508 38,978 45,897 Non –Revenue Water (% leakage) 28% 22% 31% 24% Cost Recovery Water Supply Services: Operating Income/Net Operating Revenue 28.5% 27.7% 22.3% 26.2% Income Before Tax/Net Operating Revenue 22.9% 24.5% 19.9% 22.9% Consolidated: Operating Income/Net Operating Revenue 21.3% 22.1% 19.4% 20.1% Income Before Tax/Net Operating Revenue 16.9% 20.1% 16.6% 18.6% Net Income/Net Operating Revenue 11.6% 13.8% 11.4% 13.4% Water Supply Gross Revenues/Consolidated Gross Revenues 63.4% 67.2% 66.7% 64.9% Cost Efficiency & Effectiveness (VND/ m3 water sold) Operations & Maintenance 1,620 1,604 1,656 1,722 Enterprise Management 115 71 91 90 Depreciation 485 451 591 575 Total 2,221 2,125 2,339 2,387 Weighted Average Tariff 3,483 Liquidity Profile Current Ratio 309% 184% 37% 38% Quick Ratio 235% 150% 16% 21%
In terms of cost recovery, consolidated operating income as percentage of net operating revenue indicated a rate of 20.1 percent in 2004, declining slightly from 21.3 percent in 2001. On average, this ratio was 20.8 percent during the 2001-2004 period. Average income before tax and net income over net operating revenue were 18 percent and 12.6 percent respectively during this same period, all showing increasing trends which suggest that costs had been held under tighter control during this period.
Like all WSDCs, revenue of the company comes from different sources including water sales, selling of equipment, installation and construction services. Water supply services is the main business line and the share of revenue is observed to decrease slightly during the 2001-2004 period. In 2001 the share of water supply gross revenue was 63.4 percent of consolidated gross revenue and those for 2002, 2003, and 2004 were 67.2 percent, 66.7 percent and 64.0 percent respectively.
As far as unit cost structure is concerned, there was a tendency for the average unit cost to increase. Particularly, the 2001 unit cost was VND2,221/m3 of water sold, but this level increased to VND2,387/m3 in 2004, or an increase of VND166/m3. This was not a significant increase in the cost structure and the composition of the structure did not experience significant changes during this period either. On average, O&M costs accounted for 72.8 percent, enterprise management costs 4.0 percent and depreciation costs (cumulated) 23.2 percent during the 2001-2004 period. In absolute figures, 2004 unit cost showed an O&M cost of VND1,722 (72.1 percent), an enterprise management cost of VND90 (3.8 percent), and a depreciation cost of VND575 (24.1 percent). All together, average unit cost in 2004 was VND2,387 while the weighted average water tariff (with drainage surcharge included) was VND3,483/m3 of water sold. This means that the company is operating the water supply services at a surplus.

TA 4485- VIE: Central Region Small and Medium Towns Development FINAL REPORT Appendix 20, page 14
June 2006
Table A20-10 summarizes financial statement indicators for the period 2001-2004. Total assets of the company at 31 December 2004 was VND186.9 billion, paid-in capital VND52.2 billion, and total owner's equity VND60.3 billion
Table A20-10. Khanh Hoa WSDC - Summary Financial Statements: 2001-2004
Balance Sheet Item ( VNDD million) 2001 2002 2003 2004 Total Assets 49,347 58,805 164,303 186,924 Current Assets 11,651 16,155 40,281 47,986 Current Liabilities 3,774 8,784 109,356 125,806 Paid-in Capital 40,504 42,117 47,464 522,296 Total Owner’s Equity 45,573 50,021 54,227 60,347
Annual Percentage Changes 2001 2002 2003 2004 Total Assets Base 19.2% 179.4% 13.8% Current Assets Base 38.7% 149.3% 19.1% Current Liabilities Base 132.8% 1144.9% 15.0% Paid-in Capital Base 4.0% 12.7% 10.25 Total Owner’s Equity Base 9.8% 8.4% 11.3% Consolidated Income Statement Items (VND million) 2001 2002 2003 2004 Net Operating Revenues 28558 30,735 39,065 47,470 Operating Expenses 22461 23,933 21,469 37,917 Operating Income 6097 6,802 7,596 9,553 Income Before Tax 4815 6,186 6,472 8,826 Net Income 3326 4,239 4,434 6,371
Annual Percentage Changes Net Operating Revenues Base 7.6% 27.1% 21.5% Operating Expenses Base 6.6% 31.5% 20.5% Operating Income Base 11.6% 11.7% 25.8% Income Before Tax Base 28.5% 4.6% 36.4% Income Base 27.5% 4.6% 43.7%
In a nutshell, the analysis may be summarized as follows:
• Khanh Hoa WSDC is currently operating as a going concern entity with authority to charge tariff to users in service areas. However, in terms of product/service costing and pricing, it should be given more authority. This would also involve the power to decide on strategic and financial planning, autonomy in decision making process.
• Current weighted average water tariff is significantly higher than breakeven cost level. In the short term, the company will still be profitable without increasing the tariff, but it should be noted that cost control must be carried out in line with revenue planning. Therefore, tariff setting must be flexible.
• As far as the current ADB loan is concerned, the company will be capable to take on another loan if the trend in the analyses continues.
(Full details of the financial statements are presented in Annex 5.)
2.5. Dak Nong WSD&PWC
Dak Nong WSD&PWC was established in June 2004, and officially operated in October 2004. There was no revenue from water sales in 2004.
The only earning asset at the time the Report was written was the 1500-m3 water supply system, constructed to serve the new administration of Dak Nong province

TA 4485- VIE: Central Region Small and Medium Towns Development FINAL REPORT Appendix 20, page 15
June 2006
located in Gia Nghia provincial town. The estimated revenue from this asset for the first 6 months of 2005 was VND60 million and users were mainly 50 public administration offices. It was estimated that the network coverage would be expanded to 20 more public offices and 200 households in the second half of 2005.
For the purpose of the systematic financial analyses, no detailed financial data were available at the time the Report was written due to the fact that all physical works assigned to Dak Nong WSDC&PWC have not been finalized by way of commissioning. Available data provided are presented in Appendix 6.
The following observations were made:
• Dak Nong WSD&PWC is a new company with all responsibilities in urban utility services, i,e., water supply, drainage, and solid waste. If these are to be carried out seriously, it would become a burden to the company in terms of financing sources. It would be acceptable for the company to undertake all these responsibilities. However, to ensure that financial sustainability is achieved, a separation between subsidized (or public) activities and cost recoverable activities is needed.
• There is no information how affordable the prevailing water tariffs are1, but these tariffs are observed to be as high as those in affluent provinces. Therefore, if the number of users reaches the critical mass, it would be easy for Dak Nong WSD&PWC to achieve breakeven.
• Further analyses will be made from the Project investment perspectives to calculate the average incremental financial cost as well as the financial rate of return to evaluate the cost recovery profile.
3. Draft Financing Mechanism
Based on the analyses in Section 2, potential project operating entities are operating on a safe and sound basis and can be evaluated as going concern entities. All other things being equal, these entities will be capable to act as future project operating entities.
Further to prevailing regulations, it is proposed that MOF will on lend part of the loan funds from ADB (and AFD if any) to the WSDCs (and UPWCs to be identified) through subsidiary loans in domestic currency to cover the cost of water supply development and solid waste components. Part of the loan fund will also be provided to PPCs as grants to cover the cost of other components including drainage and waste water, and PPCs will be responsible for the contribution of required counterpart funding.
The funds flow is illustrated in Figure 1.
~~~~~~~~~~~~~~~~~~~~~~~~~~~~~~~~ 1 Current water tariffs issued in Decision 471/QD-UB (4 June 2004) are as follows: residential users VND4,000.m3, institutional users VND6,000.m3, industrial users VND7,000.m3, and commercial users VND8,000.m3

TA 4485- VIE: Central Region Small and Medium Towns Development FINAL REPORT Appendix 20, page 16
June 2006
Figure 1 Loan Financing Mechanism
42
5
ADB/AFD
Government (MOF)
PPCs
WSDCs (and UPWCs) TWUs
1
3
ADB =Asian Development Bank, AFD = Agence Française de Dévéloppement, MOF = Ministry of Finance, WSDC = Water Supply and Drainage Company, UPWC = Urban Public Works Company, PPC = Provincial People’s Committee, TWU = Town Women’s Union
1. ADB/AFD Loans to Government of Viet Nam.
2. Portion of loan proceeds passed to WSDCs and UPWCs through subsidiary loans to cover the cost of water supply development and solid waste management components.
3. Portion of loan proceeds passed to PPCs to cover the cost of other components including drainage and wastewater.
4. Entire counterpart contribution provided by PPCs.
5. Portion of loan proceeds passed from PPCs to TWU to cover sanitation credit schemes.

TA 4485- VIE: Central Region Small and Medium Towns Development FINAL REPORT Appendix 20, page 17
June 2006
Annex 1 BEST PRACTICES IN USER CHARGING AND IMPLICATIONS FOR CRSMTDP
There has been an increasing tendency of financing public utility services through user charging, which has dual objectives to achieve cost recovery from users and to make public utility services more effective and efficient. User charging practices are currently very much in their infancy in Vietnam. The purpose of this section is to present eight best practices in user charging for public utility services such as water supply, drainage, wastewater and solid waste.
Best Practice 1 - Defining the Legal Authority Clearly It is important that the legal authority for an organization to charge for its services be clearly defined. This authority should be a general framework for the application of user charges and should not set the precise amount of the charges to be applied. This allows the charges to be adjusted without further legislative authorization.
Best Practice 2 - Being in Consultation with Users Consideration should be given to holding consultations with users when a charge is being introduced or significantly altered. This serves to communicate to the users the rationale for the charges and avoid misunderstandings. Furthermore, the views of the users can be useful in designing and implementing an effective and efficient charging system. It needs to be made clear to users that these consultations are a forum for discussing the best manner of implementing user charges rather than whether user charges should be implemented. The consultations should proceed rapidly with a date for their conclusion set in advance.
Questions concerning the implementation of user charging systems will most frequently be directed to front-line staff. The rationale for user charging and the operation of the system should therefore be clear to front-line staff.
Best Practice 3 - Determining Full Costs The full cost of providing each service that is subject to a charge should be determined. This costing should be carried out regardless of whether the intention is to recover fully, or only partially, the cost of providing the service. If the intention is not to fully recover costs, this information will make transparent the degree of subsidy involved in providing the service. Full costs include not only the direct costs of the service, but also costs shared with other activities (joint costs) and such non-cash costs as depreciation and cost of capital.
Determining full costs can be complex, especially when joint costs must be allocated. The effort made in costing should be commensurate with the scale of the service being charged for. In the case of small scale services, it may be appropriate to use reasonable estimates for allocating joint costs rather than elaborate cost accounting systems. This costing should be reviewed periodically to ensure its accuracy.
Best Practice 4 - Applying an Effective and Efficient Collection System An effective and efficient system for collecting user charges is critical for the credibility of any user charging regime. Responsibility for collection should rest with the organization levying the charge. However, this does not preclude an organization from contracting with a third party for collection services. In cases where payment cannot be demanded in

TA 4485- VIE: Central Region Small and Medium Towns Development FINAL REPORT Appendix 20, page 18
June 2006
advance of, or simultaneously with, the delivery of service, invoices should be sent out in a timely manner with clear deadlines for payment. Invoices should be clear and simple, providing sufficient but not over detailed information.
Efforts should be made to minimize collection costs and any inconveniences associated with the collection process. Non-payment of user charges should be followed up immediately. Appropriate enforcement mechanisms should be in place prior to the charge coming into effect. Recourse to these mechanisms needs to be clearly defined and transparent. The level of non-payment of user charges should be transparent. If a user charge is so small that it will not justify collection action, then the form of the charge should be changed.
Best Practice 5 - Improving and Monitoring Organizational Performance Charging users directly for the services they receive can be a powerful management tool for improving organizational efficiency and service quality. Leadership by top management is required to fully reap these benefits. Setting specific financial, service quality and other performance targets for organizations, in conjunction with user charging systems, is important. The performance of organizations should be monitored on a regular basis to ensure appropriate levels of efficiency and service quality. Organizations should regularly and systematically solicit the views of service users in order to better understand their service requirements.
It should be recognized that user charging may require a new set of skills for many public utility service organizations. This should also be recognized and properly planned for. This is especially relevant in the fields of human resource management and management information systems. Sufficient time and resources need to be devoted to developing and maintaining these skills.
Best Practice 6 - Retaining the Revenue Collected at Respective Organizations Consideration should be given to the respective organization retaining the proceeds of any user charges it collects. Such revenue should be classified as offsetting receipts (negative expenditures), as appropriate. This serves to reinforce the notion that users are paying a charge in return for a specific service and that responsibility for revenue management rests with the organization itself.
Consideration should also be given to adopting flexible budgetary arrangements for organizations financed by user charges, which would allow them to respond timely to increased service volume by permitting commensurate increases in expenditure and user charging receipts.
Best Practice 7 - Adopting Appropriate Pricing Strategies Wherever relevant, pricing should be based on competitive market prices. In other cases, pricing should be based on the principle of full cost recovery for each service unless there is a clear rationale for less-than-full-cost recovery. This serves to enhance an efficient allocation of resources in the economy. Simplicity in the fee structure is important. If substantially the same service is provided to a group of users, it can be appropriate to charge a uniform fee not withstanding some variability in the cost of servicing individual users. If certain services are attributable to a class of users rather than individual users, it may be appropriate to charge each user within that class a fee to recover the costs of those services. It should, however, be recognized that this may involve the loss of some of the benefits of user charging, as the link between the charge and the service provision is less direct. Consideration should be given to differentiated prices for peak and off-peak

TA 4485- VIE: Central Region Small and Medium Towns Development FINAL REPORT Appendix 20, page 19
June 2006
periods in order to spread demand for services. Similarly, consideration should be given to offering priority service for a premium price.
Introducing user charging for one service can have a significant impact on the demand for substitute services if they are not subject to a similar charge. Consideration therefore needs to be given to also charging for such substitute services.
Best Practice 8 - Recognizing Equity Issues Consideration should be given to reduced charges for users where full cost recovery would represent an excessive financial burden on individual users. This may be especially relevant to lower-income individuals, households, smaller entities, users located in remote areas, and heavy volume users of services. The criteria for applying reduced charges should be clear and explicit.
When a user charge does not represent full cost recovery, the degree of subsidy should be transparent to those providing and monitoring the service. It should be recognized that measures through the tax and benefit system may be a more efficient means of ensuring equity than reduced charges.

TA 4485- VIE: Central Region Small and Medium Towns Development FINAL REPORT Appendix 20, page 20
June 2006
Annex 2 NINH THUAN WATER SUPPLY AND DRAINAGE COMPANY - FINANCIAL DATA
Name of Province: Ninh Thuan Name of Company: Ninh Thuan Water Supply and Drainage Company
Table Annex 2.1 Balance Sheet 2001 - 2004 (VND million) 2001 2002 2003 2004 Assets
A. Current Assets 2,447 3,914 3,756 7,109 1. Cash Cash on Hand (Including Notes) 133 84 139 101 Cash in Bank 530 2,450 1,192 4,204 Cash in Transit Total cash 663 2,534 1,331 4,305
2. Accounts Receivable Accounts Receivable from Customers 870 562 1,521 1,442 Advances to Suppliers 24 7 73 10 Intercompany Receivables Investment in Equity of Subsidiaries Other Receivables From Subsidiaries Other Receivables 12 55 49 221 Provision for Bad Debt (18) (21) (2) Total Accounts Receivable 906 606 1,622 1,671
3. Inventory Goods in Transit Raw Materials 756 648 712 1,011 Tools and Supplies Work in Progress 76 86 82 77 Finished Goods Merchandise Inventory Goods on Consignment Provision for Inventory Devaluation Total Inventory 832 734 794 1,088
4. Other Current Assets Advances 46 40 3 45 Prepaid Expenses 6 Deferred Expenses Shortage of Assets Awaiting Resolution Total Other Current Assets 46 40 9 45
B. Fixed Assets & Long Term Investments 1. Fixed Assets Tangible fixed Assets: Cost 56,067 56,819 57,703 57,889 Accumulated Depreciation (12,697) (16,437) (21,875) (28,421) Net Tangible Fixed Assets 43,370 40,382 35,828 29,468 Intangible Fixed Assets: Cost Accumulated Depreciation Net Intangible Fixed Assets 0 0 0 0 Net Fixed Assets 43,370 40,382 35,828 29,468
2. Long Term Investments Long Term Securities 50 50 95 88
3. Work in Progress 133 1,633 1,700 234
4. Long Term Deposits Total Fixed Assets & Long Term Investments Total Assets 46,000 45,979 46,379 44,923

TA 4485- VIE: Central Region Small and Medium Towns Development FINAL REPORT Appendix 20, page 21
June 2006
Liabilities & Owner's Equity (Table 1 continued) 2001 2002 2003 2004 A. Liabilities 1. Current Liabilities Short Term Borrowings Current Portion of Long Term Debt Accounts Payable - Trade 311 20 9 1 Advances from Customers 353 373 113 79 Taxes and Payable to State Budget -18 33 110 355 Payable to Staff 1,169 1,141 1,418 1,191 Intercompany Payable Other Payable 49 16 24 45 Total Current Liabilities 1,864 1,583 1,674 1,671
2. Long Term Liabilities Long Term Debt Other Long Term Liabilities Total Long Term Liabilities 0 0 0 0 3. Other Liabilities Accrued Expenses Payable 5 5 Assets Surplus Awaiting Resolution Long Term Deposits Received Total Other Liabilities 5 5 Total Liabilities 1,864 1,583 1,679 1,676
B. Owner's Equity
1. Capital Sources & Funds Paid in Capital 43,723 43,806 44,056 42,574 Differences Upon Asset Revaluation Foreign Exchange Differences Business Development Funds 182 303 299 313 Reserved Funds 146 187 233 280 Undistributed Earnings Bonus & Welfare Fund 49 64 76 44 Fund for Capital Expenditures 36 36 36 36 Total Capital Sources & Funds 44,136 44,396 44,700 43,247
2. Budget Sources Management Funds of Higher Level Subsidy Funds from State Budget Prior Year Current Year Total Budget Sources 0 0 0 0
Total Owner's Equity 44,136 44,396 44,700 43,247
Total Liabilities & Equity 46,000 45,979 46,379 44,923

TA 4485- VIE: Central Region Small and Medium Towns Development FINAL REPORT Appendix 20, page 22
June 2006
Table Annex 2.2 Income Statements – Water Supply Services: 2001 – 2004 (VND million)
2001 2002 2003 2004 A. Revenues
1 Gross Revenues 6,849 8,289 10,867 12,036 2 Deductions from Revenues 3 Sold Goods to be Returned 4 Revenue Tax/VAT 5 Other deductions 6 Total Deductions (=3+4+5) - - - - 7 Net Operating Revenues (=1-6) 6,849 8,289 10,867 12,036 B. Operating Expenses 8 Labor 855 1,120 1,948 2,218 9 Raw Materials and Supplies 350 601 686 729
10 Depreciation 3,410 3,477 5,101 6,152 11 Electricity 1,429 1,601 1,700 1,809 12 Administration 35 34 30 36 13 Production Instruments 55 90 115 125 14 Frequent Repair Expenses 204 433 450 360 15 Social Insurance 41 80 93 103 16 Office Equipment 20 22 36 41 17 Taxes, Fees and Charges 9 10 11 11 18 Other Expenses 7 7 8 6 19 Total B (=sum of items 8 to18) 6,415 7,475 10,178 11,590 20 Operating Income (=7-19) 434 814 689 446 C. Enterprise Management Expenses 21 Labor 147 200 201 210 22 Depreciation 153 155 170 185 23 Social Insurance 15 20 30 38 24 Other Expenses 100 392 209 102 25 Total C (=21+22+23+24) 415 767 610 535 D. Sales Expenses 26 Sales Expenses 38 39 40 41 E. Non-Operating Revenues & Expenses 27 Interest & Other Financial Income 105 43 125 605 28 Interest & Other Financial Expenses 4 7 29 Extraordinary Income 76 291 3 30 Extraordinary Expenses 157 32 Net Balance E (=27-28+29-30) 101 119 259 601
33 Income Before Tax (=20-25-26+32) 82 127 298 471

TA 4485- VIE: Central Region Small and Medium Towns Development FINAL REPORT Appendix 20, page 23
June 2006
Table Annex 2.3 Income Statements – All Services: 2001-2004 (VND million) 2001 2002 2003 2004
A. Revenues 1 Gross Revenues 13,361 11,877 14,708 15,155 2 Deductions from Revenues 3 Sold Goods to be Returned - - - - 4 Revenue Tax/VAT - - - - 5 Other deductions - - - - 6 Total Deductions (=3+4+5) - - - - 7 Net Operating Revenues (=1-6) 13,361 11,877 14,708 15,155 B. Operating Expenses 8 Labor 2,704 2,140 ,034 3,031 9 Raw Materials and Supplies 2,701 1,845 ,975 1,888 10 Depreciation 3,578 3,567 5,205 6,405 11 Electricity 1,520 1,650 1,753 1,853 12 Administration 60 41 45 49 13 Production Instruments 258 170 203 209 14 Frequent Repair Expenses 560 590 610 402 15 Social Insurance 133 150 179 185 16 Office Equipment 50 31 40 44 17 Taxes, Fees and Charges 17 17 17 17 18 Other Expenses 14 10 10 8 19 Total B (=sum of items 8 to18) 11,595 10,211 13,071 14,091 20 Operating Income (=7-19) 1,766 1,666 1,637 1,064 C. Enterprise Management Expenses 21 Labor 400 427 450 376 22 Depreciation 162 173 231 243 23 Social Insurance 38 40 52 58 24 Other Expenses 625 501 428 246 25 Total C (=21+22+23+24) 1,225 1,141 1,161 923 D. Sales Expenses 26 Sales Expenses 38 39 40 41 E. Non-Operating Revenues & Expenses 27 Interest & Other Financial Income 105 43 133 605 28 Interest & Other Financial Expenses 4 0 0 7 29 Extraordinary Income 0 76 366 3 30 Extraordinary Expenses 0 0 213 0 32 Net Balance E (=27-28+29-30) 101 119 286 601
33 Income Before Tax (=20-25-26+32) 604 605 722 701 34 Less Profit/Income Tax 193 194 231 230 35 Net Income (=33-34) 411 411 491 471

TA 4485- VIE: Central Region Small and Medium Towns Development FINAL REPORT Appendix 20, page 24
June 2006
Table Annex 2.4 Existing Water Tariffs and Drainage Surcharge (VND/m3)
Operating Data (Water Supply Company) 2001 2002 2003 2004 Total population of the Town/City Water production capacity (000m3 per year) 5,110 5,110 5,110 5,110 Water sales (000m3 per year) 2,653 3,232 3,522 3,856 Water sales (m3 per day) 7,268 8,855 9,649 10,564 Non-revenue Water (% leakage) 29% 29% 28% 26%
Customer Group Consumption Block (m3/month)
Tariff (VND/m3)
Of which, Drainage
Surcharge (VND/m3)
Quantity (m3) Sold (2004
figure)/1
#households/ premises
by customer group
1. Residential 1 m3 - 16 m3 2,500 0 2,304,964 19,530 17 m3 -25 m3 3,000 0 305,130 1,558 26 m3 - 35 m3 4,000 0 133,641 786 >35 m3 5,000 0 96,987 675 2. Institutional 4,000 0 558,960 435 3. Industrial 5,200 0 320,869 92 4. Commercial 7,600 0 136,320 114 Average Tariff (2004) 3,277 3,856,871

TA 4485- VIE: Central Region Small and Medium Towns Development FINAL REPORT Appendix 20, page 25
June 2006
Annex 3 BINH THUAN WATER SUPPLY AND DRAINAGE COMPANY – FINANCIAL DATA
Name of Province: Binh Thuan Name of Company: Binh Thuan Water Supply and Drainage Company
Table Annex 3.1 Balance Sheets 2001-2004 (VND million) 2001 2002 2003 2004 Assets
A. Current Assets 16,514.1 19,230.0 31,032.2 34,477.7 1. Cash Cash on Hand (Including Notes) 1.9 4.6 12.8 2.0 Cash in Bank 11,275.3 13,810.2 19,493.4 22,910.9 Cash in Transit Total cash 11,277.2 13,814.7 19,506.2 22,912.9
2. Accounts Receivable Accounts Receivable from Customers 279.4 727.0 592.4 2,368.3 Advances to Suppliers 2,423.5 2,248.6 2,308.3 526.0 Intercompany Receivables 56.0 56.0 56.0 56.0 Investment in Equity of Subsidiaries 0.0 0.0 0.0 0.0 Other Receivable From Subsidiaries 56.0 56.0 56.0 56.0 Other Receivables 46.9 43.4 47.0 62.4 Provision for Bad Debt -17.7 Total Accounts Receivable 2,805.7 3,075.0 3,003.7 2,995.0
3. Inventory Goods in Transit Raw Materials 2,062.2 2,220.8 8,493.6 8,218.3 Tools and Supplies 25.0 13.1 18.3 10.0 Work in Progress 241.4 42.9 0.0 284.4 Finished Goods Merchandise Inventory Goods on Consignment Provision for Inventory Devaluation Total Inventory 2,328.6 2,276.8 8,511.9 8,512.7
4. Other Current Assets Advances 9.6 18.9 6.3 26.3 Prepaid Expenses 89.2 44.6 Deferred Expenses Shortage of Assets Awaiting Resolution 3.9 0.0 4.1 30.8 Total Other Current Assets 102.6 63.5 10.4 57.1
B. Fixed Assets & Long Term Investments 1. Fixed Assets Tangible fixed Assets: Cost 92,944.5 116,317.1 157,584.0 169,651.0 Accumulated Depreciation -25,397.4 -25,289.2 -31,831.8 -40,433.1 Net Tangible Fixed Assets 67,547.0 91,028.0 125,752.3 129,217.9 Intangible Fixed Assets: Cost 37.8 133.9 132.9 116.1 Accumulated Depreciation -14.2 -24.8 -40.1 -37.8 Net Intangible Fixed Assets 23.6 109.2 92.8 78.3 Net Fixed Assets 67,570.7 91,137.1 125,845.1 129,296.2
2. Long Term Investments Long Term Securities 100.0 100.0 200.0 135.0
3. Work in Progress 251.7 23.2 169.2 426.2
4. Long Term Deposits Total Fixed Assets & Long Term Investments 67,922.3 91,260.3 126,214.3 129,857.5
Total Assets 84,436.4 110,490.3 157,246.5 164,335.2

TA 4485- VIE: Central Region Small and Medium Towns Development FINAL REPORT Appendix 20, page 26
June 2006
Liabilities & Owner's Equity (Table 1 continued) 2001 2002 2003 2004 A. Liabilities 1. Current Liabilities Short Term Borrowings Current Portion of Long Term Debt Accounts Payable - Trade 407.8 238.7 1,018.4 1,157.9 Advances from Customers 1,006.5 1,063.7 62.0 14.8 Taxes and Payable to State Budget 479.3 542.4 97.7 199.7 Payable to Staff 665.6 776.1 894.0 1,274.4 Intercompany Payable Other Payable 731.7 1,689.3 449.2 762.7 Total Current Liabilities 3,290.9 4,310.2 2,521.2 3,409.5
2. Long Term Liabilities Long Term Debt 49,737.2 73,256.7 119,258.5 118,515.8 Other Long Term Liabilities 214.8 214.8 214.8 214.8 Total Long Term Liabilities 49,952.0 73,471.5 119,473.2 118,730.6
3. Other Liabilities Accrued Expenses Payable 331.3 1,928.2 Assets Surplus Awaiting Resolution 8.8 0.0 12.0 42.9 Long Term Deposits Received 12.3 14.3 17.9 17.3 Total Other Liabilities 21.0 14.3 361.3 1,988.5 Total Liabilities 53,263.9 77,795.9 122,355.7 124,128.5
B. Owner's Equity
1. Capital Sources & Funds Paid in Capital 28,489.4 29,310.6 30,737.5 35,468.6 Differences Upon Asset Revaluation Foreign Exchange Differences 181.6 280.8 Business Development Funds 2,196.5 2,357.4 3,021.5 3,555.0 Reserved Funds 420.4 618.7 771.6 913.9 Undistributed Earnings Bonus & Welfare Fund -143.1 99.2 332.4 250.1 Fund for Capital Expenditures 19.1 19.1 19.1 19.1 Total Capital Sources & Funds 31,163.8 32,685.7 34,882.0 40,206.7
2. Budget Sources Management Funds of Higher Level Subsidy Funds from State Budget Prior Year 8.7 8.7 8.7 Current Year Total Budget Sources 8.7 8.7 8.7
Total Owner's Equity 31,172.5 32,694.4 34,890.8 40,206.7
Total Liabilities & Equity 84,436.4 110,490.3 157,246.5 164,335.2

TA 4485- VIE: Central Region Small and Medium Towns Development FINAL REPORT Appendix 20, page 27
June 2006
Table Annex 3.1 Income Statements – Water Supply Services: 2001 – 2004 (VND million)
2001 2002 2003 2004 A. Revenues
1 Gross Revenues 12,857.4 14,916.0 18,091.9 21,541.1 2 Deductions from Revenues 3 Sold Goods to be Returned 4 Revenue Tax/VAT 5 Other deductions 6 Total Deductions (=3+4+5) 7 Net Operating Revenues (=1-6) 12,857.4 14,916.0 18,091.9 21,541.1 B. Operating Expenses 8 Labor 1,541.8 1,615.6 2,318.5 2,796.2 9 Raw Materials and Supplies 1,624.4 3,133.7 2,742.0 3,859.3 10 Depreciation 3,854.7 4,833.9 5,685.4 7,687.4 11 Electricity 1,519.1 1,772.5 2,135.7 2,407.1 12 Administration 56.0 52.0 84.0 105.0 13 Production Instruments 74.0 100.0 104.0 128.0 14 Frequent Repair Expenses 302.8 173.0 115.8 246.4 15 Social Insurance 152.9 149.7 237.6 257.3 16 Office Equipment 54.0 100.0 154.0 168.0 17 Taxes, Fees and Charges 18 Other Expenses 331.2 320.7 519.9 652.1 19 Total B (=sum of items 8 to18) 9,510.9 12,251.1 14,096.9 18,306.8 20 Operating Income (=7-19) 3,346.5 2,665.0 3,995.0 3,234.3 C. Enterprise Management Expenses 21 Labor 477.2 523.4 652.4 877.3 22 Depreciation 866.0 714.8 794.5 854.4 23 Social Insurance 46.6 42.5 77.1 67.2 24 Other Expenses 269.8 631.9 674.8 796.2 25 Total C (=21+22+23+24) 1,659.7 1,912.6 2,198.8 2,595.0 D. Sales Expenses 26 Sales Expenses E. Non-Operating Revenues & Expenses 27 Interest & Other Financial Income 28 Interest & Other Financial Expenses 1,739.2 29 Extraordinary Income 30 Extraordinary Expenses 31 Net Balance E (=27-28+29-30) 0.0 0.0 0.0 -1,739.2
32 Income Before Tax (=20-25-26+31) 1,686.8 752.4 1,796.2 -1,099.9

TA 4485- VIE: Central Region Small and Medium Towns Development FINAL REPORT Appendix 20, page 28
June 2006
Table Annex 3.2 Income Statements – All Services: 2001-2004 (VND million) 2001 2002 2003 2004
A. Revenues 1 Gross Revenues 22,651.4 23,015.7 23,918.0 31,711.1 2 Deductions from Revenues 3 Sold Goods to be Returned 4 Revenue Tax/VAT 5 Other deductions 6 Total Deductions (=3+4+5) 7 Net Operating Revenues (=1-6) 22,651.4 23,015.7 23,918.0 31,711.1 B. Operating Expenses 8 Labor 3,218.8 3,128.6 3,725.9 4,810.1 9 Raw Materials and Supplies 7,906.8 6,839.3 6,082.3 8,688.3 10 Depreciation 3,854.7 4,833.9 5,685.4 7,687.4 11 Electricity 1,519.1 1,772.5 2,135.7 2,407.1 12 Administration 13 Production Instruments 742.1 721.0 435.5 468.6 14 Frequent Repair Expenses 15 Social Insurance 185.6 178.6 176.5 297.5 16 Office Equipment 17 Taxes, Fees and Charges 18 Other Expenses 840.1 659.4 1,102.6 1,414.9 19 Total B (=sum of items 8 to18) 18,267.2 18,133.4 19,343.9 25,773.9 20 Operating Income (=7-19) 4,384.2 4,882.3 4,574.1 5,937.1 C. Enterprise Management Expenses 21 Labor 477.2 654.2 815.6 1,096.6 22 Depreciation 866.0 893.4 993.1 1,068.0 23 Social Insurance 46.6 53.2 77.1 83.9 24 Other Expenses 684.7 789.8 862.8 995.2 25 Total C (=21+22+23+24) 2,074.6 2,390.7 2,748.6 3,243.7 D. Sales Expenses 26 Sales Expenses E. Non-Operating Revenues & Expenses 27 Interest & Other Financial Income 212.5 386.4 418.8 558.9 28 Interest & Other Financial Expenses 1,739.2 29 Extraordinary Income 3.2 163.5 8.9 467.4 30 Extraordinary Expenses 14.6 124.7 5.8 3.0 31 Net Balance E (=27-28+29-30) 201.0 425.2 421.9 -715.9
32 Income Before Tax (=20-25-26+31) 2,510.6 2,916.8 2,247.4 1,977.5 33 Less Profit/Income Tax 762.0 933.4 719.2 553.7 34 Net Income (=32-33) 1,748.6 1,983.4 1,528.2 1,423.8

TA 4485- VIE: Central Region Small and Medium Towns Development FINAL REPORT Appendix 20, page 29
June 2006
Table Annex 3.3 – Existing Water Tariffs and Drainage Surcharge (VND/m3) – Whole Province
Operating Data (Water Supply Company) 2001 2002 2003 2004 Total population of the Town/City 301,530 303,634 310,554 314,279 Water production capacity (000m3 per year) 6,365 7,293 8,789 10,499 Water sales (000m3 per year) 4,639 5,366 6,465 7,727 Water sales (m3 per day) 12,709 14,702 17,711 21,170 Non-revenue Water (% leakage) 27.1% 26.4% 26.4% 26.4%
Customer Group Consumption Block (m3/month)
Tariff (VND/m3)
Of which, Drainage
Surcharge (VND/m3)
Quantity (m3) Sold
(2004 figure)/1
#households/ premises by
customer group
< 16 m3 2,900 100 3,426,471 16m3 - 25m3 3,600 100 826,860 26m3 - 35m3 3,600 100 367,874
1. Residential
>35m3 4,000 100 462,355
28,827
Public offices (HC) 3,600 100 2. Institutional Social organizations (SN) 4,000 100 906,141 519
3. Industrial and production 5,400 100 948,448 137 4. Commercial 7,200 100 453,359 178
3,800 100 335,610 1 5. Phan Ri Cua (via metering) Average Tariff (2004) 3,778 7,727,118

TA 4485- VIE: Central Region Small and Medium Towns Development FINAL REPORT Appendix 20, page 30
June 2006
Annex 4 PHU YEN WATER SUPPLY AND DRAINAGE COMPANY – FINANCIAL DATA
Name of Province: Phu Yen Name of Company: Phu Yen Water Supply and Drainage Company
Table Annex 4.1 Balance Sheets 2001 – 2004 (VND million) 2001 2002 2003 2004 Asset
A. Current Assets 7,631 8,772 9,497 12,427 1. Cash Cash on Hand (Including Notes) 5 8 79 27 Cash in Bank 3,785 6,477 6829 9723 Cash in Transit Short term financial securities 2,000 200 500 733 Total cash 5,790 6,685 7,408 10,483
2. Accounts Receivable Accounts Receivable from Customers 297 498 518 493 Advances to Suppliers 159 293 290 92 Intercompany Receivables Investment in Equity of Subsidiaries Other Receivable From Subsidiaries 11 Other Receivables 296 244 360 282 Provision for Bad Debt -2 -114 -104 -33 Total Accounts Receivable 750 921 1,075 834
3. Inventory Goods in Transit Raw Materials Tools and Supplies 498 413 630 674 Work in Progress 86 229 83 153 Finished Goods Merchandise Inventory 454 372 Goods on Consignment 2 Provision for Inventory Devaluation -55 -33 Total Inventory 985 981 713 827
4. Other Current Assets Advances 92 180 284 283 Prepaid Expenses 5 16 Deferred Expenses 14 Shortage of Assets Awaiting Resolution 1 Total Other Current Assets 106 185 301 283
B. Fixed Assets & Long Term Investments 1. Fixed Assets Tangible fixed Assets: Cost 51,400 53,190 57,313 78,399 Accumulated Depreciation -4,690 -6,654 -9,050 -12,106 Net Tangible Fixed Assets 46,710 46,536 48,263 66,293 Intangible Fixed Assets: Cost 847 933 892 28 Accumulated Depreciation -48 -78 -109 -9 Net Intangible Fixed Assets 799 855 783 19 Net Fixed Assets 47,509 47,391 49,046 66,312
2. Long Term Investments 137 149 165 5 Long Term Securities 137 149 165 5
3. Work in Progress 486 183 296 4
4. Long Term Deposits 510 Total Fixed Assets & Long Term Investments 510 Total Assets 55,763 56,495 59,004 79,258

TA 4485- VIE: Central Region Small and Medium Towns Development FINAL REPORT Appendix 20, page 31
June 2006
Liabilities & Owner's Equity (Table 1 continued) 2001 2002 2003 2004 A. Liabilities 1. Current Liabilities Short Term Borrowings Current Portion of Long Term Debt Accounts Payable - Trade 200 323 484 572 Advances from Customers 37 147 9 64 Taxes and Payable to State Budget 64 -11 -134 -43 Payable to Staff 722 632 845 928 Intercompany Payable Other Payable 932 76 318 410 Total Current Liabilities 1,955 1,367 1,522 1,931
2. Long Term Liabilities Long Term Debt Other Long Term Liabilities Total Long Term Liabilities
3. Other Liabilities 3 2 52 Accrued Expenses Payable 52 Assets Surplus Awaiting Resolution 3 2 Long Term Deposits Received Total Other Liabilities
Total Liabilities
B. Owner's Equity
1. Capital Sources & Funds Paid in Capital 52,856 54,600 56,968 76,638 Differences Upon Asset Revaluation Foreign Exchange Differences Business Development Funds 335 58 18 116 Reserved Funds 116 139 163 188 Undistributed Earnings Bonus & Welfare Fund 127 108 116 118 Fund for Capital Expenditures 374 220 215 215 Total Capital Sources & Funds 53,808 55,125 57,480 77,275
2. Budget Sources Management Funds of Higher Level Subsidy Funds from State Budget Prior Year Current Year Total Budget Sources
Total Owner's Equity 53,808 55,125 57,480 77,275
Total Liabilities & Equity 55,763 56,495 59,004 79,258

TA 4485- VIE: Central Region Small and Medium Towns Development FINAL REPORT Appendix 20, page 32
June 2006
Name of Province: Phu Yen Name of Company: Phu Yen Water Supply and Drainage Company
Table Annex 4.2 Income Statements – Water Supply Services: 20001-2004 (VND million)
2001 2002 2003 2004 A. Revenues
1 Gross Revenues 4,075 5,089 6,083 7,200 2 Deductions from Revenues 3 Sold Goods to be Returned 4 Revenue Tax/VAT 5 Other deductions 6 Total Deductions (=3+4+5) 7 Net Operating Revenues (=1-6) 4,075 5,089 6,083 7,200 B. Operating Expenses 8 Labor 430 613 711 952 9 Raw Materials and Supplies 640 896 942 169 10 Depreciation 1,310 1,612 2,053 2,823 11 Electricity 615 849 999 1,410 12 Administration 18 24 28 35 13 Production Instruments 96 128 151 36 14 Frequent Repair Expenses 133 307 362 200 15 Social Insurance 48 64 75 124 16 Office Equipment 18 24 28 35 17 Taxes, Fees and Charges 5 7 8 19 18 Other Expenses 18 24 28 27 19 Total B (=sum of items 8 to18) 3,331 4,548 5,385 5,830 20 Operating Income (=7-19) 744 541 698 1,370 C. Enterprise Management Expenses 21 Labor 260 256 479 457 22 Depreciation 25 25 46 140 23 Social Insurance 13 12 23 27 24 Other Expenses 248 380 334 469 25 Total C (=21+22+23+24) 546 673 882 1,093 D. Sales Expenses 26 Sales Expenses 132 222 406 E. Non-Operating Revenues & Expenses 27 Interest & Other Financial Income 28 Interest & Other Financial Expenses 29 Extraordinary Income 30 Extraordinary Expenses 32 Net Balance E (=27-28+29-30)
33 Income Before Tax (=20-25-26+32) 66 -132 -406 -129

TA 4485- VIE: Central Region Small and Medium Towns Development FINAL REPORT Appendix 20, page 33
June 2006
Table Annex 4.3 Income Statements – All Services: 2001-2004 (VND million) 2001 2002 2003 2004 A. Revenues
1 Gross Revenues 7,520 8,405 9,691 10,334 2 Deductions from Revenues 3 Sold Goods to be Returned 6 4 6 9 4 Revenue Tax/VAT 5 Other deductions 6 Total Deductions (=3+4+5) 6 4 6 9 7 Net Operating Revenues (=1-6) 7,514 8,401 9,685 10,325 B. Operating Expenses 8 Labor 958 1,107 1,213 1,578 9 Raw Materials and Supplies 2,277 2,452 2,650 1,679 10 Depreciation 1,474 1,908 2,183 2,832 11 Electricity 796 1,005 1,154 1,437 12 Administration 29 35 39 74 13 Production Instruments 123 154 177 40 14 Frequent Repair Expenses 404 475 530 200 15 Social Insurance 69 84 95 290 16 Office Equipment 33 39 43 86 17 Taxes, Fees and Charges 9 11 12 20 18 Other Expenses 32 37 42 74 19 Total B (=sum of items 8 to18) 6,204 7,307 8,138 8,310 20 Operating Income (=7-19) 1,310 1,094 1,547 2,015 C. Enterprise Management Expenses 21 Labor 424 460 641 900 22 Depreciation 41 45 62 197 23 Social Insurance 21 22 31 129 24 Other Expenses 456 493 687 571 25 Total C (=21+22+23+24) 942 1,020 1,421 1,797 D. Sales Expenses 26 Sales Expenses 138 155 227 409 E. Non-Operating Revenues & Expenses 27 Interest & Other Financial Income 173 402 446 509 28 Interest & Other Financial Expenses 2 2 3 29 Extraordinary Income 35 53 21 21 30 Extraordinary Expenses 7 44 23 2 32 Net Balance E (=27-28+29-30) 199 409 441 528
33 Income Before Tax (=20-25-26+32) 429 328 340 337 34 Less Profit/Income Tax 137 105 109 108 35 Net Income (=33-34) 292 223 231 229

TA 4485- VIE: Central Region Small and Medium Towns Development FINAL REPORT Appendix 20, page 34
June 2006
Table Annex 4.4 Existing Water Tariffs and Drainage Surcharge (VND/m3)
Operating Data (Water Supply Company) 2001 2002 2003 2004 Total population of the Town/City Water production capacity (000m3 per year) 3,337 3,875 4,562 5,243 Water sales (000m3 per year) 2,436 2,751 3,239 3,670 Water sales (m3 per day) 6,674 7,537 8,874 10,054 Non-revenue Water (% leakage) 27% 29% 29% 30%
Customer Group Consumption Block (m3/month) Tariff (VND/m3)
Of which, Drainage
Surcharge (VND/m3)
Quantity (m3) Sold
(2004 figure)/1
#households/ premises by
customer group
1. Residential 5 m3/person/month 1,600 100 2,071,490 >5 m3/person/month 2,500 100 447,564
12,450
2. Institutional 2,500 200 662,582 451 3. Industrial 3,500 200 299,137 73 4. Commercial 5,000 200 189,625 263 Average Tariff (2004) 2,203 3,670,398

TA 4485- VIE: Central Region Small and Medium Towns Development FINAL REPORT Appendix 20, page 35
June 2006
Annex 5 KHANH HOA WATER SUPPLY AND DRAINAGE COMPANY - FINANCIAL DATA
Name of Province: Khanh Hoa Name of Company: Khanh Hoa Water Supply and Drainage Company
Table Annex 5.1 Balance Sheets 2001-2004 (VND million) 2001 2002 2003 2004 Assets
A. Current Assets 11,651 16,155 40,281 47,986 1. Cash Cash on Hand (Including Notes) 82 146 11 143 Cash in Bank 7,621 11,084 14,999 23,678 Cash in Transit Total cash 7,703 11,230 15,010 23,821
2. Accounts Receivable Accounts Receivable from Customers 766 1,633 1,809 2,011 Advances to Suppliers 117 81 72 44 Intercompany Receivables Investment in Equity of Subsidiaries Other Receivable From Subsidiaries Other Receivables 119 40 82 291 Provision for Bad Debt -12 Total Accounts Receivable 990 1,754 1,963 2,346
3. Inventory Goods in Transit 114 Raw Materials 1,800 1,869 21,365 19,961 Tools and Supplies 8 10 13 267 Work in Progress 904 1,128 1,757 1,464 Finished Goods Merchandise Inventory Goods on Consignment Provision for Inventory Devaluation -27 Total Inventory 2,799 3,007 23,135 21,692
4. Other Current Assets Advances 155 160 169 123 Prepaid Expenses Deferred Expenses 4 4 4 4 Shortage of Assets Awaiting Resolution Total Other Current Assets 159 164 173 127
B. Fixed Assets & Long Term Investments 1. Fixed Assets Tangible fixed Assets: Cost 54,354 60,352 140,764 162,098 Accumulated Depreciation -22,541 -27,586 -27,512 -35,966 Net Tangible Fixed Assets 31,813 32,766 113,252 126,132 Intangible Fixed Assets: Cost 40 Accumulated Depreciation -6 Net Intangible Fixed Assets 34 Net Fixed Assets 31,813 32,766 113,252 126,166
2. Long Term Investments 1,241 1,341 1,648 328 Long Term Securities
3. Work in Progress 15 2,605 41
4. Long Term Deposits 4,627 5,938 9,122 12,403 Total Fixed Assets & Long Term Investments 37,696 42,650 124,022 138,938
Total Assets 49,347 58,805 164,303 186,924

TA 4485- VIE: Central Region Small and Medium Towns Development FINAL REPORT Appendix 20, page 36
June 2006
Liabilities & Owner's Equity (Table 1 continued) 2001 2002 2003 2004 A. Liabilities 1. Current Liabilities Short Term Borrowings Current Portion of Long Term Debt Accounts Payable - Trade 264 569 215 340 Advances from Customers 132 124 41 Taxes and Payable to State Budget 383 211 354 462 Payable to Staff 968 989 1,868 Intercompany Payable Other Payable 2,995 6,912 107,757 123,136 Total Current Liabilities 3,774 8,784 109,356 125,806
2. Long Term Liabilities Long Term Debt Other Long Term Liabilities Total Long Term Liabilities
3. Other Liabilities Accrued Expenses Payable 720 792 Assets Surplus Awaiting Resolution Long Term Deposits Received Total Other Liabilities 720 792
Total Liabilities 3,774 8,784 110,076 126,598
B. Owner's Equity
1. Capital Sources & Funds Paid in Capital 40,507 42,117 47,464 52,296 Differences Upon Asset Revaluation Foreign Exchange Differences Business Development Funds 2,479 3,906 2,649 3,716 Reserved Funds 884 1,263 1,677 2,091 Undistributed Earnings 495 904 1,046 434 Bonus & Welfare Fund 743 1,356 917 1,336 Fund for Capital Expenditures 465 475 474 474 Total Capital Sources & Funds 45,573 50,021 54,227 60,347
2. Budget Sources Management Funds of Higher Level Subsidy Funds from State Budget Prior Year Current Year Total Budget Sources
Total Owner's Equity 45,573 50,021 54,227 60,347
Total Liabilities & Equity 49,347 58,805 164,303 186,945

TA 4485- VIE: Central Region Small and Medium Towns Development FINAL REPORT Appendix 20, page 37
June 2006
Name of Province: Khanh Hoa Name of Company: Khanh Hoa Water Supply and Drainage Company
Table Annex 5.2 Income Statements – Water Supply Services: 2001-2004 (VND million)
2001 2002 2003 2004 A. Revenues 1 Gross Revenues 18,112 20,650 26,059 30,419 2 Deductions from Revenues 3 Sold Goods to be Returned 4 Revenue Tax/VAT 5 Other deductions 6 Total Deductions (=3+4+5) 7 Net Operating Revenues (=1-6) 18,112 20,650 26,059 30,419 B. Operating Expenses 8 Labor 2,527 2,975 3,571 3,901 9 Raw Materials and Supplies 757 922 1,280 1,276 10 Depreciation 4,442 4,980 8,028 9,229 11 Electricity 3,200 3,480 4,200 4,733 12 Administration 179 176 137 158 13 Production Instruments 36 58 90 53 14 Frequent Repair Expenses 387 279 653 577 15 Social Insurance 16 Office Equipment 17 Taxes, Fees and Charges 18 Other Expenses 1,427 2,052 2,300 2,527 19 Total B (=sum of items 8 to18) 12,955 14,922 20,259 22,454 20 Operating Income (=7-19) 5,157 5,728 5,800 7,965 C. Enterprise Management Expenses 21 Labor 326 206 184 327 22 Depreciation 165 78 39 20 23 Social Insurance 24 Other Expenses 518 394 395 654 25 Total C (=21+22+23+24) 1,009 678 618 1,001 D. Sales Expenses 26 Sales Expenses E. Non-Operating Revenues & Expenses 27 Interest & Other Financial Income 28 Interest & Other Financial Expenses 29 Extraordinary Income 30 Extraordinary Expenses 32 Net Balance E (=27-28+29-30)
33 Income Before Tax (=20-25-26+32) 4,148 5,050 5,182 6,964

TA 4485- VIE: Central Region Small and Medium Towns Development FINAL REPORT Appendix 20, page 38
June 2006
Table Annex 5.3 Income Statements – All Services: 2001-2004 (VND million) 2001 2002 2003 2004
A. Revenues 1 Gross Revenues 28,572 30,741 39,072 47,510 2 Deductions from Revenues 14 6 7 40 3 Sold Goods to be Returned 14 6 7 40 4 Revenue Tax/VAT 5 Other deductions 6 Total Deductions (=3+4+5) 14 6 7 40 7 Net Operating Revenues (=1-6) 28,558 30,735 39,065 47,470 B. Operating Expenses 8 Labor 3,886 5,364 5,252 6,744 9 Raw Materials and Supplies 7,372 6,560 8,308 10,085 10 Depreciation 4,988 5,166 8,226 9,470 11 Electricity 3,248 3,528 4,248 4,760 12 Administration 200 191 142 176 13 Production Instruments 37 65 91 56 14 Frequent Repair Expenses 387 279 653 580 15 Social Insurance 183 192 292 320 16 Office Equipment 17 Taxes, Fees and Charges 18 Other Expenses 2,160 2,588 4,257 5,726 19 Total B (=sum of items 8 to18) 22,461 23,933 31,469 37,917 20 Operating Income (=7-19) 6,097 6,802 7,596 9,553 C. Enterprise Management Expenses 21 Labor 494 284 394 490 22 Depreciation 241 112 71 29 23 Social Insurance 24 Other Expenses 751 543 881 1,004 25 Total C (=21+22+23+24) 1,486 939 1,346 1,523 D. Sales Expenses 26 Sales Expenses E. Non-Operating Revenues & Expenses 27 Interest & Other Financial Income 295 410 527 675 28 Interest & Other Financial Expenses 17 29 Extraordinary Income 52 81 63 349 30 Extraordinary Expenses 143 151 368 228 32 Net Balance E (=27-28+29-30) 204 323 222 796
33 Income Before Tax (=20-25-26+32) 4,815 6,186 6,472 8,826 34 Less Profit/Income Tax 1,489 1,947 2,038 2,455 35 Net Income (=33-34) 3,326 4,239 4,434 6,371

TA 4485- VIE: Central Region Small and Medium Towns Development FINAL REPORT Appendix 20, page 39
June 2006
Table Annex 5.4 Existing Water Tariffs and Drainage Surcharge (VND/m3)
Operating Data (Water Supply Company) 2001 2002 2003 2004 Total population of the Town/City Water production capacity (000m3 per year) 4,911 14,979 20,196 21,666 Water sales (000m3 per year) 10,783 11,703 14,032 16,523 Water sales (m3 per day) 29,953 32,508 38,978 45,897 Non-revenue Water (% leakage) 28% 22% 31% 24%
Customer Group Consumption Block (m3/month)
Tariff (VND/m3)
Of which, Drainage
Surcharge (VND/m3)
Quantity (m3) Sold (2004
figure)/1
#households/ premises by
customer group
1. Residential 3,500 350 12,294,912 2. Institutional 2,500 250 2,027,459 3. Industrial 3,500 350 1,033,694 4. Commercial 5,000 500 1,167,604 Average Tariff (2004) 3,483 16,523,669

TA 4485- VIE: Central Region Small and Medium Towns Development FINAL REPORT Appendix 20, page 40
June 2006
Annex 6 DAK NONG WATER SUPPLY AND DRAINAGE COMPANY - FINANCIAL DATA
Name of Province: Dak Nong Name of Company: Dak Nong Water Supply, Drainage, and Public Works Company
Table Annex 6.1 Balance Sheets 2001-2004 (VND million) 2001 2002 2003 2004 Assets
A. Current Assets 1. Cash 50 Cash on Hand (Including Notes) 1,150 Cash in Bank Cash in Transit Short term financial securities Total cash 1,200
2. Accounts Receivable Accounts Receivable from Customers 668 Advances to Suppliers Intercompany Receivables Investment in Equity of Subsidiaries Other Receivable From Subsidiaries Other Receivables Provision for Bad Debt Total Accounts Receivable 668
3. Inventory Goods in Transit Raw Materials Tools and Supplies Work in Progress Finished Goods Merchandise Inventory Goods on Consignment Provision for Inventory Devaluation Total Inventory
4. Other Current Assets Advances 31 Prepaid Expenses Deferred Expenses 69 Shortage of Assets Awaiting Resolution Total Other Current Assets 100
B. Fixed Assets & Long Term Investments 1. Fixed Assets Tangible fixed Assets: Cost 116 Accumulated Depreciation Net Tangible Fixed Assets Intangible Fixed Assets: Cost 28 Accumulated Depreciation Net Intangible Fixed Assets Net Fixed Assets 144
2. Long Term Investments Long Term Securities
3. Work in Progress
4. Long Term Deposits Total Fixed Assets & Long Term Investments 144
Total Assets 2,112

TA 4485- VIE: Central Region Small and Medium Towns Development FINAL REPORT Appendix 20, page 41
June 2006
Liabilities & Owner's Equity (Table 1 continued) 2001 2002 2003 2004 A. Liabilities 1. Current Liabilities Short Term Borrowings Current Portion of Long Term Debt Accounts Payable - Trade 530 Advances from Customers Taxes and Payable to State Budget 34 Payable to Staff Intercompany Payable Other Payable Total Current Liabilities 564
2. Long Term Liabilities Long Term Debt Other Long Term Liabilities Total Long Term Liabilities 33
3. Other Liabilities Accrued Expenses Payable Assets Surplus Awaiting Resolution Long Term Deposits Received Total Other Liabilities
Total Liabilities 597
B. Owner's Equity
1. Capital Sources & Funds Paid in Capital 1,500 Differences Upon Asset Revaluation Foreign Exchange Differences Business Development Funds Reserved Funds Undistributed Earnings 15 Bonus & Welfare Fund Fund for Capital Expenditures Total Capital Sources & Funds 1,515
2. Budget Sources Management Funds of Higher Level Subsidy Funds from State Budget Prior Year Current Year Total Budget Sources
Total Owner's Equity 1515
Total Liabilities & Equity 2,112

TA 4485- VIE: Central Region Small and Medium Towns Development FINAL REPORT Appendix 20, page 42
June 2006
Table Annex 6.2 Income Statements – Water Supply Services: 2001-2004 (VND million)
2001 2002 2003 2004 A. Revenues 1 Gross Revenues 2 Deductions from Revenues 3 Sold Goods to be Returned 4 Revenue Tax/VAT 5 Other deductions 6 Total Deductions (=3+4+5) 7 Net Operating Revenues (=1-6) B. Operating Expenses 8 Labor 9 Raw Materials and Supplies 10 Depreciation 11 Electricity 12 Administration 13 Production Instruments 14 Frequent Repair Expenses 15 Social Insurance 16 Office Equipment 17 Taxes, Fees and Charges 18 Other Expenses 19 Total B (=sum of items 8 to18) 20 Operating Income (=7-19) C. Enterprise Management Expenses 21 Labor 22 Depreciation 23 Social Insurance 24 Other Expenses 25 Total C (=21+22+23+24) D. Sales Expenses 26 Sales Expenses E. Non-Operating Revenues & Expenses 27 Interest & Other Financial Income 28 Interest & Other Financial Expenses 29 Extraordinary Income 30 Extraordinary Expenses 32 Net Balance E (=27-28+29-30)
33 Income Before Tax (=20-25-26+32)

TA 4485- VIE: Central Region Small and Medium Towns Development FINAL REPORT Appendix 20, page 43
June 2006
Table annex 6.3 Income Statements – All Services: 2001-2004 (VND million) 2001 2002 2003 2004 A. Revenues
1 Gross Revenues 641 2 Deductions from Revenues 3 Sold Goods to be Returned 4 Revenue Tax/VAT 34 5 Other deductions 6 Total Deductions (=3+4+5) 607 7 Net Operating Revenues (=1-6) B. Operating Expenses 8 Labor 170 9 Raw Materials and Supplies 337 10 Depreciation 11 Electricity 12 Administration 13 Production Instruments 14 Frequent Repair Expenses 15 Social Insurance 16 Office Equipment 17 Taxes, Fees and Charges 18 Other Expenses 8 19 Total B (=sum of items 8 to18) 515 20 Operating Income (=7-19) 92 C. Enterprise Management Expenses 21 Labor 33 22 Depreciation 6 23 Social Insurance 24 Other Expenses 25 Total C (=21+22+23+24) 45 D. Sales Expenses 26 Sales Expenses 84 E. Non-Operating Revenues & Expenses 27 Interest & Other Financial Income 14 28 Interest & Other Financial Expenses 7 29 Extraordinary Income 30 Extraordinary Expenses 32 Net Balance E (=27-28+29-30) 7
33 Income Before Tax (=20-25-26+32) 15 34 Less Profit/Income Tax 35 Net Income (=33-34) 15

TA 4485- VIE: Central Region Small and Medium Towns Development FINAL REPORT Appendix 20, page 44
June 2006
Table Annex 6.4 Existing Water Tariffs and Drainage Surcharge (VDND/m3)
Operating Data (Water Supply Company) 2001 2002 2003 2004 Total population of the Town/City Water production capacity (000m3 per year) Water sales (000m3 per year) Water sales (m3 per day) Non-revenue Water (% leakage)
Customer Group Consumption Block (m3/month) Tariff (VND/m3)
Of which, Drainage
Surcharge (VND/m3)
Quantity (m3) Sold
(2004 figure)/1
#households/ premises
by customer group
1. Residential 4,000 0 2. Institutional 6,000 0 3. Industrial 7,000 0 4. Commercial 8,000 0 Average Tariff (2004) 6,250

TA 4485-VIE: Central Region Small and Medium Towns Development Project FINAL REPORT Appendix 21, page 1
June 2006
SUMMARY ASSESSMENT OF LAND ACQUISITION AND RESETTLEMENT
A. DAK NONG PROVINCE
Table A21-1. Initial Assessment of Land Acquisition and Resettlement Impacts
Town Sub-component Scheme Element Land area
(hectares) Current land use, e.g. Rice,
forest, tree crops)
Ownership, e.g. government, commune,
private
Number of households
affected Comment
Water supply Water treatment plant (WTP)
Existing WTP to be expanded on adjacent site already owned by water company. Hence no LAR impact.
Pumping station (temporary)
Under 1 ha (near Dak Tik bridge)
River margin Not yet assessed Site not yet selected but impact unlikely to be significant
Transmission main 7km x 5m easement
Edge of fields and treed areas next to road.
Private/ Public …. Impact likely to be minimal and temporary. Cannot be assessed until completion of FS.
Distribution network 52km length Urban/ rural (tree crops) Primarily public rights of way
…. Impact likely to be minimal and temporary as will be located along existing or newly constructed roads whose LAR impacts will be outside this project. This cannot be assessed until completion of the FS.
Solid waste Land fill site 6ha initially; 90 ha available
Light forest, withy some crops
Government/ managed by local authority
None Actual site is 90 has but only 6 has required. The site has some illegal cultivation of cashew trees by minorities but the area required for the landfill will be sited so as not to affect this cultivation.
Gia Nghia (NB. As a future provincial capital, a major re-
planning of Gia Nghia will take place over the next few
years. This will involve major new road construction
and relocation of many existing residential areas to already selected relocation
sites).
Access road 2km (widening of existing track)
Forest Mostly public …. Some permanent acquisition but impact likely to be minimal as most land is not cultivated.
Cannot be assessed until

TA 4485-VIE: Central Region Small and Medium Towns Development Project FINAL REPORT Appendix 22, page 1
June 2006
SUMMARY INITIAL ENVIRONMENTAL ASSESSMENT 1. INTRODUCTION
This report summarizes the outcome of the initial environmental examinations (IEEs) of the subprojects under the proposed Central Region Small and Medium Towns Development Project (or “the Project”). It is intended to give a brief description of the Project’s potential adverse impacts on the environment, and present the recommended measures to mitigate them and the proposed Environmental Monitoring Plans (EMPs). The IEEs were carried out following the Environment Policy, Environmental Assessment Guidelines, and Environmental Guidelines for Selected Infrastructure Projects of the Asian Development Bank (ADB), and relevant environmental policies and guidelines of the Government of Vietnam (GOV). These will be updated by the Project Management Units (PMUs) in all provinces after completion of the detailed engineering designs (DEDs) for submission to the ADB for approval and Department of Natural Resources and Environment (DONRE) for review and endorsement to the concerned Provincial People’s Committees (PPCs). Government regulations require full Environmental Impact Assessment (EIA) for each of the proposed sanitary landfills during the DED stage. Findings of the EIAs shall be integrated into the updated IEEs and EMPs accordingly.
2. PROJECT DESCRIPTION
The proposed Project will develop, expand or improve water supply, drainage, wastewater management and/or solid waste management systems in thirteen (13) towns in five (5) Central Region Provinces namely, Phu Yen, Khanh Hoa, Ninh Thuan, Binh Thuan and Dak Nong. It has five (5) main components: i) Community Environmental Sanitation and Awareness; ii) Water Supply Development and Expansion; iii) Drainage and Wastewater Management; iv) Solid Waste Management; and v) Project Management and Institutional Strengthening. Components ii, iii and iv are the physical components of the Project, hence, subjected to environmental assessment (Figure A22-1 and Table A22-1). Component ii will develop, expand or improve piped water supply in eight (8) towns. The existing water supply systems in four (4) of the eight (8) towns will be expanded from 7,000 to 29,000 m3/day combined capacity. In the remaining 4 towns, new water supply systems with 10,000 m3/day combined capacity will be developed (Figures A22-1 – A22-8). Component iii will develop complete and integrated drainage and wastewater management systems, including wastewater treatment, in 5 towns; and will develop and improve the combined drainage systems in 4 towns. Public sanitation works will also be carried out (Figures A22-9 – A22-17). Component iv will improve solid waste management in 7 towns. Sanitary landfills will be developed in only 5 of the 7 towns; but collection and transport will be improved in all 7 towns (Figures A22-18 – A22-21).

TA 4485-VIE: Central Region Small and Medium Towns Development Project FINAL REPORT Appendix 22, page 2
June 2006
Figure A22-1. Location of 5 Subproject Provinces and 13 Subproject Towns

TA 4485-VIE: Central Region Small and Medium Towns Development Project FINAL REPORT Appendix 22, page 3
June 2006
Table A22-1. Central Region Small and Medium Towns Development Project

TA 4485-VIE: Central Region Small and Medium Towns Development Project FINAL REPORT Appendix 22, page 4
June 2006
3. DESCRIPTION OF THE ENVIRONMENT
Geographically and ecologically, the subcomponent sites in Phu Yen, Khanh Hoa, Ninh Thuan and Binh Thuan are very similar in that most are either coastal or near coastal settings, often located on (or within close proximity to) rivers or canals discharging directly into the South China Sea, or in low foothills or dry rolling lands, about 20-40 km inland from the coast. Dak Nong, on the other hand, is the only landlocked mountainous province, with differing seasons, ecological conditions and a much less disturbed natural environment. All five provinces have experienced serious levels of environmental degradation due to unabated forest removal, resource extraction, and/or discharge of untreated liquid and solid wastes onto water bodies. Generally, the urban environmental conditions in all five provinces are very similar. Urban population base continues to grow; demand for clean and safe water is rising; waste generation (mostly household waste) is increasing; but provisions for basic urban infrastructure services is wanting. The lack of urban infrastructure to manage the generated waste adds to the degradation of local rivers, canals, lakes and coastal waters. This level of contamination is, with few exceptions, continuing unabated. Coupled with the lack of potable water supply and inadequate drainage system, the quality of the urban environment is fast deteriorating. Tested and analyzed samples taken from proposed raw water sources for Khanh Hoa, Ninh Thuan and Dak Nong have revealed high levels of suspended solids and exceedingly high coliform counts. Tested and analyzed samples from water bodies that are currently receiving outfalls from drainage systems (including those that are tapped to receive effluents from proposed wastewater stabilization ponds) in the four coastal provinces also yielded exceeding levels of suspended solids and/or coliform counts. Dak Nong’s environment, however, is relatively still healthy and at a considerably low-level of degradation, yet will benefit greatly from the Project.
Physical Resources Climate. Phu Yen, Khanh Hoa, Ninh Thuan and Binh Thuan are coastal provinces in the South Central Region, located in monsoon tropical zone, affected by sea climate, with an average temperature of 26.5oC and with 3-4 months of more pronounced rains (from September to December) accounting for 75 percent to 80 percent of the total annual rainfall. Relative humidity averages at 80 percent to 82 percent. Dak Nong is a high mountain province in Highland Central Region, affected by temperate climate. It experiences 3 months of rainy season from August to October, accounting for 76 percent of the total annual rainfall. Average temperature is 22 oC. Relative humidity averages at 82 percent (Table A22-1). Air Quality and Noise. Based on available data, as of 2004, suspended dust in seven subproject towns exceeded at least 1.3 times, at most twice, the limit in the VN Standard. Concentrations of NO2 and SO2 were within VN Standards. Noise levels in five of nine subproject towns exceeded the VN Standard limit (Table A22-2). Topography and Soils. The four coastal provinces of Phu Yen, Khanh Hoa, Ninh Thuan and Binh Thuan lie at the eastern side of Truong Son Range. As such, the undulating terrain in these provinces (excluding islands) slopes down from west to east. Typical main features in these provinces are sandy areas, deltaic or alluvial plains, mountains and hills. Dak Nong Province is a mountainous province in the

TA 4485-VIE: Central Region Small and Medium Towns Development Project FINAL REPORT Appendix 22, page 5
June 2006
southwest of the Central Highlands. Terrain is higher in its west, lower in its east, comprising of valleys, hills, and mountains. There are eight main soil groups in the coastal provinces. Sandy soil in coastal plains; alkaline soil in low plains and estuaries; alluvial soil in downstream areas of rivers; grey soil in semi-dough mound areas; yellow-red soil in hill/mountain areas with high slopes; yellow-red humus soil in mountains of elevation 900-1,000 m; valley soil in river valleys; and gravelly (stony) eroded soil in slopes. Dak Nong has 3 main soil groups. Soil from weathered basalt stone and grey soil largely make up the Province. Alluvial soil is concentrated in areas near rivers. Surface Water. There are about 50 large and small rivers in Phu Yen, two of which traverse the subproject towns. Khanh Hoa, Ninh Thuan and Dak Nong have two main river systems each; while Binh Thuan has seven main rivers. In general, with the exception of total suspended solids (TSS) and bacteria values, and with the exception of some effluent-receiving points having high BOD5 level, the quality of waters in rivers, tributaries and streams running through subproject towns are reportedly still meeting the Surface Water Class A standards (for domestic water supply). This has been confirmed by the results of tests and analyses of water samples (taken from some existing and proposed raw water intake and effluent-receiving points) conducted by Pasteur Institute in October 2005 as arranged by the Project Preparation Team (Tables A22-3 and A22-4). Groundwater. Groundwater potentials in Ninh Thuan, Binh Thuan and Dak Nong Provinces are not abundant compared to Phu Yen. Total potential exploitation volume in Phu Yen is 1,210,000 m3/day; in Ninh Thuan and Binh Thuan, a little over 200,000 m3/day and in Dak Nong, about 260,000 m3/day. Groundwater quality in Binh Thuan and Phu Yen Provinces is reported to be generally still satisfactory. In Thap Cham Town of Ninh Thuan and Cam Ranh Town of Khanh Hoa, groundwater has significantly high nitrate and sulfate levels. In Ninh Thuan and Dak Nong Provinces, groundwater has high levels of coliform count. Salt water intrusion has affected the groundwater quality in coastal areas, particularly those in Khanh Hoa and Ninh Thuan. Ecological Resources The forest cover rates of the five provinces range from 34 percent (Phu Yen) to 64 percent (Dak Nong). Between 83 percent and 95 percent of the forests in the five provinces are nature forests. Subcomponent sites are far from the forest areas. Protected areas in the five provinces include 7 existing and 1 proposed nature reserves, 6 proposed marine protected areas, 1 existing national park and 1 existing cultural/historical site. Subcomponent sites outside the town centers are not in close proximity to any known protected area (Table A22-5). Human and Economic Development Population. In 2004, the 13 subproject towns registered a combined population of over 950,000 people (or about 23 percent of the combined population of the 5 provinces). Population of these towns range from 3,500 to 215,800. The three largest towns were Cam Ranh (215,800), Phan Thiet (207,000) and Tuy Hoa (162,300). The combined urban population of the 13 subproject towns was over 585,000, or about 60 percent of the combined total population. The urban population in the five provinces is estimated to be growing at an average annual rate of 2.3 percent. When disaggregated by gender, female population is higher than male population.

TA 4485-VIE: Central Region Small and Medium Towns Development Project FINAL REPORT Appendix 22, page 6
June 2006
Economy. The economy in the five provinces has been growing at average annual rates ranging from 9 to 11 percent, in the recent years, with Khanh Hoa taking the lead and followed closely by Phu Yen. Dak Nong experiences lowest economic growth among the five provinces, at about 9.2 percent between 2000 and 2005. The 13 subproject towns include two Class III cities, three Class IV provincial towns, seven Class V district towns and one commune center. These towns mainly serve as economic growth centers for their surrounding rural hinterlands or fishing communities. They provide most of the non-agricultural employment in their respective provinces. The two cities, Tuy Hoa and Phan Thiet, serve as provincial, administrative and political centers, and like the larger subproject towns, provide health and educational services that are typically available in smaller towns or communes. Income and Employment. Based on the socioeconomic survey conducted by the PPTA Team, of the thirteen towns, Ca Na and Phan Thiet, have the highest range of per capita monthly income, VND 600,000 to 700,000. Tuy Hoa follows closely with a range of VND 500,000 to VND 700,000. The towns of Van Gia and Quang Khe have lower ranges, VND 250,000 to VND 300,000 and VND 250,000 to VND 350,000, respectively. To appreciate these survey results, based on the 2004 Living Standard Survey of the General Statistics office of Vietnam, the national average per capita monthly income is VND 484,000 (urban, VND 815,000, and rural, VND 378,000); in the South Central Coast Region, VND 414,000; and in the Central Highland, VND 390,000. Using the new standard set by MOLISA in 2004, the social survey results reveal that the three towns of Quang Khe, Ea Tling and Dak Mam in Dak Nong Province have the three highest incidence of poverty, at 55 percent, 45 percent and 36 percent of their respective population. The remaining towns have poverty rates not exceeding 20 percent. The town of Phan Thiet in Binh Thuan Province has the lowest poverty incidence, at 3 percent. The same survey revealed that in 8 subproject towns, more people are employed in the agricultural sector, i.e., between 45 percent (Can Na and Tan Son) and 92 percent (Quang Khe) of total employed population. In Ea Tling, Phan Thiet and Tuy Hoa, between 53 percent to 65 percent in the business and service sector. In Van Gia, more employed people are in the industry sector. Quality of Life Values. Owing to the policy of compulsory education for primary level children, the presence of skilled and competent teachers and the availability of school buildings, the literacy rate in the subproject towns ranges from high (85 percent in Quang Khe) to very high (95 percent to 100 percent in all other towns). Cases of malnutrition, malaria, dengue, tuberculosis, diarrhea and/or HIV are reported but not in alarming rates. Households, in general, source water from drilled or dug wells. Piped water supply is available in only eight of the thirteen subproject towns and access to it ranges between 5 percent (in Song Cau) and 80 percent (in Phan Thiet). In terms of awareness in sanitation, washing hands after using the toilet is highly practiced; and 90 percent to 100 percent of the households boil water for drinking. The proportion of households in each town using toilets with septic tanks ranges from 10 percent (Ea Tling) to 85 percent (Tuy Hoa); those using latrines, 12 percent (Tuy Hoa) to 60 percent (Ea Tling); and those with no sanitation facilities, 3 percent (Tuy Hoa and Phan Thiet) to 58 percent (Dak Mam). Solid waste collection service is not available in Tan Son and in the Central Highland towns of Ea Tling, Dak Mam and Quang Khe. Where this is available, the proportion of

TA 4485-VIE: Central Region Small and Medium Towns Development Project FINAL REPORT Appendix 22, page 7
June 2006
households with access to it range from 15 percent (Ca Na) to 89 percent (Tuy Hoa) .
4. POTENTIAL IMPACTS AND MITIGATING MEASURES
Issues/Concerns Relative to Siting/Location Water Supply Development and Expansion. Overall, the proposed sites of water intake, treatment and transmission subcomponents in all six towns are confronted with negligible or minimal degree of environmental issues/concerns, which can be considered and incorporated in the design, pre-construction, construction and operation stages without difficulty. Salient among the minor concerns are the following: i) The sites of the existing water intake and treatment facilities in Tan Son are limited in size and do not allow provision of buffer zone for protection and security. These are surrounded with residential and/or institutional structures; ii) minimal to moderate number of households will be adversely affected by land recovery/acquisition for pumping stations and/or water treatment facilities, i.e., very minimal number in Khanh Hoa Province, 1 HH in Tan Son and a moderate number in Ca Na (Ninh Thuan Province), and 4 HHs in Quang Khe, 5 HHs in Dak Mam and a few minorities cultivating in Gia Nghia (Dak Nong Province); and iii) the sites’ degrees of vulnerability to flooding and damage during earthquakes will also have to be confirmed/verified and considered during detailed engineering design and considered in operation (Table A22-6). Drainage and Wastewater Management. The more prominent concerns relative to siting of wastewater stabilization ponds are the following: i) The proposed sites in Thap Cham, Phan Thiet and Cam Ranh, are within, or in close proximities to, populated areas; ii) moderate to large number of households will be adversely affected by land recovery/acquisition for the wastewater stabilization ponds and/or wastewater pumping stations, i.e., some 49 HHs in Tuy Hoa (Phu Yen Province), 17 HHs in Cam Ranh (Khanh Hoang Province), large number of HHs in Thap Cham (Ninh Thuan Province), and 18 HHs in Phan Thiet (Binh Thuan Province); and iii) the sites’ vulnerability to flooding and damage during earthquakes, and sites’ proximities to aquifer/ground water systems that are used as potable water sources need to be confirmed/verified and considered in design and operation. Potential adverse effect of storm surges in Cam Ranh Bay will have to be considered in the design of the Cam Ranh WSP. iv) access roads to the proposed sites in Tuy Hoa and Pha Thiet need to be improved and/or completed; and v) In Thap Cham, proposed site is intended for new urban development under the Master Plan. A land use reclassification will have to be requested from the Ninh Thuan PPC (Table A22-7). Solid Waste Management. Salient among the issues and concerns relative to the proposed sites for the sanitary landfill subcomponents in four towns include the following: i) minimal number of households will have to be compensated for the planted crops/trees in the proposed sanitary landfill sites, i.e., very minimal number in Song Cau (Phu Yen Province), 1 HH in Van Gia and 14 HHs in Cam Ranh (Khanh Hoa Province), and minimal number in Gia Nghia (Dak Nong Province); ii) the availability of, and/or accessibility to, sufficient soil cover material will have to be ensured; iii) the respective sites’ vulnerability to flooding, to polluting groundwater resources and to damage during earthquakes, need to be confirmed/verified and carefully considered during the detailed engineering design, and considered in operation; and iv) all sites are interior. All-weather access road from the highway

TA 4485-VIE: Central Region Small and Medium Towns Development Project FINAL REPORT Appendix 22, page 8
June 2006
and reliable supplies of power and water will have to be ensured for efficient operation (Table A22-8). Issues/Concerns/Problems Relative to Design The potential issues/concerns/problems relative to design are perceived to be minimal in magnitude. The proposed technologies are those that are deemed acceptable, feasible and sustainable in developing countries. Issues/Concerns/Impacts During Construction The adverse issues/concerns/impacts during construction are assessed to be: i) on air quality and socioeconomic environment, generally low in magnitude in less populated towns or areas of towns; and ii) on water resources quality and (marine) biological environment, generally low in magnitude in construction sites that are at reasonably far distance from water bodies (Tables A22-9, A22-10 and A22-11). Air Quality. Increase in total suspended particles (from clearing, grubbing and excavation and movements of construction equipment), gas emissions and noise from the operation of construction equipment will have greater impact in densely populated areas. Water Resources and Quality. Proposed sites for water intake structures, pumping stations, reservoirs and treatment facilities; wastewater stabilization ponds; and sanitary landfills are far from the reaches of piped water supply. Water requirements during construction may have to be met using groundwater resources. Extraction of groundwater resources in the vicinity may have to consider its effects on the other traditional water rights in the area (if applicable) or on other groundwater wells in the vicinity. Large areas of exposed soils, generated construction debris, sewage, hazardous wastes may affect nearby water bodies, unless properly managed. Flooding (intermittent or perennial) in adjacent areas could be a consequence of heavy siltation of, or deposits in, nearby rivers caused by inadequate management of exposed ground surfaces, removed topsoil, soil stockpiles and construction debris. Biological Environment. The adverse impacts on nearby water bodies that are brought about by improper management of construction wastes, exposed soils and excavated materials may affect marine life (aquatic flora and fauna). Socioeconomic Environment. The impacts on the public in terms of traffic, inconvenience, disruption of socioeconomic activities, disruption in water and power supply, and accidents will relate more to construction activities in urban centers. Issues/Concerns/Impacts/Benefits During Operation Adverse issues/concerns/impacts during operation may only arise with inefficient management, particularly environmental management, of operation. These issues/concerns/impacts are assessed to be: i) on air quality and socioeconomic environment, generally low in magnitude in less populated towns or areas of towns; and ii) on water resources quality and (marine) biological environment, generally low in magnitude in facility sites that are at reasonably far distance from water bodies (Tables A22-12, A22-13 and A22-14).

TA 4485-VIE: Central Region Small and Medium Towns Development Project FINAL REPORT Appendix 22, page 9
June 2006
Air Quality. Odor emissions waste stabilization ponds will be more of a concern in Cam Ranh, Thap Cham and Phan Thiet as these are sited within, or in close proximity to, populous areas. Water Resources and Quality. Degeneration of relevant surface water resources may be caused by: i) backwash flow or sludge disposal from water treatment plants; ii) increased generation of sewage/wastewater brought about by improved water supply in towns without adequate sewers and sewage treatment; iii) wastewater from combined drainage systems that directly discharge to receiving water bodies; iv) poorly treated effluents from wastewater stabilization ponds; v) accidental overflows from wastewater stabilization ponds; and vi) accidental leachate contamination from sanitary landfills. Biological Environment. The adverse impacts on nearby water bodies that are brought about by poor environmental management of operation may affect marine life (aquatic flora and fauna). Socioeconomic Environment. The operation of improved water supply system and sanitary landfills will adversely affect the livelihood of the waste pickers in the existing open dumps and of the water vendors in towns that are currently highly dependent on them for potable water supply. The adverse impacts on the public in the event of inefficient operation may be in terms of: i) nuisance from influx of pests and insects generated by wastewater stabilization ponds, and indiscriminate disposal of sludge; and ii) health hazards from odor and overflows of wastewater stabilization ponds, contaminated treated water, diseases transmitted by pests/insects, birds from sanitary landfills and WSPs. Project Benefits. The operation of the Project’s subcomponents will bring about the following benefits that far outweigh all aforementioned minimal to moderate adverse impacts in the event of inefficient operation: i) enhanced environmental sanitation and public health (particularly reduced incidence of water-related and water-borne diseases); ii) reduced/eliminated incidence of flooding; iii) induced socioeconomic growth, which is expected to confront local authorities with pressures to meet rising demand for basic infrastructure services and, therefore, would require coordinated planning of development activities; and open up income and employment opportunities; and iv) higher public revenues contributed by intensifying economic activities and increasing land values. Mitigation Measures Prior to Construction. Where necessary, resettlement plans will be prepared with proper consultation and active participation of affected households and according to the approved/agreed upon Compensation and Resettlement Policy Framework. Full compensation and resettlement shall have been completed prior to land acquisition and awarding of contract for construction, respectively. During Construction and Operation. The measures that are recommended to mitigate the potential adverse impacts of the Project during construction and operation are standard practices and can be provided and instituted without difficulty. It is, however, advisable to explicitly stipulate in contracts (for construction and operation) the obligation of parties involved to institute the mitigation measures properly and carry out environmental monitoring according to the approved subproject EMPs (which will be prepared in detail during the detailed engineering design) (Tables A22-2 and A22-3).

TA 4485-VIE: Central Region Small and Medium Towns Development Project FINAL REPORT Appendix 22, page 10
June 2006
5. INSTITUTIONAL REQUIREMENTS AND ENVIRONMENTAL MONITORING PLAN
Institutional Arrangements The PPCs in the five provinces will be the Executing Agency of the subproject/s in their respective jurisdictions. Each province will set up a Provincial Project Management Unit (PPMU) to manage and monitor day-to-day implementation activities of subproject/s. The PPMU will include representatives from the water supply, drainage and public works companies (WSC, WSDC, URENCO, UPWC and/or WSDandUPWC), Vietnam Women’s Union (VWU), Department of Health (DOH), subproject towns, and other involved entities. Relevant provincial departments and Town People’s Committee/s (TPCs) shall provide assistance to the PPMU. The PPMU shall set up an Environmental Management Unit (EMU) to be responsible for ensuring that: i) mitigation measures and monitoring activities are carried out accordingly; and ii) reporting is done in compliance with ADB and GOV requirements. It shall be headed by a qualified staff from among those assigned full time to the PPMU. At least one full-time technical support staff and one full-time administrative staff shall be assigned to the EMU. The relevant water supply, drainage and/or public works companies, TPC, DOH, VWU, and if possible and acceptable, Vietnam Youth Union, will designate their representatives to assist the EMU. If warranted, the PPMU will engage a local Environmental Specialist to technically assist the EMU. The water supply, drainage and/or public works companies (or the relevant TPC), whichever is appropriate, will post a Sanitation or Environmental Engineer in each subproject as the “focal person”, with whom the EMU will be closely coordinating. If Project Implementation Assistance (PIA) consultants will be granted during implementation, the PIA Team’s Environmental Specialist will impart expert advice and guidance and conduct capacity building on environmental management and monitoring. Environmental Monitoring Plan The Environmental Monitoring Plan (EMP) will serve as framework for EMU’s environmental management and monitoring. This will be finalized after completion of the detailed designs, when specific subproject EMPs will have been done (Table A22-15). The EMU’s capacity to implement the EMP will be strengthened as part of the Capacity Building Program of the Project. The EMU will use the existing laboratory facilities of Pasteur Institute in Khanh Hoa Province. If feasible and practicable, working arrangements with the Department of Science and Technology and DOH relative to samples taking and analyses will be made. The Terms of Reference for the detailed engineering design and bid documents should stipulate the preparation of specific EMP for each subproject, which shall be presented in a public consultation for comment and appreciation by the stakeholders. Environmental monitoring during operation is essentially the responsibility of the operators and/or concerned utility agencies of the completed subproject. Environmental monitoring results will be documented to ensure that signs of adverse impacts are detected at the earliest possible time. Monitoring results prior

TA 4485-VIE: Central Region Small and Medium Towns Development Project FINAL REPORT Appendix 22, page 11
June 2006
to, and during, construction will have to be reported monthly by the designated “focal person” of each town to the EMU. A year-end report (or an end-of-monitoring phase report, e.g., end of pre-construction phase or end of construction phase), whichever is applicable, will have to be jointly prepared by the “focal persons” of each town and the EMU for submission to PPMU head, who will in turn submit to DONRE for endorsement to the PPC. PPC will submit to the ADB. The format for the monthly and annual environmental monitoring report will be developed during detailed engineering design stage and may have to be refined during implementation to incorporate all monitoring findings and lessons learned. Preliminary Cost Estimates and Funding Environmental monitoring during construction in all five provinces is estimated to cost a total of USD 52,800 (VND 839.52 Million). During operation, the estimated total annual budget requirement for environmental monitoring is USD 102,520 (VND 1,597.00 Million) (Table A22-4). Respective PPCs will be responsible for providing the funds for environmental monitoring during the construction stages; while respective subproject operators will be responsible for including in its annual operational budget the costs for environmental monitoring during operation.
6. PUBLIC CONSULTATION AND DISCLOSURE
Consultation and Participation Process The consultation and participation process during project preparation stage involved reconnaissance surveys, socioeconomic surveys, participatory workshop and consultation meetings. Reconnaissance surveys of subproject towns and subcomponent sites were held almost every month between June and November 2005. These were done by a composite group of members of the Project Preparation Team (PPT) and provincial and town representatives. On-site discussions with provincial and relevant town officials provided the PPT with information on the physical and environmental resources, opportunities and constraints relevant to the proposed subprojects. Socioeconomic surveys (SESs) were conducted in September 2005 to establish the socioeconomic profile of subproject towns. The survey, at township level, included such usual indicators as population, income and poverty levels, health, education, migration patterns, residential status, among others, as well as access to water supply and sanitation facilities. In terms of participatory-based consultations with stakeholder groups, there were considerable sharing of information and environmental concerns with public sector officials and informal consultations with local community members including poorer and vulnerable groups. Participatory workshops were held in each province in November 2005. These were participated in by representatives from the PPMU, PPC and relevant provincial, town and city offices/agencies, and the Vietnam Women’s Union. The workshops presented the subprojects and the perceived outstanding social and environmental issues and concerns; solicited feedback from the participants on the foregoing; and consulted participants on their existing capacities in, and recommendations for, performing environmental management and monitoring.

TA 4485-VIE: Central Region Small and Medium Towns Development Project FINAL REPORT Appendix 22, page 12
June 2006
In April and May 2006, the PPT conducted a series of consultations meetings in subproject towns. Participated in by relevant government units/agencies and local residents, the consultation meetings presented the technical designs of the subprojects and the findings of the IEEs; and obtained feedbacks/reactions from the participants. Future public consultations are expected to be held during detailed engineering design, construction, and operations stages. All stakeholders should be invited and encouraged to participate in the consultation meetings. Suggestions from the general public may be sought through the mass media, when necessary. The PPMUs and, when necessary, People’s Committees (at relevant level) should be open to contact by the public on matters concerning the progress of the subprojects, adverse impacts and mitigation measures and environmental monitoring. Information Disclosed To Date Information disclosed to date, include Project/subproject objectives; subproject locations, designs and cost estimates; GOV and ADB environmental policies and procedures; project/subproject environmental categories per ADB and GOV policies; forms of possible institutional set up for environmental monitoring, findings of the IEEs.
7. CONCLUSIONS AND RECOMMENDATIONS
The Project will improve potable water supply, drainage and sanitation, and/or solid waste management in the urban areas of 13 subproject towns in the South Central Coast Region and the Central Highland. The proposed technologies under the Project are deemed acceptable, feasible and sustainable in developing countries. The inherent features of the proposed subproject sites do not pose any significant constraints that would require costly special mitigation measures. The findings of the IEEs indicate that the adverse environmental impacts of the Project, as a whole, will be minor, or moderate and high for a few of them (particularly in terms of effects of land recovery/acquisition). Measures to mitigate them can be provided and instituted without difficulty through proper engineering design and environment-friendly management of construction activities and operation of subprojects. The adverse impacts will be greatly offset by improvements in health, sanitation and environmental conditions for the urban residents of the 13 towns. However, full environmental benefits will only be obtained with efficient operation (to incorporate environmental monitoring) and maintenance. The IEEs confirmed that the Project is Category B. No further study or detailed EIA needs to be undertaken to comply with ADB‘s Environmental Policy. To comply, however, with GOV Circular 490, Appendix I, a full EIA shall have to be conducted during the detailed engineering design (DED) stage by the Environmental Specialist of the DED Team, for the proposed sanitary landfills in Song Cau (Phu Yen Province), Van Gia and Cam Ranh (Khanh Hoa Province), Gia Nghia (Dak Nong Province).

TA 4485-VIE: Central Region Small and Medium Towns Development Project FINAL REPORT Appendix 22, page 13
June 2006
Table A22-2. Mitigation Measures of Impacts During Construction

TA 4485-VIE: Central Region Small and Medium Towns Development Project FINAL REPORT Appendix 22, page 14
June 2006
Table A22-3. Mitigation Measures of Impacts During Operation

TA 4485-VIE: Central Region Small and Medium Towns Development Project FINAL REPORT Appendix 22, page 15
June 2006
Table A22-4. Cost Estimates for Environmental Monitoring Quantity
PY KH NT BT DN Cost Item SC TH VG NH CR TC CN TS PT ET DM GN QK
Sub-Total
Freq in a Year
Total
Unit Rate USD
Total Cost USD
DURING CONSTRUCTION A. Consultants A.1 International Environmental Specialist
(part of PIA Team - TA Grant, 4 mos. Intermittently for a year)
A.2 Local Environmental Specialist (part of PIA Team - TA Grant, 6 mos. intermittently for a year)
B EMU-PPMU B.1 Sanitary Engineer 1 1 1 1 1 1 1 1 1 1 1 1 1 13 12 156 200 31,200
(1 for each town, full time for a year) B.2 Monitoring Activities
B.2.1 Measuring/Analysis - Air Quality and Noise Level 2 1 2 1 2 1 1 1 1 1 1 3 1 18 4 72 80 5,760 - Surface Water Quality 2 1 2 1 2 1 1 1 1 1 1 3 1 18 4 72 80 5,760B.2.2 Taking/Handling Samples Per Diem: - Air Quality and Noise Level 2 1 2 1 2 1 1 1 1 1 1 3 1 18 4 72 20 1,440 - Surface Water Quality 2 1 2 1 2 1 1 1 1 1 1 3 1 18 4 72 20 1,440 Transport: - Air Quality and Noise Level 2 1 2 1 2 1 1 1 1 1 1 3 1 18 4 72 50 3,600 - Surface Water Quality 2 1 2 1 2 1 1 1 1 1 1 3 1 18 4 72 50 3,600
USD 52,800Total (During Construction) (VND 839.52 M)DURING OPERATION A. Environmental Monitoring Staff A.1 Sanitary Engineer 1 1 1 1 1 1 1 1 1 1 1 1 1 13 12 156 200 31,200B. Monitoring Activities B.1 Measuring / Analysis
- Air Quality and Noise Level 1 1 1 1 1 1 1 1 1 1 1 1 1 13 2 26 80 2,080- Surface Water Quality 1 1 1 1 1 1 1 1 1 1 1 1 1 13 4 52 80 4,160- Groundwater Quality 4 2 4 - 4 2 - - 2 - - 4 - 22 4 88 60 5,280- Treated Water Quality - - 1 1 - - 1 1 - 1 1 1 1 8 365 2920 20 58,400
B.2 Air Quality Measuring Per Diem and Transport
- Per Diem 1 - 1 - 2 1 - - 1 1 1 1 1 10 2 20 20 400- Transport 1 - 1 - 2 1 - - 1 1 1 1 1 10 2 20 50 1,000
USD 102,520Total (During Operation) (VND 1,597.00 M)1 USD = VND 15,900

TA 4485-VIE: Central Region Small and Medium Towns Development Project FINAL REPORT Appendix 22, page 16
June 2006
Figure A22-2. Proposed Water Supply Development and Expansion In VAN GIA (Khanh Hoa)

TA 4485-VIE: Central Region Small and Medium Towns Development Project FINAL REPORT Appendix 22, page 17
June 2006
Figure A22-3. Proposed Water Supply Development and Expansion In NINH HOA (Khanh Hoa)

TA 4485-VIE: Central Region Small and Medium Towns Development Project FINAL REPORT Appendix 22, page 18
June 2006
Figure A22-4. Proposed Water Supply Development In CA NA (Ninh Thuan)

TA 4485-VIE: Central Region Small and Medium Towns Development Project FINAL REPORT Appendix 22, page 19
June 2006
Figure A22-5. Proposed Water Supply Expansion In TAN SON (Ninh Thuan)

TA 4485-VIE: Central Region Small and Medium Towns Development Project FINAL REPORT Appendix 22, page 20
June 2006
Figure A22-6. Proposed Water Supply Development In EA TLING (Dak Nong)

TA 4485-VIE: Central Region Small and Medium Towns Development Project FINAL REPORT Appendix 22, page 21
June 2006
Figure A22-7. Proposed Water Supply Development in DAK MAM (Dak Nong)

TA 4485-VIE: Central Region Small and Medium Towns Development Project FINAL REPORT Appendix 22, page 22
June 2006
Figure A22-8. Proposed Water Supply Development and Expansion in GIA NGHIA (Dak Nong)

TA 4485-VIE: Central Region Small and Medium Towns Development Project FINAL REPORT Appendix 22, page 23
June 2006
Figure A22-9. Proposed Water Supply Development in QUANG KHE (Dak Nong)

TA 4485-VIE: Central Region Small and Medium Towns Development Project FINAL REPORT Appendix 22, page 24
June 2006
Figure A22-10. Proposed Small-Scale Drainage Works in SONG CAU (Phu Yen)

TA 4485-VIE: Central Region Small and Medium Towns Development Project FINAL REPORT Appendix 22, page 25
June 2006
Figure A22-11. Proposed Drainage and Wastewater Management in TUY HOA (Phu Yen)

TA 4485-VIE: Central Region Small and Medium Towns Development Project FINAL REPORT Appendix 22, page 26
June 2006
Figure A22-12. Proposed Drainage and Wastewater Management in CAM RANH (Khanh Hoa)

TA 4485-VIE: Central Region Small and Medium Towns Development Project FINAL REPORT Appendix 22, page 27
June 2006
Figure A22-13. Proposed Drainage and Wastewater Management in THAP CHAM (Ninh Thuan)

TA 4485-VIE: Central Region Small and Medium Towns Development Project FINAL REPORT Appendix 22, page 28
June 2006
Figure A22-14. Proposed Drainage and Wastewater Management in PHAN THIET (Binh Thuan)

TA 4485-VIE: Central Region Small and Medium Towns Development Project FINAL REPORT Appendix 22, page 29
June 2006
Figure A22-15. Proposed Small-Scale Drainage Works in EA TLING (Dak Nong)

TA 4485-VIE: Central Region Small and Medium Towns Development Project FINAL REPORT Appendix 22, page 30
June 2006
Figure A22-16. Proposed Small-Scale Drainage Works in DAK MAM (Dak Nong)

TA 4485-VIE: Central Region Small and Medium Towns Development Project FINAL REPORT Appendix 22, page 31
June 2006
Figure A22-17. Proposed Drainage and Wastewater Management in GIA NGHIA (Dak Nong)

TA 4485-VIE: Central Region Small and Medium Towns Development Project FINAL REPORT Appendix 22, page 32
June 2006
Figure A22-18. Proposed Small-Scale Drainage Works in QUANG KHE (Dak Nong)

TA 4485-VIE: Central Region Small and Medium Towns Development Project FINAL REPORT Appendix 22, page 33
June 2006
Figure A22-19. Proposed Sanitary Landfill in SONG CAU (Phu Yen)
(Map unavailable as of this report)

TA 4485-VIE: Central Region Small and Medium Towns Development Project FINAL REPORT Appendix 22, page 34
June 2006
Figure A22-20. Proposed Regional Sanitary Landfill in VAN GIA (Khanh Hoa)
(Map unavailable as of this report)

TA 4485-VIE: Central Region Small and Medium Towns Development Project FINAL REPORT Appendix 22, page 35
June 2006
Figure A22-21. Proposed Landfill in CAM RANH (Khanh Hoa)
(Map unavailable as of this report)

TA 4485-VIE: Central Region Small and Medium Towns Development Project FINAL REPORT Appendix 22, page 36
June 2006
Figure A22-22. Proposed Sanitary Landfill in GIA NGHIA (Dak Nong)
(Map unavailable as of this report)

TA 4485-VIE: Central Region Small and Medium Towns Development Project FINAL REPORT Appendix 22, page 37
June 2006
Table A22-5. Climate Details Annual Averages Per Province Climate Indicators Phu Yen1 Khanh Hoa2 Ninh Thuan3 Binh Thuan4 Dak Nong5
Temperature 26-27oC 26-27oC 26-27oC 26-27oC 22oC Amount of sunny hours 2,700-2,800 hrs 2,700-2,800 hrs 2,700-2,800 hrs 2,900 hrs 2,300 hrs Rainfall 1,200-2,300 mm 1,800-2,100 mm 750 – 800 mm 1,400 mm** 2,000-2,400 mm Relative humidity 80-82 % 80-82 % 80-82 % 82 % 80-82 % Evaporation 1,000-1,200 mm 1,000-1,200 mm 1,000-1,200 mm 1,200 mm 1,000 mm
Sources: 1 Report on State of Environment of Phu Yen Province, May 2004, DONRE Phu Yen rainfall data taken from Vol. 4, Rural Energy 11 Project Central Region: Works in Phu Yen Province Environmental
Assessment, by Power Design Centre, Da Nang and Roop and Associates, Hanoi for Power Company No. 3, Da Nang, March 2004. 2 Report on State of Environment of Khanh Hoa Province, May 2004, DONRE. 3 Report on State of Environment of Ninh Thuan Province, 2005, DONRE. 4 Hydro-Meteorology Station in South Central Region, 2004. 5 Report on State of Environment of Dak Nong Province, June 2005, DONRE.
Table A22-6. Air Quality and Noise Levels PROVINCE City/Town
Suspended Dust (mg/m3)
NO2 (mg/m3)
SO2 (mg/m3)
Noise (dBA)
PHU YEN Data not available KHANH HOA Van Gia 0.53 0.005 0.043 79.5 Ninh Hoa 0.53 0.005 0.048 70.2 Cam Ranh 0.58 0.005 0.040 74.3 NINH THUAN Thap Cham Data not available 80.0 BINH THUAN Phan Thiet Data not available 58.0-70.0 DAK NONG Ea Tling 0.39 0.015 0.100 65.0 Dak Mam 0.38 0.015 0.100 62.0 Gia Nghia 0.40 0.040 0.280 75.0 Quang Khe 0.40 0.040 0.280 72.0 VN Standards Hourly Average 0.30 0.400 0.500
Day, Peak Hrs and Night 70.0
Sources: Reports on State of Environment of Khanh Hoa, Ninh Thuan, Binh Thuan and Dak Nong, 2004-2005, DONREs TCVN 5937 – 1995.

TA 4485-VIE: Central Region Small and Medium Towns Development Project FINAL REPORT Appendix 22, page 38
June 2006
Table A22-7. Water Quality at Proposed/Existing Water Supply Intake Points
Values Khanh Hoa Ninh Thuan Dak Nong Parameters Unit Ninh Hoa Thap Cham
(for Ca Na) Tan Son EaTlinh Dak Mam Gia Nghia VN Standard*
1 pH mg/l 7.32 7,87 7.8 7.3 7.3 7.1 6.0-8.5 2 Chloride mg/l 30.5 16.3 14.2 11.4 7.1 7.1 300 3 Nitrate NO3 mg/l 2.15 3.23 1.87 1.06 2.24 0.39 50 4 Nitrite NO2
- mg/l <0.01 <0.01 <0.01 <0.01 <0.01 <0.01 3 5 NH4
+ mg/l <0.01 0.14 <0.01 0.25 <0.01 0.14 3 6 Hardness (Ca++/l) mg/l 50.4 24.8 41 16 20 9 350 7 Suspended solid (SS) mg/l 25 171 113 76 44 30 20 (MONRE) 8 Total Fe mg/l 0.18 0.09 0.10 <0.01 <0.01 <0.01 0.5 9 Sulphate SO4
-- mg/l 27 10 6 2 4 <0.1 10 Manganese mg/l 0.031 <0.001 <0.001 0.059 0.032 0.023 0.5 11 Cyanide mg/l <0.01 <0.01 <0.01 <0.01 <0.01 <0.01 0.07 12 Mercury mg/l <0.001 <0.001 <0.001 <0.001 <0.001 <0.001 0.001 13 Phenol µg/l ND ND ND N.D ND N.D 14 Copper (Cu) mg/l <0.001 <0.001 <0.001 <0.001 <0.001 <0.001 2 15 Lead Pb mg/l <0.001 <0.001 <0.001 <0.001 <0.001 <0.001 0.01 16 Fluoride F mg/l 0.42 1.23 0.7 0.65 1.3 0.13 1.5 17 Aluminum mg/l 0.366 5.1 2.68 1.192 1.902 0.073 18 Arsenic mg/l <0.001 <0.001 <0.001 <0.001 <0.001 <0.001 0.05 19 Chroma mg/l <0.001 <0.001 <0.001 <0.001 <0.001 <0.001 300 20 Cadmium mg/l <0.001 <0.001 <0.001 <0.001 <0.001 <0.001 21 Selenic mg/l <0.001 <0.001 <0.001 <0.001 <0.001 <0.001 22 Coliform MPN/100 ml 1600 180 1600 50 23 E. Coli MPN/100 ml 70 8 920 NA
Date of Analysis 03 Nov. ‘05 27 Oct. ‘05 27 Oct. ‘05 12 Oct. ‘05 12 Oct. ‘05 12 Oct. ‘05 Sample Location Name of River Dinh
(existing) Dinh
(existing) Ong
(existing) Serepok
(Proposed) Dak Ro
(Proposed) Dak Tik
(Proposed)
Sources: Water Quality Analyses by Faculty of Community Health of Pasteur Institute (arranged by the Project Preparation Team) TCVN 1329 BYT 2005 for the standards for quality of raw water for domestic water supply.

TA 4485-VIE: Central Region Small and Medium Towns Development Project FINAL REPORT Appendix 22, page 39
June 2006
Table A22-8.Water Quality At Existing Drainage Outfalls And Proposed WSP Outfalls Values
pH BOD5 DO SS NO3 Animal/
Vegetable Fat and
Oil PO4 Coliform E.Coli
Province Town Location
mg/l mg/l mg/l mg/l mg/l mg/l MPN/100 ml MPN/100 ml
Tran Phu Culvert
7.86
38.00
8.60
145.00
0.90
ND
0.15
43 x 106
23 x 106
Phu Yen Tuy Hoa1 Nguyen Trai 7.56 46.00 8.70 110.00 0.60 4.40 2.50 4 x 10⁶ 4 x 10⁵
Duy Tan 7.50 10.00 7.30 105.00 0.60 ND 0.26 2.4 x 10⁶ 9.3 x 10⁴ Hung Vuong 7.18 36.00 8.20 123.00 0.20 3.60 1.78 4 x 10⁶ 23 x 105 Tran Hung Dao 7.31 8.00 7.80 115.00 0.50 0.80 0.11 9 x 10⁸ 7 x 10⁸ Da Rang Bridge/Da Rang River* 7.58 6.00 7.20 241.00 1.50 12.4 0.32 11 x 108 4 x 10⁶ Bau Ha Estuary/Da Rang River 7.55 25.00 7.50 227.00 0.60 16.80 0.22 210 x 108 23 x 106
Tra Long Bridge
7.70
7.00
7.40
78.00
<0.01
ND
0.02
17 x 104
9 x 10⁴
Khanh Hoa Cam Ranh2 Cultural House Stadium 7.40 15.00 7.10 87.00 1.18 ND 0.34 6 x 10⁴ 4 x 10⁴
Ba Ngoi River 7.85 6.00 7.40 55.00 <0.01 ND 0.03 4 x 10⁴ 2 x 10⁴ Cam Ranh Bay* 7.80 2.60 8.82 37.10 14.1 x 10⁴
Ninh Thuan Thap Cham
end of Dinh River*
7.50
1.50
5.70
0.20
3,247 x 104
Ly Thuong Kiet (Culvert)
6.95
71.00
4.00
113.00
<0.01
14.80
17.30
3,500 x 104
2,100 x 104
Tran Hung Dao (Culvert) 7.60 34.00 7.70 78.00 0.92 4.80 2.02 2,800 x 104 110 x 104 So Muoi Bridge, Cau Ke Canal 7.30 5.00 6.80 106.00 <0.01 5.60 0.35 140 x 104 95 x 104
Cau Ke Canal at Ben Loi Bridge 7.20 7.00 7.30 156.00 0.91 6.00 0.35 140 x 104 70 x 104 Cau Ke Canal at WSP-Stage 2* 7.37 9.00 7.60 208.0 <0.01 1.6 0.36 54 x 104 32 x 104
Binh Thuan Phan Thiet1
Ca Ty River at WSP-Stage 1* 7.52 4.00 7.70 160.0 0.81 6.8 0.10 64 x 104 48 x 104
VN Standard-Level I 6772-2000
5-9
30.00
NA
50.00
30.00
20.0
6.00
1,000
NA
* Proposed outfall for proposed WSPs under the Project. 1. Water Quality Analyses by Faculty of Community Health of Pasteur Institute (arranged by the Project Preparation Team). Analyses dates: 9 Sep ’05 for Tuy Hoa, 4 Oct ’05 for Cam Ranh, 7 Oct ’05 for
Binh Thuan. 2. Data obtained from Status of Environment-Khanh Hoa 2004.

TA 4485-VIE: Central Region Small and Medium Towns Development Project FINAL REPORT Appendix 22, page 40
June 2006
Table A22-9. Existing and Proposed Protected Areas PROVINCE/Name of Area (Location)* Land Area*
(ha) Proximity to Subcomponents
PHU YEN
- Krong Trai Nature Reserve 22,290 - >30 km to Tuy Hoa WSP (Son Hoi Commune, Son Hoa District) - >80 km to Song Cau SL - Deo Ca-Hon Nua Cultural and Historical Site 8,876 - 40 km to Tuy Hoa WSP (Tuy Hoa District) - 100 km to Song Cau SL - Proposed O Loan Marine Protected Area 2,650 - 25 km to Tuy Hoa WSP (Tuy An District, nearby waters and Mai Nha Island) - 35 km to Song Cau SL KHANH HOA
- Proposed Thuy Trieu Marine Protected Area 5,000 - >10 km to Cam Ranh WSP (N of Cam Ranh Bay) - > 20 km to Cam Ranh SL - Porposed Nha Phu-Hon Heu Marine Protected Area 5,600 - >20 km to Ninh Hoa WTP (Ninh Hoa District) - 20 km to Van Gia SL - Proposed Hon Mun Marine Protected Area 10,500 - > 60 km to Van Gia Town (SE of Nha Trang City) - > 60 km to Ninh Hoa Town NINH THUAN
- Nui Chua Nature Park 25,013 - 20 km to Thap Cham WSP (Khanh Hiep-Khanh Hai Communes, Ninh Hai District) - 50 km to Ca Na PSs - 35 km to Tan Son WTP - Phuoc Binh Nature Reserve 19,814 - 60 km to Thap Cham WSP (Bac Ai District) - 80 km to Ca Na PSs - 20 km to Tan Son WTP - Nai Marine Protected Area 1,000 Very far from all subcomponents (Nai Lagoon, Ninh Hai District) BINH THUAN
- Nui Ong Nature Reserve 25,500 - 40 km (South Ham Thuan and Tanh Linh Districts) - Kalon-Song Mao Nature Reserve 20,000 - > 80 km (Phan Lam Commune, Bac Binh District) - Ta Kou Nature Reserve 11,886 - > 30 km (South Ham Thuan District) - Proposed Hon Cau-Vinh Hao Marine Protected Area 12,500 - So far from Phan Thiet (Cu Lao Hon Island in Ca Na Bay) - Proposed Dau Phu Quy Marine Protected Area 18,980 - ~100 km from Mainland (Phu Quy Island) DAK NONG
- Nam Ca 24,555 - 60 km to Gia Nghia SL (Krong No District) - 50 km to Ea Tling WTP - 40 km to Dak Mam WTP - Nam Nung 10,849 - 45 km to Gia Nghia SL (Dak Nong and Krong No Districts) - 50 km to Quang Khe WTP - 20 km to Dak Mam WTP - 40 km to Ea Tling WTP - Ta Dung 18,893 - 40 km to Gia Nghia SL (Dak Nong District) - 30 km to Quang Khe WTP - 80 km to Dak Mam WTP - 100 km to Ea Tling WTP
*www.birdlifeindochina.org/source_book

TA 4485-VIE: Central Region Small and Medium Towns Development Project FINAL REPORT Appendix 22, page 41
June 2006
Table A22-10. Screening of Potential Issues/Concerns Relative To Siting - Water Supply Development And Expansion* Assessed Magnitude of Issues/Concerns
Phu Yen Khanh Hoa Ninh Thuan Binh Thuan Dak Nong Issues/Concerns
SC TH VG NH CR TC CN TS PT ET DM GN QK 1 Pollution of raw water supply from upstream
discharges. - N-L - N-L L L L L
2 Water use conflicts. N N N N N N N N 3 Proximity to, capacity of, stream to receive backwash
overflow. - N-L
- N-L
N-L N-L N-L N-L
4 Vulnerability to flooding. N N N N N N N N 5 Earthquake damage risk/proximity to fault line. N-L N-L N-L N-L N-L N-L N-L N-L 6 Vulnerability to erosion/landslide/land subsidence. N N N N N-L N-L N-L N-L 7 Proximity to environmentally sensitive area. N N N N N N N N 8 Proximity to ethnic minority community. N N N N
N N N
9 Proximity to natural habitats. N N N N N N N N 10 Proximity to cultural property. N N N N N N N N 11 Deteriorating/unprotected water catchment area. - N-L - N-L N-L N-L N-L N-L 12 Area densely populated/heavy with urban activities. L N-L L M N N N N 13 Area densely populated/heavy with urban activities. L N L M N N N N 14 Land acquisition requirements and displacement of
local residents. L L M L N L L L
15 Conflict of proposed use with Town’s Master Plan. N N N N N N N N 16 Accessibility to trunk infrastructure:
- Access road N L L N N N N N - Power supply N L L N N N N N
*Screening applies to screening of proposed sites for water intake and treatment structures, and transmission pipelines SC-Song Cau, TH=Tuy Hoa, VG-Van Gia, NH-Ninh Hoa, CR-Cam Ranh, TC-Thap Cham, CN-Ca Na, TS-Tan Son, PT-Phan Thiet, EA-Ea Tling, DK-Dak Mam, GN-Gia Nghia, QK-Quang Khe N-Not a concern/negligible, L-Low, M-Moderate, H-High

TA 4485-VIE: Central Region Small and Medium Towns Development Project FINAL REPORT Appendix 22, page 42
June 2006
Table A22-11. Screening of Potential Issues/Concerns Relative To Siting - Drainage and Wastewater Management Assessed Magnitude of Issues/Concerns
Phu Yen Khanh Hoa Ninh Thuan Binh Thuan Dak Nong Issues/Concerns
SC^ TH VG NH CR TC CN TS PT ET^ DM^ GN QK^ 1 WSP’s proximity to human settlement. - M L H L - - - -
2 WSP’s proximity to environmentally sensitive areas/ areas with aesthetic value.
- N N N N - - - -
3 WSP’s proximity to ethnic minority community. - N N N N - - - - 4 WSP’s proximity to natural habitats. - N N N N - - - - 5 WSP’s proximity to cultural property. - N N N N - - - - 6 WSPs proximity to ground water systems used as
potable water sources. - L-M N-L L-M L - - - -
7 Vulnerability to flooding. - N-L L-M N N-L - - - - 8 Earthquake damage risk/proximity to fault line. - N-L N-L N-L N-L - - - - 9 Insufficiency of land size to include required buffer
zone and for future expansion. - N N N N - - - -
10 Land acquisition requirements and displacement of local residents.
- M M H M - - - -
11 Conflict of proposed use of site with Town’s Development Master Plan.
- N N N N - - - -
12 Combined drains and sewers, interfering with waterlines.
N L L L L N N L N
13 Insufficient land size for wastewater PSs and WSP to include buffer zone for security and for safeguard against nuisance to neighbors.
- N N N N - - N -
14 Inadequate access for maintenance, particularly of wastewater PSs and WSP.
- N N N N - - N -
15 Proximity to, and capacity of, water body to receive effluent from combined drainage and wastewater system.
- N-L N-L N-L L - - - -
16 Accessibility to trunk infrastructure: - Road - N L N N - - - -
- Water supply - N N N N - - - - - Power supply - N N N N - - - -
^Small-scale drainage works. SC-Song Cau, TH=Tuy Hoa, VG-Van Gia, NH-Ninh Hoa, CR-Cam Ranh, TC-Thap Cham, CN-Ca Na, TS-Tan Son, PT-Phan Thiet, EA-Ea Tling, DK-Dak Mam, GN-Gia Nghia, QK-Quang Khe N-Not a concern/negligible, L-Low, M-Moderate, H-High

TA 4485-VIE: Central Region Small and Medium Towns Development Project FINAL REPORT Appendix 22, page 43
June 2006
Table A22-12. Screening of Potential Issues/Concerns Relative To Siting - Solid Waste Management* Assessed Magnitude of Issues/Concerns
Phu Yen Khanh Hoa Ninh Thuan Binh Thuan Dak Nong Issues/Concerns
SC TH VG NH^ CR TC CN TS PT ET^ DM^ GN QK 1 Proximity to human settlement. N N - N - - N
2 Proximity to environmentally sensitive areas/areas with aesthetic value.
N N - N - - N
3 Proximity to ethnic minority community. N N - N - - N
4 Proximity to natural habitats. N N - N - - N
5 Proximity to cultural property. N N - N - - N
6 Proximity to ground water systems used as potable water sources.
N N - N - - N
7 Shallow water table. N N - N - - N
8 Upstream of (and in close proximity to) a reservoir or dam for water supply.
N N - N - - N
9 Vulnerability to flooding. N N - N - - N
10 Earthquake damage risk/proximity to fault line. N-L N-L - N-L - - N-L
11 Vulnerability to erosion/landslide. N N - N - - N
12 Underlying porous rock formations. N N - N - - N
13 Insufficiency of land size to include required buffer zone and for future expansion.
N N - N - - N
14 Land acquisition requirements and displacement of local residents.
L L - L - - L
15 Conflict of proposed use of site with Town’s Development Master Plan.
N N - N - - N
16 Access to soil cover material. N-L N-L - N-L - - N-L
17 Proximity to airport. N N - N - - N
18 Major water, gas, power or communication line crossing the site.
N N - N - - N
19 Accessibility to trunk infrastructure:
- Road N L - L - - L
- Water supply H H - H - - H
- Power supply L L - L - - L *Screening applies to screening of proposed sites for sanitary landfill. ^Subcomponent involves only acquisition of storage bins, handcarts, and compactor trucks. SC-Song Cau, TH=Tuy Hoa, VG-Van Gia, NH-Ninh Hoa, CR-Cam Ranh, TC-Thap Cham, CN-Ca Na, TS-Tan Son, PT-Phan Thiet, EA-Ea Tling, DK-Dak Mam, GN-Gia Nghia, QK-Quang Khe N-Not a concern/negligible, L-Low, M-Moderate, H-High

TA 4485-VIE: Central Region Small and Medium Towns Development Project FINAL REPORT Appendix 22, page 44
June 2006
Table A22-13. Screening of Potential Issues/Impacts During Construction - Water Supply Development and Expansion Assessed Magnitude of Issues/Concerns
Phu Yen Khanh Hoa Ninh Thuan Binh Thuan Dak Nong Issues/Concerns
SC TH VG NH CR TC CN TS PT ET DM GN QK 1 Physical/Chemical Environment
1.1 Air Quality - total suspended particles L L-M L L M L M L - gas emissions N-L L-M L L L L L L - odor N-L N-L N L N-L N-L N-L N-L - noise L L-M L-M L-M L L L L 1.2 Water resources and quality
- degeneration of surface water L L-M N-L N-L L L L L - generation of sewage/wastewater L L-M L L L L M L - generation of solid wastes L L-M L L L L M L - generation of hazardous wastes L L N-L N-L L L L L - siltation/erosion L L-M L L L L M L
2 Biological Environment
- impairment of marine/other natural habitats N N N N N N N N - loss of vegetation N N N N N N N N
3 Socioeconomic Environment
- traffic N-L L-M L L L L M L - public inconveniences L L-M L L L L M L - disruption of socioeconomic activities N L N-L N-L N-L N-L L N-L - health hazard N-L N-L L L N-L N-L N-L N-L - accidents and safety hazard N-L L L L N-L N-L L N-L +short-term employment of local population L L L L-M L-M L-M M L-M +increased earnings of micro-enterprises L L L L L L L-M L
SC-Song Cau, TH=Tuy Hoa, VG-Van Gia, NH-Ninh Hoa, CR-Cam Ranh, TC-Thap Cham, CN-Ca Na, TS-Tan Son, PT-Phan Thiet, EA-Ea Tling, DK-Dak Mam, GN-Gia Nghia, QK-Quang Khe N-Not a concern/negligible, L-Low, M-Moderate, H-High

TA 4485-VIE: Central Region Small and Medium Towns Development Project FINAL REPORT Appendix 22, page 45
June 2006
Table A22-14. Screening of Potential Issues/Impacts During Construction - Drainage And Wastewater Management Assessed Magnitude of Issues/Concerns
Phu Yen Khanh Hoa Ninh Thuan Binh Thuan Dak Nong Issues/Concerns
SC TH VG NH CR TC CN TS PT ET DM GN QK 1 Physical/Chemical Environment
1.1 Air Quality - total suspended particles L L-M L-M M-H L-M L L H L - gas emissions L L-M L L L-M L L M L - odor N-L N-L L L N-L N-L N-L N-L N-L - noise L-M L-M L-M L-M L-M L L L L 1.2 Water resources and quality - degeneration of surface water L L-M L-M L-M L-M L L L L - generation of sewage/wastewater L L-M L-M L-M L-M L L M L - generation of solid wastes L L-M L-M L-M M-H L L M L - generation of hazardous wastes L L L L N-L L L L L - siltation/erosion L L-M L-M L-M L-M L L L L 2 Biological Environment
- impairment of marine/other natural habitats N N N N N N N N N - loss of vegetation N N N-L N-L N N N N N
3 Socioeconomic Environment
- traffic L L-M L-M L-M L-M N-L N-L L N-L - public inconveniences N-L L-M L-M L-M L-M L L L L - disruption of socioeconomic activities N-L L L L L-M N-L N-L L N-L - health hazard N-L N-L L L N-L N-L N-L N-L N-L - accidents and safety hazard L L L L L L L L L +short-term employment of local population L L L L L-M L L L-M L +increased earnings of micro-enterprises L L L L L-M L L L-M L
SC-Song Cau, TH=Tuy Hoa, VG-Van Gia, NH-Ninh Hoa, CR-Cam Ranh, TC-Thap Cham, CN-Ca Na, TS-Tan Son, PT-Phan Thiet, EA-Ea Tling, DK-Dak Mam, GN-Gia Nghia, QK-Quang Khe N-Not a concern/negligible, L-Low, M-Moderate, H-High

TA 4485-VIE: Central Region Small and Medium Towns Development Project FINAL REPORT Appendix 22, page 46
June 2006
Table A22-15. Screening of Potential Issues/Impacts During Construction - Solid Waste Management Assessed Magnitude of Issues/Concerns
Phu Yen Khanh Hoa Ninh Thuan Binh Thuan Dak Nong Issues/Concerns
SC TH VG NH* CR TC CN TS PT ET* DM* GN QK 1 Physical/Chemical Environment
1.1 Air Quality - total suspended particles L L - L - - L - gas emissions L L - L - - L - odor L L - L - - L - noise L L - L - - L 1.2 Water resources and quality - degeneration of surface water L L - L - - L - generation of sewage/wastewater L L - L - - L - generation of solid wastes L L - L - - L - generation of hazardous wastes L L - L - - L - siltation/erosion L-M L-M - L-M - - M 2 Biological Environment
- impairment of marine/other natural habitats N N - N - - N - loss of vegetation N L - L - - N
3 Socioeconomic Environment
- traffic N N - N - - N - public inconveniences N N - N - - N - disruption of socioeconomic activities N N - N - - N - health hazard N-L N-L - N-L - - N-L - accidents and safety hazard N-L N-L - N-L - - L +short-term employment of local population L N-L - N-L - - L +increased earnings of micro-enterprises N N - N - - N-L
*Involve only improvement in storage, collection and transport. SC-Song Cau, TH=Tuy Hoa, VG-Van Gia, NH-Ninh Hoa, CR-Cam Ranh, TC-Thap Cham, CN-Ca Na, TS-Tan Son, PT-Phan Thiet, EA-Ea Tling, DK-Dak Mam, GN-Gia Nghia, QK-Quang Khe N-Not a concern/negligible, L-Low, M-Moderate, H-High

TA 4485-VIE: Central Region Small and Medium Towns Development Project FINAL REPORT Appendix 22, page 47
June 2006
Table A22-16. Screening of Potential Issues/Impacts During Operation - Water Supply Development and Expansion Assessed Magnitude of Issues/Concerns
Phu Yen Khanh Hoa Ninh Thuan Binh Thuan Dak Nong Issues/Concerns
SC TH VG NH* CR TC CN TS PT ET* DM* GN QK 1 Physical/Chemical Environment
1.1 Air Quality (-) Total suspended particles N N N N N N N N (-) Gas emissions N N N N N N N N (-) Odor N N N N N N N N (-) Noise N N N N N N N N 1.2 Water resources and quality (-) Degeneration of surface water N N N N L L L L (-) Degeneration of ground water N N N N N N N N (-) Increased generation of sewage/wastewater L M L-M M L L L L (-) Increased generation of solid waste N-L N-L N-L N-L N N N N (-) Generation of hazardous waste N N N N N-L N-L N-L N-L 2 Biological Environment
(-) Impairment of marine/other natural habitats N N N N N-L N-L N-L N-L 3 Socioeconomic Environment
(-) Health hazard from unsafe water/depreciated treated water quality
N-L N-L N-L N-L L L L L
(-) Health/safety hazards (e.g., from poor
handling of disinfectants and if applicable, other chemicals)
N N-L N N-L L L L L
(-) Nuisance to affected properties from improper disposal of sludge
N N-L N N-L L L L L
(-) Frequent disruption of, inefficiency in, service
delivery due to poor O&M, inadequate institutional and financial capacities
N-L N-L N-L N-L N-L N-L N-L N-L
(-) Reduced earnings/loss of livelihood of water vendors
N-L L M-H L-M L-M L-M L-M L-M
(+) Improved environmental sanitation H H H H H H H H (+) Improved public health H H H H H H H H
(+) Induced socioeconomic growth and rising demand for basic infrastructures
H H H H H H H H
(+) Impact on land use and development planning H H H H H H H H SC-Song Cau, TH=Tuy Hoa, VG-Van Gia, NH-Ninh Hoa, CR-Cam Ranh, TC-Thap Cham, CN-Ca Na, TS-Tan Son, PT-Phan Thiet, EA-Ea Tling, DK-Dak Mam, GN-Gia Nghia, QK-Quang Khe N-Not a concern/negligible, L-Low, M-Moderate, H-High

TA 4485-VIE: Central Region Small and Medium Towns Development Project FINAL REPORT Appendix 22, page 48
June 2006
Table A22-17. Screening of Potential Issues/Impacts During Operation – Drainage and Wastewater Management Assessed Magnitude of Issues/Concerns
Phu Yen Khanh Hoa Ninh Thuan Binh Thuan Dak Nong Issues/Concerns
SC TH VG NH* CR TC CN TS PT ET* DM* GN QK 1 Physical/Chemical Environment
1.1 Air Quality (-) Total suspended particles N N N N N N N N N (-) Gas emissions N-L N-L N-L N-L N-L N-L N-L N-L N-L (-) Odor N-L N-L L-M L-M N-L N-L N-L N-L N-L (-) Noise N N N N N N N N N 1.2 Water resources and quality (-) Degeneration of surface water L L L L N-L L L L L
(-) Degeneration of aquifers/groundwater systems used as potable water sources
N N N-L N-L N N N N N
2 Biological Environment
(-) Impairment of marine/other natural habitats L L L N-L N-L L L L L 3 Socioeconomic Environment
(-) Accidents and/or safety hazards N N N N N N N N N
(-) Nuisance to neighboring areas (influx of pests, insects, etc)
N-L N-L L N-L N-L N-L N-L N-L N-L
(-) Overflows and flooding of neighboring properties with raw sewage
N-L N-L L L N-L N-L N-L N-L N-L
(-) Nuisance to properties/communities from improper disposal of sludge
N N L L N N-L N-L N-L N-L
(-) Public health hazard from overflow flooding N-L N-L L L N-L N-L N-L L N-L
(-) Health hazard from hazardous materials and exposure to pathogens in sewage flow
N N N-L L N N-L N-L L N-L
(-) Malfunction of system due to poor O&M, inadequate institutional/financial capacities
N-L N-L N-L N-L N-L N-L N-L N-L N-L
(+) Reduced incidence of water-borne diseases H H M-H M-H H H H H H
(+) Induced socioeconomic growth and rising demand for basic infrastructures
H H M-H M-H H L-M L-M M-H L-M
(+) Impact on land use and development planning H H M-H M-H H L-M L-M M-H L-M
(+) Improved environmental sanitation and public health (reduced/eliminated flooding)
H H H H H L-M L-M M-H L-M
SC-Song Cau, TH=Tuy Hoa, VG-Van Gia, NH-Ninh Hoa, CR-Cam Ranh, TC-Thap Cham, CN-Ca Na, TS-Tan Son, PT-Phan Thiet, EA-Ea Tling, DK-Dak Mam, GN-Gia Nghia, QK-Quang Khe N-Not a concern/negligible, L-Low, M-Moderate, H-High

TA 4485-VIE: Central Region Small and Medium Towns Development Project FINAL REPORT Appendix 22, page 49
June 2006
Table A22-18. Screening Of Potential Issues/Impacts During Operation – Solid Waste Management Assessed Magnitude of Issues/Concerns
Phu Yen Khanh Hoa Ninh Thuan Binh Thuan Dak Nong Issues/Concerns
SC TH VG NH* CR TC CN TS PT ET* DM* GN QK 1 Physical/Chemical Environment
1.1 Air Quality (-) Total suspended particles N N N N N N N (-) Gas emissions N-L L N L N N L (-) Odor N L N L N N N (-) Noise N N N N N N L 1.2 Water resources and quality (-) Degeneration of surface water N-L L N L N N L (-) Degeneration of ground water N-L L N L N N L
(-) Increased generation of sewage/ leachate/ wastewater
N-L L N L N N L
2 Biological Environment
(-) Impairment of marine/other natural habitats N-L L N L N N N-L 3 Socioeconomic Environment
(-) Nuisance to neighboring areas (influx of pests, insects)
N N N N N N N
(-) Health hazard from odor, smoke, diseases transmitted by pests, birds, insects
N-L N-L N N-L N N N-L
(-) Accidents and/or safety hazard (fire and explosion, hazardous wastes)
L L N L N N L
(-) Health hazard from inadequate management
caused by inadequate financial and institutional capacities
L L N L N N L
(-) Visual blight caused by wind-blown litters from SW trucks while enroute to landfill
N N N N N N N
(-) Frequent disruption of, inefficiency in, service
delivery due to poor O&M, inadequate institutional and financial capacities
L L L L L L L
(-) Loss of livelihood of waste pickers L L N L N N L (+) Improved environmental sanitation H H H H M M H (+) Reduced/eliminated flooding incidence H H H H M M H
(+) Induced socioeconomic growth and rising demand for basic infrastructures
H H H H M M H
SC-Song Cau, TH=Tuy Hoa, VG-Van Gia, NH-Ninh Hoa, CR-Cam Ranh, TC-Thap Cham, CN-Ca Na, TS-Tan Son, PT-Phan Thiet, EA-Ea Tling, DK-Dak Mam, GN-Gia Nghia, QK-Quang Khe N-Not a concern/negligible, L-Low, M-Moderate, H-High

TA 4485-VIE: Central Region Small and Medium Towns Development Project FINAL REPORT Appendix 22, page 50
June 2006
Table A22-19. Environmental Monitoring Plan A. Pre-Constructions Phase
Mitigation Monitoring Potential Impact Proposed Measures Responsible
Entity Activity Responsible Entity
1
Land acquisition and displacement
• Preparation and implementation of a Resettlement Plan through a participatory process.
• Full payment of compensation to adversely affected HHs prior to land acquisition.
• Complete resettlement of adversely affected HHs prior to awarding of contract to winning bidder for construction and clearing of site.
PPMU and Resettlement Committees (RCs)
• Monitoring of implementation
of RP, based on implementation schedule of RP.
• Review of submitted PPMU and RC Progress Reports.
EMA-R PPC
B. Construction Phase
Mitigation Monitoring Potential Impact Proposed Measures Responsible
Entity Activity Responsible Entity
PHYSICAL/CHEMICAL ENVIRONMENT Air Quality 1 Total suspended particles. • Dust control measures:
- Regular watering of exposed areas - Removing soil /mud from tires of vehicles leaving the sites - Covering of hauling trucks with canvass
• Sufficiently high temporary fence around construction sites of WTP and WSP that are in close proximity to residences and institutions.
2
Gas emissions
• Sufficiently high temporary fence around construction sites of
WTP and WSP that are in close proximity residences and institutions.
• Use of practicable available technologies that emit least pollutants and adjusting of operational procedures to reduce pollutants.
• Proper and prompt maintenance of construction equipment. • Traffic mitigation measures (No. 11 below).
Contractor
• Periodic (plus in-between unannounced) inspection of construction activities.
• Air quality monitoring (quarterly and more frequent when complaints/issues arise).
EMU-PPMU, PIA Consultants and DONRE*
3
Odor
• Sufficiently high temporary fence around construction sites of
WTP and WSP that are in close proximity residences and institutions.
Contractor • Periodic (plus in-between
unannounced) inspection of construction activities.
EMU-PPMU, PIA Consultants and DONRE*

TA 4485-VIE: Central Region Small and Medium Towns Development Project FINAL REPORT Appendix 22, page 51
June 2006
Mitigation Monitoring Potential Impact Proposed Measures Responsible
Entity Activity Responsible Entity
• Use of practicable available technologies that emit least pollutants and adjusting operational procedures to reduce pollutants.
• Proper and prompt maintenance of construction equipment. • Adequate temporary toilet facilities with adequate water supply
and strictly enforce proper sanitation. • Temporary disposal system for solid and hazardous wastes.
• Daily when complaints/issues arise until odor resolved.
4
Noise
• Sufficiently high temporary fence around construction sites of
WTP and WSP that are in close proximity to residences and institutions.
• Restrictions in use of noisy equipment between 7:00 PM and 7:00 A.M., as much as possible, in populated areas.
• Use of practicable available technologies that emit least noise and adjusting of operational procedures to reduce noise.
Contractor • Periodic (plus in-between
unannounced) inspection of construction activities.
• Noise level monitoring (quarterly or more frequent when issue arises).
EMU-PPMU, PIA Consultants and DONRE*
Water Quality
5 Degeneration/contamination of surface water resources.
• Suitable earthworks and stormwater management: - minimized disturbed areas - diversion drains and bunds, temporary silt traps/ponds - stockpiling of spoils in flat areas and far from drainage routes
• Disposing of unwanted spoils as soon as possible. • Adequate temporary toilet facilities with adequate water supply
and strict enforcement of proper sanitation. • Temporary disposal system for solid and hazardous wastes.
Contractor • Surface water quality monitoring (quarterly or more frequent when issue arises): - raw water source - backwash or effluent-
receiving streams
EMU-PPMU, PIA Consultants and DONRE*
6
Depreciation of groundwater resources.
• Adequate water supply to meet construction needs and setting up of rain catchment tanks.
• Adequate temporary toilet facilities with adequate water supply and strict enforcement of proper sanitation.
• Temporary disposal system for solid and hazardous wastes. • Provision of at least 4 strategically located groundwater
monitoring wells in SL site (1 upstream, 3 downstream).
Contractor • Groundwater quality
monitoring (from monitoring wells in SL site) (quarterly or more frequent when issue arises).
Contractor as part of their contract. EMU-PPMU, PIA Consultants and DONRE when issues arise.
7
Generation of sewage/ wastewater.
• Adequate water supply to meet construction needs and setting up of rain catchment tanks.
• Adequate temporary toilet facilities with adequate water supply and strict enforcement of proper sanitation.
Contractor • Periodic (plus in-between
unannounced) inspection of construction activities.
EMU-PPMU, PIA Consultants and DONRE*

TA 4485-VIE: Central Region Small and Medium Towns Development Project FINAL REPORT Appendix 22, page 52
June 2006
Mitigation Monitoring Potential Impact Proposed Measures Responsible
Entity Activity Responsible Entity
8
Generation of solid wastes. • Disposing of unwanted spoils as soon as possible.
• Temporary disposal system for solid and hazardous wastes. 9
Generation of hazardous waste. • Temporary disposal system for solid and hazardous wastes.
BIOLOGICAL ENVIRONMENT
10 Impairment of marine life, aquatic flora and fauna downstream.
• Suitable earthworks and stormwater management (No. 5 above). • Disposing of unwanted spoils as soon as possible. • Adequate temporary toilet facilities with adequate water supply. • Strict enforcement of proper sanitation. • Temporary disposal system for solid and hazardous wastes.
Contractor • Surface water quality monitoring (quarterly or more frequent when issue arises): - raw water source - backwash/effluent-receiving
streams
EMU-PPMU, PIA Consultants and DONRE*
11
Loss of vegetation • Limit land clearing as much as needed.
• Temporary fencing of vegetation that will be retained. • Signages to direct equipment traffic in site.
Contractor • Periodic (plus in-between
unannounced) inspection of construction activities.
EMU-PPMU, PIA Consultants and DONRE*
SOCIOECONOMIC ENVIRONMENT 11 Traffic • Disposing of unwanted spoils as soon as possible.
• Strict enforcement of traffic rules and regulations. • Installation of traffic aides in critical routes during peak hours. • Coordination of traffic management plan with town and commune/
ward officials. • Posting of prior notice on construction schedules and traffic
rerouting plan (at least a week prior to effective/implementation dates).
12
Public inconvenience • Sufficiently high temporary fence around construction sites of
WTP and WSP that are in close proximity to residences and institutions.
• Noise control measures (No. 4 above). • Disposing of unwanted spoils as soon as possible. • Traffic mitigation measures (No. 11 above). • Temporary access to temporarily affected residences and
institutions. • Close coordination with relevant utility companies/institutions
(water, power, drainage) on proposed alignments, construction phases and schedules.
Contractor • Periodic (plus in-between unannounced) inspection of construction activities.
• Review of minutes of coordination meetings between contractor and town/ward/commune officials (after every meeting held).
• Review of minutes of coordination meetings between contractor and water, power, drainage authorities (after every meeting held).
EMU-PPMU, PIA Consultants and DONRE*

TA 4485-VIE: Central Region Small and Medium Towns Development Project FINAL REPORT Appendix 22, page 53
June 2006
Mitigation Monitoring Potential Impact Proposed Measures Responsible
Entity Activity Responsible Entity
13
Disruption of socioeconomic activities.
• Traffic mitigation measures (No. 11 above). • Temporary access to temporarily affected residences and
institutions. • Close coordination with relevant utility companies/institutions
(water, power, drainage) on proposed alignments, construction phases and schedules.
14
Health hazard • Dust control measures (No. 1 above).
• Use of practicable available technologies that emit least noise and pollutants and adjusting of operational procedures to reduce noise and pollutants.
• Adequate temporary toilet facilities with adequate water supply • Strict enforcement of proper sanitation. • Temporary disposal system for solid and hazardous wastes.
15
Accidents and safety hazard • Sufficiently high temporary fence around construction sites of
WTP and WSP that are in close proximity to residences and institutions.
• Disposing of unwanted spoils as soon as possible. • Temporary disposal system for solid and hazardous wastes. • Traffic mitigation measures (No. 11 above). • Temporary access to temporarily affected residences and
institutions. • Provisions for adequate lighting, safe pedestrian access, storm
drains in construction sites. • Efficient emergency/contingency plans, adequate facilities and
equipment and trained staff for handling emergencies.
Contractor • Periodic (plus in-between
unannounced) inspection of construction activities.
EMU-PPMU, PIA Consultants and DONRE*

TA 4485-VIE: Central Region Small and Medium Towns Development Project FINAL REPORT Appendix 22, page 54
June 2006
B. Operation Phase Mitigation Monitoring
Potential Impact Proposed Measures Responsible
Entity Activity Responsible Entity
PHYSICAL/CHEMICAL ENVIRONMENT Air Quality 1 Gas emission • Keeping of all-weather access road to SL well-paved and
maintained. • Ensuring availability of sufficient soil cover daily at the SL, and a
well-planned and implemented system of soil cover sourcing and hauling.
• SL O&M Manual that incorporates efficient EMP that should be implemented.
SL Operator • Air quality monitoring - semi-annual and more frequent, when complaints/issues arise - monthly and more frequent when issue arises
- Concerned Agencies**, semi-annually - SL Operator (monthly) - DONRE*
2 Odor • Coordinated schedule of primary and secondary SW collection.
• Implement covering of active working cell in SL with soil daily. • Ensuring availability of sufficient soil cover daily at the SL, and a
well-planned and implemented system of soil cover sourcing and hauling.
• Maintaining dense planting in buffer zones of SLs and WSPs with insect repellant plants, and those that produce scented flowers.
Cooperatives, private collection service provider, SL and WSP Operators
• Periodic (plus in-between unannounced) inspection of SL operation.
Concerned Agencies** and DONRE*
3 Degeneration / contamination of
surface water resources • Haul and dispose of sludge from WTPs, WSPs and sewers to/at
the SL. • Dispose of sludge (from SL leachate treatment facility) in the
active working cell of the SL. • Stockpiling of SL soil cover material is flat areas and away from
natural drainage routes. • SL, WTP, DWM O&M Manuals that incorporates efficient EMP
that should be implemented. • Emergency/contingency plan and adequate facilities and
equipment and trained staff for handling emergencies.
SL, WSP and WTP Operators
4 Depreciation of groundwater
resources • Maintain groundwater monitoring wells, 4 in SLs (1 upstream and
3 downstream) and 2 in WSPs (1 upstream and 2 downstream). • SL and DWM O&M Manual that incorporates efficient EMP that
should be implemented. • Emergency/contingency plan and adequate facilities and
equipment and trained staff for handling emergencies.
SL and WSP Operators
• Monitoring of water quality of backwash/effluent/wastewater receiving streams (quarterly or more often when issue arises).
• Groundwater quality monitoring in SL and WSP vicinities (quarterly or more frequent when issue arises).
• Review of O&M Manual and emergency/contingency plan and inspection of sufficiency and efficiency of provided facilities and equipment and capabilities of staff to handle emergencies (prior to start of operation and yearly thereafter).
Concerned Agencies** (the SL Operator should also do their own water quality monitoring as part of their O&M) and DONRE*

TA 4485-VIE: Central Region Small and Medium Towns Development Project FINAL REPORT Appendix 22, page 55
June 2006
Mitigation Monitoring Potential Impact
Proposed Measures Responsible Entity Activity Responsible
Entity 5 Generation of sewage,
wastewater, leachate • Maintenance of peripheral drains around SL and WSPs and along
their access roads to ensure their efficiency. • Toilet facilities with adequate water supply. • Strict enforcement of proper sanitation practices. • Implement covering of active working cell in SL with soil daily. • Ensuring availability of sufficient soil cover daily at the SL, and a
well-planned and implemented system of soil cover sourcing and hauling.
• SL and DWM O&M Manuals that incorporates efficient EMP that should be implemented.
6 Generation of solid waste • Hauling and disposal of sludge from WTPs, WSPs and sewers to/at the SL.
• Disposal of sludge from leachate treatment facility at SL’s active working cell.
• SL, WTP and DWM O&M Manuals that incorporate efficient sludge management and EMP that should be implemented.
SL, WSP, WTP Operators
• Periodic (plus in-between unannounced) inspection of SL, and DWM operations.
• Review of O&M Manuals, (prior to start of operation and yearly thereafter for improvement).
Concerned Agencies** and DONRE*
7 Generation of hazardous waste (HW)
• Vigilance on entry of HW into SL and on wastes disposed of at SL.
• Vigilance on illegal connection of industrial wastewater systems to drains.
• Emergency/contingency plan in, and associated facilities and equipment for, handling HW.
SL and WSP Operators
• Periodic (plus in-between unannounced) inspection of SL operations and any new industrial constructions.
• Review of O&Ms and emergency/contingency plan and inspection of sufficiency and efficiency of provided facilities and equipment and capabilities of staff to handle emergencies prior to start of operation.
Concerned Agencies** and DONRE*
8 Impairment of marine life, aquatic flora and fauna downstream.
• Haul and dispose of sludge from WTPs, WSPs and sewers to/at the SL, SL, WTP and DWM O&M Manuals that incorporate efficient sludge management and EMP that should be implemented.
• Ensuring availability of sufficient soil cover daily at the SL, and a well-planned and implemented system of soil cover sourcing and hauling.
• Emergency/contingency plan and adequate facilities and equipment and trained staff for handling emergencies.
• Stockpiling of SL soil cover material is flat areas and away from natural drainage routes.
SL, WTP and WSP Operators
• Periodic (plus in-between unannounced) inspection of SL, WTP and DWM operations.
Concerned Agencies** and DONRE*

TA 4485-VIE: Central Region Small and Medium Towns Development Project FINAL REPORT Appendix 22, page 56
June 2006
Mitigation Monitoring Potential Impact
Proposed Measures Responsible Entity Activity Responsible
Entity 9 Nuisance to neighboring areas
from influx of insects, pests. • Coordinated schedule of primary and secondary SW collection to
avoid long time storage of primary-collected SW in collection points or waste storage stations.
• Implement covering of active working cell in SL with soil daily. • Ensuring availability of sufficient soil cover daily at the SL, and a
well-planned and implemented system of soil cover sourcing and hauling.
• Dense planting in buffer zones of SLs and WSPs with insect repellant plants.
• SL and DWM O&M Manuals that incorporates efficient EMP that should be implemented.
• Emergency/contingency plan and adequate facilities and equipment and trained staff for handling emergencies.
• 24-hour emergency call numbers for reporting complaints regarding water, drainage, wastewater and SW.
SL and WSP Operators
• Periodic (plus in-between unannounced) inspection of SL operation and waste storage stations.
• Review of O&M Manuals and emergency/contingency plan and inspection of sufficiency and efficiency of provided facilities and equipment and capabilities of staff to handle emergencies (prior to start of operation and yearly thereafter).
Concerned Agencies** and DONRE*
10 Nuisance from indiscriminate
disposal of sludge. • Haul and dispose of sludge from WTPs, WSPs and sewers to/at
the SL. • Disposal of sludge from leachate treatment facility at SL’s active
working cell. • SL, WTP and DWM O&M Manual that incorporates efficient
sludge management and EMP that should be implemented. • 24-hour emergency call numbers for reporting complaints
regarding water, drainage, wastewater and SW.
SL, WTP and WSP Operators
• Periodic (plus in-between unannounced) inspection of SL operation.
• Review of O&M Manuals, (prior to start of operation and yearly thereafter for improvement).
Concerned Agencies** and DONRE*

TA 4485-VIE: Central Region Small and Medium Towns Development Project FINAL REPORT Appendix 22, page 57
June 2006
Mitigation Monitoring Potential Impact
Proposed Measures Responsible Entity Activity Responsible
Entity 11 Public health hazard (unsafe
water, odor, smoke, insects/pests).
• Haul and dispose of sludge from WTPs, WSPs and sewers to/at the SL.
• Ensuring security of all SL, water intake structures, WTP, wastewater PSs from unauthorized entries.
• Coordinated schedule of primary and secondary SW collection to avoid long time storage of primary-collected SW in collection points.
• Dense planting in buffer zone of SLs and WSPs with insect repellant shrubs/trees, and those that produce scented flowers.
• SL, WTP and DWM O&M Manuals that incorporates efficient EMP that should be implemented.
• Emergency/contingency plan and adequate facilities and equipment and trained staff for handling emergencies.
• 24-hour emergency call numbers for reporting complaints regarding water, drainage, wastewater and SW.
12 Health hazard to operators (exposure to hazardous substances).
• Vigilance on entry of HW into SL and on wastes disposed of at SL.
• Vigilance on illegal connection of industrial wastewater systems to drains.
• Ensuring security of all SL, water intake structures, WTPs, WSPs wastewater PSs from unauthorized entries.
• Implement covering of active working cell in SL with soil daily. • SL, WTP and DWM O&M Manuals that incorporates safety rules
and regulations. • Strict observance of safety rules and regulations.
SL, WTP and WSP Operators
• Daily monitoring of treated water quality.
• Periodic (plus in-between unannounced) inspection of SL operation.
• Review of O&M Manuals and emergency/contingency plan and inspection of sufficiency and efficiency of provided facilities and equipment and capabilities of staff to handle emergencies (prior to start of operation and yearly thereafter.
WTP Operator,
DOH, Concerned Agencies** and
DONRE*
13 Overflows/flooding of neighboring areas with raw sewage.
• DWM O&M Manual that incorporates regular maintenance of system.
• Strict observance of safety rules and regulations. • Emergency/contingency plan and adequate facilities and
equipment and trained staff for handling emergencies. • 24-hour emergency call numbers for reporting complaints
regarding water, drainage, wastewater and SW.
WSP Operators • Periodic (plus in-between unannounced) inspection of SL operation and any new industrial development
• Review of emergency/ contingency plan and inspection of sufficiency and efficiency of provided facilities and equipment and capabilities of staff to handle emergencies prior to start of operation.
Concerned Agencies** and
DONRE*

TA 4485-VIE: Central Region Small and Medium Towns Development Project FINAL REPORT Appendix 22, page 58
June 2006
Mitigation Monitoring Potential Impact
Proposed Measures Responsible Entity Activity Responsible
Entity 14 Malfunctioning of systems/
disruption in service delivery • Keeping of all-weather access road to SLs, WTPs, WSPs, well-
paved and maintained. • Adequate peripheral drains around SL and along its access road • Ensuring security of all SL, water intake structures, WTP,
wastewater PSs from unauthorized entries. • Efficient SL, DWM and WSDE O&M manuals. • Emergency/contingency plan and adequate facilities and equipment
and trained staff for handling emergencies. • 24-hour emergency call numbers for reporting complaints regarding
water, drainage, wastewater and SW. • Maintaining qualified O&M staff, adequate training of staff,
adequate O&M budget.
SL, WTP, WSP Operators
• Periodic (plus in-between unannounced) inspection of SL, WTP and DWM operations.
• Review of emergency/ contingency plan and inspection of sufficiency and efficiency of provided facilities and equipment and capabilities of staff to handle emergencies (prior to start of operation and yearly thereafter.
Concerned Agencies** and DONRE*
15 Service inefficiency from inadequate institutional/ financial capacities.
• Hiring of qualified O&M personnel, adequate and regular staff training, sufficient O&M budget, prompt release of funds.
SWM, DWM, WS Operators
• Year-end assessment of service delivery performance vis-à-vis provided resources.
Concerned Agencies** and PPC
16 Accidents and safety hazard. • Keeping of all-weather access road to SLs, WSPs, WTPs well-paved and maintained.
• Ensuring security of all SLs, water intake structures, WTPs, WSPs, wastewater PSs from unauthorized entries.
• Coordinated schedule of primary and secondary SW collection to avoid long time storage of primary-collected SW in collection points.
• SL, WTP and DWM O&M Manuals that incorporates safety rules and regulations.
• Strict observance of safety rules and regulations. • 24-hour emergency call numbers for reporting complaints regarding
water, drainage, wastewater and SW.
SL, WSP, WTP Operators
• Daily monitoring of collection efficiency.
• Periodic (plus in-between unannounced) inspection of SL operation.
• Review of O&M Manuals, (prior to start of operation and yearly thereafter for improvement).
• Review of emergency/ contingency plan and inspection of sufficiency and efficiency of provided facilities and equipment and capabilities of staff to handle emergencies (prior to start of operation and yearly thereafter.
Concerned Agencies** and DONRE*
* DONRE to monitor only when complaints / issues arise. ** WSDandUPWC, DONRE Department of Natural Resources and Environment PPMU Provincial Project Management Unit EMA-R External Monitoring Agency for Resettlement PPC Provincial People’s Committee EMU Environmental Management Unit RC Resettlement Committee PIA Project Implementation Assistance

TA 4485-VIE: Central Region Small and Medium Towns Development Project FINAL REPORT Appendix 21, page 2
June 2006
Town Sub-component Scheme Element Land area
(hectares) Current land use, e.g. Rice,
forest, tree crops)
Ownership, e.g. government, commune,
private
Number of households
affected Comment
completion of FS.
Waste water treatment plant : site
A (original)
Grassland near river None (flood plain)
None
Alt. site B (downstream)
Coffee trees Private 3 households
Alt. Site C (near river)
Likely to be included as part of future project and thus will be excluded from
CSMT
Coffee trees Private 1 (rich) household likely to be relocated for construction of police/ army barracks
Originally two WWTPs but only 1 presented to Interim Workshop but alternatives proposed at workshop. Final decisions on number and location not yet available.
Drainage/ Wastewater treatment
Drainage network 40 km of primary & secondary
drains, interceptors,
pressure mains (up to 2.2m
width)
Urban and rural Primarily public rights of way
…… Impact likely to be minimal and temporary as these will be located along existing or newly constructed roads whose LAR impacts will be outside this project. The majority are also likely to be covered. Cannot be assessed until completion of FS.
WTP (2 alternatives under consideration) - Site A (near river)
2 has Inoperative brick factory Ea'tling PC None
Site B - on hill 2 has 6 brick factories and forest land.
Private/ public Around 6
Site A preferred by local authorities as impact/ acquisition costs of Site B expected to be much higher due to need for access road and relocation of electricity lines. Both sites still being considered
Water supply
Distribution network 11 km length Urban Existing or newly cons-
tructed roads
…. As for Gia Nghia distribution system
Eat Ling
Drainage (small scale)
Drainage network 2.3 km (new) + 0.6 km
rehabilitation
Urban Private at present but will become public
……. Minimal impact likely due to location along existing wide roads and roads yet to be built. Cannot be assessed until

TA 4485-VIE: Central Region Small and Medium Towns Development Project FINAL REPORT Appendix 21, page 3
June 2006
Town Sub-component Scheme Element Land area
(hectares) Current land use, e.g. Rice,
forest, tree crops)
Ownership, e.g. government, commune,
private
Number of households
affected Comment
completion of FS.
WTP 2 has Tree crops + foundations of 1 house
Private 5 An alternative is under consideration but is considered to be less favorable in LAR terms.
Water supply
Distribution network 8 km length Urban Existing or newly
constructed roads
…. As for Gia Nghia distribution system
Dak Mam
Drainage (small scale)
Drainage network 2.7 km Land is currently agricultural Private at present but will become public
……. As for Eat Ling drainage improvements.
WTP 1 hectare Uncultivated land + 3 houses Private 4 Residents are aware of project Water supply
Distribution network 10 km length Urban Existing or newly
constructed roads
…. As for Gia Nghia distribution system
Quang Khe
Drainage (small scale)
Drainage network 2.1 km Built-up Private at present but will become public
……. As for Ea Tling drainage improvements.

TA 4485-VIE: Central Region Small and Medium Towns Development Project FINAL REPORT Appendix 21, page 4
June 2006
B. PHU YEN PROVINCE
Table A21-2. Initial Assessment of Land Acquisition and Resettlement Impacts
Town Sub-component Scheme Element Land area
(hectares)
Current land use, e.g. Rice,
forest, tree crops)
Ownership, e.g. government, commune,
private
Number of households
affected Comment
Waste water stabilization pond
(WSP) 25 ha + buffer zone Rice land Private 75
General site location only; size of buffer zone to be determined during FS but cultivation likely to be permitted in this area. AP estimate based on average land holdings in province. Assumes total loss of land; in practice, number of APs likely to be greater but severity of impact will be reduced. Cannot realistically be assessed in detail until completion of detailed measurement survey (DMS).
43 km (up to 2m width) of primary & secondary drains.
12 km of wastewater
interceptors and pressure mains
Mostly existing urban area but
some new development
areas.
Primarily existing or future public rights of way ……
Impact likely to be reduced by location non existing roads or roads to be built outside the project in town expansion areas. Impact also likely to be reduced as most drains will be covered/ buried. Cannot be assessed until completion of FS.
Tuy Hoa Drainage/
Wastewater treatment
Drainage/ wastewater
network
4 pumping stations @25sq.m. each Mostly urban Private/ public …….
Cannot be assessed until sites have been selected, i.e. at completion of FS. Could be significant if demolition is involved.
Land fill site 3 ha (20 ha site available)
Essentially uncultivated with
some, non-productive,
trees.
Survey results not available at time of writing. Impact not expected to be significant although a few households may have to relocate from buffer zone. Solid waste
Access Road 5 km upgraded + 2 km new Not assessed as road will be constructed by province prior to CSMT implementation. Song Cau
Drainage Drainage network 11km up to 2m width
Existing urban and new
development areas
Private at present but will become public …….
Minimal impact likely due to location along existing wide roads and roads yet to be built. Cannot be assessed until completion of FS.
C. KHANH HOA PROVINCE

TA 4485-VIE: Central Region Small and Medium Towns Development Project FINAL REPORT Appendix 21, page 5
June 2006
Table A21-3. Initial Assessment of Land Acquisition and Resettlement Impacts
Town Sub-component Scheme Element Land area
(hectares) Current land
use Land Ownership Number of households affected Comment
WSP 10 ha + buffer zone Shrimp farms Private 40
Location being reviewed to reduced LAR impact. Estimate based on provincial estimates of size of shrimp farms and 50m buffer zone (not yet decided). Cannot be assessed in detail until completion of FS and final site selection.
36 km of primary & secondary drains, interceptor sewers and pressure mains
Mostly existing urban area but some new development areas.
Existing or newly constructed roads
….
Impact likely to be reduced by location non existing roads or roads to be built outside the project in town expansion areas. Impact also likely to be reduced as most drains will be covered/ buried. Cannot be assessed until completion of FS.
Drainage and waste water
Drainage network
4 pumping stations @25 sqm. each
As above Private/ public …….
Cannot be assessed until sites have been selected, i.e. at completion of FS. Some demolition may be involved.
Land fill site 35 ha (5 ha required initially)
Marginal land Survey results not available at time of writing. Impact not expected to be significant
as there is little cultivation.
Cam Ranh
Solid waste
Access road 1 km Not yet known Survey results not available at time of writing. Impact will depend on current land
uses and whether there is an existing track that will be upgraded.
WTP 1 hectare - two options
Hilly and largely uncultivated Survey results not available at time of writing.
Impact not expected to be significant as there is little cultivation. Options are still under consideration.
Access road 500-2,000m Not yet known Not yet known …… Impact not expected to be significant due to short length of road. Cannot be assessed until completion of FS.
Ninh Hoa
Water supply
Distribution network 52 km length (incl. transmission main)
Urban and rural Existing or newly constructed roads
…. Impact likely to be minimal and temporary as will be located along existing or newly constructed roads whose LAR impacts will be outside

TA 4485-VIE: Central Region Small and Medium Towns Development Project FINAL REPORT Appendix 21, page 6
June 2006
Town Sub-component Scheme Element Land area
(hectares) Current land
use Land Ownership Number of households affected Comment
this project. Cannot be assessed until completion of FS. Impact of transmission pipeline likely to be temporary as cultivation will not be precluded.
Drainage (small scale) Drainage network None Urban Existing main
roads …….
As above as roads are already fairly wide and should not involve more than a little temporary acquisition/ reconstruction of driveways, etc.
Booster pumping station 0.5 ha Urban Surveys not completed at time of writing
Water supply Pipeline 2 km Rural next to
road Private ….
As above as cultivation will not be precluded. Cannot be assessed until completion of FS.
Land fill site 20 ha available (5 ha initially)
Marginal/ forest land Survey results not available at time of writing.
Impact not expected to be significant as there is little cultivation. Alternative location has recently proposed but not yet assessed by engineers.
Van Gia Solid waste (combined scheme for Ninh Hoa)
Access road 2.5km Not yet known Survey results not available at time of writing. Impact will depend on current land
uses and whether there is an existing track that will be upgraded.

TA 4485-VIE: Central Region Small and Medium Towns Development Project FINAL REPORT Appendix 21, page 7
June 2006
D. NINH THUAN PROVINCE
Table A21-4. Initial Assessment of Land Acquisition and Resettlement Impacts
Town Sub-component Scheme Element Land area (hectares) Current land
use Ownership Number of households affected
Comment
WTP c. 0.5 ha Survey results not available at time of writing. Impact not expected to be significant due to small site area and location adjacent to existing WTP.
Tan Son Water supply
Distribution network 12 km Urban and rural
Existing or newly constructed roads
….
Impact likely to be minimal and temporary as will be located along existing or newly constructed roads whose LAR impacts will be outside this project. Cannot be assessed until completion of FS.
Transmission Pipeline 18km Rural Private ……..
Cannot be assessed until completion of FS. Large number of persons likely to be affected but impact likely to be small as cultivation can continue over 5m wide pipeline easement. There will be some permanent acquisition for 2 booster pumping stations. Ca Na Water supply
Distribution network 8 km Urban
Public (existing roads)
….
Impact likely to be minimal and temporary as will be located along existing roads. Cannot be assessed until completion of FS.
WSP 7ha Not yet known Site for WSP still undecided. Surveys yet to be undertaken.
Thap Cham
Drainage and waste water
Drainage network
Around 11km of primary & secondary drains, interceptor sewers and pressure mains
Mostly existing urban area but some new development areas.
Existing or newly constructed roads
….
Impact likely to be reduced by location non existing roads or roads to be built outside the project in town expansion areas. Impact also likely to be reduced as most drains will be covered/ buried. Cannot be assessed until completion of FS.

TA 4485-VIE: Central Region Small and Medium Towns Development Project FINAL REPORT Appendix 21, page 8
June 2006
Town Sub-component Scheme Element Land area (hectares) Current land
use Ownership Number of households affected
Comment
3 pumping stations @25 sqm. Each As above Private/ public …….
Cannot be assessed until sites have been selected, i.e. at completion of FS. Some demolition may be involved.

TA 4485-VIE: Central Region Small and Medium Towns Development Project FINAL REPORT Appendix 21, page 9
June 2006
E. BIHN THUAN PROVINCE
Table A21-5. Initial Assessment of Land Acquisition and Resettlement Impacts
Town Sub-
compo-nent
Scheme Element
Land area (hectares)
Current land use, e.g. Rice,
forest, tree crops)
Ownership, e.g. government, commune, private
Number of households
affected Comment
WSP 15 ha + buffer zone
Shrimp farms + some housing Private 100
Survey results not yet available. Indicative estimate based on provincial estimates of size of shrimp farms and 50m buffer zone (not yet decided). Cannot be assessed in detail until completion of FS and final site selection.
Around 37 km of primary & secondary
drains, interceptor sewers and
pressure mains
Mostly existing urban area but
some new development
areas.
Existing or newly constructed roads ….
Impact likely to be reduced by location non existing roads or roads to be built outside the project in town expansion areas. Impact also likely to be reduced as most drains will be covered/ buried. Cannot be assessed until completion of FS.
Phan Thiet
Drainage and waste
water
Drainage network
4 pumping stations @25
sqm. each As above Private/public …….
Cannot be assessed until sites have been selected, i.e. at completion of FS. Some demolition may be involved.