The Anatomy of Mobile Handsets: On the development of effective cell phone services
Upload
khangminh22Category
view
3download
0
Effective Design of Products/Services: An Approach Based on
Integration of Marketing and Operations Management
Decisions
Rohit Verma
Department of Management, DePaul Universiv, Chicago, IL 60604, email: [email protected]
Gary M. Thompson
School of Hotel Administration, Cornell University, Ithaca, NY 14850, email: gmtl @cornell.edu
William L. Moore
David Eccles School of Business, University of Utah, Salt Lake City, UT 84112, email:
Jordan J. Louviere
Memetrics Pty. Ltd., Sydney, Australia, email: jordan.louviere @memetrics.com
This paper presents an integrated framework for designing profit-maximizing
products/services, which can also be produced at reasonable operating difficulty levels.
Operating difficulty is represented as a function of product and process attributes, and
measures a firm’s relative ease or difficulty in meeting customer demand patterns under
specified operating conditions. Earlier optimum product design procedures have not
considered operational difficulty. We show that optimum profit, market share, cost, and
product profiles are dependent on operating difficulty level. Empirical results from the
pizza delivery industry demonstrate the value of the proposed Effective Product/Service
Design approach.
Introduction
According to the lead article in a recent issue of Time, “when industries are competing
at equal price and functionality, design is the only differential that matters” (Gibney &
Luscombe, 2000, p. 69). The need for market-based product/service design has led to the
development of many mathematical procedures for the identification of “optimal”
product/service profiles (e.g., Balakrishnan & Jacob, 1996; Green & Krieger, 1991a; McBride &
Zufryden, 1988; Moore, Louviere, & Verma, 1999; Nair, Thakur, & Wen, 1995). Most of the
published procedures utilize conjoint analysis or multidimensional scaling (MDS)-based
customer preference data, identify market segments of interest, and use optimal/heuristic
procedures to search for best combinations of attributes for a product to maximize sales or
market share (Green & Krieger, 1989; Shocker & Srinivasan, 1979). Such models are typically
suboptimal because market-share-maximizing products are not necessarily the profit- or
revenue-maximizing products as well. Therefore, the more recent approaches have considered
variable costs (Green & Krieger, 1991a) or sums of fixed and variable costs (Raman & Chhajed,
1995; Morgan, Daniels, & Kouvelis, 1996; Moore et al., 1999) when identifying profit-
maximizing product/service designs.
A major remaining drawback in marketing (only)-based product/service design
procedures is that they often do not consider operating capability, constraints, and other
managerial decisions. This is problematic because it is quite likely that the profit-maximizing
product profile would be relatively difficult to produce under the existing operating setup.
Following a call for greater integration between marketing and operations management (Chase,
1996; Karmarkar, 1996), the Effective Product/Service Design (EPSD) model proposed in this
paper incorporates customer preferences, production cost, and operating difficulty/capability
into the analysis scheme. Our approach is consistent with past research, which suggests that by
working together, operations and marketing can better appreciate each other’s constraints and,
therefore, will become more willing to make trade-offs in their own functions (Heskett, 1987;
Hill, 1989).
Methodologically, we measure customer preferences using a latent-segment discrete-
choice framework (Ben-Akiva & Lerman, 1991 ; Louviere, Hensher, & Swait, 2001). Recent
studies have demonstrated that discrete choice framework is very effective in estimating the
aggregate market shares of products/services (McFadden, 1986; Moore, Gray-Lee, & Louviere,
1998). In addition, we use conjoint analysis to estimate two important components of the EPSD
model-product cost and operating difficulty/capability as functions of product/service and
process attributes.
The remainder of the paper is divided into the following five sections. The second
section provides a review of past work on optimal product/service design, and develops a
conceptual basis for including cost and operating difficulty/capability into the analysis schemes.
In the third section, we develop the EPSD framework. An empirical illustration of the proposed
EPSD approach is described in the fourth section. We discuss managerial implications of the
proposed framework in the fifth section. And finally, conclusions, limitations of the study, and
directions for future research are presented in the sixth section.
Background
Research on optimum design and market positioning of products and services is not
new, and an extensive array of articles on this topic has been published in marketing and
management journals (e.g., Green, Carroll, & Goldberg, 1981; Green & Krieger, 1991a; Shocker
& Srinivasan, 1979). Therefore, we first review multidimensional scaling (MDS) and conjoint-
based optimal product design studies followed by a review of the discrete choice framework
used in our study. Next, we review various approaches for market segmentation, which can
further enhance the effectiveness of optimal product procedures. Finally, we discuss the past
work related to our conceptualization of cost and operating difficulty/capability into product-
design procedures.
MDS-based Optimal Product Design
Multidimensional scaling (MDS), also known as perceptual mapping, is a procedure that
allows a researcher to determine the perceived relative image of a set of objects (Hair,
Anderson, Tatham, & Black, 1998). Shocker and Srinivasan (1974) formulated a mathematical
programming model to minimize the distance between the “ideal” points (for each customer)
and product/service options in the MDS space. Subsequently, a number of other optimal
product design formulations were proposed (e.g., Bachem & Simon, 1981; Gavish, Horsky, &
Srikanth, 1983; Shocker & Srinivasan, 1979; Sudharshan, May, & Gruca, 1988).
The majority of MDS-based optimal product design procedures were published in the
1970s and early 1980s. Since the late 1970s, conjoint analysis gained considerable attention in
the marketing literature as the preferred approach for modeling customer preferences
(Louviere, 1988). Subsequently, a majority of the product design articles published since the
mid-1980s to date have been based on conjoint analysis-based customer preference data.
Conjoint/Choice Model-based Optimal Product Design
Conjoint analysis is a term used to describe a family of techniques that attempt to
model respondents’ preferences as functions of the determinant attributes of products and
services (Hair et al., 1998). In a typical conjoint experiment, the researcher first constructs a set
of real or hypothetical products/services by combining several levels of each attribute. The
combinations (conjoint profiles) are then presented to selected respondents who provide their
overall evaluations in the form of a ranking or numerical rating. Because the researcher
constructs the conjoint profiles using experimental design procedures, the influence of each
product/service attribute on the overall evaluation can be estimated for each individual
respondent/decision maker (Green & Krieger, 1996; Louviere, 1988).
Zufryden (1979) presented one of the first approaches for adapting conjoint analysis
methods to product design optimization. Subsequently, Green et al. (1981) introduced a
general procedure POSSE (Product Design Optimization and Selected Segment Evaluation) for
optimizing product/service features in a given market environment. Kohli and Krishnamurti
(1987), and Green and Krieger ( 1987) developed heuristics for quickly identifying near-
optimum product design; Sudharshan et al. (1988) developed an approach for generating
simultaneously optimal multiple new products for a wide range of conjoint-based preference
models. During the recent years a number of conjoint-based sophisticated optimization
techniques for identifying optimal product design have been developed. They include: genetic
algorithms (Balakrishnan & Jacob, 1996); dynamic programming (Kohli & Krishnamurti, 1987);
game theory (Choi, Desarbo, & Harker, 1990); nonlinear programming (Gavish et al., 1983); and
tabu-search (Morgan et al., 1996).
In summary, the conjoint-based optimum service/product design literature is very rich,
and researchers have used extremely rigorous methodologies in the proposed analyses
schemes. However, during the recent years a number of researchers have shown in a series of
studies that probabilistic discrete choice analysis (DCA) (also known as choice-based conjoint)
predicts aggregate market preferences with much higher accuracy (e.g., Elrod, Louviere, &
Davey, 1992; Horowitz & Louviere, 1993; Louviere, Fox, & Moore, 1993; Moore et al., 1998).
Refer to Verma, Thompson, and Louviere (1999), and Pullman, Verma, and Goodale (2001) for
further details about DCA.
Superficially, conjoint analysis and DCA appear very similar to each other because both
approaches are based on consumers’ evaluation of experimentally generated product/service
profiles that the researcher manipulates. The major differences include the underlying error
theory, statistical models, experimental design, and the data collection approach (Verma et al.,
1999). Conjoint response data typically is obtained in the form of ratings (on a predetermined
scale-for example, 1-100) or rankings of experimental profiles (the respondents do not “choose”
any alternative), or more rarely, binary responses. In contrast, DCA response data are
categorical (choose or not choose), and require forms of discrete multivariate models to analyze
data (e.g., multinomial logit or more complex econometric model). Consequently, DCA is
applied to analyze choice data supplied by aggregates of respondents, such as market
segments, which requires much more sophistication in design and analysis to account for
different choice processes and market characteristics such as heterogeneity in preference
parameters (Louviere et al., 2001). We therefore use DCA in the optimum product/service
design formulation presented in this paper. Our approach can be easily extended to the design
of optimal product lines as well.
Optimal Product-Service Design and Market Segmentation
Incorporating the nature and relative sizes of various market segments into estimation
procedures can further extend the effectiveness of optimal product design methods (Currim,
1981; Dickson & Ginter, 1987; Green and Krieger, 1991b). According to Green and Krieger
(1996), managers are often interested in making market share predictions at the segment level.
Although there are many approaches for identifying market segments, studies show that latent
segment models based on DCA seem to predict market share quite well (Moore et al., 1998;
Vriens, Oppewal, & Wedel, 1998).
Building on past work, our formulation explicitly considers multiple market segments.
Although the model formulation is independent of any specific market segmentation method,
in the empirical results presented in this paper we use the latent segment model based on DCA
since it predicts market share quite well (Moore et a1.,1988; Vriens et al., 1988). In addition, we
used a simulated annealing procedure to further enhance the predictive accuracy of a DCA-
based latent segment model (Kirkpatrick, Gelatt, & Vecchi, 1983).
Cross-functional (Marketing/Operations) Product/Service Design Approaches
During recent years, market-utility-based approaches (conjoint and discrete choice
analyses) have started appearing in operations management-focused product/service design
articles. For example, Pullman and Moore (1999) presented an optimal service design model by
combining a DCA-based customer preference model with capacity and demand management
strategies. Moore et al. (1999) demonstrated how results from a series of conjoint experiments
could be combined together to make effective product platform decisions, which are consistent
with market needs, and at the same time also take into account operating constraints such as
production/development costs and components sharing among products. Pullman, Goodale,
and Verma (2000) developed an integrated design of mass services by combining preferences
of customers of multiple market segments with waiting times and labor-scheduling decisions.
Assuming conjoint data, Raman and Chhajed (1995) developed an approach for simultaneously
determining product attributes, prices, and production processes; Morgan et al. (1996)
presented a mathematical programming formulation for managing marketing/manufacturing
trade-offs in product-line management; and Ramdas and Sawhney (1999) developed an
approach for multiple product-line extensions.
Operating Trade-offs, Capability, Difficulty, and Costs
Several operations management researchers have emphasized the relationship between
product design, variety, production mix (and volume), and process design/capability. In one of
the most widely cited operations management articles, Skinner (1974) stated that continued
additions and/or changes in the product mix for existing production facilities leads to multiple
operational difficulties (confusion, lack of focus, complex process flows, etc.). Presumably,
organizations add these products because an incremental analysis indicated that they would be
profitable. However, that analysis probably did not include the costs of the added complexity,
or operating difficulty, of production. Therefore, Skinner (1974) suggested a better alignment
between the requirements of marketing and capabilities of operations function within an
organization. Recent publications such as Clark and Fujimoto (1990); Fitzsimmons, Kouvelis, and
Mallick (1991); Karmarkar (1996); Meyer and Lehnerd (1997); Nevins and Whitney (1989); Pine
(1993); and Srinivasan, Lovejoy, and Beach (1997) continue to emphasize that product/service
design decisions should be based on both marketing and production capabilities and
constraints. Relationships between product design, process design/capabilities, and
performance have been studied in detail (e.g., Ettlie, 1995; Jordan & Graves, 1995; McDuffie,
Sethuraman, & Fisher, 1996; Safizadeh, Ritzman, Sharma, & Wood, 1996).
A number of publications have also attempted to directly link market-based product
service design with various operations management decisions such as cost, demand, and
production capability. For example, Meyer, Tertzakian, and Utterbeck (1997) proposed various
methods for measuring the performance of R&D in the new product development process
considering among other parameters, product platforms/families, costs, and performance in a
multi-time-period framework. Similarly, Bhoovaraghavan, Vasudeven, and Chandran (1996)
presented a consumer-based approach (based on choice theory) to distinguish between
product and process innovation. Since the publication of Hauser and Clausing’s (1988)
managerial article on Quality Function Deployment (QFD), a number of QFD-based product-
process design approaches have also been proposed (e.g., Burchill & Fine, 1997; Chakravarty &
Ghose, 1993; Park & Kim, 1998; Griffin & Hauser, 1993; Wasserman, 1993).
Building on the recent advances in consumer choice modeling using DCA, cross-
functional (marketing-operations) approaches, and the operations strategy literature, we
propose to integrate an aggregate measure of design/production complexity and operating
trade-off/capability into the optimum product/service design procedures. We refer to this
aggregate measure as “operating difficulty,” which measures management’s relative ease in
meeting market needs under the given operating configurations. We modeled operating
difficulty as a function of all the product and process attributes. This construct captures the
various trade-offs managers have to make in order to deliver product/service based on
customer preferences, while at the same time taking into account operating constraints and
capability.
Although “operating difficulty” as formulated in our work has not been explicitly
referred to in past research, a number of operations management articles have presented
many similar conceptualizations. For example, Skinner’s (1974) focused factory concept was
based on the premise that adding variety leads to many production complications/confusions.
Examples of increased difficulty include sharp rises in overhead, greater material handling and
inventory costs, more diverse process flows, more complex scheduling requirements, more
need for planning and control activities, and wider skill requirements for employees (Kekre &
Srinivasan, 1990; Abegglen & Stalk, 1985; Johnson & Kaplan, 1987). Furthermore, many of these
costs, like more diverse process flows, more complex scheduling requirements, more need for
planning and control activities, and wider skill requirements for employees are not easily
quantified, and may not be captured in cost estimates of broader product lines. Therefore, we
model production cost and operating difficulty separately.
In the current study, we model product cost as a function of the determinant product
and process attributes. (Note, however, that the formulation can be easily modified in terms of
fixed and variable costs, if desired). Even though a number of articles referred to earlier have
considered some relevant costs (fixed, variable, engineering), they have not considered how
changes in the operating configuration affect net product cost. We, on the other hand, consider
both the demand side (customer preferences, demand volume, etc.) and supply side (operating
resources, workforce size and availability, wage rates, etc.) when modeling production cost.
The Effective Product/Service Design Model
The EPSD model formulation integrates customer preferences and the elements of the
production process with the objective of identifying profit-maximizing product profiles, which
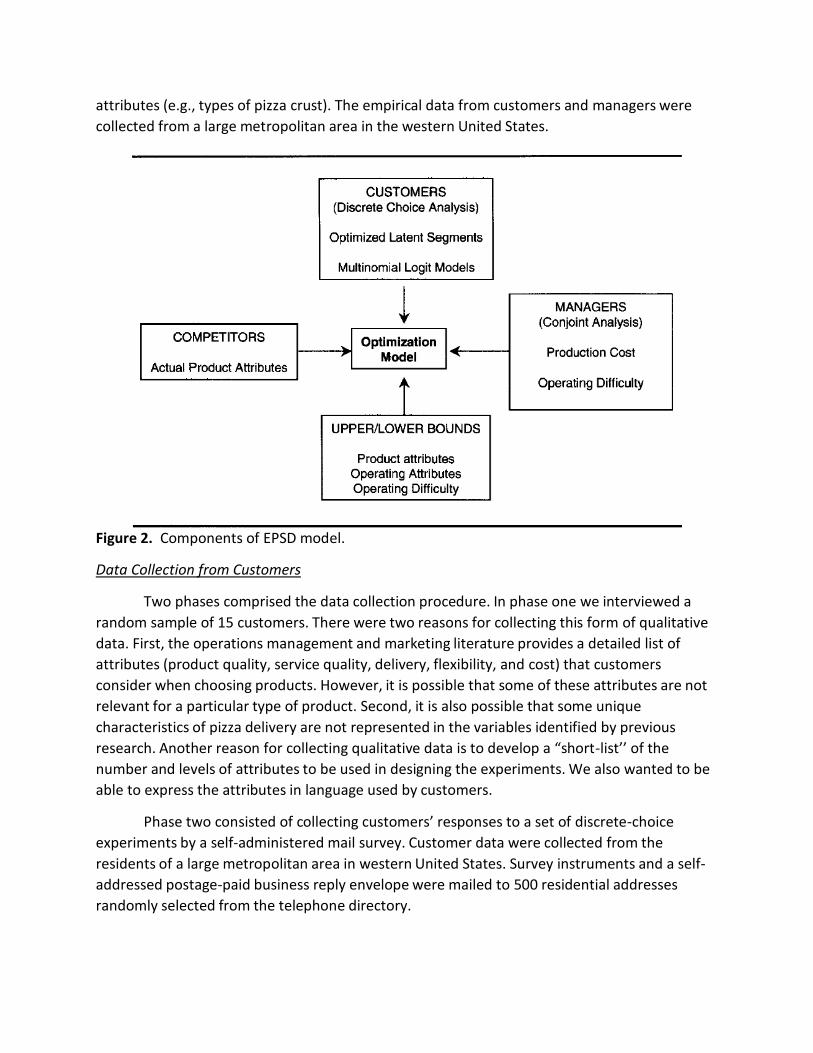
can be produced at a given operating difficulty level. An overview of the proposed approach is
presented in Figure 1.
The formulation builds on the choice patterns of customers from one or more market
segments. The market share of each product offered is a function of customer choice patterns,
product attributes, and the attributes of products offered by competitors. Figure 1 also shows
that the production cost can be thought to be a function of the product and process attributes.
In addition, we propose that the product and process attributes together determine operating
difficulty level, which is an aggregate measure of production capability. For example, reducing
the number of skilled workers can reduce production cost. However this could make it more
difficult to make the products most desired by customers and, thus, reduce profit. Similarly,
increasing product variety can impact both cost and product complexity, thereby making it
relatively difficult to meet market needs. We propose that optimal product profiles be
identified as a function of operating difficulty level. The empirical results presented later in this
paper demonstrate the validity of our contention.
Mathematical Formulation
In this paper, we look at a relatively simple situation: The management of a particular
company, which we refer to as Company Z, can change one or more product attribute(s) and/or
one or more operating attribute(s), whereas the competitors’ product attributes remain
constant. It is theoretically possible to extend the formulation to multiple stages when all
competitors are allowed to change their attributes using a game-theoretic approach or by
setting up DCA as an interactive agency problem (Lee & Tang, 1997; Hensher & Chow, 1998).
This paper presents a DCA based optimal product-service design formulation for one specific
company, which operates in a specified market. We hope to demonstrate the usefulness of
including product cost and operating difficulty/capability in optimal product-service design
problem formulations. Building on the above ideas, the effective product-service optimization
model can be formulated for Company Z in the following manner:
subject to
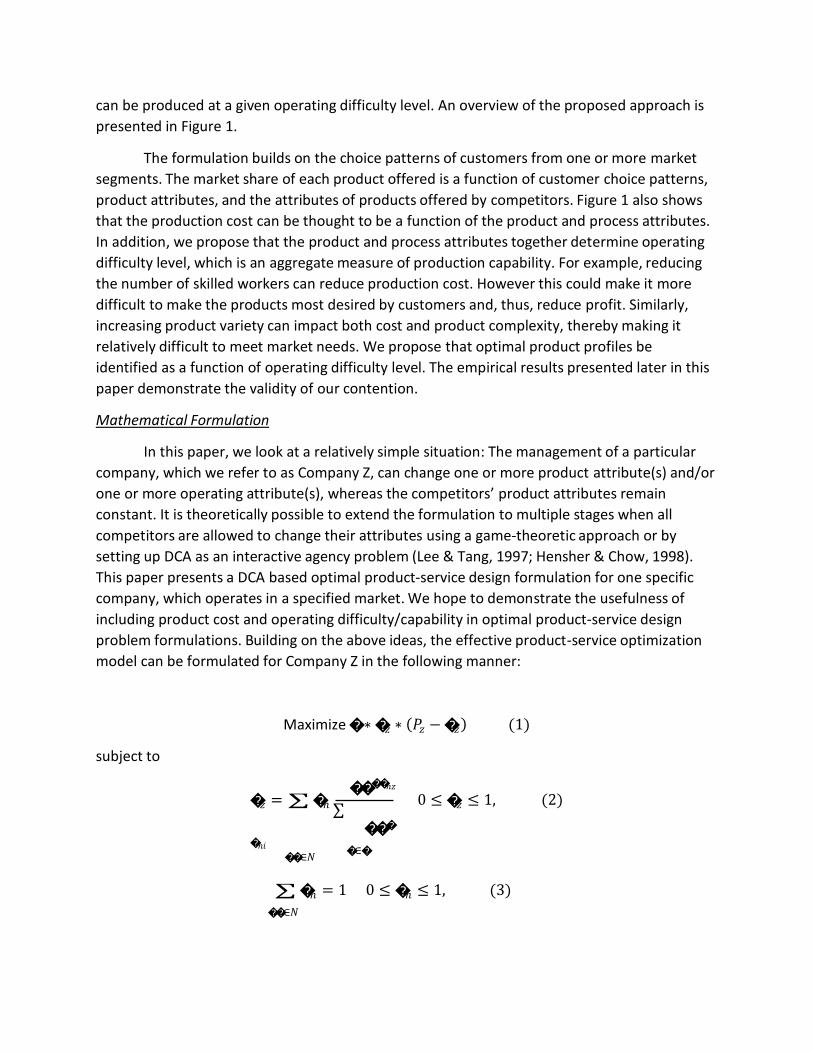
Maximize � ∗ �𝑧 ∗ (𝑃𝑧 − �𝑧 ) (1)
����𝑛𝑧
�𝑧 = ∑ �𝑛 ∑ ����𝑛𝑖
0 ≤ �𝑧 ≤ 1, (2)
��∈𝑁 �∈�
∑ �𝑛 = 1
��∈𝑁
0 ≤ �𝑛 ≤ 1, (3)
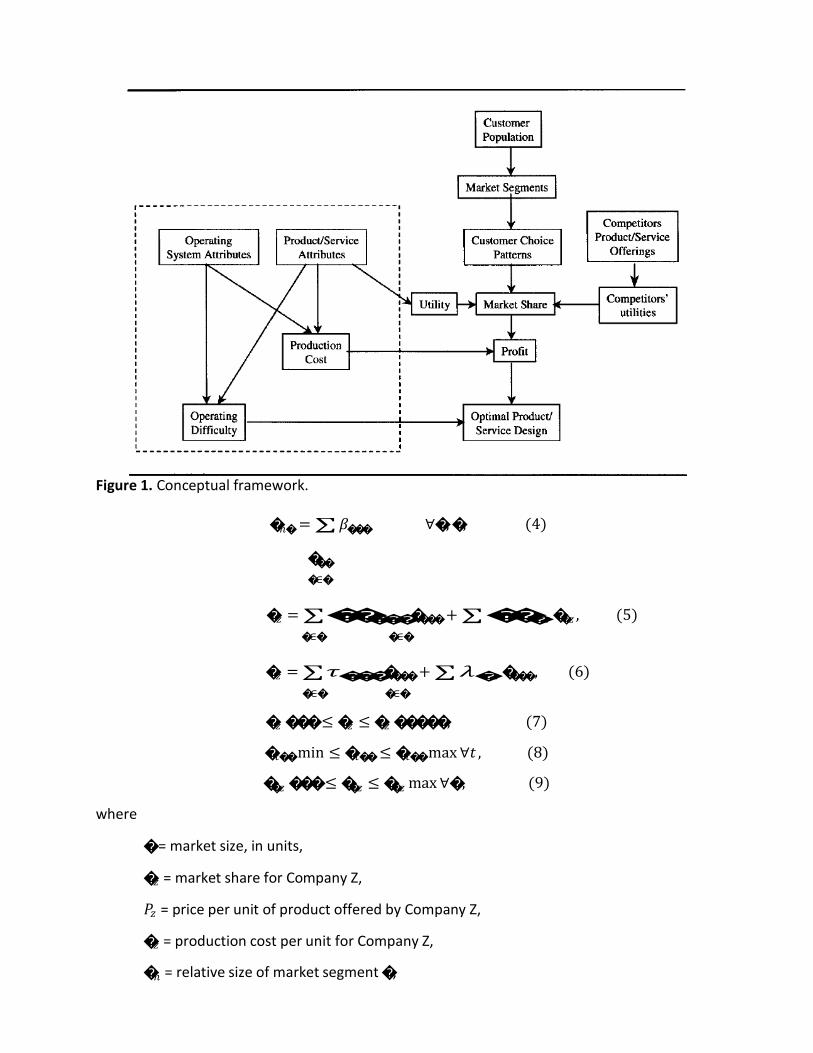
Figure 1. Conceptual framework.
�𝑛� = ∑ 𝛽���
���
�∈�
∀�, �, (4)
�𝑧 = ∑ ����� ���� + ∑ ���𝑧 ��𝑧 , (5)
�∈� �∈�
�𝑧 = ∑ 𝜏��� ���� + ∑ 𝜆�𝑧 ���� , (6)
�∈� �∈�
where
�𝑧 ��� ≤ �𝑧 ≤ �𝑧 �����, (7)
�𝑡�� min ≤ �𝑡�� ≤ �𝑡�� max ∀𝑡 , (8)
��𝑧 ��� ≤ ��𝑧 ≤ ��𝑧 max ∀� , (9)
� = market size, in units,
�𝑧 = market share for Company Z,
𝑃𝑧 = price per unit of product offered by Company Z,
�𝑧 = production cost per unit for Company Z,
�𝑛 = relative size of market segment �,
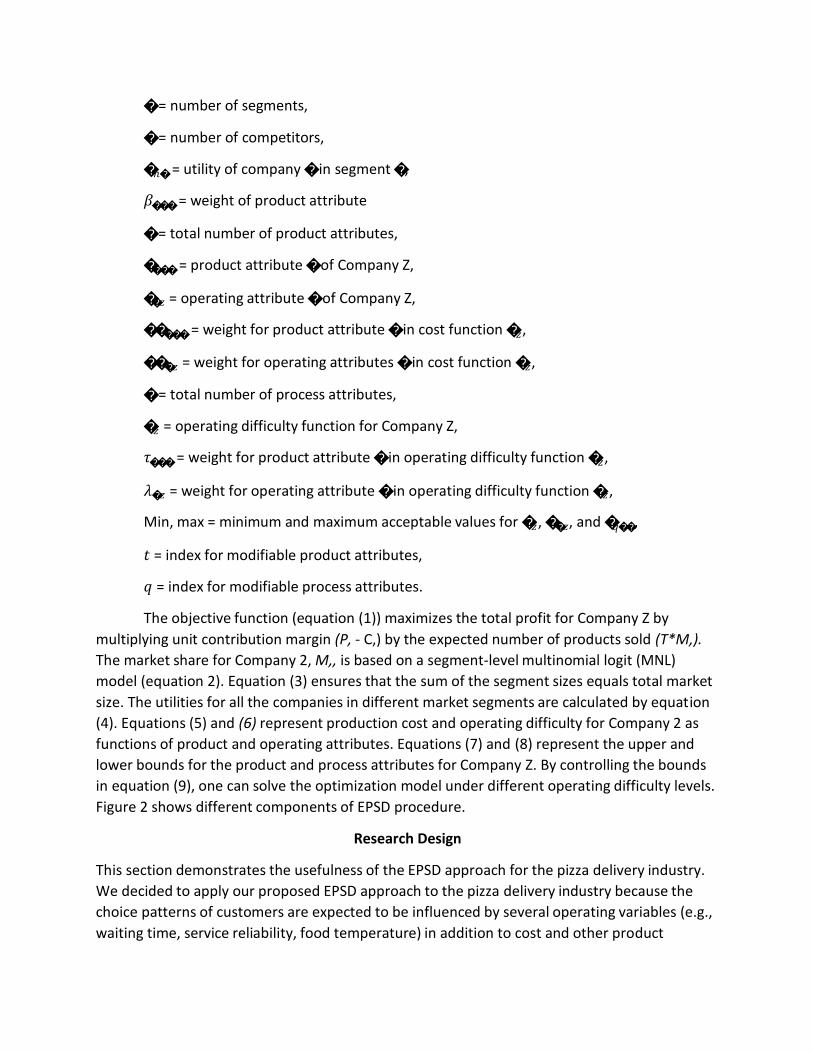
� = number of segments,
� = number of competitors,
�𝑛� = utility of company � in segment �,
𝛽��� = weight of product attribute
� = total number of product attributes,
���� = product attribute � of Company Z,
��𝑧 = operating attribute � of Company Z,
����� = weight for product attribute � in cost function �𝑧 ,
���𝑧 = weight for operating attributes � in cost function �𝑧 ,
� = total number of process attributes,
�𝑧 = operating difficulty function for Company Z,
𝜏��� = weight for product attribute � in operating difficulty function �𝑧 ,
𝜆�𝑧 = weight for operating attribute � in operating difficulty function �𝑧 ,
Min, max = minimum and maximum acceptable values for �𝑧 , ��𝑧 , and �𝑞�� ,
𝑡 = index for modifiable product attributes,
𝑞 = index for modifiable process attributes.
The objective function (equation (1)) maximizes the total profit for Company Z by
multiplying unit contribution margin (P, - C,) by the expected number of products sold (T*M,).
The market share for Company 2, M,, is based on a segment-level multinomial logit (MNL)
model (equation 2). Equation (3) ensures that the sum of the segment sizes equals total market
size. The utilities for all the companies in different market segments are calculated by equation
(4). Equations (5) and (6) represent production cost and operating difficulty for Company 2 as
functions of product and operating attributes. Equations (7) and (8) represent the upper and
lower bounds for the product and process attributes for Company Z. By controlling the bounds
in equation (9), one can solve the optimization model under different operating difficulty levels.
Figure 2 shows different components of EPSD procedure.
Research Design
This section demonstrates the usefulness of the EPSD approach for the pizza delivery industry.
We decided to apply our proposed EPSD approach to the pizza delivery industry because the
choice patterns of customers are expected to be influenced by several operating variables (e.g.,
waiting time, service reliability, food temperature) in addition to cost and other product
attributes (e.g., types of pizza crust). The empirical data from customers and managers were
collected from a large metropolitan area in the western United States.
Figure 2. Components of EPSD model.
Data Collection from Customers
Two phases comprised the data collection procedure. In phase one we interviewed a
random sample of 15 customers. There were two reasons for collecting this form of qualitative
data. First, the operations management and marketing literature provides a detailed list of
attributes (product quality, service quality, delivery, flexibility, and cost) that customers
consider when choosing products. However, it is possible that some of these attributes are not
relevant for a particular type of product. Second, it is also possible that some unique
characteristics of pizza delivery are not represented in the variables identified by previous
research. Another reason for collecting qualitative data is to develop a “short-list’’ of the
number and levels of attributes to be used in designing the experiments. We also wanted to be
able to express the attributes in language used by customers.
Phase two consisted of collecting customers’ responses to a set of discrete-choice
experiments by a self-administered mail survey. Customer data were collected from the
residents of a large metropolitan area in western United States. Survey instruments and a self-
addressed postage-paid business reply envelope were mailed to 500 residential addresses
randomly selected from the telephone directory.
Data Collection from Managers
In our study we considered only those pizza delivery outlets that belonged to multiple
establishment businesses. There were approximately 60 such pizza delivery establishments in
the metropolitan area. We excluded single-establishment businesses from the study for one or
more of the following reasons: they only deliver pizza in a limited area, they charge extra for
pizza delivery, or they offer only gourmet pizzas. The managers of all the pizza delivery
establishments with two or more shops were contacted and invited to participate in the study.
As an incentive for responding to the surveys, we promised to provide the managers a
summary of results and included two cinema tickets. The regional manager of a national pizza
chain agreed to participate in the study and encouraged the individual pizza delivery store
managers to respond to the survey. We refer to this pizza delivery company as Company Z.
Design of Discrete Choice Experiments for Customers
Market-based criteria can be classified into the following broad constructs: product
quality (which can be further divided into eight dimensions), service quality (which can be
further divided into 10 dimensions), delivery, flexibility, and cost (Hayes & Wheelwright, 1984;
Garvin, 1987; Parasuraman, Zeithaml, & Berry, 1985). These dimensions were used as the basis
for qualitative interviews conducted with 15 randomly selected customers and five pizza
managers. According to Griffin and Hauser (1993), qualitative data collected from
approximately 20-25 randomly selected respondents is enough to identify a majority of the
determinant attributes. Because home-delivery pizza is a fairly standard product offering, we
concluded that qualitative responses for 20 individuals were sufficient for identifying the
important determinant attributes. As a result of these interviews, seven product attributes
were selected for the choice study: promised delivery time, actual delivery time, types of crust,
pizza temperature, unconditional money-back guarantee, price, and discount on a second pizza.
A 27−3 fractional factorial design was used to generate a 16-profile orthogonal experimental design using CONSURV (Intelligent Marketing Systems, 1992a). With two levels for every variable, this experimental design can estimate all the main effects and six selected
two-way interactions. The seven variables are assigned to the experimental design such that all
two-way interactions between promised delivery time, actual delivery time, pizza variety, and
price can be estimated. Attribute levels reflect the actual market values. Table 1 presents the
attributes, attribute levels, and experimental design codes for all the variables. Each of the 16
profiles is combined with its “foldover” profile and a no-choice option to generate three-item
choice sets. A foldover profile contains the exact opposite attribute levels (-1 for +1 and vice
versa) of the original profile and, therefore, ensures a complete orthogonal design. The
customers had to choose one pizza delivery company (original design, foldover design, or none)
from each of the 16 choice sets. (Refer to Verma et al., 1999, for further details on designing and
conducting discrete choice experiments.)
Design of Conjoint Experiments for Managers
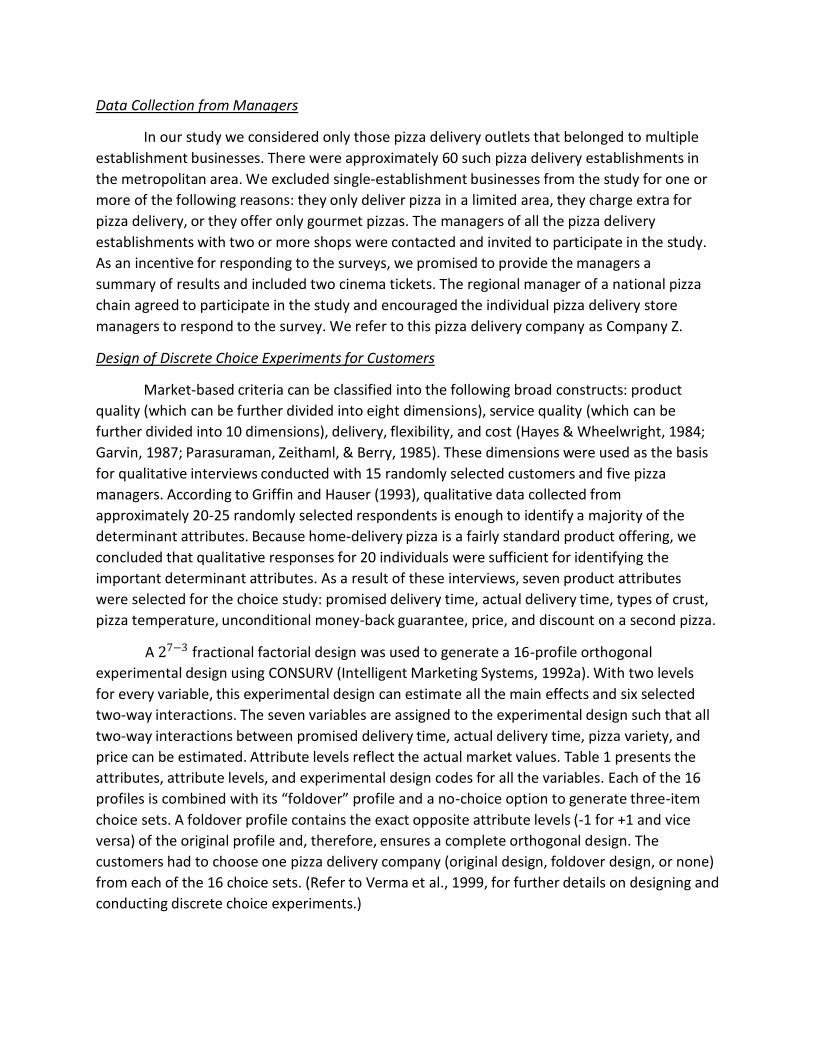
We used conjoint analysis to develop ordinary least square (OLS) models for production
cost and operating difficulty as functions of product attributes and operating system attributes.
Based on qualitative information collected from five managers of different pizza delivery
companies, seven operating variables were selected to represent the operating system. These
Table 1. Attributes and their levels.
variables are: daily demand rate, customer order similarity, number of pizza delivery personnel,
number of in-store employees, average wage rate, and supplier delivery frequency. Table 1 also
shows the operating system attributes and their levels. Again, the attribute levels reflect the
actual market values. In addition to the seven operating attributes, seven pizza attributes (used
in the design of discrete choice experiments) were also used in the experimental design. This
results in 14 variables with two levels each. The managers were asked to predict the production
cost and operating difficulty level for each of the 32 profiles generated by CONSURV (Intelligent
Marketing Systems, 1992a).
Results and Discussion
The following sections describe the results obtained from the data collected from
customers and managers of pizza delivery firms. We describe the multinomial logit (MNL)
models for the identified market segments followed by ordinary least square (OLS) regression
models for product cost and operating difficulty. Finally, we present EPSD optimization results
followed by a managerial illustration.
Customer choice survey instruments were mailed to 500 randomly selected customers
in a large metropolitan area in the western United States. Fifty-six surveys were returned
because of incomplete or inaccurate addresses. Sixteen individuals returned the survey
unanswered because they either didn’t eat pizza or because they didn’t want to participate in
the study. A total of 145 surveys were returned out of which 17 were less than 25% complete
and, hence, were not considered. Therefore, the effective response rate was 3 1.1 %. We used
NTELOGIT to estimate all multinomial logit (MNL) models presented in this paper (Intelligent
Marketing Systems, 1992b). Since NTELOGIT is now commercially not available, we also cross-
checked some of the results using the NLOGIT module of LIMDEP (Greene, 1995) and to ensure
consistency.
Market Segmentation Results
Identification of market segments based on customer choices is an essential element of
the EPSD model (equation (2)). It should also be noted that the EPSD model can be solved for
the aggregate market (or for only one segment) by simply assuming that there is only one
market segment. As mentioned earlier, we used simulated annealing (SA) to identify and
optimize the latent segments based on customer choices. Note, however, that the EPSD
formulation is independent of latent segments. Thus, one may implement EPSD with ANY
market segmentation procedure.
The simulated annealing-based latent segment procedure was used to develop two-
through five-segment models. We chose not to develop models with more than five segments
because the total sample size was only 128, which would likely have resulted in some segments
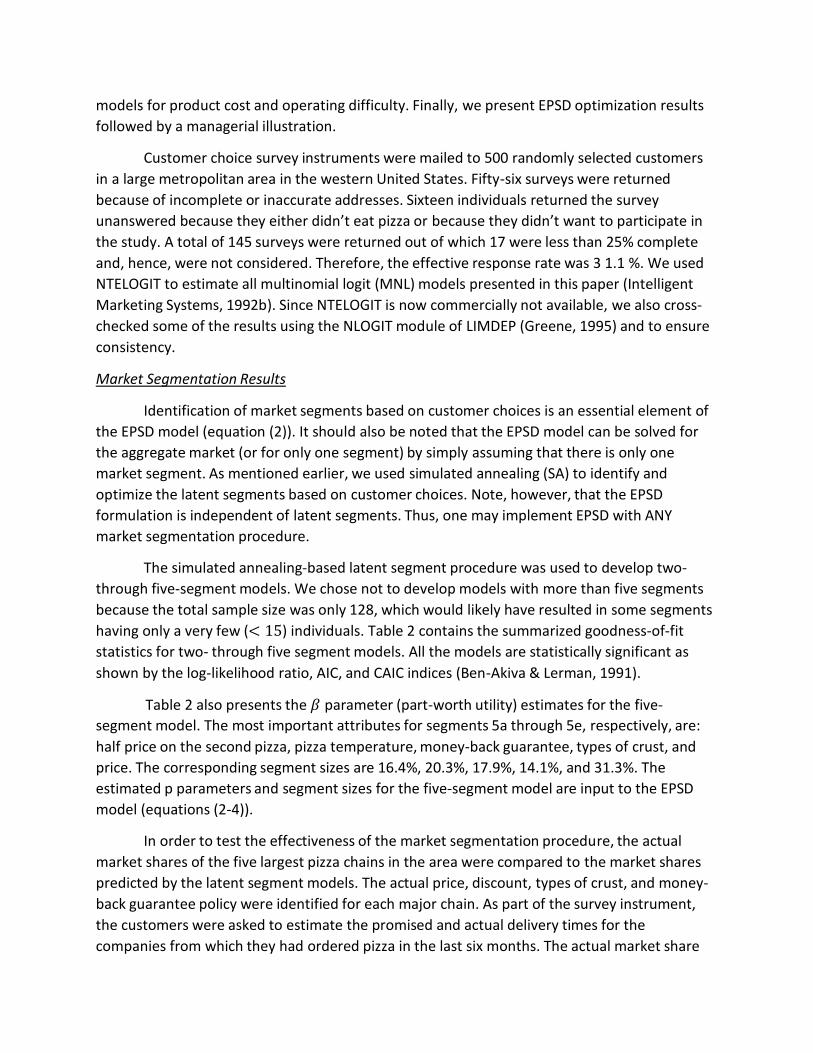
having only a very few (< 15) individuals. Table 2 contains the summarized goodness-of-fit
statistics for two- through five segment models. All the models are statistically significant as shown by the log-likelihood ratio, AIC, and CAIC indices (Ben-Akiva & Lerman, 1991).
Table 2 also presents the 𝛽 parameter (part-worth utility) estimates for the five- segment model. The most important attributes for segments 5a through 5e, respectively, are: half price on the second pizza, pizza temperature, money-back guarantee, types of crust, and
price. The corresponding segment sizes are 16.4%, 20.3%, 17.9%, 14.1%, and 31.3%. The
estimated p parameters and segment sizes for the five-segment model are input to the EPSD
model (equations (2-4)).
In order to test the effectiveness of the market segmentation procedure, the actual
market shares of the five largest pizza chains in the area were compared to the market shares
predicted by the latent segment models. The actual price, discount, types of crust, and money-
back guarantee policy were identified for each major chain. As part of the survey instrument,
the customers were asked to estimate the promised and actual delivery times for the
companies from which they had ordered pizza in the last six months. The actual market share
Segment Relative Size (16.4%) (20.3%) (17.9%) (14.1%) (31.3%)
Price of a Large Pizza -0.626* -0.988* -0.344* -0.187 -2.383*
Percent Discount on 0.846* 0.364* 0.026 0.299* 0.745* Second Pizza
Promised Delivery Time -0.145 -0.364* -0.464* -0.024 -0.913*
Actual Delivery Time -0.686' -0.162 0.014 0.224 -0.05
Pizza Variety 0.466* 0.289• 0.146 1.703* 0.286*
Pizza Temperature 0.344* 1.659* 0.338* 0.463* 0.396
Money-bade Guarantee 0.276* 0.232 0.891* 0.112 0.513*
Intercept -0.232 0.277 0.732* -0.245 0.694*
a.Goodness-of-Fit Statistics
Number of Segments Two Three Four Five
-2 [ LL(O) -LL(fl)] 1543.134 1695.354 1769.05 1930.43
(X2, 17 dj) (X2, 26 dj) (X2, 35 dj) <x2,44 dfl
AIC 2924.78 2756.56 2794.86 2649.48
CAlC 3144.045 3085.458 3105.39 3037
p2 .343 .376 .393 .429
Adjusted p2 .336 .366 .378 .411
b.Parameter estimates () for the five-segment MNL model for 128 respondents (16 observations/respondents).Relative size of each segment is presented as percentage.
Sa Sb 5c 5d 5e
Note: Boldface indicates highest value/column.
c. Estimated and Predicted Market Share
Ambassador
Domino's
Free- Wheeler
Godfatber's
Company Pizza Pizza Pizza Pizza Pizza Hut
Estimated Market Share (2-segment model)
0.1922 0.2926 0.0701 0.1355 0.3095
Estimated Market Share 0.2301 0.2627 0.1109 0.1183 0.278 (3-segment model) Estimated Market Share 0.1923 0.2968 0.1056 0.1075 0.2969 (4-segment model)
Estimated Market Share (5-segment model)
0.21 37 0.2999 0.0545 0.1077 0.3252
Actual Market Share (based on number
0.2037 0.3148 0.037 0.0926 0.3518
of shops)
*p < .05 (based on asymptotic t-statistic)
Table 2: Market segm entation results.
was calculated based on the relative number of pizza delivery establishments per company.
This assumption was judged to be reaso nabIe because all of the est ab li sh m ents deliver
approximately 200 pizzas per weekday and approximately 400 pizzas duringthe weekends (the
managers of the five pizza chains independently provided us the above information). Next,
expected market shares for the companies were calculated by the two-, three-, four-, or five-
segment models. Table 2 shows the estimated market share (based on actual number of shops)
and the predicted market share (based on 2 to 5-segment models). The five-segment model
prediction is remarkably close to the estimated market share (shown in boldface) and,
therefore, provides a strong external validity to the SALS procedure results. These results
provide further support to Moore et al.’s (1998) conclusions that latent segments estimate
aggregate market shares very effectively.
Production Cost and Operating Difficulty Results
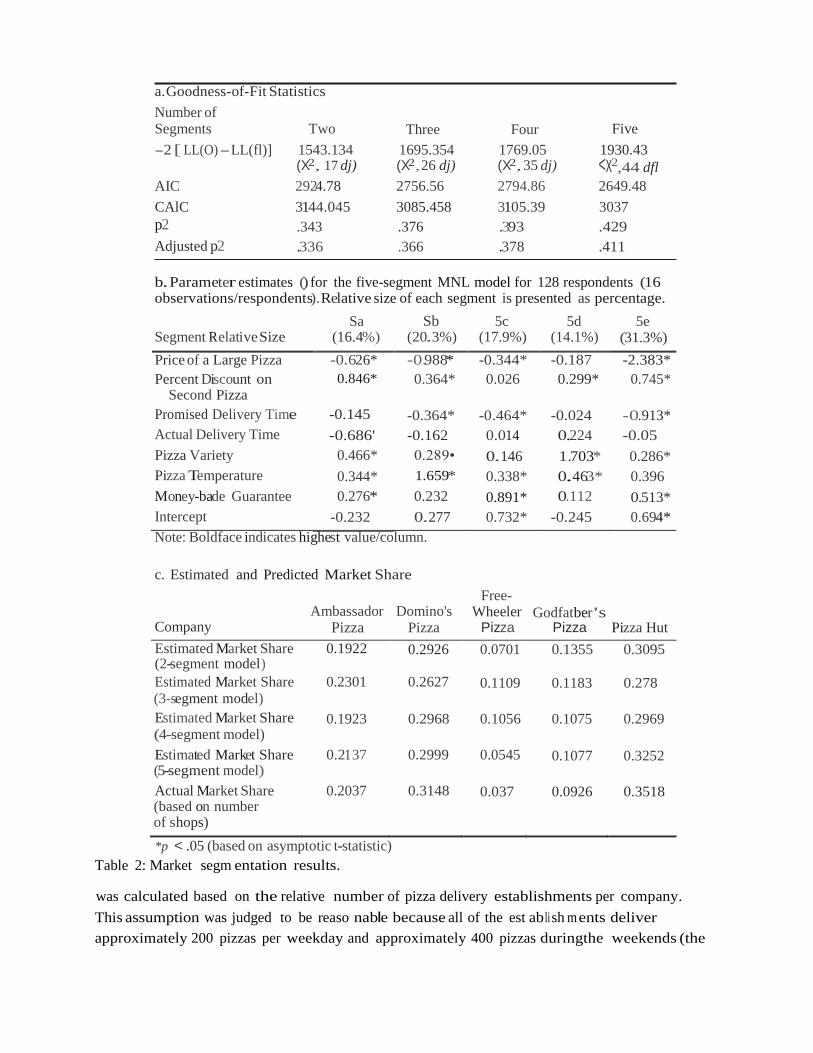
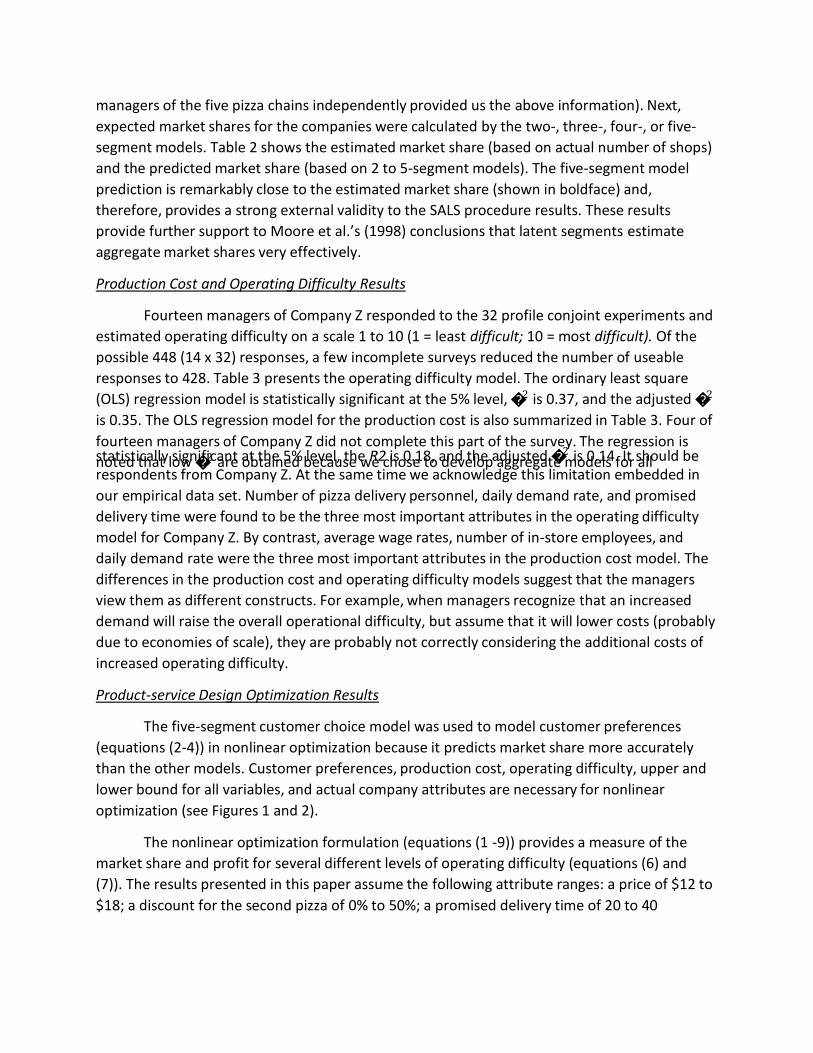
Fourteen managers of Company Z responded to the 32 profile conjoint experiments and
estimated operating difficulty on a scale 1 to 10 (1 = least difficult; 10 = most difficult). Of the
possible 448 (14 x 32) responses, a few incomplete surveys reduced the number of useable
responses to 428. Table 3 presents the operating difficulty model. The ordinary least square
(OLS) regression model is statistically significant at the 5% level, �2 is 0.37, and the adjusted �2
is 0.35. The OLS regression model for the production cost is also summarized in Table 3. Four of fourteen managers of Company Z did not complete this part of the survey. The regression is statistically significant at the 5% level, the R2 is 0.18, and the adjusted �2 is 0.14. It should be noted that low �2 are obtained because we chose to develop aggregate models for all respondents from Company Z. At the same time we acknowledge this limitation embedded in our empirical data set. Number of pizza delivery personnel, daily demand rate, and promised
delivery time were found to be the three most important attributes in the operating difficulty
model for Company Z. By contrast, average wage rates, number of in-store employees, and
daily demand rate were the three most important attributes in the production cost model. The
differences in the production cost and operating difficulty models suggest that the managers
view them as different constructs. For example, when managers recognize that an increased
demand will raise the overall operational difficulty, but assume that it will lower costs (probably
due to economies of scale), they are probably not correctly considering the additional costs of
increased operating difficulty.
Product-service Design Optimization Results
The five-segment customer choice model was used to model customer preferences
(equations (2-4)) in nonlinear optimization because it predicts market share more accurately
than the other models. Customer preferences, production cost, operating difficulty, upper and
lower bound for all variables, and actual company attributes are necessary for nonlinear
optimization (see Figures 1 and 2).
The nonlinear optimization formulation (equations (1 -9)) provides a measure of the
market share and profit for several different levels of operating difficulty (equations (6) and
(7)). The results presented in this paper assume the following attribute ranges: a price of $12 to
$18; a discount for the second pizza of 0% to 50%; a promised delivery time of 20 to 40
minutes; an actual delivery time of 0 to 15 minutes late; availability of pizza with 1,2, or 3 crusts;
pizza temperature either warm or hot; a money-back guarantee either available or not available;
a daily demand rate between 200 and 400 pizzas; and orders either all small sizes or a mix
between small and large sizes. The range for the other process attributes were number of
Table 3: Production cost and operating difficulty models for Company Z (based on 32 responses
each from 14 managers)
delivery personnel from 3 to 7, number of in-store personnel from 3 to 7, average wage rates
from $5 to $8 per hour, pizza preparation and cooking time of 10 to 20 minutes, and supplier
delivery frequencies of either once a week or every other day. To simplify the profit
calculations, the total market size was fixed at 1,000 pizzas. The nonlinear optimization problem
(equations (1)-(9)) was solved using the solver module included within Microsoft Excel.
Table 4 presents the optimization results. We solved the optimization model for each
0.25-unit difficulty range (example 3.5 5 D, 53.75). However, for the sake of simplicity, Table 4
only shows results separated by 0.5 difficulty units. It can be seen clearly that the optimum
profit and the market share increase as the operating difficulty level increases. Figure 3a
illustrates the change in the optimal profit level with the increase in the difficulty level. It shows
that profit increases at a decreasing rate with increases in the difficulty level. The market share
corresponding to optimum profit as a function of operating difficulty is presented in Figure 3b.
The market share increases sharply when the difficulty level is increased from 2.5 to
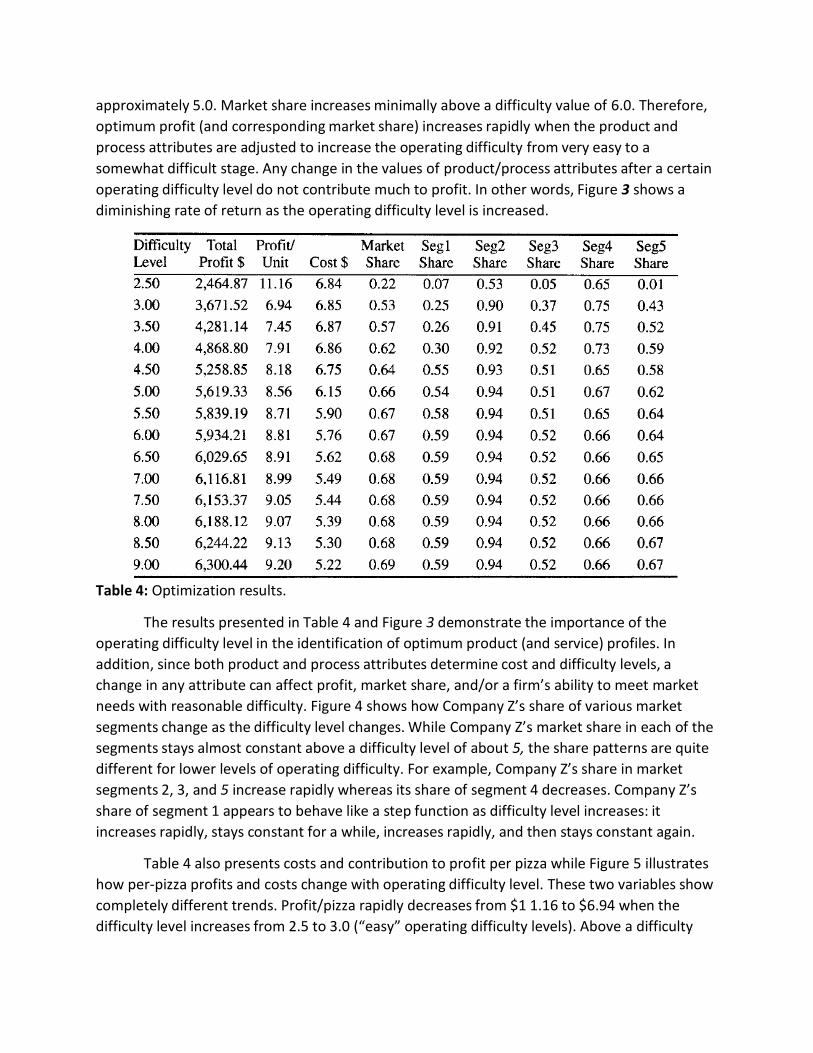
approximately 5.0. Market share increases minimally above a difficulty value of 6.0. Therefore,
optimum profit (and corresponding market share) increases rapidly when the product and
process attributes are adjusted to increase the operating difficulty from very easy to a
somewhat difficult stage. Any change in the values of product/process attributes after a certain
operating difficulty level do not contribute much to profit. In other words, Figure 3 shows a
diminishing rate of return as the operating difficulty level is increased.
Table 4: Optimization results.
The results presented in Table 4 and Figure 3 demonstrate the importance of the
operating difficulty level in the identification of optimum product (and service) profiles. In
addition, since both product and process attributes determine cost and difficulty levels, a
change in any attribute can affect profit, market share, and/or a firm’s ability to meet market
needs with reasonable difficulty. Figure 4 shows how Company Z’s share of various market
segments change as the difficulty level changes. While Company Z’s market share in each of the
segments stays almost constant above a difficulty level of about 5, the share patterns are quite
different for lower levels of operating difficulty. For example, Company Z’s share in market
segments 2, 3, and 5 increase rapidly whereas its share of segment 4 decreases. Company Z’s
share of segment 1 appears to behave like a step function as difficulty level increases: it
increases rapidly, stays constant for a while, increases rapidly, and then stays constant again.
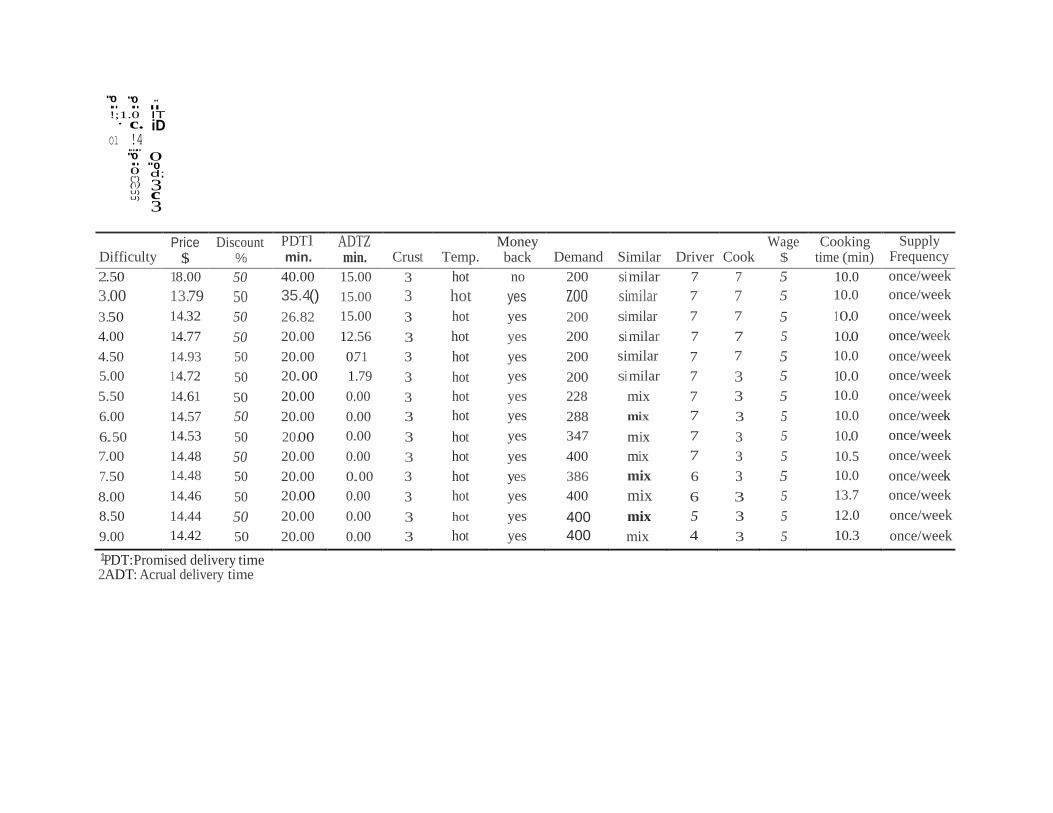
Table 4 also presents costs and contribution to profit per pizza while Figure 5 illustrates
how per-pizza profits and costs change with operating difficulty level. These two variables show
completely different trends. Profit/pizza rapidly decreases from $1 1.16 to $6.94 when the
difficulty level increases from 2.5 to 3.0 (“easy” operating difficulty levels). Above a difficulty
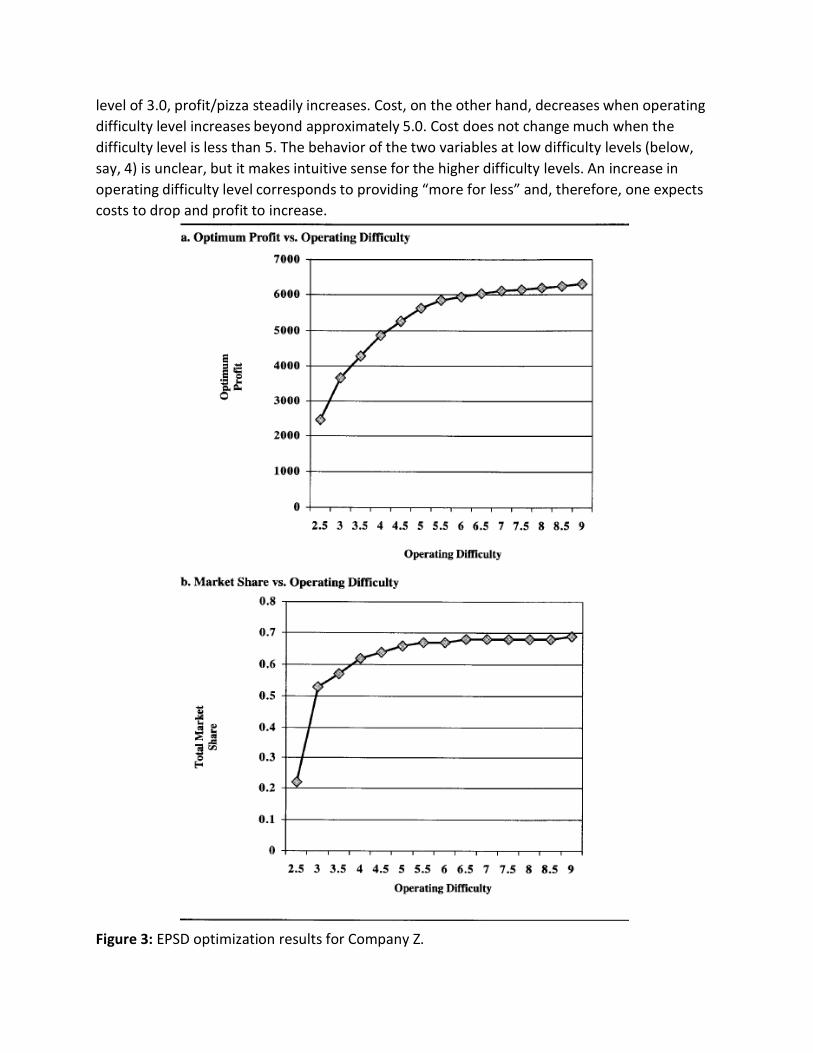
Figure 3: EPSD optimization results for Company Z.
level of 3.0, profit/pizza steadily increases. Cost, on the other hand, decreases when operating
difficulty level increases beyond approximately 5.0. Cost does not change much when the
difficulty level is less than 5. The behavior of the two variables at low difficulty levels (below,
say, 4) is unclear, but it makes intuitive sense for the higher difficulty levels. An increase in
operating difficulty level corresponds to providing “more for less” and, therefore, one expects
costs to drop and profit to increase.
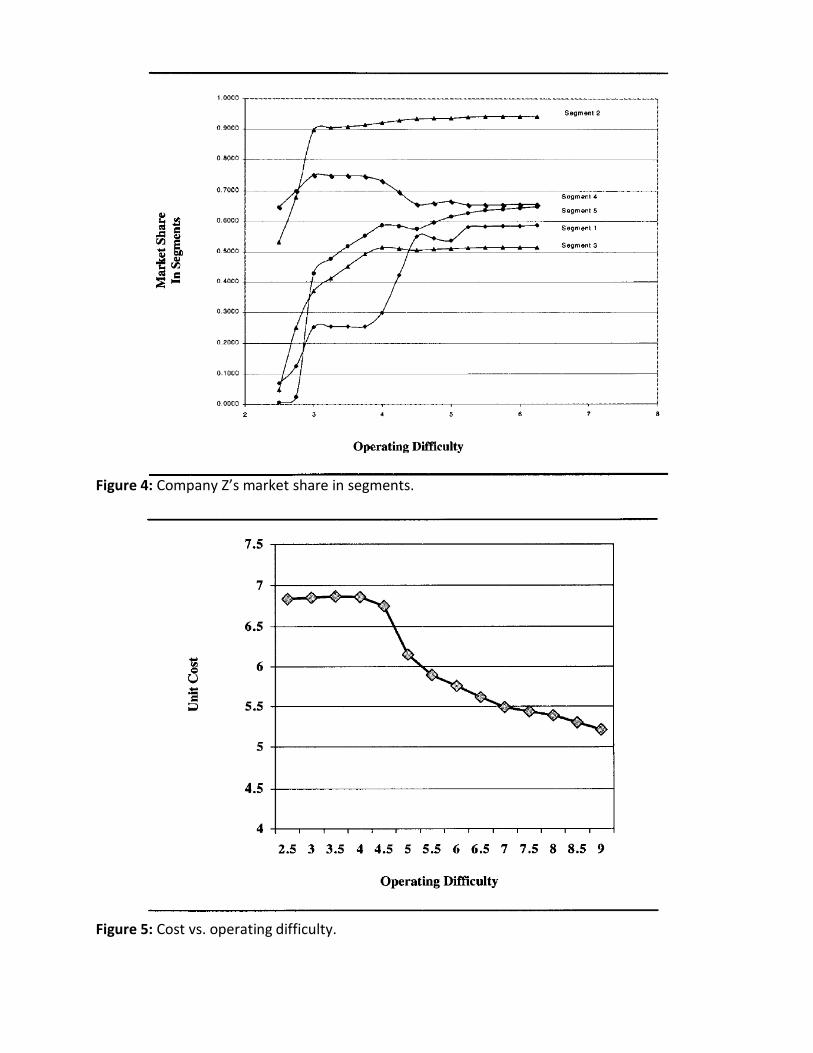
Figure 5: Cost vs. operating difficulty.
Figure 4: Company Z’s market share in segments.
c 3
"0
".0.. ".0.. .... !;1.0 IT · c. iD
Ol .!...4.. ".0.. 0 0 d; (")
(\) U) U)
3
Difficulty
Price $
Discount %
PDTl min.
ADTZ min.
Crust
Temp.
Money back
Demand
Similar
Driver
Cook
Wage $
Cooking time (min)
Supply Frequency
2.50 18.00 50 40.00 15.00 3 hot no 200 si milar 7 7 5 10.0 once/week
3.00 13.79 50 35.4() 15.00 3 hot yes zoo similar 7 7 5 10.0 once/week
3.50 14.32 50 26.82 15.00 3 hot yes 200 similar 7 7 5 1 0.0 once/week
4.00 14.77 50 20.00 12.56 3 hot yes 200 si milar 7 7 5 10.0 once/week
4.50 14.93 50 20.00 0.71 3 hot yes 200 similar 7 7 5 10.0 once/week
5.00 14.72 50 20.00 1.79 3 hot yes 200 si milar 7 3 5 10.0 once/week
5.50 14.61 50 20.00 0.00 3 hot yes 228 mix 7 3 5 10.0 once/week
6.00 14.57 50 20.00 0.00 3 hot yes 288 mix 7 3 5 10.0 once/week
6.50 14.53 50 20.00 0.00 3 hot yes 347 mix 7 3 5 10.0 once/week
7.00 14.48 50 20.00 0.00 3 hot yes 400 mix 7 3 5 10.5 once/week
7.50 14.48 50 20.00 0.00 3 hot yes 386 mix 6 3 5 10.0 once/week
8.00 14.46 50 20.00 0.00 3 hot yes 400 mix 6 3 5 13.7 once/week
8.50 14.44 50 20.00 0.00 3 hot yes 400 mix 5 3 5 12.0 once/week
9.00 14.42 50 20.00 0.00 3 hot yes 400 mix 4 3 5 10.3 once/week
1PDT:Promised delivery time 2ADT: Acrual delivery time
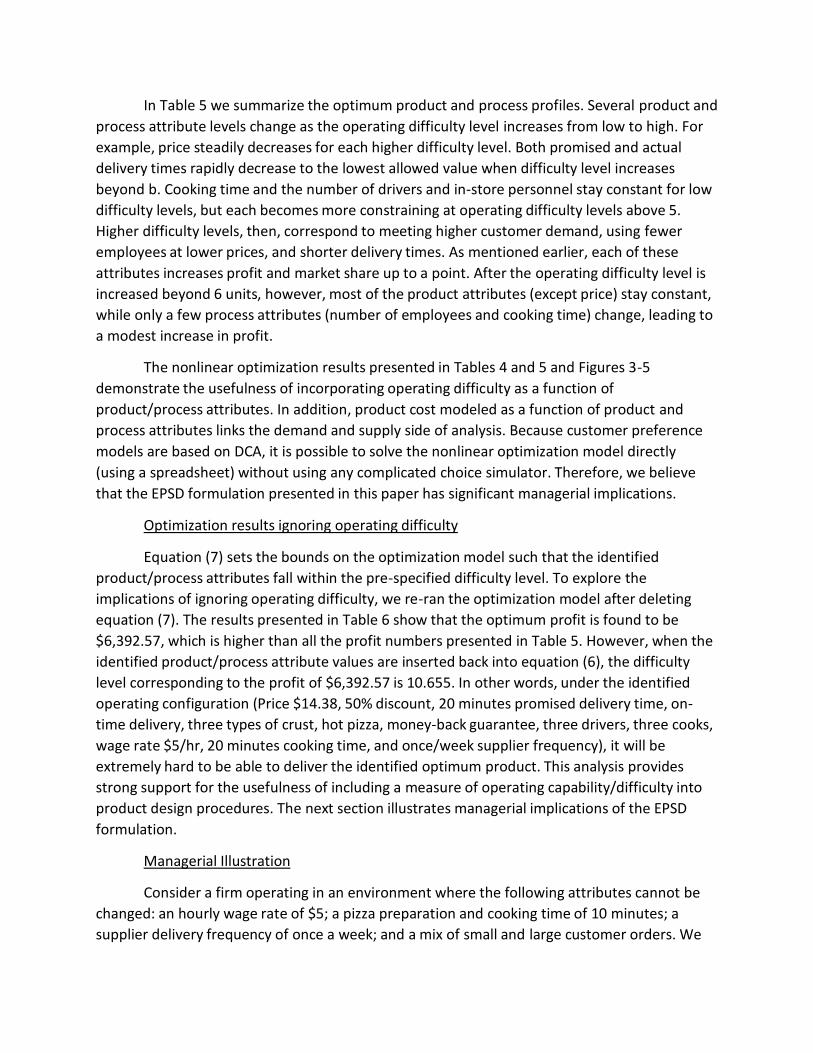
In Table 5 we summarize the optimum product and process profiles. Several product and
process attribute levels change as the operating difficulty level increases from low to high. For
example, price steadily decreases for each higher difficulty level. Both promised and actual
delivery times rapidly decrease to the lowest allowed value when difficulty level increases
beyond b. Cooking time and the number of drivers and in-store personnel stay constant for low
difficulty levels, but each becomes more constraining at operating difficulty levels above 5.
Higher difficulty levels, then, correspond to meeting higher customer demand, using fewer
employees at lower prices, and shorter delivery times. As mentioned earlier, each of these
attributes increases profit and market share up to a point. After the operating difficulty level is
increased beyond 6 units, however, most of the product attributes (except price) stay constant,
while only a few process attributes (number of employees and cooking time) change, leading to
a modest increase in profit.
The nonlinear optimization results presented in Tables 4 and 5 and Figures 3-5
demonstrate the usefulness of incorporating operating difficulty as a function of
product/process attributes. In addition, product cost modeled as a function of product and
process attributes links the demand and supply side of analysis. Because customer preference
models are based on DCA, it is possible to solve the nonlinear optimization model directly
(using a spreadsheet) without using any complicated choice simulator. Therefore, we believe
that the EPSD formulation presented in this paper has significant managerial implications.
Optimization results ignoring operating difficulty
Equation (7) sets the bounds on the optimization model such that the identified
product/process attributes fall within the pre-specified difficulty level. To explore the
implications of ignoring operating difficulty, we re-ran the optimization model after deleting
equation (7). The results presented in Table 6 show that the optimum profit is found to be
$6,392.57, which is higher than all the profit numbers presented in Table 5. However, when the
identified product/process attribute values are inserted back into equation (6), the difficulty
level corresponding to the profit of $6,392.57 is 10.655. In other words, under the identified
operating configuration (Price $14.38, 50% discount, 20 minutes promised delivery time, on-
time delivery, three types of crust, hot pizza, money-back guarantee, three drivers, three cooks,
wage rate $5/hr, 20 minutes cooking time, and once/week supplier frequency), it will be
extremely hard to be able to deliver the identified optimum product. This analysis provides
strong support for the usefulness of including a measure of operating capability/difficulty into
product design procedures. The next section illustrates managerial implications of the EPSD
formulation.
Managerial Illustration
Consider a firm operating in an environment where the following attributes cannot be
changed: an hourly wage rate of $5; a pizza preparation and cooking time of 10 minutes; a
supplier delivery frequency of once a week; and a mix of small and large customer orders. We
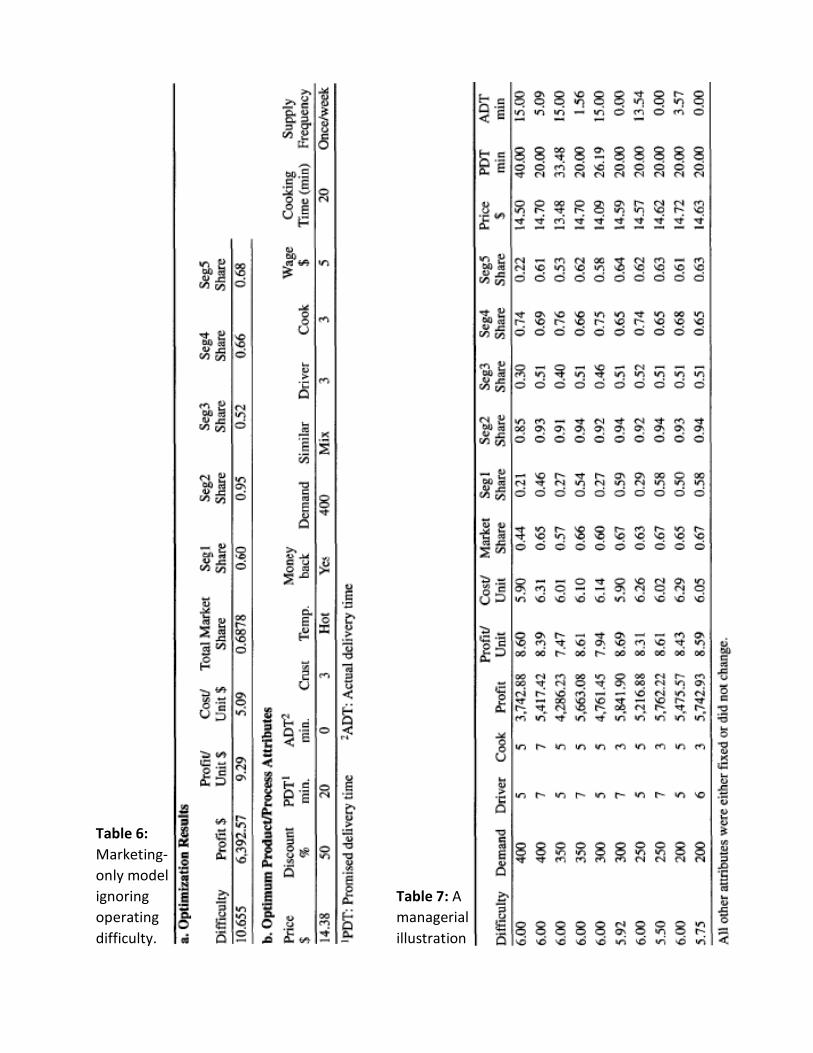
Table 6:
Marketing-
only model
ignoring Table 7: A
operating managerial
difficulty. illustration
assume that the firm currently employs five drivers and five in-store personnel, and that
management wishes to identify the optimum profit-maximizing product profile at a reasonable
difficulty level (say between 5 and 6). Further, we assume that management would like to know
the impact on the optimal product profile (and the corresponding total profit, market share,
profit cost, cost) if they change the number of employees (drivers, in-store personnel).
The EPSD formulation (equations (1-9)) can be easily modified to solve the above
problem. All of the process attributes can be fixed at the predetermined level, and the optimum
product profile can be identified for difficulty range 5-6. Next, the number of employees can be
allowed to vary along with product attributes, and the problem can be re-solved.
Table 7 presents results for the above managerial illustration. We solved the problem
for both baseline (fixed number of employees) and alternative (variable number of employees)
operating conditions under daily demand rates of 200,250, 300, 350, and 400. The results
presented in Table 7 show that the values of three product attributes–price, promised delivery
time, and actual delivery time–change between the baseline and alternative operating
conditions. The number of employees changed for each demand under the alternative
operating condition. Note that for each demand level, the optimum profit increased
significantly without increasing operating difficulty level.
The above (simplified) illustration demonstrates the managerial usefulness of the EPSD
formulation. Depending on the process configuration, managers can perform various “what-if’
types of analyses without any need for intense calculations. Once the customer preferences,
production cost, and operating difficulty models are ready, optimum product profiles can be
easily identified on a spreadsheet.
Conclusions
The objective of this study was to develop a model for effective product/service design
that integrates customer choice, production cost, and operating difficulty. Data collected from
customers and managers of the pizza delivery industry demonstrate that an optimum product
design depends not only on customer preferences and product cost information, but also on
the relative managerial difficulty in meeting market needs under a given operating
configuration (Figures 2-4). In other words, if one ignores operating difficulty, which is a
function of product and process attributes, one risks identifying product profiles that appear to
be cost effective, very profitable, and/or capture market share, but are in fact very difficult to
produce and deliver to the customers. Our EPSD model thus better represents the nuances of
product design decisions that management faces.
We observed (Figure 2) a “diminishing rate of return” effect between operating
difficulty, profitability, and market share. Recall that difficulty was represented as a function of
product and operating attributes. Therefore, an increase in difficulty might mean that a given
set of operating attributes has to deliver a larger number of higher quality products more
quickly. Additional pressure on operating attributes can be expected to result in a higher level
of productivity, but the rate of increase in productivity cannot be expected to be linearly
related to increase in difficulty level.
Several business management articles published in the last 10 years or so have argued
that operations capabilities should be aligned according to market needs if operations
management is to become a competitive weapon in a firm. This article presents an approach
that can help management achieve that goal. We propose and show that manager’ abilities to
meet customer needs depend not only on customer demand patterns but also on operating
variables. These results provide insight into the complex issue of effective coordination
between marketing and operations functions of a firm. In other words, this study provides
empirical support to an integrated approach to product design and management.
Limitations and Directions for Future Research
We believe that the EPSD formulation and empirical results presented in this paper
contribute to both operations management and marketing literatures as documented above.
However, the study does have some limitations, which should be addressed in future research
projects. For example, the EPSD formulation does not consider the implications of changing
product/service attributes of competitors. One can argue that to accurately represent the
market conditions, a multiperiod model (such as a game-theoretic approach) should be
developed that can assess the impact of changing one or more attribute by competitors
simultaneously.
The interrelationships between operating difficulty and cost need further exploration.
We modeled both of the above constructs as functions of product-service and process
attributes and noticed that statistically significant variables differ between the two models. We
also demonstrated the nonlinear relationships between the above two constructs for the
identified optimum products (see Figure 5b). In addition, the results presented in Table 6
showed that ignoring operating difficulty results in a solution that might be very difficult to
achieve. Although these results are interesting, we have not tested the applicability of
operating difficulty as an essential construct for other managerial analyses. Therefore, EPSD
formulation is only a first step towards building an integrated marketing-operations- based
product-service and process design procedure.
The current study also suffers from the usual problems of empirical research. For
example, low �2 for operating difficulty and cost models suggest that we must identify better
measures for representing these constructs. In addition, the study should be repeated in more complex service environments to further validate the proposed constructs and optimization
model formulation. [Received: March 8, 1999. Accepted: March 2, 2001.]
References
Abegglen, J. C., & Stalk, G., Jr. (1985). KAZSHA, The Japanese corporation. New York: Basic
Books.
Bachem, A., & Simon, H. (1981). A product positioning model with costs and prices. European
Journal of Operational Research, 7,362-370.
Balakrishnan P. V. (Sundar), & Jacob, V. S. (1996). Genetic algorithms for product design.
Management Science, 42(8), 1105-1 117.
Ben-Akiva, M., & Lerman, S. R. (1991). Discrete choice analysis. Cambridge, MA: MIT Press.
Bhoovaraghavan, S., Vasudevan, A., & Chandran, R. (1996). Resolving the process vs. product
innovation dilemma: A consumer choice theoretic approach. Management Science,
42(2), 232-246.
Burchill, G., & Fine, C. H. (1997). Time versus market orientation in product concept
development: Empirically-based theory generation. Management Science, 43(4), 465-
478.
Chakravarty, A. K., & Ghose, S. (1993). Tracking product-process interactions: A research
paradigm. Production and Operations Management, 2(2), 72-93.
Chase, R. (1996). The mall is my factory: Reflections of a service junkie. Production and
Operations Management, 5(4), 298-308.
Choi, S. C., DeSarbo, W. S., & Harker, P. T. (1990). Product positioning under price competition.
Management Science, 36(2), 175-198.
Clark, K. B., & Fujimoto, T. (1990). The power of product integrity. Harvard Business Review,
90(6), 107-1 18.
Currim, I. S. (1981). Using segmentation approaches for better prediction and understanding
from consumer mode choice models. Journal of Marketing Research, 18(August), 301-
309.
Dickson, P. R., & Ginter J. L. (1987). Market segmentation, product differentiation, and
marketing strategy. Journal of Marketing, 51 (2), 1-10.
Elrod, R., Louviere, J. J., & Davey, K. (1992). An empirical comparison of ratings based and
choice-based conjoint models. Journal of Marketing Research, 29
Ettlie, J. E. (1 995). Product-process development integration in manufacturing. Management
Science, 41(7), 1224-1237.
Fitzsimmons, J. A., Kouvelis, P., & Mallick, D. N. (1991). Design strategy and its interface with
manufacturing and marketing: A conceptual framework. Journal of Operations
Management, 10(3), 398-41 5.
Garvin, D. A. (1987). Competing on the eight dimensions of quality. Harvard Business Review,
November-December.
Gavish, B., Horsky, D., & Srikanth, K. (1983). An approach to the optimal positioning of a new
product. Management Science, 29(11), 1277-1297.
Gibney, F., Jr., & Luscombe, B. (2000). The redesigning of America. Time, March
Green, P. E., Carroll, J. D., & Goldberg, S. M. (1981). A general approach to product design
optimization via conjoint analysis. Journal of Marketing, 45, Summer, 17-37.
Green, P. E., & Krieger, A. M. (1987). A consumer-based approach to designing product line
extensions. Journal of Product Innovation Management, 4, 2 1 - 32.
Green, P. E., & Krieger, A. M. (1989). Recent contributions to optimal product positioning and
buyer segmentations. European Journal of Operational Research, 41, 127-141.
Green, P. E., & Krieger, A. M. (1991a). Product design strategies for target-market positioning.
Journal of Product Innovation Management, 8, 189-202.
Green, P. E., & Krieger, A. M. (1991b). Segmenting markets with conjoint analysis. Journal of
Marketing, Oct., 20-31.
Green, P. E., & Krieger, A. M. (1996). Individualized hybrid models for conjoint analysis.
Management Science, 42(6), 850-867.
Griffin, A., & Hauser, J. R. (1993). The voice of the customer. Marketing Science, 12(1, Winter),
1-27.
Hair, J. F., Jr., Anderson, R. E., Tatham, R. L., & Black, W. C. (1998). Multivariate data analysis.
Englewood Cliffs, NJ: Prentice Hall.
Hauser, J. R., & Clausing, D. (1988). The house of quality. Harvard Business Review, 66, 63-73.
Hayes, R. H., & Wheelwright, S. C. (1984). Restoring our competitive edge: Competing through
manufacturing. New York: John Wiley & Sons.
Hensher, D. A., & Chow, G. (1998). Interacting agents and discrete choices in logistics
outsourcing: A conceptual framework. Working Paper, Institute for Transport Studies,
University of Sydney.
Heskett, J. L. (1987). Lessons in the service sector. Harvard Business Review, March-April.
Hill, T. (1989). Manufacturing strategy: Text and cases. Homewood, IL: Irwin.
Horowitz, J. L., & Louviere, J. J. (1993). Testing predicted choices against observations in
probabilistic discrete choice models. Marketing Science, 12(3),
Intelligent Marketing Systems. (1992a). CONSERV software program and user’s manual,
Edmonton, Canada.
Intelligent Marketing Systems. (1992b). NTELOGI7: software program and user’s manual,
Edmonton, Canada.
Johnson, H. T., & Kaplan, R. S. (1987). Relevance lost: The rise and fall of management
accounting. Cambridge, MA: Harvard Business School Press.
Jordan, W. C., & Graves, S. C. (1995). Principles on the benefits of manufacturing process
flexibility. Management Science, 41 (4), 577-594.
Karmarkar, U. S. (1996). Integrative research in marketing and operations management. Journal
of Marketing Research, May, 125-133.
Kekre, S., & Srinivasan, K. (1990). Boarder product line: A necessity to achieve success.
Mnnagement Science, 36(10), 1216-1231.
Kirkpartick, S., Gelatt, C. D., Jr., & Vecchi, M. P. (1983). Optimization by simulated annealing.
Science, 220,67 1-683.
Kohli, R., & Krishnamurti, R. (1987). A heuristic approach to product design. Management
Science, 33, 1523-1533.
Lee, H. L., & Tang, C. S. (1997). Modeling the costs and benefits of delayed product
differentiation. Management Science, 43 (1), 40-53.
Louviere, J. J. (1988). Analyzing decision making: Metric conjoint analysis. Newbury Park, CA:
Sage.
Louviere, J. J., Fox, M. F., & Moore, W. L. (1993). Cross validity comparison of stated preference
choice models. Marketing Letters, 4(3), 205-213.
Louviere, J. J., Hensher, D. A., & Swait, J. D. (2001). Stated preference methods: Analysis and
application. Cambridge, UK: Cambridge University Press.
McBride, R. D., & Zufryden, F. S. (1988). An integer programming approach to the optimal
product line selection problem. Marketing Science, 7(2), 126-140.
McDuffie, J. P., Sethuraman, K., & Fisher, M. L. (1996). Product variety and manufacturing
performance: Evidence from the international automobile assembly plant study.
Management Science, 42(3), 350-369.
McFadden, D. (1986). The choice theory approach to marketing research. Marketing Science,
5(4), 275-297.
Meyer, M. H., & Lehnerd, A. P. (1997). The power of product platforms: Building value and cost
leadership. New York: The Free Press.
Meyer, M. H., Tertzakian, P., & Utterback, J. M. (1997). Metrics for managing research and
development in the context of product family. Management Science, 43(1), 88-111.
Moore, W. L., Gray-Lee, J., & Louviere, J. J. (1998). A cross-validity comparison of conjoint
analysis and choice models at different levels of aggregation. Marketing Letters, 9(2),
195-207.
Moore, W. L., Louviere, J. J., & Verma, R. (1999). Using conjoint analysis to help design product
platforms. Journal of Product Innovation Management,
Morgan, L. O., Daniels, R. L., & Kouvelis, P. (1996). Marketing/manufacturing tradeoffs in
product line management: Insights from a mathematical programming model. Working
paper, University of Utah.
Nair, S. K., Thakur, L. S., & Wen, K. (1995). Near optimal solutions for product line design and
selection: Beam search heuristics. Management Science,
Nevins, J. L., & Whitney, D. E. (1989). Concurrent design of products and processes. New York:
McGraw Hill.
Parasuraman, A., Zeithaml, V. A., & Berry, L. L. (1985). A conceptual model of service quality
and its implications for future research. Journal of Marketing, 49, Fall, 41-50.
Park, T., & Kim, K. (1998). Determination of an optimal set of design requirement using house of
quality. Journal of Operations Management, 16,569-58 1.
Pine, B. J., 11. (1993). Mass customization: The new frontier in business competition.
Cambridge, MA: Harvard Business School Press.
Pullman, M. E., Goodale, J. C., & Verma, R. (2000). Service capacity design with an integrated
market-utility-based method. In J. A. Fitzsimons & M. J. Fitzsimmons (Eds.), New service
development: Creating memorable experiences. Thousand Oaks, CA: Sage.
Pullman, M. E., & Moore, W. L. (1999). Optimal service design: Integrating marketing and
operations perspectives. International Journal of Service Industry Management, 10(2),
239-260.
Pullman, M. E., Verma, R., & Goodale, J. C. (2001). Service design and operations strategy
formulation in multicultural markets. Journal of Operations Management, 19(2), 239-
254.
Raman, N., & Chhajed, D. (1995). Simultaneous determination of product attributes and prices,
and production processes in product-line design. Journal of Operations Management,
12, 187-204.
Ramdas, K., & Sawhney, M. S. (1999). A cross functional approach to evaluating multiple line
extensions for assembled products. Report #99-105, Boston, MA: Marketing Science
Institute.
Safizadeh, M. H., Ritzman, L. P., Sharma, D., & Wood, C. (1996). An empirical analysis of the
product-process matrix. Management Science, 42 (1), 1576-1591.
Shocker, A. D., & Srinivasan, V. (1974). A consumer-based methodology for the identification of
new product ideas. Management Science, 20(6), 921-937.
Shocker, A. D., & Srinivasan, V. (1979). Multiattribute approaches for product concept
evaluation and generation: A critical review. Journal of Marketing Research, 16(5), 159-
180.
Skinner, W. (1974). The focused factory. Harvard Business Review, May-June,
Srinivasan, V., Lovejoy, W. S., & Beach, D. (1997). Integrated product design for marketability
and manufacturing. Journal of Marketing Research, 34 (February), 154-163
Sudharshan, D., May, J. H., & Gruca, T. (1988). DIFFSTRAT An analytical procedure for
generating optimal new product concepts for a differentiated-type strategy. European
Journal of Operational Research, 36, 50-65.
Verma, R., Thompson, G. M., & Louviere, J. J. (1999). Configuring service operations in
accordance with customers needs and preferences. Journal of Service Research, 1(3),
262-274.
Vriens, M., Oppewal, H., & Wedel, M. (1998). Rating-based versus choice-based latent class
conjoint models-An empirical comparison. Journal of the Market Research Society,
40(3), 237-248.
Wasserman, G. S. (1993). On how to prioritize design requirements during the QFD planning
process. IIE Transactions, 25(3), 59-65.
Zufryden, F. S. (1979). ZIPMAP-A zero-one integer programming model for market
segmentation and product positioning. Journal of Operational Research Society, 30 (1),
63-70.
Copyright © 2022 FDOKUMEN