Effect of total sleep deprivation on postprandial metabolic and insulin responses in shift workers...
11
Effect of total sleep deprivation on postprandial metabolic and insulin responses in shift workers and non-shift workers Sophie M T Wehrens, Shelagh M Hampton, Rebecca E Finn and Debra J Skene Centre for Chronobiology, Faculty of Health and Medical Sciences, University of Surrey, Guildford GU2 7XH, UK (Correspondence should be addressed to S M T Wehrens; Email: [email protected] or to D J Skene; Email: [email protected]) Abstract Epidemiological studies have shown that shift workers are at a greater risk of developing cardiovascular disease which may, in part, be related to metabolic and hormonal changes. Partial sleep deprivation, a common consequence of rotating shift work, has been shown to affect glucose tolerance and insulin sensitivity. The current study investigated the effects of one night of total sleep deprivation, as a proxy for the first night shift, on postprandial glucose, insulin and lipid (triacylglycerols (TAGs) and non-esterified fatty acids (NEFAs)) responses under controlled laboratory conditions in shift workers and non-shift workers. Eleven experienced shift workers (35 . 7G7 . 2 years, meanGS.D .) who had worked in shifts for 8 . 7G5 . 25 years were matched with 13 non-shift workers who had worked for 32 . 8G6 . 4 years. After an adaptation night and a baseline sleep night, volunteers were kept awake for 30 . 5 h, followed by a nap (4 h) and recovery sleep. Blood samples were taken prior to and after a standard breakfast following baseline sleep, total sleep deprivation and recovery sleep. Basal TAG levels prior to the standard breakfast were significantly lower after sleep deprivation, indicating higher energy expenditure. Basal NEFA levels were significantly lower after recovery sleep. Postprandial insulin and TAG responses were significantly increased, and the NEFA response was decreased after recovery sleep, suggestive of insulin insensitivity. Although there were no overall significant differences between non-shift workers and shift workers, non-shift workers showed significantly higher basal insulin levels, lower basal NEFA levels, and an increased postprandial insulin and a decreased NEFA response after recovery sleep. In future, the reasons for these inter-group differences are to be investigated. Journal of Endocrinology (2010) 206, 205–215 Introduction Epidemiological studies have shown that shift workers may be at a higher risk of developing cardiovascular disease (CVD; e.g. Kawachi et al. 1995, Boggild & Knutsson 1999, Karlsson et al. 2001, 2003, Ellingsen et al. 2007, Sookoian et al. 2007, De Bacquer et al. 2009, Esquirol et al. 2009). The mechanisms underlying this phenomenon are still unclear, but the increased risk may, in part, be related to circadian misalignment (Knutsson & Boggild 2000). The circadian clock plays an important role in the regulation of endogenous metabolic processes (Woon et al. 2007, Green et al. 2008, Monteleone et al. 2008, Scott et al. 2008, Sookoian et al. 2008). Under entrained or adapted circumstances, these endogenous processes are synchronised to or in phase with daily routines, such as food intake and sleep. However, shift work studies done by our group (Hampton et al. 1996, Ribeiro et al. 1998, Lund et al. 2001) and by other groups (Simon et al. 2000, Scheer et al. 2009) have shown altered hormone and metabolic responses when subjects were phase shifted (i.e. intake of food at a different circadian clock time). In addition to circadian misalignment, sleep deprivation commonly occurs during rotating shift work or permanent night work (e.g. Akerstedt 1998, Pilcher et al. 2000, Sallinen et al. 2003). Epidemiological research has shown that sleep deprivation is associated with obesity, hypertension, and metabolic and hormonal changes associated with CVD (e.g. Taheri et al. 2004, Gangwisch et al. 2006). In agreement with these reports, laboratory studies have demonstrated decreased glucose tolerance and insulin sensitivity after partial sleep deprivation, restricting sleep to either 5 . 5 h for 14 nights or 4 h for 6 nights (Spiegel et al. 1999, Nedeltcheva et al. 2009), and a significant reduction in the triacylglycerol (TAG) rhythm amplitude and average TAG levels after 3–5 days of total sleep deprivation (Vondra et al. 1986). Furthermore, it is likely that there are inter-individual differences in the vulnerability to the effects of shift work and sleep deprivation, due to, for example, diurnal preference (morningness–eveningness; Taillard et al. 1999, Mongrain et al. 2006), genetics (Retey et al. 2006, Viola et al. 2007, 2008) or shift work history. Epidemiological studies, however, do not always detail the shift work duration, so it is difficult to assess the relationship between shift work duration and adverse health effects. The shift work duration beyond which health effects are measurable may range from more than 6 to 10 years (Kawachi et al. 1995, De Bacquer et al. 2009, 205 Journal of Endocrinology (2010) 206, 205–215 DOI: 10.1677/JOE-10-0077 0022–0795/10/0206–205 q 2010 Society for Endocrinology Printed in Great Britain Online version via http://www.endocrinology-journals.org
Transcript of Effect of total sleep deprivation on postprandial metabolic and insulin responses in shift workers...

205
Effect of total sleep deprivation on
postprandial metabolic and insulinresponses in shift workers and non-shift workersSophie M T Wehrens, Shelagh M Hampton, Rebecca E Finn and Debra J Skene
Centre for Chronobiology, Faculty of Health and Medical Sciences, University of Surrey, Guildford GU2 7XH, UK
(Correspondence should be addressed to S M T Wehrens; Email: [email protected] or to D J Skene; Email: [email protected])
Abstract
Epidemiological studies have shown that shift workers are at
a greater risk of developing cardiovascular disease which
may, in part, be related to metabolic and hormonal changes.
Partial sleep deprivation, a common consequence of rotating
shift work, has been shown to affect glucose tolerance and
insulin sensitivity. The current study investigated the effects
of one night of total sleep deprivation, as a proxy for the
first night shift, on postprandial glucose, insulin and lipid
(triacylglycerols (TAGs) and non-esterified fatty acids
(NEFAs)) responses under controlled laboratory conditions
in shift workers and non-shift workers. Eleven experienced
shift workers (35.7G7.2 years, meanGS.D.) who had worked
in shifts for 8.7G5.25 years were matched with 13 non-shift
workers who had worked for 32.8G6.4 years. After an
adaptation night and a baseline sleep night, volunteers were
kept awake for 30.5 h, followed by a nap (4 h) and recovery
Journal of Endocrinology (2010) 206, 205–2150022–0795/10/0206–205 q 2010 Society for Endocrinology Printed in Great
sleep. Blood samples were taken prior to and after a standard
breakfast following baseline sleep, total sleep deprivation and
recovery sleep. Basal TAG levels prior to the standard
breakfast were significantly lower after sleep deprivation,
indicating higher energy expenditure. Basal NEFA levels were
significantly lower after recovery sleep. Postprandial insulin
and TAG responses were significantly increased, and the
NEFA response was decreased after recovery sleep, suggestive
of insulin insensitivity. Although there were no overall
significant differences between non-shift workers and shift
workers, non-shift workers showed significantly higher basal
insulin levels, lower basal NEFA levels, and an increased
postprandial insulin and a decreased NEFA response after
recovery sleep. In future, the reasons for these inter-group
differences are to be investigated.
Journal of Endocrinology (2010) 206, 205–215
Introduction
Epidemiological studies have shown that shift workers may be
at a higher risk of developing cardiovascular disease (CVD;
e.g. Kawachi et al. 1995, Boggild & Knutsson 1999, Karlsson
et al. 2001, 2003, Ellingsen et al. 2007, Sookoian et al. 2007,
De Bacquer et al. 2009, Esquirol et al. 2009). The mechanisms
underlying this phenomenon are still unclear, but the
increased risk may, in part, be related to circadian
misalignment (Knutsson & Boggild 2000). The circadian
clock plays an important role in the regulation of endogenous
metabolic processes (Woon et al. 2007, Green et al. 2008,
Monteleone et al. 2008, Scott et al. 2008, Sookoian et al.
2008). Under entrained or adapted circumstances, these
endogenous processes are synchronised to or in phase with
daily routines, such as food intake and sleep. However, shift
work studies done by our group (Hampton et al. 1996,
Ribeiro et al. 1998, Lund et al. 2001) and by other groups
(Simon et al. 2000, Scheer et al. 2009) have shown altered
hormone and metabolic responses when subjects were phase
shifted (i.e. intake of food at a different circadian clock time).
In addition to circadian misalignment, sleep deprivation
commonly occurs during rotating shift work or permanent
night work (e.g. Akerstedt 1998, Pilcher et al. 2000, Sallinen
et al. 2003). Epidemiological research has shown that sleep
deprivation is associated with obesity, hypertension, and
metabolic and hormonal changes associated with CVD (e.g.
Taheri et al. 2004, Gangwisch et al. 2006). In agreement with
these reports, laboratory studies have demonstrated decreased
glucose tolerance and insulin sensitivity after partial sleep
deprivation, restricting sleep to either 5.5 h for 14 nights or
4 h for 6 nights (Spiegel et al. 1999, Nedeltcheva et al. 2009),
and a significant reduction in the triacylglycerol (TAG)
rhythm amplitude and average TAG levels after 3–5 days of
total sleep deprivation (Vondra et al. 1986).
Furthermore, it is likely that there are inter-individual
differences in the vulnerability to the effects of shift work and
sleep deprivation, due to, for example, diurnal preference
(morningness–eveningness; Taillard et al. 1999, Mongrain
et al. 2006), genetics (Retey et al. 2006, Viola et al. 2007,
2008) or shift work history. Epidemiological studies, however,
do not always detail the shift work duration, so it is difficult to
assess the relationship between shift work duration and
adverse health effects. The shift work duration beyond which
health effects are measurable may range from more than
6 to 10 years (Kawachi et al. 1995, De Bacquer et al. 2009,
DOI: 10.1677/JOE-10-0077Britain Online version via http://www.endocrinology-journals.org
S M T WEHRENS and others . Sleep deprivation and postprandial metabolism206
Esquirol et al. 2009) to as short as 1–2 years (Knutsson et al.
1986, Schernhammer et al. 2001). Long-term shift work
may lead to either adaptation or sensitisation to the effects of
sleep deprivation. This suggests that non-shift workers
and experienced shift workers may respond differently
when subjected to the same sleep restriction conditions and
dietary intake.
The effect of one night of total sleep deprivation on basal
glucose and insulin levels and the postprandial response to a
standard breakfast have not been investigated yet, even though
total sleep deprivation is similar to the first night shift for
many shift workers (e.g. Pilcher et al. 2000, Akerstedt 2003,
Sallinen et al. 2003). A nap is often taken after this night shift,
although this occurence and length of sleep and nap periods
appears to be highly dependent on the shift work pattern
and other circumstances, such as family commitments
(Pilcher et al. 2000, Akerstedt 2003, Sallinen et al. 2003).
In addition, the effects of shift work experience have not
been assessed when food is given at a normal circadian clock
time (i.e. similar to what occurs in non-shift workers).
Finally, shift workers and matched non-shift workers have
not been compared simultaneously under controlled
laboratory conditions.
The aim of the current study was to investigate the effect
of one night of total sleep deprivation per se compared to
baseline sleep and recovery sleep on basal and postprandial
metabolic and insulin responses following a standard break-
fast under controlled laboratory conditions. In addition, the
responses of experienced shift workers (with a shift work
duration of 5 years or more) were compared with those of
non-shift workers.
Materials and Methods
Procedures
The University of Surrey Ethics Committee gave a favourable
opinion for all the aspects of this study. All volunteer
information was kept coded and held in strictest confidence
in compliance with the Data Protection Act (1998). Male shift
workers and non-shift workers between 25 and 45 years of age
were recruited. All the participants gave written informed
consent. Written consent was also obtained from the subject’s
general practitioner confirming the subject’s suitability to
participate in the study.
Pre-study screening and the laboratory part of the study
took place in the Clinical Investigation Unit (CIU) of the
Faculty of Health and Medical Sciences at the University
of Surrey.
Screening and subjects
An extensive screening procedure was applied. Shift workers
were required to have a recent cumulative shift work history
of 5 years or more (preferably continuous), working either
Journal of Endocrinology (2010) 206, 205–215
permanent night or rotating shifts with at least three night
shifts per month. Non-shift workers were required to have a
cumulative shift work history of !6 months over their life
time. Waist and hip circumferences were measured, and a
general health questionnaire and four validated questionnaires
were completed: Horne–Ostberg questionnaire (HO; Horne
& Ostberg 1976), Pittsburgh Sleep Quality Index (PSQI;
Buysse et al. 1989), Beck’s depression inventory (BDI; Beck &
Beamesderfer 1974, Beck et al. 1974) and Epworth Sleepiness
Scale (ESS; Johns 1991, 1992). As PSQI, BDI and ESS were
dependent on the current shift pattern of shift workers,
second assessments were carried out for some of the subjects
during the week prior to the study or before the adaptation
night. These shift workers were asked to keep only days off or
day shifts in mind when completing the questionnaires. Shift
workers were also asked to complete the Standard Shift work
Index (Barton et al. 1995), which was used to determine the
total shift work duration and the shift pattern of their last
job. Subjects were free of any medical conditions and
medication, including over-the-counter medication, thought
to affect cardiovascular, metabolic, gastrointestinal and
immune functions. In addition, they had normal results for
the haematological and biochemical screening, did not
smoke, did not consume more than 15 units of alcohol a
week and were negative for drugs of abuse at the time of
recruitment and during the study. Demographics of the
24 participants (13 non-shift workers and 11 shift workers) are
given in Table 1.
Prior to the laboratory session
In order to maintain or establish regular circadian rhythms
(i.e. for the shift workers to be adapted for the laboratory
study) and to minimise sleep debt, volunteers were asked to
maintain a self-selected regular sleep–wake cycle with a sleep
duration of 7.5 or 8 h for 8 days prior to the laboratory study
(bed time 23.3G0.5 h (meanGS.D.), range 22–24 h, wake up
time 7.2G0.5 h, 5.5–8 h, and sleep duration 7.9G0.2 h,
7.5–8 h). Volunteers were allowed to nap within a 4-h
window in the afternoon (centred 12 h away from the
midpoint of their nighttime sleep to avoid phase shifting of
circadian rhythms (Buxton et al. 2000)). To confirm their
regular sleep–wake cycle, the participants were asked to call
the laboratory’s voicemail within 10 min before going to bed
and after waking up, to wear two actiwatches (Actiwatch-L
(AWL); Cambridge Neurotechnology, Cambridge, UK), one
around their neck and another on their non-dominant wrist,
both recording activity and light exposure, and to complete a
daily sleep diary (Lockley et al. 1999). For the 7 days prior to
and on the morning of the laboratory study, the study
participants were asked to get 15 min exposure to outdoor
natural light (without wearing sunglasses) within 90 min after
waking up to strengthen the regularity of their circadian
rhythms (Revell et al. 2005).
Two days prior to the laboratory study, the participants
were asked to refrain from alcohol, caffeine and heavy exercise.
www.endocrinology-journals.org

Table 1 Characteristics of the non-shift workers and shift workers during the first assessment. Values aremeansGS.D. and ranges (between brackets), measured on the screening day or the baseline day of the laboratorystudy for basal levels of glucose, TAGs, NEFAs and insulin
Non-shift workers (nZ13) Shift workers (nZ11)
Shift work (years) 0.03G0.12 (0–0.42) 8.7G5.2*** (5–18.5)Time since last shift (months) 60 1.6G5.4 (0–18)Age (years) 32.8G6.4 (25–42) 35.7G7.2 (25–45)Weight (kg) 84.6G13.6 (67.8–109) 91.6G10.3 (82–117)Height (m) 1.77G0.06 (1.66–1.85) 1.79G0.07 (1.71–1.91)BMI (kg/m2) 26.8G3.5 (21.5–34.0) 28.7G3.8 (23–35.7)Waist circumference (cm) 92G9.3 (76–107) 98G6.7 (90–110)Hip circumference (cm) 101G7.6 (88–114) 106G6.2 (95–114)WHR 0.91G0.03 (0.86–0.96) 0.93G0.03 (0.86–0.98)Cholesterol (mmol/l) 4.8G0.5 (3.9–5.5) 4.9G1.1 (3–6.5)HDL (mmol/l) 1.3G0.2 (0.8–1.6) 1.4G0.4 (0.9–2.4)Glucose (mmol/l) 5.1G0.4 (4.4–5.9) 5.2G0.2 (4.8–5.6)TAGs (mmol/l) 1.4G0.4 (0.7–2.1) 1.3G0.5 (0.9–2.5)NEFAs (mmol/l) 0.3G0.1 (0.2–0.6) 0.3G0.1 (0.2–0.5)Insulin (pmol/l) 67.5G12.4 (47.3–81.7) 63G16.8 (38.3–92.2)Smoke currently (units/day) 0 0Smoked in the past (units/day) 3.9G5.9 (0–15.5) 4.5G5.7 (0–15)Smoking duration (years) 2.9G4.5 (0–14) 4.4G6.3 (0–20)Time since last smoked (months) 17.9G24.1 (0.5–60) 38.4G54.1 (0.25–132)HO 59.3G5.2 (51–70) 55.5G13.0 (34–75)PSQIa 4.0G1.9 (1–7) 5.1G2.2 (2–10)BDIa 3.3G3.1 (0–9) 4.7G4.9 (0–17)ESSa 4.7G3.3 (1–11) 6.2G3.3 (2–11)
***P!0.001 compared with non-shift workers by independent two-tailed t-test. BMI, body mass index; WHR, waist–hip ratio;HDL, high-density lipoprotein; TAGs, triacylglycerols; NEFAs, non-esterified fatty acids; HO, Horne–Ostberg questionnaire;PSQI, Pittsburgh Sleep Quality Index; BDI, Beck’s depression inventory; ESS, Epworth Sleepiness Scale.aValues given are those obtained during the week prior to the study (see Materials and Methods).
Sleep deprivation and postprandial metabolism . S M T WEHRENS and others 207
On the day the subjects came to the laboratory they were
asked to refrain from foods and drinks other than water for
6 h before the standard dinner provided in the CIU.
The laboratory session
Volunteers spent four nights and days in the CIU (Fig. 1).
Light was kept constant at !8 lux in the direction of gaze
(apart from darkness (0 lux) during the sleep periods). Light
levels were regularly checked with a calibrated lux meter
(Edmund Optics, York, UK). Temperature was set around
20 8C, and both light and temperature in the CIU were
continuously recorded with Hobo sensors (Tempcon,
Arundel, UK).
After an adaptation night and a baseline night, the subjects
were required to stay awake for 30.5 h, followed by a 4-h
recovery nap and a recovery sleep (bed and wake up times for
the three nights in the CIU were equal to those of the week
prior to the study). The subjects were continually monitored
during the hours they were supposed to be awake by the staff
in order to ensure that they did not fall asleep (which was
evaluated post hoc with polysomnography). In order to control
for inter-individual differences in circadian phase, all
interventions and measurements were scheduled relative to
each subject’s self-selected wake up time (Burgess et al. 2003).
Body posture was controlled throughout the study.
Subjects were asked to remain in a semi-recumbent position
www.endocrinology-journals.org
in bed during the sleep and sleep-deprivation periods and for
4 h each afternoon. Blood sampling was performed in a seated
position. Subjects were allowed to use the toilet during these
periods, but were instructed to be seated 20 min before the
collection of each blood sample.
Food intake
All the subjects were provided with the same standard
breakfast, lunch, dinner and evening snack throughout the
study at 1.75, 4.75, 12 and 15 h after wake up time (Table 2).
Between these meals, the subjects were not allowed to have
any food or drinks except water made available ad libitum.
The breakfast had a relatively high fat and sugar content in
order to elicit a well-defined postprandial response. The snack
was included in the protocol to reduce the feelings of hunger
and irritation during sleep deprivation.
Blood sampling
On the baseline day, a cannula was inserted by a qualified
nurse. After baseline sleep, sleep deprivation and recovery
sleep, blood samples were taken 15 and 0 min prior to and 15,
30, 45, 60, 90, 120, 180 and 240 min after the standard
breakfast. The first sample of the day was taken 1.5 h after
wake up time, following a 10.5-h fast.
Journal of Endocrinology (2010) 206, 205–215

Entering laboratory
0
Blood sampling Cannula insertion Wakefulness during TSD
Time of day (h)
All day = dim light < 8 luxBody posture controlledbetween daysSleep (0 lux)Meals controlled between
days
6 12 18 24
Adaptation
Baseline
Total sleepdeprivation
Recovery
Recovery nap
Time after breakfast (min)
Studyday
1
0 1 2 3 4 5 6 7
–15 15 30 45 60 90 120 180 2400
8 9 10 11 12 13 14 15 16 17 18 19 20 21 22 23 24 h
2
3
4
5
Figure 1 Laboratory protocol followed during the five study days for a subject sleepingfrom 2300 to 0700 h. All interventions (see key) were relative to the subject’s self-selectedwake up time.
S M T WEHRENS and others . Sleep deprivation and postprandial metabolism208
Assay procedures
Plasma was separated by centrifugation at 1750 g, 4 8C for
10 min, aliquoted and stored at K20 8C until analysis.
Metabolite levels were determined with the Ilab 650
(Instrumentation Laboratory, Warrington, UK) using
reagents for the enzymatic colorimetric detection of glucose,
TAGs (IL TestTM, Instrumentation Laboratory) and non-
esterified fatty acid (NEFAs; Randox Laboratories Ltd,
Crumlin, UK). Inter-assay coefficients of variation (CV)
were !5% for glucose and TAGs, and !10% for NEFAs.
Plasma insulin was measured using a human insulin-specific
RIA kit (Millipore Ltd, Watford, UK). The plasma was
thawed and centrifuged at 1500 g for 5 min at 4 8C. All the
samples from one shift worker and one non-shift worker were
measured in the same assay, and the day order was randomised
to minimise any effects of possible assay drift. The inter-assay
CV was !15%. One non-shift worker had an extremely high
insulin response (O2 S.D. from the mean), was considered an
outlier and was excluded from all the insulin analyses.
Table 2 Percentage of fat, protein and carbohydrates and energy foreach of the meals and overall composition of all the meals
Protein(%)
Fat(%)
Carbohydrate(%)
Energy(kcal)
Breakfast 7.8 39.7 53.3 967.5Lunch 14.1 53.6 32.2 996.9Dinner 13.3 43.9 42.5 950.0Evening snack 14.9 25.4 59.1 300.0Overall
composition12.0 43.9 44.1 3214.4
Statistical analysis
An independent two-tailed Student’s t-test was used to
compare the demographics of the non-shift workers and shift
workers and the basal TAG, NEFA, glucose and insulin levels
on the baseline day of the study. For the ANOVAs, some
missing values were compiled by linear intra-/extrapolation
(!4% of the data set). The effects of baseline sleep, total sleep
deprivation and recovery sleep on the time course of TAGs,
NEFAs, glucose and insulin in the non-shift workers and shift
workers were compared using a three-factor ANOVA (factors
‘day’ (three levels: ‘baseline sleep’, ‘total sleep deprivation’
and ‘recovery sleep’), ‘time’ (ten levels: time points 15 min
Journal of Endocrinology (2010) 206, 205–215
prior to 240 min after the standard meal) and ‘group’
(two levels: ‘non-shift workers’ and ‘shift workers’)). If
applicable, the P values for the effects in all ANOVAs were
Greenhouse–Geisser adjusted when Mauchly’s test for
sphericity was significant. Tukey’s honest significant
difference post hoc tests were used to locate significant
differences after a significant main effect or interaction.
Whether postprandial levels returned to basal levels (the mean
of the K15 and 0 time points) was assessed using a three-
factor ANOVA (factors ‘day’, ‘time’ (two levels: ‘basal state’
and ‘240 min’) and ‘group’). Basal levels and incremental
area under the curve (IAUC; total area under the curve minus
the area under the basal level) were analysed using a
two-factor ANOVA (factors ‘day’ and ‘group’). For NEFAs,
many data points were lower than the basal level, so a net
IAUC was calculated as the area above the basal level minus
the area below the basal level. Since statistically significant
differences between the groups may not be revealed in these
combined analyses due to the small sample number, non-shift
workers and shift workers were also analysed separately
using ANOVA.
www.endocrinology-journals.org
*** * ** **
Non-shift workers Shift workers All subjects
B Basal NEFAs
Pla
sma
TA
Gs
(mm
ol/l)
2·0
1·8
1·6
1·4
1·2
1·0
A Basal TAGs
Sleep deprivation and postprandial metabolism . S M T WEHRENS and others 209
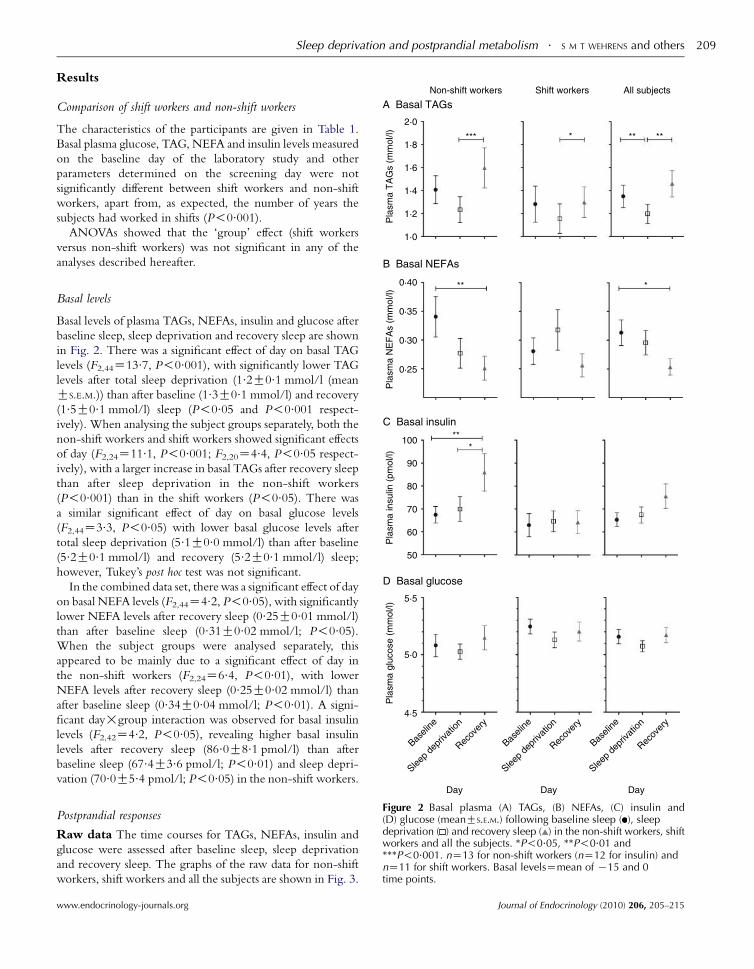
Results
Comparison of shift workers and non-shift workers
The characteristics of the participants are given in Table 1.
Basal plasma glucose, TAG, NEFA and insulin levels measured
on the baseline day of the laboratory study and other
parameters determined on the screening day were not
significantly different between shift workers and non-shift
workers, apart from, as expected, the number of years the
subjects had worked in shifts (P!0.001).
ANOVAs showed that the ‘group’ effect (shift workers
versus non-shift workers) was not significant in any of the
analyses described hereafter.
** *
Baseli
ne
Sleep
depr
ivatio
n
Recov
ery
Baseli
ne
Sleep
depr
ivatio
n
Recov
ery
Baseli
ne
Sleep
depr
ivatio
n
Recov
ery
***
C Basal insulin
D Basal glucose
Pla
sma
NE
FA
s (m
mol
/l)P
lasm
a in
sulin
(pm
ol/l)
Pla
sma
gluc
ose
(mm
ol/l)
0·40
100
90
80
70
60
50
5·5
5·0
4·5
0·35
0·30
0·25
Basal levels
Basal levels of plasma TAGs, NEFAs, insulin and glucose after
baseline sleep, sleep deprivation and recovery sleep are shown
in Fig. 2. There was a significant effect of day on basal TAG
levels (F2,44Z13.7, P!0.001), with significantly lower TAG
levels after total sleep deprivation (1.2G0.1 mmol/l (mean
GS.E.M.)) than after baseline (1.3G0.1 mmol/l) and recovery
(1.5G0.1 mmol/l) sleep (P!0.05 and P!0.001 respect-
ively). When analysing the subject groups separately, both the
non-shift workers and shift workers showed significant effects
of day (F2,24Z11.1, P!0.001; F2,20Z4.4, P!0.05 respect-
ively), with a larger increase in basal TAGs after recovery sleep
than after sleep deprivation in the non-shift workers
(P!0.001) than in the shift workers (P!0.05). There was
a similar significant effect of day on basal glucose levels
(F2,44Z3.3, P!0.05) with lower basal glucose levels after
total sleep deprivation (5.1G0.0 mmol/l) than after baseline
(5.2G0.1 mmol/l) and recovery (5.2G0.1 mmol/l) sleep;
however, Tukey’s post hoc test was not significant.
In the combined data set, there was a significant effect of day
on basal NEFA levels (F2,44Z4.2, P!0.05), with significantly
lower NEFA levels after recovery sleep (0.25G0.01 mmol/l)
than after baseline sleep (0.31G0.02 mmol/l; P!0.05).
When the subject groups were analysed separately, this
appeared to be mainly due to a significant effect of day in
the non-shift workers (F2,24Z6.4, P!0.01), with lower
NEFA levels after recovery sleep (0.25G0.02 mmol/l) than
after baseline sleep (0.34G0.04 mmol/l; P!0.01). A signi-
ficant day!group interaction was observed for basal insulin
levels (F2,42Z4.2, P!0.05), revealing higher basal insulin
levels after recovery sleep (86.0G8.1 pmol/l) than after
baseline sleep (67.4G3.6 pmol/l; P!0.01) and sleep depri-
vation (70.0G5.4 pmol/l; P!0.05) in the non-shift workers.
Day Day DayFigure 2 Basal plasma (A) TAGs, (B) NEFAs, (C) insulin and(D) glucose (meanGS.E.M.) following baseline sleep ( ), sleepdeprivation ( ) and recovery sleep ( ) in the non-shift workers, shiftworkers and all the subjects. *P!0.05, **P!0.01 and***P!0.001. nZ13 for non-shift workers (nZ12 for insulin) andnZ11 for shift workers. Basal levelsZmean of K15 and 0time points.
Postprandial responses
Raw data The time courses for TAGs, NEFAs, insulin and
glucose were assessed after baseline sleep, sleep deprivation
and recovery sleep. The graphs of the raw data for non-shift
workers, shift workers and all the subjects are shown in Fig. 3.
www.endocrinology-journals.org Journal of Endocrinology (2010) 206, 205–215

3·0
A TAGs
B NEFAs
C Insulin
D Glucose
Non-shift workers Shift workers All subjects
2·5
2·0
Pla
sma
TA
G (
mm
ol/l)
Pla
sma
NE
FA
s (m
mol
/l)P
lasm
a in
sulin
(pm
ol/l)
Pla
sma
gluc
ose
(mm
ol/l)
1·5
1·0
0·5
0·5
0·4
0·3
0·2
0·1
0·0
1250
1000
750
500
250
0
9
8
7
6
5
40 60 120
Time afterbreakfast (min)
180 240 0 60 120
Time afterbreakfast (min)
180 240 0 60 120 180 240
Time afterbreakfast (min)
Figure 3 Plasma (A) TAGs, (B) NEFAs, (C) insulin and (D) glucose(meanGS.E.M.) prior to (K15 and 0 min) and after (15–240 min) astandard breakfast, following baseline sleep ( ), sleep deprivation( ) and recovery sleep ( ) in the non-shift workers, shift workers andall the subjects. nZ13 for non-shift workers (nZ12 for insulin) andnZ11 for shift workers.
S M T WEHRENS and others . Sleep deprivation and postprandial metabolism210
There was a significant effect of day on TAG levels (F2,44Z10.9, P!0.001), with TAGs being significantly increased
after recovery sleep than after total sleep deprivation
(P!0.001) and baseline sleep (P!0.05). When non-shift
workers and shift workers were analysed separately, both the
groups showed a significant effect of day, but the effect was
stronger in the non-shift workers (F2,24Z8.2, P!0.01) than
in the shift workers (F2,20Z3.7, P!0.05). Insulin showed a
significant day!group interaction (F2,42Z4.2, P!0.05),
with higher levels after recovery sleep than after total sleep
deprivation and baseline sleep in the non-shift workers
(P!0.001). When non-shift workers and shift workers were
analysed separately, both the groups showed a significant effect
of day, but the effect was stronger in the non-shift workers
(F2,22Z10.9, P!0.001) than in the shift workers (F2,20Z4.3,
P!0.05). Post hoc tests showed that insulin levels were
significantly higher after recovery sleep than after total sleep
deprivation and baseline sleep in the non-shift workers
(P!0.01), and that they were significantly higher than those
Journal of Endocrinology (2010) 206, 205–215
after sleep deprivation in the shift workers (P!0.05).
A significant effect of day was also observed for NEFAs
(F2,44Z5.2, P!0.01), with lower NEFA levels after recovery
sleep than after baseline sleep (P!0.01). When the groups
were analysed separately, the NEFA levels after recovery sleep
were significantly lower than those after baseline sleep in the
non-shift workers only (P!0.01). For glucose, no significant
effect of day was observed, but there was a significant
interaction between day and time (F8.3,183.2Z2.2, P!0.05),
indicating that the time course of the glucose response varied
over the 3 days. The post hoc tests revealed that the only
difference between the same time points on different days was
an elevated glucose level 30 min after the standard breakfast
following recovery sleep, compared with that after total sleep
deprivation (P!0.05). Separate analyses of the groups did not
show any significant effects of day or day!time interactions.
Normalised data Since there was a statistically significant
effect of day on basal TAG, NEFA, insulin and glucose levels
(Fig. 2), the postprandial responses were also analysed as a
percentage of the basal levels. Using normalised data, no
statistically significant effects were found, apart from a
day!time interaction for glucose (F16,352Z2.0, P!0.05).
However, in contrast to the raw data, there were no significant
differences between the same time points on different days.
Return to basal levels
To assess the postprandial return to basal levels, the levels
prior to the standard breakfast were compared to the levels 4 h
after the breakfast (240 min time point) across the 3 days.
Statistical analyses showed a significant day!time interaction
(F2,44Z3.9, P!0.05) for glucose in the combined subject
group, revealing that glucose levels after the standard
breakfast did not return to basal levels by 240 min after total
sleep deprivation (P!0.01; Fig. 4B a). Insulin in the
combined subject group also showed a day!time interaction
(F2,42Z4.2, P!0.05), with higher insulin levels 240 min
after the standard breakfast following total sleep deprivation
compared with those following baseline sleep (P!0.01;
Fig. 4A b). In addition, insulin levels were significantly higher
240 min after the standard breakfast than before the breakfast
on all of the 3 days in each of the subject groups and the
combined data set (Fig. 4A c). Similarly, TAGs and NEFAs
showed significant effects of time in each of the subject groups
and the combined data set, indicating that the levels 240 min
after the standard breakfast did not return to basal levels on
any of the 3 days, apart from those of NEFAs in the non-shift
workers (data not shown).
Incremental area under the curve
IAUCs for TAGs, NEFAs, insulin and glucose were
calculated, and are shown in Fig. 5. Analysis of the IAUCs
showed a significant effect of day on the insulin (F1.4,30.4Z9.7, P!0.01) response in the combined subject group.
www.endocrinology-journals.org

250
Non-shift workers
c* c*** c***
b**
a**
Shift workers All subjectsA Insulin
B Glucose
200
150
100
50
Pla
sma
insu
lin (
pmol
/l)P
lasm
a gl
ucos
e (m
mol
/l)
6·0
5·5
5·0
4·5Basal
Time afterbreakfast (min)
240 Basal
Time afterbreakfast (min)
240 Basal
Time afterbreakfast (min)
240
Figure 4 Plasma (A) insulin and (B) glucose (meanGS.E.M.) in thebasal state and 240 min after the standard breakfast, followingbaseline sleep ( ), sleep deprivation ( ) and recovery sleep ( ) in thenon-shift workers, shift workers and all the subjects. The lettersrepresent the following comparisons: a, 240 min versus basal statefollowing sleep deprivation; b, 240 min following sleep deprivationversus 240 min following baseline sleep; c, 240 min versus basalstate on all the three days. *P!0.05 **P!0.01 and ***P!0.001.nZ13 for non-shift workers (nZ12 for insulin) and nZ11 forshift workers.
200A TAGs
B NEFAs
C Insulin
D Glucose
Non-shift workers Shift workers All subjects
150
100
IAU
C T
AG
(m
mol
/l·m
in)
Net
IAU
C N
EF
As
(mm
ol/l·
min
)IA
UC
insu
lin (
pmol
/l·m
in)
l/l·m
in)
50
0
0
−10
−20
−30
−40
−50
125 000 ** **
**100 000
75 000
50 000
25 000
400
Sleep deprivation and postprandial metabolism . S M T WEHRENS and others 211
The insulin IAUC was increased after recovery sleep (83 148
G8524 pmol/l.min) than after sleep deprivation (62 644
G5422 pmol/l.min) and baseline sleep (59 680G5205
pmol/l.min; P!0.01). In addition, there was a trend for
a day!group interaction for the net NEFA IAUC
(F2,44Z3, PZ0.061). No significant effects were observed
for the TAG and glucose responses. When non-shift workers
and shift workers were analysed separately, the effect of day
on the insulin IAUC remained significant in the non-shift
workers (F1.4,15Z7.8, P!0.01), with a larger insulin IAUC
after recovery sleep (96 299G14 174 pmol/l.min) than after
baseline sleep (60 923G8622 pmol/l.min; P!0.01) and
sleep deprivation (64 089G8323 pmol/l.min; P!0.05).
The day!group interaction trend for the net NEFA IAUC
appeared to be mainly due to an effect of day in the non-shift
workers (F1.2,15Z3.6, PZ0.068), with a smaller net NEFA
IAUC after recovery sleep than after baseline sleep (P!0.05).
Glu
cose
iAU
C (
mm
o
300
200
100
Day
Baseli
ne
Sleep
depr
ivatio
nRec
over
y
Day
Baseli
ne
Sleep
depr
ivatio
nRec
over
y
Day
Baseli
ne
Sleep
depr
ivatio
nRec
over
y
Figure 5 Incremental areas under the curve (IAUCs) for (A) TAGs,(B) NEFAs, (C) insulin and (D) glucose (meanGS.E.M.) after baselinesleep ( ), sleep deprivation ( ) and recovery sleep ( ) in the non-shift workers, shift workers and all the subjects. **P!0.01. nZ13for non-shift workers (nZ12 for insulin) and nZ11 for shift workers.
Discussion
This is the first study to report the effect of total sleep
deprivation and recovery sleep per se on basal and postprandial
metabolic and insulin responses to a standard breakfast. The
responses of experienced shift workers with long-term
exposure to shift work for 5 years or more were compared
with those of the non-shift workers under well-controlled
laboratory conditions.
Morning basal TAG levels were significantly lower after
total sleep deprivation than after baseline and recovery sleep.
www.endocrinology-journals.org
This finding is in agreement with the observations obtained
using a protocol consisting of isocaloric meals being provided
every 3 h, which showed that 3–5 days of total sleep
deprivation resulted in a significant decrease in the amplitude
of the TAG rhythm and significantly lower TAG levels in the
morning (Vondra et al. 1986). Ilan et al. (1992) also reported
that 76–80 h total sleep deprivation resulted in a decrease in
TAG levels, although food intake was ad libitum and body
posture was not controlled. The lower TAG levels in the
morning after total sleep deprivation may, in part, be due to
higher energy expenditure while staying awake during the
night, even though in the current study, the subjects were
instructed to remain semi-recumbent throughout the night.
Journal of Endocrinology (2010) 206, 205–215

S M T WEHRENS and others . Sleep deprivation and postprandial metabolism212
In agreement with this hypothesis, animal studies have
reported lower/unaltered TAG levels after sleep deprivation,
accompanied by weight loss despite higher food/calorie
intake, indicating a higher turnover of nutrients during sleep
deprivation (Everson & Wehr 1993, Andersen et al. 2004,
Martins et al. 2010). Alternatively, these observations could be
due to impaired nutrient absorption. In agreement with the
current finding, Nedeltcheva et al. (2009) did not observe any
differences in fasting glucose and insulin levels between
baseline sleep and partial sleep restriction. Other studies on
partial sleep deprivation did not report the fasting glucose and
insulin concentrations (Spiegel et al. 1999, Tasali et al. 2008).
Although energy utilisation may increase during sleep
deprivation, the way the body deals with subsequent energy
intake following a meal might be different. In the analysis
done on all of the subjects, glucose levels 4 h after the standard
breakfast did not return to basal levels after total sleep
deprivation. In addition, insulin levels 4 h after the breakfast
were significantly higher after sleep deprivation than after
baseline sleep. This finding is in accordance with previous
sleep deprivation studies (Spiegel et al. 1999, Tasali et al. 2008,
Nedeltcheva et al. 2009). The slower glucose clearance despite
increased insulin levels indicates insulin insensitivity
(DeFronzo 1988, Reaven 2002). As glucose and insulin
production and metabolism are tightly controlled by the
autonomous nervous system (Iversen et al. 2000), it might be
suggested, as has been done previously (Spiegel et al. 1999),
that the insulin insensitivity after sleep deprivation may be due
to an altered balance between the parasympathetic and
sympathetic nervous systems. More specifically, it could be
that the hypothalamus and, in particular, the wake-promoting
factor orexin (Saper et al. 2005) plays a role in this process.
Neurons from the hypothalamus project to the fat tissue, the
liver and the pancreas (Kreier et al. 2006), and orexin has been
shown to stimulate sympathetic neurons innervating these
tissues (van den Top et al. 2003), which would lead to, for
example, increased glucose mobilisation and altered insulin
sensitivity (Shiuchi et al. 2009, Yi et al. 2009). Orexin has also
been shown to increase in the cerebrospinal fluid of both
squirrel monkeys and rats after sleep deprivation (Deboer et al.
2004, Zeitzer et al. 2007). Increased exposure to orexin
during sustained wakefulness may therefore result in an
overstimulation of the sympathetic nervous system and higher
glucose mobilisation.
Significant effects of total sleep deprivation were observed
on basal TAG levels and 4 h postprandial glucose and insulin
levels. After a 4 h recovery nap followed by an 8 h overnight
recovery sleep, the basal TAG levels were significantly
higher than those after the sleep deprivation night in both
the groups. In the non-shift workers, the average basal TAG
level after recovery sleep was elevated above the levels
reported to be associated with smaller and denser low-density
lipoprotein production (TAG levels O1.5 mmol/l) which
may increase the risk for CVD (Griffin et al. 1994). However,
it has to be kept in mind that the basal samples in the current
Journal of Endocrinology (2010) 206, 205–215
study were taken after a fasting period of 10.5 h, and are thus
not strictly considered fasting samples.
Basal NEFA levels were significantly lower after recovery
sleep than after baseline sleep in the non-shift workers and in
all the subjects. Basal insulin levels were significantly higher
after recovery sleep than after baseline sleep and total sleep
deprivation in the non-shift workers, suggestive of insulin
insensitivity.
The overall TAG and insulin responses were higher and
NEFA levels were lower after recovery sleep. The increased
IAUC for insulin suggests that this increase after recovery sleep
is likely to be independent of the change in basal levels. Similar
glucose levels despite a significantly larger insulin response
indicate insulin insensitivity. Moreover, this hyperinsulinae-
mic state would result in an enhanced hepatic conversion of
NEFAs to TAGs and suppress lipid mobilisation by lipoprotein
lipase, leading to hypertriglyceridaemia (DeFronzo 1988,
Reaven 2002), which may explain the lower postprandial
NEFA levels and the trend for a smaller net NEFA IAUC after
recovery sleep than after baseline sleep. These results after
recovery sleep are unexpected as most of the parameters in
other studies (e.g. Spiegel et al. 1999, Mullington et al. 2003,
van Leeuwen et al. 2009) show the largest alterations following
sleep deprivation, and the parameters either remain changed
after recovery sleep or start to return to basal levels. However,
there is no satisfactory explanation as to why some parameters
in this study would change after recovery sleep. This may be
either a direct effect of recovery sleep or a delayed effect of
sleep deprivation. Future studies including a longer recovery
period or longer periods of (partial) sleep deprivation may
help to clarify this issue.
Although there were no significant differences between non-
shift workers and shift workers when they were assessed in the
same ANOVA, separate analyses of non-shift workers and shift
workers revealed some differences. In almost all the analyses, the
effects of sleep deprivation and recovery sleep were more
pronounced in the non-shift workers than in the shift workers.
It could be speculated that the shift workers in this study
appeared to be adapted to sleep deprivation. This observation
might also be explained by other factors linked to the ability to
cope with shift work and sleep deprivation, for example
morningness–eveningness (Taillard et al. 1999, Mongrain et al.
2004, 2006) as assessed by the HO questionnaire, clock gene
polymorphisms (Viola et al. 2007) and genetic variation in the
adenosinergic system (Porkka-Heiskanen et al. 2003, Retey
et al. 2005, 2006). The lack of major differences in the
postprandial responses between the shift workers and non-shift
workers may also be explained by the fact that the meal was
given at the normal clock time. In previous studies reporting
postprandial differences, meals were given at an abnormal clock
time (Hampton et al. 1996, Ribeiro et al. 1998, Lund et al. 2001,
Scheer et al. 2009), suggesting that the food intake at an
inappropriate clock time may be a major contributor to the
adverse effects of shift work.
One of the limitations of this study was the fact that the
postprandial response was only measured for up to 4 h after
www.endocrinology-journals.org

Sleep deprivation and postprandial metabolism . S M T WEHRENS and others 213
the standard breakfast. Unfortunately, this time period could
not be lengthened because lunch had to be included in the
protocol before the scheduled nap. The peak of the TAG
response was not observed, as it normally takes w9 h for
TAGs to return to basal levels after a meal (Ribeiro et al. 1998,
Lund et al. 2001, Sopowski et al. 2001). The decrease in TAGs
observed after total sleep deprivation may thus not be a
decrease but a delay in the TAG response; unfortunately, the
protocol was unable to distinguish between these two. Future
research should include longer sampling periods to assess how
long it takes for TAGs, NEFAs, insulin and glucose to return
to basal levels. Alternatively, subjects could be monitored after
both breakfast and lunch as the postprandial hormone and
metabolic responses may be additive if the time between the
two meals is short.
In this study, an assumption that all measurements were
taken at the same circadian phase for each subject was made.
Circadian phase was predicted by habitual wake up time in
contrast to using melatonin as a reliable marker of circadian
phase (Klerman et al. 2002, Arendt 2003). Measurements may
have thus been taken at slightly different circadian phases,
although wake up time has been reported to be a good
predictor of circadian phase when sleep and light exposure
were controlled prior to the laboratory study (Burgess et al.
2003, Revell et al. 2005).
In conclusion, this is the first study to assess the basal and
postprandial insulin and metabolic responses after total
sleep deprivation and recovery sleep, and to compare non-
shift workers and shift workers under controlled laboratory
conditions. Significantly lower basal TAG levels after total
sleep deprivation indicate higher energy expenditure during
sleep deprivation, despite any increased physical activity.
Postprandial TAG and insulin responses were larger after
recovery sleep, suggestive of insulin insensitivity. These
results might be explained by an altered balance between the
parasympathetic and sympathetic nervous systems. The more
pronounced effects of sleep deprivation and recovery sleep
observed in the non-shift workers require further study.
Declaration of interest
The authors declare that there is no conflict of interest that could be perceived
as prejudicing the impartiality of the research reported.
Funding
This work was supported by an EU Marie Curie Research Training Network
grant (CT-2004-512362).
Author contribution statement
SMTW, SMH and DJS conceived and designed the experiments; SMTW,
SMH and REF performed the experiments; SMTW analysed the data and
SMTW, SMH and DJS wrote the paper.
www.endocrinology-journals.org
Acknowledgements
We would like to thank the volunteers for participating in the study; students
and staff at the University of Surrey for their help in carrying out the
laboratory study; Dr Max Wong for assisting with the I-lab measurements and
Mr Peter Williams for his statistical advice.
References
Akerstedt T 1998 Shift work and disturbed sleep/wakefulness. Sleep Medicine
Reviews 2 117–128.
Akerstedt T 2003 Shift work and disturbed sleep/wakefulness. Occupational
Medicine 53 89–94.
Andersen ML, Martins PJF, D’Almeida V, Santos RF, Bignotto M & Tufik S
2004 Effects of paradoxical sleep deprivation on blood parameters associated
with cardiovascular risk in aged rats. Experimental Gerontology 39 817–824.
Arendt J 2003 Importance and relevance of melatonin to human biological
rhythms. Journal of Neuroendocrinology 15 427–431.
Barton J, Costa G, Smith L, Spelten E, Totterdell P & Folkard S 1995 The
standard shiftwork index: a battery of questionnaires for assessing shiftwork
related problems. Work and Stress 9 3–30.
Beck AT & Beamesderfer A 1974 Assessment of depression: the depression
inventory. Modern Problems of Pharmacopsychiatry 7 151–169.
Beck AT, Rial WY & Rickels K 1974 Short form of depression inventory:
cross-validation. Psychological Reports 34 1184–1186.
Boggild H & Knutsson A 1999 Shift work, risk factors and cardiovascular
disease. Scandinavian Journal of Work, Environment & Health 25 85–99.
Burgess HJ, Savic N, Sletten T, Roach G, Gilbert SS & Dawson D 2003 The
relationship between the dim light melatonin onset and sleep on a regular
schedule in young healthy adults. Behavioral Sleep Medicine 1 102–114.
Buxton OM, L’Hermite-Baleriaux M, Turek FW & van Cauter E 2000
Daytime naps in darkness phase shift the human circadian rhythms of
melatonin and thyrotropin secretion. American Journal of Physiology.
Regulatory, Integrative and Comparative Physiology 278 R373–R382.
Buysse DJ, Reynolds CF III, Monk TH, Berman SR & Kupfer DJ 1989 The
Pittsburgh Sleep Quality Index: a new instrument for psychiatric practice
and research. Psychiatry Research 28 193–213.
De Bacquer D, Van Risseghem M, Clays E, Kittel F, De Backer G &
Braeckman L 2009 Rotating shift work and the metabolic syndrome: a
prospective study. International Journal of Epidemiology 38 848–854 (dyn360).
Deboer T, Overeem S, Visser NA, Duindam H, Frolich M, Lammers GJ &
Meijer JH 2004 Convergence of circadian and sleep regulatory mechanisms
on hypocretin-1. Neuroscience 129 727–732.
DeFronzo RA 1988 Lilly lecture 1987. The triumvirate: beta-cell, muscle,
liver. A collusion responsible for NIDDM. Diabetes 37 667–687.
Ellingsen T, Bener A & Gehani AA 2007 Study of shift work and risk of
coronary events. Journal of the Royal Society for the Promotion of Health 127
265–267.
Esquirol Y, Bongard V, Mabile L, Jonnier B, Soulat J-M & Perret B 2009 Shift
work and metabolic syndrome: respective impacts of job strain, physical
activity, and dietary rhythms. Chronobiology International 26 544–559.
Everson CA & Wehr TA 1993 Nutritional and metabolic adaptations to
prolonged sleep deprivation in the rat. American Journal of Physiology 264
R376–R387.
Gangwisch JE, Heymsfield SB, Boden-Albala B, Buijs RM, Kreier F,
Pickering TG, Rundle AG, Zammit GK & Malaspina D 2006 Short sleep
duration as a risk factor for hypertension: analyses of the first National
Health and Nutrition Examination Survey. Hypertension 47 833–839.
Green CB, Takahashi JS & Bass J 2008 The meter of metabolism. Cell 134
728–742.
Griffin BA, Freeman DJ, Tait GW, Thomson J, Caslake MJ, Packard CJ &
Shepherd J 1994 Role of plasma triglyceride in the regulation of plasma low
density lipoprotein (LDL) subfractions: relative contribution of small, dense
LDL to coronary heart disease risk. Atherosclerosis 106 241–253.
Journal of Endocrinology (2010) 206, 205–215

S M T WEHRENS and others . Sleep deprivation and postprandial metabolism214
Hampton SM, Morgan LM, Lawrence N, Anastasiadou T, Norris F, Deacon S,
Ribeiro D & Arendt J 1996 Postprandial hormone and metabolic responses
in simulated shift work. Journal of Endocrinology 151 259–267.
Horne JA & Ostberg O 1976 A self-assessment questionnaire to determine
morningness–eveningness in human circadian rhythms. International
Journal of Chronobiology 4 97–110.
Ilan Y, Martinowitz G, Abramsky O, Glazer G & Lavie P 1992 Prolonged
sleep-deprivation induced disturbed liver functions serum lipid levels, and
hyperphosphatemia. European Journal of Clinical Investigation 22 740–743.
Iversen S, Iversen L & Saper C 2000 The autonomic nervous system and the
hypothalamus. In Principles of Neural Science, edn 4, ch 49, pp 960–981
(international). Eds ER Kandel, JH Schwartz & TM Jesell. New York:
McGraw-Hill: Health Professions Division.
Johns MW 1991 A new method for measuring daytime sleepiness: the
Epworth Sleepiness Scale. Sleep 14 540–545.
Johns MW 1992 Reliability and factor analysis of the Epworth Sleepiness
Scale. Sleep 15 376–381.
Karlsson B, Knutsson A & Lindahl B 2001 Is there an association between shift
work and having a metabolic syndrome? Results from a population based
study of 27,485 people Occupational and Environmental Medicine 58 747–752.
Karlsson BH, Knutsson AK, Lindahl BO & Alfredsson LS 2003 Metabolic
disturbances in male workers with rotating three-shift work. Results of the
WOLF study. International Archives of Occupational and Environmental Health
76 424–430.
Kawachi I, Colditz GA, Stampfer MJ, Willett WC, Manson JE, Speizer FE &
Hennekens CH 1995 Prospective study of shift work and risk of coronary
heart disease in women. Circulation 92 3178–3182.
Klerman EB, Gershengorn HB, Duffy JF & Kronauer RE 2002 Comparisons
of the variability of three markers of the human circadian pacemaker.
Journal of Biological Rhythms 17 181–193.
Knutsson A & Boggild H 2000 Shiftwork and cardiovascular disease: review of
disease mechanisms. Reviews on Environmental Health 15 359–372.
Knutsson A, Akerstedt T, Jonsson BG & Orth-Gomer K 1986 Increased risk
of ischaemic heart disease in shift workers. Lancet 2 89–92.
Kreier F, Kap YS, Mettenleiter TC, van Heijningen C, van der Vliet J,
Kalsbeek A, Sauerwein HP, Fliers E, Romijn JA & Buijs RM 2006 Tracing
from fat tissue, liver, and pancreas: a neuroanatomical framework for the
role of the brain in type 2 diabetes. Endocrinology 147 1140–1147.
van Leeuwen WMA, Lehto M, Karisola P, Lindholm H, Luukkonen R,
Sallinen M, Harma M, Porkka-Heiskanen T & Alenius H 2009 Sleep
restriction increases the risk of developing cardiovascular diseases by
augmenting proinflammatory responses through IL-17 and CRP.
PLoS ONE 4 e4589.
Lockley SW, Skene DJ & Arendt J 1999 Comparison between subjective and
actigraphic measurement of sleep and sleep rhythms. Journal of Sleep Research
8 175–183.
Lund J, Arendt J, Hampton SM, English J & Morgan LM 2001 Postprandial
hormone and metabolic responses amongst shift workers in Antarctica.
Journal of Endocrinology 171 557–564.
Martins PJ, Marques MS, Tufik S & D’Almeida V 2010 Orexin activation
precedes increased NPYexpression, hyperphagia, and metabolic changes in
response to sleep deprivation. American Journal of Physiology. Endocrinology
and Metabolism 298 E726–E734.
Mongrain V, Lavoie S, Selmaoui B, Paquet J & Dumont M 2004 Phase
relationships between sleep–wake cycle and underlying circadian rhythms
in morningness–eveningness. Journal of Biological Rhythms 19 248–257.
Mongrain V, Carrier J & Dumont M 2006 Circadian and homeostatic
sleep regulation in morningness–eveningness. Journal of Sleep Research 15
162–166.
Monteleone P, Tortorella A, Docimo L, Maldonato MN, Canestrelli B,
De Luca L & Maj M 2008 Investigation of 3111T/C polymorphism of
the CLOCK gene in obese individuals with or without binge eating
disorder: association with higher body mass index. Neuroscience Letters 435
30–33.
Mullington JM, Chan JL, Van Dongen HP, Szuba MP, Samaras J, Price NJ,
Meier-Ewert HK, Dinges DF & Mantzoros CS 2003 Sleep loss reduces
diurnal rhythm amplitude of leptin in healthy men. Journal of
Neuroendocrinology 15 851–854.
Journal of Endocrinology (2010) 206, 205–215
Nedeltcheva AV, Kessler L, Imperial J & Penev PD 2009 Exposure to
recurrent sleep restriction in the setting of high caloric intake and physical
inactivity results in increased insulin resistance and reduced glucose
tolerance. Journal of Clinical Endocrinology and Metabolism 94 3242–3250.
Pilcher JJ, Lambert BJ & Huffcutt AI 2000 Differential effects of permanent
and rotating shifts on self-report sleep length: a meta-analytic review. Sleep
23 155–163.
Porkka-Heiskanen T, Kalinchuk A, Alanko L, Urrila A & Stenberg D 2003
Adenosine, energy metabolism, and sleep. Scientific World Journal 3 790–798.
Reaven GM 2002 Control of blood glucose and its disturbance: insulin
resistance. In Comprehensive Clinical Endocrinology, edn 3, pp 291–301.
Eds GM Besser & MO Thorner. Edinburgh: Mosby.
Retey JV, Adam M, Honegger E, Khatami R, Luhmann UF, Jung HH,
Berger W & Landolt HP 2005 A functional genetic variation of adenosine
deaminase affects the duration and intensity of deep sleep in humans.
PNAS 102 15676–15681.
Retey JV, Adam M, Gottselig JM, Khatami R, Durr R, Achermann P &
Landolt HP 2006 Adenosinergic mechanisms contribute to individual
differences in sleep deprivation-induced changes in neurobehavioral
function and brain rhythmic activity. Journal of Neuroscience 26
10472–10479.
Revell VL, Kim H, Tseng CY, Crowley SJ & Eastman CI 2005 Circadian
phase determined from melatonin profiles is reproducible after 1 wk in
subjects who sleep later on weekends. Journal of Pineal Research 39 195–200.
Ribeiro DC, Hampton SM, Morgan L, Deacon S & Arendt J 1998 Altered
postprandial hormone and metabolic responses in a simulated shift work
environment. Journal of Endocrinology 158 305–310.
Sallinen M, Harma M, Mutanen P, Ranta R, Virkkala J & Muller K 2003
Sleep–wake rhythm in an irregular shift system. Journal of Sleep Research 12
103–112.
Saper CB, Scammell TE & Lu J 2005 Hypothalamic regulation of sleep and
circadian rhythms. Nature 437 1257–1263.
Scheer FAJL, Hilton MF, Mantzoros CS & Shea SA 2009 Adverse metabolic
and cardiovascular consequences of circadian misalignment. PNAS 106
4453–4458.
Schernhammer ES, Laden F, Speizer FE, Willett WC, Hunter DJ, Kawachi I
& Colditz GA 2001 Rotating night shifts and risk of breast cancer in
women participating in the nurses’ health study. Journal of the National
Cancer Institute 93 1563–1568.
Scott EM, Carter AM & Grant PJ 2008 Association between polymorphisms
in the Clock gene, obesity and the metabolic syndrome in man. International
Journal of Obesity 32 658–662.
Shiuchi T, Haque MS, Okamoto S, Inoue T, Kageyama H, Lee S, Toda C,
Suzuki A, Bachman ES, Kim YB et al. 2009 Hypothalamic orexin
stimulates feeding-associated glucose utilization in skeletal muscle via
sympathetic nervous system. Cell Metabolism 10 466–480.
Simon C, Weibel L & Brandenberger G 2000 Twenty-four-hour rhythms of
plasma glucose and insulin secretion rate in regular night workers. American
Journal of Physiology. Endocrinology and Metabolism 278 E413–E420.
Sookoian S, Gemma C, Fernandez Gianotti T, Burgueno A, Alvarez A,
Gonzalez CD & Pirola CJ 2007 Effects of rotating shift work on biomarkers
of metabolic syndrome and inflammation. Journal of Internal Medicine 261
285–292.
Sookoian S, Gemma C, Gianotti TF, Burgueno A, Castano G & Pirola CJ
2008 Genetic variants of Clock transcription factor are associated with
individual susceptibility to obesity. American Journal of Clinical Nutrition 87
1606–1615.
Sopowski MJ, Hampton SM, Ribeiro DCO, Morgan L & Arendt J 2001
Postprandial triacylglycerol responses in simulated night and day shift:
gender differences. Journal of Biological Rhythms 16 272–276.
Spiegel K, Leproult R & Van Cauter E 1999 Impact of sleep debt on metabolic
and endocrine function. Lancet 354 1435–1439.
Taheri S, Lin L, Austin D, Young T & Mignot E 2004 Short sleep duration is
associated with reduced leptin, elevated ghrelin, and increased body mass
index. PLoS Medicine 1 e62.
Taillard J, Philip P & Bioulac B 1999 Morningness/eveningness and the need
for sleep. Journal of Sleep Research 8 291–295.
www.endocrinology-journals.org

Sleep deprivation and postprandial metabolism . S M T WEHRENS and others 215
Tasali E, Leproult R, Ehrmann DA & Van Cauter E 2008 Slow-wave
sleep and the risk of type 2 diabetes in humans. PNAS 105
1044–1049.
van den Top M, Nolan MF, Lee K, Richardson PJ, Buijs RM, Davies CH
& Spanswick D 2003 Orexins induce increased excitability and
synchronisation of rat sympathetic preganglionic neurones. Journal of
Physiology 549 809–821.
Viola AU, Archer SN, James LM, Groeger JA, Lo JC, Skene DJ, von Schantz
M & Dijk DJ 2007 PER3 polymorphism predicts sleep structure and
waking performance. Current Biology 17 613–618.
Viola AU, James LM, Archer SN & Dijk DJ 2008 PER3 polymorphism
and cardiac autonomic control: effects of sleep debt and circadian phase.
American Journal of Physiology. Heart and Circulatory Physiology 295
H2156–H2163.
Vondra K, Brodan V, Dobiasova M, Vitek V & Kopecka J 1986 Effect of sleep
deprivation on cholesterol metabolism and triglyceridaemia in male
volunteers. European Journal of Applied Physiology and Occupational Physiology
55 83–87.
www.endocrinology-journals.org
Woon PY, Kaisaki PJ, Braganca J, Bihoreau MT, Levy JC, Farrall M &
Gauguier D 2007 Aryl hydrocarbon receptor nuclear translocator-like
(BMAL1) is associated with susceptibility to hypertension and type 2
diabetes. PNAS 104 14412–14417.
Yi CX, Serlie MJ, Ackermans MT, Foppen E, Buijs RM, Sauerwein HP,
Fliers E & Kalsbeek A 2009 A major role for perifornical orexin neurons
in the control of glucose metabolism in rats. Diabetes 58 1998–2005.
Zeitzer JM, Buckmaster CL, Lyons DM & Mignot E 2007 Increasing length
of wakefulness and modulation of hypocretin-1 in the wake-consolidated
squirrel monkey. American Journal of Physiology. Regulatory, Integrative and
Comparative Physiology 293 R1736–R1742 (00460.02007).
Received in final form 25 April 2010Accepted 17 May 2010Made available online as an Accepted Preprint17 May 2010
Journal of Endocrinology (2010) 206, 205–215