The pathogenesis of Plasmodium falciparum malaria in humans: insights from splenic physiology
Upload
agroparistechCategory
view
1download
0
BioMed CentralMalaria Journal
ss
Open AcceMethodologyEffect of the haematocrit layer geometry on Plasmodium falciparum static thin-layer in vitro culturesJordi Ferrer*†1, Marina D Rosal2, Jaume M Vidal†2, Clara Prats1, Joaquim Valls1, Esperanza A Herreros2, Daniel López1 and Domingo Gargallo2Address: 1Escola Superior d'Agricultura de Barcelona, Campus del Baix Llobregat, Departament de Física i Enginyeria Nuclear, Universitat Politècnica de Catalunya, Avda. del Canal Olímpic 15, 08860 Castelldefels, Spain and 2Drug Discovery Biology Group, Diseases of the Developing World Center, of GlaxoSmithKline R&D, Tres Cantos, Madrid, Spain
Email: Jordi Ferrer* - [email protected]; Marina D Rosal - [email protected]; Jaume M Vidal - [email protected]; Clara Prats - [email protected]; Joaquim Valls - [email protected]; Esperanza A Herreros - [email protected]; Daniel López - [email protected]; Domingo Gargallo - [email protected]
* Corresponding author †Equal contributors
AbstractBackground: In vitro cultivation of Plasmodium falciparum is usually carried out through thecontinuous preservation of infected erythrocytes deposited in static thin layers of settledhaematocrit. This technique, called the candle-jar method, was first achieved by Trager and Jensenin 1976 and has undergone slight modifications since then. However, no systematic studiesconcerning the geometry of the haematocrit layer have been carried out. In this work, a thoroughinvestigation of the effects of the geometric culturing conditions on the parasite's development ispresented.
Methods: Several experimental trials exploring different settings have been carried out, coveringhaematocrit layer depths that ranged from 6 mm to 3 mm and separation between the walls of theculturing device that ranged from 7.5 mm to 9 mm. The obtained results have been analysed andcompared to different system-level models and to an Individual-Based Model.
Conclusion: In line with the results, a mechanism governing the propagation of the infection whichlimits it to the vicinity of the interface between the haematocrit layer and the culture medium isdeduced, and the most appropriate configurations are proposed for further experimental assays.
BackgroundMalaria parasites were first preserved in vitro without lossof infective viability by Pavanand et al [1]. Continuousculture of viable Plasmodium falciparum schizogonic stageswas first achieved soon after by means of cultures thatmaintained infected red blood cells (RBCs) settled in athin deposit under controlled conditions (static cultures).
Trager and Jensen developed two types of static cultures: asystem with continuous medium replacement, and a sys-tem with discrete daily medium renewal, called the can-dle-jar method [2]. The protocols then reported have beenwidely studied, and many modifications have been tried[3-6]. During the 1980s and the 1990s, the possibility ofestablishing suspended cultures was also explored [7,8],
Published: 8 October 2008
Malaria Journal 2008, 7:203 doi:10.1186/1475-2875-7-203
Received: 20 June 2008Accepted: 8 October 2008
This article is available from: http://www.malariajournal.com/content/7/1/203
© 2008 Ferrer et al; licensee BioMed Central Ltd. This is an Open Access article distributed under the terms of the Creative Commons Attribution License (http://creativecommons.org/licenses/by/2.0), which permits unrestricted use, distribution, and reproduction in any medium, provided the original work is properly cited.
Page 1 of 12(page number not for citation purposes)
Malaria Journal 2008, 7:203 http://www.malariajournal.com/content/7/1/203
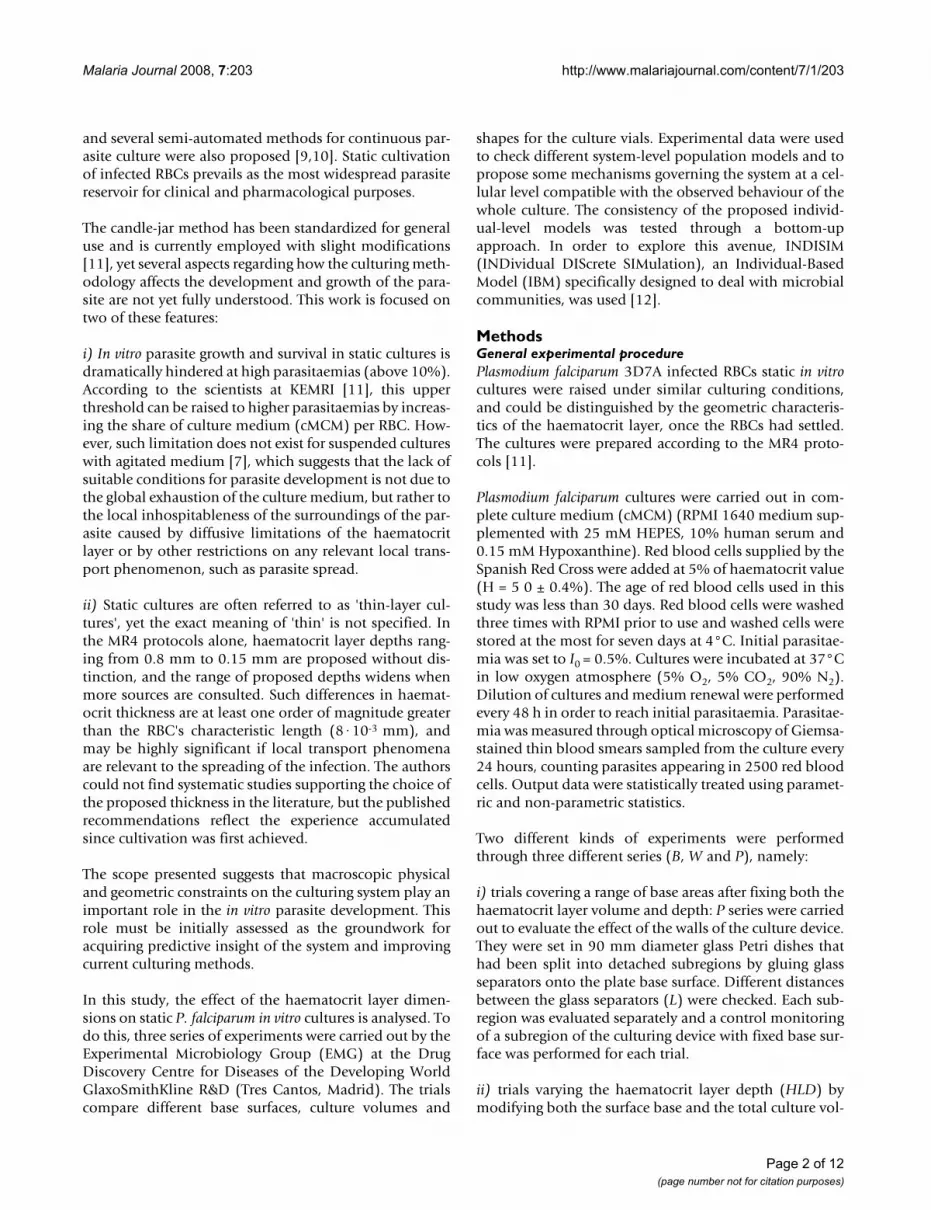
and several semi-automated methods for continuous par-asite culture were also proposed [9,10]. Static cultivationof infected RBCs prevails as the most widespread parasitereservoir for clinical and pharmacological purposes.
The candle-jar method has been standardized for generaluse and is currently employed with slight modifications[11], yet several aspects regarding how the culturing meth-odology affects the development and growth of the para-site are not yet fully understood. This work is focused ontwo of these features:
i) In vitro parasite growth and survival in static cultures isdramatically hindered at high parasitaemias (above 10%).According to the scientists at KEMRI [11], this upperthreshold can be raised to higher parasitaemias by increas-ing the share of culture medium (cMCM) per RBC. How-ever, such limitation does not exist for suspended cultureswith agitated medium [7], which suggests that the lack ofsuitable conditions for parasite development is not due tothe global exhaustion of the culture medium, but rather tothe local inhospitableness of the surroundings of the par-asite caused by diffusive limitations of the haematocritlayer or by other restrictions on any relevant local trans-port phenomenon, such as parasite spread.
ii) Static cultures are often referred to as 'thin-layer cul-tures', yet the exact meaning of 'thin' is not specified. Inthe MR4 protocols alone, haematocrit layer depths rang-ing from 0.8 mm to 0.15 mm are proposed without dis-tinction, and the range of proposed depths widens whenmore sources are consulted. Such differences in haemat-ocrit thickness are at least one order of magnitude greaterthan the RBC's characteristic length (8·10-3 mm), andmay be highly significant if local transport phenomenaare relevant to the spreading of the infection. The authorscould not find systematic studies supporting the choice ofthe proposed thickness in the literature, but the publishedrecommendations reflect the experience accumulatedsince cultivation was first achieved.
The scope presented suggests that macroscopic physicaland geometric constraints on the culturing system play animportant role in the in vitro parasite development. Thisrole must be initially assessed as the groundwork foracquiring predictive insight of the system and improvingcurrent culturing methods.
In this study, the effect of the haematocrit layer dimen-sions on static P. falciparum in vitro cultures is analysed. Todo this, three series of experiments were carried out by theExperimental Microbiology Group (EMG) at the DrugDiscovery Centre for Diseases of the Developing WorldGlaxoSmithKline R&D (Tres Cantos, Madrid). The trialscompare different base surfaces, culture volumes and
shapes for the culture vials. Experimental data were usedto check different system-level population models and topropose some mechanisms governing the system at a cel-lular level compatible with the observed behaviour of thewhole culture. The consistency of the proposed individ-ual-level models was tested through a bottom-upapproach. In order to explore this avenue, INDISIM(INDividual DIScrete SIMulation), an Individual-BasedModel (IBM) specifically designed to deal with microbialcommunities, was used [12].
MethodsGeneral experimental procedurePlasmodium falciparum 3D7A infected RBCs static in vitrocultures were raised under similar culturing conditions,and could be distinguished by the geometric characteris-tics of the haematocrit layer, once the RBCs had settled.The cultures were prepared according to the MR4 proto-cols [11].
Plasmodium falciparum cultures were carried out in com-plete culture medium (cMCM) (RPMI 1640 medium sup-plemented with 25 mM HEPES, 10% human serum and0.15 mM Hypoxanthine). Red blood cells supplied by theSpanish Red Cross were added at 5% of haematocrit value(H = 5 0 ± 0.4%). The age of red blood cells used in thisstudy was less than 30 days. Red blood cells were washedthree times with RPMI prior to use and washed cells werestored at the most for seven days at 4°C. Initial parasitae-mia was set to I0 = 0.5%. Cultures were incubated at 37°Cin low oxygen atmosphere (5% O2, 5% CO2, 90% N2).Dilution of cultures and medium renewal were performedevery 48 h in order to reach initial parasitaemia. Parasitae-mia was measured through optical microscopy of Giemsa-stained thin blood smears sampled from the culture every24 hours, counting parasites appearing in 2500 red bloodcells. Output data were statistically treated using paramet-ric and non-parametric statistics.
Two different kinds of experiments were performedthrough three different series (B, W and P), namely:
i) trials covering a range of base areas after fixing both thehaematocrit layer volume and depth: P series were carriedout to evaluate the effect of the walls of the culture device.They were set in 90 mm diameter glass Petri dishes thathad been split into detached subregions by gluing glassseparators onto the plate base surface. Different distancesbetween the glass separators (L) were checked. Each sub-region was evaluated separately and a control monitoringof a subregion of the culturing device with fixed base sur-face was performed for each trial.
ii) trials varying the haematocrit layer depth (HLD) bymodifying both the surface base and the total culture vol-
Page 2 of 12(page number not for citation purposes)
Malaria Journal 2008, 7:203 http://www.malariajournal.com/content/7/1/203
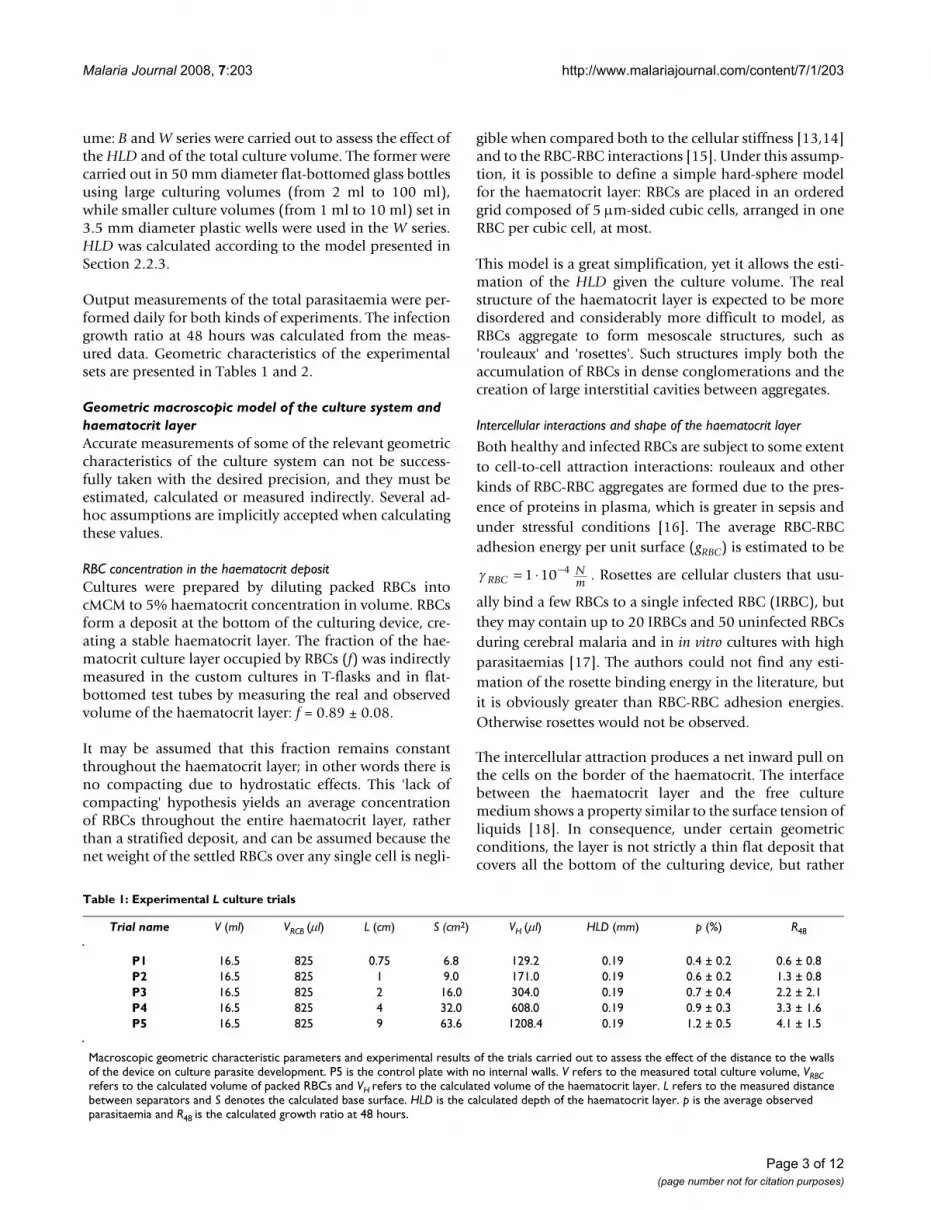
ume: B and W series were carried out to assess the effect ofthe HLD and of the total culture volume. The former werecarried out in 50 mm diameter flat-bottomed glass bottlesusing large culturing volumes (from 2 ml to 100 ml),while smaller culture volumes (from 1 ml to 10 ml) set in3.5 mm diameter plastic wells were used in the W series.HLD was calculated according to the model presented inSection 2.2.3.
Output measurements of the total parasitaemia were per-formed daily for both kinds of experiments. The infectiongrowth ratio at 48 hours was calculated from the meas-ured data. Geometric characteristics of the experimentalsets are presented in Tables 1 and 2.
Geometric macroscopic model of the culture system and haematocrit layerAccurate measurements of some of the relevant geometriccharacteristics of the culture system can not be success-fully taken with the desired precision, and they must beestimated, calculated or measured indirectly. Several ad-hoc assumptions are implicitly accepted when calculatingthese values.
RBC concentration in the haematocrit depositCultures were prepared by diluting packed RBCs intocMCM to 5% haematocrit concentration in volume. RBCsform a deposit at the bottom of the culturing device, cre-ating a stable haematocrit layer. The fraction of the hae-matocrit culture layer occupied by RBCs (f) was indirectlymeasured in the custom cultures in T-flasks and in flat-bottomed test tubes by measuring the real and observedvolume of the haematocrit layer: f = 0.89 ± 0.08.
It may be assumed that this fraction remains constantthroughout the haematocrit layer; in other words there isno compacting due to hydrostatic effects. This 'lack ofcompacting' hypothesis yields an average concentrationof RBCs throughout the entire haematocrit layer, ratherthan a stratified deposit, and can be assumed because thenet weight of the settled RBCs over any single cell is negli-
gible when compared both to the cellular stiffness [13,14]and to the RBC-RBC interactions [15]. Under this assump-tion, it is possible to define a simple hard-sphere modelfor the haematocrit layer: RBCs are placed in an orderedgrid composed of 5 μm-sided cubic cells, arranged in oneRBC per cubic cell, at most.
This model is a great simplification, yet it allows the esti-mation of the HLD given the culture volume. The realstructure of the haematocrit layer is expected to be moredisordered and considerably more difficult to model, asRBCs aggregate to form mesoscale structures, such as'rouleaux' and 'rosettes'. Such structures imply both theaccumulation of RBCs in dense conglomerations and thecreation of large interstitial cavities between aggregates.
Intercellular interactions and shape of the haematocrit layer
Both healthy and infected RBCs are subject to some extentto cell-to-cell attraction interactions: rouleaux and otherkinds of RBC-RBC aggregates are formed due to the pres-ence of proteins in plasma, which is greater in sepsis andunder stressful conditions [16]. The average RBC-RBCadhesion energy per unit surface (gRBC) is estimated to be
. Rosettes are cellular clusters that usu-
ally bind a few RBCs to a single infected RBC (IRBC), butthey may contain up to 20 IRBCs and 50 uninfected RBCsduring cerebral malaria and in in vitro cultures with highparasitaemias [17]. The authors could not find any esti-mation of the rosette binding energy in the literature, butit is obviously greater than RBC-RBC adhesion energies.Otherwise rosettes would not be observed.
The intercellular attraction produces a net inward pull onthe cells on the border of the haematocrit. The interfacebetween the haematocrit layer and the free culturemedium shows a property similar to the surface tension ofliquids [18]. In consequence, under certain geometricconditions, the layer is not strictly a thin flat deposit thatcovers all the bottom of the culturing device, but rather
γ RBCNm= 1 10 4⋅ −
Table 1: Experimental L culture trials
Trial name V (ml) VRCB (μl) L (cm) S (cm2) VH (μl) HLD (mm) p (%) R48
P1 16.5 825 0.75 6.8 129.2 0.19 0.4 ± 0.2 0.6 ± 0.8P2 16.5 825 1 9.0 171.0 0.19 0.6 ± 0.2 1.3 ± 0.8P3 16.5 825 2 16.0 304.0 0.19 0.7 ± 0.4 2.2 ± 2.1P4 16.5 825 4 32.0 608.0 0.19 0.9 ± 0.3 3.3 ± 1.6P5 16.5 825 9 63.6 1208.4 0.19 1.2 ± 0.5 4.1 ± 1.5
Macroscopic geometric characteristic parameters and experimental results of the trials carried out to assess the effect of the distance to the walls of the device on culture parasite development. P5 is the control plate with no internal walls. V refers to the measured total culture volume, VRBC refers to the calculated volume of packed RBCs and VH refers to the calculated volume of the haematocrit layer. L refers to the measured distance between separators and S denotes the calculated base surface. HLD is the calculated depth of the haematocrit layer. p is the average observed parasitaemia and R48 is the calculated growth ratio at 48 hours.
Page 3 of 12(page number not for citation purposes)

Malaria Journal 2008, 7:203 http://www.malariajournal.com/content/7/1/203
resembles a sessile drop. The shape of the layer dependson the ratio between the intercellular attractive forces andthe RBC adhesion to the walls of the culturing device. Forsmall volumes of packed RBCs, the haematocrit layer cov-ers only a fraction of the total available surface at the bot-tom of the culturing device, and different shapes can beobserved for wettable (polymer surfaces) and non-wetta-ble materials such as glass surfaces (Figure 1).
The analogy with liquids can be used to define the capil-
lary length ( ), the haracteristic length scale in
which intercellular interactions are comparable to gravita-tional energy.
LC defines the extent to which the effects of the surface ten-
sion must be taken into account. For in vitro cultures,
is the difference in density between an aver-
age RBC and the culturing medium, and is
gravity. By considering just the RBC-RBC interactions
[15], a minimum threshold for the cap-Lc g= γ
ρΔ
Δρ = 140 3Kg
m
g m
s= 9.8 2
γ RBCNm= 1 10 4⋅ −
Table 2: Experimental HLD culture trials
Trial name V (ml) VRBC(μl) D (cm) S (cm2) VH(μl) HLD (mm) P (%) R48
W1 1.0 49.4 3.5 9.62 73.73 0.060. ± 0.015 1.5 ± 1.2 5.2 ± 1.8W2 1.5 74.1 3.5 9.62 110.60 0.09 ± 0.02 1.6 ± 1.1 5.4 ± 1.9W3 3.1 155.5 3.5 9.62 194.03 0.19 ± 0.05 1.7 ± 1.3 6 ± 2W4 5.8 290 3.5 9.62 232.09 0.34 ± 0.08 1.5 ± 1.0 4.9 ± 1.0W5 10.0 500 3.5 9.62 388.06 0.59 ± 0.15 1.4 ± 1.0 5 ± 2B1 2.6 130 3.1 7.54 432.84 0.18 ± 0.05 1.8 ± 1.2 6.3 ± 1.2B2 5.2 260 3.3 8.55 432.84 0.34 ± 0.08 1.7 ± 1.2 6.4 ± 0.9B3 5.8 290 3.4 9.08 746.27 0.32 ± 0.08 1.7 ± 1.6 7 ± 3B4 10.1 506.5 3.6 10.1 755.97 0.56 ± 0.14 1.4 ± 0.8 5.1 ± 0.8B5 10.4 520 3.5 9.62 776.12 0.60 ± 0.15 1.4 ± 1.0 5.1 ± 1.8B6 20.8 1040 3.9 11.9 1552.24 1.0 ± 0.2 1.1 ± 1.5 3.3 ± 0.7B7 26.0 1300 4.1 13.2 1940.30 1.1 ± 0.3 1.0 ± 0.4 3.0 ± 0.5B8 51.5 2074 5 19.6 3841.79 1.5 ± 0.4 0.7 ± 0.2 1.6 ± 0.3B9 68.6 3432 5 19.6 5122.39 2.0 ± 0.5 0.50 ± 0.19 1.6 ± 0.4B10 74.1 3705 5 19.6 5529.85 2.2 ± 0.5 0.4 ± 0.2 1.0 ± 0.2B11 98.8 4940 5 19.6 7373.13 2.9 ± 0.7 0.3 ± 0.16 0.8 ± 0.4
Macroscopic geometric characteristic parameters and experimental results of the trials performed to assess the effect of HLD on the culture development. V refers to the total culture volume, VRBC refers to the calculated volume of packed RBCs, and VH refers to the calculated volume of the haematocrit layer. D refers to the diameter of the haematocrit layer deposit and S denotes the calculated base surface. HLD is the calculated depth of the haematocrit layer, p is the average of the observed parasitaemias and R48 is the calculated growth ratio at 48 h. W refers to cultures in 6-well plastic plates and B to cultures in 5 cm diameter flat-bottom glass bottles. W assays with volumes lower than 1.0 ml have not been presented because they did not develop well, due to the effects of surface tension.
Different observed shapes of the haematocrit layerFigure 1Different observed shapes of the haematocrit layer. A) Glass culturing devices produce a convex meniscus. A1: flat bot-tomed bottles used in the B series. A2: Petri dishes with glass separators used in the P series. B) Plastic culturing devices pro-duce a concave meniscus, as can be observed in the 6-well plates used in the W series.
Page 4 of 12(page number not for citation purposes)
Malaria Journal 2008, 7:203 http://www.malariajournal.com/content/7/1/203
illary length can be defined: Lc = 0.27 mm. In this context,
LC can be associated with the maximum depth of an
unbounded sessile drop [19], meaning the maximumdepth that the haematocrit layer can reach when it is set-tled in the bottom of a culturing device without being incontact with its lateral walls. It can also be associated withthe area of the region affected by the curve of the menis-cus, as, for instance, the fraction of the layer which isaffected by the presence of the walls of the culturingdevice when the layer covers the whole bottom surface(LEXC). It must be pointed out that this calculated value for
LC is expected to be an underestimation of the value calcu-
lated from experimental observations, because the presentestimation does not account for the strengthening ofintercellular interactions (adhesiveness) caused by theinfection.
Estimation of the experimental haematocrit layer depthThe capillary length determines the shape and depth ofthe haematocrit deposit for very small cultures. The usualculturing conditions imply spatial scales much larger thanthe capillary length and thus surface tension effects maybe neglected and the haematocrit layer may be considereda flat thin bed.
Under this assumption, haematocrit layer depth (HLD) iscalculated from the total culture volume (V), haematocritconcentration (H) and fraction of the haematocrit layeroccupied by RBCs (f) (Equation 1).
The calculated HLD is used from now on to characterizethe effect of the haematocrit depth on parasite develop-ment in static in vitro cultures
ResultsExperiments reveal two geometric characteristics of thehaematocrit layer that affect the in vitro development ofthe parasite: depth (HLD) and separation between wallsof the culturing device (L). Culture characteristics andobserved results for W, B and P trials are presented inTables 1 and 2.
The observed measurements throughout each trial show astrong time correlation, as a consequence of both the par-asite infection cycle and the external manipulation of theculture system. In fact, each single trial can be regarded asthe evolution of a single culture, thus characterized by theaverage parasitaemia throughout the whole culture trial(p), or as a set of replicas of the evolution of the culturebetween two subsequent sub-cultivations, thus character-
ized by the average growth ratio (R48). The latter approachseems to be more appropriate in building geometric mod-els to better understand the evolution of the culture,because the cycles throughout each trial show a similarbehaviour and no significant long-term evolution can bedistinguished in a scale broader than the subcultivationcycles. Thus the data sets from each trial comprise a varia-ble amount of the observed growth ratios between twosuccessive subcultivations. Further, a Jarque-Bera (JB) testshows that data sets from any single trial do not comefrom a normal distribution, so the observed statistical dis-persion of the measurements of the parasitaemia must notbe mistaken for a standard deviation from the averagevalue. The calculated growth ratios barely fulfil the JB testrequirement with 90% significance. Thus, the comparisonof the data from each of the trials within a series must betackled using non-parametric statistics.
Experimental results were also compared to geometric sys-tem-level models and to bottom-up approaches (IBMs).Comparison between theoretical outcomes and experi-mental results were carried out assuming that both datasets were sampled from normal distributions.
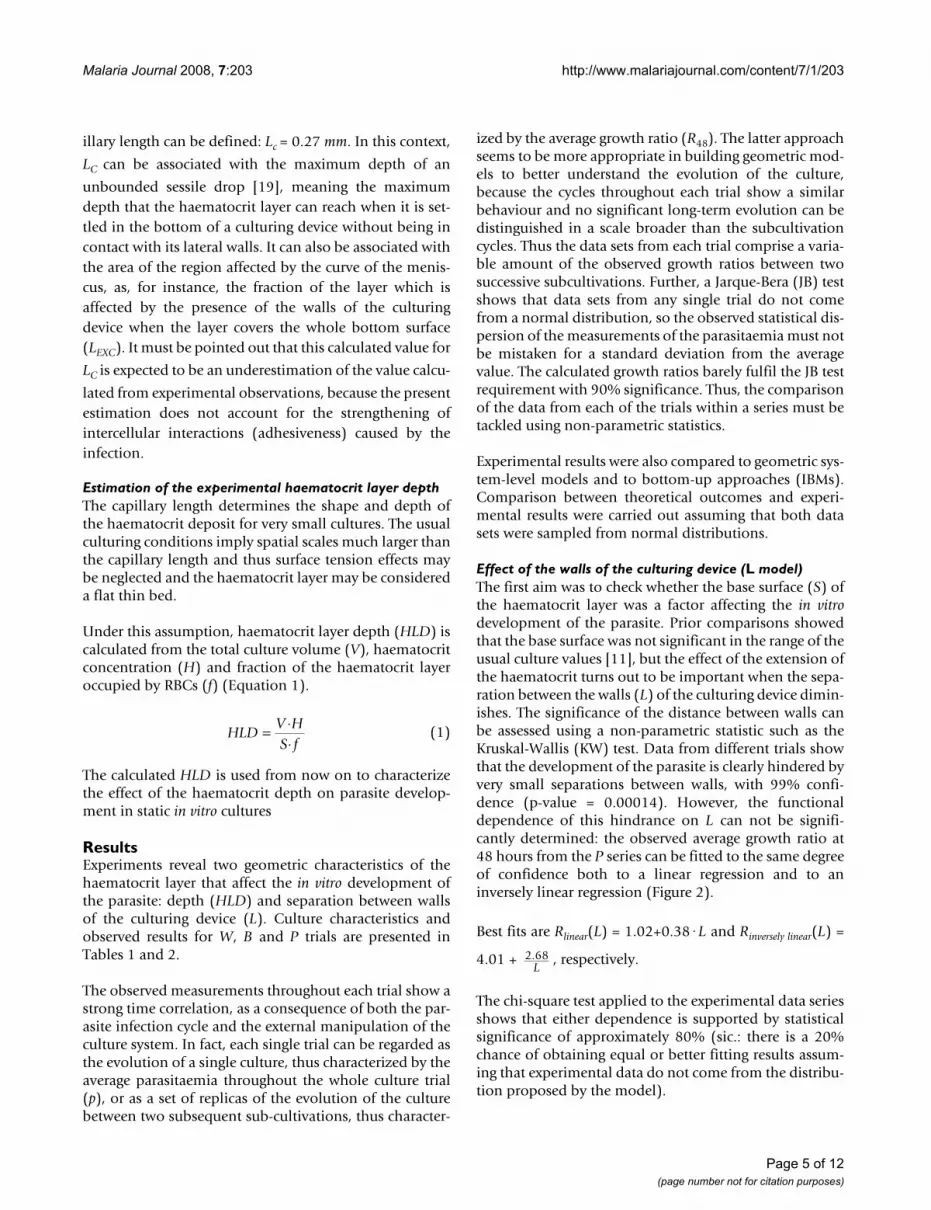
Effect of the walls of the culturing device (L model)The first aim was to check whether the base surface (S) ofthe haematocrit layer was a factor affecting the in vitrodevelopment of the parasite. Prior comparisons showedthat the base surface was not significant in the range of theusual culture values [11], but the effect of the extension ofthe haematocrit turns out to be important when the sepa-ration between the walls (L) of the culturing device dimin-ishes. The significance of the distance between walls canbe assessed using a non-parametric statistic such as theKruskal-Wallis (KW) test. Data from different trials showthat the development of the parasite is clearly hindered byvery small separations between walls, with 99% confi-dence (p-value = 0.00014). However, the functionaldependence of this hindrance on L can not be signifi-cantly determined: the observed average growth ratio at48 hours from the P series can be fitted to the same degreeof confidence both to a linear regression and to aninversely linear regression (Figure 2).
Best fits are Rlinear(L) = 1.02+0.38·L and Rinversely linear(L) =
4.01 + , respectively.
The chi-square test applied to the experimental data seriesshows that either dependence is supported by statisticalsignificance of approximately 80% (sic.: there is a 20%chance of obtaining equal or better fitting results assum-ing that experimental data do not come from the distribu-tion proposed by the model).
HLDV HS f
= ⋅⋅
(1)
2.68L
Page 5 of 12(page number not for citation purposes)
Malaria Journal 2008, 7:203 http://www.malariajournal.com/content/7/1/203
The inversely linear dependence can be explained bymeans of a whole-system model that considers an exclu-sion region in the vicinity of the walls of the culturingdevice where the infection cannot progress (see Figure3a). Under this assumption, the expected average growthratio of a culture as a function of the separation betweenwalls (R48(L)) is described by curve 2:
where A2 is the growth ratio in the exclusion region (LEXC),and A1 is the bulk growth ratio (A1 > A2). The parametersthat best fit this curve to the experimental data set areshown in Table 3. According to this fit, the exclusionregion would be spread over approximately LEXC = 2.5 mm.Many microscopic mechanisms may be speculated asbeing responsible for creating this exclusion region (e. g.,limitations on the spread of the metabolic waste products,hindered propagation of the parasite due to the existenceof a meniscus) but it is not possible to discriminateamong them with the current information. In particular,the observed exclusion region is consistent with theexpected exclusion region induced by the capillary length(LC) (see Section 2.2.2).
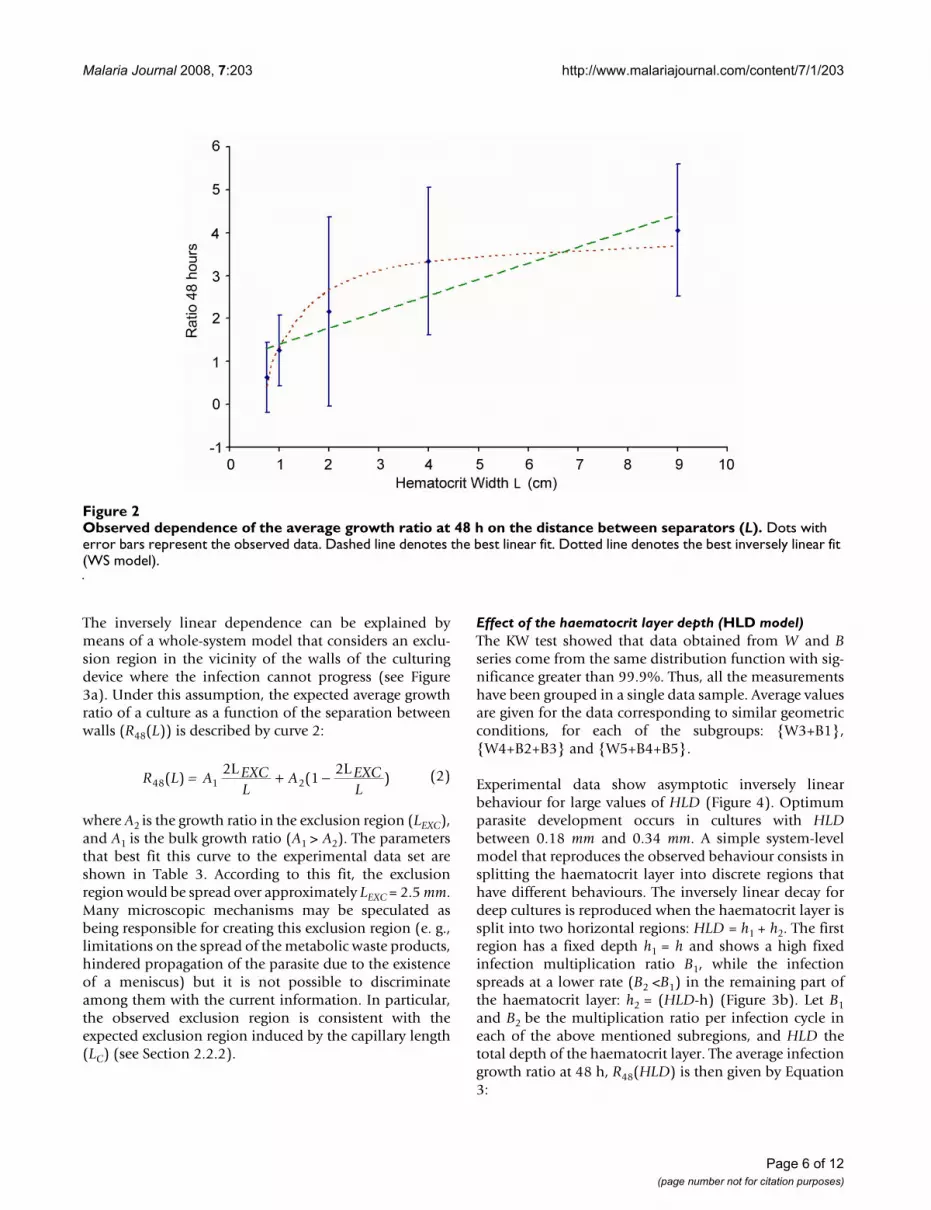
Effect of the haematocrit layer depth (HLD model)The KW test showed that data obtained from W and Bseries come from the same distribution function with sig-nificance greater than 99.9%. Thus, all the measurementshave been grouped in a single data sample. Average valuesare given for the data corresponding to similar geometricconditions, for each of the subgroups: {W3+B1},{W4+B2+B3} and {W5+B4+B5}.
Experimental data show asymptotic inversely linearbehaviour for large values of HLD (Figure 4). Optimumparasite development occurs in cultures with HLDbetween 0.18 mm and 0.34 mm. A simple system-levelmodel that reproduces the observed behaviour consists insplitting the haematocrit layer into discrete regions thathave different behaviours. The inversely linear decay fordeep cultures is reproduced when the haematocrit layer issplit into two horizontal regions: HLD = h1 + h2. The firstregion has a fixed depth h1 = h and shows a high fixedinfection multiplication ratio B1, while the infectionspreads at a lower rate (B2 <B1) in the remaining part ofthe haematocrit layer: h2 = (HLD-h) (Figure 3b). Let B1and B2 be the multiplication ratio per infection cycle ineach of the above mentioned subregions, and HLD thetotal depth of the haematocrit layer. The average infectiongrowth ratio at 48 h, R48(HLD) is then given by Equation3:
R L A EXCL
A EXCL48
2L(1
2L( ) )= 1 2+ − (2)
Observed dependence of the average growth ratio at 48 h on the distance between separators (L)Figure 2Observed dependence of the average growth ratio at 48 h on the distance between separators (L). Dots with error bars represent the observed data. Dashed line denotes the best linear fit. Dotted line denotes the best inversely linear fit (WS model).
Page 6 of 12(page number not for citation purposes)

Malaria Journal 2008, 7:203 http://www.malariajournal.com/content/7/1/203
This behaviour can be theoretically supported by the con-sideration of local diffusive limitations of relevant solutesthrough the haematocrit layer. For instance, parasitedevelopment could be optimal in the vicinity of the inter-face with the free culturing medium, and hindered in'deep regions' of the haematocrit layer due to the localscarcity of glucose, or to the excess of harmful metabolicwaste products. The parameters that define the curve thatbest fits with the experimental data set are shown in Table3.
The parameters have been estimated using a numericalapproximation, and their likelihood given the observa-
tions has been checked using both the Kolmogorov-Smirnoff (KS) test and the chi-squared test (c2). Theformer statistic has been taken as the reference for the sta-tistical significance of likelihood, because it implies fewerrestrictions on both data sets and provides a smaller valuefor the degree of confidence of the results.
Whole-system model that accounts for HLD and L together (WS model)The models presented in sections 3.1 and 3.2 can bemerged into a system-level representation of the wholeculture (Figure 3c). The evolution of the culture as a func-tion of the geometric variables L and HDL is shown inEquation 4:
R HLDB B B
hHLD
if HLD > h
B if HLD < h48( )
( )=
+2 1 2
2
− ⋅⎧⎨⎪
⎩⎪
(3)
R L,HLDK K K
hHLD L
if HLD > h
K EXCL
K48
2
( )( ) ( )
(=
+
+
2 1 2
1
12LEXC
2L1
− ⋅ ⋅ −
−−
⎧
⎨⎪⎪
⎩⎪⎪
2LEXC L
if HLD < h)
(4)
Depiction of the whole system model of the haematocrit layerFigure 3Depiction of the whole system model of the haematocrit layer. a) Schema of the culture system according to the model used to tackle P trials. HLD indicates haematocrit layer depth, L stands for the separation between walls of the culturing device and LEXC represents the extent of the exclusion region, where the spread of the infection is hindered. The shaded subre-gion (1) indicates the fraction of the haematocrit layer where the rate of infection spreading is high. b) Schema of the culture system according to the model used to tackle B and W trials. HLD indicates the haematocrit layer depth, D stands for the diam-eter of the haematocrit layer and h represents the region where the spread of the infection is not hindered. The shaded subre-gion (1) indicates the fraction of the haematocrit layer where the rate of infection spreading is high. c) Schaema of the model to tackle all the geometric effects simultaneously. The propagation of the infection is hindered both by the walls of the culturing device and by diffusive limitations. The shaded subregion (1) indicates the fraction of the haematocrit layer where the rate of infection spread is high.
Table 3: Characteristic parameters of the continuous models
Characteristic parameters of the L-model A1 A2 LEXC (mm) p-valueBest fit values 4.1 0.6 2.5 0.03Characteristic parameters of the HLD-model B1 B2 H (mm) p-valueBest fit values 5.8 0.1 0.7 < 0.0001Characteristic parameters of the WS-model K1 K2 H, LEXC p-valueBest fit values 5.4 0.4 set 0.001
Characteristic parameters of the continuous models defined at a system level of description that best reproduces the experimental observations. L-model considers the effect of the distance between the walls of the culturing device, and LEXC is the region near the walls of the culturing device where the propagation of the parasite is hindered; HLD-model considers the effect of the depth of the haematocrit layer, with h the horizontal subregion where the propagation of the parasite is not hindered; WS-model merges both models and aims to reproduce the culture behaviour for any geometric layout; LEXC and h have maintained their values from the best fits obtained with the L- and the HLD- models. The values for the parameters K1 and K2 have been set through the optimization of the likelihood of the model outcome to experimental data. Significance of the obtained results was assessed using the Kolmogorov-Smirnoff (KS) test; the values presented show the probability of obtaining better results assuming the null hypothesis.
Page 7 of 12(page number not for citation purposes)
Malaria Journal 2008, 7:203 http://www.malariajournal.com/content/7/1/203
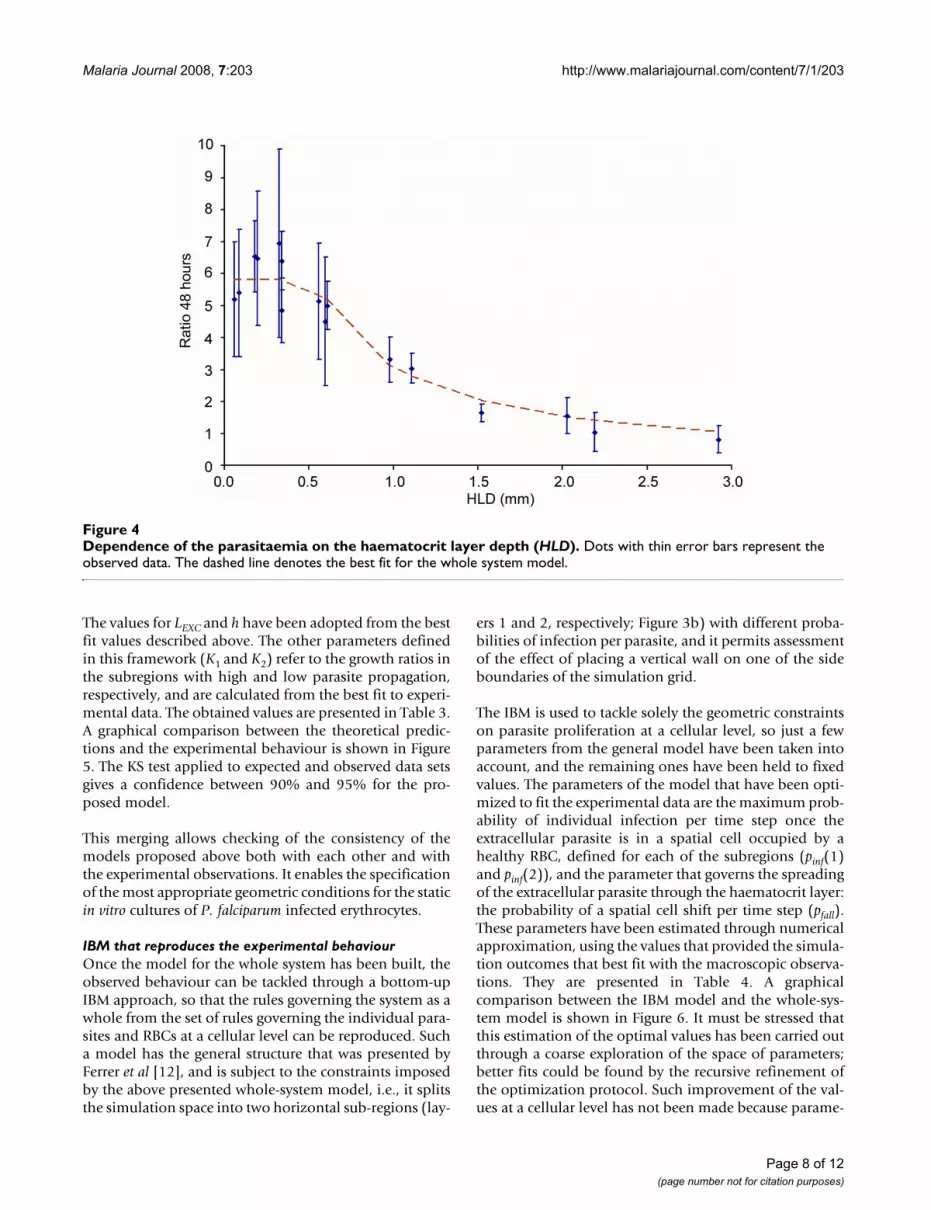
The values for LEXC and h have been adopted from the bestfit values described above. The other parameters definedin this framework (K1 and K2) refer to the growth ratios inthe subregions with high and low parasite propagation,respectively, and are calculated from the best fit to experi-mental data. The obtained values are presented in Table 3.A graphical comparison between the theoretical predic-tions and the experimental behaviour is shown in Figure5. The KS test applied to expected and observed data setsgives a confidence between 90% and 95% for the pro-posed model.
This merging allows checking of the consistency of themodels proposed above both with each other and withthe experimental observations. It enables the specificationof the most appropriate geometric conditions for the staticin vitro cultures of P. falciparum infected erythrocytes.
IBM that reproduces the experimental behaviourOnce the model for the whole system has been built, theobserved behaviour can be tackled through a bottom-upIBM approach, so that the rules governing the system as awhole from the set of rules governing the individual para-sites and RBCs at a cellular level can be reproduced. Sucha model has the general structure that was presented byFerrer et al [12], and is subject to the constraints imposedby the above presented whole-system model, i.e., it splitsthe simulation space into two horizontal sub-regions (lay-
ers 1 and 2, respectively; Figure 3b) with different proba-bilities of infection per parasite, and it permits assessmentof the effect of placing a vertical wall on one of the sideboundaries of the simulation grid.
The IBM is used to tackle solely the geometric constraintson parasite proliferation at a cellular level, so just a fewparameters from the general model have been taken intoaccount, and the remaining ones have been held to fixedvalues. The parameters of the model that have been opti-mized to fit the experimental data are the maximum prob-ability of individual infection per time step once theextracellular parasite is in a spatial cell occupied by ahealthy RBC, defined for each of the subregions (pinf(1)and pinf(2)), and the parameter that governs the spreadingof the extracellular parasite through the haematocrit layer:the probability of a spatial cell shift per time step (pfall).These parameters have been estimated through numericalapproximation, using the values that provided the simula-tion outcomes that best fit with the macroscopic observa-tions. They are presented in Table 4. A graphicalcomparison between the IBM model and the whole-sys-tem model is shown in Figure 6. It must be stressed thatthis estimation of the optimal values has been carried outthrough a coarse exploration of the space of parameters;better fits could be found by the recursive refinement ofthe optimization protocol. Such improvement of the val-ues at a cellular level has not been made because parame-
Dependence of the parasitaemia on the haematocrit layer depth (HLD)Figure 4Dependence of the parasitaemia on the haematocrit layer depth (HLD). Dots with thin error bars represent the observed data. The dashed line denotes the best fit for the whole system model.
Page 8 of 12(page number not for citation purposes)
Malaria Journal 2008, 7:203 http://www.malariajournal.com/content/7/1/203
Page 9 of 12(page number not for citation purposes)
Dependence of the parasite growth ratio both on the haematocrit layer depth (HLD) and width (L), represented as the dependence on the total number of cultured RBCsFigure 5Dependence of the parasite growth ratio both on the haematocrit layer depth (HLD) and width (L), repre-sented as the dependence on the total number of cultured RBCs. Dots with error bars represent the observed data from P trials. Triangles with error bars represent the averaged observed values from W and B trials. The solid line represents the best fit values provided by the WS model. a) Experimental data sets from W and B trials on the whole. b) Detail for trials with small culture volumes.

Malaria Journal 2008, 7:203 http://www.malariajournal.com/content/7/1/203
ters such as pinf concern specific characteristics of theparasite strain and blood sample, and thus do not providegeneral insight concerning the culture system. The likeli-hood of the simulation results, given the experimentalobservations, has been checked using both the Kol-mogorov-Smirnoff (KS) test and the chi-squared test (c2).Again, the former statistic has been taken as the referencefor the statistical significance of the likelihood, because itimplies fewer restrictions on both data sets and it providesa smaller value for the degree of confidence of the results.
DiscussionThe systematic study of different macroscopic culturingconditions has allowed for the building of a quite simplemodel which is compatible with the experimental obser-vations and which may account for some as yet poorlyunderstood phenomena.
Some conclusions may be drawn from the experimentalresults, assuming the whole-system model:
1. Cell-cell interactions such as erythrocyte aggregatenessand rosette formation around parasitized cells can beaccounted for as average intercellular binding energy thatdetermines the macroscopic shape of the haematocritlayer in the in vitro cultivation of P. falciparum-infectederythrocytes. Under custom culturing conditions, the hae-matocrit layer can be considered as a flat film, but suchdepiction is not valid when the haematocrit volumedecreases. At small volumes of haematocrit the intracellu-
lar binding energy (which can be tackled as a surface ten-sion on the haematocrit boundaries) is comparable togravitational energy, so the haematocrit must be regardedas a sessile drop at the macroscopic scale. Different hae-matocrit shapes are observed depending on the materialof the culturing device.
2. Geometric conditions of the culture systems at a macro-scopic level of description play an important role in para-site development. Most appropriate dimensions ofhaematocrit layer depth (HLD) range from 0.18 mm to0.34 mm. The spread of the infection is strongly hinderedwhen HLD > 1 mm. According to this model, the spread ofthe infection is strongly hindered by short distancesbetween walls (L), and cultures are unviable when L <LEXC= 2.5 mm. By extrapolating Equation 4, it is deduced thatthe effect of the exclusion region can be overlooked whenL > 2 cm with more than 95% confidence. Effective para-site development takes place solely in a limited region ofthe haematocrit layer. One of the possible culturing sce-narios shows the area of parasite proliferation coveringsolely the haematocrit upper surface (properly speaking,the interface between the haematocrit layer and the freeculturing medium), excluding the boundaries in contactwith the walls of the culturing device.
A bottom-up approach can be used to check the validityand consistency of the system-level model (WS model).This may provide justification for splitting the haemat-ocrit layer into two subregions due to the diffusive limita-
Dependence of the parasite growth ratio on the haematocrit layer depth (HLD)Figure 6Dependence of the parasite growth ratio on the haematocrit layer depth (HLD). Dots with error bars represent the observed data. The solid line denotes the best fit for the Individual-Based Model simulation outcomes. Dashed lines repre-sent the deviation observed for four simulation runs of each of the observed points.
Page 10 of 12(page number not for citation purposes)
Malaria Journal 2008, 7:203 http://www.malariajournal.com/content/7/1/203
tions of the substrate through the haematocrit, and theconsequent formation of gradients of concentration thatmay hinder the viability of the IRBCs. Such an approachalso enables specific study and treatment of the relevantprocesses occurring at the scale of the parasite. The macro-scopic subregions of different parasite proliferations (lay-ers 1 and 2 in Figure 3) are externally imposed on the IBMas modifications on the parasite proliferation at a locallevel. Some additional conclusions may be drawn fromanalysis of the IBM:
all authors have read and approved the final manuscript.
3. The maximum threshold for the growth ratio at thezone of high parasite proliferation is geometrically fixed.The local multiplication of the parasite is not enough toensure its propagation; a minimum spreading range isalso required. This is shown by the model when increas-ing the maximum probability of individual infection (pinf)above a certain threshold value and noting that this doesnot increase the infection growth ratio. Indeed, allowing agreater diffusion rate for the extracellular parasite throughthe haematocrit layer (pfall) does increase the globalgrowth ratio over the previous maximum threshold. Thedefinition of the spreading range strongly affects the sys-tem-level outcome behaviour. In particular, if merozoitesare allowed to propagate fast enough (pfall > 0.2 per timestep), the decay in the infection with (HLD) is hindered.
4. The observed reduction in the average R48 for very thinhaematocrit layers (unfeasibility of the harvest when HLD< 0.04 mm, and observable effects on cultures with HLD <0.2 mm) can be reproduced with the IBM even though ithas not been introduced as an external input on the rulesgoverning the model. This is an example of an emergentbehaviour that arises from the local interactions amongindividuals, and it is caused by the effect of the bottomboundary of the system on the propagation of the para-site. Such behaviour can be related to a hindering effectcaused by the bottom of the culturing devices on realexperimental systems.
ConclusionThe present study provides some hints for the predictiveunderstanding of P. falciparum-infected erythrocytes static
in vitro cultures under different geometric constructions. Asystematic study has been carried out examining a widerange of geometric configurations, and the observedbehaviour has been formalized in a system-level phenom-enological model.
The theoretical analysis of the phenomenological laws hasbeen carried out by means of a bottom-up approach con-sidering solely the geometric limitations on the parasitepropagation. However, many other factors should betaken into consideration in order to obtain a broaderdepiction of the system.
Competing interestsThe authors declare that they have no competing interests.
Authors' contributionsMDR, JMV, EH and DG performed the systematic experi-mental trials; CP, JMV, JF and DL built the system-leveland IBM models; and JF, CP, DL and JV carried out theIBM simulations and analysed the results. All authorshave read and approved the final manuscript.
AcknowledgementsWe thank Marta Dies for her help with statistical analysis of the experimen-tal data and simulation results. We gratefully acknowledge the financial sup-port of the Plan Nacional I+D+i of the Ministerio de Educación y Ciencia CGL 2007-65142/BOS.
References1. Pavanand K, Permpani B, Chuanak N, Sookto P: Preservation of
Plasmodium falciparum-infected erythrocytes for in vitro cul-tures. J Parasitol 1974, 60:537-539.
2. Trager W, Jensen JB: Human malaria parasites in continuousculture. Science 1976, 193:673-675.
3. Jensen JB, Trager W: Some recent advances in the cultivationof Plasmodium falciparum. Isr J Med Sci 1978, 14:563-570.
4. Trager W: Cultivation of malaria parasites. Methods Cell Biol1994, 45:7-26.
5. Schuster FL: Cultivation of Plasmodium spp. Clin Microbiol Rev2002, 15:355-364.
6. Hurd H, Al-Olayan E, Butcher GA: In vitro methods for culturingvertebrate and mosquito stages of Plasmodium. Microbes Infect2003, 5:321-327.
7. Butcher GA: A comparison of static thin layer and suspensioncultures for the maintenance in vitro of Plasmodium falci-parum. Ann Trop Med Parasitol 1981, 75:7-17.
8. Butcher GA: The behaviour of different strains of Plasmodiumfalciparum in suspension and static cultures. Trans R Soc TropMed Hyg 1982, 76:407-409.
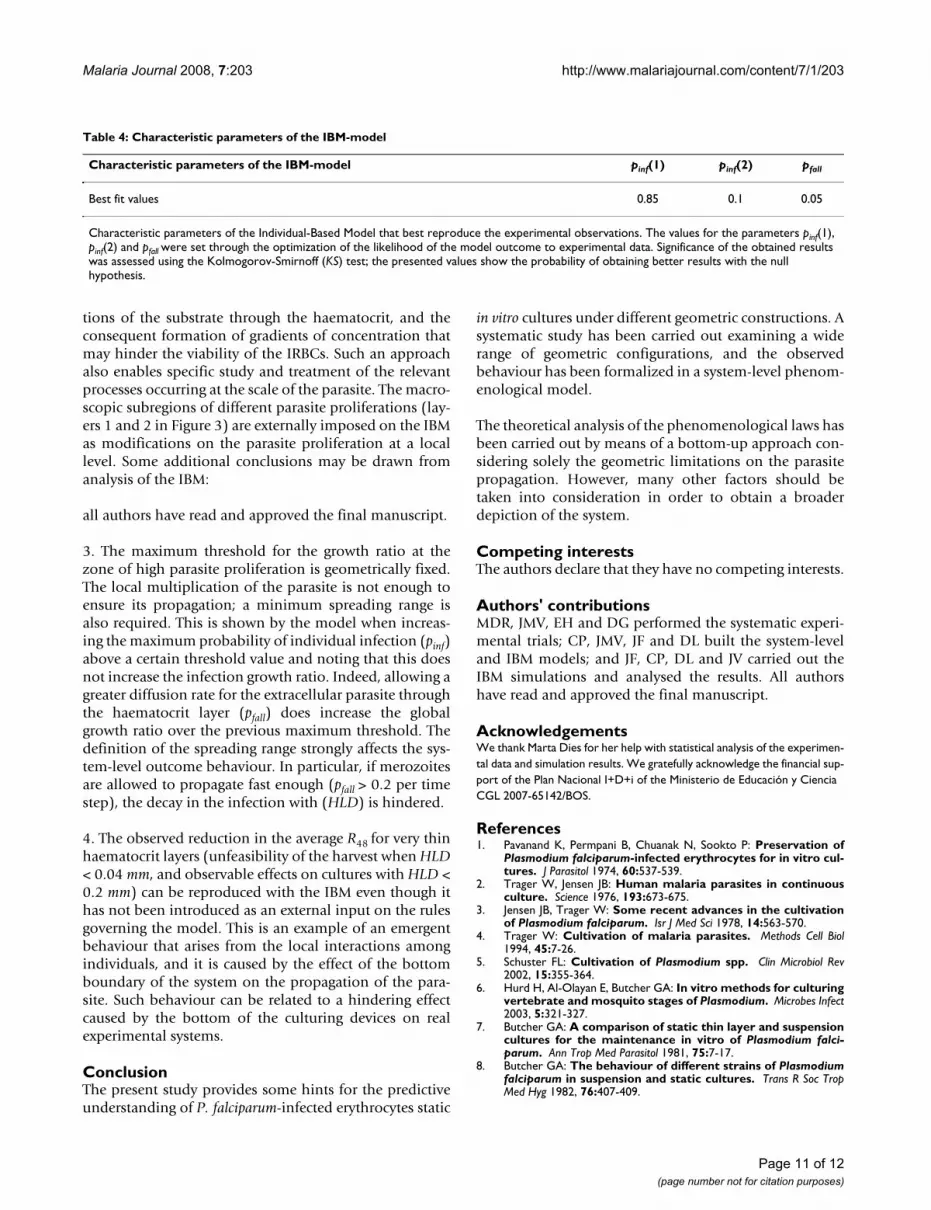
Table 4: Characteristic parameters of the IBM-model
Characteristic parameters of the IBM-model pinf(1) pinf(2) pfall
Best fit values 0.85 0.1 0.05
Characteristic parameters of the Individual-Based Model that best reproduce the experimental observations. The values for the parameters pinf(1), pinf(2) and pfall were set through the optimization of the likelihood of the model outcome to experimental data. Significance of the obtained results was assessed using the Kolmogorov-Smirnoff (KS) test; the presented values show the probability of obtaining better results with the null hypothesis.
Page 11 of 12(page number not for citation purposes)

Malaria Journal 2008, 7:203 http://www.malariajournal.com/content/7/1/203
Publish with BioMed Central and every scientist can read your work free of charge
"BioMed Central will be the most significant development for disseminating the results of biomedical research in our lifetime."
Sir Paul Nurse, Cancer Research UK
Your research papers will be:
available free of charge to the entire biomedical community
peer reviewed and published immediately upon acceptance
cited in PubMed and archived on PubMed Central
yours — you keep the copyright
Submit your manuscript here:http://www.biomedcentral.com/info/publishing_adv.asp
BioMedcentral
9. Palmer KL, Hui GNS, Siddiqui WA: A large-scale in vitro produc-tion system for Plasmodium falciparum. J Parasitol 1982,68:1180-1183.
10. Moloney MB, Pawluk AR, Ackland NR: Plasmodium falciparumgrowth in deep culture. Trans R Soc Trop Med Hyg 1990,84:516-518.
11. Malaria Research and Reference Reagent Resource Center (MR4):Methods in Malaria Research. MR4/ATCC 2008:1-3 [http://www.mr4.org/Publications/MethodsinMalariaResearch/tabid/333/Default.aspx].
12. Ferrer J, Vidal J, Prats C, Valls J, Herreros E, López D, Giró A, Gar-gallo D: Individual-based model and simulation of Plasmodiumfalciparum infected erythrocyte in vitro cultures. J Theor Biol2007, 248:448-459.
13. Shung KK, Krisko BA, Ballard JO: Acoustic measurement oferythrocyte compressibility. J Acoust Soc Am 1982,72:1364-1367.
14. Godin M, Bryan AK, Burg TP, Babcock K, Manalis SR: Measuring themass, density, and size of particles and cells using a sus-pended microchannel resonator. J Appl Phys 2007, 91:123121.
15. Hochmuth RM, Marcus WD: Membrane tethers formed fromblood cells with available area and determination of theiradhesion energy. Biophys J 2002, 82:2964-2969.
16. Barshtein G, Wajnblum D, Yedgar S: Kinetics of linear rouleauxformation studied by visual monitoring of red cell dynamicorganization. Biophys J 2000, 78:2470-2474.
17. Wahlgren M, Fernandez V, Scholander C, Carlson J: Rosetting. Par-asitol Today 1994, 10:73-79.
18. Foty RA, Steinberg MS: The differential adhesion hypothesis: adirect evaluation. Dev Biol 2005, 278:255-263.
19. Padday JF, Pitt AR: Surface and interfacial tension from profileof a sessile drop. Proc R Soc Lond A Math 1972, 329:421-431.
Page 12 of 12(page number not for citation purposes)
Copyright © 2022 FDOKUMEN