Effect of sand-dune slope orientation on soil free-living nematode abundance and diversity
10
©2010 Parasitological Institute of SAS, Košice DOI 10.2478/s11687-010-0027-6 179 Summary The spatial and temporal dynamics and composition of a soil free-living nematode community were studied in order to determine the impact of slope orientation on the com- munity on the xeric south- and the mesic north-facing sand-dune slopes. A significant effect of sampling location on organic matter, total number of free-living nematodes, and trophic di- versity was found. Although soil moisture had a significant effect on separate nematode trophic groups and on most of the applied ecological indices, no differences in soil mois- ture were observed between slopes. Organic matter was found to have a significant effect on the fungivore nema- todes. The obtained results indicate that the south-facing slope is more favorable for the observed free-living nema- todes than the other sampling sites. Twenty-four of the 77 nematode species that were found in the observed area showed dependence on dune slope orientation. The fungi- bacteria ratio, Simpson's dominance index, and basal index were useful tools for determining slope differences. Keywords: desert ecosystem; dune; ecological indices; nematode communities; slope orientation; trophic groups Introduction Topography is one of the main factors influencing local microclimate by means of elevation, lateral redistribution of water, and slope orientation, and it, in turn, affects biotic distribution and diversity (Turner et al., 2001; Monger & Bestelmeyer, 2006). In the northern hemisphere (Nevo, 1997), south-facing slopes (SFS) receive higher solar radiation associated with higher temperatures and drought than the opposite north- facing slopes (NFS). Previous studies (Nevo, 1997, 2001; Pen-Mouratov et al., 2009) on the co-variation of the relief of an area and the diversity of plant and soil biotic com- ……. munities indicated that the SFS is richer in paleotropical xeric biota, whereas the NFS has higher densities of mesic temperate species. In spite of the small distance between the two slopes, a sharp and significant difference in micro- climatic conditions greatly influences the soil biota, lead- ing to an increasing divergence between species located on the south- and north-facing slopes. This difference is more pronounced in xeric environments (Auslander et al., 2003). Moreover, even relatively small-scale changes in relief of an area that occur across low ridges can dictate whether a biotic community is desertified (Monger & Bestelmeyer, 2006). The considerable effects of slope aspect on the surroundings can be seen in desert ecosystems with com- plex topography, where sharp and significant differences in microclimate conditions exist between the north-facing slopes (cooler, moister, with higher organic matter avail- ability) and the south-facing counterparts (warmer, dryer, with lower organic matter availability). These differences influence the biology, biodiversity, and ecology of above- ground organisms and lead to an increasing divergence between species located on the different-facing slopes (Dick-Peddie, 1993). Numerous investigations consider soil free-living nema- tode communities as one of the most important compo- nents of the soil biota (Sohlenius, 1980; Bongers, 1990; Whitford, 2002) and one the most useful indicators of soil quality (Bongers, 1990; de Goede & Bongers, 1994; Wasilewska, 1994; Gupta & Yeates, 1997). Our previous investigation showed the importance of the slope orienta- tion of a Plio-Pleistocene canyon dated 3 – 5 million years ago and its effect on trophic levels, community structure, and generic diversity of soil free-living nematodes (Pen- Mouratov et al., 2009). In spite of many scientific publications during the last decade devoted to studying the nematode community in sand-dune habitats (von Bussau, 1990; de Goede et al., HELMINTHOLOGIA, 47, 3: 179 – 188, 2010 Effect of sand-dune slope orientation on soil free-living nematode abundance and diversity S. PEN-MOURATOV 1 , C. HU 1,2 , E. HINDIN 1 , Y. STEINBERGER 1 * 1 The Mina & Everard Goodman Faculty of Life Sciences, Bar-Ilan University, Ramat-Gan 52900, Israel, Email: [email protected]; 2 Institute of Plant Protection and Soil Science, Hubei Academy of Agricultural Sciences, Wuhan 430064, P. R. China
-
Upload
independent -
Category
Documents
-
view
1 -
download
0
Transcript of Effect of sand-dune slope orientation on soil free-living nematode abundance and diversity

©2010 Parasitological Institute of SAS, Košice DOI 10.2478/s11687-010-0027-6
179
Summary The spatial and temporal dynamics and composition of a soil free-living nematode community were studied in order to determine the impact of slope orientation on the com-munity on the xeric south- and the mesic north-facing sand-dune slopes. A significant effect of sampling location on organic matter, total number of free-living nematodes, and trophic di-versity was found. Although soil moisture had a significant effect on separate nematode trophic groups and on most of the applied ecological indices, no differences in soil mois-ture were observed between slopes. Organic matter was found to have a significant effect on the fungivore nema-todes. The obtained results indicate that the south-facing slope is more favorable for the observed free-living nema-todes than the other sampling sites. Twenty-four of the 77 nematode species that were found in the observed area showed dependence on dune slope orientation. The fungi-bacteria ratio, Simpson's dominance index, and basal index were useful tools for determining slope differences. Keywords: desert ecosystem; dune; ecological indices; nematode communities; slope orientation; trophic groups Introduction Topography is one of the main factors influencing local microclimate by means of elevation, lateral redistribution of water, and slope orientation, and it, in turn, affects biotic distribution and diversity (Turner et al., 2001; Monger & Bestelmeyer, 2006). In the northern hemisphere (Nevo, 1997), south-facing slopes (SFS) receive higher solar radiation associated with higher temperatures and drought than the opposite north-facing slopes (NFS). Previous studies (Nevo, 1997, 2001; Pen-Mouratov et al., 2009) on the co-variation of the relief of an area and the diversity of plant and soil biotic com-
……. munities indicated that the SFS is richer in paleotropical xeric biota, whereas the NFS has higher densities of mesic temperate species. In spite of the small distance between the two slopes, a sharp and significant difference in micro-climatic conditions greatly influences the soil biota, lead-ing to an increasing divergence between species located on the south- and north-facing slopes. This difference is more pronounced in xeric environments (Auslander et al., 2003). Moreover, even relatively small-scale changes in relief of an area that occur across low ridges can dictate whether a biotic community is desertified (Monger & Bestelmeyer, 2006). The considerable effects of slope aspect on the surroundings can be seen in desert ecosystems with com-plex topography, where sharp and significant differences in microclimate conditions exist between the north-facing slopes (cooler, moister, with higher organic matter avail-ability) and the south-facing counterparts (warmer, dryer, with lower organic matter availability). These differences influence the biology, biodiversity, and ecology of above-ground organisms and lead to an increasing divergence between species located on the different-facing slopes (Dick-Peddie, 1993). Numerous investigations consider soil free-living nema-tode communities as one of the most important compo-nents of the soil biota (Sohlenius, 1980; Bongers, 1990; Whitford, 2002) and one the most useful indicators of soil quality (Bongers, 1990; de Goede & Bongers, 1994; Wasilewska, 1994; Gupta & Yeates, 1997). Our previous investigation showed the importance of the slope orienta-tion of a Plio-Pleistocene canyon dated 3 – 5 million years ago and its effect on trophic levels, community structure, and generic diversity of soil free-living nematodes (Pen-Mouratov et al., 2009). In spite of many scientific publications during the last decade devoted to studying the nematode community in sand-dune habitats (von Bussau, 1990; de Goede et al.,
HELMINTHOLOGIA, 47, 3: 179 – 188, 2010
Effect of sand-dune slope orientation on soil free-living nematode abundance
and diversity
S. PEN-MOURATOV1, C. HU1,2, E. HINDIN1, Y. STEINBERGER1*
1The Mina & Everard Goodman Faculty of Life Sciences, Bar-Ilan University, Ramat-Gan 52900, Israel, Email: [email protected]; 2Institute of Plant Protection and Soil Science, Hubei Academy of Agricultural
Sciences, Wuhan 430064, P. R. China

180
1993; Goralczyk, 1998; Wall et al., 2002), most focused on coastal-dune ecosystems, whereas only a few were con-ducted on inland sand-dunes of arid and semiarid envi-ronments (e.g., Zhang et al., 2007). These facts indicate that our knowledge of the effect of dune slope orientation on the structure and dynamics of soil free-living nematode communities is insufficient. An attempt was made in the present study to fill this gap, and to determine the effect of dune slope orientation on soil free-living nematode abundance and diversity in west-ern Negev Desert, Israel. Materials and methods Study site The study site was located at the Nizzana sand-dune site within the Hallamish dune field eastern extension of the northern Sinai dune field, western Negev Desert, Israel. The Nizzana-South experimental site is about 45 km inland from the Mediterranean Sea and the Nizzana-North test site about 32 km. The dune field comprises longitudinal dunes that are aligned west-east, are 15 – 20 m high, and are separated by 50 – 200 m-wide interdunes. The mobile crests of the Nizzana dunes are greatly influenced by expo-sure to wind due to an almost total lack of vegetation as well as the fact that they have no microbial crust. Mean multi-annual precipitation is 95 mm, with an interannual variability of up to 300 % (Littmann, 1997) and potential evaporation reaching 2600 mm (Evenari & Shuval, 1981; Kidron, 2001; Kidron & Yair, 2001). Organic matter is severely limited in sandy soil. However, Nizzana dunes do possess a thin microbial crust consisting of cyanobacteria, mosses, and algae, which cover much of the lower part of the dunes, while the mobile crests, the peaks of the dunes, as well as the playa, lack this biological crust (Kidron & Yair, 1997). The vegetation found is mainly the perennial Chenopodi-aceous species, with Anabasis articulate in the intersand-dune valley (Breckle et al., 2008). Sampling A total of 220 soil samples were collected between October 2008 and September 2009 from the upper (0 – 10 cm) and deeper (10 – 20 cm) soil layers on the south-facing slope, on the north-facing slope, and in the interdune area. Soil samples were also collected from the middle and top of every of observed slope. Four sample replicates, each 0.5 kg in weight, were collected from the sampling area. Soil samples were deposited in individual plastic bags that were placed in an insulated container and taken to the laboratory. These soil samples were kept in cold storage at 4°C until processing. They were sieved (2-mm mesh size) before biological and chemical analyses in order to remove root particles and other organic debris. Laboratory analysis The following analyses were performed on each sample: 1. Soil water content (SWC) was determined gravimetri-
cally as a percentage of dry mass by drying the samples to a constant weight at 105oC. 2. Soil organic matter (OM) was determined using a modified method of Rowell (1994). 3. The nematode population was determined by extrac-tion from 100 g fresh soil samples using the Baermann funnel procedure (Cairns, 1999). The recovered organisms were counted using a compound microscope and preserved in formalin. The nematodes from each sample were col-lected and identified according to order, family, and genus using a compound microscope. Nematodes were classified according to known feeding habitats or stoma and esopha-geal morphology (Steinberger & Sarig, 1993; Pen-Moura-tov et al., 2004) into the following trophic groups (Yeates et al., 1993): (1) bacteria-feeding; (2) fungi-feeding; (3) plant-parasites; and (4) omnivore-predators. The total number of nematodes was counted and adjusted to 100 g dry soil. Ecological indices and statistical analysis The characteristics of the nematode communities were described using the following indices: (1) absolute abun-dance of individuals adjusted to 100 g-1 dry soil TNEM (total number of free-living nematodes); (2) abundance of omnivore-predator (OP), plant-parasitic (PP), fungi-feed-ing (FF) and bacteria-feeding (BF) nematodes (trophic structure) (Steinberger & Loboda, 1991; Steinberger & Sarig, 1993; Liang et al., 2000); (3) WI=(FF+BF)/PP (Wasilewska, 1994); (4) fungivore/bacterivore (F/B) ratio, F/B=FF/BF (Twinn, 1974); (5) trophic diversity (T), T=1/∑Pi
2, where Pi is the proportion of the i-th trophic group (Heip et al., 1988); (6) Simpson's dominance index (λ), λ=∑Pi
2 (Simpson, 1949); (7) Shannon-Weaver index (H'), H'=-∑PiI (lnPiI), where p is the proportion of individuals in the i-th taxon (Shannon & Weaver, 1949); (8) maturity index (MI), MI=∑υίfi/n, where υί, is the c-p value assigned by Bongers (1990, 1999) of the i-th genus in the nematode, fi is the frequency of family i in sample and n is the total number of individuals in a sample (Neher & Darby, 2005). The c-p values describe the nematode life strategies, and range from 1 (colonizers, tolerant to disturbance) to 5 (persisters, sensitive to disturbance); (9) plant-parasite index (PPI) (Bongers, 1990); (10) maturity modification index (MMI), including plant-feeding nematodes (Yeates, 1994); (11) evenness (J’), J’=H’/ln(S), where S is the number of taxa (Yeates & King, 1997); (12) species richness, SR=(S-1)/ln(N), where S is the number of taxa and N is the number of individuals identified (Yeates & King, 1997); (13) basal index (BI) = 100 (b/(b + e + s)); (14) structure index (SI) = 100 x (s/(s + b)), where b = 0.8 x (Fu2+Ba2); s = 0.8 x Ca2 + 1.8 x Σ(X3) + 3.2 x Σ(X4) + 5.0 x Σ(X5); e = 3.2 x Ba1 + 0.8 x Fu2; and (15) enrichment index (EI) = 100 x (e/(e + b)) (Ferris et al., 2001; Hohberg, 2003; Ferris et al., 2004; Liang et al., 2005). All data were subjected to statistical analysis of variance using the SAS model (ANOVA, Duncan’s multiple range test, and Pearson correlation coefficient) and were used to
181
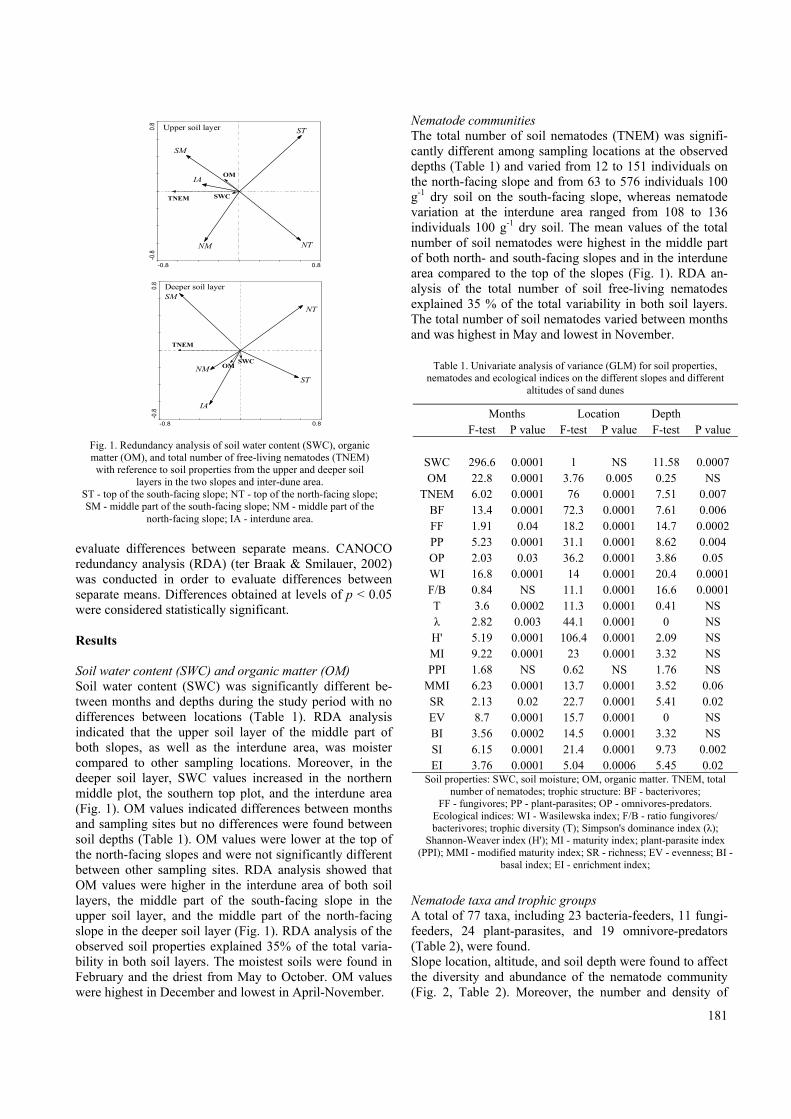
evaluate differences between separate means. CANOCO redundancy analysis (RDA) (ter Braak & Smilauer, 2002) was conducted in order to evaluate differences between separate means. Differences obtained at levels of p < 0.05 were considered statistically significant. Results Soil water content (SWC) and organic matter (OM) Soil water content (SWC) was significantly different be-tween months and depths during the study period with no differences between locations (Table 1). RDA analysis indicated that the upper soil layer of the middle part of both slopes, as well as the interdune area, was moister compared to other sampling locations. Moreover, in the deeper soil layer, SWC values increased in the northern middle plot, the southern top plot, and the interdune area (Fig. 1). OM values indicated differences between months and sampling sites but no differences were found between soil depths (Table 1). OM values were lower at the top of the north-facing slopes and were not significantly different between other sampling sites. RDA analysis showed that OM values were higher in the interdune area of both soil layers, the middle part of the south-facing slope in the upper soil layer, and the middle part of the north-facing slope in the deeper soil layer (Fig. 1). RDA analysis of the observed soil properties explained 35% of the total varia-bility in both soil layers. The moistest soils were found in February and the driest from May to October. OM values were highest in December and lowest in April-November.
Nematode communities The total number of soil nematodes (TNEM) was signifi-cantly different among sampling locations at the observed depths (Table 1) and varied from 12 to 151 individuals on the north-facing slope and from 63 to 576 individuals 100 g-1 dry soil on the south-facing slope, whereas nematode variation at the interdune area ranged from 108 to 136 individuals 100 g-1 dry soil. The mean values of the total number of soil nematodes were highest in the middle part of both north- and south-facing slopes and in the interdune area compared to the top of the slopes (Fig. 1). RDA an-alysis of the total number of soil free-living nematodes explained 35 % of the total variability in both soil layers. The total number of soil nematodes varied between months and was highest in May and lowest in November.
Nematode taxa and trophic groups A total of 77 taxa, including 23 bacteria-feeders, 11 fungi-feeders, 24 plant-parasites, and 19 omnivore-predators (Table 2), were found. Slope location, altitude, and soil depth were found to affect the diversity and abundance of the nematode community (Fig. 2, Table 2). Moreover, the number and density of
-0.8 0.8
-0.8
0.8
SWC
OM
TNEM
NTNM
ST
SM
IA
Upper soil layer
-0.8 0.8
-0.8
0.8
SWCOM
TNEM
NT
NM
ST
SM
IA
Deeper soil layer
Fig. 1. Redundancy analysis of soil water content (SWC), organic matter (OM), and total number of free-living nematodes (TNEM) with reference to soil properties from the upper and deeper soil
layers in the two slopes and inter-dune area. ST - top of the south-facing slope; NT - top of the north-facing slope; SM - middle part of the south-facing slope; NM - middle part of the
north-facing slope; IA - interdune area.
Table 1. Univariate analysis of variance (GLM) for soil properties, nematodes and ecological indices on the different slopes and different
altitudes of sand dunes
Months Location Depth F-test P value F-test P value F-test P value
SWC 296.6 0.0001 1 NS 11.58 0.0007 OM 22.8 0.0001 3.76 0.005 0.25 NS
TNEM 6.02 0.0001 76 0.0001 7.51 0.007 BF 13.4 0.0001 72.3 0.0001 7.61 0.006 FF 1.91 0.04 18.2 0.0001 14.7 0.0002 PP 5.23 0.0001 31.1 0.0001 8.62 0.004 OP 2.03 0.03 36.2 0.0001 3.86 0.05 WI 16.8 0.0001 14 0.0001 20.4 0.0001 F/B 0.84 NS 11.1 0.0001 16.6 0.0001 T 3.6 0.0002 11.3 0.0001 0.41 NS λ 2.82 0.003 44.1 0.0001 0 NS H' 5.19 0.0001 106.4 0.0001 2.09 NS MI 9.22 0.0001 23 0.0001 3.32 NS PPI 1.68 NS 0.62 NS 1.76 NS
MMI 6.23 0.0001 13.7 0.0001 3.52 0.06 SR 2.13 0.02 22.7 0.0001 5.41 0.02 EV 8.7 0.0001 15.7 0.0001 0 NS BI 3.56 0.0002 14.5 0.0001 3.32 NS SI 6.15 0.0001 21.4 0.0001 9.73 0.002 EI 3.76 0.0001 5.04 0.0006 5.45 0.02
Soil properties: SWC, soil moisture; OM, organic matter. TNEM, total number of nematodes; trophic structure: BF - bacterivores;
FF - fungivores; PP - plant-parasites; OP - omnivores-predators. Ecological indices: WI - Wasilewska index; F/B - ratio fungivores/ bacterivores; trophic diversity (T); Simpson's dominance index (λ);
Shannon-Weaver index (H'); MI - maturity index; plant-parasite index (PPI); MMI - modified maturity index; SR - richness; EV - evenness; BI -
basal index; EI - enrichment index;

182
……
Table 2. The mean relative (%) change of soil nematode community on the different slopes and altitudes of sand dunes
Upper soil layer Deeper soil layer NT NM ST SM IA NT NM ST SM IA b1 Acrobeles 0.59 2.58 1.15 11.57 0.32 1.00 2.58 1.72 9.64 1.28 b2 Acrobeloides 0.18 2.49 1.70 7.15 0.20 0.19 1.65 2.21 4.55 0.42 b3 Bunonema 0.01 b4 Bursilla 0.04 0.02 b5 Cephalobus 0.08 2.02 1.45 3.99 0.25 0.18 1.62 2.61 2.30 0.48 b6 Cervidellus 0.03 0.44 0.86 1.13 0.52 0.03 0.74 1.55 0.54 0.20 b7 Chambersiella 0.01 0.01 0.02 b8 Chiloplacus 0.04 1.41 0.08 3.28 0.22 0.11 1.91 0.14 2.07 0.52 b9 Chronogaster 0.30 0.46 0.04 0.02 b10 Eucephalobus 0.03 0.14 0.06 0.06 0.20 0.04 0.04 b11 Mesorhabditis 0.05 b12 Metateratocephalus 0.04 0.38 1.51 2.17 0.30 0.43 0.79 1.30 2.15 0.14 b13 Monhystera 0.01 0.15 0.07 0.01 b14 Panagrobelus 0.01 0.21 0.03 0.02 0.07 b15 Panagrolaimus 0.01 0.11 0.02 0.12 0.03 0.04 0.11 0.04 0.01 b16 Plectus 0.03 0.23 0.08 b17 Prismatolaimus 0.04 b18 Protorhabditis 0.04 0.01 b19 Rhabditis 0.02 0.02 0.68 0.04 0.02 0.02 b20 Rhabditoides 0.02 b21 Teratocephalus 0.07 0.34 0.04 0.05 0.11 b22 Tylocephalus 0.01 0.06 0.14 0.09 b23 Wilsonema 0.01 0.54 0.27 0.40 1.17 1.02 0.38 0.09 0.18 f1 Anguina 0.17 0.13 f2 Aphelenchoides 0.07 0.27 0.04 1.73 0.60 0.24 1.33 0.56 0.77 f3 Aphelenchus 0.04 0.97 0.46 1.84 1.04 0.36 1.06 0.32 0.87 0.50 f4 Aprutides 0.04 0.06 f5 Diphtherophora 0.04 0.11 0.03 f6 Ditylenchus 0.15 0.12 0.02 1.05 0.14 0.17 0.03 0.40 0.12 f7 Leptonchus 0.02 0.37 0.02 0.61 0.04 0.05 f8 Nothotylenchus 0.23 0.02 1.92 0.01 0.02 0.07 0.22 f9 Paraphelenchus 0.04 0.27 0.06 0.11 0.03 f10 Tylencholaimus 0.20 0.02 1.20 0.01 0.06 0.02 1.17 0.08 f11 Tylencholaimellus 0.01 0.02 0.05 0.07 0.04 0.12 p1 Belonolaimus 0.11 p2 Criconema 0.16 0.12 p3 Dolichorhynchus 0.14 0.32 p4 Filenchus 0.04 0.23 0.02 0.20 0.14 0.10 0.58 0.04 0.04 p5 Heterodera 0.12 0.04 0.05 0.00 0.05 0.10 0.05 0.02 0.04 p6 Helicotylenchus 0.02 0.06 0.01 0.02 p7 Hoplolaimus 0.03 0.06 0.30 0.75 0.16 0.04 p8 Longidorus 0.02 0.01 p9 Macroposthonia 0.01 p10 Macrotrophurus 0.06 p11 Malenchus 0.01 p12 Meloidodera 0.02 p13 Meloidogyne 0.02 0.09 0.12 0.10 0.24 0.27 p14 Paratylenchus 0.02 0.01 0.01 0.08 0.01 0.05 0.27 p15 Pratylenchoides 0.12 0.04 0.09 0.05 0.01 0.07 p16 Pratylenchus 0.08 0.11 0.06 0.32 0.03 0.26 0.85 0.63 0.09 p17 Psilenchus 0.05 p18 Telotylenchus 0.16 0.04 0.21 0.16 p19 Tetylenchus 0.03 0.02 0.01 0.19 0.02 0.02 0.17 0.03 p20 Trichodorus 0.56 0.03 p21 Trophurus 0.01 0.19 0.01 p22 Tylenchorhynchus 0.17 0.46 1.65 2.78 0.26 0.07 2.90 2.35 4.42 0.25 p23 Tylenchus 0.06 0.14 0.01 0.76 0.01 0.11 0.03 0.10 0.43 0.08 p24 Xiphinema 0.03 0.16 0.02 1.10 0.37 0.03 o1 Anatonchus 0.03 o2 Aporcelaimus 0.04 0.68 3.24 4.96 0.23 0.18 0.59 4.85 2.99 0.25 o3 Aporcelaimellus 0.06 0.32 0.02 1.84 0.49 0.12 0.30 1.92 0.04 o4 Axonchium 0.38 o5 Belondira 0.01 o6 Discolaimium 0.11 0.06 0.03 0.07 o7 Discolaimus 0.13 0.38 1.08 0.05 0.12 0.07 0.09 0.61 0.04 o8 Dorydorella 0.08 0.13 o9 Dorylaimellus 0.05 0.54 0.12 0.36 o10 Dorylaimoides 0.23 0.34 0.23 0.05 o11 Dorylaimus 0.13 0.24 0.02 0.22 0.05 o12 Eudorylaimus 0.03 0.45 0.23 0.04 o13 Labronema 0.29 0.77 0.54 0.03 0.01 1.37 0.15 0.05 o14 Mesodorylaimus 0.03 0.15 0.11 0.76 0.17 0.44 o15 Microdorylaimus 0.02 0.02 0.23 0.06 0.03 0.21 0.06 o16 Nygolaimus 0.13 0.07 1.43 0.03 0.24 4.37 0.48 0.09 o17 Paraxonchium 0.28 o18 Thonus 0.11 0.44 1.29 0.02 0.12 0.07 0.09 0.83 0.05 o19 Tripyla 0.04 0.14 0.04
ST - top of the south-facing slope; NT - top of the north-facing slope; SM - middle part of the south-facing slope; NM - middle part of the north-facing slope; IA - interdune area
183
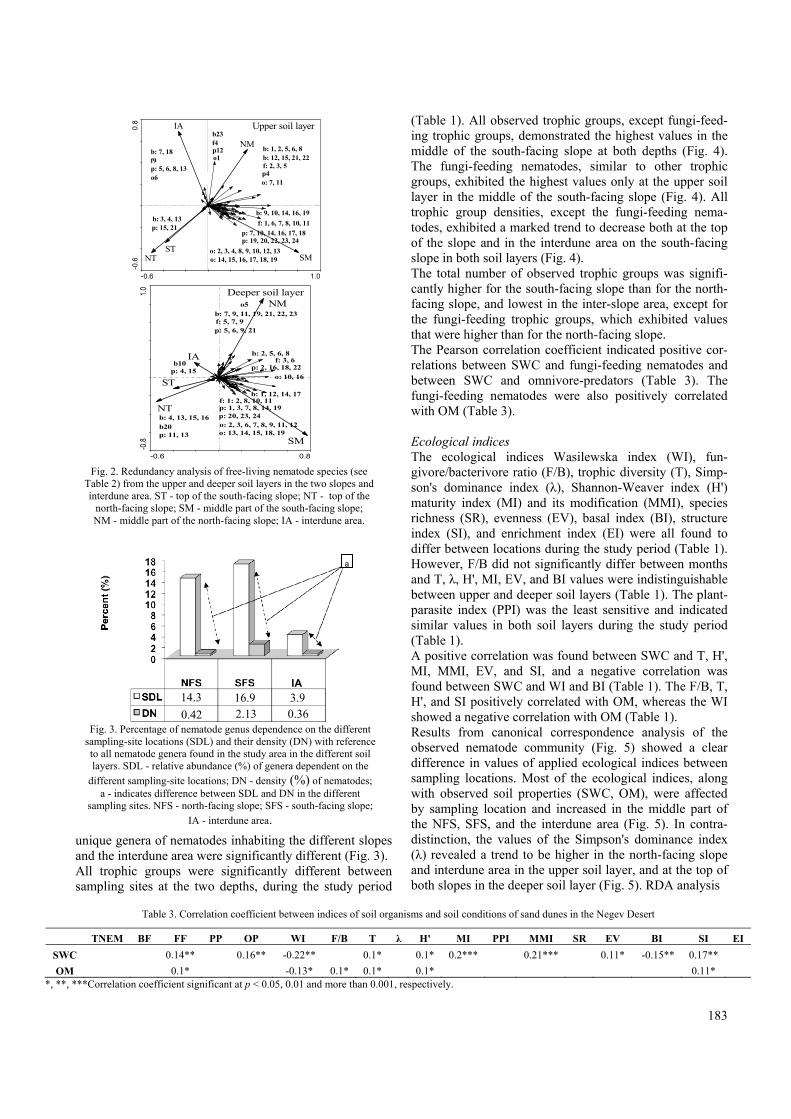
unique genera of nematodes inhabiting the different slopes and the interdune area were significantly different (Fig. 3). All trophic groups were significantly different between sampling sites at the two depths, during the study period
(Table 1). All observed trophic groups, except fungi-feed-ing trophic groups, demonstrated the highest values in the middle of the south-facing slope at both depths (Fig. 4). The fungi-feeding nematodes, similar to other trophic groups, exhibited the highest values only at the upper soil layer in the middle of the south-facing slope (Fig. 4). All trophic group densities, except the fungi-feeding nema-todes, exhibited a marked trend to decrease both at the top of the slope and in the interdune area on the south-facing slope in both soil layers (Fig. 4). The total number of observed trophic groups was signifi-cantly higher for the south-facing slope than for the north-facing slope, and lowest in the inter-slope area, except for the fungi-feeding trophic groups, which exhibited values that were higher than for the north-facing slope. The Pearson correlation coefficient indicated positive cor-relations between SWC and fungi-feeding nematodes and between SWC and omnivore-predators (Table 3). The fungi-feeding nematodes were also positively correlated with OM (Table 3). Ecological indices The ecological indices Wasilewska index (WI), fun-givore/bacterivore ratio (F/B), trophic diversity (T), Simp-son's dominance index (λ), Shannon-Weaver index (H') maturity index (MI) and its modification (MMI), species richness (SR), evenness (EV), basal index (BI), structure index (SI), and enrichment index (EI) were all found to differ between locations during the study period (Table 1). However, F/B did not significantly differ between months and T, λ, H', MI, EV, and BI values were indistinguishable between upper and deeper soil layers (Table 1). The plant-parasite index (PPI) was the least sensitive and indicated similar values in both soil layers during the study period (Table 1). A positive correlation was found between SWC and T, H', MI, MMI, EV, and SI, and a negative correlation was found between SWC and WI and BI (Table 1). The F/B, T, H', and SI positively correlated with OM, whereas the WI showed a negative correlation with OM (Table 1). Results from canonical correspondence analysis of the observed nematode community (Fig. 5) showed a clear difference in values of applied ecological indices between sampling locations. Most of the ecological indices, along with observed soil properties (SWC, OM), were affected by sampling location and increased in the middle part of the NFS, SFS, and the interdune area (Fig. 5). In contra-distinction, the values of the Simpson's dominance index (λ) revealed a trend to be higher in the north-facing slope and interdune area in the upper soil layer, and at the top of both slopes in the deeper soil layer (Fig. 5). RDA analysis
-0.6 1.0
-0.6
0.8
b: 1, 2, 5, 6, 8
b: 3, 4, 13
b: 7, 18
b: 9, 10, 14, 16, 19
p: 19, 20, 22, 23, 24
o: 14, 15, 16, 17, 18, 19
b: 12, 15, 21, 22
b23
f: 1, 6, 7, 8, 10, 11
f: 2, 3, 5
f4
f9
p4p: 5, 6, 8, 13
p: 7, 10, 14, 16, 17, 18
p12
p: 15, 21
o1
o: 2, 3, 4, 8, 9, 10, 12, 13
o6o: 7, 11
NT
NM
STSM
IA Upper soil layer
-0.6 0.8
-0.8
1.0
b: 1, 12, 14, 17
b: 2, 5, 6, 8
b: 4, 13, 15, 16
b: 7, 9, 11, 19, 21, 22, 23
b10
b20
f: 3, 6
f: 5, 7, 9
f: 1: 2, 8, 10, 11p: 1, 3, 7, 8, 14, 19
p: 2, 16, 18, 22
p: 5, 6, 9, 21
p: 11, 13
p: 4, 15
p: 20, 23, 24o: 2, 3, 6, 7, 8, 9, 11, 12
o5
o: 10, 16
o: 13, 14, 15, 18, 19
NT
NM
ST
SM
IA
Deeper soil layer
Fig. 2. Redundancy analysis of free-living nematode species (see
Table 2) from the upper and deeper soil layers in the two slopes and interdune area. ST - top of the south-facing slope; NT - top of the
north-facing slope; SM - middle part of the south-facing slope; NM - middle part of the north-facing slope; IA - interdune area.
Fig. 3. Percentage of nematode genus dependence on the different
sampling-site locations (SDL) and their density (DN) with reference to all nematode genera found in the study area in the different soil layers. SDL - relative abundance (%) of genera dependent on the
different sampling-site locations; DN - density (%) of nematodes; a - indicates difference between SDL and DN in the different
sampling sites. NFS - north-facing slope; SFS - south-facing slope;
IA - interdune area.
14.3 16.9 3.9
0.42 2.13 0.36
IA
a
Table 3. Correlation coefficient between indices of soil organisms and soil conditions of sand dunes in the Negev Desert
TNEM BF FF PP OP WI F/B T λ H' MI PPI MMI SR EV BI SI EI
SWC 0.14** 0.16** -0.22** 0.1* 0.1* 0.2*** 0.21*** 0.11* -0.15** 0.17**
OM 0.1* -0.13* 0.1* 0.1* 0.1* 0.11* *, **, ***Correlation coefficient significant at p < 0.05, 0.01 and more than 0.001, respectively.

184
…
Upper soil layer Deeper soil layer
Fig. 4. Distribution of the nematode trophic groups in the different sites of the two slopes. BF - bacterial-feeding; FF - fungal-feeding; PP - plant-parasitic; OP - omnivore-predator.
ST - top of the south-facing slope; NT - top of the north-facing slope; SM - middle part of the south-facing slope; NM - middle part of the north-facing slope; IA - interdune area.
185
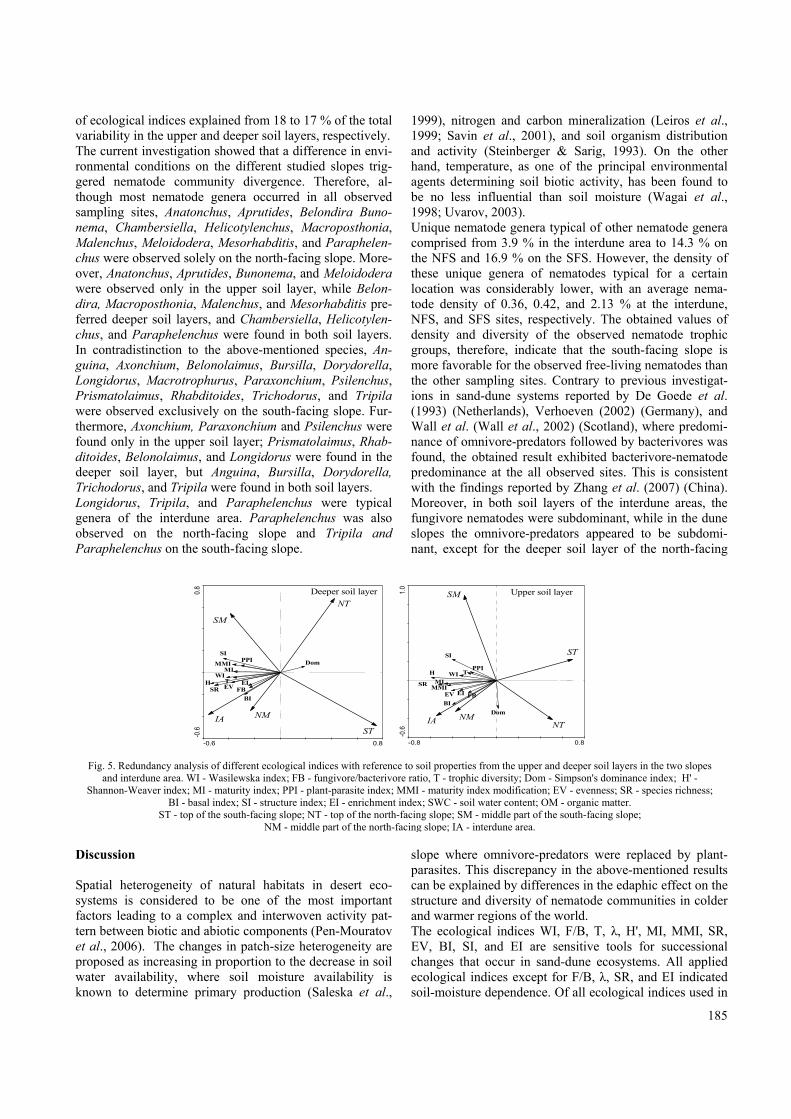
of ecological indices explained from 18 to 17 % of the total variability in the upper and deeper soil layers, respectively. The current investigation showed that a difference in envi-ronmental conditions on the different studied slopes trig-gered nematode community divergence. Therefore, al-though most nematode genera occurred in all observed sampling sites, Anatonchus, Aprutides, Belondira Buno-nema, Chambersiella, Helicotylenchus, Macroposthonia, Malenchus, Meloidodera, Mesorhabditis, and Paraphelen-chus were observed solely on the north-facing slope. More-over, Anatonchus, Aprutides, Bunonema, and Meloidodera were observed only in the upper soil layer, while Belon-dira, Macroposthonia, Malenchus, and Mesorhabditis pre-ferred deeper soil layers, and Chambersiella, Helicotylen-chus, and Paraphelenchus were found in both soil layers. In contradistinction to the above-mentioned species, An-guina, Axonchium, Belonolaimus, Bursilla, Dorydorella, Longidorus, Macrotrophurus, Paraxonchium, Psilenchus, Prismatolaimus, Rhabditoides, Trichodorus, and Tripila were observed exclusively on the south-facing slope. Fur-thermore, Axonchium, Paraxonchium and Psilenchus were found only in the upper soil layer; Prismatolaimus, Rhab-ditoides, Belonolaimus, and Longidorus were found in the deeper soil layer, but Anguina, Bursilla, Dorydorella, Trichodorus, and Tripila were found in both soil layers. Longidorus, Tripila, and Paraphelenchus were typical genera of the interdune area. Paraphelenchus was also observed on the north-facing slope and Tripila and Paraphelenchus on the south-facing slope.
Discussion Spatial heterogeneity of natural habitats in desert eco-systems is considered to be one of the most important factors leading to a complex and interwoven activity pat-tern between biotic and abiotic components (Pen-Mouratov et al., 2006). The changes in patch-size heterogeneity are proposed as increasing in proportion to the decrease in soil water availability, where soil moisture availability is known to determine primary production (Saleska et al.,
1999), nitrogen and carbon mineralization (Leiros et al., 1999; Savin et al., 2001), and soil organism distribution and activity (Steinberger & Sarig, 1993). On the other hand, temperature, as one of the principal environmental agents determining soil biotic activity, has been found to be no less influential than soil moisture (Wagai et al., 1998; Uvarov, 2003). Unique nematode genera typical of other nematode genera comprised from 3.9 % in the interdune area to 14.3 % on the NFS and 16.9 % on the SFS. However, the density of these unique genera of nematodes typical for a certain location was considerably lower, with an average nema-tode density of 0.36, 0.42, and 2.13 % at the interdune, NFS, and SFS sites, respectively. The obtained values of density and diversity of the observed nematode trophic groups, therefore, indicate that the south-facing slope is more favorable for the observed free-living nematodes than the other sampling sites. Contrary to previous investigat-ions in sand-dune systems reported by De Goede et al. (1993) (Netherlands), Verhoeven (2002) (Germany), and Wall et al. (Wall et al., 2002) (Scotland), where predomi-nance of omnivore-predators followed by bacterivores was found, the obtained result exhibited bacterivore-nematode predominance at the all observed sites. This is consistent with the findings reported by Zhang et al. (2007) (China). Moreover, in both soil layers of the interdune areas, the fungivore nematodes were subdominant, while in the dune slopes the omnivore-predators appeared to be subdomi-nant, except for the deeper soil layer of the north-facing
slope where omnivore-predators were replaced by plant-parasites. This discrepancy in the above-mentioned results can be explained by differences in the edaphic effect on the structure and diversity of nematode communities in colder and warmer regions of the world. The ecological indices WI, F/B, T, λ, H', MI, MMI, SR, EV, BI, SI, and EI are sensitive tools for successional changes that occur in sand-dune ecosystems. All applied ecological indices except for F/B, λ, SR, and EI indicated soil-moisture dependence. Of all ecological indices used in
-0.6 0.8
-0.6
0.8
WI
FB
T
Dom
H
MI
PPIMMI
EVSR
SI
EI
BI
NT
NM
ST
SM
IA
Deeper soil layer
-0.8 0.8
-0.6
1.0
WI
FB
T
Dom
H
MI
PPI
MMIEV
SR
SI
EI
BI
NTNM
ST
SM
IA
Upper soil layer
Fig. 5. Redundancy analysis of different ecological indices with reference to soil properties from the upper and deeper soil layers in the two slopes
and interdune area. WI - Wasilewska index; FB - fungivore/bacterivore ratio, T - trophic diversity; Dom - Simpson's dominance index; H' - Shannon-Weaver index; MI - maturity index; PPI - plant-parasite index; MMI - maturity index modification; EV - evenness; SR - species richness;
BI - basal index; SI - structure index; EI - enrichment index; SWC - soil water content; OM - organic matter. ST - top of the south-facing slope; NT - top of the north-facing slope; SM - middle part of the south-facing slope;
NM - middle part of the north-facing slope; IA - interdune area.

186
the current study, only WI, F/B, T, H', and SI showed de-pendence on OM. Values of applied indices that reflected nematode species and trophic abundance and diversity (WI, F/B, T, MI, MMI, SR, EV, BI, SI, and EI) and esti-mated the weight of rare species (H') increased from younger successional stages (top of dune with movable sandy soil) to more mature successional stages (middle of slopes and interdune area). In the older successional stages, the trophic and species abundance and diversity of nema-todes were higher and more complex, which is in agree-ment with Odum (1983). The fungi-bacteria (F/B) ratio which is based on the structure and function of the soil food web and is used as an indicator of ecosystem health (Coleman et al., 1992) was higher in the middle part of the north-facing slope than in the middle of the south-facing slope. Attention should be turned to the shifts in Simpson's domi-nance index (λ) values from the top of the two observed slopes (in the deeper soil layer) to the north-facing slope and the inter-slope area (in the upper soil layer). On the one hand, the high λ values in the younger successional stages (top of observed slopes in the deeper soil layer) might be explained by a more adaptive ability of certain nematode species to rigorous (high-temperature, in this case) environmental conditions (Odum, 1983), while an increase in dominance index values in the more mature successional stages (middle north-facing slope in the upper soil layer) might be explained by the development of more moisture-loving and umbraticolous nematodes. On the other hand, in more umbrageous environments (north-facing slope), the percentage of predominance of fungi-feeding nematode species may increase (Coleman et al., 1992), as confirmed by an increase in the F/B ratio in the same place. The basal index (BI), which is used as an indicator of a food web diminished by stress or marked by limited nutri-ent resources (Ferris et al., 2001; Berkelmans et al., 2003) and as an indicator of the prevalence of general opportu-nistic nematodes tolerant of soil perturbation (Sánchez-Moreno et al., 2006), indicated a divergence in soil nema-tode community development on the different sand-dune slopes. Taking into account that SWC and OM had no explicit prevalence on either of the observed slopes, we can con-sider local temperature as the determining factor for the divergence of the nematode communities. Conclusion The middle part of the south-facing slope was found as the most favorable habitat for soil free-living nematodes. Moreover, nematode species sensitive to dune-slope ori-entation were found. Nevertheless, water content did not differ between the observed slopes, although most of the applied ecological indices indicated a dependence on SWC. We can consider organic matter as the main factor that determines a habitat difference between the observed slopes. However, of all trophic groups, only fungi-feeding
nematodes exhibited a correlation with OM. It can, there-fore, be assumed that temperature is one of the principal environmental agents, along with soil properties, that de-termine differences in the soil-biotic habitat in the sand-dunes of the Negev Desert. Acknowledgement The authors express their appreciation to Ms. G. Barness for technical assistance. References AUSLANDER, M., NEVO, E., INBAR, M. (2003): The effects of slope orientation on plant growth, developmental insta-bility and susceptibility to herbivores. J. Arid Environ., 55: 405 – 4 16 BERKELMANS, R., FERRIS, H., TENUTA, M., VAN BRUGGEN, A. H. C. (2003): Effects of long-term crop management on nematode trophic levels other than plant feeders disappear after 1 year of disruptive soil management. Appl. Soil Ecol., 23: 223 – 235. BONGERS, T. (1990): The maturity index: An ecological measure of environmental disturbance based on nematode species composition. Oecologia, 83: 14 – 19 BONGERS, T. (1999): The Maturity Index, the evolution of nematode life history traits, adaptive radiation and cp-scaling. Plant Soil, 212: 13 – 22 BRECKLE, S. -W., YAIR, A., VESTE, M., editors (2008): Arid Dune Ecosystem: The Nizzana Sands in the Negev Desert. Ecological Studies. Vol. 200, Springer-Verlag, Berlin, Heidelberg, Germany CAIRNS, D. M. (1999): Multi-scale analysis of soil nutri-ents at alpine treeline in Glacier National Park, Montana. Phys. Geogr., 20: 256 – 271 COLEMAN, D. C., ODUM, E. P., CROSSLEY, D. A. J. (1992): Soil biology, soil ecology, and global change. Biol. Fertil. Soils, 14: 104 – 111 DE GOEDE, R. G. M., BONGERS, T. (1994): Nematode community structure in relation to soil and vegetation characteristics. Appl. Soil Ecol., 1: 29 – 44 DE GOEDE, R. G. M., GEORGIEVA, S. S., VERSCHOOR, B. C., KAMERMAN, J. W. (1993): Changes in nematode com-munity structure in a primary succession of blown-out areas in a drift sand landscape. Fundam. Appl. Nematol., 16: 501 – 513 DICK-PEDDIE, W. A. (1993): New Mexico Vegetation: Past, Present and Future. Albuquerque, NM: University of New Mexico Press EVENARI, M. (1981): Ecology of the Negev Desert: A critical review of our knowledge. In: SHUVAL, H. (Ed) Developments in Arid Zone Ecology and Environmental Quality. Philadelphia, PA: Balaban ISS, pp. 1 – 33 FERRIS, H., BONGERS, T., DE GOEDE, R. G. M. (2001): A framework for soil food web diagnostics: extension of the nematode faunal analysis concept. Appl. Soil Ecol., 18: 13 – 29 FERRIS, H., VENETTE, R. C., SCOW, K. M. (2004): Soil
187
management to enhance bacterivore and fungivore nema-tode populations and their nitrogen mineralisation function. Appl. Soil Ecol., 25: 19 – 35 GORALCZYK, K. (1998): Nematodes in a coastal dune suc-cession: Indicators of soil properties? Appl. Soil Ecol., 9: 465 – 469 GUPTA, V. V. S. R., YEATES, G. W. (1997): Soil micro-fauna as bioindicators of soil health. In: PANKHURST, C. E., DOUBE, B. M., GUPTA, V. V. S. R., GRACE, P. R. (Eds) Soil Biota Management in Sustainable Farming Systems. Oxon, UK: CAB International, pp. 201 – 233 HEIP, C., HERMAN, P. M. J., SOETAERT, K. (1988): Data processing, evaluation and analysis. In: HIGGINS, R. P., THIEL, H. (Eds) Introduction to the Study of Meiofauna. Washington, DC: Smithsonian Institution Press, pp. 197 – 231 HOHBERG, K. (2003): Soil nematode fauna of afforested mine sites: genera distribution, trophic structure and func-tional guilds. Appl. Soil. Ecol., 22: 113 – 126 KIDRON, G. J. (2001): Runoff-induced sediment yield over dune slopes in the Negev Desert. 2: Texture, carbonate and organic matter. Earth Surf. Proc. Landf., 26: 583 – 599 KIDRON, G. J., YAIR, A. (1997): Rainfall-runoff relation-ship over encrusted dune surfaces, Nizzana, Western Negev, Israel. Earth Surf. Proc. Landf., 22: 1169 – 1184 KIDRON, G. J., YAIR, A. (2001): Runoff-induced sediment yield over dune slopes in the Negev Desert. 1: Quantity and variability. Earth Surf. Proc. Landf., 26: 461 – 474 LEIROS, M. C., TRASAR-CEPEDA, C., SEOANE, S., GIL-SOTRES, F. (1999): Dependence of mineralization of soil organic matter on temperature and moisture. Soil Biol. Biochem., 31: 327 – 335 LIANG, W. J., PINHASI-ADIV, Y., SHTULTZ, H., STEINBERGER, Y. (2000): Nematode population dynamics under the canopy of desert halophytes. Arid Soil Res. Re-habil., 14: 183 – 192 LIANG, W. J., LI, Q., JIANG, Y., NEHER, D. A. (2005): Nematode faunal analysis in an aquic brown soil fertilised with slow-release urea, Northeast China. Appl. Soil Ecol., 29: 185 – 192 LITTMANN, T. (1997): Atmospheric input of dust and ni-trogen into the Nizzana sand dune ecosystem, north-west-ern Negev, Israel. J. Arid Environ., 36: 433 – 457 MONGER, H. C., BESTELMEYER, B. T. (2006): The soil-geomorphic template and biotic change in arid and semi-arid ecosystems. J. Arid Environ., 65: 207 – 218 NEHER, D. A., DARBY, B. J. (2005): Computation and ap-plication of nematode community indices: General guide-lines. In: ABEBE, E. (Eds) Freshwater Nematodes: Ecology and Taxonomy. CABI, pp. 211 – 222 NEVO, E. (1997): Evolution in action across phylogeny caused by microclimatic stresses at "evolution canyon". Theor. Popul. Biol., 52: 231 – 243 NEVO, E. (2001): Evolution of genome-phenome diversity under environmental stress. Proc. Natl. Acad. Sci. U. S. A., 98: 6233 – 6240 ODUM, H. T. (1983): Systems Ecology: An Introduction. New York: Wiley
PEN-MOURATOV, S., HE, X. L., STEINBERGER, Y. (2004): Spatial distribution and trophic diversity of nematode populations under Acacia raddiana along a temperature gradient in the Negev Desert ecosystem. J. Arid Environ., 56: 339 – 355 PEN-MOURATOV, S., RAKHIMBAEV, M., STEINBERGER, Y. (2006): Spatio-temporal effect on soil respiration in fine-scale patches in a desert ecosystem. Pedosphere, 16: 1 ─ 9 PEN-MOURATOV, S., BERG, N., GENZER, N., UKABI, S., SHARGIL, D., STEINBERGER, Y. (2009): Do slope orienta-tion and sampling location determine soil biota compo-sition? Front. Biol. China, 4: 364 – 375 ROWELL, D. L. (1994): Soil Science: Methods and Appli-cations. London: Longman Group UK Ltd. SALESKA, S. R., HARTE, J., TORN, M. S. (1999): The effect of experimental ecosystem warming on CO2 fluxes in a montane meadow. Global Change Biol., 5: 125 – 141 SÁNCHEZ-MORENO, S., CAMARGO, J. A., NAVAS, A. (2006): Ecotoxicological assessment of the impact of re-sidual heavy metals on soil nematodes in the Guadiamar River Basin (Southern Spain). Environ. Monit. Assess., 116: 245 – 262 SAVIN, M. C., GORRES, J. H., NEHER, D. A., AMADOR, J. A. (2001): Biogeophysical factors influencing soil respiration and mineral nitrogen content in an old field soil. Soil Biol. Biochem., 33: 429 – 438 SHANNON, C. E., WEAVER, W. (1949): The Mathematical Theory of Communication. Urbana, IL: University of Il-linois Press SIMPSON, E. H. (1949): Measurement of diversity. Nature, 163: 668 SOHLENIUS, B. (1980): Abundance, biomass and contribu-tion to energy flow by soil nematodes in terrestrial eco-systems. Oikos, 34: 186 – 194 STEINBERGER, Y., LOBODA, I. (1991): Nematode popula-tion dynamics and trophic structure in a soil profile under the canopy of the desert shrub Zygophyllum dumosum. Pedobiologia, 35: 191 – 197 STEINBERGER, Y., SARIG, S. (1993): Response by soil nematode populations in the soil microbial biomass to a rain episode in the hot, dry Negev Desert. Biol. Fertil. Soils, 16: 188 – 192 TER BRAAK, C. J. F., SMILAUER, P. (2002): CANOCO Re-ference Manual and CanoDraw for Windows User's Gui-de: Software for Canonical Community Ordination (Ver-sion 4.5). Wageningen and Ceske Budejovice: Biometrics TURNER, M. G., GARDNER, R. H., O'NEILL, R. V. (2001): Landscape Ecology in Theory and Practice. New York: Springer TWINN, D. C. (1974): Nematodes. In: DICKINSON, C. H., PUGH, G. J. F. (Eds) Biology of Plant Litter Decomposition. London: Academic Press, pp. 421 – 465 UVAROV, A. V. (2003): Effects of diurnal temperature fluctuations on population responses of forest floor mites. Pedobiologia, 47: 331 – 339 VERHOEVEN, R. (2002): The structure of the microtrophic system in a development series of dune soils. Pedobiolo-gia, 46: 75 – 89

188
VON BUSSAU, C. (1990): Freeliving nematodes from the coastal dunes and adjoining biotopes of the German and Danish coasts. 1. General part and re-description of some Chromadorida (Nematoda). Zool. Anz., 225: 161 – 188 WAGAI, R., BRYE, K. R., GOWER, S. T., NORMAN, J. M., BUNDY, L. G. (1998): Land use and environmental factors influencing soil surface CO2 flux and microbial biomass in natural and managed ecosystems in southern Wisconsin. Soil Biol. Biochem., 30: 1501 – 1509 WALL, J. W., SKENE, K. R., NEILSON, R. (2002): Nematode community and trophic structure along a sand dune succes-sion. Biol. Fertil. Soils, 35: 293 – 301 WASILEWSKA, L. (1994): The effect of age of meadows on succession and diversity in soil nematode communities. Pedobiologia, 38: 1 – 11 RECEIVED NOVEMBER 18, 2009
WHITFORD, W. G. (2002): Ecology of Desert Systems. London: Academic Press YEATES, G. W. (1994): Modification and qualification of the nematode maturity index. Pedobiologia, 38: 97 – 101 YEATES, G. W., KING, K. L. (1997): Soil nematodes as indicators of the effect of management on grasslands in the New England Tablelands (NSW): Comparison of native and improved grasslands. Pedobiologia, 41: 526 – 536 YEATES, G. W., BONGERS, T., DE GOEDE, R. G. M., FRECKMAN, D., GEORGIEVA, S. S. (1993): Feeding habits in soil nematode families and genera - an outline for soil ecologists. J. Nematol. 25: 315 – 331 ZHANG, X. K., LIANG, W. J., JIANG, D. M., LIU, Z. M., JIANG, S. W. (2007): Soil nematode community structure in a Chinese sand dune system. Helminthologia, 44: 204 – 209 ACCEPTED JULY 19, 2010