Effect of Return on Asset, Price Earning Ratio and Capital ...
10
Effect of Return on Asset, Price Earning Ratio and Capital Structure on Firm Value at Company Hotel, Restaurant and Tourism Sub-sector ServicesListed on IDX Stephanie, Yusuf Ronny Edward, Galumbang Hutagalung and Wilsa Road Betterment Sitepu Universitas Prima Indonesia, Jalan Sekip Simpang Sikambing, Medan, Indonesia Keywords: Return on Asset (ROA), Price Earning Ratio(PER), Capital Structure, Firm Value. Abstract: This study aims to examine and analyze the effect of Return on Assets (ROA), Price Earning Ratio (PER) and Capital Structure on Firm Value in hotel, restaurant and tourism sub-sector service companies listed on the IDX for the 2016-2018 period. The research method used in this research is quantitative research methods. The type of research used in this research is quantitative associative research. The nature of the research used in this study is a causal relationship. The population in this study were 25 companies consisting of 3 years. The selection of research samples using purposive sampling technique, namely sampling with certain criteria so that the number of samples taken was 39 samples. The data analysis method used in this research is multiple linear regression analysis, the coefficient of determination, the F test and the t test. The results showed that Return On Asset (ROA), Price Earning Ratio (PER) and Capital Structure simultaneously had a significant positive effect on Firm Value with a determination coefficient of 78.4%. Return on Asset (ROA) has a negative and insignificant effect on Firm Value, Price Earning Ratio (PER) has a positive and insignificant effect on Firm Value and Capital Structure has a significant positive effect on Firm Value. 1 INTRODUCTION The hotel, restaurant and tourism sub-sector service companies are currently growing rapidly because people now spend a lot of time traveling and these sectors also greatly affect foreign exchange in the country. Therefore, the competition that arises is very fierce. This competition encourages companies to have strong funding and large market access in order to survive in fighting for market share and dominating it. The strong funds can be obtained from selling shares to investors and attracting potential investors. With the ease of accessing and buying shares, investors and potential investors must be more observant in assessing which companies are able to provide them with benefits in the future. Investor's investigation activities in the capital market require a lot of information about the company that would be the place to invest (Triani&Tarmidi, 2019). Investors are interested in investing in companies that have high firm value.Firm value is very important because if a firm value is high its stakeholders will a high prosperity (Zuhroh, 2019). The way that investors and potential investors can judge which firm value is better is by calculating the asset turnover ratio or Return on Asset.Another way to measure is the Price to Book Value (PBV) ratio (Sudjiman&Sudjiman, 2019). After assessing the firm value, an investor or potential investor must be able to find out whether at the time of buying the shares it was classified as undervalued or overvalued. Financial ratio is an option that can be used to measure stocks classified as undervalued or overvalued. One of the financial ratios available is the Price Earning Ratio. A company that has funding that uses more debt will increase the risk for the company which can affect the returns that will be obtained from investors and potential investors so it is also necessary to know how capable the company is in managing the existing capital structure. As for previous research conducted (Husna & Satria, 2019) the research found that the Return On Asset has an effect on firm value but contradicts research conducted by (Agustiani, 2016) and Stephanie, ., Edward, Y., Hutagalung, G. and Betterment Sitepu, W. Effect of Return on Asset, Price Earning Ratio and Capital Structure on Firm Value at Company Hotel, Restaurant and Tourism Sub-sector ServicesListed on IDX. DOI: 10.5220/0010303800870096 In Proceedings of the International Conference on Culture Heritage, Education, Sustainable Tourism, and Innovation Technologies (CESIT 2020), pages 87-96 ISBN: 978-989-758-501-2 Copyright c 2021 by SCITEPRESS – Science and Technology Publications, Lda. All rights reserved 87
-
Upload
khangminh22 -
Category
Documents
-
view
2 -
download
0
Transcript of Effect of Return on Asset, Price Earning Ratio and Capital ...
Effect of Return on Asset, Price Earning Ratio and Capital Structure on Firm Value at Company Hotel, Restaurant and Tourism
Sub-sector ServicesListed on IDX
Stephanie, Yusuf Ronny Edward, Galumbang Hutagalung and Wilsa Road Betterment Sitepu Universitas Prima Indonesia, Jalan Sekip Simpang Sikambing, Medan, Indonesia
Keywords: Return on Asset (ROA), Price Earning Ratio(PER), Capital Structure, Firm Value.
Abstract: This study aims to examine and analyze the effect of Return on Assets (ROA), Price Earning Ratio (PER) and Capital Structure on Firm Value in hotel, restaurant and tourism sub-sector service companies listed on the IDX for the 2016-2018 period. The research method used in this research is quantitative research methods. The type of research used in this research is quantitative associative research. The nature of the research used in this study is a causal relationship. The population in this study were 25 companies consisting of 3 years. The selection of research samples using purposive sampling technique, namely sampling with certain criteria so that the number of samples taken was 39 samples. The data analysis method used in this research is multiple linear regression analysis, the coefficient of determination, the F test and the t test. The results showed that Return On Asset (ROA), Price Earning Ratio (PER) and Capital Structure simultaneously had a significant positive effect on Firm Value with a determination coefficient of 78.4%. Return on Asset (ROA) has a negative and insignificant effect on Firm Value, Price Earning Ratio (PER) has a positive and insignificant effect on Firm Value and Capital Structure has a significant positive effect on Firm Value.
1 INTRODUCTION
The hotel, restaurant and tourism sub-sector service companies are currently growing rapidly because people now spend a lot of time traveling and these sectors also greatly affect foreign exchange in the country. Therefore, the competition that arises is very fierce. This competition encourages companies to have strong funding and large market access in order to survive in fighting for market share and dominating it. The strong funds can be obtained from selling shares to investors and attracting potential investors.
With the ease of accessing and buying shares, investors and potential investors must be more observant in assessing which companies are able to provide them with benefits in the future. Investor's investigation activities in the capital market require a lot of information about the company that would be the place to invest (Triani&Tarmidi, 2019).
Investors are interested in investing in companies that have high firm value.Firm value is very
important because if a firm value is high its stakeholders will a high prosperity (Zuhroh, 2019).
The way that investors and potential investors can judge which firm value is better is by calculating the asset turnover ratio or Return on Asset.Another way to measure is the Price to Book Value (PBV) ratio (Sudjiman&Sudjiman, 2019).
After assessing the firm value, an investor or potential investor must be able to find out whether at the time of buying the shares it was classified as undervalued or overvalued. Financial ratio is an option that can be used to measure stocks classified as undervalued or overvalued. One of the financial ratios available is the Price Earning Ratio.
A company that has funding that uses more debt will increase the risk for the company which can affect the returns that will be obtained from investors and potential investors so it is also necessary to know how capable the company is in managing the existing capital structure.
As for previous research conducted (Husna & Satria, 2019) the research found that the Return On Asset has an effect on firm value but contradicts research conducted by (Agustiani, 2016) and
Stephanie, ., Edward, Y., Hutagalung, G. and Betterment Sitepu, W.Effect of Return on Asset, Price Earning Ratio and Capital Structure on Firm Value at Company Hotel, Restaurant and Tourism Sub-sector ServicesListed on IDX.DOI: 10.5220/0010303800870096In Proceedings of the International Conference on Culture Heritage, Education, Sustainable Tourism, and Innovation Technologies (CESIT 2020), pages 87-96ISBN: 978-989-758-501-2Copyright c© 2021 by SCITEPRESS – Science and Technology Publications, Lda. All rights reserved
87

(Salempang, 2016) which shows Return On Assets do not have a significant effect on firm value.
Research on other variables has also been carried out by (Prasetyorini, 2013) and (Lebelaha, 2016) where the results of the research show that Price Earning Ratio (PER) has a significant effect on firm value, but on the other hand, another research conducted by (Devianasari, 2015) Price Earning Ratio (PER) does not have a significant effect on firm value.
Research on capital structure variables has also been carried out by (Chasanah, 2017) and (Purwanto, 2017) where the results of this study show the capital structure where the Debt to Equity Ratio (DER) indicator has a significant effect on firm value and it is contrary to the results of research which conducted by (Rahmantio, 2018) and (Mandalika, 2016) which shows that the Debt to Equity Ratio (DER) does not have a significant effect on firm value.
From the results above, which shows the differences in the results of research by previous researchers, the researchers are interested in reexamining the effect of Return On Assets (ROA), Price Earning Ratio (PER) and Capital Structure on Firm Value in the hotel, restaurant and tourism sub-sectorservice companies listed on the IDX for 2016-2018 period.
1.1 Literature Review and Hypotheses
1.1.1 Firm Value
Price to Book Value (PBV) is a ratio that describes the comparison between stock market prices and book value of equity as shown in the statement of financial position (Murhadi,2015:66). Firm value is defined as the company's selling price, that is reflected in the stock market prices traded in the capital market(Widyastuti, 2019).
Based on the above understanding, it can be concluded that company value is the investor's assessment of a company with the benchmark is the company's stock price.
Price to Book Value (PBV) describes how much the market appreciates the book value of a company's shares. The higher this ratio means the market is confident in the prospect (SugionodanUntung, 2016:70).
PBV = Stock Market PriceShare Book Value
(1)
Book Value per Share is calculated by:
BVS = Total Equity
Number of Shares (2)
1.1.2 Return on Asset (ROA)
Return on Asset (ROA) is a ratio that shows how much net income the company earns when measured from asset value (Harahap, 2015:305). High value of Return on Assets (ROA) will increase the efficiency of the company, and the chance for the company to increase its value (Chabachib et al., 2020).
Based on the above understanding, it can be concluded that Return on Assets (ROA) is a ratio to measure how much profit a company can generate in using existing assets.
Return on Asset (ROA) is used to measure the company's ability to generate return on assets owned by the company (Darmadji and Fakhruddin, 2015: 158). The measurement of Return on Asset (ROA) can be formulated as follows:
ROA = Net Income After TaxTotal Assets
x100% (3)
1.1.3 Price Earning Ratio (PER)
Price Earning Ratio (PER) is a ratio to determine whether the market is relatively attractive or unattractive. In addition, Price Earning Ratio (PER) is also used to identify companies with super growth (Gumanti, 2011:236).
Based on the above understanding, it can be concluded that Price Earning Ratio (PER) is a ratio to measure how much earnings can be obtained from a stock price. In other words, Price Earning Ratio (PER) is the ratio between stock price and earning per share of an investment.
Price Earning Ratio (PER) describes the comparison between market prices and earnings per share. Price Earning Ratio (PER) that is too high, indicates that the company's stock market price is too expensive (Murhadi, 2015:65).
Price Earning Ratio (PER) is obtained by:
PER = Price per shareEPS
(4)
1.1.4 Capital Structure
The capital structure choice of a firm is the most significant decision taken by the management of the firm to maximize profits and at the same time minimize costs of capital leads to the maximization of stockholders wealth (Rahman et al., 2019). The company's capital structure is a mixture or proportion of long-term debt and equity, in order to
CESIT 2020 - International Conference on Culture Heritage, Education, Sustainable Tourism, and Innovation Technologies
88
finance its investment (operating assets) (Raharjaputra, 2011:212).
Based on the above understanding, it can be concluded that the capital structure is a balance or comparison between foreign capital and own capital. Foreign capital is defined as long-term debt or short-term debt. Meanwhile, capital itself is divided into retained earnings.
The capital structure and solvency ratio illustrates the company's ability to pay off long-term obligations if the company is liquidated (SjahrialdanPurba, 2013:37).
The debt to equity ratio is debt divided by equity (Luo &Lusmeida, 2018) so the capital structure and solvency ratios are:
DER = Total Debt or liabilitiesEquity
x100% (5)
1.1.5 The Effect of Return on Asset on Firm Value
Return on Asset, which is one of the ratios of profitability, if it has a high value, will give a positive signal to investors because the company will be able to record an increase in profit so that it will increase the company's stock price, which if the stock price in the market increases, the company value will also increase (Husna & Satria, 2019).
1.1.6 The Effect of Price Earning Ratio (PER) on Firm Value
This ratio is obtained from the market price of common stock divided by the company's profit (Earning per Share), so the higher this ratio will indicate that the company's performance is also getting better. On the other hand, if the PER is too high, it can also indicate that the stock price being offered is very high or irrational (Sugiono&Untung, 2016:70).
1.1.7 The Effect of Capital Structure on Firm Value
Funding decisions by management will affect the company's valuation, which is reflected in the stock price. Therefore, one of the duties of a financial manager is to determine a funding policy that maximizes the share price which is a reflection of firm value (Harmono, 2014:137).
1.1.8 Hyphotesis
Based on the limitations and problem formulations, the following research hypothesis is made:
1. Return on Asset (ROA), Price Earning Ratio (PER) and capital structure simultaneously influence firm value in the hotel, restaurant and tourism sub-sector service companies listed on the IDX for the 2016-2018 period.
2. Return on Asset (ROA) has an effect on firm value in the hotel, restaurant and tourism sub-sector service companies listed on the IDX for the 2016-2018 period.
3. Price Earning Ratio (PER) affects the value of the company in the hotel, restaurant and tourism sub-sector service companies listed on the IDX for the 2016-2018 period.
4. Capital structure affects the value of the company in the hotel, restaurant and tourism sub-sector service companies listed on the IDX for the 2016-2018 period.
2 METHOD
2.1 Research Sites
This study uses secondary data which can be downloaded via the website www.idx.co.id for 3 years from 2016-2018.
2.2 Population
The population in this study is the hotel, restaurant and tourism sub-sector service companies listed on the IDX for the 2016-2018 period where the number of companies listed on the IDX are 25 companies.
2.3 Data Determination Techniques
The technique of determining data or sampling in this study using purposive sampling technique where the sampling is based on the criteria of the researchers themselves.
These criteria are: 1. Hotel, restaurant and tourism sub-sector
service companies listed on the IDX for the 2016-2018 period.
2. Hotel, restaurant and tourism sub-sector service companies that publish complete financial reports for the 2016-2018 period.
3. Hotel, restaurant and tourism sub-sector service companies that did not experience losses during the 2016-2018 period.
Effect of Return on Asset, Price Earning Ratio and Capital Structure on Firm Value at Company Hotel, Restaurant and Tourism Sub-sectorServicesListed on IDX
89

4. Hotel, restaurant and tourism sub-sector service companies whose equity was not deficit during the 2016-2018 period.
Based on these criteria, the researchers took a sample of 13 companies which were studied for 3 years so that the total sample studied was 39 samples.
2.4 Sample
The research sample can be seen in Table 1.
Table 1: Sample of hotel, restaurant and tourism sub-sector service companies listed on the IDX for the 2016-2018 period.
No Stock Code
Company Name
IPO Date
Type of Business
1 BAYU BayuBuanaTbk 30-Oct-1989
Tourism
2 FAST Fast Food Indonesia Tbk
11-May-1993
Restaurant
3 INPP Indonesia Paradise Property Tbk
01-Dec-2004
Hotel
4 JIHD
Jakarta International Hotel & Development Tbk
29-Feb-1984
Hotel
5 JSPT
Jakarta Setiabudi International Tbk
12-Jan-1998
Hotel
6 KPIG MNC Land Tbk
30-Mar-2000
Hotel & Tourism
7 MAMI Mas Murni Indonesia Tbk
09-Feb-1994
Restaurant& Hotel
8 MAPB MAP Boga AdiperkasaTbk
21-Jun-2017
Restaurant
9 PDES DestinasiTirta Nusantara Tbk
08-Jul-2008
Tourism
10 PGLI Pembangunan Graha Lestari Indah Tbk
05-Apr-2000
Restaurant
11 PJAA Pembangunan Jaya AncolTbk
02-Jul-2004
Restaurant & Tourism
12 PTSP
Pioneerindo Gourmet International Tbk
30-May-1994
Restaurant
13 SHID
Hotel Sahid Jaya International Tbk
08-Mei-1990
Hotel
Source: www.idx.co.id (2019)
The data listed in table 1 is sample data taken after complying with the sampling criteria where the company name and company code listed on the IDX and the type of business of the company are recorded.
2.5 Data Analysis Technique
In this study, the data analysis method used was statistical methods. This test is conducted using SPSS statistical data processing software. The classic assumption test is done first before testing the hypothesis.
The data analysis model used in this research is multiple linear regression analysis, which functions to determine the effect of the independent and dependent variables, the formula for multiple linear regression analysis is as follows:
Y = a + b1X1 + b2X2 + b3X3 + e (1) Note : Y = Firm Value a = Constant b1b2b3 = Regression Coefficient X1 = Return on Asset X2 = Price Earning Ratio X3 = Capital Structure e = Standard Error (5%)
2.6 Research Procedure
2.6.1 Normality Test
In this test, it can be seen whether the confounding variables in the regression model are normally distributed or not.
To detect data normality can be done by: 1. Testing using theKolmogorov-Smirnov test
statistic. 2. Testing using histogram graph analysis. 3. Testing using graph analysis of normal
probability plots (Ghozali, 2016).
2.6.2 Multicollinearity Test
To get the presence or absence of multicollinearity in the regression model, it can also be seen from the tolerance value and the opposite of Variance Inflation Factor (VIF). A high VIF value indicates a low tolerance value. The determination value used generally indicates the absence of multicollinearity, is the Tolerance value ≥ 0.10 or equal to the VIF value ≤ 10 (Ghozali, 2016).
CESIT 2020 - International Conference on Culture Heritage, Education, Sustainable Tourism, and Innovation Technologies
90
2.6.3 Autocorrelation Test
Detect autocorrelation with a run test. There is no relationship between the residuals '' threshold ''. Run the tests used to see if the residual data is random or systematic.
H0: residual (res_1) random (acak) HA: residual (res_1) not random (Ghozali,
2016).
2.6.4 Heteroscedasticity Test
The heteroscedasticity test aims to test whether in the regression model there is an inequality of variance from the residuals of one observation to another. A good regression model does not occur heteroscedasticity.
In this study, to detect heteroscedasticity can be done by:
1. Scatterplot chart method 2. Glejser test(Ghozali, 2016).
2.6.5 Coefficient of Determination
The ability of a model to explain variations in the dependent variable can be measured by the coefficient of determination (R2). The coefficient of determination is between zero and one. If the ability of the independent variables in explaining the variation in the dependent variable is very limited, it will be shown from the small R2 value. If the value is close to one, it means that the independent variables are able to provide almost all the information needed to predict the variation in the dependent variable (Ghozali, 2016).
2.6.6 Simultaneous Hypothesis Testing
Simultaneous hypothesis testing (F test) aims to test whether all independent or independent variables included in the model have a joint influence on the dependent or dependent variable. This test is done by comparing Fcount with Ftable with the following conditions:
1. H0 is accepted if F-count ≤ F-table on α = 5% 2. Ha is accepted if F-count > F-table on α = 5%
(Ghozali, 2016).
The null hypothesis (H0) indicates that the parameters in the model are equal to zero, or:
H0 : b1, b2, b3=0 (1)
Return on Asset (ROA), Price Earning Ratio (PER) and Capital Structure have no simultaneous
effect on Firm Value at Hotel, Restaurant and Tourism Sub Sector Service Companies listed on the IDX for the 2016-2018 period.
The alternative hypothesis (Ha) does not all parameters simultaneously equal zero, or:
Ha : b1, b2, b3 ≠ 0 (2)
Return on Asset (ROA), Price Earning Ratio
(PER) and Capital Structure have a simultaneous effect on Firm Value in Hotel, Restaurant and Tourism Sub Sector Service Companies listed on the IDX for the 2016-2018 period.
2.6.7 Partial Hypothesis Testing
Partial hypothesis testing (t test) shows how far the influence of one explanatory / independent variable individually in explaining the variance of the dependent variable. This test is done by comparing tcount with ttable with the following conditions:
1. H0 is accepted if t-count ≤ t-table on α = 5% 2. Ha is accepted if t-count > t-table on α =
5%(Ghozali, 2016). The null hypothesis (H0) to be tested is whether a
parameter (bi) is equal to zero, or:
H0 : b1 = 0 (1)
Return on Asset (ROA) has no partial effect on Firm Value in Hotel, Restaurant and Tourism Sub Sector Service Companies listed on the IDX for the 2016-2018 period.
Ha : b1 ≠ 0 (2)
Return on Asset (ROA) has a partial effect on Firm Value in Hotel, Restaurant and Tourism Sub Sector Service Companies listed on the IDX for the 2016-2018 period.
H0 : b2 = 0 (1)
Price Earning Ratio (PER) does not have a partial effect on Firm Value in Hotel, Restaurant and Tourism Sub Sector Service Companies listed on the IDX for the 2016-2018 period.
Ha : b2 ≠ 0 (2)
Price Earning Ratio (PER) has a partial effect on Firm Value in Hotel, Restaurant and Tourism Sub Sector Service Companies listed on the IDX for the 2016-2018 period.
Effect of Return on Asset, Price Earning Ratio and Capital Structure on Firm Value at Company Hotel, Restaurant and Tourism Sub-sectorServicesListed on IDX
91

H0 : b3 = 0 (3)
Capital Structure does not have a partial effect on Firm Value in Hotel, Restaurant and Tourism Sub Sector Service Companies listed on the IDX for the 2016-2018 period.
Ha : b3 ≠ 0 (4)
Capital Structure has a partial effect on Firm Value in Hotel, Restaurant and Tourism Sub Sector Service Companies listed on the IDX for the 2016-2018 period.
3 RESULTS AND DISCUSSIONS
3.1 Results of Data Analysis
This study uses a multiple linear regression equation research model. The following is a multiple linear regression table:
Table 2: Multiple linear regression equation.
Coefficientsa
Model Unstandardizedcoefficients
B Std.error
(Constant) -.525 .765
ROA -.022 .156
1PER .001 .001
DER 4.229 .379
a. Dependent Variable: PBV Source: The data were processed using SPSS
(2019). From Table 2 it can also be seen that the values
are as follows: a = -0,525 β1 =-0,022 β2 =0,001 β3 =4,229
So the multiple linear regression equation for the three variables is (Return on Assets (ROA), Price Earning Ratio (PER) and capital structure) are:
Firm value = -0,525 - 0,022 ROA + 0,001 PER + 4,229 capital structure
(1)
From the regression equation above, the constant value (a) of the firm value is -0.525. This constant value (a) indicates that if the independent variables,
namely Return on Assets (ROA), Price Earning Ratio (PER), and capital structure are considered constant or fixed, then the firm value is -0.525.
From the regression equation, the Return on Assets (ROA) variable produces β1 = -0.022, which means that every 1% increase in the Return on Assets (ROA) variable, the company value will decrease by 0.022 assuming the other variables are fixed and the effect of Return on Assets (ROA) to firm value is significant.
From the regression equation, the variable Price Earning Ratio (PER) produces β2 = 0.001, which means that each increase in the Price Earning Ratio (PER) variable by 1%, the company value will increase by 0.001 assuming the other variables are fixed and the effect of Price Earning Ratio (PER). To firm value is significant.
From the regression equation, the capital structure variable produces β3 = 4.229, which means that each increase in the capital structure variable by 1%, the firm value will increase by 4.229, assuming the other variables are fixed and the effect of capital structure on firm value is significant.
3.2 Classical Assumption Test Results
3.2.1 Normality Test Result
1. Kolmogorov-Smirnov Test Statistics (K-S) The following is a test of data normality results using the Kolmogorov-Smirnov (K-S) non-parametric test:
Table 3: Kolmogorov Smirnov (K-S) test.
One-Sample Kolmogorov-Smirnov Test Unstandardized
Residual N 39
Mean .0000000Normal Parametersa,b
Std. Deviation 2.35295705Absolute .192
Most Extreme Differences Positive
.192
Most Extreme Differences Negative
-.105
Kolmogorov-Smirnov Z 1.197 Asymp. Sig. (2-tailed) .114
a. Test distribution is Normal. b. Calculate from data.
Source: The data were processed using SPSS (2019).
Based on the table of the results of the Kolmogorov-Smirnov (K-S) test, it shows that the Kolmogorov-Smirnov (K-S) value is 1.197 and the
CESIT 2020 - International Conference on Culture Heritage, Education, Sustainable Tourism, and Innovation Technologies
92

significant value is 0.114. It can be concluded that all variables meet the normal data distribution because the significant value is greater than 0.05. 2. Histogram Graph Analysis
The following is a test of the results of data normality using graph analysis and normal probability plots as shown in Figures 1 and 2.
Figure1: Histogram graph.
Based on Figure 1 from the Histogram Graph, it shows that the observation data has been normally distributed. This can be seen from the curve on the histogram graph is not skewed to the left or right. And also the data can be seen that the data bars are inside the curve, so it can be concluded that the data in this regression model is normally distributed. 3. Normal Probability Plot Graph Analysis If the data spreads far from the diagonal line or does not follow the direction of the diagonal line or the histogram graph does not show a normal distribution pattern, then the regression model does not meet the normality assumption. However, from the above test it can be seen in the normal probability plot graph in Figure 2 that the data spreads close to the diagonal line and follows the direction of the diagonal line, so it can be said that the data meets the assumption of normality.
Figure 2: Normalprobability plot graph analysis.
3.2.2 Multicollinearity Test Results
The results of the multicollinearity test can be seen in Table 4.
Table 4: Multicollinearity test results.
Coefficientsa Model Collinearity Statistic
Tolerence VIF
(Constant) ROA .728 1.374 1
PER .818 1.223
DER .878 1.139
a. Dependent Variable: PBV Source: The data were processed using SPSS (2019).
The results of the tolerance value calculation show that the three independent variables, namely Return on Asset (ROA), Price Earning Ratio (PER) and capital structure have a tolerance value greater than 0.10 with a Return on Asset (ROA) value of 0.728, Price Earning Ratio (PER). ) amounting to 0.818 and the capital structure of 0.878.
Meanwhile, the VIF value calculation results also show that the three independent variables, namely Return on Asset (ROA), Price Earning Ratio (PER) and capital structure have a value less than 10 with a Return on Asset (ROA) value of 1.374 Price Earning Ratio (PER) of 1,223 and the capital structure of 1,139.
From the results of the above calculations it can be concluded that the data does not occur multicollinearity.
3.2.3 Autocorrelation Test Results
The results of the run test can be seen in table 5.
Table 5: Run test.
Unstandardized ResidualTest Valuea -.29885
Cases < Test Value 19 Cases >= Test Value 20
Total Cases 39 Number of Runs 14
Z -1.944 Asymp. Sig. (2-tailed) .052
a. Median Source: The data were processed using SPSS (2019).
The results of the above calculation can be seen that the value of the run test is -1.944 with a probability of 0.052 which is significantly greater than 0.05, which means that there is no correlation
Effect of Return on Asset, Price Earning Ratio and Capital Structure on Firm Value at Company Hotel, Restaurant and Tourism Sub-sectorServicesListed on IDX
93

between residuals or it can be said that the data is random or there is no autocorrelation between residual values.
3.2.4 Heteroscedasticity Test Results
1. Test Scatterplot Graph
Thefollowing are the results of the heteroscedasticity test by looking at the Scatterplot Graph:
Figure 3: Scatterplot graph.
Based on the image from the scatterplot graph above, it can be seen that the dots are spread randomly and are spread either above or below the number 0 on the Y axis. It can be concluded that there is no heteroscedasticity in the regression model so this regression model is feasible to use.
2. Glejser Test
In addition to using a scatterplot graph to test for heteroscedasticity, the Glejser test can also be used. The results of the Glejser test can be seen in Table 6.
Table 6: Glejser test.
Coefficientsa Model t Sig.
(Constant) 2.610 .013ROA .095 .9251
PER .157 .876
DER .033 .974a. Dependent Variable: ABS_RES1 Source: The data were processed using SPSS (2019).
Based on the results of the Glejser test, it shows that all independent variables, namely Return on Assets (ROA), Price Earning Ratio (PER) and capital structure have a significant value above 0.05 with a Return on Assets (ROA) value of 0.925; Price
Earning Ratio (PER) of 0.876 and capital structure of 0.974.
From the results of the Glejser test above, it can be said that the regression model does not have heteroscedasticity.
3.3 Results of the Hypothesis Determination Coefficient
To test the hypothesis, the researcher used multiple linear regression analysis. Based on the results of data processing with SPSS version 21, the results are as shown in Table 7.
Table 7: The coefficient of determination (Adjusted R Square).
Model Summaryb
Model R R Square Adjusted R Square
1 .895 .801 .784 Source: The data were processed using SPSS
The coefficient of determination test results shows that the value of the Adjusted R Square coefficient of determination is 0.784. This shows that the variable Return on Assets (ROA), Price Earning Ratio (PER) and capital structure can affect firm value by 78.4%. Meanwhile, 21.6% of the firm value variable is influenced by other factors outside the variables studied.
3.4 Simultaneous Hypothesis Testing
Based on the results of data processing with the SPSS version 21 program, the results are as shown in Table 8.
Table 8: Simultaneous hypothesis testing (F-test).
ANOVAa
Model F Sig.Regression 47.047 .000b
1 Residual Total
a. Dependent Variable: PBV b. Predictors: (Constant), DER, PER, ROA
Source: The data were processed using SPSS(2019).
Based on the ANOVA or F-test, it is obtained that Fcount is 47.047 greater than Ftable 2.85 with a significant value of 0.000 less than 0.05, so the three independent variables are Return on Assets (ROA), Price Earning Ratio (PER) and capital structure.
CESIT 2020 - International Conference on Culture Heritage, Education, Sustainable Tourism, and Innovation Technologies
94
significantly influence the dependent variable, namely firm value together or simultaneously.
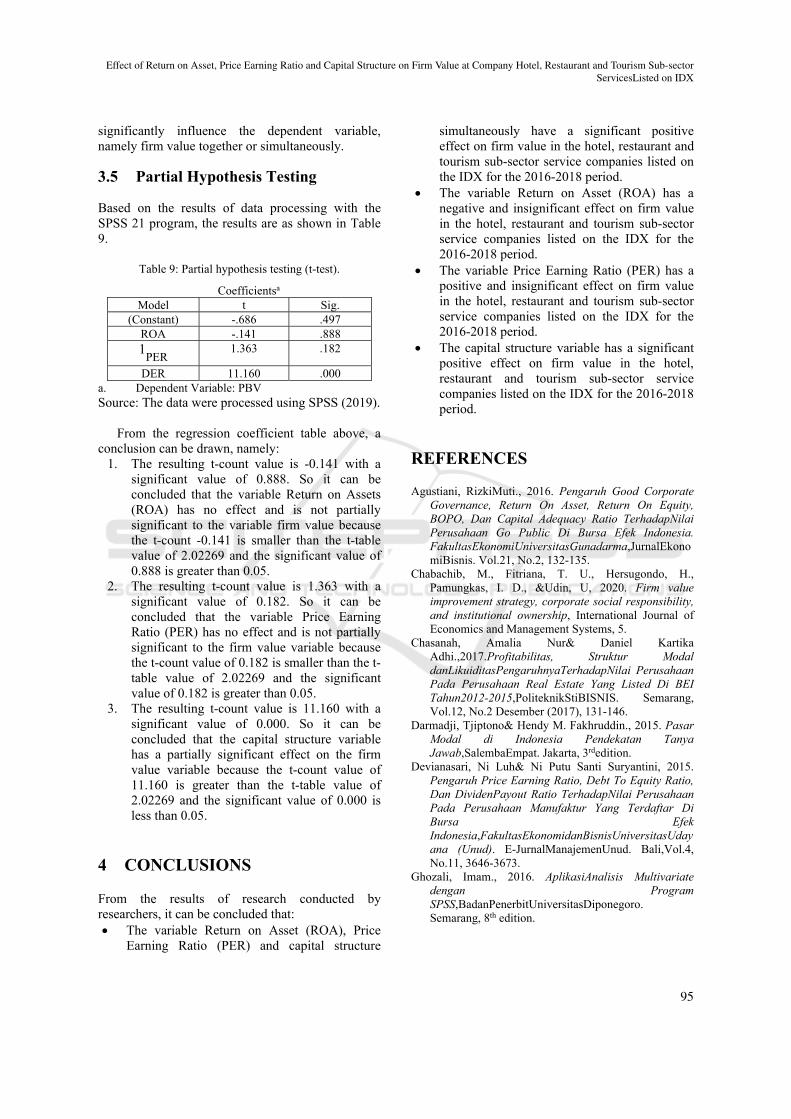
3.5 Partial Hypothesis Testing
Based on the results of data processing with the SPSS 21 program, the results are as shown in Table 9.
Table 9: Partial hypothesis testing (t-test).
Coefficientsa
Model t Sig.(Constant) -.686 .497
ROA -.141 .8881
PER 1.363 .182
DER 11.160 .000a. Dependent Variable: PBV Source: The data were processed using SPSS (2019).
From the regression coefficient table above, a
conclusion can be drawn, namely: 1. The resulting t-count value is -0.141 with a
significant value of 0.888. So it can be concluded that the variable Return on Assets (ROA) has no effect and is not partially significant to the variable firm value because the t-count -0.141 is smaller than the t-table value of 2.02269 and the significant value of 0.888 is greater than 0.05.
2. The resulting t-count value is 1.363 with a significant value of 0.182. So it can be concluded that the variable Price Earning Ratio (PER) has no effect and is not partially significant to the firm value variable because the t-count value of 0.182 is smaller than the t-table value of 2.02269 and the significant value of 0.182 is greater than 0.05.
3. The resulting t-count value is 11.160 with a significant value of 0.000. So it can be concluded that the capital structure variable has a partially significant effect on the firm value variable because the t-count value of 11.160 is greater than the t-table value of 2.02269 and the significant value of 0.000 is less than 0.05.
4 CONCLUSIONS
From the results of research conducted by researchers, it can be concluded that: The variable Return on Asset (ROA), Price
Earning Ratio (PER) and capital structure
simultaneously have a significant positive effect on firm value in the hotel, restaurant and tourism sub-sector service companies listed on the IDX for the 2016-2018 period.
The variable Return on Asset (ROA) has a negative and insignificant effect on firm value in the hotel, restaurant and tourism sub-sector service companies listed on the IDX for the 2016-2018 period.
The variable Price Earning Ratio (PER) has a positive and insignificant effect on firm value in the hotel, restaurant and tourism sub-sector service companies listed on the IDX for the 2016-2018 period.
The capital structure variable has a significant positive effect on firm value in the hotel, restaurant and tourism sub-sector service companies listed on the IDX for the 2016-2018 period.
REFERENCES
Agustiani, RizkiMuti., 2016. Pengaruh Good Corporate Governance, Return On Asset, Return On Equity, BOPO, Dan Capital Adequacy Ratio TerhadapNilai Perusahaan Go Public Di Bursa Efek Indonesia. FakultasEkonomiUniversitasGunadarma,JurnalEkonomiBisnis. Vol.21, No.2, 132-135.
Chabachib, M., Fitriana, T. U., Hersugondo, H., Pamungkas, I. D., &Udin, U, 2020. Firm value improvement strategy, corporate social responsibility, and institutional ownership, International Journal of Economics and Management Systems, 5.
Chasanah, Amalia Nur& Daniel Kartika Adhi.,2017.Profitabilitas, Struktur Modal danLikuiditasPengaruhnyaTerhadapNilai Perusahaan Pada Perusahaan Real Estate Yang Listed Di BEI Tahun2012-2015,PoliteknikStiBISNIS. Semarang, Vol.12, No.2 Desember (2017), 131-146.
Darmadji, Tjiptono& Hendy M. Fakhruddin., 2015. Pasar Modal di Indonesia Pendekatan Tanya Jawab,SalembaEmpat. Jakarta, 3rdedition.
Devianasari, Ni Luh& Ni Putu Santi Suryantini, 2015. Pengaruh Price Earning Ratio, Debt To Equity Ratio, Dan DividenPayout Ratio TerhadapNilai Perusahaan Pada Perusahaan Manufaktur Yang Terdaftar Di Bursa Efek Indonesia,FakultasEkonomidanBisnisUniversitasUdayana (Unud). E-JurnalManajemenUnud. Bali,Vol.4, No.11, 3646-3673.
Ghozali, Imam., 2016. AplikasiAnalisis Multivariate dengan Program SPSS,BadanPenerbitUniversitasDiponegoro. Semarang, 8th edition.
Effect of Return on Asset, Price Earning Ratio and Capital Structure on Firm Value at Company Hotel, Restaurant and Tourism Sub-sectorServicesListed on IDX
95

Gumanti, Tatang Ary., 2011. Manajemen Investasi Konsep Teori dan Aplikasi, Mitra Wacana Media. Jakarta, 1st edition.
Harahap, SofyanSyafri., 2015. AnalisisKritisAtasLaporanKeuangan,PT.RajaGrafindoPersada. Jakarta.
Harmono., 2014. ManajemenKeuanganBerbasis Balanced Scorecard, PT.BumiAksara. Jakarta.
Husna, Asmaul & Satria Ibnu., 2019. Effect of Return on Asset, Debt to Asset Ratio, Current Ratio, Firm Size, and Dividen Payout Ratio on Firm Value, International Journal of Economics and Financial Issues. Vol 9, Issue 9(5),50-54.
Lebelaha, Devina L. A. & Ivonne S. Saerang, 2016. Pengaruh Price Earning Ratio, Debt To Equity dan Dividend Payout Ratio Terhadap Nilai Perusahaan BUMN Yang Terdaftar Di Bursa Efek Indonesia Periode 2011-2014. Fakultas Ekonomi dan Bisnis Universitas Sam Ratulangi. Jurnal Berkala Ilmiah Efisiensi. Manado, Vol.16, No.02 (2016), 376-386.
Luo, J., & Lusmeida, H., 2019. The Effect of Corporate Social Responsibility and Financial Ratio to Company’s Value (Case Study of Companies Listed in LQ45 of IDX for the period 2011-2015). International Conference on Islamic Economics and Business (ICONIES 2018). Atlantis Press.
Mandalika, Andri, 2016. Pengaruh Struktur Aktiva, Struktur Modal, dan Pertumbuhan Penjualan Terhadap Nilai Perusahaan Pada Perusahaan Yang Terdaftar Di Bursa Efek Indonesia Periode 2011-2014. Fakultas Ekonomi dan Bisnis Universitas Sam Ratulangi. Jurnal Berkala Ilmiah Efisiensi. Manado, Vol.16, No.01, 207-218.
Murhadi, Werner R., 2015. Analisis Laporan Keuangan Proyeksi dan Valuasi Saham, Salemba Empat. Jakarta.
Nurainy, R., Nurcahyo, B., Kurniasih, A.S., Sugiharti, B., 2013. Implementation of good corporate governance and its impact on corporate performance : The mediation role of firm size (empirical study from Indonesia), Global Business and Management Research: An International Journal, Vol 5, Nos 2-3.
Prasetyorini, Bhekti Fitri, 2013. Pengaruh Ukuran Perusahaan, Leverage, Price Earning Ratio Dan Profitabilitas Terhadap Nilai Perusahaan.. Fakultas Ekonomi Universitas Negeri Surabaya. Jurnal Ilmu Manajemen. Surabaya, Vol.1, No.1, 183-196.
Purwanto,P & Jillian Agustin, 2017. Financial Performance towards Value of Firms in Basic and Chemicals Industry. Faculty of Economic and Business, Padjajaran University. European Research Studies Journal. Bandung, Volume.XX, Issue.2A, 443-460.
Raharjaputra, Hendra S., 2011. Buku Panduan Praktis Manajemen Keuangan dan Akuntansi untuk Eksekutif Perusahaan, Salemba Empat. Jakarta.
Rahman, M. A., Sarker, M. S. I., & Uddin, M. J., 2019. The impact of capital structure on the profitability of publicly traded manufacturing firms in Bangladesh. Applied Economics and Finance, 6(2), 1-5.
Rahmantio, Imam, dkk., April 2018. Pengaruh Debt To Equity, Return On Equity, Return On Asset dan Ukuran Perusahaan Terhadap Nilai Perusahaan (Studi pada Perusahaan Pertambangan yang Terdaftar di Bursa Efek Indonesia Tahun 2012-2016). Universitas Brawijaya. Jurnal Administrasi Bisnis. Malang, Vol.57, No.1, 151-159.
Salempang, Lita Elisabeth, dkk, 2016. Pengaruh Return On Asset, Debt To Equity dan Pertumbuhan Penjualan Terhadap Nilai Perusahaan Pada Sektor Real Estate Dan Property Yang Terdaftar Di BEI Tahun 2013-2014. Universitas Sam Ratulangi. Jurnal Berkala Ilmiah Efisiensi. Manado, Vol.16, No.03, 813-824.
Sudjiman, P. E., & Sudjiman, L. S, 2019. Do Leverage Concentration Influence Firms Value, In Abstract Proceedings International Scholars Conference. Vol. 7, No. 1, pp. 1330-1342.
Sugiono, Edy Untung., 2016. Panduan Praktis Dasar Analisa Laporan Keuangan, PT Grasindo. Jakarta.
Triani, N., &Tarmidi, D., 2019. Firm Value: Impact of Investment Decisions, Funding Decisions and Dividend Policies, International Journal of Academic Research in Accounting, Finance and Management Sciences, 9(2), 158-163.
Widyastuti, M., 2019. Analysis of liquidity, activity, leverage, financial performance and company value in food and beverage companies listed on the Indonesia Stock Exchange, SSRG International Journal of Economics and Management Studies (SSRG-IJEMS), 6(5), 52-58.
Zuhro, I., 2019. The Effects of Liquidity, Firm Size, and Profitability on the Firm Value with Mediating Leverage,KnE Social Sciences, 203-230.
CESIT 2020 - International Conference on Culture Heritage, Education, Sustainable Tourism, and Innovation Technologies
96