Effect of modified cellulose on open time of glue mortar - Pure
144
Effect of modified cellulose on open time of glue mortar Citation for published version (APA): Faiyas Aduvattu Purayil, A. (2019). Effect of modified cellulose on open time of glue mortar: an NMR study on transport and hydration. Technische Universiteit Eindhoven. Document status and date: Published: 06/11/2019 Document Version: Publisher’s PDF, also known as Version of Record (includes final page, issue and volume numbers) Please check the document version of this publication: • A submitted manuscript is the version of the article upon submission and before peer-review. There can be important differences between the submitted version and the official published version of record. People interested in the research are advised to contact the author for the final version of the publication, or visit the DOI to the publisher's website. • The final author version and the galley proof are versions of the publication after peer review. • The final published version features the final layout of the paper including the volume, issue and page numbers. Link to publication General rights Copyright and moral rights for the publications made accessible in the public portal are retained by the authors and/or other copyright owners and it is a condition of accessing publications that users recognise and abide by the legal requirements associated with these rights. • Users may download and print one copy of any publication from the public portal for the purpose of private study or research. • You may not further distribute the material or use it for any profit-making activity or commercial gain • You may freely distribute the URL identifying the publication in the public portal. If the publication is distributed under the terms of Article 25fa of the Dutch Copyright Act, indicated by the “Taverne” license above, please follow below link for the End User Agreement: www.tue.nl/taverne Take down policy If you believe that this document breaches copyright please contact us at: [email protected] providing details and we will investigate your claim. Download date: 29. Mar. 2022
-
Upload
khangminh22 -
Category
Documents
-
view
3 -
download
0
Transcript of Effect of modified cellulose on open time of glue mortar - Pure
Effect of modified cellulose on open time of glue mortar
Citation for published version (APA):Faiyas Aduvattu Purayil, A. (2019). Effect of modified cellulose on open time of glue mortar: an NMR study ontransport and hydration. Technische Universiteit Eindhoven.
Document status and date:Published: 06/11/2019
Document Version:Publisher’s PDF, also known as Version of Record (includes final page, issue and volume numbers)
Please check the document version of this publication:
• A submitted manuscript is the version of the article upon submission and before peer-review. There can beimportant differences between the submitted version and the official published version of record. Peopleinterested in the research are advised to contact the author for the final version of the publication, or visit theDOI to the publisher's website.• The final author version and the galley proof are versions of the publication after peer review.• The final published version features the final layout of the paper including the volume, issue and pagenumbers.Link to publication
General rightsCopyright and moral rights for the publications made accessible in the public portal are retained by the authors and/or other copyright ownersand it is a condition of accessing publications that users recognise and abide by the legal requirements associated with these rights.
• Users may download and print one copy of any publication from the public portal for the purpose of private study or research. • You may not further distribute the material or use it for any profit-making activity or commercial gain • You may freely distribute the URL identifying the publication in the public portal.
If the publication is distributed under the terms of Article 25fa of the Dutch Copyright Act, indicated by the “Taverne” license above, pleasefollow below link for the End User Agreement:www.tue.nl/taverne
Take down policyIf you believe that this document breaches copyright please contact us at:[email protected] details and we will investigate your claim.
Download date: 29. Mar. 2022
Effect of modified cellulose on open time of glue
mortar: an NMR study on transport and hydration
PROEFSCHRIFT
ter verkrijging van de graad van doctor
aan de Technische Universiteit Eindhoven,
op gezag van de rector magnificus Prof.Dr.ir. F.P.T. Baaijens
voor een commissie aangewezen door het College voor
Promoties, in het openbaar te verdedigen
op woensdag 06 november 2019 om 16.00 uur
door
Ahammed Faiyas Aduvattu Purayil
geboren te Vazhakkad, Kerala, India
Dit proefschrift is goedgekeurd door de promotoren en de samenstelling van de
promotiecommissie is als volgt:
voorzitter: Prof.dr.ir. G.M.W. Kroesen
1e promotor: Prof.dr.ir. O.C.G. Adan
2e promotor: Prof.dr.ir. E.A.B. Koenders (Technical University of Darmstadt)
Copromotor (en): Dr.ir. S.J.F. Erich
leden: Dr. M. Prat (Institut de Mécanique des Fluides de Toulouse) (IMFT)
Prof.dr.ir. T.A.M. Salet
Prof.dr.ir. N. de Belie (University of Gent)
Adviseur Dr. T.G. Nijland (TNO)
Het onderzoek dat in dit proefschrift wordt beschreven is uitgevoerd in overeenstemming
met de TU/e Gedragscode Wetenschapsbeoefening.

To my father
A catalogue record is available from the Eindhoven University of Technology Library.
ISBN: 978-94-91909-53-5
Cover image: Timo Nijland
Cover Design: Faiyas and Jaisan
Printed by: GildePrint
Copyright © by A.P.A. Faiyas, all right reserved.
This research was performed under the project number M81.6.08315 in the framework of
the Research Program of the Materials innovation institute (M2i) (www.m2i.nl).
The work described in this thesis has been carried out at the Eindhoven University of
Technology (TU/e) at the Department of Applied Physics, within the group Transport in
permeable Media (TPM). This research is supported by the Materials innovation institute
(M2i) and by the Netherlands Organization for Applied Scientific Research (TNO).
i
Contents
Chapter 1 Introduction
1.1 History of glue mortar …………………………………………………..………………………………………1
1.2 Applying a glue mortar; importance of open time ……………..…………………………………2
1.3 Introduction to drying of glue mortar ………………………………..………………………………….4
1.3.1 Composition of modern glue mortar .…………………….……………………………………4
1.3.1.1 Cellulose Ethers ..................…………………………………………………………5
1.3.1.2 Polymer latexes …………………………………………………………………………….6
1.3.1.3 Redispersible polymer powders …………………………………………………….6
1.3.1.4 Liquid polymers …………………………………………………………………………....6
1.3.2 Drying of glue mortar ………………………………………………………………………………….7
1.3.2.1 Evaporation ………………………………………………………………………….........8
1.3.2.2 Water transport in the mortar ………………………………………………………8
1.3.2.3 Suction of water in substrate and tile ……………………………………………9
1.3.2.4 Polymer transport …………………………………………………………………………9
1.3.2.5 Hydration …………………………………..……………………………………………….10
1.3.2.6 Carbonation ………………………………………………………………………………..12
1.4 Understanding the open time of glue mortar ………………………………………………………12
1.5 Research questions ……………………………………………………………………………………………..13
1.6 Outline of the thesis ……………………………………………………………………………………………14
Chapter 2 Imaging of drying phenomena
2.1 Introduction .…………………………………………………………………………………………………..19
2.2 Application of NMR .....……………………………………………………………………………………….19
2.3 NMR Imaging .............…………………………………………………………………………………………20
2.3.1 NMR principle ..........……………………………………………………………………………..20
2.3.2 Sensitivity and the Boltzmann Equation ............……………………………………….21
2.3.3 Relaxation ..........………………………………………………………………………………………22
2.3.4 Spatial Resolution ...........…………………………………………………………………………22
2.3.5 NMR Pulse sequence ............……………………………………………………………………23
2.3.5.1 Spin echo .............................................................................…………23
2.3.5.2Carr Purcell pulse sequence ..........…………………………………………….23
2.3.6 Probing the pore size by NMR relaxometry ………………………………………………24
2.4 NMR set-up used for drying experiment ......……………………………………………………….25
2.5 NMR in porous media ..….…………………………………………………………………………………27
2.5.1 NMR imaging of porous media ....…………………………………………………………….27
2.5.2 NMR on cement hydration ..…………………………………………………………………..29
ii
Chapter 3 How methylhydroxyethylcellulose (MHEC) influences drying in porous media
3.1 Introduction ………………………………………………………………………………………………………..36
3.2 Experimental ……………………………………………………………………………………………………….37
3.2.1 Methylhydroxyethylcellulose ………………………………………………………………….37
3.2.2 Fired Clay Brick (FCB) as model porous medium ...……………………………………38
3.2.3 Drying experiments ………………………………………………………………………………..39
3.3 Theory ……………………………………………………………………………………………………………...39
3.3.1 Transport equation and moisture diffusivity ……………………………………………..39
3.3.2 Capillary number .………………………………………………………………………………….41
3.4 Result and Discussion ...................................……………………………………………………..42
3.4.1 Drying Profiles ………………………………………………………………………………………..42
3.4.2 Understanding drying behavior ………………………………………………………………44
3.4.2.1 Capillary number ………………………………………………………………………..44
3.4.2.2 Moisture diffusivity …………………………………………………………………….45
3.5 Conclusions .................…………………………………………………………………………………….50
Chapter 4 Effect of MHEC on evaporation and hydration characteristics of glue mortar
4.1 Introduction ………………………………………………………………………………………………………..55
4.2 Experimental ……………………………………………………………………………………………….57
4.2.1 Glue mortar composition and preparation …………………………………………….57
4.2.2 Methylhydroxyethylcellulose (MHEC) ………………………………………………….58
4.3 Results of evaporation and hydration ....................................................................58
4.3.1 Moisture distribution profiles .......................................................................58
4.3.2 Time scale of mortar evaporation and hydration .........................................61
4.3.3 Role of MHEC on the microstructure evolution .….……………………………………62
4.3.4 Influence of MHEC on the pore size distribution ……………………………………….65
4.4 Conclusions …………………………………………………………………………………………..............66
Chapter 5 Transport of a water-soluble polymer during drying of a model porous
medium
5.1 Introduction ………………………………………………………………………………………………………71
5.2 Materials and Method ………………………………………………………………………………………73
5.2.1 Methylhydroxyethylcellulose ………………………………………………………………….73
5.2.2 Drying experiments ………………………………………………………………………………….74
5.2.3 TGA measurement on MHEC dried bead ………………………………………………..75
5.3 Results and discussion ………………………………………………………………………………………..76
5.3.1 Moisture profiles during drying of packed beads with different pore size ..76
5.3.2 Forces determining the drying behavior ……………………………………………………80
iii
5.3.3 MHEC transport ……………………………………………………………………………………….83
5.4 Conclusions …………………………………………………………………………………………………………88
Chapter 6 Understanding the water absorption from MHEC modified glue mortar into
porous tile: Influence of pre-drying.
6.1 Introduction ………………………………………………………………………………………………………93
6.2 Materials and methods ……………………………………………………………………………………..95
6.2.1 Glue mortar ……………………………………………………………………………………………..96
6.2.2 Base concrete substrate ……………………………………………………………………………96
6.2.3 Tile…………………………………………………………………………………………………………….97
6.2.4 Methylhydroxyethylcellulose ………………………………………………………………….97
6.3 Capillary number: Key parameters to characterize absorption ..……………………...100
6.4 Results …………………………………………………………………………………………………………….102
6.4.1 Water absorption from mortar into concrete base substrate and tiles ……102
6.4.2 Effect of pre-drying of mortar ………………………………………………………………..105
6.5 Discussion .........................…………………………………………………………………………………107
6.5.1 Absorption behavior as function of MHEC concentration ............……………107
6.5.2 Change of capillary force during drying ..................................…………………108
6.5.3 Understanding flow reversal ..........................................………………………..108
6.5.4 Understanding pre-drying ...................................…………………………………..109
6.5.5 Effect of moisture content on pre-drying ..................………………………………110
6.6 Conclusion and practical consequences ..…………………………………………………………110
Chapter 7 Conclusions and Outlook
7.1 Conclusions ……………………………………………………………………………………………………….115
7.1.1 Conceptual model of drying process ……………………………………………………….117
7.1.2 Practical implications ………………………………………………………………………………119
7.2 Outlook ……………………………………………………………………………………………………………..119
7.2.1 Film formation of MHEC: A mechanism that limits open time …………………119
7.2.2 Water and MHEC transport: Influence of additive migration ..………………120
7.2.3 Environmental parameters: Key parameters in transport………………………..120
7.2.4 Other formulations: Influence of the composition …………………………………..121
7.2.5 Adhesion test: Key analysis of effective contribution ………………………………121
Summary ....…………………………………………………………………………………………………………………..123
Samenvatting ….……………………………………………………………………………………………….………..127
Acknowledgements .........……………………………………………………………………………………………131
List of publications ……………………………………………………………………………………………………..134
Curriculum Vitae ..………………………………………………………………………………………………………135

iv
1
Chapter 1
Introduction
1 Introduction
1.1 History of glue mortar
Mortar itself has a tradition of several thousands of years. Gypsum based mortars have
already been used 10.000 years ago. According to Roman Ghirshman, the first evidence of
humans using a form of mortar was at the Mehrgarh of Baluchistan in Pakistan, built of
sun-dried bricks in 6500 B.C.E. [1]. Within mortars, the oldest binder was known to be
mud, closely followed by clay, as verified by the finds at CatalHüyük, Turkey, dating from
6000 BC. By the 6th millennium BC, as agriculture began to spread westward into Europe
and the first use of brick appeared at CatalHüyük, lime began to be implemented as a
binder [2]. Other historic applications of bituminous mortars in construction have been
identified in the ancient Indus Valley cities of Mohenjo-Daro and Harappa around 3000
B.C.E, and near the Tigris River in 1300 B.C.E [3]. Many natural polymers have been used in
ancient mortar, including albumen, blood, rice paste, and others [4]. The ancient Harappa
city in Pakistan was built in about 2500 B.C.E., with kiln-fired bricks and a gypsum mortar
[3]. Gypsum mortar was used in the constructions of Egyptian pyramids and ancient
structures. The Portland cement mortar was invented in 1794 by Joseph Aspdin and
patented on 18 December 1824 and became popular during the late nineteenth century
[5]. The earliest indication of the use of polymers in cement was apparently in 1909, in the
United States, when a patent for such use was granted to L. H. Backland; and in 1922, in
France, when a patent was granted to M. E. Varegyas. In Britain, polymers in concrete
advanced in 1923 with L. Cresson's patent for rubber-modified road surfacing material. In
1924 with V. Lefebure's development of natural rubber latex cement; and in 1925 by S. H.
Kirkpatrik's innovation on that product [4]. Synthetic polymers were invented in the 1940s
in response to the wartime decline in the availability of natural rubber and the increased
demand of the war effort. Incorporation of synthetic polymers in Portland cement mortars
and concrete started in the 1950s [4]. Modern cement research started almost
contemporaneously with cement production at the end of the 18th
century. During these
periods, scientific analytic methods developed rapidly.
Prior to the early 1900s, tiles were only produced to adorn important public
buildings and for homes of the wealthy. Today, tiles can be both affordable and luxurious
for everyone and the design possibilities are endless. Ceramic tiles are commonly used to
decorate and protect kitchens, bathrooms, walls, countertops, interior and exterior floors
and roofs. Ubiquitous through recorded history, ceramic tiles helps human to create living
Chapter 1
2
environments that are not only beautiful, but durable, waterproof, easy to clean, and
electrically insulating. Modern construction materials, such as gypsum wallboard, plywood
and cement backer boards, led to demand for less labor-intensive and more effective
ceramic tile adhesives.
Tiles were kiln-fired from various combinations of clay, sand and water. Ceramic tiles
found in the remains of ancient civilizations from Mesopotamia and Greece to China,
Rome and Egypt are part of the historical record in some part, because of the long-
standing adhesives that kept them in place [6]. In 1824, Portland cement was invented,
and it quickly became the most popular adhesive method for ceramic tiles. From the early
beginnings until the middle of the last century, tiling mortars were basically prepared by
mixing cement, sand and water in the appropriate ratio by hand at the work site. The
quality of the mortar depends on the quality of the raw material and the mixing ratio,
which could not be controlled easily. In the 1950s, polymers were added to cementitious
tile adhesives in order to improve their fresh mixture properties. Subsequently, the
industry introduced polymer modified dry mix additives. Construction ingredients like
cellulose ethers and redispersible latex powders enabled the development of thin set
mortars, improving performance and conserving materials compared to thick-bed mortar
adhesives. The thin bed mortar is usually spread with a notched trowel onto the substrate,
resulting in a ribbed mortar bed of typically 2 to 5 mm thickness. The thick bed mortar
ranges from a thickness of 15 to 30 mm thickness. Cement, sand and water are mixed at
the building site. The thick bed tiling method was used before 1960s for earthenware tiles
and is still in use for big and heavy natural stones.
Today, polymer modified mortar are the dominant choices for virtually all
applications and are widely accepted. Polymer modified mortars comprised of Portland
cement, aggregates such as silica sand or limestone, and modifiers, such as redispersible
latex polymer powders and cellulose ethers. Polymer modified mortars are better for wet
installations, such as shower stalls, kitchen and bathroom floors. They are also best for
applications near heat sources and heavy traffic floors. Cellulose ethers are used as
polymeric additives in glue mortars for their excellent water retention, which improves
the workability, open time, and correction time of the mortar.
1.2 Applying a glue mortar; importance of open time
At the work site, the tiler mixes the glue mortar constituent and applies the mortar with a
toothed trowel onto the substrate, such as concrete, render or screed, and spreads the
mortar within the reach of an arm’s length. Consequently, he covers an area of around
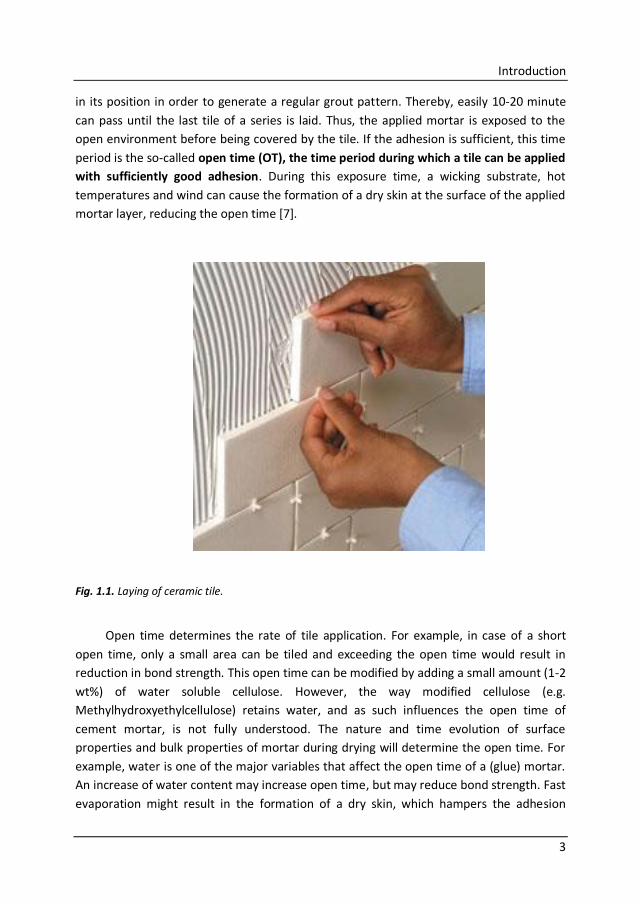
1m2 with adhesives, before he starts laying a series of tiles (Fig. 1.1). Generally, a tiler
needs to put considerable attention to spreading adhesives on the substrate, so that tiling
can be completed before the adhesive harden. Each single tile is laid, loaded and adjusted
Introduction
3
in its position in order to generate a regular grout pattern. Thereby, easily 10-20 minute
can pass until the last tile of a series is laid. Thus, the applied mortar is exposed to the
open environment before being covered by the tile. If the adhesion is sufficient, this time
period is the so-called open time (OT), the time period during which a tile can be applied
with sufficiently good adhesion. During this exposure time, a wicking substrate, hot
temperatures and wind can cause the formation of a dry skin at the surface of the applied
mortar layer, reducing the open time [7].
Fig. 1.1. Laying of ceramic tile.
Open time determines the rate of tile application. For example, in case of a short
open time, only a small area can be tiled and exceeding the open time would result in
reduction in bond strength. This open time can be modified by adding a small amount (1-2
wt%) of water soluble cellulose. However, the way modified cellulose (e.g.
Methylhydroxyethylcellulose) retains water, and as such influences the open time of
cement mortar, is not fully understood. The nature and time evolution of surface
properties and bulk properties of mortar during drying will determine the open time. For
example, water is one of the major variables that affect the open time of a (glue) mortar.
An increase of water content may increase open time, but may reduce bond strength. Fast
evaporation might result in the formation of a dry skin, which hampers the adhesion
Chapter 1
4
considerably. In general, a skin is a surface layer of different composition, microstructure
and/or properties (viscosity), which is well known to be present in coatings. Formation of
a skin close to the surface of a glue mortar may inhibit a good adhesion between mortars
and tiles, and at least partly the open time of a glue mortar.
1.3 Introduction to drying of glue mortar
In this section, we will introduce the typical composition of an organic based glue mortar
and the polymeric additives. Subsequently, we will introduce the different stages of drying
of a glue mortar.
1.3.1 Composition of modern glue mortar
Mortars have gone through a significant development in recent years. Commercial
mortars are complex systems, with Portland cement as basic ingredient. Portland cement
consists of variety of chemical constituents, such as Lime (CaO), Silica (SiO2), Alumina
(Al2O3), Iron Oxide (Fe2O3), Magnesia (MgO), Sulphur trioxide (SO3), Soda and/or Potash
(Na2O and K2O). Under influence of water, cement reacts through a variety of path ways
leading to different inorganic phases, basically Calcium Silicate Hydrate (CSH). In order to
create a sufficient operating window for applying cement as glue, various organic and
inorganic additives are used to influence the cement reaction itself and the workability of
the mortar.
A typical formulation for a standard tile adhesive is given in Table 1.1. CEM I 52.5R is
a Portland cement with high initial strength. The main constituents, according to EN 197-
1:2002, are: clinker between 95 - 100% and auxiliary components between 0 - 5%. Cement
is commonly mixed with other ingredients to produce a mortar such as quartz or gravel
and fillers. Quartz is added to provide volume, stability, resistance to wear or erosion, and
other desired physical properties to the finished structure. Limestone is added to make
the mortar creamier or more workable and durable, and may help to minimize cracking as
the mix dries out. Inorganic and organic additives can be summarized with respect to their
influence on the setting and hardening of cement [8, 9, 10]. Most commonly used
polymeric additives in tile adhesive industry are Cellulose Ethers, polymer latexes, re-
dispersible polymer powders and liquid polymers, and are discussed in the following sub
sections [11].
Introduction
5
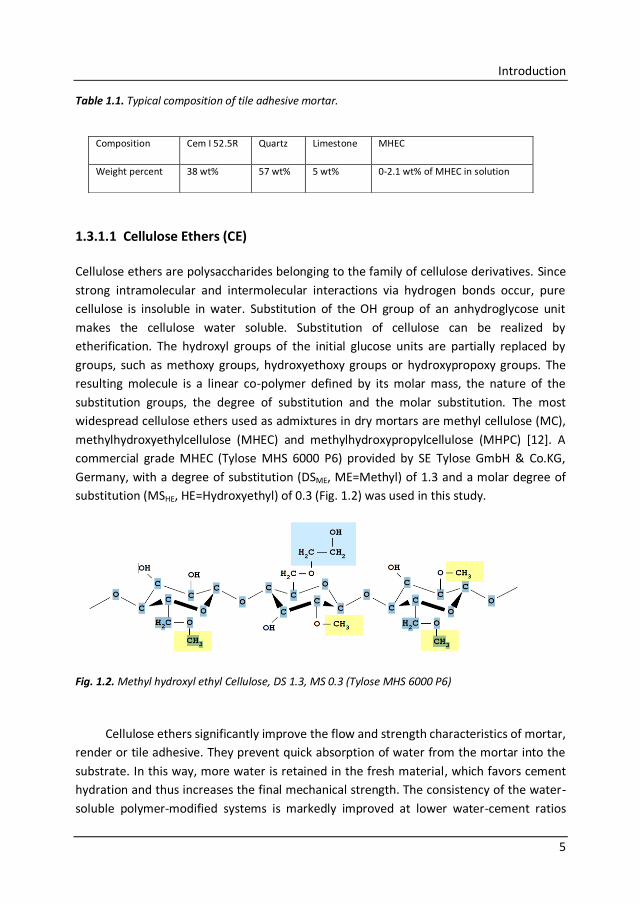
Table 1.1. Typical composition of tile adhesive mortar.
1.3.1.1 Cellulose Ethers (CE)
Cellulose ethers are polysaccharides belonging to the family of cellulose derivatives. Since
strong intramolecular and intermolecular interactions via hydrogen bonds occur, pure
cellulose is insoluble in water. Substitution of the OH group of an anhydroglycose unit
makes the cellulose water soluble. Substitution of cellulose can be realized by
etherification. The hydroxyl groups of the initial glucose units are partially replaced by
groups, such as methoxy groups, hydroxyethoxy groups or hydroxypropoxy groups. The
resulting molecule is a linear co-polymer defined by its molar mass, the nature of the
substitution groups, the degree of substitution and the molar substitution. The most
widespread cellulose ethers used as admixtures in dry mortars are methyl cellulose (MC),
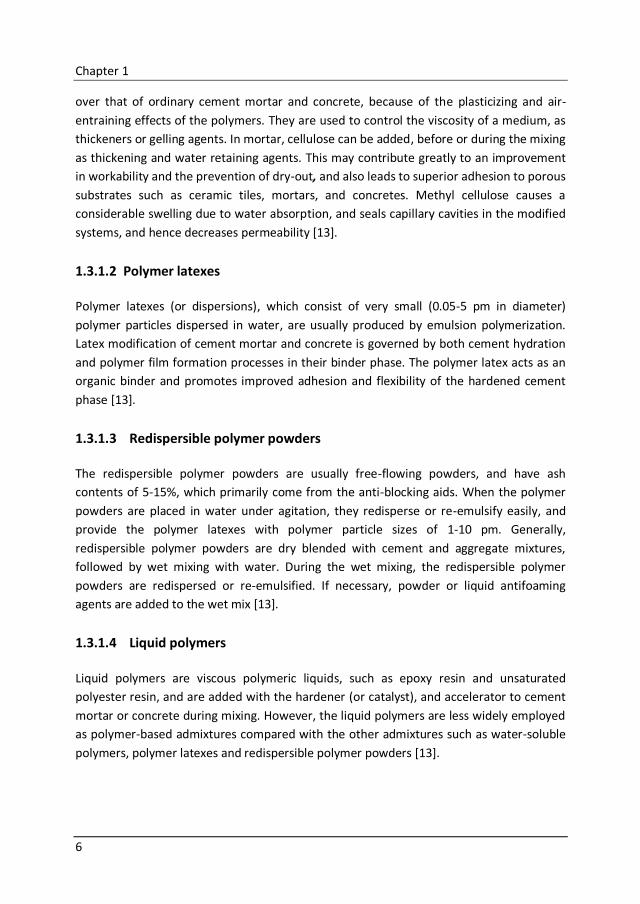
methylhydroxyethylcellulose (MHEC) and methylhydroxypropylcellulose (MHPC) [12]. A
commercial grade MHEC (Tylose MHS 6000 P6) provided by SE Tylose GmbH & Co.KG,
Germany, with a degree of substitution (DSME, ME=Methyl) of 1.3 and a molar degree of
substitution (MSHE, HE=Hydroxyethyl) of 0.3 (Fig. 1.2) was used in this study.
Fig. 1.2. Methyl hydroxyl ethyl Cellulose, DS 1.3, MS 0.3 (Tylose MHS 6000 P6)
Cellulose ethers significantly improve the flow and strength characteristics of mortar,
render or tile adhesive. They prevent quick absorption of water from the mortar into the
substrate. In this way, more water is retained in the fresh material, which favors cement
hydration and thus increases the final mechanical strength. The consistency of the water-
soluble polymer-modified systems is markedly improved at lower water-cement ratios
Composition Cem I 52.5R Quartz Limestone MHEC
Weight percent 38 wt% 57 wt% 5 wt% 0-2.1 wt% of MHEC in solution
Chapter 1
6
over that of ordinary cement mortar and concrete, because of the plasticizing and air-
entraining effects of the polymers. They are used to control the viscosity of a medium, as
thickeners or gelling agents. In mortar, cellulose can be added, before or during the mixing
as thickening and water retaining agents. This may contribute greatly to an improvement
in workability and the prevention of dry-out, and also leads to superior adhesion to porous
substrates such as ceramic tiles, mortars, and concretes. Methyl cellulose causes a
considerable swelling due to water absorption, and seals capillary cavities in the modified
systems, and hence decreases permeability [13].
1.3.1.2 Polymer latexes
Polymer latexes (or dispersions), which consist of very small (0.05-5 pm in diameter)
polymer particles dispersed in water, are usually produced by emulsion polymerization.
Latex modification of cement mortar and concrete is governed by both cement hydration
and polymer film formation processes in their binder phase. The polymer latex acts as an
organic binder and promotes improved adhesion and flexibility of the hardened cement
phase [13].
1.3.1.3 Redispersible polymer powders
The redispersible polymer powders are usually free-flowing powders, and have ash
contents of 5-15%, which primarily come from the anti-blocking aids. When the polymer
powders are placed in water under agitation, they redisperse or re-emulsify easily, and
provide the polymer latexes with polymer particle sizes of 1-10 pm. Generally,
redispersible polymer powders are dry blended with cement and aggregate mixtures,
followed by wet mixing with water. During the wet mixing, the redispersible polymer
powders are redispersed or re-emulsified. If necessary, powder or liquid antifoaming
agents are added to the wet mix [13].
1.3.1.4 Liquid polymers
Liquid polymers are viscous polymeric liquids, such as epoxy resin and unsaturated
polyester resin, and are added with the hardener (or catalyst), and accelerator to cement
mortar or concrete during mixing. However, the liquid polymers are less widely employed
as polymer-based admixtures compared with the other admixtures such as water-soluble
polymers, polymer latexes and redispersible polymer powders [13].
Introduction
7
1.3.2 Drying of glue mortar
Drying is a complicated process with simultaneous heat and mass transfer accompanied
by physicochemical transformations. Drying of fresh mortar or cement paste is much more
complex than just drying of inert porous media. In case of inert materials, drying refers to
the evaporation of water. In cementitious materials, often, the word drying refers to the
combined effect of water evaporation and hydration. As soon as the mortar paste is
applied on the substrate, the water from the mortar starts to evaporate from the surface
to the atmosphere and the water may also be absorbed by the substrate. During
evaporation, water inside the mortar is transported towards the surface as a result of
capillary pressure difference inside the mortar sample. Upon the addition of water in the
mortar, cement reacts via various pathways, leading to different inorganic phases,
basically Calcium Silicate Hydrate (CSH), that provide mechanical strength to the finally
hardened mortar. In many cases, the amount of moisture that leaves the sample is smaller
than the amount of water that becomes part of the final material as a result of the
formation of hydrates and the gel phase. Water in cement-based materials is often
classified as non-evaporable and evaporable water. Non-evaporable water is chemically
bound in the hydrates and can be removed only by thermally destroying the material
microstructure. Evaporable water can be removed during drying and is usually further
subdivided into capillary pore (10 µm-10 nm) water and gel pore (10 nm – 2.5 nm) water
of the solid gel formed upon cement hydration. During the drying of cement-based
materials, higher initial water contents usually lead to higher sample porosity and thus
more efficient capillary removal of moisture during the initial stages of drying. Extended
moisture curing of the samples tends to lead to a lower porosity and permeability of the
materials and thus to a reduced efficiency of capillary flow. As with other drying materials,
during the later stages moisture is removed by diffusion and a receding drying front is
formed [14].
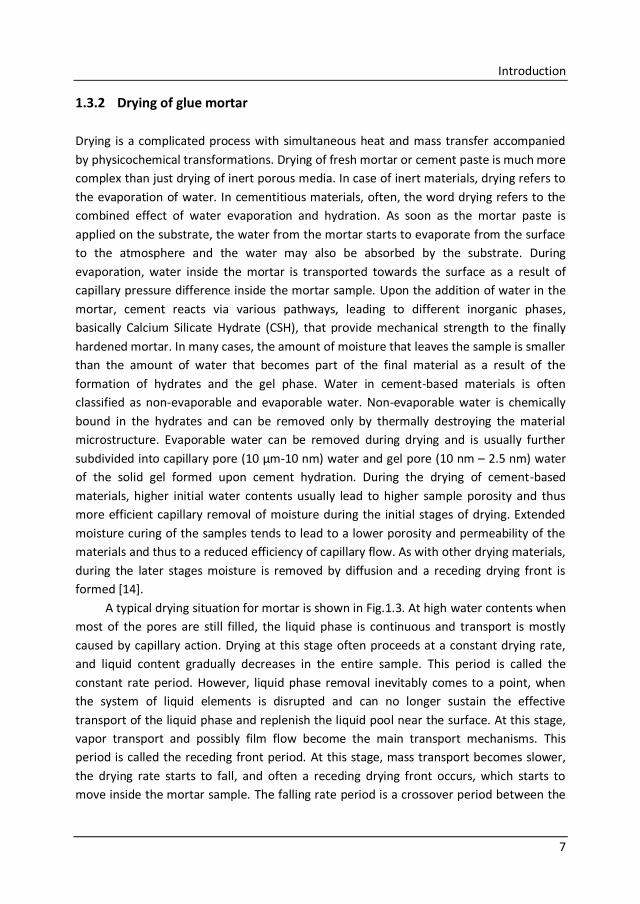
A typical drying situation for mortar is shown in Fig.1.3. At high water contents when
most of the pores are still filled, the liquid phase is continuous and transport is mostly
caused by capillary action. Drying at this stage often proceeds at a constant drying rate,
and liquid content gradually decreases in the entire sample. This period is called the
constant rate period. However, liquid phase removal inevitably comes to a point, when
the system of liquid elements is disrupted and can no longer sustain the effective
transport of the liquid phase and replenish the liquid pool near the surface. At this stage,
vapor transport and possibly film flow become the main transport mechanisms. This
period is called the receding front period. At this stage, mass transport becomes slower,
the drying rate starts to fall, and often a receding drying front occurs, which starts to
move inside the mortar sample. The falling rate period is a crossover period between the
Chapter 1
8
0 5 10 15
0.0
0.2
0.4
0.6
0.8
1.0
V
(cm
3)
tim e(h)
const
ant ra
te p
eriod
falling rate
period
rece
din
g fro
nt period
constant rate period and the receding front period, characterized by a significant drop in
the drying rate.
Fig. 1.3. Typical evolution of total volume of mortar as function of time
In the following subsections, we address various mass transport mechanisms active
during mortar drying, such as, evaporation, suction, water transport and polymer
transport and chemical reactions, such as hydration and carbonation etc.
1.3.2.1 Evaporation
The rate of transport and deposition of additives at the material surface will strongly
depend on the evaporation rate, because, evaporation drives the advection. The
evaporation rate is largely dependent on the climatic conditions, which are given by the
specific environment on the construction site. Typical time scale for evaporation of a
drying mortar is about 10 h. However, the evaporation process will be influenced by the
additives.
1.3.2.2 Water transport in the mortar
The main mechanism for moisture transport in cementitious material is through vapor
diffusion and/or capillary suction, when the pores are in contact with liquid water.
Transport of liquid takes place in the pores, micro-cracks and voids of the concrete. In
addition, the flow properties are depending on several material parameters, like type of
cement based material (Portland cement, pozzolanic, admixtures, impregnation etc), pore
Introduction
9
structure, water to cement ratio (w⁄c‐ratio), initial water content, pre‐treatment or
ageing, drying and temperature/freezing. It in turn may extend the problem into multi-
phase transport. It is therefore a challenge to make a model to predict the motion of the
water in concrete under various types of exposure.
1.3.2.3 Suction of water in substrate and tile
The absorption behavior is influenced by the drying process of mortar as a result of
evaporation, internal moisture flow and hydration. The degree of wetting indicates the
moisture uptake and penetration of glue compounds into the tile, which determine the
adhesion between tile and substrate to a large extent. In addition, the degree of hydration
determines the mechanical strength of glue mortar. Next to the drying effects, the
immediate absorption of water into the tile has significant importance because a
threshold amount of available water is crucial for proper hydration of glue mortar. Liquid
absorption in porous media is a complex process [15, 16, 17]. Most studies focus on the
capillary absorption of water in porous media. The mass of the liquid absorbed per unit
area increases with the square root of the time elapsed until the liquid absorption reaches
the boundary of the material, which may be described by the so-called Washburn
equation. The suction coefficient obtained from fitting the Washburn equation to such
data depends on the physical properties of the liquid and properties of the porous
materials [18, 19, 20].
1.3.2.4 Polymer transport
Transport of solutes like salts and polymers is of paramount importance in building
materials. While the ingress of solutes accompanies the transport of water, there may be
major differences between the water transport and solute transport processes. The
transport of water in porous material is determined by capillary pressure and, therefore,
by pore-size distribution. On contrast, ions are transported via diffusion and advection
with the flow of the water. These processes are described by a diffusion-advection
equation. The competition between advection and diffusion can be characterized by the
Peclet number Pe. The Peclet number is a dimensionless number, being the ratio of
advection and diffusion. For high drying rates (Pe ≥1) advection dominates the ion
transport, whereas for low drying rates (Pe ≤1) diffusion dominates the ion transport.
During mortar drying, polymeric additives and cement particles can be transported
towards the drying surface, where it accumulates and generates a skin. The skin formation
may be influenced by the drying processes of mortar, as a result of evaporation, internal
moisture flow and hydration. Jenni et al. [21] investigated the skin formation of cellulose
ether (CE) and polyvinyl alcohol (PVA) modified mortar during open time and considered
Chapter 1
10
that skin formation is a key factor that determines adhesion. The authors showed that
both organic and inorganic substances can transport toward the drying surface along with
the water flux. Bentz et al. [22] investigated the skin formation and observed the transport
of cellulose ether and small cement particles during drying. Zurbriggen et al. [23]
investigated skin formation by investigating the interface between mortar and a glass
plate to visualize the skin formation. When the glass plate is illuminated from the bottom
side, the location where skin formed and prevented wetting appears dark, whereas the
fresh mortar that wetted the glass appears bright. Gasparo et al. [24] reported a higher
enrichment of CE at the mortar surface and a skin formation at the mortar/air interface.
They suggest that evaporation and corresponding water flow is the reason for the
observed CE enrichment. Unfortunately, their investigation does not provide detailed
explanation of the transport processes.
1.3.2.5 Hydration
Cement is the most important construction material used nowadays as a binder in
different building materials formulations. Portland cements commonly consist of the
inorganic clinker phases, such as tricalcium silicate (C3S), dicalcium silicate (C2S), calcium
aluminate (C3A), and calcium aluminate ferrite (C2(A,F)) [25, 26, 27]. Several components
are added before clinkerization to the Portland cement, e.g., limited amount of calcium
sulfate(CaSO4, which controls the set time), or to the raw material, e.g., Fe2O3, inorder to
optimize the processing window, to accelerate or retard setting, or to obtain improved
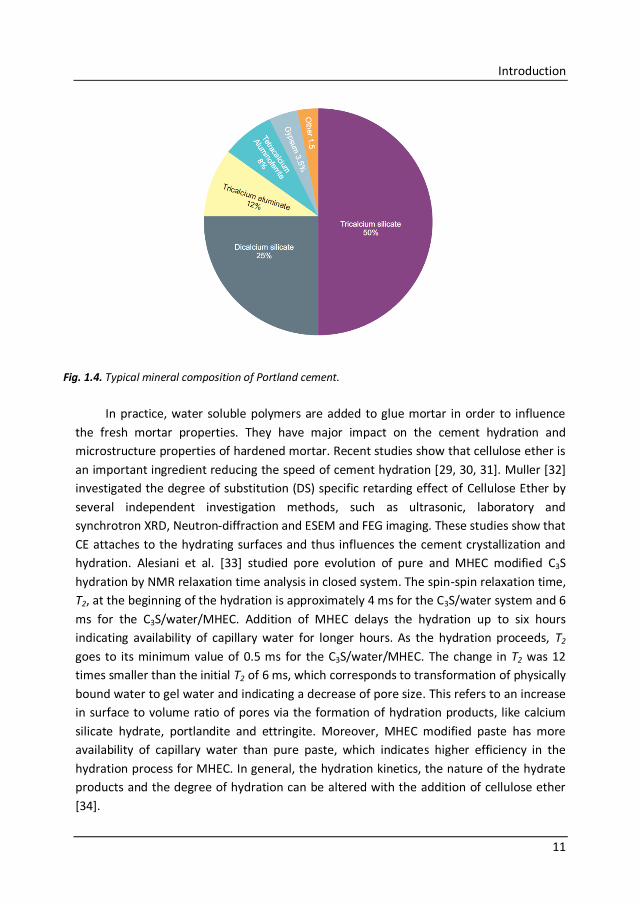
mechanical stability. A typical composition of mineral in Portland cement is given in Fig.
1.4. When water is added to the cement powder, ettringite is formed. The high water
content of ettringite results in an enormous volume increase at the surface of the cement
grains. When the cement paste runs poor in sulfate concentration, monosulfate is formed
by partially consuming the ettringite. The aluminates components react most strongly at
the beginning of the hydration and therefore affect the rheology of the cement slurry and
early strength development. Both C3A and C4AF produce the calcium-aluminate-ferrite
through intermediate metastable reactions. In this way, an inorganic network of calcium
silicate hydrates (CSH), calcium aluminum oxide hydrates (CAH) and calcium aluminate
ferrite hydrates C(A,F)H is formed [28].
Introduction
11
Fig. 1.4. Typical mineral composition of Portland cement.
In practice, water soluble polymers are added to glue mortar in order to influence
the fresh mortar properties. They have major impact on the cement hydration and
microstructure properties of hardened mortar. Recent studies show that cellulose ether is
an important ingredient reducing the speed of cement hydration [29, 30, 31]. Muller [32]
investigated the degree of substitution (DS) specific retarding effect of Cellulose Ether by
several independent investigation methods, such as ultrasonic, laboratory and
synchrotron XRD, Neutron-diffraction and ESEM and FEG imaging. These studies show that
CE attaches to the hydrating surfaces and thus influences the cement crystallization and
hydration. Alesiani et al. [33] studied pore evolution of pure and MHEC modified C3S
hydration by NMR relaxation time analysis in closed system. The spin-spin relaxation time,
T2, at the beginning of the hydration is approximately 4 ms for the C3S/water system and 6
ms for the C3S/water/MHEC. Addition of MHEC delays the hydration up to six hours
indicating availability of capillary water for longer hours. As the hydration proceeds, T2
goes to its minimum value of 0.5 ms for the C3S/water/MHEC. The change in T2 was 12
times smaller than the initial T2 of 6 ms, which corresponds to transformation of physically
bound water to gel water and indicating a decrease of pore size. This refers to an increase
in surface to volume ratio of pores via the formation of hydration products, like calcium
silicate hydrate, portlandite and ettringite. Moreover, MHEC modified paste has more
availability of capillary water than pure paste, which indicates higher efficiency in the
hydration process for MHEC. In general, the hydration kinetics, the nature of the hydrate
products and the degree of hydration can be altered with the addition of cellulose ether
[34].
Chapter 1
12
1.3.2.6 Carbonation
Carbonation is a well-known neutralization reaction, where carbon dioxide in the
environment reacts with the calcium hydroxide in the cement paste, while producing
calcium carbonate. The reaction of carbon dioxide and calcium hydroxide primarily occurs
in solution. Thus in very dry concrete, carbonation will be slow. The most favorable
condition for the carbonation reaction is when there is sufficient moisture for the
reaction. Too much moisture content may prevent carbonation as water may act as a
barrier. Usually, carbonation is described as a long-term process at and near the surface of
cementitious materials in contact with air, where substantial amounts of cementitious
phases are converted. However, to form a micron-thin skin at the surface of a freshly
applied mortar, only minutes are required [35]. With continued drying of the surface, the
carbonation reaction is slowed down. As the drying front recedes inside the mortar, the
carbonation front is migrating into the material. The potential of CO2 to induce
carbonation will depend on its ability to access the pore system of the material through
emptied pores.
1.4 Understanding the open time of glue mortar
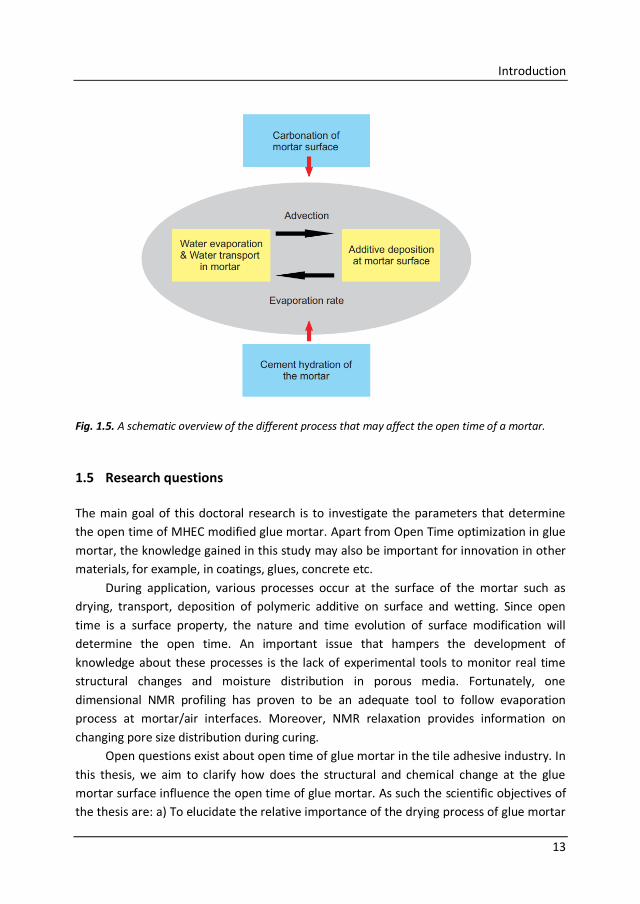
After having introduced the drying of mortar, it is clear that many processes are at play. A
schematic overview of the different processes that may affect the open time of a mortar is
given in Fig. 1.5. In summary, three mechanisms seem to play an important role in
modifying the surface region of the MHEC modified mortar: 1) The formation of a dry zone
near the mortar surface due to evaporation of water. 2) The transport to and deposition
at the mortar surface of (polymeric) additives, which may lead to sealing the mortar. 3)
Structural re-arrangements of the surface region due to the formation of hydrates and
carbonates. Although, one can distinguish these three processes separately, to some
extent they are coupled in the drying process, see Fig. 1.5.
The evaporation rate is largely depending on the environmental conditions, such as
relative humidity, air speed and temperature. The flow of water causes transport and
enrichment of polymers and cementitious ions at the drying front, which promote early
precipitations as hydrates and carbonates. The flow rate of mortar water can be
controlled by pre-treatment of substrate before application, or by adjusting the mortar
formulations. As illustrated in Fig. 1.5, the central issue is the moisture migration during
water evaporation and the transport and deposition of polymeric additives at the drying
surface. These two processes have a purely physical origin and may not be considered
uncoupled. Additionally, two chemical processes, being cement hydration and
carbonation will have significant influence on open time.
Introduction
13
Fig. 1.5. A schematic overview of the different process that may affect the open time of a mortar.
1.5 Research questions
The main goal of this doctoral research is to investigate the parameters that determine
the open time of MHEC modified glue mortar. Apart from Open Time optimization in glue
mortar, the knowledge gained in this study may also be important for innovation in other
materials, for example, in coatings, glues, concrete etc.
During application, various processes occur at the surface of the mortar such as
drying, transport, deposition of polymeric additive on surface and wetting. Since open
time is a surface property, the nature and time evolution of surface modification will
determine the open time. An important issue that hampers the development of
knowledge about these processes is the lack of experimental tools to monitor real time
structural changes and moisture distribution in porous media. Fortunately, one
dimensional NMR profiling has proven to be an adequate tool to follow evaporation
process at mortar/air interfaces. Moreover, NMR relaxation provides information on
changing pore size distribution during curing.
Open questions exist about open time of glue mortar in the tile adhesive industry. In
this thesis, we aim to clarify how does the structural and chemical change at the glue
mortar surface influence the open time of glue mortar. As such the scientific objectives of
the thesis are: a) To elucidate the relative importance of the drying process of glue mortar
Chapter 1
14
in presence of MHEC. b) What is the influence of MHEC on the pore evolution and
hydration characteristics of glue mortar c) To determine the typical time scale of
evaporation and hydration of mortar, and to identify the dominant factor d) To investigate
MHEC transport towards the drying surface, and the effect of pore size on the transport of
MHEC e) To determine the influence of MHEC on the water absorption process of a
substrate and tile and the effect of humidity and air flow on the wetting and adhesion
process of glue mortar.
It is crucial to understand the water/polymer transport, hydration of mortar and the
wetting characteristics of porous materials in presence of MHEC. The exact processes that
influence Open Time are not yet studied.
1.6 Outline of the thesis
In Chapter 2 of this thesis, the basic principles of NMR are briefly discussed. In Chapter 3,
the drying of high viscous MHEC solution inside a fired clay brick is investigated in order to
understand the influence of viscosity, surface tension and contact angle on the drying
process. A drying model is developed to describe the observed drying process. In Chapter
4, we focus on understanding the effect of MHEC on the evaporation and hydration
characteristics of glue mortar. This study permits to differentiate the time scale of
evaporation and hydration of glue mortar and also the effect of MHEC on the hydration
characteristics of sealed and unsealed mortar. In Chapter 5, we discuss the transport of
MHEC during drying in a model porous medium saturated with MHEC solution. Model
porous media with different pore size are investigated to understand the influence of pore
size on drying process in presence of MHEC and transport behavior of MHEC. In Chapter 6,
the influence of MHEC on the moisture uptake from mortar to tile and substrate is
investigated. This study helped to understand the MHEC viscosity and drying induced
transport on moisture uptake and the wettability of mortar between substrate and tile.
Finally, In Chapter 7, general conclusions and outlook of further research are presented.
Introduction
15
References
1. Ancient Bricks, Aurangzeb Khan. Retrieved 2013-02-16.
2. J. Elsen, Microscopy of historic mortar- A review, Cement and Concrete Research, 36
(2006) 1416-1424 .
3. Introduction to Mortars CEMEX Corporation.
4. S. Chandra, Y. Ohama. Polymers in concrete 1994, CRC Press, Boca Raton, USA.
5. O. P. Jaggi, History of science and technology in India, Volume 1, Atma Ram, 1969.
6. Fred S. Kleiner, Gardner's Art Through The Ages, A Global History. p.357. ISBN 978-0-
495-41059-1.
7. T. Buhler, R. Zurbriggen, U. Pieles, L. Huwiler, R.A. Raso, Dynamics of early skin
formation of tiling mortars investigated by microscopy and diffuse reflectance
infrared Fourier transformed spectroscopy, Cement and Concrete Composites, 37
(2013) 161-170.
8. E. V. Deutsche Bauchemie, Modified Mineral Mortar Systems and the Environment,
1998, www.deutsche-bauchemie.de
9. E. V. Deutsche Bauchemie, Concrete Admixtures and the Environment, 1999,
www.deutsche-bauchemie.de
10. U.S. Department of Transportation, Federal Highway administration, Set-Acceleration,
1999, www.fhwa.dot.gov.
11. J. Rottsteggea, M. Arnolda, L. Herschkea, G. Glassera, M. Wilhelma, H. W. Spiessa, W.
D. Hergethb, Solid state NMR and LVSEM studies on the hardening of latex modified
tile mortar systems, Cement and Concrete Research 35 (2005) 2233–2243.
12. C. Clasen, W. M. kulicke, Determination of viscoelastic and rheo optical material
functions of water soluble cellulose derivatives, Prog. Polym. Sci, 26 (2001) 1839-
1919.
13. Yoshihiko Ohama, Polymer-based Admixtures, Cement and Concrete Composites 20
(1998) 189-212.
14. A. S. Mujumdar, 2007. Handbook of Industrial Drying, third ed. Taylor and Francis,
Philadelphia.
15. E. W. Washburn, The dynamics of capillary flow, Physical Review, 17 (1921) 273-283.
16. A. Escardino, V. Beltran, A. Barba, E. Sanchez, Liquid suction be porous ceramic
materials. Influence of firing condition, British Ceramic Transactions, 98 (1999) 225-
229.
17. C. Hall, W. D. Hoff, S. C. Taylor, P. Meredith, A. M, Donald, Water anomaly in capillary
liquid absorption by cement-based materials, Journal of Material Science Letters, 14
(1995) 1178-1181.
18. M. Raimondo, M. Dondi, D. Guarini, F. Mazzanti, Predicting the initial rate of water
absorption in clay bricks, Construction and building material, 23 (2009) 2623-2630.
Chapter 1
16
19. V. Beltran, A. Barba, M. D. Rodrigo, A. Escardino, Liquid suction by porous ceramic
material.3-Influence of the nature of the composition and the preparation method of
the pressing powder, Br Ceram Trans J, 88 (1989) 219-222.
20. V. Beltran, A. Barba, J. C. Jarque, A. Escardino, Liquid suction by porous ceramic
material.2-Influence of pressing condition. Br Ceram Trans J, 90 (1991) 77-80.
21. A. Jenni, L. Holzer, R. Zurbriggen, M. Herwegh, Influence of polymers on
microstructure and adhesive strength of cementitious tile adhesive mortars, Cement
and Concrete Research, 35 (2005) 35–50.
22. D. P. Bentz, C-J. Haecker, M. A. Peltz, K. A. Snyder, X-Ray Absorption Studies of Drying
of Cementitious Tile Adhesive Mortar, Cement and Concrete Composites, 30 (2008)
361-373.
23. R. Zurbriggen, M. Herwegh, U. Pieles, Th. Buhler, L. Huwiler, A new laboratory method
to investigate skin formation and open time performance, Dry mix Mortar Yearbook,
idmmc three, Nuremberg, 3 (2011) 28-29.
24. De Gasparo, M. Herwegh, R. Zurbriggen, K. Scrivener, Quantitative distribution
patterns of additives in self-leveling flooring compounds (underlayments) as function
of application, formulation and climatic conditions, Cement and Concrete Research,
39 (2009) 313–323.
25. Taylor H. F. W. Cement chemistry. 2nd ed. London: Telford Publishing; 1997.
26. J. Benstedt, P. Barnes, Structure and performance of cements. London: Spon Press;
2002.
27. Bever M. B. 1st ed. Encyclopedia of materials science and engineering, vol. 1. Oxford:
Pergamon Press; 1986. p. 566f.
28. J. Rottstegge, M. Wilhelm, H. W. Spiess, Solid state NMR investigations on the role of
organic admixtures on the hydration of cement pastes, Cement & Concrete
Composites 28 (2006) 417–426.
29. Schwamborn, M. Fiebrich, Polymers in Concrete, Proceedings of the 7th International
Congress on Polymers in Concrete, pp. 250-264, BETECOM, Moscow, 1992.
30. J. Pourchez, P. Grosseau, R. Guyonnet, B. Ruot, HEC influence on cement hydration
measured by conductometry, Cem. Concr. Res. 36 (2006) 1777–1780.
31. Thomas Poinot, Alexandre Govin, PhilippeGrosseau, Impact of hydroxypropylguars on
the early age hydration of Portland cement, Cement and Concrete Research, 44 (
2013) 69-76.
32. I. Muller, Influence of cellulose ethers on the kinetics of early Portland cement
hydration. PhD thesis, Inst. F. Min. Wilhems-Universitet Muenster, ISSN 1618-2677,
2006.
33. M. Alesiani, S. Capuani, R. Giorgi, B. Maraviglia, I. Pirazzoli, F. Ridi, P. Baglioni, J. Phys.
Chem. B, 108 (2004) 4869–4874.
Introduction
17
34. E. Knapen, Microstructure formation in cement mortar modified with water soluble
polymers, PhD thesis, ISBN-978-90-5682-889-9.
35. Th. Bühler, R. Zurbriggen, U. Pieles, L. Huwiler, R. A. Raso, Dynamics of early skin
formation of tiling mortars investigated by microscopy and diffuse reflectance
infrared Fourier transformed spectroscopy, Cement & Concrete Composites 37 (2013)
161–170.

18
Imaging of drying phenomena
19
Chapter 2
Imaging of drying phenomena
2 Imaging of drying phenomena
2.1 Introduction
Nuclear magnetic resonance was first observed in 1946 by scientists Felix Bloch and
Edward Purcell [1, 2, 3] at Stanford and Harvard Universities, respectively. During 1950
and 1970, NMR was developed further by the introduction of the Fourier transformation
by R. Ernst, 1966 [4], and by the extension of the NMR spectrum to more than one
frequency coordinate, called multidimensional NMR [5]. In 1973, Mansfeld and Grannell
[6] and independently Lauterbur [7], obtained the first magnetic resonance images using
linear gradient fields.
The first pulsed NMR spectrometer became available in the 1970s. Since then, there
has been a rapid growth in the number of NMR applications. The development of Nuclear
Magnetic Resonance Imaging (MRI) added a new aspect to NMR, namely image formation,
allowing the spatially resolved measurement of any selected part (volume, slice etc.) of
the system under observation. Today, NMR has become a sophisticated and powerful
analytical technique that has found a variety of application in many disciplines of scientific
research, medicine, and in various industries.
2.2 Application of NMR
Application of NMR can be found in different fields of medicine, chemistry, physics and
materials science. Magnetic Resonance Imaging (MRI) is one of the most valuable clinical
diagnostic tools in health care today. MRI employs the underlying principles of Nuclear
Magnetic Resonance (NMR) to image molecules and biological materials. With a patient
placed in the whole-body compartment of an MRI system, magnetic resonance signals
from hydrogen nuclei at specific locations in the body can be detected and used to
construct an image of the interior structure of the body. These images may reveal physical
abnormalities and thereby aid in the diagnosis of injury and disease.
Nuclear Magnetic Resonance is an important tool in chemical analysis. As the name
implies, it uses the spin magnetic moments of nuclei (particularly hydrogen) and resonant
excitation. By studying the peaks of nuclear magnetic resonance spectra, chemists can
determine the structure of many compounds. It can be a very selective technique,
Chapter 2
20
distinguishing many bonds within a molecule or collection of molecules of the same type,
but which differ only in terms of their local chemical environment. NMR spectroscopy is
used to unambiguously identify known and novel compounds, and as such, is usually
applied for identity confirmation of synthesized new compounds.
Nuclear Magnetic Resonance (NMR) is a unique tool for characterizing fluid and flow
in permeable media, in a non-invasive and non-destructive manner with high spatial and
time resolution [8, 9].NMR is a well established method for fast and accurate moisture
determination in technical materials such as concrete, wood and polymers. One
dimensional profiling is adequate to follow the water transport processes in building
materials. By imaging the water content distribution, it is possible to analyze the actual
moisture situation in detail. Due to the fact that NMR images can be acquired very rapidly,
it is possible to monitor time-dependent processes as absorption/desorption and
migration of moisture during capillary flow and drying.
Nuclear magnetic relaxation methods offer a variety of opportunities for
characterizing the molecular dynamics in confined environments, such as high surface
area materials including biological tissues, chromatographic supports, heterogeneous
catalytic materials, plaster, cements and natural microporous materials, such as clay
minerals and rocks. The magnetic field dependence of the nuclear spin relaxation rate
provides a good test of the theories that relate the measurement to the micro-dynamical
behavior of the liquid. NMR relaxation provides information about changing pore size
distribution during curing. The measured relaxation time of water in a pore can be related
to pore size.
The aim of this Chapter is to give an overview of the NMR principles, the pulse
sequences and the arrangement of NMR set-up used in the experiments and the state of
art of the application of NMR in cementitious materials. For more detailed information
about NMR, we refer to the book “Principles of Magnetic Resonance” *10+.
2.3 NMR Imaging
2.3.1 NMR principle
Almost all nuclei have a magnetic dipole moment, resulting from their spin angular
momentum. When a nucleus with a net nuclear magnetic moment (such as 1H, 23Na, 35Cl, 19F and 6Li etc.) is placed in an external magnetic field B0 the moment precesses at a
certain resonance frequency, called the Larmor frequency, 𝜔𝑙 and depends on the
magnetic field strength,
𝜔𝑙 = 𝛾𝐵0 , (2.1)
where 𝛾 is the gyromagnetic ratio of the nuclei ( 𝛾 2𝜋 = 42.58 MHz/T for hydrogen
nuclei), and B0 the magnetic field strength. It is possible to measure selectively different
Imaging of drying phenomena
21
nuclei by changing the frequency of the NMR measurements to match a specific Larmor
frequency.
The sum of all individual magnetic moments is called the net macroscopic
magnetization M0. In equilibrium, the net magnetization is aligned parallel (longitudinal
magnetization) to B0. The net magnetization can be manipulated by applying an oscillating
magnetic field 𝐵1 corresponding to the resonance frequency, 𝜔𝑙 of the nuclei. A so-called
900 RF pulse will rotate the magnetization by 900 from the z-axis (parallel to B0) in to the
xy-plane. The magnetization in the xy-plane is called the transverse magnetization (Mxy). It
will continue to rotate in the xy-plane at the Larmor frequency. The rotating
magnetization will generate an induction in RF pick up coil. The relaxation processes will
restore the magnetization to its equilibrium value.
The intensity of the resulting spin echo signal is proportional to the density of the
magnetic moments and thus the hydrogen or water concentration at different positions.
Besides the proton density also information about the interaction of the spins can be
obtained. The interaction can be measured by measuring the signal decay in NMR
experiments, using a Carr-Purcell-Meiboom-Gill (CPMG) pulse sequence. In principle the
spin echo signal decay is the sum of different exponential components (of which the
origins will be explained in the next paragraph) and is given by:
𝑆 𝑛𝑡𝑒 = 𝑆𝑖𝑚𝑖=1 e−𝑛𝑡𝑒/𝑇2
𝑖, (2.2)
where 𝑆𝑖 the intensity of the signal at t=0 corresponding to a spin-spin relaxation time 𝑇2𝑖
of the total amount of exponential components𝑚, te represents the echo time (which
equals the inter pulse spacing) and 𝑛 the nth echo.
2.3.2 Sensitivity and the Boltzmann Equation
When a group of spins is placed in a magnetic field, each spin aligns in one of the two
possible orientations. The extent to which one orientation (energy state) is favored over
the other depends on the strength of the small nuclear magnet (proportional to
gyromagnetic ratio) and the strength of the strong magnetic field Bo in which it is placed.
The distribution of nuclei in the different energy states (i.e., orientations of nuclear
magnets) under conditions in which the nuclear spin system is unperturbed by application
of any RF energy is given by the Boltzmann equation:
𝑁+
𝑁− = 𝑒−ℎ𝑣 𝑘𝑇 (2.3)
where N+ and N- represent the population (i.e., number) of nuclei in upper and lower
energy states, respectively, k is the Boltzmann constant, and T is the absolute temperature
(K). The small population difference presents a significant sensitivity problem for NMR
Chapter 2
22
because only the difference in populations is detected; the others effectively cancel one
another. The inherent low sensitivity of NMR is probably its greatest limitation for
applications to biological systems. The use of stronger magnetic fields will increase the
population ratio and, consequently, the sensitivity.
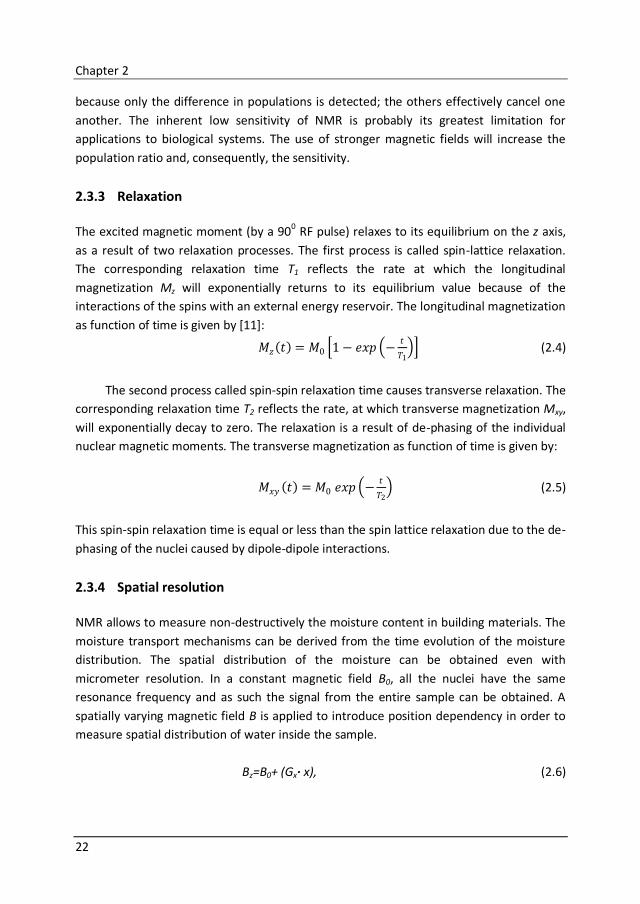
2.3.3 Relaxation
The excited magnetic moment (by a 900 RF pulse) relaxes to its equilibrium on the z axis,
as a result of two relaxation processes. The first process is called spin-lattice relaxation.
The corresponding relaxation time T1 reflects the rate at which the longitudinal
magnetization Mz will exponentially returns to its equilibrium value because of the
interactions of the spins with an external energy reservoir. The longitudinal magnetization
as function of time is given by [11]:
𝑀𝑧 𝑡 = 𝑀0 1 − 𝑒𝑥𝑝 −𝑡
𝑇1 (2.4)
The second process called spin-spin relaxation time causes transverse relaxation. The
corresponding relaxation time T2 reflects the rate, at which transverse magnetization Mxy,
will exponentially decay to zero. The relaxation is a result of de-phasing of the individual
nuclear magnetic moments. The transverse magnetization as function of time is given by:
𝑀𝑥𝑦 𝑡 = 𝑀0 𝑒𝑥𝑝 −𝑡
𝑇2 (2.5)
This spin-spin relaxation time is equal or less than the spin lattice relaxation due to the de-
phasing of the nuclei caused by dipole-dipole interactions.
2.3.4 Spatial resolution
NMR allows to measure non-destructively the moisture content in building materials. The
moisture transport mechanisms can be derived from the time evolution of the moisture
distribution. The spatial distribution of the moisture can be obtained even with
micrometer resolution. In a constant magnetic field B0, all the nuclei have the same
resonance frequency and as such the signal from the entire sample can be obtained. A
spatially varying magnetic field B is applied to introduce position dependency in order to
measure spatial distribution of water inside the sample.
Bz=B0+ (Gx· x), (2.6)
Imaging of drying phenomena
23
where Gx is the magnetic field gradient and x the position. This enables in-situ monitoring
of moisture content at different positions in the sample since the resonance frequency
varies as a function of position.
2.3.5 NMR Pulse sequence
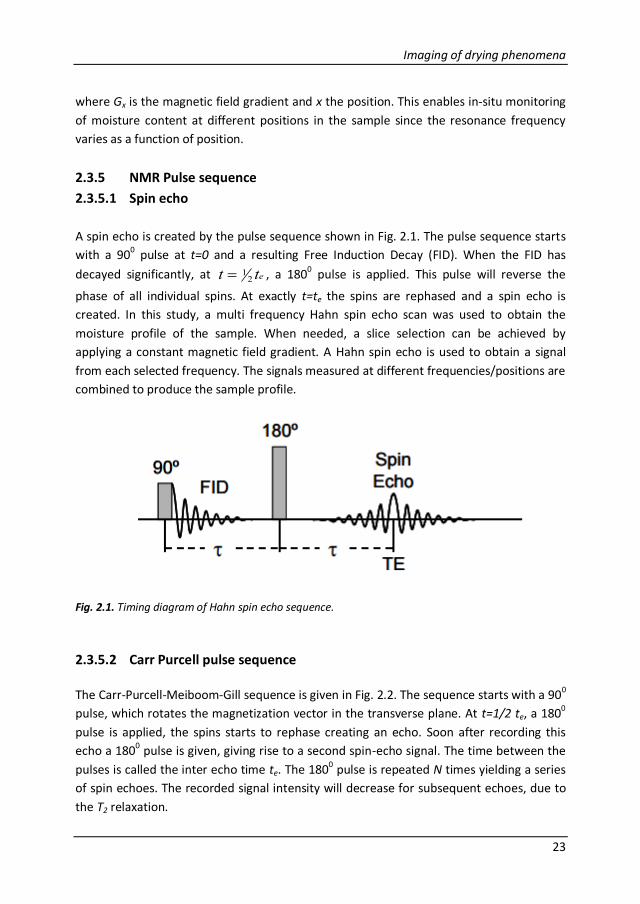
2.3.5.1 Spin echo
A spin echo is created by the pulse sequence shown in Fig. 2.1. The pulse sequence starts
with a 900 pulse at t=0 and a resulting Free Induction Decay (FID). When the FID has
decayed significantly, at ett 21 , a 180
0 pulse is applied. This pulse will reverse the
phase of all individual spins. At exactly t=te the spins are rephased and a spin echo is
created. In this study, a multi frequency Hahn spin echo scan was used to obtain the
moisture profile of the sample. When needed, a slice selection can be achieved by
applying a constant magnetic field gradient. A Hahn spin echo is used to obtain a signal
from each selected frequency. The signals measured at different frequencies/positions are
combined to produce the sample profile.
Fig. 2.1. Timing diagram of Hahn spin echo sequence.
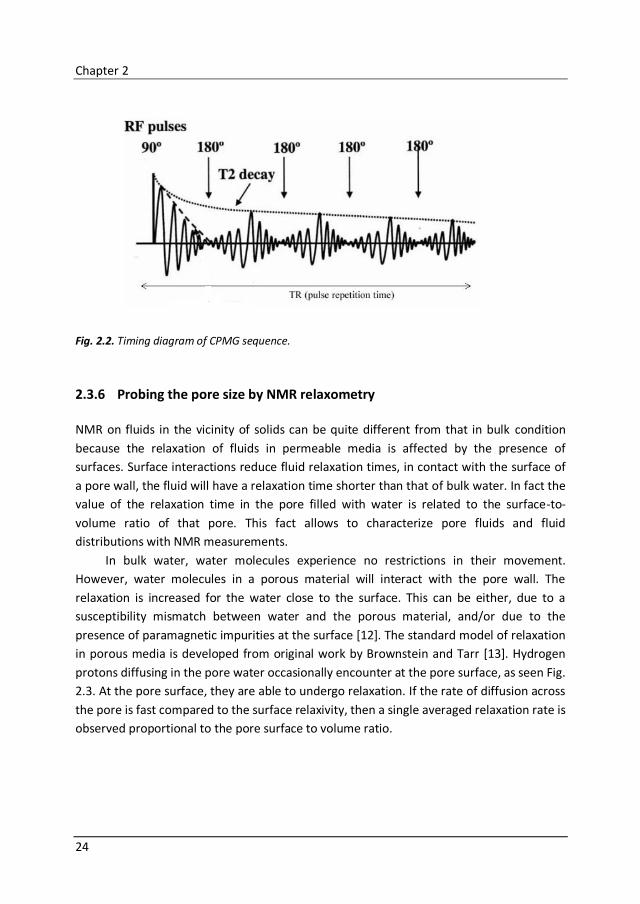
2.3.5.2 Carr Purcell pulse sequence
The Carr-Purcell-Meiboom-Gill sequence is given in Fig. 2.2. The sequence starts with a 900
pulse, which rotates the magnetization vector in the transverse plane. At t=1/2 te, a 1800
pulse is applied, the spins starts to rephase creating an echo. Soon after recording this
echo a 1800 pulse is given, giving rise to a second spin-echo signal. The time between the
pulses is called the inter echo time te. The 1800 pulse is repeated N times yielding a series
of spin echoes. The recorded signal intensity will decrease for subsequent echoes, due to
the T2 relaxation.
Chapter 2
24
Fig. 2.2. Timing diagram of CPMG sequence.
2.3.6 Probing the pore size by NMR relaxometry
NMR on fluids in the vicinity of solids can be quite different from that in bulk condition
because the relaxation of fluids in permeable media is affected by the presence of
surfaces. Surface interactions reduce fluid relaxation times, in contact with the surface of
a pore wall, the fluid will have a relaxation time shorter than that of bulk water. In fact the
value of the relaxation time in the pore filled with water is related to the surface-to-
volume ratio of that pore. This fact allows to characterize pore fluids and fluid
distributions with NMR measurements.
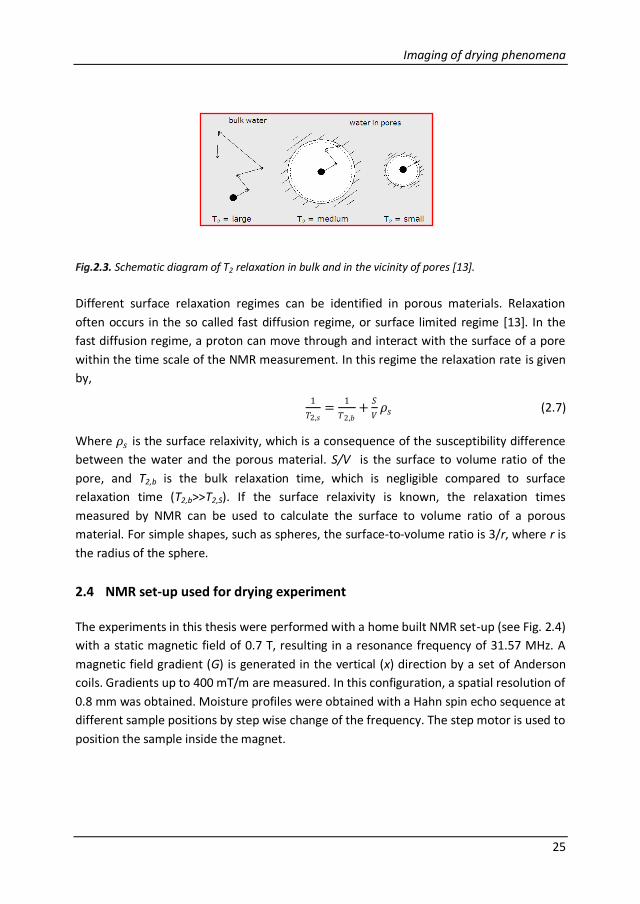
In bulk water, water molecules experience no restrictions in their movement.
However, water molecules in a porous material will interact with the pore wall. The
relaxation is increased for the water close to the surface. This can be either, due to a
susceptibility mismatch between water and the porous material, and/or due to the
presence of paramagnetic impurities at the surface [12]. The standard model of relaxation
in porous media is developed from original work by Brownstein and Tarr [13]. Hydrogen
protons diffusing in the pore water occasionally encounter at the pore surface, as seen Fig.
2.3. At the pore surface, they are able to undergo relaxation. If the rate of diffusion across
the pore is fast compared to the surface relaxivity, then a single averaged relaxation rate is
observed proportional to the pore surface to volume ratio.
Imaging of drying phenomena
25
Fig.2.3. Schematic diagram of T2 relaxation in bulk and in the vicinity of pores [13].
Different surface relaxation regimes can be identified in porous materials. Relaxation
often occurs in the so called fast diffusion regime, or surface limited regime [13]. In the
fast diffusion regime, a proton can move through and interact with the surface of a pore
within the time scale of the NMR measurement. In this regime the relaxation rate is given
by,
1
𝑇2,𝑠=
1
𝑇2,𝑏+
𝑆
𝑉𝜌𝑠 (2.7)
Where 𝜌𝑠 is the surface relaxivity, which is a consequence of the susceptibility difference
between the water and the porous material. S/V is the surface to volume ratio of the
pore, and T2,b is the bulk relaxation time, which is negligible compared to surface
relaxation time (T2,b>>T2,S). If the surface relaxivity is known, the relaxation times
measured by NMR can be used to calculate the surface to volume ratio of a porous
material. For simple shapes, such as spheres, the surface-to-volume ratio is 3/r, where r is
the radius of the sphere.
2.4 NMR set-up used for drying experiment
The experiments in this thesis were performed with a home built NMR set-up (see Fig. 2.4)
with a static magnetic field of 0.7 T, resulting in a resonance frequency of 31.57 MHz. A
magnetic field gradient (G) is generated in the vertical (x) direction by a set of Anderson
coils. Gradients up to 400 mT/m are measured. In this configuration, a spatial resolution of
0.8 mm was obtained. Moisture profiles were obtained with a Hahn spin echo sequence at
different sample positions by step wise change of the frequency. The step motor is used to
position the sample inside the magnet.
Chapter 2
26
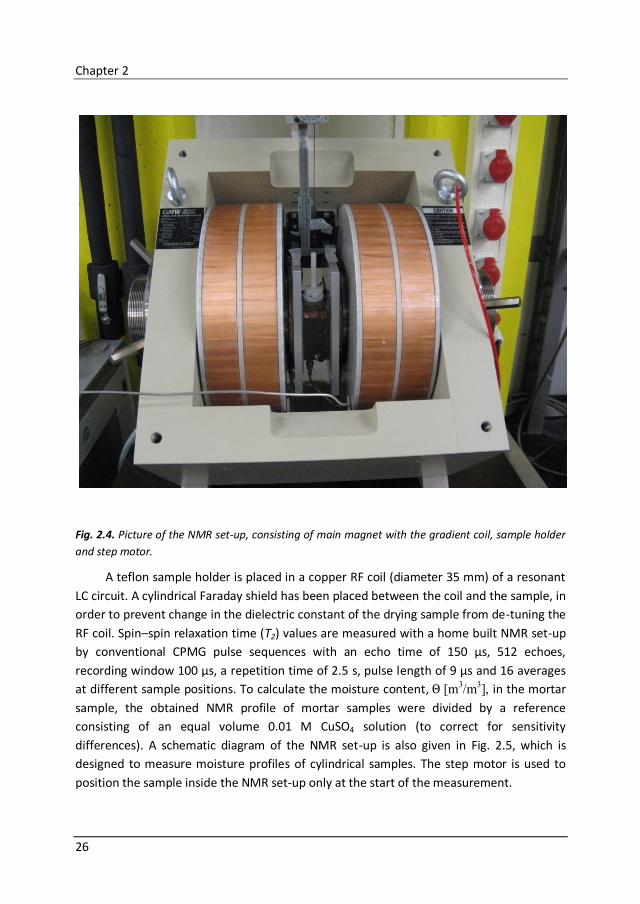
Fig. 2.4. Picture of the NMR set-up, consisting of main magnet with the gradient coil, sample holder
and step motor.
A teflon sample holder is placed in a copper RF coil (diameter 35 mm) of a resonant
LC circuit. A cylindrical Faraday shield has been placed between the coil and the sample, in
order to prevent change in the dielectric constant of the drying sample from de-tuning the
RF coil. Spin–spin relaxation time (T2) values are measured with a home built NMR set-up
by conventional CPMG pulse sequences with an echo time of 150 µs, 512 echoes,
recording window 100 µs, a repetition time of 2.5 s, pulse length of 9 µs and 16 averages
at different sample positions. To calculate the moisture content, Θ [m3/m3], in the mortar
sample, the obtained NMR profile of mortar samples were divided by a reference
consisting of an equal volume 0.01 M CuSO4 solution (to correct for sensitivity
differences). A schematic diagram of the NMR set-up is also given in Fig. 2.5, which is
designed to measure moisture profiles of cylindrical samples. The step motor is used to
position the sample inside the NMR set-up only at the start of the measurement.

Imaging of drying phenomena
27
Fig. 2.5. A schematic diagram of the NMR set-up used for measuring moisture profiles and T2
relaxation times [13].
2.5 NMR in porous media
There is a strong interest in the direct and non-invasive measurement of transport process
in (micro) porous system, like cement, to understand processes in porous materials.
Specifically for this thesis there is an interest to measure the water transport, additive
transport, and cement hydration as a function of time and position. In this section, we
wish to demonstrate the value of NMR to image drying and hydration processes in
cement. Drying of cement based material can also be studied by means of various
techniques: synchrotron X-ray tomography, ultrasound, electrical conductivity, calorimetry
and MIP etc. However, these techniques only follow single parameters such as water
content, hardening, setting phase and hydration advancement, pore size and so on. The
traditional techniques available for characterizing water content and transport in cement
are largely inadequate, because they are either destructive or invasive. Nuclear magnetic
resonance (NMR) provides a non-invasive way of following water transport and cement
hydration processes. In the following subsection, we will respectively show the value of
NMR imaging to unravel transport processes, and NMR relaxation analysis for cement
hydration studies.
2.5.1 NMR imaging of porous media
MRI can provide useful information about the various aspects of mass transport in porous
materials. Especially drying is an important process, as drying is widely found in a broad
variety of porous and non-porous materials. Some materials, such as calcined ceramics,
Chapter 2
28
-2 0 2 4 6 8 10 120.00
0.05
0.10
0.15
0.20
0.25
0.30
0.35
(m3m-3)
X(mm)
Top Bottom
a
pre-dried concrete, porous rocks, etc., represent rigid matrices with an intrinsic porous
space structure, which have little modification upon the removal of a liquid phase. Some
drying processes involve chemical and/or structural changes, such as in case of hardening
of cementitious materials, solidification of polymeric film coatings and paints. In some
situations (e.g., curing and hydration of cement) a fluid may not actually leave the sample.
Specifically in case of cement mortar, the amount of moisture that evaporates during
drying of mortar is smaller than the amount of water that becomes a part of the cured
mortar as a result of the formation of hydrates and the gel phase. In principle, NMR can
follow different aspects of these processes. The most straightforward is one-dimensional
imaging of the evaporation process.
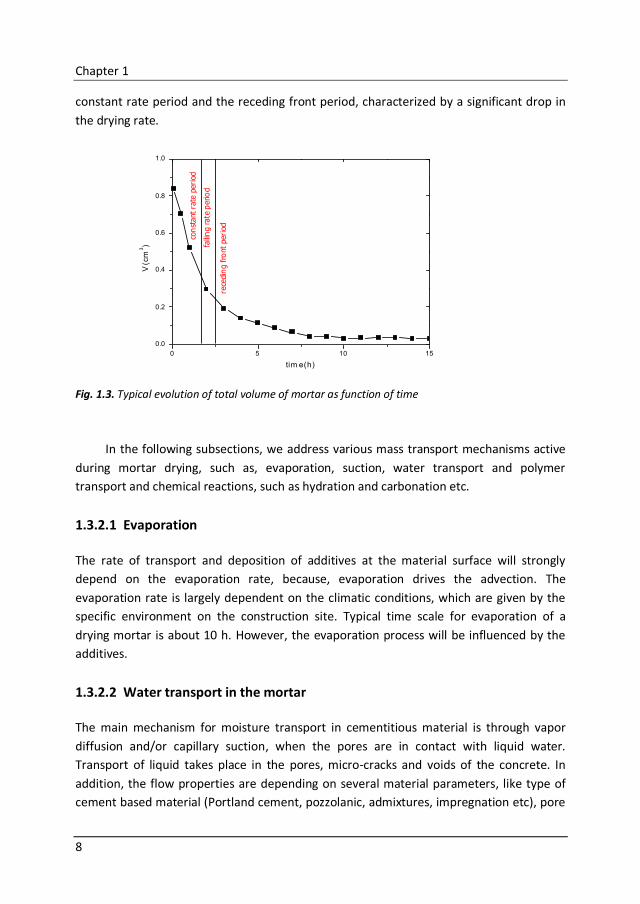
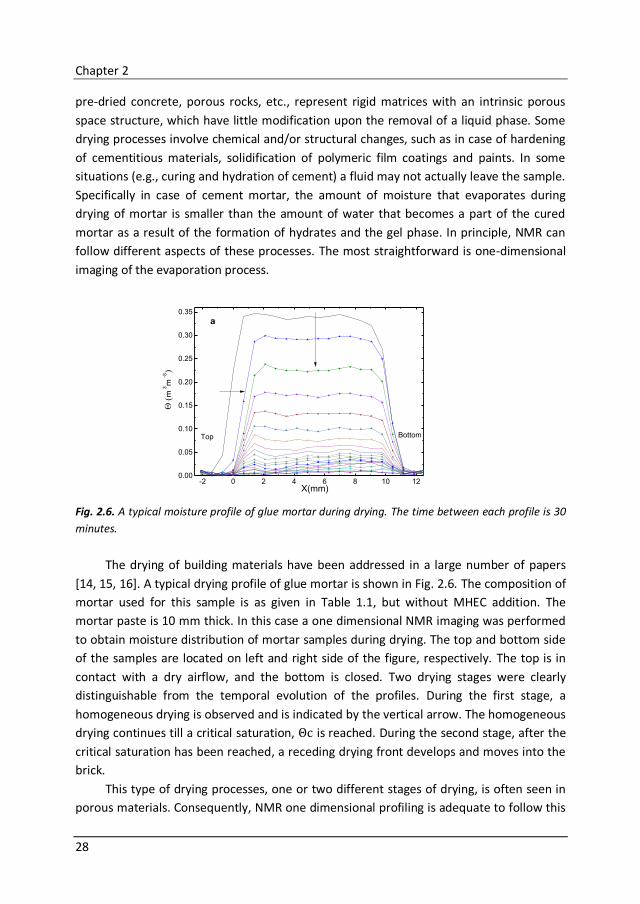
Fig. 2.6. A typical moisture profile of glue mortar during drying. The time between each profile is 30
minutes.
The drying of building materials have been addressed in a large number of papers
[14, 15, 16]. A typical drying profile of glue mortar is shown in Fig. 2.6. The composition of
mortar used for this sample is as given in Table 1.1, but without MHEC addition. The
mortar paste is 10 mm thick. In this case a one dimensional NMR imaging was performed
to obtain moisture distribution of mortar samples during drying. The top and bottom side
of the samples are located on left and right side of the figure, respectively. The top is in
contact with a dry airflow, and the bottom is closed. Two drying stages were clearly
distinguishable from the temporal evolution of the profiles. During the first stage, a
homogeneous drying is observed and is indicated by the vertical arrow. The homogeneous
drying continues till a critical saturation, Θc is reached. During the second stage, after the
critical saturation has been reached, a receding drying front develops and moves into the
brick.
This type of drying processes, one or two different stages of drying, is often seen in
porous materials. Consequently, NMR one dimensional profiling is adequate to follow this
Imaging of drying phenomena
29
drying process. The total magnetization determined from the NMR echo signal intensity is
a direct measure of the amount of water present. In these plots it becomes very difficult
to distinguish between evaporated water, or water incorporated in the hydrated material.
Therefore, we need to further analyze the NMR signal, to see if this can be distinguished
directly. In some cases, it would work by performing measurements in both open and
closed conditions, to distinguish the two processes (evaporation and chemical reaction). In
the following section, we address the use of NMR on studying the microstructure
development and the cement hydration processes during mortar curing.
2.5.2 NMR on cement hydration
Nuclear magnetic resonance (NMR) provides non-destructive ways of following the
hydration process of concrete products. The rate of hydration and the formation of the
pore structure can be followed by measurement of nuclear spin relaxation times.
Specifically, the NMR relaxation can even be followed as a function of position. Among the
numerous relaxation parameters that can be quantified by NMR, the spin-spin relaxation
parameter (T2) has been employed for the analysis of water in cement pastes and mortars.
The T2 relaxes in pore as function of time. The measurement of T2 relaxation times
provides information on the microstructure evolution during cement hydration. One of
the most important challenges in cement science is to understand the pore structure and
how it affects the physical properties. Porosity is one of the most important characteristics
of cement pastes. In cements, the pore size extends over a wide range, from macropores
to micropores.
NMR relaxation measurements distinguish different relaxation components from
hydrated cement paste, which belongs to different pore size. Cement hydration via NMR
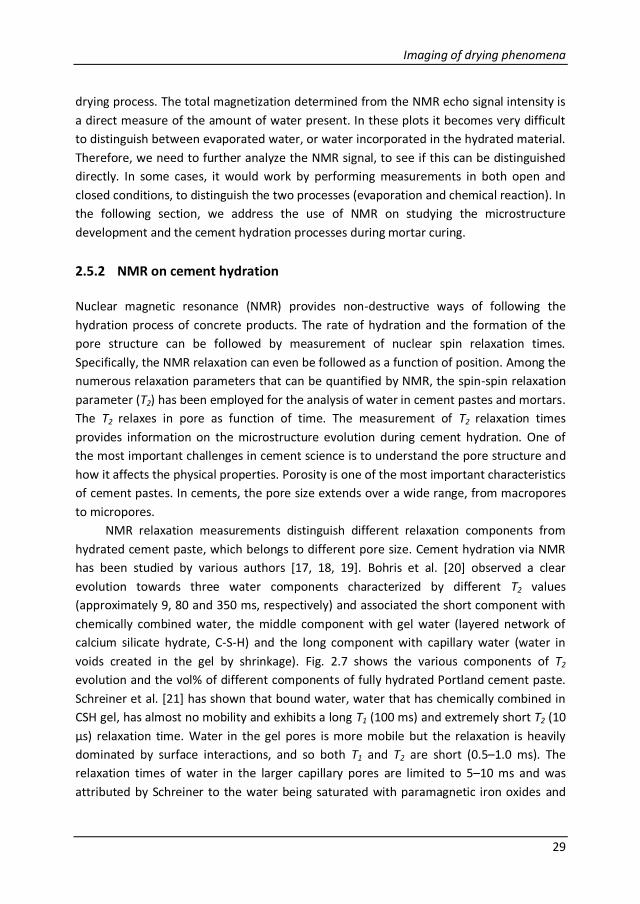
has been studied by various authors [17, 18, 19]. Bohris et al. [20] observed a clear
evolution towards three water components characterized by different T2 values
(approximately 9, 80 and 350 ms, respectively) and associated the short component with
chemically combined water, the middle component with gel water (layered network of
calcium silicate hydrate, C-S-H) and the long component with capillary water (water in
voids created in the gel by shrinkage). Fig. 2.7 shows the various components of T2
evolution and the vol% of different components of fully hydrated Portland cement paste.
Schreiner et al. [21] has shown that bound water, water that has chemically combined in
CSH gel, has almost no mobility and exhibits a long T1 (100 ms) and extremely short T2 (10
µs) relaxation time. Water in the gel pores is more mobile but the relaxation is heavily
dominated by surface interactions, and so both T1 and T2 are short (0.5–1.0 ms). The
relaxation times of water in the larger capillary pores are limited to 5–10 ms and was
attributed by Schreiner to the water being saturated with paramagnetic iron oxides and
Chapter 2
30
0 5 10 15 20 25 30
0
1
2
3
4
5
T2
(m
s)
H ydration t ime (h)
Induc tion period(I)
acce leration pe riod(II)
d iff usion p eriod(III)
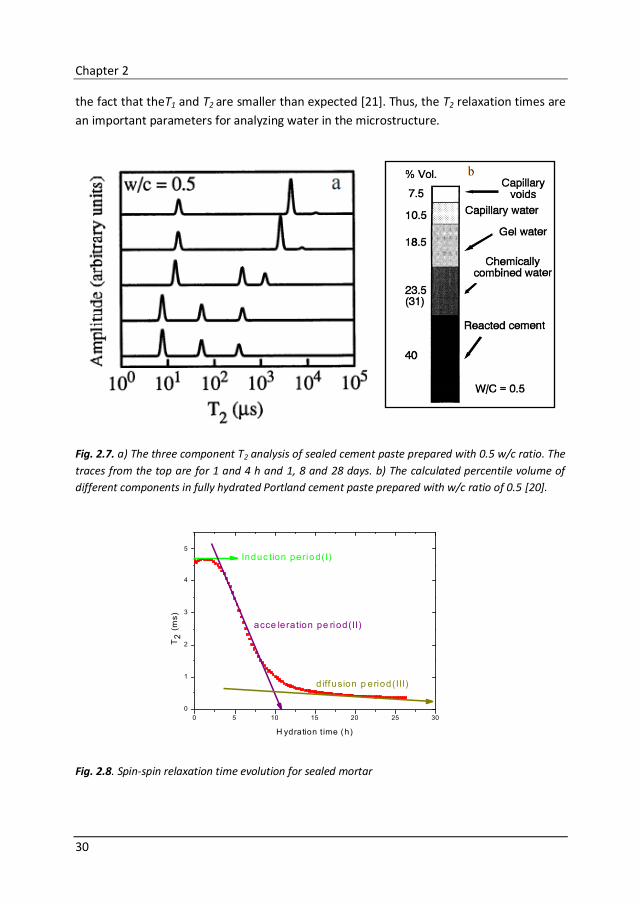
the fact that theT1 and T2 are smaller than expected [21]. Thus, the T2 relaxation times are
an important parameters for analyzing water in the microstructure.
Fig. 2.7. a) The three component T2 analysis of sealed cement paste prepared with 0.5 w/c ratio. The
traces from the top are for 1 and 4 h and 1, 8 and 28 days. b) The calculated percentile volume of
different components in fully hydrated Portland cement paste prepared with w/c ratio of 0.5 [20].
Fig. 2.8. Spin-spin relaxation time evolution for sealed mortar
Imaging of drying phenomena
31
Moreover, NMR T2 evolution can be used to analyze the different stages of cement
hydration during mortar curing. Fig. 2.8 shows T2 evolution of sealed mortar as function of
time. The experimental data were fitted both with a bi-exponential function and mono-
exponential function in order to evaluate the contribution from the water in different
environments. However, bi-exponential fitting was not continued due to little contribution
of the second relaxation component. The mono exponential fit was proven to be
sufficiently accurate in fitting the signal decays throughout the hydration process. This
mono exponential fit is what is shown in Fig. 2.8. From Fig. 2.8, different stages of
hydration such as, induction period, acceleration period and diffusion period can be visible
from T2 evolution curve. By using this evolution plot as a reference, the influence of
modified cellulose on the cement hydration and microstructure development can be easily
followed. In this thesis, time evolution of spin-spin relaxation time was used to study the
cement hydration with and without MHEC during mortar curing. CPMG pulse sequences
were used to obtain T2 relaxation values from the drying mortar samples.
Chapter 2
32
References
1. F. Bloch, Nuclear induction, Physical Review, 70 (1946) 460.
2. F. Bloch, W. Hansen, and M. Packard, The nuclear induction experiment, Physical
Review, 70 (1946) 474.
3. E. M. Purcell, E. C. Torrey, and R. V. Pound, Resonance absorption by nuclear
magnetic moments in a solid, Physical Review, 69 (1946) 37–38.
4. R. R. Ernst, W. A. Anderson, Application of Fourier transform spectroscopy to
magnetic resonance, Rev. Sci. Instr. 37 (1996) 93- 102.
5. A. Gareth. Morris , W. James. Emsley, Multi dimensional NMR: an introduction, Wiley,
ISBN: 9781118589083
6. P. Mansfield, P. K. Grannell, NMR diffraction in solids, Journal of Physics C: Solid State
Physics, Volume 6, Number 22.
7. P. C. Lauterbur, Image Formation by Induced Local Interactions: Examples
Employing Nuclear Magnetic Resonance, Nature, 242 (1973) 190–191.
8. K. Kopinga, L. Pel, One-dimensional scanning of moisture in porous materials with
NMR, Rev. Sci. Instrum. 65 (1994) 3673-3681.
9. Igor V. Koptyug, MRI of mass transport in porous media: Drying and sorption
processes, Progress in Nuclear Magnetic Resonance Spectroscopy, 65 (2012) 1–65.
10. Charles P. Slichter, Principles of magnetic resonance. Berlin, Springer, 3rd enl. and
upd. ed. edition, 1990.
11. P. T. Callaghan, Principles of Nuclear Magnetic Resonance Spectroscopy, Clarendon
Press-Oxford, 1991.
12. J. P. Korb, Curr. Opin. Colloid Interface Sci, 14 (2009) 192.
13. K. R. Brownstein, C. E. Tarr, Importance of classical diffusion in NMR studies of water
in biological cell. Phys. Rev. A, 19 (1979) 2446.
14. L. Pel, ‘Moisture transport in porous Building Materials’, PhD thesis, Eindhoven
University of Technology, The Netherlands, p 125, 1995.
15. G. H. A. van der Heijden, H. P. Huinink, L. Pel, K. Kopinga, Chem. Eng. Sci, 64 (2009)
3010.
16. G. H. A. van der Heijden, R. M. W. van Bijnen, L. Pel, H. P. Huinink, Cement Concrete
Res, 37 (2007) 894.
17. N. Nestle, A. Kuhn, K. Friedemann, C. Horch, F. Stallmach, G. Herth, Water balance
and pore structure development in cementitious materials in internal curing with
modified superabsorbent polymer studied by NMR. Microporous Mesoporous Mater,
125 (2009) 51–7.
Imaging of drying phenomena
33
18. G. van der Heijden, R. van Bijnen, L. Pel, H. Huinink, Moisture transport in heated
concrete, as studied by NMR, and its consequences for fire spalling, Cem. Concr. Res.
37 (2007) 894–901.
19. M. Alesiani, S. Capuani, R. Giorgi, B. Maraviglia, I. Pirazzoli, F. Ridi, P. Baglioni,
Influence of Cellulosic Additives on Tricalcium Silicate Hydration: Nuclear Magnetic
Resonance Relaxation Time Analysis, J. Phys. Chem. B, 108 (2004) 4869–4874.
20. A. J. Bohris, U. Goerke, P. J. McDonald, M. Mulheron, B. Newling, B. Le Page, Magn.
Reson. Imag, 16 (1998) 455.
21. L. J Schreiner, J. C MacTavish, L. Miljkovic, NMR Line shape—spin–lattice relaxation
correlation study of Portland cement hydration, J. Am. Ceram. Soc. 68 (1985) 10–6.
22. W. P Halperin, J.-Y Jehng, Y.-Q Song, Application of spin-spin relaxation to
measurement of surface area and pore size distributions in a hydrating cement paste,
Magn. Reson. Imaging, 12 (1994) 169 –173.

34
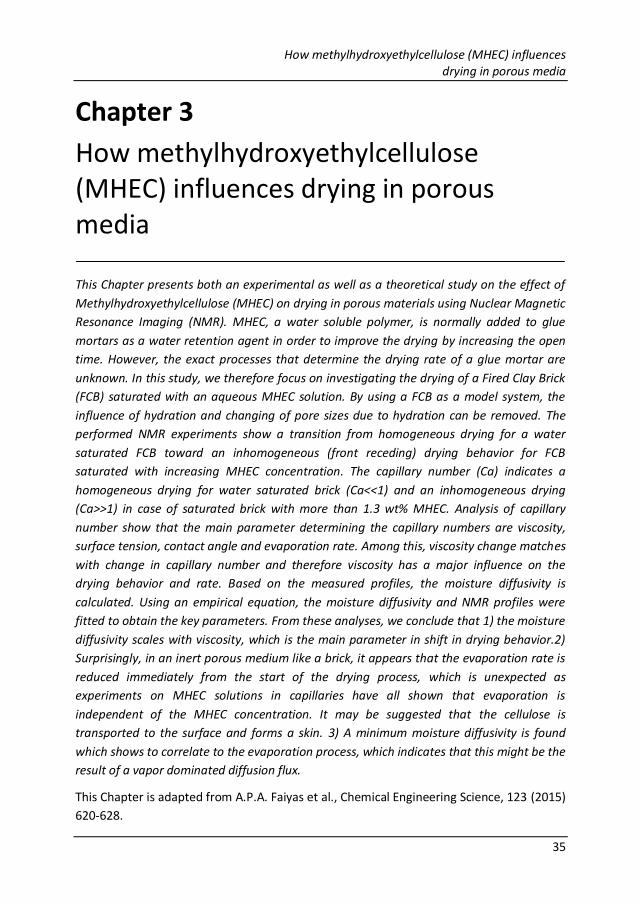
How methylhydroxyethylcellulose (MHEC) influences drying in porous media
35
Chapter 3
How methylhydroxyethylcellulose (MHEC) influences drying in porous media
This Chapter presents both an experimental as well as a theoretical study on the effect of
Methylhydroxyethylcellulose (MHEC) on drying in porous materials using Nuclear Magnetic
Resonance Imaging (NMR). MHEC, a water soluble polymer, is normally added to glue
mortars as a water retention agent in order to improve the drying by increasing the open
time. However, the exact processes that determine the drying rate of a glue mortar are
unknown. In this study, we therefore focus on investigating the drying of a Fired Clay Brick
(FCB) saturated with an aqueous MHEC solution. By using a FCB as a model system, the
influence of hydration and changing of pore sizes due to hydration can be removed. The
performed NMR experiments show a transition from homogeneous drying for a water
saturated FCB toward an inhomogeneous (front receding) drying behavior for FCB
saturated with increasing MHEC concentration. The capillary number (Ca) indicates a
homogeneous drying for water saturated brick (Ca<<1) and an inhomogeneous drying
(Ca>>1) in case of saturated brick with more than 1.3 wt% MHEC. Analysis of capillary
number show that the main parameter determining the capillary numbers are viscosity,
surface tension, contact angle and evaporation rate. Among this, viscosity change matches
with change in capillary number and therefore viscosity has a major influence on the
drying behavior and rate. Based on the measured profiles, the moisture diffusivity is
calculated. Using an empirical equation, the moisture diffusivity and NMR profiles were
fitted to obtain the key parameters. From these analyses, we conclude that 1) the moisture
diffusivity scales with viscosity, which is the main parameter in shift in drying behavior.2)
Surprisingly, in an inert porous medium like a brick, it appears that the evaporation rate is
reduced immediately from the start of the drying process, which is unexpected as
experiments on MHEC solutions in capillaries have all shown that evaporation is
independent of the MHEC concentration. It may be suggested that the cellulose is
transported to the surface and forms a skin. 3) A minimum moisture diffusivity is found
which shows to correlate to the evaporation process, which indicates that this might be the
result of a vapor dominated diffusion flux.
This Chapter is adapted from A.P.A. Faiyas et al., Chemical Engineering Science, 123 (2015)
620-628.
Chapter 3
36
3.1 Introduction
Methylhydroxyethylcellulose (MHEC) is widely used as water retention agent in
cementitious materials. The major applications are tile adhesives, wall renders, self-
leveling underlayments, floor screeds and water-proofing membranes. However, the way
MHEC retains water, and as such influences the open time (OT) of cement mortar, is not
fully understood. Open time is the time during which tiles can be applied with sufficiently
good adhesion. This open time can be modified by adding a small amount (1-2 wt%) of
water soluble polymer, which might be caused by a change in drying behavior of
cementitious glue mortar.
Drying of porous media is a complex process [1-6]. In most studies, drying in porous
media focuses on low-viscous fluids (e.g., water). In most cases, a porous material dries
homogeneously with a constant drying rate until critical moisture content is reached [7].
In the first stage, drying is dominated by the external mass transfer (e.g., evaporation). At
the critical moisture content, the fluid path is no longer continuous and drying no longer
homogeneous. From this point onwards the drying process takes place by transport of
vapor and/or liquid films. In this stage, drying is dominated by internal mass transfer (e.g.,
internal vapor transport). Different transport processes inside porous materials may result
in similar drying behavior. After the critical moisture content, the drying behavior is
almost similar to that observed in case of drying of squared or other shaped capillaries in
which liquid films are present in the corners of the capillaries [8, 9].
Resolving the exact drying processes in a porous medium is difficult, because in-situ
measurement of drying materials is not straightforward. As a consequence, many studies
focus on simulating drying behavior, for example, through pore network models (PNM).
Metzger et al. [10] simulated a 3D pore network both with and without viscous forces
(water) and studied the viscous stabilization of the drying front and its effect on the drying
rate. These models show that the viscous forces of water play a role in the intermediate
stages of drying, by shifting the profile from a homogeneous to inhomogeneous drying
behavior (the second stage). As far as we know, no experiments have been performed
with high viscous fluids in porous materials. Only few investigations focus on the drying of
porous media and investigate the effect of changes in contact angle, for example,
hydrophobic or hydrophilic surfaces [11]. In the latter case, it was shown that hydrophobic
surfaces having a contact angle above a critical contact (e.g., 120º) exhibit a flat traveling
drying front and that drying is independent of the contact angle.
As indicated, measuring transport processes inside a real 3D porous material is
challenging, because porous media are in general non transparent. Fortunately, some 2D
model porous systems consisting of glass beads exist, allowing imaging the drying process
using a camera [12]. To measure fluid distributions inside 3D porous materials techniques
like synchrotron X-ray tomography [13] and Nuclear Magnetic Resonance (NMR) imaging
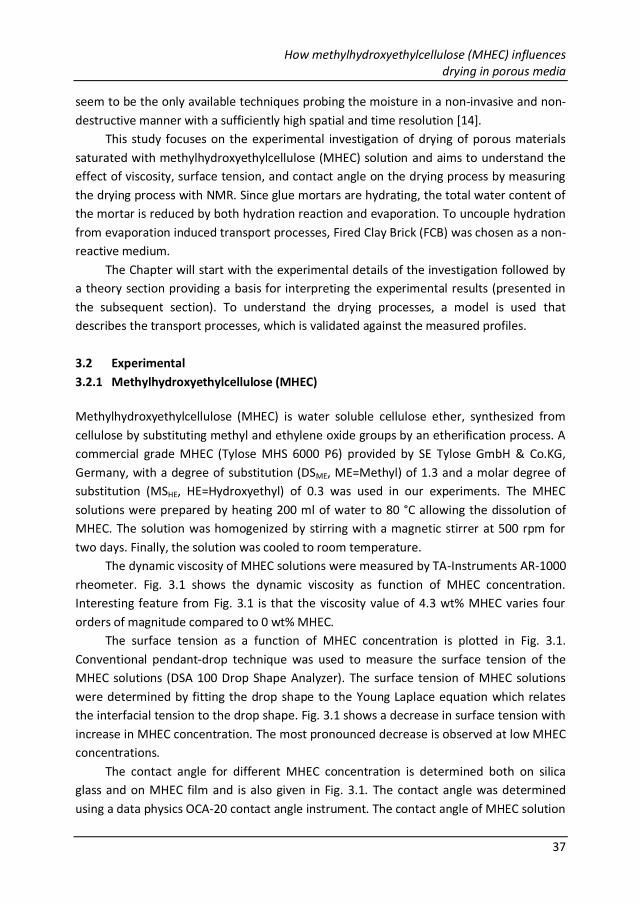
How methylhydroxyethylcellulose (MHEC) influences drying in porous media
37
seem to be the only available techniques probing the moisture in a non-invasive and non-
destructive manner with a sufficiently high spatial and time resolution [14].
This study focuses on the experimental investigation of drying of porous materials
saturated with methylhydroxyethylcellulose (MHEC) solution and aims to understand the
effect of viscosity, surface tension, and contact angle on the drying process by measuring
the drying process with NMR. Since glue mortars are hydrating, the total water content of
the mortar is reduced by both hydration reaction and evaporation. To uncouple hydration
from evaporation induced transport processes, Fired Clay Brick (FCB) was chosen as a non-
reactive medium.
The Chapter will start with the experimental details of the investigation followed by
a theory section providing a basis for interpreting the experimental results (presented in
the subsequent section). To understand the drying processes, a model is used that
describes the transport processes, which is validated against the measured profiles.
3.2 Experimental
3.2.1 Methylhydroxyethylcellulose (MHEC)
Methylhydroxyethylcellulose (MHEC) is water soluble cellulose ether, synthesized from
cellulose by substituting methyl and ethylene oxide groups by an etherification process. A
commercial grade MHEC (Tylose MHS 6000 P6) provided by SE Tylose GmbH & Co.KG,
Germany, with a degree of substitution (DSME, ME=Methyl) of 1.3 and a molar degree of
substitution (MSHE, HE=Hydroxyethyl) of 0.3 was used in our experiments. The MHEC
solutions were prepared by heating 200 ml of water to 80 °C allowing the dissolution of
MHEC. The solution was homogenized by stirring with a magnetic stirrer at 500 rpm for
two days. Finally, the solution was cooled to room temperature.
The dynamic viscosity of MHEC solutions were measured by TA-Instruments AR-1000
rheometer. Fig. 3.1 shows the dynamic viscosity as function of MHEC concentration.
Interesting feature from Fig. 3.1 is that the viscosity value of 4.3 wt% MHEC varies four
orders of magnitude compared to 0 wt% MHEC.
The surface tension as a function of MHEC concentration is plotted in Fig. 3.1.
Conventional pendant-drop technique was used to measure the surface tension of the
MHEC solutions (DSA 100 Drop Shape Analyzer). The surface tension of MHEC solutions
were determined by fitting the drop shape to the Young Laplace equation which relates
the interfacial tension to the drop shape. Fig. 3.1 shows a decrease in surface tension with
increase in MHEC concentration. The most pronounced decrease is observed at low MHEC
concentrations.
The contact angle for different MHEC concentration is determined both on silica
glass and on MHEC film and is also given in Fig. 3.1. The contact angle was determined
using a data physics OCA-20 contact angle instrument. The contact angle of MHEC solution
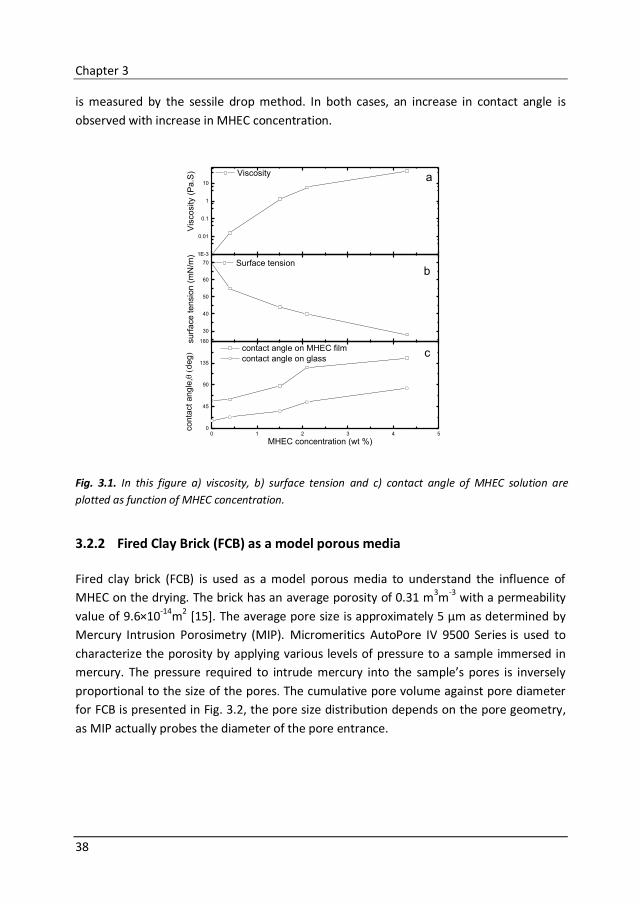
Chapter 3
38
0 1 2 3 4 50
45
90
135
180
30
40
50
60
70
1E-3
0.01
0.1
1
10
contact angle on MHEC film
contact angle on glass
conta
ct
angle
,(
deg)
MHEC concentration (wt %)
c
su
rfa
ce
te
nsio
n (
mN
/m)
Surface tensionb
Vis
co
sity (
Pa
.S) Viscosity a
is measured by the sessile drop method. In both cases, an increase in contact angle is
observed with increase in MHEC concentration.
Fig. 3.1. In this figure a) viscosity, b) surface tension and c) contact angle of MHEC solution are
plotted as function of MHEC concentration.
3.2.2 Fired Clay Brick (FCB) as a model porous media
Fired clay brick (FCB) is used as a model porous media to understand the influence of
MHEC on the drying. The brick has an average porosity of 0.31 m3m-3 with a permeability
value of 9.6×10⁻¹⁴m2 [15]. The average pore size is approximately 5 µm as determined by
Mercury Intrusion Porosimetry (MIP). Micromeritics AutoPore IV 9500 Series is used to
characterize the porosity by applying various levels of pressure to a sample immersed in
mercury. The pressure required to intrude mercury into the sample’s pores is inversely
proportional to the size of the pores. The cumulative pore volume against pore diameter
for FCB is presented in Fig. 3.2, the pore size distribution depends on the pore geometry,
as MIP actually probes the diameter of the pore entrance.
How methylhydroxyethylcellulose (MHEC) influences drying in porous media
39
Fig. 3.2. Cumulative pore volume vs. pore diameter for FCB from MIP.
3.2.3 Drying experiments
One dimensional NMR drying experiments were performed on FCB samples saturated
both with and without MHEC. Cylindrical samples were drilled with a diameter of 18 mm
and a length of 10 mm. One sample was vacuum saturated with pure water and the rest
were vacuum saturated with different concentrations of MHEC in aqueous solution,
namely 0.4 wt%, 1.3 wt%, 2.1 wt% and 4.3 wt%. Each sample was vacuum saturated for
three days to ensure full saturation. The drying was performed by an air flow of 1 l min-1
introduced vertically in the middle of the sample producing an almost zero relative
humidity on top of the sample. All other sides of the samples were closed by a cylindrical
teflon tube.
3.3 Theory
This section aims to provide the theoretical basis for the calculation and interpretation of
the moisture profiles based on the material parameters, boundary conditions, and the
obtained moisture diffusivity determined from the moisture profiles.
3.3.1 Transport equation and moisture diffusivity
One-dimensional moisture transport in porous media under isothermal conditions can be
described by the following conservation equation: 𝜕Θ
𝜕𝑡+
𝜕
𝜕𝑥𝑞(Θ) = 0, (3.1)
0.1 1 10 1000.00
0.01
0.02
0.03
0.04
0.05
0.06
0.07
0.08
Incre
menta
l pore
volu
me (
ml/g)
Mean Diameter (µm)
0.00
0.05
0.10
0.15
0.20
cum
ula
tive
pore
volu
me (
ml/g)
Chapter 3
40
in which Θ [m3/m
3] represents the moisture content and the moisture flux q [m
3/m
2s]
consists of vapor transport and pressure driven Darcy flow, given by:
𝑞 Θ = −𝐷𝑣
𝜌𝑤
𝜕𝜌𝑣
𝜕𝑥+
𝐾
𝜂
𝜕𝑝𝑐
𝜕𝑥, (3.2)
where 𝐷𝑣 [m2/s] represents the vapor diffusion coefficient, 𝜌𝑣 [kg/m
3] the vapor density,
𝜌𝑤 [kg/m3] the density of water, K [m2] the permeability, 𝜂 [Pa s] the viscosity, and 𝑝𝑐 [Pa]
the capillary pressure. Phenomenological, a moisture transport equation can be described
by a non linear diffusion equation:
𝜕Θ
𝜕𝑡+
𝜕
𝜕𝑥𝐷(Θ)
𝜕Θ
𝜕𝑥= 0, (3.3)
where Θ is the moisture content and D Θ the moisture diffusivity, which is depending on
the local moisture content. The moisture diffusivity now covers both the vapor transport
as well as the Darcy flow. Determination of the moisture diffusivity 𝐷 Θ in porous media,
incorporating the above two processes, using moisture concentration profiles can be
achieved by using the following equation [16, 17]:
𝐷(Θ(x′)) =
𝜕Θ
𝜕𝑡 𝑑𝑥
𝑥 ′𝐿
𝜕Θ
𝜕𝑥 𝑥 ′
, (3.4)
where L denotes the length of the sample and the position at the back of the sample.
Physically, the moisture diffusivity contains two processes, vapor diffusion and liquid flow,
and is given by:
𝐷 Θ =𝐷𝑣
𝜌𝑤
𝜕𝜌𝑣
𝜕Θ−
𝐾
𝜂
𝜕𝑝𝑐
𝜕Θ. (3.5)
The vapor density 𝜌𝑣 can be related to Pc via the Kelvin equation:
𝜌𝑣 = 𝜌0𝑒−𝑀𝑤𝑝𝑐𝜌𝑤𝑅𝑇 , (3.6)
where 𝜌0 [22 g/cm3] is the vapor density of water, 𝜌𝑤 [kg/m3] the density of water, 𝑀𝑤
[18g/mol] the molar mass of water, T [K] the temperature and R [8.314 J/mol K] the gas
constant. To calculate both the vapor pressure and liquid flow, the capillary pressure of
the material needs to be calculated, which can be achieved from mercury intrusion
porosimetry and fitted with the Van Genugten equation [18]:
𝑝𝑐 = 𝑝𝑐0
𝜃𝑚𝑎𝑥
𝜃
𝑚
𝑚−1− 1
1
𝑚
, (3.7)
where pc 0 is the maximum capillary pressure (for our FCB 258 kPa), θmax (for our FCB
0.31m3/m3) is the moisture content when fully saturated, and m [1.96] a constant.
To describe the transport also the evaporation process at the boundary should be
taken into account. The vapor flux is determined by the vapor diffusion (𝐷𝑎𝑖𝑟 ) induced by
a vapor density difference (Δ𝜌𝑣) over a surface layer with a thickness (𝛿) with dry air at
the outer part of this layer (𝜌𝑣𝛿 ≈ 0) and a sample surface vapor density of 𝜌𝑣
𝑠.
How methylhydroxyethylcellulose (MHEC) influences drying in porous media
41
Δ𝜌𝑣 = 𝜌𝑣𝑠 − 𝜌𝑣
𝛿 ≈ 𝜌𝑣𝑠, (3.8)
The flux over this surface area can be calculated by 𝑗 =𝐷𝑎𝑖𝑟 Δ𝜌𝑣
𝛿=
𝐷𝑎𝑖𝑟 𝜌𝑣𝑠
𝛿. The vapor
pressure at the direct surface of the sample depends on the saturation level of the
material at the surface, and can be calculated by the Kelvin equation (eq.3.6).
3.3.2 Capillary number
One can characterize the drying inside a porous material using the capillary number (Ca).
The capillary number is the ratio between the viscous force and the capillary force, and is
given by,
𝐶𝑎 ≡𝐿n𝜈𝜂𝑟
2 𝐾γ cos 𝜃, (3.9)
where n [-] represents the porosity, ѵ [m/s] the fluid velocity, 𝜂 [Pa s] the viscosity, r [m]
the pore radius, K [m2] the permeability, k [N/m] the surface tension and θ [º] the contact
angle. This equation shows that the drying behavior is mainly determined by evaporation
rate (which determines the fluid velocity, ѵ), viscosity, the permeability of the material,
surface tension and the contact angle of the pore liquid, considering that the pore radius,
sample size and porosity are constant for each sample. In essence, equation (3.9)
describes the ratio between viscous forces and capillary forces in a specific porous
material that is drying at the surface. When Ca <<1, capillary forces dominate over the
viscous forces. In case Ca>>1, the capillary forces (present due to the evaporation process
at the surface) no longer surpass the viscous forces in the permeable material. Looking at
the properties of the MHEC fluid in Fig. 3.1, we conclude that the viscosity of MHEC
changes several orders of magnitude, whereas the surface tension and contact angle only
influence the capillary number by an order of magnitude.
One can re-write the equation (3.9) by using Darcy’s law as,
𝐶𝑎 =𝐿
𝜉, (3.10)
where L is the size of the sample and ξ represents the width of the drying front. By using
this equation, we can directly relate the value of capillary number to the drying behavior.
In case Ca<<1, the width of the front is much larger than the size of the sample, which
represents homogeneous drying of the material. If Ca>> 1, the width of the front is much
smaller than the size of the sample, which corresponds to inhomogeneous drying
characterized by a receding front [19].
Chapter 3
42
3.4 Result and discussion
3.4.1 Drying profiles
With NMR imaging, the moisture distribution in drying fired clay brick samples was
obtained. Fig. 3.3 shows the moisture distribution of fired clay brick for different cellulose
concentrations at different times during drying. The top and bottom side of the samples
are located on left and right side of the profiles, respectively.
To investigate the difference in drying behavior, the cellulose ether concentration
within the FCB is varied. Fig. 3.3a shows the drying in case of pure water. The first curve
(black) represents the profile after 20 min of averaging. The profiles are acquired and
plotted every 20 min. After 7 profiles, the profile is plotted every 40 min to visualise the
drying process. Homogeneous drying is observed, as indicated by the vertical arrow and
continues till a critical saturation, Θc, reached at ≈ 0.08 m3 m-3, indicated by the horizontal
arrow. After the critical saturation has been reached, a receding drying front develops and
moves into the brick.
The moisture profile for the sample having 0.4 wt% (Fig. 3.3b) of MHEC shows
homogeneous drying behavior similar to the drying observed in pure water saturated
brick. However, with increasing concentration, as seen in Fig. 3.3c with 1.3 wt% MHEC, the
drying behavior becomes more inhomogeneous. A receding drying front is observed from
the start of the drying process, as indicated by the horizontal arrow. This shows that the
capillary forces are not large enough to sustain sufficient flow. However, at the back of the
sample, the moisture content still decreases quite homogeneously, indicating that the
capillary forces are still driving the flow on smaller length scales. The moisture profiles
shown in Fig. 3.3d (4.3 wt%) also show an inhomogeneous drying behavior. A moving front
is observed as indicated by the horizontal arrow. Additionally, one can observe a gradient
in moisture content (with a typical length scale of 7 mm) at the deeper layers (indicated by
the second arrow). Additionally, at the bottom, more homogenous drying is visible
(indicated by the vertical arrow). A similar drying behavior was observed for the samples
with 2.1 wt% MHEC solution.
In order to characterize the drying, the total moisture content is plotted in Fig. 3.4
against time for different wt% of MHEC. The total moisture content is obtained by
integrating the moisture profiles. The symbols plotted in this figure represent the
measured data, while the continuous line represents a model fit, which will be discussed
in the next sections of this Chapter. Different drying stages can be distinguished. In the
first period for 0 wt% MHEC, the drying curve is decreasing linearly. In the last period of
drying, the moisture decrease is non-linear and the evaporation rate drops. This
corresponds to the period in which a receding front moves inside the material and is
dominated by internal evaporation process and subsequent diffusion.
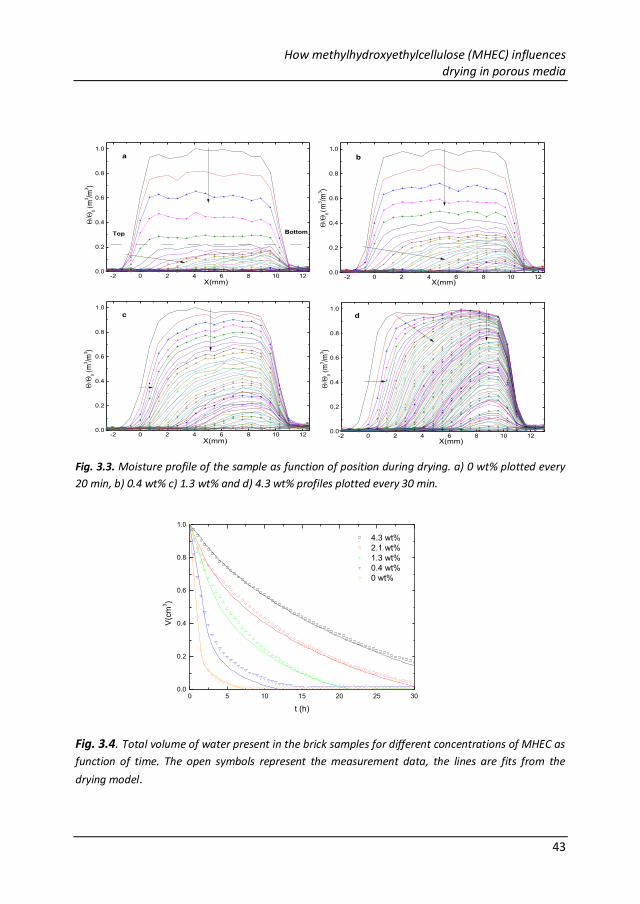
How methylhydroxyethylcellulose (MHEC) influences drying in porous media
43
Fig. 3.3. Moisture profile of the sample as function of position during drying. a) 0 wt% plotted every
20 min, b) 0.4 wt% c) 1.3 wt% and d) 4.3 wt% profiles plotted every 30 min.
Fig. 3.4. Total volume of water present in the brick samples for different concentrations of MHEC as
function of time. The open symbols represent the measurement data, the lines are fits from the
drying model.
0 5 10 15 20 25 300.0
0.2
0.4
0.6
0.8
1.0
4.3 wt%
2.1 wt%
1.3 wt%
0.4 wt%
0 wt%
V(c
m3)
t (h)
-2 0 2 4 6 8 10 120.0
0.2
0.4
0.6
0.8
1.0
(m
3/m
3)
X(mm)
a
Top Bottom
-2 0 2 4 6 8 10 120.0
0.2
0.4
0.6
0.8
1.0
(m
3/m
3)
X(mm)
b
-2 0 2 4 6 8 10 120.0
0.2
0.4
0.6
0.8
1.0
(m
3/m
3)
X(mm)
c
-2 0 2 4 6 8 10 120.0
0.2
0.4
0.6
0.8
1.0
(m
3/m
3)
X(mm)
d
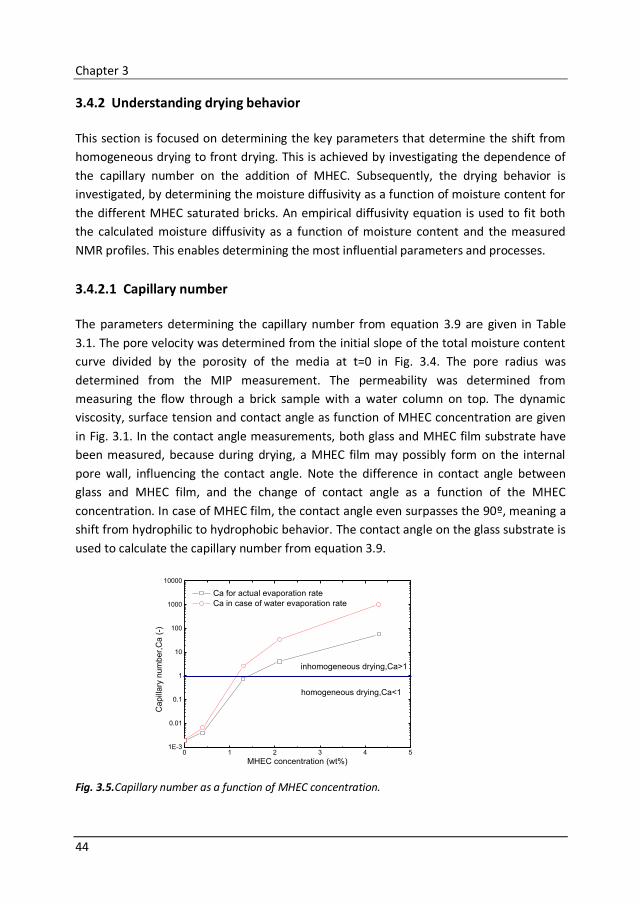
Chapter 3
44
3.4.2 Understanding drying behavior
This section is focused on determining the key parameters that determine the shift from
homogeneous drying to front drying. This is achieved by investigating the dependence of
the capillary number on the addition of MHEC. Subsequently, the drying behavior is
investigated, by determining the moisture diffusivity as a function of moisture content for
the different MHEC saturated bricks. An empirical diffusivity equation is used to fit both
the calculated moisture diffusivity as a function of moisture content and the measured
NMR profiles. This enables determining the most influential parameters and processes.
3.4.2.1 Capillary number
The parameters determining the capillary number from equation 3.9 are given in Table
3.1. The pore velocity was determined from the initial slope of the total moisture content
curve divided by the porosity of the media at t=0 in Fig. 3.4. The pore radius was
determined from the MIP measurement. The permeability was determined from
measuring the flow through a brick sample with a water column on top. The dynamic
viscosity, surface tension and contact angle as function of MHEC concentration are given
in Fig. 3.1. In the contact angle measurements, both glass and MHEC film substrate have
been measured, because during drying, a MHEC film may possibly form on the internal
pore wall, influencing the contact angle. Note the difference in contact angle between
glass and MHEC film, and the change of contact angle as a function of the MHEC
concentration. In case of MHEC film, the contact angle even surpasses the 90º, meaning a
shift from hydrophilic to hydrophobic behavior. The contact angle on the glass substrate is
used to calculate the capillary number from equation 3.9.
Fig. 3.5.Capillary number as a function of MHEC concentration.
0 1 2 3 4 51E-3
0.01
0.1
1
10
100
1000
10000
Ca for actual evaporation rate
Ca in case of water evaporation rate
Capill
ary
num
ber,
Ca (
-)
MHEC concentration (wt%)
homogeneous drying,Ca<1
inhomogeneous drying,Ca>1
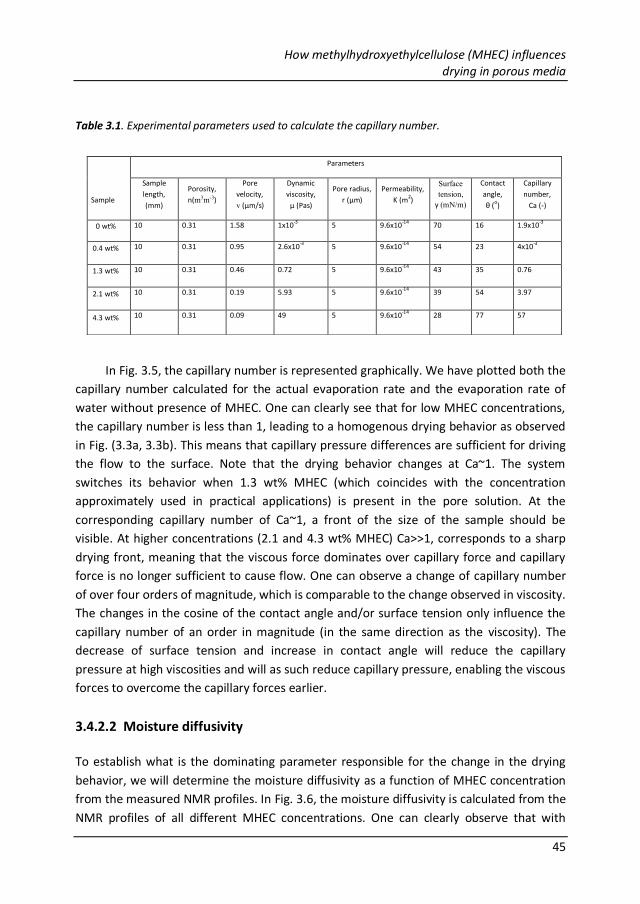
How methylhydroxyethylcellulose (MHEC) influences drying in porous media
45
Table 3.1. Experimental parameters used to calculate the capillary number.
In Fig. 3.5, the capillary number is represented graphically. We have plotted both the
capillary number calculated for the actual evaporation rate and the evaporation rate of
water without presence of MHEC. One can clearly see that for low MHEC concentrations,
the capillary number is less than 1, leading to a homogenous drying behavior as observed
in Fig. (3.3a, 3.3b). This means that capillary pressure differences are sufficient for driving
the flow to the surface. Note that the drying behavior changes at Ca~1. The system
switches its behavior when 1.3 wt% MHEC (which coincides with the concentration
approximately used in practical applications) is present in the pore solution. At the
corresponding capillary number of Ca~1, a front of the size of the sample should be
visible. At higher concentrations (2.1 and 4.3 wt% MHEC) Ca>>1, corresponds to a sharp
drying front, meaning that the viscous force dominates over capillary force and capillary
force is no longer sufficient to cause flow. One can observe a change of capillary number
of over four orders of magnitude, which is comparable to the change observed in viscosity.
The changes in the cosine of the contact angle and/or surface tension only influence the
capillary number of an order in magnitude (in the same direction as the viscosity). The
decrease of surface tension and increase in contact angle will reduce the capillary
pressure at high viscosities and will as such reduce capillary pressure, enabling the viscous
forces to overcome the capillary forces earlier.
3.4.2.2 Moisture diffusivity
To establish what is the dominating parameter responsible for the change in the drying
behavior, we will determine the moisture diffusivity as a function of MHEC concentration
from the measured NMR profiles. In Fig. 3.6, the moisture diffusivity is calculated from the
NMR profiles of all different MHEC concentrations. One can clearly observe that with
Sample
Parameters
Sample
length,
(mm)
Porosity,
n(m3m-3)
Pore
velocity,
v (μm/s)
Dynamic
viscosity,
μ (Pas)
Pore radius,
r (μm)
Permeability,
K (m2)
Surface
tension,
γ (mN/m)
Contact
angle,
θ (o)
Capillary
number,
Ca (-)
0 wt% 10 0.31 1.58 1x10⁻³
5 9.6x10⁻¹⁴
70 16 1.9x10⁻³
0.4 wt% 10 0.31 0.95 2.6x10⁻³
5 9.6x10⁻¹⁴
54 23 4x10⁻³
1.3 wt% 10 0.31 0.46 0.72 5 9.6x10⁻¹⁴
43 35 0.76
2.1 wt% 10 0.31 0.19 5.93 5 9.6x10⁻¹⁴
39 54 3.97
4.3 wt% 10 0.31 0.09 49 5 9.6x10⁻¹⁴
28 77 57
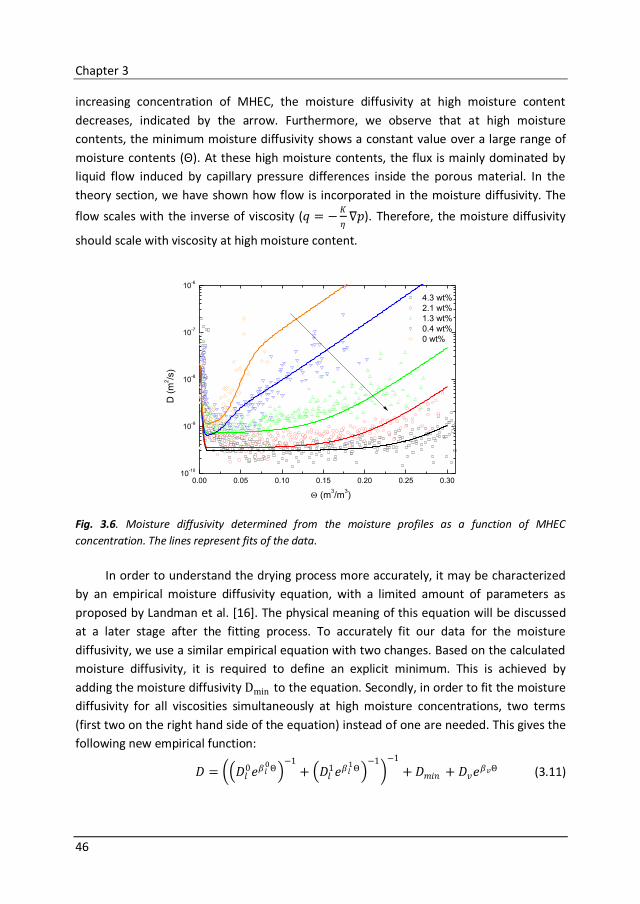
Chapter 3
46
increasing concentration of MHEC, the moisture diffusivity at high moisture content
decreases, indicated by the arrow. Furthermore, we observe that at high moisture
contents, the minimum moisture diffusivity shows a constant value over a large range of
moisture contents (Θ). At these high moisture contents, the flux is mainly dominated by
liquid flow induced by capillary pressure differences inside the porous material. In the
theory section, we have shown how flow is incorporated in the moisture diffusivity. The
flow scales with the inverse of viscosity (𝑞 = −𝐾
𝜂∇𝑝). Therefore, the moisture diffusivity
should scale with viscosity at high moisture content.
Fig. 3.6. Moisture diffusivity determined from the moisture profiles as a function of MHEC
concentration. The lines represent fits of the data.
In order to understand the drying process more accurately, it may be characterized
by an empirical moisture diffusivity equation, with a limited amount of parameters as
proposed by Landman et al. [16]. The physical meaning of this equation will be discussed
at a later stage after the fitting process. To accurately fit our data for the moisture
diffusivity, we use a similar empirical equation with two changes. Based on the calculated
moisture diffusivity, it is required to define an explicit minimum. This is achieved by
adding the moisture diffusivity Dmin to the equation. Secondly, in order to fit the moisture
diffusivity for all viscosities simultaneously at high moisture concentrations, two terms
(first two on the right hand side of the equation) instead of one are needed. This gives the
following new empirical function:
𝐷 = 𝐷𝑙0𝑒𝛽𝑙
0Θ −1
+ 𝐷𝑙1𝑒𝛽𝑙
1Θ −1
−1
+ 𝐷𝑚𝑖𝑛 + 𝐷𝑣𝑒𝛽𝑣Θ (3.11)
0.00 0.05 0.10 0.15 0.20 0.25 0.3010
-10
10-9
10-8
10-7
10-6
4.3 wt%
2.1 wt%
1.3 wt%
0.4 wt%
0 wt%
D (
m2/s
)
(m3/m
3)
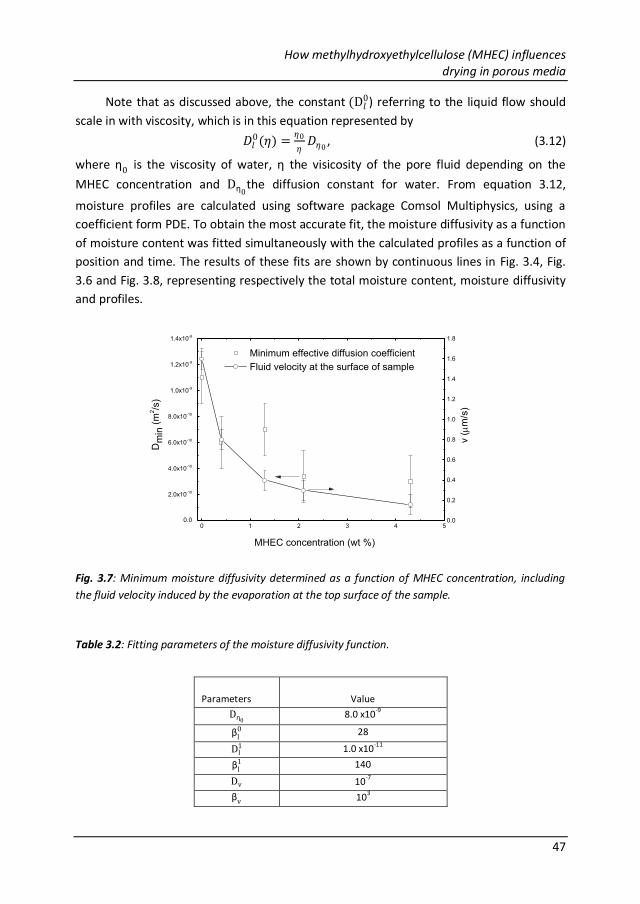
How methylhydroxyethylcellulose (MHEC) influences drying in porous media
47
Note that as discussed above, the constant (D𝑙0) referring to the liquid flow should
scale in with viscosity, which is in this equation represented by
𝐷𝑙0(𝜂) =
𝜂0
𝜂𝐷𝜂0
, (3.12)
where η0 is the viscosity of water, η the visicosity of the pore fluid depending on the
MHEC concentration and Dη0the diffusion constant for water. From equation 3.12,
moisture profiles are calculated using software package Comsol Multiphysics, using a
coefficient form PDE. To obtain the most accurate fit, the moisture diffusivity as a function
of moisture content was fitted simultaneously with the calculated profiles as a function of
position and time. The results of these fits are shown by continuous lines in Fig. 3.4, Fig.
3.6 and Fig. 3.8, representing respectively the total moisture content, moisture diffusivity
and profiles.
Fig. 3.7: Minimum moisture diffusivity determined as a function of MHEC concentration, including
the fluid velocity induced by the evaporation at the top surface of the sample.
Table 3.2: Fitting parameters of the moisture diffusivity function.
Parameters
Value
Dη0 8.0 x10
-9
βl0 28
Dl1 1.0 x10
-11
βl1 140
Dv 10-7
βv 103
0 1 2 3 4 50.0
2.0x10⁻¹⁰
4.0x10⁻¹⁰
6.0x10⁻¹⁰
8.0x10⁻¹⁰
1.0x10⁻⁹
1.2x10⁻⁹
1.4x10⁻⁹
v (
m/s
)
Minimum effective diffusion coefficient
Fluid velocity at the surface of sample
MHEC concentration (wt %)
Dm
in (
m2/s
)
0.0
0.2
0.4
0.6
0.8
1.0
1.2
1.4
1.6
1.8
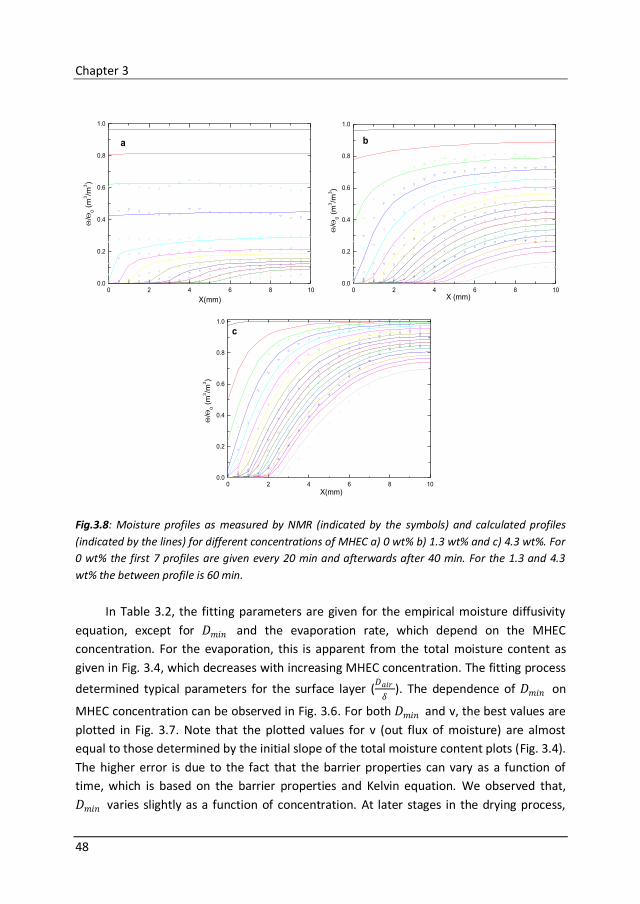
Chapter 3
48
Fig.3.8: Moisture profiles as measured by NMR (indicated by the symbols) and calculated profiles
(indicated by the lines) for different concentrations of MHEC a) 0 wt% b) 1.3 wt% and c) 4.3 wt%. For
0 wt% the first 7 profiles are given every 20 min and afterwards after 40 min. For the 1.3 and 4.3
wt% the between profile is 60 min.
In Table 3.2, the fitting parameters are given for the empirical moisture diffusivity
equation, except for 𝐷𝑚𝑖𝑛 and the evaporation rate, which depend on the MHEC
concentration. For the evaporation, this is apparent from the total moisture content as
given in Fig. 3.4, which decreases with increasing MHEC concentration. The fitting process
determined typical parameters for the surface layer (𝐷𝑎𝑖𝑟
𝛿). The dependence of 𝐷𝑚𝑖𝑛 on
MHEC concentration can be observed in Fig. 3.6. For both 𝐷𝑚𝑖𝑛 and v, the best values are
plotted in Fig. 3.7. Note that the plotted values for v (out flux of moisture) are almost
equal to those determined by the initial slope of the total moisture content plots (Fig. 3.4).
The higher error is due to the fact that the barrier properties can vary as a function of
time, which is based on the barrier properties and Kelvin equation. We observed that,
𝐷𝑚𝑖𝑛 varies slightly as a function of concentration. At later stages in the drying process,
0 2 4 6 8 100.0
0.2
0.4
0.6
0.8
1.0
/
0 (
m3/m
3)
X(mm)
a
0 2 4 6 8 100.0
0.2
0.4
0.6
0.8
1.0
/
0 (
m3/m
3)
X (mm)
b
0 2 4 6 8 100.0
0.2
0.4
0.6
0.8
1.0
/
0 (
m3/m
3)
X(mm)
c
How methylhydroxyethylcellulose (MHEC) influences drying in porous media
49
𝐷𝑚𝑖𝑛 plays a dominant role. This constant determines the decrease of moisture content in
case of a front. At high MHEC concentrations, the moisture diffusivity remains constant
over a large range of the moisture content, in that range the capillary forces are
insufficient to drive the flow.
The fitting process and presented observation leads to three key conclusions. 1) No
difference in evaporation rate was expected, with or without presence of MHEC, since our
experiments of capillary tubes or bulk solutions have shown that evaporation rates of
cellulose ether solution remained constant. Nevertheless, a reduction of evaporation rate
was observed. This indicates that another mechanism is at play. We suggest that cellulose
may be transported to the surface and forms a skin. This hypothesis is supported by Fig.
3.1c, which shows that in that event MHEC layer is formed, it will be hydrophobic and as
such free of liquid, thereby possibly creating a barrier for vapor transport.2) In Fig. 3.7, the
values for 𝐷𝑚𝑖𝑛 are given, which were optimized to obtain the most suitable fit in the
profiles and integrals. The reason for the observed trend for 𝐷𝑚𝑖𝑛 is unclear. Several
explanations are possible. First of all, both the evaporation induced moisture velocity and
𝐷𝑚𝑖𝑛 show an apparent correlation (Fig. 3.7). This would support a hypothesis that 𝐷𝑚𝑖𝑛 is
in fact a vapor dominated diffusion flux. In this case, the flux due to the evaporation
process should be equal to the vapor diffusion. This hypothesis remains to be proven.3)
The profiles and moisture diffusivity can be calculated based on scaling the diffusivity at
high moisture content with one single other key parameter being viscosity. Consequently,
we conclude that the viscosity of the fluid is key for the change observed in the moisture
diffusivity at high moisture content.
Chapter 3
50
3.5 Conclusions
NMR drying experiments performed on fired clay brick saturated with pure water shows a
well-known drying behavior. Until a critical saturation is reached, the water is distributed
homogenously. After this critical saturation is reached, a drying front develops. In case of
drying of a MHEC saturated fired clay brick (FCB), inhomogeneous drying is observed,
which results in a receding drying front at the start of the drying process. The capillary
number confirms and explains this shift from homogenous to front receding drying. At a
capillary number of around 1, the shift from homogeneous drying to front receding drying
occurs. This happens around 1.3 wt% of MHEC in pore solution, which approximately
coincides with the concentration used in glue mortars. At higher concentrations (>1.3 wt%
MHEC), Ca>>1 and a front receding drying is observed; at low concentrations (<1.3 wt%
MHEC), Ca<<1 homogeneous drying is observed.
Analysis of the capillary number shows, that the main parameter determining this
change are the evaporation, viscosity, contact angle, and surface tension. The other
parameters, such as porosity, permeability, pore radius and sample size are constant
throughout the experiments, since they are properties of the material. The parameter
showing the largest change is the viscosity, which indicates that this is probably the key
parameter influencing the drying.
The moisture diffusivity was determined from the NMR profiles by modifying the
empirical moisture diffusivity equation of Landman et al [16]. Viscosity was the only
parameter changed to fit all five moisture diffusivity curves and NMR profiles having the
same set of parameters, combined with a variation of the evaporation and a minimum
moisture diffusivity as a function of MHEC concentration. From the final values, we
observed that 1) the evaporation rate drops with increase MHEC concentration, 2) the
diffusivity scales with viscosity, and 3) and a clear minimum diffusivity is found.
The fact that the evaporation rate depends on the MHEC concentration is quite
unexpected, as experiments on MHEC solutions in capillaries have all shown that
evaporation is independent of the MHEC concentration. In contrast, in an inert porous
medium like a brick, it appears that the evaporation rate is reduced immediately from the
start of the drying process. It may be suggested that the cellulose is transported to the
surface and forms a skin. This hypothesis is supported by Fig. 3.1c, which shows that in
that event MHEC layer is formed, it will be hydrophobic and as such free of liquid, thereby
possibly creating a barrier for vapor transport. This hypothesis remains to be proven.
We conclude that viscosity is indeed the main factor influencing the type of drying
behavior of the MHEC filled brick. This small change in contact angle and/or surface
tension as a function of MHEC does not influence the behavior significantly, as shown by
the high quality of the fits which are accurate by only scaling with viscosity. The fast
change of regime from capillary flow to front receding drying can be explained by the
How methylhydroxyethylcellulose (MHEC) influences drying in porous media
51
following: In case of front receding drying, contact angle and surface tension are not
relevant, since the moisture is stationary and contact angle and surface tension do not
change this. Large changes in contact angle and surface tension occur at high MHEC
concentrations. At these high MHEC concentrations, the fluid has a high viscosity, which
does not allow the capillary force to overcome the viscous forces. In addition, the change
of contact angle and surface tension only decreases the capillary forces, allowing viscous
forces to dominate at lower concentration. As such it is conceivable that in a transitional
regime (Ca~1), contact angle and surface tension may reduce the concentration at which
the capillary number changes from below 1 to above 1.
The fact that the moisture diffusivity 𝐷𝑚𝑖𝑛 remains constant over a large range of
moisture contents at high MHEC concentration and the apparent relationship with the
moisture velocity at the surface of the sample, support a hypothesis that 𝐷𝑚𝑖𝑛 is in fact a
vapor dominated diffusion flux. In case of a constant gradient in moisture content, the
evaporation process and the corresponding vapor diffusion should be equal. This
hypothesis remains to be proven. This observation has become apparent especially in this
study since to our knowledge previously no measurements were performed on drying of
high viscous fluids inside porous materials.
Chapter 3
52
References
1. M. Prat, Percolation model of drying under isothermal conditions in porous media,
Int. J. Multiphase Flow. 19 (1993) 691–704.
2. A. G. Yiotis, A. K. Stubos, A. G. Boudouvis, I. N. Tsimpanogiannis, Y. C. Yortsos, Pore-
Network Modeling of Isothermal Drying in Porous Media, Transp. Porous Media. 58
(2005) 63-86.
3. K. Kopinga, L. Pel, One-dimensional scanning of moisture in porous materials with
NMR, Rev. Sci. Instrum. 65 (1994) 3673-3681.
4. M. Prat, Recent advances in pore-scale models for drying of porous media, Chem. Eng.
J. 86 (2002) 153-164.
5. Y. Le Bray and M. Prat, Three-dimensional pore network simulation of drying in
capillary porous media, Int. J. Heat Mass Transfer, 42 (1999) 4207- 4224.
6. T. Metzger and E. Tsotsas, Influence of Pore Size Distribution on Drying Kinetics: A
Simple Capillary Model, Drying Technology. 23 (2005) 1797-1809.
7. M. Prat, S. Veran-Tissoires, N. Vorhauer, T. Metzger, E. Tsotsas, Fractal Phase
Distribution and Drying: Impact on Two-Phase Zone Scaling and Drying Time Scale
Dependence, Drying Technology, 30 (2012)1129-1135.
8. F. Chauvet, P. Duru, S. Geoffroy, M. Prat, Three Periods of Drying of a Single Square
Capillary Tube, Phys. Rev. Lett. 103 (2009) 124502.
9. M. Prat, On the influence of pore shape, contact angle and film flows on drying of
capillary porous media, Int. J. Heat Mass Transfer. 50 (2007) 1455-1468.
10. T. Metzger, E. Tsotsas, Viscous stabilization of drying front: Three-dimensional pore
network simulations, Chem. Eng. Res. Des. 86 (2008) 739-744.
11. M. Prat, Pore Network Models of Drying, Contact Angle, and Film Flows, Chem. Eng.
Technol. 34 (2011) 1029-1038.
12. T. X. Lu, J.W. Biggar, D. R. Nielsen, Water movement in glass bead porous media: 1.
Experiments of capillary rise and hysteresis, Water Rour. Res.30 (1994) 3275-3281.
13. Nima Shokri, Muhammad Sahimi, Structure of drying fronts in three-dimensional
porous media, Phys. Rev. E. 85 (2012) 066312.
14. L. Pel, K. Kopinga, H. Brocken, Moisture transport in porous building materials, Heron.
41 (1996) 95-105.
15. C. Hall, D. Hoff, Water transport in brick, stone and concrete (Spon Press, London,
2012).
16. K. A. Landman, L. Pel, E. F. Kaasschieter, Analytic modelling of drying of porous
materials, Math. Eng. Ind, 8 (2001) 89-122.
17. L. Pel, H. Brocken, K. Kopinga, Determiination of moisture diffusivity in porous media
using moisture concentration profiles, Int. J. Heat Mass Transfer, 39 (1996) 1273-
1280.
How methylhydroxyethylcellulose (MHEC) influences drying in porous media
53
18. V. Genuchten, A closed-form Equation to predicting the hydraulic conductivity of
unsaturated soil, M. Th, Soil Sci. Soc. Am. J. 44 (1980) 892-898.
19. R. Lenormand, E. Touboul, C. Zarcone, Numerical models and experiments on
immiscible displacements in porous media, J. Fluid. Mech, 189 (1988) 165-187.

54
Effect of MHEC on evaporation and hydration characteristics of glue mortar
55
Chapter 4
Effect of MHEC on evaporation and
hydration characteristics of glue mortar
The influence of methylhydroxyethylcellulose (MHEC) on both moisture distribution and
hydration characteristics of glue mortar using Nuclear Magnetic Resonance Imaging
(NMR) is investigated. MHEC is added to glue mortar in order to control the drying rate by
increasing the open time. Besides drying, MHEC might influence hydration characteristics
of mortar. In this study, we therefore examined the effect of MHEC on the hydration
characteristics of unsealed mortar. Without MHEC, the evaporation time is faster than
hydration time and the water distribution is homogeneous in the mortar, resulting in poor
hydration. Addition of MHEC > 1.3 wt% exhibits an evaporation time comparable to the
hydration time of mortar. However, in that case, inhomogeneous distribution of water
causes differences in the degree of hydration throughout the mortar sample, i.e., the top
surface shows poor hydration and the bottom surface shows good hydration, as confirmed
by MIP and T2 relaxation analysis.
This Chapter is adapted from A.P.A. Faiyas et al., Cement and Concrete Research, 83
(2016) 97-103.
4.1 Introduction
Cement based mortars are widely used as tile adhesives in building and construction.
Commercial mortars are complex systems, with Portland cement as main ingredient,
consisting of a variety of inorganic calcium silicates and calcium aluminates [1]. Together
with water, the cement reacts through various pathways into different inorganic phases
(calcium and aluminum hydrates etc.) [2, 3]. In case of a glue mortar, water soluble
polymers, such as methyl cellulose and modified Cellulose Ether (CE) (e.g.,
methylhydroxyethylcellulose (MHEC)) are added to influence the open time [4, 5].
However, the way MHEC retains water, and as such influences the open time (OT) of
cement mortar, is not fully understood.
Open time of the glue mortar is the time during which a tile can be fixed by mortar
to the substrate with sufficiently good adhesion and without reduction of bond strength.
Open time of the mortar determines the rate of application of tile, for example, in case of
short open time, only a small area can be tiled and exceeding the open time would result

Chapter 4
56
in reduction in bond strength. Among others, the open time is determined by the drying
process of mortar as a result of evaporation, internal moisture flow and hydration. Many
questions are still open on how MHEC influences the drying behavior of a glue mortar,
both by influencing the hydration as well as evaporation. Several aspects have been
studied, of which an overview is given of the relevant papers for this study.
In Chapter 3, the drying of high viscous MHEC solution inside non-reactive porous
medium has been studied in detail [6]. In that study, a saturated fired clay brick (FCB) was
studied as a model system, excluding the influence of hydration. It was found that the
addition of MHEC may increase the viscosity of pore liquid four orders in magnitude and,
as such, influences moisture transport. Accordingly, the performed NMR drying
experiments show a switch from homogeneous drying to an inhomogeneous drying
behavior, as a function of MHEC concentration. The research resulted in two main
conclusions: 1) The viscosity is the dominating factor influencing the moisture transport,
resulting in a receding front type of drying at high concentration of MHEC. 2) Evaporation
is also reduced by the addition of MHEC, however, the processes reducing the evaporation
are not fully understood. This is surprising since Patural et al. [7] found that addition of
MHEC does not modify the self-diffusion coefficient of water, and our studies of MHEC
solution in capillaries do not show any reduction in evaporation, which suggests some
other mechanism at play.
Another process influencing the available amount of water in a glue mortar is the
hydration of cement, which evidently consumes free water. Several studies have shown
that cellulose ether is an important ingredient reducing the speed of cement hydration [8,
9]. These studies show that methoxyl groups of hydroxyethylmethylcellulose (HEMC) and
hydroxypropylmethylcellulose (HPMC) are responsible for the delay in portlandite Ca(OH)2
precipitation. The molecular weight and the presence of hydroxyl propyl seem to have
negligible impact on cement hydration process. Silva et al. [10] studied the impact of
Hydroxyethylcellulose (HEC) on the pore size distribution of cement paste by MIP. The
pore size distribution of cement paste without HEC in this study shows at least two peaks
with a pore size of 4 nm and 75 nm. High concentration of HEC changes this distribution
and gives two additional peaks at 100-500 nm, which corresponds to capillary pores.
The evaporation of water results in spatial variations in moisture content, pore
structure, and hydration. To investigate these spatial variations, imaging techniques are
necessary. Various techniques could be used, such as: synchrotron X-ray tomography,
ultrasound and NMR. Nuclear Magnetic Resonance (NMR) has proven to be a powerful
tool to probe simultaneously water content as well as pore evolution through relaxation
analysis in a non-invasive and non-destructive manner with sufficiently high spatial and
time resolution [11]. One dimensional profiling is adequate to follow the evaporation
process at mortar/air interfaces and NMR relaxation provides information on changing
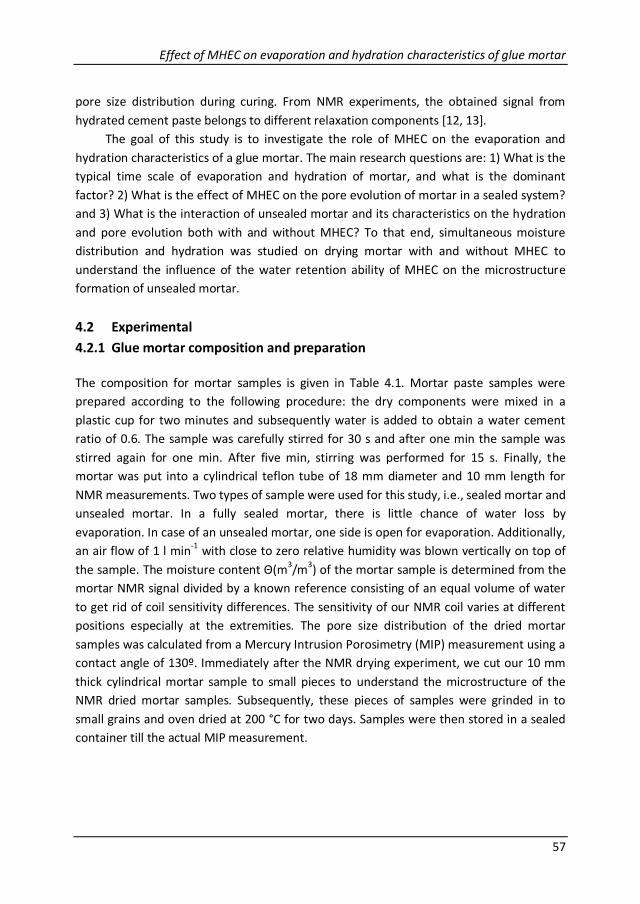
Effect of MHEC on evaporation and hydration characteristics of glue mortar
57
pore size distribution during curing. From NMR experiments, the obtained signal from
hydrated cement paste belongs to different relaxation components [12, 13].
The goal of this study is to investigate the role of MHEC on the evaporation and
hydration characteristics of a glue mortar. The main research questions are: 1) What is the
typical time scale of evaporation and hydration of mortar, and what is the dominant
factor? 2) What is the effect of MHEC on the pore evolution of mortar in a sealed system?
and 3) What is the interaction of unsealed mortar and its characteristics on the hydration
and pore evolution both with and without MHEC? To that end, simultaneous moisture
distribution and hydration was studied on drying mortar with and without MHEC to
understand the influence of the water retention ability of MHEC on the microstructure
formation of unsealed mortar.
4.2 Experimental
4.2.1 Glue mortar composition and preparation
The composition for mortar samples is given in Table 4.1. Mortar paste samples were
prepared according to the following procedure: the dry components were mixed in a
plastic cup for two minutes and subsequently water is added to obtain a water cement
ratio of 0.6. The sample was carefully stirred for 30 s and after one min the sample was
stirred again for one min. After five min, stirring was performed for 15 s. Finally, the
mortar was put into a cylindrical teflon tube of 18 mm diameter and 10 mm length for
NMR measurements. Two types of sample were used for this study, i.e., sealed mortar and
unsealed mortar. In a fully sealed mortar, there is little chance of water loss by
evaporation. In case of an unsealed mortar, one side is open for evaporation. Additionally,
an air flow of 1 l min-1 with close to zero relative humidity was blown vertically on top of
the sample. The moisture content Θ(m3/m3) of the mortar sample is determined from the
mortar NMR signal divided by a known reference consisting of an equal volume of water
to get rid of coil sensitivity differences. The sensitivity of our NMR coil varies at different
positions especially at the extremities. The pore size distribution of the dried mortar
samples was calculated from a Mercury Intrusion Porosimetry (MIP) measurement using a
contact angle of 130º. Immediately after the NMR drying experiment, we cut our 10 mm
thick cylindrical mortar sample to small pieces to understand the microstructure of the
NMR dried mortar samples. Subsequently, these pieces of samples were grinded in to
small grains and oven dried at 200 °C for two days. Samples were then stored in a sealed
container till the actual MIP measurement.
Chapter 4
58
Table 4.1. Glue mortar composition.
4.2.2 Methylhydroxyethylcellulose (MHEC)
Methylhydroxyethylcellulose (MHEC) is water soluble cellulose ether synthesized from
cellulose by substituting methyl and ethylene oxide groups by an etherification process. A
commercial grade MHEC (Tylose MHS 6000 P6) provided by SE Tylose GmbH & Co.KG,
Germany, with a degree of substitution (DSME, ME=Methyl) of 1.3 and a molar degree of
substitution (MSHE, HE=Hydroxyethyl) of 0.3 was used for our experiments. The MHEC was
added in a range from 0 to 2.1 wt% on the dry mix.
4.3 Results of evaporation and hydration
4.3.1 Moisture distribution profiles
This section focuses on the influence of MHEC on the water distribution of unsealed glue
mortar as function of time. One dimensional NMR imaging was performed on mortar
paste samples with 0 wt% MHEC, 0.4 wt% MHEC, 1.3 wt% MHEC and 2.1 wt% MHEC. The
mortar samples were prepared according to the procedure defined in section 4.2.1,
subsequently inserted in the NMR set-up and dried with dry air at the top surface. Fig. 4.1
shows the moisture distribution of samples with different cellulose concentration as
function of position. The top and bottom side of the samples are located on left and right
side of the figure, respectively, which are the same for all samples.
The moisture profile of 0 wt% MHEC mortar is shown in Fig. 4.1a. The time between
each profile is 24 min. At early drying period (first three profiles), shrinkage is observed
(indicated by horizontal arrow) due to evaporation, i.e., the mortar compacts.
Furthermore, it is observed that the water is distributed homogeneously (indicated by the
vertical arrow) till all observable water has disappeared. The hydrated water is not
observable with the NMR settings used. The moisture profile for 0.4 wt% (Fig. 4.1b) shows
initially a homogeneous distribution of water as in case of 0 wt% MHEC. Below a moisture
content (θ) of about 0.10 (m3/m3), the water distribution shows a gradient in moisture
content. With 1.3 wt% MHEC and 2.1 wt% MHEC (Fig. (4.1c, 4.1d)) respectively, a drying
front develops at the surface soon after the start of the measurement. Simultaneous with
the front movement, the water content below the front reduces more or less
homogeneously.
Composition CEM I 52.5R Quartz Limestone MHEC
Weight percent 38 wt% 57 wt% 5 wt% 0-2.1 wt% of MHEC in solution
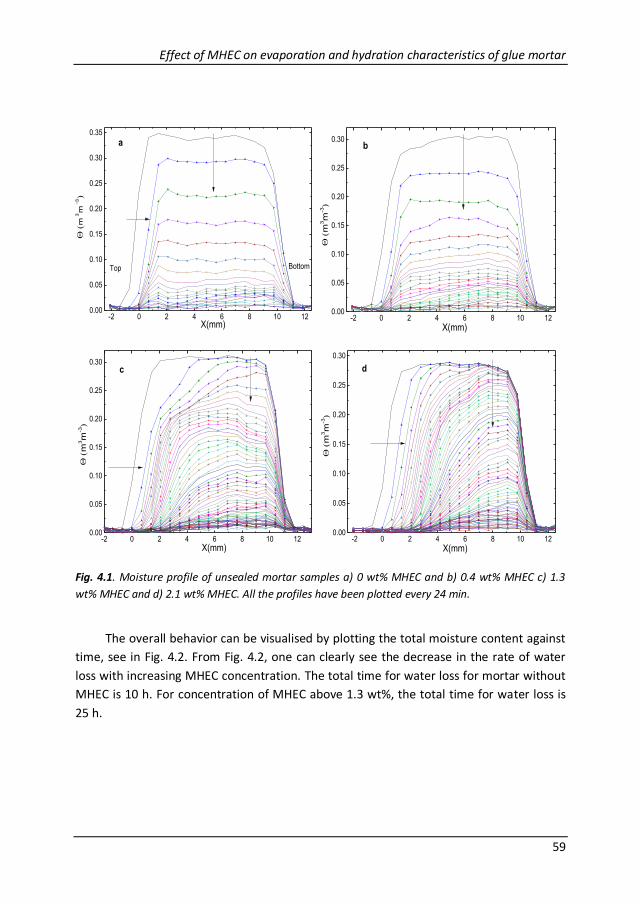
Effect of MHEC on evaporation and hydration characteristics of glue mortar
59
Fig. 4.1. Moisture profile of unsealed mortar samples a) 0 wt% MHEC and b) 0.4 wt% MHEC c) 1.3
wt% MHEC and d) 2.1 wt% MHEC. All the profiles have been plotted every 24 min.
The overall behavior can be visualised by plotting the total moisture content against
time, see in Fig. 4.2. From Fig. 4.2, one can clearly see the decrease in the rate of water
loss with increasing MHEC concentration. The total time for water loss for mortar without
MHEC is 10 h. For concentration of MHEC above 1.3 wt%, the total time for water loss is
25 h.
-2 0 2 4 6 8 10 120.00
0.05
0.10
0.15
0.20
0.25
0.30
X(mm)
(
m3m
-3)
c
-2 0 2 4 6 8 10 120.00
0.05
0.10
0.15
0.20
0.25
0.30
(
m3m
-3)
X(mm)
d
-2 0 2 4 6 8 10 120.00
0.05
0.10
0.15
0.20
0.25
0.30
0.35
(m3m-3)
X(mm)
Top Bottom
a
-2 0 2 4 6 8 10 120.00
0.05
0.10
0.15
0.20
0.25
0.30
(
m3m
-3)
X(mm)
b
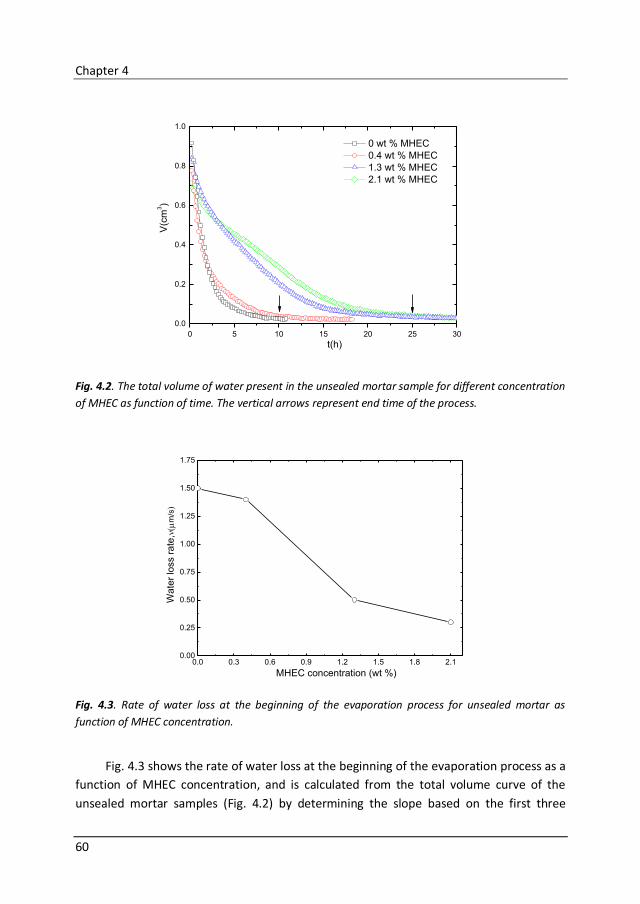
Chapter 4
60
0 5 10 15 20 25 30
0.0
0.2
0.4
0.6
0.8
1.0
V(c
m3)
t(h)
0 wt % MHEC
0.4 wt % MHEC
1.3 wt % MHEC
2.1 wt % MHEC
0.0 0.3 0.6 0.9 1.2 1.5 1.8 2.10.00
0.25
0.50
0.75
1.00
1.25
1.50
1.75
Wate
r lo
ss r
ate
,(
m/s)
MHEC concentration (wt %)
Fig. 4.2. The total volume of water present in the unsealed mortar sample for different concentration
of MHEC as function of time. The vertical arrows represent end time of the process.
Fig. 4.3. Rate of water loss at the beginning of the evaporation process for unsealed mortar as
function of MHEC concentration.
Fig. 4.3 shows the rate of water loss at the beginning of the evaporation process as a
function of MHEC concentration, and is calculated from the total volume curve of the
unsealed mortar samples (Fig. 4.2) by determining the slope based on the first three
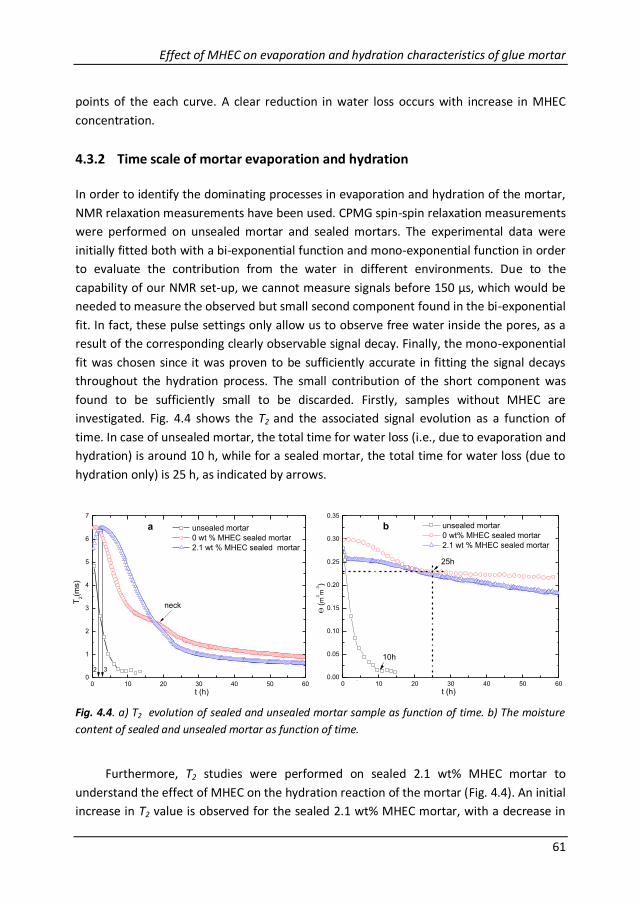
Effect of MHEC on evaporation and hydration characteristics of glue mortar
61
points of the each curve. A clear reduction in water loss occurs with increase in MHEC
concentration.
4.3.2 Time scale of mortar evaporation and hydration
In order to identify the dominating processes in evaporation and hydration of the mortar,
NMR relaxation measurements have been used. CPMG spin-spin relaxation measurements
were performed on unsealed mortar and sealed mortars. The experimental data were
initially fitted both with a bi-exponential function and mono-exponential function in order
to evaluate the contribution from the water in different environments. Due to the
capability of our NMR set-up, we cannot measure signals before 150 µs, which would be
needed to measure the observed but small second component found in the bi-exponential
fit. In fact, these pulse settings only allow us to observe free water inside the pores, as a
result of the corresponding clearly observable signal decay. Finally, the mono-exponential
fit was chosen since it was proven to be sufficiently accurate in fitting the signal decays
throughout the hydration process. The small contribution of the short component was
found to be sufficiently small to be discarded. Firstly, samples without MHEC are
investigated. Fig. 4.4 shows the T2 and the associated signal evolution as a function of
time. In case of unsealed mortar, the total time for water loss (i.e., due to evaporation and
hydration) is around 10 h, while for a sealed mortar, the total time for water loss (due to
hydration only) is 25 h, as indicated by arrows.
Fig. 4.4. a) T2 evolution of sealed and unsealed mortar sample as function of time. b) The moisture
content of sealed and unsealed mortar as function of time.
Furthermore, T2 studies were performed on sealed 2.1 wt% MHEC mortar to
understand the effect of MHEC on the hydration reaction of the mortar (Fig. 4.4). An initial
increase in T2 value is observed for the sealed 2.1 wt% MHEC mortar, with a decrease in
0 10 20 30 40 50 600
1
2
3
4
5
6
7
T
2(m
s)
t (h)
unsealed mortar
0 wt % MHEC sealed mortar
2.1 wt % MHEC sealed mortar
32
neck
a
0 10 20 30 40 50 600.00
0.05
0.10
0.15
0.20
0.25
0.30
0.35
(
m3m
-3)
t (h)
unsealed mortar
0 wt% MHEC sealed mortar
2.1 wt % MHEC sealed mortar
25h
10h
b
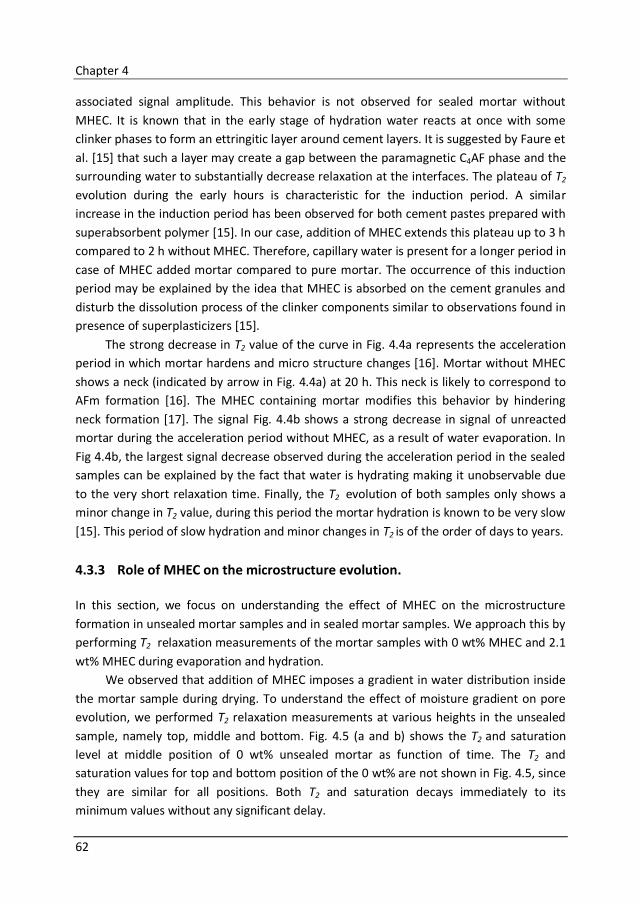
Chapter 4
62
associated signal amplitude. This behavior is not observed for sealed mortar without
MHEC. It is known that in the early stage of hydration water reacts at once with some
clinker phases to form an ettringitic layer around cement layers. It is suggested by Faure et
al. [15] that such a layer may create a gap between the paramagnetic C4AF phase and the
surrounding water to substantially decrease relaxation at the interfaces. The plateau of T2
evolution during the early hours is characteristic for the induction period. A similar
increase in the induction period has been observed for both cement pastes prepared with
superabsorbent polymer [15]. In our case, addition of MHEC extends this plateau up to 3 h
compared to 2 h without MHEC. Therefore, capillary water is present for a longer period in
case of MHEC added mortar compared to pure mortar. The occurrence of this induction
period may be explained by the idea that MHEC is absorbed on the cement granules and
disturb the dissolution process of the clinker components similar to observations found in
presence of superplasticizers [15].
The strong decrease in T2 value of the curve in Fig. 4.4a represents the acceleration
period in which mortar hardens and micro structure changes [16]. Mortar without MHEC
shows a neck (indicated by arrow in Fig. 4.4a) at 20 h. This neck is likely to correspond to
AFm formation [16]. The MHEC containing mortar modifies this behavior by hindering
neck formation [17]. The signal Fig. 4.4b shows a strong decrease in signal of unreacted
mortar during the acceleration period without MHEC, as a result of water evaporation. In
Fig 4.4b, the largest signal decrease observed during the acceleration period in the sealed
samples can be explained by the fact that water is hydrating making it unobservable due
to the very short relaxation time. Finally, the T2 evolution of both samples only shows a
minor change in T2 value, during this period the mortar hydration is known to be very slow
[15]. This period of slow hydration and minor changes in T2 is of the order of days to years.
4.3.3 Role of MHEC on the microstructure evolution.
In this section, we focus on understanding the effect of MHEC on the microstructure
formation in unsealed mortar samples and in sealed mortar samples. We approach this by
performing T2 relaxation measurements of the mortar samples with 0 wt% MHEC and 2.1
wt% MHEC during evaporation and hydration.
We observed that addition of MHEC imposes a gradient in water distribution inside
the mortar sample during drying. To understand the effect of moisture gradient on pore
evolution, we performed T2 relaxation measurements at various heights in the unsealed
sample, namely top, middle and bottom. Fig. 4.5 (a and b) shows the T2 and saturation
level at middle position of 0 wt% unsealed mortar as function of time. The T2 and
saturation values for top and bottom position of the 0 wt% are not shown in Fig. 4.5, since
they are similar for all positions. Both T2 and saturation decays immediately to its
minimum values without any significant delay.
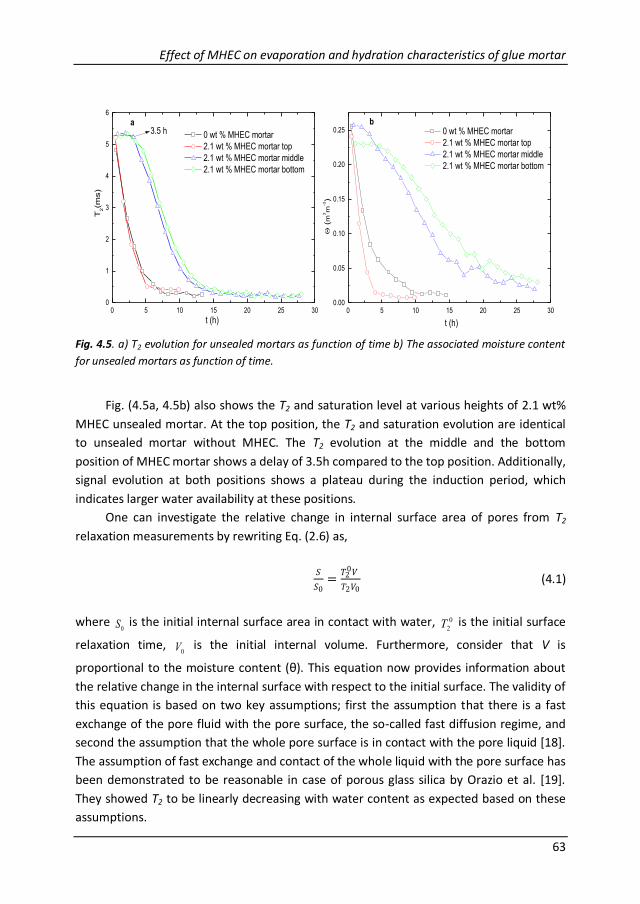
Effect of MHEC on evaporation and hydration characteristics of glue mortar
63
Fig. 4.5. a) T2 evolution for unsealed mortars as function of time b) The associated moisture content
for unsealed mortars as function of time.
Fig. (4.5a, 4.5b) also shows the T2 and saturation level at various heights of 2.1 wt%
MHEC unsealed mortar. At the top position, the T2 and saturation evolution are identical
to unsealed mortar without MHEC. The T2 evolution at the middle and the bottom
position of MHEC mortar shows a delay of 3.5h compared to the top position. Additionally,
signal evolution at both positions shows a plateau during the induction period, which
indicates larger water availability at these positions.
One can investigate the relative change in internal surface area of pores from T2
relaxation measurements by rewriting Eq. (2.6) as,
𝑆
𝑆0=
𝑇20𝑉
𝑇2𝑉0 (4.1)
where 0S
is the initial internal surface area in contact with water, 0
2T is the initial surface
relaxation time, 0V
is the initial internal volume. Furthermore, consider that V is
proportional to the moisture content (θ). This equation now provides information about
the relative change in the internal surface with respect to the initial surface. The validity of
this equation is based on two key assumptions; first the assumption that there is a fast
exchange of the pore fluid with the pore surface, the so-called fast diffusion regime, and
second the assumption that the whole pore surface is in contact with the pore liquid [18].
The assumption of fast exchange and contact of the whole liquid with the pore surface has
been demonstrated to be reasonable in case of porous glass silica by Orazio et al. [19].
They showed T2 to be linearly decreasing with water content as expected based on these
assumptions.
0 5 10 15 20 25 300
1
2
3
4
5
6
T2(m
s)
t (h)
0 wt % MHEC mortar
2.1 wt % MHEC mortar top
2.1 wt % MHEC mortar middle
2.1 wt % MHEC mortar bottom
3.5 ha
0 5 10 15 20 25 300.00
0.05
0.10
0.15
0.20
0.25
(m
3m
-3)
t (h)
0 wt % MHEC mortar
2.1 wt % MHEC mortar top
2.1 wt % MHEC mortar middle
2.1 wt % MHEC mortar bottom
b
Chapter 4
64
Fig. 4.6. Relative internal surface plotted as a function of moisture content for sealed mortars and
unsealed mortars. The dashed lines are guide to the eye.
Fig. 4.6 shows the relative internal surface as a function of moisture content for
unsealed and sealed mortar samples. For a sealed sample with 0 wt% and 2.1 wt% MHEC,
a steep increase in the internal surface is observed; note that the graph heads towards a 6
times higher internal surface compared to unsealed top of the sample and open MHEC
free sample. Since the mortar is sealed, no water is lost as a result of evaporation and the
change in T2 is the result of pore evolution due to hydration increasing the surface area. A
similar 6 time increase in the specific surface area is also reported by Barberon et al., for
mortar with a w/c ratio of 0.65 [20]. The internal surface evolution for sealed mortar with
2.1 wt% MHEC is similar to sealed mortar with 0 wt% MHEC. This indicates little effect of
MHEC on the pore evolution in the sealed mortar.
In case of unsealed mortar with 0 wt% MHEC, no noticeable change in the internal
surface area is observed until a saturation value of about 0.1 is reached. Below that, a
slight increase in internal surface area may be observed, which might be a consequence of
the experimental error at these low concentration. The internal surface evolution for
unsealed mortar with 2.1 wt% MHEC at the top position is similar to unsealed mortar with
0 wt% MHEC. In essence, the observed constant value for S/S0 indicates the pore structure
does not significantly change. As a result of fast evaporation of water, at the mortar
surface or whole sample in case of absence of MHEC, hydration will be limited. The
conclusion that the pore structure does not significantly change is only true under the
assumption that the complete internal surface is covered with water even at these low
0.00 0.05 0.10 0.15 0.20 0.250
1
2
3
4
5
6
7 2.1 wt % unsealed top
2.1 wt % unsealed middle
2.1 wt % unsealed bottom
0 wt % unsealed
0 wt % sealed
2.1 wt % sealed
S/S
0
(m3m)
Effect of MHEC on evaporation and hydration characteristics of glue mortar
65
concentrations. This is reasonable since for any hydration to occur water is required and
would be in contact with the new surface, in addition, it is reasonable to assume that the
hydrophilic nature of the cement will ensure the internal pore structure to be fully wetted.
As expected, the change in internal surface for unsealed mortar with 2.1 wt% MHEC
at middle and bottom positions falls within the value found for the sealed mortar samples
and unsealed mortar with 0 wt% MHEC, and shows characteristics of both hydration and
evaporation. The inhomogeneous water distribution of MHEC mortar causes different
level of hydration throughout the material.
4.3.4 Influence of MHEC on the pore size distribution
The aim of this section is to understand the effect of MHEC on the microstructure of
mortar samples after 2 days of drying. This is achieved by means of mercury intrusion
porosimetry (MIP). Fig. 4.7 shows the incremental pore volume of various mortar samples
as function of pore diameter. The sealed mortar with 2.1 wt% MHEC (circle) and without
MHEC (triangle) show a similar pore size distribution (10-100 nm), except for a small shift
to lower pore sizes for MHEC containing mortar. The pore size distribution of unsealed
mortar without MHEC (square) shows a significant shift toward larger pore sizes (500 nm –
5 µm). The observed shift is more than one order in magnitude compared to sealed
mortar, which indicates either poor hydration or formation of micro-cracks as a result of
fast shrinkage as a consequence of fast drying. The pore size distribution of unsealed
mortar with 2.1 wt% MHEC (diamond) shows two peaks, one with pore size distribution
(10-100 nm) similar to sealed mortar and the second with pore size distribution (500 nm-5
µm) similar to unsealed mortar with 0 wt% MHEC. This means that unsealed mortar with
2.1 wt% MHEC shows both characteristics of a sealed and open sample. As a result of
water retention one can expect a significant level of hydration in the sample. The higher
availability of water ensures a higher degree of hydration resulting the formation of
smaller pores.
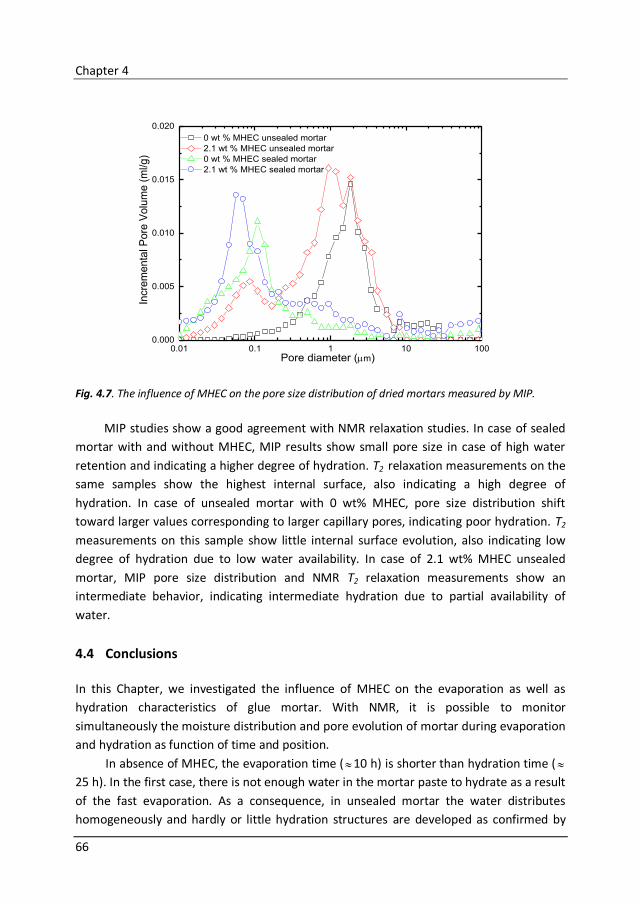
Chapter 4
66
Fig. 4.7. The influence of MHEC on the pore size distribution of dried mortars measured by MIP.
MIP studies show a good agreement with NMR relaxation studies. In case of sealed
mortar with and without MHEC, MIP results show small pore size in case of high water
retention and indicating a higher degree of hydration. T2 relaxation measurements on the
same samples show the highest internal surface, also indicating a high degree of
hydration. In case of unsealed mortar with 0 wt% MHEC, pore size distribution shift
toward larger values corresponding to larger capillary pores, indicating poor hydration. T2
measurements on this sample show little internal surface evolution, also indicating low
degree of hydration due to low water availability. In case of 2.1 wt% MHEC unsealed
mortar, MIP pore size distribution and NMR T2 relaxation measurements show an
intermediate behavior, indicating intermediate hydration due to partial availability of
water.
4.4 Conclusions
In this Chapter, we investigated the influence of MHEC on the evaporation as well as
hydration characteristics of glue mortar. With NMR, it is possible to monitor
simultaneously the moisture distribution and pore evolution of mortar during evaporation
and hydration as function of time and position.
In absence of MHEC, the evaporation time (10 h) is shorter than hydration time (
25 h). In the first case, there is not enough water in the mortar paste to hydrate as a result
of the fast evaporation. As a consequence, in unsealed mortar the water distributes
homogeneously and hardly or little hydration structures are developed as confirmed by
0.01 0.1 1 10 1000.000
0.005
0.010
0.015
0.020
0 wt % MHEC unsealed mortar
2.1 wt % MHEC unsealed mortar
0 wt % MHEC sealed mortar
2.1 wt % MHEC sealed mortar
In
cre
menta
l P
ore
Volu
me (
ml/g)
Pore diameter (m)
Effect of MHEC on evaporation and hydration characteristics of glue mortar
67
MIP and T2 relaxation studies. In presence of MHEC at concentrations of 1.3 wt% and
higher, and in case of unsealed mortar, the evaporation time is comparable to hydration
time and development of a front imparts a different level of moisture distribution in the
mortar. As a consequence, at the top of the mortar mainly evaporation happens and
insufficient water is available for hydration of the mortar paste. At the bottom of mortar,
water reduces very slowly and maintains minimum water level required for full hydration.
The good hydration at the bottom is confirmed by MIP and T2 relaxation studies.
Additionally, we notice a reduction in evaporation of mortar with increase in MHEC
concentration. This is surprising, since our studies of MHEC solution in capillaries do not
show reduction in evaporation. This might be due to transport of MHEC towards drying
surface, where MHEC concentration may exceed the solubility concentration and
deposition of MHEC film occurs at surface. This MHEC film probably acts as a barrier for
water vapor. This hypothesis remains to be proven.
Chapter 4
68
References
1. J. Rottstegge, M. Arnold, L. Herschke, G. Glasser, M. Wilhelm, H. W. Spiess, W. D.
Hegeth, Solid state NMR and LVSEM studies on the hardening of latex modified tile
mortar systems, Cem. Concr. Res. 35 (2005) 2233-2243.
2. R. Zurbriggen, M. Herwegh, A. Jenni, A. De Gasparo, L. Holzer, The influence of organic
additives on the microstructural development and properties of mortars, ZKG
International. 60 (2007) 62-67.
3. A. Jenni, L. Holzer, R. Zurbriggen, M. Herwegh, Influence of polymers on
microstructure and adhesive strength of cementitious tile adhesive mortars, Cem.
Concr. Res. 35 (2005) 35-50.
4. N. K. Singh, P. C. Mishra, V. K. Singh, K. K. Narang, Effects of hydroxyethyl cellulose and
oxalic acid on the properties of cement, Cem. Concr. Compos. 33 (2003) 1319-1329.
5. Th. Bühler , R. Zurbriggen , U. Pieles , L. Huwiler , R. A. Raso, Dynamics of early skin
formation of tiling mortars investigated by microscopy and diffuse reflectance infrared
Fourier transformed spectroscopy, Cem. Concr. Compos. 37 (2013) 161–170.
6. A. P. A. Faiyas, S. J. F. Erich, M. van.Soestbergen, H. P. Huinink, O.C. G. Adan, T. G.
Nijland, Howmethylhydroxyethylcellulose influences drying in porous media, 23 (2015)
620-628.
7. L. Patural, P. Porion, H. Van Damme, A. Govin, P. Grosseau, B. Ruot, O. Devès, A pulsed
field gradient and NMR imaging investigations of the water retention mechanism by
cellulose ethers in mortars, Cem. Concr. Res. 40 (2010) 1378–1385.
8. I. Muller, 2006, Influence of cellulose ethers on the kinetics of early Portland cement
hydration. PhD thesis, Inst. F. Min. Wilhems-Universitet Muenster, ISSN 1618-2677.
9. J. Pourchez, P. Grosseau, R. Guyonnet, B. Ruot, 2006b, HEC influence on cement
hydration measured by conductometry. Cem. Concr. Res. 36 (2006) 1777–1780.
10. D. A. Silva, V. M. John, J. L. D. Ribeiro, H. R. Roman, Pore size distribution of hydrated
cement pastes modified with polymers, Cem. Concr. Res, 31 (2001)1177–84.
11. K. Kopinga, L. Pel, One-dimensional scanning of moisture in porous materials with
NMR, Rev. Sci. Instrum. 65 (1994) 3673-3681.
12. J. P. Korb, Curr. Opin. Colloid Interface Sci. 14 (2009) 192.
13. A. Valori, P. J. McDonald, K. L. Scrivener, The morphology of C-S-H: Lessons from 1H
nuclear magnetic resonance relaxometry, Cem. Concr. Res, 49 (2013) 65-81.
14. K. R. Brownstein and C. E. Tarr, Importance of classical diffusion in NMR studies of
water in biological cells. Phys. Rev. A. 19 (1979) 2446.
15. P. F. Faure, Stephane Rodts, Proton relaxation as a probe for setting cement paste,
Magn. Reson. Imaging. 26 (2008) 1183-1196.
16. Jeffrey W. Bullard, et al., Mechanisms of cement hydration, Cement and Concrete
Research, 41 (2011) 1208-1223.
Effect of MHEC on evaporation and hydration characteristics of glue mortar
69
17. J. Tritt-Goc, N. Pislewski, S. Koscielski, F. Milia, The influence of the superplasticizer on
the hydration and freezing processes in white cement studied in white cement studied
by 1H spin–lattice relaxation time and single point imaging. Cement Concr Res,
30(2000) 931–6.
18. W. P. Halperin, Application of spin-spin relaxation to measurement of surface area and
pore size distributions in a hydrating cement paste, Magnetic Resonance Imaging, 12
(1994) 169,
19. Orazio et al., Application of nuclear magnetic resonance pore structure analysis to
porous silica glass, Journal of Applied Physics 65 (1989) 742.
20. F. Barberon, J.-P. Korb, D. Petit, V. Morin, E. Bermejo, What is the specific area of
porous cement-based material? A nuclear magnetic relaxation dispersion approach,
Magn. Reson. Imaging. 21 (2003) 355.

70
Transport of water-soluble polymer during drying of a model porous media
71
Chapter 5
Transport of a water soluble polymer
during drying of a model porous medium
This Chapter presents an experimental investigation on transport of
Methylhydroxyethylcellulose (MHEC) during drying of a model porous material. Nuclear
Magnetic Resonance Imaging (NMR) and Thermo Gravimetric Analysis (TGA) are used to
measure water and MHEC transport respectively. MHEC is added to glue mortars inorder
to increase open time, i.e., the time period during which tiles can be applied with
sufficiently good adhesion. Previous work (Chapter 4) showed that MHEC promotes a
receding front during drying and therefore leads to differences in the degree of hydration
throughout the mortar sample, i.e., the top surface shows poor hydration and the bottom
surface shows good hydration. In this study, we investigate the transport of MHEC during
drying of a model porous material, consisting of packed glass beads saturated with an
aqueous MHEC solution. At MHEC concentration less than 1.3 wt%, homogeneous drying is
observed, enabling advective transport of MHEC towards the drying surface. In this case,
accumulation of MHEC may form a skin at the top surface and below this skin layer, a gel
zone may form, which allows migration of water towards the evaporation surface. When
the MHEC concentration is above 1.3 wt%, front receding drying is observed, which
prevents transport of MHEC, resulting in a more homogeneous distribution of MHEC.
This Chapter is adapted from A.P.A. Faiyas et al., Drying Technology, 35 (2017) 1874-1886.
5.1 Introduction
Methylhydroxyethylcellulose (MHEC) is added to glue mortar to control open time. Open
time is the time period during which a tile can be applied with sufficiently good adhesion.
MHEC is said to retain water enabling sufficient adhesion [1, 2]. During drying, a skin may
form that influences open time. The skin can be considered a surface layer ranging from
micron to tens of micron thickness and having different properties compared to the bulk
material. Different processes are reported to contribute to skin formation, such as,
evaporation, densification through transport of smaller inorganic mortar components,
hydration, carbonation, and accumulation of polymeric materials [3].
Chapter 5
72
Drying of porous media is a complex process [4, 5]. In most studies, drying in porous
media focuses on low-viscous fluids (e.g., water). In most cases, a porous material dries
homogeneously with a constant drying rate until a critical moisture content is reached [6].
In the first stage, drying is dominated by the external mass transfer (e.g., evaporation). At
the critical moisture content, the fluid path is no longer continuous and drying no longer
homogeneous. From this point onward, the drying process takes place by transport of
vapor and/or liquid films. In this stage, drying is dominated by internal mass transfer (e.g.,
internal vapor transport). Different transport processes inside porous materials may result
in similar drying behavior. After critical moisture content, the drying behavior is almost
similar to that observed in case of drying of squared or other shaped capillaries in which
liquid films are present in the corners of the capillaries [7, 8].
The evaporation rate at early stages largely depends on the external conditions, such
as air flow and humidity. Very fast drying may lead to formation of a dry skin. A skin can
also be the result of densification of the mortar by inorganic mortar components. During
drying, concentration of reactive cement particles at the top surface of mortar may occur,
where their rapid hydration could contribute to the reduction of open time by reducing
the free water content and stiffening of the paste [9]. Also carbonation can generate a
skin, typically consisting of a 10 μm thick layer of CaCO3 formed during the first 30 min of
air exposure. Finally, the flow of water during drying may transport MHEC to the mortar
surface, where it may deposit. This skin formation at the drying surface is suggested to be
the key process that determines the open time [3].
Only limited knowledge exists on the transport of polymers towards the drying
surface and skin formation during drying. Jenni et al. [9] investigated the skin formation of
cellulose ether (CE) and polyvinyl alcohol (PVA) modified mortar during open time and
considered that skin formation is a key factor that determines adhesion. The authors
showed that both organic and inorganic substances can transport toward the drying
surface along with the water flux. Bentz et al. [10] investigated the skin formation and
observed the transport of cellulose ether and small cement particles during drying.
Zurbriggen et al. [11] investigated skin formation by investigating the interface between
mortar and a glass plate to visualize the skin formation. When the glass plate is
illuminated from the side, the location where skin formed and appears dark prevented
wetting, whereas the fresh mortar that wetted the glass appears bright. Gasparo et al.
[12] reported a higher enrichment of CE at the mortar surface and a skin formation at the
mortar/air interface. They suggest that evaporation and corresponding water flow is the
reason for the observed CE enrichment. Unfortunately, their investigation does not
provide detailed explanation of the transport processes.
Mortars are complex and the identification of polymer in a mortar matrix is difficult,
especially in commercial formulations with low concentrations of 0-1 wt%. Our aim is to
understand the contribution of transport processes of MHEC on drying mortar, which is
Transport of water-soluble polymer during drying of a model porous media
73
driven by water transport. In Chapter 4, we have studied transport processes in reactive
media [2], which make interpretation quite challenging. To only investigate the effect of
transport process of MHEC on the distribution, a non-reactive model is needed.
Consequently, to unravel hydration effect from evaporation effect, packed glass beads
were chosen as a non-reactive model material. We have chosen packed glass beads as the
model porous media, instead of other materials such as sintered Al2O3, because, the pore
size of the packed glass beads can be easily manipulated by changing bead size, and MHEC
can be easily extracted from the bead surface. Glass beads with three different diameters
were used to understand the influence of pore size and structure on the MHEC
distribution during drying. Some 2D model porous systems consisting of glass beads exist,
allowing imaging the drying process using a camera [13, 14, 15]. To measure fluid
distributions inside 3D porous materials, techniques like synchrotron X-ray tomography
[16] and Nuclear Magnetic Resonance (NMR) imaging [17, 18, 19] allow non-invasive
probing of moisture with a sufficiently high spatial and time resolution. For this study,
NMR was used to monitor the moisture distribution during drying process. Unfortunately,
NMR is not able to determine the MHEC distribution. Consequently, Thermo Gravimetric
Analysis (TGA) was chosen as an analysis technique for the MHEC distribution.
The goal of this study is to understand the transport behavior of MHEC during drying
in a model porous medium saturated with an MHEC solution. For the first time, an
attempt is made to link MHEC to the transport processes during the drying process using
NMR and correlate final distribution of MHEC to the drying processes. The following
specific research questions are addressed: 1) How does the pore size influence the drying
behavior of porous media saturated with MHEC? 2) How does the pore size influence the
transport of MHEC?
5.2 Materials and Method
5.2.1 Methylhydroxyethylcellulose (MHEC)
Methylhydroxyethylcellulose (MHEC) is water soluble cellulose ether, synthesized from
cellulose by substituting methyl and ethylene oxide groups by an etherification process. A
commercial grade MHEC (Tylose MHS 6000 P6), provided by SE Tylose GmbH & Co.KG,
Germany, with a degree of substitution (DSME, ME=Methyl) of 1.3 and a molar degree of
substitution (MSHE, HE=Hydroxyethyl) of 0.3, we chose this MHEC as a model system being
the most standard modified cellulose being commonly used for influencing drying
properties for cementitious materials, such as glue mortar. The MHEC solutions were
prepared by heating 200 ml of water to 80 °C allowing the dissolution of MHEC. The
solution was homogenized by stirring the solution with a magnetic stirrer at 500 rpm for
two days. Finally, the solution was cooled to room temperature.
Chapter 5
74
The dynamic viscosity of MHEC solutions was measured with a TA-Instruments AR-
1000 rheometer. To investigate the effect of viscosity, a concentration range of MHEC was
selected. Table 5.1 shows the dynamic viscosity for different MHEC concentration.
Obviously, the viscosity value of 4.3 wt% MHEC varies four orders of magnitude compared
to 0 wt% MHEC.
The surface tension as a function of MHEC concentration is shown in Table 5.1. A
conventional pendant-drop technique was used to measure the surface tension of the
MHEC solutions (DSA 100 Drop Shape Analyzer). The surface tension of MHEC solutions
were determined by fitting the drop shape to the Young Laplace equation, which relates
the interfacial tension to the drop shape. The table shows a decrease in surface tension
with increasing MHEC concentration, wherein the most pronounced decrease is observed
at low MHEC concentrations.
The contact angle for different MHEC concentration (Table 5.1) is determined on
silica glass. The contact angle was determined using a data physics OCA-20 contact angle
instrument and using the sessile drop method. An increase in contact angle is observed
with increasing MHEC concentration.
5.2.2 Drying experiments
The bead diameters used for this study are 1 mm, 500 μm and 50 μm, respectively. The
different bead diameters were used to make model porous media with different pore
sizes inorder to investigate the influence of pore size, and corresponding capillary forces,
on drying and transport of MHEC. The beads are cleaned with de-mineralized water and
an acetone solution. After oven drying, the beads are put in a cylindrical glass sample
holder with a diameter of 18 mm and a length of 10 mm for an NMR drying measurement.
The samples were first packed with beads and each sample was vacuum saturated with
pure water and increasing concentrations of MHEC solution, namely 0.4 wt%, 1.3 wt%, 2.1
wt% and 4.3 wt%. Each sample was vacuum saturated for 3 days to ensure full saturation.
The drying was performed using an air flow of 1 l min-1
, with a close to zero relative
humidity on top of the sample. The experiments were performed at the room
temperature (20 °C), although the authors are aware that the temperature is influencing,
especially the evaporation process, this was beyond the scope of this study.
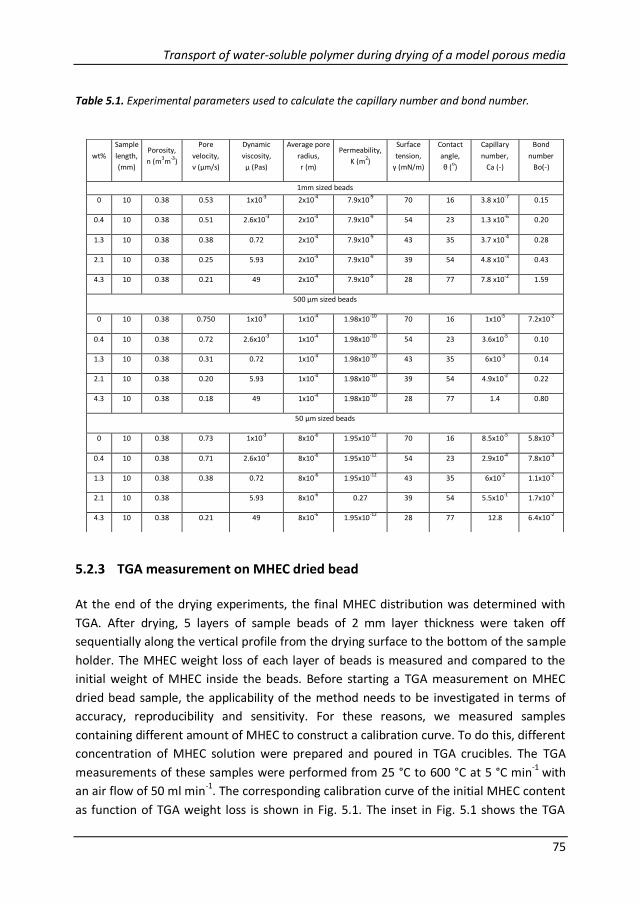
Transport of water-soluble polymer during drying of a model porous media
75
Table 5.1. Experimental parameters used to calculate the capillary number and bond number.
5.2.3 TGA measurement on MHEC dried bead
At the end of the drying experiments, the final MHEC distribution was determined with
TGA. After drying, 5 layers of sample beads of 2 mm layer thickness were taken off
sequentially along the vertical profile from the drying surface to the bottom of the sample
holder. The MHEC weight loss of each layer of beads is measured and compared to the
initial weight of MHEC inside the beads. Before starting a TGA measurement on MHEC
dried bead sample, the applicability of the method needs to be investigated in terms of
accuracy, reproducibility and sensitivity. For these reasons, we measured samples
containing different amount of MHEC to construct a calibration curve. To do this, different
concentration of MHEC solution were prepared and poured in TGA crucibles. The TGA
measurements of these samples were performed from 25 °C to 600 °C at 5 °C min-1
with
an air flow of 50 ml min-1. The corresponding calibration curve of the initial MHEC content
as function of TGA weight loss is shown in Fig. 5.1. The inset in Fig. 5.1 shows the TGA
wt%
Sample
length,
(mm)
Porosity,
n (m3m
-3)
Pore
velocity,
ν (μm/s)
Dynamic
viscosity,
µ (Pas)
Average pore
radius,
r (m)
Permeability,
K (m2)
Surface
tension,
γ (mN/m)
Contact
angle,
θ (o)
Capillary
number,
Ca (-)
Bond
number
Bo(-)
1mm sized beads
0 10 0.38 0.53 1x10⁻³
2x10⁻⁴
7.9x10⁻⁹
70 16 3.8 x10⁻⁷
0.15
0.4 10 0.38 0.51 2.6x10⁻³
2x10⁻⁴
7.9x10⁻⁹
54 23 1.3 x10⁻⁶
0.20
1.3 10 0.38 0.38 0.72 2x10⁻⁴
7.9x10⁻⁹
43 35 3.7 x10⁻⁴
0.28
2.1 10 0.38 0.25 5.93 2x10⁻⁴
7.9x10⁻⁹
39 54 4.8 x10⁻³
0.43
4.3 10 0.38 0.21 49 2x10⁻⁴
7.9x10⁻⁹
28 77 7.8 x10⁻²
1.59
500 µm sized beads
0 10 0.38 0.750 1x10⁻³
1x10⁻⁴
1.98x10⁻¹⁰
70 16 1x10⁻⁵
7.2x10⁻²
0.4 10 0.38 0.72 2.6x10⁻³
1x10⁻⁴
1.98x10⁻¹⁰
54 23 3.6x10⁻⁵
0.10
1.3 10 0.38 0.31 0.72 1x10⁻⁴
1.98x10⁻¹⁰
43 35 6x10⁻³
0.14
2.1 10 0.38 0.20 5.93 1x10⁻⁴
1.98x10⁻¹⁰
39 54 4.9x10⁻²
0.22
4.3 10 0.38 0.18 49 1x10⁻⁴
1.98x10⁻¹⁰
28 77 1.4 0.80
50 µm sized beads
0 10 0.38 0.73 1x10⁻³
8x10⁻⁶
1.95x10⁻¹²
70 16 8.5x10⁻⁵
5.8x10⁻³
0.4 10 0.38 0.71 2.6x10⁻³
8x10⁻⁶
1.95x10⁻¹²
54 23 2.9x10⁻⁴
7.8x10⁻³
1.3 10 0.38 0.38 0.72 8x10⁻⁶
1.95x10⁻¹²
43 35 6x10⁻²
1.1x10⁻²
2.1 10 0.38 5.93 8x10⁻⁶
0.27 39 54 5.5x10⁻¹
1.7x10⁻²
4.3 10 0.38 0.21 49 8x10⁻⁶
1.95x10⁻¹²
28 77 12.8 6.4x10⁻²
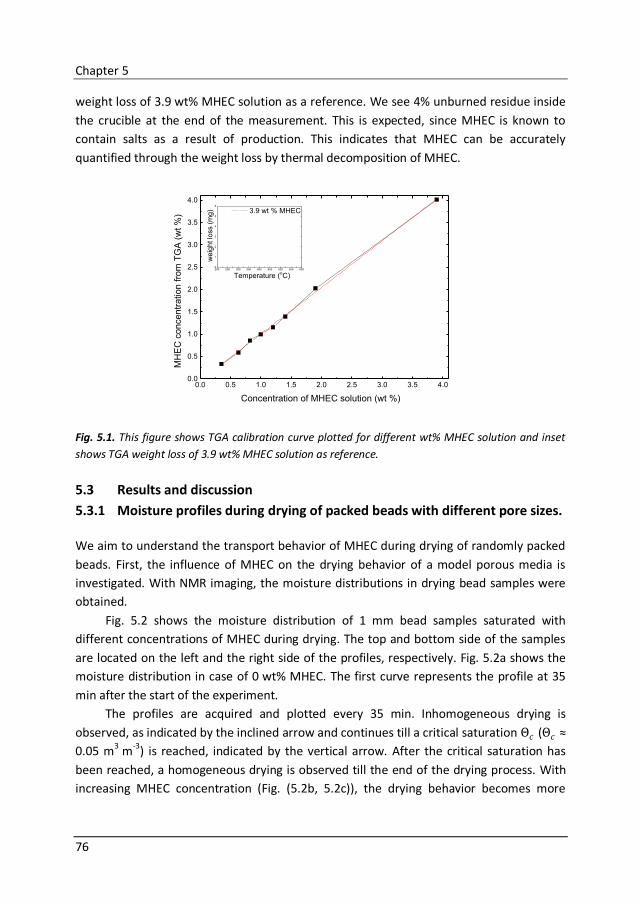
Chapter 5
76
0.0 0.5 1.0 1.5 2.0 2.5 3.0 3.5 4.00.0
0.5
1.0
1.5
2.0
2.5
3.0
3.5
4.0
200 250 300 350 400 450 500 550 6000
1
2
3
4
5
6
we
igh
t lo
ss (
mg)
Temperature (oC)
3.9 wt % MHEC
MH
EC
concentr
ation fro
m T
GA
(w
t %
)
Concentration of MHEC solution (wt %)
weight loss of 3.9 wt% MHEC solution as a reference. We see 4% unburned residue inside
the crucible at the end of the measurement. This is expected, since MHEC is known to
contain salts as a result of production. This indicates that MHEC can be accurately
quantified through the weight loss by thermal decomposition of MHEC.
Fig. 5.1. This figure shows TGA calibration curve plotted for different wt% MHEC solution and inset
shows TGA weight loss of 3.9 wt% MHEC solution as reference.
5.3 Results and discussion
5.3.1 Moisture profiles during drying of packed beads with different pore sizes.
We aim to understand the transport behavior of MHEC during drying of randomly packed
beads. First, the influence of MHEC on the drying behavior of a model porous media is
investigated. With NMR imaging, the moisture distributions in drying bead samples were
obtained.
Fig. 5.2 shows the moisture distribution of 1 mm bead samples saturated with
different concentrations of MHEC during drying. The top and bottom side of the samples
are located on the left and the right side of the profiles, respectively. Fig. 5.2a shows the
moisture distribution in case of 0 wt% MHEC. The first curve represents the profile at 35
min after the start of the experiment.
The profiles are acquired and plotted every 35 min. Inhomogeneous drying is
observed, as indicated by the inclined arrow and continues till a critical saturation Θ𝑐 (Θ𝑐 ≈
0.05 m3 m-3) is reached, indicated by the vertical arrow. After the critical saturation has
been reached, a homogeneous drying is observed till the end of the drying process. With
increasing MHEC concentration (Fig. (5.2b, 5.2c)), the drying behavior becomes more
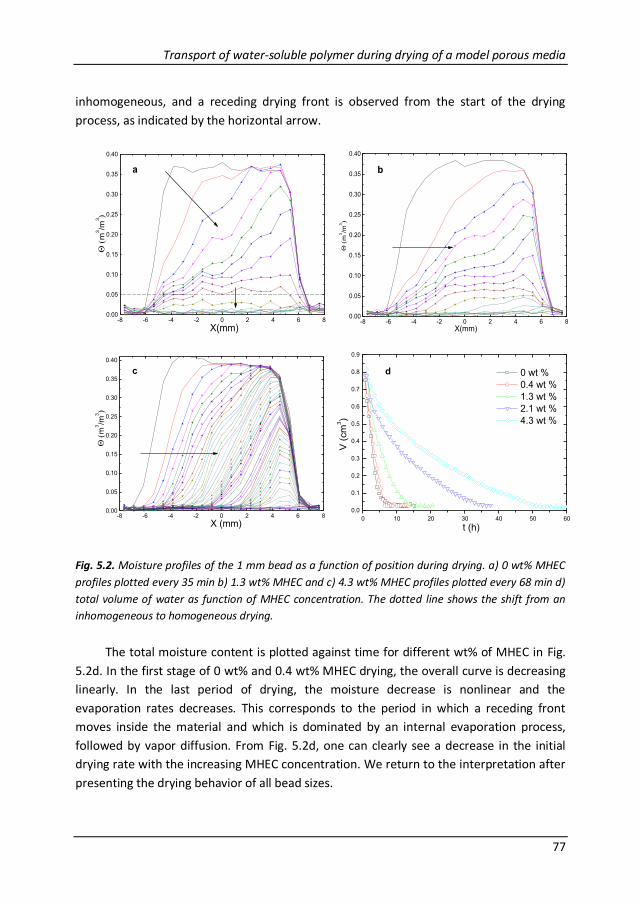
Transport of water-soluble polymer during drying of a model porous media
77
inhomogeneous, and a receding drying front is observed from the start of the drying
process, as indicated by the horizontal arrow.
Fig. 5.2. Moisture profiles of the 1 mm bead as a function of position during drying. a) 0 wt% MHEC
profiles plotted every 35 min b) 1.3 wt% MHEC and c) 4.3 wt% MHEC profiles plotted every 68 min d)
total volume of water as function of MHEC concentration. The dotted line shows the shift from an
inhomogeneous to homogeneous drying.
The total moisture content is plotted against time for different wt% of MHEC in Fig.
5.2d. In the first stage of 0 wt% and 0.4 wt% MHEC drying, the overall curve is decreasing
linearly. In the last period of drying, the moisture decrease is nonlinear and the
evaporation rates decreases. This corresponds to the period in which a receding front
moves inside the material and which is dominated by an internal evaporation process,
followed by vapor diffusion. From Fig. 5.2d, one can clearly see a decrease in the initial
drying rate with the increasing MHEC concentration. We return to the interpretation after
presenting the drying behavior of all bead sizes.
-8 -6 -4 -2 0 2 4 6 80.00
0.05
0.10
0.15
0.20
0.25
0.30
0.35
0.40
(
m3/m
3)
X(mm)
a
-8 -6 -4 -2 0 2 4 6 80.00
0.05
0.10
0.15
0.20
0.25
0.30
0.35
0.40
(
m3/m
3)
X (mm)
c
0 10 20 30 40 50 60
0.0
0.1
0.2
0.3
0.4
0.5
0.6
0.7
0.8
0.9
0 wt %
0.4 wt %
1.3 wt %
2.1 wt %
4.3 wt %
V
(cm
3)
t (h)
d
-8 -6 -4 -2 0 2 4 6 80.00
0.05
0.10
0.15
0.20
0.25
0.30
0.35
0.40
(
m3/m
3)
X(mm)
b
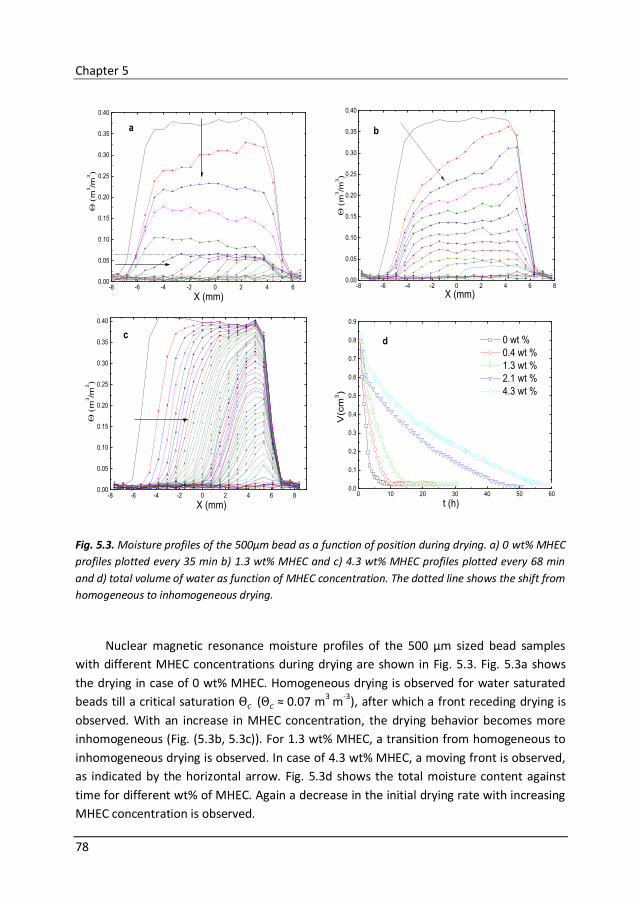
Chapter 5
78
Fig. 5.3. Moisture profiles of the 500μm bead as a function of position during drying. a) 0 wt% MHEC
profiles plotted every 35 min b) 1.3 wt% MHEC and c) 4.3 wt% MHEC profiles plotted every 68 min
and d) total volume of water as function of MHEC concentration. The dotted line shows the shift from
homogeneous to inhomogeneous drying.
Nuclear magnetic resonance moisture profiles of the 500 µm sized bead samples
with different MHEC concentrations during drying are shown in Fig. 5.3. Fig. 5.3a shows
the drying in case of 0 wt% MHEC. Homogeneous drying is observed for water saturated
beads till a critical saturation Θ𝑐 (Θ𝑐 ≈ 0.07 m
3 m
-3), after which a front receding drying is
observed. With an increase in MHEC concentration, the drying behavior becomes more
inhomogeneous (Fig. (5.3b, 5.3c)). For 1.3 wt% MHEC, a transition from homogeneous to
inhomogeneous drying is observed. In case of 4.3 wt% MHEC, a moving front is observed,
as indicated by the horizontal arrow. Fig. 5.3d shows the total moisture content against
time for different wt% of MHEC. Again a decrease in the initial drying rate with increasing
MHEC concentration is observed.
-8 -6 -4 -2 0 2 4 60.00
0.05
0.10
0.15
0.20
0.25
0.30
0.35
0.40
(
m3/m
3)
X (mm)
a
-8 -6 -4 -2 0 2 4 6 80.00
0.05
0.10
0.15
0.20
0.25
0.30
0.35
0.40
(
m3/m
3)
X (mm)
b
-8 -6 -4 -2 0 2 4 6 80.00
0.05
0.10
0.15
0.20
0.25
0.30
0.35
0.40
(
m3/m
3)
X (mm)
c
0 10 20 30 40 50 600.0
0.1
0.2
0.3
0.4
0.5
0.6
0.7
0.8
0.9
V(c
m3)
t (h)
0 wt %
0.4 wt %
1.3 wt %
2.1 wt %
4.3 wt %
d
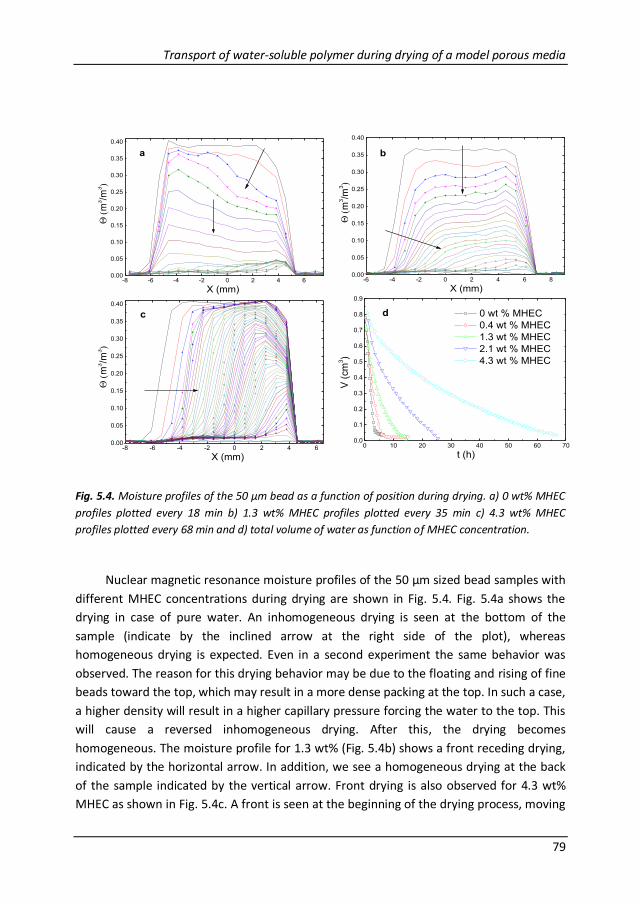
Transport of water-soluble polymer during drying of a model porous media
79
Fig. 5.4. Moisture profiles of the 50 μm bead as a function of position during drying. a) 0 wt% MHEC
profiles plotted every 18 min b) 1.3 wt% MHEC profiles plotted every 35 min c) 4.3 wt% MHEC
profiles plotted every 68 min and d) total volume of water as function of MHEC concentration.
Nuclear magnetic resonance moisture profiles of the 50 µm sized bead samples with
different MHEC concentrations during drying are shown in Fig. 5.4. Fig. 5.4a shows the
drying in case of pure water. An inhomogeneous drying is seen at the bottom of the
sample (indicate by the inclined arrow at the right side of the plot), whereas
homogeneous drying is expected. Even in a second experiment the same behavior was
observed. The reason for this drying behavior may be due to the floating and rising of fine
beads toward the top, which may result in a more dense packing at the top. In such a case,
a higher density will result in a higher capillary pressure forcing the water to the top. This
will cause a reversed inhomogeneous drying. After this, the drying becomes
homogeneous. The moisture profile for 1.3 wt% (Fig. 5.4b) shows a front receding drying,
indicated by the horizontal arrow. In addition, we see a homogeneous drying at the back
of the sample indicated by the vertical arrow. Front drying is also observed for 4.3 wt%
MHEC as shown in Fig. 5.4c. A front is seen at the beginning of the drying process, moving
-8 -6 -4 -2 0 2 4 60.00
0.05
0.10
0.15
0.20
0.25
0.30
0.35
0.40
(
m3/m
3)
X (mm)
a
-6 -4 -2 0 2 4 6 80.00
0.05
0.10
0.15
0.20
0.25
0.30
0.35
0.40
(
m3/m
3)
X (mm)
b
-8 -6 -4 -2 0 2 4 60.00
0.05
0.10
0.15
0.20
0.25
0.30
0.35
0.40
(
m3/m
3)
X (mm)
c
0 10 20 30 40 50 60 700.0
0.1
0.2
0.3
0.4
0.5
0.6
0.7
0.8
0.9
V (
cm
3)
t (h)
0 wt % MHEC
0.4 wt % MHEC
1.3 wt % MHEC
2.1 wt % MHEC
4.3 wt % MHEC
d
Chapter 5
80
inside the sample, as indicated by the horizontal arrow. Fig. 5.4d shows the total moisture
content against time for different weight percentage of MHEC. Again here a decrease in
the initial drying rate with increasing MHEC concentration is observed.
5.3.2 Forces determining the drying behavior
In this section, we focus on the forces determining the drying behavior. This is achieved by
investigating the capillary number (Ca) and bond number (Bo) dependence on the addition
of MHEC. With these numbers a phase diagram is constructed that is used to explain the
experimental findings.
One can characterize the drying inside a porous material using the capillary number
(Ca). The capillary number can be considered a ratio of length scales L and ξ, ( /LCa ),
where L is the size of the sample and ξ represents the width of the observed drying front.
One can rewrite the capillary number, using Darcy’s law and the Young-Laplace equation
𝑝𝑐 = 2𝛾 𝑐𝑜𝑠 𝜃 /𝑟 to obtain [1]
𝐶𝑎 ≡𝐿𝑛𝜈𝜂𝑟
2 𝐾𝛾 𝑐𝑜𝑠 𝜃 , (5.1)
where n [-] represents the porosity, v [m/s] the initial fluid velocity, 𝜂 [Pa s] the viscosity, r
[m] the average pore radius, K [m2+ the permeability, γ *N/m+ the surface tension and 𝜃
[o] the contact angle. This equation shows that the drying behavior is mainly determined
by evaporation rate, viscosity, the permeability of the material, surface tension and the
contact angle of the pore liquid, considering that the pore radius, sample size and porosity
is constant for each sample. In essence, the equation describes the ratio between viscous
forces and capillary forces. When Ca<<1 capillary forces dominate over the viscous forces.
In case Ca >>1, the capillary forces no longer surpass the viscous forces in the permeable
material.
For large pore size materials, the effect of gravitational force on the drying cannot be
neglected. In that case the effect on drying inside a porous material can be characterized
using the bond number (Bo). The bond number is the ratio between gravitational forces
and the capillary forces.
𝐵𝑜 =𝜌𝑔ℎ𝑟
2𝛾 𝑐𝑜𝑠 𝜃, (5.2)
where ρ [kg/m3] is the liquid density, g [m/s2] the acceleration of gravity, h [m] is the
sample length, γ *N/m+ the surface tension and 𝜃[o] the contact angle. This equation
shows that the main parameters determining the effect on drying are the pore radius,
surface tension and the contact angle, considering that the sample height and liquid
density are constant for each sample. In case Bo<<1, the capillary force dominates over
Transport of water-soluble polymer during drying of a model porous media
81
the gravitational force, resulting in homogeneous drying of the material. In case Bo>> 1,
the gravitational force dominates over capillary force resulting in front drying.
To parameterize Ca and Bo, both the physical property values of liquid and the
properties of model porous media are required. The parameters determining the capillary
number and the bond number are given in Table 5.1 for all bead sizes. The physical
properties of the liquid, such as viscosity, surface tension and contact angle were given in
section 5.2.1. The other parameters to be determined for the model systems are porosity,
pore radius and permeability. The porosity of a packed bed determines the saturation
level, which can be easily obtained from the NMR experiment. The saturation level is the
result of the type of packing. For all bead sizes, our NMR experiments show a saturation
value of 0.37, which corresponds to close random packing. The typical highest form of
dense packing is a tetrahedral packing that exhibits the smallest void space. As such, this
results in the highest obtainable capillary pressure. Therefore, we chose tetrahedral voids
packing to calculate the pore radius, r 0.225R, where R is the diameter of the bead.
The permeability of the porous medium is the ability of the fluid flowing through a
porous media caused by a pressure difference. There are several approaches reported in
literature to calculate the permeability of porous media [20, 21, 22, 23]. Each of them
have their own accuracy and assumptions and some models are for mortars and concrete
only, since, those models are being used for pore size distributions. However, in our study,
we have chosen Carman-Kozeny model [24], as this model is often applied on packed
beads and powders. In the so-called ‘Carman and Kozeny’ model, or ‘hydraulic diameter’
model, the packed beads of porous media can be considered as a parallel sequence of
pores of which the cross sectional area has a complicated shape. The assumed laminar
flow through such a medium of parallel pores is described by the Hagen-Poiseuille law,
giving a relation for the interstitial velocity and the cross sectional shape, based on the
hydraulic diameter. Based on these starting points, Carman and Kozeny [24] derived their
equation to calculate the permeability of such packed beds,
𝐾 =𝑑𝑝
2𝜖3
)1( 2A (5.3)
where K [m2] is the permeability, dp [m] is the diameter of the bead and ε [m3m-3] is the
porosity of packing, 38.0 calculated from NMR moisture profiles (the experimental
range of porosity is considered between 0.35 and 0.67 [24]) and A is 36k, k is the so called
Carman-Kozeny constant with k=5 for beds packed with spherical particles. Flow
experiments on disordered packed beds of monodisperse spheres have resulted in values
for A in between 150 and 185 [25, 26]. Studies show that the Carman-Kozeny relation can
be used for dense, disordered packed beds, irrespective of particle size and shape [27, 28].
Although a variations of a factor of 2, our calculation of capillary number (Fig. 5.5) does
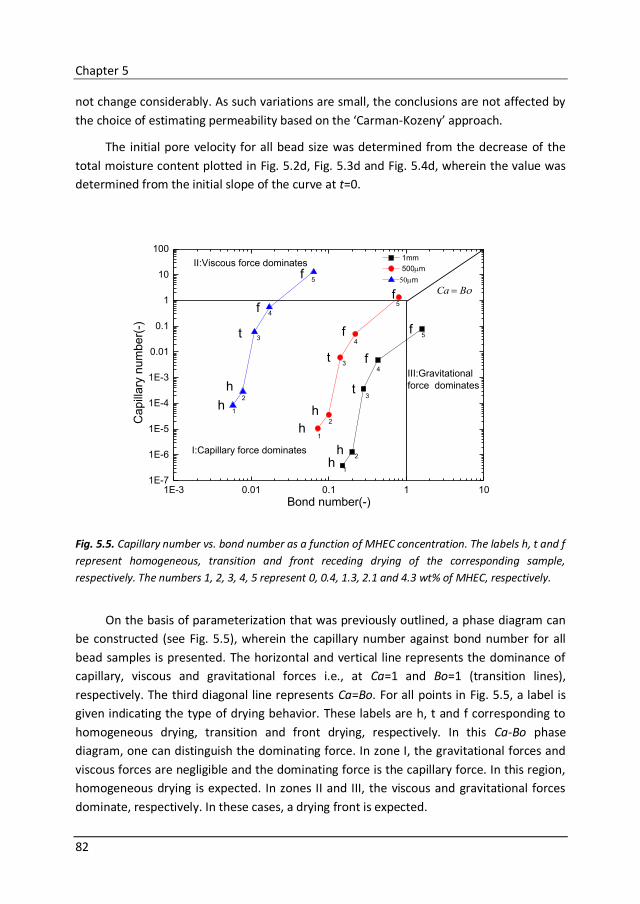
Chapter 5
82
not change considerably. As such variations are small, the conclusions are not affected by
the choice of estimating permeability based on the ‘Carman-Kozeny’ approach.
The initial pore velocity for all bead size was determined from the decrease of the
total moisture content plotted in Fig. 5.2d, Fig. 5.3d and Fig. 5.4d, wherein the value was
determined from the initial slope of the curve at t=0.
Fig. 5.5. Capillary number vs. bond number as a function of MHEC concentration. The labels h, t and f
represent homogeneous, transition and front receding drying of the corresponding sample,
respectively. The numbers 1, 2, 3, 4, 5 represent 0, 0.4, 1.3, 2.1 and 4.3 wt% of MHEC, respectively.
On the basis of parameterization that was previously outlined, a phase diagram can
be constructed (see Fig. 5.5), wherein the capillary number against bond number for all
bead samples is presented. The horizontal and vertical line represents the dominance of
capillary, viscous and gravitational forces i.e., at Ca=1 and Bo=1 (transition lines),
respectively. The third diagonal line represents Ca=Bo. For all points in Fig. 5.5, a label is
given indicating the type of drying behavior. These labels are h, t and f corresponding to
homogeneous drying, transition and front drying, respectively. In this Ca-Bo phase
diagram, one can distinguish the dominating force. In zone I, the gravitational forces and
viscous forces are negligible and the dominating force is the capillary force. In this region,
homogeneous drying is expected. In zones II and III, the viscous and gravitational forces
dominate, respectively. In these cases, a drying front is expected.
1E-3 0.01 0.1 1 101E-7
1E-6
1E-5
1E-4
1E-3
0.01
0.1
1
10
100
5
4
3
2
1
5
4
4
2
1
2
3
5
3f
f
t
hh
h
h
f
f
h
BCa
Capill
ary
num
ber(
-)
Bond number(-)
1mm
500m
m
I:Capillary force dominates
II:Viscous force dominates
III:Gravitational
force dominates
h
t
f
t
f
1
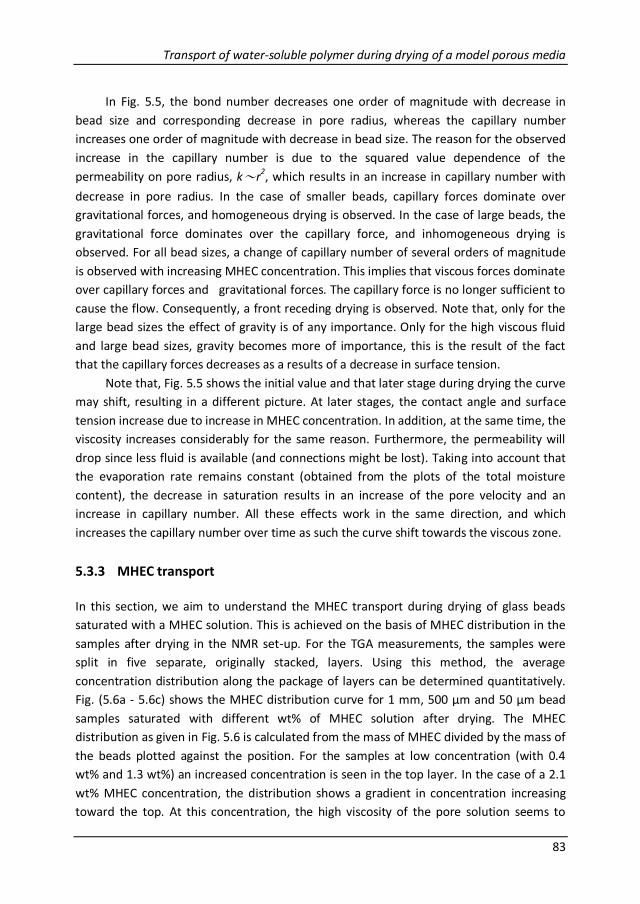
Transport of water-soluble polymer during drying of a model porous media
83
In Fig. 5.5, the bond number decreases one order of magnitude with decrease in
bead size and corresponding decrease in pore radius, whereas the capillary number
increases one order of magnitude with decrease in bead size. The reason for the observed
increase in the capillary number is due to the squared value dependence of the
permeability on pore radius, k~r2, which results in an increase in capillary number with
decrease in pore radius. In the case of smaller beads, capillary forces dominate over
gravitational forces, and homogeneous drying is observed. In the case of large beads, the
gravitational force dominates over the capillary force, and inhomogeneous drying is
observed. For all bead sizes, a change of capillary number of several orders of magnitude
is observed with increasing MHEC concentration. This implies that viscous forces dominate
over capillary forces and gravitational forces. The capillary force is no longer sufficient to
cause the flow. Consequently, a front receding drying is observed. Note that, only for the
large bead sizes the effect of gravity is of any importance. Only for the high viscous fluid
and large bead sizes, gravity becomes more of importance, this is the result of the fact
that the capillary forces decreases as a results of a decrease in surface tension.
Note that, Fig. 5.5 shows the initial value and that later stage during drying the curve
may shift, resulting in a different picture. At later stages, the contact angle and surface
tension increase due to increase in MHEC concentration. In addition, at the same time, the
viscosity increases considerably for the same reason. Furthermore, the permeability will
drop since less fluid is available (and connections might be lost). Taking into account that
the evaporation rate remains constant (obtained from the plots of the total moisture
content), the decrease in saturation results in an increase of the pore velocity and an
increase in capillary number. All these effects work in the same direction, and which
increases the capillary number over time as such the curve shift towards the viscous zone.
5.3.3 MHEC transport
In this section, we aim to understand the MHEC transport during drying of glass beads
saturated with a MHEC solution. This is achieved on the basis of MHEC distribution in the
samples after drying in the NMR set-up. For the TGA measurements, the samples were
split in five separate, originally stacked, layers. Using this method, the average
concentration distribution along the package of layers can be determined quantitatively.
Fig. (5.6a - 5.6c) shows the MHEC distribution curve for 1 mm, 500 μm and 50 μm bead
samples saturated with different wt% of MHEC solution after drying. The MHEC
distribution as given in Fig. 5.6 is calculated from the mass of MHEC divided by the mass of
the beads plotted against the position. For the samples at low concentration (with 0.4
wt% and 1.3 wt%) an increased concentration is seen in the top layer. In the case of a 2.1
wt% MHEC concentration, the distribution shows a gradient in concentration increasing
toward the top. At this concentration, the high viscosity of the pore solution seems to
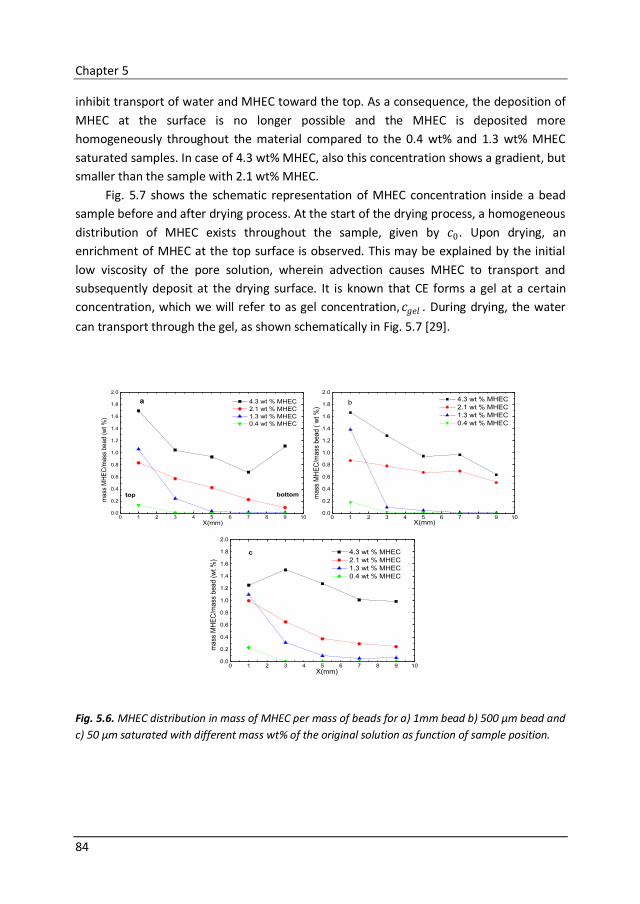
Chapter 5
84
inhibit transport of water and MHEC toward the top. As a consequence, the deposition of
MHEC at the surface is no longer possible and the MHEC is deposited more
homogeneously throughout the material compared to the 0.4 wt% and 1.3 wt% MHEC
saturated samples. In case of 4.3 wt% MHEC, also this concentration shows a gradient, but
smaller than the sample with 2.1 wt% MHEC.
Fig. 5.7 shows the schematic representation of MHEC concentration inside a bead
sample before and after drying process. At the start of the drying process, a homogeneous
distribution of MHEC exists throughout the sample, given by 𝑐0. Upon drying, an
enrichment of MHEC at the top surface is observed. This may be explained by the initial
low viscosity of the pore solution, wherein advection causes MHEC to transport and
subsequently deposit at the drying surface. It is known that CE forms a gel at a certain
concentration, which we will refer to as gel concentration, 𝑐𝑔𝑒𝑙 . During drying, the water
can transport through the gel, as shown schematically in Fig. 5.7 [29].
Fig. 5.6. MHEC distribution in mass of MHEC per mass of beads for a) 1mm bead b) 500 µm bead and
c) 50 µm saturated with different mass wt% of the original solution as function of sample position.
0 1 2 3 4 5 6 7 8 9 100.0
0.2
0.4
0.6
0.8
1.0
1.2
1.4
1.6
1.8
2.0
bottom
X(mm)
mass
MH
EC
/mass
bead (
wt %
)
4.3 wt % MHEC
2.1 wt % MHEC
1.3 wt % MHEC
0.4 wt % MHEC
a
top
0 1 2 3 4 5 6 7 8 9 100.0
0.2
0.4
0.6
0.8
1.0
1.2
1.4
1.6
1.8
2.0
X(mm)
mass
MH
EC
/mass
bead (
wt %
)
4.3 wt % MHEC
2.1 wt % MHEC
1.3 wt % MHEC
0.4 wt % MHEC
b
0 1 2 3 4 5 6 7 8 9 100.0
0.2
0.4
0.6
0.8
1.0
1.2
1.4
1.6
1.8
2.0
mass
MH
EC
/mass
bead (
wt %
)
X(mm)
4.3 wt % MHEC
2.1 wt % MHEC
1.3 wt % MHEC
0.4 wt % MHEC
c
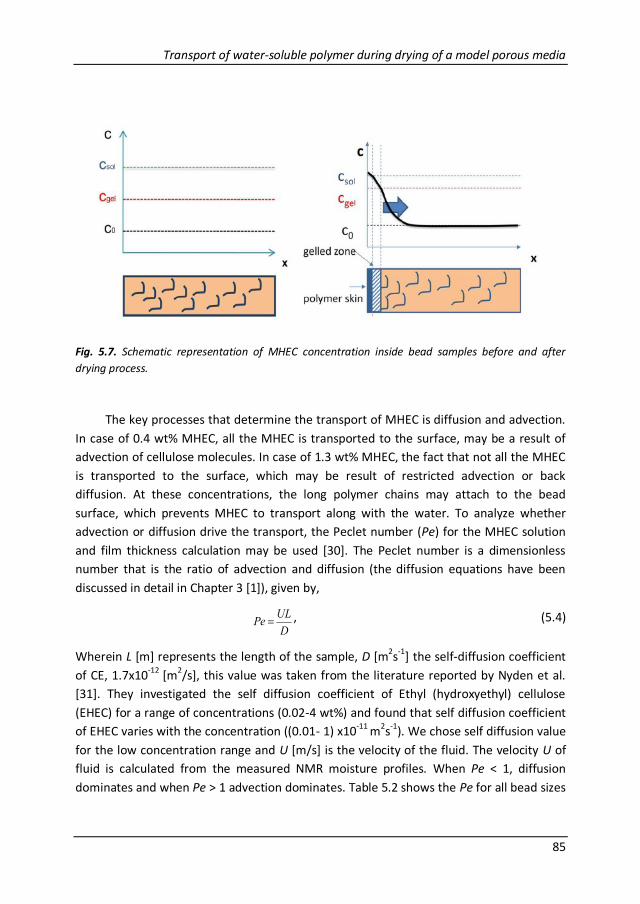
Transport of water-soluble polymer during drying of a model porous media
85
Fig. 5.7. Schematic representation of MHEC concentration inside bead samples before and after
drying process.
The key processes that determine the transport of MHEC is diffusion and advection.
In case of 0.4 wt% MHEC, all the MHEC is transported to the surface, may be a result of
advection of cellulose molecules. In case of 1.3 wt% MHEC, the fact that not all the MHEC
is transported to the surface, which may be result of restricted advection or back
diffusion. At these concentrations, the long polymer chains may attach to the bead
surface, which prevents MHEC to transport along with the water. To analyze whether
advection or diffusion drive the transport, the Peclet number (Pe) for the MHEC solution
and film thickness calculation may be used [30]. The Peclet number is a dimensionless
number that is the ratio of advection and diffusion (the diffusion equations have been
discussed in detail in Chapter 3 [1]), given by,
D
ULPe , (5.4)
Wherein L [m] represents the length of the sample, D [m2s-1] the self-diffusion coefficient
of CE, 1.7x10⁻¹²
[m2/s], this value was taken from the literature reported by Nyden et al.
[31]. They investigated the self diffusion coefficient of Ethyl (hydroxyethyl) cellulose
(EHEC) for a range of concentrations (0.02-4 wt%) and found that self diffusion coefficient
of EHEC varies with the concentration ((0.01- 1) x10-11 m2s-1). We chose self diffusion value
for the low concentration range and U [m/s] is the velocity of the fluid. The velocity U of
fluid is calculated from the measured NMR moisture profiles. When Pe < 1, diffusion
dominates and when Pe > 1 advection dominates. Table 5.2 shows the Pe for all bead sizes
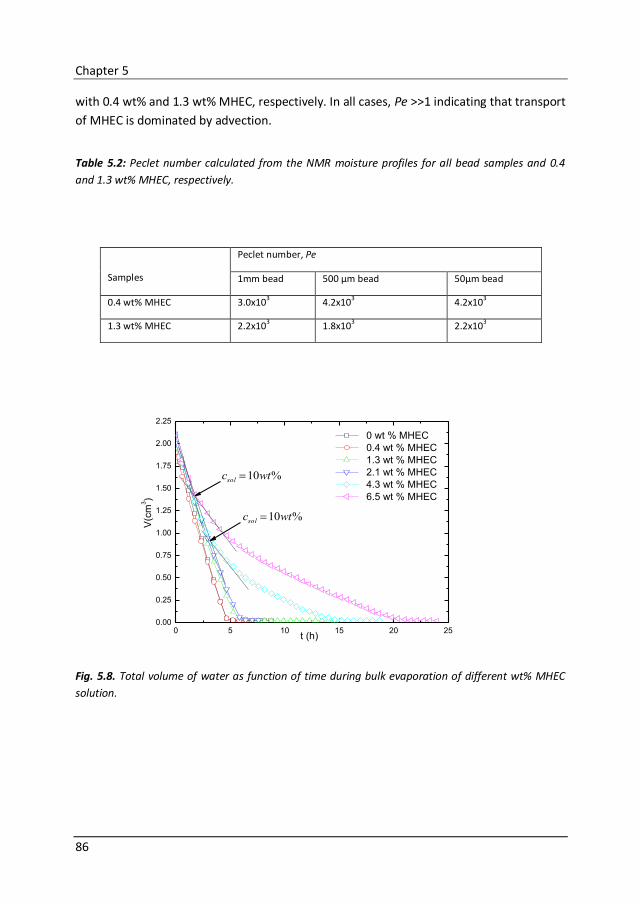
Chapter 5
86
with 0.4 wt% and 1.3 wt% MHEC, respectively. In all cases, Pe >>1 indicating that transport
of MHEC is dominated by advection.
Table 5.2: Peclet number calculated from the NMR moisture profiles for all bead samples and 0.4
and 1.3 wt% MHEC, respectively.
Fig. 5.8. Total volume of water as function of time during bulk evaporation of different wt% MHEC
solution.
Samples
Peclet number, Pe
1mm bead 500 μm bead 50μm bead
0.4 wt% MHEC 3.0x10³ 4.2x10
3 4.2x10
3
1.3 wt% MHEC 2.2x10³ 1.8x10
3 2.2x10
3
0 5 10 15 20 250.00
0.25
0.50
0.75
1.00
1.25
1.50
1.75
2.00
2.25
%10wtcsol
0 wt % MHEC
0.4 wt % MHEC
1.3 wt % MHEC
2.1 wt % MHEC
4.3 wt % MHEC
6.5 wt % MHEC
V(c
m3)
t (h)
%10wtcsol
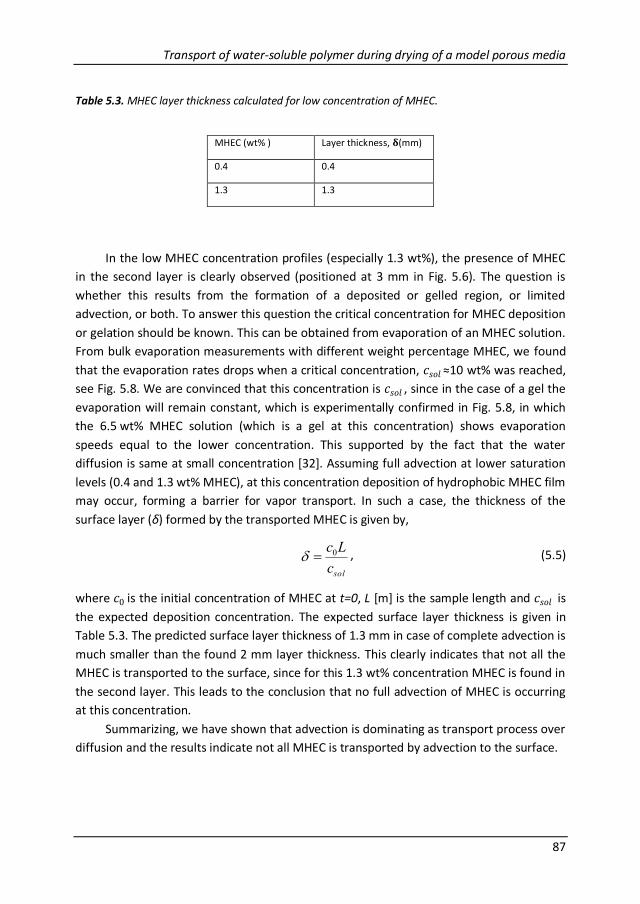
Transport of water-soluble polymer during drying of a model porous media
87
Table 5.3. MHEC layer thickness calculated for low concentration of MHEC.
In the low MHEC concentration profiles (especially 1.3 wt%), the presence of MHEC
in the second layer is clearly observed (positioned at 3 mm in Fig. 5.6). The question is
whether this results from the formation of a deposited or gelled region, or limited
advection, or both. To answer this question the critical concentration for MHEC deposition
or gelation should be known. This can be obtained from evaporation of an MHEC solution.
From bulk evaporation measurements with different weight percentage MHEC, we found
that the evaporation rates drops when a critical concentration, 𝑐𝑠𝑜𝑙 ≈10 wt% was reached,
see Fig. 5.8. We are convinced that this concentration is 𝑐𝑠𝑜𝑙 , since in the case of a gel the
evaporation will remain constant, which is experimentally confirmed in Fig. 5.8, in which
the 6.5 wt% MHEC solution (which is a gel at this concentration) shows evaporation
speeds equal to the lower concentration. This supported by the fact that the water
diffusion is same at small concentration [32]. Assuming full advection at lower saturation
levels (0.4 and 1.3 wt% MHEC), at this concentration deposition of hydrophobic MHEC film
may occur, forming a barrier for vapor transport. In such a case, the thickness of the
surface layer (δ) formed by the transported MHEC is given by,
solc
Lc0 , (5.5)
where 𝑐0 is the initial concentration of MHEC at t=0, L [m] is the sample length and 𝑐𝑠𝑜𝑙 is
the expected deposition concentration. The expected surface layer thickness is given in
Table 5.3. The predicted surface layer thickness of 1.3 mm in case of complete advection is
much smaller than the found 2 mm layer thickness. This clearly indicates that not all the
MHEC is transported to the surface, since for this 1.3 wt% concentration MHEC is found in
the second layer. This leads to the conclusion that no full advection of MHEC is occurring
at this concentration.
Summarizing, we have shown that advection is dominating as transport process over
diffusion and the results indicate not all MHEC is transported by advection to the surface.
MHEC (wt% ) Layer thickness, 𝛅(mm)
0.4 0.4
1.3 1.3
Chapter 5
88
5.4 Conclusions
This Chapter presents an experimental investigation on the transport behavior of MHEC in
a model porous media made of packed glass beads. NMR imaging and TGA are used to
measure water and MHEC transport, respectively.
When drying at low concentration of MHEC, the NMR profiles show a homogeneous
drying for all bead sizes, whereas with an increase in MHEC concentration, we observe a
front receding drying behavior.
Our experimental result of the MHEC distribution shows that for all bead sizes filled
samples that have a low MHEC concentration 1.3 wt%, a higher enrichment of MHEC
towards the drying surface is observed. At these MHEC concentrations, the homogeneous
drying, which indicates a liquid path all the way to the surface of the sample, allows
advective transport of MHEC toward the drying surface. At high MHEC concentration
above 1.3 wt%, more or less homogeneous MHEC distribution is observed. At these
concentrations, front receding drying is observed, which inhibits transport of MHEC due to
advection. Our results show that the pore diameter doesn’t have any significant influence
on the drying behavior. This is corroborated by Fig. 5.5, which shows that although the
curves shift the measured concentration points are positioned as such that they roughly
maintain their drying pattern. A larger shift in pore size would be required to change the
drying pattern as we observed an inhomogeneous drying for 1 mm beads at low wt% of
MHEC due to gravitational force. However, with increase in MHEC concentration the
gravitational force become negligible and viscous force leads a receding front drying
behavior. In general, homogenous becomes more a front-like drying pattern.
Further, analysis on the transport of MHEC by analyzing the MHEC distribution of
dried samples saturated at low MHEC concentration (1.3 wt% and lower) shows that not
all MHEC are transported to the surface, in other words, no full advection is taken place.
Furthermore, based on the Peclet number, we showed that diffusion is too small to be of
any influence. At higher concentrations a layer by layer deposition is observed, which is
because of the observed front-like drying. In fact, the beads do not seem to directly
influence the transport of MHEC rather than changing the drying behavior.
Transport of water-soluble polymer during drying of a model porous media
89
References
1. A. P. A. Faiyas, S. J. F. Erich, M. van. Soestbergen, H. P. Huinink, O. C. G. Adan and T. G.
Nijland, How methylhydroxyethylcellulose influences drying in porous media.
Chemical Engineering Science, 23 (2015) 620-628.
2. A. P. A. Faiyas, S. J. F. Erich, H. P. Huinink, O. C. G. Adan and T. G. Nijland, Effect of
MHEC on evaporation and hydration characteristics of glue mortar. Cement and
Concrete Research, 83(2016) 97-103.
3. T. Buhler, R. Zurbriggen, U. Pieles, L. Huwiler, R.A. Raso, Dynamics of early skin
formation of tiling mortars investigated by microscopy and diffuse reflectance
infrared Fourier transformed spectroscopy. Cement and Concrete Composites, 37
(2013) 161-170.
4. Y. Le Bray, M. Prat, Three-dimensional pore network simulation of drying in capillary
porous media, Int. J. Heat Mass Transfer, 42 (1999) 4207- 4224.
5. T. Metzger, E. Tsotsas, Influence of Pore Size Distribution on Drying Kinetics: A Simple
Capillary Model. Drying Technology, 23 (2005) 1797-1809.
6. M. Prat, S. Veran-Tissoires, N. Vorhauer, T. Metzger, E. Tsotsas, Fractal Phase
Distribution and Drying: Impact on Two-Phase Zone Scaling and Drying Time Scale
Dependence. Drying Technology, 30 (2012) 1129-1135.
7. F. Chauvet, P. Duru, S. Geoffroy, M. Prat, Three Periods of Drying of a Single Square
Capillary Tube, Physical Review Letters, 103 (2009) 124502.
8. M. Prat, On the influence of pore shape, contact angle and film flows on drying of
capillary porous media. Int. J. Heat Mass Transfer, 50 (2007) 1455-1468.
9. A. Jenni, L. Holzer, R. Zurbriggen, M. Herwegh, Influence of polymers on
microstructure and adhesive strength of cementitious tile adhesive mortars. Cement
and Concrete Research, 35 (2005) 35–50.
10. D. P. Bentz, C-J. Haecker, M. A. Peltz, K. A. Snyder, X-Ray Absorption Studies of Drying
of Cementitious Tile Adhesive Mortar. Cement and Concrete Composites, 30 (2008)
361-373.
11. R. Zurbriggen, M. Herwegh, U. Pieles, Th, Buhler, L. Huwiler, A new laboratory method
to investigate skin formation and open time performance. Dry mix Mortar Yearbook,
idmmc three, Nuremberg, 3 (2011) 28-29.
12. A. De Gasparo, M. Herwegh, R. Zurbriggen, K. Scrivener, Quantitative distribution
patterns of additives in self-leveling flooring compounds (underlayments)as function
of application. formulation and climatic conditions. Cement and Concrete Research,
39 (2009) 313–323.
13. P. Horgue, F. Augier, P. Duru, M. Prat, M. Quintard, Experimental and numerical study
of tow- phase flows in arrays of cylinders. Chemical Engineering Science, 102 (2013)
335-345.
Chapter 5
90
14. N. Vorhauer, Q. T. Tran, T. Metzger, E. Tsotsas, M. Prat, Experimental investigation of
Drying in a Model Porous Medium: Influence of Thermal Gradients. Drying
Technology, (2013) 31920-929.
15. T. X. Lu, J.W. Biggar, D.R. Nielsen, Water movement in glass bead porous media: 1.
Experiments of capillary rise and hysteresis. Water Resources Research, 30 (1994)
3275-3281.
16. N. Shokri, M. Sahimi, Structure of drying fronts in three-dimensional porous media.
Physical. Review E, 85 (2012) 066312.
17. K. Kopinga, L. Pel, One-dimensional scanning of moisture in porous materials with
NMR. Review of Scientific Instruments, 65 (1994) 3673-3681.
18. L. Pel, K. Kopinga, H. Brocken, Moisture transport in porous building materials, Heron,
41 (1996) 95-105.
19. L. Pel, H. Brocken, K. Kopinga, Determination of moisture diffusivity in porous media
using moisture concentration profiles, International Journals of Heat and Mass
Transfer, 39 (1996) 1273-1280.
20. J. P. Olivier, M. Massat, Permeability and micostructure of concrete : a review of
modelling Cement and Concrete Research, 22 (1992) 503-514.
21. J. Van Brakel, P. M. Heertjes, Analysis of diffusion in macroporous media in terms of a
porosity, a tortuosity and a constrictivity. Int. J. Heat Mass Transfer, 17 (1975) 1093-
1103.
22. A. Aït-Mokhtar, O. Amiri, P. Dumargue, S. Sammartino, Analylitic modelling and
experimental study of the porosity and permeability of a porous medium –
application to cement mortars and granitic rock. Magazine of Concrete Research, 51
(1999) 391-396.
23. A. Aït-Mokhtar, O. Amiri, P. Dumargue, S. Sammartino, A new model to calculate
water permeability of cement-based materials from MIP results. Advance in Concrete
Research, 14 (2002) 43-49.
24. Massoud Kaviany, Principles of Heat Transfer in Porous Media, Second Edition,
Springer, New York.
25. C. R. Dudgeon, An experimental study of the flow of water through coarse granular
media. La Houille Blanche, 7 (1996) 785-800.
26. W. Kozicki, C. Hsu, C. Tiu, Non-Newtonian flow through packed beds and porous
media, Chemical Engineering Science, 22 (1967) 487.
27. W. Kulicke, R. Haas, Flow behavior of dilute polyacrylamide solutions through porous
media. 1. influence of chain length, concentration and thermodynamic quality of
solvent. Industrial and Engineering Chemistry Fundamentals, 23 (1984) 308.
28. P. G. Scherer, R. Swiatek, Measurement of permeability II Silica gel, Journals of Non
Crystalline Solids, 113 (1989) 119.
Transport of water-soluble polymer during drying of a model porous media
91
29. A. P. Philipse, C. Pathma manoharan, Liquid permeation (and sedimentation) of dense
colloidal hard-sphere packings, Journal of colloids and interface science, 159 (1993)
96.
30. S. Gupta, H. P. Huinink, L. Pel, K. Kopinga, How ferrocyanide influences NaCl
crystallization under different humidity conditions, Crystal Growth and Design, 14
(2014) 1591-1599.
31. M. Nyden, O. Soderman, An NMR Self Diffusion Investigation of Agglomeration
Phenomena in Solution of Ethyl (hydroxyethyl) cellulose, Macromolecules, 31 (1998)
4990-5002.
32. M. Hirrien, C. Chevillard, Thermogelation of methylcelluloses: new evidence for
understanding the gelation mechanism, Polymer, 39 (1998) 6251-6259.

92
93
Chapter 6
Understanding the water absorption
from MHEC modified glue mortar into
porous tile: Influence of pre-drying.
This Chapter presents an experimental investigation on the influence of
Methylhydroxyethylcellulose (MHEC) modified mortar on water absorption into tile and
base substrate using Nuclear Magnetic Resonance (NMR) imaging. Addition of MHEC shifts
the absorption behavior from homogeneous to inhomogeneous as a result of increased
viscosity of pore solution. The observed reverse flow from tile to mortar is a result of
decrease in capillary pressure in mortar as a consequence of decrease in pore size due to
hydration. Pre-drying of 1.3 wt% MHEC mortar with dry air shows little wetting by tile due
to MHEC transport and formation of dry region at the mortar surface. On the contrary,
pre-drying of 1.3 wt% MHEC mortar at 40% RH slows down MHEC transport and delays the
formation of dry region at the mortar surface enabling higher wetting by tile.
This Chapter is adapted from A.P.A. Faiyas et al., Construction and Building Materials, 217
(2019) 363-371.
6.1 Introduction
Cement based glue mortars are widely used as tile adhesives in buildings and
constructions. Commercial glue mortars are complex systems, with Portland cement as a
main ingredient, and a variety of inorganic calcium silicates and calcium aluminates [1].
Methylhydroxyethylcellulose (MHEC) is widely used as water retention agent in
cementitious materials. The major applications are tile adhesives, wall renders, self-
levelling underlayments, floor screeds and water-proofing membranes.
Critical for the use of mortar is the time to application, which is limited by the so-
called open time, being the time during which a tile can be fixed to the substrate with
sufficiently good adhesion. This open time can be modified by adding a small amount (1-2
wt%) of water soluble polymer, which might be caused by a change in drying behavior of
cementitious glue mortar. Among others, the open time is determined by the drying
process of mortar as a result of evaporation, internal moisture flow, hydration and film
Chapter 6
94
formation. Other key parameters that determine the open time are wetting of the tile
during application and sagging of the tile. The degree of wetting relates to the water
absorption and penetration of glue compounds into the tile, which determine the
adhesion between tile and substrate to a large extent. The wetting behavior is influenced
by the drying process of the mortar as a result of evaporation, internal moisture flow,
viscosity of pore solution and polymer transport [2, 3].
In Chapter 3, drying of highly viscous MHEC/water solutions inside non-reactive
porous media has been studied in detail [2]. It was found that MHEC increases the
viscosity of the pore liquid four orders of magnitude and, as such, inhibits fluid flow. A
transition from homogeneous drying to a front drying is observed for MHEC
concentrations above 1.3 wt%. Consequently, a decrease of the evaporation rate is
observed as the drying front retracts itself into the material. As MHEC addition leads to
front drying, it reduces the drying rate.
Drying of glue mortar, a reactive porous material, in the presence of MHEC has also
been studied in Chapter 4 [3]. In that study, we examined the effect of MHEC on the
hydration characteristics of unsealed mortar. In absence of MHEC, mortar shows a
homogeneous drying behavior and in presence of MHEC, mortar shows a front receding
drying behavior. The drying time of pure mortar is shorter than hydration time, causing
incomplete hydration. The drying time of MHEC modified mortar is comparable to the
hydration time, ensuring good hydration. Again, a reduction in evaporation rate with
increasing MHEC concentration is observed simultaneously accompanied by the formation
of a film. The hypothesis is that MHEC forms a film at the surface [4]. This film will be
hydrophobic and as such free of water, thereby possibly creating a barrier for water
transport.
In Chapter 5, to understand the influence of pore size on MHEC transport, we
studied [4] the distribution of MHEC during drying by using a model porous material
consisting of packed glass beads with different diameters saturated with an aqueous
MHEC solution. At MHEC concentration less than 1.3 wt%, an advective transport of MHEC
towards the drying surface is observed. In this case, accumulation of MHEC forms a film at
the top surface and below this film layer, gel zone forms, which allows migration of water
towards the evaporation surface. When the MHEC concentration is above 1.3 wt%,
transport of MHEC is prevented, resulting in a more homogeneous final distribution of
MHEC. Moreover, our observations show that the difference in pore size does not have
any significant influence on MHEC transport. The observed reduction in evaporation in
presence of MHEC is due to the transport of MHEC to the surface, and which may causes
the formation of a film. This film is expected to be hydrophobic and as such free of water,
and create a barrier for vapor transport, further reducing the overall evaporation rate [3].
The immediate absorption of water into the tile has potentially a significant effect,
because a threshold amount of available water is crucial for proper hydration of glue
Understanding the water absorption from MHEC modified glue mortar into Porous tile : influence of pre-drying
95
mortar. Water absorption in porous medium is a complex process [5, 6, 7]. Most studies
focus on the capillary absorption of water in porous media. The mass of the liquid
absorbed per unit area increases with the square root of the time elapsed until the liquid
absorption reaches the boundary of the material, which may be described by both the
Washburn and Richards equations [8, 9, 10]. The suction coefficient obtained from fitting
the Washburn equation to such data depends on the physical properties of the liquid and
properties of the porous materials. Only few studies relate the capillary absorption of
water with the physical properties of liquid such as viscosity, surface tension and contact
angle [11, 12, 13]. Gummerson et al. [12] showed that the rate of liquid absorption into
brick ceramics scales approximately with )/( 1/2, where is the surface tension and
the viscosity. No studies were reported on suction characteristics of MHEC solutions in
building materials.
Measuring transport processes inside a porous material is challenging as most
materials are non-transparent. Only a few techniques can measure fluid distributions
inside 3D porous materials non-destructively and non-invasively, such as synchrotron, X-
ray tomography [14] and Nuclear Magnetic Resonance (NMR) imaging [15]. In this study,
we have chosen NMR imaging to monitor the water absorption processes of base concrete
substrate and tile from a cellulose modified mortar, because NMR allows in-situ
monitoring of water distribution with high spatial and temporal resolution non-
destructively and non-invasively.
The aim of this study is to investigate the influence of MHEC on the water absorption
from glue mortar into both the base concrete substrate and tile. The main research
questions are: 1) What is the influence of MHEC added to the mortar mix on the water
absorption process of a base concrete substrate and tile? 2) What is the effect of pre-
drying of MHEC modified mortar on water absorption process before application of the
tile? 3) What is the effect of humidity and air flow on the wetting and adhesion process of
glue mortar? To answer these questions we have studied the water absorption from
mortar with and without MHEC into a base concrete substrate and tile using NMR, with
different drying conditions.
6.2 Materials and methods
This section focuses on the materials and methods used to understand the influence of
MHEC on the moisture transport from the freshly prepared glue mortar into its
neighbouring substrates; i.e., a base concrete slab and a tile (Fig. 6.1). In the first set of
experiments, water absorption from mortar to the porous tile with increasing MHEC
concentration was studied. In the second set of experiments, a pre-drying is performed on
mortar before applying the tile in order to understand the influence of various drying
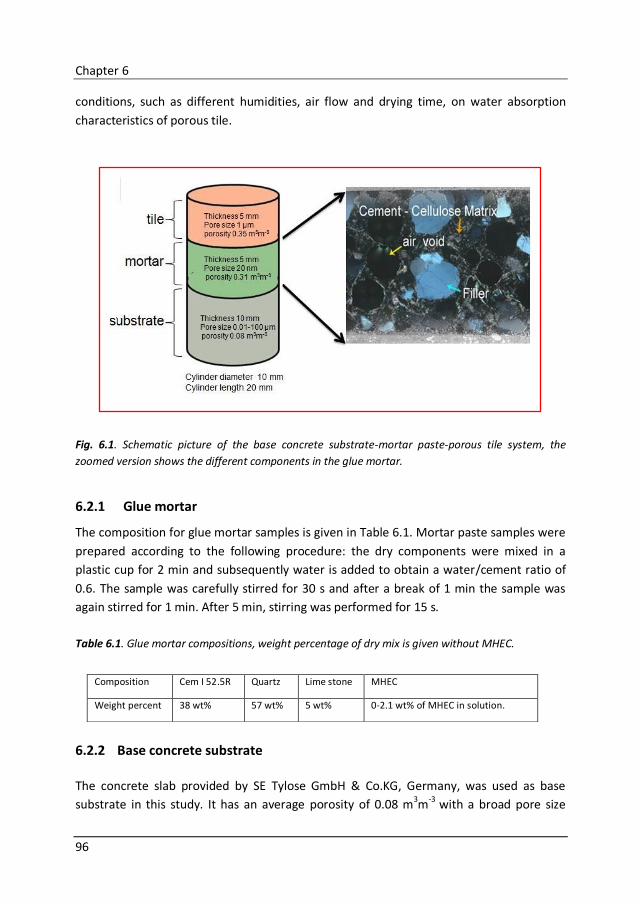
Chapter 6
96
conditions, such as different humidities, air flow and drying time, on water absorption
characteristics of porous tile.
Fig. 6.1. Schematic picture of the base concrete substrate-mortar paste-porous tile system, the
zoomed version shows the different components in the glue mortar.
6.2.1 Glue mortar
The composition for glue mortar samples is given in Table 6.1. Mortar paste samples were
prepared according to the following procedure: the dry components were mixed in a
plastic cup for 2 min and subsequently water is added to obtain a water/cement ratio of
0.6. The sample was carefully stirred for 30 s and after a break of 1 min the sample was
again stirred for 1 min. After 5 min, stirring was performed for 15 s.
Table 6.1. Glue mortar compositions, weight percentage of dry mix is given without MHEC.
6.2.2 Base concrete substrate
The concrete slab provided by SE Tylose GmbH & Co.KG, Germany, was used as base
substrate in this study. It has an average porosity of 0.08 m3m
-3 with a broad pore size
Composition Cem I 52.5R Quartz Lime stone MHEC
Weight percent 38 wt% 57 wt% 5 wt% 0-2.1 wt% of MHEC in solution.
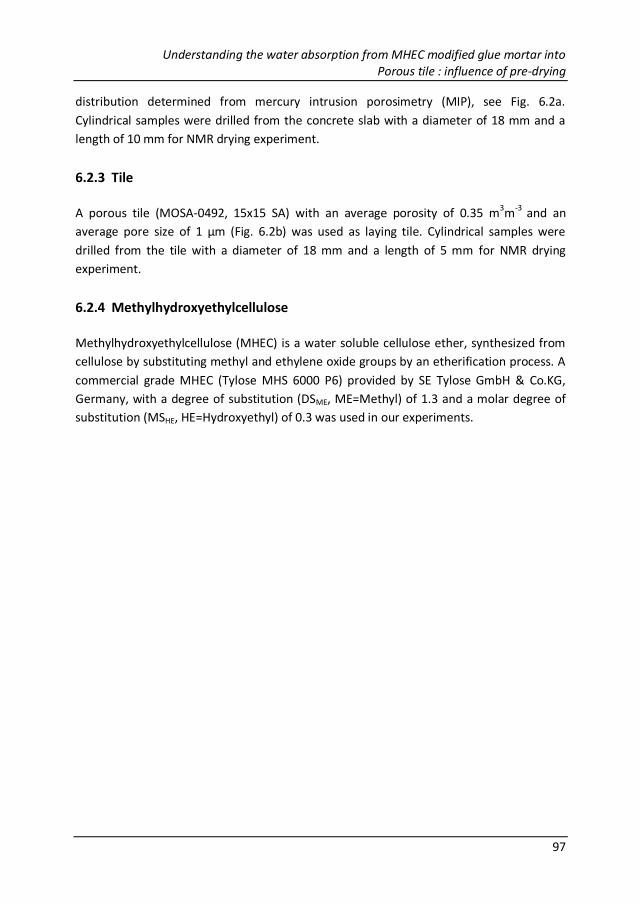
Understanding the water absorption from MHEC modified glue mortar into Porous tile : influence of pre-drying
97
distribution determined from mercury intrusion porosimetry (MIP), see Fig. 6.2a.
Cylindrical samples were drilled from the concrete slab with a diameter of 18 mm and a
length of 10 mm for NMR drying experiment.
6.2.3 Tile
A porous tile (MOSA-0492, 15x15 SA) with an average porosity of 0.35 m3m-3 and an
average pore size of 1 μm (Fig. 6.2b) was used as laying tile. Cylindrical samples were
drilled from the tile with a diameter of 18 mm and a length of 5 mm for NMR drying
experiment.
6.2.4 Methylhydroxyethylcellulose
Methylhydroxyethylcellulose (MHEC) is a water soluble cellulose ether, synthesized from
cellulose by substituting methyl and ethylene oxide groups by an etherification process. A
commercial grade MHEC (Tylose MHS 6000 P6) provided by SE Tylose GmbH & Co.KG,
Germany, with a degree of substitution (DSME, ME=Methyl) of 1.3 and a molar degree of
substitution (MSHE, HE=Hydroxyethyl) of 0.3 was used in our experiments.
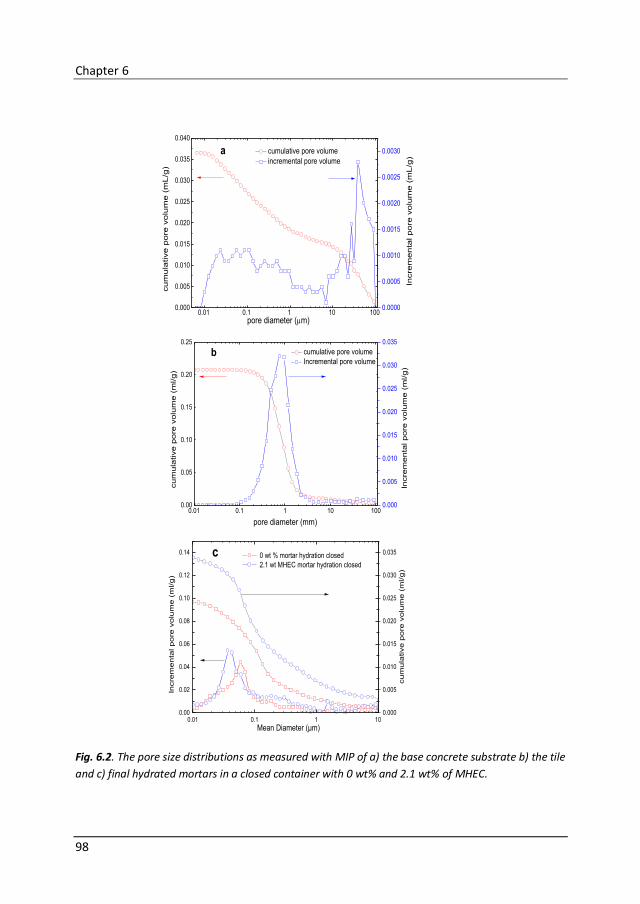
Chapter 6
98
0.01 0.1 1 10 1000.000
0.005
0.010
0.015
0.020
0.025
0.030
0.035
0.040
cumulative pore volume
incremental pore volume
pore diameter (m)
cum
ula
tive p
ore
volu
me (
mL/g
)
a
0.0000
0.0005
0.0010
0.0015
0.0020
0.0025
0.0030
Incre
menta
l pore
volu
me (
mL/g
)
0.01 0.1 1 10 1000.00
0.05
0.10
0.15
0.20
0.25
pore diameter (mm)
cumulative pore volume
Incremental pore volume
cum
ula
tive p
ore
volu
me (
ml/g)
b
0.000
0.005
0.010
0.015
0.020
0.025
0.030
0.035
Incre
menta
l pore
volu
me (
ml/g)
0.01 0.1 1 100.00
0.02
0.04
0.06
0.08
0.10
0.12
0.14
Mean Diameter (µm)
Incre
menta
l pore
volu
me (
ml/g)
0 wt % mortar hydration closed
2.1 wt MHEC mortar hydration closed
c
0.000
0.005
0.010
0.015
0.020
0.025
0.030
0.035
cum
ula
tive p
ore
volu
me (
ml/g)
Fig. 6.2. The pore size distributions as measured with MIP of a) the base concrete substrate b) the tile
and c) final hydrated mortars in a closed container with 0 wt% and 2.1 wt% of MHEC.
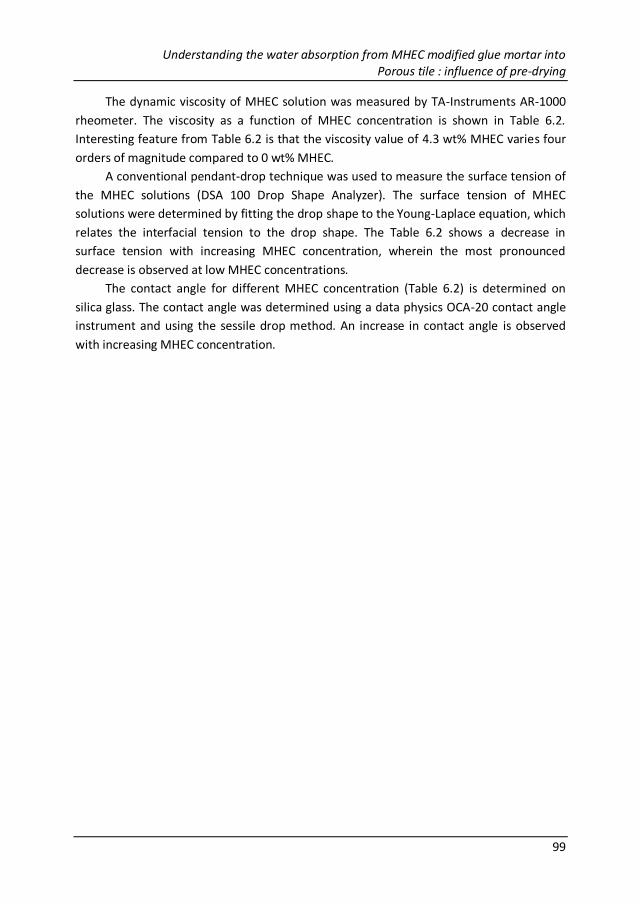
Understanding the water absorption from MHEC modified glue mortar into Porous tile : influence of pre-drying
99
The dynamic viscosity of MHEC solution was measured by TA-Instruments AR-1000
rheometer. The viscosity as a function of MHEC concentration is shown in Table 6.2.
Interesting feature from Table 6.2 is that the viscosity value of 4.3 wt% MHEC varies four
orders of magnitude compared to 0 wt% MHEC.
A conventional pendant-drop technique was used to measure the surface tension of
the MHEC solutions (DSA 100 Drop Shape Analyzer). The surface tension of MHEC
solutions were determined by fitting the drop shape to the Young-Laplace equation, which
relates the interfacial tension to the drop shape. The Table 6.2 shows a decrease in
surface tension with increasing MHEC concentration, wherein the most pronounced
decrease is observed at low MHEC concentrations.
The contact angle for different MHEC concentration (Table 6.2) is determined on
silica glass. The contact angle was determined using a data physics OCA-20 contact angle
instrument and using the sessile drop method. An increase in contact angle is observed
with increasing MHEC concentration.
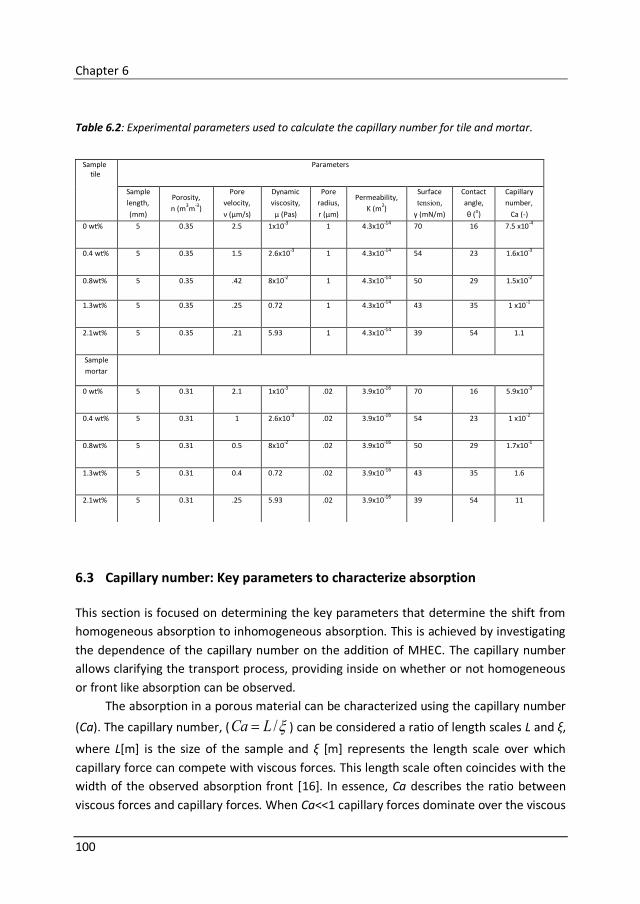
Chapter 6
100
Table 6.2: Experimental parameters used to calculate the capillary number for tile and mortar.
6.3 Capillary number: Key parameters to characterize absorption
This section is focused on determining the key parameters that determine the shift from
homogeneous absorption to inhomogeneous absorption. This is achieved by investigating
the dependence of the capillary number on the addition of MHEC. The capillary number
allows clarifying the transport process, providing inside on whether or not homogeneous
or front like absorption can be observed.
The absorption in a porous material can be characterized using the capillary number
(Ca). The capillary number, ( /LCa ) can be considered a ratio of length scales L and ξ,
where L[m] is the size of the sample and ξ [m] represents the length scale over which
capillary force can compete with viscous forces. This length scale often coincides with the
width of the observed absorption front [16]. In essence, Ca describes the ratio between
viscous forces and capillary forces. When Ca<<1 capillary forces dominate over the viscous
Sample tile
Parameters
Sample
length,
(mm)
Porosity,
n (m3m
-3)
Pore
velocity,
ν (μm/s)
Dynamic
viscosity,
μ (Pas)
Pore
radius,
r (μm)
Permeability,
K (m2)
Surface
tension,
γ (mN/m)
Contact
angle,
θ (o)
Capillary
number,
Ca (-)
0 wt% 5 0.35 2.5 1x10⁻³
1 4.3x10⁻¹⁴
70 16 7.5 x10⁻⁴
0.4 wt% 5 0.35 1.5 2.6x10⁻³
1 4.3x10⁻¹⁴
54 23 1.6x10⁻³
0.8wt% 5 0.35 .42 8x10⁻²
1 4.3x10⁻¹⁴
50 29 1.5x10⁻²
1.3wt% 5 0.35 .25 0.72 1 4.3x10⁻¹⁴
43 35 1 x10⁻¹
2.1wt% 5 0.35 .21 5.93 1 4.3x10⁻¹⁴
39 54 1.1
Sample
mortar
0 wt% 5 0.31 2.1 1x10⁻³
.02 3.9x10⁻¹⁶
70 16 5.9x10⁻³
0.4 wt% 5 0.31 1 2.6x10⁻³
.02 3.9x10⁻¹⁶
54 23 1 x10⁻²
0.8wt% 5 0.31 0.5 8x10⁻²
.02 3.9x10⁻¹⁶
50 29 1.7x10⁻¹
1.3wt% 5 0.31 0.4 0.72 .02 3.9x10⁻¹⁶
43 35 1.6
2.1wt% 5 0.31 .25 5.93 .02 3.9x10⁻¹⁶
39 54 11
Understanding the water absorption from MHEC modified glue mortar into Porous tile : influence of pre-drying
101
forces. In case Ca >>1, the capillary forces no longer surpass the viscous forces in the
permeable material. One can rewrite the capillary number, using Darcy’s law *17] and the
capillary pressure for a cylindrical pore𝑝𝑐 = 2𝛾 𝑐𝑜𝑠 𝜃 /𝑟 to obtain [2]
𝐶𝑎 ≡𝐿𝑛𝜈𝜂𝑟
2 𝐾𝛾 𝑐𝑜𝑠 𝜃 (6.1)
where L [m] is length of the sample, n [-] represents the porosity, [m/s] the fluid
velocity, 𝜂 [Pa s] the viscosity, r [m] the average pore radius, K [m2] the permeability,
[N/m] the surface tension and [º] the contact angle. This equation shows that the
absorption behavior is mainly determined by absorption rate, viscosity, the permeability
of the material, surface tension and the contact angle of the pore liquid, considering that
the pore radius, sample size and porosity is constant for each sample.
In order to parameterize Ca, both properties of the liquid and the porous medium
are required. The parameters determining the capillary number are summarized in Table
6.2. The physical properties of the liquid, such as viscosity, surface tension and contact
angle were given in section 6.2.4. The other parameters to be determined for the model
systems are porosity, pore radius and permeability. The initial pore velocity of the liquid
was determined from the decrease of the total moisture content plotted in Fig. 6.4,
wherein the value was determined from the initial slope of the curve at t=0.
The average pore size of the tile and mortar is determined by Mercury Intrusion
Porosimetry (MIP). Note that, mortar sample used to determine the pore size is the final
cured mortar after finishing the drying experiment. There will be a gradual decrease in
pore radius due to cement hydration during mortar curing as such influence the transport
properties. This point is discussed in the next section on this chapter. The porosity of the
tile and mortar determines the saturation level, which can be easily obtained from the
NMR experiment. The permeability of the porous medium is the ability of the fluid flowing
through a porous media caused by a pressure difference. Various authors [18, 19, 20] have
conducted studies that deal with the relationship between porous structure and
permeability. Holly et al. [21] based their work on that of Shi et al. [22] and Brown [23] to
connect numerically the permeability with the porosity, from a pore statistical
distribution. Each of these models has their own accuracy and assumptions. In our study,
we have chosen Ait-Mokhtar model, as this model is often applied on cement based
materials [24]. However, in such models, it is important to note that experimental
measures on materials give inferior permeability values in relation to those obtained from
the model with same material parameters. The explanation can be found mainly in the
hypothesis used in the theoretical model. Theoretically, it is known that the cylindrical
pore hypothesis offer a much simpler approach. This hypothesis supposes a shorter flow
path and this minimize the head lose, which overestimate the permeability value. In the
Ait-Mokhtar model [24], the pores are represented by several capillaries with constant or
Chapter 6
102
variable radii. Permeability is calculated as a function of porosity , average pore radius rp
and the location parameter and the permeability is given by,
e8
2
2
p 6ξεr
K , (6.2)
with 0 in case of constant radii. The pore radius is determined from the MIP
measurements and the porosity of the material is calculated from NMR moisture profiles.
Note that, a variation of a factor of 2, our calculation of capillary number (Fig. 6.5) does
not change considerably. As such variations are small, the calculations are not affected by
the choice of estimating permeability based on Ait-Mokhtar approach.
6.4 Results
6.4.1 Water absorption from mortar into concrete base substrate and tiles
This section focuses on understanding the role of MHEC on the moisture transport from
the freshly prepared glue mortar into its neighbouring substrates; i.e., a base concrete
slab and a tile. One dimensional NMR imaging was performed with mortars containing 0
wt% MHEC, 1.3 wt% MHEC and 2.1 wt% MHEC. In our experiments, the substrates were
inserted in a cylindrical teflon sample holder on which a 5 mm thick mortar paste with
different wt% MHEC was applied. After applying the mortar, immediately a completely dry
tile is placed on top. The teflon sample holder is subsequently sealed to prevent
evaporation and inserted in NMR set-up to perform water absorption measurements.
The moisture profiles during water absorption for 0 wt% MHEC mortar are shown in
Fig. 6.3a. Every profile is an average over 11 min of measuring and the time between two
subsequent presented profiles is 33 min. The absorption of water from mortar to the base
concrete substrate is observed as indicated by the arrow in Fig. 6.3a showing low water
content in the base concrete substrate due to its low porosity. Immediately after
application of the tile, absorption of water by the tile is observed, this is already visible in
the first profile (i.e., 11 min) in Fig. 6.3a. Subsequently, a homogeneous transport of water
is observed from the tile to mortar, which is visible by the decrease in moisture content as
indicated by the vertical arrows.
Fig. 6.3b shows moisture profiles in case 1.3 wt% MHEC is present in the mortar. The
profiles are acquired and plotted every 11 min. After 10 profiles, the profiles are plotted
every 33 min. Again water absorption into the base concrete substrate is observed with
lower water content as compared with 0 wt% MHEC mortar. In the tile, an absorption
front develops during the first phase of the absorption process. The absorption front
reaches the bottom part of the tile after eight profiles. The water absorption in the tile
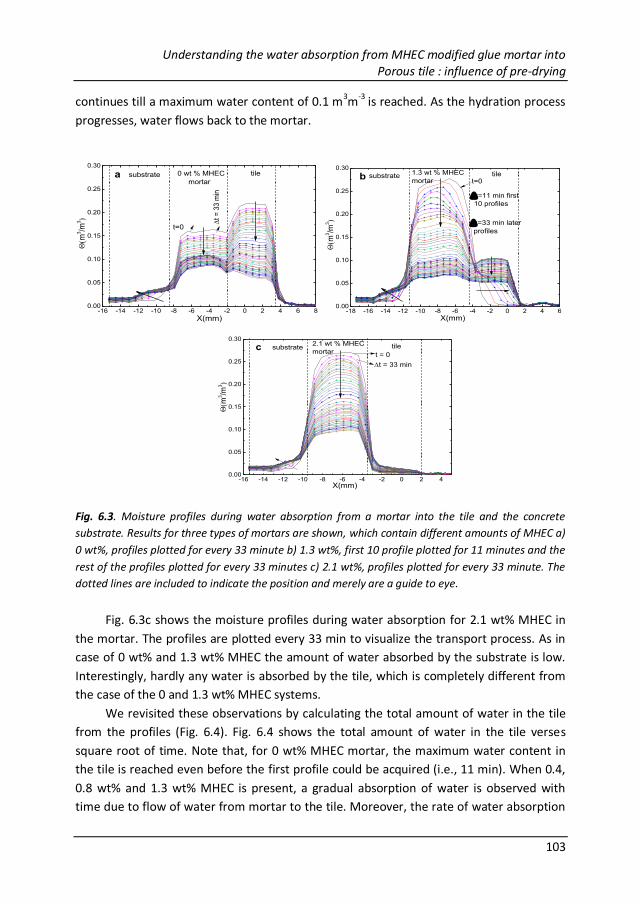
Understanding the water absorption from MHEC modified glue mortar into Porous tile : influence of pre-drying
103
-16 -14 -12 -10 -8 -6 -4 -2 0 2 4 6 80.00
0.05
0.10
0.15
0.20
0.25
0.30
(m
3/m
3)
X(mm)
substrate 0 wt % MHEC
mortar
tile
t
= 3
3 m
in
t=0
a
-18 -16 -14 -12 -10 -8 -6 -4 -2 0 2 4 60.00
0.05
0.10
0.15
0.20
0.25
0.30
t=33 min later
profiles
(m
3/m
3)
X(mm)
substrate1.3 wt % MHEC
mortartile
t=11 min first
10 profiles
t=0b
-16 -14 -12 -10 -8 -6 -4 -2 0 2 40.00
0.05
0.10
0.15
0.20
0.25
0.30
(m
3/m
3)
X(mm)
substrate2.1 wt % MHEC
mortartile
t = 33 min
t = 0c
continues till a maximum water content of 0.1 m3m
-3 is reached. As the hydration process
progresses, water flows back to the mortar.
Fig. 6.3. Moisture profiles during water absorption from a mortar into the tile and the concrete
substrate. Results for three types of mortars are shown, which contain different amounts of MHEC a)
0 wt%, profiles plotted for every 33 minute b) 1.3 wt%, first 10 profile plotted for 11 minutes and the
rest of the profiles plotted for every 33 minutes c) 2.1 wt%, profiles plotted for every 33 minute. The
dotted lines are included to indicate the position and merely are a guide to eye.
Fig. 6.3c shows the moisture profiles during water absorption for 2.1 wt% MHEC in
the mortar. The profiles are plotted every 33 min to visualize the transport process. As in
case of 0 wt% and 1.3 wt% MHEC the amount of water absorbed by the substrate is low.
Interestingly, hardly any water is absorbed by the tile, which is completely different from
the case of the 0 and 1.3 wt% MHEC systems.
We revisited these observations by calculating the total amount of water in the tile
from the profiles (Fig. 6.4). Fig. 6.4 shows the total amount of water in the tile verses
square root of time. Note that, for 0 wt% MHEC mortar, the maximum water content in
the tile is reached even before the first profile could be acquired (i.e., 11 min). When 0.4,
0.8 wt% and 1.3 wt% MHEC is present, a gradual absorption of water is observed with
time due to flow of water from mortar to the tile. Moreover, the rate of water absorption
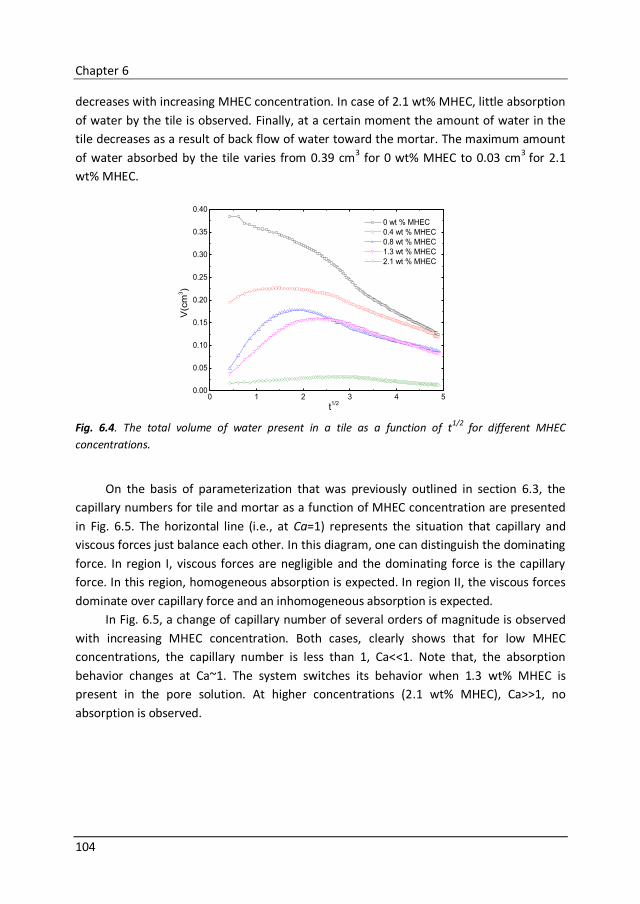
Chapter 6
104
0 1 2 3 4 50.00
0.05
0.10
0.15
0.20
0.25
0.30
0.35
0.40
V(c
m3)
t1/2
0 wt % MHEC
0.4 wt % MHEC
0.8 wt % MHEC
1.3 wt % MHEC
2.1 wt % MHEC
decreases with increasing MHEC concentration. In case of 2.1 wt% MHEC, little absorption
of water by the tile is observed. Finally, at a certain moment the amount of water in the
tile decreases as a result of back flow of water toward the mortar. The maximum amount
of water absorbed by the tile varies from 0.39 cm3 for 0 wt% MHEC to 0.03 cm3 for 2.1
wt% MHEC.
Fig. 6.4. The total volume of water present in a tile as a function of t1/2
for different MHEC
concentrations.
On the basis of parameterization that was previously outlined in section 6.3, the
capillary numbers for tile and mortar as a function of MHEC concentration are presented
in Fig. 6.5. The horizontal line (i.e., at Ca=1) represents the situation that capillary and
viscous forces just balance each other. In this diagram, one can distinguish the dominating
force. In region I, viscous forces are negligible and the dominating force is the capillary
force. In this region, homogeneous absorption is expected. In region II, the viscous forces
dominate over capillary force and an inhomogeneous absorption is expected.
In Fig. 6.5, a change of capillary number of several orders of magnitude is observed
with increasing MHEC concentration. Both cases, clearly shows that for low MHEC
concentrations, the capillary number is less than 1, Ca<<1. Note that, the absorption
behavior changes at Ca~1. The system switches its behavior when 1.3 wt% MHEC is
present in the pore solution. At higher concentrations (2.1 wt% MHEC), Ca>>1, no
absorption is observed.
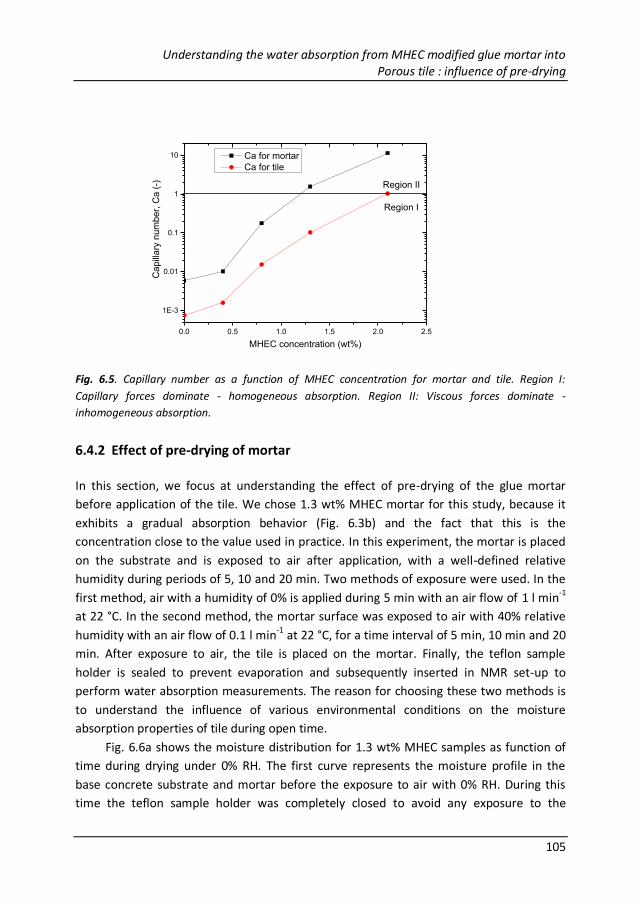
Understanding the water absorption from MHEC modified glue mortar into Porous tile : influence of pre-drying
105
0.0 0.5 1.0 1.5 2.0 2.5
1E-3
0.01
0.1
1
10
Region I
Ca
pill
ary
num
be
r, C
a (
-)
MHEC concentration (wt%)
Ca for mortar
Ca for tile
Region II
Fig. 6.5. Capillary number as a function of MHEC concentration for mortar and tile. Region I:
Capillary forces dominate - homogeneous absorption. Region II: Viscous forces dominate -
inhomogeneous absorption.
6.4.2 Effect of pre-drying of mortar
In this section, we focus at understanding the effect of pre-drying of the glue mortar
before application of the tile. We chose 1.3 wt% MHEC mortar for this study, because it
exhibits a gradual absorption behavior (Fig. 6.3b) and the fact that this is the
concentration close to the value used in practice. In this experiment, the mortar is placed
on the substrate and is exposed to air after application, with a well-defined relative
humidity during periods of 5, 10 and 20 min. Two methods of exposure were used. In the
first method, air with a humidity of 0% is applied during 5 min with an air flow of 1 l min-1
at 22 °C. In the second method, the mortar surface was exposed to air with 40% relative
humidity with an air flow of 0.1 l min-1 at 22 °C, for a time interval of 5 min, 10 min and 20
min. After exposure to air, the tile is placed on the mortar. Finally, the teflon sample
holder is sealed to prevent evaporation and subsequently inserted in NMR set-up to
perform water absorption measurements. The reason for choosing these two methods is
to understand the influence of various environmental conditions on the moisture
absorption properties of tile during open time.
Fig. 6.6a shows the moisture distribution for 1.3 wt% MHEC samples as function of
time during drying under 0% RH. The first curve represents the moisture profile in the
base concrete substrate and mortar before the exposure to air with 0% RH. During this
time the teflon sample holder was completely closed to avoid any exposure to the
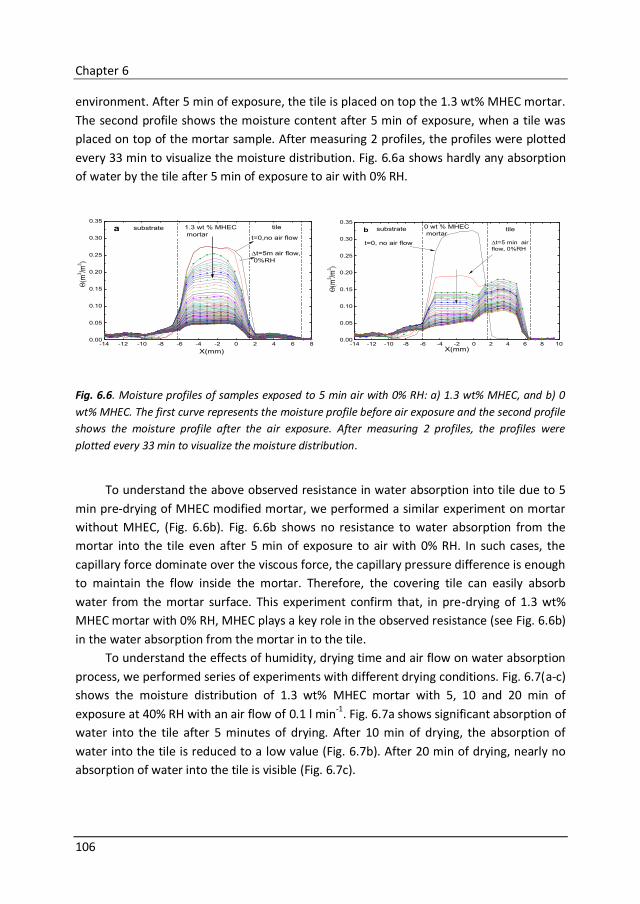
Chapter 6
106
-14 -12 -10 -8 -6 -4 -2 0 2 4 6 8 100.00
0.05
0.10
0.15
0.20
0.25
0.30
0.35
(m
3 /m3 )
X(mm)
substrate 0 wt % MHEC
mortar
t=0, no air flow t=5 min air
flow, 0%RH
tileb
-14 -12 -10 -8 -6 -4 -2 0 2 4 6 80.00
0.05
0.10
0.15
0.20
0.25
0.30
0.35
(m
3 /m3 )
X(mm)
substrate 1.3 wt % MHEC
mortart=0,no air flow
tile
t=5m air flow,
0%RH
a
environment. After 5 min of exposure, the tile is placed on top the 1.3 wt% MHEC mortar.
The second profile shows the moisture content after 5 min of exposure, when a tile was
placed on top of the mortar sample. After measuring 2 profiles, the profiles were plotted
every 33 min to visualize the moisture distribution. Fig. 6.6a shows hardly any absorption
of water by the tile after 5 min of exposure to air with 0% RH.
Fig. 6.6. Moisture profiles of samples exposed to 5 min air with 0% RH: a) 1.3 wt% MHEC, and b) 0
wt% MHEC. The first curve represents the moisture profile before air exposure and the second profile
shows the moisture profile after the air exposure. After measuring 2 profiles, the profiles were
plotted every 33 min to visualize the moisture distribution.
To understand the above observed resistance in water absorption into tile due to 5
min pre-drying of MHEC modified mortar, we performed a similar experiment on mortar
without MHEC, (Fig. 6.6b). Fig. 6.6b shows no resistance to water absorption from the
mortar into the tile even after 5 min of exposure to air with 0% RH. In such cases, the
capillary force dominate over the viscous force, the capillary pressure difference is enough
to maintain the flow inside the mortar. Therefore, the covering tile can easily absorb
water from the mortar surface. This experiment confirm that, in pre-drying of 1.3 wt%
MHEC mortar with 0% RH, MHEC plays a key role in the observed resistance (see Fig. 6.6b)
in the water absorption from the mortar in to the tile.
To understand the effects of humidity, drying time and air flow on water absorption
process, we performed series of experiments with different drying conditions. Fig. 6.7(a-c)
shows the moisture distribution of 1.3 wt% MHEC mortar with 5, 10 and 20 min of
exposure at 40% RH with an air flow of 0.1 l min-1
. Fig. 6.7a shows significant absorption of
water into the tile after 5 minutes of drying. After 10 min of drying, the absorption of
water into the tile is reduced to a low value (Fig. 6.7b). After 20 min of drying, nearly no
absorption of water into the tile is visible (Fig. 6.7c).
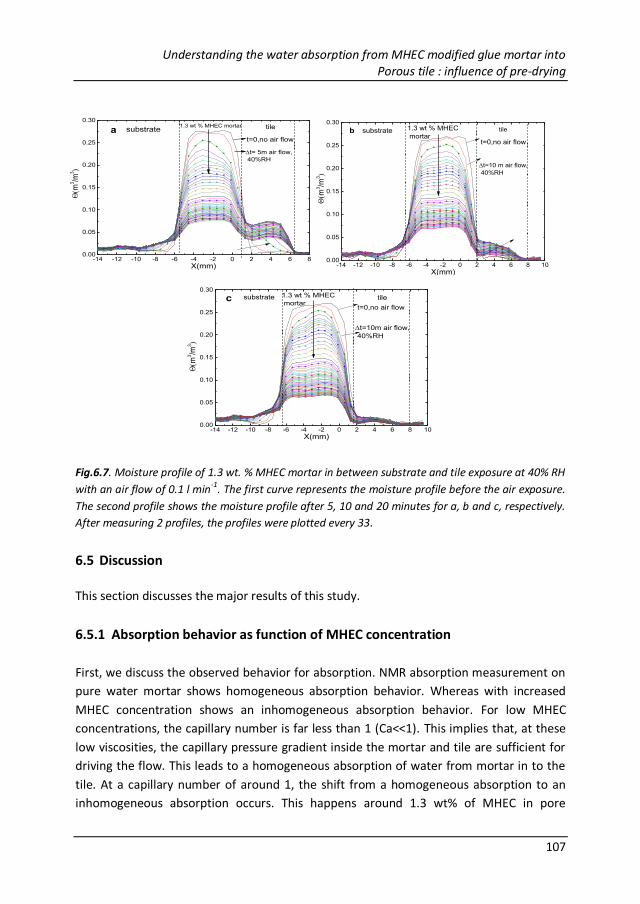
Understanding the water absorption from MHEC modified glue mortar into Porous tile : influence of pre-drying
107
-14 -12 -10 -8 -6 -4 -2 0 2 4 6 80.00
0.05
0.10
0.15
0.20
0.25
0.30
(m
3/m
3)
X(mm)
substrate1.3 wt % MHEC mortar tile
t= 5m air flow,
40%RH
t=0,no air flow
a
-14 -12 -10 -8 -6 -4 -2 0 2 4 6 8 100.00
0.05
0.10
0.15
0.20
0.25
0.30
(m
3/m
3)
X(mm)
substrate 1.3 wt % MHEC
mortartileb
t=0,no air flow
t=10 m air flow,
40%RH
-14 -12 -10 -8 -6 -4 -2 0 2 4 6 8 100.00
0.05
0.10
0.15
0.20
0.25
0.30
(m
3/m
3)
X(mm)
substrate 1.3 wt % MHEC
mortartilec
t=0,no air flow
t=10m air flow,
40%RH
Fig.6.7. Moisture profile of 1.3 wt. % MHEC mortar in between substrate and tile exposure at 40% RH
with an air flow of 0.1 l min-1. The first curve represents the moisture profile before the air exposure.
The second profile shows the moisture profile after 5, 10 and 20 minutes for a, b and c, respectively.
After measuring 2 profiles, the profiles were plotted every 33.
6.5 Discussion
This section discusses the major results of this study.
6.5.1 Absorption behavior as function of MHEC concentration
First, we discuss the observed behavior for absorption. NMR absorption measurement on
pure water mortar shows homogeneous absorption behavior. Whereas with increased
MHEC concentration shows an inhomogeneous absorption behavior. For low MHEC
concentrations, the capillary number is far less than 1 (Ca<<1). This implies that, at these
low viscosities, the capillary pressure gradient inside the mortar and tile are sufficient for
driving the flow. This leads to a homogeneous absorption of water from mortar in to the
tile. At a capillary number of around 1, the shift from a homogeneous absorption to an
inhomogeneous absorption occurs. This happens around 1.3 wt% of MHEC in pore
Chapter 6
108
solution, which approximately coincides with the concentration used in glue mortars. At
the corresponding capillary number of Ca~1, the viscous forces start to overcome the
capillary force. Therefore, an inhomogeneous absorption is observed and an absorption
front should be visible at the drying surface. Later, the absorption front moves inside the
tile until it reach the bottom part of the tile. At higher concentrations (2.1 wt% MHEC,
Ca>>1), little absorption of water is observed, whereas an inhomogeneous absorption is
expected. At this concentration, the high viscosity of the pore solution inhibits the
transport of water and MHEC into the porous tile, causing insufficient adhesion between
the mortar and tile. Obviously, a four order increase of the viscosity inhibits the
absorption i.e., water can no longer flow through the material.
6.5.2 Change of capillary force during drying
Furthermore, the capillary number calculation for both tile and mortar (Fig. 6.5) shows
that the system is either in the capillary or in the transition region for concentrations of
MHEC up to 1.3 wt%. At this low MHEC concentration, the solution can flow both in the
mortar and the tile. As the hydration process in the mortar proceeds, the surface tension
and the contact angle may vary as a consequence of a decrease in water content inside
the pore, leading to an effective increase of the MHEC concentration in the solution. The
decrease of surface tension and increase in contact angle will further reduce the capillary
pressure, allowing viscous forces to dominate. Consequently, the contact angle and
surface tension may reduce the concentration at which the capillary number changes from
below 1 to above 1. Additionally, the decrease of pore size of mortar during hydration may
increase the capillary number, as such allowing viscous force to dominate over capillary
force, which affects the transport of water in mortar. The reason for the increase in the
capillary number is due to the squared value dependence of the permeability on pore
radius, k~r2, which results in an increase in capillary number with decrease in pore radius.
6.5.3 Understanding flow reversal
In Fig. 6.3a, initially water flows from mortar to the tile and later a reverse flow is
observed from tile to the mortar. In order to understand the observed reverse flow, a
schematic picture of the reverse flow process in terms of capillary pore size is presented in
Fig. 6.8. The “maximum” capillary pressure for tile and hydrated mortar without MHEC are
134 kPa and 6720 kPa, experimentally, calculated from Table II. Initially, the water is
absorbed to the tile as a consequence of capillary pressure gradient between mortar and
tile. During this period, the mortar has a lower capillary pressure than the tile and hence
water flows from mortar to the tile. As the mortar starts to hydrate the microstructure
develops leading to an overall decrease in pore sizes of the mortar [4]. As shown in the
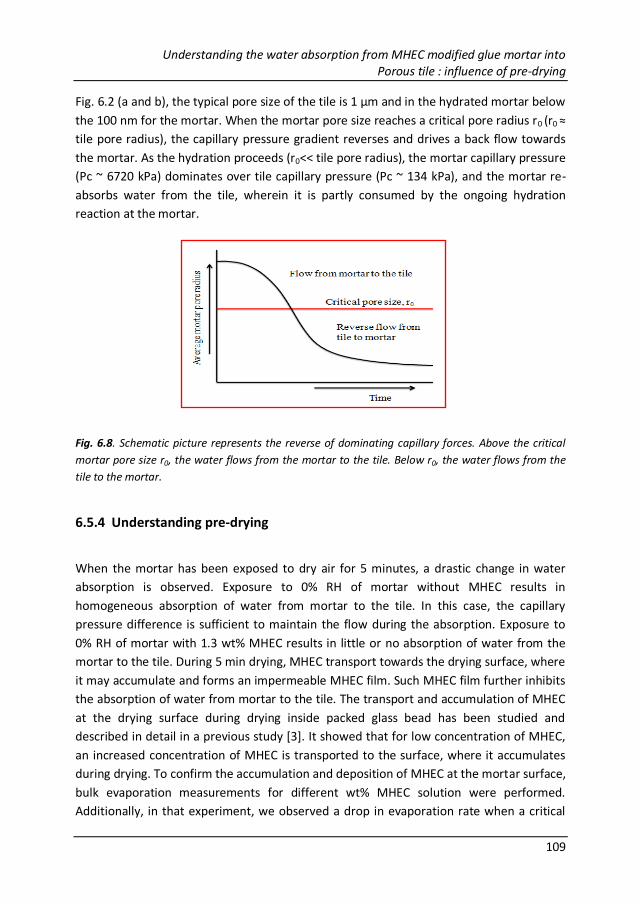
Understanding the water absorption from MHEC modified glue mortar into Porous tile : influence of pre-drying
109
Fig. 6.2 (a and b), the typical pore size of the tile is 1 μm and in the hydrated mortar below
the 100 nm for the mortar. When the mortar pore size reaches a critical pore radius r0 (r0 ≈
tile pore radius), the capillary pressure gradient reverses and drives a back flow towards
the mortar. As the hydration proceeds (r0<< tile pore radius), the mortar capillary pressure
(Pc ~ 6720 kPa) dominates over tile capillary pressure (Pc ~ 134 kPa), and the mortar re-
absorbs water from the tile, wherein it is partly consumed by the ongoing hydration
reaction at the mortar.
Fig. 6.8. Schematic picture represents the reverse of dominating capillary forces. Above the critical
mortar pore size r0, the water flows from the mortar to the tile. Below r0, the water flows from the
tile to the mortar.
6.5.4 Understanding pre-drying
When the mortar has been exposed to dry air for 5 minutes, a drastic change in water
absorption is observed. Exposure to 0% RH of mortar without MHEC results in
homogeneous absorption of water from mortar to the tile. In this case, the capillary
pressure difference is sufficient to maintain the flow during the absorption. Exposure to
0% RH of mortar with 1.3 wt% MHEC results in little or no absorption of water from the
mortar to the tile. During 5 min drying, MHEC transport towards the drying surface, where
it may accumulate and forms an impermeable MHEC film. Such MHEC film further inhibits
the absorption of water from mortar to the tile. The transport and accumulation of MHEC
at the drying surface during drying inside packed glass bead has been studied and
described in detail in a previous study [3]. It showed that for low concentration of MHEC,
an increased concentration of MHEC is transported to the surface, where it accumulates
during drying. To confirm the accumulation and deposition of MHEC at the mortar surface,
bulk evaporation measurements for different wt% MHEC solution were performed.
Additionally, in that experiment, we observed a drop in evaporation rate when a critical
Chapter 6
110
concentration Csol≈10 wt% was reached. This concentration is deposition concentration, as
in the case of a gel, the evaporation remains constant. Consequently, the observed
resistance in the water absorption with MHEC mortar may be due to a MHEC film at the
mortar tile interface.
6.5.5 Effect of moisture content on pre-drying
When a mortar with 1.3 wt% MHEC is exposed to air with an RH of 40%, the water
absorption decreases with increasing drying time. During 5 minutes drying, the MHEC
transport is advected towards the drying surface, but the MHEC concentration might not
exceed the solubility limit leading to film formation. Therefore, the capillary forces can still
drive flow towards the mortar surface. Consequently, we observe absorption of water
from mortar into the tile. With increase of drying time, a gradual decrease of water
absorption from mortar to the tile occurs due to the transport and formation of
impermeable MHEC film at the drying surface of the mortar. This impermeable film may
prevent wetting of tile surface by mortar. At this point, the capillary force is unable to
maintain the flow from the mortar to the tile and the water transport is decreased by
vapor diffusion.
6.6 Conclusions and practical consequences
This Chapter presents an experimental investigation of the water absorption behavior of a
porous substrate and tile in presence of MHEC modified mortar using Nuclear Magnetic
Resonance Imaging. The performed NMR study shows a clear effect of the addition of
MHEC on the water absorption behavior of porous tile.
Our results show that the moderate addition of MHEC (MHEC<1.3 wt%) results in a
viscosity value low enough to enable the absorption of water by the porous tile, and as
such provide better adhesion between mortar and tile. Our study also reveals that a
higher addition of MHEC increases the viscosity to such a value that the absorption of
water by porous tile is prevented. This may lead to a situation that water cannot flow into
the tile, which decreases wetting, known to be a good indicator for loss in the mechanical
adhesion.
In addition, the pre-drying experiments show that environmental parameters such as
air flow and humidity have significant influence on the MHEC transport. Exposure to 0%
RH with air flow of 1 l m-1 of 1.3 wt% MHEC mortar results transport of MHEC and the
formation of MHEC film at the drying surface, which inhibits absorption of water from
mortar to tile. When the mortar is exposed to 40% RH with air flow of 0.1 l m-1 of 1.3 wt%
MHEC, the transport of MHEC and water slows down. In the latter case, the concentration
Understanding the water absorption from MHEC modified glue mortar into Porous tile : influence of pre-drying
111
of MHEC in not enough to form a film, enable water transport from the mortar to tile.
However, when the exposure time is increased, the concentration of MHEC at the mortar
surface gradually increases, resulting in a MHEC film forming inhibiting the transport of
water from the mortar to the tile.
The climatic condition highly influences the MHEC drying, therefore it is advisable to
cover the work place in case of higher temperature (hot climate) and situations with a
high air flow. This is to prevent evaporation rate in order to increase open time.
Additionally, in such cases, it is also advisable to increase the water cement ratio.
Going back to the key question which was raised in the introduction part, we could
largely be answered to those questions from a higher perspective. Still, a number of
problems have to be addressed in order to get a clear picture on open time mechanism for
practical reason. A better understanding of the skin formation mechanism of MHEC within
the 30 min exposure period and its three dimensional growth mechanism need to be
explored in order to fully understand the skin dynamics as such the open time - the key
questions for a logical follow up of this study.
Chapter 6
112
References
1. J. Rottstegge, M. Arnold, L. Herschke, G. Glasser, M. Wilhelm, H. W. Spiess, W. D.
Hegeth, Solid state NMR and LVSEM studies on the hardening of latex modified tile
mortar systems, Cement and Concrete Research, 35 (2005) 2233-2243.
2. A. P. A. Faiyas et.al, Howmethylhydroxyethylcellulose influences drying in a porous
media, Chemical engineering science, 123 (2015) 620-628.
3. A. P. A. Faiyas et.al, Effect of MHEC on evaporation and hydration characteristics of
glue mortar, Cement and Concrete Research, 83 (2016) 97-103.
4. A. P. A. Faiyas, S. J. F. Erich, H. P. Huinink, O. C. G. Adan, Transport of water soluble
polymer during drying of a porous material, Drying technology, 35 (2017) 1874-1886.
5. E. W. Washburn, The dynamics of capillary flow, Physical Review, 17 (1921) 273-283.
6. A. Escardino, V. Beltran, A. Barba, E. Sanchez, Liquid suction be porous ceramic
materials. Influence of firing condition, British Ceramic Transactions, 98 (1999) 225-
229.
7. C. Hall, W. D. Hoff, S. C. Taylor, P. Meredith, A. M, Donald, Water anomaly in capillary
liquid absorption by cement-based materials, Journal of Material Science Letters, 14
(1995) 1178-1181.
8. M. Raimondo, M. Dondi, D. Guarini, F. Mazzanti, Predicting the initial rate of water
absorption in clay bricks, Construction and building material, 23 (2009) 2623-2630.
9. V. Beltran, A. Barba, M.D. Rodrigo, A. Escardino, Liquid suction by porous ceramic
material. 3-Influence of the nature of the composition and the preparation method of
the pressing powder, Br Ceram Trans J, 88 (1989) 219-222.
10. V. Beltran, A. Barba, J. C. Jarque, A. Escardino, Liquid suction by porous ceramic
material.2-Influence of pressing condition. Br Ceram Trans J, 90 (1991) 77-80.
11. V. Beltran, A. Escardino, C, Feliu, M. D. Rodrigo, Liquid suction by porous ceramic
material, Br Ceram Trans J, 87 (1988) 64-69.
12. R. J. Gummerson, C. Hall, W. D. Hoff, Water movement in porous building materials—
II. Hydraulic suction and sorptivity of brick and other masonry materials, building and
Environment, 15 (1980) 101-108.
13. S. C. Taylor et.al, Anomalous water transport properties of Portland and blended
cement-based materials, Journal of Material Science Letters, 18 (1999) 1925-1927.
14. T. Sochi, Non-Newtonian flow in porous media, Polymers 51 (2010) 5007-5023.
15. K. Kopinga, L. Pel, One-dimensional scanning of moisture in porous materials with
NMR, Rev. Sci. Instrum. 65 (1994) 3673-368.
16. M. Prat, S. Veran-Tissoires, N. Vorhauer, T. Metzger, E. Tsotsas, Fractal Phase
Distribution and Drying: Impact on Two-Phase Zone Scaling and Drying Time Scale
Dependence, Drying Technology. 30 (2012) 1129-1135.
17. H. Darcy. Les Fontaines Publiques de la Ville de Dijon. Dalmont, Paris, 1856
Understanding the water absorption from MHEC modified glue mortar into Porous tile : influence of pre-drying
113
18. A. Aït-Mokhtar, O. Amiri, P. Dumargue, S. Sammartino, A new model to calculate
water permeability of cement-based materials from MIP results. Advance in Concrete
Research, 14 (2002) 43-49.
19. J. P Olivier, M. Massat, Permeability and microstructure of concrete : a review of
modelling Cement and Concrete Research, 22(1992) 503-514.
20. J. Van Brakel, P. M Heertjes, Analysis of diffusion in macroporous media in terms of a
porosity, a tortuosity and a constrictivity. Int. J. Heat Mass Transfer, 17 (1975) 1093-
1103.
21. J. Holly, D. Hampton, A. Thomas, Modelling relationships between permeability and
cement paste pore microstructures. Cement and Concrete Research, 23 (1993)
1317±1330.
22. D. Shi P., Brown P. and Kurtz. In Pore structure and permeability of cementitious
materials. Materials Research Society, Pittsburgh 1989, 23±34.
23. J. A. C Brown, J. Aitchison, The Log-Normal Distribution. Cambridge University Press,
1957, chap. 10.
24. A. Aït-Mokhtar, O. Amiri P. Dumargue, S. Sammartino, Analytic modelling and
experimental study of the porosity and permeability of a porous medium -application
to cement mortars and granitic rock, Magazine of Concrete Research, 51 (1999) 391-
396.

114
Conclusions and Outlook
115
Chapter 7
Conclusions and Outlook
Water soluble polymers are normally added to glue mortars as water retention agent in
order to improve the drying by increasing the open time. However, little information is
available about their role on drying, and as such the open time of glue mortar. Therefore,
the aim of this doctoral thesis is to investigate the physical processes that determine the
open time of glue mortar, and to explore the importance of MHEC as polymeric additives
in glue mortar inorder to improve the open time. In section 7.1, general conclusions are
presented and in section 7.2, recommendations for further research are given.
7.1 Conclusions
In this thesis, the main parameters that influence the open time of glue mortar are studied
to get better understanding of MHEC as polymeric additive in glue mortar. For this
purpose, a home-built NMR set-up was used to monitor real time structural changes and
moisture distribution during drying of glue mortar.
To answer the research questions put forward in the introduction, we systematically
addressed these questions in the different chapters in this thesis. In chapter 3, to
investigate the importance of MHEC on the drying behavior, we first studied the drying
behavior of MHEC solution inside FCB. Our study reveals that addition of MHEC shifts the
drying from homogeneous to inhomogeneous. Analysis of the capillary number, defined
as the ratio between capillary forces and viscous forces, shows that the main parameters
determining the transport processes are the evaporation, viscosity, contact angle and
surface tension. The study clearly shows that viscosity is the dominating parameter
causing the observed transition in the drying behavior. This is attributed by the four
orders increase of the viscosity of the pore solution as a function of the MHEC
concentration. Our results also suggest that the water evaporation rate of mortar can be
controlled by optimizing the wt% of MHEC. The drop in the evaporation rate with
increased MHEC concentration is quite unexpected, as experiments on MHEC solution in
capillaries reveal that evaporation is independent on MHEC concentration. We
hypothesized that cellulose is transported to the surface and forms a hydrophobic
impermeable film, creating a vapor barrier that decreases the evaporation rate and as
such increases the water retention. This hypothesis remains to be proven and is addressed
in the subsequent research.
To understand the dominating factors in terms of the drying processes, such as
evaporation, hydration and pore evolution, we studied the time scales of the different

Chapter 7
116
processes occurring in cellulose modified mortar using NMR imaging and relaxation
analysis. It was found that, with increasing MHEC concentration, the evaporation time will
become comparable to order of the hydration time of mortar, and when further
increasing the concentration the hydration time will be shorter than the evaporation time.
At low MHEC concentrations, an insufficient amount of water necessary to hydrate the
mortar is present, resulting in poor hydration throughout the mortar. Addition of 2.1 wt%
MHEC results in an evaporation time comparable to the hydration time of mortar which
enables a higher degree of hydration in MHEC modified mortar. Consequently, the top
surface shows poor hydration due to a drying front and the bottom surface shows good
hydration due to the availability of water till the end of the drying process. We have
shown that the addition of MHEC determines the evaporation rate as such influence the
degree of hydration of mortar.
To understand transport behavior of MHEC and the influence of pore size on the
drying behavior, MHEC transport and the formation of MHEC film at drying surface were
studied. TGA analyses for compositions with <1.3 wt% MHEC reveal a higher enrichment
of MHEC at the surface. The accumulated MHEC at the surface exceeds the solubility
concentration of MHEC in solution and therefore results in a deposition of an
impermeable MHEC film at the surface that subsequently inhibits the vapor transport
reducing the evaporation. However, at higher concentration (2.1 wt% of MHEC), a layer
by layer deposition is observed as a consequence of front like drying. Our results show
that within the range of pore sizes used, the available pore size does not have any
significant influence on the drying behavior. Only moderate addition of MHEC allows the
transport of MHEC, and contributes to the MHEC film formation at the mortar surface.
Concerning the influence of MHEC on water absorption in a three layer tiling system
consisting of the substrate, mortar and tile. It was found that addition of 1.3 wt% MHEC
changes the absorption behavior from homogeneous to inhomogeneous. This is
attributed by the increased viscosity of pore solution, wherein the viscous forces start to
overcome the capillary force. For low concentration of MHEC<1.3 wt%, water initially
flows from mortar to the tile and at a later time the opposite happens. This is a
consequence of the increase of capillary pressure inside the glue mortar, as a result of a
decrease in pore size during the hydration process. For a concentration above 1.3 wt%,
little or no absorption of water occurs, as a result of the high viscosity of the pore
solution. Here, the capillary force simply cannot overcome the viscous force.
With respect to the influence of environmental conditions such as airflow and
humidity before tile application we conclude that when increasing the exposure time, the
concentration of MHEC at the mortar surface gradually increases, which inhibits the
transport of water from the mortar to the tile. Dry air exposure of 1.3 wt% MHEC mortar
resulted in transport and formation of a MHEC film at the drying surface, inhibiting
absorption of water from mortar to tile. In this thesis, we studied the key processes that
Conclusions and Outlook
117
control the open time of glue mortar. Addition of MHEC significantly reduces the water
evaporation rate, basically resulting in dominance of the hydration time over
evaporation time of mortar. Inhomogeneous drying of MHEC modified mortar shows
different degrees of hydration inside the mortar. For low concentrations, it is evident that
MHEC can transport and accumulate at the drying surface, and as such can form a film
that further inhibits the water transport. Furthermore, the pore size of glue mortar does
not have any significant influence on the MHEC/water transport.
7.1.1 Conceptual model of drying process
In the following section, a conceptual model (see Fig. 7.1) of the different processes during
drying of glue mortar is presented as a three-stage process. This model describes the
drying processes for a concentration of 1.3 wt% MHEC, similar to a typical commercial
formulation.
Stage 1: As soon as the adhesive with moderate addition of MHEC (MHEC<1.3 wt%)
is applied to the substrate, water starts to evaporate from the mortar surface (see
Fig.7.1a). During this period, the adsorbed water on the surface evaporates, the resulting
water flow creates a wet surface. At the same time the flow of water, within the
capillaries, will transport organic and inorganic materials, such as cement ions, toward the
surface. This can be seen as a kind of skin that forms; the result of densification of the
mortar by organic and inorganic mortar components, such as the deposition of MHEC at
the mortar surface. This stage occurs critically within the 5-10-minute exposure period.
Stage 2: This is a transition stage in which the adsorbed water on the surface has
evaporated and the water will be only available in the capillaries (see Fig. 7.1b).
Competition occurs between the evaporation rate and water flow rate, leading to a dry
surface and the capillary water is available below the dry surface region. The duration of
this stage ends after an approximate10-20 minute exposure period.
Stage 3: Finally, the evaporation is faster than the water flow rate in capillaries. As a
consequence water in capillaries recedes and a receding drying front appears below the
surface layer (see Fig.7.1c). Here, the viscous force dominates over the capillary force at
the surface, which results in a dry surface layer. Thus, the build-up of a dry surface layer is
regarded as a relative movement between the surface layer of the mortar and the
evaporation front, which relatively retreats from the mortar surface.
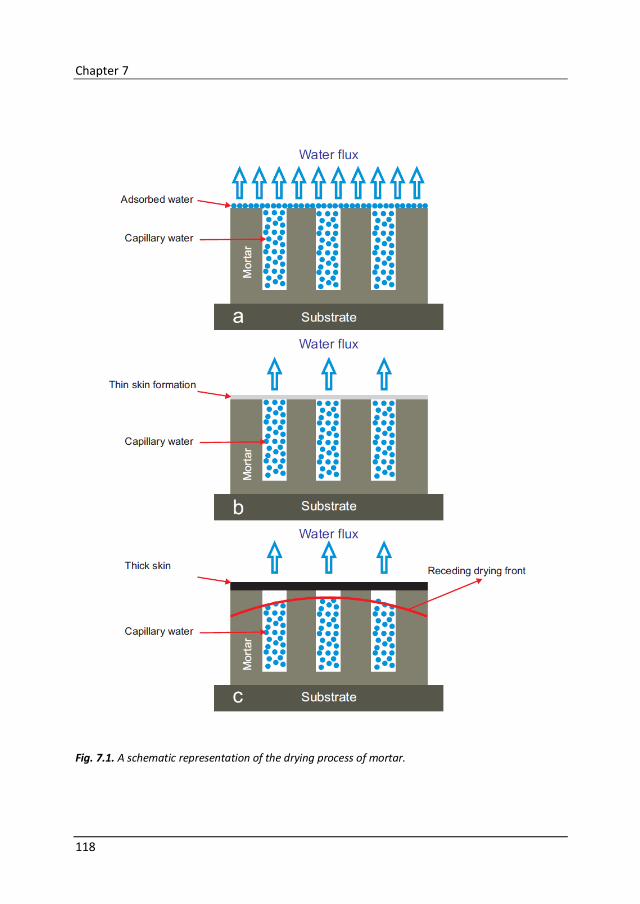
Chapter 7
118
Fig. 7.1. A schematic representation of the drying process of mortar.
Conclusions and Outlook
119
7.1.2 Practical implications
Our results show that the moderate addition of MHEC (MHEC<1.3 wt%) results in a
viscosity value low enough to enable transport of MHEC towards the drying surface, and
as such controls the evaporation rate and hence the open time. Our study also reveals
that a higher addition of MHEC increases the viscosity to such a value that the MHEC
transport toward the drying surface is prevented. This may lead to a situation that water
cannot flow into the tile, which decreases wetting, known to be a good indicator for loss in
the mechanical adhesion. The climatic condition highly influences the MHEC drying,
therefore it is advisable to cover the work place in case of higher temperature (hot
climate) and situations with a high air flow. This is to prevent evaporation rate inorder to
increase open time. Additionally, in such cases, it is also advisable to increase the water
cement ratio.
7.2 Outlook
In this thesis, the key parameters that control the open time of glue mortar have been
investigated. Still, a number of problems have to be addressed inorder to get a clear
picture on open time mechanism for practical reason. A better understanding of the skin
formation mechanism of MHEC within the 30 min exposure period and its three-
dimensional growth mechanism need to be explored in order to fully understand the skin
dynamics as such the open time. In the following sub sections recommendations for
further research are formulated for a logical follow up of this study.
7.2.1 Film formation of MHEC: A mechanism that limits open time
Knowing the film formation mechanism of MHEC solution is a key step toward
understanding the role of skin in determining the open time of drying mortar. Obviously,
the challenge is to find out the nature of film formation of MHEC in presence of individual
mortar constituents and critically in the mortar matrix within the 30 min exposure period.
In our study (Chapter 5), the bulk evaporation measurements with different wt% MHEC
show that the evaporation rates drops when a critical concentration, 𝐶𝑠𝑜𝑙 ≈10 wt% was
reached (see Fig. 5.8 in Chapter 5). To predict the film formation, a measure of minimum
film concentration, temperature, PH and thickness should be established. In addition, the
physical, mechanical and thermal properties of the film should be examined since
properties of the film partially determine the open time, and as such the adhesion.
In this thesis, with 0.7 T NMR, we observed moisture distributions with millimeter
spatial resolution. This resolution is insufficient for analyzing films. The GARField NMR
imaging, introduced by Glover et al. [1], enables imaging with a high resolution of about
Chapter 7
120
5μm. Additionally, the combination of high resolution NMR imaging with NMR
relaxometry can provide information about water content and mobility of the polymer
chains as a function of the position in the sample. Consequently, study the film formation
mechanism of MHEC in absence of mortar constituents, and then study with the cement
ions and with the other constituents of mortar such as cement, limestone and sand. The
objective is verifying if there is any influence of mortar constituents on polymer film
formation.
7.2.2 Water and MHEC transport: Influence of additive migration.
In-situ monitoring of polymer transport is quite challenging, especially in complex mortar
matrix. Migration of polymer and its accumulation on the drying surface significantly
influence skin formation. Therefore, polymer migration must be followed in order to fully
understand the skin dynamics. From our study (Chapter 5), it is known that, for low
concentration, MHEC migrates to and accumulates at the drying surface. A profound in-
situ investigation of the polymer migration is needed to understand the gradual growth of
skin during early drying.
By adding D2O to the cellulose, the migration of the cellulose might be followed by
using NMR imaging. Since deuterium is not probed, only the signal from the cellulose is
measured. While the exchange between deuterons of heavy water and protons of the
polymer is possible, most of the H will remain attached to the cellulose ether and the
number of exchangeable protons is negligible. Additionally, in-situ surface analysis of
mortar is also an option, in order to understand the compositional changes at the skin
surface. Diffuse Reflectance Infrared Fourier Transform (DRIFT) Spectroscopy has proven
to be an ideal tool to analyze the mortar surface in their dry and wet state. ESEM can also
be used to study the surface morphology and the composition of mortar surface.
7.2.3 Environmental parameters: Key parameters in transport.
It is known that climatic conditions have a strong influence on the rate of skin formation.
This is because the air flow rate, temperature and the humidity significantly influence the
evaporation rate. Additionally, the temperature might influence the water polymer
interaction and consequently influence the skin formation. In an open working site or in a
bare building where the windows are not yet installed, the wind and the humidity can
accelerate the skinning rate. As part of a follow up study, one of the main focuses should
be on the temperature effect on skin formation, because, temperature has a strong
influence on water polymer interactions.
Room temperature measurements are common in NMR, however change in mortar
temperature during long term measurement is not desirable and often disturbing the
Conclusions and Outlook
121
physical and chemical processes, specifically the film formation. Therefore, even for the
room temperature measurement the sample may be stabilized using a chiller inorder to
keep the mortar exactly at 23oC. For elevated temperatures a regulated internal probe
heating is sufficient and for experiment below room temperature require chiller with
precise regulation. The humidity and air flow can be easily controlled by a home built air
flow unit. The aim of such study to understands the influence of different climatic
conditions on the open time of glue mortar, critically the film formation by using NMR
imaging.
7.2.4 Other formulations: Influence of the composition.
In this work, we mainly focused on the influence of MHEC on moisture/polymer transport
and hydration characteristics in glue mortar and in different model porous materials. In
Chapter 4, we show MHEC modified mortar improve the mortar hydration. Our
interpretation was based on the higher availability of water in MHEC mortar as a
consequence of decrease in water evaporation. Besides water retention, the presence of
MHEC might influence the hydration kinetics and the nature and morphology of cement
hydrate, and as such influence the microstructure of the hardened material. Therefore,
further investigation is needed on the reaction between cellulose and the mineral phase
to fully understand the effect of MHEC on the hydration characteristics of glue mortar.
The rate of hydration and the interaction of polymers with cement hydrates can be
investigated by analytical measurements, such as isothermal calorimetry, thermal analysis,
X-ray diffraction and FTIR.
Furthermore, MHEC might adsorb and possibly form film at the interfaces of cement
hydrates and on the mortar constituents. The higher tensile strength of polymer as
compared with cementitious matrix might improve the tensile and flexural strength of the
hardened mortar. The cement reaction can also be studied by analyzing compressive
strength and the strength contribution of polymer film can be studied by flexural strength
and tensile strength analysis.
7.2.5 Adhesion test: Key analysis of effective contribution.
Cost for tile floors/walls consists of materials costs and labor costs for tile laying of which
latter cover the dominant part in the overall costs price. Generally, short open time
reduces the tile laying rate, consequently the time consumption for tiling increase the
labor cost. Obviously, a hot climate (eg., United Arab Emirates, 45 oC) significantly reduce
the open time, and as such increase the labor cost. Additionally, climatic parameters
highly influence the curing period required for sufficient adhesion between mortar and
Chapter 7
122
tile. New building earns nothing until and unless they are occupied and consequently the
project must be finished in shortest duration of time.
Therefore, further investigation is needed to understand the climatic condition on
open time (see section 7.2.3) as well as the optimal curing period in order to achieve
sufficient adhesion. Inorder to understand the effect of climatic condition on curing
period, tensile adhesion strength test (DIN EN1348:2007) under various storage conditions
such as at room temperature, water immersion and heat aging shall be carried out.
Feedback from tensile adhesion strength test will give insight to the product development
for varying climatic conditions.
References
1. P. M. Glover, P. S. Aptaker, J. R. Bowler, E. Ciampi, P. J. McDonald, A Novel High-
Gradient Permanent Magnet for the Profiling of Planer Films and Coatings.
Journal of Magnetic Resonance, 139 (1980) 90–97.
123
Summary
The so-called open time is a crucial parameter for the performance of (glue) mortars for
joining material components, such as tiles and bricks. Methylhydroxyethylcellulose
(MHEC), a chemically modified cellulose, is widely added to glue mortar in order to
increase the open time. The open time is the time during which tiles can be fixed with a
sufficiently good adhesion to the substrate. During open time, various processes occur at
the surface of the mortar, such as evaporation, microstructure formation, transport and
deposition of polymeric additive on surface, and wetting. However, the exact processes
that determine the open time are unclear. Therefore, the main goal of this research thesis
is to investigate the processes that determine the open time. An important issue that
hampers the development of knowledge about the open time processes is the lack of
experimental tools to probe real-time structural changes and moisture distributions in
porous media. Only with techniques like Nuclear Magnetic Resonance (NMR), Computed
Tomography (CT) and neutron diffraction the evolution of the structure formation and
water distribution can be monitored non-destructively. Especially NMR imaging has
proven to be a powerful tool for studying transport processes like water uptake, drying,
salt migration and crystallization in porous media. For this purpose, a home-built NMR set-
up was used to monitor real time structural changes and moisture distribution during
drying of glue mortar.
The thesis starts with an overview of knowledge on cellulose modified mortar in
Chapter 1. This chapter focuses on introducing the topic and the influence of the key
processes in open time, such as evaporation, cement hydration, water transport, additive
migration and wetting. In practice, cellulose is being added to glue mortar in order to
improve fresh mortar properties. Cellulose modified mortar shows higher water retention
than ordinary mortar. Therefore, it prevents the dry out of mortar surface by evaporation
and absorption or suction to the porous substrate. However, very little information is
available about the water retention mechanism of cellulose in mortar. Moreover, the
presence of cellulose in fresh mortar influences the hydration kinetics and the
microstructure formation of the cement mortar. The polymer film formation and their
influence on drying and the interaction of polymer solution on cement hydrates is rarely
looked at. Therefore, a detailed study about the water/polymer transport and
microstructure formation during drying of mortar should be carried out. Further, the
thesis proceeds with a description of NMR principles in Chapter 2. It discusses the NMR
basics, principles of imaging, the used pulse sequence and the NMR set-up used in the
experiments.
124
Drying behavior of glue mortar in presence of MHEC may significantly influence the
open time of glue mortar. As mortar is reactive, mortar drying is a combination of
evaporation and chemical reaction. In order to study only drying behavior and to avoid the
influence of chemical reaction on drying, an inert fired clay brick (FCB) is used as model
porous medium. In Chapter 3, the drying behavior of MHEC solution inside FCB is
investigated by using NMR imaging. It was found that the addition of MHEC may increase
the viscosity of pore liquid four orders in magnitude and the drying experiments show a
switch from homogeneous to an inhomogeneous drying behavior. The research resulted in
two main conclusions: 1) The viscosity is a dominating factor influencing the moisture
transport, resulting in a receding drying front at high concentration of MHEC. 2)
Evaporation is also reduced by the addition of MHEC, however, the processes reducing the
evaporation are not fully understood.
Besides drying, the presence of MHEC may influence the hydration characteristics of
glue mortar. In Chapter 4, the influence of MHEC on evaporation and hydration during
drying of a glue mortar is investigated by using NMR imaging. The nature of the drying
behavior of mortar with and without MHEC is similar to FCB drying. Additionally, without
MHEC, the evaporation time (10h) is faster than hydration time (25h), this causes an
insufficient amount of water necessary to hydrate the mortar, resulting in poor hydration
throughout the mortar as confirmed by mercury intrusion porosimetry (MIP) and T2
relaxation studies. When adding a MHEC concentration larger than 1.3 wt%, mortar
exhibits an evaporation time comparable to the hydration time of mortar. Above 1.3 wt%,
also an inhomogeneous distribution of water is observed that causes differences in the
degree of hydration within the mortar sample. The top surface shows poor hydration due
to a drying front at the top and the bottom surface shows good hydration due to the
availability of water till the end of the drying process. The good hydration at the bottom is
confirmed by MIP and T2relaxation studies.
The influence of pore size on the drying behavior is being addressed in Chapter 5.
Additionally, the observed drop in the evaporation rate with increased MHEC
concentration is quite unexpected, as experiments on MHEC solutions in capillaries shown
evaporation is independent on MHEC concentration. It may be suggested cellulose is
transported to the surface and forms a hydrophobic impermeable skin, creating a barrier
for vapor transport.
Subsequently, in Chapter 5, we studied the transport and distribution of MHEC
during drying inside packed glass beads with 1 mm, 500 µm and 50µm diameters to
understand the influence of pore size, and corresponding capillary forces, on drying and
transport of MHEC. For all bead sizes, MHEC concentration less than 1.3 wt%,
homogeneous drying is observed, causing advective transport of MHEC towards the drying
surface. In such case, accumulation of MHEC may form a skin at the top surface and below
this skin layer, a gel zone may form, which allows migration of water towards the
125
evaporation surface. When the MHEC concentration is above 1.3 wt%, front receding
drying is observed, which prevents transport of MHEC, resulting in a more homogeneous
distribution of MHEC. In fact the beads do not seem to directly influence the transport of
MHEC rather than changing the drying behavior for larger bead size, 1 mm at low wt% of
MHEC, due to gravitational force.
In Chapter 6, we investigated the absorption characteristics of a porous substrate
and tile in presence of MHEC added mortar. Water absorption studies of mortar on porous
tile show a gradual shift from a homogeneous to inhomogeneous absorption behavior
with increasing MHEC concentration. For concentrations of MHEC ≥ 2.1 wt%, little or no
absorption of water is observed in the tile. At this concentration, the high viscosity of the
pore solution seems to inhibit the transport of water and MHEC in to the porous tile. This
will cause insufficient adhesion between the mortar and tile. To investigate the influence
of drying conditions on open time, the absorption of water in a tile has been studied for
different humidity and air flow. Drying of mortar without MHEC at zero humidity results
homogeneous absorption of water from mortar to the tile. In this case the capillary
pressure difference is enough to maintain the flow during absorption. As can be expected,
drying of 1.3 wt% MHEC mortar at zero humidity shows little wetting of the tile due to the
advective transport and deposition of MHEC at the mortar surface. This may further
inhibit the absorption of water from mortar to the tile. When exposing 1.3 wt% MHEC
mortar to stagnant air slow absorption of water and MHEC by the tile is observed. In such
case, the concentration of MHEC at the mortar surface may not be enough to form a film
to inhibit the water transport from the mortar to tile, and capillary pressure can still
overcome the viscous forces. With increasing exposure time, the concentration of MHEC
at the mortar surface gradually raises, inhibiting the transport of water from the mortar to
the tile.
In Chapter 7, general conclusions and outlook based on the results of the previous
Chapters. In this work, the hydration and transport process in cellulose modified glue
mortar was studied successfully with NMR imaging and Thermo Gravimetric Analysis
(TGA). At low concentration of MHEC ≤ 0.8 wt% in glue mortars, the time scale of
evaporation is short compared to the hydration time, resulting in partial hydration. At
these low concentrations, transport of water and MHEC is high, enabling a good suction
into tiles. However, the high evaporation rate results in a short open time, requiring fast
processing and posing a high risk of insufficient adhesion. Higher concentrations of MHEC
≥ 2.1 wt% result in inhomogeneous drying as a result of the viscosity. Additionally, the
high concentration of MHEC results in reduced transport of water and MHEC, leading to
limited suction and wetting of the tile, reducing the adhesion. Moderate addition of
MHEC≈ 1.3 wt% is helpful in water retention by extending the evaporation time, which
ensures full hydration. At this concentration, homogeneous drying with higher enrichment
of MHEC towards the drying surface is observed. This indicates a liquid path all the way to

126
the surface of the sample, or in other words: an advective transport of MHEC towards the
drying surface is occurring. Moderate addition of MHEC allows gradual suction of water by
tiles where it results in good wetting and reduction of a low adhesion risk.
127
Samenvatting
De zogenaamde opentijd is een cruciale parameter voor de prestatie van lijmmortels
tijdens het aanbrengen van tegels en stenen. Methylhydroxyethylcellulose (MHEC), een
chemisch gemodificeerde cellulose, wordt op grote schaal gebruikt als additief in
lijmmortels met als doel de opentijd te vergroten. De opentijd is de tijd, waarin tegels
kunnen worden bevestigd met een voldoende goede hechting op het onderliggend
materiaal, het substraat. Tijdens de opentijd vinden verschillende processen plaats aan
het oppervlak van de mortel, zoals verdamping, microstructuurvorming, transport en
depositie van polymeer additieven aan het oppervlak. De precieze processen die de
opentijd bepalen zijn echter onduidelijk. Het belangrijkste doel van dit proefschrift is de
processen te onderzoeken die van invloed zijn op de opentijd. Een belangrijk probleem dat
de ontwikkeling van kennis over de opentijdprocessen belemmert, is het gebrek aan
experimentele hulpmiddelen om real-time structurele veranderingen en vochtverdelingen
in poreuze media te onderzoeken. Alleen met technieken zoals Nuclear Magnetic
Resonance (NMR), Computed Tomography (CT) en neutronendiffractie kan de evolutie van
de structuurvorming en waterverdeling niet-destructief worden gemonitord. Vooral NMR-
beeldvorming is een krachtig hulpmiddel gebleken voor het bestuderen van
transportprocessen zoals wateropname, drogen, zoutmigratie en kristallisatie in poreuze
media. Een zelfgebouwde NMR-opstelling is daarom gebruikt om real-time structuur
veranderingen en vochtverdeling tijdens het drogen van lijmmortel te onderzoeken.
Dit proefschrift begint met een overzicht van kennis vanmet cellulose
gemodificeerde mortel (hoofdstuk 1). Dit hoofdstuk richt zich op de invloed van de
belangrijkste processen in opentijd, zoals verdamping, cementhydratatie, watertransport,
additieve migratie en bevochtiging. In de praktijk wordt cellulose aan lijmmortel
toegevoegd om de eigenschappen van verse mortel te verbeteren. Cellulose
gemodificeerde mortel vertoont een hogere waterretentie dan gewone mortel, waarmee
het uitdrogen van morteloppervlak door verdamping en absorptie of opzuiging inhet
poreuze substraat wordt voorkomen. Er is echter zeer weinig informatie beschikbaar over
ditwaterretentie-mechanisme van cellulose in mortel. Bovendien beïnvloedt de
aanwezigheid van cellulose in verse mortel de hydratatiekinetiek en de
microstructuurvorming van de cementmortel. De filmvorming door de cellulose, het
gevolg daarvan op het drogen en de interactie van (polymeer) oplossing op hydrateren
van het cement iszelden bekeken. Daarom moet een gedetailleerd onderzoek worden
uitgevoerd naarhet transport van water en/of polymeer en de vorming van
microstructuren tijdens het drogen van mortel. Dit proefschrift vervolgt met een
beschrijving van de NMR-principes in hoofdstuk 2. Het behandelt de NMR-beginselen,
128
principes van beeldvorming, de gebruikte pulssequentie en -tot slot- de NMR-opstelling
die in de experimenten is gebruikt.
Het drooggedrag van lijmmortel in aanwezigheid van MHEC kan de opentijd van
lijmmortel aanzienlijk beïnvloeden. Aangezien mortel reactief is, is morteldroging een
combinatie van verdamping en chemische reactie (hydratatie). Om alleen het drooggedrag
te bestuderen en de invloed van een chemische reactie op het drogen uit te sluiten, wordt
een inerte baksteen (firedclaybrick: FCB) gebruikt als een model poreus medium. In
hoofdstuk 3 wordt het drooggedrag van de MHEC-oplossing in FCB onderzocht met behulp
van NMR-beeldvorming. De resultaten laten zien dat de toevoeging van MHEC de
viscositeit van vloeistof vier orden in grootte kan verhogen en dat de droogexperimenten
een overgang van homogeen naar een inhomogeen drooggedrag vertonen. Het onderzoek
resulteert in twee hoofdconclusies: 1) De viscositeit is een dominante factor die het
vochttransport beïnvloedt, resulterend in een terugtrekkend droogfront bij een hoge
concentratie MHEC. 2) Verdamping wordt ook verminderd door de toevoeging van MHEC,
maar de processen die de verdamping verminderen worden niet volledig begrepen.
Naast drogen kan de aanwezigheid van MHEC de hydratatie-eigenschappen van
lijmmortel beïnvloeden. In hoofdstuk 4 wordt de invloed van MHEC op verdamping en
hydratatie tijdens het drogen van een lijmmorte londerzocht door middel van NMR-
beeldvorming. De aard van het drooggedrag van mortel met en zonder MHEC is
vergelijkbaar met baksteen (FCB) drogen. Zonder MHEC is de verdampingstijd (10h) veel
sneller dan de hydratatietijd (25h), waardoor er een onvoldoende hoeveelheid water is
om de mortel volledig te hydrateren. De onvoldoende graad van hydratatie wordt
bevestigd door kwik porosimetrie (MIP) en T2-relaxatie metingen. Bij toevoeging van een
MHEC-concentratie van meer dan 1.3 massa% vertoont mortel een verdampingstijd die
vergelijkbaar is met de hydratatie tijd van mortel. Boven 1.3 massa% toevoeging wordt
ook een inhomogene verdeling van water waargenomen die ongelijkmatige hydratatie
inhet mortelmonster veroorzaakt. Het oppervlak vertoont slechte hydratatie als gevolg
van een droogfront aan de bovenkant, terwijl de onderkant goede hydratatie vertoont,
vanwege de lange beschikbaarheid van water tot het einde van het droogproces. De
goede hydratatie aan de onderzijde wordt bevestigd door MIP en T2-relaxatie metingen.
De invloed van poriegrootte op het drooggedrag wordt behandeld in hoofdstuk 5. De
in hoofdstuk 3 geobserveerde daling van de verdampingssnelheid met verhoogde MHEC-
concentratie was onverwacht, omdat experimenten met cellulose oplossingen in
capillairen een verdampingssnelheid vertonen die onafhankelijk is van de gebruikte
concentratie. Onze hypothese is dat de cellulose naar het oppervlak wordt
getransporteerd en een hydrofobe, ondoordringbare huid vormt die een barrière vormt
voor damptransport. Vervolgens hebben we in hoofdstuk 5 het transport en de distributie
van MHEC onderzocht tijdens het drogen van een bed van gepakte glasparels met 1 mm,
500 μm en 50 μm diameter. Doel was om inzicht te krijgen in de invloed van de
129
poriegrootte en de bijbehorende capillaire krachten op het drogen en transporteren van
MHEC. Voor korrelgroottes met MHEC-concentratie van minder dan 1.3 massa% werd
homogeen drogen waargenomen, waardoor de cellulose in de richting van het
droogoppervlak werd getransporteerd. In een dergelijk geval kan accumulatie van MHEC
een huid vormen aan het oppervlak met daaronder een gelzone. Deze gelzone maakt
migratie van water naar het verdampingsoppervlak mogelijk. Wanneer de MHEC-
concentratie hoger is dan 1.3 massa% wordt er een terugtrekkend droogfront
waargenomen. Dit resulteert in een meer homogene verdeling van MHEC, omdat
transport van MHEC niet mogelijk is. In feite lijken de glasparels niet direct het transport
van MHEC te beïnvloeden. Slechtsbij grotereglasparel afmetingen (1 mm) en lage massa
percentages van MHEC verandert het drooggedrag als gevolg van de zwaartekracht.
In hoofdstuk 6 hebben we de absorptiekenmerken van een poreus substraat en tegel
in aanwezigheid van MHEC toegevoegde mortel onderzocht. Waterabsorptiestudies van
mortel op poreuze tegels laten een geleidelijke verschuiving zien van homogeen naar
inhomogeen absorptiegedrag met toenemende MHEC-concentratie. Voorcellulose
concentraties vanaf ≥ 2.1 massa% wordt weinig of geen absorptie van water in de tegel
waargenomen. Bij deze concentraties blijkt de hoge viscositeit van de poriënoplossing het
transport van water en MHEC naar de poreuze tegel te belemmeren. De consequentie is:
onvoldoende hechting tussen mortel en tegel. Om de invloed van droogomstandigheden
op de opentijd te onderzoeken, is de absorptie van water in een tegel bestudeerd voor
verschillende vochtigheid en luchtstroming over de mortel. Drogen van mortel zonder
cellulose toevoeging met droge luchtvochtigheid resulteert in homogene absorptie van
water van mortel naar de tegel. In dit geval drijft het capillaire drukverschil het transport.
Vanzelfsprekend vertoont drogen van 1.3 massa% MHEC-mortel bij een droge lucht weinig
bevochtiging van de tegel op. Dit als gevolg van een verhoogde viscositeit aan het
morteloppervlak door transport en afzetting van MHEC aan het morteloppervlak. Dit
belemmert verder de absorptie van water van mortel naar de tegel. Wanneer de mortel
bij 1.3 massa% MHEC wordt blootgesteld aan stilstaande lucht, dan verlaagt dit de
snelheid van MHEC-transport naar het oppervlak. Een vertraging in filmvorming van MHEC
is dan het directe gevolg. Bij deze laatste situatie wordt opname gezien in de tegelen
kunnende capillaire krachten de viskeuze krachten overwinnen. Een verdere toename van
de droogtijd leidt echter tot geleidelijkere filmvorming aan het oppervlak. Deze
ondoordringbare film kan geleidelijk het bevochtigen van tegeloppervlak door mortel
voorkomen.
In hoofdstuk 7 worden algemene conclusies en suggesties voor vervolgonderzoek
gepresenteerd op basis van de resultaten uit de voorgaande hoofdstukken. In dit werk is
het hydratatie- en transportproces in met cellulose gemodificeerde lijmmortelmet NMR-
beeldvorming en Thermo Gravimetrische Analysis (TGA) met succes onderzocht. Bij lage
concentratie MHEC ≤ 0.8 massa% in lijmmortels is de tijdschaal van verdamping kort in
130
vergelijking met de hydratatietijd, hetgeen resulteert in gedeeltelijke hydratatie. Bij deze
lage concentraties is het transport van water en MHEC hoog, waardoor een goede
zuigingdoor de tegels mogelijk is. De hoge verdampingssnelheid resulteert echter in een
korte opentijd, die een snelle verwerking vereist en een hoog risico van onvoldoende
hechting met zich meebrengt. Hogere concentraties van MHEC ≥ 2.1 massa% resulteren in
inhomogene droging als gevolg van de viscositeit. Bovendien resulteert de hoge
concentratie van MHEC in verminderd transport van water en MHEC, hetgeen leidt tot
beperkte zuiging en bevochtiging van de tegel en verminderde hechting. Matige
toevoeging van MHEC≈ 1.3 massa% is nuttig voor het vasthouden van water, wat volledige
hydratatie garandeert. Bij deze concentratie wordt homogeen drogen met hogere
verrijking van MHEC aan hetoppervlak waargenomen. Dit duidt op een vloeistofpad tot
aan het oppervlak. Matige toevoeging van MHEC maakt een gedeeltelijke zuiging van
water per tegel mogelijk, resulterend in een goede bevochtiging van tegels, waardoor het
risico van lage hechting wordt verminderd.
131
Acknowledgement
Venturing this PhD has been a truly life transformative experience for me and it would not
have been possible to do without the support and guidance that I received from many
people. I would like to express my sincere gratitude to all of them and I will remember this
forever.
Firstly, I would like to express my sincere gratitude to my promotor Prof. Olaf Adan
for giving me the opportunity to perform my PhD studies in his esteemed group. Olaf, your
constant motivation, dynamism, vision, critical thinking and smartness have deeply
inspired me. Thanks for your lessons to logically structuring my results and to present the
results as clearly as possible. It was a great privilege and honor to me to work and study
under your guidance.
Bart, my very special thank to you for your patient guidance, encouragements,
advices, healthy criticism, valuable time and trust that has been provided throughout the
time as your student. My gratitude to you is beyond the word and without your able
guidance and constant feedback this PhD would not have been achievable. I greatly
appreciate your constant effort to higher me as an independent researcher throughout
the time and especially during our high energy endless discussion. Bart, I have been
extremely lucky to have a supervisor like you, you cared so much about my work, and
responded to my questions and queries so promptly. Bart, thanks for the Dutch summary
of the thesis and for your friendship and empathy too!
Henk, my deep thank to you for your guidance, inspiration and suggestions in my
quest for knowledge. Our Monday meeting was very precious that helped me to shape my
results even more solid and scientifically sound. Henk, thanks for your invaluable feedback
on articles.
I would also like to express my gratitude to my second promoter, Prof. E.A.B.
Koenders, for his valuable feedback on the manuscript and all committee members for
their participation in the PhD defense ceremony and for their valuable feedback on the
manuscript.
Timo NIjland, thank you for your extensive help in microscopy analysis of mortar
samples at TNO and your invaluable feedbacks during our project meetings. C.J Haecker,
thank you for providing the cellulose ether samples and for helpful discussion in an early
phase of the project during our industry visit to SE Tylose GmbH&Co, Wiesbaden,
Germany. Michiel van Soestbergen, I appreciate your help with the Comsol for modeling
the drying. Marc Prat, thank you for providing the bead samples and helpful discussion on
2D and 3D drying.
132
Leo, thank you for pushing my NMR set-up busy and keep working. Klaas, thanks for
your NMR lectures and your presence at the group meeting. Jef, thanks for your constant
monitoring to avoid any holiday for my NMR set-up! also Jef, you shown to me that there
is no age barrier for friendship and I appreciate your sports skills. Hans, thanks for your
very strict technical assistance to use scientific instruments in our lab. Hans, your blood
donation service inspired me to become a blood donator, thanks; you really have a
helping heart. I am thankful to all people working in workshop for their skill full fabrication
of sample holders for NMR measurements. I would like to thank Ria, Marlouke, Wendy
and Gitty & Brigitt (M2i) for their care and support in administrative work. I greatly
acknowledge Materials innovation institute (M2i) and Netherlands Organization for
Applied Scientific Research (TNO) for helping and funding for the research work.
Pim, Nico and Victor, thank you for your interesting scientific discussion and for your
company. Pim, thanks for sharing your NMR skill and knowledge and also thanks for your
Dutch to English translation whenever needed. Nico, thanks for motivating and
inspirational comments on my work. Victor, thanks for constructive criticism and useful
scientific discussion on my research topic.
Sonia and Kashif, thanks for your immense care and support even from my first visit
to Netherlands. Sonia, thank you for interesting discussion in common language whether
it is scientific or social, which helped me to release most of my stress and homesick. I
enjoyed the unforgettable gathering and homely food offered by you. Kashif, thank you
for treating me as your younger brother, your utmost care and peaceful and thoughtful
advices greatly helped me to achieve my dream.
Rahela, Sofia, Ozlem and Ching Ping thanks for friendly atmosphere and moral
support. Rahela, I really enjoyed interesting discussion during lunch and coffee break and
enjoyed your Iranian dishes, especially the Soups! Sofiya, thank you for being a cool
officemate. Ozlem, thank you for your moral support and help whenever needed, you are
really a group entertainer. Ching Ping, thank you for introducing me to the Chinese food
(half cooked! ) and tradition.
I would like to express my sincere thanks to my other colleagues of TPM group;
Tamerlan, Mirjam , Gijs, Stephan, kees, Kateryna, Negar, Karel, Okan and Ahmed. Thank
you all for being nice colleagues and for offering a nice atmosphere to work.
I would like to thanks all my friends; Gagen, Susheel, Jaisan, Ramesh Nair, Vinod,
afsal, ramesh, musthafa, rajesh, joshy, saju, vasudevan, Arun, Naveen, Manoj, Shekar,
Sangeeth, Arun kumar and Shabeerali, for their constant support and you were always
beside me during the happy and hard moments to push me and motivate me.
My special regards to my former supervisor Prof. R. K Pandey, Prof. G. Mohan Rao,
Prof. K. Narasimha Rao, Prof. K.S. Sangunni and Dr R. Ganesh, your guidance and research
training helped me to overcome issues related with the PhD successfully.
133
My deep and sincere gratitude goes to my family for their continuous and
unparalleled love, help and support. Mom and Dad, thank you for endless payers and
showing faith in me and giving me liberty to choose what I desired. Dad, you took the lead
to heaven before the completion of this work, you are my ultimate role model and this
thesis is heartily dedicated to you. My heartfelt regard goes to my brothers Nisar, Ameer
Ali , Rafeeque and sister Laila, Shafeena for their patience, love and prayers. Also I express
my thanks to my father in law, mother in law, brother in law Najeeb, Basheer, Noushad
Ali, Muhammed Kutty, Naveed, Nadheem, Nihad and sister in law Saleena, Riswana
Nusrin, Nishath, Neshwi for their love and moral support . Thanks to my sweet nephews &
nieces Nidha, Niha, Neja, Muhsin, Murshid, Rifan, Muna, Vafeed, Finla, Maleeha, Shadin,
Shefin, Aayath for their cute innocent love.
Most importantly, I wish to thank my dearest wife and best friend, Fathima Nishah
for her eternal support and understanding of my goals and aspirations. Her patience, love
and sacrifice will remain my inspiration throughout my life. I also dedicate this Ph.D. thesis
to my two lovely children, Fidhil and Ezza who are the pride and joy of my life. Thanks for
cheering me up by your cute disturbance during my thesis writing.
134
List of publications
A. P. A. Faiyas, S. J. F. Erich, M. van. Soestbergen, H. P. Huinink, O. C. G. Adan, T. J.
Nijland, How methylhydroxyethylcellulose influences drying in porous media,
Chemical Engineering Science, 123 (2015) 620-628.
A. P. A. Faiyas, S. J. F. Erich, H. P. Huinink, O. C. G. Adan, T. J. Nijland, Effect of
MHEC on evaporation and hydration Characteristics of glue mortar, Cement and
Concrete Research, 83 (2016) 97-103.
A. P. A. Faiyas, S. J. F. Erich, H. P. Huinink, O. C. G. Adan, Transport of water-
soluble polymer during drying of a model porous media, Drying Technology, 35
(2017) 1874-1886.
A. P. A. Faiyas, S. J. F. Erich, T. J. Nijland, H. P. Huinink, O. C. G. Adan,
Microstructure development of drying tile mortar containing methylhydroxy-
ethylcellulose (MHEC), 15th Euroseminar on Microscopy Applied to Building
Materials, 17-1 June 2015, Delft, The Netherlands.
A. P. A. Faiyas, S. J. F. Erich, H. P. Huinink, O. C. G. Adan, Understanding water
absorption from MHEC modified glue mortar into porous tile: Influence of pre-
drying, Construction and Building Materials, 217 (2019) 363-371.
Other Publications
A. P. A. Faiyas, E. M Vinod, J. Joseph, R. Ganesan, R. K. Pandey, Dependence of PH
and surfactant effect in the synthesis of magnetite (Fe3O4) nano particles and its
properties, Journal of Magnetism and Magnetic materials, 322 (2010) 400-404.
E. M Vinod, R Naik, A. P. A. Faiyas, R. Ganesan, K. S Sangunni, Temperature
dependant optical constants of amorphous Ge2Sb2Te5 thin film, Journal of Non-
Crystalline Solids, 356 (2012) 2172-2174.
135
CURRICULUM VITAE
Ahammed Faiyas was born on 25th of May 1984 in Vazhakkad in
Kerala, India. He matriculated in 2001 from Government Higher
Secondary School Vazhakkad in Kerala. The following years, in
2004 he graduated in Physics from ST Joseph’s College Devagiri,
Calicut, Kerala and in 2006, he has obtained Master degree in
physics and in 2008, he has obtained Master of Technology in
Materials Science from Barkatullah University Bhopal, India.
Later, he worked as a research Assistant at Indian Institute of
Science, Banglore. In 2010, Faiyas was employed as PhD
researcher by Materials Innovation Institute (M2i), Delft and
has started his PhD project at the Eindhoven University of
Technology in the group Transport in Permeable Media (TPM), Eindhoven, The
Netherlands. The PhD project aimed to investigate effect of modified cellulose on open
time of glue mortar. The main body of the work and its conclusions are presented in this
thesis.