Flow conditions of fresh mortar and concrete in different pipes
10
Flow conditions of fresh mortar and concrete in different pipes Stefan Jacobsen a, ⁎, Lars Haugan b , Tor Arne Hammer b , Evangelos Kalogiannidis a a Norwegian University of Science and Technology, Dept of Structural Engineering, Trondheim, Norway b SINTEF Byggforsk AS Building and Infrastructure, Trondheim, Norway abstract article info Article history: Received 24 February 2009 Accepted 10 July 2009 Keywords: Fresh concrete Workability Rheology Pumping The variation in fresh concrete flow rate over the pipe cross section was investigated on differently coloured and highly flowable concrete mixes flowing through pipes of different materials (rubber, steel, acryl). First, uncoloured (gray) concrete was poured through the pipe and the pipe blocked. Similar but coloured (black) concrete was then poured into the pipe filled with gray concrete, flowing after the gray concrete for a while before being blocked and hardened. The advance of the colouring along the pipe wall (showing boundary flow rate) was observed on the moulded concrete surface appearing after removing the pipe from the hardened concrete. The shapes of the interfaces between uncoloured and coloured concrete (showing variation of flow rate over the pipe cross section) were observed on sawn surfaces of concrete half cylinders cut along the length axes of the concrete-filled pipe. Flow profiles over the pipe cross section were clearly seen with maximum flow rates near the centre of the pipe and low flow rate at the pipe wall (typically rubber pipe with reference concrete without silica fume and/or stabilizers). More plug-shaped profiles, with long slip layers and less variation of flow rate over the cross section, were also seen (typically in smooth acrylic pipes). Flow rate, amount of concrete sticking to the wall after flow and SEM-images of pipe surface roughness were observed, illustrating the problem of testing full scale pumping. © 2009 Elsevier Ltd. All rights reserved. 1. Introduction Pumpability is mainly depending on the fresh concrete, but cannot only be defined in terms of rheological properties. Since pumping concrete is a widely used method for distribution and placement due to the increasing need for speedy construction [1,2] the pumpability is of practical importance for the industry. Both fundamental parameters governing flow and placement of concrete [3–6] and hardened properties are included in the practical definition of concrete pumpability; “ability to flow through pipes and hoses by the help of a pump without negative effect on fresh and hardened properties” [7,8]. The main parameters of pumpability have been reviewed and studied [1,2,9–11] and can be divided into site conditions (type of pump, size, length and material of pipe, energy use, required flow etc) and concrete technology (composition, rheology, age etc). To predict pumpability of a certain concrete mix in a specific pumping set-up, the complex relation between concrete rheology and pumpability needs elucidation. In addition there are various physical phenomena involved. In [1,12,13] two different flow mechanisms were proposed; plug/slip- and/or shear flow. Equipment, concrete composi- tion and rheology affect both these two flow modes. The plug/slip action is assumed to be facilitated by a slip layer between the concrete and the pipe wall. Prior to pumping, the slip layer is usually established by pipeline priming, but during successful pumping it is probably maintained by the concrete. The concrete should neither have too low nor too high fines content depending on aggregate packing, size, shape etc. Furthermore, there should neither be too much nor too fast pressurized bleeding to avoid a dewatered plug, nor too high friction at the pipe wall. The shear conditions of the bulk flow motion can be assumed to depend on whether the concrete yield stress is surpassed. The yield stress can be assumed to be reached first near the wall, and the plug radius reduced towards the centre of the pipe at increasing pressure [10]. For such shear flow development, plastic viscosity governs the velocity profile between the moving plug and the pipe wall, as flow and shear rate increase and the plug eventually disappears if the resulting shear action on the surface of the plug surpasses the yield stress over the whole cross section. This is quantified by Eq. (1) below. Few experimental studies on the relation between rheology and pumpability exist. In a study on the relation between concrete rheol- ogy and hydraulic oil pressure in a piston pump at 200 m vertical concrete pumping during the production of a North sea off-shore structure [14], measurements were made with the MkII viscometer [10,15] before and after pumping. The results showed that both the yield, g (Nm), and the rate of change, h (Nms), related to the pressure. Best relation was found between increasing yield and increased pressure. Also slump was measured, and related best to reduced pressure. The investigated concrete mixes had w/b =0.42–0.45, 420 kg of cement, 2% silica fume, around 1.2% superplasticizer by weight of cement and 190–240 mm slump. A more complete study was made on a French construction site [16], measuring fresh concrete Cement and Concrete Research 39 (2009) 997–1006 ⁎ Corresponding author. E-mail address: [email protected] (S. Jacobsen). 0008-8846/$ – see front matter © 2009 Elsevier Ltd. All rights reserved. doi:10.1016/j.cemconres.2009.07.005 Contents lists available at ScienceDirect Cement and Concrete Research journal homepage: http://ees.elsevier.com/CEMCON/default.asp
Transcript of Flow conditions of fresh mortar and concrete in different pipes
Cement and Concrete Research 39 (2009) 997–1006
Contents lists available at ScienceDirect
Cement and Concrete Research
j ourna l homepage: ht tp: / /ees.e lsev ie r.com/CEMCON/defau l t .asp
Flow conditions of fresh mortar and concrete in different pipes
Stefan Jacobsen a,⁎, Lars Haugan b, Tor Arne Hammer b, Evangelos Kalogiannidis a
a Norwegian University of Science and Technology, Dept of Structural Engineering, Trondheim, Norwayb SINTEF Byggforsk AS Building and Infrastructure, Trondheim, Norway
⁎ Corresponding author.E-mail address: [email protected] (S. Jacobse
0008-8846/$ – see front matter © 2009 Elsevier Ltd. Adoi:10.1016/j.cemconres.2009.07.005
a b s t r a c t
a r t i c l e i n f oArticle history:Received 24 February 2009Accepted 10 July 2009
Keywords:Fresh concreteWorkabilityRheologyPumping
The variation in fresh concrete flow rate over the pipe cross section was investigated on differently colouredand highly flowable concrete mixes flowing through pipes of different materials (rubber, steel, acryl). First,uncoloured (gray) concrete was poured through the pipe and the pipe blocked. Similar but coloured (black)concrete was then poured into the pipe filled with gray concrete, flowing after the gray concrete for a whilebefore being blocked and hardened. The advance of the colouring along the pipe wall (showing boundaryflow rate) was observed on the moulded concrete surface appearing after removing the pipe from thehardened concrete. The shapes of the interfaces between uncoloured and coloured concrete (showingvariation of flow rate over the pipe cross section) were observed on sawn surfaces of concrete half cylinderscut along the length axes of the concrete-filled pipe. Flow profiles over the pipe cross section were clearlyseen with maximum flow rates near the centre of the pipe and low flow rate at the pipe wall (typicallyrubber pipe with reference concrete without silica fume and/or stabilizers). More plug-shaped profiles, withlong slip layers and less variation of flow rate over the cross section, were also seen (typically in smoothacrylic pipes). Flow rate, amount of concrete sticking to the wall after flow and SEM-images of pipe surfaceroughness were observed, illustrating the problem of testing full scale pumping.
© 2009 Elsevier Ltd. All rights reserved.
1. Introduction
Pumpability is mainly depending on the fresh concrete, but cannotonly be defined in terms of rheological properties. Since pumpingconcrete is awidely usedmethod for distribution andplacement due tothe increasing need for speedy construction [1,2] the pumpability is ofpractical importance for the industry. Both fundamental parametersgoverning flow and placement of concrete [3–6] and hardenedproperties are included in the practical definition of concretepumpability; “ability to flow through pipes and hoses by the help ofa pump without negative effect on fresh and hardened properties”[7,8]. The main parameters of pumpability have been reviewed andstudied [1,2,9–11] and can be divided into site conditions (type ofpump, size, length and material of pipe, energy use, required flow etc)and concrete technology (composition, rheology, age etc).
To predict pumpability of a certain concrete mix in a specificpumping set-up, the complex relation between concrete rheology andpumpability needs elucidation. In addition there are various physicalphenomena involved. In [1,12,13] two different flow mechanisms wereproposed; plug/slip- and/or shear flow. Equipment, concrete composi-tion and rheology affect both these twoflowmodes. The plug/slip actionis assumed to be facilitated by a slip layer between the concrete and thepipe wall. Prior to pumping, the slip layer is usually established by
n).
ll rights reserved.
pipeline priming, but during successful pumping it is probablymaintained by the concrete. The concrete should neither have too lownor too high fines content depending on aggregate packing, size, shapeetc. Furthermore, there should neither be too much nor too fastpressurized bleeding to avoid a dewatered plug, nor too high friction atthe pipe wall. The shear conditions of the bulk flow motion can beassumed to depend on whether the concrete yield stress is surpassed.The yield stress can be assumed to be reachedfirst near thewall, and theplug radius reduced towards the centre of thepipeat increasingpressure[10]. For such shear flow development, plastic viscosity governs thevelocity profile between the moving plug and the pipewall, as flow andshear rate increase and the plug eventually disappears if the resultingshear action on the surface of the plug surpasses the yield stress over thewhole cross section. This is quantified by Eq. (1) below.
Few experimental studies on the relation between rheology andpumpability exist. In a study on the relation between concrete rheol-ogy and hydraulic oil pressure in a piston pump at 200 m verticalconcrete pumping during the production of a North sea off-shorestructure [14], measurements were made with the MkII viscometer[10,15] before and after pumping. The results showed that both theyield, g (Nm), and the rate of change, h (Nms), related to the pressure.Best relation was found between increasing yield and increasedpressure. Also slump was measured, and related best to reducedpressure. The investigated concrete mixes had w/b=0.42–0.45,420 kg of cement, 2% silica fume, around 1.2% superplasticizer byweight of cement and 190–240 mm slump. A more complete studywasmade on a French construction site [16], measuring fresh concrete
998 S. Jacobsen et al. / Cement and Concrete Research 39 (2009) 997–1006
line pressure, -flow and plastic viscosity, μ (Pa·s), and yield stress, τ0(Pa), in the BTRHEOMviscometer [15] on a range of concretes pumpedwith piston pumps. Flow, v (m/s), through a pipe can be calculatedwith the Buckingham–Reiner equation, Eq. (1), relating pressure, flowand rheology for laminar flow in a Bingham fluid (like Hagen–Poiseuille's equation does for a Newtonian fluid) [9,10,16]:
v =πr2
8μdpdx
1−4R0
3r
� �+
R0
3r
� �4� �: ð1Þ
Here, dp/dx (Pa/m) is pressure gradient over the pump line, R0 (m)is plug radius, r (m) is pipe radius and μ (Pa s) plastic viscosity. Theplug radius is derived from mechanical equilibrium of the plug in thepipe axis giving Eq. (2):
R0 = 2τ0dpdx
: ð2Þ
Here, theyield,τ0 (Pa), is thatof the concrete in theplug. Itwas foundthat Eq. (1) always predicted too low flow compared to measured pipeline flow for the concretes [16]. Therefore, a surface slip/tribology testwas later developed, giving improved pump flow predictionwith a newslip layer viscosity model [2]. In [11], pumping experiments were madeon a wide range of concretes and mortars with τ0 and μ ranging fromalmost zero to around 800 Pa and 100 Pa s respectively, slump values inthe range of 60 to 240 mmand slumpflow in the range of 400–900 mm.τ0 and μ were measured with the BML viscometer [15,17–20]. Allmaterials in [11] were pumped through 30 or 50 mm diameter rubberhoses of up to 70 m length using screw pump and measuring v and dp/dx. The sameunderestimation of Eq. (1)was observed aswith the pistonpump in [16]. Visual appearance of the fresh materials at the hose endvaried from stiff, sometimes with a visible wet surface on the exitingplug, to highly flowing, almost liquid like. Calculated R0, based onmeasured pump line pressure and yield (BML viscometer), varied fromaround 10 times the actual hose diameter to practically zero. This was inlinewith the visually observed plug-like or liquid-like appearance of theoutput material. Reynolds numbers varied from b1 to almost 100, alsoindicating possibilities for awide spectre of flowconditions fromplug toviscous flow of some kind.
Direct observations of flow profiles can increase our understandingof how concrete flows in pipes. Such observations are unfortunatelyrather few. Two early experimental studies of flow characteristics ofconcrete during pumping used coloured concrete pumped into pipesfilled with uncoloured (gray) concrete [9,21]. Interfaces on sawnconcrete cross sections were observed after hardening in the pipes. In[21], the visual observations showed both the existence of flow velocityprofiles and porous, paste rich zones at the pipewall, indicating awaterrich slip layer as well as shear action over the cross section. In addition,orientation tendencies of aggregate particles were observed [21]. Nodetails about concrete or pumping characteristics were given. In [9],coloured, stiff plastic consistencyconcretemixesflowed intouncolouredmixes and were then left to harden in the steel pipes. Sections weresawn in the longitudinal and transversal direction of the 125 mmdiameter pipes showing clear profiles and slip layers of plasticconsistency concrete. Coloured concrete can also be used to observeflow during form filling. In [3], coloured self compacting concrete waspumped into gray concrete, revealing some of the flow patterns fromobservations of coloured concrete on the concrete surface after formwork removal. In [22], transparent polymer matrix mixes with variableviscosity containing aggregate particles were observed through trans-parent acryl (“plexiglass”) during flow. The aggregate particles wereeither smooth plastic balls or LWA particles with a bit rougher surface.The forward increase of coarse aggregate particle concentration wasmost sensitive to matrix viscosity for the LWA particles. The LWAparticles resulted in higher forward particle content at low than at highmatrix viscosity. Blockage occurred by arch formation of the roughest
particles, particularly at tapering. Studies of hardened blocked concretein pipes after full scale piston pumping [2,23] showed that coarseaggregate particles pressed together formed the blocking. The authorsproposed the blocking mechanism as forward segregation, due to theacceleration of these large particles in a paste or matrix with too lowviscosity during the stroke of piston pumps. An expression was derivedcombining Stokes law and Newton's second law, giving a differentialequation found to fit reasonably [2,23] to the observed coarse aggregatemovement up to the observed blocking. The same authors also appliedfast measurements of bleeding rate, correlating just as well topumpability and blocking tendency as the more tedious pressurizedbleeding and slump measurements recommended in [13] did. The twonegative effects on pumpability, coarse aggregate segregation andpressurized bleeding, were thus bridged [23].
Additional useful information with coloured fresh concrete wasobtained in an experiment with colouring agent injected in the freshconcrete along the inner, static cylinder of the BML viscometer [24]. Thecolouring agent stayed at the static core of the concentric viscometerduring rotation. This indicates that whatever flow conditions (shear,plug/slip), the lowest pressure occurred at the interface to the staticsteel core, and/or that the colouring stayed in the lubricating layer, notspreading into the fresh concrete.
Despite the above discussion, it seems that viscometry cannotpredict pumpability unambiguously. There is therefore a need for directvisualisation of the flow conditions of modern types of highly flow ableconcrete: slip layer existence and/ormovement, and existence of plugorflowprofiles. The scopeof the experimental part of thiswork is thereforeto investigate whether coloured concrete can be used to observe var-iation offlow rate over a cross section and existence and/or nature of sliplayers in modern highly flow able concrete. The experimental setup isbased on the investigations [9,21] with observations of flow profiles onsawn surfaces, but modified to include surface observations of thecolouring to indicate movement of the slip layer during gravitationalflow. For this purpose coloured fresh concretewaspoured into pipes justfilled with similar uncoloured fresh concrete, and both concretes letflowing together for a while before blocking the pipe. Different pipematerials were studied, flow rate and amount of concrete sticking to thepipe measured, and observations made of pipe surface roughness bySEM.
2. Experiments
2.1. Flow test
A pilot study was first conducted. There, two mortars with flowingconsistency, one without and one with colouring agent were pouredthrough straight observation pipes. These were 30 mm inner diameterand 60 cm long PVC pipes kept at varying angles with the horizontalplane; 0, 15, 30, 45 and 90°. The observation pipes had sliding platesgoing through slots cut normally to the length axis at both ends forshutting. First, uncoloured mortar was filled via a funnel mounted ontop of a 25 cm long vertical pipe leading down to the observation pipethat was fixed to a stand and shut at the lower end. Then the funneland the vertical pipe were emptied and remounted. Finally, theobservation pipe was partly filled with coloured mortar by letting outhalf a litre of gray mortar at the lower end by first opening the upperand then the lower shutter. The time to fill half a litre of mortar into abeaker was noted. Then, both ends of the observation pipe were shutand it was left to harden for 4days.
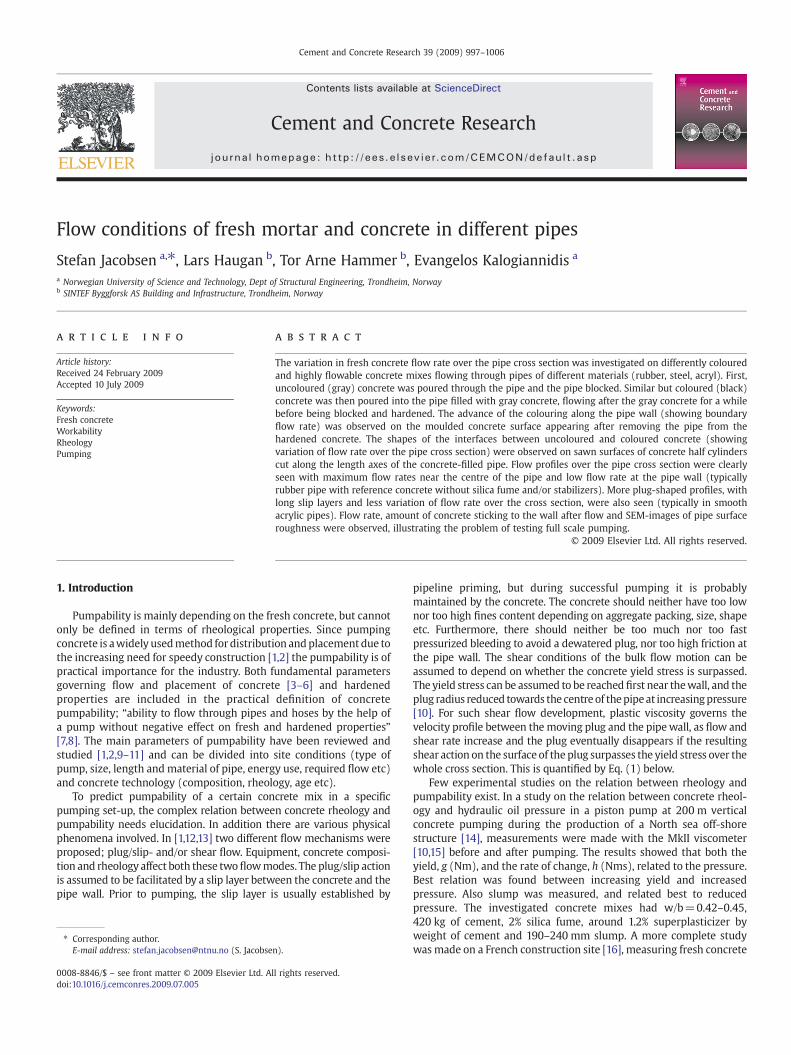
Following experiences with the pilot study, a larger test set-up wasmade for more accurate simultaneous flow measurements, inspired by[25,26]. Three different types of pipes were investigated; acrylic(“plexiglass”) and rubber with 45 mm, and steel pipes with 40 mminner diameter. The observation pipes were all tilted at 45° to thehorizontal plane, see Fig.1. The height of the vertical filling pipes leadingdown to the observation pipe were now increased to 1.75 m with a
Fig. 1. Experimental set-up Mixes 1–4.
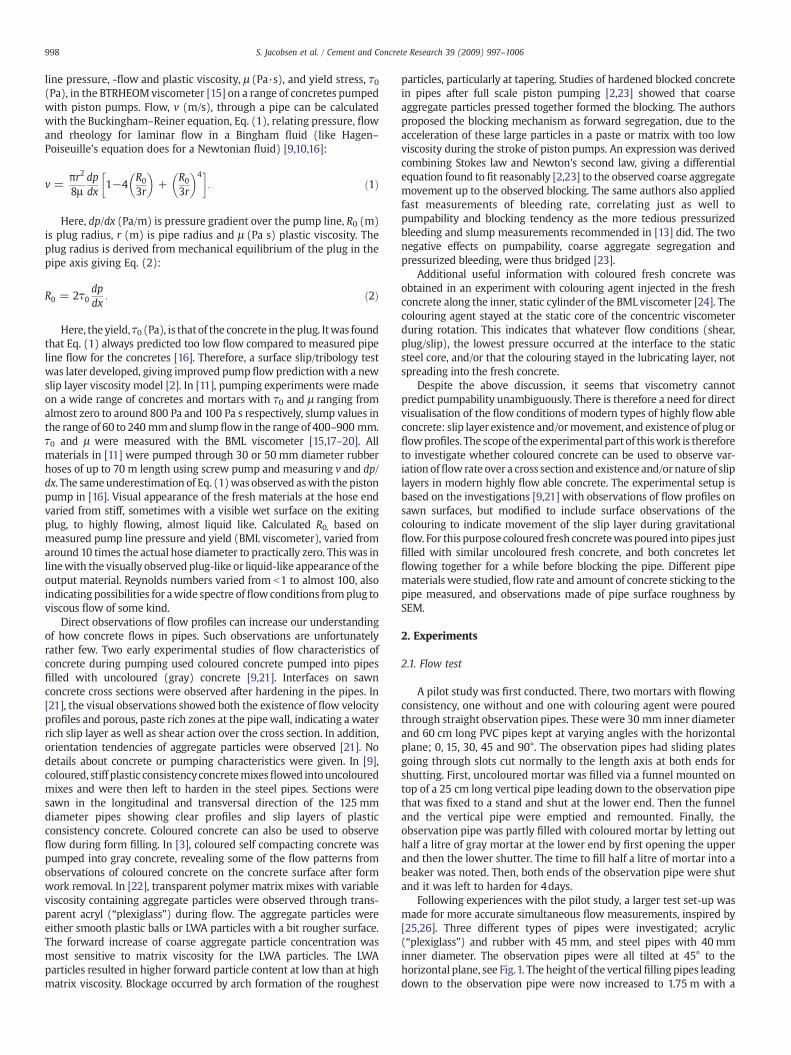
Fig. 2. Filling with coloured concrete.
999S. Jacobsen et al. / Cement and Concrete Research 39 (2009) 997–1006
funnel on top, and the observation sections were 1.1 m long. The sametypes of shutting plates at the ends of the observation pipe were used.First the two pipes were mounted and filled with uncoloured concrete,see Fig. 2. Flowwasmeasuredwhile approximately 6 kg of concretewasflowing into a beaker on a scale, registering the flow by logging weightand time. This kind of weighing procedure has given good reproduci-bility in similar tests of matrix flow resistance [25]. Then the upper endof the observation pipe was shut while filled with gray concrete. Thevertical pipewas emptied, re-connected andfilledwith readily preparedcoloured fresh concrete. The upper shutter was removed so thatcoloured concrete could flow into the observation pipe as the lowershutter was opened. Then, around 1 l of gray concrete was let out fromthe observation pipe, filling it approximately halfway with colouredconcrete before the lower and then the upper shutters were closed. Theobservation pipe was left carefully to harden for 3–4 days. Then it wascut with diamond blade along the central axis to display the flowprofilebetween uncoloured and coloured concrete. Finally, the pipe wasremoved to display the progress of the colouring along the surface of theconcrete facing the pipe wall.
2.2. Concrete materials and mixtures
A number of trial mixes were made to obtain highly flowing,practically self compacting concrete that could flow through the pipesunder its own weight and yet be stable against separation or excessbleeding. The mixes were prepared in a 10 l flat bottomed, horizontallyrotating counter current mixer with two paddles. Dry materials weremixed for 1 min before admixtures and water was added andmixed for2 min. For the first three mixes fresh properties were then measured.Finally, the concrete was remixed for 1 min.
In the pilot study the desired flowing consistencywas achievedwitha quite rich mix with only sand (0–8 mm) as aggregate, w/b=0.40,paste volume=47% and matrix volume (including all particlesb0.125 mm)=50% of volume, and using 1% water reducer by weightof cement. For the last part of the study, with three different pipematerials in the larger flow test set-up, leanermixesweremadewithw/b=0.50, paste volume=36%,matrix volume=40%and25% of the sand
replaced with 4-8 mm aggregate. In Mixes 1–4 with constant w/b thematrix quality was varied with viscosity modifying agent, silica fumeand filler, while maintaining stability and flow-ability. The dosage ofwater reducer varied from 0.7 to 2% by weight of binder for uncolouredmixes and adding 0.5% to colouredmixes to compensate for loss of flowdue to the pigments. Air void content of fresh concrete was assumed tobe2% for allmixes. For thefirst threemixes,workabilitywasdeterminedin terms of slump flowand T50 according to [15,27], and plastic viscosityand yield stress were measured with the BML ConTec viscometer[15,17,18,20].
Table 1 presents composition of mortars used in the flow experi-ments. Mixes 1–4 followed some pilot studies with a parallel plateviscometer with the actual concrete materials finer than 0.125 mm toobtainmatrices with large variations of τ0 and μ [28]. Properties of freshconcrete were determined for the pilot mixes and for Mix 1. For the restof the mixes, only flow rates were determined. All mixes were stablewith respect to segregation andbleeding. The concretematerialswere: agranitic aggregate from Årdal Norway [29] consisting of 0-8 mm sandwith 6.3–6.7% material finer than 0.125 mm and 0.8% absorption bymass, and 4–8 mm mixed natural/crushed material with 0.5% absorp-tion by mass. The particle density was 2670 kg/m3. In one mix,additional natural filler b0.125 mm of the same origin was added. Thecement was a Norwegian manufactured Norcem Standard FA conform-ing to the designationCEM II 42.5 [30]with20% interground low limeflyash anddensityof 2950 kg/m3. Adry Elkemmicro silica grade 9400withdensity2200 kg/m3wasused. Thewater reducerwas a co-polymer fromBASF; Glenium 151with 15% solid content and density of 1000 kg/m3. Inaddition, a polymeric stabilizer was used in Mix 2; SIKA 4R with 4.5%solid content and density of 1000 kg/m3.
2.3. Pigments
In the pilot study, different colouring agents and pigments wereinvestigated in terms of sharpness of interface between coloured anduncoloured concrete and effect onworkability. Interface sharpness wasobserved by filling cube moulds halfway with uncoloured concrete,toppingwith coloured concrete, hardening for a few days before sawingand visual inspection. A brown iron oxide powder pigment (600Ferroxon) was found to give best and sufficient sharpness at a dosage of1.7% bymass of cementwith relatively loweffect onworkabilitywithout
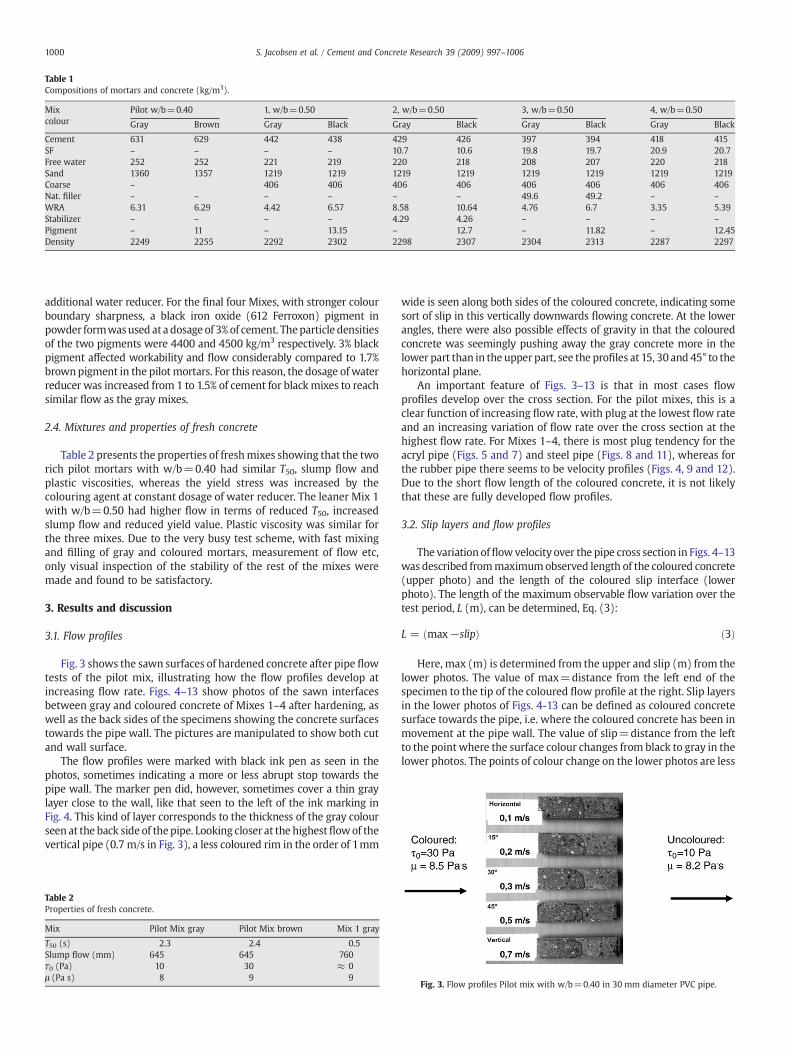
Table 1Compositions of mortars and concrete (kg/m3).
Mixcolour
Pilot w/b=0.40 1, w/b=0.50 2, w/b=0.50 3, w/b=0.50 4, w/b=0.50
Gray Brown Gray Black Gray Black Gray Black Gray Black
Cement 631 629 442 438 429 426 397 394 418 415SF – – – – 10.7 10.6 19.8 19.7 20.9 20.7Free water 252 252 221 219 220 218 208 207 220 218Sand 1360 1357 1219 1219 1219 1219 1219 1219 1219 1219Coarse – 406 406 406 406 406 406 406 406Nat. filler – – – – – – 49.6 49.2 – –
WRA 6.31 6.29 4.42 6.57 8.58 10.64 4.76 6.7 3.35 5.39Stabilizer – – – – 4.29 4.26 – – – –
Pigment – 11 – 13.15 – 12.7 – 11.82 – 12.45Density 2249 2255 2292 2302 2298 2307 2304 2313 2287 2297
1000 S. Jacobsen et al. / Cement and Concrete Research 39 (2009) 997–1006
additional water reducer. For the final four Mixes, with stronger colourboundary sharpness, a black iron oxide (612 Ferroxon) pigment inpowder formwasused at a dosage of 3% of cement. Theparticle densitiesof the two pigments were 4400 and 4500 kg/m3 respectively. 3% blackpigment affected workability and flow considerably compared to 1.7%brownpigment in the pilot mortars. For this reason, the dosage ofwaterreducer was increased from 1 to 1.5% of cement for blackmixes to reachsimilar flow as the gray mixes.
2.4. Mixtures and properties of fresh concrete
Table 2 presents the properties of freshmixes showing that the tworich pilot mortars with w/b=0.40 had similar T50, slump flow andplastic viscosities, whereas the yield stress was increased by thecolouring agent at constant dosage of water reducer. The leaner Mix 1with w/b=0.50 had higher flow in terms of reduced T50, increasedslump flow and reduced yield value. Plastic viscosity was similar forthe three mixes. Due to the very busy test scheme, with fast mixingand filling of gray and coloured mortars, measurement of flow etc,only visual inspection of the stability of the rest of the mixes weremade and found to be satisfactory.
3. Results and discussion
3.1. Flow profiles
Fig. 3 shows the sawn surfaces of hardened concrete after pipe flowtests of the pilot mix, illustrating how the flow profiles develop atincreasing flow rate. Figs. 4–13 show photos of the sawn interfacesbetween gray and coloured concrete of Mixes 1–4 after hardening, aswell as the back sides of the specimens showing the concrete surfacestowards the pipe wall. The pictures are manipulated to show both cutand wall surface.
The flow profiles were marked with black ink pen as seen in thephotos, sometimes indicating a more or less abrupt stop towards thepipe wall. The marker pen did, however, sometimes cover a thin graylayer close to the wall, like that seen to the left of the ink marking inFig. 4. This kind of layer corresponds to the thickness of the gray colourseen at the back side of thepipe. Looking closer at the highestflowof thevertical pipe (0.7 m/s in Fig. 3), a less coloured rim in the order of 1mm
Table 2Properties of fresh concrete.
Mix Pilot Mix gray Pilot Mix brown Mix 1 gray
T50 (s) 2.3 2.4 0.5Slump flow (mm) 645 645 760τ0 (Pa) 10 30 ≈ 0μ (Pa s) 8 9 9
wide is seen along both sides of the coloured concrete, indicating somesort of slip in this vertically downwards flowing concrete. At the lowerangles, there were also possible effects of gravity in that the colouredconcrete was seemingly pushing away the gray concrete more in thelower part than in the upper part, see the profiles at 15, 30 and 45° to thehorizontal plane.
An important feature of Figs. 3–13 is that in most cases flowprofiles develop over the cross section. For the pilot mixes, this is aclear function of increasing flow rate, with plug at the lowest flow rateand an increasing variation of flow rate over the cross section at thehighest flow rate. For Mixes 1–4, there is most plug tendency for theacryl pipe (Figs. 5 and 7) and steel pipe (Figs. 8 and 11), whereas forthe rubber pipe there seems to be velocity profiles (Figs. 4, 9 and 12).Due to the short flow length of the coloured concrete, it is not likelythat these are fully developed flow profiles.
3.2. Slip layers and flow profiles
The variation offlowvelocity over the pipe cross section in Figs. 4–13was described frommaximumobserved length of the coloured concrete(upper photo) and the length of the coloured slip interface (lowerphoto). The length of the maximum observable flow variation over thetest period, L (m), can be determined, Eq. (3):
L = ðmax−slipÞ ð3Þ
Here, max (m) is determined from the upper and slip (m) from thelower photos. The value of max=distance from the left end of thespecimen to the tip of the coloured flow profile at the right. Slip layersin the lower photos of Figs. 4-13 can be defined as coloured concretesurface towards the pipe, i.e. where the coloured concrete has been inmovement at the pipe wall. The value of slip=distance from the leftto the point where the surface colour changes from black to gray in thelower photos. The points of colour change on the lower photos are less
Fig. 3. Flow profiles Pilot mix with w/b=0.40 in 30 mm diameter PVC pipe.
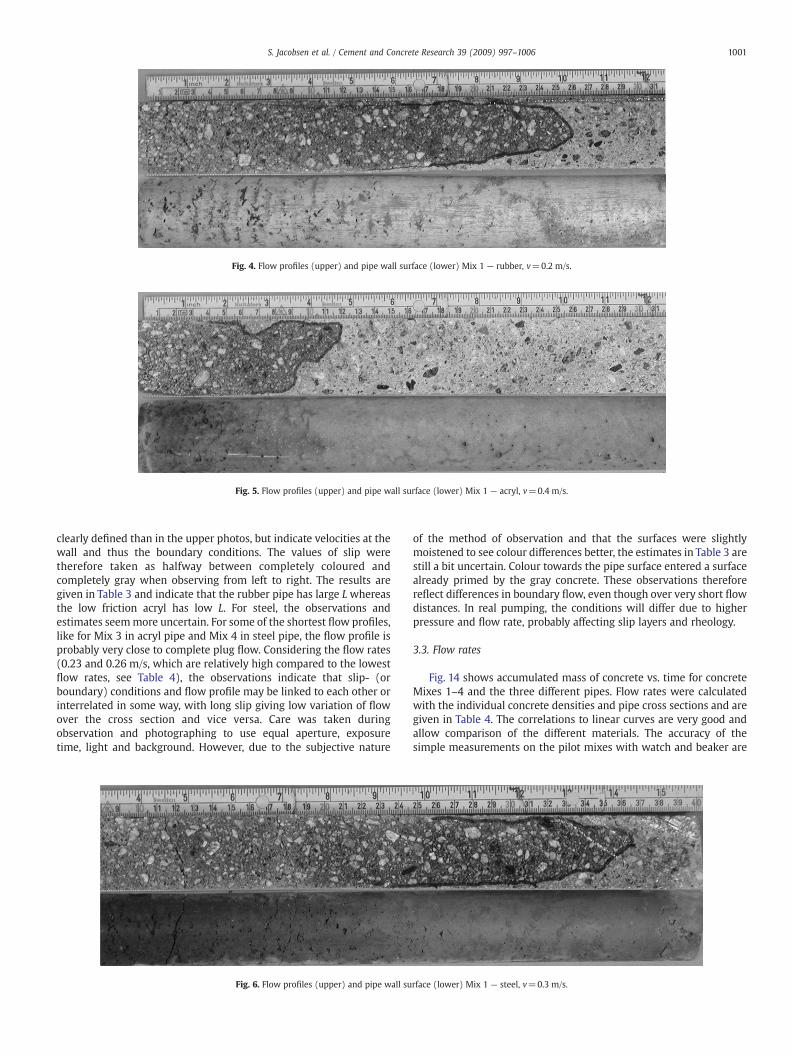
Fig. 4. Flow profiles (upper) and pipe wall surface (lower) Mix 1 — rubber, v=0.2 m/s.
Fig. 5. Flow profiles (upper) and pipe wall surface (lower) Mix 1 — acryl, v=0.4 m/s.
1001S. Jacobsen et al. / Cement and Concrete Research 39 (2009) 997–1006
clearly defined than in the upper photos, but indicate velocities at thewall and thus the boundary conditions. The values of slip weretherefore taken as halfway between completely coloured andcompletely gray when observing from left to right. The results aregiven in Table 3 and indicate that the rubber pipe has large L whereasthe low friction acryl has low L. For steel, the observations andestimates seemmore uncertain. For some of the shortest flow profiles,like for Mix 3 in acryl pipe and Mix 4 in steel pipe, the flow profile isprobably very close to complete plug flow. Considering the flow rates(0.23 and 0.26 m/s, which are relatively high compared to the lowestflow rates, see Table 4), the observations indicate that slip- (orboundary) conditions and flow profile may be linked to each other orinterrelated in some way, with long slip giving low variation of flowover the cross section and vice versa. Care was taken duringobservation and photographing to use equal aperture, exposuretime, light and background. However, due to the subjective nature
Fig. 6. Flow profiles (upper) and pipe wall su
of the method of observation and that the surfaces were slightlymoistened to see colour differences better, the estimates in Table 3 arestill a bit uncertain. Colour towards the pipe surface entered a surfacealready primed by the gray concrete. These observations thereforereflect differences in boundary flow, even though over very short flowdistances. In real pumping, the conditions will differ due to higherpressure and flow rate, probably affecting slip layers and rheology.
3.3. Flow rates
Fig. 14 shows accumulated mass of concrete vs. time for concreteMixes 1–4 and the three different pipes. Flow rates were calculatedwith the individual concrete densities and pipe cross sections and aregiven in Table 4. The correlations to linear curves are very good andallow comparison of the different materials. The accuracy of thesimple measurements on the pilot mixes with watch and beaker are
rface (lower) Mix 1 — steel, v=0.3 m/s.
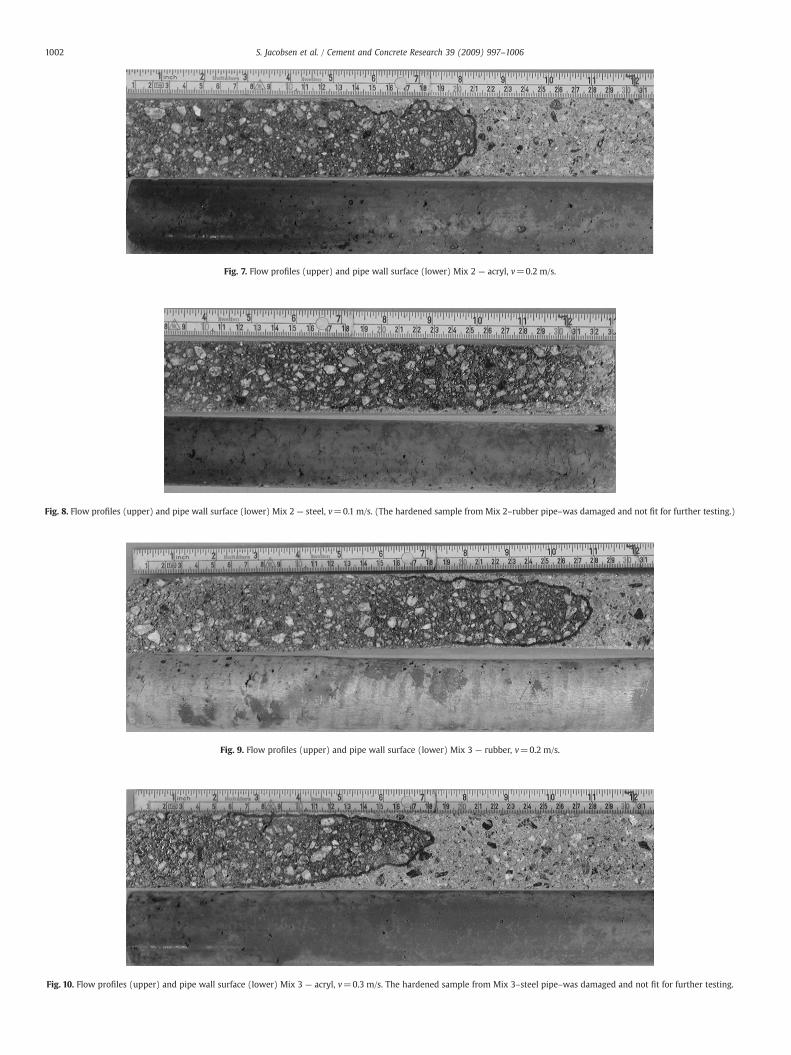
Fig. 7. Flow profiles (upper) and pipe wall surface (lower) Mix 2 — acryl, v=0.2 m/s.
Fig. 8. Flow profiles (upper) and pipe wall surface (lower) Mix 2 — steel, v=0.1 m/s. (The hardened sample from Mix 2–rubber pipe–was damaged and not fit for further testing.)
Fig. 9. Flow profiles (upper) and pipe wall surface (lower) Mix 3 — rubber, v=0.2 m/s.
Fig. 10. Flow profiles (upper) and pipe wall surface (lower) Mix 3 — acryl, v=0.3 m/s. The hardened sample from Mix 3–steel pipe–was damaged and not fit for further testing.
1002 S. Jacobsen et al. / Cement and Concrete Research 39 (2009) 997–1006
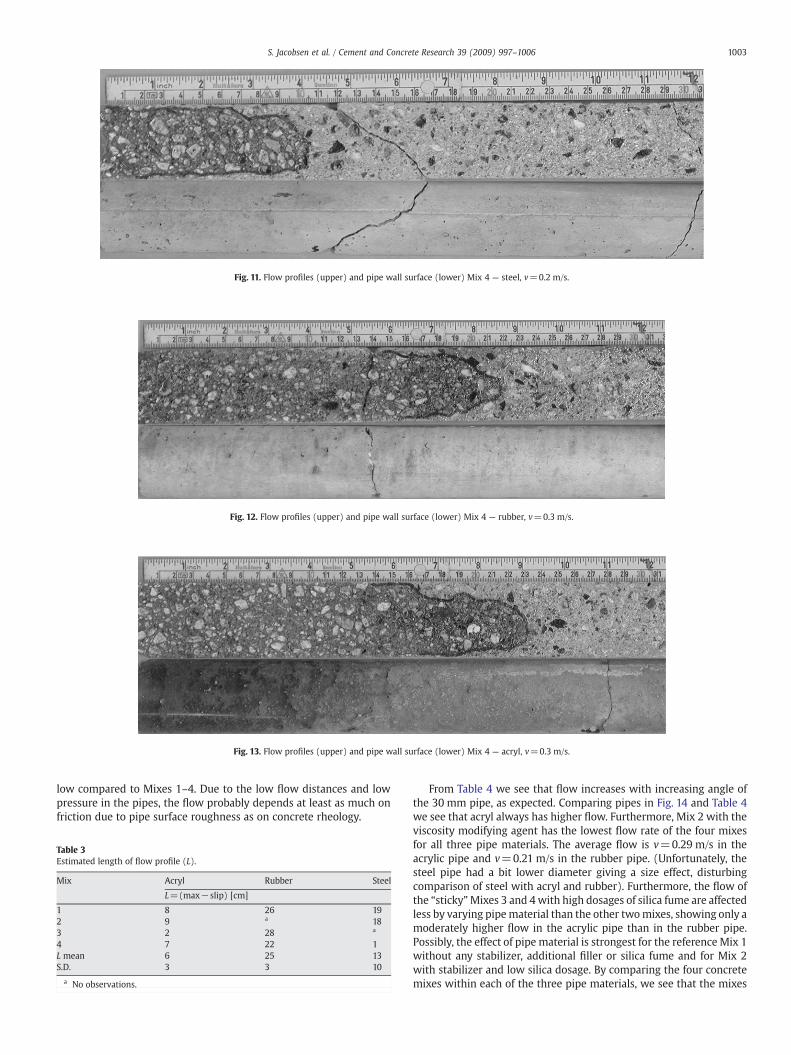
Fig. 11. Flow profiles (upper) and pipe wall surface (lower) Mix 4 — steel, v=0.2 m/s.
Fig. 12. Flow profiles (upper) and pipe wall surface (lower) Mix 4 — rubber, v=0.3 m/s.
Fig. 13. Flow profiles (upper) and pipe wall surface (lower) Mix 4 — acryl, v=0.3 m/s.
1003S. Jacobsen et al. / Cement and Concrete Research 39 (2009) 997–1006
low compared to Mixes 1–4. Due to the low flow distances and lowpressure in the pipes, the flow probably depends at least as much onfriction due to pipe surface roughness as on concrete rheology.
Table 3Estimated length of flow profile (L).
Mix Acryl Rubber Steel
L=(max−slip) [cm]
1 8 26 192 9 a 183 2 28 a
4 7 22 1L mean 6 25 13S.D. 3 3 10
a No observations.
From Table 4 we see that flow increases with increasing angle ofthe 30 mm pipe, as expected. Comparing pipes in Fig. 14 and Table 4we see that acryl always has higher flow. Furthermore, Mix 2 with theviscosity modifying agent has the lowest flow rate of the four mixesfor all three pipe materials. The average flow is v=0.29 m/s in theacrylic pipe and v=0.21 m/s in the rubber pipe. (Unfortunately, thesteel pipe had a bit lower diameter giving a size effect, disturbingcomparison of steel with acryl and rubber). Furthermore, the flow ofthe “sticky”Mixes 3 and 4with high dosages of silica fume are affectedless by varying pipematerial than the other twomixes, showing only amoderately higher flow in the acrylic pipe than in the rubber pipe.Possibly, the effect of pipe material is strongest for the reference Mix 1without any stabilizer, additional filler or silica fume and for Mix 2with stabilizer and low silica dosage. By comparing the four concretemixes within each of the three pipe materials, we see that the mixes
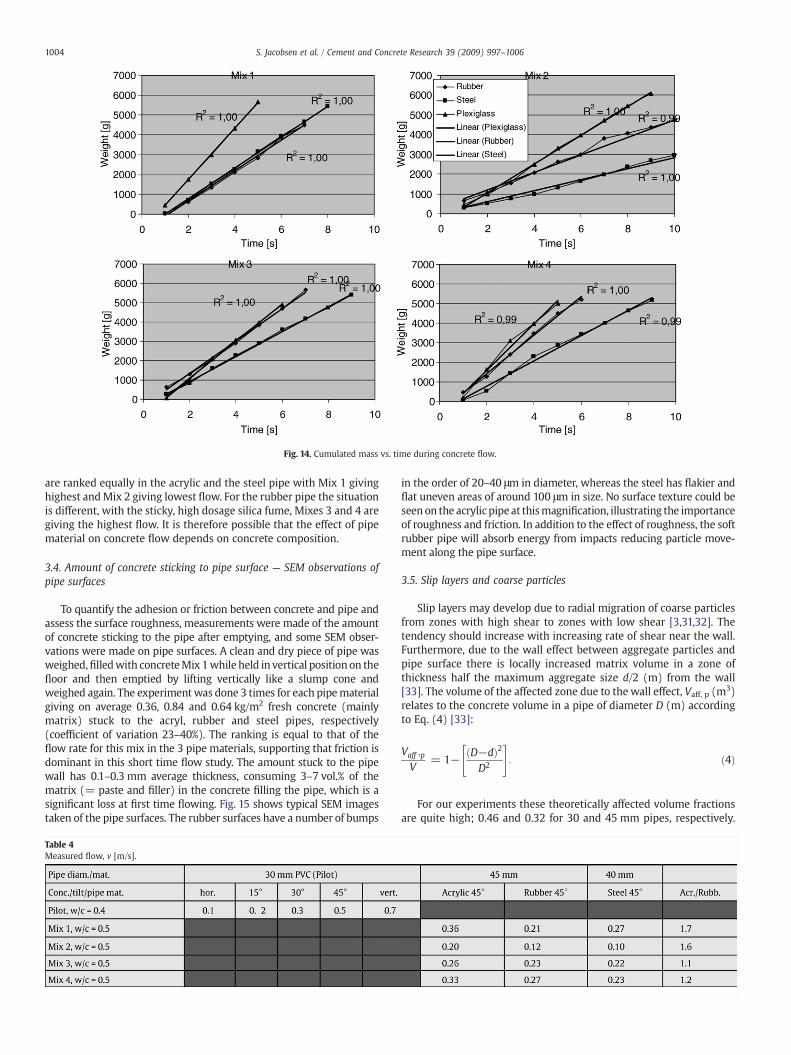
Fig. 14. Cumulated mass vs. time during concrete flow.
1004 S. Jacobsen et al. / Cement and Concrete Research 39 (2009) 997–1006
are ranked equally in the acrylic and the steel pipe with Mix 1 givinghighest andMix 2 giving lowest flow. For the rubber pipe the situationis different, with the sticky, high dosage silica fume, Mixes 3 and 4 aregiving the highest flow. It is therefore possible that the effect of pipematerial on concrete flow depends on concrete composition.
3.4. Amount of concrete sticking to pipe surface — SEM observations ofpipe surfaces
To quantify the adhesion or friction between concrete and pipe andassess the surface roughness, measurements were made of the amountof concrete sticking to the pipe after emptying, and some SEM obser-vations were made on pipe surfaces. A clean and dry piece of pipe wasweighed,filledwith concreteMix 1while held in vertical position on thefloor and then emptied by lifting vertically like a slump cone andweighed again. The experimentwas done 3 times for each pipematerialgiving on average 0.36, 0.84 and 0.64 kg/m2 fresh concrete (mainlymatrix) stuck to the acryl, rubber and steel pipes, respectively(coefficient of variation 23–40%). The ranking is equal to that of theflow rate for this mix in the 3 pipe materials, supporting that friction isdominant in this short time flow study. The amount stuck to the pipewall has 0.1–0.3 mm average thickness, consuming 3–7 vol.% of thematrix (= paste and filler) in the concrete filling the pipe, which is asignificant loss at first time flowing. Fig. 15 shows typical SEM imagestaken of the pipe surfaces. The rubber surfaces have a number of bumps
Table 4Measured flow, v [m/s].
in the order of 20–40 μm in diameter, whereas the steel has flakier andflat uneven areas of around 100 μm in size. No surface texture could beseen on the acrylic pipe at thismagnification, illustrating the importanceof roughness and friction. In addition to the effect of roughness, the softrubber pipe will absorb energy from impacts reducing particle move-ment along the pipe surface.
3.5. Slip layers and coarse particles
Slip layers may develop due to radial migration of coarse particlesfrom zones with high shear to zones with low shear [3,31,32]. Thetendency should increase with increasing rate of shear near the wall.Furthermore, due to the wall effect between aggregate particles andpipe surface there is locally increased matrix volume in a zone ofthickness half the maximum aggregate size d/2 (m) from the wall[33]. The volume of the affected zone due to the wall effect, Vaff, p (m3)relates to the concrete volume in a pipe of diameter D (m) accordingto Eq. (4) [33]:
Vaff ;pV
= 1− ðD−dÞ2D2
" #: ð4Þ
For our experiments these theoretically affected volume fractionsare quite high; 0.46 and 0.32 for 30 and 45 mm pipes, respectively.
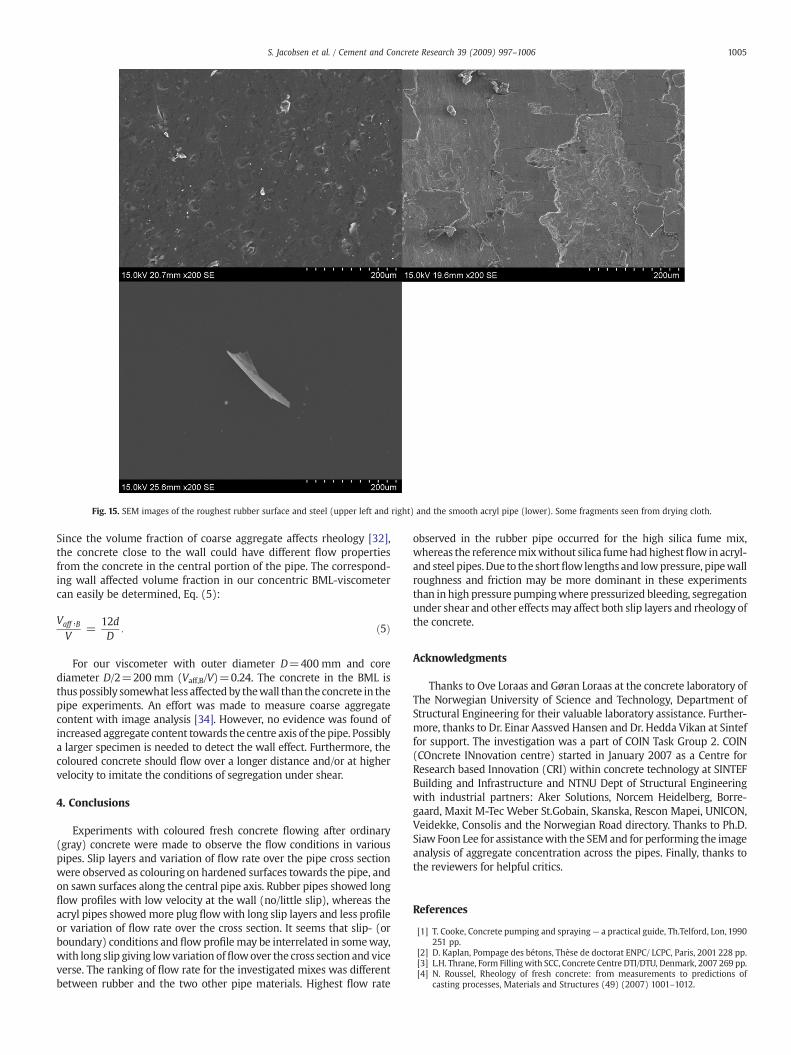
Fig. 15. SEM images of the roughest rubber surface and steel (upper left and right) and the smooth acryl pipe (lower). Some fragments seen from drying cloth.
1005S. Jacobsen et al. / Cement and Concrete Research 39 (2009) 997–1006
Since the volume fraction of coarse aggregate affects rheology [32],the concrete close to the wall could have different flow propertiesfrom the concrete in the central portion of the pipe. The correspond-ing wall affected volume fraction in our concentric BML-viscometercan easily be determined, Eq. (5):
Vaff ;BV
=12dD
: ð5Þ
For our viscometer with outer diameter D=400 mm and corediameter D/2=200 mm (Vaff,B/V)=0.24. The concrete in the BML isthus possibly somewhat less affected by thewall than the concrete in thepipe experiments. An effort was made to measure coarse aggregatecontent with image analysis [34]. However, no evidence was found ofincreased aggregate content towards the centre axis of thepipe. Possiblya larger specimen is needed to detect the wall effect. Furthermore, thecoloured concrete should flow over a longer distance and/or at highervelocity to imitate the conditions of segregation under shear.
4. Conclusions
Experiments with coloured fresh concrete flowing after ordinary(gray) concrete were made to observe the flow conditions in variouspipes. Slip layers and variation of flow rate over the pipe cross sectionwere observed as colouring on hardened surfaces towards the pipe, andon sawn surfaces along the central pipe axis. Rubber pipes showed longflow profiles with low velocity at the wall (no/little slip), whereas theacryl pipes showedmore plug flowwith long slip layers and less profileor variation of flow rate over the cross section. It seems that slip- (orboundary) conditions and flow profile may be interrelated in someway,with long slip giving lowvariation offlowover the cross section and viceverse. The ranking of flow rate for the investigated mixes was differentbetween rubber and the two other pipe materials. Highest flow rate
observed in the rubber pipe occurred for the high silica fume mix,whereas the referencemixwithout silica fumehadhighestflow inacryl-and steel pipes. Due to the shortflowlengths and lowpressure, pipewallroughness and friction may be more dominant in these experimentsthan in high pressure pumpingwhere pressurized bleeding, segregationunder shear and other effects may affect both slip layers and rheology ofthe concrete.
Acknowledgments
Thanks to Ove Loraas and Gøran Loraas at the concrete laboratory ofThe Norwegian University of Science and Technology, Department ofStructural Engineering for their valuable laboratory assistance. Further-more, thanks to Dr. Einar Aassved Hansen and Dr. Hedda Vikan at Sinteffor support. The investigation was a part of COIN Task Group 2. COIN(COncrete INnovation centre) started in January 2007 as a Centre forResearch based Innovation (CRI) within concrete technology at SINTEFBuilding and Infrastructure and NTNU Dept of Structural Engineeringwith industrial partners: Aker Solutions, Norcem Heidelberg, Borre-gaard, Maxit M-Tec Weber St.Gobain, Skanska, Rescon Mapei, UNICON,Veidekke, Consolis and the Norwegian Road directory. Thanks to Ph.D.Siaw Foon Lee for assistancewith the SEM and for performing the imageanalysis of aggregate concentration across the pipes. Finally, thanks tothe reviewers for helpful critics.
References
[1] T. Cooke, Concrete pumping and spraying— a practical guide, Th.Telford, Lon, 1990251 pp.
[2] D. Kaplan, Pompage des bétons, Thèse de doctorat ENPC/ LCPC, Paris, 2001 228 pp.[3] L.H. Thrane, Form Fillingwith SCC, Concrete Centre DTI/DTU, Denmark, 2007 269 pp.[4] N. Roussel, Rheology of fresh concrete: from measurements to predictions of
casting processes, Materials and Structures (49) (2007) 1001–1012.
1006 S. Jacobsen et al. / Cement and Concrete Research 39 (2009) 997–1006
[5] A. Gram, S. Mechtcherine, K. Schwabe, K. Krentzer, J. Silfwerbrand, Modelling andsimulation of SCC flow, Presentation SCC2008, ACBM, Chicago, 2008 51 pp.
[6] J.E. Wallevik, Minimizing end-effects in the coaxial cylinders viscometer:viscoplastic flow inside the ConTech BML Viscometer 3, J.Non-New Fl Mech 155(2008) 116–123.
[7] ACI Comm.304 (1998) Placing concrete by pumping meth. ACI 304.2R-96, 2. Print25 pp.
[8] M. Jolin, F. Chapdelaine, D. Burns, F. Gagnon, D. Baupré, Pumping concrete; afundamental and practical approach, presentation Shotcrete for undergroundsupport X Sept.12-16/ Universitè Laval (2006), 2006 9 pp.
[9] M. Rössig, Fördernvon Frischbeton, insbesondere von Leichtbeton, durch Rohrleitun-gen, Dr.diss, RWTH, Westdeutscher Verlag, ISBN 3-531-02456-6, 1974 132 pp.+92pp. fig/tab.
[10] G.H. Tattersall, P.F.G. Banfill, The rheology of fresh concrete, Pitman Books Ltd.,London, 1983 356 pp.
[11] Jacobsen S., Mork J.-H., Lee S.F, Haugan L. (2008) Pumping of concrete andmortar –State of the art, COIN Project Report no. 5, ISBN 978-82-536-1069-6, Norw Univ ofSc and Tech-SINTEF 42 pp., 5 app.
[12] A.N. Ede, The resistance of concrete pumped through pipelines, Magazine ofConcrete Research (1957) 129–140 November.
[13] D. Browne Roger, B. Bamforth Phillip, Tests to establish concrete pumpability, ACIJournal (1977) 193–203 May 1977.
[14] Hansen J.K.B.(1988) Characterisation of concrete pumpability using the two-pointapparatus, HPC Materials Dev rep 3.2, report no Sintef STF 65 F89046 (In Norw.)45 pp.
[15] Bartos R.J.M, Sonebi M and Tamimi A.K.(2002) Workability and Rheology of FreshConcrete: Compendium of Tests, Report of RILEM TC 145-WSM, RILEM Publica-tions, 127 pp.
[16] C Hu, F. De Larrard, T. Sedran, A new rheometer for high performance concrete, 4thInt Symp on HS/HPC, LCPC/Presses de ENPC, Paris, 1996, pp. 179–186.
[17] Wallevik O.(1990) Rheology of fresh concrete and utilization on concrete with andwithout silica fume, Dr.ing dissertation 1990:45 Norw.Un.Sc.&Tech, 182 pp. (InNorw.).
[18] O. Wallevik, O.E. Gjørv, Development of a coaxial cylinders viscosimeter forfresh concrete, Proc RILEM Int conference on properties of fresh concrete, 1990,pp. 213–224.
[19] J-H. Mork, A presentation of the BML-viscometer, in: P.J.M. Bartos, et al., (Eds.),Productionmethods andworkability of concrete, RILEM Proc., 32,1996, pp. 369–376.
[20] J.E. Wallevik, Rheology of particle suspensions. Fresh concrete, mortar and cementpaste with various types of lignosulfonates, 2003 Dr.ing 2003:18 Norw.Un.Sc.&Tech, 397 pp.
[21] V. Vassiliev, Concrete flow regime in pipes, 1953 Originally published in Russian,cited in the PhD of Denis Kaplan 2001 pp. 33-34.
[22] A. Nanayakkara, D. Gunatilaka, K. Ozawa, K. Maekawa, Mathematical modelling ofdeformation for fresh concrete in pumping, Univ of Tokyo, 1988, pp. 819–824,Paper 1146.
[23] D. Kaplan, F. deLarrard, T. Sedran, Avoidance of blockages in concrete pumpingprocess, ACI Materials Journal 102 (3) (2005) 183–191.
[24] Mork J.H.(1994) Effect of gypsum-hemi hydrate ratio of cement on rheology offresh concrete, dr.ing dissertation (In Norwegian) NTH 1994:04, Trondheim,Norway, 286 pp.
[25] E. Mørtsell, S. Smeplass, T.A. Hammer, M. Maage, Flowcyl — how to determine theflow properties of thematrix phase of high performance concrete, 4th Int Symp onHS/HPC, LCPC/Presses de ENPC, Paris, Paris, 1996, pp. 26–268.
[26] D Feys, B. Calie, R. Verhoeven, G. De Schutter, Evaluation of gravitational flow testswith SCC in pipes as a forecast for pumping pressures, 5th Int. symp. on SCC, RilemPRO54 ISBN 978-2-35158-047-9, vol.1, 2007, pp. 515–520.
[27] European guidelines for self compacting concrete, Specification, production anduse, 2005 ERMCO/CEMBUREAU/EFNARC, 63 pp.
[28] L. Haugan, Unpublished results, Sintef-NTNU, Norway, 2009.[29] NS3099 Norwegian Standard NS3099, Reference Concrete ICS 91.100.30 (1999)
4pp.[30] NS-EN 197-1:2000, Cement part 1: Composition, specifications and conformity
criteria for common cements, standard Norge ICS 91.100.10;2005:39 pp.[31] M. Haist, H.S. Müller, Optimization of the pumpability of self-compacting light
weight concrete, Proc SCC 2005 ACBM, NWU, Evanston, 2005, 6 pp.[32] F. Mahaut, S. Mokéddem, X. Chateau, N. Roussel, G. Ovarlez, Effect of coarse
particle volume fraction on the yield stress and thixotropy of cementitiousmaterials, Cement and concrete research 38 (11) (2008) 1276–1285.
[33] T. Sedran, F. DeLarrard, Mix design of Self Compacting Concrete (SCC), in: PJMBartos, et al., (Eds.), Production methods and workability of concrete, RILEM Proc.,32, 1996, pp. 439–450.
[34] Lee S.F., Monsøy A., Lein H.L., Jacobsen S. (2009) paper submitted to Cement andConcrete Research.