Effect of moderate dietary restriction on visceral organ weight, hepatic oxygen consumption, and...
13
K. M. Wood, B. J. Awda, C. Fitzsimmons, S. P. Miller, B.W. McBride and K. C. Swanson pregnant beef cows consumption, and metabolic proteins associated with energy balance in mature Effect of moderate dietary restriction on visceral organ weight, hepatic oxygen doi: 10.2527/jas.2013-6421 originally published online July 26, 2013 2013, 91:4245-4255. J ANIM SCI http://www.journalofanimalscience.org/content/91/9/4245 the World Wide Web at: The online version of this article, along with updated information and services, is located on www.asas.org at The University of Guelph on September 10, 2013 www.journalofanimalscience.org Downloaded from
-
Upload
independent -
Category
Documents
-
view
0 -
download
0
Transcript of Effect of moderate dietary restriction on visceral organ weight, hepatic oxygen consumption, and...
K. M. Wood, B. J. Awda, C. Fitzsimmons, S. P. Miller, B.W. McBride and K. C. Swansonpregnant beef cows
consumption, and metabolic proteins associated with energy balance in mature Effect of moderate dietary restriction on visceral organ weight, hepatic oxygen
doi: 10.2527/jas.2013-6421 originally published online July 26, 20132013, 91:4245-4255.J ANIM SCI
http://www.journalofanimalscience.org/content/91/9/4245the World Wide Web at:
The online version of this article, along with updated information and services, is located on
www.asas.org
at The University of Guelph on September 10, 2013www.journalofanimalscience.orgDownloaded from
4245
Effect of moderate dietary restriction on visceral organ weight, hepatic oxygen consumption, and metabolic
proteins associated with energy balance in mature pregnant beef cows1,2
K. M. Wood,* B. J. Awda,* C. Fitzsimmons,†‡ S. P. Miller,* B.W. McBride,*3 and K. C. Swanson§3
*Department of Animal and Poultry Science, University of Guelph, Guelph, ON N1G 2W0, Canada, ; †Agriculture and Agrifood Canada, Edmonton, AB, Canada; ‡Department of Agriculture, Food & Nutritional Science, University of Alberta,
Edmonton, AB, Canada; and §Department of Animal Science, North Dakota State University, Fargo 58102
ABSTRACT: Twenty-two nonlactating multiparous pregnant beef cows (639 ± 68 kg) were used to investigate the effect of dietary restriction on the abundance of selected proteins regulating cellular energy metabolism. Cows were fed at either 85% (n = 11; LOW) or 140% (n = 11; HIGH) of total NE requirements. The diet consisted of a haylage-based total mixed ration containing 20% wheat straw. Cows were slaughtered by block (predicted date of parturition), beginning 83 d after the initiation of dietary treatments and every week thereafter for 6 wk, such that each block was slaughtered at approximately 250 d of gestation. Tissue samples from liver, kidney, sternomandibularis muscle, ruminal papilli (ventral sac), pancreas, and small intestinal muscosa were collected at slaughter and snap frozen in liquid N2. Western blots were conducted to quantify abundance of proliferating cell nuclear antigen (PCNA), ATP synthase, ubiquitin, and Na/K+ ATPase for all tissues; PPARγ, PPARγ coactivator 1 α
(PGC-1α), and 5´-adenosine monophosphate-activated protein kinase (AMPK) and the activated form phosphorylated-AMPK (pAMPK) for liver, muscle, and rumen; phosphoenolpyruvate carboxykinase (PEPCK) for liver and kidney; and uncoupling protein 2 (UCP2) for liver. Statistical analysis was conducted using Proc Mixed in SAS and included the fixed effects of dietary treatment, cow age, block, and the random effect of pen. Dietary treatments resulted in cows fed HIGH having greater (P ≤ 0.04) ADG and final BW than cows fed LOW. Abundance of ubiquitin in muscle was greater (P = 0.009) in cows fed LOW, and PCG-1 α in liver was greater (P = 0.03) in cows fed HIGH. Hepatic O2 consumption was greater in HIGH (P ≤ 0.04). Feed intake can influence the abundance of important metabolic proteins and suggest that protein degradation may increase in muscle from moderately nutrient restricted cows and that energy metabolism in liver increases in cows fed above NE requirements.
Key words: beef cows, cellular energy metabolism, feed intake, organ mass, peroxisome proliferator-activated receptor gamma coactivator 1 alpha, ubiquitin
© 2013 American Society of Animal Science. All rights reserved. J. Anim. Sci. 2013.91:4245–4255 doi:10.2527/jas2013-6421
INTRODUCTION
Although adequate nutrition is needed for growth, reproduction and maintenance of bodily functions, there are differences among animals in how energy and nutrients are used relative to feed consumption. Herd et al. (2004) suggested that approximately two-thirds of variation among animals that are efficient and those that are inefficient relates to basal metabolic rate, cellular maintenance requirements, and related energy lost as heat. In mature beef cows, maintenance requirements represent approximately 70 to 75% of the total annual energy requirements (Ferrell and Jenkins, 1985). Little is
1The authors thank Charlie Watson and the staff at the Elora Beef Research station, Brian McDougall and the staff at the University of Guelph Meat Laboratory, Margaret Quinton, Gordon Vanderoort, Tim Caldwell, Linda Trouten-Radford, and Loren Hopkins for their assistance with data collection and analysis.
2Financial support was provided by Canadian Beef Cattle Industry Science Cluster, through funding provided by the Beef Cattle Research Council and Agriculture and Agri-Food Canada, Agriculture Adaptation Council-Farm Innovation Program, Ontario Ministry of Agriculture, Food and Rural Affairs, and the Ontario Cattleman’s Association.
3Corresponding author: [email protected] and [email protected]
Received February 27, 2013.Accepted May 15, 2013.
at The University of Guelph on September 10, 2013www.journalofanimalscience.orgDownloaded from
Wood et al.4246
known about the underlying cellular mechanisms involved in these processes in relation to feed efficiency in the cow. Because chronic feed restriction has been shown to reduce basal metabolic rate, (Blaxter et al., 1966; Labussière et al., 2011), we aimed to alter metabolic rate by feeding cows below and above recommended total NE requirements.
The objective of this experiment was to investigate the impact of nutrient restriction of pregnant beef cows during mid- and late gestation on performance, organ mass, liver O2 consumption, citrate synthase activity, and abundance of proteins relating to energy metabolism, namely ATP synthase, Na+/K+ ATPase, proliferating cell nuclear antigen (PCNA), uncoupling protein 2 (UCP2), phosphoenolpyruvate carboxykinase (PEPCK), PPARγ, PPARγ coactivator 1 α (PGC-1α), 5´-adenosine monophosphate-activated protein kinase (AMPK), and the activated form phosphorylated-AMPK (pAMPK). Intake-induced differences in abundance of these proteins may indicate key pathways involved in efficient phenotypes in mature cows. By better understanding cellular processes relating to maintenance energy requirements, cellular mechanisms may be identified for further study such as nutritional manipulation or genetic selection to improve feed efficiency in the mature cow.
MATERIALS AND METHODS
This experiment followed recommendations of the Ca-nadian Council on Animal Care (1993) and met the approv-al of the University of Guelph Animal Care Committee.
Animals, Experimental Design, and Dietary Treatments
Twenty-two (11 per dietary treatment; n = 11) nonlactating, mature pregnant beef cows, primarily of Angus and Simmental crossbreeding were used in a randomized complete block design. This subset of cows was randomly selected from a group of 72 cows (36 per dietary treatment; 6 cows per pen; data not included) that were blocked by expected date of parturition, such that each block (n = 6) was slaughtered approximately 4 wk before expected date of parturition (approximately 250 d of gestation). Block therefore accounted for day of gestation in initial and midtrial measures and time on feed in slaughter measures. Cows were multiparous and averaged 3.23 ± 1.04 (mean ± SD) yr old. Animals were randomly assigned to pen (n = 12) and 1 of 2 dietary treatments: high level of feed intake (n = 11; HIGH): formulated to be 1.4 × total NE requirements for maintenance and fetal growth (NRC, 1996), equivalent to 2.1% of BW; and low level of intake (n = 11; LOW): to be 0.85 × total NE requirements for maintenance and fetal growth, equivalent to1.25% of BW.
Dry matter intake was measured for individual animals using Calan gates (American Calan, Inc.,
Northwood, NH), with orts (if present) collected once per week. Feed intakes were adjusted for individual cows every 14 d based on BW to maintain a constant level of NE intake relative to treatment (1.4 or 0.85 × total NE requirements for maintenance and fetal growth). The experiment took place over the winter, beginning in December with the first block sent to slaughter at the end of February. The average daily high and low temperature over this period was –4.0°C and –16.6°C, respectively (Environment Canada, 2013; National Climate and Information Archive).
Rations were fed once daily as a total mixed ration (TMR) and contained haylage (79.5% of diet DM; Table 1) primarily made up of mixed grasses along with wheat straw (20% of diet DM) and a trace mineral and vitamin supplement (0.5% of diet DM; 35.8% NaCl, 14% Na, 12% Ca, 4% P, 1% Mg, 0.6% S, 0.2% K, 2,369 mg/kg Mn, 1,000 mg/kg Cu, 3,000 mg/kg Zn, 2,294 mg/kg Fe, 58 mg/kg I, 25.5 mg/kg Co, 16.2 mg/kg Se, 601.5 KIU/kg vitamin A, 100.5 KIU/kg vitamin D, and 2,000 IU/kg vitamin E).
Animals were weighed and ultrasounded using an Aloka SSD-500 ultrasound unit (Corometrics Medical Systems, Wallingford, CT) for rib fat (between the 12th and 13th rib) and rump fat at the start, midpoint (d 56 of trial) and 3 to 5 d before slaughter. Blood samples were also obtained via jugular venipuncture at these time points in the morning before feeding, for later analysis of plasma metabolites.
Feed and Sample Analysis
Weekly TMR samples were collected and frozen at –20°C for future analysis. Samples were later dried at 55°C for 96 h to determine DM concentration and then ground to pass through a 1-mm screen. All feed analysis was performed at the Agri-Food Laboratories Inc. (Guelph, ON). Dry matter analysis was done in accordance with the Association of Official Analytical Chemists guidelines (AOAC, 1990, Method 930.15). Acid detergent fiber (expressed inclusive of residual ash) and NDF (assayed with heat stable amylase and sodium sulphite and expressed inclusive of residual ash) was determined using the methods of Robertson and Van Soest (1981) using an Ankom fiber analyzer (Ankom Technology Corp., Fairport, NY). Percent CP was determined by multiplying 6.25 by percent dietary nitrogen as determined by the Leco Nitrogen analyzer (Leco Corporation, St. Joseph, MI).
Sample Collection and Carcass Measurements
Four cows from blocks 1 through 4 and 6 (2 from each treatment) and 2 cows from block 5 (1 from each
at The University of Guelph on September 10, 2013www.journalofanimalscience.orgDownloaded from
Feed intake and metabolic proteins 4247
treatment) were slaughtered at the University of Guelph Meat Laboratory per sample collection day. The first block of cows was slaughtered on d 83 relative to the start of dietary treatments, and the remaining blocks were slaughtered weekly thereafter, such that cows were sent to slaughter at a common day of gestation (approximately d 250 of gestation). Final BW was obtained by weighing the morning of slaughter. Hot carcass weight, grade fat (minimum fat depth over the last quadrant of the LM), LM area (LMA), and subjective marbling score were determined as previously described (Mandell et al., 1997; Laborde et al., 2002; Mader et al., 2009). Visceral organs (liver, kidneys, heart, lungs, pancreas) were weighed and approximately 10-g samples of liver (midlobe), kidney (cortex of the larger of the 2 kidneys) and pancreas (body), along with sternomandibularis muscle were rinsed twice in 4°C saline (154 mM NaCl) and snap-frozen in liquid nitrogen for future analysis. The spleen, esophagus, reticulorumen, and total lower gastrointestinal tract (small and large intestine, cecum, and colon) were trimmed of fat, emptied, rinsed and weighed. Trimmed visceral fat, including kidney and pelvic fat, was also weighed. Samples of the rumen (ventral sac) and the small intestine (11th meter after the pylorus) were rinsed twice in chilled saline (154 mM NaCl) and snap frozen in liquid N2 until further analysis.
Blood samples (7 mL) were allowed to clot at room temperature for more than 30 min before storing on ice, after which they were centrifuged at 3,000 × g for 25 min 4˚C and serum was separated and then frozen at –20°C until further analysis. Serum samples were analyzed for serum urea, glucose, NEFA, β-hydroxybutyrate (BHBA) and total cholesterol at the University of Guelph Animal Health Laboratory (Guelph, ON) using Roche Cobas c311 and Immulite 1000 analyzers (Hoffmann-La Roche Ltd., Mississauga, ON, Canada). Serum samples
were also analyzed by IDEXX Laboratory (Markham, ON.) for serum triiodothyronine (T3) using a Siemens IMMULITE 2000 total T3 solid phase competitive chemiluminescent immunoassay (Siemens Healthcare Diagnostics, Mississauga, ON, Canada).
Protein Concentration, SDS-PAGE, and Immunoblots
Western blots were conducted to quantify abundance of PCNA, ATP synthase, ubiquitin, and Na/K+ ATPase for all tissues; PGC-1α, PPARγ, AMPKα and pAMPKα for liver, muscle, and rumen; PEPCK for liver and kid-ney; and UCP2 for liver. One gram of each tissue sam-ple of liver, kidney, pancreas, muscle, rumen papillae, and scraped small intestinal epithelia (Matthews et al., 1996; Wang et al., 2009) were homogenized in an ice-cold SEB solution (0.25 mM sucrose, 10 mM HEPES-KOH, 1 mM EDTA) containing 10 μL/mL of a protease inhibitor cocktail (Pierce Protease Inhibitor Cocktail Kit, Pierce Biotechnology, Rockford, IL, for all other samples) and then stored at –80°C until further analysis. Protein concentration of homogenate was determined using a commercially available bicinchononic acid kit (Pierce BCA Protein Assay Kit, Pierce Biotechnology) using BSA as a standard and measured on a PowerWave XS microplate spectrophotometer (BioTek Instruments Inc., Winooski, VT).
Twenty micrograms of total protein for ATP synthase and PCNA and 40 µg for all other protein targets were loaded on to SDS-PAGE gels (8% for Na/K+ ATPase and PGC-1α; 18% for ubiquitin, and 10% for all other proteins). Gels were electrophoresed according to meth-ods described by Laemmli (1970) and transferred to a polyvinylidene fluoride membrane (0.2 μm; Millipore Corporation, Bedford, MA). Membranes were blocked in a blocking solution containing 10 mM Tris-HCL, 200 mM NaCl, 1 mL/L Tween-20, and 50 g/L nonfat dry milk (Carnation Instant Skim Milk Powder, Markham, ON, Canada) for 1 h at room temperature before incuba-tion with primary antibodies. Primary antibodies were diluted in a blocking solution containing 10 mM Tris-CL, 200 mM NaCl, 1mL/L Tween-20, and 20 g/L nonfat dry milk. The primary antibodies, concentrations, and incubation times used were ATP Synthase (Complex 5; F1F0ATPase; mouse antibovine monoclonal; #459240, Invitrogen, Camarillo, CA; 1:5000 dilution; incubated for 1 h); PCNA rabbit antihuman polyclonal (SC-7907, Santa Cruz Biotechnology Inc., Dallas, TX; 1:1000 dilu-tion; incubated for 1 h); Na+/K+ ATPase α1 mouse an-tirabbit monoclonal (10R-N102A, Fitzgerald Industries International, Acton, MA; 1:750 for liver, kidney, pan-creas, and rumen, and 1:300 for small intestine and mus-cle, incubated overnight at 4°C); Ubiquitin rabbit antihu-man polyclonal (No. 3933, Cell Signalling Technology,
Table 1. Diet composition and analysesItem AmountIngredient, % DM Basis Grass haylage 79.5 Wheat straw 20.0 Mineral premix1 0.5Analysis2
DM, % 36.8 CP, %DM 12.2 ADF, %DM 39.4 NDF, %DM 58.2 NEm, Mcal/kg3 1.5
1Contains: 35.8% NaCl, 14% Na, 12% Ca, 4% P, 1% Mg, 0.6% S, 0.2% K, 2,369 mg/kg Mn, 1,000 mg/kg Cu, 3,000 mg/kg Zn, 2,294 mg/kg Fe, 58 mg/kg I, 25.5 mg/kg Co, 16.2 mg/kg Se, 601.5 KIU/kg vitamin A, 100.5 KIU/kg vitamin D, and 2,000 IU/kg vitamin E.
2Average of weekly samples.3Calculated according to Weiss et al. (1992) and NRC (1996).
at The University of Guelph on September 10, 2013www.journalofanimalscience.orgDownloaded from
Wood et al.4248
Danvers, MA; 1:1,000 dilution, incubated for 1.5 h for liver, kidney, and pancreas, and 2.5 h for small intestine and rumen, and overnight at 4°C for muscle); PPARγ rabbit antihuman monoclonal (No. 2435, Cell Signalling Technology, 1:500 dilution, incubated overnight at 4°C); AMPKα rabbit antihuman monoclonal (No. 5831, Cell Signalling Technology, Danvers, 1:1,000 dilution, incu-bated overnight at 4°C); Phospho-AMPKα rabbit antihu-man monoclonal (No. 2535, Cell Signalling Technology, 1:1000 dilution, incubated overnight at 4°C); PEPCK2 rabbit antihuman polyclonal (No. 6924, Cell Signalling Technology, 1:750 dilution, for 15 h); PGC-1α rabbit antimouse polyclonal (AB3242, Millipore, Temecula, CA, 1:750 dilution for liver and rumen and 1:500 dilu-tion for muscle, incubated overnight at 4°C); and UCP-2 rabbit antihuman polyclonal (144–157, Calbiochem, Darmsttadt, Germany, 1:750 dilution, incubated over-night at 4°C). Donkey antimouse immunoglobulin (1:5,000 dilution, Santa Cruz) and donkey antirabbit immunoglobulin for (1:5,000 dilution; GE Amersham, Baie d’Urfe, Quebec, QC, Canada) horseradish peroxi-dase-linked secondary antibodies were used in combina-tion with ECL Western Blotting Detection Reagents (GE Amersham) for chemiluminescent detection of immuno-reactive proteins.
Apparent protein migration weights were determined using molecular weight markers (Precision plus standards, 10 to 250 kDa; Bio-Rad Laboratories Ltd., Mississauga, ON, Canada). Band intensities were quantified using a FlourChem HD2 (Cell Biosciences/Proteinsimple, Santa Clara, CA) imaging system and Alphaview software (Alpha Innotech/Proteinsimple, Santa Clara, CA) correcting for local background intensity. To correct for unequal loading and/or transfer of proteins, membranes were stained with fast green (Fisher Scientific, Ottawa, ON, Canada) and a common predominant band was quantified and used to normalize immunoblots (Howell et al., 2003, Wang et al., 2009) Band intensities are expressed as corrected arbitrary units (AU) of optical intensity.
Oxygen Consumption
Hepatic tissue samples were collected immediately after slaughter for O2 consumption analysis as descried previously (McBridge and Milligan 1985; Scheaffer et al., 2003). Liver samples were placed into ice-cold Krebs-Ringer bicarbonate buffer fortified with sodium pyruvate (5 mM), sodium glutamate (5.0 mM), sodium acetate (4.5 mM), glucose (12.8 mM), and malic acid (4.5 mM) buffer at room temperature and immediately transported to the laboratory. Tissue samples were sliced into 5 mm thick slices with a Stadie-Riggs microtome (Thomas Scientific, Swedesboro, NJ), transferred into Petri dishes containing
buffer, and maintained at 37°C. Sliced tissue samples then were subsampled using an 8.0 mm biopsy punch (Premier Uni-Punch, Plymouth Meeting, PA), and placed into 4 mL of buffer, and analyzed for in vitro oxygen consumption, using a Clarke polariographic electrode (model 5300, Yellow Springs Instruments, Yellow Springs, OH). Oxygen consumption was measured on duplicate samples over 3 min.
Citrate Synthase Activity
Liver tissue (0.1 g) was homogenized in 2 mL of prechilled CelLytic MT mammalian tissue lysis/extraction reagent (Sigma-Aldrich, St. Louis, MO) using a Pyrex Ten Broeck Tissue Grinder (Model: 7727–07; PYREX, Corning, NY). Lysed samples (homogenate) were centrifuged (16,000 × g, for 10 min at 4˚C) and the supernatant was used to measure citrate synthase activity as an indicator of mitochondrial biogenesis (Morgunov and Srere, 1998). Citrate synthase activity was measured using a commercially available kit (Citrate Synthase Assay Kit, Sigma-Aldrich). Protein concentration (mg/g) was determined using the BCA assay (Pierce Biotechnology) similar as described above. One unit (U) of enzyme activity equals 1 mole product produced per minute. Citrate synthase activity data are expressed as U/g wet tissue, U/g of protein, kU/liver, and U/kg BW.
Statistical Analysis
Data were analyzed using PROC MIXED (SAS Inst. Inc., Cary. NC). The model included the effect of dietary treatment, cow age, pen and block. Pen nested within block and treatment was included as a random effect. Results were considered significant at P ≤ 0.05.
RESULTS
As designed, DMI was greater (P < 0.001; Table 2) in cows fed HIGH than those fed LOW. Although, initial BW did not differ, final BW was greater (P = 0.04) for cows fed HIGH. This resulted in a greater (P = 0.003) ADG for HIGH cows. Real-time ultrasound measures of rib fat and rump fat were not different between treatments at start of trial, middle (d 56 of restriction), or before slaughter. Hot carcass weight did not differ between dietary treatments. Carcass measures of rib-eye area and grade fat were not different between treatments, nor was subjective marbling score.
Circulating BHBA, urea, and total cholesterol were not different (Table 3) between treatments at any time point. Circulating NEFA and T3 were not different between dietary treatment initially or at the middle time point, but at the final preslaughter time point circulating
at The University of Guelph on September 10, 2013www.journalofanimalscience.orgDownloaded from
Feed intake and metabolic proteins 4249
NEFA concentrations were greater (P = 0.03) in cows fed LOW and T3 concentrations were greater (P = 0.01) in cows fed HIGH. Glucose concentration was greater in HIGH during the initial (P ≤ 0.05) and midtrial time points, but did not differ at the final time point.
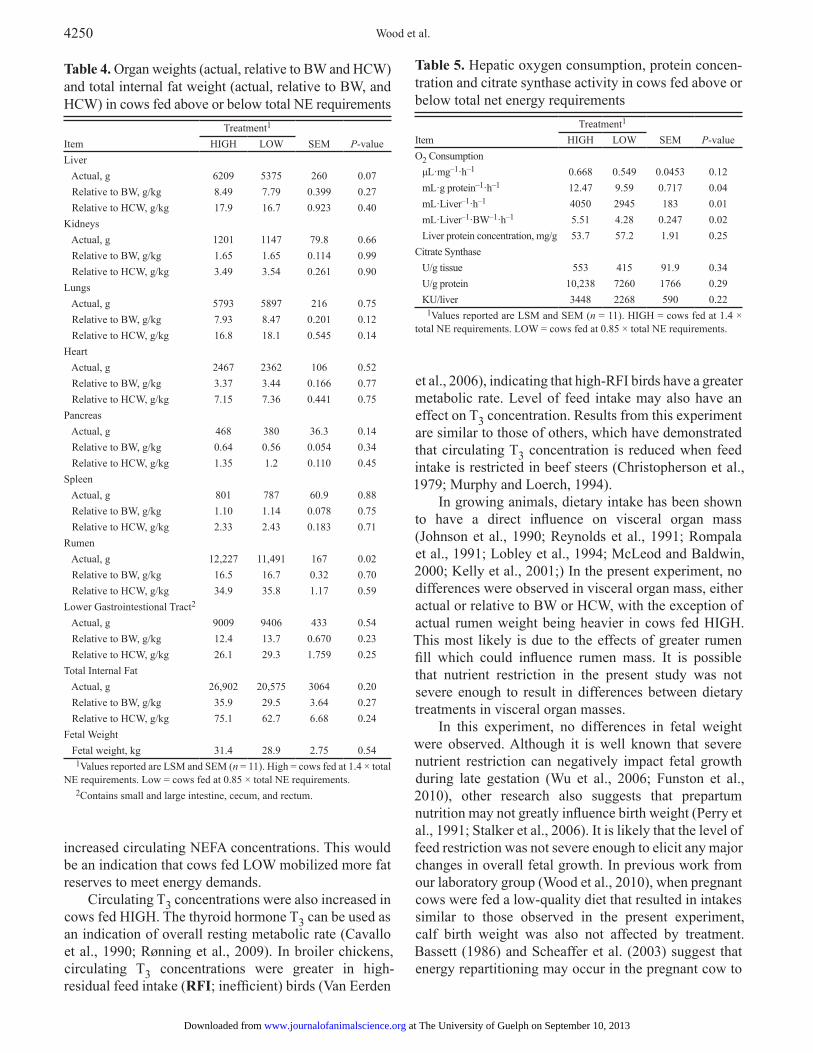
Mass of liver, kidney, lungs, heart, pancreas, spleen, and lower gastrointestional tract (intestinal + caecum + rectum) weight (both actual and relative to BW and HCW) did not differ (Table 4) between dietary treatments. Rumen mass was greater (P = 0.02) in cows fed HIGH than cows fed LOW, although was not different relative to BW or HCW. Total internal fat weight also was not different between treatments. Fetal weight averaged 31.4 kg in cows fed HIGH and 28.9 kg in cow fed LOW and was not different between treatments.
Liver in vitro O2 consumption per mg of tissue was not different (Table 5) between treatments; however, O2 consumption per mg protein, liver weight, or relative to BW was greater (P ≤ 0.04) in cows fed HIGH than cows fed LOW. Citrate synthase activity (concentration or relative to BW) did not differ between treatments.
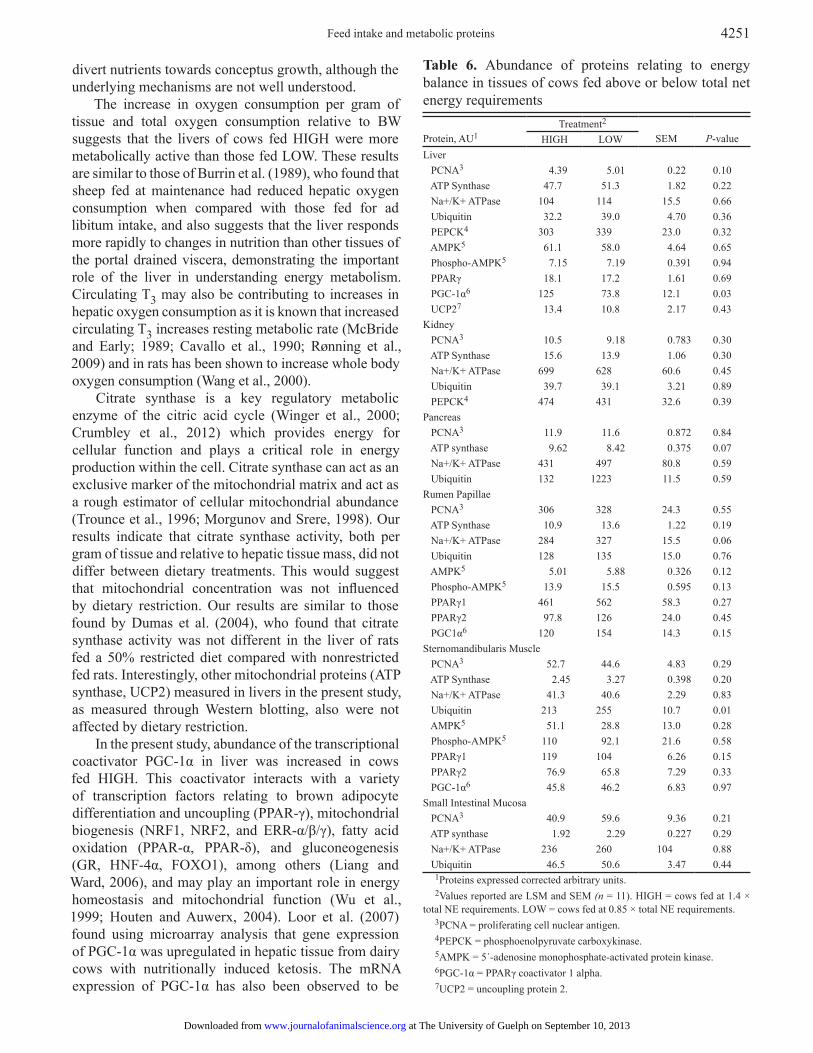
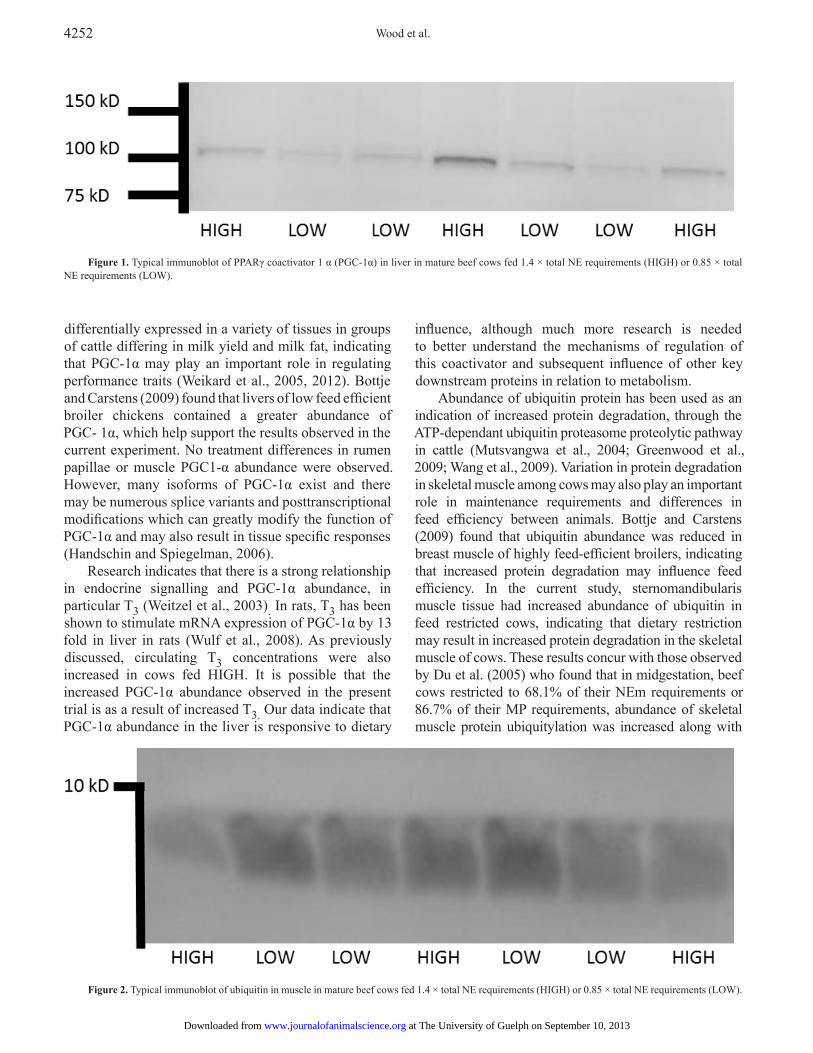
Abundance of PCNA, ATP synthase, and Na+/K+-ATPase, did not differ (P ≥ 0.06; Table 6) between treatments in all sampled tissues. Liver PGC1α was greater (P = 0.03; Fig. 1) in cows fed HIGH but did not differ between cows fed HIGH and LOW in muscle or rumen. In liver, rumen and muscle tissues, AMPK, pAMPK, or PPARγ abundance did not differ between treatments. Liver and kidney PEPCK abundance, and liver UCP2 abundance was not different
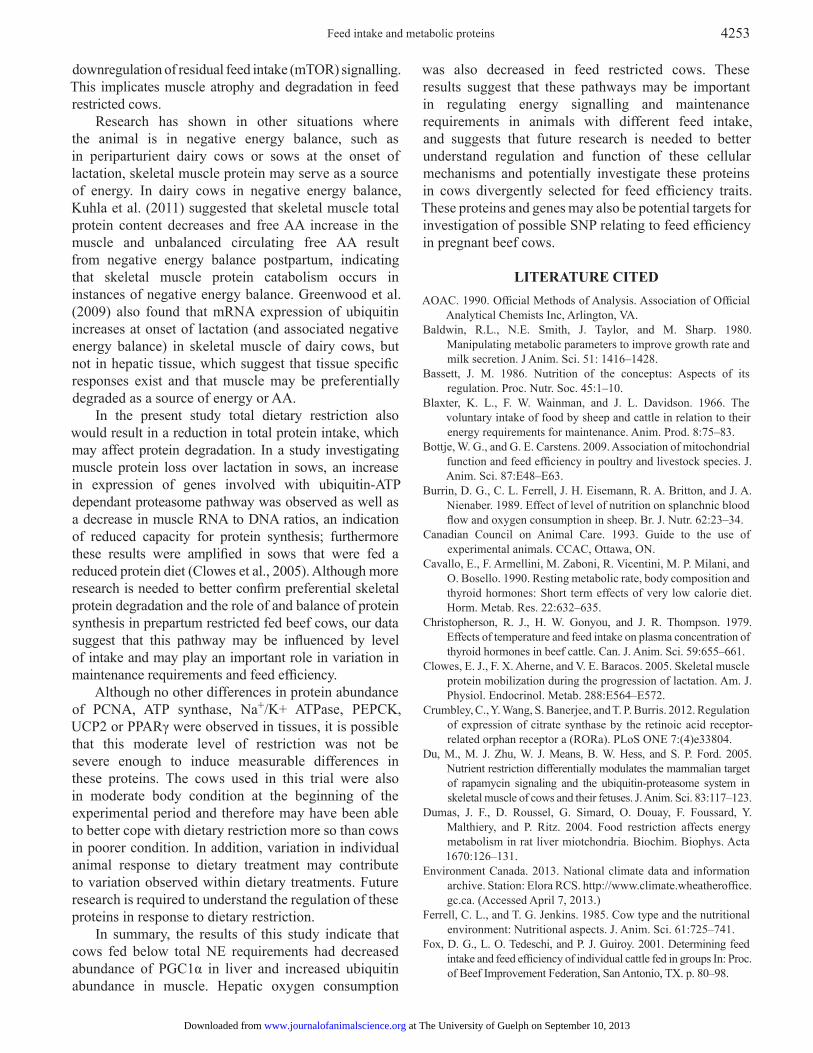
between dietary treatments. Muscle ubiquitin abundance was greater (P = 0.01; Fig. 2) in cows fed LOW, but did not differ between treatments for other tissues.
DISCUSSION
As the cost of feeding cattle continues to increase, the need to improve feed efficiency is increasingly important. Fox et al. (2001) suggested that if feed intake remained constant and if efficiency of ME use improved by 10%, profit for the producer would increase by 43%. Cellular maintenance functions represent 40 to 56% of basal energy requirements and can be further subdivided in to protein turnover (9 to 12%), lipid turnover (2 to 4%), and ion transport (30 to 40%; Baldwin et al., 1980). By better understanding maintenance energy requirements on a metabolic level, potential targets for improved selection of metabolically efficient cows may be identified.
As we would expect from the design of the experiment cows fed LOW consumed approximately 62% of the intake of cows fed HIGH. With this moderate rate of nutrient restriction, decreases in cow performance (ADG and final BW) were also observed. Circulating metabolites indicate that cows fed LOW were in a more catabolic state when compared with cow fed HIGH, as final (preslaughter) serum samples had
Table 2. Performance, real-time ultrasound and carcass characteristics of cows fed above or below total net energy requirements Variable
Treatment1 SEM
P-valueHIGH LOW
DMI, kg/d 10.9 6.8 0.119 <0.001ADG, kg/d 1.11 0.59 0.066 0.003Initial BW, kg 639 635 17.2 0.90Final BW, kg 738 690 12.7 0.04Initial U.S. rib fat,2 mm 7.5 7.8 1.74 0.90Initial U.S. rump fat,2 mm 10.9 10.8 2.28 0.96Midtrial U.S. rib fat,2 mm 8.72 8.08 1.68 0.80Midtrial U.S. rump fat,2 mm 12.1 10.4 2.23 0.62Final U.S. rib fat,2 mm 9.00 7.20 1.50 0.44Final U.S. rump fat,2 mm 12.4 8.6 2.11 0.26HCW, kg 354 323 9.96 0.07Grade fat, mm 8.7 6.2 1.59 0.32LM area, cm2 815 824 40.2 0.88Marbling score3 5.51 5.57 0.169 0.80
1Values reported are LSM and SEM (n = 11). HIGH = cows fed at 1.4 × total NE requirements. LOW = cows fed at 0.85 × total NE requirements.
2US = real time ultrasound.3LM scored subjectively for marbling using a 10-point scale (10 = devoid,
9 = practically devoid, 8 = traces, 7 = slight, 6 = small, 5 = modest, 4 = moderate, 3 = slightly abundant, 2 = moderately abundant, 1 = abundant).
Table 3. Circulating serum metabolites of cows fed above or below total net energy requirements
Item
Treatment1 SEM
P-valueHIGH LOW
–––––––– μmol/L ––––––––Initial BHBA2 461 410 43.1 0.44Midtrial BHBA2 132 158 18.1 0.35Final BHBA2 244 319 37.0 0.21Initial cholesterol 3.40 3.26 0.171 0.58Midtrial cholesterol 3.14 2.67 0.136 0.06Final cholesterol 2.77 2.57 0.115 0.28Initial NEFA 0.09 0.13 0.022 0.27Midtrial NEFA 0.56 0.64 0.114 0.62Final NEFA 0.47 1.08 0.144 0.03Initial glucose 3.67 3.27 0.105 0.04Midtrial glucose 3.79 3.57 0.059 0.05Final glucose 3.70 3.53 0.074 0.17Initial urea 5.63 5.53 0.400 0.88Midtrial urea 3.31 3.64 0.016 0.19Final urea 3.30 3.87 0.175 0.07Initial T3,3 pmol/L 2.34 2.30 0.099 0.79Midtrial T3,3 pmol/L 1.93 1.74 0.096 0.22Final T3,3 pmol/L 2.40 1.85 0.086 0.01
1Values reported are LSM and SEM (n = 11). HIGH = cows fed at 1.4 × total NE requirements. LOW = cows fed at 0.85 × total NE requirements.
2BHBA = β-hydroxybutyrate.3T3 = triiodothyronine.
at The University of Guelph on September 10, 2013www.journalofanimalscience.orgDownloaded from
Wood et al.4250
increased circulating NEFA concentrations. This would be an indication that cows fed LOW mobilized more fat reserves to meet energy demands.
Circulating T3 concentrations were also increased in cows fed HIGH. The thyroid hormone T3 can be used as an indication of overall resting metabolic rate (Cavallo et al., 1990; Rønning et al., 2009). In broiler chickens, circulating T3 concentrations were greater in high-residual feed intake (RFI; inefficient) birds (Van Eerden
et al., 2006), indicating that high-RFI birds have a greater metabolic rate. Level of feed intake may also have an effect on T3 concentration. Results from this experiment are similar to those of others, which have demonstrated that circulating T3 concentration is reduced when feed intake is restricted in beef steers (Christopherson et al., 1979; Murphy and Loerch, 1994).
In growing animals, dietary intake has been shown to have a direct influence on visceral organ mass (Johnson et al., 1990; Reynolds et al., 1991; Rompala et al., 1991; Lobley et al., 1994; McLeod and Baldwin, 2000; Kelly et al., 2001;) In the present experiment, no differences were observed in visceral organ mass, either actual or relative to BW or HCW, with the exception of actual rumen weight being heavier in cows fed HIGH. This most likely is due to the effects of greater rumen fill which could influence rumen mass. It is possible that nutrient restriction in the present study was not severe enough to result in differences between dietary treatments in visceral organ masses.
In this experiment, no differences in fetal weight were observed. Although it is well known that severe nutrient restriction can negatively impact fetal growth during late gestation (Wu et al., 2006; Funston et al., 2010), other research also suggests that prepartum nutrition may not greatly influence birth weight (Perry et al., 1991; Stalker et al., 2006). It is likely that the level of feed restriction was not severe enough to elicit any major changes in overall fetal growth. In previous work from our laboratory group (Wood et al., 2010), when pregnant cows were fed a low-quality diet that resulted in intakes similar to those observed in the present experiment, calf birth weight was also not affected by treatment. Bassett (1986) and Scheaffer et al. (2003) suggest that energy repartitioning may occur in the pregnant cow to
Table 4. Organ weights (actual, relative to BW and HCW) and total internal fat weight (actual, relative to BW, and HCW) in cows fed above or below total NE requirements
Item
Treatment1 SEM
P-valueHIGH LOW
Liver Actual, g 6209 5375 260 0.07 Relative to BW, g/kg 8.49 7.79 0.399 0.27 Relative to HCW, g/kg 17.9 16.7 0.923 0.40Kidneys Actual, g 1201 1147 79.8 0.66 Relative to BW, g/kg 1.65 1.65 0.114 0.99 Relative to HCW, g/kg 3.49 3.54 0.261 0.90Lungs Actual, g 5793 5897 216 0.75 Relative to BW, g/kg 7.93 8.47 0.201 0.12 Relative to HCW, g/kg 16.8 18.1 0.545 0.14Heart Actual, g 2467 2362 106 0.52 Relative to BW, g/kg 3.37 3.44 0.166 0.77 Relative to HCW, g/kg 7.15 7.36 0.441 0.75Pancreas Actual, g 468 380 36.3 0.14 Relative to BW, g/kg 0.64 0.56 0.054 0.34 Relative to HCW, g/kg 1.35 1.2 0.110 0.45Spleen Actual, g 801 787 60.9 0.88 Relative to BW, g/kg 1.10 1.14 0.078 0.75 Relative to HCW, g/kg 2.33 2.43 0.183 0.71Rumen Actual, g 12,227 11,491 167 0.02 Relative to BW, g/kg 16.5 16.7 0.32 0.70 Relative to HCW, g/kg 34.9 35.8 1.17 0.59Lower Gastrointestional Tract2
Actual, g 9009 9406 433 0.54 Relative to BW, g/kg 12.4 13.7 0.670 0.23 Relative to HCW, g/kg 26.1 29.3 1.759 0.25Total Internal Fat Actual, g 26,902 20,575 3064 0.20 Relative to BW, g/kg 35.9 29.5 3.64 0.27 Relative to HCW, g/kg 75.1 62.7 6.68 0.24Fetal Weight Fetal weight, kg 31.4 28.9 2.75 0.54
1Values reported are LSM and SEM (n = 11). High = cows fed at 1.4 × total NE requirements. Low = cows fed at 0.85 × total NE requirements.
2Contains small and large intestine, cecum, and rectum.
Table 5. Hepatic oxygen consumption, protein concen-tration and citrate synthase activity in cows fed above or below total net energy requirements
Item
Treatment1 SEM
P-valueHIGH LOW
O2 Consumption μL·mg–1·h–1 0.668 0.549 0.0453 0.12 mL·g protein–1·h–1 12.47 9.59 0.717 0.04 mL·Liver–1·h–1 4050 2945 183 0.01 mL·Liver–1·BW–1·h–1 5.51 4.28 0.247 0.02 Liver protein concentration, mg/g 53.7 57.2 1.91 0.25Citrate Synthase U/g tissue 553 415 91.9 0.34 U/g protein 10,238 7260 1766 0.29 KU/liver 3448 2268 590 0.22
1Values reported are LSM and SEM (n = 11). HIGH = cows fed at 1.4 × total NE requirements. LOW = cows fed at 0.85 × total NE requirements.
at The University of Guelph on September 10, 2013www.journalofanimalscience.orgDownloaded from
Feed intake and metabolic proteins 4251
divert nutrients towards conceptus growth, although the underlying mechanisms are not well understood.
The increase in oxygen consumption per gram of tissue and total oxygen consumption relative to BW suggests that the livers of cows fed HIGH were more metabolically active than those fed LOW. These results are similar to those of Burrin et al. (1989), who found that sheep fed at maintenance had reduced hepatic oxygen consumption when compared with those fed for ad libitum intake, and also suggests that the liver responds more rapidly to changes in nutrition than other tissues of the portal drained viscera, demonstrating the important role of the liver in understanding energy metabolism. Circulating T3 may also be contributing to increases in hepatic oxygen consumption as it is known that increased circulating T3 increases resting metabolic rate (McBride and Early; 1989; Cavallo et al., 1990; Rønning et al., 2009) and in rats has been shown to increase whole body oxygen consumption (Wang et al., 2000).
Citrate synthase is a key regulatory metabolic enzyme of the citric acid cycle (Winger et al., 2000; Crumbley et al., 2012) which provides energy for cellular function and plays a critical role in energy production within the cell. Citrate synthase can act as an exclusive marker of the mitochondrial matrix and act as a rough estimator of cellular mitochondrial abundance (Trounce et al., 1996; Morgunov and Srere, 1998). Our results indicate that citrate synthase activity, both per gram of tissue and relative to hepatic tissue mass, did not differ between dietary treatments. This would suggest that mitochondrial concentration was not influenced by dietary restriction. Our results are similar to those found by Dumas et al. (2004), who found that citrate synthase activity was not different in the liver of rats fed a 50% restricted diet compared with nonrestricted fed rats. Interestingly, other mitochondrial proteins (ATP synthase, UCP2) measured in livers in the present study, as measured through Western blotting, also were not affected by dietary restriction.
In the present study, abundance of the transcriptional coactivator PGC-1α in liver was increased in cows fed HIGH. This coactivator interacts with a variety of transcription factors relating to brown adipocyte differentiation and uncoupling (PPAR-γ), mitochondrial biogenesis (NRF1, NRF2, and ERR-α/β/γ), fatty acid oxidation (PPAR-α, PPAR-δ), and gluconeogenesis (GR, HNF-4α, FOXO1), among others (Liang and Ward, 2006), and may play an important role in energy homeostasis and mitochondrial function (Wu et al., 1999; Houten and Auwerx, 2004). Loor et al. (2007) found using microarray analysis that gene expression of PGC-1α was upregulated in hepatic tissue from dairy cows with nutritionally induced ketosis. The mRNA expression of PGC-1α has also been observed to be
Table 6. Abundance of proteins relating to energy balance in tissues of cows fed above or below total net energy requirements Protein, AU1
Treatment2 SEM
P-valueHIGH LOW
Liver PCNA3 4.39 5.01 0.22 0.10 ATP Synthase 47.7 51.3 1.82 0.22 Na+/K+ ATPase 104 114 15.5 0.66 Ubiquitin 32.2 39.0 4.70 0.36 PEPCK4 303 339 23.0 0.32 AMPK5 61.1 58.0 4.64 0.65 Phospho-AMPK5 7.15 7.19 0.391 0.94 PPARγ 18.1 17.2 1.61 0.69 PGC-1α6 125 73.8 12.1 0.03 UCP27 13.4 10.8 2.17 0.43Kidney PCNA3 10.5 9.18 0.783 0.30 ATP Synthase 15.6 13.9 1.06 0.30 Na+/K+ ATPase 699 628 60.6 0.45 Ubiquitin 39.7 39.1 3.21 0.89 PEPCK4 474 431 32.6 0.39Pancreas PCNA3 11.9 11.6 0.872 0.84 ATP synthase 9.62 8.42 0.375 0.07 Na+/K+ ATPase 431 497 80.8 0.59 Ubiquitin 132 1223 11.5 0.59Rumen Papillae PCNA3 306 328 24.3 0.55 ATP Synthase 10.9 13.6 1.22 0.19 Na+/K+ ATPase 284 327 15.5 0.06 Ubiquitin 128 135 15.0 0.76 AMPK5 5.01 5.88 0.326 0.12 Phospho-AMPK5 13.9 15.5 0.595 0.13 PPARγ1 461 562 58.3 0.27 PPARγ2 97.8 126 24.0 0.45 PGC1α6 120 154 14.3 0.15Sternomandibularis Muscle PCNA3 52.7 44.6 4.83 0.29 ATP Synthase 2.45 3.27 0.398 0.20 Na+/K+ ATPase 41.3 40.6 2.29 0.83 Ubiquitin 213 255 10.7 0.01 AMPK5 51.1 28.8 13.0 0.28 Phospho-AMPK5 110 92.1 21.6 0.58 PPARγ1 119 104 6.26 0.15 PPARγ2 76.9 65.8 7.29 0.33 PGC-1α6 45.8 46.2 6.83 0.97Small Intestinal Mucosa PCNA3 40.9 59.6 9.36 0.21 ATP synthase 1.92 2.29 0.227 0.29 Na+/K+ ATPase 236 260 104 0.88 Ubiquitin 46.5 50.6 3.47 0.44
1Proteins expressed corrected arbitrary units.2Values reported are LSM and SEM (n = 11). HIGH = cows fed at 1.4 ×
total NE requirements. LOW = cows fed at 0.85 × total NE requirements.3PCNA = proliferating cell nuclear antigen. 4PEPCK = phosphoenolpyruvate carboxykinase.5AMPK = 5´-adenosine monophosphate-activated protein kinase.6PGC-1α = PPARγ coactivator 1 alpha.7UCP2 = uncoupling protein 2.
at The University of Guelph on September 10, 2013www.journalofanimalscience.orgDownloaded from
Wood et al.4252
differentially expressed in a variety of tissues in groups of cattle differing in milk yield and milk fat, indicating that PGC-1α may play an important role in regulating performance traits (Weikard et al., 2005, 2012). Bottje and Carstens (2009) found that livers of low feed efficient broiler chickens contained a greater abundance of PGC- 1α, which help support the results observed in the current experiment. No treatment differences in rumen papillae or muscle PGC1-α abundance were observed. However, many isoforms of PGC-1α exist and there may be numerous splice variants and posttranscriptional modifications which can greatly modify the function of PGC-1α and may also result in tissue specific responses (Handschin and Spiegelman, 2006).
Research indicates that there is a strong relationship in endocrine signalling and PGC-1α abundance, in particular T3 (Weitzel et al., 2003). In rats, T3 has been shown to stimulate mRNA expression of PGC-1α by 13 fold in liver in rats (Wulf et al., 2008). As previously discussed, circulating T3 concentrations were also increased in cows fed HIGH. It is possible that the increased PGC-1α abundance observed in the present trial is as a result of increased T3. Our data indicate that PGC-1α abundance in the liver is responsive to dietary
influence, although much more research is needed to better understand the mechanisms of regulation of this coactivator and subsequent influence of other key downstream proteins in relation to metabolism.
Abundance of ubiquitin protein has been used as an indication of increased protein degradation, through the ATP-dependant ubiquitin proteasome proteolytic pathway in cattle (Mutsvangwa et al., 2004; Greenwood et al., 2009; Wang et al., 2009). Variation in protein degradation in skeletal muscle among cows may also play an important role in maintenance requirements and differences in feed efficiency between animals. Bottje and Carstens (2009) found that ubiquitin abundance was reduced in breast muscle of highly feed-efficient broilers, indicating that increased protein degradation may influence feed efficiency. In the current study, sternomandibularis muscle tissue had increased abundance of ubiquitin in feed restricted cows, indicating that dietary restriction may result in increased protein degradation in the skeletal muscle of cows. These results concur with those observed by Du et al. (2005) who found that in midgestation, beef cows restricted to 68.1% of their NEm requirements or 86.7% of their MP requirements, abundance of skeletal muscle protein ubiquitylation was increased along with
Figure 1. Typical immunoblot of PPARγ coactivator 1 α (PGC-1α) in liver in mature beef cows fed 1.4 × total NE requirements (HIGH) or 0.85 × total NE requirements (LOW).
Figure 2. Typical immunoblot of ubiquitin in muscle in mature beef cows fed 1.4 × total NE requirements (HIGH) or 0.85 × total NE requirements (LOW).
at The University of Guelph on September 10, 2013www.journalofanimalscience.orgDownloaded from
Feed intake and metabolic proteins 4253
downregulation of residual feed intake (mTOR) signalling. This implicates muscle atrophy and degradation in feed restricted cows.
Research has shown in other situations where the animal is in negative energy balance, such as in periparturient dairy cows or sows at the onset of lactation, skeletal muscle protein may serve as a source of energy. In dairy cows in negative energy balance, Kuhla et al. (2011) suggested that skeletal muscle total protein content decreases and free AA increase in the muscle and unbalanced circulating free AA result from negative energy balance postpartum, indicating that skeletal muscle protein catabolism occurs in instances of negative energy balance. Greenwood et al. (2009) also found that mRNA expression of ubiquitin increases at onset of lactation (and associated negative energy balance) in skeletal muscle of dairy cows, but not in hepatic tissue, which suggest that tissue specific responses exist and that muscle may be preferentially degraded as a source of energy or AA.
In the present study total dietary restriction also would result in a reduction in total protein intake, which may affect protein degradation. In a study investigating muscle protein loss over lactation in sows, an increase in expression of genes involved with ubiquitin-ATP dependant proteasome pathway was observed as well as a decrease in muscle RNA to DNA ratios, an indication of reduced capacity for protein synthesis; furthermore these results were amplified in sows that were fed a reduced protein diet (Clowes et al., 2005). Although more research is needed to better confirm preferential skeletal protein degradation and the role of and balance of protein synthesis in prepartum restricted fed beef cows, our data suggest that this pathway may be influenced by level of intake and may play an important role in variation in maintenance requirements and feed efficiency.
Although no other differences in protein abundance of PCNA, ATP synthase, Na+/K+ ATPase, PEPCK, UCP2 or PPARγ were observed in tissues, it is possible that this moderate level of restriction was not be severe enough to induce measurable differences in these proteins. The cows used in this trial were also in moderate body condition at the beginning of the experimental period and therefore may have been able to better cope with dietary restriction more so than cows in poorer condition. In addition, variation in individual animal response to dietary treatment may contribute to variation observed within dietary treatments. Future research is required to understand the regulation of these proteins in response to dietary restriction.
In summary, the results of this study indicate that cows fed below total NE requirements had decreased abundance of PGC1α in liver and increased ubiquitin abundance in muscle. Hepatic oxygen consumption
was also decreased in feed restricted cows. These results suggest that these pathways may be important in regulating energy signalling and maintenance requirements in animals with different feed intake, and suggests that future research is needed to better understand regulation and function of these cellular mechanisms and potentially investigate these proteins in cows divergently selected for feed efficiency traits. These proteins and genes may also be potential targets for investigation of possible SNP relating to feed efficiency in pregnant beef cows.
LITERATURE CITEDAOAC. 1990. Official Methods of Analysis. Association of Official
Analytical Chemists Inc, Arlington, VA.Baldwin, R.L., N.E. Smith, J. Taylor, and M. Sharp. 1980.
Manipulating metabolic parameters to improve growth rate and milk secretion. J Anim. Sci. 51: 1416–1428.
Bassett, J. M. 1986. Nutrition of the conceptus: Aspects of its regulation. Proc. Nutr. Soc. 45:1–10.
Blaxter, K. L., F. W. Wainman, and J. L. Davidson. 1966. The voluntary intake of food by sheep and cattle in relation to their energy requirements for maintenance. Anim. Prod. 8:75–83.
Bottje, W. G., and G. E. Carstens. 2009. Association of mitochondrial function and feed efficiency in poultry and livestock species. J. Anim. Sci. 87:E48–E63.
Burrin, D. G., C. L. Ferrell, J. H. Eisemann, R. A. Britton, and J. A. Nienaber. 1989. Effect of level of nutrition on splanchnic blood flow and oxygen consumption in sheep. Br. J. Nutr. 62:23–34.
Canadian Council on Animal Care. 1993. Guide to the use of experimental animals. CCAC, Ottawa, ON.
Cavallo, E., F. Armellini, M. Zaboni, R. Vicentini, M. P. Milani, and O. Bosello. 1990. Resting metabolic rate, body composition and thyroid hormones: Short term effects of very low calorie diet. Horm. Metab. Res. 22:632–635.
Christopherson, R. J., H. W. Gonyou, and J. R. Thompson. 1979. Effects of temperature and feed intake on plasma concentration of thyroid hormones in beef cattle. Can. J. Anim. Sci. 59:655–661.
Clowes, E. J., F. X. Aherne, and V. E. Baracos. 2005. Skeletal muscle protein mobilization during the progression of lactation. Am. J. Physiol. Endocrinol. Metab. 288:E564–E572.
Crumbley, C., Y. Wang, S. Banerjee, and T. P. Burris. 2012. Regulation of expression of citrate synthase by the retinoic acid receptor-related orphan receptor a (RORa). PLoS ONE 7:(4)e33804.
Du, M., M. J. Zhu, W. J. Means, B. W. Hess, and S. P. Ford. 2005. Nutrient restriction differentially modulates the mammalian target of rapamycin signaling and the ubiquitin-proteasome system in skeletal muscle of cows and their fetuses. J. Anim. Sci. 83:117–123.
Dumas, J. F., D. Roussel, G. Simard, O. Douay, F. Foussard, Y. Malthiery, and P. Ritz. 2004. Food restriction affects energy metabolism in rat liver miotchondria. Biochim. Biophys. Acta 1670:126–131.
Environment Canada. 2013. National climate data and information archive. Station: Elora RCS. http://www.climate.wheatheroffice.gc.ca. (Accessed April 7, 2013.)
Ferrell, C. L., and T. G. Jenkins. 1985. Cow type and the nutritional environment: Nutritional aspects. J. Anim. Sci. 61:725–741.
Fox, D. G., L. O. Tedeschi, and P. J. Guiroy. 2001. Determining feed intake and feed efficiency of individual cattle fed in groups In: Proc. of Beef Improvement Federation, San Antonio, TX. p. 80–98.
at The University of Guelph on September 10, 2013www.journalofanimalscience.orgDownloaded from
Wood et al.4254
Funston, R. N., D. M. Larson, and K. A. Vonnahme. 2010. Effects of maternal nutrition on conceptus growth and offspring performance: Implications for beef cattle production. J. Anim. Sci. 88:E205–E215.
Greenwood, S. L., T. C. Wright, N. G. Purdie, J. Doelman, J. P. Cant, and B. W. McBride. 2009. Lactation induces upregulation of the ubiquitin-mediated proteolytic pathway in skeletal muscle of dairy cows but does not alter hepatic expression. Can. J. Anim. Sci. 89:309–313.
Handschin, C., and B.M. Spiegelman. 2006. Peroxisome proliferator-activated receptor γ coactivator 1: Coactivators, energy homeostasis and metabolism. Endocr. Rev. 27:728–735.
Herd, R. M., V. H. Oddy, and E. C. Richardson. 2004. Biological basis for variation in residual feed intake in beef cattle. 1. Review of potential mechanisms. Aust. J. Exp. Agric. 44:423–430.
Houten, S. M., and J. Auwerx. 2004. PGC-1α: Turbocharging mitochondria. Cell 119:5–7.
Howell, J. A., A. D. Matthews, T. C. Welbourne, and J. C. Matthews. 2003. Content of ileal EAAC1 and hepatic GLT-1 high-affinity glutamate transporters is increased in growing vs. nongrowing lambs, paralleling increased tissue D- and L-glutamate, plasma glutamine, and alanine concentrations. J. Anim. Sci. 81:1030–1039.
Johnson, D. E., K. A. Johnson, and R. L. Bladwin. 1990. Changes in liver and gastrointestinal tract energy demands in response to physiological workload in ruminants. J. Nutr. 120:649–655.
Kelly, J. M., T. Mutsvangwa, L. P. Milligan, D. R. Waldo, and B. W. McBride. 2001. Quantification of energy expenditures of the gastrointestinal tract of steers fed three diets at two levels of intake. Can. J. Anim. Sci. 81:533–540.
Kuhla, B., G. Nürnberg, D. Albrecht, S. Görs, H. H. Hammon, and C. C. Metges. 2011. Involvement of skeletal muscle protein, glycogen, and fat metabolism in the adaptation on early lactation of dairy cows. J. Proteome Res. 10:4252–4262.
Laborde, F. L., I. B. Mandell, J. J. Tosh, J. G. Buchanan-Smith, and J. W. Wilton. 2002. Effect of management strategy on growth performance, carcass characteristics fatty acid composition, and palatability attributes in crossbred steers. Can. J. Anim. Sci. 82:49–57.
Labussière, E., J. van Milgen, C. F. M. de Lange, and J. Noblet. 2011. Maintenance energy requirements of growing pigs and calves are influenced by feeding level. J. Nutr. 141:1855–1861.
Laemmli, U. K. 1970. Cleavage of structural proteins during the assembly of the head of bacteriophage T4. Nature 227:680–685.
Liang, H., and W. F. Ward. 2006. PGC-1α: A key regulator of energy metabolism. Adv. Physiol. Educ. 30:145–151.
Lobley, G. E., A. Connell, E. Milne, A. M. Newman, and T. A. Ewing. 1994. Protein synthesis in splanchnic tissues of sheep offered two levels of intake. Br. J. Nutr. 71:3–12.
Loor, J. J., R. E. Everts, M. Bionaz, H. M. Dann, D. E. Morin, R. Oliveira, S. L. Rodriguez-Zas, J. K. Drackley, and H. A. Lewin. 2007. Nutriton-induced ketosis alters metabolic and signalling gene networks in liver of periparturient dairy cows. Physiol. Genomics. 32:105–116.
Mader, C. J., Y. R. Montanholi, Y. J. Wang, S. P. Miller, I. B. Mandell, B. W. McBride, and K. C. Swanson. 2009. Relationships among measures of growth performance and efficiency with carcass traits, visceral organ mass, and pancreatic digestive enzymes in feedlot cattle. J. Anim. Sci. 87:1548–1557.
Mandell, I. B., E. A. Gullett, J. G. Buchanan-Smith, and C. P. Campbell. 1997. Effects of diet and slaughter endpoint on carcass composition and beef quality in Charolais cross steers. Can. J. Anim. Sci. 77:403–414.
Matthews, J. C., E. A.Wong, P. K. Bender, J. R. Bloomquist, and K. E. Webb, Jr. 1996. Demonstration and characterization of dipeptide transport system activity in sheep omasal epithelium by expression of mRNA in Xenopus laevis oocytes. J. Anim. Sci. 74:1720–1727.
McBride, B. W., and R. J. Early. 1989. Energy expenditure associated with sodium/potassium transport and protein synthesis in skeletal muscle and isolated hepatocytes from hyperthyroid sheep. Br. J. Nutr. 62:673–682.
McBridge, B. W., and L. P. Milligan. 1985. Magnitude of ouabain-sensitive respiration in the liver of growing, lactating and starved sheep. Br. J. Nutr. 54:293–303.
McLeod, K. R., and R. L. Baldwin, 6th. 2000. Effects of diet forage:concentrate ratio and metabolizable energy intake on visceral organ growth and in vitro oxidative capacity of gut tissues in sheep. J. Anim. Sci. 78:760–770.
Morgunov, I., and P. A. Srere. 1998. Interaction between citrate synthase and malate dehydrogenase. Substrate channeling of oxaloacetate. J. Biol. Chem. 273:29540–29544.
Murphy, T. A., and S. C. Loerch. 1994. Effects of restricted feeding of growing steers on performance, carcass characteristics, and composition. J. Anim. Sci. 72:2497–2507.
Mutsvangwa, T., J. Gilmore, J. E. Squires, M. I. Lindinger, and B. W. McBride. 2004. Chronic metabolic acidosis increases mRNA levels for components of the ubiquitin-mediated proteolytic pathway in skeletal muscle of dairy cows. J. Nutr. 134:558–561.
NRC. 1996. Nutrient requirements of beef cattle. 7th ed. Natl. Acad. Press, Washington, DC.
Perry, R. C., L. R. Corah, R. C. Cochran, W. E. Beal, J. S. Stevenson, J. E. Minton, D. D. Simms, and J. R. Brethour. 1991. J. Anim. Sci. 69:3762–3773.
Reynolds, C. K., H. F. Tyrrell, and P. J. Reynolds. 1991. Effects of diet forage to concentrate ratio and intake on energy metabolism in growing beef heifers: Whole body energy metabolism and nitrogen balance and visceral heat production. J. Nutr. 121:994–1003.
Robertson, J. B., and P. J. Van Soest. 1981. The detergent system of analysis and its application to human foods. In: W. P. T. James and O. Theander, editors, The analysis of dietary fiber. Marcell Dekker, New York. p. 123–158.
Rompala, R. E., D. E. Johnson, W. V. Rumpler, H. W. Phetteplace, S. M. Specht, and C. F. Parker. 1991. Energy utilization and organ mass of targhee sheep selected for a rate and efficiency of gain and receiving high and low planes of nutrition. J. Anim. Sci. 69:1760–1765.
Rønning, B., A. S. Mortensen, B. Moe, O. Chastel, A. Arukwe, and C. Bech. 2009. Food restriction in young Japanese quails: Effects on growth, metabolism, plasma thyroid hormones and mRNA species in the thyroid hormone signalling pathway. J. Exp. Biol. 212:3060–3067.
Scheaffer, A. N., J. S. Caton, M. L. Bauer, D. A. Redmer, and L. P. Reynolds. 2003. The effect of pregnancy on visceral growth and energy use in beef heifers. J. Anim. Sci. 81:1853–1861.
Stalker, L. A., D. C. Adams, T. J. Klopfenstein, D. M. Feuz, and R. N. Funston. 2006. Effects of pre- and postpartum nutrition on reproduction in spring calving cows and calf feedlot performance. J. Anim. Sci. 84:2582–2589.
Trounce, I. A., Y. L. Kim, A. S. Jun, and C. Douglas. 1996. Assessment of mitochondrial oxidative phosphorylation in patient muscle biopsies, lymphoblasts, and transmitochondrial cell lines. Methods Enzymol. 264:484–509.
Van Eerden, E., H. Van Den Brand, M. J. W. Heetkamp, E. Decuypere, and B. Kemp. 2006. Energy partitioning and thyroid hormone levels during salmonella enteritidis infections in pullets with high or low residual feed intake. Poult. Sci. 85:1775–1783.
Wang, J. J., N. Chinookoswong, S. Yin, and Z. Q. Shi. 2000. Calorigenic actions of lepton are additive to, but not dependent on, those of thyroid hormones. Am. J. Physiol. Endocrinol. Metab. 279:E1278–E1285.
at The University of Guelph on September 10, 2013www.journalofanimalscience.orgDownloaded from
Feed intake and metabolic proteins 4255
Wang, Y. J., M. Ko, S. Holligan, B. W. McBride, M. Z. Fan, and K. C. Swanson. 2009. Effect of dry matter intake on visceral organ mass, cellularity, and the protein expression of ATP synthase, Na+/K+-ATPase, proliferating cell nuclear antigen and ubiquitin in feedlot steers. Can. J. Anim. Sci. 89:253–262.
Weikard, R., T. Glodammer, R. M. Brunner, and C. Kuehn. 2012. Tissue-specific mRNA expression patterns reveal a coordinated metabolic response associated with genetic selection for milk production in cows. Physiol. Genomics 44:728–739.
Weikard, R., C. Kühn, T. Goldammer, G. Freyer, and M. Schwerin. 2005. The bovine PPARGC1A gene: Molecular characterisation and association of an SNP with variation of milk fat synthesis. Physiol. Genomics 21:1–13.
Weiss, W. P., H. R. Conrad, and N. R. St. Pierre. 1992. A theoretically-based model for predicting total digestible nutrient values for forages and concentrates. Anim. Feed Sci. Technol. 39:95–110.
Weitzel, J. M., K. A. H. Iwen, and H. J. Seitz. 2003. Regulation of mitochondrial biogenesis by thyroid hormone. Exp. Physiol. 88:121–128.
Winger, Q. A., J.R. Hill, A.J. Watson, and M.E. Westhusin. 2000. Characterization of a bovine cDNA encoding citrate synthase, and presence of citrate synthase mRNADuring bovine pre-attachment development. Mol. Reprod. Dev. 55:14–19.
Wood, K. M., M. J. Kelly, S. P. Miller, I. B. Mandell, and K. C. Swanson. 2010. Effects of crop residues in haylage-based rations on the performance of pregnant beef cows. Can. J. Anim. Sci. 90:69–76.
Wu, G., F. W. Bazer, J. M. Wallace, and T. E. Spencer. 2006. Board-Invited Review: Intrauterine growth retardation: Implications for the animal sciences. J. Anim. Sci. 84:2316–2337.
Wu, Z., P. Puigserver, U. Andersson, C. Zhang, G. Adelmant, V. Mootha, A. Troy, S. Cinti, B. Lowell, R. C. Scarpulla, and B. M. Spiegelman. 1999. Mechanisms controlling mitochondrial biogenesis and regulation through the thermogenic coactivator PGC-1. Cell 98:115–124.
Wulf, A., A. Harneit, M. Kröger, M. Kebenko, M. G. Wetzel, and J. M. Weitzel. 2008. T3-mediated expression of PGC-1α via a far upstream located thyroid hormone response element. Mol. Cell. Endocrinol. 287:90–95.
at The University of Guelph on September 10, 2013www.journalofanimalscience.orgDownloaded from

Referenceshttp://www.journalofanimalscience.org/content/91/9/4245#BIBLThis article cites 55 articles, 30 of which you can access for free at:
at The University of Guelph on September 10, 2013www.journalofanimalscience.orgDownloaded from