The Cash Cows, Dogs, Stars and Problem Children of the ...
13
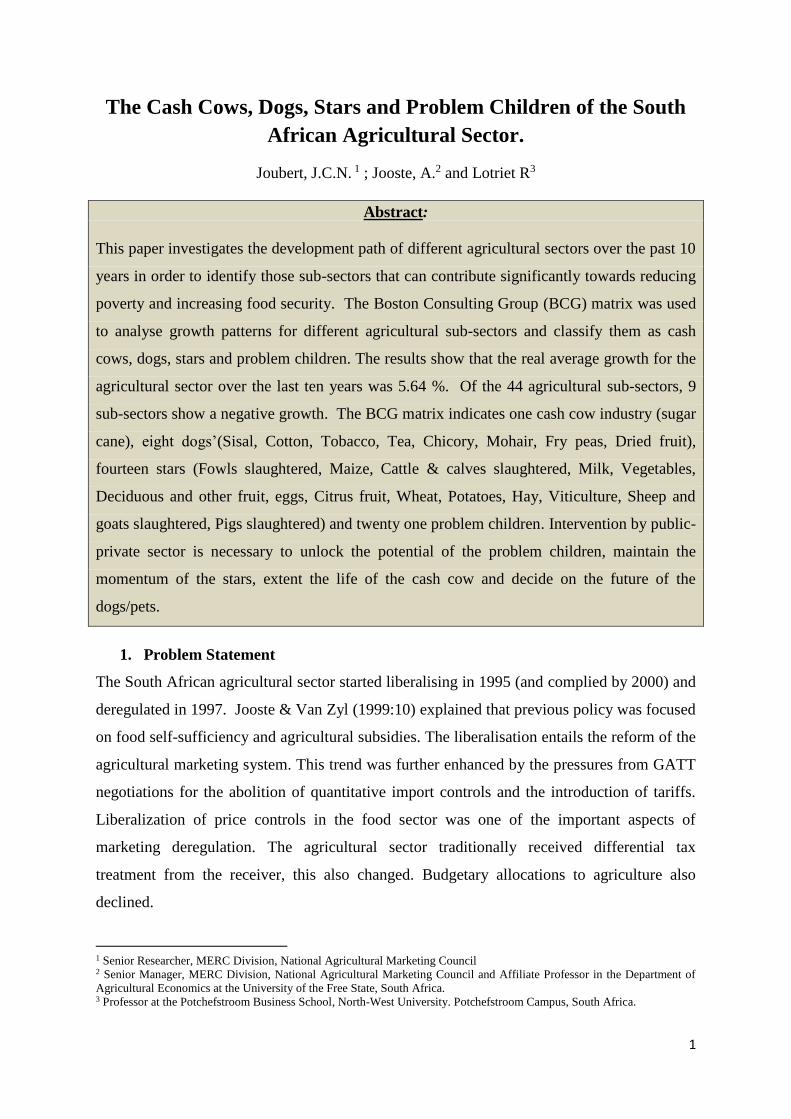
1 The Cash Cows, Dogs, Stars and Problem Children of the South African Agricultural Sector. Joubert, J.C.N. 1 ; Jooste, A. 2 and Lotriet R 3 Abstract: This paper investigates the development path of different agricultural sectors over the past 10 years in order to identify those sub-sectors that can contribute significantly towards reducing poverty and increasing food security. The Boston Consulting Group (BCG) matrix was used to analyse growth patterns for different agricultural sub-sectors and classify them as cash cows, dogs, stars and problem children. The results show that the real average growth for the agricultural sector over the last ten years was 5.64 %. Of the 44 agricultural sub-sectors, 9 sub-sectors show a negative growth. The BCG matrix indicates one cash cow industry (sugar cane), eight dogs’(Sisal, Cotton, Tobacco, Tea, Chicory, Mohair, Fry peas, Dried fruit), fourteen stars (Fowls slaughtered, Maize, Cattle & calves slaughtered, Milk, Vegetables, Deciduous and other fruit, eggs, Citrus fruit, Wheat, Potatoes, Hay, Viticulture, Sheep and goats slaughtered, Pigs slaughtered) and twenty one problem children. Intervention by public- private sector is necessary to unlock the potential of the problem children, maintain the momentum of the stars, extent the life of the cash cow and decide on the future of the dogs/pets. 1. Problem Statement The South African agricultural sector started liberalising in 1995 (and complied by 2000) and deregulated in 1997. Jooste & Van Zyl (1999:10) explained that previous policy was focused on food self-sufficiency and agricultural subsidies. The liberalisation entails the reform of the agricultural marketing system. This trend was further enhanced by the pressures from GATT negotiations for the abolition of quantitative import controls and the introduction of tariffs. Liberalization of price controls in the food sector was one of the important aspects of marketing deregulation. The agricultural sector traditionally received differential tax treatment from the receiver, this also changed. Budgetary allocations to agriculture also declined. 1 Senior Researcher, MERC Division, National Agricultural Marketing Council 2 Senior Manager, MERC Division, National Agricultural Marketing Council and Affiliate Professor in the Department of Agricultural Economics at the University of the Free State, South Africa. 3 Professor at the Potchefstroom Business School, North-West University. Potchefstroom Campus, South Africa.
-
Upload
khangminh22 -
Category
Documents
-
view
0 -
download
0
Transcript of The Cash Cows, Dogs, Stars and Problem Children of the ...
1
The Cash Cows, Dogs, Stars and Problem Children of the South
African Agricultural Sector.
Joubert, J.C.N. 1 ; Jooste, A.2 and Lotriet R3
Abstract:
This paper investigates the development path of different agricultural sectors over the past 10
years in order to identify those sub-sectors that can contribute significantly towards reducing
poverty and increasing food security. The Boston Consulting Group (BCG) matrix was used
to analyse growth patterns for different agricultural sub-sectors and classify them as cash
cows, dogs, stars and problem children. The results show that the real average growth for the
agricultural sector over the last ten years was 5.64 %. Of the 44 agricultural sub-sectors, 9
sub-sectors show a negative growth. The BCG matrix indicates one cash cow industry (sugar
cane), eight dogs’(Sisal, Cotton, Tobacco, Tea, Chicory, Mohair, Fry peas, Dried fruit),
fourteen stars (Fowls slaughtered, Maize, Cattle & calves slaughtered, Milk, Vegetables,
Deciduous and other fruit, eggs, Citrus fruit, Wheat, Potatoes, Hay, Viticulture, Sheep and
goats slaughtered, Pigs slaughtered) and twenty one problem children. Intervention by public-
private sector is necessary to unlock the potential of the problem children, maintain the
momentum of the stars, extent the life of the cash cow and decide on the future of the
dogs/pets.
1. Problem Statement
The South African agricultural sector started liberalising in 1995 (and complied by 2000) and
deregulated in 1997. Jooste & Van Zyl (1999:10) explained that previous policy was focused
on food self-sufficiency and agricultural subsidies. The liberalisation entails the reform of the
agricultural marketing system. This trend was further enhanced by the pressures from GATT
negotiations for the abolition of quantitative import controls and the introduction of tariffs.
Liberalization of price controls in the food sector was one of the important aspects of
marketing deregulation. The agricultural sector traditionally received differential tax
treatment from the receiver, this also changed. Budgetary allocations to agriculture also
declined.
1 Senior Researcher, MERC Division, National Agricultural Marketing Council 2 Senior Manager, MERC Division, National Agricultural Marketing Council and Affiliate Professor in the Department of
Agricultural Economics at the University of the Free State, South Africa. 3 Professor at the Potchefstroom Business School, North-West University. Potchefstroom Campus, South Africa.

2
In addition to dealing with globalisation and the deregulation of domestic agricultural
markets in the 1990s, the South African farmer also had to adapt to a rapidly changing
political environment after 1994. For example, land reform, broad-based black economic
empowerment in agriculture (AgriBEE), new labour legislation, minimum wages, property
taxes and skills levies have been instituted during the last ten years.
SA farmers also face some specific challenges to remain competitive that their equals in
many other countries with more business-friendly political environments do not experience
(Ortmann, 2005). Apart from increases in production costs (seed, fertilizer,fuel) expenses
related to electricity and labour will also increase rapidly over next few years. BFAP
(2010:viii) indicated that electricity’s share of total production costs of maize under irrigation
is projected to increase from 8% in 2009 to 20% by 2015. To aggravate this micro-economic
level scenario even more, it is estimated that the HIV/AIDS prevalence rate amongst adults in
South Africa was 20.1% with up to five million people estimated to be living with HIV/AIDS
(Chaminuka et al.,2006). The smallholder agriculture sector, relying mainly on labour
because of the low levels of mechanisation, has also not been spared by the pandemic. The
government extension service has also shifted its focus from serving commercial agriculture
to advising mainly these emerging producers - with an estimated 90% of agricultural and
redistribution programmes declared a failure (Radebe, 2011:2), while the durability of water
rights for irrigation farmers has become less certain.
On a macro-economic policy level, SA has most of the “correct” World Bank approved
macro-economic policies to attract investment in place, but does not qualify for much of the
poorest countries assistance (grants and loans), despite being still in many agricultural areas a
predominantly developing country (FANRPAN, 2006). On this level the SA agrarian sector
need to undergo transformation to meet the related challenges concerning food security and
responding to the demands of climate change. Projections relating to population growth and
food consumption tendencies show that agricultural production need to increase by
approximately 70% to meet the demand levels by 2050 (FAO,2010:ii). In the country on its
own the demands are huge – SA’s economy remains one of the most inequitable in the world
(40% of national income went to the richest 10% of households), with fewer than 50% of all
working-age population are in income-generating jobs (international benchmark is almost
67% employment) (Mills, 2011:7).

3
In the ambit of this the South African agricultural sector is one of the least supported sectors
in the world as measured with the Producer Support Estimate by the Organisation for
Economic Cooperation and Development. Van der Merwe and Otto (1997) argues the
optimum allocation of agricultural resources; competitive advantages based on natural
endowments and unsubsidised markets have become important policy issues. The result of
the above is sub-sectors with diminishing growth. Despite the fact that commercial
farming has contributed significantly to the country's economic growth in the past, and that
agriculture shows the best employment ratio of 19 for every R1 million Gross Value Added
in the economy, employment by the sector reduced with 46 % from September 2003 and
commercial farming units reduced with 34 % from 1996 (NWPG, 2008). Although South
Africa is self-sufficient in terms of a net export on primary agriculture, the sector needs to
import a lot of basic foods for example poultry, beef, wheat, soya bean, oil cake, etc.
Therefore, on a macro-economic level, many questions are being asked about the
sustainability of these sectors and what must be done to ensure production, self sufficiency
and food security.
2. Objectives
This paper investigates the development path of different agricultural sectors over the past 10
years in terms of average growth and market share. The paper also categorise the South
African Agricultural sub-sectors as cash cows, dogs, stars and problem children.
3. Discussion
Agriculture, machinery and equipment, pharmaceuticals and other chemicals sectors in SA
were indicated as sectors that have the highest strategic value, with agriculture as such
identified to be one that are most suited to absorb the large pool of unskilled labour. South
Africa’s recent exports per capita are barely higher than in 1960’s and the country’s status as
a natural resource exporter does not explain this poor performance. Similar countries have all
performed much better in terms of volume, value and sophistication. One of the most
important principles in economics is that of comparative advantage which basically proposes
that every country would benefit from specializing in what it was relatively best at producing
and then in engaging in trade for everything else (Moss, 2007:16-19). It led to Paul
Samuelson who remarked that “for all its oversimplification, the theory of comparative

4
advantage provides a most important glimpse of truth.” A country that neglects this may pay
quite a price in terms of living standards and growth.
Collins & Montgomery (2005:20) explains that the Boston Consulting Group (BCG) was
responsible for the first analytical breakthrough in corporate strategy in matrix format. The
BCG-matrix describe the business position in the market – it evaluates businesses in
comparison with the competition and the market. It basically shows areas where a business
excel or drag behind. The basic assumption is that companies that is large enough to be
organized in strategic business units face the challenge of allocating resources among these
units. As a consequence this is a model for managing a portfolio of different business units
or major product lines. Within the context of farming, the improved use of climate science
data for example, can enhance planning that reduces the uncertainties generated by climate
change, improve early warning signals (drought, pests, and disease incidence) that would
increase the capacity for those involved to allocate resources more effectively and reduce
risks. Examples of collective resource management activities are the restoration of degraded
areas to improve soil quality and the improved management of water resources and
facilitation of plant genetic resources (FAO,2010: 18-22).
The BCG matrix has two important dimensions (determinants of profitability):
The growth rate, which attempted to capture the potential resource usage of a
business.
A growth rate measures the percentage change in the value of a variety of markets,
companies, or operations (a proxy for industry attractiveness). One of the factors in
evaluating whether to recommend that investors purchase, hold, or sell its shares in a
company depends on the growth rate. It is also more accurate when a comparison is done
between entities to use a growth rate (than the actual numerical value), because the size of
economies can be fastly different (Farflex: 2010). Market growth is illustrated on the vertical
axis in figure 1 and illustrates real growth of the specific sub-sector.
The second dimension is the relative market share - which is an indication of overall
strength and hence the cash generation potential. The average market share for 44
sub-sectors are presented.
The market share (a proxy for competitive advantage) per sub-sector was calculated as a
percentage of the total value of agricultural production for 2009.
5
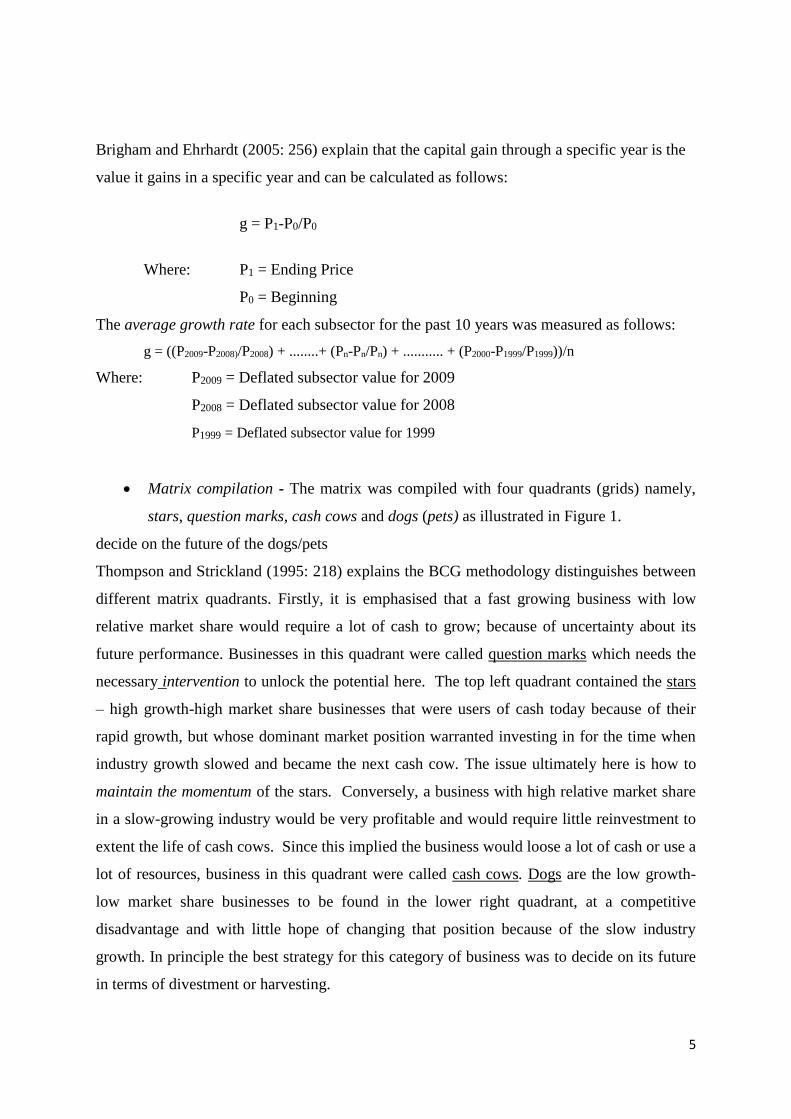
Brigham and Ehrhardt (2005: 256) explain that the capital gain through a specific year is the
value it gains in a specific year and can be calculated as follows:
g = P1-P0/P0
Where: P1 = Ending Price
P0 = Beginning
The average growth rate for each subsector for the past 10 years was measured as follows:
g = ((P2009-P2008)/P2008) + ........+ (Pn-Pn/Pn) + ........... + (P2000-P1999/P1999))/n
Where: P2009 = Deflated subsector value for 2009
P2008 = Deflated subsector value for 2008
P1999 = Deflated subsector value for 1999
Matrix compilation - The matrix was compiled with four quadrants (grids) namely,
stars, question marks, cash cows and dogs (pets) as illustrated in Figure 1.
decide on the future of the dogs/pets
Thompson and Strickland (1995: 218) explains the BCG methodology distinguishes between
different matrix quadrants. Firstly, it is emphasised that a fast growing business with low
relative market share would require a lot of cash to grow; because of uncertainty about its
future performance. Businesses in this quadrant were called question marks which needs the
necessary intervention to unlock the potential here. The top left quadrant contained the stars
– high growth-high market share businesses that were users of cash today because of their
rapid growth, but whose dominant market position warranted investing in for the time when
industry growth slowed and became the next cash cow. The issue ultimately here is how to
maintain the momentum of the stars. Conversely, a business with high relative market share
in a slow-growing industry would be very profitable and would require little reinvestment to
extent the life of cash cows. Since this implied the business would loose a lot of cash or use a
lot of resources, business in this quadrant were called cash cows. Dogs are the low growth-
low market share businesses to be found in the lower right quadrant, at a competitive
disadvantage and with little hope of changing that position because of the slow industry
growth. In principle the best strategy for this category of business was to decide on its future
in terms of divestment or harvesting.

6
Figure 1: The Boston Consulting Group Matrix
(Source: Own calculation based literature from Thompson & Strickland, 1995)
4. Results
The agricultural industry is basically divided into three sectors namely: field crops,
horticulture and animal production. Figure 2 illustrate that the volume of agricultural
production for 2008/9 was 0,7% higher that the previous year. The volume of field crop
production reflected a 2,4% decrease as a result of a decline in the production of summer
grains (especially maize) (DAFF,2010:10). Winter grains and oil seeds however, showed
increases. Horticultural production increased by 1,3% with animal production showing an
increase of 2,7% mainly because of increases of 3,7% in poultry products (meat and eggs);
3,3% in fresh milk production, 3% in stock slaughtered and 2,1% in pastoral products (wool,
mohair, karakul pelts and ostrich feathers).
Figure 2: Volume of agricultural production (2004-2009) (DAFF,2010:10):

7
The production of field crops is expected to decline because profit margins have closed down
with the increasing input costs. The challenge for future agricultural production in South
Africa is to increase the overall efficiency, resilience, adaptive capacity and mitigation
potential of the sector through its various components. This includes soil and nutrient
management; improved water harvesting and retention and water-use efficiency through
irrigation systems; evidence of crops showing more lack of resistance to disease such as the
wheat disease Spot Blotch requires collaborative pest and disease control; increased provision
of ecosystem services like controls of pests and diseases, decompositions of waste; the
preservation of genetic resources in developing improved resilience to shocks. With more
complex and longer supply chains it is becoming more important to increase the operational
efficiency of processing, packaging, storage and transport to ensure improved shelf life,
sufficient quality and to reduce carbon footprints (FAO,2010: i-5).
The average growth for the last 10 years and markets share for the 2009 production season is
illustrated in Table 1.
Table 1: Agricultural sector division, growth rate and market share
Agricultural Sectors Average growth rate Market Share
Field crops 6.65% 27.97%
Horticulture 4.58% 24.84%
Animal productions 7.00% 47.19%
(Source: Own calculation from data from DAFF 2010).
8
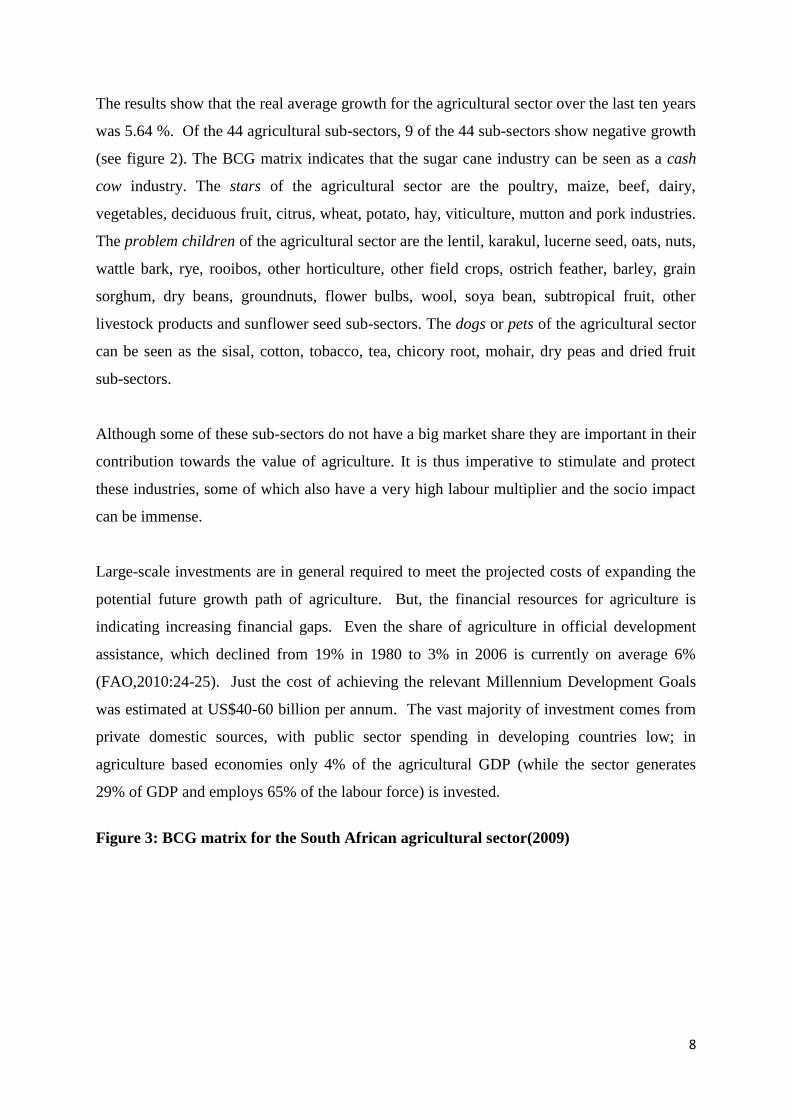
The results show that the real average growth for the agricultural sector over the last ten years
was 5.64 %. Of the 44 agricultural sub-sectors, 9 of the 44 sub-sectors show negative growth
(see figure 2). The BCG matrix indicates that the sugar cane industry can be seen as a cash
cow industry. The stars of the agricultural sector are the poultry, maize, beef, dairy,
vegetables, deciduous fruit, citrus, wheat, potato, hay, viticulture, mutton and pork industries.
The problem children of the agricultural sector are the lentil, karakul, lucerne seed, oats, nuts,
wattle bark, rye, rooibos, other horticulture, other field crops, ostrich feather, barley, grain
sorghum, dry beans, groundnuts, flower bulbs, wool, soya bean, subtropical fruit, other
livestock products and sunflower seed sub-sectors. The dogs or pets of the agricultural sector
can be seen as the sisal, cotton, tobacco, tea, chicory root, mohair, dry peas and dried fruit
sub-sectors.
Although some of these sub-sectors do not have a big market share they are important in their
contribution towards the value of agriculture. It is thus imperative to stimulate and protect
these industries, some of which also have a very high labour multiplier and the socio impact
can be immense.
Large-scale investments are in general required to meet the projected costs of expanding the
potential future growth path of agriculture. But, the financial resources for agriculture is
indicating increasing financial gaps. Even the share of agriculture in official development
assistance, which declined from 19% in 1980 to 3% in 2006 is currently on average 6%
(FAO,2010:24-25). Just the cost of achieving the relevant Millennium Development Goals
was estimated at US$40-60 billion per annum. The vast majority of investment comes from
private domestic sources, with public sector spending in developing countries low; in
agriculture based economies only 4% of the agricultural GDP (while the sector generates
29% of GDP and employs 65% of the labour force) is invested.
Figure 3: BCG matrix for the South African agricultural sector(2009)

9
(Source: Own calculation based on data from DAFF, 2009.)
There seems to be a lack of consensus on the strategic role of SA agriculture in the future
economic growth plans if the New Growth Path of the Economic Development Minister (to
reduce unemployment to 15% in 10 years), the Planning Commission’s Strategic Plan for SA;
the IPAP2 in connection with the creation of export markets and the union’s SA growth
plans’ programmes are considered (Radebe,2011:2). It is a serious challenge for the state to
deal with the problems of poverty and food insecurity (more than 20% have inadequate
access to food) through the means of agricultural development (Mkokeli & Shoba,2011:1).
It should also be recognised that the agricultural sector has large multiplier effects
(SACOB,2007) with large forward and backward production, and consumer demand
linkages. Agricultural growth multipliers generally vary from around 1.5 to 2.0 and are 3
times as large as those for non-agricultural growth according to the findings of the Harvard
Group (Hausmann & Klinger as cited in SACOB, 2007).
5. Conclusion

10
It is evident that certain important sub-sectors struggle to perform and are likely to diminish
even further if intervention does not take place. For example the effect of policy on the
cotton industry resulted in a decreasing area planted from 90 000 hectares in 1995 to 7 000
hectares in 2009. The tobacco industry was similarly affected with the area planted under
tobacco decreased from 15 600 hectares in 2000 to 4 000 hectares in 2009. The current
surplus has enabled the maize industry to export a portion of its surplus of 4 million tonne.
The government intervened here by finding markets (buyers) for about 100 000 tonnes of
maize in Saudi Arabia and India (Blom, 2011:38), this after the Competition Commission
prevented maize farmers from pooling the surplus for export purposes (to maintain food
security and keep food prices under control).
Different farming systems provide opportunities for increasing overall production and
economic resilience of farmers (FAO,2010: 15). An integrated systemic approach are not
frequently implemented due to a lack of technical and institutional capacity and of policy
support. Research into a more diversified and integrated food-energy systemic approach is
necessary – for example integrating crop and livestock systems (FAO,2010). The waste
products of one component (manure) serve as an input resource for the other (crop production
or crop residues and by-products are used as animal feeds).
Classifying the position of the sub-sectors in the BCG matrix, must give way to decisions
regarding what to do with them (Tutor2U, 2011) - sub-sectors can move from problem
children to stars if the necessary support and action plans can be implemented to make them
more competitive. A main concern regarding sub-sectors is competitiveness. Studies on
competitiveness often err by only considering the output side of the agribusiness system
(from farm to table) and thereby ignoring the possible impact the input sector could have on
the competitiveness of the agricultural industry. Relating to the strategic matrix positioning
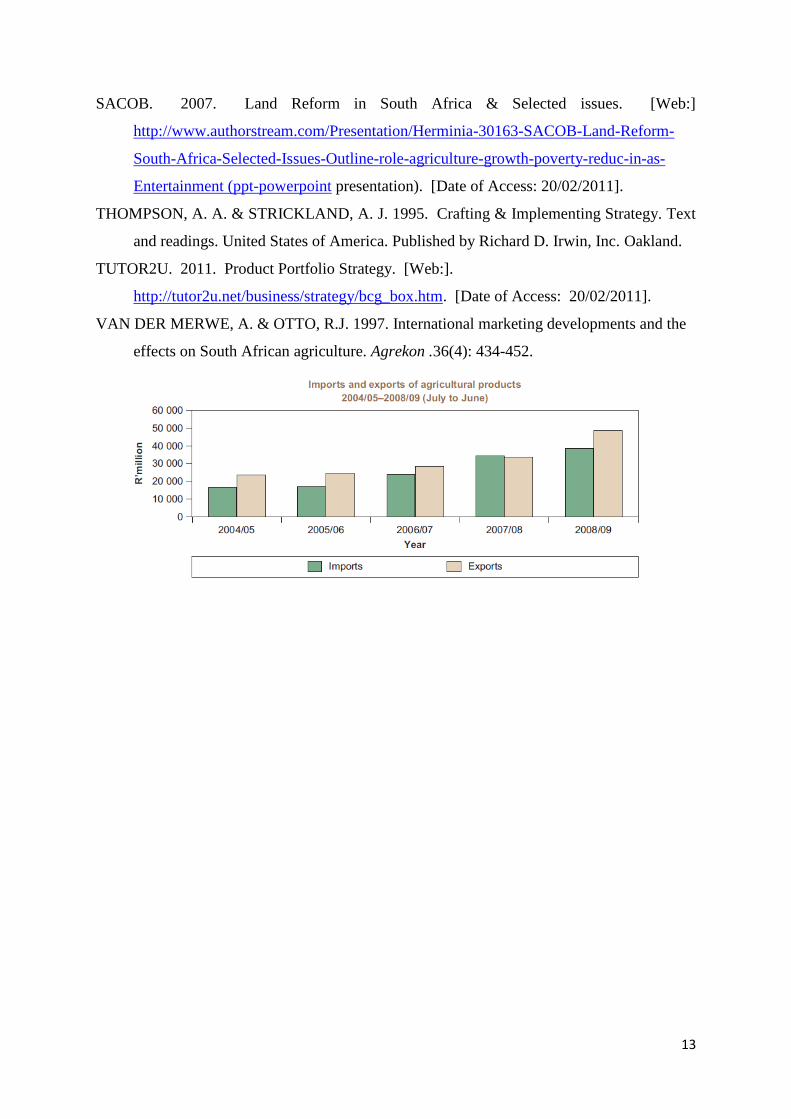
and the balance of trade for agricultural products it is projected for example that imports of
food staples, meat and diary products will increase and exports will decrease by 2019. The
opposite trend is projected for wine, fruits and some oilseeds where the increase in the value
of exports is projected to outpace the increase in imports (BFAP,2010). Consequently, it
challenges these sub-sectors to strategically position themselves according to the trend line
and ultimately create and think “chain reaction” (Esterhuizen et al: 2001).
The exhibition of different levels of vulnerability in the different sub-sectors as indicated by
the BCG matrix, show a real need for collaboration and differentiated policy responses that
11
target differentiated needs. The government should rather ensure an enabling environment
for the sector through partnerships that enable knowledge management and transference and
policy actions to perform competitively through private initiative. This strategic positioning
is not an isolated research project – it needs to serve as a basis for further research into the
different sub-sectors to understand the drivers in the value chain to pro-actively react to
ensure sustainability. There are many sub-sectors in the SA context that due to lack of
aspects such as finances, resources, knowledge, and capacity are functioning well below the
potential yield that could be achieved. One of the important issues is the adaptability to
climate smart production – i.e transitioning to a high production, intensified, resilient,
sustainable, and low emission agriculture.
The BCG matrix may serve as a starting point of discussing resource allocation among the
various agribusinesses and markets. After all, food security is a function of production levels
and the ability to earn income and allocate that income towards expenditure. The South
African economy needs a much more aligned and ambitious strategy in a largely
underdeveloped agricultural potential.
References
BFAP see Bureau for Food and Agricultural Policy
BUREAU for FOOD and AGRICULTURAL POLICY. 2010. The South African
Agricultural Baseline. BFAP: Pretoria.
BRIGHAM, E. F. & EHRHARDT, M.C. 2005. Financial Management Theory and Practice.
Ohio: R.R. Donnelley Willard.
CHAMINUKA, P., ANIM, P., DEBUSHO, L.K & NQANGWENI, S. 2006. The Impact of
HIV & Aids on Agriculture and Food Security. The Case of Limpopo Province in South
Africa. (FANRPAN Working Document: Series Ref. Number: NAT SAA005. Prepared for
FANRPAN by authors). [Web:].
http://www.fanrpan.org/documents/d00150/Agriculture_Aids_SA_2006.pdf. [Date of
Access: 15/02/2011].
COLLINS, D. J. & MONTGOMERY, C. A. 2005. Corporate Strategy. A Resource-Based
Approach. New York McGraw-Hill/Irwin.
DEPARTMENT OF AGRICULTURE, FORESTRY and FISHERIES see DAFF
DAFF, 2009. Abstract for Agricultural Statistics. Pretoria: Department of Agriculture
Forestry and Fishery.
12
DAFF. 2010. Srategic Plan For The Department of Agriculture, Forestry and Fisheries
2010/2011. DAFF: Pretoria. ISBN:978-1-86871-308-0.
FOOD and AGRICULTURAL ORGANIZATION of the UNITED NATIONS see FAO
FAO. 2010.Climate Smart Agriculture. Italy: Rome. 41p. (Paper at the Hague Conference
on Agriculture, Food security and Climate Change. 31 October to 5 November. 2010.)
HAUSMANN, R & KLINGER, B. 2006. South Africa’s Export Predicament. [Web:].
http://www.cid.harvard.edu/cidwp/pdf/129.pdf. [Date of Access: 15/02/2011].
CID Working Paper No. 129. 50 years of abysmal export performance:
ESTERHUIZEN, D, VAN ROOYEN, C.J., DOYER, O.T., 2001. How competitive is the
South African Agricultural industry? Production, processing and inputs. A report by
the Agricultural Business Chamber, ABSA Chair in Agribusiness Management,
University of Pretoria and the Agricultural Research Council. Pretoria. Agricultural
Business Chamber.
FARFLEX. 2010. The Free Dictionary. Growth Rate. Available from: http://financial-
dictionary.thefreedictionary.com/CAGR/ (Accessed 3 July 2010).
MKOKELI, S & SHOBA, S. 2011. Zuma turns to state to generate more jobs. Business
Day: 1. January. 10.
MILLS, G. 2011. New, new growth path will only survive on political will. Sunday Times
Review: 7. January. 30.
MOSS, D.A. 2007. A Concise Guide to Macro-Economics. Harvard Business School
Press:Massachusetts. 189p.
North-West Provincial Government see NWPG
NWPG. 2008. Environment Outlook. [Web:] 2008.
http://www.nwpg.gov.za/Agriculture/NW_ENVIRONMENTAL_OUTLOOK/chapter.a
sp?CHAPTER=3&PAGE=4&TITLE=Conclusion. [Date of Access: 15/02/2011].
ORGANISATION FOR ECONOMIC CO-OPERATION AND DEVELOPMENT (OECD).
2006. Review of Agricultural Policies: South Africa. Paris: OECD.
ORTMANN. G.F. 2005. Promoting the competitiveness of South African agriculture in a
dynamic economic and political environment. Agrekon, 44(3). September.
RADEBE, H. 2010. State failing to assist emerging farmers. Business Day: 2. November.
17.
QUICKMBA.COM. (2010). BCG Growth-Share Matrix Available from:
http://www.quickmba.com/strategy/matrix/bcg/ (Accessed 3 July 2010).
RADEBE, H. 2011. Agricultural sector left in the lurch. Business Day: 2. January. 1.
13
SACOB. 2007. Land Reform in South Africa & Selected issues. [Web:]
http://www.authorstream.com/Presentation/Herminia-30163-SACOB-Land-Reform-
South-Africa-Selected-Issues-Outline-role-agriculture-growth-poverty-reduc-in-as-
Entertainment (ppt-powerpoint presentation). [Date of Access: 20/02/2011].
THOMPSON, A. A. & STRICKLAND, A. J. 1995. Crafting & Implementing Strategy. Text
and readings. United States of America. Published by Richard D. Irwin, Inc. Oakland.
TUTOR2U. 2011. Product Portfolio Strategy. [Web:].
http://tutor2u.net/business/strategy/bcg_box.htm. [Date of Access: 20/02/2011].
VAN DER MERWE, A. & OTTO, R.J. 1997. International marketing developments and the
effects on South African agriculture. Agrekon .36(4): 434-452.