Effect of long-term muscle paralysis on human single fiber mechanics
11
102:340-349, 2007. First published Oct 12, 2006; doi:10.1152/japplphysiol.00609.2006 J Appl Physiol and Daniel Theisen Laurent Malisoux, Cécile Jamart, Krystel Delplace, Henri Nielens, Marc Francaux fiber mechanics Effect of long-term muscle paralysis on human single You might find this additional information useful... 30 articles, 19 of which you can access free at: This article cites http://jap.physiology.org/cgi/content/full/102/1/340#BIBL including high-resolution figures, can be found at: Updated information and services http://jap.physiology.org/cgi/content/full/102/1/340 can be found at: Journal of Applied Physiology about Additional material and information http://www.the-aps.org/publications/jappl This information is current as of January 17, 2007 . http://www.the-aps.org/. ISSN: 8750-7587, ESSN: 1522-1601. Visit our website at Physiological Society, 9650 Rockville Pike, Bethesda MD 20814-3991. Copyright © 2005 by the American Physiological Society. those papers emphasizing adaptive and integrative mechanisms. It is published 12 times a year (monthly) by the American publishes original papers that deal with diverse areas of research in applied physiology, especially Journal of Applied Physiology on January 17, 2007 jap.physiology.org Downloaded from
Transcript of Effect of long-term muscle paralysis on human single fiber mechanics

102:340-349, 2007. First published Oct 12, 2006; doi:10.1152/japplphysiol.00609.2006 J Appl Physioland Daniel Theisen Laurent Malisoux, Cécile Jamart, Krystel Delplace, Henri Nielens, Marc Francauxfiber mechanics Effect of long-term muscle paralysis on human single
You might find this additional information useful...
30 articles, 19 of which you can access free at: This article cites http://jap.physiology.org/cgi/content/full/102/1/340#BIBL
including high-resolution figures, can be found at: Updated information and services http://jap.physiology.org/cgi/content/full/102/1/340
can be found at: Journal of Applied Physiologyabout Additional material and information http://www.the-aps.org/publications/jappl
This information is current as of January 17, 2007 .
http://www.the-aps.org/.ISSN: 8750-7587, ESSN: 1522-1601. Visit our website at Physiological Society, 9650 Rockville Pike, Bethesda MD 20814-3991. Copyright © 2005 by the American Physiological Society.those papers emphasizing adaptive and integrative mechanisms. It is published 12 times a year (monthly) by the American
publishes original papers that deal with diverse areas of research in applied physiology, especiallyJournal of Applied Physiology
on January 17, 2007 jap.physiology.org
Dow
nloaded from
Effect of long-term muscle paralysis on human single fiber mechanics
Laurent Malisoux, Cecile Jamart, Krystel Delplace, Henri Nielens, Marc Francaux, and Daniel TheisenInstitut d’Education Physique et de Readaptation, Faculte de Medecine,Universite Catholique de Louvain, Louvain-la-Neuve, Belgium
Submitted 1 June 2006; accepted in final form 3 October 2006
Malisoux L, Jamart C, Delplace K, Nielens H, Francaux M,Theisen D. Effect of long-term muscle paralysis on human singlefiber mechanics. J Appl Physiol 102: 340–349, 2007. First publishedOctober 12, 2006; doi:10.1152/japplphysiol.00609.2006.—This studycompared human muscles following long-term reduced neuromuscu-lar activity to those with normal functioning regarding single fiberproperties. Biopsies were obtained from the vastus lateralis of 5individuals with chronic (�3 yr) spinal cord injury (SCI) and 10able-bodied controls (CTRL). Chemically skinned fibers were testedfor active and passive mechanical characteristics and subsequentlyclassified according to myosin heavy chain (MHC) content. SCIindividuals had smaller proportions of type I (11 � 7 vs. 34 � 5%)and IIa fibers (11 � 6 vs. 31 � 5%), whereas type IIx fibers were morefrequent (40 � 13 vs. 7 � 3%) compared with CTRL subjects (P �0.05). Cross-sectional area and peak force were similar in both groupsfor all fiber types. Unloaded shortening velocity of fibers fromparalyzed muscles was higher in type IIa, IIa/IIx, and IIx fibers (26,65, and 47%, respectively; P � 0.01). Consequently, absolute peakpower was greater in type IIa (46%; P � 0.05) and IIa/IIx fibers(118%; P � 0.01) of the SCI group, whereas normalized peak powerwas higher in type IIa/IIx fibers (71%; P � 0.001). Ca2� sensitivityand passive fiber characteristics were not different between the twogroups in any fiber type. Composite values (average value across allfibers analyzed within each study participant) showed similar resultsfor cross-sectional area and peak force, whereas maximal contractionvelocity and fiber power were more than 100% greater in SCIindividuals. These data illustrate that contractile performance is pre-served or even higher in the remaining fibers of human musclesfollowing reduced neuromuscular activity.
chemically skinned fibers; unloaded shortening velocity; fiber power;passive tension; spinal cord injury
MUSCLE UNLOADING OCCURS in a variety of conditions, such asimmobilization, disease, paralysis, or exposure to micrograv-ity. The absence of normal weight-bearing activity induces arapid decrease in muscle mass and strength, especially ofantigravity muscles (1, 25). Muscle atrophy induced by un-loading is associated with several structural changes, such asmodifications of the myosin heavy chain (MHC) isoformexpression, inducing fiber-type transitions toward a higherproportion of fast type II fibers. Experiments based on singlefiber models have demonstrated great sensitivity in detectingalso a certain degree of functional variability of fibers express-ing the same MHC isoforms, especially when the pattern ofmuscle activity changes. Human studies involving 17 days ofbed rest (27, 28) or spaceflight (26) revealed that maximalsingle fiber force (P0) from the soleus muscle was decreased,mainly as a result of a decline in fiber cross-sectional area(CSA), and that maximal unloaded shortening velocity (V0)
was increased. Consequently, single fiber power was eithermaintained or depressed, depending on the study participant orfiber type (29), with fibers expressing type I MHC beinggenerally more affected. Muscle unloading up to 4 mo in along-term bed-rest study induced a similar pattern of adapta-tion in the functional properties of type I fibers from the soleusmuscle (31), with changes seemingly proportional to the dura-tion of unloading.
Lower limb muscle paralysis as a consequence of spinal cordinjury (SCI) is a typical situation of severe, long-term muscledisuse. However, it differs from spaceflight or bed-rest models,since the muscles concerned are not only unloaded, but theirneuromuscular activity is also chronically reduced or elimi-nated. SCI has been shown to induce a pronounced loss of legmuscle mass, reduced oxidative capacity, and alterations in themicrovasculature (21, 22). Muscle atrophy is the result of areduction of the fiber CSA (hypotrophy) and a loss of musclefibers (hypoplasia) (13). Additionally, this atrophy is accom-panied by a relative increase of perimysial tissue (15, 16).Paralyzed muscles display a fiber-type transition toward apredominance of type II fibers (16, 21), and this process seemsto be proportional to the duration of the lesion within the first2 yr posttrauma (4). The modification of fiber-type composi-tion results not only from a loss of type I fibers but also froma progressive conversion of MHC I expression toward MHCIIx expression, which is believed to be the default MHCisoform in humans (12, 19). As a consequence of these phe-notypic changes, electrically stimulated lower limb musclesfrom individuals with SCI have been demonstrated to developlower isometric force and to have faster contractile propertiesand greater fatigability (11). More recently, the dynamic me-chanical properties of whole muscles were investigated after along-term spinal cord transection on rat soleus muscle (23).Despite a great loss of maximal force, whole muscle maximalpower output was conserved as a result of an increased max-imal shortening velocity. It should be noted that whole musclefunctional characteristics could be largely influenced by thefiber-type transition following paralysis. Therefore, the singlefiber model associated with post hoc fiber-type identificationallows for a more in depth analysis of muscle contractilefunction.
The purpose of this study was to characterize the contractileproperties of chemically skinned quadriceps fibers of individ-uals with chronic SCI and to compare them to those ofable-bodied control subjects. Given the results from previousshort-term unloading studies, we specifically hypothesizedthat, in individuals with SCI, single fiber CSA, P0, power, andCa2� sensitivity would be decreased and that V0 would be
Address for reprint requests and other correspondence: D. Theisen, 1, placeP. de Coubertin, B-1348 Louvain-La-Neuve, Belgium (e-mail: [email protected]).
The costs of publication of this article were defrayed in part by the paymentof page charges. The article must therefore be hereby marked “advertisement”in accordance with 18 U.S.C. Section 1734 solely to indicate this fact.
J Appl Physiol 102: 340–349, 2007.First published October 12, 2006; doi:10.1152/japplphysiol.00609.2006.
8750-7587/07 $8.00 Copyright © 2007 the American Physiological Society http://www. jap.org340
on January 17, 2007 jap.physiology.org
Dow
nloaded from

increased. Furthermore, we tested the hypothesis that passivefiber properties would be altered after several years of muscledisuse.
MATERIALS AND METHODS
Subjects
Ten able-bodied men (CTRL; age 26 � 2 yr, height 180 � 3 cm,body mass 73 � 5 kg; mean � SE) and five men with SCI (age 33 �5 yr, height 181 � 1 cm, body mass 93 � 8 kg) volunteered toparticipate in this investigation. The CTRL subjects were all recre-ationally active for a mean of 2.6 � 0.5 h/wk. The SCI subjects werenot able to stand or walk and had all been permanent wheelchair usersfor a minimum of 3 yr (15 � 5 yr). Two SCI participants (subjects SCI3 and SCI 4; time since injury 28 and 3 yr, respectively) had motorincomplete lesions (level L1 and L4/5, respectively) and were able tohave voluntary although not functionally useful contractions of theirquadriceps muscles. Subjects SCI 1, SCI 2, and SCI 5 had a completemotor paralysis as a consequence of C7, D7/8, or C7 lesions, respec-tively (time since injury 17, 24, and 5 yr, respectively). All partici-pants were informed of the risks associated with the investigation andprovided written, informed consent. The protocol of this study hadbeen previously approved by the Faculty Ethical Review Committeeand complied with the principles of the Declaration of Helsinki.
Muscle Biopsies
A muscle sample was obtained from the vastus lateralis of the rightleg using the needle biopsy technique with suction. Control subjectswere asked to refrain from intense physical activities 3 days before thesample extraction to minimize the possibility of studying damagedfibers. Muscle samples were immediately placed in cold (0°C) skin-ning solutions (cf. composition below) and sectioned longitudinally insmall bundles of fibers. The bundles were stored in regularly replacedskinning solution at �20°C for at least 5 days before the firstexperiment.
Skinning, Activating, and Relaxing Solutions
The skinning solution contained (in mM) 125 propionic acid, 2.0EGTA, 1 MgCl2, 4.0 ATP, 20 imidazol (pH 7.0), 50% (vol/vol)glycerol and protease inhibitors: 0.5 mM PMSF and 20 �g/ml leu-peptin. The composition of the relaxing (pCa 9.0; pCa � �log[Ca2�]) and the activating solutions (pCa 4.5) were based on calcu-lations using an iterative computer program described by Fabiato andFabiato (6), with apparent stability constants adjusted for temperature,pH, and ionic strength. Both solutions contained (in mM) 7.0 EGTA,20 imidazol, 14.5 creatine phosphate, 1.0 free Mg2�, and 4.0 MgATP.Calcium was added as CaCl2, ATP was added as a dissodium salt, andMg2� was added in the form of MgCl2 with a specified free concen-tration of 1 mM. In both solutions, pH was adjusted to 7.0 with KOHand total ionic strength to 180 mM with KCl. Submaximal activatingsolutions were prepared by mixing appropriate volumes of activatingand relaxing solutions to obtain a series of different free Ca2�
concentrations ranging from pCa 4.7 to pCa 6.4.
Single Fiber Dynamic Force Measuring Setup
Single muscle fibers were subjected to a series of mechanical testswithin a time span of 4–5 wk following the muscle biopsy, but not allexperiments were performed on all fibers. In a first series of tests,single fiber segments were evaluated either for P0, V0, and force-velocity relationships or for passive tension characteristics. Theseexperiments were performed on a dynamic force measuring setup,allowing for both controlled fiber length changes and force measure-ments. On the day of an experiment, a muscle fiber segment of �3mm was isolated from the bundle in the relaxing solution and thepreparation was mounted between a force transducer (model 400A,
Aurora Scientific) and the arm of a high-speed motor (model 312B,Aurora Scientific) as described by Moss (17). The motor was operatedeither in length (slack tests and passive stretch tests) or in force mode(isotonic contractions) via a high-speed digital controller (model600A, Aurora Scientific) consisting of an electronic interface, a 16-bitanalog-to-digital converter and custom software. Output signals fromthe motor and the force were recorded by the controller, and collecteddata were analyzed offline using custom-made software written in ourlaboratory (LabView, National Instruments). The setup was built overthe stage of an inverted microscope (Axiovert 25C, Zeiss) so that thefiber could be viewed with a magnification of 400 and could berapidly transferred between wells of a Teflon plate, containing eitherthe relaxing or the maximally activating solution. To perform all theexperiments at 15°C, the microscope stage was cooled using abath/circulation thermostat (Ecoline RE 106, Lauda). The temperatureof the solutions was controlled by a thermocouple inserted into one ofthe wells.
Single fiber dimensions. Once sarcomere length was adjusted to 2.5�m (20) by means of a calibrated eyepiece micrometer (400), apicture of the fiber was obtained using a digital camera (CamediaC3020 Z, Olympus) connected to the microscope while the segmentwas briefly suspended in the air (�5 s). Assuming that the fiber takesa circular shape, the CSA was determined as the mean of threediameter measurements along the fiber segment on the calibrateddigital picture. Fiber length (FL) was measured on a second picturerecorded with a magnification of 50 and defined as the distancebetween the two fixation ends.
Single fiber P0. Fiber contraction was induced by rapidly transfer-ring the fiber from relaxing into activating solution. Peak activatedforce (P0, mN) was determined as the stable maximal force developedby the fiber while submerged in activating solution (pCa 4.5). Peakspecific tension (kN �m�2) was defined as P0/CSA.
Single fiber V0. Unloaded shortening velocity (V0) was measuredby the slack test method (5-kHz sampling rate). The fiber was fullyactivated in the pCa 4.5 solution. Once peak isometric force wasreached, the fiber was rapidly released so that the force dropped tozero and redeveloped after a time lapse proportional to the step length(of Fig. 1A, inset). The fiber was then transferred back into the pCa 9.0solution and slowly reextended to its original length. Four to sixdifferent length steps were applied on each fiber, all being �20% ofinitial fiber length. The relationship between the time required forforce redevelopment and the step length (Fig. 1A) was fit for each fiberwith a first-order least squares regression line, the slope of whichcorresponds to V0 of the fiber. V0 was expressed in fiber lengths (FL)per second to account for differences in the number of sarcomeres inseries between different fiber preparations.
Single fiber force-velocity relationship. Fiber shortening velocitywas measured during isotonic contractions performed at differentloads (5-kHz sampling rate). After full activation with pCa 4.5solution, the fiber was subjected to three successive isotonic loadclamps (Fig. 1B, inset). Each step was 150 ms in duration forslow-twitch fibers and 100 ms in duration for fast-twitch fibers.Shorter time intervals were required for the faster contracting fibers tolimit the total distance shortened to �20% of initial fiber length.Shortening velocity and force were measured over the final third ofthe step (50–30 ms), when the force was constant and the fibershortening velocity linear. The third isotonic clamp was followed bya length step to slacken the segment to 80% of initial fiber length. Thefiber was then relaxed in the pCa 9.0 solution and slowly reextendedto its original length. This procedure was repeated 5–6 times atdifferent loads so that each fiber was submitted to a total of 15–18isotonic contractions. All shortening velocities were normalized withrespect to initial fiber length and expressed as fiber lengths per second.The data obtained on a single fiber were fitted using an iterativenonlinear curve-fitting procedure (Marquardt-Levenberg algorithm)based on the following Hill equation: (P � a)(V � b) � (P0 � a)b,where P is force, V is velocity, P0 is peak isometric force developed
341LONG-TERM MUSCLE PARALYSIS AND SINGLE FIBER MECHANICS
J Appl Physiol • VOL 102 • JANUARY 2007 • www.jap.org
on January 17, 2007 jap.physiology.org
Dow
nloaded from

after full activation with pCa 4.5 solution, and the constants a and bhave the dimension of force and velocity, respectively (Fig. 1B). Thefitting procedure yields values for a and b, which allows calculation ofmaximal V (Vmax). Only individual experiments for which this rela-tionship yielded a value for r2 of �0.98 were retained for furtherprocessing. Fiber power was determined based on the parameters ofthe fitted force-velocity relationship (P0 and Vmax). Absolute power(�N �FL�s�1) was calculated as the product of force and contractionvelocity, and normalized power (W/l) was defined as the product ofspecific tension and contraction velocity. Average curves from CTRLand SCI groups were determined based on individual power-velocityrelationships of single fibers.
Passive tension measurement. Passive fiber characteristics wereevaluated in a separate pool of samples from the five SCI participantsand five CTRL subjects. These fibers were tested with a progressivestretch-release protocol while remaining in the pCa 9.0 solution usingthe same ergometer as described above (10-Hz sampling rate). Thefiber was first slackened from the initial fiber length to 76% and then
progressively stretched to 140% in successive steps of 8% of initialfiber length (Fig. 2, inset), thus covering an assumed range ofsarcomere lengths of 1.90–3.50 �m. Each step was reached within10 s, followed by a period of 3 min of constant fiber length. Passiveforce progressively declined toward a plateau after the rapid increaseinduced by the stretch. Following the step at 140% of initial fiberlength, the fiber was progressively relaxed using similar time con-straints (Fig. 2, inset). Passive tension (kN/m2) was defined as theCSA-normalized force recorded at the end of each step, expressed asthe change compared with the value recorded at 76% of initial fibersegment length. For each experiment, passive tension was expressedas a function of fiber strain, evaluated as the ratio of fiber length fora given stretch (mm) divided by fiber length at 76% of initial length(mm) minus one. The ascending limb of the passive tension-fiberstrain relationship was analyzed using the equation Y � E �X2, whereX is the fiber strain and E (kN/m2) represents complex Young’smodulus reflecting the steepness of the curve and thus the stiffness ofthe fiber (24). Only individual experiments for which this relationshipyielded a r2 of �0.98 were included for further analyses. To assessvisco-elastic properties of the fiber, hysteresis (kN/m2) was calculatedas the area between the ascending and the descending limb of thepassive tension-fiber strain relationship (Fig. 2).
Isometric Force Measuring Setup
In addition to the previously described mechanical tests, singlefiber Ca2� sensitivity was evaluated on samples of four SCI and fourCTRL subjects. Due to the time constraints related to this study, theseexperiments were performed on a different setup than the one de-scribed above.
Single fiber preparation. After isolation of a single fiber segment(approximate length of 3.5 mm) in ice-cooled relaxing solution, thepreparation was attached to an isometric force-measuring setup usingtwo aluminium T clips carefully folded over the fiber ends. The outputsignal from the force transducer (sensitivity 29.41 mV/mN) wasamplified and recorded (200-Hz sampling rate) using a Lab-PC�12-bit digitizer (National Instrument) for later offline analysis. Fiberlength was adjusted so as to yield a sarcomere length of 2.5 �m, asevaluated by laser diffraction. A Peltier element was fitted underneaththe experimental wells and maintained the experimental solutions at aconstant temperature of 15°C throughout the tests.
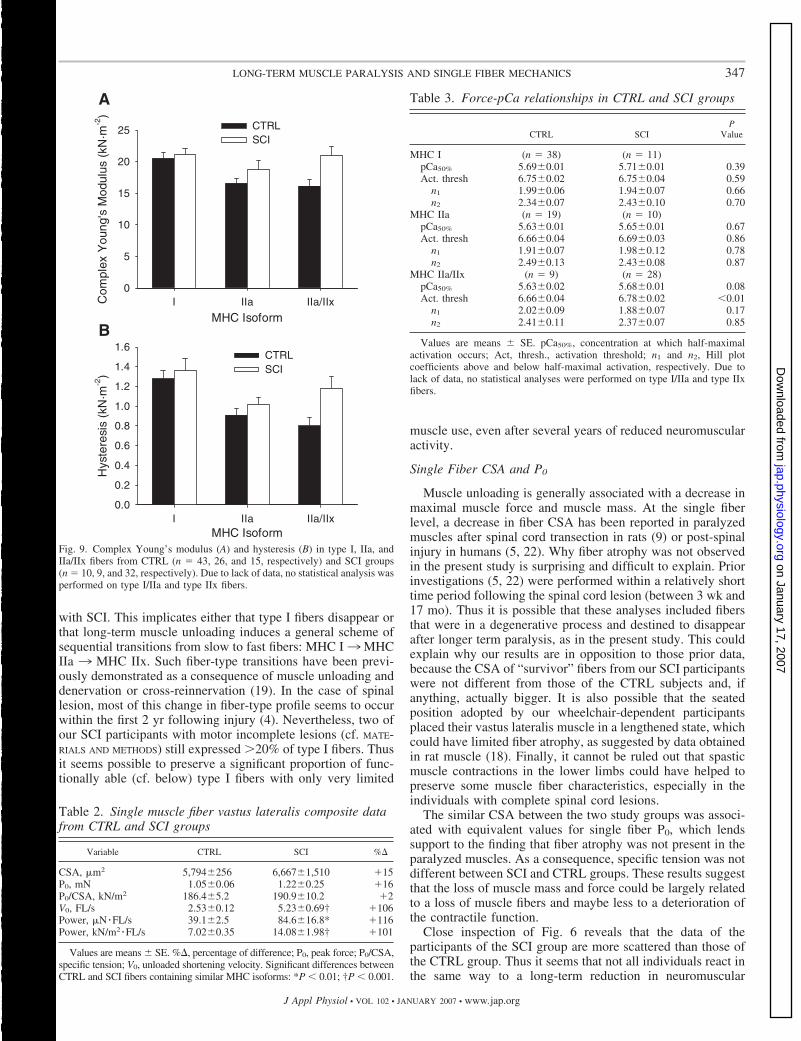
Fig. 2. Progressive passive stretch experiments. The fiber was progressivelystretched from 76 to 140% of initial fiber length (sarcomere length of 2.5 �m)and then released again to 76%, using a step length of 8% of initial fiber lengthand a step duration of 3 min (inset). Passive tension was taken as the forcerecorded at the end of each step divided by fiber cross-sectional area andexpressed as the change compared with the value at 76% of initial fiber length.Fiber strain was defined as any given FL divided by FL at 76% of initial lengthminus 1. The ascending limb of the passive tension-fiber strain relationship (E)was used to determine complex Young’s modulus (E) according to Y � E �X2
(solid line). The data displayed were acquired from a fiber containing type IMHC.
Fig. 1. Representative example of slack test experiments (A) and isotoniccontractions experiment (B) in slow [myosin heavy chain (MHC) type I; F] andfast (MHC type IIa; E) single fibers. Superimposed position and force recordsof 2 slack tests performed on the same single fiber are illustrated in the bottomright portion of A. When maximal peak force was reached, the fiber wassubjected to a rapid shortening of various steps, in this case 8 and 20% of initialfiber length. Four to six different length steps are plotted against the respectiveduration of unloaded shortening of the fiber. Fiber maximal shortening velocitywas determined as the slope of the least squares linear regression andexpressed as fiber length (FL)/s. FL and force records of an isotonic contrac-tion experiment are illustrated in the top right portion of B. After maximalactivation, the fiber was subjected to 3 successive load clamps of 100- to150-ms duration. Velocity and force were evaluated over the last 50 ms of eachstep. The data points of 6 isotonic contraction experiments from the same fiberwere fit with the Hill equation.
342 LONG-TERM MUSCLE PARALYSIS AND SINGLE FIBER MECHANICS
J Appl Physiol • VOL 102 • JANUARY 2007 • www.jap.org
on January 17, 2007 jap.physiology.org
Dow
nloaded from

Protocol for isometric force measurements. During the experiment,the fiber was successively activated, either maximally (pCa 4.5solution) or submaximally (pCa between 4.7 and 6.4), by rapidlytransferring it from a well containing the relaxing solution intodifferent activating Ca2� solutions. The fiber was maintained in therespective activating solution until the developed force showed aplateau. Maximal contractions were performed at the beginning of theprotocol, after baseline measurement, as well as once and againthroughout the experiment between submaximal contractions (Fig. 3,top inset). The force developed at submaximal activating levels (Pr)was expressed relative to the preceding and following contractionrecorded at pCa 4.5.
Calcium sensitivity calculation. The force-calcium relationship wasevaluated for each fiber using an iterative nonlinear curve-fittingprocedure (Marquardt-Levenberg algorithm). Experimental datapoints were fitted with the Hill equation Pr � pCan/(pCa50%
n � pCan),where pCa50% is the Ca2� concentration at which half-maximalactivation occurs and n is the Hill coefficient, an indicator of the slopeof the relationship (Fig. 3). Separate Hill plots were constructed byplotting log[Pr/(1 � Pr)] against pCa, and the Hill plot coefficients, n1
and n2, were calculated as the slope of the least square regression linesfitted to points above and below half-maximal activation, respectively(Fig. 3, bottom inset). The Ca2� activation threshold was calculated asthe pCa for which log[Pr/(1 � Pr)] � �2.5 using data points belowhalf-maximal activation.
Fiber MHC Isoform Determination
After completion of the mechanical tests, the fiber segment wasremoved from the respective setup, dissolved in 25 �l of SDS samplebuffer, and stored at �20°C. Later, the sample was analyzed for MHCisoform content using SDS-PAGE. The sample was heated at 95°C for3 min, and 5 �l of this extract was loaded on a electrophoresis system(Bio-Rad, Hercules, CA) with a 4% (wt/vol) acrylamide stacking geland 8% separating gel (2). The gels were run at 140 V for 17 h at 4°Cand thereafter stained using a Silver Stain Plus kit (Bio-Rad). TheMHC expression was determined on each fiber segment used for themechanical tests plus on �50 fibers per biopsy to determine the MHCprofile on some 100 fibers for each subject. A representative exampleof an SDS gel showing the MHC bands is illustrated in Fig. 4.
Statistical Analyses
Results are presented as means � SE. One-way ANOVA were usedto determine a disparity between the two groups for MHC isoformprofiles. Intergroup differences in the fiber contractile properties wereanalyzed using a general linear model with a nested design (fibersnested within subjects) and “subject” used as a random factor. Be-cause type I/IIa fibers were underrepresented in the samples, no testswere performed for these fiber types. Differences in the passivecharacteristics between fiber types (according to MHC isoforms) incontrol samples were assessed using a two-way ANOVA, with subjectand fiber type as main factors.
Because of the extremely dissimilar MHC profiles of the twogroups and the high proportion of hybrid fibers (which have differentfunctional properties compared with fibers containing only one MHCisoform), composite values that reflect the average for the entiremuscle sample were calculated for each individual (25). For a givenvariable, this composite value was obtained by adding the values fromall fibers expressing the different MHC isoforms and dividing theresult by the total number of fibers analyzed. This approach allowedus to take into account the hybrid I/IIa fibers and illustrates the effectof long-term muscle disuse on the contractile function of the muscle,assuming that the sample of fibers studied is representative. Thisanalysis was performed on the variables CSA, P0, P0/CSA, V0, power,and normalized power for each individual and then averaged torepresent the CTRL and SCI groups. One-way ANOVA was used todetermine a disparity between the two groups. Statistical significancewas accepted at P � 0.05.
RESULTS
MHC Isoform Composition
MHC isoform profiles of SCI and CTRL groups wereestablished based on the analysis of 536 and 1,474 singlefibers, respectively. As illustrated in Fig. 5, long-term muscleparalysis following SCI seems to induce a general transitiontoward MHC type II fibers, as shown by the lower proportionof type I fibers in SCI compared with CTRL subjects (11 � 7%vs. 34 � 5%; P � 0.05). Additionally, type IIa fibers were alsosignificantly less expressed in the SCI group (11 � 6% vs.31 � 5%; P � 0.05), revealing an all-range transition towardtype IIx fibers, the proportion of which was sixfold higher inthe SCI group (40 � 13% vs. 7 � 3%; P � 0.01). In the sameway, individuals with SCI showed a higher level of type IIa/IIxfibers (34 � 5% vs. 23 � 3%), but this difference was notstatistically significant (P � 0.06). A disparity was observed inMHC isoform expression among SCI individuals. Type IIafibers were expressed in the muscles of the two subjects withincomplete spinal lesions (SCI 3 and 4) plus one participantwith a complete paralysis (SCI 1), whereas type I fibers wereexpressed only in those with incomplete injuries.
Fig. 3. Representative example of force-pCa relationship experiments. Top leftinset: gross recording of the experiment performed on a single fiber (MHC typeI in this example). Vertical lines indicate full activations using a pCa 4.5solution. Pr/P0, force expressed relative to maximal Ca2�-activated force,plotted against the respective Ca2� concentrations expressed in pCa (�log[Ca2�]). Solid line represents the fit obtained by the Hill equation. Bottom rightinset: Hill plot constructed by plotting log[Pr/(1 � Pr)] against the respectivepCa.
Fig. 4. MHC isoform determination in single muscle fibers. The figure is arepresentative example of an 8% silver stained SDS gel. The four samples inthe middle stem from single fibers containing (from left to right) the type IIa,I, IIa, and IIx MHC isoform, respectively. STD, standard samples containingMHC I, IIa, and IIx isoforms.
343LONG-TERM MUSCLE PARALYSIS AND SINGLE FIBER MECHANICS
J Appl Physiol • VOL 102 • JANUARY 2007 • www.jap.org
on January 17, 2007 jap.physiology.org
Dow
nloaded from

Single Muscle Fiber CSA, P0, and P0/CSA
Figure 6 shows P0 as a function of CSA and illustrates thegreat disparity observed among SCI subjects. For example,subject SCI 2 had surprisingly big and strong fibers, whereassubject SCI 5 was situated at the other extremity of the data
cloud. This distribution was not related to the characteristics ofthe spinal cord lesion, since both subjects had complete muscleparalysis and obvious muscle atrophy. It should be noted thatno statistically significant difference was found between SCIindividuals with complete and incomplete lesions for any of thevariables under study. Although the mean values of CSAappeared to be higher in the SCI group compared with theCTRL group (14% for type I fibers, 16% for type IIa fibers,36% for type IIa/IIx fibers, and 4% for type IIx fibers), nostatistically significant difference was observed between thetwo groups for any fiber type (Table 1). Similarly, P0 in the SCIgroup was not different from that of the CTRL subjects, evenif a trend for higher values was observed in SCI group for typeI (30%), type IIa (13%), and type IIa/IIx fibers (23%). As aconsequence, specific tension (P0/CSA) was similar in the SCIand the CTRL groups. The same conclusions were reachedwhen performing the statistical analyses without the data ofsubject SCI 2.
Unloaded Shortening Velocity, V0
Frequency histograms of V0, with respect to fiber types andexperimental groups, are presented in Fig. 7. Single fibers fromthe SCI participants had globally higher values for V0 thanthose from the CTRL group, regardless of fiber type. Signifi-cant differences were found for type IIa (3.84 � 0.19 vs.
Fig. 5. MHC isoform content profiles of single fibers from control (CTRL) andspinal cord injury (SCI) groups. Significant difference between CTRL and SCIgroups: *P � 0.05; **P � 0.01.
Fig. 6. Relation between fiber cross-sectional area (CSA) and peak Ca2�-activated force (P0) with respect to fiber MHC isoform expression. Each symbolrepresents the results of a single muscle fiber. F, Fibers from CTRL group (n � 84, 96, 50, and 16, for type I, IIa, IIa/IIx, and IIx fibers, respectively); opensymbols, fibers of the different individuals from the SCI group (n � 18, 15, 48, and 49 for type I, IIa, IIa/IIx, and IIx fibers, respectively).
344 LONG-TERM MUSCLE PARALYSIS AND SINGLE FIBER MECHANICS
J Appl Physiol • VOL 102 • JANUARY 2007 • www.jap.org
on January 17, 2007 jap.physiology.org
Dow
nloaded from

3.05 � 0.07; P � 0.01), type IIa/IIx (5.92 � 0.20 vs. 3.58 �0.10; P � 0.001), and type IIx fibers (6.60 � 0.21 vs. 4.48 �0.29; P � 0.01) but not for type I fibers (1.21 � 0.05 vs.1.03 � 0.03; not significant).
Power-Velocity Relationships
Power-velocity relationships were evaluated on a lowernumber of fibers than for slack tests (see Fig. 8 legend fordetails). The extrapolation of the force-velocity relationshipwas used to determine the maximal shortening velocity of eachfiber (Vmax). The results generally confirmed those obtainedwith the slack test method, in that Vmax was higher in the SCIgroup for type I fibers (0.94 � 0.07 vs. 0.68 � 0.03 FL/s; P �0.001), type IIa/IIx (4.69 � 0.14 vs. 1.94 � 0.10 FL/s; P �0.001), and type IIx fibers (4.61 � 0.16 vs. 2.30 � 0.27 FL/s;P � 0.01). However, no statistical difference was foundbetween the two groups for Vmax of type IIa fibers (2.69 � 0.26vs. 1.84 � 0.08 FL/s for SCI and CTRL subjects, respectively;P � 0.09).
Figure 8 illustrates the average (�SE) curve of absolutepower in relation to shortening velocity for each fiber type.
Absolute fiber peak power was not different between SCI andCTRL subjects for type I (19.0 � 1.3 vs. 15.2 � 0.6 �N �FL/s)and type IIx fibers (90.0 � 6.4 vs. 58.9 � 5.6 �N.FL/s).Nevertheless, absolute peak power was higher in the SCI groupfor type IIa (77.4 � 5.0 vs. 52.9 � 1.4 �N �FL/s; P � 0.05) andtype IIa/IIx fibers (108.7 � 7.4 vs. 49.7 � 2.7 �N �FL/s; P �0.01). When normalized by fiber volume, fiber peak power ofSCI individuals was still greater in type IIa/IIx fibers (16.14 �0.88 vs. 9.43 � 0.48 W/l; P � 0.001), whereas no differencewas found for type I (3.34 � 0.18 vs. 2.87 � 0.09 W/l), typeIIa (11.11 � 1.41 vs. 8.57 � 0.25 W/l), and type IIx fibers(16.95 � 0.79 vs. 11.43 � 1.46 W/l). Since it appears that peakfiber force was not different between groups, the greater fiberpower in SCI individuals was mainly the result of a highershortening velocity. Accordingly, the velocity at which peakpower occurs (Vopt) was significantly higher in the SCI groupfor type I (0.12 � 0.01 vs. 0.10 � 0.01 FL/s; P � 0.01) andtype IIa/IIx fibers (0.62 � 0.02 vs. 0.30 � 0.01 FL/s; P �0.001) but not for type IIa (0.40 � 0.03 vs. 0.29 � 0.01 FL/s;P � 0.12) and type IIx fibers (0.64 � 0.02 vs. 0.35 � 0.04FL/s; P � 0.05). Fiber force at which peak power occurs was
Table 1. CSA, P0, and P0/CSA of single fibers from CTRL and SCI groups
MHCIsoform
n CSA, �m2 P0, mN P0/CSA, kN/m2
CTRL SCI CTRL SCI CTRL SCI CTRL SCI
I 84 18 5,470�213 6,222�575 0.94�0.03 1.22�0.09 179.5�4.5 201.7�8.6I/IIa 11 4 4,856�359 4,465�158 0.96�0.06 0.89�0.02 202.1�15.2 200.9�9.2IIa 96 15 6,415�157 7,473�661 1.16�0.03 1.31�0.10 183.1�2.8 185.8�11.4IIa/IIx 50 48 5,518�238 7,502�663 1.11�0.05 1.37�0.11 204.2�5.4 190.3�5.7IIx 16 49 5,724�495 5,943�534 1.15�0.08 1.07�0.09 206.9�7.5 188.7�5.4
Values are means � SE. MHC, myosin heavy chain; CSA, cross-sectional area; P0, peak Ca2� -activated force; CTRL, control; SCI, spinal cord injury. Dueto lack of data, no statistical analysis was performed on type I/IIa fibers.
Fig. 7. Shortening velocity (V0) histograms of single fibers from CTRL and SCI groups with respect to MHC isoform expression, as determined from the slacktest method. Total number of analyzed fibers is similar to those given for CSA and P0 determination.
345LONG-TERM MUSCLE PARALYSIS AND SINGLE FIBER MECHANICS
J Appl Physiol • VOL 102 • JANUARY 2007 • www.jap.org
on January 17, 2007 jap.physiology.org
Dow
nloaded from

similar in both groups (0.16 � 0.01 vs. 0.15 � 0.01 mN in typeI, 0.21 � 0.02 vs. 0.19 � 0.01 mN in type IIa, 0.18 � 0.01 vs.0.18 � 0.01 mN in type IIa/IIx, and 0.15 � 0.01 vs. 0.18 �0.01 mN in type IIx fibers of SCI and CTRL subjects, respec-tively).
Passive Tension
Passive characteristics of single fibers were assessed on 93and 76 fiber segments from CTRL and SCI groups, respec-tively (Fig. 9). The statistical analyses could only be performedon type I, IIa, and IIa/IIx fibers, because the other fiber typeswere underrepresented. In the CTRL group, no differenceswere found regarding complex Young’s modulus between typeI (20.55 � 0.86 kN/m2), type IIa (16.61 � 0.78 kN/m2), andtype IIa/IIx fibers (16.14 � 1.08 kN/m2). However, type Ifibers had higher values for complex Young’s modulus than alltype II fibers combined (16.44 � 0.62 kN/m2; P � 0.01).Hysteresis was higher in type I fibers (1.28 � 0.08) comparedwith type IIa/IIx fibers (0.80 � 0.09 kN/m2; P � 0.05),whereas the results found in type IIa fibers (0.91 � 0.07kN/m2) were not significantly different from any other fibertype. Once again, hysteresis was higher in type I fibers com-pared with all type II fibers (0.87 � 0.05 kN/m2; P � 0.001).
Single muscle fiber stiffness was not altered following long-term muscle paralysis, as complex Young’s modulus was notdifferent in the SCI group for type I (21.18 � 0.92 kN/m2),type IIa (18.77 � 1.35 kN/m2), or type IIa/IIx fibers (20.90 �1.53 kN/m2). Similarly, no difference was observed for thehysteresis values following SCI (1.36 � 0.12, 1.02 � 0.07, and1.18 � 0.12 kN/m2 in type I, type IIa, and type IIa/IIx fibers,respectively).
Single Muscle Fiber Composite Values
Composite values of fiber characteristics are given in Table2. The SCI group showed higher values for V0 (P � 0.001),peak power (P � 0.01), and normalized peak power (P �0.001), whereas no dissimilarity was observed for P0, CSA,and P0/CSA.
Force-pCa Relationships
Force-pCa relationships were evaluated on a total of 74 and87 single fibers from 4 CTRL and 4 SCI individuals, respec-tively (Table 3). No difference between groups was observedin the force-pCa relationships for type I and type IIa fibers.Despite the fact that the Ca2� activation threshold was lower inSCI group for type IIa/IIx fibers (P � 0.05), no differenceappeared for pCa50% and Hill plot coefficients n1 and n2.Because of insufficient sample size, no statistical analysiscould be performed on type I/IIa and type IIx fibers.
DISCUSSION
The present study is the first to characterize the functionaladaptations of single muscle fibers from subjects having expe-rienced a chronic decrease or absence of neuromuscular activ-ity for several years. The participants of the SCI group all hadlongstanding (�3 yr) spinal lesions that had prevented themfrom normal use of their quadriceps muscles, confining them topermanent wheelchair use. Contrary to our expectations, manyof our hypotheses could not be supported by our results.
Fiber-type Profile
The analysis of MHC isoform expression reveals high pro-portions of type II fibers in atrophied muscles of individuals
Fig. 8. Power-velocity relationships fromCTRL and SCI groups with respect to MHCisoform expression. The graphs illustrate av-erage power curves � SE of the CTRL group(n � 83, 94, 49, and 15 for type I, IIa, IIa/IIx,and IIx fibers, respectively) and SCI group(n � 16, 14, 46, and 49 for type I, IIa, IIa/IIx,and IIx fibers, respectively).
346 LONG-TERM MUSCLE PARALYSIS AND SINGLE FIBER MECHANICS
J Appl Physiol • VOL 102 • JANUARY 2007 • www.jap.org
on January 17, 2007 jap.physiology.org
Dow
nloaded from
with SCI. This implicates either that type I fibers disappear orthat long-term muscle unloading induces a general scheme ofsequential transitions from slow to fast fibers: MHC I3MHCIIa 3 MHC IIx. Such fiber-type transitions have been previ-ously demonstrated as a consequence of muscle unloading anddenervation or cross-reinnervation (19). In the case of spinallesion, most of this change in fiber-type profile seems to occurwithin the first 2 yr following injury (4). Nevertheless, two ofour SCI participants with motor incomplete lesions (cf. MATE-RIALS AND METHODS) still expressed �20% of type I fibers. Thusit seems possible to preserve a significant proportion of func-tionally able (cf. below) type I fibers with only very limited
muscle use, even after several years of reduced neuromuscularactivity.
Single Fiber CSA and P0
Muscle unloading is generally associated with a decrease inmaximal muscle force and muscle mass. At the single fiberlevel, a decrease in fiber CSA has been reported in paralyzedmuscles after spinal cord transection in rats (9) or post-spinalinjury in humans (5, 22). Why fiber atrophy was not observedin the present study is surprising and difficult to explain. Priorinvestigations (5, 22) were performed within a relatively shorttime period following the spinal cord lesion (between 3 wk and17 mo). Thus it is possible that these analyses included fibersthat were in a degenerative process and destined to disappearafter longer term paralysis, as in the present study. This couldexplain why our results are in opposition to those prior data,because the CSA of “survivor” fibers from our SCI participantswere not different from those of the CTRL subjects and, ifanything, actually bigger. It is also possible that the seatedposition adopted by our wheelchair-dependent participantsplaced their vastus lateralis muscle in a lengthened state, whichcould have limited fiber atrophy, as suggested by data obtainedin rat muscle (18). Finally, it cannot be ruled out that spasticmuscle contractions in the lower limbs could have helped topreserve some muscle fiber characteristics, especially in theindividuals with complete spinal cord lesions.
The similar CSA between the two study groups was associ-ated with equivalent values for single fiber P0, which lendssupport to the finding that fiber atrophy was not present in theparalyzed muscles. As a consequence, specific tension was notdifferent between SCI and CTRL groups. These results suggestthat the loss of muscle mass and force could be largely relatedto a loss of muscle fibers and maybe less to a deterioration ofthe contractile function.
Close inspection of Fig. 6 reveals that the data of theparticipants of the SCI group are more scattered than those ofthe CTRL group. Thus it seems that not all individuals react inthe same way to a long-term reduction in neuromuscular
Fig. 9. Complex Young’s modulus (A) and hysteresis (B) in type I, IIa, andIIa/IIx fibers from CTRL (n � 43, 26, and 15, respectively) and SCI groups(n � 10, 9, and 32, respectively). Due to lack of data, no statistical analysis wasperformed on type I/IIa and type IIx fibers.
Table 2. Single muscle fiber vastus lateralis composite datafrom CTRL and SCI groups
Variable CTRL SCI %
CSA, �m2 5,794�256 6,667�1,510 �15P0, mN 1.05�0.06 1.22�0.25 �16P0/CSA, kN/m2 186.4�5.2 190.9�10.2 �2V0, FL/s 2.53�0.12 5.23�0.69† �106Power, �N � FL/s 39.1�2.5 84.6�16.8* �116Power, kN/m2 � FL/s 7.02�0.35 14.08�1.98† �101
Values are means � SE. %, percentage of difference; P0, peak force; P0/CSA,specific tension; V0, unloaded shortening velocity. Significant differences betweenCTRL and SCI fibers containing similar MHC isoforms: *P � 0.01; †P � 0.001.
Table 3. Force-pCa relationships in CTRL and SCI groups
CTRL SCIP
Value
MHC I (n � 38) (n � 11)pCa50% 5.69�0.01 5.71�0.01 0.39Act. thresh 6.75�0.02 6.75�0.04 0.59
n1 1.99�0.06 1.94�0.07 0.66n2 2.34�0.07 2.43�0.10 0.70
MHC IIa (n � 19) (n � 10)pCa50% 5.63�0.01 5.65�0.01 0.67Act. thresh 6.66�0.04 6.69�0.03 0.86
n1 1.91�0.07 1.98�0.12 0.78n2 2.49�0.13 2.43�0.08 0.87
MHC IIa/IIx (n � 9) (n � 28)pCa50% 5.63�0.02 5.68�0.01 0.08Act. thresh 6.66�0.04 6.78�0.02 �0.01
n1 2.02�0.09 1.88�0.07 0.17n2 2.41�0.11 2.37�0.07 0.85
Values are means � SE. pCa50%, concentration at which half-maximalactivation occurs; Act, thresh., activation threshold; n1 and n2, Hill plotcoefficients above and below half-maximal activation, respectively. Due tolack of data, no statistical analyses were performed on type I/IIa and type IIxfibers.
347LONG-TERM MUSCLE PARALYSIS AND SINGLE FIBER MECHANICS
J Appl Physiol • VOL 102 • JANUARY 2007 • www.jap.org
on January 17, 2007 jap.physiology.org
Dow
nloaded from

activity. Some degree of disparity between individual reactionsto unloading has been reported in previous work. Widrick andcoworkers (28) showed that in one subject out of eight, fiberdiameter remained unchanged and P0 was increased after 17days of bedrest, whereas average values showed significantdecreases in both variables. This individual also had increasesin V0 and fiber power (27, 28). In another investigation fromthe same group, one out of four astronauts did not display adecrease in fiber diameter following a 17-day spaceflight mis-sion, in contrast to the other three astronauts (26). Given thesevery specific adaptations of muscle tissue to unloading in someindividuals, future research should focus on such disparitiesand the possible explanations of these peculiar observations.
Shortening Velocity and Power
A well documented but still insufficiently explained adapta-tion of the contractile machinery to muscle unloading is theincrease of maximal shortening velocity observed on wholemuscle (23) as well as at the single fiber level (26, 28, 31).Talmadge et al. (23) demonstrated that V0 and Vmax of ratsoleus muscles were increased 3–6 mo after spinal cord tran-section as a result of a fiber-type transition toward largerproportions of type II fibers. Similarly, electrically stimulatedquadriceps muscles from individuals with long-term spinalparalysis had higher contraction rates than those of able-bodiedcontrol subjects (11). The present data imply that increasedwhole muscle contraction velocity could not only be theconsequence of fiber-type transition but also result from anincrease in contraction velocity (V0 and Vopt) of single fibers.To date, there are no satisfactory explanations for the increasein human single fiber contraction velocity independently ofMHC isoform expression (3). More confusing is the fact thatcertain types of exercise training also promote an increase infiber V0 (14, 30), despite the contrasting physiological stimulusin terms of muscle activation. Clearly, this aspect deservesfurther attention from the scientific community to explain theunderlying mechanisms.
Our hypothesis that long-term muscle disuse would decreasefiber power was not confirmed by the present data. On thecontrary, fiber power from individuals of the SCI group wasgenerally higher than in CTRL subjects (Fig. 8), with signifi-cant differences in type IIa and IIa/IIx fibers. These resultswere mainly due to the large increases in contraction velocity,whereas fiber CSA and P0 were similar in the two groups. Thisobservation was surprising because short-term unloading hasbeen associated with losses in power as a result of decreasedfiber CSA and P0, insufficiently compensated by a greatershortening velocity (26, 27, 31). Even normalized peak powershowed an increasing trend in our SCI participants, the risebeing significant for type IIa/IIx fibers. However, this highernormalized peak power could have been caused by a largerproportion of type IIx MHC within those hybrid fibers.
Whole muscle function is not only influenced by single fibercontractile performance but also by fiber-type distributionwithin the muscle, as well as the total number of fibers present.Composite values were calculated for different variables re-lated to fiber mechanics (25), in an attempt to give a reflectionof the average fiber contractile function. The data presented inTable 2 illustrate that average maximal contraction velocityand peak power were greatly increased in SCI individuals,
whereas CSA, P0, and P0/CSA were similar to the CTRLgroup. However, it is well known that whole muscle functiondeteriorates after several years of unloading, as electricallystimulated lower limb muscles from individuals with spinalparalysis were shown to develop significantly lower force (11).Thus, taken together, these results indicate that the loss ofmuscle mass and function after long-term reduced neuromus-cular activity results from a decrease in fiber number within themuscle, whereas the functional properties of the remainingfibers are conserved.
Ca2� Sensitivity
The present study failed to demonstrate a change in Ca2�
sensitivity of muscle fibers after several years of reducedneuromuscular activity. These results are in disagreement withthe previously reported decreases of Ca2� sensitivity in humanfibers following shorter periods of unloading (26, 27, 31). It isnoteworthy that those prior studies were performed on type Ifibers from the soleus muscle and, to the authors’ knowledge,no data are available on potential changes in Ca2� sensitivityof single fibers from the vastus lateralis muscle followingunloading. This could be an important feature since no changeswere found in type I and IIa fibers from monkey gastrocnemiusmuscles following spaceflight (7, 8) or in fast fibers from thered and white gastrocnemius of rats after hindlimb suspension(10). It appears clearly that different muscles do not respond inthe same way to reduced neuromuscular activity, probablydepending on their physiological and biomechanical function.
Passive Tension
Passive characteristics of single muscle fibers have notfrequently been explored. Chemically skinned fibers from ratsoleus muscles were studied by Toursel and coworkers (24)regarding the adaptations in passive characteristics following14 days of hindlimb suspension. They found that, after muscleunloading, complex Young’s modulus was decreased and thatthis decrease was associated with a loss of the relative amountof titin present in their samples. Once more, our results are incontrast with these observations. Stiffness of the fibers fromthe paralyzed muscles was not different compared with thesamples from our CTRL group (Fig. 9). The discrepancy withthe results of Toursel et al. (24) could mainly stem from theunloading paradigm and duration, as well as the species andmuscle investigated.
In conclusion, this study analyzed the mechanical propertiesof single muscle fibers following several years of reducedneuromuscular activity as a consequence of SCI. Our resultsconsistently show that functional contractile performance andpassive properties of these fibers are equivalent to those offibers from individuals with normal muscle function. Thesesurprising observations are in contrast to earlier work, whichgenerally showed significant changes in most mechanical vari-ables, indicating a clear decline in fiber contractile properties.However, past studies have used short-term unloading proto-cols and have analyzed atrophied fibers with smaller amountsof contractile protein. Although the present results do notprovide explanations as to the underlying mechanisms ofpreserved fiber function, it can be speculated that the maineffect of chronic reduced neuromuscular activity is a loss ofmuscle cells, leaving a population of surviving fibers that have
348 LONG-TERM MUSCLE PARALYSIS AND SINGLE FIBER MECHANICS
J Appl Physiol • VOL 102 • JANUARY 2007 • www.jap.org
on January 17, 2007 jap.physiology.org
Dow
nloaded from
equal or higher contraction performance compared with thosefrom normally functioning muscles.
GRANTS
This study was supported by a grant (to D. Theisen) from the FondsSpeciaux de Recherche, Universite Catholique de Louvain, and the Fonds dela Recherche Scientifique Medicale, Belgique (convention no. 3.4547.04).
REFERENCES
1. Bamman MM, Clarke MS, Feeback DL, Talmadge RJ, Stevens BR,Lieberman SA, Greenisen MC. Impact of resistance exercise during bedrest on skeletal muscle sarcopenia and myosin isoform distribution. J ApplPhysiol 84: 157–163, 1998.
2. Bamman MM, Clarke MS, Talmadge RJ, Feeback DL. Enhancedprotein electrophoresis technique for separating human skeletal musclemyosin heavy chain isoforms. Electrophoresis 20: 466–468, 1999.
3. Bottinelli R. Functional heterogeneity of mammalian single muscle fibres:do myosin isoforms tell the whole story? Pflugers Arch 443: 6–17, 2001.
4. Burnham R, Martin T, Stein R, Bell G, MacLean I, Steadward R.Skeletal muscle fibre type transformation following spinal cord injury.Spinal Cord 35: 86–91, 1997.
5. Castro MJ, Apple DF Jr, Staron RS, Campos GE, Dudley GA.Influence of complete spinal cord injury on skeletal muscle within 6 mo ofinjury. J Appl Physiol 86: 350–358, 1999.
6. Fabiato A, Fabiato F. Calculator programs for computing the composi-tion of the solutions containing multiple metals and ligands used forexperiments in skinned muscle cells. J Physiol 75: 463–505, 1979.
7. Fitts RH, Bodine SC, Romatowski JG, Widrick JJ. Velocity, force,power, and Ca2� sensitivity of fast and slow monkey skeletal musclefibers. J Appl Physiol 84: 1776–1787, 1998.
8. Fitts RH, Riley DR, Widrick JJ. Physiology of a microgravity environ-ment invited review: microgravity and skeletal muscle. J Appl Physiol 89:823–839, 2000.
9. Frontera WR, Choi H, Krishnan G, Krivickas LS, Sabharwal S, TengYD. Single muscle fiber size and contractility after spinal cord injury inrats. Muscle Nerve 34: 101–104, 2006.
10. Gardetto PR, Schluter JM, Fitts RH. Contractile function of singlemuscle fibers after hindlimb suspension. J Appl Physiol 66: 2739–2749,1989.
11. Gerrits HL, De Haan A, Hopman MT, van Der Woude LH, Jones DA,Sargeant AJ. Contractile properties of the quadriceps muscle in individ-uals with spinal cord injury. Muscle Nerve 22: 1249–1256, 1999.
12. Goldspink G, Scutt A, Martindale J, Jaenicke T, Turay L, GerlachGF. Stretch and force generation induce rapid hypertrophy and myosinisoform gene switching in adult skeletal muscle. Biochem Soc Trans 19:368–373, 1991.
13. Gordon T, Mao J. Muscle atrophy and procedures for training after spinalcord injury. Phys Ther 74: 50–60, 1994.
14. Malisoux L, Francaux M, Nielens H, Theisen D. Stretch-shorteningcycle exercises: an effective training paradigm to enhance power output ofhuman single muscle fibers. J Appl Physiol 100: 771–779, 2006.
15. Modlesky CM, Bickel CS, Slade JM, Meyer RA, Cureton KJ, DudleyGA. Assessment of skeletal muscle mass in men with spinal cord injury
using dual-energy X-ray absorptiometry and magnetic resonance imaging.J Appl Physiol 96: 561–565, 2004.
16. Mohr T, Andersen JL, Biering-Sorensen F, Galbo H, Bangsbo J,Wagner A, Kjaer M. Long-term adaptation to electrically induced cycletraining in severe spinal cord injured individuals. Spinal Cord 35: 1–16,1997.
17. Moss RL. Sarcomere length-tension relations of frog skinned musclefibres during calcium activation at short lengths. J Physiol 292: 177–192,1979.
18. Ohira Y, Yasui W, Roy RR, Edgerton VR. Effects of muscle length onthe response to unloading. Acta Anat (Basel) 159: 90–98, 1997.
19. Pette D, Staron RS. Myosin isoforms, muscle fiber types, and transitions.Microsc Res Tech 50: 500–509, 2000.
20. Rassier DE, MacIntosh BR, Herzog W. Length dependence of activeforce production in skeletal muscle. J Appl Physiol 86: 1445–1457, 1999.
21. Rochester L, Barron MJ, Chandler CS, Sutton RA, Miller S, JohnsonMA. Influence of electrical stimulation of the tibialis anterior muscle inparaplegic subjects. 2. Morphological and histochemical properties. Para-plegia 33: 514–522, 1995.
22. Scelsi R, Marchetti C, Poggi P, Lotta S, Lommi G. Muscle fiber typemorphology and distribution in paraplegic patients with traumatic cordlesion. Histochemical and ultrastructural aspects of rectus femoris muscle.Acta Neuropathol (Berl) 57: 243–248, 1982.
23. Talmadge RJ, Roy RR, Caiozzo VJ, Edgerton VR. Mechanical prop-erties of rat soleus after long-term spinal cord transection. J Appl Physiol93: 1487–1497, 2002.
24. Toursel T, Stevens L, Granzier H, Mounier Y. Passive tension of ratskeletal soleus muscle fibers: effects of unloading conditions. J ApplPhysiol 92: 1465–1472, 2002.
25. Trappe S, Trappe T, Gallagher P, Harber M, Alkner B, Tesch P.Human single muscle fibre function with 84 day bed-rest and resistanceexercise. J Physiol 557: 501–513, 2004.
26. Widrick JJ, Knuth ST, Norenberg KM, Romatowski JG, Bain JL,Riley DA, Karhanek M, Trappe SW, Trappe TA, Costill DL, Fitts RH.Effect of a 17 day spaceflight on contractile properties of human soleusmuscle fibres. J Physiol 516: 915–930, 1999.
27. Widrick JJ, Norenberg KM, Romatowski JG, Blaser CA, KarhanekM, Sherwood J, Trappe SW, Trappe TA, Costill DL, Fitts RH.Force-velocity-power and force-pCa relationships of human soleus fibersafter 17 days of bed rest. J Appl Physiol 85: 1949–1956, 1998.
28. Widrick JJ, Romatowski JG, Bain JL, Trappe SW, Trappe TA,Thompson JL, Costill DL, Riley DA, Fitts RH. Effect of 17 days of bedrest on peak isometric force and unloaded shortening velocity of humansoleus fibers. Am J Physiol Cell Physiol 273: C1690–C1699, 1997.
29. Widrick JJ, Romatowski JG, Norenberg KM, Knuth ST, Bain JL,Riley DA, Trappe SW, Trappe TA, Costill DL, Fitts RH. Functionalproperties of slow and fast gastrocnemius muscle fibers after a 17-dayspaceflight. J Appl Physiol 90: 2203–2211, 2001.
30. Widrick JJ, Trappe SW, Blaser CA, Costill DL, Fitts RH. Isometricforce and maximal shortening velocity of single muscle fibers from elitemaster runners. Am J Physiol Cell Physiol 271: C666–C675, 1996.
31. Yamashita-Goto K, Okuyama R, Honda M, Kawasaki K, Fujita K,Yamada T, Nonaka I, Ohira Y, Yoshioka T. Maximal and submaximalforces of slow fibers in human soleus after bed rest. J Appl Physiol 91:417–424, 2001.
349LONG-TERM MUSCLE PARALYSIS AND SINGLE FIBER MECHANICS
J Appl Physiol • VOL 102 • JANUARY 2007 • www.jap.org
on January 17, 2007 jap.physiology.org
Dow
nloaded from