
Effect of irrigation and nitrogen application methods on input use efficiency of wheat under...
15
ORIGINAL PAPER Effect of irrigation and nitrogen application methods on input use efficiency of wheat under limited water supply in a Vertisol of Central India K. K. Bandyopadhyay A. K. Misra P. K. Ghosh K. M. Hati K. G. Mandal M. Moahnty Received: 18 December 2008 / Accepted: 9 September 2009 / Published online: 26 September 2009 Ó Springer-Verlag 2009 Abstract Field experiments were conducted in a deep Vertisol at the Indian Institute of Soil Science, Bhopal during the years 2001–2005 to assess the effect of five different irrigation strategies through combinations of sprinkler and flood irrigation and two N application methods on yield and water use efficiency of wheat (cv WH 147). The amount of irrigation applied each year differed according to the availability of water in the water harvesting pond to simulate the actual water crisis faced by the farmers in this region during these years due to mon- soon failure. Results indicated that when wheat was grown only with 8-cm irrigation at sowing or 14 cm up to the crown root initiation stage, dry sowing of wheat immedi- ately followed by sprinkler and subsequent irrigation through flooding produced the highest yield and water and nitrogen use efficiencies. However, when 20-cm irrigation was supplied up to the flowering stage or 14-cm irrigation was supplied up to tillering stage through sprinkler in 4 and 3 splits, respectively, at critical growth stages, maximized the grain yield and water and nitrogen use efficiencies. Across the years, the crop yield and water and nitrogen use efficiencies increased with increase in water supply. Introduction In India, monsoon rains have a significant bearing on agricultural productivity. Other than meeting the water requirement of the rainy season crops, the monsoon rains also determine the recharge of groundwater and harvesting of water in ponds for subsequent use for irrigating the post- rainy season crops. In Vertisols, water harvested in the ponds does not last long enough to provide irrigation for the entire growth period of post-rainy season crops because of losses by seepage through cracks and evaporation. Thus, limited availability of irrigation water is one of the major constraints to higher productivity of wheat in the Vertisols of Central India. The erratic distribution of rainfall in this region further aggravates the problem. Thus, there is a need for developing strategies for efficient utilization of water for higher crop yield. In Vertisols, irrigation applied through surface flooding results in non-uniform distribution of water and fertilizer in the seed-zone because of preferential flow of water and the dissolved fertilizer through shrinkage cracks causing leaching loss of fertilizers (Smalling and Bouma 1992), which not only reduces the fertilizer use efficiency and crop yield but also leads to environmental pollution due to ground water contamination. Sprinkler irrigation may be a viable alternative to flood irrigation (Chen et al. 2002; Home et al. 2002) to address this water management problem. Beneficial effect of sprinkler irrigation over flood irrigation with respect to water saving and increase in water use efficiency has been reported by many workers (Verma and Shrivastava 1992; Home et al. 2002; Pawar et al. 2002). However, sprinkler irrigation is an energy intensive process because of low discharge rate than the flood irrigation, which requires the pump to run for longer period to apply a given amount of water. Furthermore, the resource-poor Communicated by E. Fereres. K. K. Bandyopadhyay A. K. Misra P. K. Ghosh K. M. Hati K. G. Mandal M. Moahnty Indian Institute of Soil Science, Nabibagh, Berasia Road, Bhopal 462 038, Madhya Pradesh, India K. K. Bandyopadhyay (&) Central Institute for Cotton Research Regional Station, Coimbatore 641003, India e-mail: [email protected] 123 Irrig Sci (2010) 28:285–299 DOI 10.1007/s00271-009-0190-z
Transcript of Effect of irrigation and nitrogen application methods on input use efficiency of wheat under...
ORIGINAL PAPER
Effect of irrigation and nitrogen application methodson input use efficiency of wheat under limited water supplyin a Vertisol of Central India
K. K. Bandyopadhyay Æ A. K. Misra ÆP. K. Ghosh Æ K. M. Hati Æ K. G. Mandal ÆM. Moahnty
Received: 18 December 2008 / Accepted: 9 September 2009 / Published online: 26 September 2009
� Springer-Verlag 2009
Abstract Field experiments were conducted in a deep
Vertisol at the Indian Institute of Soil Science, Bhopal
during the years 2001–2005 to assess the effect of five
different irrigation strategies through combinations of
sprinkler and flood irrigation and two N application
methods on yield and water use efficiency of wheat (cv
WH 147). The amount of irrigation applied each year
differed according to the availability of water in the water
harvesting pond to simulate the actual water crisis faced by
the farmers in this region during these years due to mon-
soon failure. Results indicated that when wheat was grown
only with 8-cm irrigation at sowing or 14 cm up to the
crown root initiation stage, dry sowing of wheat immedi-
ately followed by sprinkler and subsequent irrigation
through flooding produced the highest yield and water and
nitrogen use efficiencies. However, when 20-cm irrigation
was supplied up to the flowering stage or 14-cm irrigation
was supplied up to tillering stage through sprinkler in 4 and
3 splits, respectively, at critical growth stages, maximized
the grain yield and water and nitrogen use efficiencies.
Across the years, the crop yield and water and nitrogen use
efficiencies increased with increase in water supply.
Introduction
In India, monsoon rains have a significant bearing on
agricultural productivity. Other than meeting the water
requirement of the rainy season crops, the monsoon rains
also determine the recharge of groundwater and harvesting
of water in ponds for subsequent use for irrigating the post-
rainy season crops. In Vertisols, water harvested in the
ponds does not last long enough to provide irrigation for
the entire growth period of post-rainy season crops because
of losses by seepage through cracks and evaporation. Thus,
limited availability of irrigation water is one of the major
constraints to higher productivity of wheat in the Vertisols
of Central India. The erratic distribution of rainfall in this
region further aggravates the problem. Thus, there is a need
for developing strategies for efficient utilization of water
for higher crop yield.
In Vertisols, irrigation applied through surface flooding
results in non-uniform distribution of water and fertilizer in
the seed-zone because of preferential flow of water and the
dissolved fertilizer through shrinkage cracks causing
leaching loss of fertilizers (Smalling and Bouma 1992),
which not only reduces the fertilizer use efficiency and crop
yield but also leads to environmental pollution due to
ground water contamination. Sprinkler irrigation may be a
viable alternative to flood irrigation (Chen et al. 2002;
Home et al. 2002) to address this water management
problem. Beneficial effect of sprinkler irrigation over flood
irrigation with respect to water saving and increase in water
use efficiency has been reported by many workers (Verma
and Shrivastava 1992; Home et al. 2002; Pawar et al. 2002).
However, sprinkler irrigation is an energy intensive process
because of low discharge rate than the flood irrigation,
which requires the pump to run for longer period to apply a
given amount of water. Furthermore, the resource-poor
Communicated by E. Fereres.
K. K. Bandyopadhyay � A. K. Misra � P. K. Ghosh �K. M. Hati � K. G. Mandal � M. Moahnty
Indian Institute of Soil Science, Nabibagh, Berasia Road,
Bhopal 462 038, Madhya Pradesh, India
K. K. Bandyopadhyay (&)
Central Institute for Cotton Research Regional Station,
Coimbatore 641003, India
e-mail: [email protected]
123
Irrig Sci (2010) 28:285–299
DOI 10.1007/s00271-009-0190-z
farmers of the third world countries cannot afford to own
the sprinkler system, rather they can hire it from other
farmers having this system. So, strategically, there is novel
effort for combined use of irrigation methods (Manjunatha
et al. 2000). Honglu et al. (1998) reported that an irrigation
system with sprinkler in the early stages of maize and wheat
and surface irrigation at the later stage was economically
feasible and water efficient.
Yield of wheat under irrigated condition is a function of
evapo-transpiration, which is usually reflected in the water
use efficiency and water use pattern of the crop (Van
Keulen 1975; Fischer 1979). The relationship between crop
yield and seasonal evapo-transpiration in the form of
evapo-transpiration production function (ETPF) has been
reported as linear by some workers (Singh et al. 1979;
Steiner et al. 1985; Hunsaker and Bucks 1987; Musick and
Porter 1990; Hati et al. 2001). However, others have
reported curvilinear ETPF (Ehlig and Le Mert 1976;
Sharratt et al. 1980; Bandyopadhyay et al. 2004). Although
yield–ET relationships have been widely used for irrigation
management purpose in water-limited areas, they did not
account for nutrient management and these are mostly
based on conventional flood irrigation method. Therefore,
there is need for a thorough understanding of the effect of
irrigation methods on relationships between crop yield and
evapo-transpiration and water use efficiency by wheat.
There is a significant interaction between nitrogen and
water supply for their effect on wheat yield (Gajri et al.
1993; Hussain and Al-Jalaud 1995). However, the response
of yield to N supply is strongly influenced by environ-
mental conditions, especially the quantity and timing of
water available to the crop (Hauck 1984). So there is a need
for developing strategies for optimum utilization of water
for achieving higher nitrogen use efficiency and crop yield.
Nitrogen use efficiency by wheat is less in Vertisols due to
losses of N by ammonia volatilization under high soil pH,
leaching and denitrification. Efforts have been made by
different workers to improve the nitrogen use efficiency in
wheat through modified nitrogenous fertilizers, nitrifica-
tion, urease inhibitors etc. Manipulation of timing of fer-
tilizer application and method of irrigation may help in
improving nitrogen use efficiency of wheat (Abourached
et al. 2008). A number of experiments in winter cereals
have shown that adjusting fertilizer rate and splitting of N
fertilizer application are strategies to improve nitrogen use
efficiency (Dilz 1988; Alcoz et al. 1993; Delogu et al.
1998; Lopez Bellido et al. 2005). Besides timing, place-
ment of fertilizer N also influences the nitrogen use effi-
ciency (Mahler et al. 1994). It has been reported that
application of nitrogenous fertilizer before irrigation
transports it to subsurface layer and results in higher
nitrogen use efficiency and crop yield. However, in Ver-
tisols, because of crack formation, farmers usually prefer to
apply nitrogen fertilizers after irrigation to avoid the
leaching loss of N through the cracks.
In this backdrop, the objective of the present investi-
gation was to study the effect of different combinations of
sprinkler and surface flooding on root growth, soil water
extraction, crop yield, evapo-transpiration production
functions and water and nitrogen use efficiency of wheat
under limited water supply.
Materials and methods
Soil and climate
Field experiments were conducted during 2001–2005 in a
Vertisol at the research farm of the Indian Institute of Soil
Science, Bhopal (23�180N, 77�240E and 485 m above mean
sea level), Madhya Pradesh, India. The region has a hot and
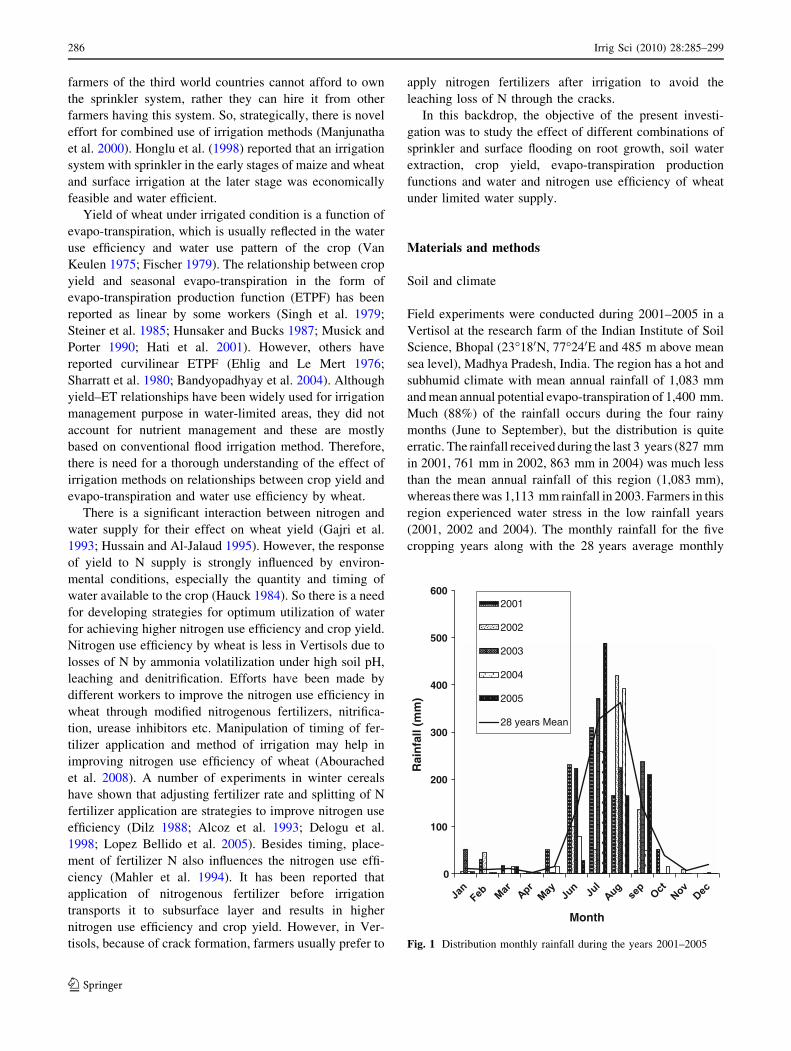
subhumid climate with mean annual rainfall of 1,083 mm
and mean annual potential evapo-transpiration of 1,400 mm.
Much (88%) of the rainfall occurs during the four rainy
months (June to September), but the distribution is quite
erratic. The rainfall received during the last 3 years (827 mm
in 2001, 761 mm in 2002, 863 mm in 2004) was much less
than the mean annual rainfall of this region (1,083 mm),
whereas there was 1,113 mm rainfall in 2003. Farmers in this
region experienced water stress in the low rainfall years
(2001, 2002 and 2004). The monthly rainfall for the five
cropping years along with the 28 years average monthly
0
100
200
300
400
500
600
Rai
nfa
ll (m
m)
Month
2001
2002
2003
2004
2005
28 years Mean
Fig. 1 Distribution monthly rainfall during the years 2001–2005
286 Irrig Sci (2010) 28:285–299
123
rainfall have been depicted in Fig. 1. The soil of the exper-
imental site was a deep Vertisol (Typic Haplustert) with
clayey texture (52% clay) and bulk density of 1.34 Mg m-3
at 0.27 g g-1 soil water content. The moisture retentions at
0.033 and 1.5 Mpa were 40.6 and 25.6%, respectively, in the
surface (0–15 cm) layer. The pH of the surface soil (1:2 soil/
water ratio) was 7.5 with 5.2 g kg-1 soil organic carbon
(Walkley and Black 1934), 0.3 dS m-1 electrical conduc-
tivity (1:2 soil/water ratio) and 46 cmol (p?) kg-1 cation
exchange capacity. The soil was low in available N (Alkaline
KMnO4 oxidizable N as per Subbiah and Asija 1956)
(112 mg kg-1), exchangeable NH4-N being 15.5 kg ha-1
and exchangeable NO3-N being 25.3 kg ha-1 (Keeney and
Nelson 1982) and available P (0.5 M NaHCO3 extractable P
as per Olsen et al. 1954) (2.6 mg kg-1) and high in available
K (1 M ammonium acetate extractable K as per Knudsen
et al. 1982) (227 mg kg-1).
Experimental details
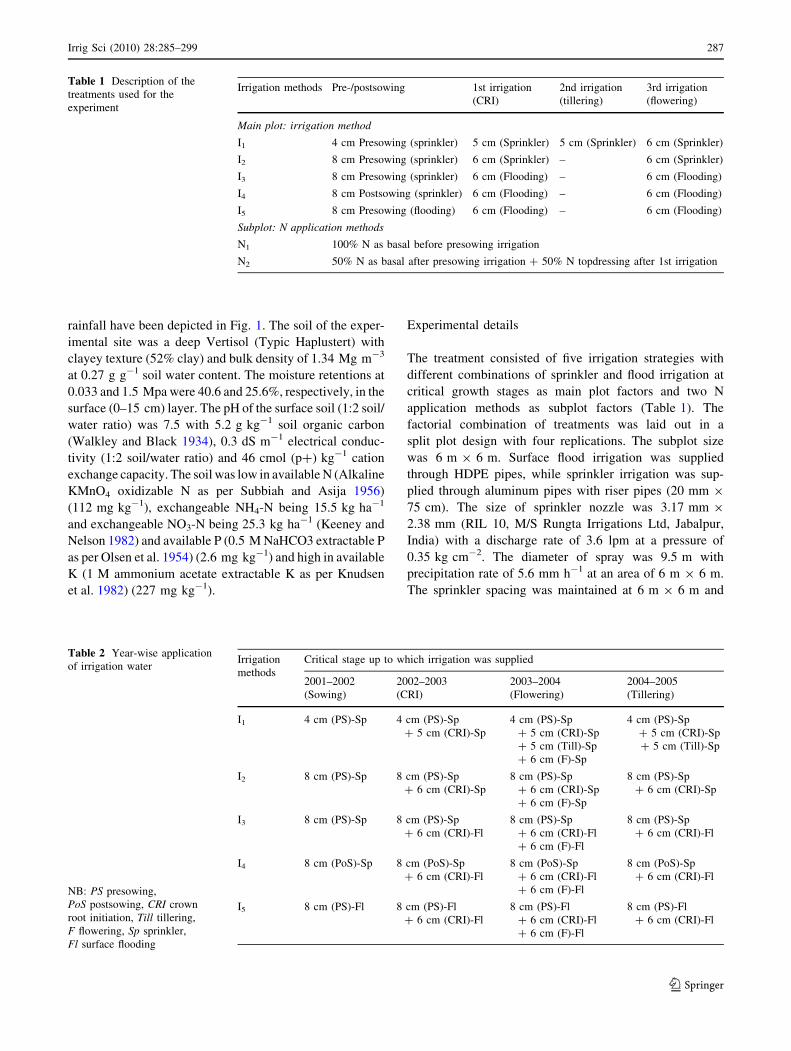
The treatment consisted of five irrigation strategies with
different combinations of sprinkler and flood irrigation at
critical growth stages as main plot factors and two N
application methods as subplot factors (Table 1). The
factorial combination of treatments was laid out in a
split plot design with four replications. The subplot size
was 6 m 9 6 m. Surface flood irrigation was supplied
through HDPE pipes, while sprinkler irrigation was sup-
plied through aluminum pipes with riser pipes (20 mm 9
75 cm). The size of sprinkler nozzle was 3.17 mm 9
2.38 mm (RIL 10, M/S Rungta Irrigations Ltd, Jabalpur,
India) with a discharge rate of 3.6 lpm at a pressure of
0.35 kg cm-2. The diameter of spray was 9.5 m with
precipitation rate of 5.6 mm h-1 at an area of 6 m 9 6 m.
The sprinkler spacing was maintained at 6 m 9 6 m and
Table 1 Description of the
treatments used for the
experiment
Irrigation methods Pre-/postsowing 1st irrigation
(CRI)
2nd irrigation
(tillering)
3rd irrigation
(flowering)
Main plot: irrigation method
I1 4 cm Presowing (sprinkler) 5 cm (Sprinkler) 5 cm (Sprinkler) 6 cm (Sprinkler)
I2 8 cm Presowing (sprinkler) 6 cm (Sprinkler) – 6 cm (Sprinkler)
I3 8 cm Presowing (sprinkler) 6 cm (Flooding) – 6 cm (Flooding)
I4 8 cm Postsowing (sprinkler) 6 cm (Flooding) – 6 cm (Flooding)
I5 8 cm Presowing (flooding) 6 cm (Flooding) – 6 cm (Flooding)
Subplot: N application methods
N1 100% N as basal before presowing irrigation
N2 50% N as basal after presowing irrigation ? 50% N topdressing after 1st irrigation
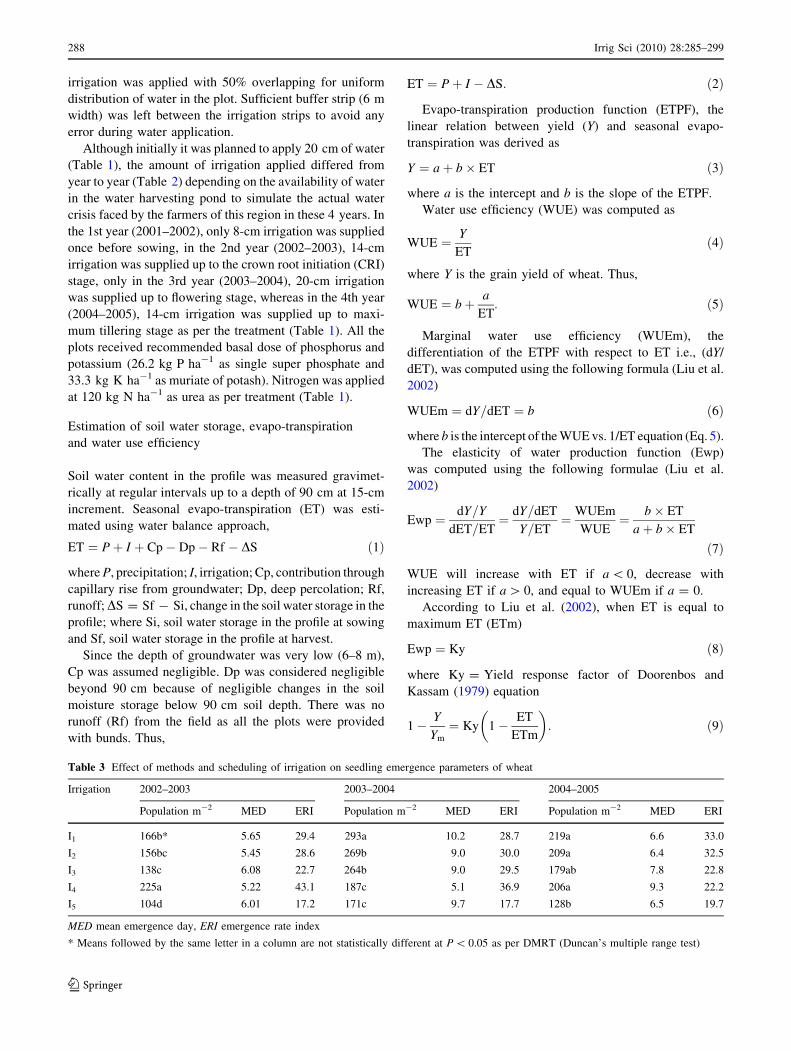
Table 2 Year-wise application
of irrigation water
NB: PS presowing,
PoS postsowing, CRI crown
root initiation, Till tillering,
F flowering, Sp sprinkler,
Fl surface flooding
Irrigation
methods
Critical stage up to which irrigation was supplied
2001–2002
(Sowing)
2002–2003
(CRI)
2003–2004
(Flowering)
2004–2005
(Tillering)
I1 4 cm (PS)-Sp 4 cm (PS)-Sp
? 5 cm (CRI)-Sp
4 cm (PS)-Sp
? 5 cm (CRI)-Sp
? 5 cm (Till)-Sp
? 6 cm (F)-Sp
4 cm (PS)-Sp
? 5 cm (CRI)-Sp
? 5 cm (Till)-Sp
I2 8 cm (PS)-Sp 8 cm (PS)-Sp
? 6 cm (CRI)-Sp
8 cm (PS)-Sp
? 6 cm (CRI)-Sp
? 6 cm (F)-Sp
8 cm (PS)-Sp
? 6 cm (CRI)-Sp
I3 8 cm (PS)-Sp 8 cm (PS)-Sp
? 6 cm (CRI)-Fl
8 cm (PS)-Sp
? 6 cm (CRI)-Fl
? 6 cm (F)-Fl
8 cm (PS)-Sp
? 6 cm (CRI)-Fl
I4 8 cm (PoS)-Sp 8 cm (PoS)-Sp
? 6 cm (CRI)-Fl
8 cm (PoS)-Sp
? 6 cm (CRI)-Fl
? 6 cm (F)-Fl
8 cm (PoS)-Sp
? 6 cm (CRI)-Fl
I5 8 cm (PS)-Fl 8 cm (PS)-Fl
? 6 cm (CRI)-Fl
8 cm (PS)-Fl
? 6 cm (CRI)-Fl
? 6 cm (F)-Fl
8 cm (PS)-Fl
? 6 cm (CRI)-Fl
Irrig Sci (2010) 28:285–299 287
123
irrigation was applied with 50% overlapping for uniform
distribution of water in the plot. Sufficient buffer strip (6 m
width) was left between the irrigation strips to avoid any
error during water application.
Although initially it was planned to apply 20 cm of water
(Table 1), the amount of irrigation applied differed from
year to year (Table 2) depending on the availability of water
in the water harvesting pond to simulate the actual water
crisis faced by the farmers of this region in these 4 years. In
the 1st year (2001–2002), only 8-cm irrigation was supplied
once before sowing, in the 2nd year (2002–2003), 14-cm
irrigation was supplied up to the crown root initiation (CRI)
stage, only in the 3rd year (2003–2004), 20-cm irrigation
was supplied up to flowering stage, whereas in the 4th year
(2004–2005), 14-cm irrigation was supplied up to maxi-
mum tillering stage as per the treatment (Table 1). All the
plots received recommended basal dose of phosphorus and
potassium (26.2 kg P ha-1 as single super phosphate and
33.3 kg K ha-1 as muriate of potash). Nitrogen was applied
at 120 kg N ha-1 as urea as per treatment (Table 1).
Estimation of soil water storage, evapo-transpiration
and water use efficiency
Soil water content in the profile was measured gravimet-
rically at regular intervals up to a depth of 90 cm at 15-cm
increment. Seasonal evapo-transpiration (ET) was esti-
mated using water balance approach,
ET ¼ Pþ I þ Cp� Dp� Rf � DS ð1Þ
where P, precipitation; I, irrigation; Cp, contribution through
capillary rise from groundwater; Dp, deep percolation; Rf,
runoff; DS = Sf - Si, change in the soil water storage in the
profile; where Si, soil water storage in the profile at sowing
and Sf, soil water storage in the profile at harvest.
Since the depth of groundwater was very low (6–8 m),
Cp was assumed negligible. Dp was considered negligible
beyond 90 cm because of negligible changes in the soil
moisture storage below 90 cm soil depth. There was no
runoff (Rf) from the field as all the plots were provided
with bunds. Thus,
ET ¼ Pþ I � DS: ð2Þ
Evapo-transpiration production function (ETPF), the
linear relation between yield (Y) and seasonal evapo-
transpiration was derived as
Y ¼ aþ b� ET ð3Þ
where a is the intercept and b is the slope of the ETPF.
Water use efficiency (WUE) was computed as
WUE ¼ Y
ETð4Þ
where Y is the grain yield of wheat. Thus,
WUE ¼ bþ a
ET: ð5Þ
Marginal water use efficiency (WUEm), the
differentiation of the ETPF with respect to ET i.e., (dY/
dET), was computed using the following formula (Liu et al.
2002)
WUEm ¼ dY=dET ¼ b ð6Þ
where b is the intercept of the WUE vs. 1/ET equation (Eq. 5).
The elasticity of water production function (Ewp)
was computed using the following formulae (Liu et al.
2002)
Ewp ¼ dY=Y
dET=ET¼ dY=dET
Y=ET¼WUEm
WUE¼ b� ET
aþ b� ET
ð7Þ
WUE will increase with ET if a \ 0, decrease with
increasing ET if a [ 0, and equal to WUEm if a = 0.
According to Liu et al. (2002), when ET is equal to
maximum ET (ETm)
Ewp ¼ Ky ð8Þ
where Ky = Yield response factor of Doorenbos and
Kassam (1979) equation
1� Y
Ym
¼ Ky 1� ET
ETm
� �: ð9Þ
Table 3 Effect of methods and scheduling of irrigation on seedling emergence parameters of wheat
Irrigation 2002–2003 2003–2004 2004–2005
Population m-2 MED ERI Population m-2 MED ERI Population m-2 MED ERI
I1 166b* 5.65 29.4 293a 10.2 28.7 219a 6.6 33.0
I2 156bc 5.45 28.6 269b 9.0 30.0 209a 6.4 32.5
I3 138c 6.08 22.7 264b 9.0 29.5 179ab 7.8 22.8
I4 225a 5.22 43.1 187c 5.1 36.9 206a 9.3 22.2
I5 104d 6.01 17.2 171c 9.7 17.7 128b 6.5 19.7
MED mean emergence day, ERI emergence rate index
* Means followed by the same letter in a column are not statistically different at P \ 0.05 as per DMRT (Duncan’s multiple range test)
288 Irrig Sci (2010) 28:285–299
123
Soil water extraction from different soil layers was
computed as
SWEi ¼Xk
j¼1
Dwij � qi � zi ð10Þ
where SWEi, soil water extraction from ith layer; Dwij,
change in the gravimetric water content of the ith layer at
jth sampling interval; qi, bulk density of the ith layer; zi,
depth of ith layer; and k, number of sampling intervals.
Total soil water extraction from the profile was com-
puted as
SWE ¼Xn
i¼1
SWEi ð11Þ
where n is the number of layers in the profile.
Estimation of nitrogen use efficiency
After leaving the border rows of 1 m from all the four sides
of the plot, the net plot was harvested manually. Then,
representative plant samples were collected for N analysis.
After processing, the grain and straw samples were ana-
lyzed for total N content using Kjeldhal method A.O.A.C
(1970). Using the biomass and N concentration, the N
uptake by grain and straw was estimated. These data were
utilized to compute different nitrogen use efficiency
parameters as follows:
N uptake kg ha�1� �
¼ N concentration %ð Þ� Biomass kg ha�1
� �ð12Þ
N Harvest Index ðNHI)
¼N uptake by grain kg ha�1
� �Total N uptake by grain and straw kg ha�1
� � ð13Þ
N requirement NR, kg N uptake 100 kg�1 grain� �
¼ 100�Total N uptake kgha�1
� �Grain yield kg ha�1
� � ð14Þ
Partial factor productivity of N ðPFPN)
¼Grain yield kg ha�1
� �Total N applied kg ha�1
� � ð15Þ
N utilization efficiency NUtE, kg kg�1� �
¼Grain yield kg ha�1
� �Total N uptake kg ha�1
� �: ð16Þ
Root studies
Root samples were collected at the flowering stage of
wheat using root sampling cores (6 cm height, 8.6 cm
diameter) up to a depth of 30 cm. After thorough washing
in the root washing system and staining with methylene
blue staining agent, the root length was determined with a
Delta T scanner and image analysis system (Delta-T
Devices Ltd., Burwell, Cambridge, England).
The root length density (RLD) of a given layer was
computed as
RLDi ¼ Li=V ð17Þ
where Li, length of roots collected from ith layer, V, vol-
ume of the sampling core.
The root mass density (RMD) of a given layer was
computed using the oven dry weight of the root mass
collected in the core samplers using the following formulae
RMDi ¼ Mi=V ð18Þ
where Mi, mass of roots collected from ith layer, V, volume
of the sampling core.
Seedling emergence study
Seedling emergence parameters were determined by daily
counting of the number of emerged seedlings in 1 m2 area
with three replications until a constant value was attained.
0.0 1.0 2.0 3.0 4.0 5.0
0-7.5
7.5-15
15-22.5
22.5-30
RLD (cm cm-3)
Dep
th (
cm)
(a) Root length density
I1
I2
I3
I4
I5
0.0 0.5 1.0 1.5 2.0 2.5 3.0
0-7.5
7.5-15
15-22.5
22.5-30
RMD (mg cm-3)
So
il d
epth
(cm
)
(b) Root mass density
I1I2I3I4I5
NS
NS
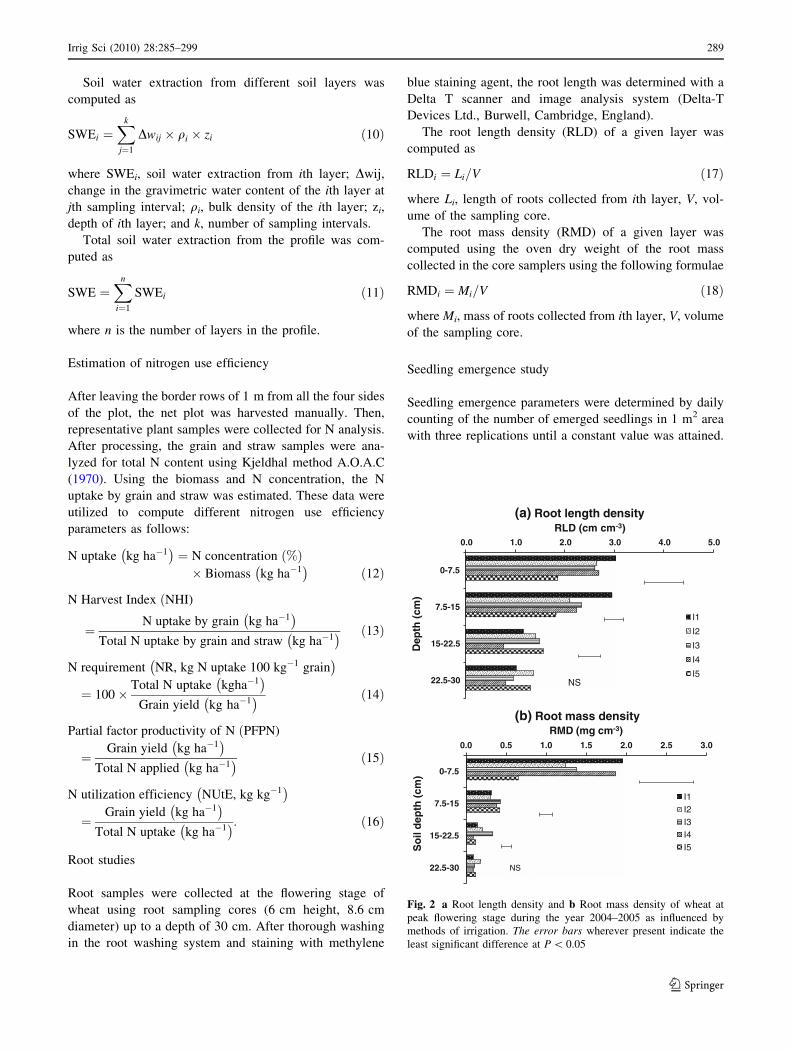
Fig. 2 a Root length density and b Root mass density of wheat at
peak flowering stage during the year 2004–2005 as influenced by
methods of irrigation. The error bars wherever present indicate the
least significant difference at P \ 0.05
Irrig Sci (2010) 28:285–299 289
123

The emergence rate index (ERI) was estimated follow-
ing Bilbro and Wanjura (1982)
ERI ¼ No: of emerged plants=mð Þ=Mean emergence day MEDð Þ ð21Þ
where
MED ¼Xn
i
NiDi
,Xn
i
Ni ð20Þ
Ni is the number of plants emerged in any particular day
(Di), and Di is the number of days after sowing.
Statistical analysis
All the data were statistically analyzed using analysis of
variance (ANOVA) as applicable to split plot design
(Gomez and Gomez 1984). The significance of the
treatment effects was determined using F-test, and the
difference between the means was estimated by using
least significance difference and Duncan’s multiple range
test at 5% probability level. Regression analyses were
determined using the data analysis tool pack of MS
excel.
15
20
25
30
35
40
0 25 50 75 100 125 150
So
il m
ois
ture
sto
rag
e (c
m)
Days after sowing
Year 2001-02 I1
I2
I3
I4
I5
0.033 MPa
1.5 MPa
15
20
25
30
35
40
0 25 50 75 100 125 150
So
il m
ois
ture
sto
rag
e (c
m)
Days after sowing
Year 2002-03
I1
I2
I3
I4
I5
0.033 MPa
1.5 MPa
15
20
25
30
35
40
0 25 50 75 100 125 150
So
il m
ois
ture
Sto
rag
e (c
m)
Days afer sowing
Year 2003-04 I1
I2
I3
I4
I5
0.033 MPa
1.5 MPa
15
20
25
30
35
40
0 25 50 75 100 125 150
So
il m
ois
ture
sto
rag
e (c
m)
Days after sowing
Year 2004-05 I1
I2
I3
I4
I5
0.033 MPa
1.5 MPa
Fig. 3 Temporal variation in
the soil water storage in the
profile (0–90 cm) during wheat
growth in different years as
influenced by the methods of
irrigation
290 Irrig Sci (2010) 28:285–299
123
Results and discussion
Seedling emergence under different methods
of irrigation
Flood-irrigated plots (I5) had lower plant population and
emergence rate index than sprinkler-irrigated plots
(Table 3). This may be attributed to uniform wetting of
seed zone under sprinkler irrigation, whereas under flood
irrigation, there was chance of non-uniform wetting of seed
zone due to preferential flow of water through shrinkage
cracks (Smalling and Bouma 1992). Mean emergence day
(MED), the time taken for complete emergence, was lowest
in I4 during 2002–2003 and 2003–2004 and in I2 during
2004–2005. The emergence rate index (ERI) was highest in
I4 during 2002–2003 and 2003–2004, whereas during the
year 2004–2005, the highest ERI was recorded in I1.
However, in all the years of study, the lowest ERI was
recorded in I5. There was no significant difference among
the nitrogen treatments with respect to seedling emergence.
012345678
0 1 37 64 85 121
So
il m
ois
ture
sto
rag
e (c
m)
Days after sowing
2001-02I1
I2
I3
I4
I5
0.033 MPa
1.5 MPa
0
2
4
6
8
2 15 22 48 70 108
soil
mo
istu
re s
tora
ge
(cm
)
Days after sowing
2002-03
I1
I2
I3
I4
I5
0.033 MPa
1.5 MPa
01234567
1 18 21 29 36 56 70 79 111 123
So
il m
ois
ture
sto
rag
e (c
m)
Days after sowing
2003-04I1
I2
I3
I4
I5
0.033 MPa
1.5 MPa
0
2
4
6
8
0 4 19 25 54 66 90 106 146
So
il m
ois
ture
sto
rag
e (c
m)
Days after sowing
2004-05I1
I2
I3
I4
I5
0.033 MPa
1.5 MPa
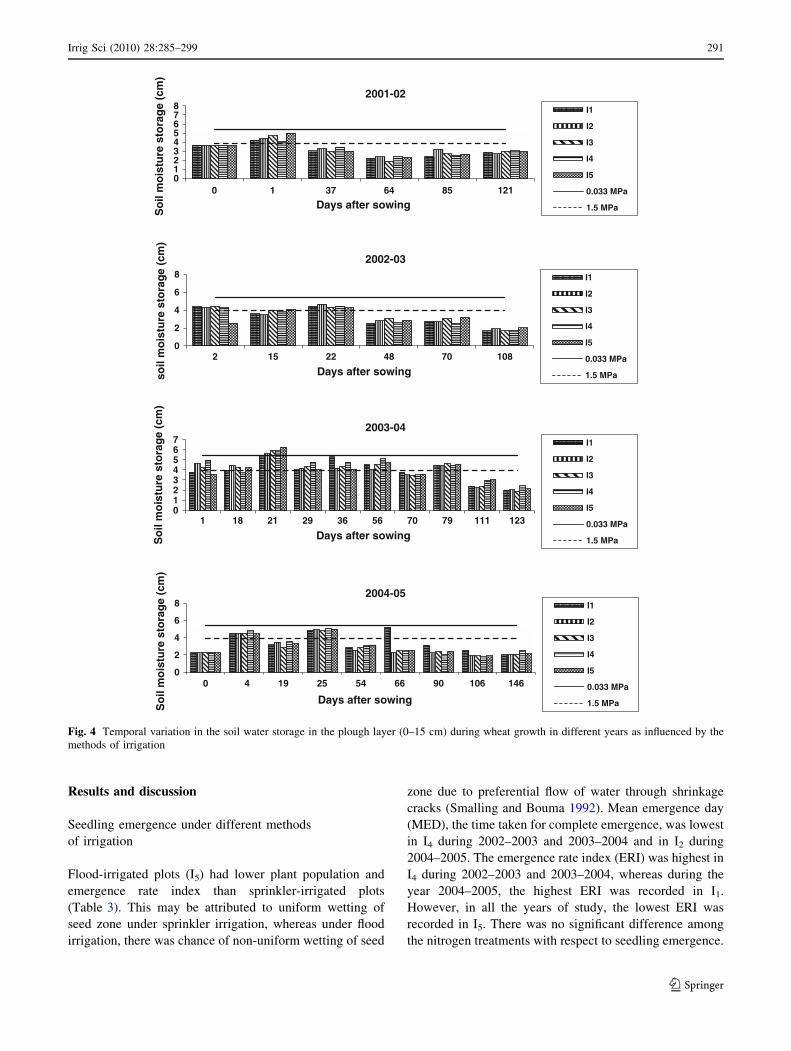
Fig. 4 Temporal variation in the soil water storage in the plough layer (0–15 cm) during wheat growth in different years as influenced by the
methods of irrigation
Irrig Sci (2010) 28:285–299 291
123
Root growth under different methods of irrigation
Irrespective of the treatments, the maximum root length
density (RLD) and root mass density (RMD) of wheat
occurred in the 0–15 cm soil layer, and there was decline in
the RLD and RMD with depth (Fig. 2a, b). The reduction
in the RLD with depth was less than that in RMD. This
implies that the length/mass ratio of wheat roots increased
more in lower soil layers than in upper layers. Hence,
mostly finer roots were found in the lower soil layers. The
RLD and RMD of wheat under sprinkler irrigation were
higher than that of flood irrigation (I5) treatment. In the
plough layer (0–15 cm), the maximum RLD and RMD
were recorded under I1. This may be attributed to frequent
and light irrigation under this treatment, which resulted in
higher soil moisture storage for longer period of time.
Soil water dynamics and soil water extraction
Temporal variations in the soil water storage in the profile
(0–90 cm) for the 4 years (2001–2005) are presented in
Fig. 3. The numbers of irrigations are reflected in terms of
numbers of peaks in soil moisture storage observed during
the crop growth period. The difference in soil water storage
in the profile due to irrigation was not significant for the
same amount and frequency of irrigation. However, when
soil water storage of the surface layer (0–15 cm) was
compared, relatively higher storage was recorded in I4
(Fig. 4). This was attributed to the fact that unlike other
treatments, the soil was not ploughed for sowing following
irrigation in I4 treatment as irrigation was supplied
immediately after dry sowing. So the evaporation loss of
water was expected to be low in this treatment than other
irrigation treatments.
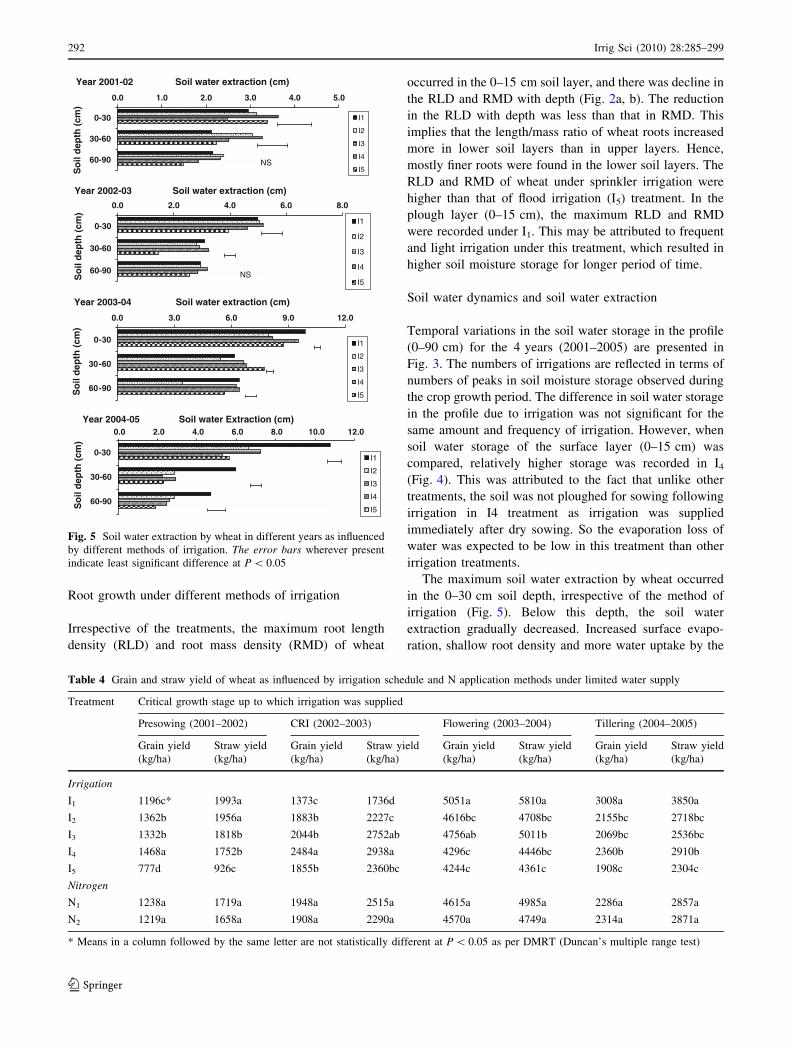
The maximum soil water extraction by wheat occurred
in the 0–30 cm soil depth, irrespective of the method of
irrigation (Fig. 5). Below this depth, the soil water
extraction gradually decreased. Increased surface evapo-
ration, shallow root density and more water uptake by the
0.0 1.0 2.0 3.0 4.0 5.0
0-30
30-60
60-90
Soil water extraction (cm)S
oil
dep
th (
cm)
Year 2001-02
I1
I2
I3
I4
I5
0.0 2.0 4.0 6.0 8.0
0-30
30-60
60-90
Soil water extraction (cm)
So
il d
epth
(cm
)
Year 2002-03
I1
I2
I3
I4
I5
0.0 3.0 6.0 9.0 12.0
0-30
30-60
60-90
Soil water extraction (cm)
So
il d
epth
(cm
)
Year 2003-04
I1
I2
I3
I4
I5
0.0 2.0 4.0 6.0 8.0 10.0 12.0
0-30
30-60
60-90
Soil water Extraction (cm)
So
il d
epth
(cm
)
Year 2004-05
I1
I2
I3
I4
I5
NS
NS
Fig. 5 Soil water extraction by wheat in different years as influenced
by different methods of irrigation. The error bars wherever present
indicate least significant difference at P \ 0.05
Table 4 Grain and straw yield of wheat as influenced by irrigation schedule and N application methods under limited water supply
Treatment Critical growth stage up to which irrigation was supplied
Presowing (2001–2002) CRI (2002–2003) Flowering (2003–2004) Tillering (2004–2005)
Grain yield
(kg/ha)
Straw yield
(kg/ha)
Grain yield
(kg/ha)
Straw yield
(kg/ha)
Grain yield
(kg/ha)
Straw yield
(kg/ha)
Grain yield
(kg/ha)
Straw yield
(kg/ha)
Irrigation
I1 1196c* 1993a 1373c 1736d 5051a 5810a 3008a 3850a
I2 1362b 1956a 1883b 2227c 4616bc 4708bc 2155bc 2718bc
I3 1332b 1818b 2044b 2752ab 4756ab 5011b 2069bc 2536bc
I4 1468a 1752b 2484a 2938a 4296c 4446bc 2360b 2910b
I5 777d 926c 1855b 2360bc 4244c 4361c 1908c 2304c
Nitrogen
N1 1238a 1719a 1948a 2515a 4615a 4985a 2286a 2857a
N2 1219a 1658a 1908a 2290a 4570a 4749a 2314a 2871a
* Means in a column followed by the same letter are not statistically different at P \ 0.05 as per DMRT (Duncan’s multiple range test)
292 Irrig Sci (2010) 28:285–299
123
crops from the surface layer due to availability of irrigation
water and presence of active roots in the surface layer may
be the possible reason for the decline in soil water
extraction at lower depths (Hati et al. 2001). The soil
moisture extraction from 0–30 cm soil depth under sprin-
kler irrigation or combination of sprinkler and flood irri-
gation was significantly higher than the flood irrigation
treatment.
Table 5 Effect of irrigation
scheduling and N application
methods on harvest index of
wheat under limited water
supply
* The means followed by the
same letter in a column are not
statistically different at
P \ 0.05 as per DMRT
(Duncan’s multiple range test)
Treatment Critical growth stage up to which irrigation was supplied (harvest index)
Presowing
(2001–2002)
CRI
(2002–2003)
Flowering
(2003–2004)
Tillering
(2004–2005)
Irrigation
I1 0.456a 0.441a 0.494a 0.450a
I2 0.408c 0.467a 0.496a 0.441a
I3 0.431b 0.426a 0.488ab 0.451a
I4 0.426b 0.459a 0.493a 0.446a
I5 0.410c 0.449a 0.467b 0.437a
Nitrogen
N1 0.424b 0.441a 0.483b 0.443a
N2 0.428a 0.456a 0.492a 0.447a
0150300450600750
I1 I2 I3 I4 I5
Wat
er b
alac
e co
mp
on
ents
(m
m)
Irrigation treatment
Year 2001-02
ET
Rain
Irrigation
Soil moisture
0150300450600750
I1 I2 I3 I4 I5
Wat
er b
alan
ce
com
po
nen
t (m
m)
Irrigation treatment
Year 2002-03ET
Rain
Irrigation
Soil moisture
0150300450600750
I1 I2 I3 I4 I5
Wat
er b
alan
ce
com
po
nen
t (m
m)
Irrigation treatment
Year 2003-04
ET
Rain
Irrigation
Soil moisture
0150300450600750
I1 I2 I3 I4 I5
wat
er b
alan
ce
com
po
nen
t (m
m)
Irrigation treatment
Year 2004-05
ET
Rain
Irrigation
Soil moisture
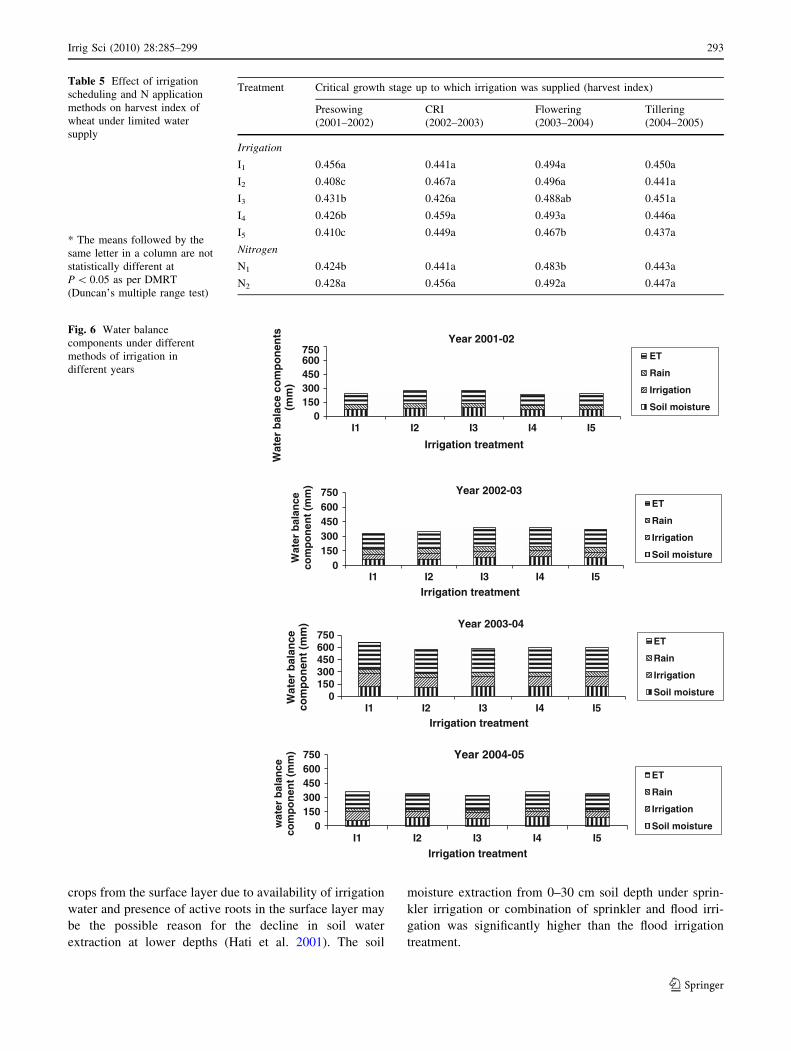
Fig. 6 Water balance
components under different
methods of irrigation in
different years
Irrig Sci (2010) 28:285–299 293
123
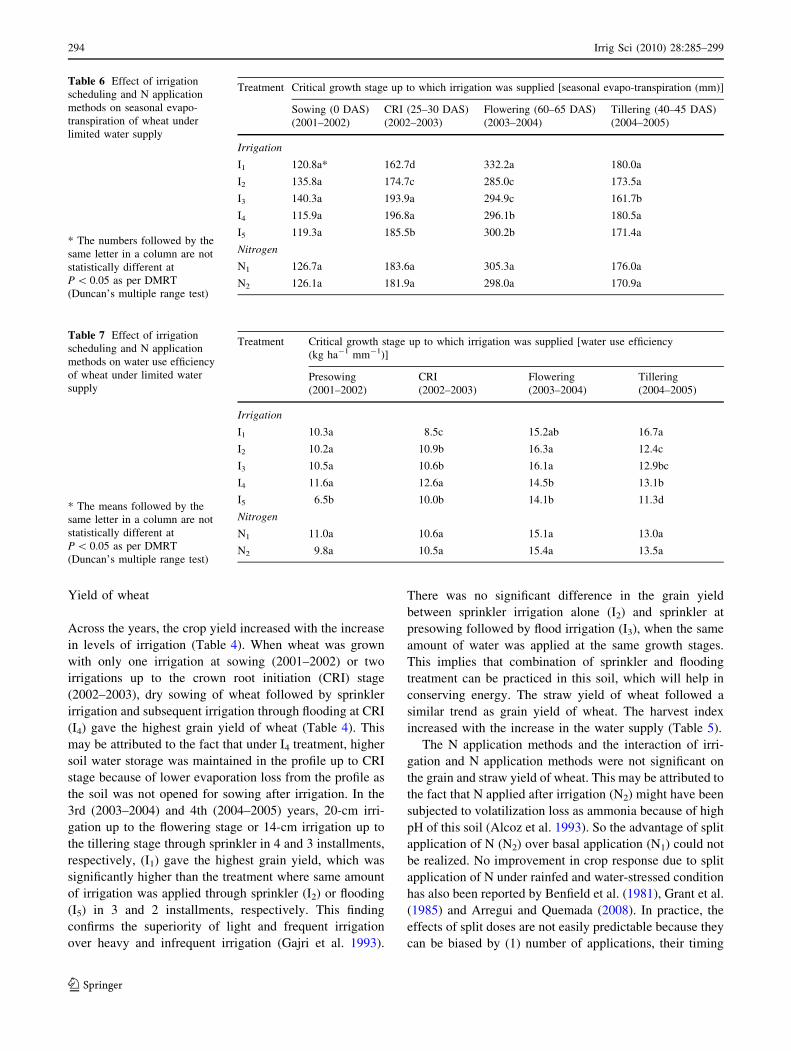
Yield of wheat
Across the years, the crop yield increased with the increase
in levels of irrigation (Table 4). When wheat was grown
with only one irrigation at sowing (2001–2002) or two
irrigations up to the crown root initiation (CRI) stage
(2002–2003), dry sowing of wheat followed by sprinkler
irrigation and subsequent irrigation through flooding at CRI
(I4) gave the highest grain yield of wheat (Table 4). This
may be attributed to the fact that under I4 treatment, higher
soil water storage was maintained in the profile up to CRI
stage because of lower evaporation loss from the profile as
the soil was not opened for sowing after irrigation. In the
3rd (2003–2004) and 4th (2004–2005) years, 20-cm irri-
gation up to the flowering stage or 14-cm irrigation up to
the tillering stage through sprinkler in 4 and 3 installments,
respectively, (I1) gave the highest grain yield, which was
significantly higher than the treatment where same amount
of irrigation was applied through sprinkler (I2) or flooding
(I5) in 3 and 2 installments, respectively. This finding
confirms the superiority of light and frequent irrigation
over heavy and infrequent irrigation (Gajri et al. 1993).
There was no significant difference in the grain yield
between sprinkler irrigation alone (I2) and sprinkler at
presowing followed by flood irrigation (I3), when the same
amount of water was applied at the same growth stages.
This implies that combination of sprinkler and flooding
treatment can be practiced in this soil, which will help in
conserving energy. The straw yield of wheat followed a
similar trend as grain yield of wheat. The harvest index
increased with the increase in the water supply (Table 5).
The N application methods and the interaction of irri-
gation and N application methods were not significant on
the grain and straw yield of wheat. This may be attributed to
the fact that N applied after irrigation (N2) might have been
subjected to volatilization loss as ammonia because of high
pH of this soil (Alcoz et al. 1993). So the advantage of split
application of N (N2) over basal application (N1) could not
be realized. No improvement in crop response due to split
application of N under rainfed and water-stressed condition
has also been reported by Benfield et al. (1981), Grant et al.
(1985) and Arregui and Quemada (2008). In practice, the
effects of split doses are not easily predictable because they
can be biased by (1) number of applications, their timing
Table 6 Effect of irrigation
scheduling and N application
methods on seasonal evapo-
transpiration of wheat under
limited water supply
* The numbers followed by the
same letter in a column are not
statistically different at
P \ 0.05 as per DMRT
(Duncan’s multiple range test)
Treatment Critical growth stage up to which irrigation was supplied [seasonal evapo-transpiration (mm)]
Sowing (0 DAS)
(2001–2002)
CRI (25–30 DAS)
(2002–2003)
Flowering (60–65 DAS)
(2003–2004)
Tillering (40–45 DAS)
(2004–2005)
Irrigation
I1 120.8a* 162.7d 332.2a 180.0a
I2 135.8a 174.7c 285.0c 173.5a
I3 140.3a 193.9a 294.9c 161.7b
I4 115.9a 196.8a 296.1b 180.5a
I5 119.3a 185.5b 300.2b 171.4a
Nitrogen
N1 126.7a 183.6a 305.3a 176.0a
N2 126.1a 181.9a 298.0a 170.9a
Table 7 Effect of irrigation
scheduling and N application
methods on water use efficiency
of wheat under limited water
supply
* The means followed by the
same letter in a column are not
statistically different at
P \ 0.05 as per DMRT
(Duncan’s multiple range test)
Treatment Critical growth stage up to which irrigation was supplied [water use efficiency
(kg ha-1 mm-1)]
Presowing
(2001–2002)
CRI
(2002–2003)
Flowering
(2003–2004)
Tillering
(2004–2005)
Irrigation
I1 10.3a 8.5c 15.2ab 16.7a
I2 10.2a 10.9b 16.3a 12.4c
I3 10.5a 10.6b 16.1a 12.9bc
I4 11.6a 12.6a 14.5b 13.1b
I5 6.5b 10.0b 14.1b 11.3d
Nitrogen
N1 11.0a 10.6a 15.1a 13.0a
N2 9.8a 10.5a 15.4a 13.5a
294 Irrig Sci (2010) 28:285–299
123
and quantities (Mahler et al. 1994), (2) the weather condi-
tions during the season that influence leaching, volatiliza-
tion and crop growth (Alcoz et al. 1993) and (3) the mineral
nitrogen amount present in the soil at the time of fertilizer
application (Sowers et al. 1994).
Seasonal evapo-transpiration and water use efficiency
With the increase in the amount of irrigation application,
the seasonal evapo-transpiration increased and maximum
seasonal evapo-transpiration was recorded during the year
2003–2004 when 20-cm irrigation was applied (Fig. 6;
Table 6). During the years 2003–2004 and 2004–2005, the
maximum seasonal ET was recorded in I1, whereas during
the year 2002–2003, the maximum seasonal ET was
recorded in I4. However, during the year 2001–2002, there
was no significant difference in the seasonal ET among the
irrigation treatments. The effect of nitrogen management on
seasonal ET was not significant in all the 4 years of study.
Except in the year 2002–2003, sprinkler irrigation (I2) or
combination of sprinkler and flood irrigation (I3 or I4) reg-
istered significantly higher water use efficiency over flood
irrigation system (I5) for the same amount and frequency of
irrigation in the rest 3 years (Table 7). During the year 2001–
2002 and 2002–2003, the maximum WUE was recorded in
I4, whereas during the year 2003–2004, the maximum WUE
was recorded in I2, and in the year 2004–2005, the maximum
WUE was observed in I1. This was attributed to uniform
water application, better root proliferation, higher soil water
extraction recorded in sprinkler-irrigated plots than flood-
irrigated plots. The superiority of sprinkler irrigation over
flood irrigation with respect to higher water use efficiency
has been reported by Verma and Shrivastava (1992), Malik
et al. (1987) and Ghani et al. (2001) in wheat, Home et al.
(2002) in okra, Pawar et al. (2002) in potato and El Yazal
et al. (1998) in cotton. There is also report that compared to
surface flooding; sprinkler irrigation system improves
physical property of soil, which might have contributed to
higher water use efficiency in this irrigation system. Grazy
et al. (1989) reported that there was improvement in the
water stable aggregates under micro sprinkler irrigation than
flood irrigation. Khan (1988) observed that in Vertisols,
drying after surface irrigation resulted in 2–3 times wide and
0.5–1 m deep cracks compared to sprinkler irrigation, where
only a few fine cracks were found.
The N application methods and the interaction of irri-
gation and N application method were not significant on
the water use efficiency of wheat in all the 4 years of study.
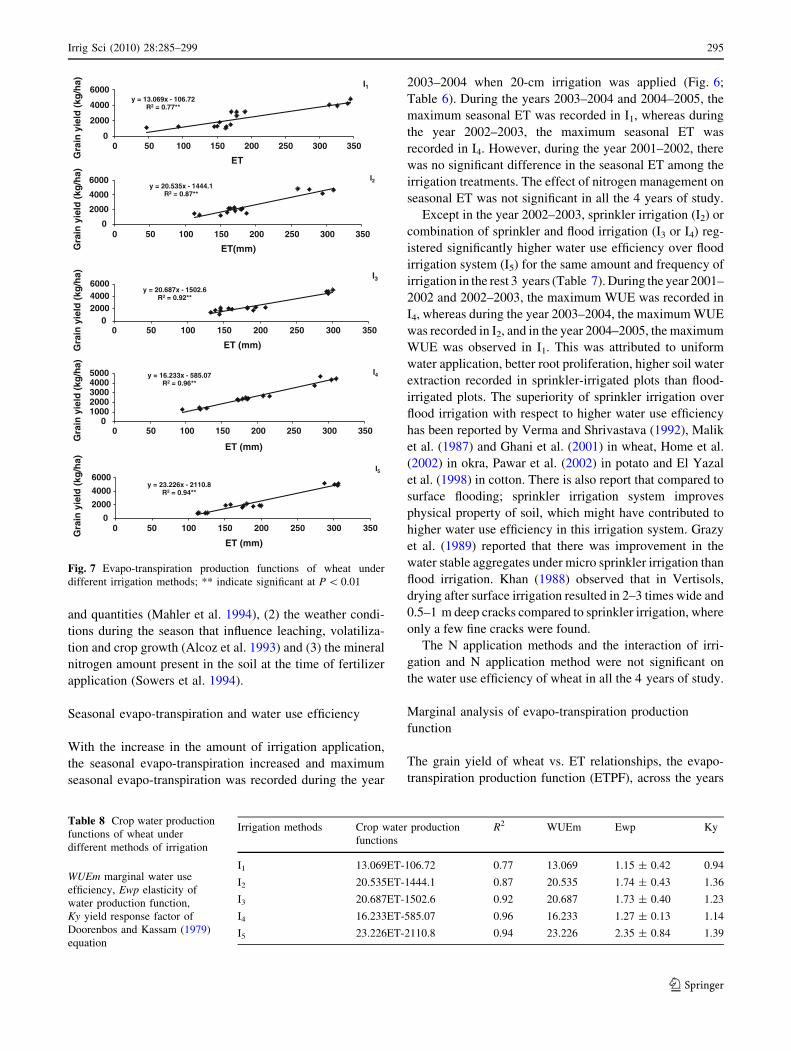
Marginal analysis of evapo-transpiration production
function
The grain yield of wheat vs. ET relationships, the evapo-
transpiration production function (ETPF), across the years
y = 16.233x - 585.07R2 = 0.96**
010002000300040005000
0 50 100 150 200 250 300 350
Gra
in y
ield
(kg
/ha)
ET (mm)
I4
y = 13.069x - 106.72R2 = 0.77**
0
2000
4000
6000
0 50 100 150 200 250 300 350
Gra
in y
ield
(kg
/ha)
ET
I1
y = 20.535x - 1444.1R2 = 0.87**
0
2000
4000
6000
0 50 100 150 200 250 300 350
Gra
in y
ield
(kg
/ha)
ET(mm)
I2
y = 20.687x - 1502.6R2 = 0.92**
0200040006000
0 50 100 150 200 250 300 350
Gra
in y
ield
(kg
/ha)
ET (mm)
I3
y = 23.226x - 2110.8R2 = 0.94**
0
2000
4000
6000
0 50 100 150 200 250 300 350
Gra
in y
ield
(kg
/ha)
ET (mm)
I5
Fig. 7 Evapo-transpiration production functions of wheat under
different irrigation methods; ** indicate significant at P \ 0.01
Table 8 Crop water production
functions of wheat under
different methods of irrigation
WUEm marginal water use
efficiency, Ewp elasticity of
water production function,
Ky yield response factor of
Doorenbos and Kassam (1979)
equation
Irrigation methods Crop water production
functions
R2 WUEm Ewp Ky
I1 13.069ET-106.72 0.77 13.069 1.15 ± 0.42 0.94
I2 20.535ET-1444.1 0.87 20.535 1.74 ± 0.43 1.36
I3 20.687ET-1502.6 0.92 20.687 1.73 ± 0.40 1.23
I4 16.233ET-585.07 0.96 16.233 1.27 ± 0.13 1.14
I5 23.226ET-2110.8 0.94 23.226 2.35 ± 0.84 1.39
Irrig Sci (2010) 28:285–299 295
123
were linear in the present study (Fig. 7). It was observed
that 77–96% variation in crop yield could be explained by
variation in ET (Table 8). The slope of the ETPF, the
marginal water use efficiency (WUEm), was maximum for
I5 and minimum for I1. With the increase in the ET by
1 mm, the grain yield of wheat increased by 13–23 kg.
Zhang and Oweis (1999) and Steiner et al. (1985) also
observed an increase in grain yield of wheat by 6.8–
10.8 kg ha-1 per mm increase in ET. The intercept of the
ETPF (a) is less than 0 in all the treatments indicating
increase in WUE with the increase in ET (Liu et al. 2002).
The elasticity of water production function (Ewp) was
greater than 1 in all the treatments (Table 8). The maxi-
mum Ewp was recorded in I5 and the minimum value was
recorded in I1. The yield response factor (Ky) of Dooren-
bos and Kassam (1979) was estimated from the ETPF and
the maximum value of Ky (1.39) was recorded in I5 and the
minimum value (0.94) was recorded in I1. Probably
because of lower yield level in I5 the Ky and Ewp were
higher in this treatment.
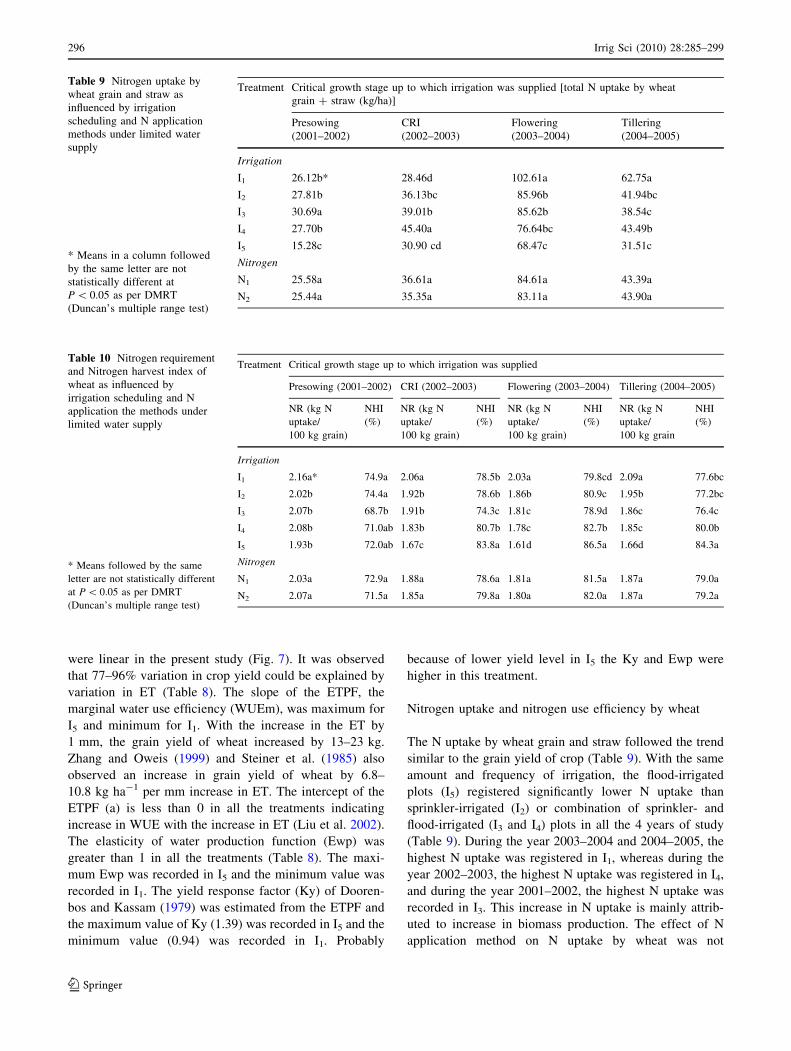
Nitrogen uptake and nitrogen use efficiency by wheat
The N uptake by wheat grain and straw followed the trend
similar to the grain yield of crop (Table 9). With the same
amount and frequency of irrigation, the flood-irrigated
plots (I5) registered significantly lower N uptake than
sprinkler-irrigated (I2) or combination of sprinkler- and
flood-irrigated (I3 and I4) plots in all the 4 years of study
(Table 9). During the year 2003–2004 and 2004–2005, the
highest N uptake was registered in I1, whereas during the
year 2002–2003, the highest N uptake was registered in I4,
and during the year 2001–2002, the highest N uptake was
recorded in I3. This increase in N uptake is mainly attrib-
uted to increase in biomass production. The effect of N
application method on N uptake by wheat was not
Table 9 Nitrogen uptake by
wheat grain and straw as
influenced by irrigation
scheduling and N application
methods under limited water
supply
* Means in a column followed
by the same letter are not
statistically different at
P \ 0.05 as per DMRT
(Duncan’s multiple range test)
Treatment Critical growth stage up to which irrigation was supplied [total N uptake by wheat
grain ? straw (kg/ha)]
Presowing
(2001–2002)
CRI
(2002–2003)
Flowering
(2003–2004)
Tillering
(2004–2005)
Irrigation
I1 26.12b* 28.46d 102.61a 62.75a
I2 27.81b 36.13bc 85.96b 41.94bc
I3 30.69a 39.01b 85.62b 38.54c
I4 27.70b 45.40a 76.64bc 43.49b
I5 15.28c 30.90 cd 68.47c 31.51c
Nitrogen
N1 25.58a 36.61a 84.61a 43.39a
N2 25.44a 35.35a 83.11a 43.90a
Table 10 Nitrogen requirement
and Nitrogen harvest index of
wheat as influenced by
irrigation scheduling and N
application the methods under
limited water supply
* Means followed by the same
letter are not statistically different
at P \ 0.05 as per DMRT
(Duncan’s multiple range test)
Treatment Critical growth stage up to which irrigation was supplied
Presowing (2001–2002) CRI (2002–2003) Flowering (2003–2004) Tillering (2004–2005)
NR (kg N
uptake/
100 kg grain)
NHI
(%)
NR (kg N
uptake/
100 kg grain)
NHI
(%)
NR (kg N
uptake/
100 kg grain)
NHI
(%)
NR (kg N
uptake/
100 kg grain
NHI
(%)
Irrigation
I1 2.16a* 74.9a 2.06a 78.5b 2.03a 79.8cd 2.09a 77.6bc
I2 2.02b 74.4a 1.92b 78.6b 1.86b 80.9c 1.95b 77.2bc
I3 2.07b 68.7b 1.91b 74.3c 1.81c 78.9d 1.86c 76.4c
I4 2.08b 71.0ab 1.83b 80.7b 1.78c 82.7b 1.85c 80.0b
I5 1.93b 72.0ab 1.67c 83.8a 1.61d 86.5a 1.66d 84.3a
Nitrogen
N1 2.03a 72.9a 1.88a 78.6a 1.81a 81.5a 1.87a 79.0a
N2 2.07a 71.5a 1.85a 79.8a 1.80a 82.0a 1.87a 79.2a
296 Irrig Sci (2010) 28:285–299
123
significant as the biomass was not significantly influenced
by the split application of N.
Across the years, the nitrogen harvest index (NHI), i.e.,
proportion of nitrogen uptake in grain, increased from 68.7
to 74.9% in 2001–2002 to 78.9 to 86.5% in 2003–2004 due
to increase in water supply (Table 10). The maximum NHI
was recorded in I5, and the minimum value was recorded in
I3 in all the years except in 2001–2002. In the year 2001–
2002, the maximum NHI was recorded in I1. Lopez Bellido
et al. (2006) reported that NHI was significantly affected by
year, and the highest value was recorded with lowest bio-
mass and grain yield.
The nitrogen requirement (NR) i.e., kg N uptake to
produce 100 kg of wheat grain decreased in 2003–2004
(from 1.61 to 2.03) compared to 2001–2002 (from 1.93 to
2.16) due to increase in water supply (Table 10). Under the
flood irrigation system (I5), the nitrogen requirement was
less than the sprinkler irrigation (I1, I2) or combination of
sprinkler and flood irrigation system (I3, I4).
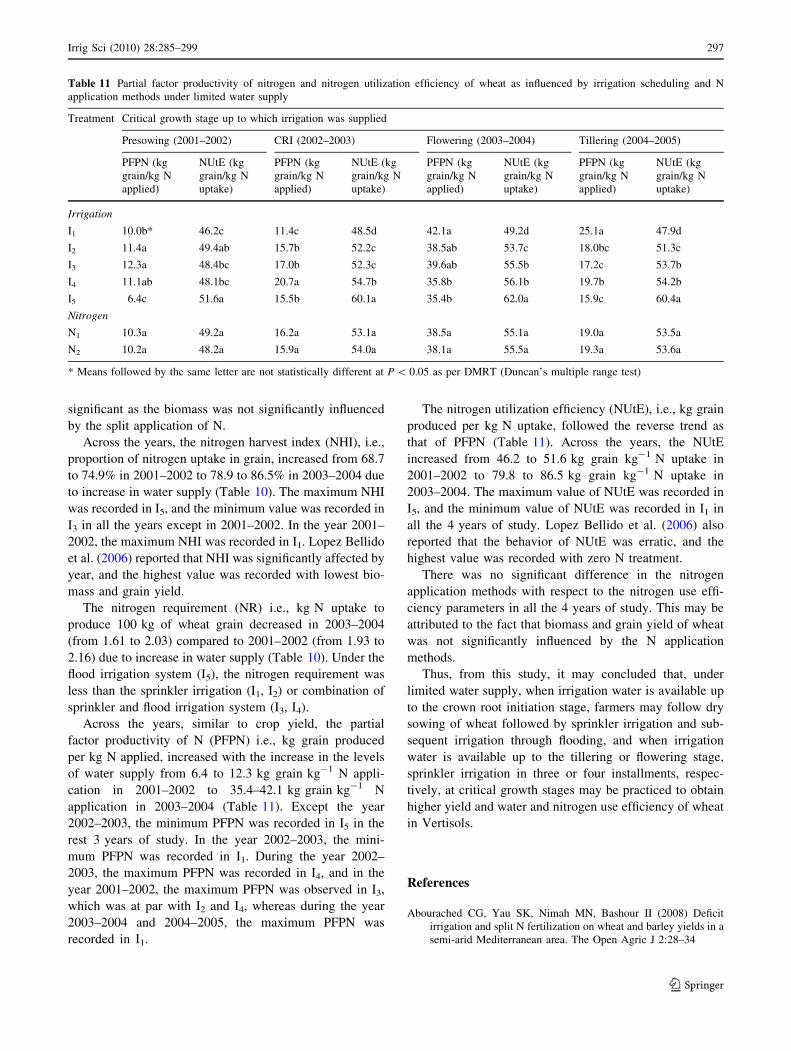
Across the years, similar to crop yield, the partial
factor productivity of N (PFPN) i.e., kg grain produced
per kg N applied, increased with the increase in the levels
of water supply from 6.4 to 12.3 kg grain kg-1 N appli-
cation in 2001–2002 to 35.4–42.1 kg grain kg-1 N
application in 2003–2004 (Table 11). Except the year
2002–2003, the minimum PFPN was recorded in I5 in the
rest 3 years of study. In the year 2002–2003, the mini-
mum PFPN was recorded in I1. During the year 2002–
2003, the maximum PFPN was recorded in I4, and in the
year 2001–2002, the maximum PFPN was observed in I3,
which was at par with I2 and I4, whereas during the year
2003–2004 and 2004–2005, the maximum PFPN was
recorded in I1.
The nitrogen utilization efficiency (NUtE), i.e., kg grain
produced per kg N uptake, followed the reverse trend as
that of PFPN (Table 11). Across the years, the NUtE
increased from 46.2 to 51.6 kg grain kg-1 N uptake in
2001–2002 to 79.8 to 86.5 kg grain kg-1 N uptake in
2003–2004. The maximum value of NUtE was recorded in
I5, and the minimum value of NUtE was recorded in I1 in
all the 4 years of study. Lopez Bellido et al. (2006) also
reported that the behavior of NUtE was erratic, and the
highest value was recorded with zero N treatment.
There was no significant difference in the nitrogen
application methods with respect to the nitrogen use effi-
ciency parameters in all the 4 years of study. This may be
attributed to the fact that biomass and grain yield of wheat
was not significantly influenced by the N application
methods.
Thus, from this study, it may concluded that, under
limited water supply, when irrigation water is available up
to the crown root initiation stage, farmers may follow dry
sowing of wheat followed by sprinkler irrigation and sub-
sequent irrigation through flooding, and when irrigation
water is available up to the tillering or flowering stage,
sprinkler irrigation in three or four installments, respec-
tively, at critical growth stages may be practiced to obtain
higher yield and water and nitrogen use efficiency of wheat
in Vertisols.
References
Abourached CG, Yau SK, Nimah MN, Bashour II (2008) Deficit
irrigation and split N fertilization on wheat and barley yields in a
semi-arid Mediterranean area. The Open Agric J 2:28–34
Table 11 Partial factor productivity of nitrogen and nitrogen utilization efficiency of wheat as influenced by irrigation scheduling and N
application methods under limited water supply
Treatment Critical growth stage up to which irrigation was supplied
Presowing (2001–2002) CRI (2002–2003) Flowering (2003–2004) Tillering (2004–2005)
PFPN (kg
grain/kg N
applied)
NUtE (kg
grain/kg N
uptake)
PFPN (kg
grain/kg N
applied)
NUtE (kg
grain/kg N
uptake)
PFPN (kg
grain/kg N
applied)
NUtE (kg
grain/kg N
uptake)
PFPN (kg
grain/kg N
applied)
NUtE (kg
grain/kg N
uptake)
Irrigation
I1 10.0b* 46.2c 11.4c 48.5d 42.1a 49.2d 25.1a 47.9d
I2 11.4a 49.4ab 15.7b 52.2c 38.5ab 53.7c 18.0bc 51.3c
I3 12.3a 48.4bc 17.0b 52.3c 39.6ab 55.5b 17.2c 53.7b
I4 11.1ab 48.1bc 20.7a 54.7b 35.8b 56.1b 19.7b 54.2b
I5 6.4c 51.6a 15.5b 60.1a 35.4b 62.0a 15.9c 60.4a
Nitrogen
N1 10.3a 49.2a 16.2a 53.1a 38.5a 55.1a 19.0a 53.5a
N2 10.2a 48.2a 15.9a 54.0a 38.1a 55.5a 19.3a 53.6a
* Means followed by the same letter are not statistically different at P \ 0.05 as per DMRT (Duncan’s multiple range test)
Irrig Sci (2010) 28:285–299 297
123
Alcoz MM, Hons FM, Haby VA (1993) Nitrogen fertilizer timing
effect on wheat production, nitrogen uptake efficiency, and
residual soil nitrogen. Agron J 85:1198–1203
A.O.A.C. (1970) Association of official analytical chemists, Wash-
ington, Edn II, pp 934
Arregui LM, Quemada M (2008) Strategies to improve nitrogen use
efficiency in winter cereal crops under rainfed conditions. Agron
J 100:277–284
Bandyopadhyay KK, Ghosh PK, Chaudhary RS, Hati KM, Mandal
KG, Misra AK (2004) Integrated nutrient management practices
in soybean (Glycine max) and sorghum (Sorghum bicolor) in
sole and intercropped systems in a Vertisol. Indian J Agric Sci
74(2):55–63
Benfield CF, Clapp JT, Jarris RH (1981) Continuous winter wheat:
effects of spring nitrogen rate and timing. Exp Husb 37:7–15
Bilbro JD, Wanjura DF (1982) Soil crusts and cotton emergence
relationships. Trans ASAE 25(6):1484–1487
Chen C, Rosenberg RJ, Selker JS (2002) Using microsprinkler
irrigation to reduce leaching in a shrinkswell clay soil. Agril
Water Manage 54(2):159–171
Delogu G, Cattivelli L, Pecchioni N, De Falcis D, Maggiore T (1998)
Uptake and agronomic efficiency of nitrogen in winter barley
and winter wheat. Eur J Agron 9:11–20
Dilz K (1988) Efficiency of uptake and utilization of fertilizer
nitrogen by plants. In: Jenkinson DS, Smith KA (eds) Nitrogen
efficiency in agricultural soils. Elsevier Applied sci, London,
pp 1–26
Doorenbos J, Kassam AH (1979) Yield response to water. FAO
irrigation and drainage paper 33, Rome, Italy, pp 193
Ehlig CF, Le Mert RD (1976) Water use and productivity of wheat
under five irrigation treatments. Soil Sci Soc Am J 40:750–755
El Yazal MNS, El Kadys M, Kadys EL (1998) Cotton crop response
to sprinkler irrigation systems in Egyptian old land. Egyptian
J Agric Res 76(3):1347–1360
Fischer RA (1979) Growth and water limitation to dryland wheat
yield in Australia: a physiological framework. J Aust Inst Agric
Sci 45:83–94
Gajri PR, Prihar SS, Arora VK (1993) Interdependence of nitrogen
and irrigation effects on growth and input use efficiencies in
wheat. Field Crops Res 31:71–86
Ghani A, Yasin M, Shahid A, Ahmad MM, Asif M (2001)
Comparative performance of sprinkler and surface irrigation
methods. Sharhad J Agric 17(4):601–608
Gomez KA, Gomez AA (1984) Statistical procedures for agricultural
research—an IRRI book. Wiley, New York
Grant AU, Stobbe EH, Racz GJ (1985) The effect of fall-applied N
and P fertilizer and timing of N application on yield and protein
content of winter wheat grown on zero tilled land in Manitoba.
Can J Soil Sci 65(4):621–628
Grazy A, Razik AAA, Wahab MA (1989) Effect of agricultural
practices and irrigation systems on aggregate stability of
Vertisols in the Nile Delta. Egyptian J Soil Sci 29(1):89–99
Hati KM, Mandal KG, Misra AK, Ghosh PK, Acharya CL (2001)
Effect of irrigation regimes and nutrient management on soil
water dynamics, evapo-transpiration and yield of wheat (Triti-cum Aestivum) in Vertisol. Indian J Agric Sci 71(9):581–586
Hauck RD (1984) Nitrogen in crop production. Am Soc Agron,
Madison
Home PG, Panda RK, Kar S (2002) Effect of method and scheduling
of irrigation on water and nitrogen use efficiencies of okra
(Abelmoschus esculentus). Agric Water Manage 55(2):159–170
Honglu L, Wang B, Zhuxin Y, Yue C, Liu HL, Wang BH, Yang ZX,
Cao Y (1998) Study on sprinkler-pipe conveying irrigation
system in field. Transac Chinese Soc Agric Eng 14(4):93–97
Hunsaker DJ, Bucks DA (1987) Wheat yield variability in level
basins. Trans ASAE 30:1099–1104
Hussain G, Al-Jalaud AA (1995) Effect of irrigation and nitrogen on
water use efficiency of wheat in Saudi Arabia. Agric Water
Manage 27:143–153
Keeney DR, Nelson DW (1982) Nitrogen-Inorganic forms. In: Page
AL, Miller RH, Keeney DR (eds) Methods of soil analysis. Part
2. Chemical and microbiological properties. Agronomy mono-
graph No.9, 2nd edn. Am Soc Agron and Soil Sci Soc Am,
Madison, pp 643–709
Khan MA (1988) Sprinklers tested for soil crack problem in arid area.
Water Irrigation Rev 8(3):14–15
Knudsen D, Peterson GA, Pratt PF (1982) Lithium, sodium and
potassium. In: Page AL, Miller RH, Keeney DR (eds) Methods
of soil analysis. Part 2. Chemical and microbiological properties,
2nd edn. Am Soc Agron Inc and Soil Sci Soc Am Inc, Madison,
pp 225–246
Liu WZ, Hunsaker DJ, Li YS, Xie XQ, Wall GW (2002) Interrela-
tions of yield, evapo-transpiration, and water use efficiency from
marginal analysis of water production functions. Agric Water
Manage 56:143–151
Lopez Bellido L, Lopez Bellido RJ, Redondo R (2005) Nitrogen
efficiency in wheat under rainfed mediterranian conditions as
affected by split nitrogen application. Field Crops Res 94:86–97
Lopez Bellido L, Lopez Bellido RJ, Lopez Bellido FJ (2006)
Fertilizer Nitrogen efficiency in durum wheat under rainfed
mediterranian conditions: effect of split application. Agron
J 98:55–62
Mahler RL, Kochler FE, Lutcher LK (1994) Nitrogen source, timing
of application and placement: effects on winter wheat produc-
tion. Agron J 86:637–642
Malik AS, Kumar A, Singh J, Faroda AS, Singh J (1987) Effect of
methods of irrigation on grain yield, consumptive use, moisture
extraction pattern and water use efficiency of raya and wheat.
Haryana Agric Univ J Res 17(4):34–340
Manjunatha MV, Shukla KN, Chauhan HS (2000) Evaluation of
combined micro and surface irrigation systems in sweet lime
intercropping 6th international micro irrigation congress-Micro-
2000. Cape Town, South Africa, 22–27 October-2000, 1–8
Musick JT, Porter KB (1990) Wheat. In: Stewart BA, Nielsen DR
(eds) Irrigation of agricultural crops, vol 30. Agron Monogr
ASA, CSSA and SSSA, Madison, pp 597–638
Olsen SR, Cole CV, Watanabe FS and Dean LA (1954) Estimation of
available phosphorus in soils by extraction with sodium bicar-
bonate. US Dept Agric Circ 939
Pawar DD, Bhoi PG, Shinde S (2002) Effect of irrigation methods and
fertilizer levels on yield of potato. Indian J Agric Sci 72(2):80–
83
Sharratt BS, Hanks RJ, Aase JK (1980) Environmental factors
associated with yield differences between seedling rates of
spring wheat. Utah Agric Exp Stn Res Rep 92:1–28
Singh NT, Singh R, Mahajan PS, Vig AC (1979) Influence of
supplemental irrigation and presowing soil water storage on
wheat. Agron J 71:483–786
Smalling EMA, Bouma J (1992) Bypass flow and leaching of nitrogen
in a Kenyan Vertisol at the onset of growing season. Soil Use
Manage 8:44–48
Sowers KE, Miller BC, Pan WL (1994) Optimization of yield and
grain protein in soft winter wheat with split nitrogen applica-
tions. Agron J 86:1020–1025
Steiner JL, Smith RCG, Meyer WS, Adeney JA (1985) Water, foliage
temperature, and yield of irrigated wheat in southeastern
Australia. Aust J Agric Res 36:1–11
Subbiah BV, Asija GL (1956) A rapid procedure for the determina-
tion of available nitrogen in soils. Curr Sci 25:259–260
Van Keulen H (1975) Simulation of water use and herbage growth in
arid regions. Centre for Agricultural Publishing and Documen-
tation, Washington, p 175
298 Irrig Sci (2010) 28:285–299
123

Verma SK, Shrivastava NC (1992) Sprinkler irrigation is advanta-
geous in alkali soils. Indian Fmg 42(9):37
Walkley A, Black CA (1934) An examination of the Degtjareff
method for determining soil organic matter and a proposed
modification of chromic acid titration method. Soil Sci 37:29–38
Zhang H, Oweis T (1999) Water-yield relations and optimum
irrigation scheduling of wheat in the mediterranean region.
Agric Water Manage 38:195–211
Irrig Sci (2010) 28:285–299 299
123