Effect of immigration on Sweden natives’ wages: The post-secondary and post-graduate case....
33
Alejandra Corrales Jorge Vega Semester 2014 Master, 15 ECTS Economics Supervisor: Gauthier Lanot Effect of immigration on Sweden natives’ wages: The post-secondary and post-graduate case. Alejandra Corrales Jorge Vega
Transcript of Effect of immigration on Sweden natives’ wages: The post-secondary and post-graduate case....

Alejandra Corrales
Jorge Vega
Semester 2014
Master, 15 ECTS Economics Supervisor: Gauthier Lanot
Effect of immigration on Sweden natives’ wages:
The post-secondary and post-graduate case.
Alejandra Corrales
Jorge Vega
Table of Contents
I. Introduction ................................................................................................................... 2
II. Literature review .......................................................................................................... 3
III. Data ............................................................................................................................. 5
IV. Methodology ............................................................................................................ 15
IV.i. Adjustment coefficient specification .................................................................. 15
IV.ii. Three-level CES technology production specification ...................................... 16
IV.iii. Factor price elasticities ..................................................................................... 18
V. Initial results .............................................................................................................. 20
V.i. Adjustment coefficient specification ................................................................... 20
V.ii. Three-level CES specification ............................................................................ 21
V.iii. Factor price elasticities ...................................................................................... 24
V.iv. Impact of immigration on the relative wage ...................................................... 24
VI. Conclusions .............................................................................................................. 28
REFERENCES ............................................................................................................... 29

2
Acknowledgement
We would like to thank our supervisor Gauthier for his availability, comments and good
sense of humor.
To our families for their unconditional support.
2
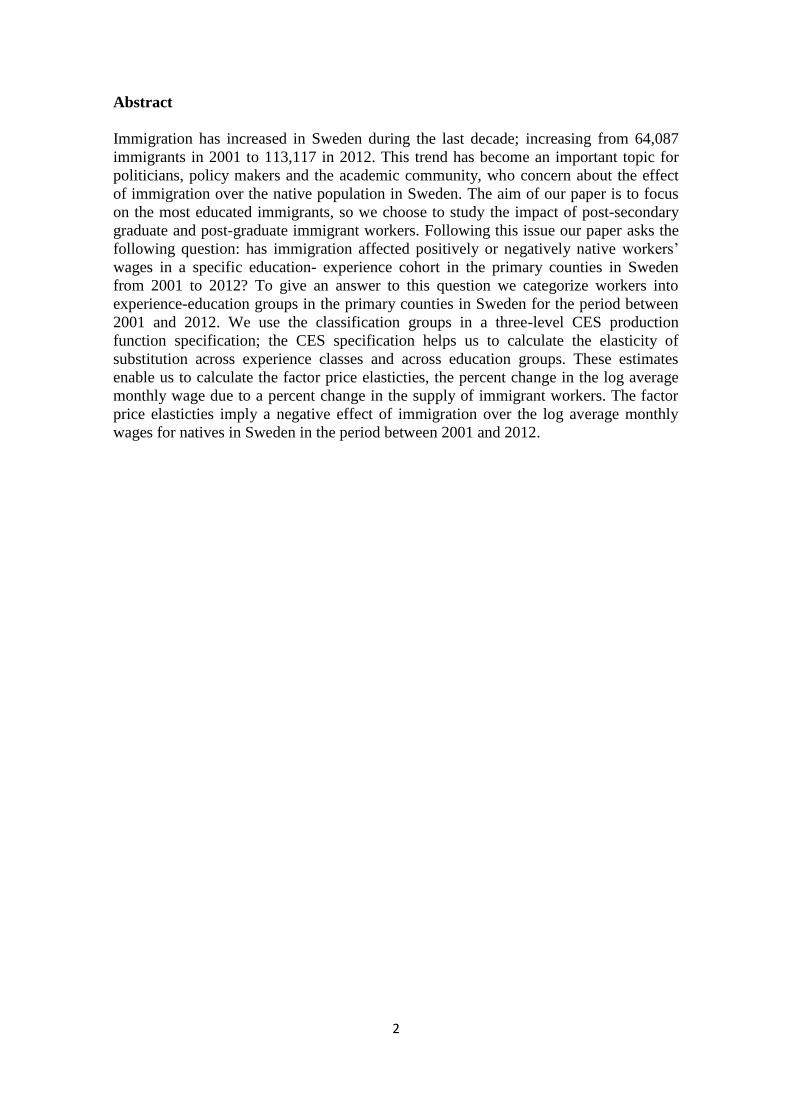
Abstract
Immigration has increased in Sweden during the last decade; increasing from 64,087
immigrants in 2001 to 113,117 in 2012. This trend has become an important topic for
politicians, policy makers and the academic community, who concern about the effect
of immigration over the native population in Sweden. The aim of our paper is to focus
on the most educated immigrants, so we choose to study the impact of post-secondary
graduate and post-graduate immigrant workers. Following this issue our paper asks the
following question: has immigration affected positively or negatively native workers’
wages in a specific education- experience cohort in the primary counties in Sweden
from 2001 to 2012? To give an answer to this question we categorize workers into
experience-education groups in the primary counties in Sweden for the period between
2001 and 2012. We use the classification groups in a three-level CES production
function specification; the CES specification helps us to calculate the elasticity of
substitution across experience classes and across education groups. These estimates
enable us to calculate the factor price elasticties, the percent change in the log average
monthly wage due to a percent change in the supply of immigrant workers. The factor
price elasticties imply a negative effect of immigration over the log average monthly
wages for natives in Sweden in the period between 2001 and 2012.
2
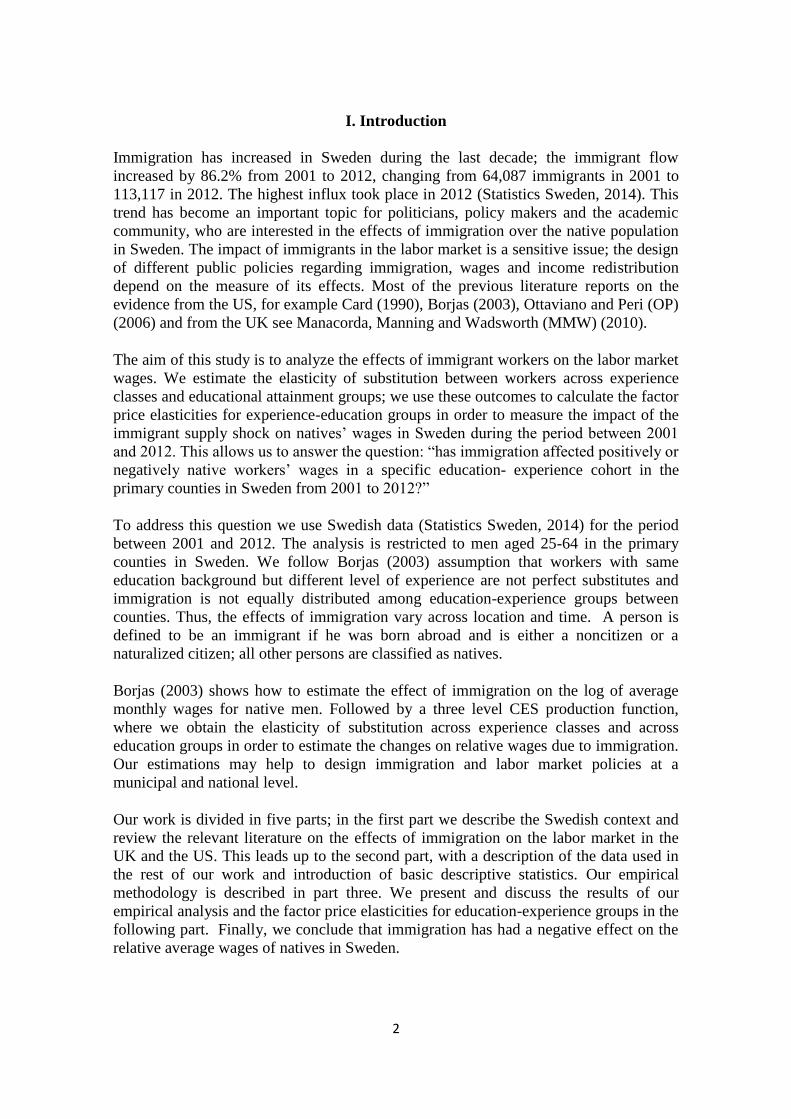
I. Introduction
Immigration has increased in Sweden during the last decade; the immigrant flow
increased by 86.2% from 2001 to 2012, changing from 64,087 immigrants in 2001 to
113,117 in 2012. The highest influx took place in 2012 (Statistics Sweden, 2014). This
trend has become an important topic for politicians, policy makers and the academic
community, who are interested in the effects of immigration over the native population
in Sweden. The impact of immigrants in the labor market is a sensitive issue; the design
of different public policies regarding immigration, wages and income redistribution
depend on the measure of its effects. Most of the previous literature reports on the
evidence from the US, for example Card (1990), Borjas (2003), Ottaviano and Peri (OP)
(2006) and from the UK see Manacorda, Manning and Wadsworth (MMW) (2010).
The aim of this study is to analyze the effects of immigrant workers on the labor market
wages. We estimate the elasticity of substitution between workers across experience
classes and educational attainment groups; we use these outcomes to calculate the factor
price elasticities for experience-education groups in order to measure the impact of the
immigrant supply shock on natives’ wages in Sweden during the period between 2001
and 2012. This allows us to answer the question: “has immigration affected positively or
negatively native workers’ wages in a specific education- experience cohort in the
primary counties in Sweden from 2001 to 2012?”
To address this question we use Swedish data (Statistics Sweden, 2014) for the period
between 2001 and 2012. The analysis is restricted to men aged 25-64 in the primary
counties in Sweden. We follow Borjas (2003) assumption that workers with same
education background but different level of experience are not perfect substitutes and
immigration is not equally distributed among education-experience groups between
counties. Thus, the effects of immigration vary across location and time. A person is
defined to be an immigrant if he was born abroad and is either a noncitizen or a
naturalized citizen; all other persons are classified as natives.
Borjas (2003) shows how to estimate the effect of immigration on the log of average
monthly wages for native men. Followed by a three level CES production function,
where we obtain the elasticity of substitution across experience classes and across
education groups in order to estimate the changes on relative wages due to immigration.
Our estimations may help to design immigration and labor market policies at a
municipal and national level.
Our work is divided in five parts; in the first part we describe the Swedish context and
review the relevant literature on the effects of immigration on the labor market in the
UK and the US. This leads up to the second part, with a description of the data used in
the rest of our work and introduction of basic descriptive statistics. Our empirical
methodology is described in part three. We present and discuss the results of our
empirical analysis and the factor price elasticities for education-experience groups in the
following part. Finally, we conclude that immigration has had a negative effect on the
relative average wages of natives in Sweden.
3
II. Literature review
During the last decades developed countries have experienced a rise in immigration, this
has given place to the debate about the effects of immigration on the wages of natives.
Sweden as most of western European countries experienced a great flow of immigrants
during the last decades. After the Second World War the immigration process
accelerated and was principally for labor reasons. Starting from 1970 immigration
turned to be mostly for family reunion or asylum seeking motives. In 1990, almost
790,000 persons born abroad lived in Sweden compared to 1,473,256 in 2012; the
immigrant share in this period increased from 9.2% to 15.4% (Statistics Sweden, 2014).
Since mid 1980 to 1999, there was a diversification of migration movements and an
increase in the range of nationalities involved, though in the 90’s the number of asylum
seekers and refugees rose substantially as well as family-linked immigration,
particularly in Sweden. In 1999 just 1% of the immigrant flow notified work as the first
cause of moving permanently or staying long-term in Sweden (OECD, 2001). Beside
this, 79% migrated for family reunification and 20% as refugees. By 1999, the foreign
born labor force represented 4.1% from the total, the fifth highest within OECD
members, immigrant labor supply was concentrated in three sectors; health and other
community services (23.1 %), mining and manufacturing (21.4%), and wholesale and
retail trade (12.7 %), (OECD, 2001).
In view of all these immigration pattern changes during the last decade, it is important
to extend our knowledge about the labor market conditions of immigrants and the
impacts on natives’ wages. Several studies have focused on the immigrants’ situation in
Sweden as well as the impact of this phenomenon in the labor market. Most of the
researches have concluded that there is indeed a wage differential between immigrants
and natives, as well as higher unemployment rates among foreign born individuals
(Duvander, 2001). On the other hand, in Sweden foreign born workers are more
susceptible than natives to economic depressions and institutional transformations
(Aguilar and Gustafsson, 1994). Immigrants also face the challenge of integration into
Swedish society. Circumstances like language skills, education background and
experience, having a Swedish partner and the amount of time spent in the country affect
the possibilities to find an occupation in the host country labor market (Aguilar and
Gustafsson, 1994).
In spite of the Swedish policy about immigration and multiculturalism and the
importance of preserving and respecting immigrants’ through equity in society, these
goals have not been completely achieved. There is low immigrant political
representation, high geographical segregation and lack of success in labor market
(Duvander, 2001). Most of these issues affect immigrants’ performance in labor market
and the way they affect Swedes’ labor opportunities. However, in politic and economic
debates the negative effects that immigration could have in the labor market results for
native workers have been highlighted (Friedberg and Hunt, 1995).
Ekberg (1998) finds that immigration also affects the public redistribution of incomes;
the impact can be negative or positive depending on whether the services immigrants
receive from the public sector exceed their contributes to taxes or not. He also points
that during the period from 1950 to 1970 the immigrants net contributions had positive
effects on the public redistribution of income in Sweden comparing to late 90’s where

4
income effects turned to be negative as a consequence of worse labor conditions among
immigrants1.
As evidence shows, immigrants had an adverse influence on Swedish public finances
during the 90’s. Unfortunately not so many studies have been developed regarding the
impact of immigration on natives’ wages in Sweden. Most of the evidence comes from
the US, Borjas (2003), Card (1990), Ottaviano and Peri (OP) (2006) and the UK,
Manacorda, Manning and Wadsworth (MMW) (2010). This evidence provides different
results; some economists identified a small effect of immigration on natives’ wages
while others found a significant negative effect.
Borjas (2003) assumes that immigration is not balanced across groups of workers who
have the same education but different levels of experience and immigrants and natives
with the same education and experience are perfect substitutes, while the empirical
evidence shows imperfect substitution. His analysis indicates that in the United States
immigration lowered the wage of competing native workers by 3 to 4 percent when
there was an increase in labor supply of 10 percent due to immigration flow. Borjas,
Freeman, and Katz (1997) proposed to analyze that matter at a national level, assuming
that the aggregate technology can be described by a CES production function with two
skill groups and this assumption implies that the relative wage of the two groups
depends linearly on their relative quantities. When the analysis is extended to include
the geographic boundary Borjas (2003) finds that immigration lowers weekly earnings
by 1.3% while Card (1990) does not find any relevant effect on earnings when the labor
force in Miami increased by 7% due the Mariel boat lift.
MMW (2010) studied the impact of immigration in wages in the UK based on the
assumption that similarly educated workers with different experience are not perfect
substitutes. In the UK different consequences in the labor market were found compared
to the US. The study found that foreign-born population in the UK is more highly
educated and even better than British population. Immigration in the UK has a bigger
share of highly educated foreign born people compared to the US. This fact was studied
by MMW, who found that college educated immigrants perceive lower wages as
immigration of high skilled workers rises. Therefore, earlier immigrants’ wages in the
UK are the only group which experiences a relevant impact for increased immigration.
Ottaviano and Peri (2006) assume the existence of an aggregate production function that
combines labor and physical capital, while using education, experience, gender and
place of origin to categorize imperfectly substitutable groups. They consider that capital
is adjusting over time to its long run growth path instead of being fixed in the short run
as Borjas does (2003).They find a small wage loss to the group of high school dropouts
and wage gains for all the other groups of U.S. natives as capital adjusts. Their model
implies that it is hard to claim that immigration has had a significant influence in the
deterioration of the wage distribution of U.S. born workers. OP concluded that labor
immigration has positive effects on high school graduated native workers and small
1 This result is based on the difference between immigrants’ contributions and expenditures to the public
sector. The immigrants' part of the total expenditures from the public sector was between 11.0% and
12.2% and their contributions were just 10%, which gave a negative outcome between 1 to 2,2%.
Therefore, immigration had a negative effect on natives’ level of income in Sweden. Though, the effect
was small, in average 0.9% of the Swedish gross national product in 1996 (Ekberg, 1998).
5
negative impact on the wages of earlier immigrants, this second result agree with
MMW’s approach.
Card (2012) analyzes and compares the work carried on by Borjas (2003), OP (2006)
and MMW (2010). Card states that in a good economy the impact of immigration
depends on the supply of capital, structure of technology and characteristics of the
added workers. He concludes that immigration may affect relative wages in some
groups but the overall impacts on native wages are not significant compared to the
effects of other variables like new technology, institutional changes, and policies related
to recession times, which have led in the past to a slow wage growth for decades in most
of labor market in the US.
III. Data
The empirical analysis based on Borjas (2003) methodology uses data drawn from
Statistics Sweden website for the years between 2001 and 2012. The analysis is
restricted to men aged 25-65 in the primary counties in Sweden. An individual is
defined to be an immigrant if he was born abroad and is either a noncitizen or a
naturalized citizen; all other persons are classified as natives2.
We sort workers into skill groups by region, educational attainment, experience and
year when these characteristics where observed. According to Statistics Sweden men are
classified into two educational attainment groups for the purpose of our study: “post-
secondary education 3 years or more” and “post-graduate education”3. We classify men
into 21 distinct groups for the primary counties in Sweden4.
As Borjas (2003) we measure work experience by the difference between the worker’s
age at the time of the survey and the assumed age of entry into the labor market.
According to the OECD (2009) the age of entry to the labor market for men with post-
secondary education lies between 22 and 24 years old and between 24 and 29 years old
for men with post-graduate education in Sweden, from this we assumed that workers
enter the labor market at the age of 24. We restrict the analysis to persons who have
between 1 and 40 years of experience each divided into 8 intervals of 5 years5.
2 We defined immigrants as first generation immigrants, excluding second generation ones, who are
individuals who were born in Sweden and such that at least one of their parents is an immigrant Statistics
Sweden (2014). 3 We restricted the study to these two education groups because this was the classification of workers per
education background found. From the two education groups 94% of the individuals correspond to the
post-secondary (3 years or more) and 6% to the post-graduate group in 2012. (Statistics Sweden, 2014). 4The counties (Statistics Sweden,2014) and the distribution of population studied in this paper in 2012
correspond to; Stockholm (34.11%), Uppsala (3.3%), Södermanland (2.65%), Östergötland (3.64%),
Jönköping (3.04%), Kronoberg (1.83%), Kalmar (1,36%), Gotland (0,17%), Blekinge (1.09%), Skåne
(16.09%), Halland (2.12%) , Västra Götaland (16.76%), Värmland (1.64%), Örebro (2.34%),
Västmanland (2.60%), Dalarna (1.40%), Gävleborg (1.56%), Västernorrland (1.18%), Jämtland (0.53%),
Västerbotten (1,34%) and Norrbotten (1,26%). 5 The classification of workers into experience groups is not precise because the Labor Force Survey
(LFS) from Statistics Sweden does not provide any data about workers’ experience or the age they enter
to the labor market.
6
We use the log of the average monthly salary in the primary counties for each
education-experience-year-region cell. The data described before enable us to classify
the workers into skill groups , where i refers to educational attainment, j to
work experience, h to county and t to the calendar year where these were observed.
We found data of the average monthly wages for the Swedish population classified by
county and year, per education level and per age group in five year intervals; we use the
eight intervals from 25 years old to 65 years old. We obtained data for the amount of
immigrants classified by age and educational attainment in every county , this amount
was taken away from the total population and the we obtained the quantity of natives N
per county for every cell observed.
The immigrant supply shock for this skill group is
: Number of immigrants in cell .
Number of natives in cell .
: Foreign-born share of the labor force6 in a particular skill group.
We can analyze the behavior of during the period from 2001 to 2012 and find
which cells are more affected by a higher foreign-born share. As we have two
educational groups, we compare the supply shocks experienced by the different groups
in Figure I and Figure II between 2001 and 2012.
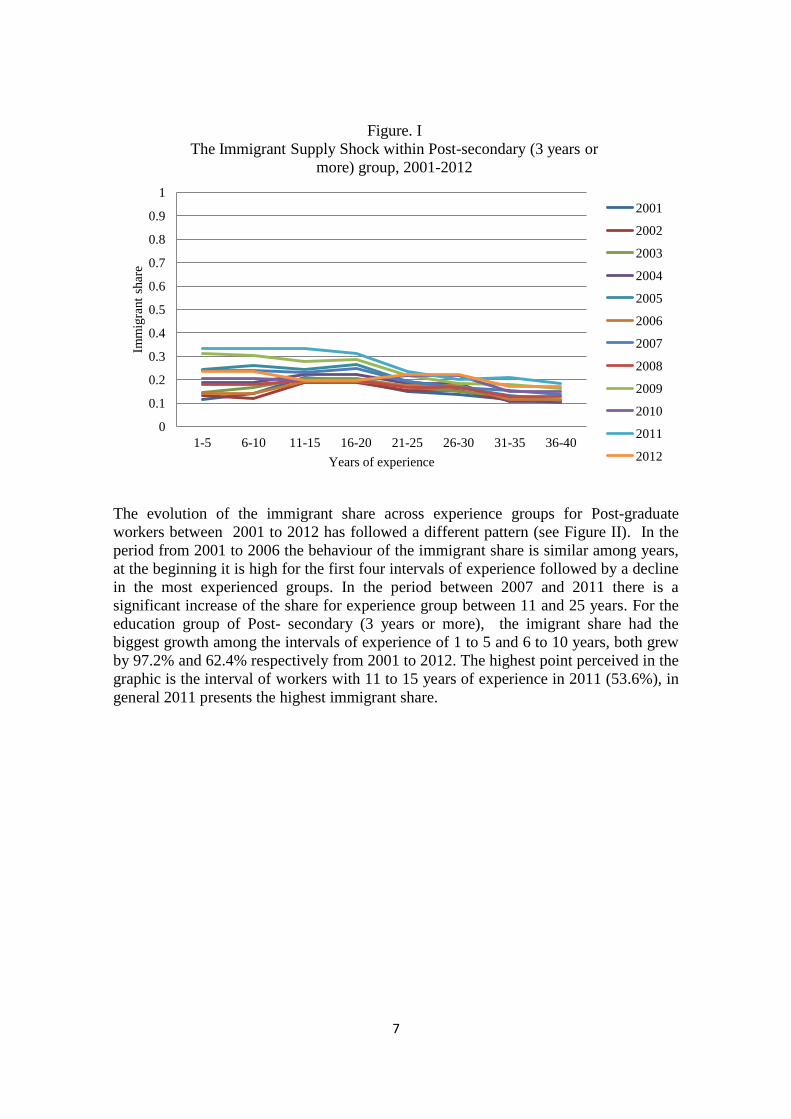
For the post-secondary education (3 years or more) group (see Figure I), there is not a
great dispersion in the intervals of experience across the time, all of them follow the
same pattern, with a high immigrant share among the first years of experience cohorts,
ending in a smaller immigrant share in the group of workers close to retirement.
Observing the trend of the immigrant share within years, the growth has not been
constant. Between 2006 and 2008 the share of immigrants within education group in all
intervals of experience decreased on average by 13.3% compared to 2005. In 2010
compared to 2009, the share fell on average by 19.7% for all intervals of experience. In
these twelve years, the cohorts which have grown the most are the ones where workers
have between 1 to 5 and 6 to 10 years of experience; they grew by 102% and 66.5%
respectively from 2001 to 2012. This increase is expected considering that in this period
the immigrant population within 22 to 34 years old was the group of the total population
which grew the most (4.22%), (Statistics Sweden, 2014).
6 The parameters M and N correspond to immigrant and native population, which we assume as the labor
force. In contrast to Borjas (2003) we did take labor force as individuals who are enrolled in the civilian
labor force, are in school and military service, due to the availability of the data.
7
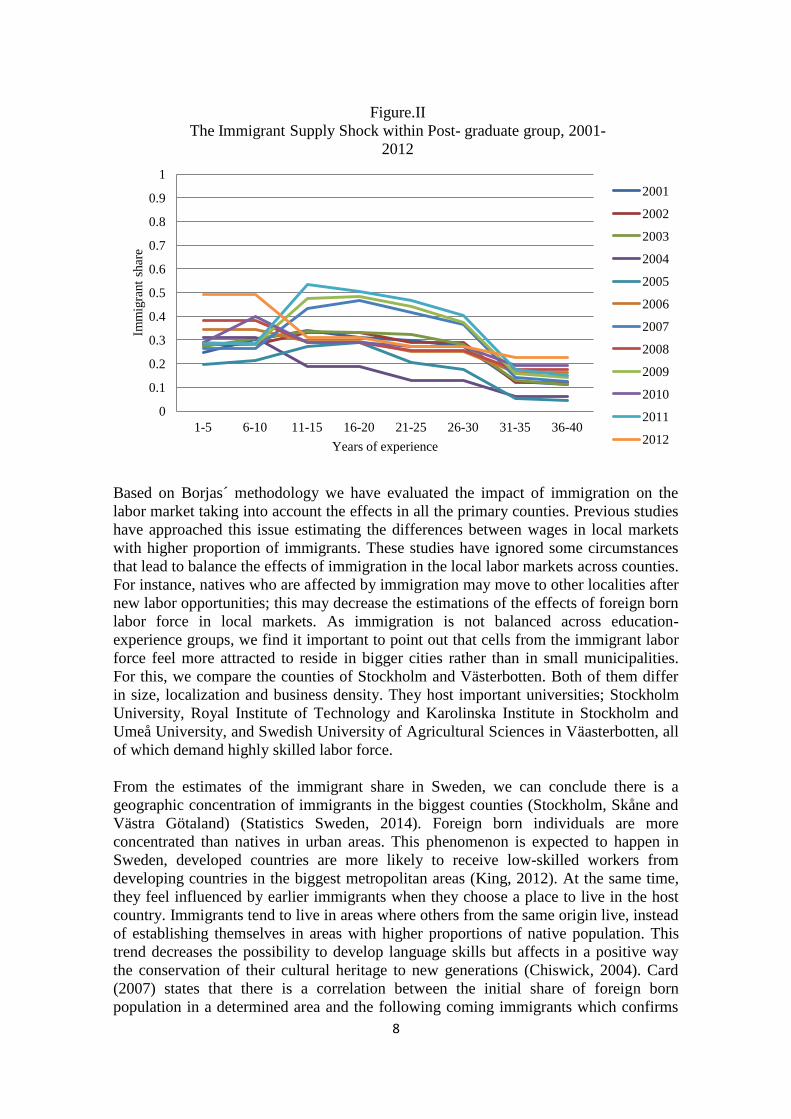
The evolution of the immigrant share across experience groups for Post-graduate
workers between 2001 to 2012 has followed a different pattern (see Figure II). In the
period from 2001 to 2006 the behaviour of the immigrant share is similar among years,
at the beginning it is high for the first four intervals of experience followed by a decline
in the most experienced groups. In the period between 2007 and 2011 there is a
significant increase of the share for experience group between 11 and 25 years. For the
education group of Post- secondary (3 years or more), the imigrant share had the
biggest growth among the intervals of experience of 1 to 5 and 6 to 10 years, both grew
by 97.2% and 62.4% respectively from 2001 to 2012. The highest point perceived in the
graphic is the interval of workers with 11 to 15 years of experience in 2011 (53.6%), in
general 2011 presents the highest immigrant share.
0
0.1
0.2
0.3
0.4
0.5
0.6
0.7
0.8
0.9
1
1-5 6-10 11-15 16-20 21-25 26-30 31-35 36-40
Imm
igra
nt
shar
e
Years of experience
Figure. I
The Immigrant Supply Shock within Post-secondary (3 years or
more) group, 2001-2012
2001
2002
2003
2004
2005
2006
2007
2008
2009
2010
2011
2012
8
Based on Borjas´ methodology we have evaluated the impact of immigration on the
labor market taking into account the effects in all the primary counties. Previous studies
have approached this issue estimating the differences between wages in local markets
with higher proportion of immigrants. These studies have ignored some circumstances
that lead to balance the effects of immigration in the local labor markets across counties.
For instance, natives who are affected by immigration may move to other localities after
new labor opportunities; this may decrease the estimations of the effects of foreign born
labor force in local markets. As immigration is not balanced across education-
experience groups, we find it important to point out that cells from the immigrant labor
force feel more attracted to reside in bigger cities rather than in small municipalities.
For this, we compare the counties of Stockholm and Västerbotten. Both of them differ
in size, localization and business density. They host important universities; Stockholm
University, Royal Institute of Technology and Karolinska Institute in Stockholm and
Umeå University, and Swedish University of Agricultural Sciences in Väasterbotten, all
of which demand highly skilled labor force.
From the estimates of the immigrant share in Sweden, we can conclude there is a
geographic concentration of immigrants in the biggest counties (Stockholm, Skåne and
Västra Götaland) (Statistics Sweden, 2014). Foreign born individuals are more
concentrated than natives in urban areas. This phenomenon is expected to happen in
Sweden, developed countries are more likely to receive low-skilled workers from
developing countries in the biggest metropolitan areas (King, 2012). At the same time,
they feel influenced by earlier immigrants when they choose a place to live in the host
country. Immigrants tend to live in areas where others from the same origin live, instead
of establishing themselves in areas with higher proportions of native population. This
trend decreases the possibility to develop language skills but affects in a positive way
the conservation of their cultural heritage to new generations (Chiswick, 2004). Card
(2007) states that there is a correlation between the initial share of foreign born
population in a determined area and the following coming immigrants which confirms
0
0.1
0.2
0.3
0.4
0.5
0.6
0.7
0.8
0.9
1
1-5 6-10 11-15 16-20 21-25 26-30 31-35 36-40
Imm
igra
nt
shar
e
Years of experience
Figure.II
The Immigrant Supply Shock within Post- graduate group, 2001-
2012
2001
2002
2003
2004
2005
2006
2007
2008
2009
2010
2011
2012
9
Chiswick´s theory about the “enclave effect”, which refers to the trend of immigrants to
locate in areas where individuals with same origin live, leading to spatial segregation.
Furthermore, low skill immigrants may affect in a negative way the wages of earlier
immigrants but they have positive effects on high skill natives´ wages. Thus, it does not
mean earnings are higher in the biggest urban areas. In the case of the most populated
counties in our study; Stockholm, Skåne and Västra Götaland present deviations with
respect to the average monthly salary in 2012 in Sweden of 0.029, 0.004 and -0.007
percent respectively (Statistics Sweden, 2014).
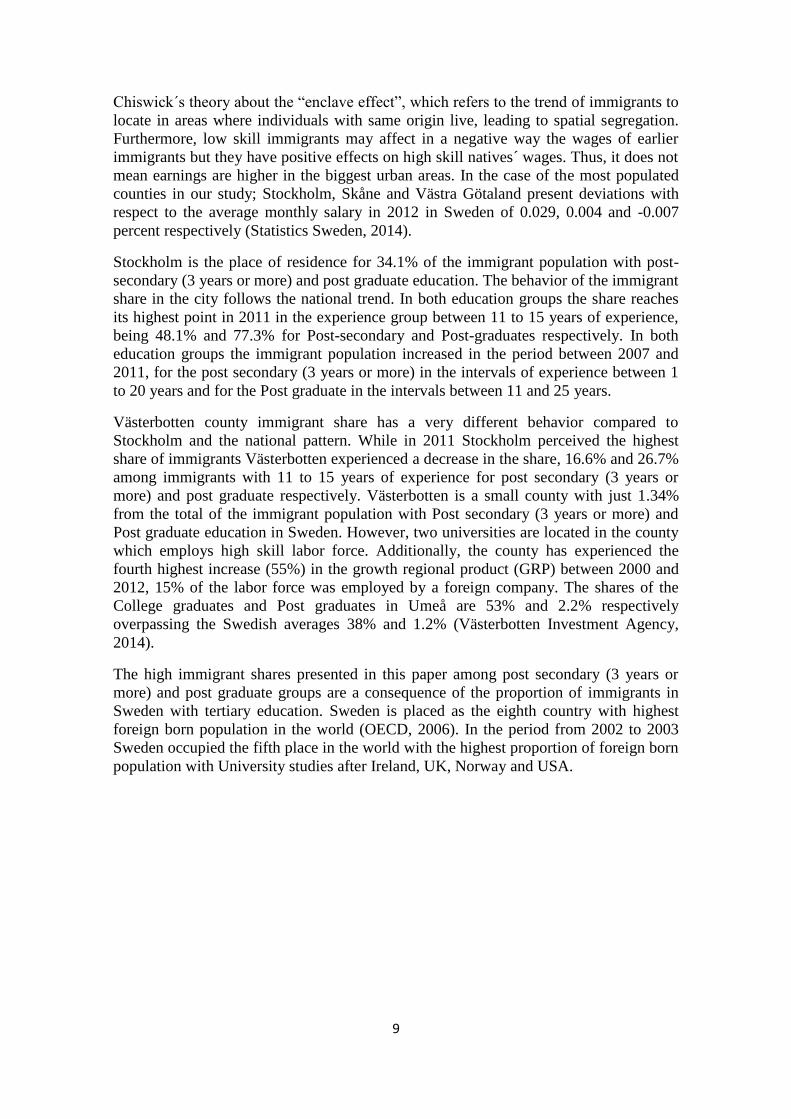
Stockholm is the place of residence for 34.1% of the immigrant population with post-
secondary (3 years or more) and post graduate education. The behavior of the immigrant
share in the city follows the national trend. In both education groups the share reaches
its highest point in 2011 in the experience group between 11 to 15 years of experience,
being 48.1% and 77.3% for Post-secondary and Post-graduates respectively. In both
education groups the immigrant population increased in the period between 2007 and
2011, for the post secondary (3 years or more) in the intervals of experience between 1
to 20 years and for the Post graduate in the intervals between 11 and 25 years.
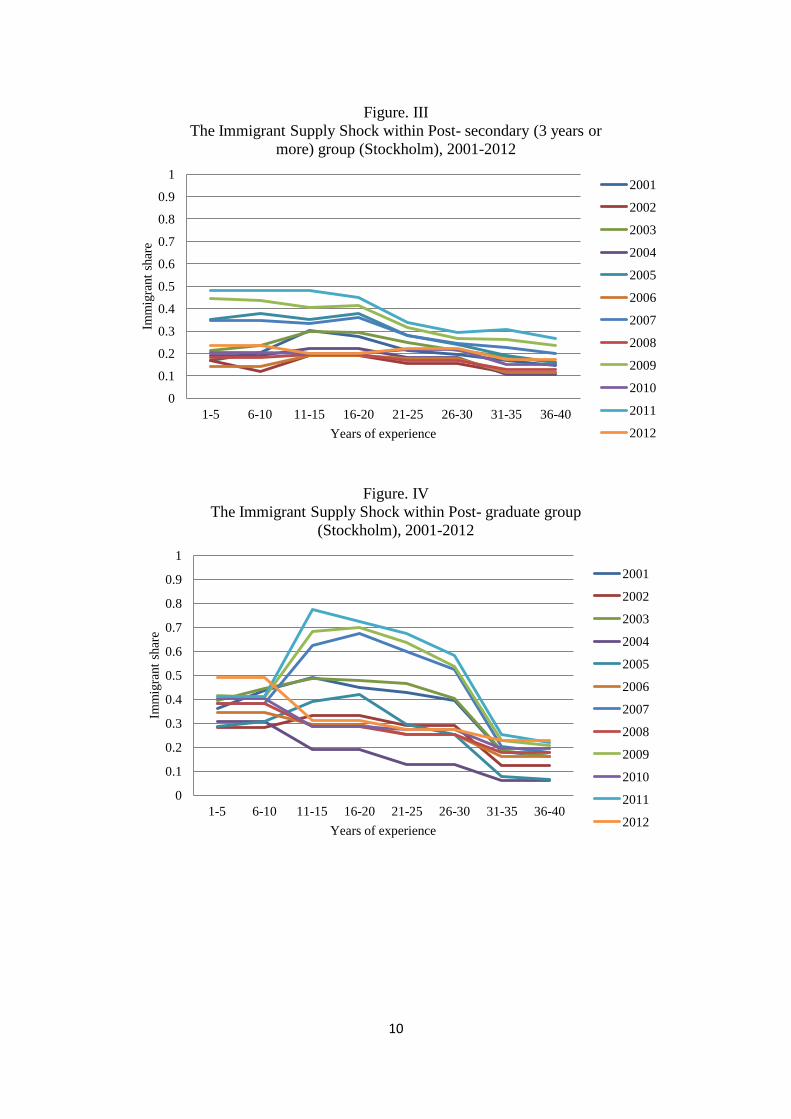
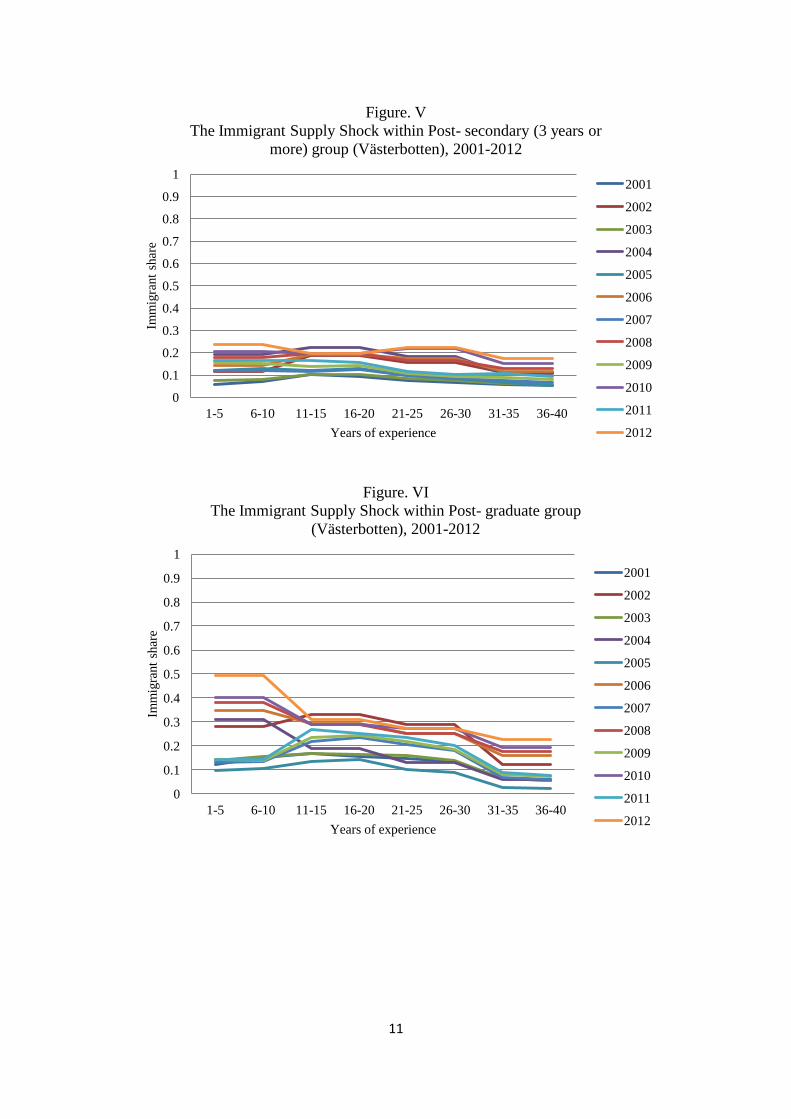
Västerbotten county immigrant share has a very different behavior compared to
Stockholm and the national pattern. While in 2011 Stockholm perceived the highest
share of immigrants Västerbotten experienced a decrease in the share, 16.6% and 26.7%
among immigrants with 11 to 15 years of experience for post secondary (3 years or
more) and post graduate respectively. Västerbotten is a small county with just 1.34%
from the total of the immigrant population with Post secondary (3 years or more) and
Post graduate education in Sweden. However, two universities are located in the county
which employs high skill labor force. Additionally, the county has experienced the
fourth highest increase (55%) in the growth regional product (GRP) between 2000 and
2012, 15% of the labor force was employed by a foreign company. The shares of the
College graduates and Post graduates in Umeå are 53% and 2.2% respectively
overpassing the Swedish averages 38% and 1.2% (Västerbotten Investment Agency,
2014).
The high immigrant shares presented in this paper among post secondary (3 years or
more) and post graduate groups are a consequence of the proportion of immigrants in
Sweden with tertiary education. Sweden is placed as the eighth country with highest
foreign born population in the world (OECD, 2006). In the period from 2002 to 2003
Sweden occupied the fifth place in the world with the highest proportion of foreign born
population with University studies after Ireland, UK, Norway and USA.
10
0
0.1
0.2
0.3
0.4
0.5
0.6
0.7
0.8
0.9
1
1-5 6-10 11-15 16-20 21-25 26-30 31-35 36-40
Imm
igra
nt
shar
e
Years of experience
Figure. III
The Immigrant Supply Shock within Post- secondary (3 years or
more) group (Stockholm), 2001-2012
2001
2002
2003
2004
2005
2006
2007
2008
2009
2010
2011
2012
0
0.1
0.2
0.3
0.4
0.5
0.6
0.7
0.8
0.9
1
1-5 6-10 11-15 16-20 21-25 26-30 31-35 36-40
Imm
igra
nt
shar
e
Years of experience
Figure. IV
The Immigrant Supply Shock within Post- graduate group
(Stockholm), 2001-2012
2001
2002
2003
2004
2005
2006
2007
2008
2009
2010
2011
2012
11
0
0.1
0.2
0.3
0.4
0.5
0.6
0.7
0.8
0.9
1
1-5 6-10 11-15 16-20 21-25 26-30 31-35 36-40
Imm
igra
nt
shar
e
Years of experience
Figure. V
The Immigrant Supply Shock within Post- secondary (3 years or
more) group (Västerbotten), 2001-2012
2001
2002
2003
2004
2005
2006
2007
2008
2009
2010
2011
2012
0
0.1
0.2
0.3
0.4
0.5
0.6
0.7
0.8
0.9
1
1-5 6-10 11-15 16-20 21-25 26-30 31-35 36-40
Imm
igra
nt
shar
e
Years of experience
Figure. VI
The Immigrant Supply Shock within Post- graduate group
(Västerbotten), 2001-2012
2001
2002
2003
2004
2005
2006
2007
2008
2009
2010
2011
2012

12
The average wages data used in this paper are drawn from Statistics Sweden (the central
government authority for official statistics) and are presented per month. Table I
summarizes the trend in log average monthly wages for the various native groups. We
observe that there is not a great deal of dispersion in the rate of 3 year-periods wage
growth by education and experience, the trend is similar to the one of the wage
dispersion in Sweden during the period between 1991 to 2012 (Statistics Sweden,
2014). On the other hand, the cells of workers with experience between 1 and 10 years
in both educational groups from 2001 to 2012, where there is the highest immigrant
share, present the lowest wages compared to workers with more years of experience
where the immigrant share is significant lower. However, workers with less years of
experience reported the lowest relative wages in Sweden compared to all other age
cohorts OECD (1999).

13
Table I
LOG MONTHLY WAGE OF MALE NATIVE WORKERS IN SWEDEN, 2001 - 2012
Education Years of Experience 2001 2002 2003 2004 2005 2006 2007 2008 2009 2010 2011 2012
Post- secondary (3 years or more) 1 -5 8.912 8.929 8.936 8.958 8.964 8.97 8.963 8.976 9.007 9.012 8.998 9.004
6 -10 8.974 9.005 9.005 9.034 9.039 9.053 9.045 9.053 9.086 9.086 9.07 9.088
11-15 9.006 9.031 9.039 9.068 9.081 9.094 9.094 9.104 9.14 9.151 9.138 9.15
16 - 20 9.048 9.071 9.068 9.096 9.104 9.117 9.116 9.124 9.16 9.175 9.168 9.187
21 - 25 9.098 9.114 9.115 9.137 9.139 9.151 9.146 9.149 9.179 9.194 9.176 9.198
26 - 30 9.15 9.165 9.159 9.18 9.182 9.193 9.183 9.184 9.214 9.22 9.205 9.222
31 - 35 9.177 9.196 9.198 9.222 9.226 9.232 9.226 9.218 9.243 9.252 9.233 9.25
36 - 40 9.155 9.182 9.185 9.218 9.23 9.244 9.241 9.236 9.264 9.277 9.257 9.273
Post - graduate 1 -5 9.038 9.051 9.062 9.101 9.081 9.079 9.066 9.094 9.126 9.136 9.122 9.123
6 -10 9.1 9.127 9.13 9.177 9.156 9.162 9.148 9.171 9.205 9.21 9.194 9.207
11-15 9.132 9.153 9.165 9.211 9.198 9.203 9.197 9.222 9.259 9.275 9.262 9.269
16 - 20 9.174 9.193 9.194 9.239 9.221 9.225 9.219 9.243 9.278 9.298 9.292 9.306
21 - 25 9.224 9.236 9.24 9.28 9.256 9.259 9.248 9.267 9.298 9.317 9.3 9.316
26 - 30 9.276 9.286 9.285 9.323 9.299 9.301 9.285 9.302 9.332 9.343 9.329 9.341
31 - 35 9.303 9.317 9.323 9.364 9.344 9.341 9.328 9.336 9.362 9.376 9.357 9.369
36 - 40 9.28 9.304 9.311 9.36 9.348 9.352 9.344 9.354 9.383 9.401 9.382 9.392
The table reports the mean of the log monthly wage of workers in each education-experience group. All wages are deflated to 2012 Swedish crowns
using the CPI (Statistics Sweden, 2014).
14
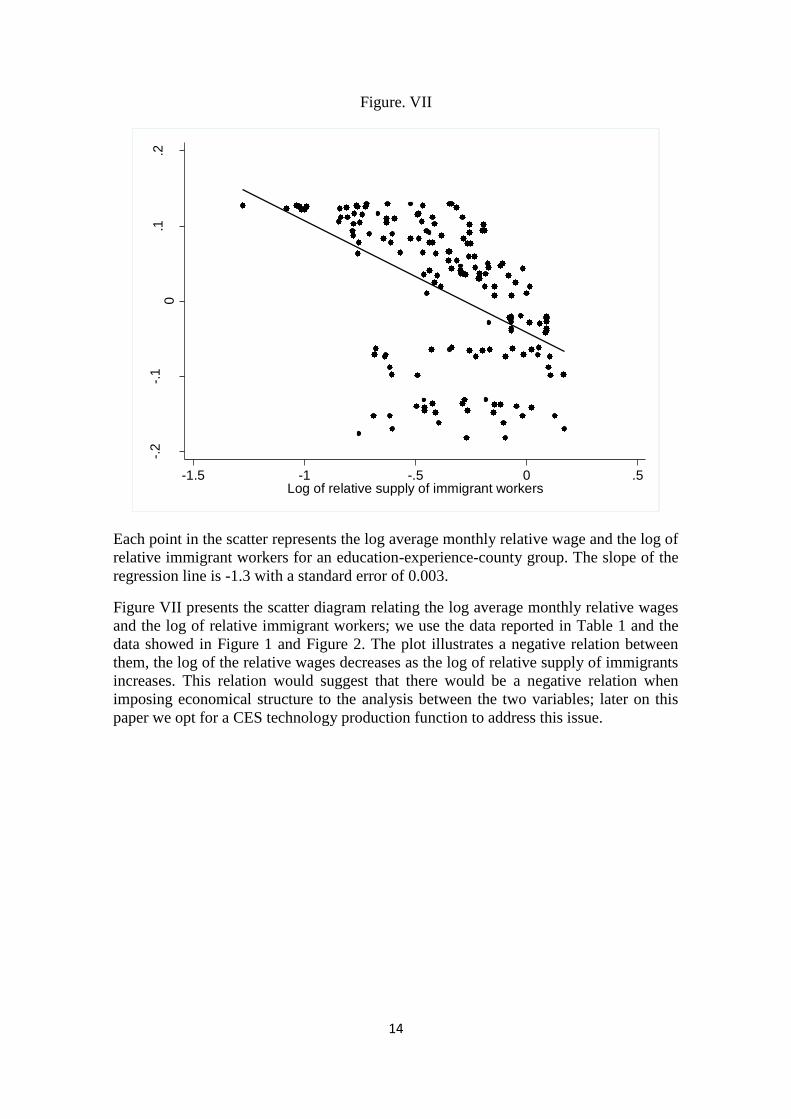
Figure. VII
Each point in the scatter represents the log average monthly relative wage and the log of
relative immigrant workers for an education-experience-county group. The slope of the
regression line is -1.3 with a standard error of 0.003.
Figure VII presents the scatter diagram relating the log average monthly relative wages
and the log of relative immigrant workers; we use the data reported in Table 1 and the
data showed in Figure 1 and Figure 2. The plot illustrates a negative relation between
them, the log of the relative wages decreases as the log of relative supply of immigrants
increases. This relation would suggest that there would be a negative relation when
imposing economical structure to the analysis between the two variables; later on this
paper we opt for a CES technology production function to address this issue.
-.2
-.1
0.1
.2
Lo
g o
f re
lative a
ve
rage
mo
nth
ly w
ag
es
-1.5 -1 -.5 0 .5Log of relative supply of immigrant workers
15
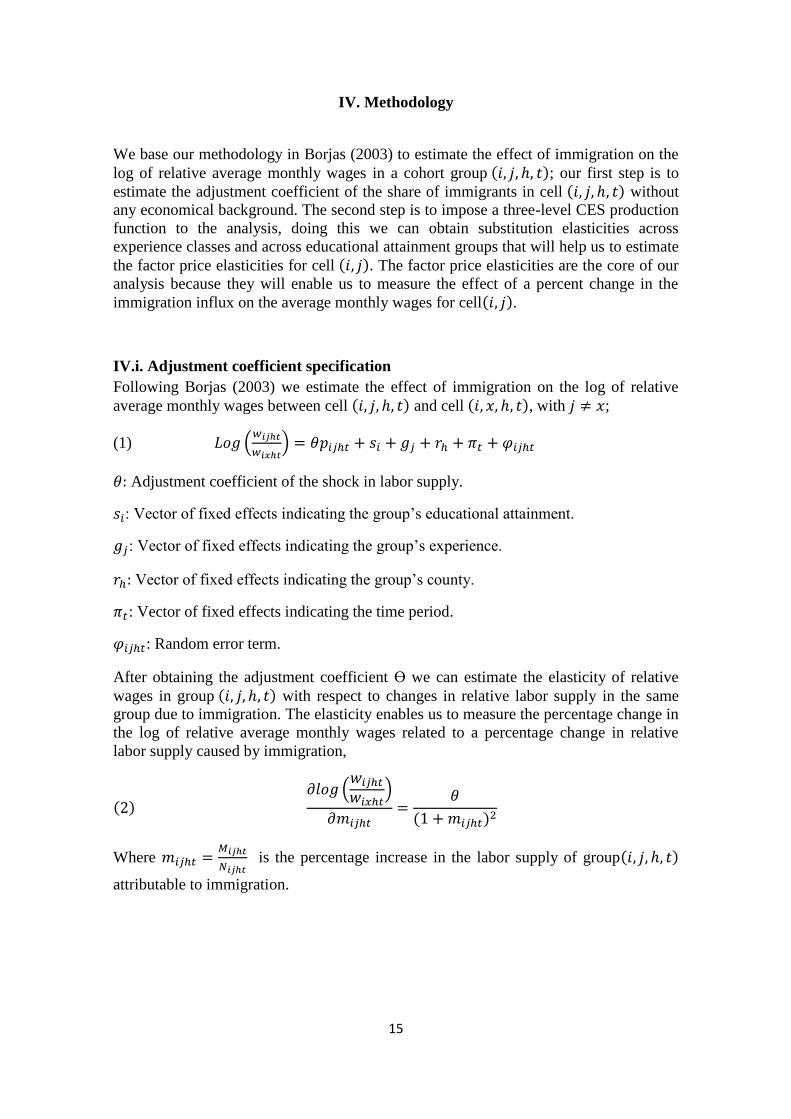
IV. Methodology
We base our methodology in Borjas (2003) to estimate the effect of immigration on the
log of relative average monthly wages in a cohort group ; our first step is to
estimate the adjustment coefficient of the share of immigrants in cell without
any economical background. The second step is to impose a three-level CES production
function to the analysis, doing this we can obtain substitution elasticities across
experience classes and across educational attainment groups that will help us to estimate
the factor price elasticities for cell . The factor price elasticities are the core of our
analysis because they will enable us to measure the effect of a percent change in the
immigration influx on the average monthly wages for cell .
IV.i. Adjustment coefficient specification
Following Borjas (2003) we estimate the effect of immigration on the log of relative
average monthly wages between cell and cell , with ;
(1)
Adjustment coefficient of the shock in labor supply.
: Vector of fixed effects indicating the group’s educational attainment.
: Vector of fixed effects indicating the group’s experience.
Vector of fixed effects indicating the group’s county.
: Vector of fixed effects indicating the time period.
: Random error term.
After obtaining the adjustment coefficient ϴ we can estimate the elasticity of relative
wages in group with respect to changes in relative labor supply in the same
group due to immigration. The elasticity enables us to measure the percentage change in
the log of relative average monthly wages related to a percentage change in relative
labor supply caused by immigration,
Where
is the percentage increase in the labor supply of group
attributable to immigration.

16
IV.ii. Three-level CES technology production specification
The latter approach estimates the correlation between the number of immigrants and the
relative wage of competing natives without specifying the technology of the production
function.
To impose economical structure to the analysis a three-level CES technology production
function is assumed. Workers from the same schooling group with different levels of
work experience are aggregated to form the effective supply of an education group; and
workers across schooling groups are then aggregated to form the national workforce.
The aggregate production function for the economy at time t is
,
=1
Q: Output.
K: Capital.
L: Aggregate labor.
: Elasticity of substitution between capital and labor.
λ: Time variant technology parameters.
Aggregate labor is the sum of the contributions of workers who differ in education and
experience. Let
: Number of workers with education i in county h at time t.
Elasticity of substitution across education aggregates.
: Time variant technology parameters that shift the relative productivity of
education groups.
The aggregation of the contribution of similarly educated workers with different
experience is defined as:

17
: Number of workers in education group i and experience group j in county h at
time t.
Elasticity of substitution across experience classes within an education group.
: Technology parameters that shift the productivity of education-experience groups.
The marginal productivity condition implies that the log of the relative wage for skill
group with , is
Equation (3) can be rewritten as
,
,
,
,
Where is absorbed by period fixed effects and controls for the differences in the
wage over county and time; is absorbed by interactions between the education
fixed effects, county fixed effects and period fixed effects and controls for the
possibility that the impact of education changed over county and time, is absorbed
by interactions between education fixed effects and experience fixed effects and
controls for the fact that the experience profile for the wage differs across schooling
groups.
From this regression model we can obtain the elasticity of substitution across experience
groups and the parameters can be also identified from the coefficients of the

18
fixed effects7, these estimates will enable us to calculate the aggregate labor for
education group i. With this information the regression for
can be estimated
from the following model
(5)
The estimations of equations (4) and (5) by ordinary least squares may lead to biased
estimates of and because the supply of workers tends to be endogenous along the
time period. To estimate these parameters we need the labor demand for cell
and respectively, the problem resides in that only the “equilibrium” quantities
for labor and wage are observed; these variables solve the equation system between
labor supply and demand curves, so we don´t have a specification for each curve. A
useful tool to solve this problem is the instrumental variable method, the IV method
solves a statistical simultaneous equations problem by using variables that appear in the
labor supply function to shift this equation and trace out the labor demand function. The
variables that do the shifting are known as instrumental variables. In our case the
instrumental variable is the immigrant influx, this will shift the supply curve as the
immigrants enter the labor market, then from the change in the labor supply we can
identify the demand curve8. The IV method is addressed by running a two stage least
squares regression, where in the first stage we use the relative supply of workers in cell
as the dependent variable and the influx of immigration in the same cell as the
regressor. In the second stage, the relative labor demand identified by the IV method is
used to estimate equation (4); the same steps are repeated for equation (5) where the cell
is .
IV.iii. Factor price elasticities
The next step after obtaining the elasticity of substitution across experience classes and
the elasticity of substitution across education groups is to show the responsiveness of
the relative wage in group to an increase in the number of immigrants in the labor
force. With this information we can determine if there is an affectation of immigration
on the relative wages trough the factor price elasticity. Obtaining the factor price
elasticities enable us to estimate the impact of immigration on the log relative wage of
group . The factor price elasticity giving the impact on the wage of factor y of an
increase in the supply of factor z is9
Where, and is the cost share
accruing to factor z.
7 The estimated fixed effect coefficient is , then .
8 The instruments used are
for equation (4) and
for equation (5), where
.
9 Marginal cost and the quantities of other factors are held constant.

19
In this model the factor price elasticities describe three impacts on the relative wage in
group ; the impacts are due to an increase in the relative supply of the same group,
an increase in the relative supply of a group with same education but different
experience and an increase in the relative supply group with different education and
different experience.
We obtain the own factor elasticity differentiating the log of the marginal productivity
of group with respect to
(6)
Where we define
gives the cost share accruing to group gives the cost share accruing to
education group i, and gives the labor’s share of income.
We can rewrite (6) as
Similarly, we differentiate the log of the marginal productivity of group with
respect to
to obtain the cross-factor price elasticity giving the impact on the
relative wage of group of an increase in the relative supply of group , with ,

20
Finally, we differentiate the log of the marginal productivity of group with respect
to
to obtain the cross-factor price elasticity giving the impact on the relative
wage of group of an increase in the relative supply of group , with and
,
The calculations of the factor price elasticities in (7)-(9) require information about the
factor shares, the elasticity of substitution across experience classes, the elasticity of
substitution between education groups and the elasticity of substitution between capital
and labor. Bentolila and Saint-Paul (2003) find that the labor’s share of income is 0.75
for Sweden; we use this share and the total monthly earnings to apportion the labor
shares accruing to the various groups10
.Finally, we use the values of
,
from
equations (4) and (5); and assume a Cobb-Douglas production function for Sweden,
which implies that the elasticity of substitution between capital and labor equals one,
Behrman (1982). The values of the factor price elasticities will fall if there is less than
one unit of substitution between capital and labor everything else constant, this implies
that the effect of immigration on the relative wages would be higher in specifications
where the production function is not represented by a Cobb-Douglas type and the
elasticity of substitution between capital and labor is less than unity. In the next session
we stick to the assumption of a Cobb-Douglas production function to calculate the
factor price elasticities.
V. Initial results
We present the results obtained after inputting the data in the specification where we
measure the shock in the labor supply due to immigration, the three-level CES
specification as well as the factor price elasticities for the education-experience groups.
Finally, we present the impact of immigration on relative wages in Sweden from 2001
to 2012.
V.i. Adjustment coefficient specification
From equation (1) the coefficient obtained is -0.027 with a standard error of 0.068, by
2012 immigration had increased the number of men in the labor force by 9.2 percent.
Equation (2) implies that the elasticity for the relative wage of average monthly
earnings is then -0.022. This means that an immigrant flow that increases the number of
workers in the skill group by 10 percent reduces relative average monthly earnings by
about 0.22%.
10
Our calculation of the cell´s income share uses all workers monthly wages in 2012. The estimated
shares for the eight experience groups with each education group are post secondary graduates
(0.04,0.05,0.05,0.05,0.06,0.06,0.06,0.06) and post-graduates (0.05,0.06,0.06,0.06,0.06,0.06,0.07,0.07).
The share of income accruing to secondary graduates is 0.53 and for post-graduates is 0.47.

21
Table II
IMPACT OF IMMIGRANT SHARE IN LOG OF RELATIVE AVERAGE WAGE
IN GROUP (i, j ,h, t)
Dependent
variable
Coef. Std. Err. F (40,3991) Prob>F
Number of
Observations
– 0.02731 0.06820 22,383.48 0 4,032
The table reports the coefficient of the immigrant share variable from the regression
where the dependent variable is the log of the relative average monthly wages for a
native education-experience-county group at a particular point in time. The regression
includes education, experience, county and time fixed-effects. We used the stata
command: xi: regress
i.Year i.County i.Education i.Experience, robust.
V.ii. Three-level CES specification
In the CES model, the first step is to estimate equation (4) using the sample of 4,032
cells, we use the wage of the group with 16-20 years as the denominator in the
relative wage. The IV estimate for the inverse of the elasticity of substitution across
experience classes is
(0.002)
Table III shows the first stage of the IV regression, where the coefficient of the
instrument is 0.43 with a standard error of 0.014. This suggests a positive relation
between the relative immigrant influx and the log of the relative labor demand. Table IV
shows the second stage of the IV regression and the inverse of the elasticity of
substitution across experience classes. The implied elasticity of substitution across
experience groups is 18.

22
Table III
IMPACT OF LOG OF RELATIVE IMMIGRANT WORKERS IN LOG OF RELATIVE
LABOR DEMAND IN GROUP (i, j ,h, t)
Linear
regression
Dependent
variable
Coef. Std. Err.
F
(255,3776) Prob>F
Number of
Observations
0.43 0.0148 23.40 0 4,032
The table reports the coefficient of the immigrant influx variable from the regression where the
dependent variable is the log of relative labor demand of a native skill group (defined in terms
of education-experience) in a county at a particular point in time. The model includes
interactions between county and period fixed effects; education, experience and county fixed
effects; and education and experience fixed effects. We used the stata command xi: regress
i.YearCounty i.EducationExperince i.EducationYearCounty, robust.
Table IV
IMPACT OF RELATIVE IMMIGRANT WORKERS IN
LOG RELATIVE AVERAGE MONTHLY WAGES IN GROUP (i, j, h, t)
IV regression
Dependent
variable
Coef. Std. Err. F(255,3776) Prob>F
Number of
Observations
-0.0551 0.0025 387.64 0 4,032
The table reports the coefficient of the log of relative labor demand variable from the regression
where the dependent variable is the log of relative average monthly wages of a native skill group
(defined in terms of education-experience) in a county at a particular point in time. The model
includes interactions between county and period fixed effects; education, experience and county
fixed effects; and education and experience fixed effects. We used the stata command xi: ivreg2
i.YearCounty i.EducationExperince i.EducationYearCounty,
robust.
23
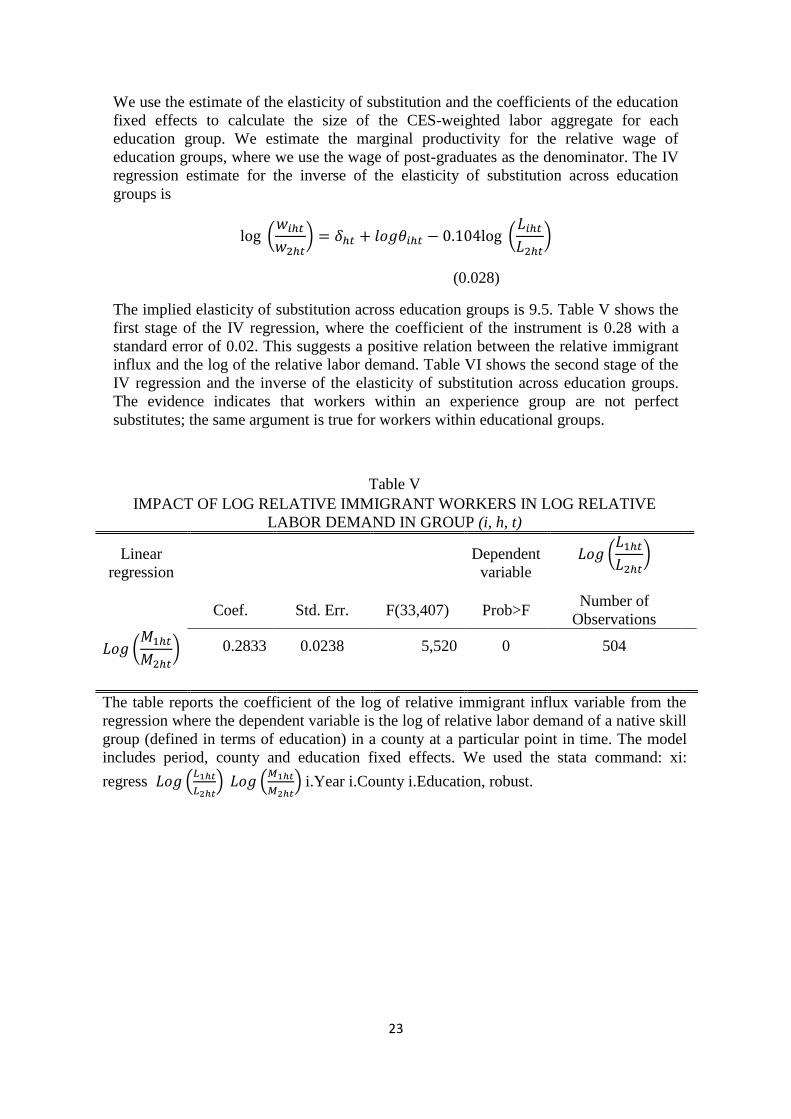
We use the estimate of the elasticity of substitution and the coefficients of the education
fixed effects to calculate the size of the CES-weighted labor aggregate for each
education group. We estimate the marginal productivity for the relative wage of
education groups, where we use the wage of post-graduates as the denominator. The IV
regression estimate for the inverse of the elasticity of substitution across education
groups is
(0.028)
The implied elasticity of substitution across education groups is 9.5. Table V shows the
first stage of the IV regression, where the coefficient of the instrument is 0.28 with a
standard error of 0.02. This suggests a positive relation between the relative immigrant
influx and the log of the relative labor demand. Table VI shows the second stage of the
IV regression and the inverse of the elasticity of substitution across education groups.
The evidence indicates that workers within an experience group are not perfect
substitutes; the same argument is true for workers within educational groups.
Table V
IMPACT OF LOG RELATIVE IMMIGRANT WORKERS IN LOG RELATIVE
LABOR DEMAND IN GROUP (i, h, t)
Linear
regression
Dependent
variable
Coef. Std. Err. F(33,407) Prob>F
Number of
Observations
0.2833 0.0238 5,520 0 504
The table reports the coefficient of the log of relative immigrant influx variable from the
regression where the dependent variable is the log of relative labor demand of a native skill
group (defined in terms of education) in a county at a particular point in time. The model
includes period, county and education fixed effects. We used the stata command: xi:
regress
i.Year i.County i.Education, robust.
24
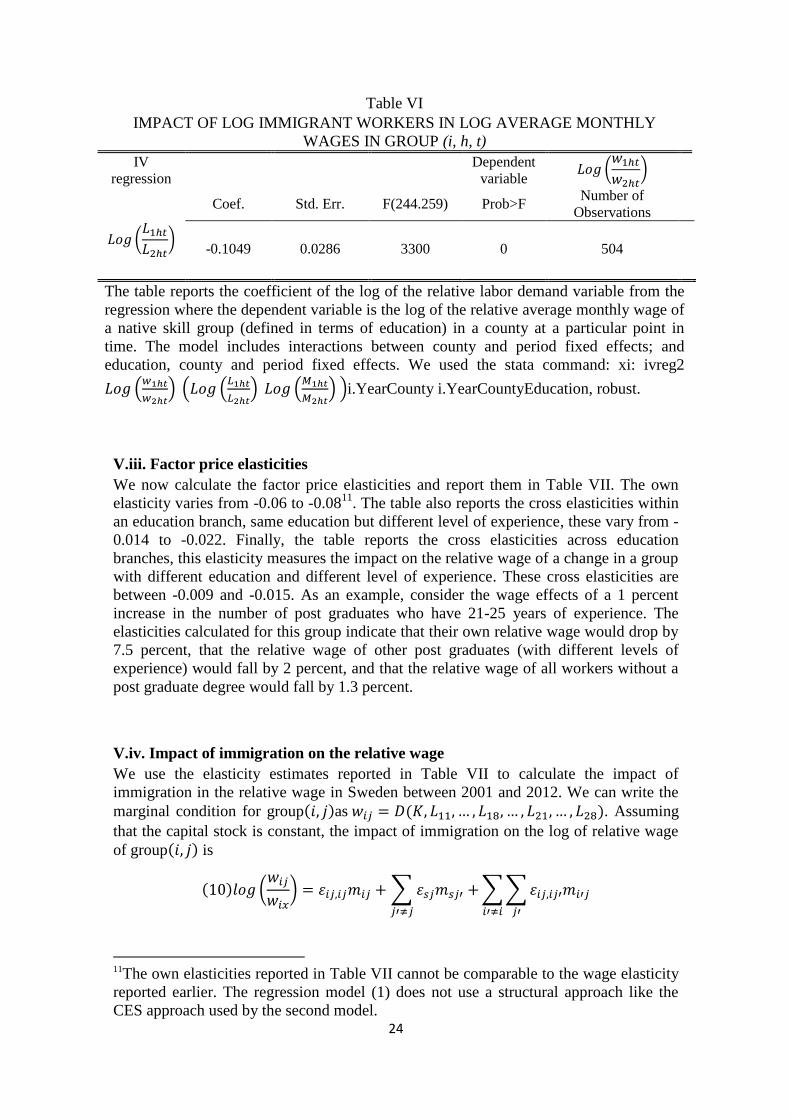
Table VI
IMPACT OF LOG IMMIGRANT WORKERS IN LOG AVERAGE MONTHLY
WAGES IN GROUP (i, h, t)
IV
regression
Dependent
variable
Coef. Std. Err. F(244.259) Prob>F
Number of
Observations
-0.1049 0.0286 3300 0 504
The table reports the coefficient of the log of the relative labor demand variable from the
regression where the dependent variable is the log of the relative average monthly wage of
a native skill group (defined in terms of education) in a county at a particular point in
time. The model includes interactions between county and period fixed effects; and
education, county and period fixed effects. We used the stata command: xi: ivreg2
i.YearCounty i.YearCountyEducation, robust.
V.iii. Factor price elasticities
We now calculate the factor price elasticities and report them in Table VII. The own
elasticity varies from -0.06 to -0.0811
. The table also reports the cross elasticities within
an education branch, same education but different level of experience, these vary from -
0.014 to -0.022. Finally, the table reports the cross elasticities across education
branches, this elasticity measures the impact on the relative wage of a change in a group
with different education and different level of experience. These cross elasticities are
between -0.009 and -0.015. As an example, consider the wage effects of a 1 percent
increase in the number of post graduates who have 21-25 years of experience. The
elasticities calculated for this group indicate that their own relative wage would drop by
7.5 percent, that the relative wage of other post graduates (with different levels of
experience) would fall by 2 percent, and that the relative wage of all workers without a
post graduate degree would fall by 1.3 percent.
V.iv. Impact of immigration on the relative wage
We use the elasticity estimates reported in Table VII to calculate the impact of
immigration in the relative wage in Sweden between 2001 and 2012. We can write the
marginal condition for group as . Assuming
that the capital stock is constant, the impact of immigration on the log of relative wage
of group is
11The own elasticities reported in Table VII cannot be comparable to the wage elasticity
reported earlier. The regression model (1) does not use a structural approach like the
CES approach used by the second model.

25
where gives the percentage change in labor supply due to immigration in cell .
Because the size of the native labor force in each skill group is shifting over time, is
defined as
So that the baseline population used to calculate the percent increase in labor supply
averages out the size of the native work-force in the skill cell and treats the preexisting
immigrant population as part of the “native” stock.
Table VIII summarizes the results of this simulation. The immigrant influx between
2001 and 2012 had a negative effect on the wages; the impact was larger for the group
with less experience in both educational classes. The wage of post-secondary graduates
fell 3.6 percent and the one for post-graduates 3.3 percent. Overall, immigration had a
negative effect on the wages by reducing them by 3.4 percent.

26
Table VII
ESTIMATED FACTOR PRICE ELASTICITIES, BY SKILL GROUP
Education Years of
experience
Own
elasticity
Cross elasticity(within education
branch)
Cross elasticity(across education
branches)
Post secondary
graduates 1-5 Years
-0,0693 -0,0142 -0,0095
6-10 Years -0,0706 -0,0154 -0,0104
11-15 Years -0,0716 -0,0164 -0,0110
16-20 Years -0,0722 -0,0170 -0,0115
21-25 Years -0,0724 -0,0172 -0,0116
26-30 Years -0,0728 -0,0177 -0,0119
31-35 Years -0,0733 -0,0182 -0,0122
36-40 Years -0,0737 -0,0186 -0,0125
Post graduates 1-5 Years -0,0718 -0,0167 -0,0108
6-10 Years -0,0732 -0,0181 -0,0117
11-15 Years -0,0744 -0,0193 -0,0124
16-20 Years -0,0751 -0,0200 -0,0129
21-25 Years -0,0753 -0,0202 -0,0131
26-30 Years -0,0759 -0,0207 -0,0134
31-35 Years -0,0764 -0,0213 -0,0138
36-40 Years -0,0769 -0,0218 -0,0141
Equations (7)–(9) define the factor price elasticities in the three-level CES framework. For a 1 percent change in the number of workers of any
specific group, the own factor price elasticity gives the percent change in that group’s relative wage; the cross elasticity within an education
branch gives the percent change in the relative wage of a group with the same education but with different experience; the cross elasticity
across education branches gives the percent change in the relative wage of groups that have different educational attainment.

27
Table VIII
WAGE CONSEQUENCES OF IMMIGRANT INFLUX BETWEEN
2001 AND 2012 (PREDICTED CHANGE IN LOG MONTHLY
WAGE)
Education
Years of
experience
Post secondary
graduates
Post
graduates
All
workers
1-5 Years -0,0392 -0,0354 -0,0391
6-10 Years -0,0419 -0,0265 -0,0417
11-15 Years -0,0348 -0,0349 -0,0349
16-20 Years -0,0360 -0,0342 -0,0360
21-25 Years -0,0328 -0,0360 -0,0331
26-30 Years -0,0356 -0,0344 -0,0355
31-35 Years -0,0348 -0,0308 -0,0344
36-40 Years -0,0349 -0,0318 -0,0347
All workers -0,0366 -0,0335 -0,0345
The simulation uses the factor price elasticities reported in Table VIII
to predict the wage effects of the immigrant influx that arrived between
2001 and 2012. The calculations assume that the capital stock is
constant. The variable measuring the group-specific immigrant supply
shock is defined as the number of immigrants arriving between 2001
and 2012 divided by a baseline population equal to the average size of
the native workforce (over 2001–2012) plus the number of immigrants
in 2001. The last column and the last row report weighted averages,
where the weight is the size of the native workforce in 2012.

28
VI. Conclusions
The analysis is based on skill groups which are defined in terms of educational attainment, work
experience, county and year. Immigrations had a large effect in the wages of workers with less
experience in both educational groups. The evidence in this paper suggests that immigration
reduces the wage of native workers. Our estimates of the own factor elasticity vary from -0.06 to
-0.08. These estimates imply that the influx of immigrant workers into the labor market has
worsened the opportunities of the native workers. Between 2001 and 2012, immigration
increased the labor supply by 9.5%; our analysis implies that this immigrant influx reduced the
wage of the native worker by 3.4%. The wage impact differed across education groups, with
wage falling by 3.6% for post-secondary graduates and 3.3% for post graduates.
Although the analysis found a negative relationship between wages and immigration, the model
ignored the long-run adjustment of capital as a consequence of immigration, it also assumed a
Cobb-Douglas production function and share of labor equal to 0.75 and perfect substitutability
between immigrants and natives with the same education and experience. A more complex
analysis should take into account the interactions between capital and labor and not only assume
that capital is fixed. Relaxing the assumption of a Cobb-Douglas production function would have
a different outcome; in the case of the model used the impact would be more negative. Finally,
less than perfect substitutability between immigrants and natives in the same cell could be
assumed to differentiate the skills from these two types of workers because experience and
education acquired outside Sweden could have a different value for employers.
The findings of the impact of immigration on the relative wages of native workers should be
complemented with the benefits that would arise from high-skilled immigrants. This type of
immigrants could lead to technological change in Sweden and have a positive impact in the
economic growth, fact that should also be considered when doing public policy.
29
REFERENCES
Aguilar, R. and Gustafsson, B. (1994). ”Immigrants in Sweden’s Labor Market during the
1980s”, Scandinavian Journal of Social Welfare, 3, 139-147.
Berhman, Jere (1982). “Country and Sectorial Variations in Manufacturing Elasticities of
Substitution between Capital and Labor”, in Anne O. Krueger, ed., Trade and Employment in
developing Contries, vol. 2: Factor Supply and Substitution ( Chicago: University of Chicago
Press, 1982), 159-192.
Borjas, George J., Richard B. Freeman, and Lawrence F. Katz (1997), “How Much Do
Immigration and Trade Affect Labor Market Outcomes?”, Brookings Papers on Economic
Activity, 1-67.
Borjas, George J (2003). “The Labor Demand Curve Is Downward Sloping: Reexamining the
Impact of Immigration on the Labor Market”, Quarterly Journal of Economics
(November):1335-74.
Borjas, George J (2004). Immigration in High-Skill Labor Markets: The Impact of Foreign
Students on the Earnings of Doctorates (March). NBER Working Paper No.w12085.
Card, D. (1990). “The impact of the Mariel boatlift on the Miami labor market”, Industrial and
Labor Relations Review XLIII, 245-257.
Chiswick, Barry R. and Miller, Paul W. (2004). "Language Skills and Immigrant Adjustment:
What Immigration Policy Can Do!,"IZA Discussion Papers 1419,1-65.
Duvander, A. (2001) “Do country-specific skills lead to improved labor market positions? An
analysis of unemployment and labor market returns to education among immigrants in Sweden”,
Work and Occupations; 28: 210-33.
Ekberg, J. (1998). “Immigration and the public sector: Income effects for the native population in
Sweden”, Inter- national Migration Quarterly Review; 411-24.
Friedberg, Rachel M., and Jennifer Hunt. (1995). "The Impact of Immigrants on Host Country
Wages, Employment and Growth." Journal of Economic Perspectives, 9(2): 23-44.
King, R. (2012). “Theories and Typologies of Migration: An Overview and a Primer”. Willy
Brandt Series of Working Papers in International Migration and Ethnic Relations. 3- 17.
OECD. 2012. Education as a glance. Paris: OECD.
OECD. 2001. Legislation, collective bargaining and enforcement: Updating the OECD
employment protection indicators. Paris: OECD.
30
OECD. 2006. OECD Reviews of Migrant Education. Paris: OECD.
OECD. 2009. Education as a glance. Paris: OECD.
Ottaviano, Gianmarco and Giovanni Peri (2006). “Rethinking the Effects of Immigration
onWages”, NBER Working Paper No. 12497, 2-11.
Manacorda Marco, Alan Manning and John Wadsworth (2010). “The Impact of Immigration on
the Structure of Male Wages: Theory and Evidence from Britain”, Journal of the European
Economic Association, 3-22.
Statistics of Sweden (2014, April) Educational attainment of the population. SCB web site
<http://www.statistikdatabasen.scb.se/pxweb/en/ssd/START__UF__UF0506/UtbSUNBef/?rxid=
3edbb0d7-65e9-4616-98a9-4c316d1fb30f#> [Retrieved 2014-04-10].
Statistics of Sweden (2014, April) Wage and salary structures and employment in county
councils. SCB web site
<http://www.statistikdatabasen.scb.se/pxweb/en/ssd/START__AM__AM0105__AM0105A/Land
sting3g/?rxid=3edbb0d7-65e9-4616-98a9-4c316d1fb30f> [Retrieved 2014-04-10].
Västerbotten Investment Agency (2014, May) Well educated people in Västerbotten. VIA web
site < http://viavasterbotten.se/regional-facts/vasterbotten/research-development/> [Retrieved
2014-05-26].