edu reach : voc journal of educationa l research
35
EDU REACH : VOC JOURNAL OF EDUCATIONAL RESEARCH (A Blind Peer Reviewed Half Yearly Journal) V.O.CHIDAMBARAM COLLEGE OF EDUCATION (Govt. Aided & Re- Accredited by NAAC with “B” Grade) THOOTHUKUDI – 628 008 E-mail id : [email protected] Phone: 0461- 2310600, Fax : 0461- 2310275 EDITORIAL BOARD Patrons Hon. A.P.C.V.Chockalingam , President Hon. A.P.C.V.Shanmugam , Secretary V.O.Chidambaram College of Education Advisory Committee Dr.V.Thamodharan, Ph.D., Principal, V.O.Chidambaram College of Education Prof. Dr.O.Nellaiyapen, Ph.D., Annamalai University, Chidambaram. Prof. Dr. Balakrishnan Muniandy, Ph.D., University Sains Malaysia, Malaysia. Prof. Dr. Ugur Demiray, Ph.D., Anadolu University, Eskisehir Turkey. Prof. Dr. Samuel Ouma Oyoo, Ph.D., Wits School of Education, Australia. Chief Editor Dr. T. Kanakaraj Editors Dr.S. Rasul Mohaideen, Dr.R.Sasipriya Co-Editors Dr.S.Usha Parvathi, Dr.S.Guru Vasuki Associate Editors Prof. Dr.E.Ramganesh, Ph.D., Prof. Dr.I.Muthuchamy, Ph.D., Bharathidhasan University, Tiruchirappalli. Dr.P.Vijayal, Ph.D., Former Principal, V.O.C.College of Education, Dr.K.Thiyagu, Ph.D., Central University of Kerala, South India. Technical Committee Dr.G.Rajadhurai Dr.C.Thanavathi Ms.S.Kavithalincy Assistant Professors, V.O.Chidambaram College of Education Published by V.O.Chidambaram Educational Society, Thoothukudi – 628008. Printed at : Uma Press, Tirunelveli. Dear Readers, Warm Greetings from EduReach! V.O.Chidambaram College of Education, proposes to revamp and relaunch its “VOC Journal of Education” in 2016. The new edition of this journal named “EduReach:VOC Journal of Educational Research” is a blind peer reviewed with an ISSN, focusing on all issues related to education. We are glad to unveil this first issue with the blessings of our Hon. founder secretary Kulapathi APC Veerabahu. We express our sense of gratitude to the faculties, research scholars and non-academicians interested and involved in education for also extending their generous and magnanimous support and constant encouragement in the forthcoming days also. Educating children today is a big challenge as the teachers have to be prepared and trained in every aspect. Unimaginable change brought by Liberalization, Privatisation and Globalisation, especially Science and Information Technology has become a big challenge. Now - a - days people from every walk of life are busy with social networking. This challenge has tremendous impact on the lives of people. At the outset, the way of thinking, culture and the life style of the people have also changed. The outcome of this change in behaviour could be visible in the early stages. In this scenario, the teachers shoulder the responsibility of educating young minds which needs dedication and training in every aspect. Teachers should inculcate values and share the knowledge make use of these resources meaningfully, because this fast growing media makes the receiver enriched. Hence, it is the duty of the teachers to monitor and accompany the children to make use of the resources effectively and efficiently, so that they become productive. This issue of our journal carries research papers on various issues like Ego Centric Characteristics, W riting Deficiency of teacher trainees, Soft Skills and Teaching Competency, Academic H elp seeking Behaviour, Personality, Organisational Climate, Communication Skills, and Human Rights Awareness. This issue mainly focuses on prospective teachers and a few on school students. This will throw some ideas to reform the teacher education institutions and ultimately the society. With Regards, Editorial Board
-
Upload
khangminh22 -
Category
Documents
-
view
1 -
download
0
Transcript of edu reach : voc journal of educationa l research
ED U REACH : VOC JOUR NAL OF EDUCATIONA L R ESEAR CH (A Blind Peer Reviewed Half Yearly Journal)
V.O .CHIDAM BARA M COLLEGE OF E DUCATION (Govt. Aided & Re- Accredited by NAAC with “B” Grade) THOOTHUKUDI – 628 008 E-mail id : vocceedureach@ gmail.com
P hone: 0461- 2 31 0600, F ax : 046 1- 2310275
EDITO RIAL BO ARD
Patrons
Hon. A .P.C.V.Chock alinga m , P residen t
Hon. A .P.C.V.Shan muga m , S ecre tary
V .O .C hidam bara m College of Educ ation
Ad visory Committee
Dr.V.T ham od haran, Ph.D., P rincipa l,
V .O .C hidam bara m College of Educ ation
Prof. D r.O.Nellaiyap en , Ph .D.,
A nnam ala i U nivers ity , Chida mba ra m .
Prof. Dr. B alak rishn an Mu niand y, Ph.D .,
U niversity S ains M a lays ia , M a laysia.
Prof. D r. Ugu r Dem iray , Ph .D.,
A nado lu U nive rs ity , Eskise hir T urke y.
Prof. Dr. Sam u el Ou m a Oyoo, Ph.D.,
W its S chool of Ed ucation, A us tralia.
Chief Editor
Dr. T . K anakaraj
Editors
Dr.S. Rasul M ohaideen, Dr.R.Sasipriya
Co-Editors
Dr.S.Usha Parvathi, Dr.S.Guru V asuki
Associa te Editors
Prof. Dr.E.Ramganesh, Ph.D .,
Prof. Dr.I.M uthuchamy, Ph.D .,
B harathidhasan U niversity , T iruchirappalli.
D r.P .Vijayal, Ph.D.,
F orm er P rincipal, V .O .C.College of E ducation,
Dr.K.Thiyagu, Ph.D.,
Ce ntral U nivers it y of K e ra la, S outh India .
Tech nical Committee
D r.G.Rajadhurai Dr.C.Thanavathi
M s.S.K avithalincy
A ss istant P rofe ssors ,
V .O .C hidam bara m College of Educ ation
Published by
V.O.Chidambaram E ducat ional Society,
T hoothukudi – 628008 .
P rinted at : U ma Pr ess , T irune lve li.
Dear Readers,
W a rm G reetings fro m E duRea ch!
V .O .C hidam bara m Colle ge of Educ ation,
proposes to revam p a nd relaunc h its “V O C Journa l of
E ducation” in 2016. T he ne w ed ition of this jo urnal
na me d “E duRe ach:V O C Journal of E ducationa l
R esea rc h” is a blind peer re vie w ed w ith an IS S N ,
focus ing o n a ll is sue s related to educ ation. W e a re
glad to unveil this f irst is sue w ith the b le ss ings o f our
H on. fou nder s ecreta ry K ula pathi A P C V ee ra bahu.
W e expres s our s ense of gra titude to the facultie s,
res earch sc holars and non-aca dem icians i nte re sted and
involved in educ ation for also extending the ir
gene rou s and m agna nimo us support a nd consta nt
enc oura gem ent in the forthcom ing d ays also .
E ducating children tod ay is a b ig c hallenge
as the tea chers ha ve to be pre pared and trained in
eve ry asp ect. U nim aginab le cha nge brought b y
L iberalization, P rivatisa tio n and G lobalis ation,
espec ia lly Sc ience a nd Inform ation T ec hno lo gy has
be com e a big cha lle nge. N ow - a - days p eople fro m
eve ry w alk o f life are busy w ith social netw orking.
T his cha lle nge has trem endo us im pact on the live s of
pe ople. A t the outse t, the w ay of thinking, culture and
the life s tyle of the peo ple have a lso c hanged . The
outco me of this c hange in be haviour could be visible
in the e arly s tages . In this s cena rio, the tea chers
shoulder the responsibility of educa ting young m inds
w hic h nee ds dedica tion and training in every asp ect.
T ea chers should inculcate value s and share the
know le dge m a ke use of these resources m eaningfully ,
be cause this fa st grow ing m edia m a ke s the rece ive r
enriche d. H e nce, it is the duty of the tea chers to
m onitor a nd a ccom pa ny the children to ma ke u se of
the re source s effe ctively a nd eff icien tl y, so tha t the y
be com e p rod uctive.
T his is sue of our journal carr ies re sea rc h
pa pers o n various is sue s like E go Ce ntr ic
C ha ra cteristics , W riting D efic ie ncy of teache r
trainees , S oft S kills a nd T e aching Com pete ncy,
A ca dem ic H elp se eking B ehaviour, P e rsonality ,
O rganis ational Clim ate , Co m munic ation S kills , and
H um a n Rights A w arene ss . T his issue m ainly focuses
on prospec tive tea chers and a few on s chool stude nts .
T his w ill throw so me id eas to re form the teac her
ed ucation i ns titutions and ultima tely the society.
W ith Rega rd s,
Ed itorial Boar d

EGOCENTRIC CHARACTERISTICS IN EARLY ADOLESCENTS WITH
REGARD TO PERSONAL, FAMILIAL AND INSTITUTIONAL VARIABLES
* Mrs.A. Linsey Cranab **Dr. B. William Dharma Raja
Abstract
Early adolescence is a distinct developmental phase, which qualitatively differs from
both latency and adolescent proper. Early adolescent at the terminal stage of concrete thinking,
may not be able to perform abstract thinking. So there may be some cognitive distortions within
them. One of the cognitive distortions encountered by them is egocentrism. It is the state of
being self-centred, preoccupied with one’s own concerns to the exclusion of noticing or caring
about others. The egocentrism at the early adolescent stage is distinctive and crucial as the
cognitive and emotional disequilibrium as well as the psychological vulnerabilities. This study
reveals the egocentrism with regard to select attributive variables.
Introduction
Adolescence is a time of transition in which
the adolescents must cope with involving his or her
mind, body, emotions and social relationships. The
term egocentrism is named by child psychologist,
Jean Piaget. From his research on developmental
stages of children, he notised that egocentrism was
a primary phase for children until about age six. He
termed egocentrism as the tendency for children to
only be aware of their own needs and thoughts and
to basically assume that they are the centre of the
world. In this phase, children are not able to consider
or grasp the thoughts of others accurately, because
they are only able to consider their own desires and
opinions. But David Elkind says that egocentrism
also occurs in the adolescents’ stage (Santrock,
2011). Adolescent egocentrism is the heightened
self-consciousness reflected in adolescents’ beliefs
that others are as interested in them and a sense of
personal uniqueness. Early adolescents at this stage
have the desire to be notised, visible and on stage.
Eventhough egocentrism is a normal occurrence, for
some individuals, it can contribute to reckless
behaviour and loneliness. Egocentricity leads some
adolescents to think that they are invulnerable.
Burka and Glenwick(1978) say that high
egocentrism is associated with shy, anxious behaviour
for girls and acting-out and learning difficulties for
boys. The findings of Riely, Adams and Nielson
(1984) examine that perceived parental support was
associated with diminished egocentrism, while
perceived parental rejection was predictive of
heightened self-consciousness. Egocentrism
contributes to unrealistic optimism (Weinstein and
Lachendro, 1982). The existence of the imaginary
audience declined with age, as did the personal
fable,although the latter did not decline to the same
extent as the former (Enright et al., 1979). According
to O’Conner (1995), identity development was
more strongly and consistently related to ego
centrism.
Significance of the Study
Child development researchers examine
different domains of development, such as physical
growth, cognition, language, personality, social
relationships, etc. Among them, the cognitive
development, the changes over time in children’s
thinking, reasoning, use of language, problem
solving, and learning, play a vital role in an individual.
The field is vast and researchers across the world
study many different aspects of children’s thinking
at different points in development (Salkind, 2002).
In addition to the abstract thinking, earlyadolescents foster egocentrism. Adolescent
egocentrism is the heightened self-consciousness of
* UGC - Junior Research Fellow, Department of Education, Manonmaniam Sundaranar University,
Tirunelveli - 627 012.
** Head, Department of Education, Manonmaniam Sundaranar University, Tirunelveli - 627 012.
Keywords : Egocentrism, Early adolescent andCognitive distortion.
EDUREACH Volume 01 Issue 01 July - December 20161
adolescents, which reflected in their belief that othersare as interested in them as they are in themselves,and in their sense of personal uniqueness and
invincibility. Many cognitive characteristics can bestudied but the egocentrism is the characteristicwhich cannot be easily identified by oneself. Because
it will diminish as the child grow to adulthood andexceptions are also there. This study helps to knowthe individual differences in their egocentric
characteristic with regard to selected backgroundvariables.
Objectives
1. To find the significant difference, if any, in theegocentric nature of the early adolescents withregard to the personal variables.
2. To find the significant difference, if any, in the
egocentric nature of the early adolescents withregard to the familial variables.
3. To find the significant difference, if any, in the
egocentric nature of the early adolescents withregard to the institutional variables.
Hypotheses
1. There is no significant difference in the egocentric
nature of the early adolescents with regard to thepersonal variables.
2. There is no significant difference in the egocentric
nature of the early adolescents with regard to thefamilial variables.
3. There is no significant difference in the egocentricnature of the early adolescents with regard to the
institutional variables.
Methodology
Survey method was adopted for this study.
Tool Used
A three point scale namely LiWi’s scale onegocentrism developed by the authors containing 22
statements was used to identify the egocentric natureof the early adolescents.
The tool was given to three experts in the
field of psychology and education for face validity.Based on the suggestions given by the experts, itemswere reframed apposite to the level of early
adolescents. Three point rating scale - always,sometimes and never - was employed. The try outwas established using 90 respondents. The
respondents were students of standard IX from sixschools. The reliability coefficient of the tool wasverified using test–retest method, and it was found
to be 0.723. The Cronbach’s -value for 38 itemsis 0.700. Items with low correlation value weredropped and 16 items were deleted. To haveCronbach’s - value as 0.803, the items werereduced from 38 to 22.
SampleThe accessible population for this study is
all high and higher secondary school students inTirunelveli district. The data were collected from 596students of standard IX from 21 schools whichinclude government, aided and private schools.
EDUREACH Volume 01 Issue 01 July - December 20162
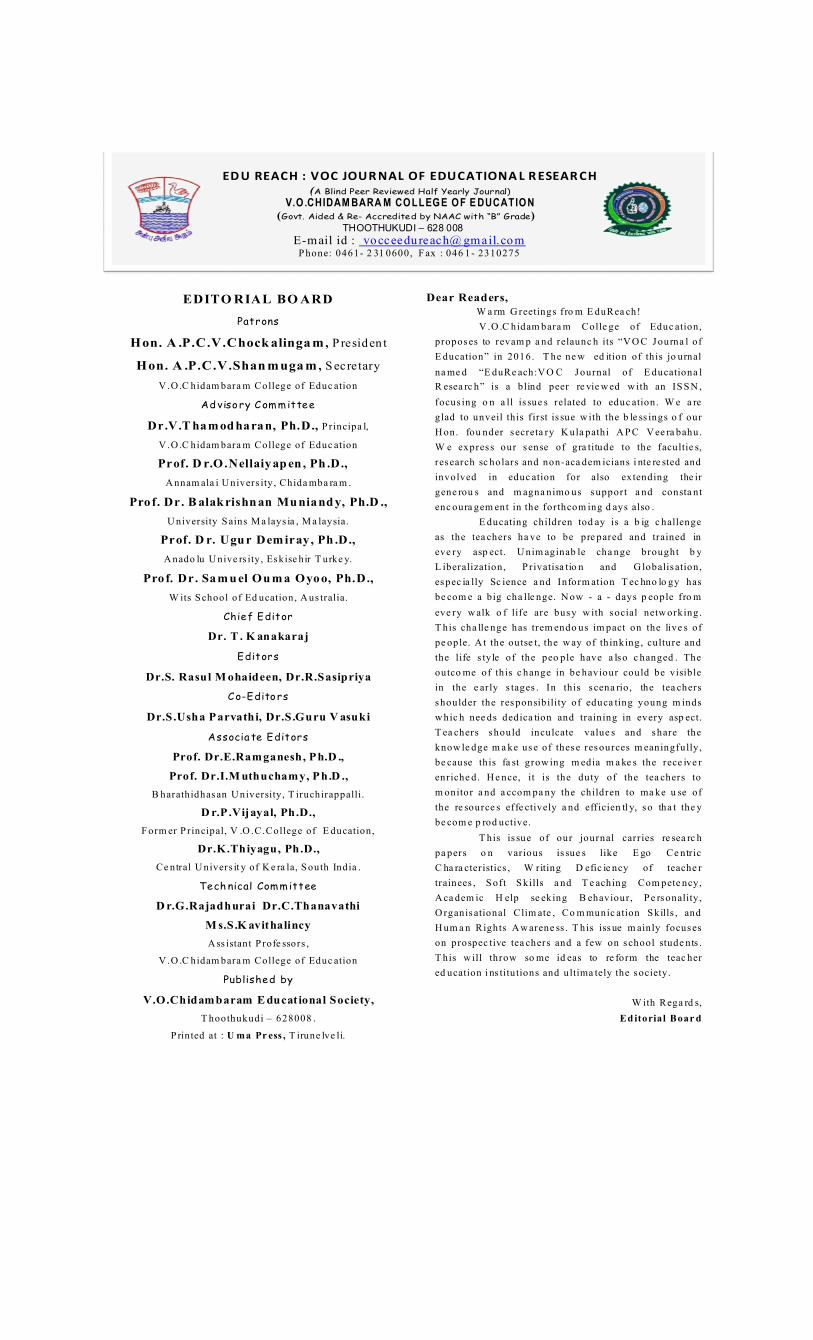
Table - 2 : Significance of difference in egocentric natureof secondary students with regard to familial variables
Familial variable N Mean SD t p Both Parents 566 63.001 9.616
Single Parent 30 63.03 11.55Mothers Employee 339 63.323 10.3Employability Not anStatus Employee 257 62.581 8.873
NS - Not Significant even at 5% level
Table - 3 : Significance of difference in egocentrism withregard to institutional variablesInstitutional Source of Sum of df Mean F value P value
Variable SquaresType of School Between 117.108 2 58.554
Within 56000.844 593 94.436Nature of School Between 1334.001 2 667.000
Within 54783.952 593 92.384Locality of Between 134.786 2 67.393
Within 55983.166 593 94.407**Significant at 1% level NS - Not Significant even at 5% level
Table - 3 (a) : Scheffe’s test result showing the significantdifference in the egocentrism of early adolescents withregard nature of school
Nature of School Mean Std.Error P ValueGovt Aided Private difference64.389 61.280 - 3.108 0.966 0.006* - 61.280 64.220 2.936 0.936 0.008*64.389 - 64.220 0.168 1.044 0.987NS
* Significant at 1% level NS - Not Significant even at 5% level
Findings and Interpretations
Table 1 reveals that there is no significant
difference in egocentrism with regard to medium
of instruction and mode of residence. And only
Data AnalysisTable – 1 : Significance of difference in egocentric natureof secondary students with regard to personal variables.Personal variable N Mean SD t pGender Male 302 64.91 10.36360
Female 294 61.044 8.57851Medium Tamil 297 63.284 9.87717
English 299 62.724 9.55273Residence Day Scholar 563 63.065 9.76301
Others 33 61.937 8.85724* Significant at 1% level NS - Not Significant at 5% level
4.967 0.000*
0.704 0.482NS
0.707 0.517 NS
0.506 0.988NS
0.924 0.356NS
0.620 0.538NS
7.220 0.001**
0.714 0.490NSSchool
Parental Status
situations, so that children can learn from one another.
Social perspective training, Interpersonal cognitive
problem solving training and value education can be
given at earlier stages to minimize the egocentric
behaviour. The Jigsaw puzzles and building blocks of
different sizes and shapes develop the child’s capacity
for abstract thinking (Weiler, n.d). These activities
are sure to hold the interest of the children and help
them to develop abstract thinking.The involvement
of teachers and parents takes a predominant role todiminish the egocentric nature among earlyadolescents and encourages altruistic behaviour.
References
Burka, A.A.and Glenwick, D.S.(1978).Egocentrism and Classroom Adjustment. Journalof Abnormal Child Psychology, 6(1), 61-70.
Retrieved fromhttp://link.springer.com/article /10.1007/BF00915782.
Enright, R.D., Lapsey, D.K. and Shukla, D.G.
(1979). Adolescent egocentrism in early and late
adolescence. Adolescence, 14(56), 687-695.Retrieved from http://psp.sage pub.com/ content/8/2/195.short.
Feldman, R.S. (2011). Understanding Psychology.(10thed.). New Delhi: Tata McGraw HillPublications.
Levinson, D., Cookson, P. and Sadovnik,
A. (Eds). (2002). Education and Sociology : Anencyclopedia. New York : Rouledge FalmerPublications.
Riely, T., Adams, G.R. and Nielson, E. (1984).Adolescent egocentrism : the association amongimaginary audience behavior, cognitive development,
and parental support and rejection. Journal ofYouth and Adolescence,13(5),401-417. Retrievedfrom http://link.springer.com/article/10.1007/
BF02088638.
Santrock, J.W.(2011). Educational Psychology.(4thed.) NewDelhi :Tata McGraw Hill EducationPrivate Limited.
Weiler, E.(n.d.).Critical thinking skills: Drawingsolutions and activities to develop creative andcritical thinking skills. Remedia Publications.
Weinstein,N.D. and Lachendro, D. (1982).Egocentrism as a source of unrealistic optimism.Personality and Social Psychology Bulletin, 8(2),
195-200.Retrieved from http://psp.sage pub.com/content/8/2/195.short.
with regard to gender early adolescents showsignificant difference at 1% level of significance.The male students exhibit more egocentriccharacteristics than their counterparts.
From the table 2, it is found that there isno significant difference in egocentrism withregard to familial variables.
Table 3, reveals that there is no significantdifference in egocentrism with regard to type ofschool, nature of school and locality of school.The early adolescents studying in governmentschools show more egocentric characteristicsthan their counter parts.
Based on the above result, it is evident thatthere is significant difference in egocentrism withregard to gender and nature of school. EvolutionaryPsychology has addressed gender differences inmany social behaviours and also many studies foundsignificant results especially in gender. From this, itis understood that there is gender difference incognition aspects. Egocentrism leads them to behighly critical of authority figures, unwilling to acceptcriticism and quick to fault others (Feldman, 2011).
Burka and Glenwick (1978) also say thathigh egocentrism associated with shy, anxiousbehaviour for girls and acting-out and learningdifficulties for boys. From this study, it is foundthat boys exposed more egocentric nature may bebecause of their biological characteristics. In thisstudy compared to girls, they feel that they are veryunique, expose heroistic characteristics and oftenwish to become leader of their peers.
In the case of government school students dueto the lack of social cognitive skills, they exhibitegocentric characteristics. Research says thatstudents studying in unisex and co-education schoolsshow significant differences in their social values andpersonal variables, academic behaviours andachievement, attachment with parents and teachers,and perception about the climate (Levinson,Cookson and Sadovnik, 2002).
Recommendations
Through various life skill developmental
programmes, the early adolescents can be trained to
think before acting, to consider the impact of this
egocentric behaviour on maintaining relationships. The
heightened egocentric behaviour shrinks the social
characteristics of an early adolescent. Social
interaction has to be encouraged in classroom
EDUREACH Volume 01 Issue 01 July - December 20163
WRITING DEFICIENCIES OF TEACHER TRAINEES: AN ANALYSIS BY SIX
SIGMA – DMAIC APPROACH
*Dr. Hariharan ** Dr.K. Mohana Sundaram
Abstract
The manufacturing units are systematically employing the six sigma method for the
comprehensive and operative quality sustenance. The utility value of six sigma DMAIC strategy
in teacher education has been rarely comprehended and the same method can revamp the
teacher education system to suit the present day opportunities and challenges (Hariharan, 2013).
This experimental study comprises of two groups namely –control and experimental groups
with 30 student teachers in each group and the Learning Deficiency Scale (LDS) was used to
analyse the writing deficiencies. The findings reveal the relevancy of six sigma-DMAIC methods
and influence of the deficiencies are less in experimental group taught by ICT enabled approach.
Six sigma calculations reveal that the student teacher’s writing strategies are deficient in both
the groups but its level is less in the experimental group.
Keywords : Six sigma, DMAIC approach, Learning
deficiency and FMEA.
Introduction
Lack of quality learning process is the
predominant factor in the classrooms whichdeliberately slow down the quality skill acquisitionof the student teachers. The academic life with poor
readability, poor writing ability, lack of self –assessment, lack of note- taking attitude mayobstruct the academic growth of the prospective
teachers. In this standpoint, the six sigma is a provenquality principle which can be adopted to find theinfluence of the negative factors of writability of
student teachers as the six sigma is widely used inthe manufacturing sectors like Motorola whichpioneered the six sigma quality strategy.
Six Sigma – Dmaic
The six sigma DMAIC analysis was establishedby Bill Smith in Motorola in 1986 to foster the
industrial quality in all the ways. Now it has beenwidely used in all the industrial units. However, it isnot much used in the academic setting (Hari Haran
et al., 2015) Hence, the research on quality ofacademic service based on the six sigma strategy isvery meagre.
Six sigma, defined O’Neill and Duvall (2005),
is a disciplined quality improvement methodologythat focuses on moving every process that touches
* Asst. Professor, Indra Gandhi National Tribal University, Amarkantak, MadhyaPradhesh.
** Former Principal, Govt. Arts College, Kumbakonam, Tamilnadu.
the customers - every product and service - towardsnear perfect quality.
The document on quality assurance in highereducation of the NAAC (2007) has stated, “the six
sigma as philosophy is concerned with customersfocus and creative process improvements. Six sigmaphilosophies believe that there is a strong correlation
between the level of defects, costs and customer(student trainees) satisfaction. If this is spread acrossthe organization as an inherent philosophy, people
work in teams with ultimate goal of reducing thedefects and aspire to reach the perfection”.According to the NAAC document, the six sigma
method can be effectively used to improve the qualityof academic learning.
The prime focus of this study is to analysequality of student teachers’ performance in theclassroom via use of the DMAIC method of the six
sigma methodology in the academic process whichis underpinning the determination of advantages ofthe DMAIC method in teacher education and
training (Hari Haran et.al, 2015).
The novel contribution of this paper is such
advantages of use of the six sigma-DMAIC methodof the six sigma methodology in teacher educationfor analysing their writing for attaining the
achievement.
EDUREACH Volume 01 Issue 01 July - December 20164

The psychological concepts are taught through
the ICT enabled classrooms by which the learning
defects can be minimised.
Table – 1 : Six sigma - DMAIC method in theclassroom learning system
Since the reading skills are the essential for
the student teachers, it is need of the hour to evaluate
their writing the psychological concepts. Further the
FMEA analysis shows that the Lack of dynamic ability
in moulding the students, Poor administrative
academic practices (294) and in Lack of skill training
of the students (210) are the most negative dominant
factors which may negatively influence the student
teachers. Hence it is obligatory to take on the current
study entitled”Writing Deficiencies of Teacher
Trainees – An Analysis by Six Sigma-DMAIC
Approach”. Since the learning deficiency will be
wholly seen as academic failure of teacher education
D Define the writing as prime objective of academic outcomeM Measure writing deficiencies while learning psychology by student
teachersA Analyse their writing the psychological principles by statistical
processI Improve learning based on the data analysis in the analyse phaseC Control plans that institutionalize the improvements for the future
to ensure that student learning stay at a desired level.
Need for the study – Failure Mode Effect Analysis(FMEA) on writing
Failure mode and effect analysis, or FMEA,
is an attempt to delineate all possible failures, their
effect on the system, the likelihood of occurrence,
and the probability that the failure will go undetected
(Pyzdek, 2010). This technique is a primal attempt
to bring out the rational outputs of writing factors
encountered by teacher trainees (Hariharan and
Mohana sundaram, 2013).
EDUREACH Volume 01 Issue 01 July - December 20165
that may create irresistible effect on the positive
development of the school children of their
respective schools and hence the present study was
conducted to analyse the learning deficiencies of
the secondary teacher trainees in terms of the reader
(HariHaran&Zaseerinska, 2015).
Study Design
The design of the present empirical study
comprises the research question and purpose,
variables, samples and methodology of the present
empirical study.
The guiding question of the present empirical
study is: Does the teaching strategy and six sigma –
[(R=SI×O×D) S.I–Severity Index; O–opportunity; D–Detection possibility; R-Risk priority number]
Table- 2: The FMEA on writing of the student teachers
Mode of Effect of S.I Causes of failure O Controls D R Recommended
failure failure action
Lack of Lack of Lack of dynamic Periodical Re sourceful T raining
readability learning ability in inspection of process
attainments 6 moulding the 5 authorities 6 180
students to write
Hampering Lack of parental Periodical Creating
The fullest care in writing visit of 4 144 infrastructural
potential in 6
authorities facilities to meet
remarkable writing skills
learning
outcome
Poor adminis trative Effective Implementation of
and academic monitoring by suitable strategies to
practices towards 7 teacher 7 294 Improve the
textual writing. educators and writability
authorities
Lack of skill Constant 210 Providing
training of the 5
Motivation by 7 motivational
students in the feedback programs–
textual writing counselling
Reluctance for Effective 112 Providing
continuous 4
monitoring 4 motivational
evaluation on programs–
writing skills counselling
Responsibility Authorities of nodal agencies, managements, fads of the institutions, Faculty and students
The table 3 reveals that the sigma mean valueof control group and experimental group are similarand hence the hypothesis above stated is accepted.
Since the pre-test attainments is similar in eachgroup, the post test is conducted so as to find theeffectiveness of ICT based learning as well as thereduction of the DPMO (Defects per Millionopportunities) and increase of sigma value in two groups.
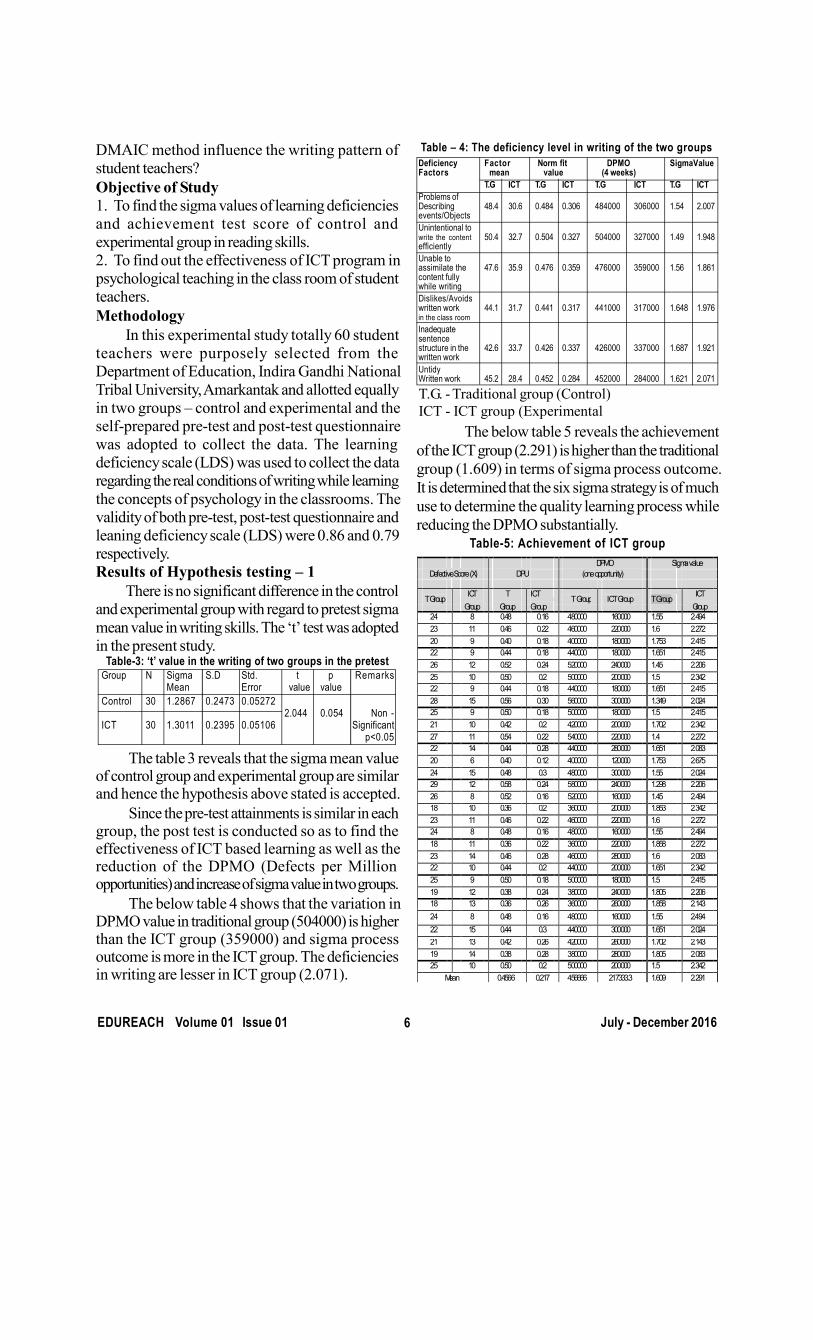
The below table 4 shows that the variation inDPMO value in traditional group (504000) is higherthan the ICT group (359000) and sigma processoutcome is more in the ICT group. The deficienciesin writing are lesser in ICT group (2.071).
EDUREACH Volume 01 Issue 01 July - December 20166
DMAIC method influence the writing pattern of
student teachers?
Objective of Study
1. To find the sigma values of learning deficiencies
and achievement test score of control and
experimental group in reading skills.
2. To find out the effectiveness of ICT program in
psychological teaching in the class room of student
teachers.
Methodology
In this experimental study totally 60 student
teachers were purposely selected from the
Department of Education, Indira Gandhi National
Tribal University, Amarkantak and allotted equally
in two groups – control and experimental and the
self-prepared pre-test and post-test questionnaire
was adopted to collect the data. The learning
deficiency scale (LDS) was used to collect the data
regarding the real conditions of writing while learning
the concepts of psychology in the classrooms. The
validity of both pre-test, post-test questionnaire and
leaning deficiency scale (LDS) were 0.86 and 0.79
respectively.
Results of Hypothesis testing – 1
There is no significant difference in the control
and experimental group with regard to pretest sigma
mean value in writing skills. The ‘t’ test was adopted
in the present study.
Table – 4: The deficiency level in writing of the two groupsDeficiency Factor Norm fit DPMO SigmaValueFactors mean value (4 weeks)
T.G ICT T.G ICT T.G ICT T.G ICTProblems ofDescribing 48.4 30.6 0.484 0.306 484000 306000 1.54 2.007events/ObjectsUnintentional towrite the content 50.4 32.7 0.504 0.327 504000 327000 1.49 1.948efficientlyUnable toassimilate the 47.6 35.9 0.476 0.359 476000 359000 1.56 1.861content fullywhile writingDislikes/Avoidswritten work 44.1 31.7 0.441 0.317 441000 317000 1.648 1.976in the class roomInadequatesentencestructure in the 42.6 33.7 0.426 0.337 426000 337000 1.687 1.921written workUntidyWritten work 45.2 28.4 0.452 0.284 452000 284000 1.621 2.071
Table-3: ‘t’ value in the writing of two groups in the pretestGroup N Sigma S.D Std. t p Remarks
Mean Error value valueControl 30 1.2867 0.2473 0.05272
2.044 0.054 Non -ICT 30 1.3011 0.2395 0.05106 Significant
p<0.05
The below table 5 reveals the achievement
of the ICT group (2.291) is higher than the traditional
group (1.609) in terms of sigma process outcome.
It is determined that the six sigma strategy is of much
use to determine the quality learning process while
reducing the DPMO substantially.Table-5: Achievement of ICT group
T.G. - Traditional group (Control)
ICT - ICT group (Experimental
DPMO Sigma value
Defective Score (X)
DPU
(one opportunity)
T Group ICT T ICT T Group ICT Group T Group ICT
Group
Group Group
Group
24 8 0.48 0.16 480000 160000 1.55 2.494
23 11 0.46 0.22 460000 220000 1.6 2.272
20 9 0.40 0.18 400000 180000 1.753 2.415
22 9 0.44 0.18 440000 180000 1.651 2.415
26 12 0.52 0.24 520000 240000 1.45 2.206
25 10 0.50 0.2 500000 200000 1.5 2.342
22 9 0.44 0.18 440000 180000 1.651 2.415
28 15 0.56 0.30 560000 300000 1.349 2.024
25 9 0.50 0.18 500000 180000 1.5 2.415
21 10 0.42 0.2 420000 200000 1.702 2.342
27 11 0.54 0.22 540000 220000 1.4 2.272
22 14 0.44 0.28 440000 280000 1.651 2.083
20 6 0.40 0.12 400000 120000 1.753 2.675
24 15 0.48 0.3 480000 300000 1.55 2.024
29 12 0.58 0.24 580000 240000 1.298 2.206
26 8 0.52 0.16 520000 160000 1.45 2.494
18 10 0.36 0.2 360000 200000 1.853 2.342
23 11 0.46 0.22 460000 220000 1.6 2.272
24 8 0.48 0.16 480000 160000 1.55 2.494
18 11 0.36 0.22 360000 220000 1.858 2.272
23 14 0.46 0.28 460000 280000 1.6 2.083
22 10 0.44 0.2 440000 200000 1.651 2.342
25 9 0.50 0.18 500000 180000 1.5 2.415
19 12 0.38 0.24 380000 240000 1.805 2.206
18 13 0.36 0.26 360000 260000 1.858 2.143
24 8 0.48 0.16 480000 160000 1.55 2.494
22 15 0.44 0.3 440000 300000 1.651 2.024
21 13 0.42 0.26 420000 260000 1.702 2.143
19 14 0.38 0.28 380000 280000 1.805 2.083
25 10 0.50 0.2 500000 200000 1.5 2.342
Mean 0.4566 0.217 456666 217333.3 1.609 2.291

The DPMO (Defects Per MillionOpportunities) noted in the table 7 of two groupsare optimum, its level is less 217333.3 in the ICTgroup than the control group (456666) as the ICTmode of teaching of psychological conceptsenhanced the learning. Further the hypothesis abovestated is rejected as there is significant differencebetween the control and experimental group existwith regard to the process sigma mean. (Control -1.612; ICT - 2.292).Discussion
The results of Kuldeep Nagi and SrisakdiCharmonman (2010) who reported that Six Sigmamethods can help in analysing the reasons for thelack of activity during the course of studies and itgives a clear identification of instructional problemscollected through data. This case study reveals thatSix Sigma based DMAIC technique can improvethe quality learning process of the secondary teachertrainees. It is in concurrence with the findings ofChlaidzeand I. Linde (2006) who reported that theSix Sigma pertains to improving the quality of mattertaught, the character generated of the students, andthe quality of study and student’s life.
Due to the lack of writing, reading, note takingand writing strategies, the achievement tests mayhave reduced score. It is concurrence with thefindings of Mirko Savic (2006) who indicated thata control chart can reduce the common causevariation which is usually a student’s responsibility,for instance, poor preparation for exams,
concentration, tiredness, etc. Further, they havestated that, a control chart can reduce our chancesof making possible errors.Conclusion
Thus the six sigma – DMAIC approach hasits relevancy in terms of enhancing the teachereducation systems as the discussions of the previousliteratures determine the same.ReferencesChlaidze,V., & I, Linde. (2006). six sigma methodapplication to the perfection of teachingeffect.Computer modelling and new technologies,vol.10, no.2, 7-14, Transport and tele communication institute, Riga, Latvia, lomonosov, 1, lv-1019.Hariharan, R.&Mohanasundaram, K. (2013 a).Impact of Six Sigma–DMAIC Approach in Learningthe ICT Concept by the Prospective Teachers.Paper presented and published in the Book ofabstracts of the Association for TeacherEducation in Europe Spring Conference 2013:Teacher of the 21st Century: Internationalconference Quality Education for QualityTeaching, p. 31, Riga, Latvia, Europe. May 10-11, 2013.Hariharan,R., Zascerinska, J., &Swamydhas.P.(2013). A Comparative Study of Methodologies ofTeaching Web Technologies to Prospective Teachersin India and Latvia. International Journal ofModern Education Forum (IJMEF).Volume 2Issue 4, November 2013.p.84-91. U.S.A. Scienceand Engineering Publishing Company (SEP).Hariharan, R., Zascerinska, J., (2015).Sixsigma–A new trend in Educational Research.Germany, Globe edit - Omni Scriptum GMBH,ISBN:978-3-639-82460-5.Kuldeep, Nagi., & Srisakdi Charmonman,(2010).Applying Six Sigma Techniques to Improvingthe Quality of e-Learning Courseware Components-a Case Study. Management of innovation andtechnology (ICMIT), 2010.IEEE Internationalconference, (275-280).MirkoSavic.(2006). P-Charts in the QualityControl of the Grading Process in the HighEducation. Panoeconomicus, 2006, 3, str. 335-347 UDC 378.4:371.26.O’Neill, M. & Duvall, C. (2005).A Six Sigmaquality approach to workplace evaluation, Journalof facilities management, 3, pp.240–253.Pyzdek, T. (2001).The Six Sigma Handbook – AComplete Guide for Greenbelts, Blackbelts andManagers at All Levels. New York, McGraw-Hill.
EDUREACH Volume 01 Issue 01 July - December 20167
Group N Sigma S.D Std. ‘t’ P RemarksMean Error value value
Control 30 1.612 0.1517 0.282 Significant16.328* 0.000 p<0.05
ICT 30 2.292 0.0305 0.023
The table 6 indicates that the means of twogroups have the perfect significant difference as thevalue of two tail significance is less than 0.05 (p<.05) and hence the hypothesis which has been statedas There is no significant difference between thesigma means of control and experimental group thebased on the reading has been rejected.The results of the hypothesis - 3Table - 7 : ‘t’ value in the achievement of two groups
Group N Sigma S.D Std. ‘t’ p RemarksMean Error value value
Control 10 1.4373 0.12011 0.028178ICT 10 1.7810 0.07252 0.019889
The results of the hypothesis - 2Table – 6 :‘t’ value in the wringing deficiencies level oftwo groups.
7.427*Significantp<0.050.000

RELATIONSHIP BETWEEN SOFTSKILLS AND TEACHING COMPETENCY
OF SECONDARY TEACHER EDUCATION STUDENTS
*Dr. R. Sasipriya **Dr.P.Annaraja
UNESCO (2001) aims to provide global leadership on teachers, their status, their
professional training, their management and administration and key policy issues. Hence teacher
education has to create a new paradigm based upon the five pillars of education - Learning to
know, Learning to do, Learning to live together, Learning to be and Learning to transform
oneself and society. National Curriculum Framework (2005) looks at the teacher as an active
agent to aid the child in knowledge construction by acting on his/her social and physical
environment. The teachers help the students to acquire not only the right knowledge but also
values, attitudes, habits and skills that are necessary to cope up with the world of tomorrow
with cutting edge knowledge. Teaching-learning, being a process of interaction and interpretation
becomes meaningful and successful only in the presence and application of soft skills and teaching
competency in the classroom. Hence, a continuous, practice in soft skills and teaching competency
during teacher training is essential. The investigator adopted the survey method to study the
relationship between the performance in soft skills and teaching competency of secondary
teacher education students. The sample consists of 1287 secondary teacher education students.
Among them 314 are male students and 973 are female students. The investigators developed
two tools for collecting data namely Soft skill inventory and Teaching competency scale (2009).
Significant relationship between the performance in soft skills of secondary teacher education
students and their teaching competency is found significant.
Abstract
Keywords : Soft skills, Teaching competency and
Teacher education.
Introduction
Education develops desirable habits, skills and
attitudes which make an individual a good citizen. It
empowers the individual with necessary skills and
competence for achieving important personal and
social goals and there by contributing to the social
development. Education is the most powerful
instrument in the hands of teachers whose effective
use requires the strength of will, dedicated work and
sacrifice.
The purpose of education is to produce
teachers who have professional competencies. The
role of teacher is no longer confined to teaching
alone. They need to be thorough professional, fully
acquired with high academic standard, pedagogic
and professional skill. To achieve one’s goal, he /
she has to acquire, update professional skills to lead
a happy life in the present democratic society that
* Assistant Professor of Physical Science, V.O.C. College of Education, Thoothukudi.
**Former Research Director & Associate Professor of Mathematics, St.Xavier’s College of Education, Tirunelveli.
encounters a number of challenges in economic,
social, political and technological fields. These skills
are known as soft skills. Every teacher has to keep
these soft skills in his /her mind while creating
optimum and challenging learning atmosphere in the
classroom situation.
Significance of the Study
The progress of a country depends upon the
quality of its teachers as they build the pillars of the
nation. Teachers occupy a pivotal role in any nation.
They are of high esteem and honour in the society.
Their position and role in the society is unique.
Teacher is one who imbibes, interprets and
disseminates the culture .They are the makers of the
future citizens of the society. They are philosophers,
guides and men of higher ideas in moulding the
society. The teacher is one who sets up the standards,
builds desirable attitudes, behaviours and characters
among the students.
EDUREACH Volume 01 Issue 01 July - December 20168

Teaching is the noblest profession among all
professions. It is a career that shapes the minds of
tomorrow. It provides the students with the skills
for survival. Teaching is a complex set of task which
demands the ability to understand, to communicate,
to inspire and to motivate the students, to create
patience, values, intelligence, enthusiasm,
friendliness, personality, sense of humour and
empathy. The concept of teaching has changed from
the teacher-centered to learner-centered. They have
become a facilitator than the instructor and the source
of all knowledge.
In this present situation the teachers require a
new type of knowledge, attitude, atmosphere and
facility to make his/her task easy, fruitful and
confirming according to the demands of the society
and the students. So the teachers must be properly
equipped with necessary knowledge, skills and
abilities to deal with children. The educational
institutions have to play significant roles and to make
possible the dreams of younger generation. Future
teachers have to play bigger and crucial roles to
incorporate, sustain and transmit competency-based
and skill-based education.
The teacher helps the students to acquire not
only the right knowledge but also values, attitudes,
habits and skills that are necessary to cope up with
the world of tomorrow. Teaching-learning, being a
process of interaction and interpretation becomes
meaningful and successful only in the presence and
application of soft skills and teaching competency
in the classroom. It is a high time for teachers to
acquire knowledge about the factors and areas that
lead and improve teaching competency. Likewise,
they should understand their own soft skills that help
them to understand students in a better manner.
Mitchell et.al (2010) found that soft skills are
important components of the educational curriculum.
So, through this study, the investigator tries to find
out the relationship between teaching competency
and soft skills namely oral communication skill,
written communication skill, computer skill, stress
management skill, organising skill, time management
skill, leadership skill, inter personal skill and team
building skill of secondary teacher education
students.
Objectives
To find out the relationship between teaching
competency and the performance in oral
communication skill, written communication skill,
computer skill, stress management skill, organising
skill, time management skill, leadership skill,
interpersonal skill, and team building skill of
secondary teacher education students.
Null Hypotheses
1. There is no significant difference between male
and female secondary teacher education students in
their performance in soft skills.
2. There is no significant difference between male
and female secondary teacher education students in
their teaching competency and its dimensions.
3. There is no significant relationship between
teaching competency and performance in soft skills
of secondary teacher education students.
Methodology
The investigator adopted the survey method
to study the relationship between teaching
competency and the performance in soft skills of
secondary teacher education students.
Population for the Study
The accessible population for the present study
includes all the secondary teacher education students
studying in B.Ed. colleges in Tirunelveli, Tuticorin
and Kanyakumari district affiliated to Tamil Nadu
Teachers Education University, Chennai.
Sample for the Study
The investigator had used stratified random
sampling technique for selecting the sample. The
investigators randomly selected 16 B.Ed. Colleges
from Tirunelveli, Tuticorin and Kanyakumari district
affiliated to Tamil Nadu Teachers Education
University.
From each college Tamil, English Maths,
Physical Science, Bioscience, History Computer
Science, Economics and Commerce optional subject
secondary teacher education students were taken
by including both male and female students.
Stratification was done on the basis of gender,
religion, management of college and type of college.
The sample consists of 1287 secondary teacher
education students. Among them 314 are male
students and 973 are female students.
EDUREACH Volume 01 Issue 01 July - December 20169

Tools Used
1. Soft skill inventory developed by Sasipriya
and Annaraja (2009).
2. Teaching competency scale developed by
Sasipriya and Annaraja (2009).Table -1 : Difference between male and female secondary
teacher education students in their soft SkillsSoft skills Male Female Calculated
(N = 314) (N = 973) ‘t’ value RemarksMean S.D Mean S.D
Oral communi-cation skill 28.04 4.478 26.75 4.861 4.374 SWritten communication skill 27.36 5.060 27.67 4.733 0.963 NSComputer skill 36.51 8.352 35.42 8.385 2.000 SStress manage-skill 32.61 5.152 31.82 5.609 2.314 SOrganising skill 29.37 5.112 29.62 4.857 0.773 NSTime manage-ment skill 28.78 5.154 29.13 5.126 1.039 NSLeadership skill 23.25 4.689 22.41 4.784 2.744 SInterpersonalskill 33.08 4.723 32.73 4.927 1.139 NSTeam buildingskill 26.64 4.776 25.22 4.463 4.654 NS
(At 5% level of significance the table value of ‘t’ is 1.96 )
(At 5% level of significance the table value of ‘t’ is 1.96 )
Table – 2 : Difference between male and female secondaryteacher education students in their teaching competency
Table-3 : Relationship between teaching competency andperformance in soft skills of secondary teacher education students
Soft skills N Table Calculated RemarksValue value of r
Oral communication skill 0.333 SWritten communication skill 0.406 SComputer skill 0.313 SStress management skill 0.424 SOrganising skill 1287 0.062 0.539 STime management skill 0.449 SLeadership skill 0.296 SInterpersonal skill 0.553 STeam buildingskill 0.533 S
(At 5% level of significance the table ‘r’ value is 0.062 )
Findings and Interpretations
Table1 reveals that there is significant difference
between male and female secondary teacher
education students in their performance in oral
communication skill, computer skill, stress
management skill and leadership skill. But there is
no significant difference between male and female
secondary teacher education students in their
performance in written communication skill,
organising skill, time management skill, interpersonal
skill and team building skill. Male students have better
performance in oral communication skill than female
students. This may be due to the fact that male
students have more social exposure which leads them
to interact with their neighbours and community.
They get the chance of mingling with their peer
group, relatives and society. This contact with
society provides them with oral communication skill.
And also they have more chances for self-exploration
through exposure to the world and they involve
themselves more in external activities because of the
favourable cultural settings. This finding supports the
investigation done by Sasipriya and Annaraja (2008).
They found that the boys were better than girls in
their oral communication skill. Male students have
better performance in computer skill than female
students. This may be due to the fact that male
students have more inclination to earn more money
to settle in life and to acquire wealth. Being aware
of the modern blooming reality to mint money in the
field of computer industries, male students show more
interest in excelling in their computer skill.
Male students have better performance in stress
management skill than female students. This may be
due to the fact that male students have more chances
to mingle with the society more freely by going out
of their house and spend time with their friends in
the recreational places like parks and play grounds.
Male have the tendency to forget the negative
happenings and thoughts more easily. They cannot
relate it with the past incidents and they are not
prejudistic. And this may help them to release their
pent up feelings and emotions and are better in stress
management skills. And male students have better
performance in leadership skill than female students.
This may be due to the fact that male students get in
touch with the outer world easily. Boys may get more
Male Female Calcu-Dimensions (N = 314) (N = 973) lated
Mean S.D Mean S.D ‘t’ value RemarksSkill of planningthe lesson 19.39 2.950 18.99 3.36 2.026 SSkill of motivation 20.19 2.969 19.94 2.97 1.328 NSSkill of subject mastery 20.16 2.971 19.96 3.13 1.009 NSSkill of presentation 23.19 3.644 22.95 3.66 1.015 NSSkill of usingaudio-visual 15.86 2.769 16.01 2.72 0.847 NSSkill of usingrelevant 16.31 2.669 16.20 2.53 0.610 NSSkill of class room 36.28 5.569 36.28 5.66 1.593 NSSkill of closure of the 16.03 2.565 16.30 2.55 0.821 NSSkill of evaluation 19.92 3.039 20.09 3.10 0.553 NSSkill of guidance 37.76 5.217 37.95 5.34 2.026 STeaching competency 19.39 2.950 18.99 3.36 1.328 NS
EDUREACH Volume 01 Issue 01 July - December 201610
chances to involve group activities such as activities
of the communities and voluntarily organisation and
sports groups. This exposure may help them to
improve their innate leadership qualities. This finding
supports the study conducted by Sasipriya and
Annaraja (2008), which revealed that the boys were
better than girls in their leadership skill.
Table 2 reveals that there is significant difference
between male and female secondary teacher
education students in their skill of planning the lesson
and skill of guidance. But there is no significant
difference between male and female secondary
teacher education students in their skill of motivation,
skill of subject mastery, skill of presentation, skill of
using audio-visual aids, skill of using relevant
examples, skill of class room management, skill of
closure of the lesson, skill of evaluation and teaching
competency. Male students have better skill of
planning the lesson than female students.This may
be due to the fact that male students get more
exposure due to their social responsibilities. They
are in the field of administration in the society and in
house.Female students have better skill of guidance
than male students.This maybe due to the fact that
they had acquired the knowledge about the past,
present and future. Their memory power and
retention power is so high. They retain those things
in their mind and provide guidance to the students.
Table 3 reveals that there is significant relation
between teaching competency and performance in
oral communication skill, written communication skill,
computer skill, stress management skill, organising
skill, time management skill, leadership skill,
interpersonal skill and team building skill of secondary
teacher education students. This may be due to the
fact that teaching competency is not a single skill to
be acquired and nurtured. It is an embodiment of
many skills. It needs a systematic practice. It is the
knowledge to use the right thing at the right time and
in a right place. If one acquires and practises soft
skills one can excel in teaching competency.
RECOMMENDATIONS
1. Soft skills training should be given to the students
in colleges of education.
2. Teaching strategies should be developed by
using different dimension of soft skills.
3. Colleges of education should organize
workshops and seminars on personality
development programmes in order to enhance
the level of soft skills.
4. Workshop on time management and stress
management can be conducted.
5. Provisions for team work should be given.
6. Various kinds of soft skills can be developed
through continuous training for prospective
teachers.
7. Female secondary teacher education students
should be given more social exposure through
academic activities in their course.
8. Students teaching practice should be more
effectively organised and supervised to promote
student’s development of relevant teaching
skills.
9. Information and communication technology
must be incorporated in teaching learning
process.
References
Bharathi, T. et. al. (2007). Personality develop -
ment and communicative English. New Delhi:
Neelkamal publications Pvt. Ltd.
Dash, B.N. (2004).The teacher and professional
growth.Vol. 1.Delhi : Dominant Publishers and
Distributors.
Glaxton, G. (1993).Developing Teachers.
Buckingham : Oxford University Press.
Jenifar, Flora, (2011). Teacher Education:
Quality Indicators.New Delhi : APH Publishing
House Corporation.
Saravanan, P. (2010).A study of locus of control
and soft skills among higher secondary students.
Unpublished M.Ed. dissertation.M.S University,
Tirunelveli.
Sasipriya, R. and Annaraja, P. (2008).
Relationship between performance in soft skills
andacademic achievement of higher secondary
students. Unpublished M.Phil.dissertation, M.S
University, Tirunelveli.
http://www.tpack.org/tpck/index. php ? title =
Pedagogical_Content_Knowledge_% 28 PCK
% 29.
http://prime % 20skills % 20 project % 20 compre-
hensive % 20report.pdf
www.ncert.nic/in/rightside/lines/pdf/framework/
english/nf2005.pdf.
hrmars.com/sofskills-important _ in _ the _ worplace
_ apreli....
EDUREACH Volume 01 Issue 01 July - December 201611
ACADEMIC HELP-SEEKING BEHAVIOUR OF PROSPECTIVE TEACHERS OF
COLLEGES OF EDUCATION IN TIRUCHIRAPPALLI DISTRICT
*Mr. A. Alexander **Dr. I. Muthuchamy
Help-Seeking is a life skill that needs to be developed by young people, so that they can
get appropriate practical and emotional support from other people. Much of the research on
help seeking has focused on mental health but it is also clearly relevant for physical health
outcomes too. Help-seeking can be informal, involving drawing on family and friends, or it can
be formal, involving professional services including teachers, teacher trainees and health
practitioners. The present study assessed Academic Help Seeking Behaviour of Prospective
Teachers of Colleges of Education in Tiruchirappalli District”. This study found that male and
female and rural and urban prospective teachers do not differ significantly in respect of their
academic help seeking behaviour.
Keywords : Academic help seeking behaviour,
Positive behaviour and Social supports.
Introduction
Seeking help was conceptualised as one
part of the positive behaviour process of every
individual. However, even though it comprises part
of the illness behaviour process, help-seeking is also
conceptualised as a dynamic process itself. One of
the earliest definitions of help-seeking was provided
by David Mechanic, who saw it as an adaptive form
of coping. Later, help-seeking was defined as the
behaviour of actively seeking help from other people.
It was deemed to be about communicating with
others to obtain assistance in terms of understanding,
advice, information, treatment, and general support
in response to a problem or distressing experience.
As such, it was a form of active and problem-
focused coping, which relied on external assistance
from others.Help can be sought from a wide range
of external sources, including people who occupy
different roles and who vary in terms of their
relationship with the person seeking help. Two main
types of help-seeking have been delineated i.e.
formal and informal help seeking.
Formal help-seeking is assistance from
professionals who have a legitimate and recognized
professional role in providing relevant advice,
support and/or treatment. Formal help-seeking is
* Research Scholar, Department of Educational Technology, Bharathidasan University, Trichy.
** Professor, Department of Educational Technology, Bharathidasan University, Trichy.
itself diverse and includes a wide range of
professions. These include health professional for
example medical specialists and health care
providers and also non-health professionals and also
non-health professional such as teachers,
administrators and community workers. The term
‘treatment-seeking’ has recently begun to be used
to delineate seeking help from specific health
treatment providers and seeking help from generic
support and community services. Informal help-
seeking is assistance from informal social networks,
such as friends, family and the society. It comprises
sources of help that have a personal, and not a
professional, relationship with the help-seeker.
Most recently, self-help has emerged as an area
of attention. This has occurred because of the rapidly
growing opportunities to use computer mediated
communication technologies to support mental
health. Help-seeking can now include assistance
from sources that do not comprise communication
with an actual person. Sophisticated and dynamic
help-seeking options are increasingly available
through online and computer-mediated processes.
Such options make an interpersonal component less
critical in the help-seeking process.
Concept of help Seeking Behaviour
“Help-Seeking Behaviour (HSB) is an appropriate
way to seek a solution for a health problem and
EDUREACH Volume 01 Issue 01 July - December 201612
Abstract
requires suitable interaction with a medically trained
professional. HSB has three main components: a
health issue (physical or psychological), a person
who needs help to address the health issue, and a
source of help.”
Before proceeding, it is important to define the
terms that frame this document, particularly “help-
seeking behaviour” and “social supports.” There are
few specific, agreed upon definitions of “help-seeking
behaviour” in the health and development literature.
Furthermore, when referenced, help- seeking
generally refers to the use of “formal” supports,
which is defined as health facilities, youth centres,
formal social institutions or professional care
providers, either in the public or private sector. In
many cases, “help-seeking” is used interchangeably
with “health-seeking,” which generally refers more
narrowly to seeking services or remedies for a
specific ailment or illness. In many of the documents
cited in the bibliography, “help-seeking” refers to
the use of health and other services in the case of
severe or serious mental health issues, including
substance use, depression and suicide. In only a few
cases in the literature is the term “help-seeking” used
in a more comprehensive way to refer to the use of
both formal supports and informal supports, which
includes men, women, children, youth, elders in the
family and society, academic and/or religious leaders.
Need and Significance of the Study
One of the greatest challenges of effective
functioning of teacher may be due to altruistic and
help seeking behaviour. Behaviour is the reluctance
of Prospective Teachers to Seek academic, Social,
Professional and mental health related context. The
study of Help Seeking of prospective teachers of
colleges of education, is essential because most of
them, do not access academic / professional, social
services for the mankind and the reason for their
problems and way to intervene need to be investi-
gated.
Consequently Academic Help Seeking has
received a greater consideration for research. The
problem and their roles better, quicker and faster
and in need of both quantitative and qualitative
growth, policy and practice, however, progress in
the field has been hindered by a lack of the high
prevalence of mental health problems is not matched
by a commensurate level of service use and
associated Help Seeking Behaviour. Instead, there
is a marked match between prevalence of mental
disorder and professional Help Seeking. At all ages,
there is a much higher prevalence than there is
greatest service to use, through the mismatch in
greatest where the need is highest.
Consequently, a focus on understanding and
encouraging Help Seeking behaviour particularly
teacher aspirants, also emerged out and to become
progressive. Help Seeking may be characterized as
effective or ineffective, effective help seeking takes
place when a learner knows when he needs help,
what kind of help the student needs, whom to ask
for help, and how to ask for the help that he needs.
Effective help seeking may avert possible failure,
maintain engagement and lead to long item monetary
and autonomous learning.
Effective help seeking in variety as an important
strategy contributes to self-regulation and vice versa
(New man, 2002, Puustinem, 1998) enabling true
student to continuing learning. Self-regulated
students control frequency with which they ask for
help, rating only at appropriate times and avoiding
dependence (Puustimen,1998) Both the overview
of help and true avoidance of help when it is needed
may lead to less effective learning. Hence, it is
warranted to carry out a study on “Academic Help
Seeking Behaviour of prospective Teachers of
Colleges of Education in Tiruchirappalli District”.
Objectives
1. To find out the level of academic help seeking
behaviour of prospective teachers.
2. To find out whether there is any significant
difference in the academic help-seeking behaviour
of prospective teachers with respect to gender,
locality and educational qualification.
Hypotheses of the study
Based on the above objectives, the null
hypotheses have been framed.
Methodology in Brief
The investigator followed the survey method
for the study. Prospective teachers’ help seeking
behaviour scale was developed and administered
to B.Ed. trainees of Colleges of Education in
Tiruchirappalli District.
EDUREACH Volume 01 Issue 01 July - December 201613
Sample
The population for the study consisted of
prospective teachers of colleges of education in
Tiruchirapalli District. The investigators selected 200
trainees from the selected colleges of education,
affiliated to Tamilnadu Teachers Education University
by using simple random sampling techniques.
Statistical Techniques
The data were tabulated and statistically ana-
lysed by adopting mean, standard deviation and t-test.
Data Analysis
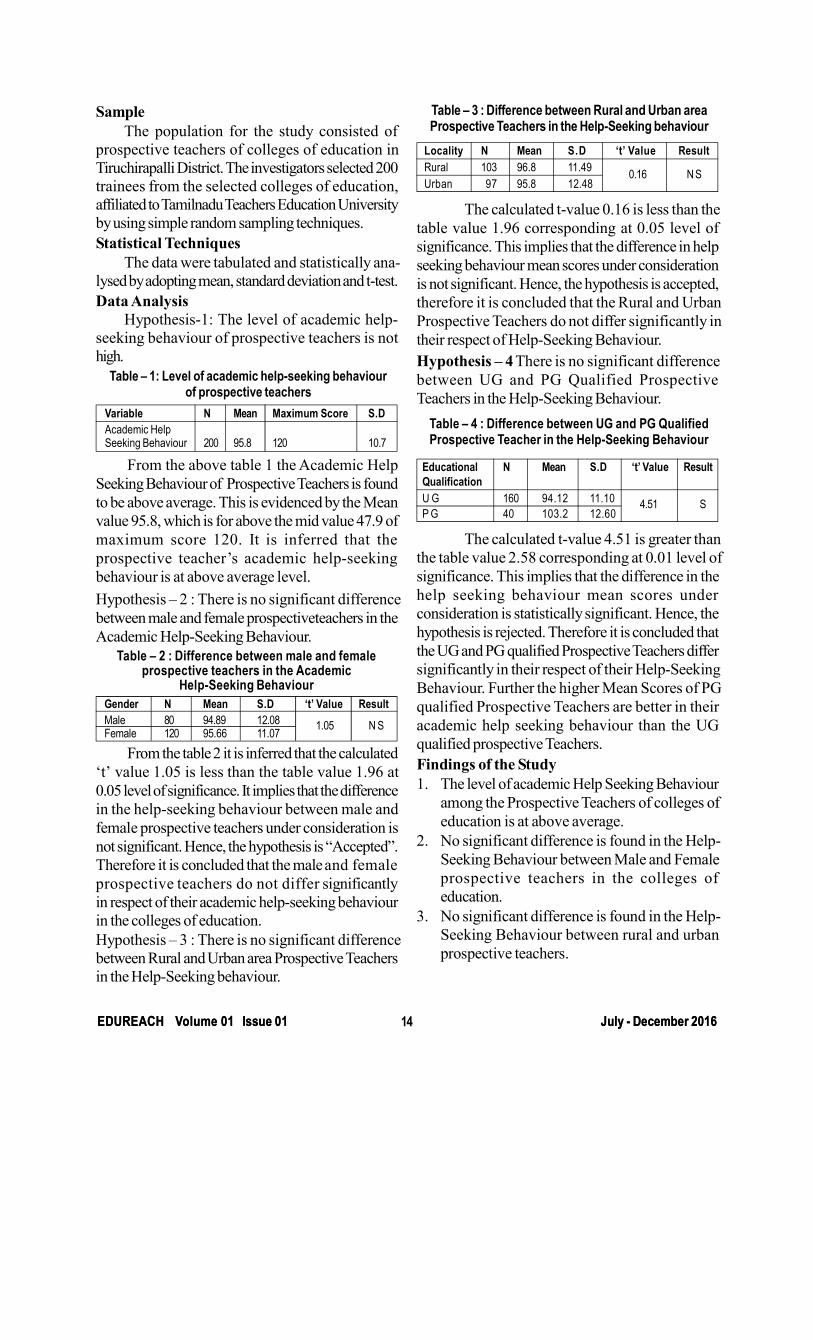
Hypothesis-1: The level of academic help-
seeking behaviour of prospective teachers is not
high.
From the above table 1 the Academic Help
Seeking Behaviour of Prospective Teachers is found
to be above average. This is evidenced by the Mean
value 95.8, which is for above the mid value 47.9 of
maximum score 120. It is inferred that the
prospective teacher’s academic help-seeking
behaviour is at above average level.
Hypothesis – 2 : There is no significant difference
between male and female prospectiveteachers in the
Academic Help-Seeking Behaviour.
Table – 1: Level of academic help-seeking behaviourof prospective teachers
Variable N Mean Maximum Score S.DAcademic HelpSeeking Behaviour 200 95.8 120 10.7
Table – 2 : Difference between male and femaleprospective teachers in the Academic
Help-Seeking BehaviourGender N Mean S.D ‘t’ Value ResultMale 80 94.89 12.08Female 120 95.66 11.07 N S1.05
Table – 3 : Difference between Rural and Urban areaProspective Teachers in the Help-Seeking behaviour
The calculated t-value 0.16 is less than the
table value 1.96 corresponding at 0.05 level of
significance. This implies that the difference in help
seeking behaviour mean scores under consideration
is not significant. Hence, the hypothesis is accepted,
therefore it is concluded that the Rural and Urban
Prospective Teachers do not differ significantly in
their respect of Help-Seeking Behaviour.
Hypothesis – 4 There is no significant difference
between UG and PG Qualified Prospective
Teachers in the Help-Seeking Behaviour.
Table – 4 : Difference between UG and PG QualifiedProspective Teacher in the Help-Seeking Behaviour
Educational N Mean S.D ‘t’ Value ResultQualificationU G 160 94.12 11.10P G 40 103.2 12.60
The calculated t-value 4.51 is greater than
the table value 2.58 corresponding at 0.01 level of
significance. This implies that the difference in the
help seeking behaviour mean scores under
consideration is statistically significant. Hence, the
hypothesis is rejected. Therefore it is concluded that
the UG and PG qualified Prospective Teachers differ
significantly in their respect of their Help-Seeking
Behaviour. Further the higher Mean Scores of PG
qualified Prospective Teachers are better in their
academic help seeking behaviour than the UG
qualified prospective Teachers.
Findings of the Study
1. The level of academic Help Seeking Behaviour
among the Prospective Teachers of colleges of
education is at above average.
2. No significant difference is found in the Help-
Seeking Behaviour between Male and Female
prospective teachers in the colleges of
education.
3. No significant difference is found in the Help-
Seeking Behaviour between rural and urban
prospective teachers.
From the table 2 it is inferred that the calculated
‘t’ value 1.05 is less than the table value 1.96 at
0.05 level of significance. It implies that the difference
in the help-seeking behaviour between male and
female prospective teachers under consideration is
not significant. Hence, the hypothesis is “Accepted”.
Therefore it is concluded that the male and female
prospective teachers do not differ significantly
in respect of their academic help-seeking behaviour
in the colleges of education.
Hypothesis – 3 : There is no significant difference
between Rural and Urban area Prospective Teachers
in the Help-Seeking behaviour.
Locality N Mean S.D ‘t’ Value ResultRural 103 96.8 11.49Urban 97 95.8 12.48
0.16 N S
4.51 S
EDUREACH Volume 01 Issue 01 July - December 201614EDUREACH Volume 01 Issue 01 July - December 2016
4. Significant difference is found in the Help-
Seeking Behaviour between UG and PG
qualification prospective Teachers. Then higher
mean scores of PG qualified prospective
teachers are better than UG qualified
prospective teachers in respect of their academic
help seeking behaviour.
Educational Implications
The findings of the study implied that
1. Prospective teachers irrespective of Men
and Women need continous improvement in
cognitive competencies, i.e. knowing when
help is necessary, knowing that others can help,
knowing how to ask a question that yields
precisely what are needs. The Women and
Unisex Colleges Prospective teachers should
develop social competencies, i.e. knowing who
is the best to approach for help, knowing how
to carry out a request for help in a socially
appropriate way.
2. In order to strengthen the motivational
contextual resources, i.e. classroom factors such
as goals, grading, academic, collaborative
activities and Student-Teachers interaction that
peer relation facilitate them in the knowledge
acquisition and transformation of knowledge and
it is important to meet in students help seeking.
Conclusion
The study has presented an analysis of the
prospective teachers on their Help Seeking
Behaviour. In the light of the research findings, it is
felt that the present research may be contributed to
help-seeking behaviour of perspective teachers. The
study has also revealed that male and female
prospective teachers, rural and urban prospective
teachers do have the adequate results in their level
of help seeking behaviour. This kind of academic
help seeking behaviour of prospective teachers will
help them to enhance their academic, social and
professional life.
References
Aleven, V. (2003). Help seeking and help design
in interactive learning environments 10 Journal of
Documentation, PP,53-54.
Barker, G. (2007). Adolescents, social support and
help - seeking behaviour, Behaviour and
Information Technology, PP 93-99.
Bowker, L. H. (1989). Understanding the help
seeking behaviour of battered women: Acomparison
of traditional service agencies and womens groups.
International Journal of Women’s Studies, PP
99–109.
Braithwaite, V. A. (2003). Social-psychological
factors affecting help-seeking for emotional
problems. Social Science and Medicine, 39,
563-572.
Rickwood, D. (2005). Young people’s help-
seeking for mental health problems. Advances in
Mental Health, Journal Australia, PP- 45-47
Willis, M. (2006). Building effective help
systems: help seeking behaviour. OZCHI, Sydney,
Australia. PP- 433-436.
EDUREACH Volume 01 Issue 01 July - December 201615
ORGANISATIONAL CLIMATE AND PROFESSIONAL COMMITMENT OF
TEACHERS WORKING IN HIGH SCHOOLS
*S.Gomathi Sankari , **Dr. A. Faritha Begam,
The main objective of the study was to find out the relationship between the organizational
climate perceived by the high school teachers and their professional commitment. Survey method was
adopted for the present study. A sample of 300 high school teachers was selected using simple random
sampling technique. Percentage analysis, mean, standard deviation,‘t’-test, ANOVA and Karl Pearson’s
product moment correlation were the statistical techniques used. The percentage analysis revealed
that the perception of organizational climate of high school teachers is neutral and the professional
commitment of high school teachers is average. A significant relationship was however found between
perceived organizational climate and the professional commitment of high school teachers.
Abstract
Keywords : Organisational Climate, Professional
Commitment.
Introduction
Organisational climate is the process of
quantifying the culture of an organization and its
proceeds the notion of organizational culture.
Comparatively, Gilmer (1966) defined climate as the
attributes that set one organization apart from
another and positively influence the behavior of the
workers within that organization. Mowday, Steer,
and Poter (1979) claim that a commitment by an
employee happens over a substantial amount of time.
During this time, the employee comes to identify
themselves with the organization and organizational
goals. Obiously, the impact of organizational
commitment in school settings easily correlates. A
desirable teacher is one who identifies with the
school, adopts school goals as their own, and is
willing to put forth extera effort (Hoy & Tarter,
1989). Mowday, et al., (1979) made the connection
between organizational climate and teacher
commitment and overall effectiveness.
Need for the Study
Every organization aspires to have
individuals who are highly committed. The
educational organizations such as schools, colleges
and universities also require teachers who are
committed to their profession and well-being of the
students. They need committed teachers to achieve
their objectives and cannot succeed without their
efforts and commitment.
Thus, it has been said that the teacher
commitment is at the center of school organizational
reform. The concept of commitment as the
investment of human resources has long been
associated with the professional characteristics of
teachers but today it is widely recognized that
teacher’s commitment to the schools is very
important. The committed teacher considers it
morally right to stay in the school, regardless of how
much status enhancement or satisfaction of the
organization gives him or her over the years. It can
be said that organizational climate is one of the key
phenomena which governs the motivation of the
teacher at their work place and subsequently make
them feel satisfied with work.
Objectives
1. To find out the nature of organizational climate
as perceived by the high school teachers.
2. To find out the level of professional commitment
of high school teachers.
3. To find out the relationship between the
organizational climate perceived by the high
school teachers and their professional
commitment.
* M.Ed Scholar, Bharathidasan University(DDE),** Assistant professor, St.Ignatius College of Education (Autonomous), Palayamkottai.
EDUREACH Volume 01 Issue 01 July - December 201616
Null Hypotheses
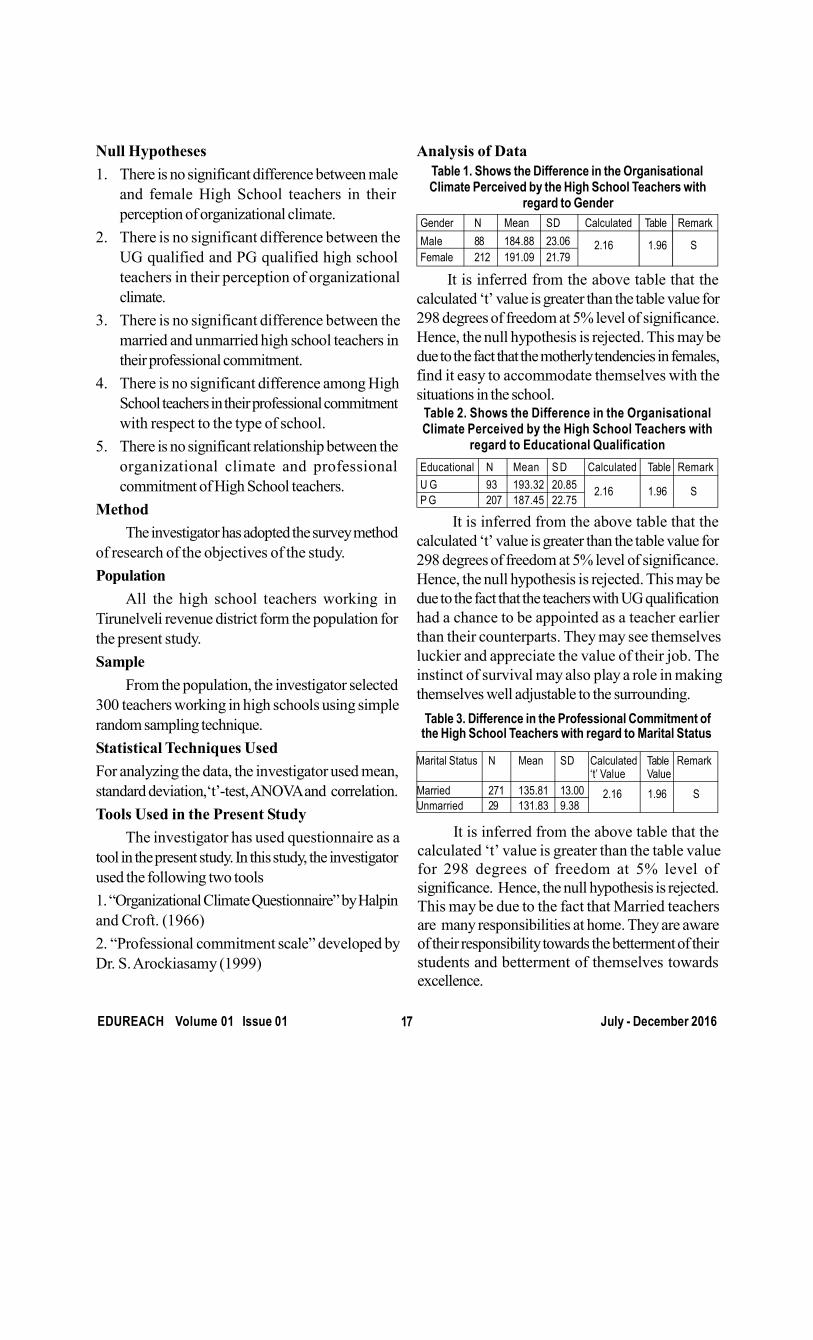
1. There is no significant difference between male
and female High School teachers in their
perception of organizational climate.
2. There is no significant difference between the
UG qualified and PG qualified high school
teachers in their perception of organizational
climate.
3. There is no significant difference between the
married and unmarried high school teachers in
their professional commitment.
4. There is no significant difference among High
School teachers in their professional commitment
with respect to the type of school.
5. There is no significant relationship between the
organizational climate and professional
commitment of High School teachers.
Method
The investigator has adopted the survey method
of research of the objectives of the study.
Population
All the high school teachers working in
Tirunelveli revenue district form the population for
the present study.
Sample
From the population, the investigator selected
300 teachers working in high schools using simple
random sampling technique.
Statistical Techniques Used
For analyzing the data, the investigator used mean,
standard deviation,‘t’-test, ANOVA and correlation.
Tools Used in the Present Study
The investigator has used questionnaire as a
tool in the present study. In this study, the investigator
used the following two tools
1. “Organizational Climate Questionnaire” by Halpin
and Croft. (1966)
2. “Professional commitment scale” developed by
Dr. S. Arockiasamy (1999)
Table 1. Shows the Difference in the OrganisationalClimate Perceived by the High School Teachers with
regard to GenderGender N Mean SD Calculated Table RemarkMale 88 184.88 23.06Female 212 191.09 21.79
2.16 1.96 S
It is inferred from the above table that the
calculated ‘t’ value is greater than the table value for
298 degrees of freedom at 5% level of significance.
Hence, the null hypothesis is rejected. This may be
due to the fact that the motherly tendencies in females,
find it easy to accommodate themselves with the
situations in the school.Table 2. Shows the Difference in the OrganisationalClimate Perceived by the High School Teachers with
regard to Educational Qualification
It is inferred from the above table that the
calculated ‘t’ value is greater than the table value for
298 degrees of freedom at 5% level of significance.
Hence, the null hypothesis is rejected. This may be
due to the fact that the teachers with UG qualification
had a chance to be appointed as a teacher earlier
than their counterparts. They may see themselves
luckier and appreciate the value of their job. The
instinct of survival may also play a role in making
themselves well adjustable to the surrounding.
Table 3. Difference in the Professional Commitment ofthe High School Teachers with regard to Marital Status
Marital Status N Mean SD Calculated Table Remark‘t’ Value Value
Married 271 135.81 13.00Unmarried 29 131.83 9.38
2.16 1.96 S
Educational N Mean S D Calculated Table RemarkU G 93 193.32 20.85P G 207 187.45 22.75
2.16 1.96 S
Analysis of Data
EDUREACH Volume 01 Issue 01 July - December 201617
It is inferred from the above table that the
calculated ‘t’ value is greater than the table value
for 298 degrees of freedom at 5% level of
significance. Hence, the null hypothesis is rejected.
This may be due to the fact that Married teachers
are many responsibilities at home. They are aware
of their responsibility towards the betterment of their
students and betterment of themselves towards
excellence.

Table 4. the Shows Difference in the ProfessionalCommitment of the High School Teachers with regard
to Type of school
It is inferred from the above table that the
calculated ‘F’ value is greater than the table value
for 2, 297 degrees of freedom at 5% level of
significance. Hence, the null hypothesis is rejected.
This may be due to the fact that the government
school teachers were found to be more satisfied with
factors like promotion, recognition, independence,
job security, job status and educational policies. They
have permanent job. They get reasonable salary.Table 5. Shows the Relationship between the
Organisational Climate Perceived by High SchoolTeachers and their Professional Commitment
Variables N Calculated Table Remark‘g’ Value Value
Organisational Climate vs.Professional Commitment 300 0.197 0.114 S
It is inferred from the above table that the
calculated ‘’ value is greater than the table value
for 298 degrees of freedom at 5% level of
significance. Hence, the null hypothesis is rejected.
This may be due to the fact that teachers may have
a democratic atmosphere in the schools. When the
teachers are working in a congenial working
environment where their needs are taken into
consideration and more encouragement is provided
by the Heads and colleagues both for personal and
professional growth, they will have a strong affinity
towards their institution. Their morale will also be high.
Findings
1. There is significant difference between male and
female high school teachers in their perception
of organizational climate.
2. There is significant difference between the UG
qualified and PG qualified high school teachers
in their perception of organizational climate.
3. There is significant difference between the
married and unmarried high school teachers in
their professional commitment.
4. There is significant difference among high school
teachers in their professional commitment with
respect to the type of school.
5. There is significant relationship between the
organizational climate perceived by the high
school teachers and their professional
commitment.
Recommendations
1. The teachers should be provided healthy
academic environment in schools, so that they
feel satisfied and comfortable.
2. The schools should give the teachers the
opportunity to attend orientation programmes,
refresher courses, workshops etc. organized by
various agencies. This will help in updating their
knowledge, skills and competencies and
ultimately will result in enhanced commitment
towards their profession.
3. The teachers should love their profession to be
more committed.
4. Teachers who always make use of mass media
are found to be more committed professionally
than others. As we are living in an age of
technology, the teachers should be encouraged
to make use of mass media very often, thereby
expanding their horizons of knowledge and
experiments.
References
Gunbayi, I.(2007)School Climate and
Teachers’ Perceptions on Climate Factors: research
into nine urban high schools. The Turkish online
Journal of Education Technology, 6 (3), (70-78),
July 2007.
Mohan, R. (2011). Teacher education.New Delhi:
PHI learning private limited.
Robbins, S. (1989).Organisational behaviour. New
Delhi: Prentice Hall of India Private Limited.
Sharma, S. (2010) A study of Professional
Commitment of Teacher Educators in relation to their
Organizational Climate and Gender
Difference.Prachi, Journal of Psycho-cultural
dimensions, 26 (2), (144-147).
Type of Mean SSb SSw d f ‘F’ Value Table Remarkschool valueGovt. 138.21Aided 135.56Private 132.06
1884.93 46602.31 2, 297 6.01 3.03 S
EDUREACH Volume 01 Issue 01 July - December 201618
A STUDY ON HUMAN RIGHTS AWARENESS OF SECONDARY
PROSPECTIVE TEACHERS
*Dr.V. Kasirajan
Human rights are essential for the full development of human personality and for humanhappiness. According to Dev (1996), Maheshwari (2002) human rights are generally defined asthe right which every human being entitles to enjoy and to protect. Human dignity is not anindividual, exclusive and isolated sense. It is a part of the common humanity. Closely related toissues that result from different interpretations of human rights are questions about whatconstitutes the cognitive and affective content of human rights that should be known by theB.Ed. trainees as they are going to be the future teachers. This study was carried out to find outthe significant difference, if any, in the human rights awareness of secondary prospective teachers.Normative Survey method was used and random sampling technique was employed for thestudy. “Human - rights awareness Inventory”was used as tool to collect data from the sampleof 300 secondary prospective teachers. The findings of the study reveal that i) There is significantdifference between male and female secondary prospective teachers in their human rightsawareness. ii) There is significant difference among men’s, women’s and co-education collegesecondary prospective teachers in their human rights awareness.
Abstract
Introduction
Education is the most vital input for the growth
and prosperity of a nation. It has the power to
transform human beings into human resources. It is
a deliberate and organized activity through which
the physical, intellectual, aesthetic, moral and spiritual
potentialities of the child are developed, both in the
individual and also as a member of society so that
one may lead the fullest and richest life possible in
this world and finally attain one’s ultimate end in the
world to come.
Education is an integral part of human life. It is
the basic condition for the development of the whole
man and vital instrument for accelerating the well
being and prosperity of all in every direction. Without
education, man would still be living just like a splendid
slave or like reasoning savage. Education is an activity
or a process which transforms the behavior of a
person’s instinctive behavior to human behavior.
Indira Gandhi mentioned “Education is a
liberating force and in our age it is also a democrating
force, cutting across the barriers of caste and class,
smoothing out inequalities imposed by birth and other
circumstances”. So education is the most important
aspect which leads human beings to know and enjoy
their rights too.
* Assistant Professor, S.Veerasamy Chettiar College of Education, Puliangudi, Tirunelveli.
Significance of the study
Man is a social animal. He cannot live apart
from the society. For leading a successful life he has
to establish with different individuals, organizations
and associations. He has to understand the nature
of human beings and society. If one wants to have
good relationship with other human beings, he is in
need of the ability to understand a person and to
their rights. Human rights denote the respect for
human personality and its absolute worth regardless
of colour, race, gender, religion and other
consideration. Human rights are essential for the full
development of human personality and for human
happiness. According to Dev (1996) and
Maheshwari (2002) human rights are generally
defined as the right which every human being entitles
to enjoy and to protect.
Every individual has dignity. The principles of
human rights were drawn up by human beings as a
way of ensuring that the dignity of everyone is
properly and equally respected, that is, to ensure
that a human being will be able to fully develop and
use human qualities such as intelligence, talent and
conscience and satisfy his or her spiritual and other
needs. Dignity gives an individual a sense of value
and worth. The existence of human rights
demonstrates that human beings are aware of each
Keywords : Human Rights, Colonialism, Racism
EDUREACH Volume 01 Issue 01 July - December 201619
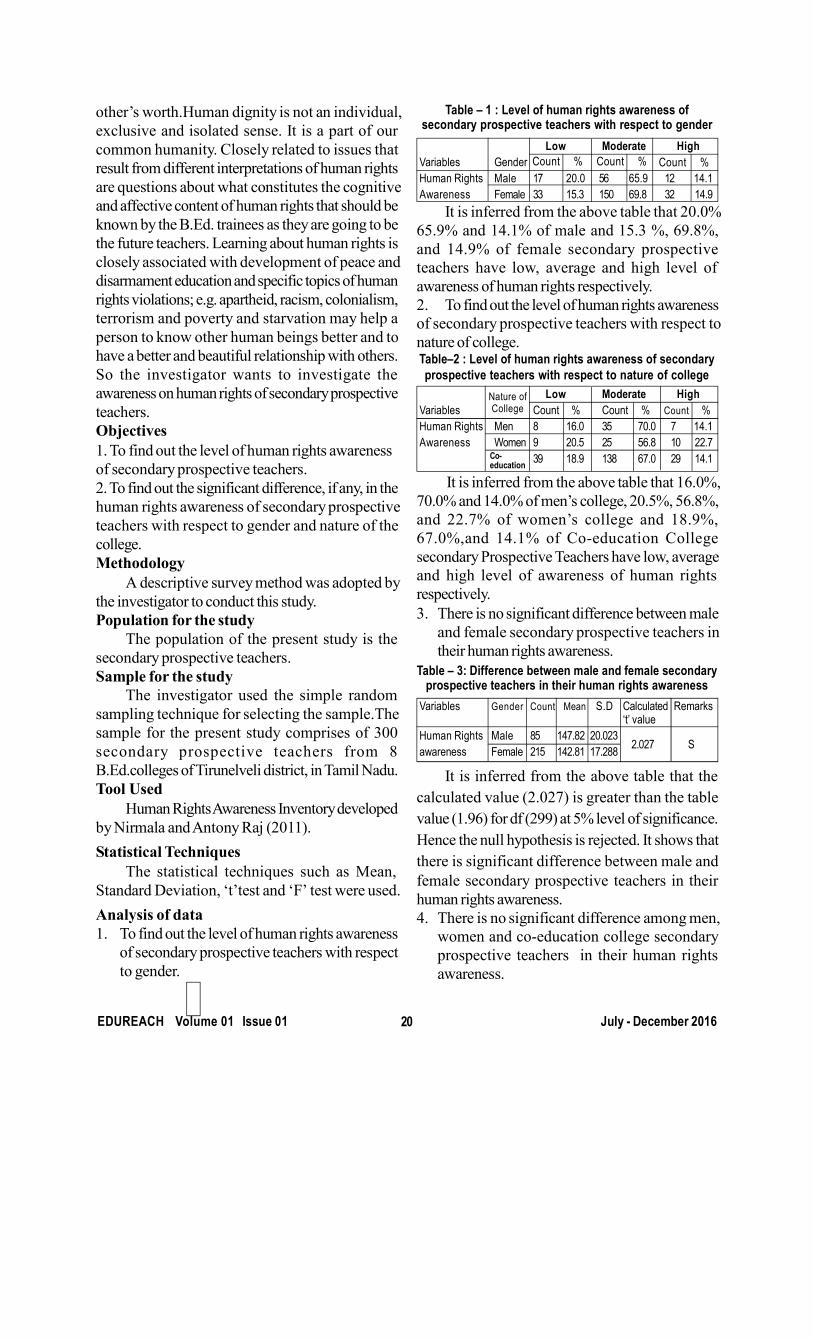
other’s worth.Human dignity is not an individual,
exclusive and isolated sense. It is a part of our
common humanity. Closely related to issues that
result from different interpretations of human rights
are questions about what constitutes the cognitive
and affective content of human rights that should be
known by the B.Ed. trainees as they are going to be
the future teachers. Learning about human rights is
closely associated with development of peace and
disarmament education and specific topics of human
rights violations; e.g. apartheid, racism, colonialism,
terrorism and poverty and starvation may help a
person to know other human beings better and to
have a better and beautiful relationship with others.
So the investigator wants to investigate the
awareness on human rights of secondary prospective
teachers.
Objectives
1. To find out the level of human rights awareness
of secondary prospective teachers.
2. To find out the significant difference, if any, in the
human rights awareness of secondary prospective
teachers with respect to gender and nature of the
college.
Methodology
A descriptive survey method was adopted by
the investigator to conduct this study.
Population for the study
The population of the present study is the
secondary prospective teachers.
Sample for the study
The investigator used the simple random
sampling technique for selecting the sample.The
sample for the present study comprises of 300
secondary prospective teachers from 8
B.Ed.colleges of Tirunelveli district, in Tamil Nadu.
Tool Used
Human Rights Awareness Inventory developed
by Nirmala and Antony Raj (2011).
Statistical Techniques
The statistical techniques such as Mean,
Standard Deviation, ‘t’test and ‘F’ test were used.
Analysis of data
1. To find out the level of human rights awareness
of secondary prospective teachers with respect
to gender.
Table – 1 : Level of human rights awareness ofsecondary prospective teachers with respect to gender
Low Moderate HighVariables GenderHuman Rights Male 17 20.0 56 65.9 12 14.1Awareness Female 33 15.3 150 69.8 32 14.9
It is inferred from the above table that 20.0%
65.9% and 14.1% of male and 15.3 %, 69.8%,
and 14.9% of female secondary prospective
teachers have low, average and high level of
awareness of human rights respectively.
2. To find out the level of human rights awareness
of secondary prospective teachers with respect to
nature of college.Table–2 : Level of human rights awareness of secondaryprospective teachers with respect to nature of college
Low Moderate HighVariables Count % Count % Count %Human Rights Men 8 16.0 35 70.0 7 14.1Awareness Women 9 20.5 25 56.8 10 22.7
39 18.9 138 67.0 29 14.1
Nature ofCollege
Co-education
It is inferred from the above table that 16.0%,
70.0% and 14.0% of men’s college, 20.5%, 56.8%,
and 22.7% of women’s college and 18.9%,
67.0%,and 14.1% of Co-education College
secondary Prospective Teachers have low, average
and high level of awareness of human rights
respectively.
3. There is no significant difference between male
and female secondary prospective teachers in
their human rights awareness.
Table – 3: Difference between male and female secondaryprospective teachers in their human rights awareness
Variables Gender Count Mean S.D Calculated Remarks‘t’ value
Human Rights Male 85 147.82 20.023awareness Female 215 142.81 17.288
It is inferred from the above table that the
calculated value (2.027) is greater than the table
value (1.96) for df (299) at 5% level of significance.
Hence the null hypothesis is rejected. It shows that
there is significant difference between male and
female secondary prospective teachers in their
human rights awareness.
4. There is no significant difference among men,
women and co-education college secondary
prospective teachers in their human rights
awareness.
2.027 S
Count % Count % Count %
EDUREACH Volume 01 Issue 01 July - December 201620
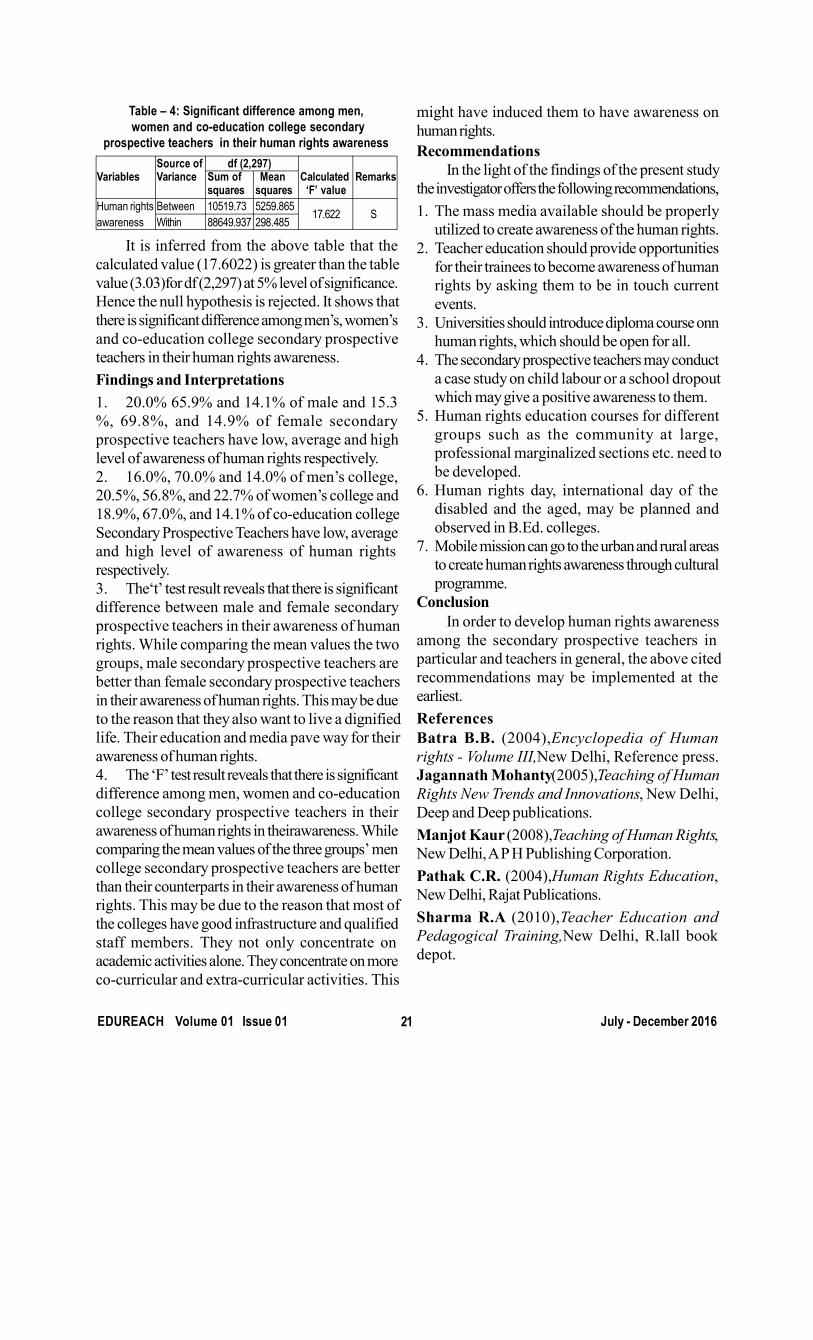
Table – 4: Significant difference among men, women and co-education college secondary
prospective teachers in their human rights awareness
It is inferred from the above table that the
calculated value (17.6022) is greater than the table
value (3.03)for df (2,297) at 5% level of significance.
Hence the null hypothesis is rejected. It shows that
there is significant difference among men’s, women’s
and co-education college secondary prospective
teachers in their human rights awareness.
Findings and Interpretations
1. 20.0% 65.9% and 14.1% of male and 15.3
%, 69.8%, and 14.9% of female secondary
prospective teachers have low, average and high
level of awareness of human rights respectively.
2. 16.0%, 70.0% and 14.0% of men’s college,
20.5%, 56.8%, and 22.7% of women’s college and
18.9%, 67.0%, and 14.1% of co-education college
Secondary Prospective Teachers have low, average
and high level of awareness of human rights
respectively.
3. The‘t’ test result reveals that there is significant
difference between male and female secondary
prospective teachers in their awareness of human
rights. While comparing the mean values the two
groups, male secondary prospective teachers are
better than female secondary prospective teachers
in their awareness of human rights. This may be due
to the reason that they also want to live a dignified
life. Their education and media pave way for their
awareness of human rights.
4. The ‘F’ test result reveals that there is significant
difference among men, women and co-education
college secondary prospective teachers in their
awareness of human rights in theirawareness. While
comparing the mean values of the three groups’ men
college secondary prospective teachers are better
than their counterparts in their awareness of human
rights. This may be due to the reason that most of
the colleges have good infrastructure and qualified
staff members. They not only concentrate on
academic activities alone. They concentrate on more
co-curricular and extra-curricular activities. This
might have induced them to have awareness on
human rights.
Recommendations
In the light of the findings of the present study
the investigator offers the following recommendations,
1. The mass media available should be properly
utilized to create awareness of the human rights.
2. Teacher education should provide opportunities
for their trainees to become awareness of human
rights by asking them to be in touch current
events.
3. Universities should introduce diploma course onn
human rights, which should be open for all.
4. The secondary prospective teachers may conduct
a case study on child labour or a school dropout
which may give a positive awareness to them.
5. Human rights education courses for different
groups such as the community at large,
professional marginalized sections etc. need to
be developed.
6. Human rights day, international day of the
disabled and the aged, may be planned and
observed in B.Ed. colleges.
7. Mobile mission can go to the urban and rural areas
to create human rights awareness through cultural
programme.
Conclusion
In order to develop human rights awareness
among the secondary prospective teachers in
particular and teachers in general, the above cited
recommendations may be implemented at the
earliest.
References
Batra B.B. (2004),Encyclopedia of Human
rights - Volume III,New Delhi, Reference press.
Jagannath Mohanty(2005),Teaching of Human
Rights New Trends and Innovations, New Delhi,
Deep and Deep publications.
Manjot Kaur (2008),Teaching of Human Rights,
New Delhi, A P H Publishing Corporation.
Pathak C.R. (2004),Human Rights Education,
New Delhi, Rajat Publications.
Sharma R.A (2010),Teacher Education and
Pedagogical Training,New Delhi, R.lall book
depot.
Source of df (2,297)Variables Variance Sum of Mean Calculated Remarks
squares squares ‘F’ valueHuman rights Between 10519.73 5259.865awareness Within 88649.937 298.485 17.622 S
EDUREACH Volume 01 Issue 01 July - December 201621
RELATIONSHIP BETWEEN COMMUNICATION SKILLS AND ACADEMIC
ACHIEVEMENT OF HIGHER SECONDARY STUDENTS IN TIRUNELVELI DISTRICT
*Dr. R. Thangadurai **Mrs.R.Thanga Selvam
This research article focuses the relationship between the communication skills of higher
secondary students and their academic achievement. The investigators adopted survey method
for collecting the data. The investigators prepared and validated a scale to measure communication
skills of higher secondary students. For measuring the academic achievement, the half-yearly
marks of the students were considered. All the higher secondary students studying standards XI
and XII in the higher secondary schools in Tirunelveli District formed the population of the
study. From the population, the investigators have chosen 1130 students using simple random
sampling technique. For analyzing the data, the investigators used Mean, SD, ‘t’ Test, ‘F’ test
and Pearson’s Product Moment Correlation. The findings showed that the communication skills
of higher secondary students are significantly correlated with their academic achievement.
Abstract
* Principal, PSN College of Education, Tirunelveli.
**Assistant Professor in Bio. Science, Annammal College of Education, Thoothukudi.
Introduction
Today the society is at the crossroads where
the explosion of technical and job oriented education
neglects life oriented education. There is revolution
of knowledge at one end and increasing inability to
assimilate it. Hence, there is a need for a shift in our
education to increase the capability of the individuals
to deal with changes and friction, since education is
the only essential means for formation and
development of the individual and nation. A healthy
system of education would be one, which ensures
physical, mental, economic development and
sensitivity of the students.
The extent to which a child will be able to
acquire the necessary skills to interact successfully
with his/her surroundings is mainly determined by
two factors viz., heredity and environment.Genetic
endowment provides a range of development to the
child. Position of a child in the given range is
determined by opportunities and exposure given to
him/her. Enriched environment compels the child to
remain at the lowest level of the range. It has been
observed that despite the rich heritage, children from
deprived background (deprived of love, care,
concern also) fail to actualize their potential to the
highest possible level. Family plays a very vital role
as an agent of providing a secure and stimulating
environment where a child can acquire as well as
practice necessary skills required for harmonious
development.
Communication Skill
Communication skill is an ability to
communicate. It is the primary factor that
distinguishes human beings from animals. And it is
the ability to communicate well that distinguishes one
individual from another. The fact is that apart from
the basic necessities, one needs to be equipped with
habits for good communication skills, as this is what
will make them a happy and successful social
being.In order to develop these habits, the people
needs to acknowledge the fact that they need to
improve communication skills from time to time. They
need to take stock of the way they interact and the
direction in which their work and personal relations
are going. The only constant in life is change, and
the more one accepts one’s strengths and works
towards dealing with their shortcomings, especially
in the area of communication skills, the better will
be their interactions and the more their social
popularity.
Today, effective communication skills have
become a predominant factor even while recruiting
employees. While interviewing candidates, most
interviewers judge them on the basis of the way they
Keywords : Communication skills, Academic
achievement.
EDUREACH Volume 01 Issue 01 July - December 201622
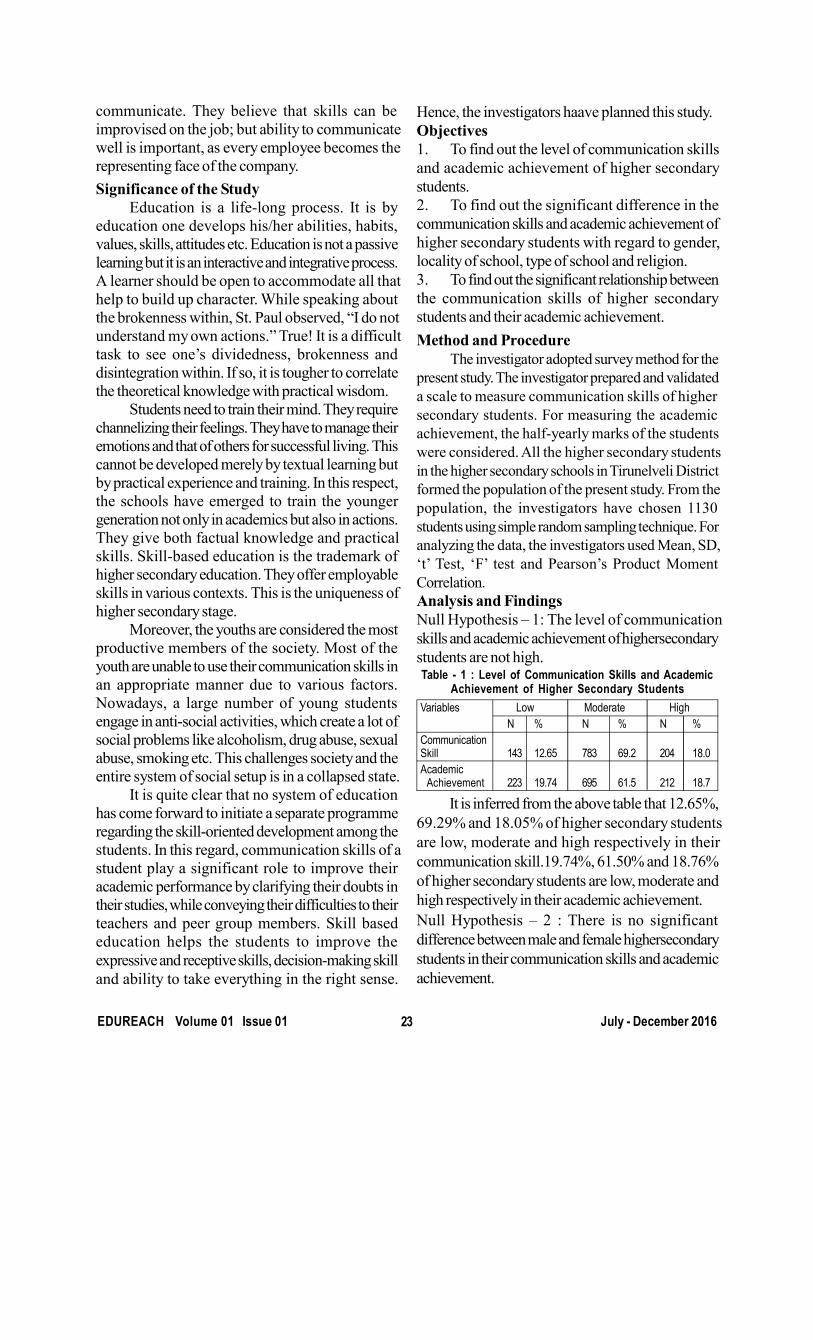
communicate. They believe that skills can be
improvised on the job; but ability to communicate
well is important, as every employee becomes the
representing face of the company.
Significance of the Study
Education is a life-long process. It is by
education one develops his/her abilities, habits,
values, skills, attitudes etc. Education is not a passive
learning but it is an interactive and integrative process.
A learner should be open to accommodate all that
help to build up character. While speaking about
the brokenness within, St. Paul observed, “I do not
understand my own actions.” True! It is a difficult
task to see one’s dividedness, brokenness and
disintegration within. If so, it is tougher to correlate
the theoretical knowledge with practical wisdom.
Students need to train their mind. They require
channelizing their feelings. They have to manage their
emotions and that of others for successful living. This
cannot be developed merely by textual learning but
by practical experience and training. In this respect,
the schools have emerged to train the younger
generation not only in academics but also in actions.
They give both factual knowledge and practical
skills. Skill-based education is the trademark of
higher secondary education. They offer employable
skills in various contexts. This is the uniqueness of
higher secondary stage.
Moreover, the youths are considered the most
productive members of the society. Most of the
youth are unable to use their communication skills in
an appropriate manner due to various factors.
Nowadays, a large number of young students
engage in anti-social activities, which create a lot of
social problems like alcoholism, drug abuse, sexual
abuse, smoking etc. This challenges society and the
entire system of social setup is in a collapsed state.
It is quite clear that no system of education
has come forward to initiate a separate programme
regarding the skill-oriented development among the
students. In this regard, communication skills of a
student play a significant role to improve their
academic performance by clarifying their doubts in
their studies, while conveying their difficulties to their
teachers and peer group members. Skill based
education helps the students to improve the
expressive and receptive skills, decision-making skill
and ability to take everything in the right sense.
Hence, the investigators haave planned this study.
Objectives
1. To find out the level of communication skills
and academic achievement of higher secondary
students.
2. To find out the significant difference in the
communication skills and academic achievement of
higher secondary students with regard to gender,
locality of school, type of school and religion.
3. To find out the significant relationship between
the communication skills of higher secondary
students and their academic achievement.
Method and Procedure
The investigator adopted survey method for the
present study. The investigator prepared and validated
a scale to measure communication skills of higher
secondary students. For measuring the academic
achievement, the half-yearly marks of the students
were considered. All the higher secondary students
in the higher secondary schools in Tirunelveli District
formed the population of the present study. From the
population, the investigators have chosen 1130
students using simple random sampling technique. For
analyzing the data, the investigators used Mean, SD,
‘t’ Test, ‘F’ test and Pearson’s Product Moment
Correlation.
Analysis and Findings
Null Hypothesis – 1: The level of communication
skills and academic achievement of highersecondary
students are not high.Table - 1 : Level of Communication Skills and Academic
Achievement of Higher Secondary StudentsVariables Low Moderate High
N % N % N %CommunicationSkill 143 12.65 783 69.2 204 18.0Academic Achievement 223 19.74 695 61.5 212 18.7
It is inferred from the above table that 12.65%,
69.29% and 18.05% of higher secondary students
are low, moderate and high respectively in their
communication skill.19.74%, 61.50% and 18.76%
of higher secondary students are low, moderate and
high respectively in their academic achievement.
Null Hypothesis – 2 : There is no significant
difference between male and female highersecondary
students in their communication skills and academic
achievement.
EDUREACH Volume 01 Issue 01 July - December 201623
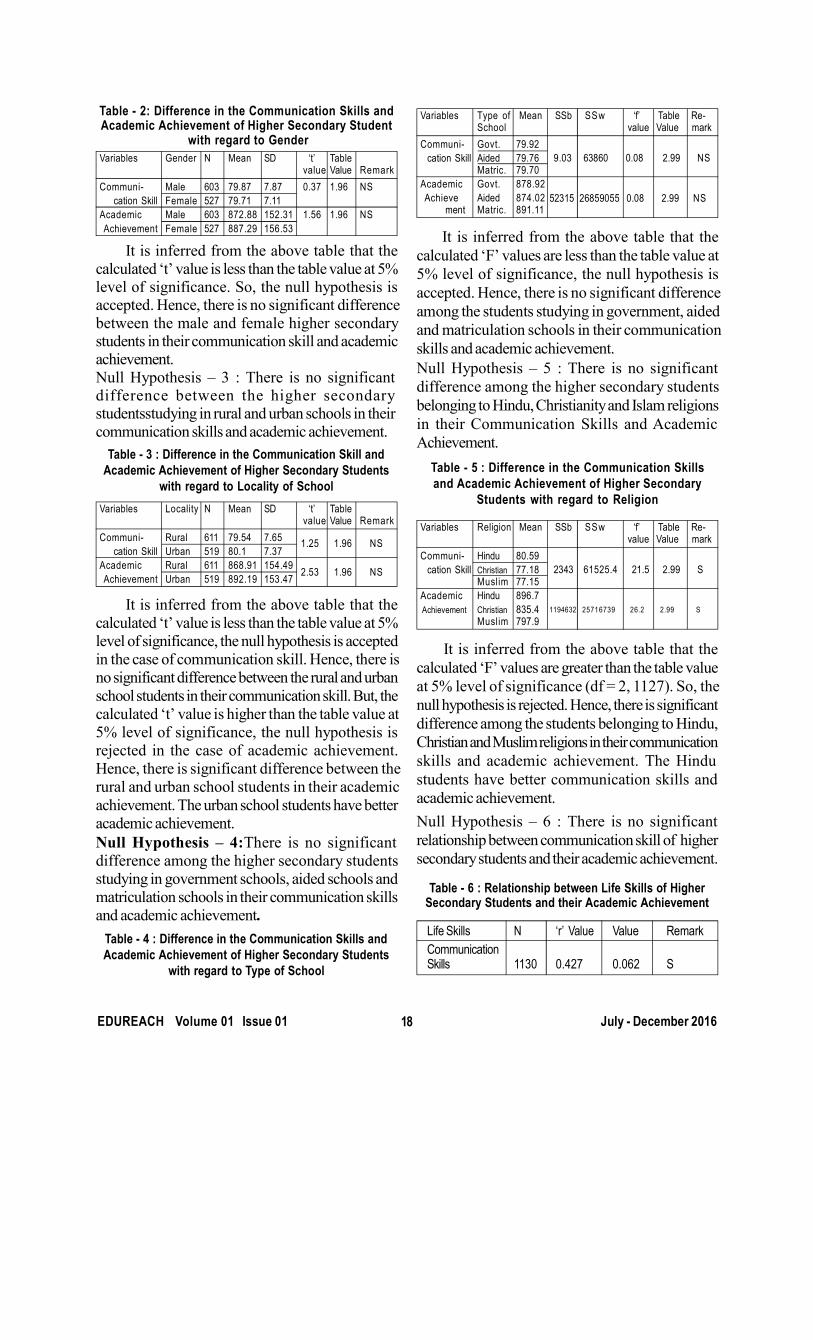
Table - 2: Difference in the Communication Skills andAcademic Achievement of Higher Secondary Student
with regard to Gender
It is inferred from the above table that the
calculated ‘t’ value is less than the table value at 5%level of significance. So, the null hypothesis isaccepted. Hence, there is no significant difference
between the male and female higher secondarystudents in their communication skill and academicachievement.
Null Hypothesis – 3 : There is no significantdifference between the higher secondarystudentsstudying in rural and urban schools in their
communication skills and academic achievement.
It is inferred from the above table that the
calculated ‘t’ value is less than the table value at 5%
level of significance, the null hypothesis is accepted
in the case of communication skill. Hence, there is
no significant difference between the rural and urban
school students in their communication skill. But, the
calculated ‘t’ value is higher than the table value at
5% level of significance, the null hypothesis is
rejected in the case of academic achievement.
Hence, there is significant difference between the
rural and urban school students in their academic
achievement. The urban school students have better
academic achievement.
Null Hypothesis – 4:There is no significant
difference among the higher secondary students
studying in government schools, aided schools and
matriculation schools in their communication skills
and academic achievement.
It is inferred from the above table that the
calculated ‘F’ values are less than the table value at
5% level of significance, the null hypothesis is
accepted. Hence, there is no significant difference
among the students studying in government, aided
and matriculation schools in their communication
skills and academic achievement.
Null Hypothesis – 5 : There is no significant
difference among the higher secondary students
belonging to Hindu, Christianity and Islam religions
in their Communication Skills and Academic
Achievement.
Table - 5 : Difference in the Communication Skillsand Academic Achievement of Higher Secondary
Students with regard to Religion
It is inferred from the above table that the
calculated ‘F’ values are greater than the table value
at 5% level of significance (df = 2, 1127). So, the
null hypothesis is rejected. Hence, there is significant
difference among the students belonging to Hindu,
Christian and Muslim religions in their communication
skills and academic achievement. The Hindu
students have better communication skills and
academic achievement.
Null Hypothesis – 6 : There is no significant
relationship between communication skill of higher
secondary students and their academic achievement.
Variables Type of Mean SSb SSw ‘f’ Table Re-School value Value mark
Communi- Govt. 79.92 cation Skill Aided 79.76
Matric. 79.70Academic Govt. 878.92 Achieve Aided 874.02 ment Matric. 891.11
9.03 63860 0.08 2.99 NS
52315 26859055 0.08 2.99 NS
EDUREACH Volume 01 Issue 01 July - December 201618
Table - 4 : Difference in the Communication Skills andAcademic Achievement of Higher Secondary Students
with regard to Type of School
Table - 6 : Relationship between Life Skills of HigherSecondary Students and their Academic Achievement
Life Skills N ‘r’ Value Value RemarkCommunicationSkills 1130 0.427 0.062 S
Variables Religion Mean SSb SSw ‘f’ Table Re- value Value mark
Communi- Hindu 80.59 cation Skill Christian 77.18
Muslim 77.15Academic Hindu 896.7 Achievement Christian 835.4
Muslim 797.9
2343 61525.4 21.5 2.99 S
1194632 25716739 26.2 2.99 S
Table - 3 : Difference in the Communication Skill andAcademic Achievement of Higher Secondary Students
with regard to Locality of SchoolVariables Locality N Mean SD ‘t’ Table
value Value RemarkCommuni- Rural 611 79.54 7.65 cation Skill Urban 519 80.1 7.37Academic Rural 611 868.91 154.49 Achievement Urban 519 892.19 153.47
1.25 1.96 NS
2.53 1.96 NS
Variables Gender N Mean SD ‘t’ Tablevalue Value Remark
Communi- Male 603 79.87 7.87 0.37 1.96 NS cation Skill Female 527 79.71 7.11Academic Male 603 872.88 152.31 1.56 1.96 NS Achievement Female 527 887.29 156.53
It is inferred from the above table that the
calculated ‘r’ value is greater than the table value at
5% level of significance. So, the null hypothesis is
rejected. Hence, there is significant relationship
between communication skill of higher secondary
students and their academic achievement.
Conclusion
It is concluded that the communication skills of
higher secondary students is significantly correlated
with their academic achievement. The urban school
students have better academic achievement. The
Hindu students have better communication skill and
academic achievement. So, the investigator opines
that necessary steps such as, skill based developed
programmes may be given for improving the
communication skills of the higher secondary students
for making their academic achievement in a better
way.
References
Albertyn, R.M., Kapp, C.A. and Groenewald,
C.J. (2001).Patterns of Empowerment inIndividuals
through the Course of a Life-skills Programme in
South Africa.Studies in theEducation of Adults,
Vol. 33, No. 2, 1 October 2001, Pp. 180-200.
SaritaKumari, and D.S. Srivastava, (2005).
Education: Skills and Competencies.New Delhi :
Isha Books.
EDUREACH Volume 01 Issue 01 July - December 201618
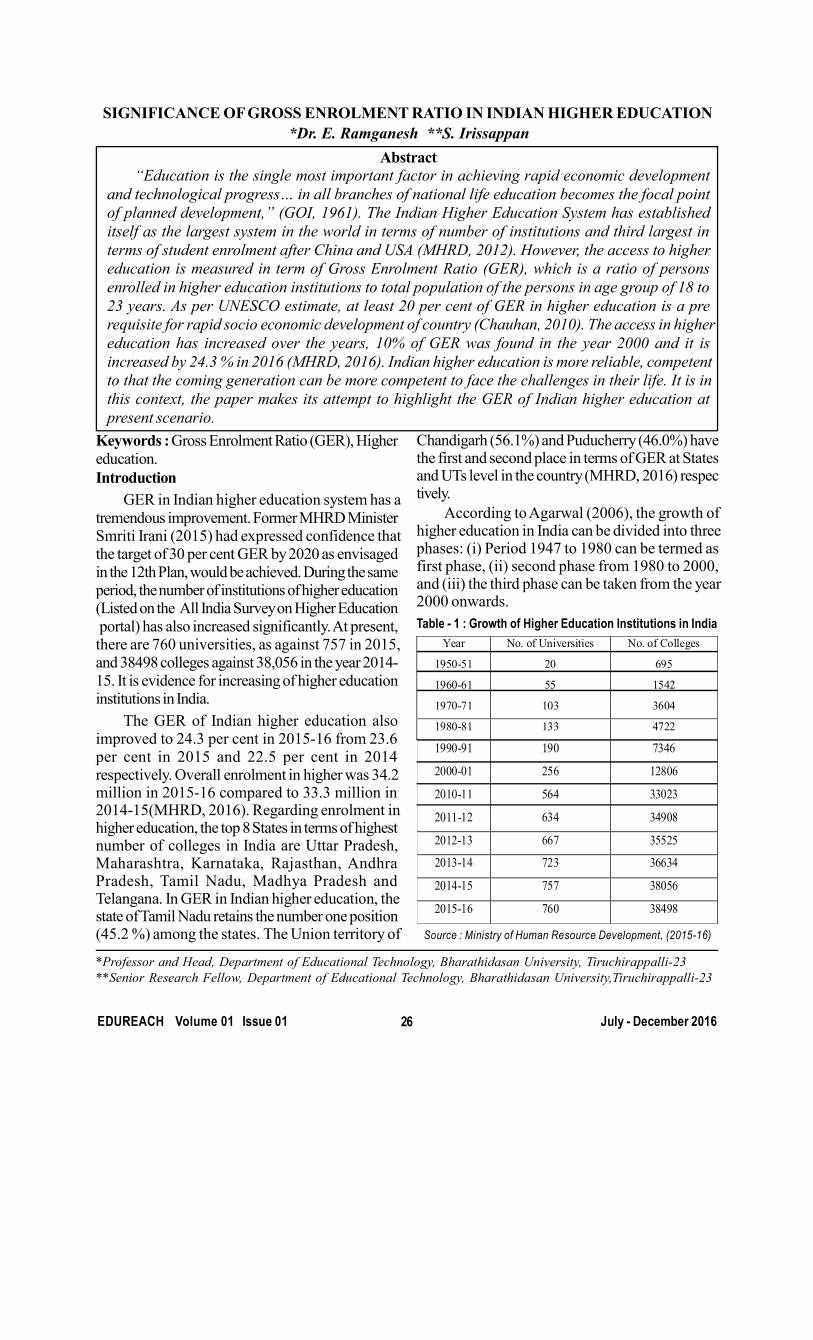
SIGNIFICANCE OF GROSS ENROLMENT RATIO IN INDIAN HIGHER EDUCATION
*Dr. E. Ramganesh **S. Irissappan
Abstract
“Education is the single most important factor in achieving rapid economic development
and technological progress… in all branches of national life education becomes the focal point
of planned development,” (GOI, 1961). The Indian Higher Education System has established
itself as the largest system in the world in terms of number of institutions and third largest in
terms of student enrolment after China and USA (MHRD, 2012). However, the access to higher
education is measured in term of Gross Enrolment Ratio (GER), which is a ratio of persons
enrolled in higher education institutions to total population of the persons in age group of 18 to
23 years. As per UNESCO estimate, at least 20 per cent of GER in higher education is a pre
requisite for rapid socio economic development of country (Chauhan, 2010). The access in higher
education has increased over the years, 10% of GER was found in the year 2000 and it is
increased by 24.3 % in 2016 (MHRD, 2016). Indian higher education is more reliable, competent
to that the coming generation can be more competent to face the challenges in their life. It is in
this context, the paper makes its attempt to highlight the GER of Indian higher education at
present scenario.
Keywords : Gross Enrolment Ratio (GER), Higher
education.
Introduction
GER in Indian higher education system has a
tremendous improvement. Former MHRD MinisterSmriti Irani (2015) had expressed confidence thatthe target of 30 per cent GER by 2020 as envisaged
in the 12th Plan, would be achieved. During the sameperiod, the number of institutions of higher education(Listed on the All India Survey on Higher Education
portal) has also increased significantly. At present,there are 760 universities, as against 757 in 2015,and 38498 colleges against 38,056 in the year 2014-
15. It is evidence for increasing of higher educationinstitutions in India.
The GER of Indian higher education alsoimproved to 24.3 per cent in 2015-16 from 23.6per cent in 2015 and 22.5 per cent in 2014respectively. Overall enrolment in higher was 34.2million in 2015-16 compared to 33.3 million in2014-15(MHRD, 2016). Regarding enrolment inhigher education, the top 8 States in terms of highestnumber of colleges in India are Uttar Pradesh,Maharashtra, Karnataka, Rajasthan, AndhraPradesh, Tamil Nadu, Madhya Pradesh andTelangana. In GER in Indian higher education, thestate of Tamil Nadu retains the number one position(45.2 %) among the states. The Union territory of
Chandigarh (56.1%) and Puducherry (46.0%) havethe first and second place in terms of GER at Statesand UTs level in the country (MHRD, 2016) respectively.
According to Agarwal (2006), the growth ofhigher education in India can be divided into threephases: (i) Period 1947 to 1980 can be termed asfirst phase, (ii) second phase from 1980 to 2000,and (iii) the third phase can be taken from the year2000 onwards.
Table - 1 : Growth of Higher Education Institutions in India
*Professor and Head, Department of Educational Technology, Bharathidasan University, Tiruchirappalli-23
**Senior Research Fellow, Department of Educational Technology, Bharathidasan University,Tiruchirappalli-23
Year No. of Universities No. of Colleges
1950-51 20 695
1960-61 55 1542
1970-71 103 3604
1980-81 133 4722
1990-91 190 7346
2000-01 256 12806
2010-11 564 33023
2011-12 634 34908
2012-13 667 35525
2013-14 723 36634
2014-15 757 38056
2015-16 760 38498
Source : Ministry of Human Resource Development, (2015-16)
EDUREACH Volume 01 Issue 01 July - December 201626
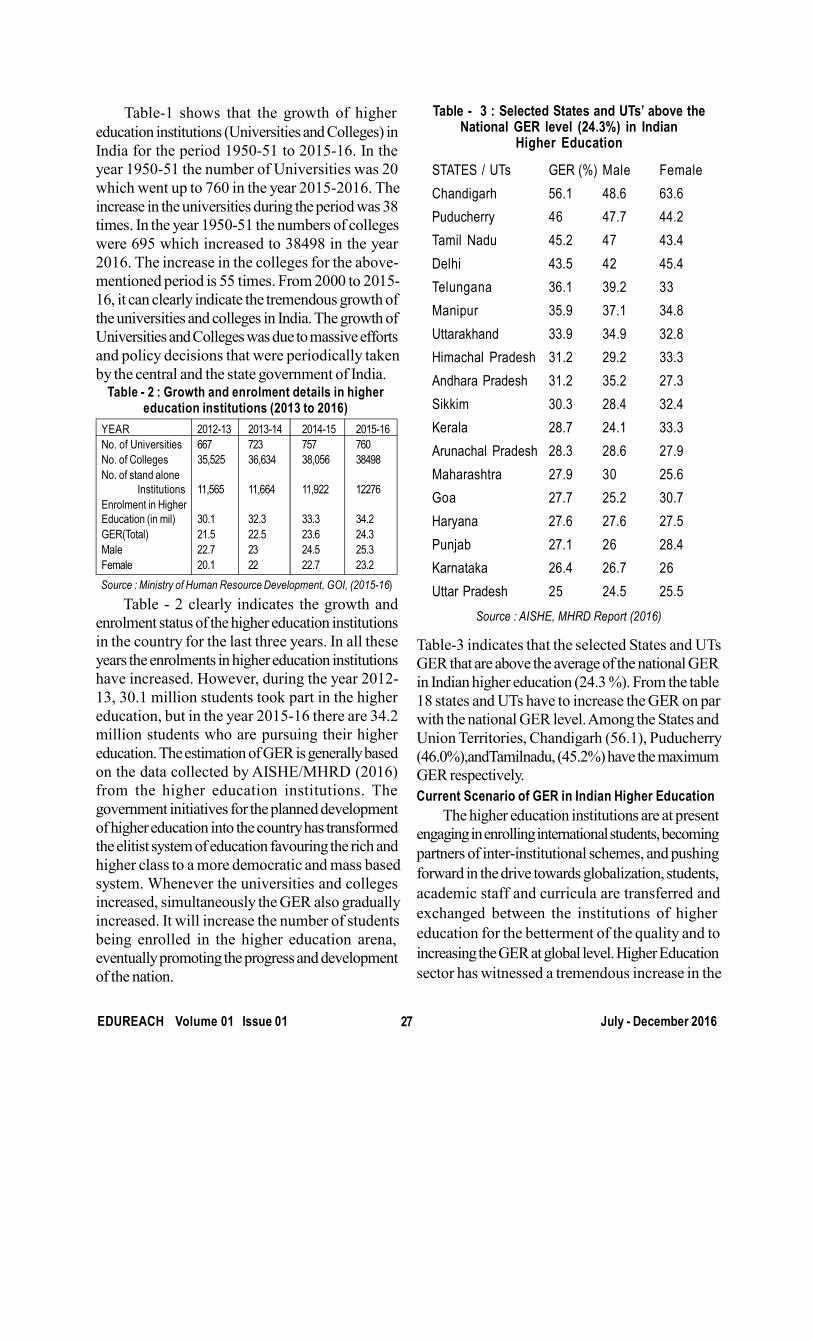
Table-1 shows that the growth of higher
education institutions (Universities and Colleges) in
India for the period 1950-51 to 2015-16. In the
year 1950-51 the number of Universities was 20
which went up to 760 in the year 2015-2016. The
increase in the universities during the period was 38
times. In the year 1950-51 the numbers of colleges
were 695 which increased to 38498 in the year
2016. The increase in the colleges for the above-
mentioned period is 55 times. From 2000 to 2015-
16, it can clearly indicate the tremendous growth of
the universities and colleges in India. The growth of
Universities and Colleges was due to massive efforts
and policy decisions that were periodically taken
by the central and the state government of India.Table - 2 : Growth and enrolment details in higher
education institutions (2013 to 2016)
Source : Ministry of Human Resource Development, GOI, (2015-16)Table - 2 clearly indicates the growth and
enrolment status of the higher education institutions
in the country for the last three years. In all these
years the enrolments in higher education institutions
have increased. However, during the year 2012-
13, 30.1 million students took part in the higher
education, but in the year 2015-16 there are 34.2
million students who are pursuing their higher
education. The estimation of GER is generally based
on the data collected by AISHE/MHRD (2016)
from the higher education institutions. The
government initiatives for the planned development
of higher education into the country has transformed
the elitist system of education favouring the rich and
higher class to a more democratic and mass based
system. Whenever the universities and colleges
increased, simultaneously the GER also gradually
increased. It will increase the number of students
being enrolled in the higher education arena,
eventually promoting the progress and development
of the nation.
Table - 3 : Selected States and UTs’ above theNational GER level (24.3%) in Indian
Higher Education
Source : AISHE, MHRD Report (2016)
Table-3 indicates that the selected States and UTs
GER that are above the average of the national GER
in Indian higher education (24.3 %). From the table
18 states and UTs have to increase the GER on par
with the national GER level. Among the States and
Union Territories, Chandigarh (56.1), Puducherry
(46.0%),andTamilnadu, (45.2%) have the maximum
GER respectively.
Current Scenario of GER in Indian Higher Education The higher education institutions are at present
engaging in enrolling international students, becoming
partners of inter-institutional schemes, and pushing
forward in the drive towards globalization, students,
academic staff and curricula are transferred and
exchanged between the institutions of higher
education for the betterment of the quality and to
increasing the GER at global level. Higher Education
sector has witnessed a tremendous increase in the
EDUREACH Volume 01 Issue 01 July - December 201627
YEAR 2012-13 2013-14 2014-15 2015-16No. of Universities 667 723 757 760No. of Colleges 35,525 36,634 38,056 38498No. of stand alone Institutions 11,565 11,664 11,922 12276Enrolment in HigherEducation (in mil) 30.1 32.3 33.3 34.2GER(Total) 21.5 22.5 23.6 24.3Male 22.7 23 24.5 25.3Female 20.1 22 22.7 23.2
STATES / UTs GER (%) Male FemaleChandigarh 56.1 48.6 63.6Puducherry 46 47.7 44.2Tamil Nadu 45.2 47 43.4Delhi 43.5 42 45.4Telungana 36.1 39.2 33Manipur 35.9 37.1 34.8Uttarakhand 33.9 34.9 32.8Himachal Pradesh 31.2 29.2 33.3Andhara Pradesh 31.2 35.2 27.3Sikkim 30.3 28.4 32.4Kerala 28.7 24.1 33.3Arunachal Pradesh 28.3 28.6 27.9Maharashtra 27.9 30 25.6Goa 27.7 25.2 30.7Haryana 27.6 27.6 27.5Punjab 27.1 26 28.4Karnataka 26.4 26.7 26Uttar Pradesh 25 24.5 25.5
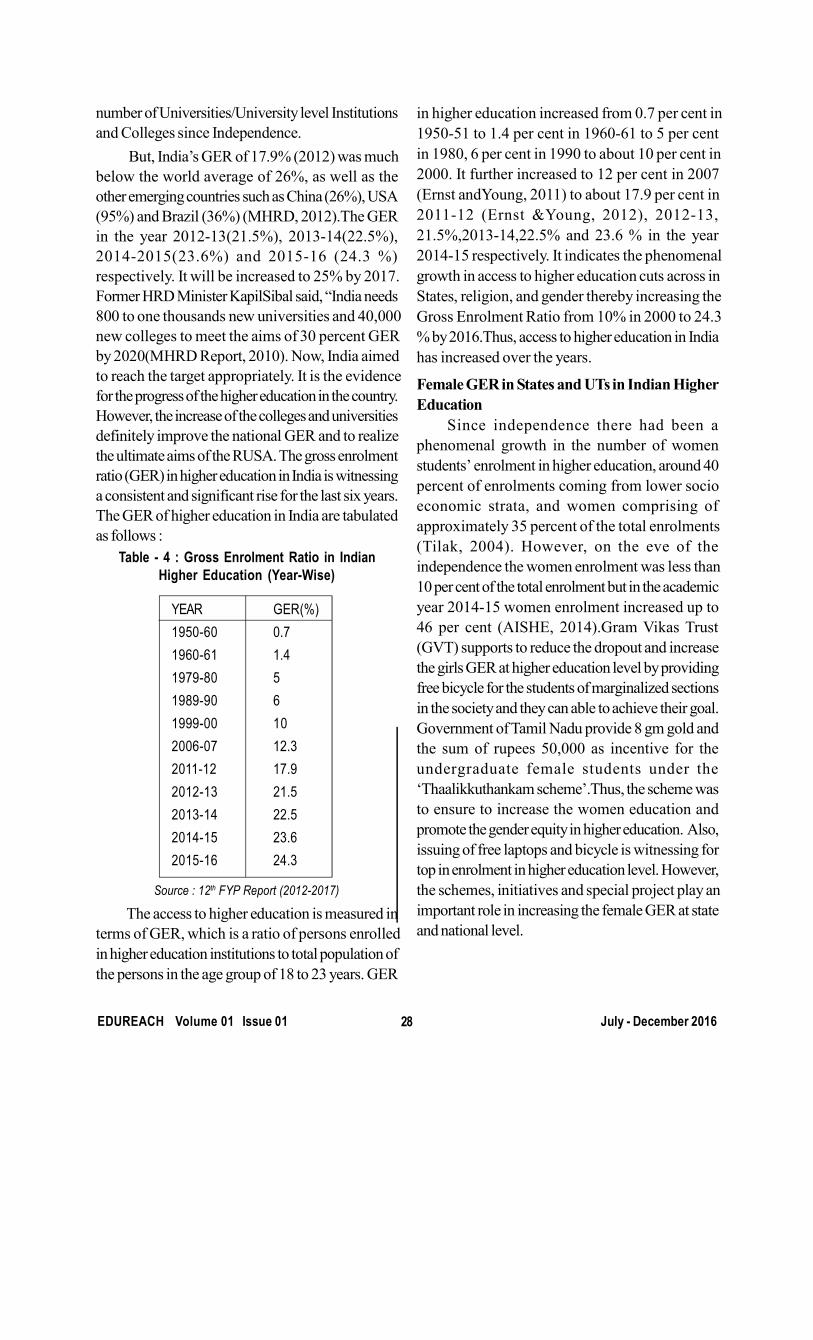
number of Universities/University level Institutions
and Colleges since Independence.
But, India’s GER of 17.9% (2012) was much
below the world average of 26%, as well as the
other emerging countries such as China (26%), USA
(95%) and Brazil (36%) (MHRD, 2012).The GER
in the year 2012-13(21.5%), 2013-14(22.5%),
2014-2015(23.6%) and 2015-16 (24.3 %)
respectively. It will be increased to 25% by 2017.
Former HRD Minister KapilSibal said, “India needs
800 to one thousands new universities and 40,000
new colleges to meet the aims of 30 percent GER
by 2020(MHRD Report, 2010). Now, India aimed
to reach the target appropriately. It is the evidence
for the progress of the higher education in the country.
However, the increase of the colleges and universities
definitely improve the national GER and to realize
the ultimate aims of the RUSA. The gross enrolment
ratio (GER) in higher education in India is witnessing
a consistent and significant rise for the last six years.
The GER of higher education in India are tabulated
as follows :
Table - 4 : Gross Enrolment Ratio in IndianHigher Education (Year-Wise)
Source : 12th FYP Report (2012-2017)
The access to higher education is measured in
terms of GER, which is a ratio of persons enrolled
in higher education institutions to total population of
the persons in the age group of 18 to 23 years. GER
in higher education increased from 0.7 per cent in
1950-51 to 1.4 per cent in 1960-61 to 5 per cent
in 1980, 6 per cent in 1990 to about 10 per cent in
2000. It further increased to 12 per cent in 2007
(Ernst andYoung, 2011) to about 17.9 per cent in
2011-12 (Ernst &Young, 2012), 2012-13,
21.5%,2013-14,22.5% and 23.6 % in the year
2014-15 respectively. It indicates the phenomenal
growth in access to higher education cuts across in
States, religion, and gender thereby increasing the
Gross Enrolment Ratio from 10% in 2000 to 24.3
% by 2016.Thus, access to higher education in India
has increased over the years.
Female GER in States and UTs in Indian Higher
Education
Since independence there had been a
phenomenal growth in the number of women
students’ enrolment in higher education, around 40
percent of enrolments coming from lower socio
economic strata, and women comprising of
approximately 35 percent of the total enrolments
(Tilak, 2004). However, on the eve of the
independence the women enrolment was less than
10 per cent of the total enrolment but in the academic
year 2014-15 women enrolment increased up to
46 per cent (AISHE, 2014).Gram Vikas Trust
(GVT) supports to reduce the dropout and increase
the girls GER at higher education level by providing
free bicycle for the students of marginalized sections
in the society and they can able to achieve their goal.
Government of Tamil Nadu provide 8 gm gold and
the sum of rupees 50,000 as incentive for the
undergraduate female students under the
‘Thaalikkuthankam scheme’.Thus, the scheme was
to ensure to increase the women education and
promote the gender equity in higher education. Also,
issuing of free laptops and bicycle is witnessing for
top in enrolment in higher education level. However,
the schemes, initiatives and special project play an
important role in increasing the female GER at state
and national level.
YEAR GER(%)1950-60 0.71960-61 1.41979-80 51989-90 61999-00 102006-07 12.32011-12 17.92012-13 21.52013-14 22.52014-15 23.62015-16 24.3
EDUREACH Volume 01 Issue 01 July - December 201628
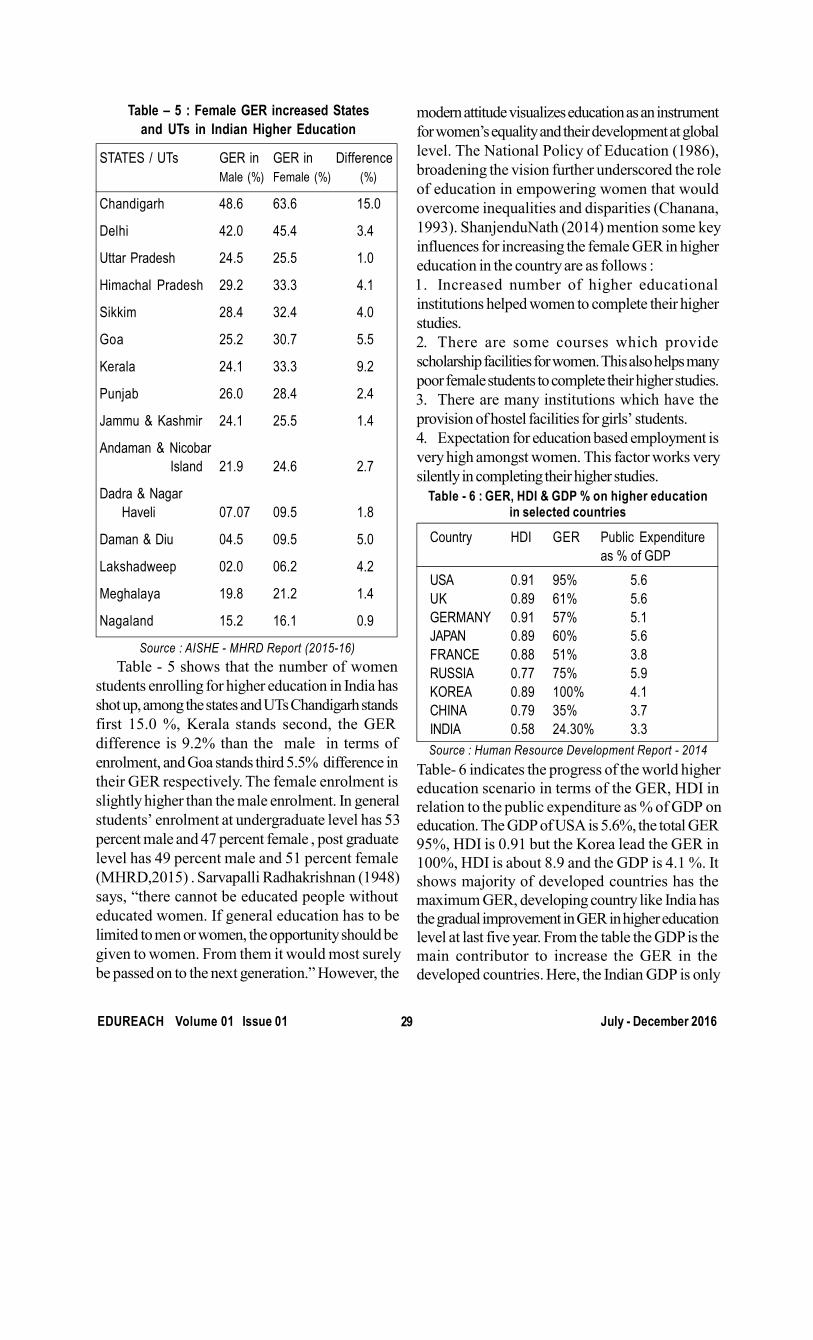
Table – 5 : Female GER increased Statesand UTs in Indian Higher Education
Source : AISHE - MHRD Report (2015-16)Table - 5 shows that the number of women
students enrolling for higher education in India has
shot up, among the states and UTs Chandigarh stands
first 15.0 %, Kerala stands second, the GER
difference is 9.2% than the male in terms of
enrolment, and Goa stands third 5.5% difference in
their GER respectively. The female enrolment is
slightly higher than the male enrolment. In general
students’ enrolment at undergraduate level has 53
percent male and 47 percent female , post graduate
level has 49 percent male and 51 percent female
(MHRD,2015) . Sarvapalli Radhakrishnan (1948)
says, “there cannot be educated people without
educated women. If general education has to be
limited to men or women, the opportunity should be
given to women. From them it would most surely
be passed on to the next generation.” However, the
modern attitude visualizes education as an instrument
for women’s equality and their development at global
level. The National Policy of Education (1986),
broadening the vision further underscored the role
of education in empowering women that would
overcome inequalities and disparities (Chanana,
1993). ShanjenduNath (2014) mention some key
influences for increasing the female GER in higher
education in the country are as follows :
Increased number of higher educational
institutions helped women to complete their higher
studies.
There are some courses which provide
scholarship facilities for women. This also helps many
poor female students to complete their higher studies.
There are many institutions which have the
provision of hostel facilities for girls’ students.
Expectation for education based employment is
very high amongst women. This factor works very
silently in completing their higher studies.
Table - 6 : GER, HDI & GDP % on higher educationin selected countries
Table- 6 indicates the progress of the world higher
education scenario in terms of the GER, HDI in
relation to the public expenditure as % of GDP on
education. The GDP of USA is 5.6%, the total GER
95%, HDI is 0.91 but the Korea lead the GER in
100%, HDI is about 8.9 and the GDP is 4.1 %. It
shows majority of developed countries has the
maximum GER, developing country like India has
the gradual improvement in GER in higher education
level at last five year. From the table the GDP is the
main contributor to increase the GER in the
developed countries. Here, the Indian GDP is only
STATES / UTs GER in GER in DifferenceMale (%) Female (%) (%)
Chandigarh 48.6 63.6 15.0
Delhi 42.0 45.4 3.4
Uttar Pradesh 24.5 25.5 1.0
Himachal Pradesh 29.2 33.3 4.1
Sikkim 28.4 32.4 4.0
Goa 25.2 30.7 5.5
Kerala 24.1 33.3 9.2
Punjab 26.0 28.4 2.4
Jammu & Kashmir 24.1 25.5 1.4
Andaman & Nicobar Island 21.9 24.6 2.7
Dadra & Nagar Haveli 07.07 09.5 1.8
Daman & Diu 04.5 09.5 5.0
Lakshadweep 02.0 06.2 4.2
Meghalaya 19.8 21.2 1.4
Nagaland 15.2 16.1 0.9
EDUREACH Volume 01 Issue 01 July - December 201629
Country HDI GER Public Expenditureas % of GDP
USA 0.91 95% 5.6UK 0.89 61% 5.6GERMANY 0.91 57% 5.1JAPAN 0.89 60% 5.6FRANCE 0.88 51% 3.8RUSSIA 0.77 75% 5.9KOREA 0.89 100% 4.1CHINA 0.79 35% 3.7INDIA 0.58 24.30% 3.3Source : Human Resource Development Report - 2014

3.3%, HDI is 0.58, the GER 23.6% respectively. If
we increase the GDP in higher education level, it
ensures the maximum GER to attain the global
average. HDI, GER and GDP have the close link
and play an important role in the development of
the any nation in the world.
Conclusion
The main objective of the higher education in
India is to increase the gross enrolment ratio in higher
education to 15 % by 2011-12 to 21% by 2016-
17 and 30 % by the year 2020 (MHRD,2014), the
current GER is 24.2 %.It will automatically increase
the number of students being enrolled in the education
arena. However, the female participation in higher
education also increased gradually. Abdul Kalam
vision of “India 2020” is to achieve the target of
India becoming a super country among the world.
Educated and skilled forces are only able to change
the present scenario. If all the enrolled youth are
turned into skilled forces in India, no doubt India
becomes a super country in the world. We can
challenge the world in terms of technological
advancement and enhance the socio-economic
status of the nation.
References
Agarwal, P.(2006). Higher Education in India: The
Need for Change. New Delhi: Indian Council for
Research on International Economic Relations.
AISHE (2014-15) Provisional Report, Ministry of
Human Resource Development, Department of
Higher Education, New Delhi, 2015.
AISHE (2015-16) Ministry of Human Resource
Development, Department of Higher Education,
New Delhi, 2016.
Chanana, K. (1993), ‘Accessing Higher Education
- The Dilemma of Schooling: Women, Minorities,
Scheduled Castes and Scheduled Tribes in
Contemporary India,’ Experience and Perspectives,
New Delhi: Sage, pp. 115-54.
Chauhan, S. (2010). Are we heading towards
World Class Universities?.University News, 48(28)
July 12-18, 2010.
Ernst & Young (2011), 40 million by 2020:
Preparing for a New Paradigm in Indian Higher
Education, EDGE report.
Ernst & Young (2012), Higher Education in India:
Twelfth Five Year Plan (2012-2017) and beyond.
MHRD Report, (2010).Department of Higher
Education.Government of India Strategic Plan for
the period (2010-11).
MHRD Report (2013) On Annual Status of
Higher Education in States and UTs in India-2013
from http://www.deloitte.com/.
ShanjenduNath(2014).Higher Education and
Women Participation in India.Journal of Business
Management & Social Sciences Research
(JBM&SSR) ISSN No: 2319-5614 Volume3,
No.2, February 2014.
SmritiIrani, (2015). BS Report on Gross
Enrolment Ratio in Higher Education Zooms, New
Delhi, December 22, 2015.www.business-
standard.com/article/current-affairs/gross-
enrolment-ratio-in-higher-education-zooms-
115122200006_1.html.
The Hindu Report (2013) Initiatives to increase
access to Higher Education pays dividend, The
Hindu Report, www.thehindu.com/,April-2013.
Tilak, J.B.,(2004), Public Subsidies in the
Education Sector in India, Economic and Political
Weekly (39), (4), (24-30) January.
University Education Commission (1948–1949)
Final Report, Government of India, Ministry of
Education, New Delhi.http://mhrd.gov.in/new-
initiatives-xi-plan.
UGC (2011)11th Five Year Plan Annual Report,
University Grants Commission, New Delhi.
UGC (2012-17) 12th Five Year Plan Report,
University Grants Commission, New Delhi.
http://shodhganga.inflibnet.ac.in:8080/jspui/
bitstream/10603/40610/9/12_chapter3.pdf
http://www.isca.in/IJSS/Archive/v2/i8/10.ISCA-
IRJSS-2013-104.pdf.
http://indianresearchjournals.com/pdf/IJSSIR/2012/
October/5.pdf.
http://www.iiste.org/Journals/index.php/JEP/article/
view File/15243/15609www.iiste.org.
http://timesofindia.indiatimes.com/home/education/
news/Enrolment-of-women-in-higher-education-
increases/articleshow/16244028.cm.
EDUREACH Volume 01 Issue 01 July - December 201630
Convocation Address delivered by
His Excellency Prof. S. Thangasamy,
Vice-Chancellor of Tamil Nadu Teachers Education University, Chennai during the
60th Convocation of V.O.Chidambaram College of Education, Thoothukudi
on 18.12.2016
Most revered President of the College,
Shri.A.P.C.V.Chockalingam! Secretary
A.P.C.V.Shanmugam! dedicated Committee
Members of the college including
Shri.A.P.C.V.Ganapathi !
Dear Principal who has been administering the
college effectively !
Beloved Professors !
The parents of the new graduates who have
come all the way from far off places to witness their
wards’ victory !
and
My dear new graduates !
Very good morning to you all !
Delivering convocation address in this
V.O.Chidambaram College of Education, gives me
immense pleasure in two different manner.
First of all, I have the chance to address in the
institution which still renders education only as the
service even in the present scenario of
commercialization of education. I was the ardent
admirer of Mr.M.G.R. during my young age for his
adventurous and chivalrous action. But the film
entitled ‘Kappalottia Thamizhan’ which is depicting
the life history of V.O.Chidambaram, turned me the
fan of Mr.Shivaji Ganesan. I am so happy to address
in the college which is named after such a legendary
V.O.Chidambaram.
Next reason is the Principal of the college,
Dr.V.Thamodharan whom I met three decade ago
with handsome outlook and skillful teaching. Thus,
it makes me doubly happy to address in the college
which is headed by such a wonderful friend of mine.
My first and foremost wishes for the new
teaching graduates is that you should come out both
from your classroom and in the life with flying
colours. Success would definitely knock at your
door if you forget the past defeats and start utilizing
the present opportunities.
I would like to share the findings of the
research done in the Centre for Research in
Education at Madurai Kamaraj University, when I
was the director there. We interviewed 31 district
collectors and asked them if they were the first rank
holders during their study periods. All of them said,
‘no’. Their academic positions were asked during
these days then. They revealed that they were above
average in all the curricular and co-curricular
activities. I hope that you are also sailing in the same
boat. So you will also over come one day.
How? I will give the suggestions for this
question also based on the research findings done
by us in the Madurai Kamaraj University. We
undertook a study with 100 people who have
become millionaires within 25 years. They were
hailing from the families which could not even
provide them basic necessities. Four important
reasons told by them for becoming millionaires are
also to be known by you and to be practised by
you.
1. The urge to become millionaire was always
burning with them.
2. Continuous defeat and humiliation made them
stronger and add fire to their furies.
3. ‘Early to raise’ is an important secret behind
their success. They raised the sun instead of
being raised by it. They understood the fact
that no birds would continue sleeping after the
dawn of the day.
4. Timely help and assistance rendered by people
and friends in and around them. It is to be noted
EDUREACH Volume 01 Issue 01 July - December 201631
here that, even our Thiruvalluvar allocated 50
couplets for ‘friendship’ whereas only 10 couplets
were written even for invocation.
I wish you to become the great teachers by
imbibing these four mantras in your life. You should
be pointed by your students when asked for their
best friend, because the teacher is the half-mother,
half-father and half-God. ‘Teacher’ should be the
only word that has to wake up every body from
their slumbers. The day should come when the sick-
children of yours should be taken to you, teachers,
for treatment instead of doctors.
Another important message I want to tell is
that,
Don’t be so sour. Others will omit you.
Don’t be so sweet. Others ill swallow you.
This is the slogam I came across in the auto.
This disturbed me a lot. At once, forgetting my
position as Vice-Cahncellor, I got down from my
car and travelled a while with that auto-man. The
reason behind sharing this experience is that you
should accept knowledge and wisdom wherever it
comes from. Develop the habit of reading the words
and deeds of the great people like Vivekananda and
Abraham Lincoln.
The revelation and realization may come from
anywhere for the human mind. Once Mahatma
Gandhi travelled from Bombay. In river Godhavari,
he happened to see a woman wearing half-saree in
her body and half tied with the nearby tree. He
asked for the reason to his secretary. He told that
adjusting with mono-dress was the position of the
majority of Indian women. This awakened Gandhiji
and made him follow the principle of half-nakedness.
So my dear young graduates Travel more ! Learn
More !
Reading, listening and travelling will widen our
knowledge. The experiences gained by these
gestures should be chewed by you all. Internal
learning and external reading are the both sides of
the success.
I would like to share the findings of another
research done by us in the Madurai Kamaraj
University. When primary school children were
asked whether they liked to go to school every day,
the answer was negative. The reason expressed by
them was that education was thrust upon them. Such
type of answers should not come from your students.
If your students feel sorry and search for you here
and there, when you take leave, it goes without
saying that you have become a good teacher.
The degree you will receive is not a mere paper
signed by three mortals namely the Vice-Chancellor,
the Registrar and the Controller of Examination. This
is the symbol of the realization of the following three
important dreams.
1. Your dream of becoming a graduate. It is jubilant
in nature.
2. Your parents’ painful and hard-working dream
of making you graduates. The charming –
tears shed by them after seeing your degree would
definitely wipe away the sufferings and hardships
encountered by them to make you graduates.
3. The third one is the dream of the society. This
will lift this universe a better position.
I offer my felicitation for cherishing these dreams
and pray the God almighty to shower all His blessings
in all your endeavors.
Considering all these two hundred teacher-
graduates as the miracles of the world, I wish you
all the best on behalf of the Tamil Nadu Teachers
Education University.
Before I conclude, I take this opportunity to
congratulate the pain-ful efforts taken by the parents
and the teachers to make this day possible.
Thank you.
EDUREACH Volume 01 Issue 01 July - December 201632
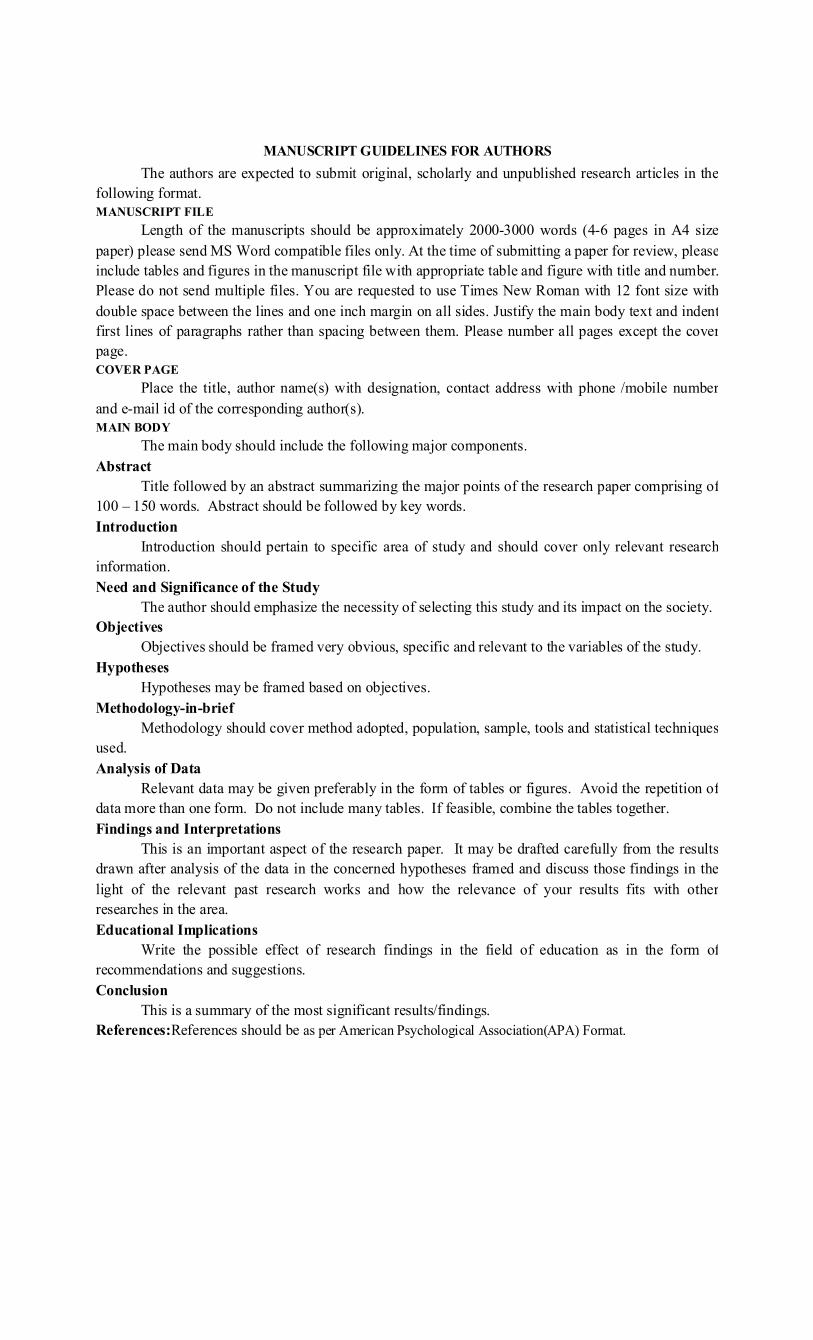
MANUSCRIPT GUIDELINES FOR AUTHORS
The authors are expected to submit original, scholarly and unpublished research articles in the
following format.
MANUSCRIPT FILE
Length of the manuscripts should be approximately 2000-3000 words (4-6 pages in A4 size
paper) please send MS Word compatible files only. At the time of submitting a paper for review, please
include tables and figures in the manuscript file with appropriate table and figure with title and number.
Please do not send multiple files. You are requested to use Times New Roman with 12 font size with
double space between the lines and one inch margin on all sides. Justify the main body text and indent
first lines of paragraphs rather than spacing between them. Please number all pages except the cover
page.
COVER PAGE
Place the title, author name(s) with designation, contact address with phone /mobile number
and e-mail id of the corresponding author(s).
MAIN BODY
The main body should include the following major components.
Abstract
Title followed by an abstract summarizing the major points of the research paper comprising of
100 – 150 words. Abstract should be followed by key words.
Introduction
Introduction should pertain to specific area of study and should cover only relevant research
information.
Need and Significance of the Study
The author should emphasize the necessity of selecting this study and its impact on the society.
Objectives
Objectives should be framed very obvious, specific and relevant to the variables of the study.
Hypotheses
Hypotheses may be framed based on objectives.
Methodology-in-brief
Methodology should cover method adopted, population, sample, tools and statistical techniques
used.
Analysis of Data
Relevant data may be given preferably in the form of tables or figures. Avoid the repetition of
data more than one form. Do not include many tables. If feasible, combine the tables together.
Findings and Interpretations
This is an important aspect of the research paper. It may be drafted carefully from the results
drawn after analysis of the data in the concerned hypotheses framed and discuss those findings in the
light of the relevant past research works and how the relevance of your results fits with other
researches in the area.
Educational Implications
Write the possible effect of research findings in the field of education as in the form of
recommendations and suggestions.
Conclusion
This is a summary of the most significant results/findings.
References:References should be as per American Psychological Association(APA) Format.


![Untitled - Physics Purdue [Edu]](https://static.fdokumen.com/doc/165x107/6329787bbfbc0e632409212c/untitled-physics-purdue-edu.jpg)