
EDU-Q Card - Edukans
10
-
Upload
khangminh22 -
Category
Documents
-
view
2 -
download
0
Transcript of EDU-Q Card - Edukans
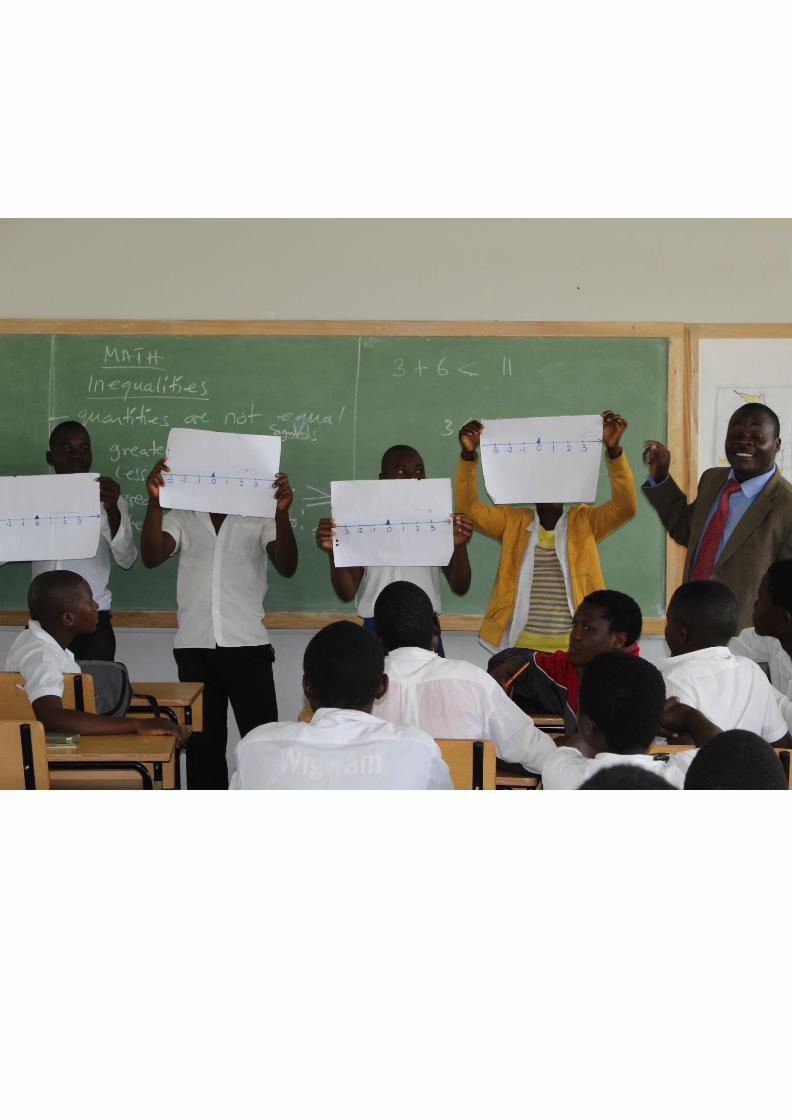
“Education is not a privilege. It is a human right”
This frequently used phrase addresses the equal access to education. Since the adoption of the Universal Declaration on Human Rights in
1948, equal access to education as well as the positive impacts of it have been widely recognized. A considerable amount of literature
suggests that schooling improves the society by promoting it in various aspects such as health and nutrition, the productive capacity, the
value of the labor force, and equality (e.g., Lockheed & Verspoor, 1994; Boissiere, Knight, & Sabot, 1985). Having no access to schooling causes
the loss of the developmental opportunities provided by primary and secondary education. However, until a couple of decades ago, the focus
on providing access to education for all children had downsized the attention on the quality of education. Learning is not only dependent on
the school attendance. Children’s ability to translate education into personal, social, or developmental benefits depends on whether real
learning occurs. Therefore, the quality of the available education is a determinative factor in the learning process and hence maintaining a
particular standard of education is essential. EDUstars Quality Card (EDU-Q Card) is developed to assess education quality in primary and
secondary schools. The instrument aims to allow school agents and inspectors to simply monitor the education quality in schools and act
for improvements of the issues that require attention. The purpose of this article is to describe the development, testing, and validation of
the instrument.
Two important questions arise from the shifting focus on the education quality: ‘What is quality in education?” and “How do we measure it?”.
Throughout the history of education studies, different scholars have given various definitions to ‘quality’ (see Jain & Prasad, 2017 or Leu &
Prince-Rom, 2006). Terms like effectiveness and efficiency have often been used interchangeably (Adams, 1993). UNESCO points out concepts
of ‘lifelong learning’ and ‘relevance’ in its definition of quality in education (International Commission on Education for the Twenty-first
Century, 1996). Similarly, in the EFA Global Monitoring Report, assuring a constant increase in students’ cognitive development was
emphasized when defining the quality (UNESCO, 2004). On the other hand, UNICEF refers to five desirable dimensions of quality in its Dakar
Framework: learners, environment, content, processes, and outcomes (UNICEF, 2000). It is possible to observe some co-existing concepts in
different definitions of quality throughout the literature, such as multidimensionality (Adams, 1993). Nonetheless, while all these definitions
give great insight in the meaning of quality education, there is no universally accepted definition yet.
The fluid nature of education quality has led to the development of a range of quality assessments. Nowadays, countries increasingly apply
various methods of teacher appraisals, student assessments, school evaluations, and education system evaluations (OECD, 2013a ). Greater
knowledge enhances the school autonomy and management capacity only if the assessment provi des meaningful feedback. Nonetheless,
existing tools are often very complex, expensive, and not yet useful. Therefore, the stakeholders (managers, teachers, learne rs, and
community) face difficulties implementing quality evaluations and translating the outcomes into an effective improvement (OECD, 2013b).
Poor quality evaluations may result in a lack of meaningful insights and detection of undesirable consequences. As Schwab (1980) highlights,
behavioral assessments are often used before having their reliability and validity tested. Using instruments which do not adequately assess
the domain of interest leads not only the tremendous time and resource loss, but also to deficient policy designs. The absence of a
comprehensive and efficient school quality assessment tool leaves school agents with little capacity to translate evaluation results to
improvements. Thus, development of a valid and reliable instrument is a necessary first step.
The need for a simple and psychometrically sound instrument to assess the education quality is now well recognized. To address this issue,
Edukans, an international non-profit organization (NGO) with headquarters in the Netherlands, took the first step to develop an instrument
assessing education quality. EDU-Q Card is a newly developed school-based instrument built upon the main principles of EDUstars model
which will be discussed in the following section. This article provides a comprehensive evaluation of the development of the instrument and
discusses further research directions. We thank Sila Ünal for her great work in carrying out this research in late 2018. Our aim is to
contribute to the knowledge of education quality measurement tools and to provide recommendations that can be directly applicable
for the development of the Edu-Q-Card and in the international context of education development.
WWW.EDUKANS.ORG
EDUstars Model
1. Learning Environment
The relationship between learning environment and
learning behavior, has been widely issued in the
education literature (see Weinstein, 1981; Fisher, 2016
or Creemers and Reezigt, 1999). In different ways, a
positive learning environment is recognized as a key
condition for learning. There is evidence that school
environment has a direct influence on children’s general
health and learning capacity (Wargo, 2004). Sousa and
Tomlinson (2011) and Ginnis (2011) stress the
importance of a safe learning environment. Both sources
refer to recent findings on physical and bio-chemical
dimensions of the functioning of the human brain.
Whereas negative and unsafe environments raise anxiety
levels within learners and effectively block cognitive
processes essential for learning, rich,
attractive and stimulating learning environments have direct
positive effects on these processes. The social and emotional
climate of a school is a key non-physical element of the learning
environment. It has a considerable influence on school
attendance, engagement in school activities, academic
achievement, students’ relationship with each other, teachers,
and other school personnel. Social-emotional school climate
refers to spheres of school life reflecting patterns of people’s
experiences in a school environment including norms, goals,
interpersonal relationships, and how “connected” or attached
individuals feel with one another (Cohen, McCabe, Michelli, &
Pickeral, 2009). Overall, positive school environment promotes
meaningful learning (Cohen et al., 2009) and therefore is
crucial for quality education.
2. Learning
The second pillar addresses the learning process. Edukans promotes an Active Learning (AL) pedagogy, rooted in a social
constructivist theory of learning. The founding fathers of this theory are Dewey, Vigotsky and Piaget. AL has been the focus of
many pedagogical change programmes world-wide. It has received considerable attention in recent decades in national
programmes aimed to improve the quality of teaching and learning by changing the classroom practice from more teacher-
centered to more student-centered. It is also referred to as learner centered education, child centered pedagogy or
competency based education. The approaches lay different accents but share the perspectives on learning and learners that
are listed below (Perkins, 1999; Philips, 1995, 1998; Good & Brophy, 2003; Schweisfurth, 2011 and 2013).
- Learning is connected to real life; by engaging in all sorts of real-life activities, students learn to develop relevant skills for
the future (jobs) and learn how to make a meaningful contribution to society.
- Learners carry out a variety of active learning behaviour: reading, writing, making exercises, discussing, debating,
experimenting, testing hypotheses, etc.
- Learning is a creative process; in order to construct their own meaning, learners must manipulate, discover, construct and
reconstructed knowledge; this is mediated through meaningful, authentic tasks.
- Learners are social and interactive. Students work and learn together and in dialogue with their teacher. Knowledge and
understanding are constructed socially.
- Learners build concepts by relating new experiences to previous understanding.
- Learning is aimed to develop higher levels of thinking and reasoning.
Many, if not all of these elements are directly correlated with successful learning outcomes for learners (Hattie, 2008; Antoniou
& Kyriakides, 2011). Edukans’ programmes are designed to support teachers to develop this in practice.
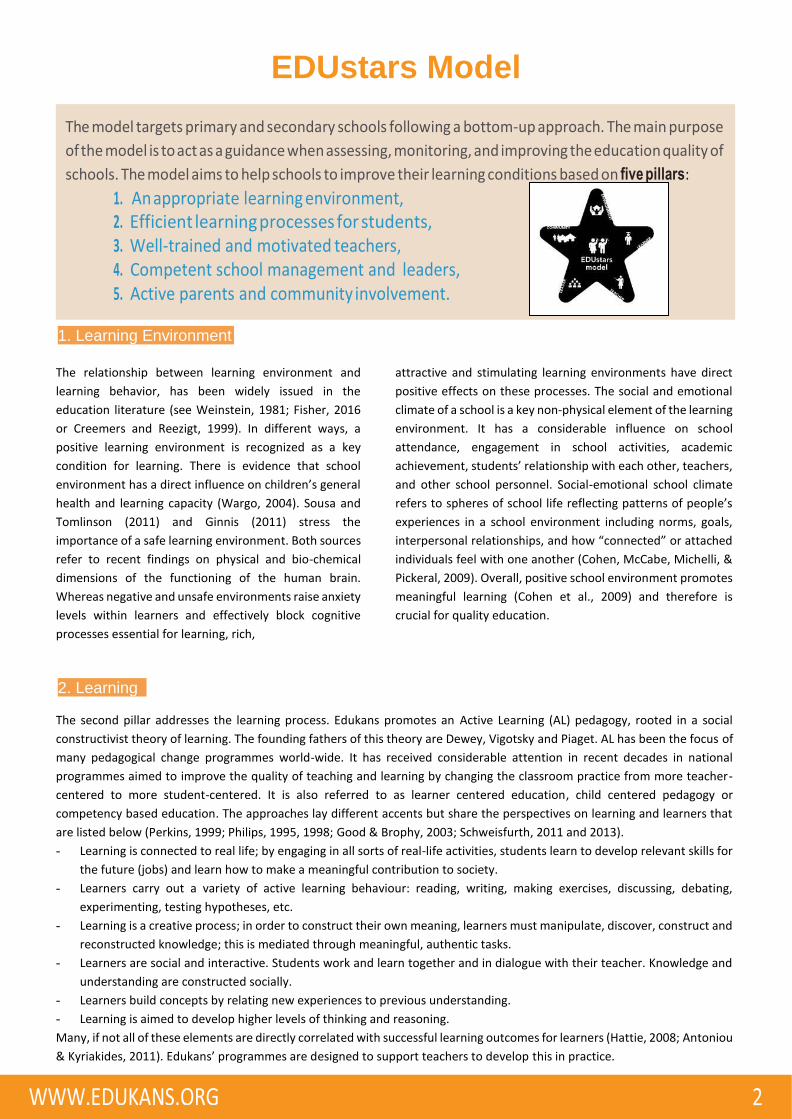
The model targets primary and secondary schools following a bottom-up approach. The main purpose
of the model is to act as a guidance when assessing, monitoring, and improving the education quality of
schools. The model aims to help schools to improve their learning conditions based on five pillars:
1. An appropriate learning environment, 2. Efficient learning processes for students, 3. Well-trained and motivated teachers, 4. Competent school management and leaders, 5. Active parents and community involvement.
3. Teaching
The third pillar (teaching) is highly connected with the
second (learning) pillar as they both reflect the teacher-
student relationship and day-to-day learning. Teachers
are the lead actors in the learning process. Strong
evidence from research suggests that highly dedicated
and motivated teachers are key for the success of their
students (Guajardo, 2011). In AL-practices teachers carry
out their role differently than in traditional classroom
teaching. They prepare meaningful and relevant
learning experiences for their students instead of acting
as all-knowing lecturers. They demonstrate skills that
are essential to guide their students in accordance to the
active and social nature of learning as illustrated above.
They also help their learners to become confident
learners and develop strategies to enable learning with
more independence from the teacher (Chrisholm &
Leyendecker, 2008). The elements in this area include
targeted design and planning of active learning methods
throughout the lesson following clear objectives. Among
other elements are effective interactive techniques for
interactive instruction, techniques to apply in concept
building, questioning and answering techniques,
classroom management and organization of cooperative
learning.
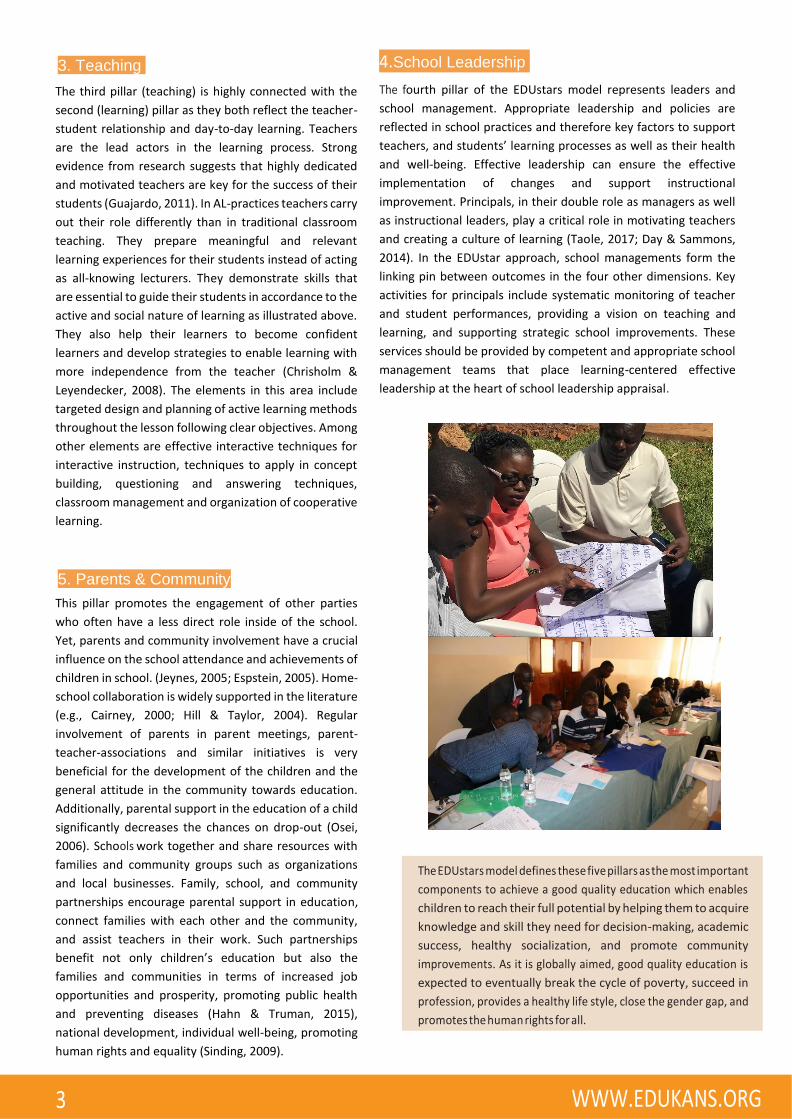
4.School Leadership
The fourth pillar of the EDUstars model represents leaders and
school management. Appropriate leadership and policies are
reflected in school practices and therefore key factors to support
teachers, and students’ learning processes as well as their health
and well-being. Effective leadership can ensure the effective
implementation of changes and support instructional
improvement. Principals, in their double role as managers as well
as instructional leaders, play a critical role in motivating teachers
and creating a culture of learning (Taole, 2017; Day & Sammons,
2014). In the EDUstar approach, school managements form the
linking pin between outcomes in the four other dimensions. Key
activities for principals include systematic monitoring of teacher
and student performances, providing a vision on teaching and
learning, and supporting strategic school improvements. These
services should be provided by competent and appropriate school
management teams that place learning-centered effective
leadership at the heart of school leadership appraisal.
5. Parents & Community
This pillar promotes the engagement of other parties
who often have a less direct role inside of the school.
Yet, parents and community involvement have a crucial
influence on the school attendance and achievements of
children in school. (Jeynes, 2005; Espstein, 2005). Home-
school collaboration is widely supported in the literature
(e.g., Cairney, 2000; Hill & Taylor, 2004). Regular
involvement of parents in parent meetings, parent-
teacher-associations and similar initiatives is very
beneficial for the development of the children and the
general attitude in the community towards education.
Additionally, parental support in the education of a child
significantly decreases the chances on drop-out (Osei,
2006). Schools work together and share resources with
families and community groups such as organizations
and local businesses. Family, school, and community
partnerships encourage parental support in education,
connect families with each other and the community,
and assist teachers in their work. Such partnerships
benefit not only children’s education but also the
families and communities in terms of increased job
opportunities and prosperity, promoting public health
and preventing diseases (Hahn & Truman, 2015),
national development, individual well-being, promoting
human rights and equality (Sinding, 2009).
The EDUstars model defines these five pillars as the most important
components to achieve a good quality education which enables
children to reach their full potential by helping them to acquire
knowledge and skill they need for decision-making, academic
success, healthy socialization, and promote community
improvements. As it is globally aimed, good quality education is
expected to eventually break the cycle of poverty, succeed in
profession, provides a healthy life style, close the gender gap, and
promotes the human rights for all.
WWW.EDUKANS.ORG
EDU-Q Card EDU-Q Card is developed to assess the quality of education based on the pillars of the EDUstars model. Therefore, the assessment consists
of five subscales representing the five pillars of the model: (1) learning environment; (2) learning; (3) teaching; (4) school management; and
(5) parents and community. Each subscale includes items assessing different aspects of the concerned domain. The instrument aims to
encourage school agents to formulate a school improvement plan. These plans should be based on a combination of the outcomes of the
instrument and schools’ priorities and local resources. The main purpose of the instrument is to grant a dialogue between school employee
and outside experts, and in turn, bolster a continuous effort for quality improvements.
EDU-Q Card represents a self-sustainable
quality improvement model that can be
reapplied numerous times until a school
reaches to a desired level of quality.
EDU-Q Card is designed in a way to enable
regular implementation of the tool which
will assist school agents in the processes
of monitoring and progressing education
quality. The instrument itself is a source
of learning as it acts as a guideline for
better quality education.
EDU-Q Card is designed to obtain practical and easily interpreted outcomes. EDU-Q Card is accessible online. The data is collected via
AkvoFlow which is an online platform to collect data and generate reports. AkvoFlow presents the instrument as an application for smart-
phones and tablets. The web-enhanced electronic data collection provides an easy access from all over the world and avoids the
disadvantages of traditional paper-based evaluations such as potential mistakes when transmitting the data in a digital environment.
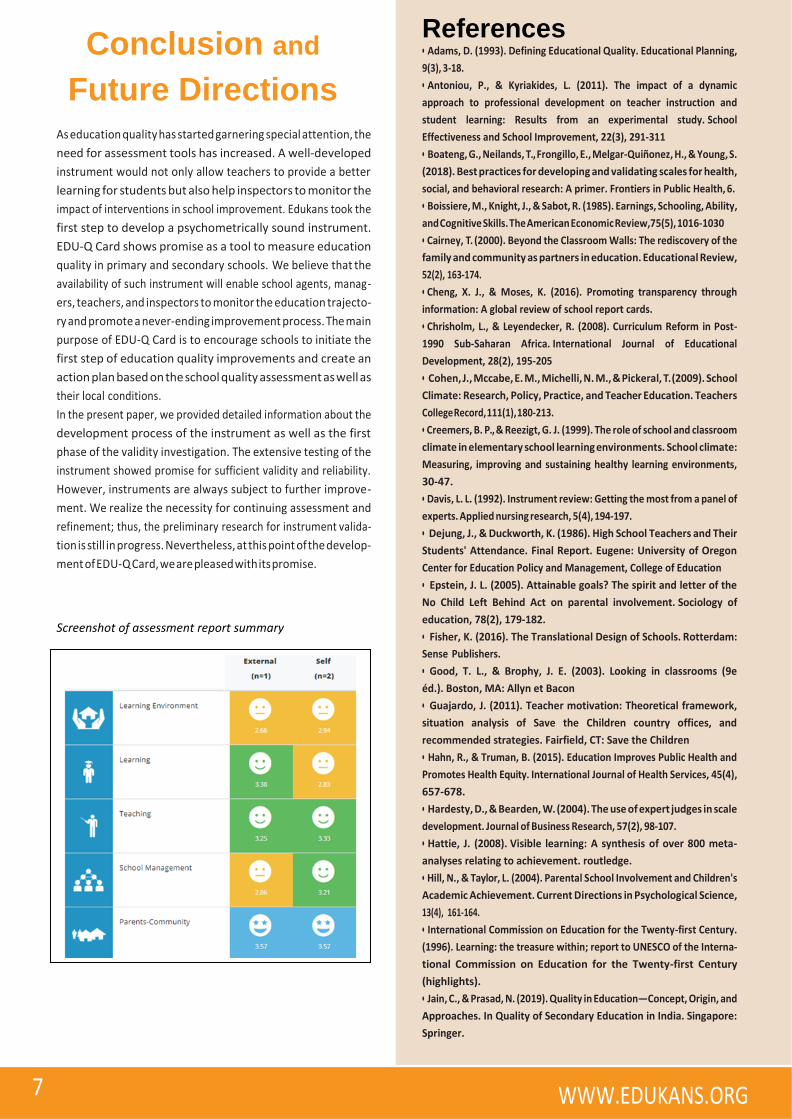
One major purpose of the EDU-Q card is to promote spot-on detection of the problems that require immediate attention. Therefore, some
additional features are added to the interface. Firstly, the instrument generates immediate reports. Unlike most of other quality cards,
EDU-Q Card allows schools to get an instant feedback for self-monitoring. School agents are able to see the issues emanating from the
analysis right after the application of the instrument and take action if necessary. Furthermore, to simplify the interpretation of the reports
for school agents, the results are presented using different colors and emoticons in addition to the actual numbers. In this way, the results
facilitate the detection of the issues that require intervention without being lost in numbers. Finally, applicants can always re-code the
items as they overcome the inadequacies and immediately see what is the next step in the school improvement plan.
This school-based quality assessment tool is designed to engage all stakeholders. It is easy to use, not only by outside experts, but also
by school managers and teachers. Deliberately, by direct reporting, a comparison is made between the results of ‘outside’ or ex pert-
evaluation and the results of self-evaluation (the report is downloaded and discussed on the spot). It is well established that internal
evaluations may lead to distorted results (Rothermund, Bak & Brandtstädter, 2005), but it is precisely the dialogue on the different
ratings that gives meaning to the assessment exercise and the points of improvements convened. This dialogue plays a key role in
triggering and feeding a process for continuous learning and improving. In a comparative study by UNESCO, School Report Cards
(SRC’s) are evaluated in three main domains: (1) market-oriented SRC’s, (2) formal sanction or rewards SRC’s and (3) public
participation SRC’s. The EDU-Q Card is positioned in the third domain (Cheng & Moses, 2016). Edukans believes that this approach
will be a positive step in the quality assessments as it not only prevents the potential self-evaluation errors but also promotes school
employees to actively engage in dialogue with external experts and others in the education community to plan for and carry out
sustainable school improvements.
Edukans has undertaken numerous visits to primary and secondary schools
around the world (e.g.: Uganda, Peru, India) in the process of developing and
assessing the feasibility of the instrument. During these visits, we learned
about the difficulties and obstacles school inspectors and education policy
makers encounter. Existing tools often are often complex to use, fail to
provide meaningful feedback to schools and leave the assessors and school
staff with no capacity to put the process of evaluation and school
improvement into practice. This hinders the design of and follow-up on
efficient interventions. In the light of such experiences from all around
the world, accessibility and simplicity were identified as two important
factors directly affecting the continuity of the application as well as the
efficiency of such instruments.
WWW.EDUKANS.ORG
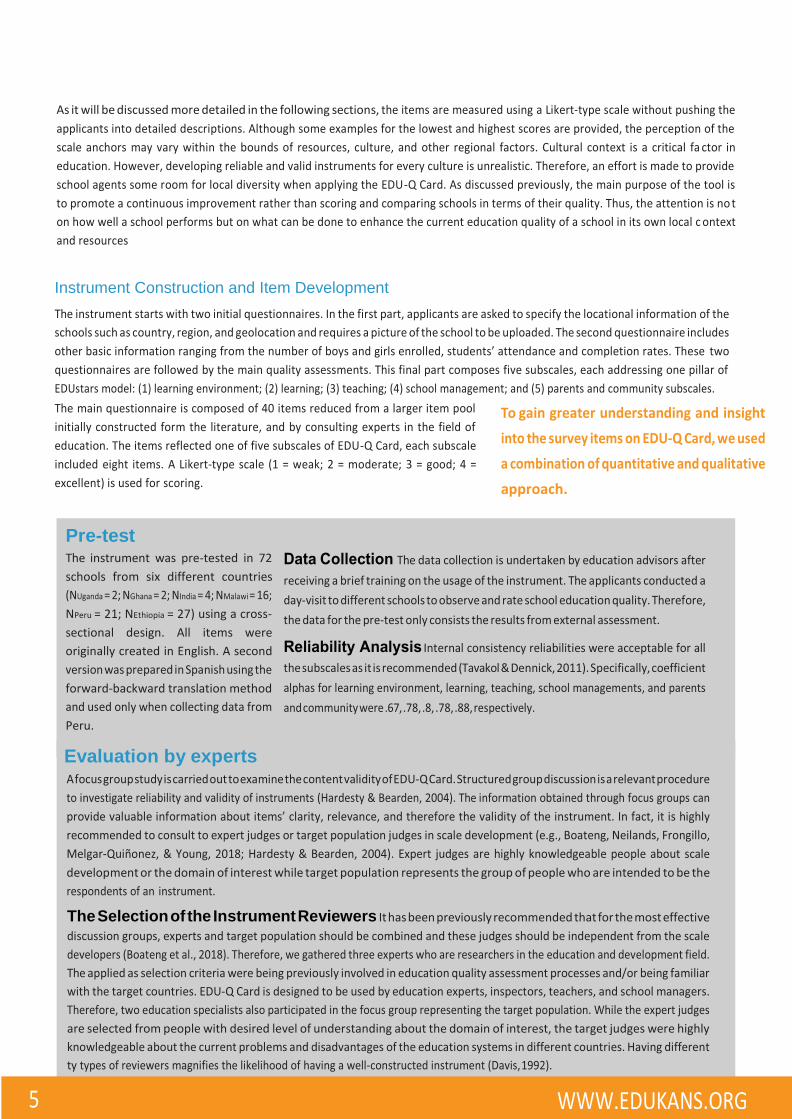
As it will be discussed more detailed in the following sections, the items are measured using a Likert-type scale without pushing the
applicants into detailed descriptions. Although some examples for the lowest and highest scores are provided, the perception of the
scale anchors may vary within the bounds of resources, culture, and other regional factors. Cultural context is a critical fa ctor in
education. However, developing reliable and valid instruments for every culture is unrealistic. Therefore, an effort is made to provide
school agents some room for local diversity when applying the EDU-Q Card. As discussed previously, the main purpose of the tool is
to promote a continuous improvement rather than scoring and comparing schools in terms of their quality. Thus, the attention is no t
on how well a school performs but on what can be done to enhance the current education quality of a school in its own local c ontext
and resources
Instrument Construction and Item Development
The instrument starts with two initial questionnaires. In the first part, applicants are asked to specify the locational information of the
schools such as country, region, and geolocation and requires a picture of the school to be uploaded. The second questionnaire includes
other basic information ranging from the number of boys and girls enrolled, students’ attendance and completion rates. These two
questionnaires are followed by the main quality assessments. This final part composes five subscales, each addressing one pillar of
EDUstars model: (1) learning environment; (2) learning; (3) teaching; (4) school management; and (5) parents and community subscales.
The main questionnaire is composed of 40 items reduced from a larger item pool
initially constructed form the literature, and by consulting experts in the field of
education. The items reflected one of five subscales of EDU-Q Card, each subscale
included eight items. A Likert-type scale (1 = weak; 2 = moderate; 3 = good; 4 =
excellent) is used for scoring.
To gain greater understanding and insight
into the survey items on EDU-Q Card, we used
a combination of quantitative and qualitative
approach.
Pre-test The instrument was pre-tested in 72
schools from six different countries
NPeru = 21; NEthiopia = 27) using a cross-
sectional design. All items were
originally created in English. A second
forward-backward translation method
Peru.
Evaluation by experts
development or the domain of interest while target population represents the group of people who are intended to be the
The Selection of the Instrument Reviewers It has been previously recommended that for the most effective
are selected from people with desired level of understanding about the domain of interest, the target judges were highly
5 WWW.EDUKANS.ORG
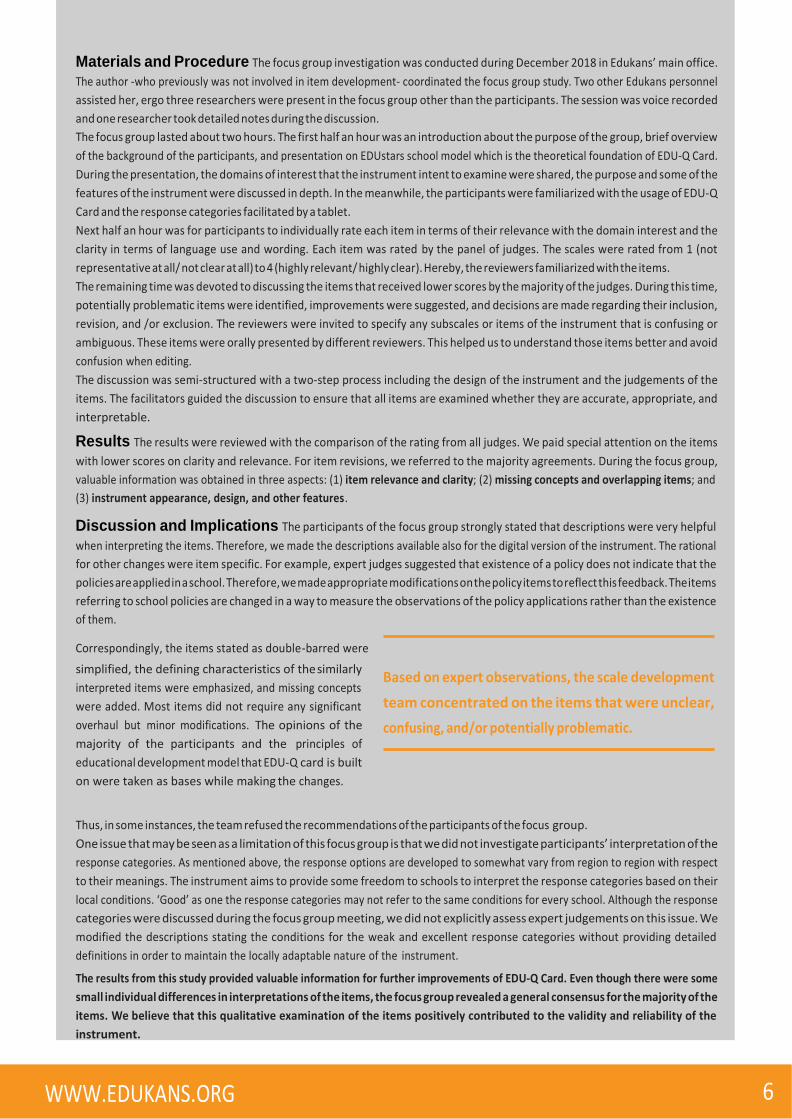
Materials and Procedure The focus group investigation was conducted during December 2018 in Edukans’ main office.
The author -who previously was not involved in item development- coordinated the focus group study. Two other Edukans personnel
assisted her, ergo three researchers were present in the focus group other than the participants. The session was voice recorded
and one researcher took detailed notes during the discussion.
The focus group lasted about two hours. The first half an hour was an introduction about the purpose of the group, brief overview
of the background of the participants, and presentation on EDUstars school model which is the theoretical foundation of EDU-Q Card.
During the presentation, the domains of interest that the instrument intent to examine were shared, the purpose and some of the
features of the instrument were discussed in depth. In the meanwhile, the participants were familiarized with the usage of EDU-Q
Card and the response categories facilitated by a tablet.
Next half an hour was for participants to individually rate each item in terms of their relevance with the domain interest and the
clarity in terms of language use and wording. Each item was rated by the panel of judges. The scales were rated from 1 (not
representative at all/ not clear at all) to 4 (highly relevant/ highly clear). Hereby, the reviewers familiarized with the items.
The remaining time was devoted to discussing the items that received lower scores by the majority of the judges. During this time,
potentially problematic items were identified, improvements were suggested, and decisions are made regarding their inclusion,
revision, and /or exclusion. The reviewers were invited to specify any subscales or items of the instrument that is confusing or
ambiguous. These items were orally presented by different reviewers. This helped us to understand those items better and avoid
confusion when editing.
The discussion was semi-structured with a two-step process including the design of the instrument and the judgements of the
items. The facilitators guided the discussion to ensure that all items are examined whether they are accurate, appropriate, and
interpretable.
Results The results were reviewed with the comparison of the rating from all judges. We paid special attention on the items
with lower scores on clarity and relevance. For item revisions, we referred to the majority agreements. During the focus group,
valuable information was obtained in three aspects: (1) item relevance and clarity; (2) missing concepts and overlapping items; and
(3) instrument appearance, design, and other features.
Discussion and Implications The participants of the focus group strongly stated that descriptions were very helpful
when interpreting the items. Therefore, we made the descriptions available also for the digital version of the instrument. The rational
for other changes were item specific. For example, expert judges suggested that existence of a policy does not indicate that the
policies are applied in a school. Therefore, we made appropriate modifications on the policy items to reflect this feedback. The items
referring to school policies are changed in a way to measure the observations of the policy applications rather than the existence
of them.
Correspondingly, the items stated as double-barred were
simplified, the defining characteristics of the similarly
interpreted items were emphasized, and missing concepts
were added. Most items did not require any significant
overhaul but minor modifications. The opinions of the
majority of the participants and the principles of
educational development model that EDU-Q card is built
on were taken as bases while making the changes.
Based on expert observations, the scale development
team concentrated on the items that were unclear,
confusing, and/or potentially problematic.
Thus, in some instances, the team refused the recommendations of the participants of the focus group.
One issue that may be seen as a limitation of this focus group is that we did not investigate participants’ interpretation of the
response categories. As mentioned above, the response options are developed to somewhat vary from region to region with respect
to their meanings. The instrument aims to provide some freedom to schools to interpret the response categories based on their
local conditions. ‘Good’ as one the response categories may not refer to the same conditions for every school. Although the response
categories were discussed during the focus group meeting, we did not explicitly assess expert judgements on this issue. We
modified the descriptions stating the conditions for the weak and excellent response categories without providing detailed
definitions in order to maintain the locally adaptable nature of the instrument.
The results from this study provided valuable information for further improvements of EDU-Q Card. Even though there were some
small individual differences in interpretations of the items, the focus group revealed a general consensus for the majority of the
items. We believe that this qualitative examination of the items positively contributed to the validity and reliability of the
instrument.
WWW.EDUKANS.ORG
Conclusion and
Future Directions As education quality has started garnering special attention, the
need for assessment tools has increased. A well-developed
instrument would not only allow teachers to provide a better
learning for students but also help inspectors to monitor the
impact of interventions in school improvement. Edukans took the
first step to develop a psychometrically sound instrument.
EDU-Q Card shows promise as a tool to measure education
quality in primary and secondary schools. We believe that the
availability of such instrument will enable school agents, manag-
ers, teachers, and inspectors to monitor the education trajecto-
ry and promote a never-ending improvement process. The main
purpose of EDU-Q Card is to encourage schools to initiate the
first step of education quality improvements and create an
action plan based on the school quality assessment as well as
their local conditions.
In the present paper, we provided detailed information about the
development process of the instrument as well as the first
phase of the validity investigation. The extensive testing of the
instrument showed promise for sufficient validity and reliability.
However, instruments are always subject to further improve-
ment. We realize the necessity for continuing assessment and
refinement; thus, the preliminary research for instrument valida-
tion is still in progress. Nevertheless, at this point of the develop-
ment of EDU-Q Card, we are pleased with its promise.
Screenshot of assessment report summary
References • Adams, D. (1993). Defining Educational Quality. Educational Planning,
9(3), 3-18.
• Antoniou, P., & Kyriakides, L. (2011). The impact of a dynamic
approach to professional development on teacher instruction and
student learning: Results from an experimental study. School
Effectiveness and School Improvement, 22(3), 291-311
• Boateng, G., Neilands, T., Frongillo, E., Melgar-Quiñonez, H., & Young, S.
(2018). Best practices for developing and validating scales for health,
social, and behavioral research: A primer. Frontiers in Public Health, 6.
• Boissiere, M., Knight, J., & Sabot, R. (1985). Earnings, Schooling, Ability,
and Cognitive Skills. The American Economic Review,75(5), 1016-1030
• Cairney, T. (2000). Beyond the Classroom Walls: The rediscovery of the
family and community as partners in education. Educational Review,
52(2), 163-174.
• Cheng, X. J., & Moses, K. (2016). Promoting transparency through
information: A global review of school report cards.
• Chrisholm, L., & Leyendecker, R. (2008). Curriculum Reform in Post-
1990 Sub-Saharan Africa. International Journal of Educational
Development, 28(2), 195-205
• Cohen, J., Mccabe, E. M., Michelli, N. M., & Pickeral, T. (2009). School
Climate: Research, Policy, Practice, and Teacher Education. Teachers
College Record, 111(1), 180-213.
• Creemers, B. P., & Reezigt, G. J. (1999). The role of school and classroom
climate in elementary school learning environments. School climate:
Measuring, improving and sustaining healthy learning environments,
30-47.
• Davis, L. L. (1992). Instrument review: Getting the most from a panel of
experts. Applied nursing research, 5(4), 194-197.
• Dejung, J., & Duckworth, K. (1986). High School Teachers and Their
Students' Attendance. Final Report. Eugene: University of Oregon
Center for Education Policy and Management, College of Education
• Epstein, J. L. (2005). Attainable goals? The spirit and letter of the
No Child Left Behind Act on parental involvement. Sociology of
education, 78(2), 179-182.
• Fisher, K. (2016). The Translational Design of Schools. Rotterdam:
Sense Publishers.
• Good, T. L., & Brophy, J. E. (2003). Looking in classrooms (9e
éd.). Boston, MA: Allyn et Bacon
• Guajardo, J. (2011). Teacher motivation: Theoretical framework,
situation analysis of Save the Children country offices, and
recommended strategies. Fairfield, CT: Save the Children
• Hahn, R., & Truman, B. (2015). Education Improves Public Health and
Promotes Health Equity. International Journal of Health Services, 45(4),
657-678.
• Hardesty, D., & Bearden, W. (2004). The use of expert judges in scale
development. Journal of Business Research, 57(2), 98-107.
• Hattie, J. (2008). Visible learning: A synthesis of over 800 meta-
analyses relating to achievement. routledge.
• Hill, N., & Taylor, L. (2004). Parental School Involvement and Children's
Academic Achievement. Current Directions in Psychological Science,
13(4), 161-164.
• International Commission on Education for the Twenty-first Century.
(1996). Learning: the treasure within; report to UNESCO of the Interna-
tional Commission on Education for the Twenty-first Century
(highlights).
• Jain, C., & Prasad, N. (2019). Quality in Education—Concept, Origin, and
Approaches. In Quality of Secondary Education in India. Singapore:
Springer.
7
WWW.EDUKANS.ORG
• Jeynes, W. (2005). A Meta-Analysis of the Relation of Parental
Involve- ment to Urban Elementary School Student Academic
Achievement. Urban Education, 40(3), 237-269
• Leu, E., & Price-Rom, A. (2006). Quality education and teacher
learning: A review of literature. Washington, DC: USAID Educational
Quality Improvement Project 1.
• Lockheed, M., & Verspoor, A. (1994). Improving primary education
in developing countries. Oxford: Oxford Univ. Press.
• OECD. (2013a). Synergies for Better Learning: An International
Perspective on Evaluation and Assessment. Paris: OECD Publishing.
• OECD. (2013b). Common Policy Challenges.
• Osei, G. (2006). Teachers in Ghana: Issues of training, remunera-
tion and effectiveness. International Journal of Educational
Development, 26(1), 38-51.
• Perkins, D. (1999). The many faces of
constructivism. Educational leadership, 57(3), 6-11.
• Phillips, D. C. (1995). The good, the bad and the ugly: The many
faces of constructivism. Educational researcher, 24(7), 5-12.
• Reid, K. (1983). Retrospection and persistent school absenteeism.
Educational Research, 25(2), 110-115.
• Rothermund, K., Bak, P., & Brandtstädter, J. (2005). Biases in
self-evaluation: moderating effects of attribute controllability.
European Journal of Social Psychology, 35(2), 281-290.
• Schweisfurth, M. (2011). Learner-centred education in developing
country contexts: From solution to problem?. International Journal of
Educational Development, 31(5), 425-432.
Schweisfurth, M. (2013). Learner-centred education in international
perspective: Whose pedagogy for whose development?. Routledg
• Schwab, D.P. (1980). Construct validity in organizational research.
Research in Organizational Behavior, 2, 3–43
• Sinding, S. (2009). Population, poverty and economic development.
Philosophical Transactions of The Royal Society B: Biological
Sciences, 364(1532), 3023-3030.
• Taole, M. J. (2013). Exploring principals’ role in providing
instructional leadership in rural high schools in South Africa. Studies
of Tribes and Tribals, 11(1), 75-82
• Tavakol, M., & Dennick, R. (2011). Making sense of Cronbach's alpha.
International Journal of Medical Education, 2, 53-55
• UNESCO. (2004). Education for all: The quality imperative; EFA
global monitoring report, 2005. Paris: UNESCO Publishing.
• UNESCO. (2015). Education for All 2000 - 2015: Achievements and
challenges (2nd ed.). Paris: UNESCO Publishing.
• UNESCO. (2016). Promoting transparency through information: a
global review of school report cards
• UNICEF. (June 2000). Defining quality in education. A paper
presented by UNICEF at the meeting of the international working
group on education Florence, Italy, Working Paper Series, Educa-
tion Section, Programme Division, United Nations Children’s Fund
UNICEF, USA.
• Wargo, J. (2004). The physical school environment: An essential
component of a health-promoting school. Geneva: WHO.
• Weinstein, C. (1981). Classroom design as an external condition for
learning. Educational Technology, 21(8), 12–19.
8 WWW.EDUKANS.ORG
8


![[P][W] M. Edu. Chiabai, Patricia.pdf](https://static.fdokumen.com/doc/165x107/631b39a87d4b3c24320cb9a9/pw-m-edu-chiabai-patriciapdf.jpg)


![Untitled - Physics Purdue [Edu]](https://static.fdokumen.com/doc/165x107/6329787bbfbc0e632409212c/untitled-physics-purdue-edu.jpg)