Edge Length and Surface Area of a Blank: Experimental Assessment of Measures, Size Predictions and...
21
RESEARCH ARTICLE Edge Length and Surface Area of a Blank: Experimental Assessment of Measures, Size Predictions and Utility Tamara Dogandžić 1 *, David R. Braun 1,2 , Shannon P. McPherron 1 1 Department of Human Evolution, Max Planck Institute for Evolutionary Anthropology, Leipzig, Germany, 2 Center for the Advanced Study of Hominid Paleobiology, Department of Anthropology, George Washington University, Washington, D.C., United States of America * [email protected] Abstract Blank size and form represent one of the main sources of variation in lithic assemblages. They reflect economic properties of blanks and factors such as efficiency and use life. These properties require reliable measures of size, namely edge length and surface area. These measures, however, are not easily captured with calipers. Most attempts to quantify these features employ estimates; however, the efficacy of these estimations for measuring critical features such as blank surface area and edge length has never been properly evalu- ated. In addition, these parameters are even more difficult to acquire for retouched imple- ments as their original size and hence indication of their previous utility have been lost. It has been suggested, in controlled experimental conditions, that two platform variables, plat- form thickness and exterior platform angle, are crucial in determining blank size and shape meaning that knappers can control the interaction between size and efficiency by selecting specific core angles and controlling where fracture is initiated. The robustness of these models has rarely been tested and confirmed in context other than controlled experiments. In this paper, we evaluate which currently employed caliper measurement methods result in the highest accuracy of size estimations of blanks, and we evaluate how platform variables can be used to indirectly infer aspects of size on retouched artifacts. Furthermore, we inves- tigate measures of different platform management strategies that control the shape and size of artifacts. To investigate these questions, we created an experimental lithic assem- blage, we digitized images to calculate 2D surface area and edge length, which are used as a point of comparison for the caliper measurements and additional analyses. The analysis of aspects of size determinations and the utility of blanks contributes to our understanding of the technological strategies of prehistoric knappers and what economic decisions they made during process of blank production. PLOS ONE | DOI:10.1371/journal.pone.0133984 September 2, 2015 1 / 21 a11111 OPEN ACCESS Citation: Dogandžić T, Braun DR, McPherron SP (2015) Edge Length and Surface Area of a Blank: Experimental Assessment of Measures, Size Predictions and Utility. PLoS ONE 10(9): e0133984. doi:10.1371/journal.pone.0133984 Editor: Michael D. Petraglia, University of Oxford, UNITED KINGDOM Received: April 23, 2015 Accepted: July 7, 2015 Published: September 2, 2015 Copyright: © 2015 Dogandžić et al. This is an open access article distributed under the terms of the Creative Commons Attribution License, which permits unrestricted use, distribution, and reproduction in any medium, provided the original author and source are credited. Data Availability Statement: Relevant data are available at Figshare: http://dx.doi.org/10.6084/m9. figshare.1502667. Funding: This project was funded by the Max Planck Society. DRB received additional support from the Alexander von Humboldt Foundation and the National Research Foundation of South Africa (74206). The funders had no role in study design, data collection and analysis, decision to publish, or preparation of the manuscript. Competing Interests: The authors have declared that no competing interests exist.
Transcript of Edge Length and Surface Area of a Blank: Experimental Assessment of Measures, Size Predictions and...
RESEARCH ARTICLE
Edge Length and Surface Area of a Blank:Experimental Assessment of Measures, SizePredictions and UtilityTamara Dogandžić1*, David R. Braun1,2, Shannon P. McPherron1
1 Department of Human Evolution, Max Planck Institute for Evolutionary Anthropology, Leipzig, Germany,2 Center for the Advanced Study of Hominid Paleobiology, Department of Anthropology, GeorgeWashington University, Washington, D.C., United States of America
AbstractBlank size and form represent one of the main sources of variation in lithic assemblages.
They reflect economic properties of blanks and factors such as efficiency and use life.
These properties require reliable measures of size, namely edge length and surface area.
These measures, however, are not easily captured with calipers. Most attempts to quantify
these features employ estimates; however, the efficacy of these estimations for measuring
critical features such as blank surface area and edge length has never been properly evalu-
ated. In addition, these parameters are even more difficult to acquire for retouched imple-
ments as their original size and hence indication of their previous utility have been lost. It
has been suggested, in controlled experimental conditions, that two platform variables, plat-
form thickness and exterior platform angle, are crucial in determining blank size and shape
meaning that knappers can control the interaction between size and efficiency by selecting
specific core angles and controlling where fracture is initiated. The robustness of these
models has rarely been tested and confirmed in context other than controlled experiments.
In this paper, we evaluate which currently employed caliper measurement methods result in
the highest accuracy of size estimations of blanks, and we evaluate how platform variables
can be used to indirectly infer aspects of size on retouched artifacts. Furthermore, we inves-
tigate measures of different platform management strategies that control the shape and
size of artifacts. To investigate these questions, we created an experimental lithic assem-
blage, we digitized images to calculate 2D surface area and edge length, which are used as
a point of comparison for the caliper measurements and additional analyses. The analysis
of aspects of size determinations and the utility of blanks contributes to our understanding
of the technological strategies of prehistoric knappers and what economic decisions they
made during process of blank production.
PLOS ONE | DOI:10.1371/journal.pone.0133984 September 2, 2015 1 / 21
a11111
OPEN ACCESS
Citation: Dogandžić T, Braun DR, McPherron SP(2015) Edge Length and Surface Area of a Blank:Experimental Assessment of Measures, SizePredictions and Utility. PLoS ONE 10(9): e0133984.doi:10.1371/journal.pone.0133984
Editor: Michael D. Petraglia, University of Oxford,UNITED KINGDOM
Received: April 23, 2015
Accepted: July 7, 2015
Published: September 2, 2015
Copyright: © 2015 Dogandžić et al. This is an openaccess article distributed under the terms of theCreative Commons Attribution License, which permitsunrestricted use, distribution, and reproduction in anymedium, provided the original author and source arecredited.
Data Availability Statement: Relevant data areavailable at Figshare: http://dx.doi.org/10.6084/m9.figshare.1502667.
Funding: This project was funded by the Max PlanckSociety. DRB received additional support from theAlexander von Humboldt Foundation and the NationalResearch Foundation of South Africa (74206). Thefunders had no role in study design, data collectionand analysis, decision to publish, or preparation ofthe manuscript.
Competing Interests: The authors have declaredthat no competing interests exist.

IntroductionModern prehistoric lithic studies are mainly concerned with fundamental questions of how andwhy flintknappers produced implements of certain forms. Flake morphology, as expressed insize and shape, is one of the main aspects of variation to be investigated in lithic technologicalstudies [1]. Depending on the research questions and perspectives, variation in blank morphol-ogy is used to infer differences in core types (morphologies) that further reveal technological tra-ditions [2–5] or as an indirect reflection of adaptations to different environmental conditions ormobility where blank design may change as a response to certain economic strategies [6–16]. Asignificant component of technological organization studies is concerned with how portabilityand utility of blanks are affected by mobility or raw material availability in an attempt to under-stand how lithic technology is organized and integrated in the overall system of settlement andmobility. Within this framework a great deal of attention is paid to the efficiency of blank pro-duction and utility of blanks [7,17–20]. The concept of efficiency, recognized early on in thework of A. Leroi-Gourhan as a proxy for technological progress through time [21] can be mod-eled in an evolutionary framework where it potentially reflects technological decisions that facil-itate meeting daily subsistence requirements. Consequently these can be considered asequivalent or at least highly correlated with genetic fitness [22].
These questions have been in focus especially when estimating the efficiency and productiv-ity of certain core technologies [23–25] or when comparing different flaking systems [26–28].The question of differences in efficiency of blanks produced by different technologies has beenparticularly important when comparing flake versus blade blanks and is repeatedly discussedin the context of the appearance of modern human behavior as blade industries have been con-sidered an archaeological marker of modern humans and therefore an expression of ‘modernbehavior’ [29]. Although a strict association between blade technologies and these cognitiverubrics has been challenged [30,31], this technology is still thought to have several advantagesover standard flake production. Possibly one of the most important advantages is the increasedlength of the cutting edge per unit weight [28,32–35]. There is, nevertheless, an opposing viewthat argues for the increased economic properties of flakes compared to blades as the formercan be repeatedly resharpened due to their larger initial surfaces. Arguments for the increasedefficiency of standard flakes centers on the increased use-life of tools that can be resharpenedmultiple times. Flake width, which is usually greater than on blades, allows for multiple genera-tions of use through retouch [26,28]. Some archeological studies have shown that radial flakeswere at times preferred over narrow flakes because of their potential for resharpening [20,36].In this case, emphasis on one particular blank form is seen as increasing their suitability fortoolkits in circumstances of increased mobility.
Efficiency in lithic production can vary and can be controlled at different points in the man-ufacture process. Three parameters are often seen as important components of an efficienttoolkit: 1) reducing the amount of raw material waste during core preparation, 2) increasingthe number of end-products per core and 3) enlarging the length of the cutting edge produced.Even though the efficiency of the overall core production system and blank properties havebeen looked at independently [18,19,23,37,38], they are not mutually exclusive, because theseproduction systems are often aimed at creating blanks with specific morphological features. Inthis paper, the focus will not be on the overall production system nor on distinctions betweentechnologies, but rather on how size and utility properties are quantified in lithic analysis. Fur-thermore we will investigate how these patterns are achieved in the production of individualpieces. The question of where the utility of a tool lies can be viewed from different perspectives,depending on the behavioral circumstances that would favor certain design properties. Whileutility can be expressed in different values, two variables are underlined as relevant in assessing
Edge Length and Surface Area of a Blank
PLOS ONE | DOI:10.1371/journal.pone.0133984 September 2, 2015 2 / 21

most aspects of blank utility: edge length and surface area [1,14,20,39]. When these variablesare inspected relative to other measures of overall size (e.g. weight, thickness) they provide arelative measure of blank utility. Within this framework, we investigate methodological ques-tions in lithic analysis related to these two variables. Estimating relative blank size using stan-dard caliper measurements has thus far never been fully investigated. When original size is notpreserved, such as in retouched elements, a need arises to assess their initial size propertiesindirectly, namely with remaining platform variables, platform size and exterior platform angle(hereafter EPA) [27,40–42]. They can, furthermore, inform us on how prehistoric knapperswere manipulating these variables to control not only size but shape and consequently otherproperties such as the amount of usable edge or the tool’s potential for resharpening.
Blank size estimationsIn lithic analysis, morphological characteristics of blanks are inferred through descriptiveassessments or, in a more precise manner, with metric attributes. Measurements are usedtogether to assess shape and to calculate surface area and the edge length of a blank. Apartfrom recent advances in scanning technologies that use digitized images and 3D models to cap-ture blank morphology or metric attributes [28,43–47], the most commonly used method toobtain linear size measurements is with digital calipers. There are, however, several ways tomeasure the length and width of lithic artifacts that are commonly used by lithic analysts[1,48,49]. As a need for reliability in metric measurements increases, some methods have beenproposed as better reflections of the morphology of a blank [50]. Other measures have beensuggested as improved estimates of edge length [32]. It is apparent that different measures givedifferent estimates of the size and shape of the blank and the length of usable edge (the edgeminus the platform). Previous attempts to evaluate how different methods of flake area calcula-tions based on common measurement of length and width compare with more reliable mea-sure of area that uses several observations along the perimeter of the flake [51] demonstratedconsistent overestimations of surface area that ranges from 11% to 47% (Baumler 1979 as citedin [51]). This study, however, did not evaluate which method produces least errors. This islargely due to the variable and irregular morphology of flakes. It can be expected that blanks ofmore or less symmetrical or standardized form, such as blades, will have a more predictablerelationship between shape measurements and subsequently edge length and surface area.Edge length prediction based on shape measurements of an asymmetrical or irregular blankwill be more variable with higher inaccuracy. Moreover, the blank and tool size estimates mea-sured by different researchers are unlikely to be compatible and hence difficult to compare.Here we investigate measures of size and shape based largely on caliper measures under theview that the majority of data collection still relies heavily on caliper measurements rather thanscanning techniques. Considering the fact that methods may vary significantly, the first aim ofthis paper is to examine the accuracy of the commonly used length and width measurements todetermine the error in measures of edge length and surface area and to find which of them pro-vides the best estimate of these variables. Using an experimental assemblage, four differentmeasurement methods are tested against the results obtained with digitized images.
Platform as an indicator of blank sizeIt is widely accepted that patterns in lithic assemblages are affected by the intensity of reductionand that evaluating the extent of reduction contributes to explaining variability in lithic assem-blages. This is specifically the case for retouched tool types. The Frison effect [52,53] suggeststhat much of the variability seen in typological categories lies in the extent of retouch. This con-cept contributed to a rejection of conventional typological units as discrete units, especially in
Edge Length and Surface Area of a Blank
PLOS ONE | DOI:10.1371/journal.pone.0133984 September 2, 2015 3 / 21
Middle Paleolithic research [54–59]. Another significance of this concept lies in its potential inexamining the notion of curation and repeated use of implements [14,60]. In this context, mea-sures of tool reduction, along with other assemblage characteristics of, e.g. core reduction etc.,give insights into the overall level of curation that an assemblage represents [39,61]. This hasfurther implications in how technology is organized in specific contexts, such as increasedmobility or transport patterns at certain distances to raw materials [62].
In evaluating this aspect of retouched tools, the central issue becomes reconstructing theoriginal size of a reduced tool to accurately quantify the amount of mass removed from theblank as a result of retouch. Various measures, ratios and indices, have been devised for thispurpose [46,63–68]. While most of them are focused on measuring the extent of retouch, oneis specifically aimed at reconstructing the original blank size as compared to the discarded size[65]. The problem of size reconstruction is directly related to the question of how knapperscontrol the detachment of a flake and, more importantly, its size. Several experimental studieshave examined flake variation, mainly dimensional attributes, resulting from variables con-trolled by the knapper ([40,42]–Fig 3x). These experiments, and many subsequent studies[27,69,70], indicate that the size of a flake is primarily determined by platform thickness andEPA. The high predictive power of platform size in assessing flake size was used to infer origi-nal size of a blank before some amount of it has been removed by retouch. In the study ofreduction patterns and their effects on typology, Dibble [64] used the ratio of the remainingsurface area to platform area as a relative measure of tool reduction.
Some researchers have expressed concern over how well this ratio works to identify thedegree of reduction in unifacial tools [71,72]. Many of these concerns revolve around the ques-tion of platform thickness’ ability to predict size despite the positive correlation between thetwo. Emphasis on curation in lithic studies has inspired further search for the best estimate ofreduction. The predictive power of platform area stimulated novel techniques for precisely cal-culating its area by scanning to improve its reliability as a predictor for blank size [44,46,73].
Another line of research that contributes to this question is looking at flake size variation asa factor of not only platform variables, but EPA as well. These two variables are crucial in deter-mining the size of the blank [40–42,70]. If we consider that this relationship is established andreliable, then size predictions should be more usable with these platform variables. The nextstep is to evaluate the robustness of these model relationships derived from controlled experi-ments on knapped assemblages. Some test studies on archaeological or experimental data werepreviously made, though with less precise measures of edge length and surface area [69,70,74].In this study we used surface area and edge measurements derived from digital images to testthese relationships. In this context, we will first investigate the possibilities of estimating origi-nal blank size and how well platform variables control for the size of the blanks.
Platform as an indicator of blank shapeThe concept of efficiency has been a major topic in the studies of lithic organization[1,7,18,23,35]. For instance, certain circumstances, such as mobility [20] or raw material con-straints [19] may have favored modifications in production strategies towards higher efficiencyor longer use-lives. Most studies that focus on the economy of lithic production stress use lifeand curation in retouched elements [7,15,59,63,68,75,76], though the importance of the unre-touched assemblage and its role in the economy of lithic reduction strategies is equally relevant[60,77,78]. While there are different concepts of flake utility [14,20], two main currenciesappeared to be especially important: 1) efficiency index as a measure of usable cutting edge perunit of mass and 2) retouch potential, i.e. the possibility of further modifying the edge thatwould extend a tool’s use-life.
Edge Length and Surface Area of a Blank
PLOS ONE | DOI:10.1371/journal.pone.0133984 September 2, 2015 4 / 21
Tool efficiency has been a focus in recent studies [18,19,32,79], though its importance in thestudies of technology and evolution was recognized earlier [35]. Leroi-Gourhan considered thegradual maximization of a tool’s cutting edge against its diminishing mass during Paleolithictimes as a step towards efficiency that marks technological progress [21]. Varied blank mor-phologies can be a solution for situations where higher efficiency is required [1,14,20,80,81].Smaller blanks have larger efficiency for the same unit of weight, though larger blanks areknown to have been transported larger distances [39,82,83].
Making a balance between usable edge and transport weight is not the only blank require-ment that foragers may have sought. While foragers would, especially in higher mobility cir-cumstances, tend to lower the transport costs of portable implements, another approach is to
Table 1. Sample size and summary statistics on experimental assemblage.
Flint Hornfels Total
Metric estimates 109 126 235
Size predictions 99 71 170
Length M = 45.74 M = 31.8 M = 38.26
SD = 14.35 SD = 9.44 SD = 13.83
range = 21.87–75.85 range = 17.64–69.9 range = 17.64–75.85
Width M = 38.45 M = 29.76 M = 33.79
SD = 17.82 SD = 10.21 SD = 14.87
range = 12.29–116.2 range = 12.03–62.78 range = 12.03–116.2
Elongation M = 1.37 M = 1.17 M = 1.27
SD = .62 SD = .48 SD = .56
range = .44–3.32 range = .5–2.61 range = .44–3.32
Skew angle M = 21.36 M = 23.03 M = 22.25
SD = 16 SD = 16.5 SD = 16.25
range = .08–64.1 range = .54–65.6 range = .08–65.6
doi:10.1371/journal.pone.0133984.t001
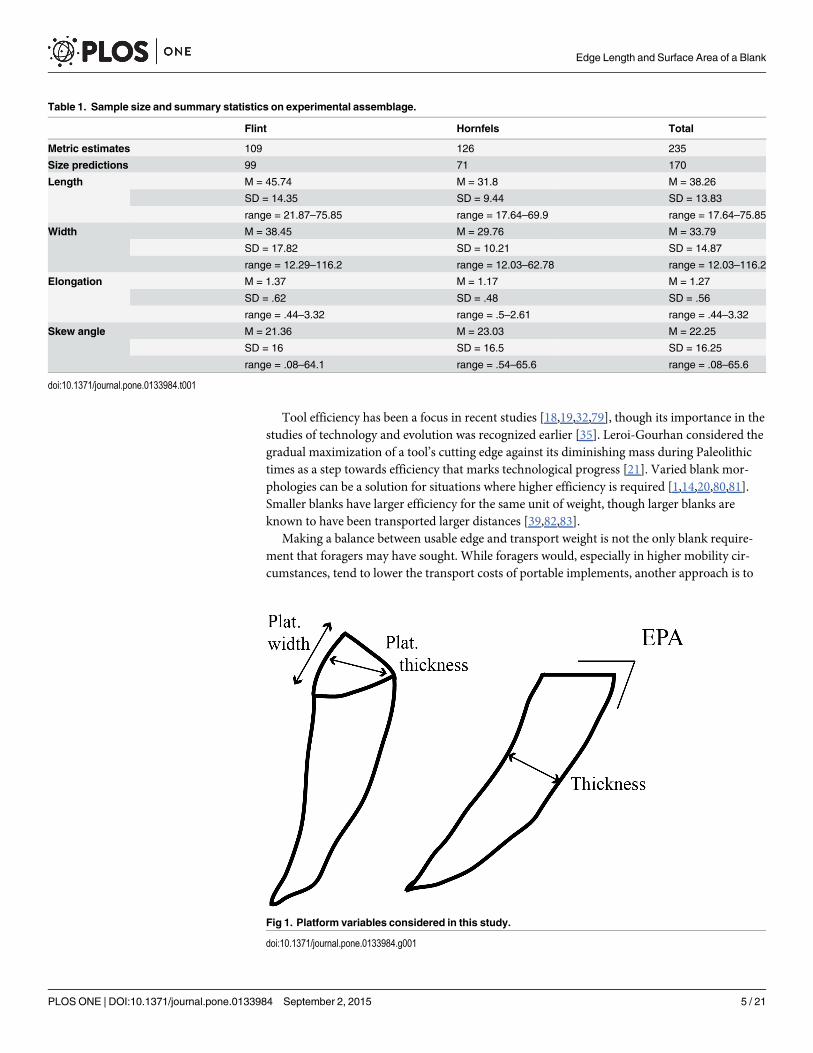
Fig 1. Platform variables considered in this study.
doi:10.1371/journal.pone.0133984.g001
Edge Length and Surface Area of a Blank
PLOS ONE | DOI:10.1371/journal.pone.0133984 September 2, 2015 5 / 21

transport larger implements with a greater potential for edge renewal. This said, a blank’sretouch potential is often taken as a proxy for tool’s longevity [7,65]. A long edge is one possi-ble prerequisite, but flakes also need to have a significant volume, and blanks of a specific form,thick and asymmetrical in section, have been suggested for this purpose [84,85]. Another, andquite different, morphological trait that increases the resharpening capacity of a blank is largersurface areas relative to thickness. This blank morphology is often associated with low edgeangles for repeated resharpening events [20,24,85,86].
Experimental studies showed that knappers used certain rules to achieve specific blankshapes [40,87]. It has been suggested that the knapper can control both blank size and shape bymanipulating platform depth and EPA [41]. If the variability of morphological ratios can becontrolled by these platform attributes, then one can look at strategies employed in
Fig 2. Screen shot from the program used to digitize artifacts. It takes artifact photos, extracts the scale, artifact outline, takes various measurements oflength, width and calculates the edge length and surface area (without the platform).
doi:10.1371/journal.pone.0133984.g002
Edge Length and Surface Area of a Blank
PLOS ONE | DOI:10.1371/journal.pone.0133984 September 2, 2015 6 / 21
technological processes aimed at acquiring blanks of specific properties. Previous work [27]has suggested that increasing the EPA will have an impact on both of these currencies. Simulta-neously decreasing the thickness will reduce the weight, which is seen as an optimal efficiencystrategy [16]. When these models are applied in an archaeological context some patterns seem
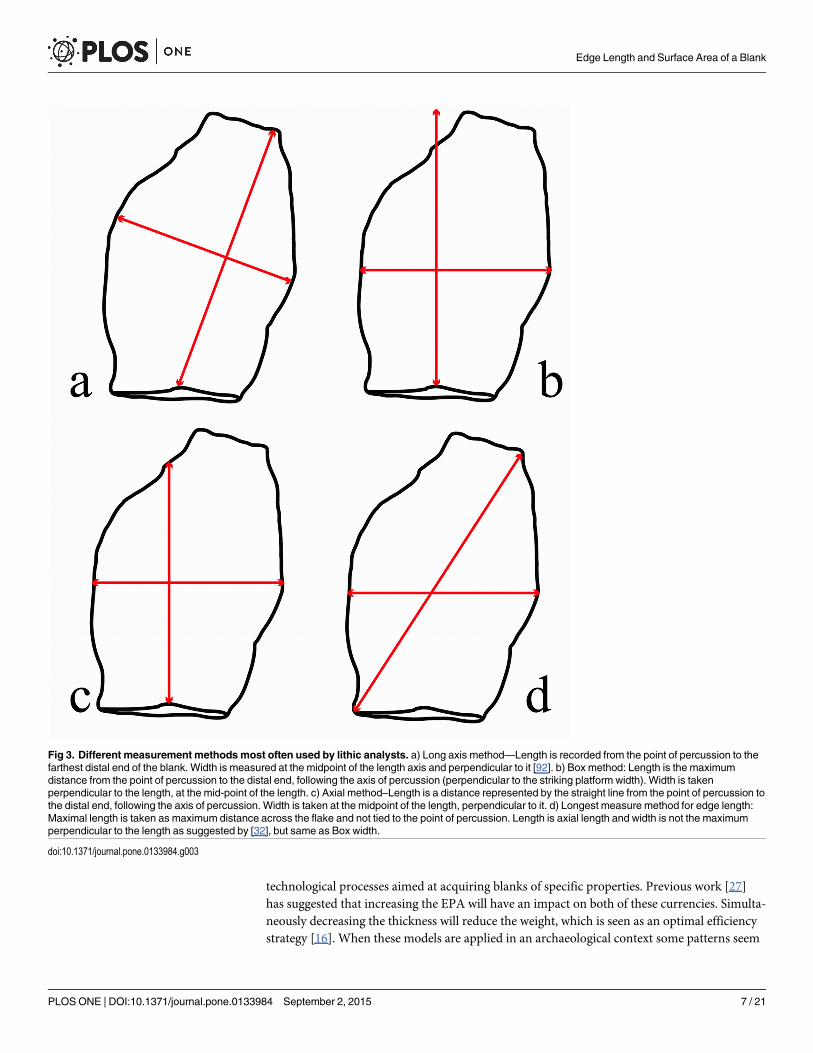
Fig 3. Different measurement methods most often used by lithic analysts. a) Long axis method—Length is recorded from the point of percussion to thefarthest distal end of the blank. Width is measured at the midpoint of the length axis and perpendicular to it [92]. b) Box method: Length is the maximumdistance from the point of percussion to the distal end, following the axis of percussion (perpendicular to the striking platform width). Width is takenperpendicular to the length, at the mid-point of the length. c) Axial method–Length is a distance represented by the straight line from the point of percussion tothe distal end, following the axis of percussion. Width is taken at the midpoint of the length, perpendicular to it. d) Longest measure method for edge length:Maximal length is taken as maximum distance across the flake and not tied to the point of percussion. Length is axial length and width is not the maximumperpendicular to the length as suggested by [32], but same as Box width.
doi:10.1371/journal.pone.0133984.g003
Edge Length and Surface Area of a Blank
PLOS ONE | DOI:10.1371/journal.pone.0133984 September 2, 2015 7 / 21

to emerge [69]. In our analysis these relationships are examined in an experimental assemblagewhere platform variables are not controlled. The platform variables vary presumably as muchas they do in some archaeological assemblages. As a result this assemblage offers anotheropportunity to evaluate the strength of the models governing blank production.
Materials and MethodsIn this study we used an experimental lithic assemblage produced with freehand, hard hammerpercussion. Artifacts were made on two different raw materials: flint, derived from the Bergeracregion of France, and hornfels (shale that had undergone contact metamorphism) collectedfrom the Karoo region of South Africa [88]. Bergerac flint is of good quality and comes inlarger nodules of less regular shape. The hornfels nodules in this study, on the other hand, aresmaller in size and were found in rounded nodules. The blanks produced vary in terms of mor-phology and technology as there was no preference for either during the flintknapping. Thegoal was to produce a variety of flakes. Some of them resemble Levallois blanks while somehave a morphology that conforms to the definition of a blade. They also vary in size, shape, andthe amount of cortex. The sample size varied for different parts of the study (Table 1). For theanalysis that requires exterior platform angle and platform size, the sample is smaller as somepieces had cortical and curvy platforms and/or dorsal surfaces that made measuring EPA unre-liable. For each artifact, we measured platform width and thickness using digital calipers to .1mm and measured weight on a digital scale to .1 gr. EPA was measured with a goniometer tothe nearest degree, and it was taken as an angle between the platform surface and dorsal surfacearea, along the axis of flaking (Fig 1).
We used digital images of artifacts to calculate the edge length and blank surface area. First,both the ventral and dorsal side of each flake was photographed with a digital camera with acentimeter scale near the platform. Flakes were placed in a container of salt so that they couldbe easily made flat and also to insure that the scale was captured at the same focal depth as theperimeter of the flake [47]. Flakes were aligned with the axis of percussion. Digital images werethen loaded into custom written software [88]. The program counted the number of pixels percentimeter in the scale, and after automatically removing the background around the artifact,the software produced a set of XY points to represent the artifact outline (Fig 2). On the ventralside image, we noted the point of percussion as well as the limits of the platform. Length andwidth measurements according to each measurement method were automatically calculatedusing the edge outline and the point of percussion. Edge length and surface area were calcu-lated without the platform length and area.
One of the most commonly used measurement system is following the axis of percussion ofthe artifact [89] (Fig 3c). For symmetrical pieces this method is a good estimate of size and sur-face area, but when the axis of flaking and axis of symmetry diverge from each other, thismethod may underestimate the overall size of the piece. To overcome this disadvantage and topreserve information on flake shape, Jelinek, following Leach [90], used a different method(Fig 3a, named Long axis method) in his study of the Tabun assemblage. Jelinek’s measure oflength is taken from the point of percussion to the farthest point on the edge of the flake. Theassumption is that this measure is a better reflection of the true outline than the standard axialmeasurement scheme [39,50,91,92]. Taking the maximum length and width measurements(Fig 3b), the so-called box method [49], is also employed by many researchers (e.g. [93,94]).Here we use a modified method where width is not maximal, but at the mid-point of the lengthmeasurement (Fig 3b). Finally, dissatisfied by the usual formula for calculating edge length,2�Length+Width, that often results in inaccurate estimates for the pieces whose maximaldimension is not its axial length, Mackay’s [32] study of changes in flake efficiency in South
Edge Length and Surface Area of a Blank
PLOS ONE | DOI:10.1371/journal.pone.0133984 September 2, 2015 8 / 21
African Middle Stone Age assemblages presented a new method designed to be a better esti-mate of flake edge length. It uses the longest measure instead of length (Fig 3d). Using linearmeasurements obtained by the software [88], edge length and surface area of every artifactwere then calculated according to each measurement system. Surface area is calculated as aproduct of length and width, edge length as a width plus two times the length, and the Mackayedge length as a sum of length, maximum length and width. Statistical analysis was done in R[95].
Results and Discussion
Blank size estimates: length, edge length and surface areaSize Measures with Calipers. Assemblage comparisons often rely on similarities and dif-
ferences in one or more absolute measures of artifacts, such as length and width. Depending onthe flake morphology, the choice of measurement method could produce variable results. Forexample, lengths taken with three different measurement systems (box, long axis and axis) for241 blanks used in this study are statistically different (Kruskal-Wallis, χ2(2) = 21.49, p< .01),with the largest difference being between the long axis method and axial measurement tech-niques (post-hoc Kruskal-Nemenyi test, p< .01) and box and axial (post-hoc Kruskal-Neme-nyi, p< .05). Obviously, difficulties can arise when assemblage comparisons based on differentmetric systems are interpreted.
Many research questions concerning lithic technologies, especially ones that tackle aspectsof technological economization, are, nevertheless, concerned with the length of the usable edgeand the area of a blank, rather than length or width of a blank alone. For that purpose, estima-tions are made from measures of lengths and widths. Here we analyzed how edge length andsurface area calculated using different caliper measurement methods compared to ones madefrom digitized images. In method comparisons for surface area estimates, Mackay measure-ment method was not included, as it was not aimed at obtaining this value, and, as it uses themaximum measurement, would consistently overestimate the area. Therefore we only com-pared three other measurement methods. While regression analysis indicates that all methodsgive good prediction for the edge length (all r2 >.92) and surface area (r2>.95), Kruskal-Wallistests showed that means and variation between metric systems significantly differ for edgelength (χ2(4) = 18.83, p< .01) and surface area estimates (χ2(3) = 9.77, p< .05). . . Pairwisecomparisons reveal that the significant difference is between digitally obtained edge length andthe estimate with longest measure method and axial method (Kruskal-Nemenyi, p< .01). Thelargest difference with the surface area measurements is with the box method (Kruskal-Neme-nyi, p< .05). An examination of the degree of error of each system compared to digitizedlength or area gives an insight into how reliable each estimate is. As shown on Table 2, mea-surement errors can be large, with some percentage errors up to 30–40% for edge length and60% for surface area and the measurements can equally over- or underestimate the value (Fig4). What is required in any analysis of lithic metrics is a measure that is most accurate, i.e.shows lowest mean percentage error, and has the highest precision, showing the lowest varia-tion in this error. As evidenced by the data on Table 2, length and width measurements takenwith the box method give the best estimation of the length of the edge. Similar results areobtained for the Jelinek’s method as well, while the other two to a large extent over- or underes-timate this value. Surface area calculations, on the other hand, are subject to larger errors andconsistent overestimates. The axial method lies closer to the digitized image values for blankarea, most probably because it represents the most conservative measurement method and itusually excludes, mainly for irregular pieces, some parts of the blank surface.
Edge Length and Surface Area of a Blank
PLOS ONE | DOI:10.1371/journal.pone.0133984 September 2, 2015 9 / 21
It is important to understand why some of these estimates are prone to such large errors.Linear measurements view blank form as an idealized, regular quadrilinear geometric shape,which is rarely the case. It is apparent that symmetrical blanks would have a predictable surfacearea and perimeter, clearly determined and easily calculated by length and width. Moreover,length and width measurements taken with different methods would largely overlap. For irreg-ular blanks, however, this relationship is not so straightforward. One of the variables consid-ered to be an indicator of the blank morphology is angle of skew [92]. Here we define it as theangle between the axis of percussion and the line between the point of percussion and most dis-tal point of a blank (equivalent to length taken according to Jelinek’s measurement), given thatthe axis of percussion has an angle of 0°.
For extreme misestimates of edge length and surface area, i.e. the outliers in estimationerrors, morphological patterning is observed: their average angle of skew is high, 40.4°, andlength to width ratio, another measure of blank shape, is usually less than 1 (on average .73).These outliers indicate that morphology does play a role in estimation errors. Moreover, flintspecimens showing extreme estimate errors are among the largest in the assemblage, with a
Table 2. Summary statistics of errors in edge length and surface error estimations with different measurement systems.
Edge Length: % error Long axis Box Axial Longest measure
Mean 3.24 1.9 -3.36 9
SD 8.32 7.36 9.24 9.92
Range -26.41–31.7 -24.77–26.86 -37.8–24.51 -18.24–43
Surface Area: % error Jelinek Box Axis
Mean 15.27 18.68 9.75
SD 12.61 10.56 10.7
Range -20.38–45.9 -11.49–63.58 -19.02–43.03
doi:10.1371/journal.pone.0133984.t002
Fig 4. Average errors of edge length (a) and surface area (b) by different measurement methods.
doi:10.1371/journal.pone.0133984.g004
Edge Length and Surface Area of a Blank
PLOS ONE | DOI:10.1371/journal.pone.0133984 September 2, 2015 10 / 21

maximum length of 72.1mm, suggesting that the estimations are less reliable for large pieceswith higher skew angles. Correlation analysis shows that deviation from the expected value ofedge length for long axis (rs = .048, p = .46) and box (rs = -.06, p = .38) method is not signifi-cantly correlated with the skew angle, while for axial (rs = .13, p = .04) and longest measure (rs= .14, p = .03) positive correlation is demonstrated. In other words, box and long axis methodsare less susceptible to variations in blank morphology. The previous study that aimed at findinga better estimation of edge length [32] showed a strong correlation between this method anddigitized edge length which was confirmed in our sample as well (r2 = .95, p< .01). Mackay,however, did not test this new measure against others. This method had the largest number ofoutliers, and the largest errors as well as substantial influence from skew angle and blank mor-phology. This measure does not prove itself as the most reliable of the measurement systemsfor edge length estimates.
In predicting the surface area, errors for box method are positively, though weakly (r = .13,p = .047) correlated with angle of skew, errors of the long axis method negatively (r = -.28, p<.01), while the reliability of the axial method does not depend on the irregularity of the flake (r= -.1, p = .095). In other words, the more irregular the flake is, the box method shows slightincrease in error in predicting area, and conversely, the long axis method gives more reliableresults for less symmetric blank shapes. Interestingly, Jelinek’s method was initially aimed atcapturing the morphology of the blank [50,92] yet the present study suggests that this measureexhibits less error in predicting the surface area for irregular pieces.
Indirect Size and Shape Estimates with Platform Variables. What lithic analysts aremore often concerned with is inferring original blank size when the question of interest is howmuch of the original tool was lost through retouch modifications. For this purpose, only mea-sures not affected by retouch can be used to reconstruct the original blank size. In his work onreduction patterns among tool types in the Middle Paleolithic, Dibble [64,65] used a ratio ofsurface area to platform area as an assessment of the amount of reduction a tool underwent.The underlying assumption is that platform area and surface area are linearly related and,therefore, display a constant ratio. Blanks with lower than expected ratios indicate tools whosesurface areas have been more reduced. This measure is relative and can be applied on an assem-blage-wide scale, looking at relative reduction between tools. In Dibble’s original study [65] theratio was compared between different tool types to show that as one moves from one tool typeto another this ratio changes. As controlled experiments demonstrated the independent effectof platform depth and EPA on flake variation [27,41,69], they should be integrated in the pre-diction of original size. Moreover, in many previous studies it has been emphasized that predic-tions should consider and include as many variables as possible [46,96]. It is important to focuson the variables that are preserved despite retouch. Blank thickness, which in many casesremains preserved even after retouch [96], is a variable that can be incorporated into these esti-mations of initial flake size. We tested the possibilities of predicting blank size with multipleregression analysis, with platform thickness, platform width, EPA and blank thickness as inde-pendent variables. As retouching a tool’s edge reduces its size in two dimensions, weight (as aproxy for mass) and surface area, both are considered as dependent size variables.
We performed multiple linear regression with platform width, thickness and EPA togetherand found a significant but weak correlation with mass, with r2 = .49, F(3,166) = 54.69, (inorder to achieve linearity for the regression all models include cube root of weight and squareroot of platform area and dorsal surface area). With blank thickness included in the model, thecoefficient of regression significantly increases (r2 = .75, F(4,165) = 128.1, p< .01), explaining75% of the variation by independent variables. ANOVA comparison of models with and with-out blank thickness shows that thickness adds to the result of linear regression (F(2,166) =175.68, p< .01). Using these three predictor variables, regression analysis gives significant
Edge Length and Surface Area of a Blank
PLOS ONE | DOI:10.1371/journal.pone.0133984 September 2, 2015 11 / 21

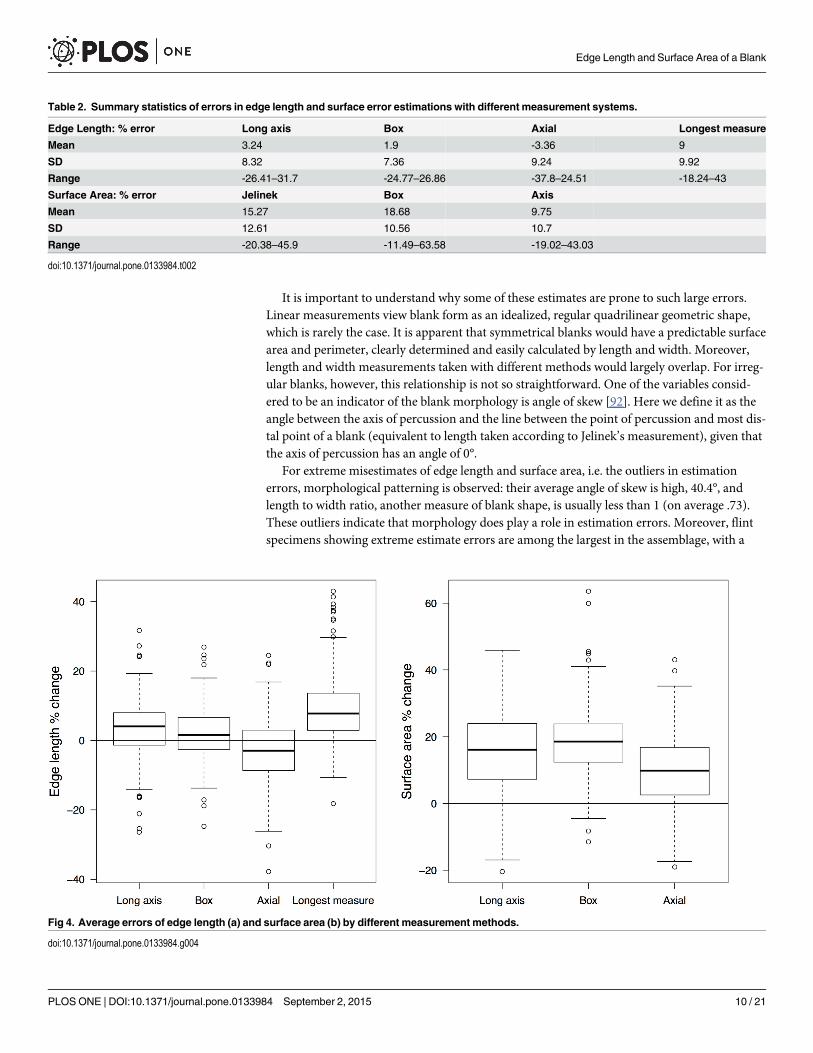
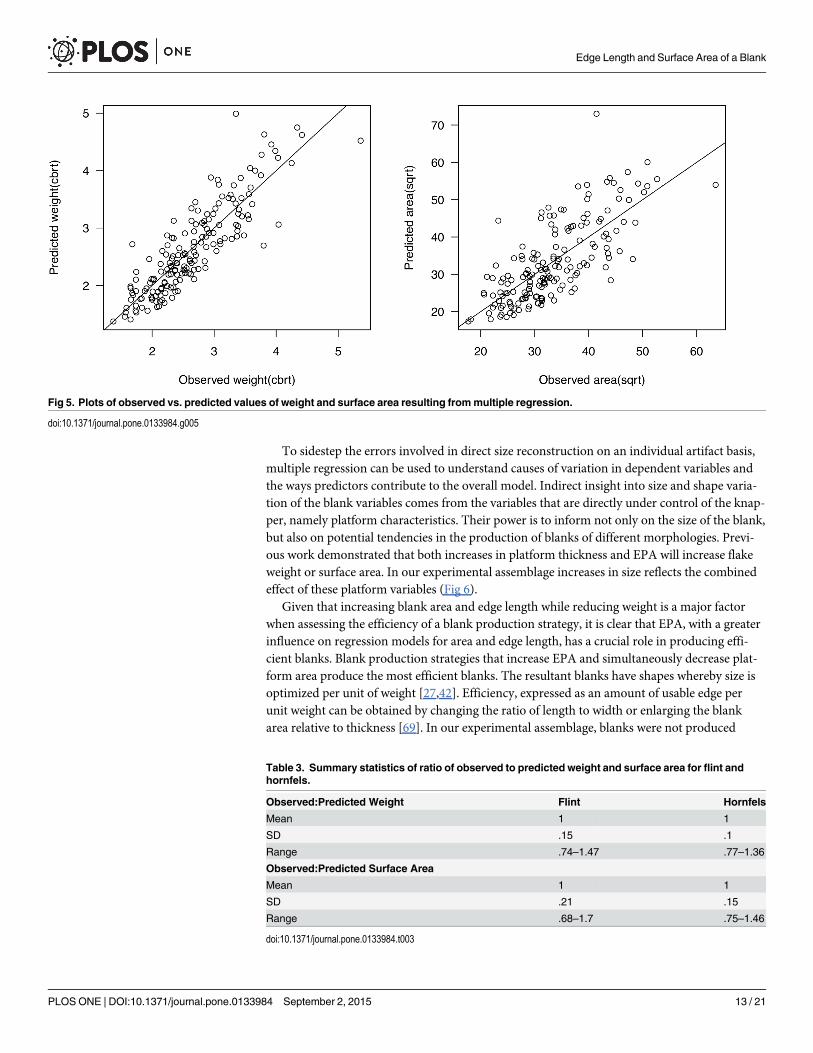
results for predicting surface area as well (r2 = .54, F(4,165) = 50.47, p< .01), though theregression coefficient is not as strong as when predicting mass. A stronger correlation existsbetween the predicted and observed values for the regression model for weight than for the sur-face area (Fig 5). Coefficients of regressions for predicting either of the size variables are signifi-cant but not strong for either. Moreover, there are differences in the regressions for the tworaw material groups, with hornfels assemblages showing a slightly higher correlation coefficient(r2 = .8, F(4,66) = 69.79, p =< .01) than flint (r2 = .73, F(4,94) = 66.65, p< .01). The same istrue for surface area (hornfels: r2 = .6, F(4,66) = 27.3, p< .01; flint: r2 = .47, F(4,94) = 22.93, p< .01). Plots of observed versus predicted values from regression models for weight and area(Fig 5) show that the models may not be accurate enough, which can lead to higher uncertain-ties in using the equation for interpretation of tool reduction on an artifact by artifact basis.
In certain flake forms, surface area decreases more rapidly with retouch than mass (i.e.flakes with high edge length relative to mass). In these instances it would be advantageous to beable to predict flake surface area with high accuracy (to be able to distinguish tool forms withslight retouch versus extensive retouch even though mass may not change dramatically).Regrettably, surface area prediction from multiple linear regression explains less variation insurface area than mass [74]. Initial-/terminal size comparisons [46,71] can be used as a ratio ofthe discarded size (mass or surface area) to the size estimated by the platform variables. Theseratios can act as an estimate for the amount of reduction in an assemblage. This ratio is, in thecase of no reduction, expected to be equal to one. The ratio of weight predicted by multipleregression to the original weight measured in our assemblages is on average equal to one(Table 3). While these mean values are encouraging, the random error in size predictions on anindividual piece by piece basis, which may be the result of measurement error, is an obstacle inreconstructing reduction intensity since prediction errors can be large and unable to revealreduction patterns [96]. The other possibility is that the over- and underestimations wouldaverage out across the assemblage and assemblage based estimation of reduction would remainfairly accurate.
One line of evidence in examining the sources of error in predictions can come from predic-tor variables. The LMGmethod for analysis of relative importance of predictor variables inmultiple regression [97] reveals that thickness of a blank plays the most significant role inregression for all measures of size, contributing to 57% of r2 value for weight, 45% for surfacearea and 52% for edge length. The relative importance of platform thickness in predictingweight and surface area is 17% and 12% respectively and only 8% for edge length, platformwidth 20% for weight, 28% for area and 15% for edge length, while EPA has only 5% contribu-tion to weight and 13% for surface area and reaches 25% for edge length predictions. Thickerplatforms mainly contribute to an increase in blank thickness and larger bulbs resulting inhigher blank weights [27]. Changes to EPA, however, affect weight at a slower rate than surfacearea or edge length. One possible influence EPA has on weight predictions may be the effectEPA has in producing relatively smaller bulbs of percussion. Flakes with relatively smallerbulbs have lower mass values [69]. In addition, the reduced effect of EPA on weight estimationsis likely the result of the inability to measure EPA with high precision. Nevertheless, as we usedresponse variables obtained with digitized images in order to reduce the error, we may considerthat the error probably lies in the more subjective measures of predictor variables, e.g. EPA.Multiple regression beta values may predict some variables with greater confidence because ofthe effect on its higher measurement reliability. Non-reliable data can mask the relevance ofpredictors compared to more reliable ones. As for the platform size, a solution to these prob-lems can be found in higher accuracy measures of platform variables [44,46]. As for the EPA, asolution is still sought.
Edge Length and Surface Area of a Blank
PLOS ONE | DOI:10.1371/journal.pone.0133984 September 2, 2015 12 / 21
To sidestep the errors involved in direct size reconstruction on an individual artifact basis,multiple regression can be used to understand causes of variation in dependent variables andthe ways predictors contribute to the overall model. Indirect insight into size and shape varia-tion of the blank variables comes from the variables that are directly under control of the knap-per, namely platform characteristics. Their power is to inform not only on the size of the blank,but also on potential tendencies in the production of blanks of different morphologies. Previ-ous work demonstrated that both increases in platform thickness and EPA will increase flakeweight or surface area. In our experimental assemblage increases in size reflects the combinedeffect of these platform variables (Fig 6).
Given that increasing blank area and edge length while reducing weight is a major factorwhen assessing the efficiency of a blank production strategy, it is clear that EPA, with a greaterinfluence on regression models for area and edge length, has a crucial role in producing effi-cient blanks. Blank production strategies that increase EPA and simultaneously decrease plat-form area produce the most efficient blanks. The resultant blanks have shapes whereby size isoptimized per unit of weight [27,42]. Efficiency, expressed as an amount of usable edge perunit weight can be obtained by changing the ratio of length to width or enlarging the blankarea relative to thickness [69]. In our experimental assemblage, blanks were not produced
Fig 5. Plots of observed vs. predicted values of weight and surface area resulting frommultiple regression.
doi:10.1371/journal.pone.0133984.g005
Table 3. Summary statistics of ratio of observed to predicted weight and surface area for flint andhornfels.
Observed:Predicted Weight Flint Hornfels
Mean 1 1
SD .15 .1
Range .74–1.47 .77–1.36
Observed:Predicted Surface Area
Mean 1 1
SD .21 .15
Range .68–1.7 .75–1.46
doi:10.1371/journal.pone.0133984.t003
Edge Length and Surface Area of a Blank
PLOS ONE | DOI:10.1371/journal.pone.0133984 September 2, 2015 13 / 21

Fig 6. 3d plots of multiple regression results with platform thickness and EPA as predictors ofdifferent size variables.
doi:10.1371/journal.pone.0133984.g006
Edge Length and Surface Area of a Blank
PLOS ONE | DOI:10.1371/journal.pone.0133984 September 2, 2015 14 / 21

following a specific technology (blade vs. flake production), therefor we tested the correlationbetween blank morphology, i.e. length to width ratio, and efficiency. There is a significantincrease in efficiency with blanks that have a higher length to width ratio (rs = .4, p< .01)which is in agreement with previous work [28,30,69]. Allometry influences this relationship aswell. As blade length increases, width and thickness, and consequently mass, increase at aslower rate. As a result the overall weight of the blade increases as with increases in length [80].The other strategy of increasing efficiency involves producing blanks with larger areas relativeto their thickness. It has been suggested that in choosing either of these strategies, a flintknap-per can either decrease platform depth or increase EPA [69]. The experimental data from thisstudy do not clearly support this pattern. While EPA is positively correlated (rs = .38, p< .01)in hornfels and platform thickness negatively correlated with the efficiency index (rs = -.44, p<.01) in the entire assemblage, their relationships with morphology ratios are not so straightfor-ward. EPA correlates with the elongation index only in the hornfels assemblage (rs = -.26, p =.02), and it shows no correlation with the surface area to thickness ratio. Platform thickness isnegatively correlated with the elongation ratio (rs = -.25 p = .01) and the surface area to thick-ness (rs = -.3, p< .01) only in the flint assemblage, while in hornfels correlation exists, but isnot significant (rs = .21, p = .07). While EPA and platform depth contribute to flake shape,there is still unexplained variability of blank morphology that can potentially be attributed toother factors, e.g. technology of blank production. The weak relationship of platform variableswith blank morphology is possibly due to the fact that variables in experimental dataset are notheld constant as in controlled experiments, where these relationships have been established.Moreover, some variation in blank morphology can be explained by variables that cannot beobserved, such as angle of blow [98].
These two efficiency strategies (longer vs. large and thin blanks) would produce blanks ofdifferent morphologies. While both are beneficial in efficiency terms, they may diverge in theirutility properties. Prehistoric knappers at times may have focused on producing blanks thathave a higher potential for retouch. Although thick flakes may have been optimized for multi-ple episodes of retouch [84], the increased flake area could be achieved by producing blankswith larger areas and reduced thickness. Elongated blanks rarely exhibit this morphology[28,80]. Discrimination between these two blank forms can be informative when looking intoquestions of whether production was aimed for certain blank forms and their specific economicproperties and the means with which they were achieved. Some studies point to the relevanceof platform width that should be considered not only in prediction equations but in managingblank form as well [41,99]. In our dataset, the platform width to platform thickness ratio is pos-itively correlated with blank area to thickness ratio (rs = .32, p< .01) and negatively correlatedwith elongation ratio (rs = -.21, p = .01). This leads us to the idea that, aside from platformdepth and EPA, some morphological variation in blanks is directed by the shape of the plat-form [41].
ConclusionsThis study considers several aspects of blank size and shape. Studies on metric estimates areessential in issues of how much errors we have in our data and difficulties in comparing assem-blages with different measurement systems. Our dataset demonstrated that estimates of flakeedge length and surface areas are prone to, sometimes large, errors. Any analysis based on com-parisons of not only length and width measurements, but also edge length and surface area,either within an assemblage or between assemblages recorded with different methods, will beproblematic. Here we have provided comparisons of different methods that highlight whensome measurement techniques are more suitable than others. The suitability of a measurement
Edge Length and Surface Area of a Blank
PLOS ONE | DOI:10.1371/journal.pone.0133984 September 2, 2015 15 / 21
technique is highly dependent on the variable investigated and blank morphology. For the bestestimates of edge length, box and long axis method revealed similar and highly reliable results.These techniques are least dependent on the irregular morphology of blanks. Surface area esti-mates are best obtained using axial measures, though the box and the long axis methods exhibitreasonably good results, while the latter performs well for more irregular blank shapes. As adownside, the long axis measure for considerably skewed artifacts can result in a false impres-sion of laminarity. The long axis measure of length will always be very close to the maximumdimension, while width will rarely be at the maximum width of the piece. Given the degree ofinaccuracy of some measurement systems in either or both edge length and blank area estima-tion, the selection of measurement system employed in lithic analysis should be driven by theresearch question and the morphological variability of the archaeological assemblage.
An alternative way to assess size and shape properties in blanks is estimating the size varia-tion with the help of platform variables. These platform variables indicate how the size andshape of a blank are achieved. This is specifically aimed at reconstructing the size of modifiedand incomplete blanks. One way of assessing the amount of mass or surface area missing, is topredict original size and compare it with the measured value from the discarded artifact. Usingmultiple regression with predictor variables that are preserved in tools after they have beenretouched indicates that mass is predicted with greater accuracy than surface area. The errorproduced by the equation or ratios aimed at reconstructing the original weight make it difficultto precisely and accurately measure size. Surface area would be more extensively affected byretouch as it reduces faster than weight. This may be because the weight removed by theretouch is not substantial. It is, nevertheless, not predicted by platform variables as well as massis. One source of error may be in imprecise measures of predictor variables. There are still diffi-culties in overcoming this problem. First, there are different opinions on how the EPA shouldbe measured [42,99] and any error in validity of this measure may lower the predictive powerof this variable when compared to controlled experimental conditions. This said, there is cer-tainly more room for investigating how different EPA management techniques (beveling, abra-sion, etc.) affect blank size and morphology, and consequently, how to measure EPA in lithicanalysis. Second, obtaining digitized images of platform area, though tedious and/or expensivetask to perform on very large assemblages, can be feasible in some cases and has been shown toimprove the estimations of size for individual pieces [19,46]. Since blank size is seen as an out-come of variables other than platform size and angle, such as angle of blow, type of hammer,size of raw material etc. [98], misestimations of size can be due to these other variables or theirinteractions. These factors most likely account for the variance not explained by our indepen-dent variables. Given our results, nevertheless, regression models can still provide a relativemeasure of mass or area loss, rather than as an equation for realizing exact size values on indi-vidual pieces.
If prediction on an individual basis is not possible and scanned platform or more reliableEPA measures are not available, examining tendencies in how a certain morphology is obtainedwith regard to variables that can be controlled for (i.e. platform size and EPA) can be used asan additional inference to blank production tendencies [100]. A question we are interested in ishow much morphology and efficiency properties are influenced by platform variables directlymanipulated by the knapper. Previous research demonstrated how changing EPA and platformthickness produces blanks of different size, morphologies and utility characteristics. Consider-ing that there are different ways to increase size values, there may have been different strategiesto increase the properties of blanks, such as enlarging the length of usable edge while loweringthe mass, i.e. reducing transport costs, or extending the use-life of a tool that could be reshar-pened multiple times. According to the results of controlled experiments both of these mea-sures can be increased by manipulating the size of the platform and its angle [27].
Edge Length and Surface Area of a Blank
PLOS ONE | DOI:10.1371/journal.pone.0133984 September 2, 2015 16 / 21
The results of this study confirm the data originally identified in controlled experimentaland/or archaeological assemblages. Most importantly our experiments confirm the importanceof platform variables in their effect on the size of lithic products. While platform depthundoubtedly exerts a great influence on blank size and to a large extent on weight, the role ofEPA is more significant for 2-dimensional measures of size (i.e. surface area and edge length).Simultaneously increasing EPA and decreasing the thickness of the platform depth will pro-duce blanks with longer edges per unit of mass. Blank morphology, however, is not related toplatform variables in a straightforward way, most probably as a result of variables not con-trolled during production of our experimental assemblage and non-measurable variables thatinfluence blank shape, such as angle of blow [98]. Moreover, effect of EPA on blank size andshape that has been confirmed in controlled experimental conditions was not as strong in ourfreehand experiment. We believe that the cause probably lies in ways EPA is measured in lithicassemblages. Furthermore, while most of the experiments in controlled settings [70] have notinvestigated the effect of platform shape on blank shape, as platform width proportionallyincreases with platform thickness, our dataset shows that managing platform size has animpact on the final blank morphology. As platform width is, to a large extent, determined bycore size (namely core width) it can be hypothesized that core morphology is a factor that influ-ences blank shape. Core reduction strategy is thought to have direct effect on blank shape([3,4] but see [70]). This study, nevertheless, does not take into account the technology used toproduce blanks as the production process was not following a particular core reduction sys-tems, rather it relied on basic shape features of blanks. How much platform size, platformwidth to thickness ratio and EPA reflect morphology of the core or are manipulated immedi-ately before detaching a blank without core morphology playing significant role in blank size/shape, is a question that is beyond the scope of this paper. These results offer an independentconfirmation that platform variables offer an insight into size and morphology of the blankthat can further be used for estimating properties of unretouched or incomplete elements, thetendencies of blank production process, while in retouched elements it offers an approximateand relative measure of weight and area loss. Combined with other lines of evidence in lithicassemblages, this adds to our understanding of decisions that are made during the blank pro-duction process. This also provides some indication of the inferences of behavior that can beinvestigated when interpreting past behaviors and adaptations. Furthermore, this facet adds toan understanding of the character and organization of lithic technological systems and ques-tions on the evolution of lithic technology.
AcknowledgmentsWe thank Will Archer, Dawit Desta, Sam Lin, and Nicolas Zwyns for help making experimen-tal assemblage.
Author ContributionsConceived and designed the experiments: TD DRB SPM. Analyzed the data: TD. Wrote thepaper: TD DRB SPM.
References1. Shott MJ. Size and Form in the Analysis of Flake Debris: Review and Recent Approaches. J Archaeol
Method Theory. 1994; 1: 69–110.
2. Boëda E. Le concept Levallois: variabilité des méthodes. CNRS, Paris.; 1994.
3. Boëda E, Geneste J-M, Meignen L. Identification de chaînes opératoires lithiques du Paléolithiqueancien et moyen. Paléo. 1990; 2: 43–80. doi: 10.3406/pal.1990.988
Edge Length and Surface Area of a Blank
PLOS ONE | DOI:10.1371/journal.pone.0133984 September 2, 2015 17 / 21

4. Inizan M-L, Reduron-Ballinger M, Roche H, Tixier J. Préhistoire de la Pierre Taillée—t. 4: Technologiede la pierre taillée. CREP, Meudon; 1995.
5. Tixier J, Inizan M-L, Roche H. Préhistoire de la Pierre Taillée 1: Terminologie et Technologie. Cerclede Recherches et d’Etudes Préhistoriques, Valbonne; 1980.
6. Andrefsky W. Raw-Material Availability and the Organization of Technology. Am Antiq. 1994; 59: 21–34.
7. Bamforth DB. Technological Efficiency and Tool Curation. Am Antiq. 1986; 51: 38–50.
8. Binford LR. Organization and Formation Processes: Looking at Curated Technologies. J AnthropolRes. 1979; 35: 255–273.
9. Delagnes A, RenduW. Shifts in Neandertal mobility, technology and subsistence strategies in west-ern France. J Archaeol Sci. Elsevier Ltd; 2011; 38: 1771–1783. doi: 10.1016/j.jas.2011.04.007
10. Kelly RL. Mobility/Sedentism: Concepts, Archaeological Measures, and Effects. Annu Rev Anthropol.1992; 21: 43–66.
11. Kuhn SL. Mousterian Technology as Adaptive Response: A Case Study. Archeol Pap Am AnthropolAssoc. 1993; 4: 25–31.
12. Nelson MC. The Study of Technological Oganization. Archaeol Method Theory. 1991; 3: 57–100.
13. Shott J. The Role of Reduction Analysis in Lithic Studies. Lithic Technol. 2007; 32: 131–141.
14. Shott MJ. An Exegesis of the Curation Concept. J Anthropol Res. 1996; 52: 259–280.
15. Shott MJ. Technological Organization and Settlement Mobility: An Ethnographic Examination. JArchaeol Method Theory. 1986; 42: 15–51.
16. Torrence R. Time-Budgeting and Hunter-Gatherer Technology. In: Bailey G, editor. Hunter-GathererEconomy in Prehistory: A European Perspective. Cambridge: Cambridge University Press;1983. pp. 11–22.
17. Bamforth DB. Technological organization and Hunter-Gatherer Land Use: A California Example. AmAntiq. 1991; 56: 216–234.
18. Braun DR, Harris JWK. Technological Developments in the Oldowan of Koobi Fora: Innovative Tech-niques of Artifact Analysis. In: Martinez Moreno J, Mora R, de la Torre I, editors. Oldowan: Rathermore than smashing stones. Treballs d’Arqueologia 9; 2003. pp. 117–144.
19. Braun DR. Examining Flake Production Strategies: Examples from the Middle Paleolithic of South-west Asia. Lithic Technol. 2005; 30: 107–125.
20. Kuhn SL. A Formal Approach to the Design and Assembly of Mobile Toolkits. Am Antiq. 1994; 59:426–442.
21. Leroi-Gourhan A. La Geste et la parole. Albin Michel, Paris; 1964.
22. Kuhn S. Evolutionary perspectives on technology and technological change. World Archaeol. 2004;36: 561–570. doi: 10.1080/0043824042000303737
23. Brantingham PJ, Kuhn SL. Constraints on Levallois Core Technology: A Mathematical Model. JArchaeol Sci. 2001; 28: 747–761. doi: 10.1006/jasc.2000.0594
24. Eren MI, Lycett SJ. Why Levallois? A morphometric comparison of experimental “preferential” Leval-lois flakes versus debitage flakes. PLoS One. 2012; 7: e29273. doi: 10.1371/journal.pone.0029273PMID: 22291888
25. Van Peer P. The Levallois Reduction Strategy. Madison: Prehistory Press; 1992.
26. Chazan M, Belfer-Cohen A, Corbey R, Roebroeks W, Mellars P, Monnier G, et al. The LanguageHypothesis for the Paleolithic Transition An Examination Based on a Multiregional Lithic Analysis.Curr Anthropol. 1995; 36: 749–768.
27. Dibble HL, Rezek Z. Introducing a new experimental design for controlled studies of flake formation:results for exterior platform angle, platform depth, angle of blow, velocity, and force. J Archaeol Sci.Elsevier Ltd; 2009; 36: 1945–1954. doi: 10.1016/j.jas.2009.05.004
28. Eren MI, Greenspan A, Sampson CG. Are Upper Paleolithic blade cores more productive than MiddlePaleolithic discoidal cores? A replication experiment. J Hum Evol. Elsevier Ltd; 2008; 55: 952–61. doi:10.1016/j.jhevol.2008.07.009
29. McBrearty S, Brooks AS. The revolution that wasn’t: a new interpretation of the origin of modernhuman behavior. J Hum Evol. 2000; 39: 453–563. doi: 10.1006/jhev.2000.0435 PMID: 11102266
30. Bar-Yosef O, Kuhn SL. The Big Deal about Blades: Laminar Technologies and Human Evolution. AmAnthropol. 1999; 101: 322–338.
31. Révillion S, Tuffreau A, editors. Les Industries Laminaires au Paléolithique Moyen. Dossier de.CNRS, Paris; 1994.
Edge Length and Surface Area of a Blank
PLOS ONE | DOI:10.1371/journal.pone.0133984 September 2, 2015 18 / 21

32. Mackay A. A method for estimating edge length from flake dimensions: use and implications for tech-nological change in the southern African MSA. J Archaeol Sci. 2008; 35: 614–622. doi: 10.1016/j.jas.2007.05.013
33. Marks AE, Chabai VP. Stasis and Change During the Crimean Middle Paleolithic. In: Hovers Erella,Kuhn SL, editors. Transitions Before the Transition: Evolution and Stability in the Middle Paleolithicand Middle Stone Age. Springer New York; 2006. pp. 121–136.
34. Rasic J, AndrefskyW Jr. Alaskan Blade Cores as Specialized Components of Mobile Toolkits:Assessing Design Parameters and Toolkit Organization through Debitage Analysis. Lithic DebitageAnalysis: Context FormMeaning. University of Utah Press, Salt Lake City; 2001. pp. 233–258.
35. Sheets PD, Muto GR. Pressure Blades and Total Cutting Edge: An Experiment in Lithic Technology.Science (80). 1972; 175: 632–634.
36. Kuhn SL. Mousterian Lithic Technology: An Ecological Perspective. Princeton: Princeton UniversityPress; 1995.
37. Lycett SJ, Eren MI. Levallois economics: an examination of “waste” production in experimentally pro-duced Levallois reduction sequences. J Archaeol Sci. Elsevier Ltd; 2013; 40: 2384–2392. doi: 10.1016/j.jas.2013.01.016
38. Mackay A, Welz A. Engraved ochre from a Middle Stone Age context at Klein Kliphuis in theWesternCape of South Africa. J Archaeol Sci. 2008; 35: 1521–1532. doi: 10.1016/j.jas.2007.10.015
39. Roth BJ, Dibble HL. Production and Transport of Blanks and Tools at the French Middle PaleolithicSite of Combe-Capelle Bas. Am Antiq. 1998; 63: 47–62.
40. Dibble HL, Whittaker JC. New experimental evidence on the relation between percussion flaking andflake variation. J Archaeol Sci. 1981; 8: 283–296. doi: 10.1016/0305-4403(81)90004-2
41. Dibble HL. Platform variability and flake morphology: A comparison of experimental and archaeolog-ical data and implications for interpreting prehistoric lithic technological strategies. Lithic Technol.1997; 22: 150–170.
42. Dibble HL, Pelcin A. The Effect of Hammer Mass and Velocity on Flake Mass. J Archaeol Sci. 1995;22: 429–439. doi: 10.1006/jasc.1995.0042
43. Cadieux N. Size Matters: Measuring Debitage Area and Getting it Right with a Digital Scanner. LithicTechnol. 2013; 38: 46–70.
44. Braun DR, Rogers MJ, Harris JWK, Walker SJ. Landscape-scale variation in hominin tool use: Evi-dence from the Developed Oldowan. J Hum Evol. Elsevier Ltd; 2008; 55: 1053–63. doi: 10.1016/j.jhevol.2008.05.020
45. Bretzke K, Conard NJ. Evaluating morphological variability in lithic assemblages using 3D models ofstone artifacts. J Archaeol Sci. Elsevier Ltd; 2012; 39: 3741–3749. doi: 10.1016/j.jas.2012.06.039
46. Clarkson C, Hiscock P. Estimating original flake mass from 3D scans of platform area. J Archaeol Sci.Elsevier Ltd; 2011; 38: 1062–1068. doi: 10.1016/j.jas.2010.12.001
47. McPherron SP, Dibble HL. Stone Tool Analysis Using Digitized Images: Examples From The Lowerand Middle Paleolithic. Lithic Technol. 1999; 24: 38–52.
48. Andrefsky W. Lithics Macroscopic Approaches to Analysis. Cambridge: Cambridge University Press;2006.
49. Debénath A, Dibble HL. Handbook of Paleolithic Typology: Lower and Middle Paleolithic of Europe.Philadelphia: University Museum Press; 1994.
50. Jelinek AJ. A preliminary report on some lower and middle paleolithic industries from the Tabun Cave,Mount Carmel (Israel). In: Wendorf F, Marks AE, editors. Problems in Prehistory: North Africa and theLevant. Southern Methodist University Press, Dallas; 1975.
51. Dibble HL, Chase PG. A NewMethod for Describing and Analyzing Artifact Shape. Am Antiq. 1981;46: 178–187.
52. Frison GC. A Functional Analysis of Certain Chipped Stone Tools. Am Antiq. 1968; 33: 149–155.
53. Jelinek A. Form, Function and Style in Lithic Analysis. In: Cleland CE, editor. Cultural Change andContinuity: Essays in Honor of James Bennett Griffin. New York: Academic Press; 1976. pp. 19–33.
54. Dibble HL. Mousterian Assemblage Variability on an Interregional Scale. J Anthropol Res. 1991; 47:239–257.
55. Hiscock P, Clarkson C. Retouched Notches at Combe Grenal (France) and the Reduction Hypothe-sis. Am Antiq. 2007; 72: 176–190.
56. Hiscock P, Clarkson C. The construction of morphological diversity: A study of Mousterian imple-ments. In: AndrefskyW, editor. Lithic Technology: Measures of Production, Use, and Curation. Cam-bridge: Cambridge University Press; 2008. pp. 106–135.
Edge Length and Surface Area of a Blank
PLOS ONE | DOI:10.1371/journal.pone.0133984 September 2, 2015 19 / 21

57. McPherron S. A reexamination of the British Biface Data. Lithics. 1995; 16: 47–63.
58. McPherron SP. Typological and Technological Variability in the Bifaces from Tabun Cave, Israel. In:Soressi M, Dibble HL, editors. From prehistoric bifaces to human behavior: Multiple approaches to thestudy of bifacial technology. Philadelphia: University Museum Press; 2003. pp. 55–75.
59. Rolland N, Dibble HL. A New Synthesis of Middle Paleolithic Variability. Am Antiq. 1990; 55: 480–499.
60. Shott MJ, Sillitoe P. Use life and curation in New Guinea experimental used flakes. J Archaeol Sci.2005; 32: 653–663. doi: 10.1016/j.jas.2004.11.012
61. Blades BS. Reduction and Retouch as Independent Measures of Intensity. In: AndrefskyW Jr., editor.Lithic Technology: Measures of Production, Use, and Curation. Cambridge: Cambridge UniversityPress; 2001.
62. Brantingham PJ. Measuring Forager Mobility. Curr Anthropol. 2006; 47: 435–459. doi: 10.1086/503062
63. Clarkson C. An Index of Invasiveness for the Measurement of Unifacial and Bifacial Retouch: A Theo-retical, Experimental and Archaeological Verification. J Archaeol Sci. 2002; 29: 65–75. doi: 10.1006/jasc.2001.0702
64. Dibble HL. The Interpretation of Middle Paleolithic Scraper Morphology. Am Antiq. 1987; 52: 109–117.
65. Dibble HL. Middle Paleolithic Scraper Reduction: Background, Clarification, and Review of the Evi-dence to Date. J Archaeol Method Theory. 1995; 2: 299–368.
66. Eren M, Dominguez Rodrigo M, Kuhn S, Adler D, Le I, Bar-Yosef O. Defining and measuring reductionin unifacial stone tools. J Archaeol Sci. 2005; 32: 1190–1201. doi: 10.1016/j.jas.2005.03.003
67. Eren MI, Prendergast ME. Comparing and synthesizing unifacial stone tool reduction indices. In:Andrefsky W Jr., editor. Lithic Technology: Measures of Production, Use, and Curation. Cambridge:Cambridge University Press; 2008. pp. 49–85.
68. Kuhn SL. A geometric index of reduction for unifacial stone tools. J Archaeol Sci. 1990; 17: 583–593.doi: 10.1016/0305-4403(90)90038-7
69. Lin SC, Rezek Z, Braun D, Dibble HL. On the Utility and Economization of Unretouched Flakes: theEffects of Exterior Platform Angle and Platform Depth. Am Antiq. 2013; 78: 724–745.
70. Rezek Z, Lin S, Iovita R, Dibble HL. The relative effects of core surface morphology on flake shapeand other attributes. J Archaeol Sci. Elsevier Ltd; 2011; 38: 1346–1359. doi: 10.1016/j.jas.2011.01.014
71. Hiscock P, Tabrett A. Generalization, inference and the quantification of lithic reduction. WorldArchaeol. 2010; 42: 545–561. doi: 10.1080/00438243.2010.517669
72. Kuhn SL. Blank Form and Reduction as Determinants of Mousterian Scraper Morphology. Am Antiq.1992; 57: 115–128.
73. Muller A, Clarkson C. Estimating Original Flake Mass on Blades using 3D Platform Area: Problemsand Prospects. J Archaeol Sci. Elsevier Ltd; 2014; doi: 10.1016/j.jas.2014.08.025
74. Shott MJ, Bradbury AP, Carr PJ, Odell GH. Flake Size from Platform Attributes: Predictive and Empiri-cal Approaches. J Archaeol Sci. 2000; 27: 877–894. doi: 10.1006/jasc.1999.0499
75. Blades BS. End Scraper Reduction and Hunter-Gatherer Mobility. Am Antiq. 2003; 68: 141–156.
76. Shott MJ, Weedman KJ. Measuring reduction in stone tools: an ethnoarchaeological study of Gamohidescrapers from Ethiopia. J Archaeol Sci. 2007; 34: 1016–1035. doi: 10.1016/j.jas.2006.09.009
77. Dibble HL, McPherron SP. The Missing Mousterian. Curr Anthropol. 2006; 47: 777–803. doi: 10.1086/506282
78. Holdaway S, Douglass M. A Twenty-First Century Archaeology of Stone Artifacts [Internet]. Journal ofArchaeological Method and Theory. 2012. pp. 101–131. doi: 10.1007/s10816-011-9103-6
79. Tactikos JC. A Re-Evaluation of Palaeolithic Stone Tool Cutting Edge Production Rates and TheirImplications. In: Moloney N, Shott MJ, editors. Lithic Analysis at the Millenium. 2003. pp. 151–162.
80. Kuhn SL. The Trouble with Ham Steaks: A Reply to Morrow. Am Anthropol. 1996; 61: 591–595.
81. Morrow TA. Bigger is Better: Comments on Kuhn’s Formal Approach to Moblie Tool Kits. Am Antiq.1996; 61: 581–590.
82. Geneste J-M. Analyse lithique d’industries moustériennes du Périgord: une approche technologiquedu comportement des groupes humains au Paléolithique moyen. Université de Bordeaux I. 1985. p.572.
83. Rensink E, Kolen J, Spieksma A. Patterns of RawMaterial Distribution in the Upper Pleistocene ofNorthwest and Central Europe. In: Montet-White A, Holen S, editors. RawMaterial Economies AmongPrehistoric Hunter-Gatherers. Publicatio. University of Kansas, Lawrence; 1991. pp. 141–160.
Edge Length and Surface Area of a Blank
PLOS ONE | DOI:10.1371/journal.pone.0133984 September 2, 2015 20 / 21
84. Turq A. Approche technologique et économique du faciès Moustérien de type Quina: étude prélimi-naire. Bull la Société préhistorique française. 1989; 86: 244–256. doi: 10.3406/bspf.1989.9390
85. Turq A. Rawmaterial and technological studies of the Quina Mousterian in Perigord. In: Dibble HL,Mellars P, editors. The Middle Paleolithic: Adaptation, Behavior, and Variability. The UniversityMuseum, University of Pennsylvania, Philadelphia; 1992. pp. 75–85.
86. Turq A. Le Moustérien de type Quina. Paléo. 2000; 2: 310–343. doi: 10.3406/pal.2000.1275
87. Speth JD. Miscellaneous Studies in Hard-Hammer Percussion Flaking: The Effects of Oblique Impact.Am Antiq. 1972; 40: 203–207.
88. McPherron SP, Braun DR, Dogandžić T, Desta D, Lin SC. An experimental assessment of the influ-ences on edge damage to lithic artifacts: a consideration of edge angle, substrate grain size, rawmaterial properties, and exposed face. J Archaeol Sci. 2014; 49: 70–82. doi: 10.1016/j.jas.2014.04.003
89. Bordes F. Typologie du Paléolithique Ancien et Moyen. Paris: Centre National de la RechercheScientifique; 1961.
90. Leach BF. The Concept of Similarity in Prehistoric Studies. Studies in. University of Otago; 1969.
91. Dibble HL, Holdaway SJ, Lenoir M, McPherron S, Roth B, Sanders-Gray H. Techniques of Excavationand Analysis. In: Dibble HL, Lenoir M, editors. The Middle Paleolithic site of Combe-Capelle Bas(France). University of Pennsylvania Museum; 1995. pp. 27–40.
92. Jelinek AJ. A preliminary study of flakes from the Tabun cave, Mount Carmel. Eretz Isr. 1977; 13: 87–96.
93. Clark JD, Kleindienst MR. The Stone Age cultural sequence: terminology, typology and raw material.In: Clark JD, editor. Kalambo Falls Prehistoric Site: Volume 3. Cambridge: Cambridge UniversityPress.; 2001. pp. 34–65.
94. Clark JD. Kalambo Falls prehistoric site, volume II. Cambridge: Cambridge University Press; 1974.
95. R Core Team. R: A language and environment for statistical computing [Internet]. Vienna, Austria: RFoundation for Statistical Computing; 2014. Available: //www.r-project.org/
96. Dibble H. Comment on “Quantifying Lithic Curation: An Experimental Test of Dibble and Pelcin’s Origi-nal Flake-Tool Mass Predictor”, by Zachary J. Davis and John J. Shea. J Archaeol Sci. 1998; 25: 611–613. doi: 10.1006/jasc.1997.0254
97. Grömping U. Estimators of Relative Importance in Linear Regression Based on Variance Decomposi-tion. Am Stat. 2007; 61: 139–147. doi: 10.1198/000313007X188252
98. Magnani M, Rezek Z, Lin SC, Chan A, Dibble HL. Flake variation in relation to the application of force.J Archaeol Sci. Elsevier Ltd; 2014; 46: 37–49. doi: 10.1016/j.jas.2014.02.029
99. Davis ZJ, Shea JJ. Quantifying Lithic Curation: An Experimental Test of Dibble and Pelcin’s OriginalFlake-Tool Mass Predictor. J Archaeol Sci. 1998; 25: 603–610. doi: 10.1006/jasc.1997.0255
100. Tostevin GB. Seeing Lithics: A Middle-Range Theory for Testing for Cultural Transmission in thePleistocene. American School of Prehistoric Research Monograph Series, Peabody Museum, Har-vard University, & Oxbow Books; 2012.
Edge Length and Surface Area of a Blank
PLOS ONE | DOI:10.1371/journal.pone.0133984 September 2, 2015 21 / 21