SDJAB2021FORM Blank Template 09.03.20.xlsx
34
-
Upload
khangminh22 -
Category
Documents
-
view
2 -
download
0
Transcript of SDJAB2021FORM Blank Template 09.03.20.xlsx
Page 2 BUDGET SUMMARY Page 2
1
2
3
45
6789
1011
12131415161718
19
2021
22
232425
26
2728293031
32
3334
353637
383940414243444546
A B C D E F G H I J K LBegin entering data on EstRev 5‐10 and EstExp 11‐17 tabs. (10) (20) (30) (40) (50) (60) (70) (80) (90)
Description: Enter Whole Numbers Only
Acct # Educational Operations &
Maintenance
Debt Service Transportation Municipal
Retirement/ Social
Security
Capital Projects Working Cash Tort Fire Prevention &
Safety
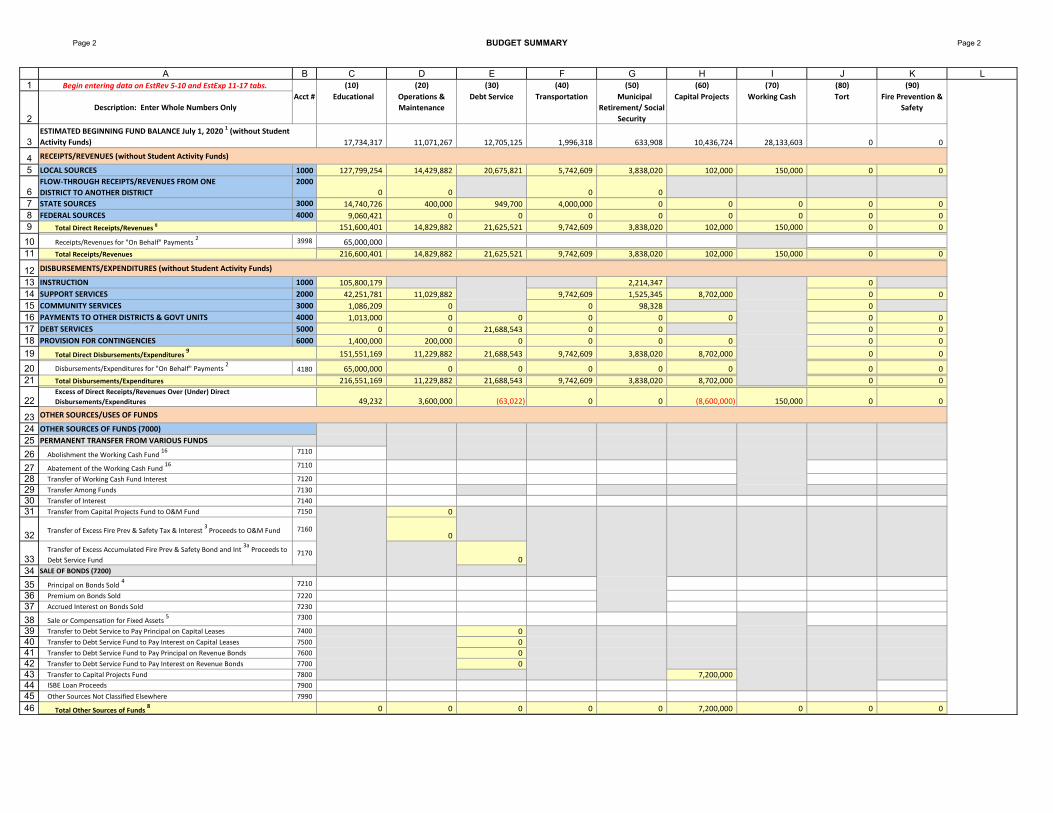
ESTIMATED BEGINNING FUND BALANCE July 1, 2020 1 (without Student
Activity Funds) 17,734,317 11,071,267 12,705,125 1,996,318 633,908 10,436,724 28,133,603 0 0
RECEIPTS/REVENUES (without Student Activity Funds)
LOCAL SOURCES 1000 127,799,254 14,429,882 20,675,821 5,742,609 3,838,020 102,000 150,000 0 0
FLOW‐THROUGH RECEIPTS/REVENUES FROM ONE
DISTRICT TO ANOTHER DISTRICT
2000
0 0 0 0
STATE SOURCES 3000 14,740,726 400,000 949,700 4,000,000 0 0 0 0 0
FEDERAL SOURCES 4000 9,060,421 0 0 0 0 0 0 0 0
Total Direct Receipts/Revenues 8 151,600,401 14,829,882 21,625,521 9,742,609 3,838,020 102,000 150,000 0 0
Receipts/Revenues for "On Behalf" Payments 2 3998 65,000,000
Total Receipts/Revenues 216,600,401 14,829,882 21,625,521 9,742,609 3,838,020 102,000 150,000 0 0
DISBURSEMENTS/EXPENDITURES (without Student Activity Funds)
INSTRUCTION 1000 105,800,179 2,214,347 0
SUPPORT SERVICES 2000 42,251,781 11,029,882 9,742,609 1,525,345 8,702,000 0 0
COMMUNITY SERVICES 3000 1,086,209 0 0 98,328 0
PAYMENTS TO OTHER DISTRICTS & GOVT UNITS 4000 1,013,000 0 0 0 0 0 0 0
DEBT SERVICES 5000 0 0 21,688,543 0 0 0 0
PROVISION FOR CONTINGENCIES 6000 1,400,000 200,000 0 0 0 0 0 0
Total Direct Disbursements/Expenditures 9 151,551,169 11,229,882 21,688,543 9,742,609 3,838,020 8,702,000 0 0
Disbursements/Expenditures for "On Behalf" Payments 2
4180 65,000,000 0 0 0 0 0 0 0
Total Disbursements/Expenditures 216,551,169 11,229,882 21,688,543 9,742,609 3,838,020 8,702,000 0 0
Excess of Direct Receipts/Revenues Over (Under) Direct
Disbursements/Expenditures 49,232 3,600,000 (63,022) 0 0 (8,600,000) 150,000 0 0
OTHER SOURCES/USES OF FUNDS
OTHER SOURCES OF FUNDS (7000)
PERMANENT TRANSFER FROM VARIOUS FUNDS
Abolishment the Working Cash Fund 16 7110
Abatement of the Working Cash Fund 16 7110
Transfer of Working Cash Fund Interest 7120
Transfer Among Funds 7130
Transfer of Interest 7140
Transfer from Capital Projects Fund to O&M Fund 7150 0
Transfer of Excess Fire Prev & Safety Tax & Interest 3 Proceeds to O&M Fund 7160
0
Transfer of Excess Accumulated Fire Prev & Safety Bond and Int 3a Proceeds to
Debt Service Fund7170
0
SALE OF BONDS (7200)
Principal on Bonds Sold 4 7210
Premium on Bonds Sold 7220
Accrued Interest on Bonds Sold 7230
Sale or Compensation for Fixed Assets 5 7300
Transfer to Debt Service to Pay Principal on Capital Leases 7400 0Transfer to Debt Service Fund to Pay Interest on Capital Leases 7500 0Transfer to Debt Service Fund to Pay Principal on Revenue Bonds 7600 0Transfer to Debt Service Fund to Pay Interest on Revenue Bonds 7700 0Transfer to Capital Projects Fund 7800 7,200,000ISBE Loan Proceeds 7900
Other Sources Not Classified Elsewhere 7990
Total Other Sources of Funds 8 0 0 0 0 0 7,200,000 0 0 0
Page 3 BUDGET SUMMARY Page 3
1
2
A B C D E F G H I J K LBegin entering data on EstRev 5‐10 and EstExp 11‐17 tabs. (10) (20) (30) (40) (50) (60) (70) (80) (90)
Description: Enter Whole Numbers Only
Acct # Educational Operations &
Maintenance
Debt Service Transportation Municipal
Retirement/ Social
Security
Capital Projects Working Cash Tort Fire Prevention &
Safety
4749
505152
5354
55
5657585960616263646566676869707172737475767778
79
80
8182
83
8485
86
87
888990
91
9293
9495
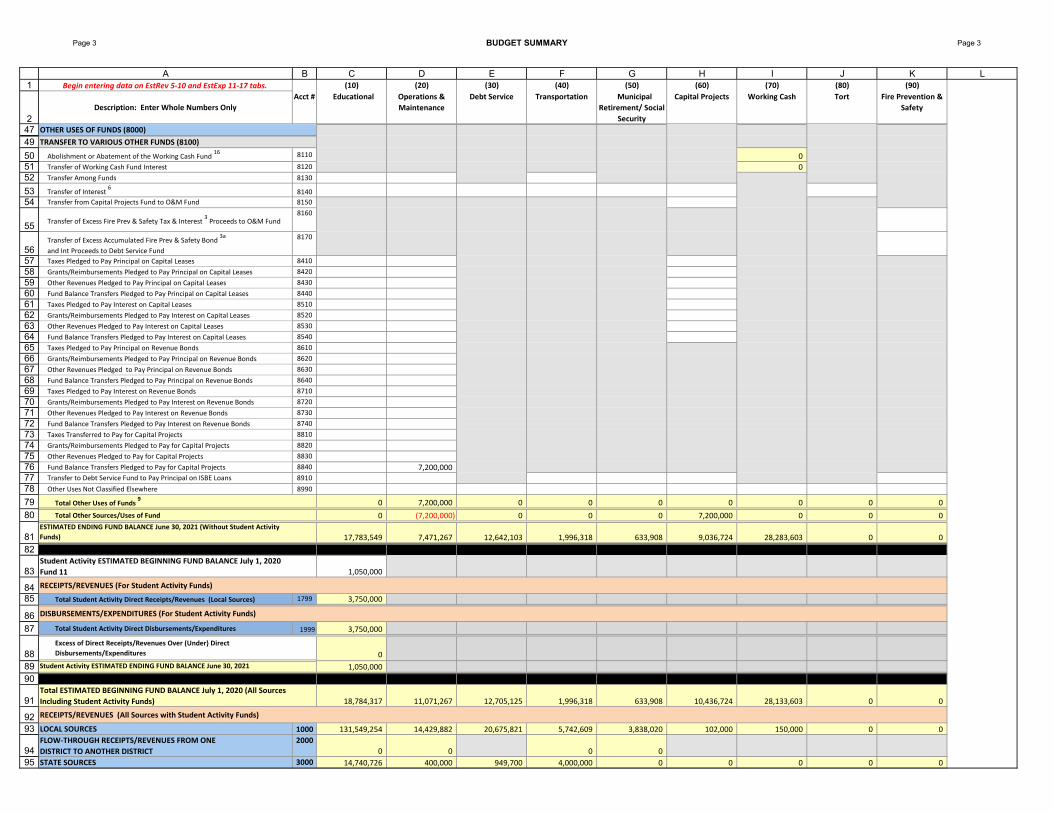
OTHER USES OF FUNDS (8000)
TRANSFER TO VARIOUS OTHER FUNDS (8100)
Abolishment or Abatement of the Working Cash Fund 16 8110 0
Transfer of Working Cash Fund Interest 8120 0Transfer Among Funds 8130
Transfer of Interest 6
8140
Transfer from Capital Projects Fund to O&M Fund 8150
Transfer of Excess Fire Prev & Safety Tax & Interest 3 Proceeds to O&M Fund
8160
Transfer of Excess Accumulated Fire Prev & Safety Bond 3a
and Int Proceeds to Debt Service Fund
8170
Taxes Pledged to Pay Principal on Capital Leases 8410
Grants/Reimbursements Pledged to Pay Principal on Capital Leases 8420
Other Revenues Pledged to Pay Principal on Capital Leases 8430
Fund Balance Transfers Pledged to Pay Principal on Capital Leases 8440
Taxes Pledged to Pay Interest on Capital Leases 8510
Grants/Reimbursements Pledged to Pay Interest on Capital Leases 8520
Other Revenues Pledged to Pay Interest on Capital Leases 8530
Fund Balance Transfers Pledged to Pay Interest on Capital Leases 8540
Taxes Pledged to Pay Principal on Revenue Bonds 8610
Grants/Reimbursements Pledged to Pay Principal on Revenue Bonds 8620
Other Revenues Pledged to Pay Principal on Revenue Bonds 8630
Fund Balance Transfers Pledged to Pay Principal on Revenue Bonds 8640
Taxes Pledged to Pay Interest on Revenue Bonds 8710
Grants/Reimbursements Pledged to Pay Interest on Revenue Bonds 8720
Other Revenues Pledged to Pay Interest on Revenue Bonds 8730
Fund Balance Transfers Pledged to Pay Interest on Revenue Bonds 8740
Taxes Transferred to Pay for Capital Projects 8810
Grants/Reimbursements Pledged to Pay for Capital Projects 8820
Other Revenues Pledged to Pay for Capital Projects 8830
Fund Balance Transfers Pledged to Pay for Capital Projects 8840 7,200,000Transfer to Debt Service Fund to Pay Principal on ISBE Loans 8910
Other Uses Not Classified Elsewhere 8990
Total Other Uses of Funds 9
0 7,200,000 0 0 0 0 0 0 0
Total Other Sources/Uses of Fund 0 (7,200,000) 0 0 0 7,200,000 0 0 0
ESTIMATED ENDING FUND BALANCE June 30, 2021 (Without Student Activity
Funds) 17,783,549 7,471,267 12,642,103 1,996,318 633,908 9,036,724 28,283,603 0 0
Student Activity ESTIMATED BEGINNING FUND BALANCE July 1, 2020
Fund 11 1,050,000
RECEIPTS/REVENUES (For Student Activity Funds)
Total Student Activity Direct Receipts/Revenues (Local Sources) 1799 3,750,000
DISBURSEMENTS/EXPENDITURES (For Student Activity Funds)
Total Student Activity Direct Disbursements/Expenditures 1999 3,750,000
Excess of Direct Receipts/Revenues Over (Under) Direct
Disbursements/Expenditures 0
Student Activity ESTIMATED ENDING FUND BALANCE June 30, 2021 1,050,000
Total ESTIMATED BEGINNING FUND BALANCE July 1, 2020 (All Sources
Including Student Activity Funds) 18,784,317 11,071,267 12,705,125 1,996,318 633,908 10,436,724 28,133,603 0 0
RECEIPTS/REVENUES (All Sources with Student Activity Funds)
LOCAL SOURCES 1000 131,549,254 14,429,882 20,675,821 5,742,609 3,838,020 102,000 150,000 0 0
FLOW‐THROUGH RECEIPTS/REVENUES FROM ONE
DISTRICT TO ANOTHER DISTRICT
2000
0 0 0 0
STATE SOURCES 3000 14,740,726 400,000 949,700 4,000,000 0 0 0 0 0
Page 4 BUDGET SUMMARY Page 4
1
2
A B C D E F G H I J K LBegin entering data on EstRev 5‐10 and EstExp 11‐17 tabs. (10) (20) (30) (40) (50) (60) (70) (80) (90)
Description: Enter Whole Numbers Only
Acct # Educational Operations &
Maintenance
Debt Service Transportation Municipal
Retirement/ Social
Security
Capital Projects Working Cash Tort Fire Prevention &
Safety
9697
9899
100101102103104105106
107
108109
110
111112113114
116
117
118119120121
122
123124125126127128129130131132
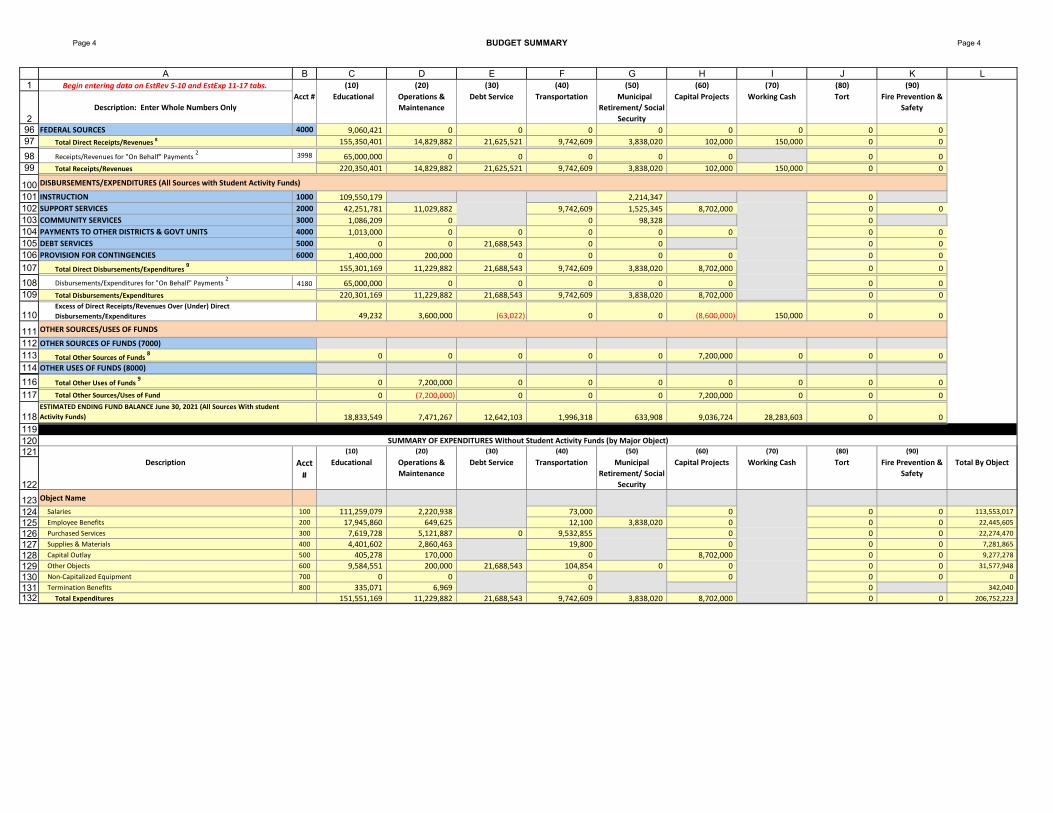
FEDERAL SOURCES 4000 9,060,421 0 0 0 0 0 0 0 0
Total Direct Receipts/Revenues 8 155,350,401 14,829,882 21,625,521 9,742,609 3,838,020 102,000 150,000 0 0
Receipts/Revenues for "On Behalf" Payments 2 3998 65,000,000 0 0 0 0 0 0 0
Total Receipts/Revenues 220,350,401 14,829,882 21,625,521 9,742,609 3,838,020 102,000 150,000 0 0
DISBURSEMENTS/EXPENDITURES (All Sources with Student Activity Funds)
INSTRUCTION 1000 109,550,179 2,214,347 0
SUPPORT SERVICES 2000 42,251,781 11,029,882 9,742,609 1,525,345 8,702,000 0 0
COMMUNITY SERVICES 3000 1,086,209 0 0 98,328 0
PAYMENTS TO OTHER DISTRICTS & GOVT UNITS 4000 1,013,000 0 0 0 0 0 0 0
DEBT SERVICES 5000 0 0 21,688,543 0 0 0 0
PROVISION FOR CONTINGENCIES 6000 1,400,000 200,000 0 0 0 0 0 0
Total Direct Disbursements/Expenditures 9 155,301,169 11,229,882 21,688,543 9,742,609 3,838,020 8,702,000 0 0
Disbursements/Expenditures for "On Behalf" Payments 2
4180 65,000,000 0 0 0 0 0 0 0
Total Disbursements/Expenditures 220,301,169 11,229,882 21,688,543 9,742,609 3,838,020 8,702,000 0 0
Excess of Direct Receipts/Revenues Over (Under) Direct
Disbursements/Expenditures 49,232 3,600,000 (63,022) 0 0 (8,600,000) 150,000 0 0
OTHER SOURCES/USES OF FUNDS
OTHER SOURCES OF FUNDS (7000)
Total Other Sources of Funds 8 0 0 0 0 0 7,200,000 0 0 0
OTHER USES OF FUNDS (8000)
Total Other Uses of Funds 9
0 7,200,000 0 0 0 0 0 0 0
Total Other Sources/Uses of Fund 0 (7,200,000) 0 0 0 7,200,000 0 0 0
ESTIMATED ENDING FUND BALANCE June 30, 2021 (All Sources With student
Activity Funds) 18,833,549 7,471,267 12,642,103 1,996,318 633,908 9,036,724 28,283,603 0 0
SUMMARY OF EXPENDITURES Without Student Activity Funds (by Major Object)(10) (20) (30) (40) (50) (60) (70) (80) (90)
Description Acct
#
Educational Operations &
Maintenance
Debt Service Transportation Municipal
Retirement/ Social
Security
Capital Projects Working Cash Tort Fire Prevention &
Safety
Total By Object
Object Name
Salaries 100 111,259,079 2,220,938 73,000 0 0 0 113,553,017
Employee Benefits 200 17,945,860 649,625 12,100 3,838,020 0 0 0 22,445,605
Purchased Services 300 7,619,728 5,121,887 0 9,532,855 0 0 0 22,274,470
Supplies & Materials 400 4,401,602 2,860,463 19,800 0 0 0 7,281,865
Capital Outlay 500 405,278 170,000 0 8,702,000 0 0 9,277,278
Other Objects 600 9,584,551 200,000 21,688,543 104,854 0 0 0 0 31,577,948
Non‐Capitalized Equipment 700 0 0 0 0 0 0 0
Termination Benefits 800 335,071 6,969 0 0 342,040
Total Expenditures 151,551,169 11,229,882 21,688,543 9,742,609 3,838,020 8,702,000 0 0 206,752,223
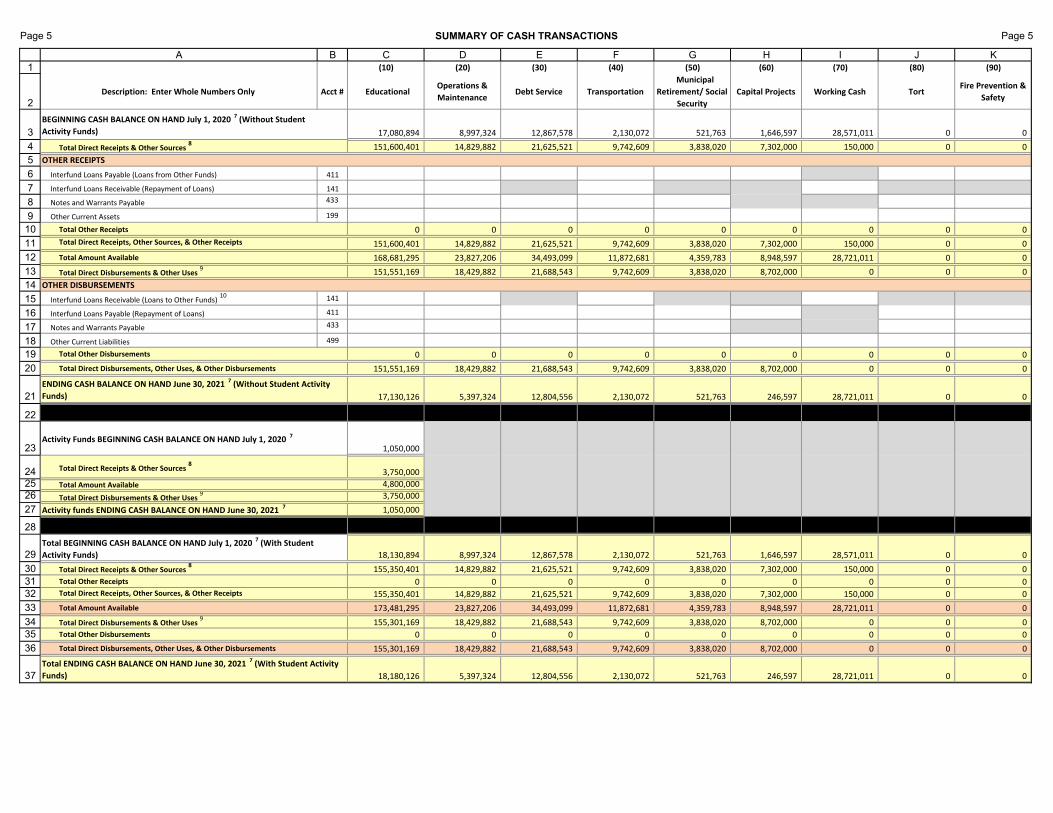
Page 5 SUMMARY OF CASH TRANSACTIONS Page 5
1
2
3
45
6
7
8
910
11
12
1314
15
16
17
1819
20
21
22
23
242526
27
28
29
303132
33
3435
36
37
A B C D E F G H I J K(10) (20) (30) (40) (50) (60) (70) (80) (90)
Description: Enter Whole Numbers Only Acct # Educational Operations &
MaintenanceDebt Service Transportation
Municipal
Retirement/ Social
Security
Capital Projects Working Cash TortFire Prevention &
Safety
BEGINNING CASH BALANCE ON HAND July 1, 2020 7 (Without Student
Activity Funds) 17,080,894 8,997,324 12,867,578 2,130,072 521,763 1,646,597 28,571,011 0 0
151,600,401 14,829,882 21,625,521 9,742,609 3,838,020 7,302,000 150,000 0 0
OTHER RECEIPTS
Interfund Loans Payable (Loans from Other Funds) 411
Interfund Loans Receivable (Repayment of Loans) 141
Notes and Warrants Payable 433
Other Current Assets 199
Total Other Receipts 0 0 0 0 0 0 0 0 0
151,600,401 14,829,882 21,625,521 9,742,609 3,838,020 7,302,000 150,000 0 0
Total Amount Available 168,681,295 23,827,206 34,493,099 11,872,681 4,359,783 8,948,597 28,721,011 0 0
151,551,169 18,429,882 21,688,543 9,742,609 3,838,020 8,702,000 0 0 0
OTHER DISBURSEMENTS
Interfund Loans Receivable (Loans to Other Funds) 10 141
Interfund Loans Payable (Repayment of Loans) 411
Notes and Warrants Payable 433
Other Current Liabilities 499
0 0 0 0 0 0 0 0 0
Total Direct Disbursements, Other Uses, & Other Disbursements 151,551,169 18,429,882 21,688,543 9,742,609 3,838,020 8,702,000 0 0 0
17,130,126 5,397,324 12,804,556 2,130,072 521,763 246,597 28,721,011 0 0
Activity Funds BEGINNING CASH BALANCE ON HAND July 1, 2020 7
1,050,000
3,750,000
Total Amount Available 4,800,000
3,750,000
1,050,000
Total BEGINNING CASH BALANCE ON HAND July 1, 2020 7 (With Student
Activity Funds) 18,130,894 8,997,324 12,867,578 2,130,072 521,763 1,646,597 28,571,011 0 0
155,350,401 14,829,882 21,625,521 9,742,609 3,838,020 7,302,000 150,000 0 0
Total Other Receipts 0 0 0 0 0 0 0 0 0
155,350,401 14,829,882 21,625,521 9,742,609 3,838,020 7,302,000 150,000 0 0
Total Amount Available 173,481,295 23,827,206 34,493,099 11,872,681 4,359,783 8,948,597 28,721,011 0 0
155,301,169 18,429,882 21,688,543 9,742,609 3,838,020 8,702,000 0 0 0
0 0 0 0 0 0 0 0 0
Total Direct Disbursements, Other Uses, & Other Disbursements 155,301,169 18,429,882 21,688,543 9,742,609 3,838,020 8,702,000 0 0 0
18,180,126 5,397,324 12,804,556 2,130,072 521,763 246,597 28,721,011 0 0
Total Direct Disbursements & Other Uses 9
Total Other Disbursements
Total ENDING CASH BALANCE ON HAND June 30, 2021 7 (With Student Activity
Funds)
Total Direct Disbursements & Other Uses 9
Activity funds ENDING CASH BALANCE ON HAND June 30, 2021 7
Total Direct Receipts & Other Sources 8
Total Direct Receipts, Other Sources, & Other Receipts
Total Direct Receipts & Other Sources 8
Total Direct Receipts & Other Sources 8
Total Direct Receipts, Other Sources, & Other Receipts
Total Direct Disbursements & Other Uses 9
Total Other Disbursements
ENDING CASH BALANCE ON HAND June 30, 2021 7 (Without Student Activity
Funds)
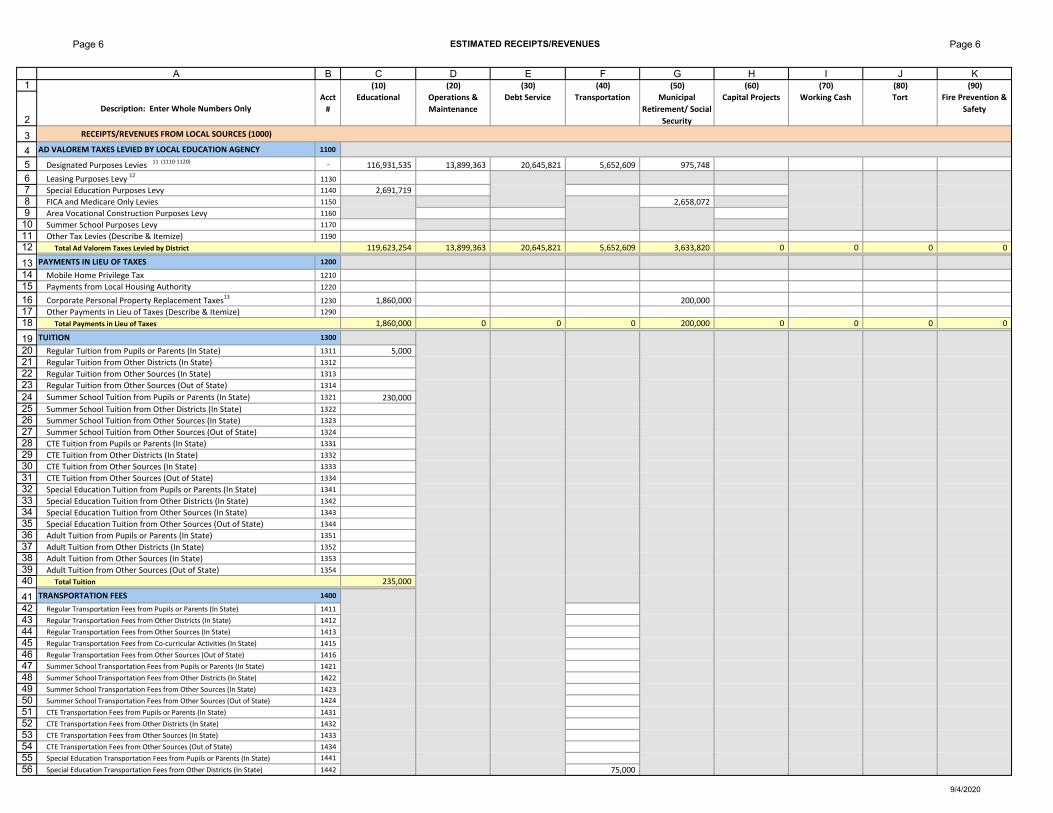
Page 6 ESTIMATED RECEIPTS/REVENUES Page 6
1
2
3
456789101112
131415161718
19202122232425262728293031323334353637383940
41424344454647484950515253545556
A B C D E F G H I J K(10) (20) (30) (40) (50) (60) (70) (80) (90)
Description: Enter Whole Numbers Only
Acct
#
Educational Operations &
Maintenance
Debt Service Transportation Municipal
Retirement/ Social
Security
Capital Projects Working Cash Tort Fire Prevention &
Safety
RECEIPTS/REVENUES FROM LOCAL SOURCES (1000)
AD VALOREM TAXES LEVIED BY LOCAL EDUCATION AGENCY 1100
Designated Purposes Levies 11 (1110‐1120) ‐ 116,931,535 13,899,363 20,645,821 5,652,609 975,748
Leasing Purposes Levy 12
1130
Special Education Purposes Levy 1140 2,691,719
FICA and Medicare Only Levies 1150 2,658,072
Area Vocational Construction Purposes Levy 1160
Summer School Purposes Levy 1170
Other Tax Levies (Describe & Itemize) 1190
Total Ad Valorem Taxes Levied by District 119,623,254 13,899,363 20,645,821 5,652,609 3,633,820 0 0 0 0
PAYMENTS IN LIEU OF TAXES 1200
Mobile Home Privilege Tax 1210
Payments from Local Housing Authority 1220
Corporate Personal Property Replacement Taxes13 1230 1,860,000 200,000
Other Payments in Lieu of Taxes (Describe & Itemize) 1290
Total Payments in Lieu of Taxes 1,860,000 0 0 0 200,000 0 0 0 0
TUITION 1300
Regular Tuition from Pupils or Parents (In State) 1311 5,000
Regular Tuition from Other Districts (In State) 1312
Regular Tuition from Other Sources (In State) 1313
Regular Tuition from Other Sources (Out of State) 1314
Summer School Tuition from Pupils or Parents (In State) 1321 230,000
Summer School Tuition from Other Districts (In State) 1322
Summer School Tuition from Other Sources (In State) 1323
Summer School Tuition from Other Sources (Out of State) 1324
CTE Tuition from Pupils or Parents (In State) 1331
CTE Tuition from Other Districts (In State) 1332
CTE Tuition from Other Sources (In State) 1333
CTE Tuition from Other Sources (Out of State) 1334
Special Education Tuition from Pupils or Parents (In State) 1341
Special Education Tuition from Other Districts (In State) 1342
Special Education Tuition from Other Sources (In State) 1343
Special Education Tuition from Other Sources (Out of State) 1344
Adult Tuition from Pupils or Parents (In State) 1351
Adult Tuition from Other Districts (In State) 1352
Adult Tuition from Other Sources (In State) 1353
Adult Tuition from Other Sources (Out of State) 1354
Total Tuition 235,000
TRANSPORTATION FEES 1400
Regular Transportation Fees from Pupils or Parents (In State) 1411
Regular Transportation Fees from Other Districts (In State) 1412
Regular Transportation Fees from Other Sources (In State) 1413
Regular Transportation Fees from Co‐curricular Activities (In State) 1415
Regular Transportation Fees from Other Sources (Out of State) 1416
Summer School Transportation Fees from Pupils or Parents (In State) 1421
Summer School Transportation Fees from Other Districts (In State) 1422
Summer School Transportation Fees from Other Sources (In State) 1423
Summer School Transportation Fees from Other Sources (Out of State) 1424
CTE Transportation Fees from Pupils or Parents (In State) 1431
CTE Transportation Fees from Other Districts (In State) 1432
CTE Transportation Fees from Other Sources (In State) 1433
CTE Transportation Fees from Other Sources (Out of State) 1434
Special Education Transportation Fees from Pupils or Parents (In State) 1441
Special Education Transportation Fees from Other Districts (In State) 1442 75,000
9/4/2020
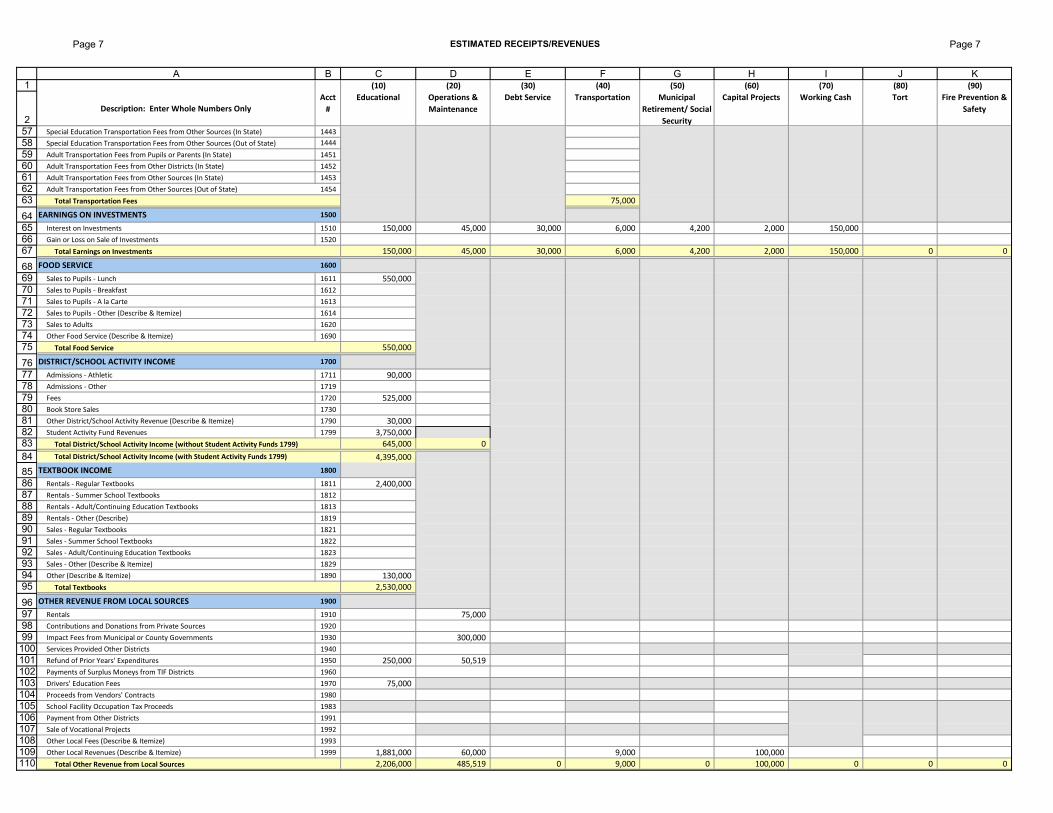
Page 7 ESTIMATED RECEIPTS/REVENUES Page 7
1
2
A B C D E F G H I J K(10) (20) (30) (40) (50) (60) (70) (80) (90)
Description: Enter Whole Numbers Only
Acct
#
Educational Operations &
Maintenance
Debt Service Transportation Municipal
Retirement/ Social
Security
Capital Projects Working Cash Tort Fire Prevention &
Safety
57585960616263
64656667
6869707172737475
767778798081828384
8586878889909192939495
96979899100101102103104105106107108109110
Special Education Transportation Fees from Other Sources (In State) 1443
Special Education Transportation Fees from Other Sources (Out of State) 1444
Adult Transportation Fees from Pupils or Parents (In State) 1451
Adult Transportation Fees from Other Districts (In State) 1452
Adult Transportation Fees from Other Sources (In State) 1453
Adult Transportation Fees from Other Sources (Out of State) 1454
Total Transportation Fees 75,000
EARNINGS ON INVESTMENTS 1500
Interest on Investments 1510 150,000 45,000 30,000 6,000 4,200 2,000 150,000Gain or Loss on Sale of Investments 1520
Total Earnings on Investments 150,000 45,000 30,000 6,000 4,200 2,000 150,000 0 0
FOOD SERVICE 1600
Sales to Pupils ‐ Lunch 1611 550,000
Sales to Pupils ‐ Breakfast 1612
Sales to Pupils ‐ A la Carte 1613
Sales to Pupils ‐ Other (Describe & Itemize) 1614
Sales to Adults 1620
Other Food Service (Describe & Itemize) 1690
Total Food Service 550,000
DISTRICT/SCHOOL ACTIVITY INCOME 1700
Admissions ‐ Athletic 1711 90,000Admissions ‐ Other 1719
Fees 1720 525,000Book Store Sales 1730
Other District/School Activity Revenue (Describe & Itemize) 1790 30,000Student Activity Fund Revenues 1799 3,750,000
Total District/School Activity Income (without Student Activity Funds 1799) 645,000 0
Total District/School Activity Income (with Student Activity Funds 1799) 4,395,000
TEXTBOOK INCOME 1800
Rentals ‐ Regular Textbooks 1811 2,400,000Rentals ‐ Summer School Textbooks 1812
Rentals ‐ Adult/Continuing Education Textbooks 1813
Rentals ‐ Other (Describe) 1819
Sales ‐ Regular Textbooks 1821
Sales ‐ Summer School Textbooks 1822
Sales ‐ Adult/Continuing Education Textbooks 1823
Sales ‐ Other (Describe & Itemize) 1829
Other (Describe & Itemize) 1890 130,000
Total Textbooks 2,530,000
OTHER REVENUE FROM LOCAL SOURCES 1900
Rentals 1910 75,000Contributions and Donations from Private Sources 1920
Impact Fees from Municipal or County Governments 1930 300,000Services Provided Other Districts 1940
Refund of Prior Years' Expenditures 1950 250,000 50,519Payments of Surplus Moneys from TIF Districts 1960
Drivers' Education Fees 1970 75,000
Proceeds from Vendors' Contracts 1980
School Facility Occupation Tax Proceeds 1983
Payment from Other Districts 1991
Sale of Vocational Projects 1992
Other Local Fees (Describe & Itemize) 1993
Other Local Revenues (Describe & Itemize) 1999 1,881,000 60,000 9,000 100,000
Total Other Revenue from Local Sources 2,206,000 485,519 0 9,000 0 100,000 0 0 0
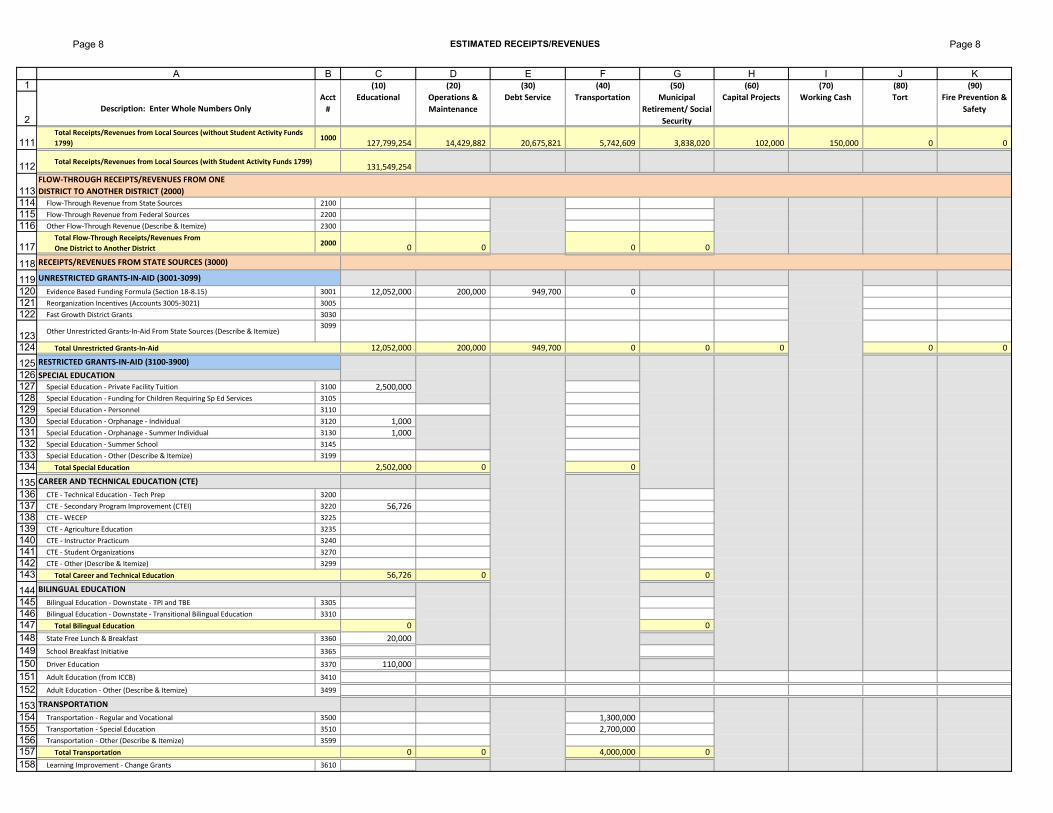
Page 8 ESTIMATED RECEIPTS/REVENUES Page 8
1
2
A B C D E F G H I J K(10) (20) (30) (40) (50) (60) (70) (80) (90)
Description: Enter Whole Numbers Only
Acct
#
Educational Operations &
Maintenance
Debt Service Transportation Municipal
Retirement/ Social
Security
Capital Projects Working Cash Tort Fire Prevention &
Safety
111
112
113114115116
117
118
119120121122
123124
125126127128129130131132133134
135136137138139140141142143
144145146147148149150151152
153154155156157158
Total Receipts/Revenues from Local Sources (without Student Activity Funds
1799)1000
127,799,254 14,429,882 20,675,821 5,742,609 3,838,020 102,000 150,000 0 0
Total Receipts/Revenues from Local Sources (with Student Activity Funds 1799)131,549,254
FLOW‐THROUGH RECEIPTS/REVENUES FROM ONE
DISTRICT TO ANOTHER DISTRICT (2000)
Flow‐Through Revenue from State Sources 2100
Flow‐Through Revenue from Federal Sources 2200
Other Flow‐Through Revenue (Describe & Itemize) 2300
Total Flow‐Through Receipts/Revenues From
One District to Another District2000
0 0 0 0
RECEIPTS/REVENUES FROM STATE SOURCES (3000)
UNRESTRICTED GRANTS‐IN‐AID (3001‐3099)
Evidence Based Funding Formula (Section 18‐8.15) 3001 12,052,000 200,000 949,700 0Reorganization Incentives (Accounts 3005‐3021) 3005
Fast Growth District Grants 3030
Other Unrestricted Grants‐In‐Aid From State Sources (Describe & Itemize)3099
Total Unrestricted Grants‐In‐Aid 12,052,000 200,000 949,700 0 0 0 0 0
RESTRICTED GRANTS‐IN‐AID (3100‐3900)
SPECIAL EDUCATION
Special Education ‐ Private Facility Tuition 3100 2,500,000Special Education ‐ Funding for Children Requiring Sp Ed Services 3105
Special Education ‐ Personnel 3110
Special Education ‐ Orphanage ‐ Individual 3120 1,000Special Education ‐ Orphanage ‐ Summer Individual 3130 1,000Special Education ‐ Summer School 3145
Special Education ‐ Other (Describe & Itemize) 3199
Total Special Education 2,502,000 0 0
CAREER AND TECHNICAL EDUCATION (CTE)
CTE ‐ Technical Education ‐ Tech Prep 3200
CTE ‐ Secondary Program Improvement (CTEI) 3220 56,726CTE ‐ WECEP 3225
CTE ‐ Agriculture Education 3235
CTE ‐ Instructor Practicum 3240
CTE ‐ Student Organizations 3270
CTE ‐ Other (Describe & Itemize) 3299
Total Career and Technical Education 56,726 0 0
BILINGUAL EDUCATION
Bilingual Education ‐ Downstate ‐ TPI and TBE 3305
Bilingual Education ‐ Downstate ‐ Transitional Bilingual Education 3310
Total Bilingual Education 0 0
State Free Lunch & Breakfast 3360 20,000
School Breakfast Initiative 3365
Driver Education 3370 110,000
Adult Education (from ICCB) 3410
Adult Education ‐ Other (Describe & Itemize) 3499
TRANSPORTATION
Transportation ‐ Regular and Vocational 3500 1,300,000
Transportation ‐ Special Education 3510 2,700,000
Transportation ‐ Other (Describe & Itemize) 3599
Total Transportation 0 0 4,000,000 0
Learning Improvement ‐ Change Grants 3610

Page 9 ESTIMATED RECEIPTS/REVENUES Page 9
1
2
A B C D E F G H I J K(10) (20) (30) (40) (50) (60) (70) (80) (90)
Description: Enter Whole Numbers Only
Acct
#
Educational Operations &
Maintenance
Debt Service Transportation Municipal
Retirement/ Social
Security
Capital Projects Working Cash Tort Fire Prevention &
Safety
159160161162163164165166167168169170171172
173
174175
176177
178179180181
182183
184
185186187188189190
191192193194195196197198199200
201202203204205206
Scientific Literacy 3660
Truant Alternative/Optional Education 3695
Early Childhood ‐ Block Grant 3705
Chicago General Education Block Grant 3766
Chicago Educational Services Block Grant 3767
School Safety & Educational Improvement Block Grant 3775
Technology ‐ Technology for Success 3780
State Charter Schools 3815
Extended Learning Opportunities ‐ Summer Bridges 3825
Infrastructure Improvements ‐ Planning/Construction 3920
School Infrastructure ‐ Maintenance Projects 3925
Other Restricted Revenue from State Sources (Describe & Itemize) 3999 200,000
Total Restricted Grants‐In‐Aid 2,688,726 200,000 0 4,000,000 0 0 0 0 0
Total Receipts/Revenues from State Sources 3000 14,740,726 400,000 949,700 4,000,000 0 0 0 0 0
RECEIPTS/REVENUES FROM FEDERAL SOURCES (4000)
Federal Impact Aid 4001
Other Unrestricted Grants‐In‐Aid Received Directly from the Federal Govt. (Describe
& Itemize)
4009
0 0 0 0 0 0 0 0 0
Head Start 4045
Construction (Impact Aid) 4050
MAGNET 4060
Other Restricted Grants‐In‐Aid Received Directly from Federal Govt.
(Describe & Itemize)
4090
Total Restricted Grants‐In‐Aid Received Directly from Federal Govt. 0 0 0 0 0 0
TITLE V
Title V ‐ Flexibility and Accountability 4100
Title V ‐ SEA Projects 4105
Title V ‐ Rural Education Initiative (REI) 4107
Title V ‐ Other (Describe & Itemize) 4199
Total Title V 0 0 0 0
FOOD SERVICE
Breakfast Start‐Up Expansion 4200
National School Lunch Program 4210 950,000Special Milk Program 4215
School Breakfast Program 4220 225,000Summer Food Service Admin/Program 4225
Child and Adult Care Food Program 4226
Fresh Fruit and Vegetables 4240
Food Service ‐ Other (Describe & Itemize) 4299
Total Food Service 1,175,000 0
TITLE I
Title I ‐ Low Income 4300 1,300,000
Title I ‐ Low Income ‐ Neglected, Private 4305
Title I ‐ Migrant Education 4340
Title I ‐ Other (Describe & Itemize) 4399
Total Title I 1,300,000 0 0 0
UNRESTRICTED GRANTS‐IN‐AID RECEIVED DIRECTLY FROM FEDERAL GOVT. (4001‐
4009)
Total Unrestricted Grants‐In‐Aid Received Directly from Fed Govt
RESTRICTED GRANTS‐IN‐AID RECEIVED DIRECTLY FROM FEDERAL GOVT
(4045‐4090)
RESTRICTED GRANTS‐IN‐AID RECEIVED FROM FEDERAL
GOVT. THRU THE STATE (4100‐4999)
Page 10 ESTIMATED RECEIPTS/REVENUES Page 10
1
2
A B C D E F G H I J K(10) (20) (30) (40) (50) (60) (70) (80) (90)
Description: Enter Whole Numbers Only
Acct
#
Educational Operations &
Maintenance
Debt Service Transportation Municipal
Retirement/ Social
Security
Capital Projects Working Cash Tort Fire Prevention &
Safety
207208209210211
212213214215216217218219
220221222223224225226227228229230231232233234235236237238239240241242243244245246247248249250251252253254255256257258259260
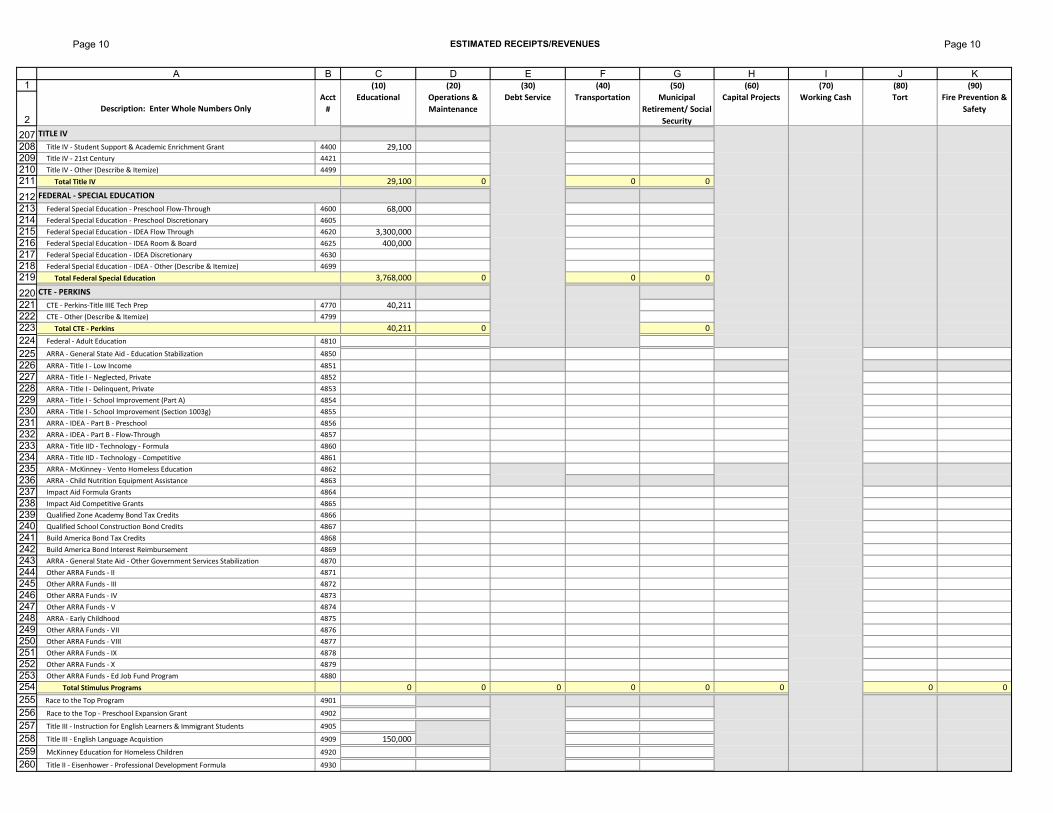
TITLE IV
Title IV ‐ Student Support & Academic Enrichment Grant 4400 29,100Title IV ‐ 21st Century 4421
Title IV ‐ Other (Describe & Itemize) 4499
Total Title IV 29,100 0 0 0
FEDERAL ‐ SPECIAL EDUCATION
Federal Special Education ‐ Preschool Flow‐Through 4600 68,000
Federal Special Education ‐ Preschool Discretionary 4605
Federal Special Education ‐ IDEA Flow Through 4620 3,300,000Federal Special Education ‐ IDEA Room & Board 4625 400,000
Federal Special Education ‐ IDEA Discretionary 4630
Federal Special Education ‐ IDEA ‐ Other (Describe & Itemize) 4699
Total Federal Special Education 3,768,000 0 0 0
CTE ‐ PERKINS
CTE ‐ Perkins‐Title IIIE Tech Prep 4770 40,211CTE ‐ Other (Describe & Itemize) 4799
Total CTE ‐ Perkins 40,211 0 0
Federal ‐ Adult Education 4810
ARRA ‐ General State Aid ‐ Education Stabilization 4850
ARRA ‐ Title I ‐ Low Income 4851
ARRA ‐ Title I ‐ Neglected, Private 4852
ARRA ‐ Title I ‐ Delinquent, Private 4853
ARRA ‐ Title I ‐ School Improvement (Part A) 4854
ARRA ‐ Title I ‐ School Improvement (Section 1003g) 4855
ARRA ‐ IDEA ‐ Part B ‐ Preschool 4856
ARRA ‐ IDEA ‐ Part B ‐ Flow‐Through 4857
ARRA ‐ Title IID ‐ Technology ‐ Formula 4860
ARRA ‐ Title IID ‐ Technology ‐ Competitive 4861
ARRA ‐ McKinney ‐ Vento Homeless Education 4862
ARRA ‐ Child Nutrition Equipment Assistance 4863
Impact Aid Formula Grants 4864
Impact Aid Competitive Grants 4865
Qualified Zone Academy Bond Tax Credits 4866
Qualified School Construction Bond Credits 4867
Build America Bond Tax Credits 4868
Build America Bond Interest Reimbursement 4869
ARRA ‐ General State Aid ‐ Other Government Services Stabilization 4870
Other ARRA Funds ‐ II 4871
Other ARRA Funds ‐ III 4872
Other ARRA Funds ‐ IV 4873
Other ARRA Funds ‐ V 4874
ARRA ‐ Early Childhood 4875
Other ARRA Funds ‐ VII 4876
Other ARRA Funds ‐ VIII 4877
Other ARRA Funds ‐ IX 4878
Other ARRA Funds ‐ X 4879
Other ARRA Funds ‐ Ed Job Fund Program 4880
Total Stimulus Programs 0 0 0 0 0 0 0 0
Race to the Top Program 4901
Race to the Top ‐ Preschool Expansion Grant 4902
Title III ‐ Instruction for English Learners & Immigrant Students 4905
Title III ‐ English Language Acquistion 4909 150,000
McKinney Education for Homeless Children 4920
Title II ‐ Eisenhower ‐ Professional Development Formula 4930
Page 11 ESTIMATED RECEIPTS/REVENUES Page 11
1
2
A B C D E F G H I J K(10) (20) (30) (40) (50) (60) (70) (80) (90)
Description: Enter Whole Numbers Only
Acct
#
Educational Operations &
Maintenance
Debt Service Transportation Municipal
Retirement/ Social
Security
Capital Projects Working Cash Tort Fire Prevention &
Safety
261262263264265266
267
268269
270
271
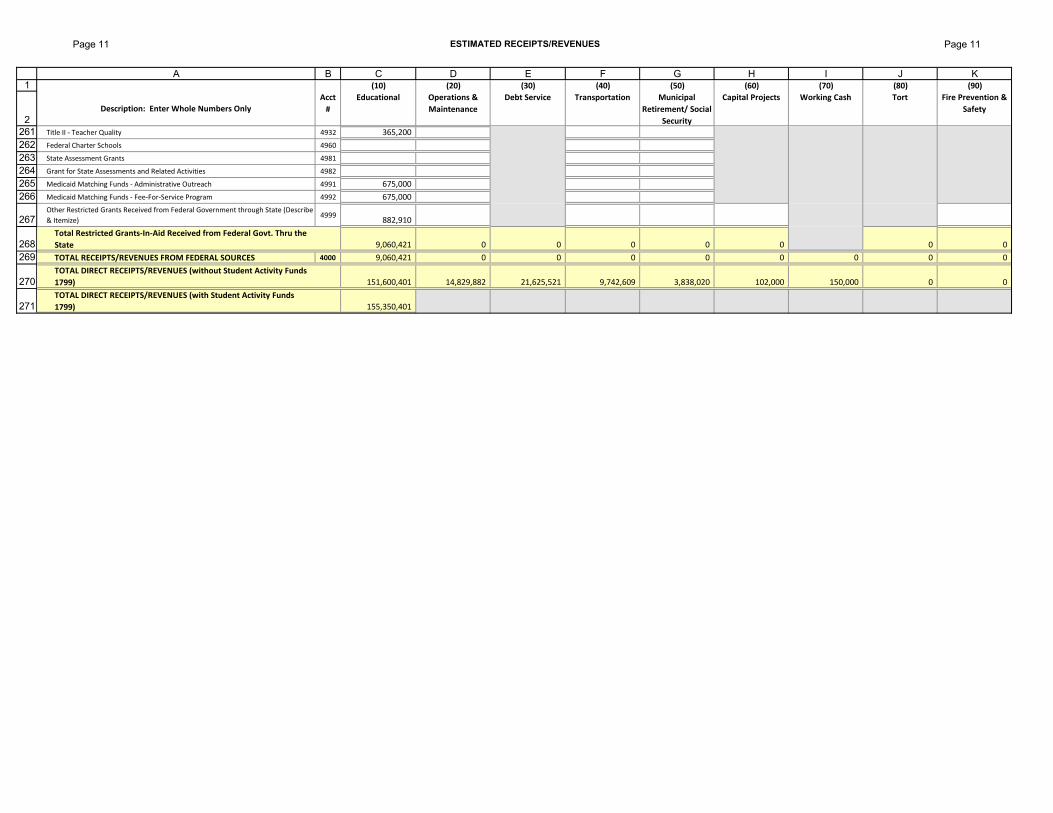
Title II ‐ Teacher Quality 4932 365,200
Federal Charter Schools 4960
State Assessment Grants 4981
Grant for State Assessments and Related Activities 4982
Medicaid Matching Funds ‐ Administrative Outreach 4991 675,000
Medicaid Matching Funds ‐ Fee‐For‐Service Program 4992 675,000
Other Restricted Grants Received from Federal Government through State (Describe
& Itemize)4999
882,910
Total Restricted Grants‐In‐Aid Received from Federal Govt. Thru the
State 9,060,421 0 0 0 0 0 0 0
TOTAL RECEIPTS/REVENUES FROM FEDERAL SOURCES 4000 9,060,421 0 0 0 0 0 0 0 0
TOTAL DIRECT RECEIPTS/REVENUES (without Student Activity Funds
1799) 151,600,401 14,829,882 21,625,521 9,742,609 3,838,020 102,000 150,000 0 0
TOTAL DIRECT RECEIPTS/REVENUES (with Student Activity Funds
1799) 155,350,401
Page 12 ESTIMATED DISBURSEMENTS/EXPENDITURES Page 12
1
2
3
4567891011121314151617181920212223242526272829303132333435
36
3738394041424344
4546474849
50515253
5455
565758
A B C D E F G H I J K(100) (200) (300) (400) (500) (600) (700) (800) (900)
Funct
#Salaries Employee Benefits
Purchased
Services
Supplies &
MaterialsCapital Outlay Other Objects
Non‐Capitalized
Equipment
Termination
BenefitsTotal
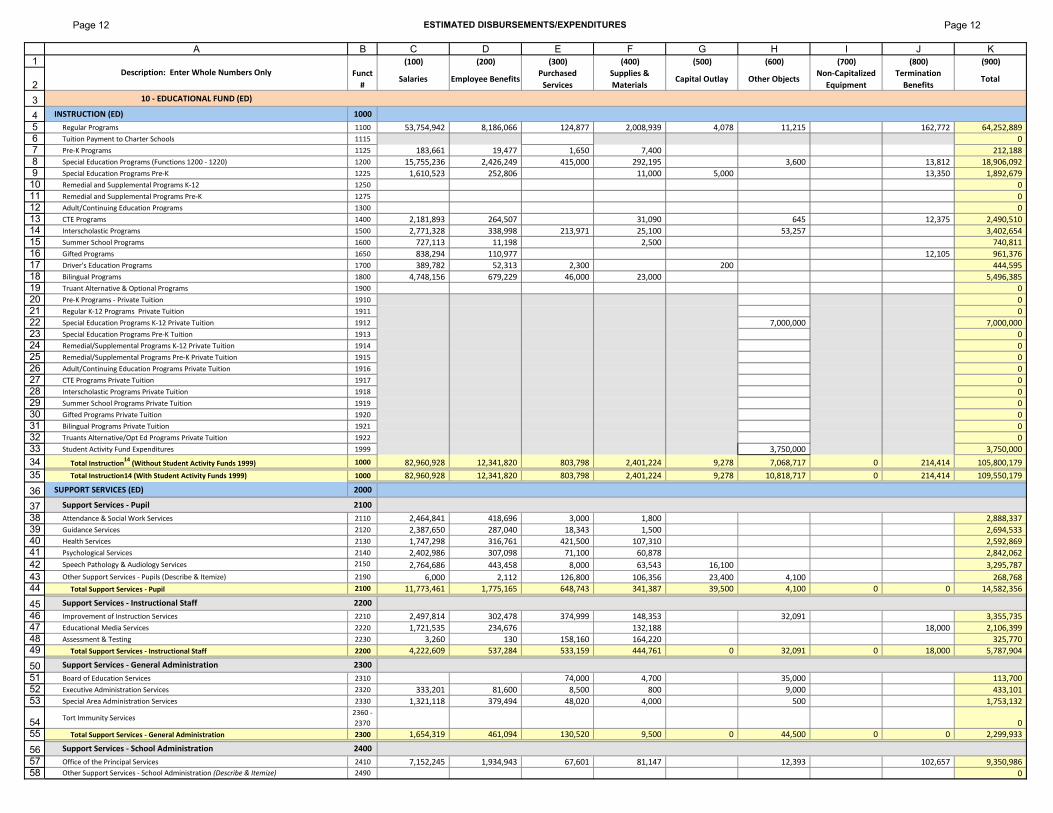
10 ‐ EDUCATIONAL FUND (ED)
INSTRUCTION (ED) 1000
Regular Programs 1100 53,754,942 8,186,066 124,877 2,008,939 4,078 11,215 162,772 64,252,889
Tuition Payment to Charter Schools 1115 0Pre‐K Programs 1125 183,661 19,477 1,650 7,400 212,188Special Education Programs (Functions 1200 ‐ 1220) 1200 15,755,236 2,426,249 415,000 292,195 3,600 13,812 18,906,092Special Education Programs Pre‐K 1225 1,610,523 252,806 11,000 5,000 13,350 1,892,679
Remedial and Supplemental Programs K‐12 1250 0
Remedial and Supplemental Programs Pre‐K 1275 0Adult/Continuing Education Programs 1300 0CTE Programs 1400 2,181,893 264,507 31,090 645 12,375 2,490,510
Interscholastic Programs 1500 2,771,328 338,998 213,971 25,100 53,257 3,402,654
Summer School Programs 1600 727,113 11,198 2,500 740,811Gifted Programs 1650 838,294 110,977 12,105 961,376Driver's Education Programs 1700 389,782 52,313 2,300 200 444,595Bilingual Programs 1800 4,748,156 679,229 46,000 23,000 5,496,385
Truant Alternative & Optional Programs 1900 0Pre‐K Programs ‐ Private Tuition 1910 0Regular K‐12 Programs Private Tuition 1911 0Special Education Programs K‐12 Private Tuition 1912 7,000,000 7,000,000
Special Education Programs Pre‐K Tuition 1913 0Remedial/Supplemental Programs K‐12 Private Tuition 1914 0
Remedial/Supplemental Programs Pre‐K Private Tuition 1915 0Adult/Continuing Education Programs Private Tuition 1916 0
CTE Programs Private Tuition 1917 0Interscholastic Programs Private Tuition 1918 0Summer School Programs Private Tuition 1919 0Gifted Programs Private Tuition 1920 0Bilingual Programs Private Tuition 1921 0Truants Alternative/Opt Ed Programs Private Tuition 1922 0Student Activity Fund Expenditures 1999 3,750,000 3,750,000
Total Instruction14 (Without Student Activity Funds 1999) 1000 82,960,928 12,341,820 803,798 2,401,224 9,278 7,068,717 0 214,414 105,800,179
Total Instruction14 (With Student Activity Funds 1999) 1000 82,960,928 12,341,820 803,798 2,401,224 9,278 10,818,717 0 214,414 109,550,179
SUPPORT SERVICES (ED) 2000
Support Services ‐ Pupil 2100
Attendance & Social Work Services 2110 2,464,841 418,696 3,000 1,800 2,888,337
Guidance Services 2120 2,387,650 287,040 18,343 1,500 2,694,533Health Services 2130 1,747,298 316,761 421,500 107,310 2,592,869
Psychological Services 2140 2,402,986 307,098 71,100 60,878 2,842,062
Speech Pathology & Audiology Services 2150 2,764,686 443,458 8,000 63,543 16,100 3,295,787
Other Support Services ‐ Pupils (Describe & Itemize) 2190 6,000 2,112 126,800 106,356 23,400 4,100 268,768
Total Support Services ‐ Pupil 2100 11,773,461 1,775,165 648,743 341,387 39,500 4,100 0 0 14,582,356
Support Services ‐ Instructional Staff 2200
Improvement of Instruction Services 2210 2,497,814 302,478 374,999 148,353 32,091 3,355,735Educational Media Services 2220 1,721,535 234,676 132,188 18,000 2,106,399Assessment & Testing 2230 3,260 130 158,160 164,220 325,770
Total Support Services ‐ Instructional Staff 2200 4,222,609 537,284 533,159 444,761 0 32,091 0 18,000 5,787,904
Support Services ‐ General Administration 2300
Board of Education Services 2310 74,000 4,700 35,000 113,700Executive Administration Services 2320 333,201 81,600 8,500 800 9,000 433,101
Special Area Administration Services 2330 1,321,118 379,494 48,020 4,000 500 1,753,132
Tort Immunity Services2360 ‐
2370 0
Total Support Services ‐ General Administration 2300 1,654,319 461,094 130,520 9,500 0 44,500 0 0 2,299,933
Support Services ‐ School Administration 2400
Office of the Principal Services 2410 7,152,245 1,934,943 67,601 81,147 12,393 102,657 9,350,986Other Support Services ‐ School Administration (Describe & Itemize) 2490 0
Description: Enter Whole Numbers Only
Page 13 ESTIMATED DISBURSEMENTS/EXPENDITURES Page 13
1
2
A B C D E F G H I J K(100) (200) (300) (400) (500) (600) (700) (800) (900)
Funct
#Salaries Employee Benefits
Purchased
Services
Supplies &
MaterialsCapital Outlay Other Objects
Non‐Capitalized
Equipment
Termination
BenefitsTotal
Description: Enter Whole Numbers Only
59
6061626364656667
68697071727374
75767778798081828384858687888990919293949596979899100101102103104105
106107108109110111112
113114
115
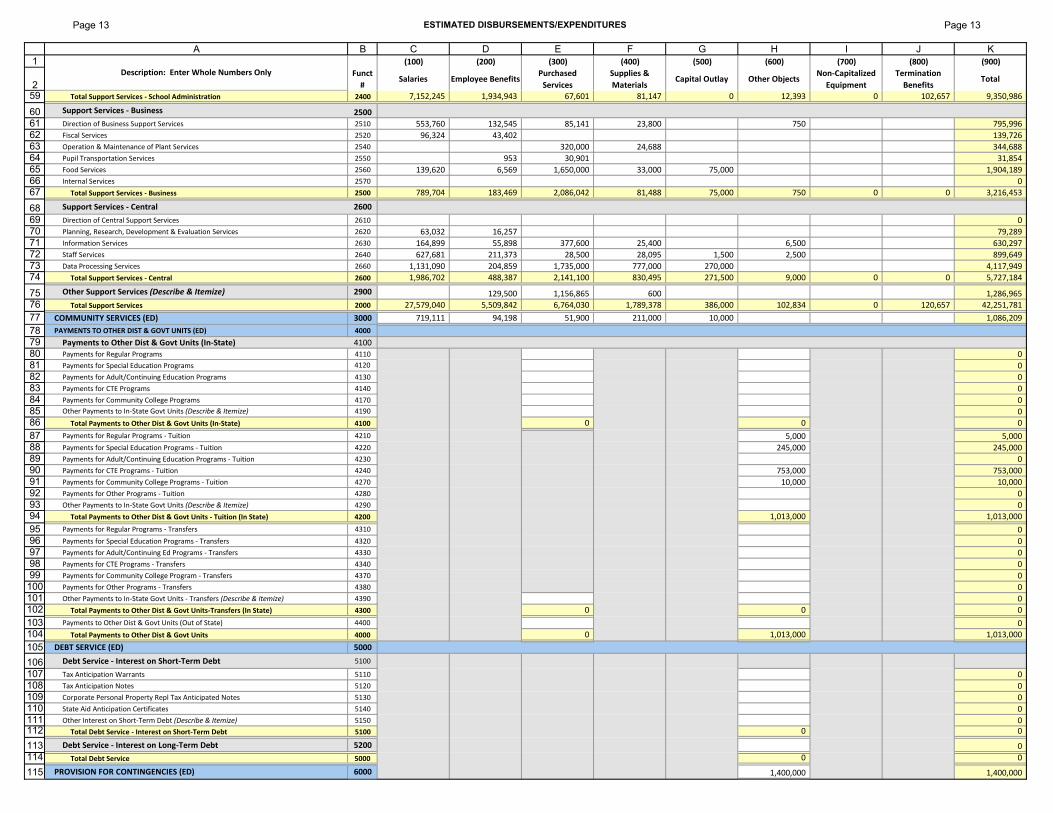
Total Support Services ‐ School Administration 2400 7,152,245 1,934,943 67,601 81,147 0 12,393 0 102,657 9,350,986
Support Services ‐ Business 2500
Direction of Business Support Services 2510 553,760 132,545 85,141 23,800 750 795,996Fiscal Services 2520 96,324 43,402 139,726
Operation & Maintenance of Plant Services 2540 320,000 24,688 344,688Pupil Transportation Services 2550 953 30,901 31,854Food Services 2560 139,620 6,569 1,650,000 33,000 75,000 1,904,189Internal Services 2570 0
Total Support Services ‐ Business 2500 789,704 183,469 2,086,042 81,488 75,000 750 0 0 3,216,453
Support Services ‐ Central 2600
Direction of Central Support Services 2610 0Planning, Research, Development & Evaluation Services 2620 63,032 16,257 79,289Information Services 2630 164,899 55,898 377,600 25,400 6,500 630,297
Staff Services 2640 627,681 211,373 28,500 28,095 1,500 2,500 899,649
Data Processing Services 2660 1,131,090 204,859 1,735,000 777,000 270,000 4,117,949
Total Support Services ‐ Central 2600 1,986,702 488,387 2,141,100 830,495 271,500 9,000 0 0 5,727,184
Other Support Services (Describe & Itemize) 2900 129,500 1,156,865 600 1,286,965
Total Support Services 2000 27,579,040 5,509,842 6,764,030 1,789,378 386,000 102,834 0 120,657 42,251,781
COMMUNITY SERVICES (ED) 3000 719,111 94,198 51,900 211,000 10,000 1,086,209
PAYMENTS TO OTHER DIST & GOVT UNITS (ED) 4000
Payments to Other Dist & Govt Units (In‐State) 4100Payments for Regular Programs 4110 0Payments for Special Education Programs 4120 0Payments for Adult/Continuing Education Programs 4130 0Payments for CTE Programs 4140 0
Payments for Community College Programs 4170 0Other Payments to In‐State Govt Units (Describe & Itemize) 4190 0
Total Payments to Other Dist & Govt Units (In‐State) 4100 0 0 0
Payments for Regular Programs ‐ Tuition 4210 5,000 5,000Payments for Special Education Programs ‐ Tuition 4220 245,000 245,000Payments for Adult/Continuing Education Programs ‐ Tuition 4230 0Payments for CTE Programs ‐ Tuition 4240 753,000 753,000Payments for Community College Programs ‐ Tuition 4270 10,000 10,000Payments for Other Programs ‐ Tuition 4280 0Other Payments to In‐State Govt Units (Describe & Itemize) 4290 0
Total Payments to Other Dist & Govt Units ‐ Tuition (In State) 4200 1,013,000 1,013,000
Payments for Regular Programs ‐ Transfers 4310 0Payments for Special Education Programs ‐ Transfers 4320 0Payments for Adult/Continuing Ed Programs ‐ Transfers 4330 0Payments for CTE Programs ‐ Transfers 4340 0
Payments for Community College Program ‐ Transfers 4370 0Payments for Other Programs ‐ Transfers 4380 0
Other Payments to In‐State Govt Units ‐ Transfers (Describe & Itemize) 4390 0
Total Payments to Other Dist & Govt Units‐Transfers (In State) 4300 0 0 0
Payments to Other Dist & Govt Units (Out of State) 4400 0
Total Payments to Other Dist & Govt Units 4000 0 1,013,000 1,013,000
DEBT SERVICE (ED) 5000
Debt Service ‐ Interest on Short‐Term Debt 5100
Tax Anticipation Warrants 5110 0Tax Anticipation Notes 5120 0
Corporate Personal Property Repl Tax Anticipated Notes 5130 0
State Aid Anticipation Certificates 5140 0Other Interest on Short‐Term Debt (Describe & Itemize) 5150 0
Total Debt Service ‐ Interest on Short‐Term Debt 5100 0 0
Debt Service ‐ Interest on Long‐Term Debt 5200 0
Total Debt Service 5000 0 0
PROVISION FOR CONTINGENCIES (ED) 6000 1,400,000 1,400,000
Page 14 ESTIMATED DISBURSEMENTS/EXPENDITURES Page 14
1
2
A B C D E F G H I J K(100) (200) (300) (400) (500) (600) (700) (800) (900)
Funct
#Salaries Employee Benefits
Purchased
Services
Supplies &
MaterialsCapital Outlay Other Objects
Non‐Capitalized
Equipment
Termination
BenefitsTotal
Description: Enter Whole Numbers Only
116
117
118
119120
121
122123124125126127128129130131132133134
135
136137138139140141
142143144
145146147148149150151
152153
154155156157
158
159
160161162163164
165
166167
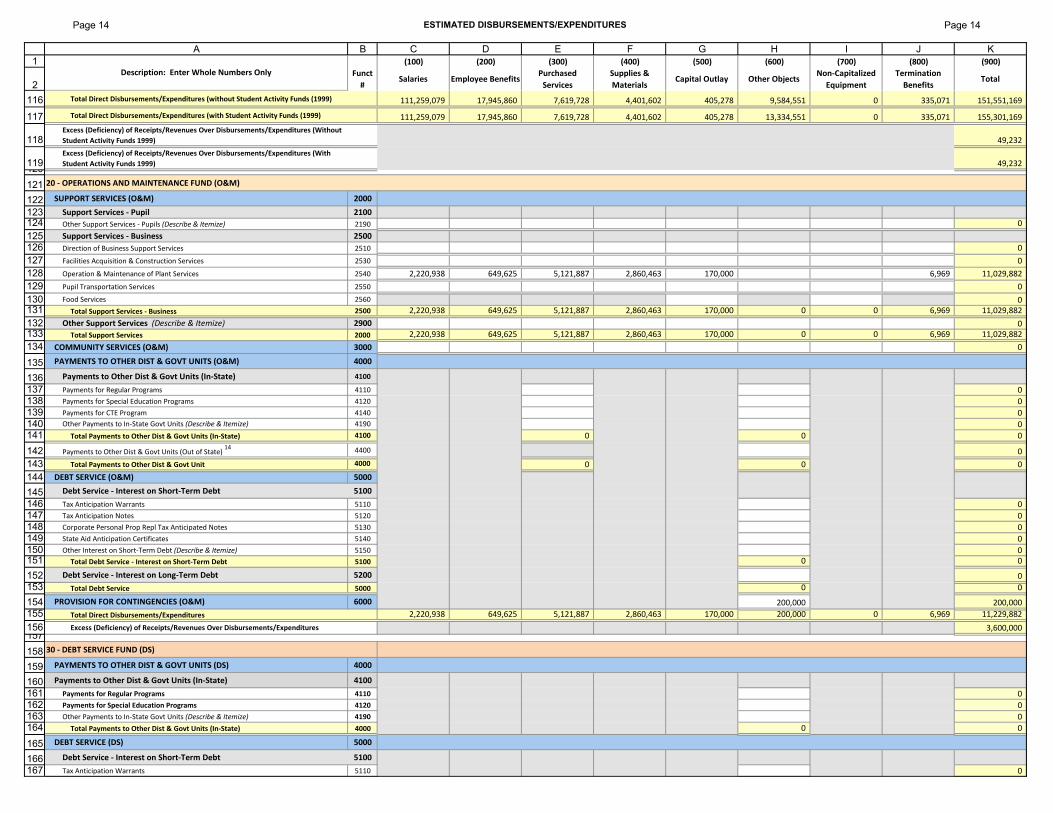
Total Direct Disbursements/Expenditures (without Student Activity Funds (1999) 111,259,079 17,945,860 7,619,728 4,401,602 405,278 9,584,551 0 335,071 151,551,169
Total Direct Disbursements/Expenditures (with Student Activity Funds (1999) 111,259,079 17,945,860 7,619,728 4,401,602 405,278 13,334,551 0 335,071 155,301,169
Excess (Deficiency) of Receipts/Revenues Over Disbursements/Expenditures (Without
Student Activity Funds 1999) 49,232
Excess (Deficiency) of Receipts/Revenues Over Disbursements/Expenditures (With
Student Activity Funds 1999) 49,232
20 ‐ OPERATIONS AND MAINTENANCE FUND (O&M)
SUPPORT SERVICES (O&M) 2000
Support Services ‐ Pupil 2100
Other Support Services ‐ Pupils (Describe & Itemize) 2190 0
Support Services ‐ Business 2500
Direction of Business Support Services 2510 0
Facilities Acquisition & Construction Services 2530 0
Operation & Maintenance of Plant Services 2540 2,220,938 649,625 5,121,887 2,860,463 170,000 6,969 11,029,882
Pupil Transportation Services 2550 0
Food Services 2560 0Total Support Services ‐ Business 2500 2,220,938 649,625 5,121,887 2,860,463 170,000 0 0 6,969 11,029,882
Other Support Services (Describe & Itemize) 2900 0Total Support Services 2000 2,220,938 649,625 5,121,887 2,860,463 170,000 0 0 6,969 11,029,882
COMMUNITY SERVICES (O&M) 3000 0
PAYMENTS TO OTHER DIST & GOVT UNITS (O&M) 4000
Payments to Other Dist & Govt Units (In‐State) 4100
Payments for Regular Programs 4110 0Payments for Special Education Programs 4120 0Payments for CTE Program 4140 0Other Payments to In‐State Govt Units (Describe & Itemize) 4190 0
Total Payments to Other Dist & Govt Units (In‐State) 4100 0 0 0
Payments to Other Dist & Govt Units (Out of State) 14 4400 0
Total Payments to Other Dist & Govt Unit 4000 0 0 0
DEBT SERVICE (O&M) 5000
Debt Service ‐ Interest on Short‐Term Debt 5100
Tax Anticipation Warrants 5110 0
Tax Anticipation Notes 5120 0Corporate Personal Prop Repl Tax Anticipated Notes 5130 0
State Aid Anticipation Certificates 5140 0Other Interest on Short‐Term Debt (Describe & Itemize) 5150 0
Total Debt Service ‐ Interest on Short‐Term Debt 5100 0 0
Debt Service ‐ Interest on Long‐Term Debt 5200 0
Total Debt Service 5000 0 0
PROVISION FOR CONTINGENCIES (O&M) 6000 200,000 200,000
Total Direct Disbursements/Expenditures 2,220,938 649,625 5,121,887 2,860,463 170,000 200,000 0 6,969 11,229,882
Excess (Deficiency) of Receipts/Revenues Over Disbursements/Expenditures 3,600,000
30 ‐ DEBT SERVICE FUND (DS)
PAYMENTS TO OTHER DIST & GOVT UNITS (DS) 4000
Payments to Other Dist & Govt Units (In‐State) 4100
Payments for Regular Programs 4110 0
Payments for Special Education Programs 4120 0
Other Payments to In‐State Govt Units (Describe & Itemize) 4190 0
Total Payments to Other Dist & Govt Units (In‐State) 4000 0 0
DEBT SERVICE (DS) 5000
Debt Service ‐ Interest on Short‐Term Debt 5100
Tax Anticipation Warrants 5110 0
Page 15 ESTIMATED DISBURSEMENTS/EXPENDITURES Page 15
1
2
A B C D E F G H I J K(100) (200) (300) (400) (500) (600) (700) (800) (900)
Funct
#Salaries Employee Benefits
Purchased
Services
Supplies &
MaterialsCapital Outlay Other Objects
Non‐Capitalized
Equipment
Termination
BenefitsTotal
Description: Enter Whole Numbers Only
168169170171172
173
174
175176
177178179180
181
182
183184
185186187188189190191192193194195196197198
199200
201
202203204205206207208
209
210
211212
213214215216
217
218
Tax Anticipation Notes 5120 0Corporate Personal Prop Repl Tax Anticipation Notes 5130 0State Aid Anticipation Certificates 5140 0
Other Interest on Short‐Term Debt (Describe & Itemize) 5150 0Total Debt Service ‐ Interest On Short‐Term Debt 5100 0 0
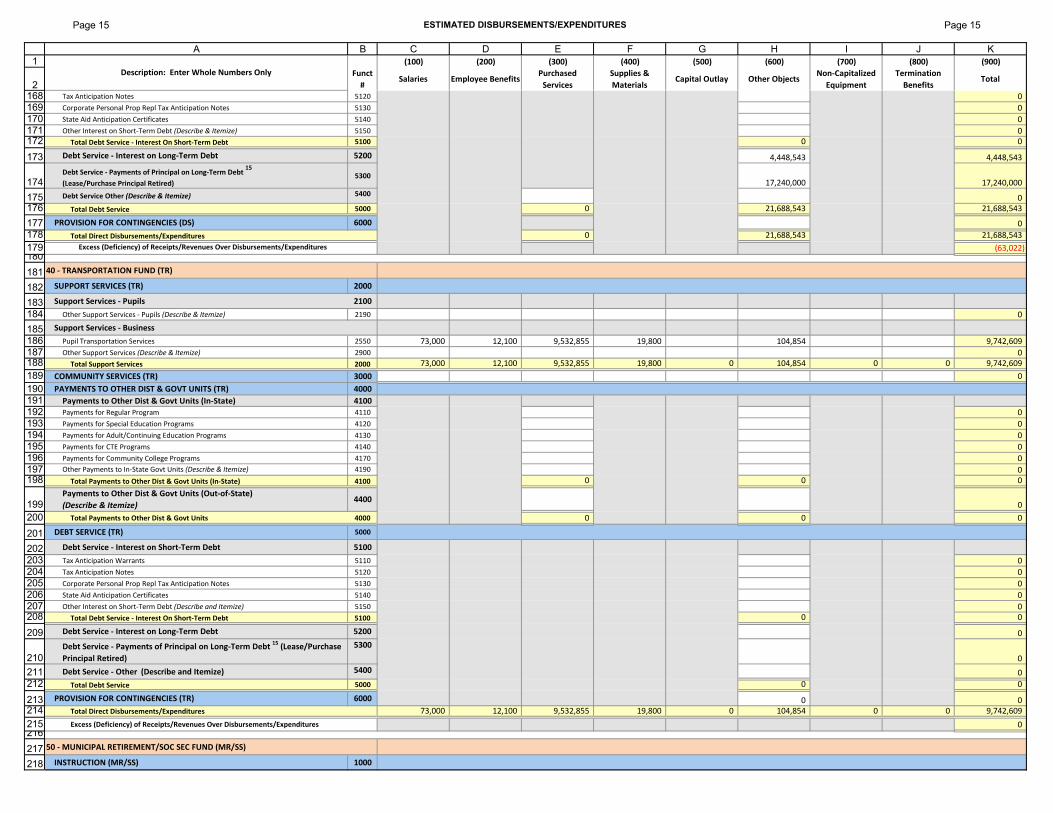
Debt Service ‐ Interest on Long‐Term Debt 5200 4,448,543 4,448,543
Debt Service ‐ Payments of Principal on Long‐Term Debt 15
(Lease/Purchase Principal Retired) 5300
17,240,000 17,240,000
Debt Service Other (Describe & Itemize) 54000
Total Debt Service 5000 0 21,688,543 21,688,543
PROVISION FOR CONTINGENCIES (DS) 6000 0
Total Direct Disbursements/Expenditures 0 21,688,543 21,688,543
(63,022)
40 ‐ TRANSPORTATION FUND (TR)
SUPPORT SERVICES (TR) 2000
Support Services ‐ Pupils 2100
Other Support Services ‐ Pupils (Describe & Itemize) 2190 0
Support Services ‐ Business
Pupil Transportation Services 2550 73,000 12,100 9,532,855 19,800 104,854 9,742,609Other Support Services (Describe & Itemize) 2900 0
Total Support Services 2000 73,000 12,100 9,532,855 19,800 0 104,854 0 0 9,742,609
COMMUNITY SERVICES (TR) 3000 0
PAYMENTS TO OTHER DIST & GOVT UNITS (TR) 4000
Payments to Other Dist & Govt Units (In‐State) 4100
Payments for Regular Program 4110 0Payments for Special Education Programs 4120 0Payments for Adult/Continuing Education Programs 4130 0Payments for CTE Programs 4140 0Payments for Community College Programs 4170 0Other Payments to In‐State Govt Units (Describe & Itemize) 4190 0
Total Payments to Other Dist & Govt Units (In‐State) 4100 0 0 0
Payments to Other Dist & Govt Units (Out‐of‐State)
(Describe & Itemize)4400
0
Total Payments to Other Dist & Govt Units 4000 0 0 0
DEBT SERVICE (TR) 5000
Debt Service ‐ Interest on Short‐Term Debt 5100
Tax Anticipation Warrants 5110 0Tax Anticipation Notes 5120 0
Corporate Personal Prop Repl Tax Anticipation Notes 5130 0State Aid Anticipation Certificates 5140 0
Other Interest on Short‐Term Debt (Describe and Itemize) 5150 0Total Debt Service ‐ Interest On Short‐Term Debt 5100 0 0
Debt Service ‐ Interest on Long‐Term Debt 5200 0
Debt Service ‐ Payments of Principal on Long‐Term Debt 15 (Lease/Purchase
Principal Retired)
5300
0
Debt Service ‐ Other (Describe and Itemize) 5400 0
Total Debt Service 5000 0 0
PROVISION FOR CONTINGENCIES (TR) 6000 0 073,000 12,100 9,532,855 19,800 0 104,854 0 0 9,742,609
Excess (Deficiency) of Receipts/Revenues Over Disbursements/Expenditures 0
50 ‐ MUNICIPAL RETIREMENT/SOC SEC FUND (MR/SS)
INSTRUCTION (MR/SS) 1000
Total Direct Disbursements/Expenditures
Excess (Deficiency) of Receipts/Revenues Over Disbursements/Expenditures
Page 16 ESTIMATED DISBURSEMENTS/EXPENDITURES Page 16
1
2
A B C D E F G H I J K(100) (200) (300) (400) (500) (600) (700) (800) (900)
Funct
#Salaries Employee Benefits
Purchased
Services
Supplies &
MaterialsCapital Outlay Other Objects
Non‐Capitalized
Equipment
Termination
BenefitsTotal
Description: Enter Whole Numbers Only
219220221222223224225226227228229230231232233
234
235236237238239240241242
243244245246247
248249250251252253254255256257258259260261
262263264265
266267268269270271272273274
275
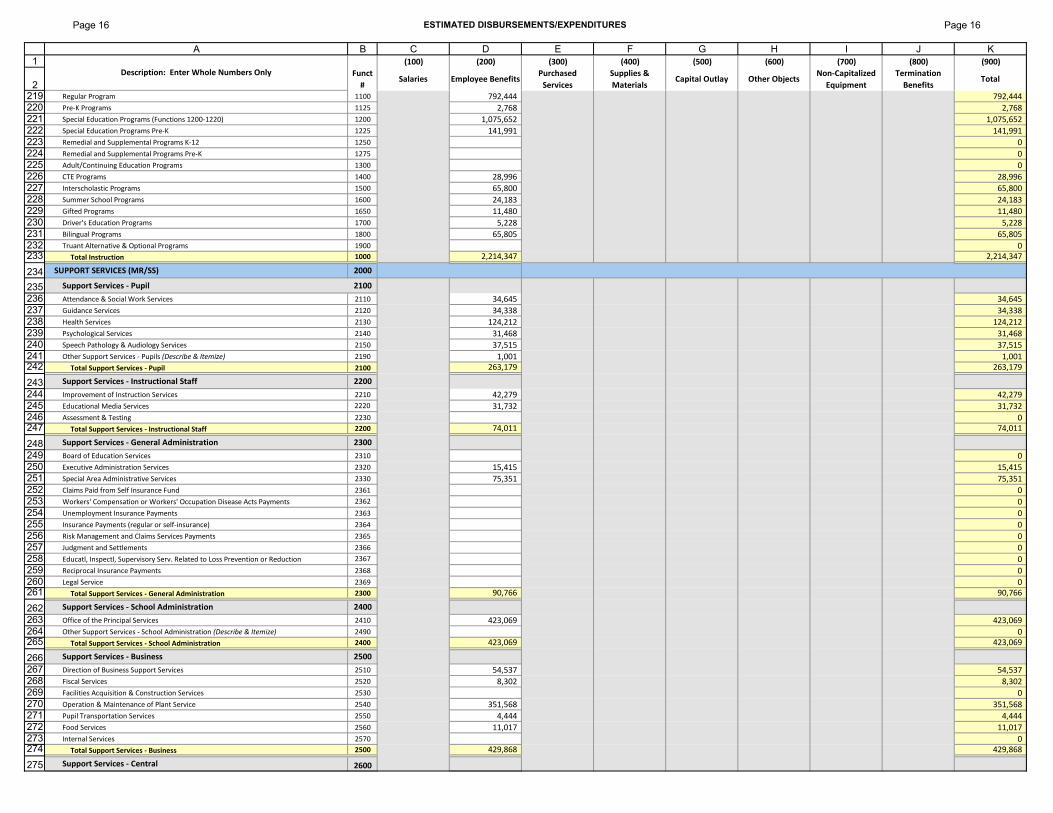
Regular Program 1100 792,444 792,444Pre‐K Programs 1125 2,768 2,768Special Education Programs (Functions 1200‐1220) 1200 1,075,652 1,075,652
Special Education Programs Pre‐K 1225 141,991 141,991Remedial and Supplemental Programs K‐12 1250 0Remedial and Supplemental Programs Pre‐K 1275 0Adult/Continuing Education Programs 1300 0
CTE Programs 1400 28,996 28,996Interscholastic Programs 1500 65,800 65,800Summer School Programs 1600 24,183 24,183Gifted Programs 1650 11,480 11,480
Driver's Education Programs 1700 5,228 5,228
Bilingual Programs 1800 65,805 65,805Truant Alternative & Optional Programs 1900 0
Total Instruction 1000 2,214,347 2,214,347
SUPPORT SERVICES (MR/SS) 2000
Support Services ‐ Pupil 2100
Attendance & Social Work Services 2110 34,645 34,645
Guidance Services 2120 34,338 34,338
Health Services 2130 124,212 124,212Psychological Services 2140 31,468 31,468Speech Pathology & Audiology Services 2150 37,515 37,515Other Support Services ‐ Pupils (Describe & Itemize) 2190 1,001 1,001
Total Support Services ‐ Pupil 2100 263,179 263,179
Support Services ‐ Instructional Staff 2200
Improvement of Instruction Services 2210 42,279 42,279
Educational Media Services 2220 31,732 31,732Assessment & Testing 2230 0
Total Support Services ‐ Instructional Staff 2200 74,011 74,011
Support Services ‐ General Administration 2300
Board of Education Services 2310 0Executive Administration Services 2320 15,415 15,415Special Area Administrative Services 2330 75,351 75,351Claims Paid from Self Insurance Fund 2361 0Workers' Compensation or Workers' Occupation Disease Acts Payments 2362 0Unemployment Insurance Payments 2363 0Insurance Payments (regular or self‐insurance) 2364 0Risk Management and Claims Services Payments 2365 0
Judgment and Settlements 2366 0Educatl, Inspectl, Supervisory Serv. Related to Loss Prevention or Reduction 2367 0
Reciprocal Insurance Payments 2368 0Legal Service 2369 0
Total Support Services ‐ General Administration 2300 90,766 90,766
Support Services ‐ School Administration 2400
Office of the Principal Services 2410 423,069 423,069Other Support Services ‐ School Administration (Describe & Itemize) 2490 0
Total Support Services ‐ School Administration 2400 423,069 423,069
Support Services ‐ Business 2500
Direction of Business Support Services 2510 54,537 54,537
Fiscal Services 2520 8,302 8,302
Facilities Acquisition & Construction Services 2530 0Operation & Maintenance of Plant Service 2540 351,568 351,568Pupil Transportation Services 2550 4,444 4,444Food Services 2560 11,017 11,017
Internal Services 2570 0Total Support Services ‐ Business 2500 429,868 429,868
Support Services ‐ Central 2600
Page 17 ESTIMATED DISBURSEMENTS/EXPENDITURES Page 17
1
2
A B C D E F G H I J K(100) (200) (300) (400) (500) (600) (700) (800) (900)
Funct
#Salaries Employee Benefits
Purchased
Services
Supplies &
MaterialsCapital Outlay Other Objects
Non‐Capitalized
Equipment
Termination
BenefitsTotal
Description: Enter Whole Numbers Only
276277278279280281
282283
284
285286287288289
290
291292293294295296297
298299300301
302
303
304305306307
308309310311312313314
315316317318
319320
321
322
323324325326327328329330331
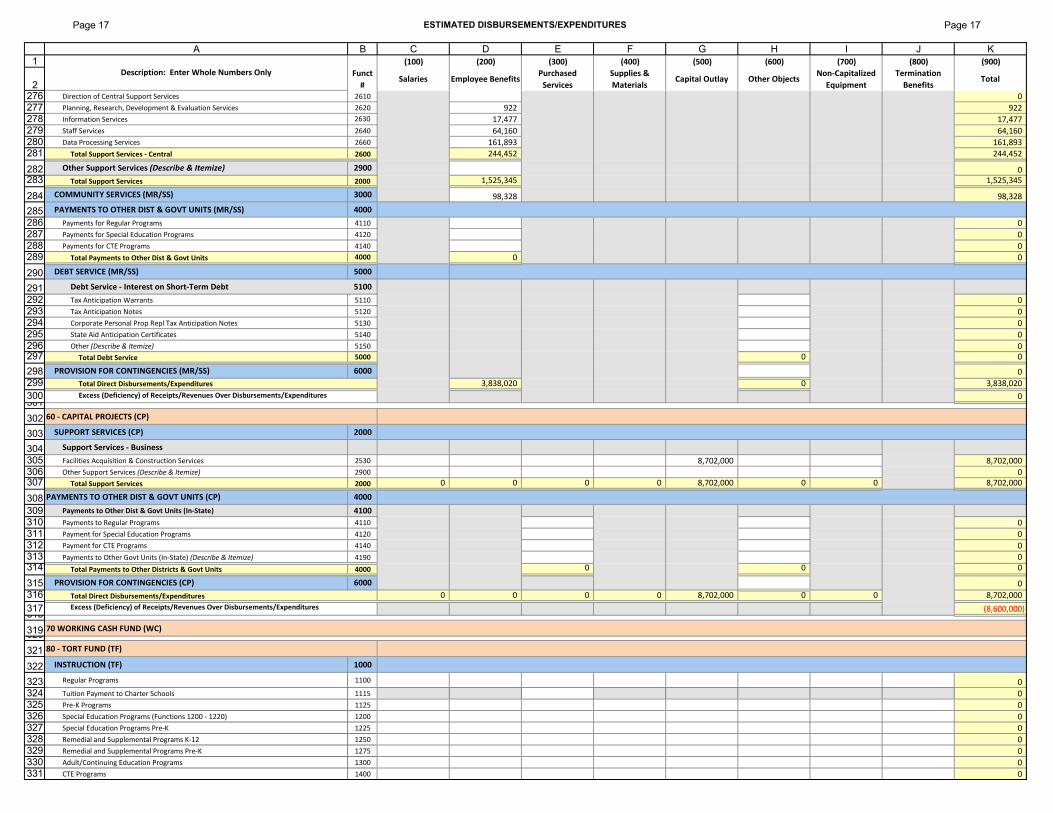
Direction of Central Support Services 2610 0Planning, Research, Development & Evaluation Services 2620 922 922Information Services 2630 17,477 17,477
Staff Services 2640 64,160 64,160Data Processing Services 2660 161,893 161,893
Total Support Services ‐ Central 2600 244,452 244,452
Other Support Services (Describe & Itemize) 2900 0
Total Support Services 2000 1,525,345 1,525,345
COMMUNITY SERVICES (MR/SS) 3000 98,328 98,328
PAYMENTS TO OTHER DIST & GOVT UNITS (MR/SS) 4000
Payments for Regular Programs 4110 0
Payments for Special Education Programs 4120 0Payments for CTE Programs 4140 0
Total Payments to Other Dist & Govt Units 4000 0 0
DEBT SERVICE (MR/SS) 5000
Debt Service ‐ Interest on Short‐Term Debt 5100
Tax Anticipation Warrants 5110 0Tax Anticipation Notes 5120 0Corporate Personal Prop Repl Tax Anticipation Notes 5130 0
State Aid Anticipation Certificates 5140 0Other (Describe & Itemize) 5150 0
Total Debt Service 5000 0 0
PROVISION FOR CONTINGENCIES (MR/SS) 6000 0
3,838,020 0 3,838,020
0
60 ‐ CAPITAL PROJECTS (CP)
SUPPORT SERVICES (CP) 2000
Support Services ‐ Business
Facilities Acquisition & Construction Services 2530 8,702,000 8,702,000Other Support Services (Describe & Itemize) 2900 0
Total Support Services 2000 0 0 0 0 8,702,000 0 0 8,702,000
PAYMENTS TO OTHER DIST & GOVT UNITS (CP) 4000
Payments to Other Dist & Govt Units (In‐State) 4100
Payments to Regular Programs 4110 0Payment for Special Education Programs 4120 0Payment for CTE Programs 4140 0
Payments to Other Govt Units (In‐State) (Describe & Itemize) 4190 0
Total Payments to Other Districts & Govt Units 4000 0 0 0
PROVISION FOR CONTINGENCIES (CP) 6000 0
Total Direct Disbursements/Expenditures 0 0 0 0 8,702,000 0 0 8,702,000
Excess (Deficiency) of Receipts/Revenues Over Disbursements/Expenditures (8,600,000)
70 WORKING CASH FUND (WC)
80 ‐ TORT FUND (TF)
INSTRUCTION (TF) 1000
Regular Programs 1100 0Tuition Payment to Charter Schools 1115 0
Pre‐K Programs 1125 0Special Education Programs (Functions 1200 ‐ 1220) 1200 0Special Education Programs Pre‐K 1225 0Remedial and Supplemental Programs K‐12 1250 0
Remedial and Supplemental Programs Pre‐K 1275 0
Adult/Continuing Education Programs 1300 0CTE Programs 1400 0
Total Direct Disbursements/Expenditures
Excess (Deficiency) of Receipts/Revenues Over Disbursements/Expenditures
Page 18 ESTIMATED DISBURSEMENTS/EXPENDITURES Page 18
1
2
A B C D E F G H I J K(100) (200) (300) (400) (500) (600) (700) (800) (900)
Funct
#Salaries Employee Benefits
Purchased
Services
Supplies &
MaterialsCapital Outlay Other Objects
Non‐Capitalized
Equipment
Termination
BenefitsTotal
Description: Enter Whole Numbers Only
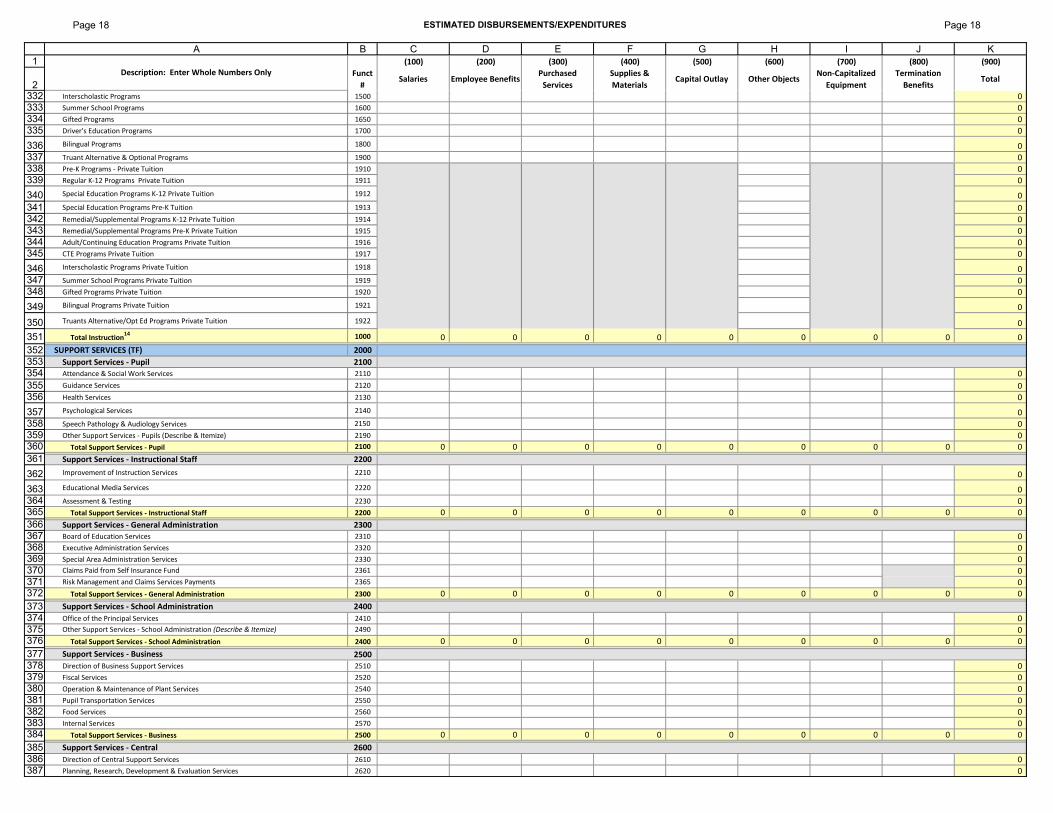
332333334335
336337338339
340341342343344345
346347348
349
350
351352353354355356
357358359360361
362
363364365366367368369370371372373374375376377378379380381382383384385386387
Interscholastic Programs 1500 0Summer School Programs 1600 0Gifted Programs 1650 0
Driver's Education Programs 1700 0
Bilingual Programs 1800 0Truant Alternative & Optional Programs 1900 0Pre‐K Programs ‐ Private Tuition 1910 0
Regular K‐12 Programs Private Tuition 1911 0
Special Education Programs K‐12 Private Tuition 1912 0
Special Education Programs Pre‐K Tuition 1913 0Remedial/Supplemental Programs K‐12 Private Tuition 1914 0
Remedial/Supplemental Programs Pre‐K Private Tuition 1915 0
Adult/Continuing Education Programs Private Tuition 1916 0CTE Programs Private Tuition 1917 0
Interscholastic Programs Private Tuition 1918 0
Summer School Programs Private Tuition 1919 0Gifted Programs Private Tuition 1920 0
Bilingual Programs Private Tuition 1921 0
Truants Alternative/Opt Ed Programs Private Tuition 1922 0
Total Instruction14 1000 0 0 0 0 0 0 0 0 0
SUPPORT SERVICES (TF) 2000
Support Services ‐ Pupil 2100Attendance & Social Work Services 2110 0
Guidance Services 2120 0Health Services 2130 0
Psychological Services 2140 0
Speech Pathology & Audiology Services 2150 0Other Support Services ‐ Pupils (Describe & Itemize) 2190 0
Total Support Services ‐ Pupil 2100 0 0 0 0 0 0 0 0 0
Support Services ‐ Instructional Staff 2200
Improvement of Instruction Services 2210 0
Educational Media Services 2220 0Assessment & Testing 2230 0
Total Support Services ‐ Instructional Staff 2200 0 0 0 0 0 0 0 0 0
Support Services ‐ General Administration 2300Board of Education Services 2310 0
Executive Administration Services 2320 0Special Area Administration Services 2330 0Claims Paid from Self Insurance Fund 2361 0Risk Management and Claims Services Payments 2365 0
Total Support Services ‐ General Administration 2300 0 0 0 0 0 0 0 0 0
Support Services ‐ School Administration 2400
Office of the Principal Services 2410 0Other Support Services ‐ School Administration (Describe & Itemize) 2490 0
Total Support Services ‐ School Administration 2400 0 0 0 0 0 0 0 0 0
Support Services ‐ Business 2500Direction of Business Support Services 2510 0
Fiscal Services 2520 0
Operation & Maintenance of Plant Services 2540 0Pupil Transportation Services 2550 0Food Services 2560 0Internal Services 2570 0
Total Support Services ‐ Business 2500 0 0 0 0 0 0 0 0 0
Support Services ‐ Central 2600
Direction of Central Support Services 2610 0
Planning, Research, Development & Evaluation Services 2620 0
Page 19 ESTIMATED DISBURSEMENTS/EXPENDITURES Page 19
1
2
A B C D E F G H I J K(100) (200) (300) (400) (500) (600) (700) (800) (900)
Funct
#Salaries Employee Benefits
Purchased
Services
Supplies &
MaterialsCapital Outlay Other Objects
Non‐Capitalized
Equipment
Termination
BenefitsTotal
Description: Enter Whole Numbers Only
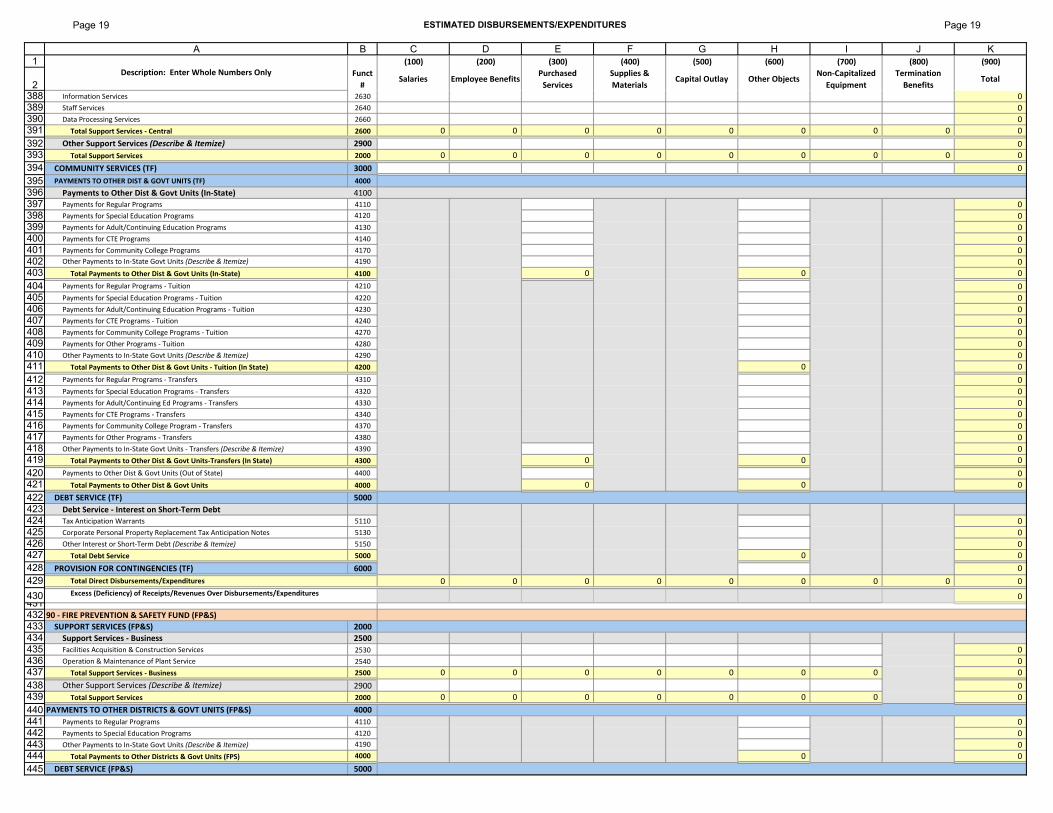
388389390391392393394395396397398399400401402403404405406407408409410411412413414415416417418419420421422423424425426427428429
430431432433434435436437438439440441442443444445
Information Services 2630 0Staff Services 2640 0Data Processing Services 2660 0
Total Support Services ‐ Central 2600 0 0 0 0 0 0 0 0 0
Other Support Services (Describe & Itemize) 2900 0
Total Support Services 2000 0 0 0 0 0 0 0 0 0
COMMUNITY SERVICES (TF) 3000 0
PAYMENTS TO OTHER DIST & GOVT UNITS (TF) 4000
Payments to Other Dist & Govt Units (In‐State) 4100
Payments for Regular Programs 4110 0Payments for Special Education Programs 4120 0Payments for Adult/Continuing Education Programs 4130 0
Payments for CTE Programs 4140 0
Payments for Community College Programs 4170 0Other Payments to In‐State Govt Units (Describe & Itemize) 4190 0
Total Payments to Other Dist & Govt Units (In‐State) 4100 0 0 0
Payments for Regular Programs ‐ Tuition 4210 0Payments for Special Education Programs ‐ Tuition 4220 0Payments for Adult/Continuing Education Programs ‐ Tuition 4230 0Payments for CTE Programs ‐ Tuition 4240 0
Payments for Community College Programs ‐ Tuition 4270 0Payments for Other Programs ‐ Tuition 4280 0Other Payments to In‐State Govt Units (Describe & Itemize) 4290 0
Total Payments to Other Dist & Govt Units ‐ Tuition (In State) 4200 0 0
Payments for Regular Programs ‐ Transfers 4310 0Payments for Special Education Programs ‐ Transfers 4320 0Payments for Adult/Continuing Ed Programs ‐ Transfers 4330 0Payments for CTE Programs ‐ Transfers 4340 0Payments for Community College Program ‐ Transfers 4370 0Payments for Other Programs ‐ Transfers 4380 0Other Payments to In‐State Govt Units ‐ Transfers (Describe & Itemize) 4390 0
Total Payments to Other Dist & Govt Units‐Transfers (In State) 4300 0 0 0
Payments to Other Dist & Govt Units (Out of State) 4400 0
Total Payments to Other Dist & Govt Units 4000 0 0 0
DEBT SERVICE (TF) 5000
Debt Service ‐ Interest on Short‐Term DebtTax Anticipation Warrants 5110 0Corporate Personal Property Replacement Tax Anticipation Notes 5130 0Other Interest or Short‐Term Debt (Describe & Itemize) 5150 0
Total Debt Service 5000 0 0
PROVISION FOR CONTINGENCIES (TF) 6000 0
0 0 0 0 0 0 0 0 0
0
90 ‐ FIRE PREVENTION & SAFETY FUND (FP&S)
SUPPORT SERVICES (FP&S) 2000
Support Services ‐ Business 2500
Facilities Acquisition & Construction Services 2530 0Operation & Maintenance of Plant Service 2540 0
Total Support Services ‐ Business 2500 0 0 0 0 0 0 0 0
Other Support Services (Describe & Itemize) 2900 0
Total Support Services 2000 0 0 0 0 0 0 0 0
PAYMENTS TO OTHER DISTRICTS & GOVT UNITS (FP&S) 4000
Payments to Regular Programs 4110 0
Payments to Special Education Programs 4120 0
Other Payments to In‐State Govt Units (Describe & Itemize) 4190 0
Total Payments to Other Districts & Govt Units (FPS) 4000 0 0
DEBT SERVICE (FP&S) 5000
Total Direct Disbursements/Expenditures
Excess (Deficiency) of Receipts/Revenues Over Disbursements/Expenditures
Page 20 ESTIMATED DISBURSEMENTS/EXPENDITURES Page 20
1
2
A B C D E F G H I J K(100) (200) (300) (400) (500) (600) (700) (800) (900)
Funct
#Salaries Employee Benefits
Purchased
Services
Supplies &
MaterialsCapital Outlay Other Objects
Non‐Capitalized
Equipment
Termination
BenefitsTotal
Description: Enter Whole Numbers Only
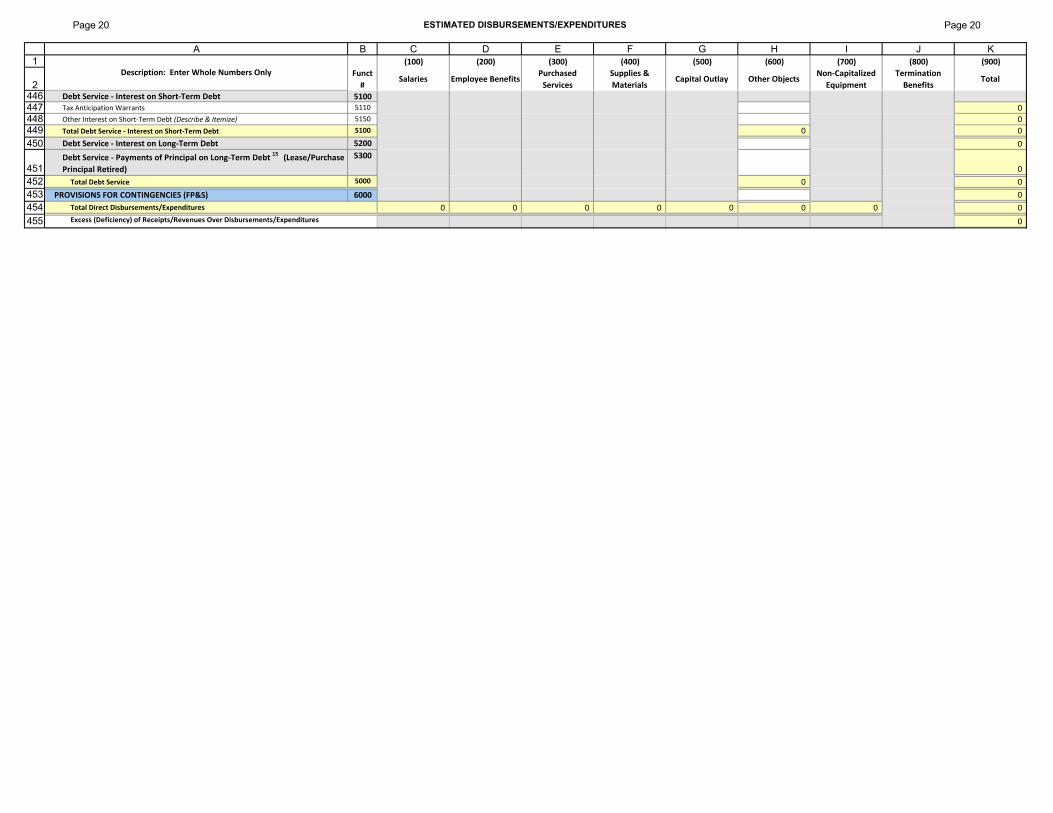
446447448449450
451452453454455
Debt Service ‐ Interest on Short‐Term Debt 5100Tax Anticipation Warrants 5110 0Other Interest on Short‐Term Debt (Describe & Itemize) 5150 0
Total Debt Service ‐ Interest on Short‐Term Debt 5100 0 0
Debt Service ‐ Interest on Long‐Term Debt 5200 0
Debt Service ‐ Payments of Principal on Long‐Term Debt 15
(Lease/Purchase
Principal Retired)
5300
0
Total Debt Service 5000 0 0
PROVISIONS FOR CONTINGENCIES (FP&S) 6000 0
0 0 0 0 0 0 0 0
0Excess (Deficiency) of Receipts/Revenues Over Disbursements/Expenditures
Total Direct Disbursements/Expenditures
Page 21 Page 21
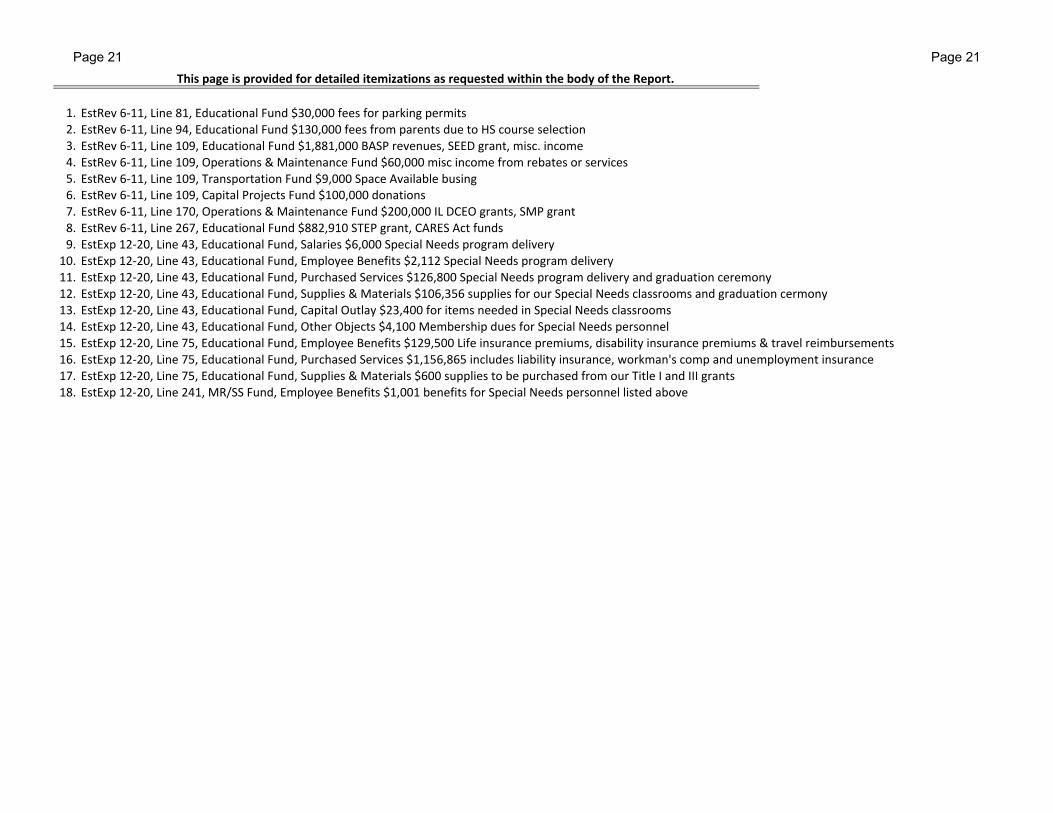
This page is provided for detailed itemizations as requested within the body of the Report.
1. EstRev 6‐11, Line 81, Educational Fund $30,000 fees for parking permits2. EstRev 6‐11, Line 94, Educational Fund $130,000 fees from parents due to HS course selection3. EstRev 6‐11, Line 109, Educational Fund $1,881,000 BASP revenues, SEED grant, misc. income4. EstRev 6‐11, Line 109, Operations & Maintenance Fund $60,000 misc income from rebates or services5. EstRev 6‐11, Line 109, Transportation Fund $9,000 Space Available busing6. EstRev 6‐11, Line 109, Capital Projects Fund $100,000 donations7. EstRev 6‐11, Line 170, Operations & Maintenance Fund $200,000 IL DCEO grants, SMP grant8. EstRev 6‐11, Line 267, Educational Fund $882,910 STEP grant, CARES Act funds9. EstExp 12‐20, Line 43, Educational Fund, Salaries $6,000 Special Needs program delivery
10. EstExp 12‐20, Line 43, Educational Fund, Employee Benefits $2,112 Special Needs program delivery11. EstExp 12‐20, Line 43, Educational Fund, Purchased Services $126,800 Special Needs program delivery and graduation ceremony12. EstExp 12‐20, Line 43, Educational Fund, Supplies & Materials $106,356 supplies for our Special Needs classrooms and graduation cermony13. EstExp 12‐20, Line 43, Educational Fund, Capital Outlay $23,400 for items needed in Special Needs classrooms14. EstExp 12‐20, Line 43, Educational Fund, Other Objects $4,100 Membership dues for Special Needs personnel15. EstExp 12‐20, Line 75, Educational Fund, Employee Benefits $129,500 Life insurance premiums, disability insurance premiums & travel reimbursements16. EstExp 12‐20, Line 75, Educational Fund, Purchased Services $1,156,865 includes liability insurance, workman's comp and unemployment insurance17. EstExp 12‐20, Line 75, Educational Fund, Supplies & Materials $600 supplies to be purchased from our Title I and III grants18. EstExp 12‐20, Line 241, MR/SS Fund, Employee Benefits $1,001 benefits for Special Needs personnel listed above
Page 22 Page 22
1
23456
7
89
10
1213
A B C D E F
Description EDUCATIONAL FUND (10)OPERATIONS &
MAINTENANCE FUND (20)
TRANSPORTATION FUND
(40)
WORKING CASH FUND
(70)TOTAL
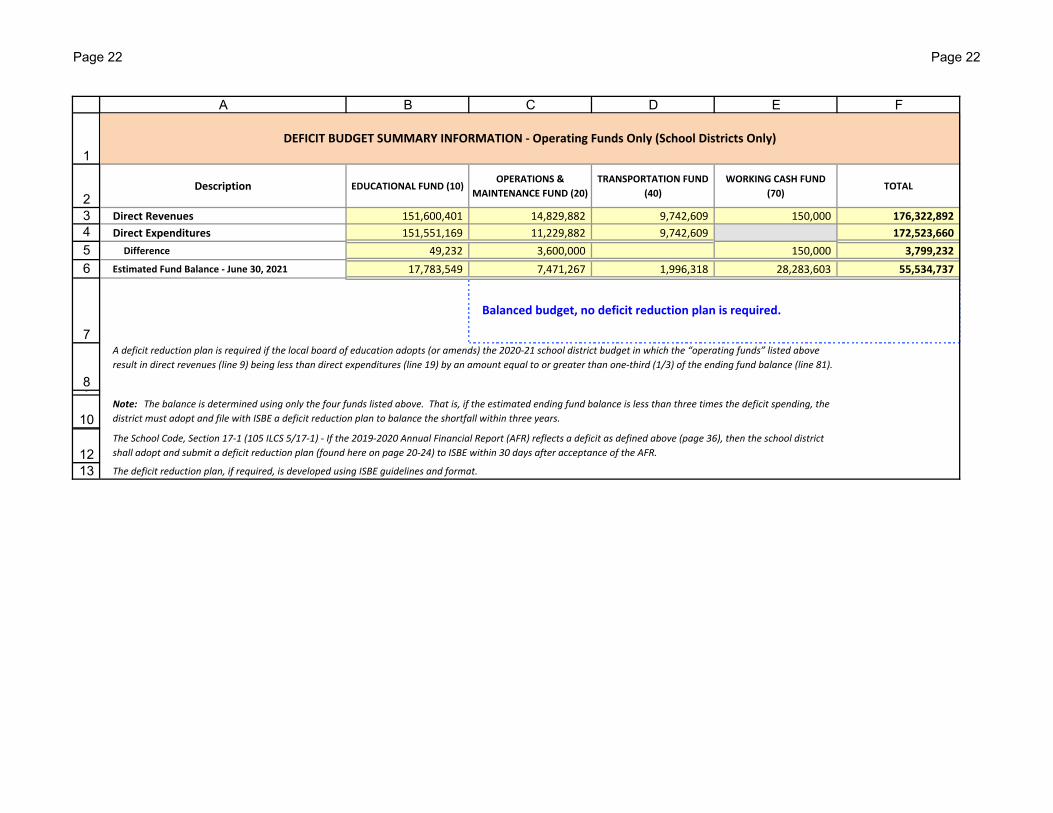
Direct Revenues 151,600,401 14,829,882 9,742,609 150,000 176,322,892
Direct Expenditures 151,551,169 11,229,882 9,742,609 172,523,660
Difference 49,232 3,600,000 150,000 3,799,232
Estimated Fund Balance ‐ June 30, 2021 17,783,549 7,471,267 1,996,318 28,283,603 55,534,737
The deficit reduction plan, if required, is developed using ISBE guidelines and format.
DEFICIT BUDGET SUMMARY INFORMATION ‐ Operating Funds Only (School Districts Only)
Balanced budget, no deficit reduction plan is required.
A deficit reduction plan is required if the local board of education adopts (or amends) the 2020‐21 school district budget in which the “operating funds” listed above
result in direct revenues (line 9) being less than direct expenditures (line 19) by an amount equal to or greater than one‐third (1/3) of the ending fund balance (line 81).
Note: The balance is determined using only the four funds listed above. That is, if the estimated ending fund balance is less than three times the deficit spending, the
district must adopt and file with ISBE a deficit reduction plan to balance the shortfall within three years.
The School Code, Section 17‐1 (105 ILCS 5/17‐1) ‐ If the 2019‐2020 Annual Financial Report (AFR) reflects a deficit as defined above (page 36), then the school district
shall adopt and submit a deficit reduction plan (found here on page 20‐24) to ISBE within 30 days after acceptance of the AFR.
Page 23 ILLINOIS STATE BOARD OF EDUCATIONSchool Business Services Division
Page 23
1234
5
6
7
8
9
10
11
1213
14
15
16
17
18
19
202122
23
24
252627
A B C D E F G
*School Districts Only
19‐022‐2000‐26District Number
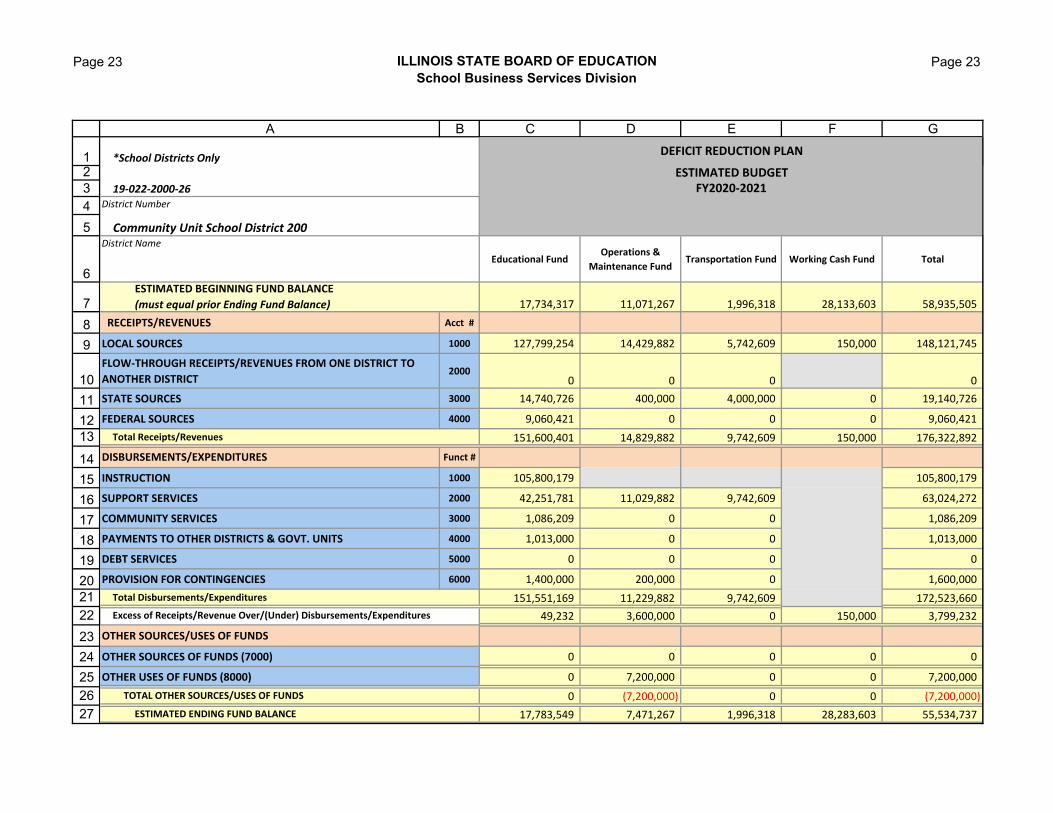
Community Unit School District 200District Name
Educational FundOperations &
Maintenance FundTransportation Fund Working Cash Fund Total
17,734,317 11,071,267 1,996,318 28,133,603 58,935,505
RECEIPTS/REVENUES Acct #
LOCAL SOURCES 1000 127,799,254 14,429,882 5,742,609 150,000 148,121,745
FLOW‐THROUGH RECEIPTS/REVENUES FROM ONE DISTRICT TO
ANOTHER DISTRICT2000
0 0 0 0
STATE SOURCES 3000 14,740,726 400,000 4,000,000 0 19,140,726
FEDERAL SOURCES 4000 9,060,421 0 0 0 9,060,421
151,600,401 14,829,882 9,742,609 150,000 176,322,892
DISBURSEMENTS/EXPENDITURES Funct #
INSTRUCTION 1000 105,800,179 105,800,179
SUPPORT SERVICES 2000 42,251,781 11,029,882 9,742,609 63,024,272
COMMUNITY SERVICES 3000 1,086,209 0 0 1,086,209
PAYMENTS TO OTHER DISTRICTS & GOVT. UNITS 4000 1,013,000 0 0 1,013,000
DEBT SERVICES 5000 0 0 0 0
PROVISION FOR CONTINGENCIES 6000 1,400,000 200,000 0 1,600,000
151,551,169 11,229,882 9,742,609 172,523,660
49,232 3,600,000 0 150,000 3,799,232
OTHER SOURCES/USES OF FUNDS
OTHER SOURCES OF FUNDS (7000) 0 0 0 0 0
OTHER USES OF FUNDS (8000) 0 7,200,000 0 0 7,200,000
0 (7,200,000) 0 0 (7,200,000)
17,783,549 7,471,267 1,996,318 28,283,603 55,534,737
DEFICIT REDUCTION PLAN
FY2020‐2021ESTIMATED BUDGET
ESTIMATED BEGINNING FUND BALANCE
(must equal prior Ending Fund Balance)
TOTAL OTHER SOURCES/USES OF FUNDS
ESTIMATED ENDING FUND BALANCE
Total Receipts/Revenues
Excess of Receipts/Revenue Over/(Under) Disbursements/Expenditures
Total Disbursements/Expenditures
Page 24 ILLINOIS STATE BOARD OF EDUCATIONSchool Business Services Division
Page 24
1234
5
6
7
8
9
10
11
1213
14
15
16
17
18
19
202122
23
24
252627
A B
*School Districts Only
19‐022‐2000‐26District Number
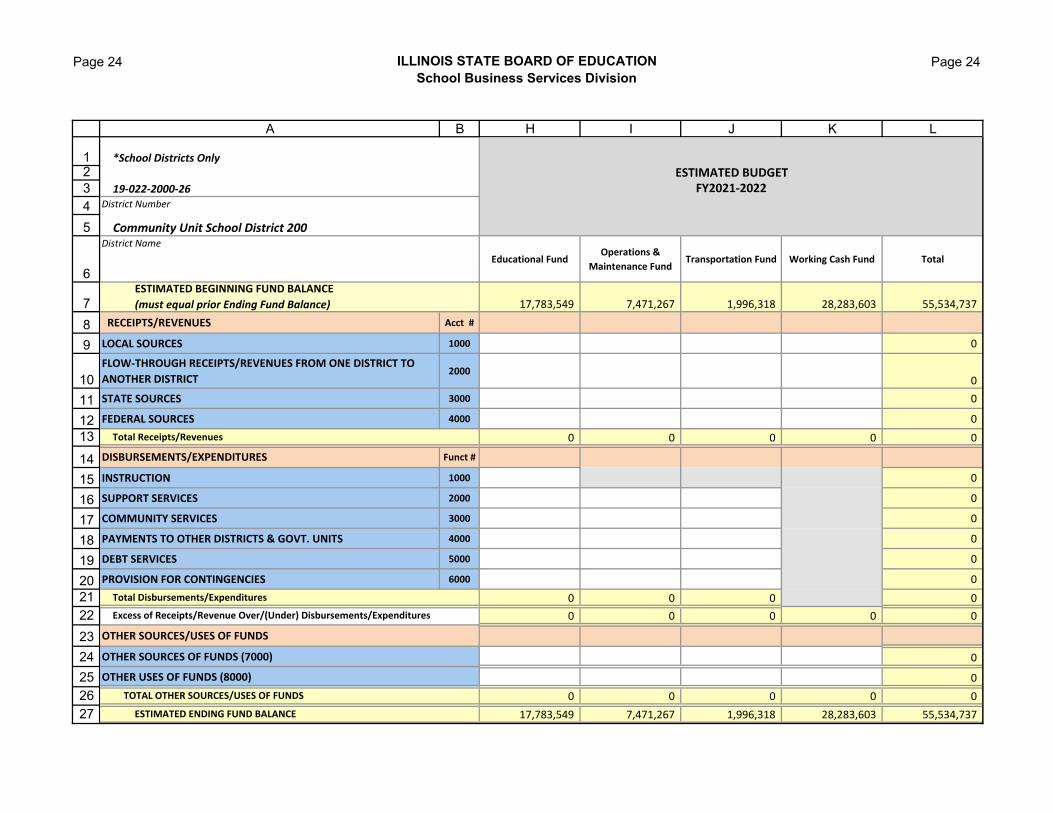
Community Unit School District 200District Name
RECEIPTS/REVENUES Acct #
LOCAL SOURCES 1000
FLOW‐THROUGH RECEIPTS/REVENUES FROM ONE DISTRICT TO
ANOTHER DISTRICT2000
STATE SOURCES 3000
FEDERAL SOURCES 4000
DISBURSEMENTS/EXPENDITURES Funct #
INSTRUCTION 1000
SUPPORT SERVICES 2000
COMMUNITY SERVICES 3000
PAYMENTS TO OTHER DISTRICTS & GOVT. UNITS 4000
DEBT SERVICES 5000
PROVISION FOR CONTINGENCIES 6000
OTHER SOURCES/USES OF FUNDS
OTHER SOURCES OF FUNDS (7000)
OTHER USES OF FUNDS (8000)
ESTIMATED BEGINNING FUND BALANCE
(must equal prior Ending Fund Balance)
TOTAL OTHER SOURCES/USES OF FUNDS
ESTIMATED ENDING FUND BALANCE
Total Receipts/Revenues
Excess of Receipts/Revenue Over/(Under) Disbursements/Expenditures
Total Disbursements/Expenditures
H I J K L
Educational FundOperations &
Maintenance FundTransportation Fund Working Cash Fund Total
17,783,549 7,471,267 1,996,318 28,283,603 55,534,737
0
0
0
0
0 0 0 0 0
0
0
0
0
0
0
0 0 0 0
0 0 0 0 0
0
0
0 0 0 0 0
17,783,549 7,471,267 1,996,318 28,283,603 55,534,737
ESTIMATED BUDGETFY2021‐2022
Page 25 ILLINOIS STATE BOARD OF EDUCATIONSchool Business Services Division
Page 25
1234
5
6
7
8
9
10
11
1213
14
15
16
17
18
19
202122
23
24
252627
A B
*School Districts Only
19‐022‐2000‐26District Number
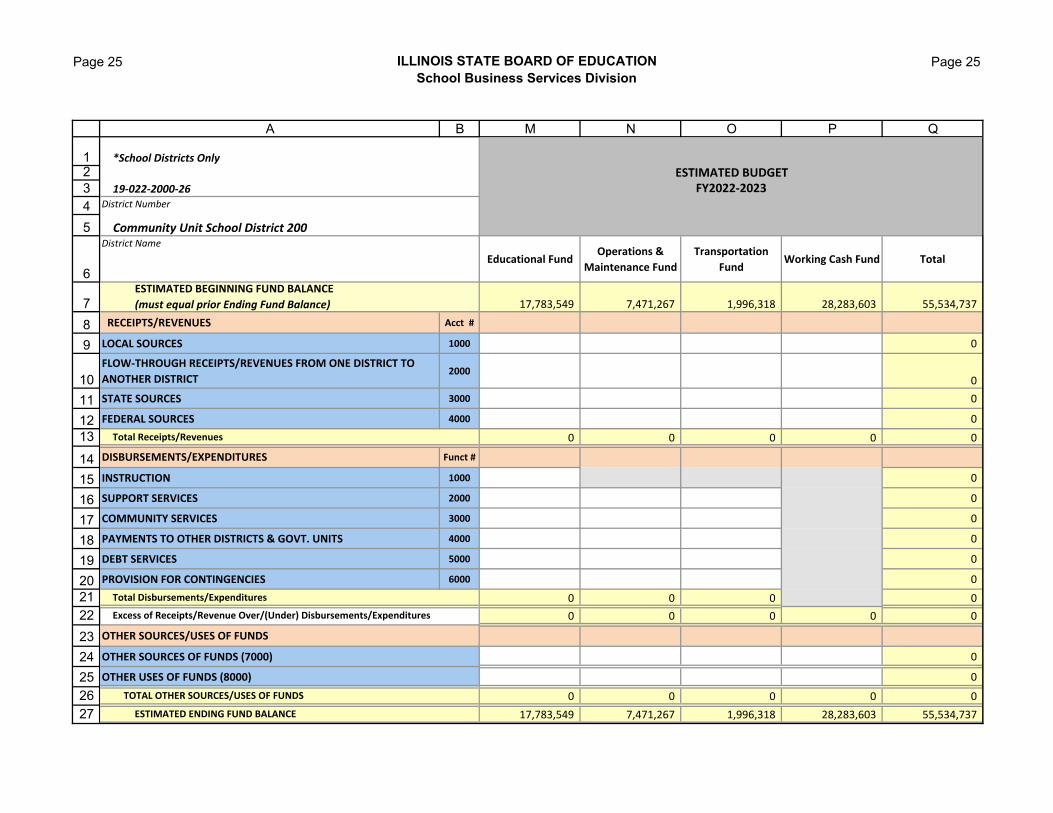
Community Unit School District 200District Name
RECEIPTS/REVENUES Acct #
LOCAL SOURCES 1000
FLOW‐THROUGH RECEIPTS/REVENUES FROM ONE DISTRICT TO
ANOTHER DISTRICT2000
STATE SOURCES 3000
FEDERAL SOURCES 4000
DISBURSEMENTS/EXPENDITURES Funct #
INSTRUCTION 1000
SUPPORT SERVICES 2000
COMMUNITY SERVICES 3000
PAYMENTS TO OTHER DISTRICTS & GOVT. UNITS 4000
DEBT SERVICES 5000
PROVISION FOR CONTINGENCIES 6000
OTHER SOURCES/USES OF FUNDS
OTHER SOURCES OF FUNDS (7000)
OTHER USES OF FUNDS (8000)
ESTIMATED BEGINNING FUND BALANCE
(must equal prior Ending Fund Balance)
TOTAL OTHER SOURCES/USES OF FUNDS
ESTIMATED ENDING FUND BALANCE
Total Receipts/Revenues
Excess of Receipts/Revenue Over/(Under) Disbursements/Expenditures
Total Disbursements/Expenditures
M N O P Q
Educational FundOperations &
Maintenance Fund
Transportation
FundWorking Cash Fund Total
17,783,549 7,471,267 1,996,318 28,283,603 55,534,737
0
0
0
0
0 0 0 0 0
0
0
0
0
0
0
0 0 0 0
0 0 0 0 0
0
0
0 0 0 0 0
17,783,549 7,471,267 1,996,318 28,283,603 55,534,737
ESTIMATED BUDGETFY2022‐2023

Page 26 ILLINOIS STATE BOARD OF EDUCATIONSchool Business Services Division
Page 26
1234
5
6
7
8
9
10
11
1213
14
15
16
17
18
19
202122
23
24
252627
A B
*School Districts Only
19‐022‐2000‐26District Number
Community Unit School District 200District Name
RECEIPTS/REVENUES Acct #
LOCAL SOURCES 1000
FLOW‐THROUGH RECEIPTS/REVENUES FROM ONE DISTRICT TO
ANOTHER DISTRICT2000
STATE SOURCES 3000
FEDERAL SOURCES 4000
DISBURSEMENTS/EXPENDITURES Funct #
INSTRUCTION 1000
SUPPORT SERVICES 2000
COMMUNITY SERVICES 3000
PAYMENTS TO OTHER DISTRICTS & GOVT. UNITS 4000
DEBT SERVICES 5000
PROVISION FOR CONTINGENCIES 6000
OTHER SOURCES/USES OF FUNDS
OTHER SOURCES OF FUNDS (7000)
OTHER USES OF FUNDS (8000)
ESTIMATED BEGINNING FUND BALANCE
(must equal prior Ending Fund Balance)
TOTAL OTHER SOURCES/USES OF FUNDS
ESTIMATED ENDING FUND BALANCE
Total Receipts/Revenues
Excess of Receipts/Revenue Over/(Under) Disbursements/Expenditures
Total Disbursements/Expenditures
R S T U V
Educational FundOperations &
Maintenance Fund
Transportation
FundWorking Cash Fund Total
17,783,549 7,471,267 1,996,318 28,283,603 55,534,737
0
0
0
0
0 0 0 0 0
0
0
0
0
0
0
0 0 0 0
0 0 0 0 0
0
0
0 0 0 0 0
17,783,549 7,471,267 1,996,318 28,283,603 55,534,737
ESTIMATED BUDGETFY2023‐2024
Page 27 ILLINOIS STATE BOARD OF EDUCATIONSchool Business Services Division
Page 27
1234
5
6
7
8
9
10
11
1213
14
15
16
17
18
19
202122
23
24
252627
A B
*School Districts Only
19‐022‐2000‐26District Number
Community Unit School District 200District Name
RECEIPTS/REVENUES Acct #
LOCAL SOURCES 1000
FLOW‐THROUGH RECEIPTS/REVENUES FROM ONE DISTRICT TO
ANOTHER DISTRICT2000
STATE SOURCES 3000
FEDERAL SOURCES 4000
DISBURSEMENTS/EXPENDITURES Funct #
INSTRUCTION 1000
SUPPORT SERVICES 2000
COMMUNITY SERVICES 3000
PAYMENTS TO OTHER DISTRICTS & GOVT. UNITS 4000
DEBT SERVICES 5000
PROVISION FOR CONTINGENCIES 6000
OTHER SOURCES/USES OF FUNDS
OTHER SOURCES OF FUNDS (7000)
OTHER USES OF FUNDS (8000)
ESTIMATED BEGINNING FUND BALANCE
(must equal prior Ending Fund Balance)
TOTAL OTHER SOURCES/USES OF FUNDS
ESTIMATED ENDING FUND BALANCE
Total Receipts/Revenues
Excess of Receipts/Revenue Over/(Under) Disbursements/Expenditures
Total Disbursements/Expenditures
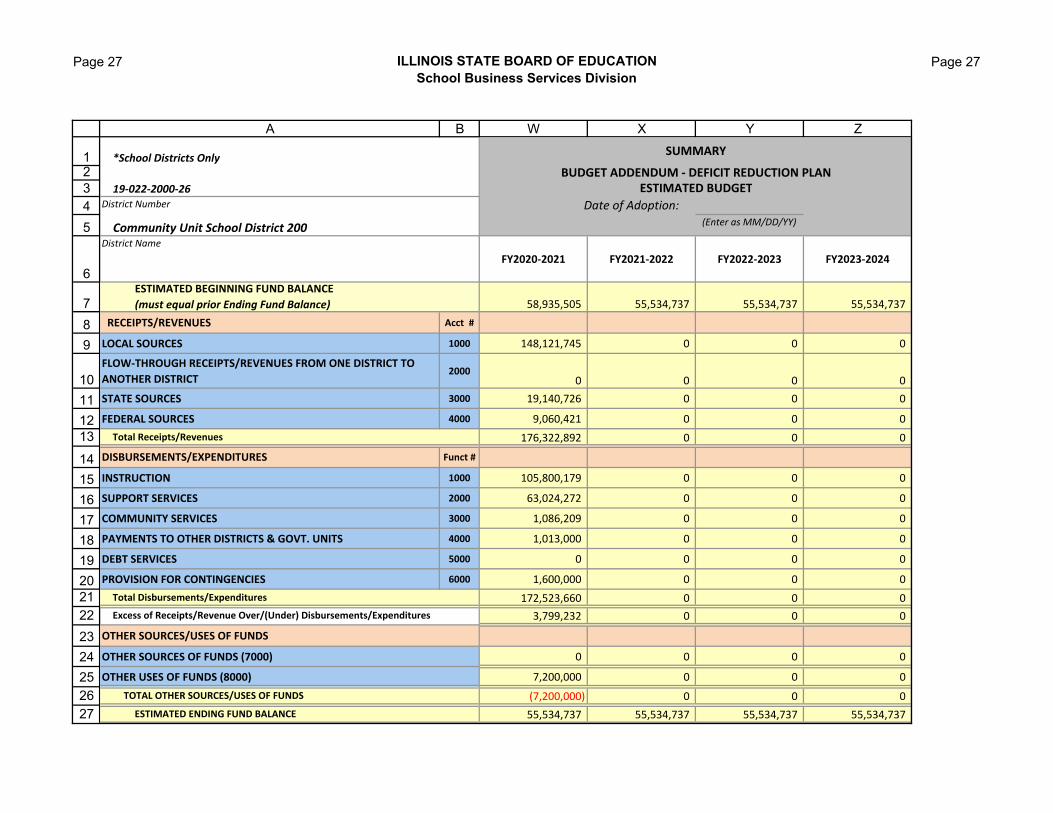
W X Y Z
(Enter as MM/DD/YY)
FY2020‐2021 FY2021‐2022 FY2022‐2023 FY2023‐2024
58,935,505 55,534,737 55,534,737 55,534,737
148,121,745 0 0 0
0 0 0 0
19,140,726 0 0 0
9,060,421 0 0 0
176,322,892 0 0 0
105,800,179 0 0 0
63,024,272 0 0 0
1,086,209 0 0 0
1,013,000 0 0 0
0 0 0 0
1,600,000 0 0 0
172,523,660 0 0 0
3,799,232 0 0 0
0 0 0 0
7,200,000 0 0 0
(7,200,000) 0 0 0
55,534,737 55,534,737 55,534,737 55,534,737
SUMMARY
Date of Adoption:
BUDGET ADDENDUM ‐ DEFICIT REDUCTION PLANESTIMATED BUDGET

Page 28 Page 28
Deficit Reduction Plan‐Background/Assumptions (School Districts Only)
Fiscal Year 2020‐2021 through Fiscal Year 2023‐2024
Community Unit School District 200 19‐022‐2000‐26
Please complete the following schedule and include a brief description to identify any areas of the budget that will be impacted from one year to the next. If the
deficit reduction plan relies upon new local revenues, identify contingencies for further budget reductions which will be enacted in the event those new revenues are
not available.
1. Background and Narrative of Budget Reductions:
2. Assumptions Used in the Deficit Reduction Plan:
‐ EBF and Estimated New Tier Funding:
‐ Equal Assessed Valuation and Tax Rates:
‐ Employee Salaries and Benefits:
‐ Short and Long Term Borrowing:
‐ Educational Impact:
Page 29 Page 29
‐ Other Assumptions:
‐ Has the district considered shared services or outsourcing (Ex: Transportation, Insurance) If yes please explain:
Page 30
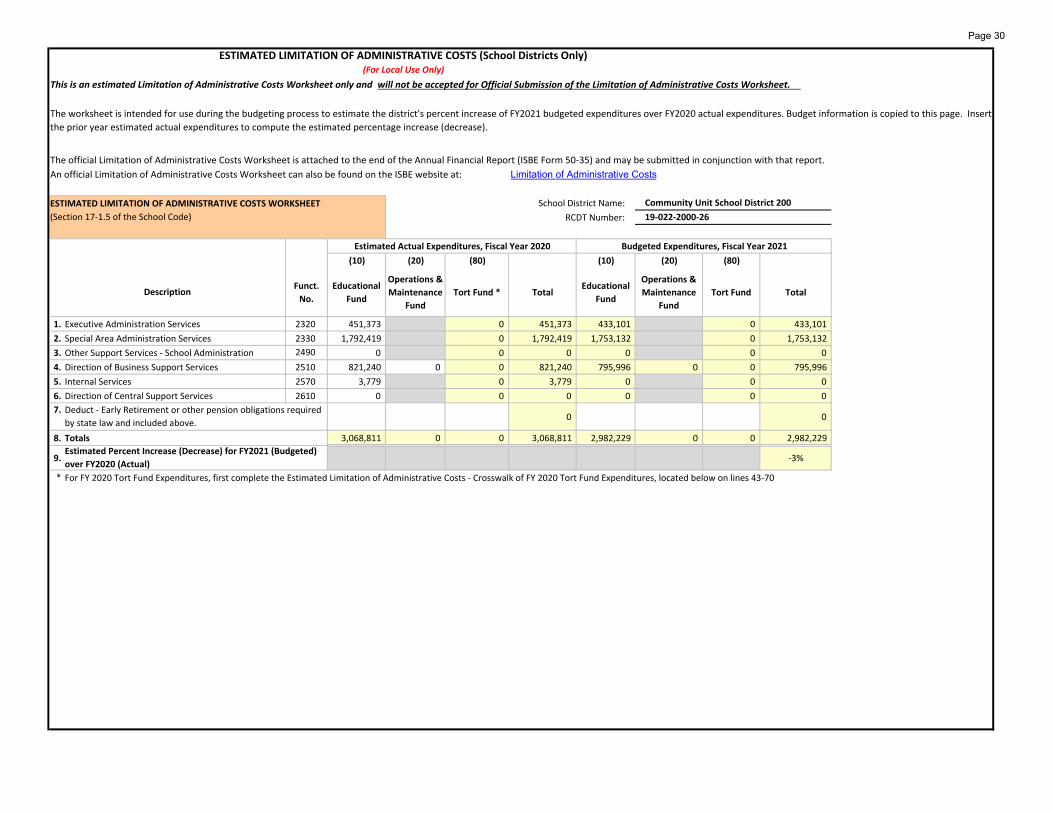
This is an estimated Limitation of Administrative Costs Worksheet only and will not be accepted for Official Submission of the Limitation of Administrative Costs Worksheet.
The official Limitation of Administrative Costs Worksheet is attached to the end of the Annual Financial Report (ISBE Form 50‐35) and may be submitted in conjunction with that report.
An official Limitation of Administrative Costs Worksheet can also be found on the ISBE website at: Limitation of Administrative Costs
ESTIMATED LIMITATION OF ADMINISTRATIVE COSTS WORKSHEET School District Name:
RCDT Number:
Estimated Actual Expenditures, Fiscal Year 2020 Budgeted Expenditures, Fiscal Year 2021
(10) (20) (80) (10) (20) (80)
Funct.
No.
Educational
Fund
Operations &
Maintenance
Fund
Tort Fund * TotalEducational
Fund
Operations &
Maintenance
Fund
Tort Fund Total
1. Executive Administration Services 2320 451,373 0 451,373 433,101 0 433,101
2. Special Area Administration Services 2330 1,792,419 0 1,792,419 1,753,132 0 1,753,132
3. Other Support Services ‐ School Administration 2490 0 0 0 0 0 0
4. Direction of Business Support Services 2510 821,240 0 0 821,240 795,996 0 0 795,996
5. Internal Services 2570 3,779 0 3,779 0 0 0
6. Direction of Central Support Services 2610 0 0 0 0 0 0
7.0 0
8. Totals 3,068,811 0 0 3,068,811 2,982,229 0 0 2,982,229
9. ‐3%
* For FY 2020 Tort Fund Expenditures, first complete the Estimated Limitation of Administrative Costs ‐ Crosswalk of FY 2020 Tort Fund Expenditures, located below on lines 43‐70
Community Unit School District 200
(Section 17‐1.5 of the School Code) 19‐022‐2000‐26
Description
Deduct ‐ Early Retirement or other pension obligations required
by state law and included above.
Estimated Percent Increase (Decrease) for FY2021 (Budgeted)
over FY2020 (Actual)
ESTIMATED LIMITATION OF ADMINISTRATIVE COSTS (School Districts Only) (For Local Use Only)
The worksheet is intended for use during the budgeting process to estimate the district's percent increase of FY2021 budgeted expenditures over FY2020 actual expenditures. Budget information is copied to this page. Insert
the prior year estimated actual expenditures to compute the estimated percentage increase (decrease).
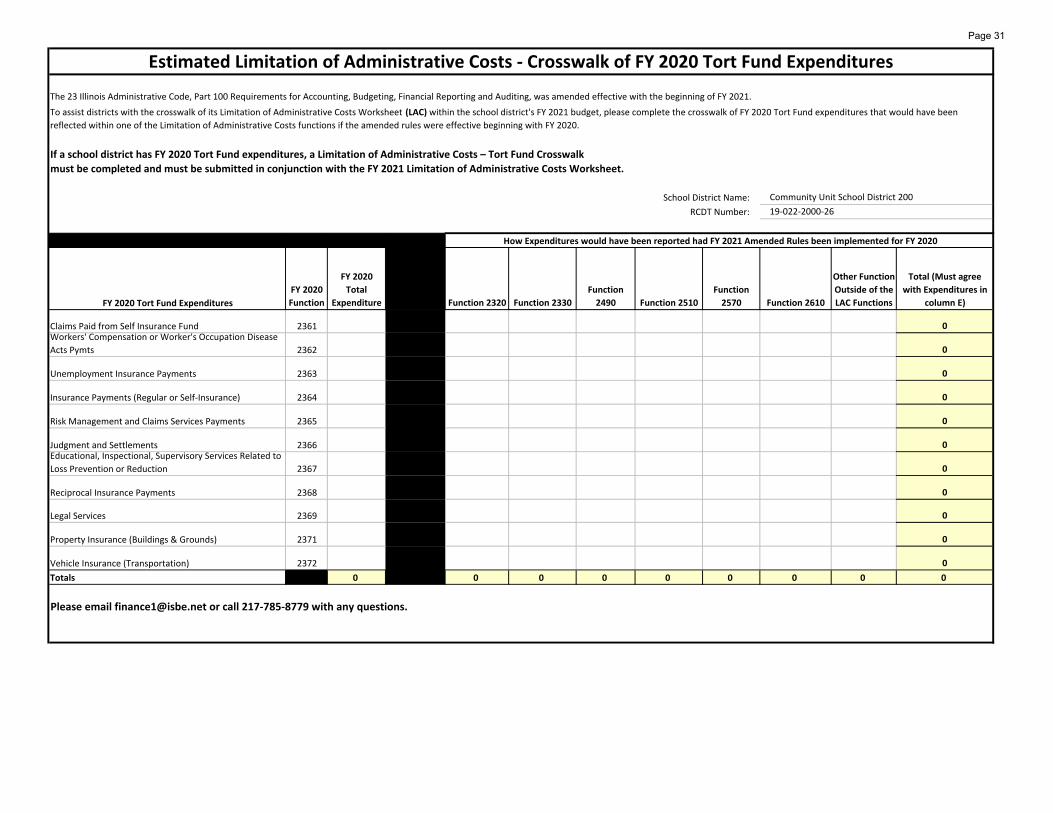
Page 31
The 23 Illinois Administrative Code, Part 100 Requirements for Accounting, Budgeting, Financial Reporting and Auditing, was amended effective with the beginning of FY 2021.
If a school district has FY 2020 Tort Fund expenditures, a Limitation of Administrative Costs – Tort Fund Crosswalk
must be completed and must be submitted in conjunction with the FY 2021 Limitation of Administrative Costs Worksheet.
School District Name:
RCDT Number:
FY 2020
Function
FY 2020
Total
Expenditure Function 2320 Function 2330
Function
2490 Function 2510
Function
2570 Function 2610
Other Function
Outside of the
LAC Functions
Total (Must agree
with Expenditures in
column E)
2361 0
2362 0
2363 0
2364 0
2365 0
2366 0
2367 0
2368 0
2369 0
2371 0
2372 0
0 0 0 0 0 0 0 0 0
Please email [email protected] or call 217‐785‐8779 with any questions.
Estimated Limitation of Administrative Costs ‐ Crosswalk of FY 2020 Tort Fund Expenditures
To assist districts with the crosswalk of its Limitation of Administrative Costs Worksheet (LAC) within the school district's FY 2021 budget, please complete the crosswalk of FY 2020 Tort Fund expenditures that would have been
reflected within one of the Limitation of Administrative Costs functions if the amended rules were effective beginning with FY 2020.
Community Unit School District 200
Educational, Inspectional, Supervisory Services Related to
Loss Prevention or Reduction
Reciprocal Insurance Payments
19‐022‐2000‐26
How Expenditures would have been reported had FY 2021 Amended Rules been implemented for FY 2020
FY 2020 Tort Fund Expenditures
Claims Paid from Self Insurance FundWorkers' Compensation or Worker's Occupation Disease
Acts Pymts
Legal Services
Property Insurance (Buildings & Grounds)
Vehicle Insurance (Transportation)
Totals
Unemployment Insurance Payments
Insurance Payments (Regular or Self‐Insurance)
Risk Management and Claims Services Payments
Judgment and Settlements
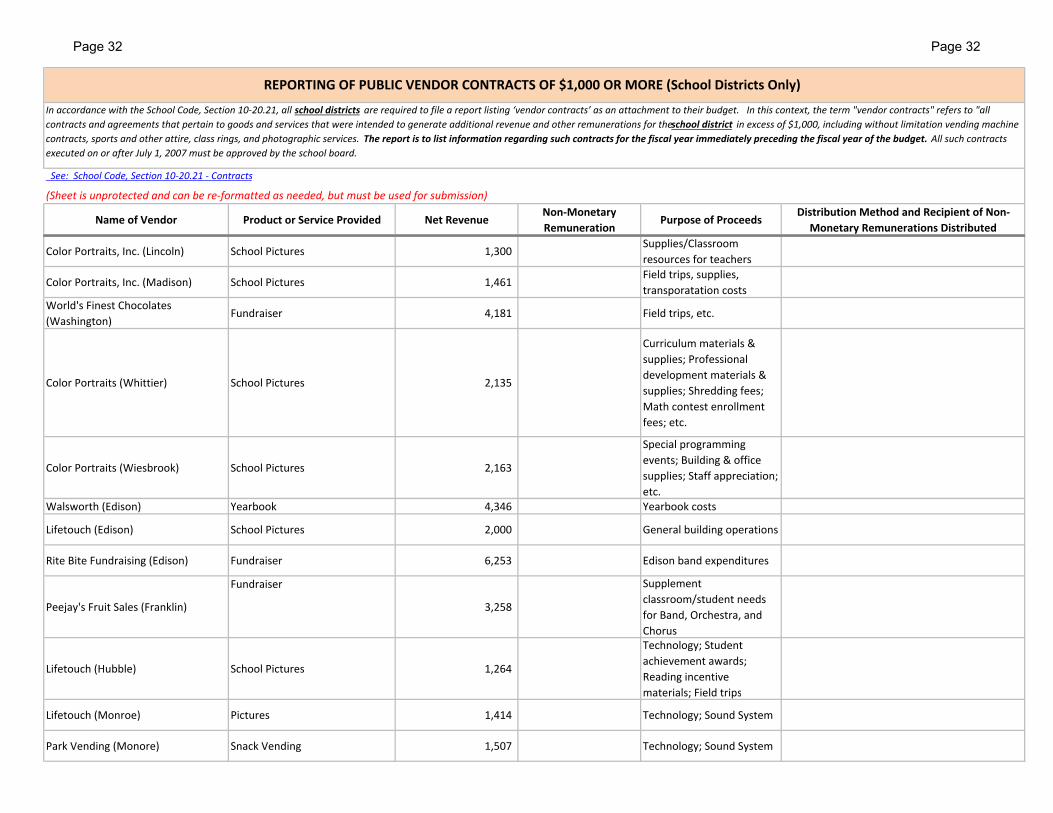
Page 32 Page 32
See: School Code, Section 10‐20.21 ‐ Contracts
(Sheet is unprotected and can be re‐formatted as needed, but must be used for submission)
Name of Vendor Product or Service Provided Net RevenueNon‐Monetary
RemunerationPurpose of Proceeds
Distribution Method and Recipient of Non‐
Monetary Remunerations Distributed
Color Portraits, Inc. (Lincoln) School Pictures 1,300Supplies/Classroom
resources for teachers
Color Portraits, Inc. (Madison) School Pictures 1,461Field trips, supplies,
transporatation costs
World's Finest Chocolates
(Washington)Fundraiser 4,181 Field trips, etc.
Color Portraits (Whittier) School Pictures 2,135
Curriculum materials &
supplies; Professional
development materials &
supplies; Shredding fees;
Math contest enrollment
fees; etc.
Color Portraits (Wiesbrook) School Pictures 2,163
Special programming
events; Building & office
supplies; Staff appreciation;
etc.Walsworth (Edison) Yearbook 4,346 Yearbook costs
Lifetouch (Edison) School Pictures 2,000 General building operations
Rite Bite Fundraising (Edison) Fundraiser 6,253 Edison band expenditures
Peejay's Fruit Sales (Franklin)
Fundraiser
3,258
Supplement
classroom/student needs
for Band, Orchestra, and
Chorus
Lifetouch (Hubble) School Pictures 1,264
Technology; Student
achievement awards;
Reading incentive
materials; Field trips
Lifetouch (Monroe) Pictures 1,414 Technology; Sound System
Park Vending (Monore) Snack Vending 1,507 Technology; Sound System
In accordance with the School Code, Section 10‐20.21, all school districts are required to file a report listing ‘vendor contracts’ as an attachment to their budget. In this context, the term "vendor contracts" refers to "all
contracts and agreements that pertain to goods and services that were intended to generate additional revenue and other remunerations for the school district in excess of $1,000, including without limitation vending machine
contracts, sports and other attire, class rings, and photographic services. The report is to list information regarding such contracts for the fiscal year immediately preceding the fiscal year of the budget. All such contracts
executed on or after July 1, 2007 must be approved by the school board.
REPORTING OF PUBLIC VENDOR CONTRACTS OF $1,000 OR MORE (School Districts Only)
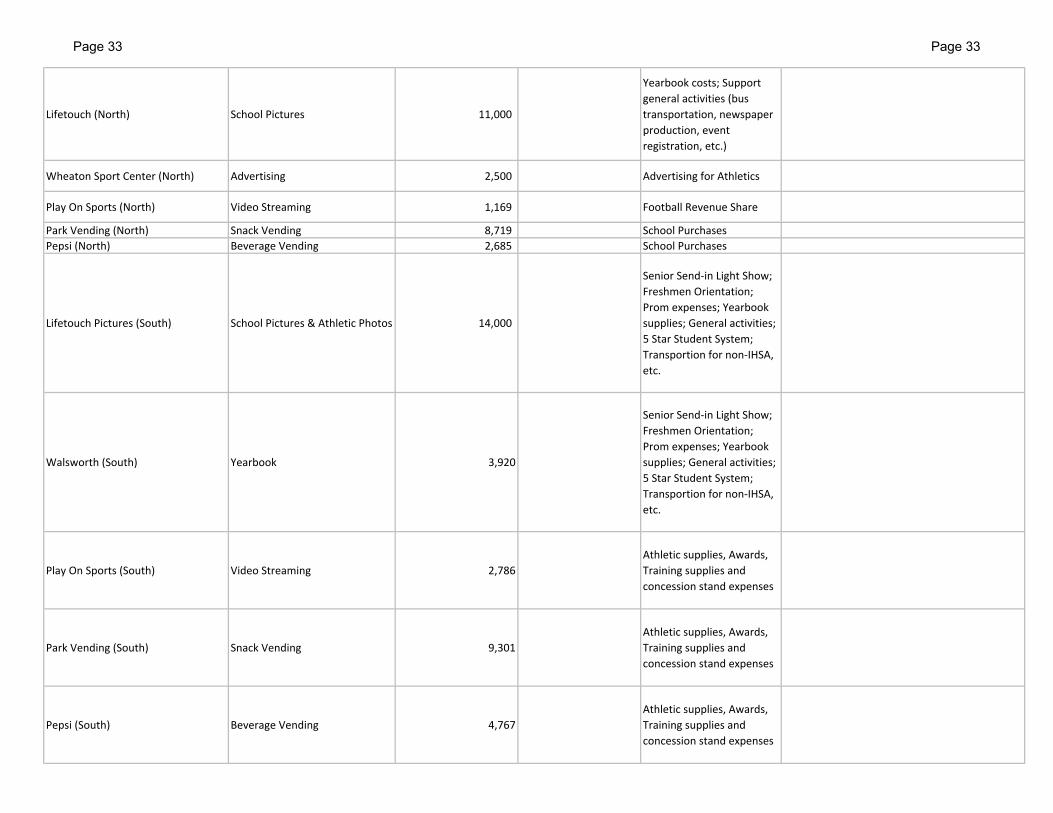
Page 33 Page 33
Lifetouch (North) School Pictures 11,000
Yearbook costs; Support
general activities (bus
transportation, newspaper
production, event
registration, etc.)
Wheaton Sport Center (North) Advertising 2,500 Advertising for Athletics
Play On Sports (North) Video Streaming 1,169 Football Revenue Share
Park Vending (North) Snack Vending 8,719 School Purchases
Pepsi (North) Beverage Vending 2,685 School Purchases
Lifetouch Pictures (South) School Pictures & Athletic Photos 14,000
Senior Send‐in Light Show;
Freshmen Orientation;
Prom expenses; Yearbook
supplies; General activities;
5 Star Student System;
Transportion for non‐IHSA,
etc.
Walsworth (South) Yearbook 3,920
Senior Send‐in Light Show;
Freshmen Orientation;
Prom expenses; Yearbook
supplies; General activities;
5 Star Student System;
Transportion for non‐IHSA,
etc.
Play On Sports (South) Video Streaming 2,786
Athletic supplies, Awards,
Training supplies and
concession stand expenses
Park Vending (South) Snack Vending 9,301
Athletic supplies, Awards,
Training supplies and
concession stand expenses
Pepsi (South) Beverage Vending 4,767
Athletic supplies, Awards,
Training supplies and
concession stand expenses
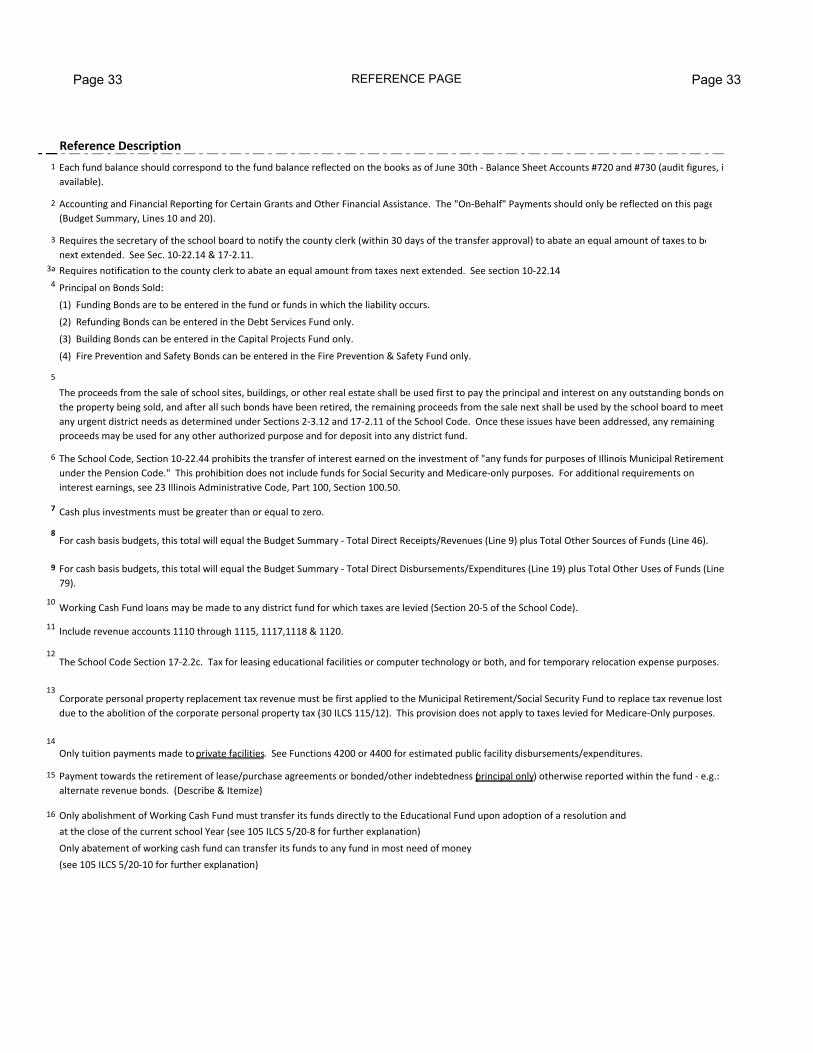
Page 33 REFERENCE PAGE Page 33
Reference Description
1 Each fund balance should correspond to the fund balance reflected on the books as of June 30th ‐ Balance Sheet Accounts #720 and #730 (audit figures, i
available).
2 Accounting and Financial Reporting for Certain Grants and Other Financial Assistance. The "On‐Behalf" Payments should only be reflected on this page
(Budget Summary, Lines 10 and 20).
3 Requires the secretary of the school board to notify the county clerk (within 30 days of the transfer approval) to abate an equal amount of taxes to be
next extended. See Sec. 10‐22.14 & 17‐2.11.3a Requires notification to the county clerk to abate an equal amount from taxes next extended. See section 10‐22.144 Principal on Bonds Sold:
(1) Funding Bonds are to be entered in the fund or funds in which the liability occurs.
(2) Refunding Bonds can be entered in the Debt Services Fund only.
(3) Building Bonds can be entered in the Capital Projects Fund only.
(4) Fire Prevention and Safety Bonds can be entered in the Fire Prevention & Safety Fund only.
5
The proceeds from the sale of school sites, buildings, or other real estate shall be used first to pay the principal and interest on any outstanding bonds on
the property being sold, and after all such bonds have been retired, the remaining proceeds from the sale next shall be used by the school board to meet
any urgent district needs as determined under Sections 2‐3.12 and 17‐2.11 of the School Code. Once these issues have been addressed, any remaining
proceeds may be used for any other authorized purpose and for deposit into any district fund.
6 The School Code, Section 10‐22.44 prohibits the transfer of interest earned on the investment of "any funds for purposes of Illinois Municipal Retirement
under the Pension Code." This prohibition does not include funds for Social Security and Medicare‐only purposes. For additional requirements on
interest earnings, see 23 Illinois Administrative Code, Part 100, Section 100.50.
7 Cash plus investments must be greater than or equal to zero.
8For cash basis budgets, this total will equal the Budget Summary ‐ Total Direct Receipts/Revenues (Line 9) plus Total Other Sources of Funds (Line 46).
9 For cash basis budgets, this total will equal the Budget Summary ‐ Total Direct Disbursements/Expenditures (Line 19) plus Total Other Uses of Funds (Line
79).
10Working Cash Fund loans may be made to any district fund for which taxes are levied (Section 20‐5 of the School Code).
11Include revenue accounts 1110 through 1115, 1117,1118 & 1120.
12The School Code Section 17‐2.2c. Tax for leasing educational facilities or computer technology or both, and for temporary relocation expense purposes.
13Corporate personal property replacement tax revenue must be first applied to the Municipal Retirement/Social Security Fund to replace tax revenue lost
due to the abolition of the corporate personal property tax (30 ILCS 115/12). This provision does not apply to taxes levied for Medicare‐Only purposes.
14
Only tuition payments made to private facilities. See Functions 4200 or 4400 for estimated public facility disbursements/expenditures.
15 Payment towards the retirement of lease/purchase agreements or bonded/other indebtedness (principal only) otherwise reported within the fund ‐ e.g.:
alternate revenue bonds. (Describe & Itemize)
16 Only abolishment of Working Cash Fund must transfer its funds directly to the Educational Fund upon adoption of a resolution and
at the close of the current school Year (see 105 ILCS 5/20‐8 for further explanation)
Only abatement of working cash fund can transfer its funds to any fund in most need of money
(see 105 ILCS 5/20‐10 for further explanation)