Economic Sustainable Development at LPM - Anglo American
106
Tanaka Business School Imperial College London (University of London) A Critical Review of Sustainable Economic Development in the Mining Industry: A Case Study of Lebowa Platinum Mine in South Africa By Kenton Kirkwood A report submitted in partial fulfilment of the requirements for the MBA degree and the Diploma of Imperial College London December 2006
-
Upload
khangminh22 -
Category
Documents
-
view
0 -
download
0
Transcript of Economic Sustainable Development at LPM - Anglo American
Tanaka Business School
Imperial College London
(University of London)
A Critical Review of Sustainable Economic
Development in the Mining Industry: A Case Study of
Lebowa Platinum Mine in South Africa
By
Kenton Kirkwood
A report submitted in partial fulfilment of the
requirements for the MBA degree and the Diploma of Imperial College London
December 2006
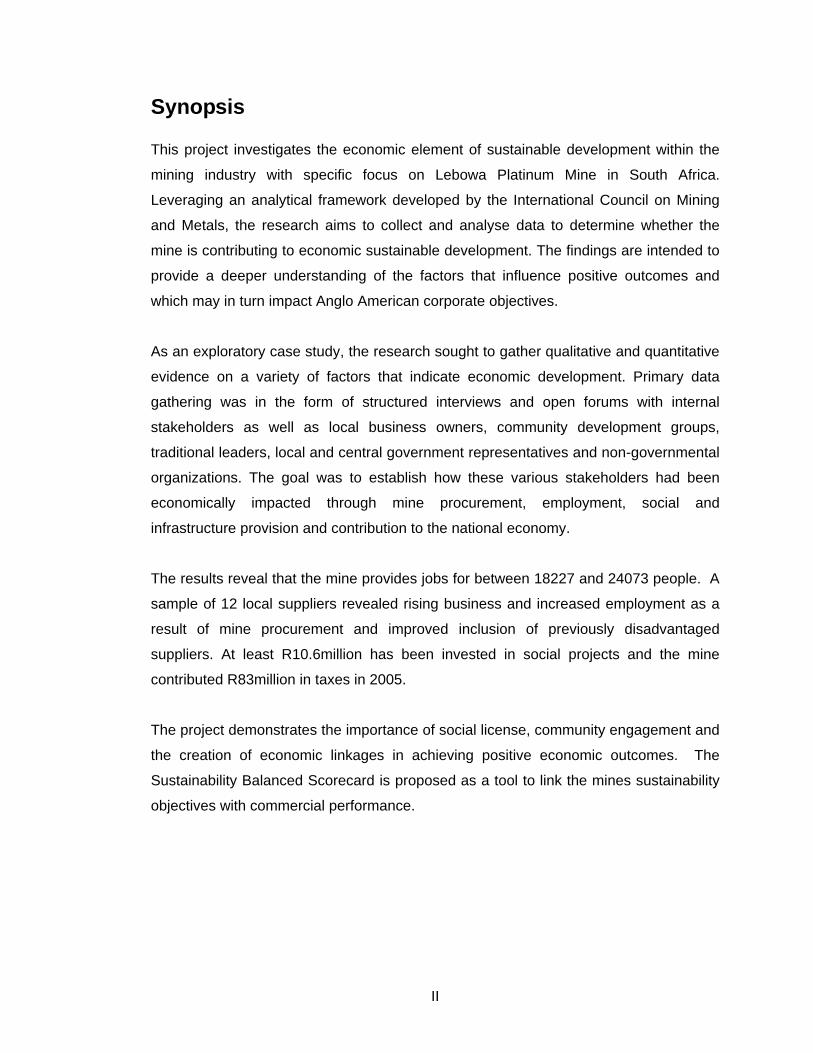
Synopsis This project investigates the economic element of sustainable development within the
mining industry with specific focus on Lebowa Platinum Mine in South Africa.
Leveraging an analytical framework developed by the International Council on Mining
and Metals, the research aims to collect and analyse data to determine whether the
mine is contributing to economic sustainable development. The findings are intended to
provide a deeper understanding of the factors that influence positive outcomes and
which may in turn impact Anglo American corporate objectives.
As an exploratory case study, the research sought to gather qualitative and quantitative
evidence on a variety of factors that indicate economic development. Primary data
gathering was in the form of structured interviews and open forums with internal
stakeholders as well as local business owners, community development groups,
traditional leaders, local and central government representatives and non-governmental
organizations. The goal was to establish how these various stakeholders had been
economically impacted through mine procurement, employment, social and
infrastructure provision and contribution to the national economy.
The results reveal that the mine provides jobs for between 18227 and 24073 people. A
sample of 12 local suppliers revealed rising business and increased employment as a
result of mine procurement and improved inclusion of previously disadvantaged
suppliers. At least R10.6million has been invested in social projects and the mine
contributed R83million in taxes in 2005.
The project demonstrates the importance of social license, community engagement and
the creation of economic linkages in achieving positive economic outcomes. The
Sustainability Balanced Scorecard is proposed as a tool to link the mines sustainability
objectives with commercial performance.
II
Acknowledgements I would like to thank Anglo American Plc and Ian Emsley for allowing me the opportunity
to become involved in this study. In addition special mention needs to be made of Anglo
Platinum’s Stephen Bullock in Johannesburg and Felix Manyanga, Andrew Letlapa and
the team at Lebowa Platinum Mine.
I’d also like to thank my supervisor Ebrahim Mohamed for providing invaluable
guidance and insight throughout the project.
Lastly I’d like to thank my wife Veronica for her patience, energy and support.
III
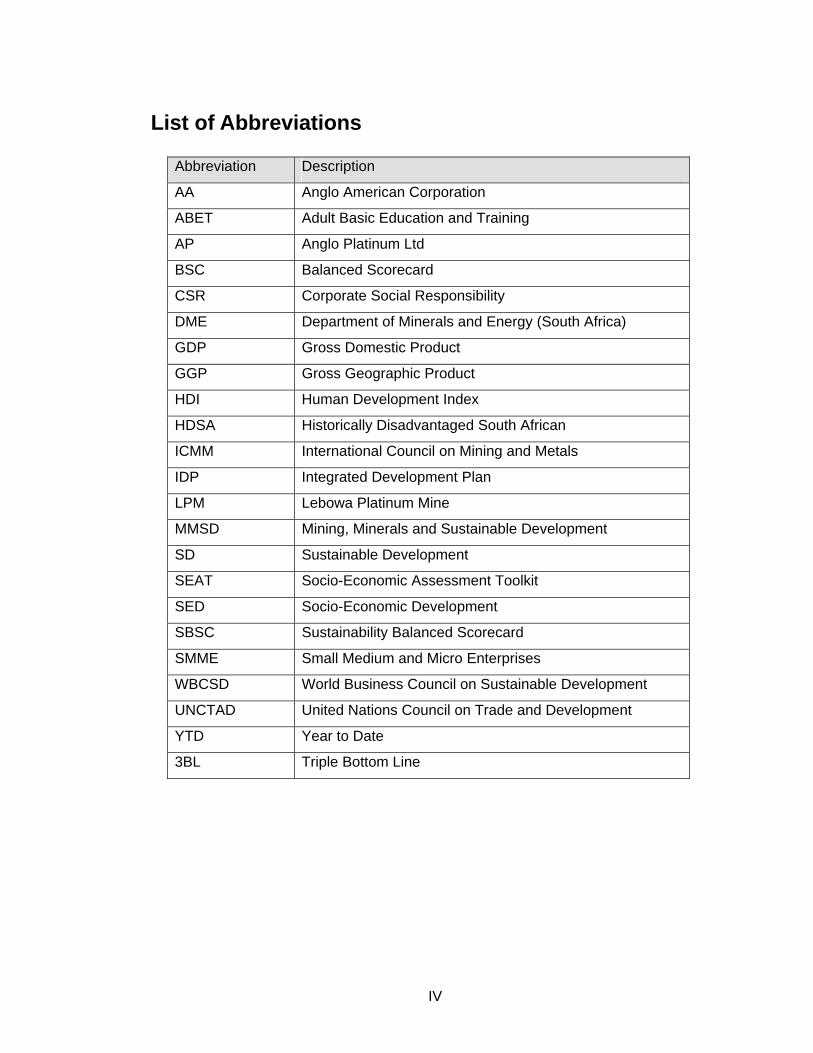
List of Abbreviations
Abbreviation Description
AA Anglo American Corporation
ABET Adult Basic Education and Training
AP Anglo Platinum Ltd
BSC Balanced Scorecard
CSR Corporate Social Responsibility
DME Department of Minerals and Energy (South Africa)
GDP Gross Domestic Product
GGP Gross Geographic Product
HDI Human Development Index
HDSA Historically Disadvantaged South African
ICMM International Council on Mining and Metals
IDP Integrated Development Plan
LPM Lebowa Platinum Mine
MMSD Mining, Minerals and Sustainable Development
SD Sustainable Development
SEAT Socio-Economic Assessment Toolkit
SED Socio-Economic Development
SBSC Sustainability Balanced Scorecard
SMME Small Medium and Micro Enterprises
WBCSD World Business Council on Sustainable Development
UNCTAD United Nations Council on Trade and Development
YTD Year to Date
3BL Triple Bottom Line
IV
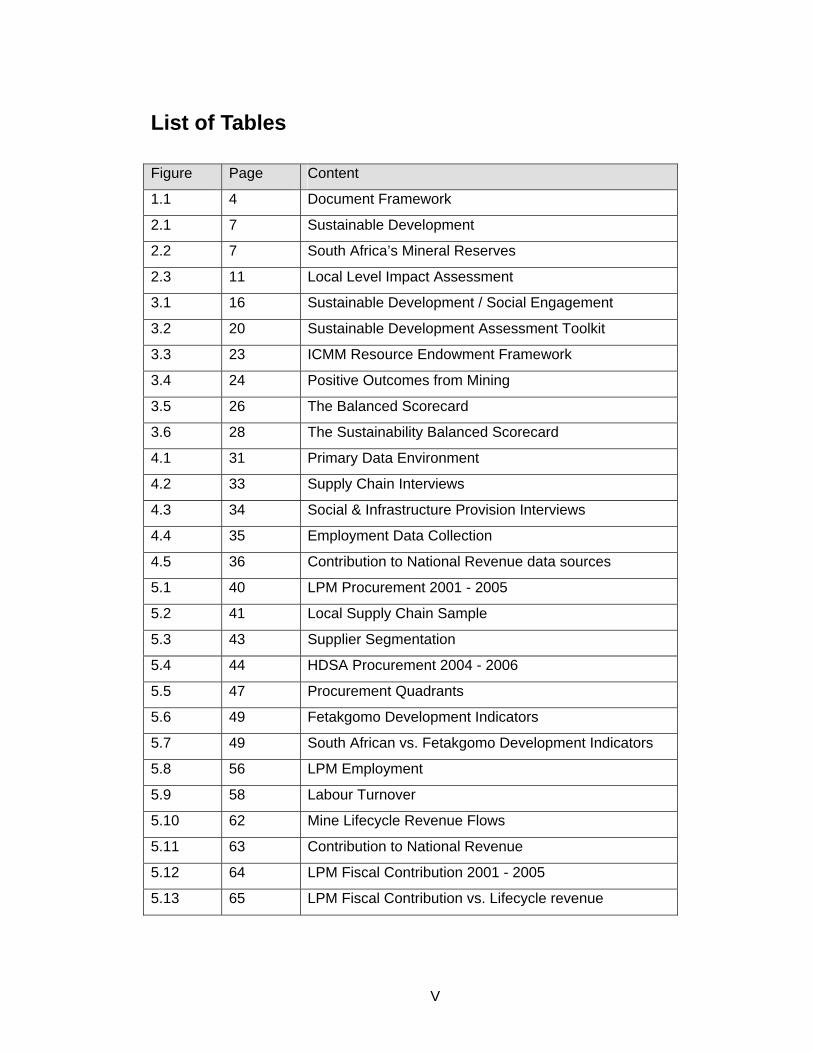
List of Tables
Figure Page Content
1.1 4 Document Framework
2.1 7 Sustainable Development
2.2 7 South Africa’s Mineral Reserves
2.3 11 Local Level Impact Assessment
3.1 16 Sustainable Development / Social Engagement
3.2 20 Sustainable Development Assessment Toolkit
3.3 23 ICMM Resource Endowment Framework
3.4 24 Positive Outcomes from Mining
3.5 26 The Balanced Scorecard
3.6 28 The Sustainability Balanced Scorecard
4.1 31 Primary Data Environment
4.2 33 Supply Chain Interviews
4.3 34 Social & Infrastructure Provision Interviews
4.4 35 Employment Data Collection
4.5 36 Contribution to National Revenue data sources
5.1 40 LPM Procurement 2001 - 2005
5.2 41 Local Supply Chain Sample
5.3 43 Supplier Segmentation
5.4 44 HDSA Procurement 2004 - 2006
5.5 47 Procurement Quadrants
5.6 49 Fetakgomo Development Indicators
5.7 49 South African vs. Fetakgomo Development Indicators
5.8 56 LPM Employment
5.9 58 Labour Turnover
5.10 62 Mine Lifecycle Revenue Flows
5.11 63 Contribution to National Revenue
5.12 64 LPM Fiscal Contribution 2001 - 2005
5.13 65 LPM Fiscal Contribution vs. Lifecycle revenue
V
Contents
Synopsis.......................................................................................................................... II
Acknowledgements ........................................................................................................ III
List of Abbreviations .......................................................................................................IV
List of Tables ...................................................................................................................V
Contents .........................................................................................................................VI
Chapter 1: Introduction.................................................................................................... 1
1.1. Background ..................................................................................................... 1 1.2. Research Objectives ....................................................................................... 3 1.3. Report Structure .............................................................................................. 3
Chapter 2: Background ................................................................................................... 5
2.1. Corporate Sustainable Development............................................................... 5 2.2. Mining in South Africa...................................................................................... 7 2.3. Anglo Platinum and Lebowa Mine ................................................................... 9 2.4. The ICMM Resource Endowment Toolkit ...................................................... 10
Chapter 3: Literature Review......................................................................................... 12
3.1. Sustainable Development.............................................................................. 12 3.2. Sustainable Development in the Mining Industry........................................... 14 3.3. The Importance of Developing Social Engagement ...................................... 15 3.4. The Relevance of Partnership and Linkages................................................. 17 3.5. Regional Development and Mining................................................................ 19
3.5.1. The Strong Linkage Model ...................................................................... 19 3.5.2. The Weak Linkage Model........................................................................ 20
3.6. Sustainable Development Frameworks and Management Models ............... 21 3.6.1. Sustainable Development Assessment Tool ........................................... 21 3.6.2. Resource Endowment Toolkit.................................................................. 22 3.6.3. Socio Economic Assessment Toolkit....................................................... 24 3.6.4. The Balanced Scorecard and Sustainable Balanced Scorecard............. 26 3.7 Summary ........................................................................................................ 29 Chapter 4: Research Methodology................................................................................ 30
4.1. Methodology .................................................................................................. 30 4.2. Data Gathering Process ................................................................................ 31
4.2.1. Procurement: ............................................................................................ 31 4.2.2. Social and Infrastructure Provision........................................................... 33 4.2.3. Employment: ............................................................................................ 34 4.2.4. Contribution to National Economy: ........................................................... 35
4.3. Access and Confidentiality: ........................................................................... 36
VI
Chapter 5: Data Analysis............................................................................................... 38
5. 1. Procurement ................................................................................................. 38 5.1.1. The Impact of Procurement ...................................................................... 38 5.1.2. Overview of the LPM Supply Chain.......................................................... 39 5.1.3. Local Procurement ................................................................................... 40 5.1.4. Capital Expenditure Projects .................................................................... 42 5.1.5. Supply Chain Development: ..................................................................... 43 5.1.6. Summary .................................................................................................. 47
5.2. Social Development and Infrastructure Provision.......................................... 48
5.2.1. Overview ................................................................................................... 48 5.2.2. Projects ..................................................................................................... 50 5.2.3. Land Use ................................................................................................... 51 5.2.4. Community Engagement ........................................................................... 52 5.2.5. Resettlement and Compensation .............................................................. 53 5.2.6. Summary ................................................................................................... 54
5.3. Employment................................................................................................... 55
5.3.1. Overview .................................................................................................... 55 5.3.2. Local Employment Challenges................................................................... 57 5.3.3. Human Capital Development...................................................................... 58 5.3.4. Summary .................................................................................................... 59
5.4 Value Contributed to Host Economy .............................................................. 61
5.4.1. Significance to host economy at Macro level ............................................. 61 5.4.2. Fiscal Revenue Contribution ...................................................................... 62 5.4.3. Summary .................................................................................................... 65
Chapter 6: Recommendations and Conclusions ........................................................... 66
6.1. Recommendations......................................................................................... 66 6.2. Review of Research Question ....................................................................... 68 6.3. Economic Impact and Sustainability .............................................................. 68 6.4. Implications for Corporate Strategy ............................................................... 69 6.5. Limitations and Future Research................................................................... 70 6.6. Conclusion..................................................................................................... 71
References .................................................................................................................... 72
Appendices.................................................................................................................... 79
Appendix 1: List of Interviews (Excluding Local Suppliers) .................................. 79 Appendix 2: Community Social Investment .......................................................... 80 Appendix: 3: Labour Profile July 2006.................................................................. 84 Appendix 4: Employment Impact .......................................................................... 85 Appendix 5: Mine Location ................................................................................... 86 Appendix 6: ICMM Fiscal Contributions Check-list............................................... 87 Appendix 7: Site Visit Itinerary – July/August 2006 .............................................. 88 Appendix 8: Mine Production Statistics ................................................................ 89 Appendix 9: Social Initiative – HIV/AIDS Awareness............................................ 90 Appendix 10: Supply Chain Analysis: Sample Questionnaire .............................. 91
VII

Appendix 11 Local Supplier Data ......................................................................... 92 Appendix 12: Social Investment Projects ............................................................. 93 Appendix 13: Socio- Economic Assessment Toolbox .......................................... 94 Appendix 14: VCT Initiatives at LPM .................................................................... 95 Appendix 15: Trial Procurement Policy ................................................................ 96 Appendix 16: Business Development Model ........................................................ 97
VIII
Chapter 1: Introduction
1.1. Background Within the business community the issue of sustainable development has emerged as a
significant theme. In a recent survey1 of senior executives and institutional investors by
the Economist, 85% of respondents noted that sustainable development2 was “central”
or “important” to investment decisions. The management advisory firms KPMG
(International CSR Survey) and PriceWaterhouseCoopers (Global CEO Survey) noted
similar findings.
The increasing role of sustainable development (SD) is impacting the relationship
between firms and its various stakeholders: investors, customers, suppliers, employees,
communities and governments. More is expected from organisations and accordingly
companies that have poor performance in sustainable development are facing growing
pressure from a multitude of sources.
Traditionally the responsibility of management was to act to maximise shareholder or
firm value. Does acting to benefit the welfare of other stakeholders then conflict with this
notion? One view is that sustainable development can lead to the maximization of firm
value through acting to improve the welfare of interest groups that are able to affect firm
value (Fisman et al 2006:p1).
The frameworks used to achieve such success are less well understood and more
importantly highly contextual. Most management writers acknowledge the preliminary
nature of research into such tools and frameworks particularly within certain industries.
The mining and resource sector is one such industry. Mining particularly, faces
immense pressure to proactively deliver to the three dimensions of sustainable
development: social, environmental and economic. To succeed in this endeavour a
clear understanding of the drivers and dynamics involved in sustainable development is
required. This report explicitly acknowledges the significance of social and
environmental factors; however it is the economic element which is examined.
1 Economist (2005) Corporate Social Responsibility Survey: The Good Company. January 2005 2 The terms sustainable development and corporate social responsibility are used interchangeably throughout the text.
1
In efforts to facilitate the maximisation of economic sustainability through its operations
the mining company Anglo-American (AA) currently pursues a number of corporate
initiatives. AA is also a signatory to various international initiatives on sustainable
development. One such initiative is the International Council on Mining and Metals’
(ICMM) Resource Endowment Programme. This programme was created to assist
resource companies to better understand regional, national and local impacts of mining.
The Resource Endowment Toolkit acts as an analytical framework that is able to
provide solid foundations for SD strategy, implementation and management best
practice.
While already a robust methodology in its own right, the Resource Endowment Toolkit
like other such tools within the industry is still in its formative stages. Practical
application of the framework may be able to influence the future effectiveness of its use,
while at the same time facilitating the analysis and understanding of sustainable
economic development in the field. It is for this reason that the research was
commissioned.
This report takes the form of a case study, and examines the economic development
performance of Lebowa Platinum Mine in South Africa using the Resource Endowment
Toolkit as the analytical framework. Results of the study are used to formulate
recommendations and may be used to assess the effectiveness of the model for
implementation on other mining operations around the world.
2
1.2. Research Objectives
Using the analytical framework of the ICMM model the project aims to analyze the
economic contribution of the Lebowa Platinum Mine within the framework of sustainable
development. This will be achieved through the collection and analysis of primary and
secondary data associated with the following areas of impact: Procurement,
Employment, Social and Infrastructure Provision and Fiscal Contribution.
Using Lebowa Platinum Mine as a case study the project will:
Seek to understand how effective mine procurement has been in stimulating local
economic development through analysis of a sample of twelve local suppliers.
Explore human capital development through examining employment data, skills
development, training, health and social investment.
Measure the economic value added to the local and national revenues through
royalties, taxes and infrastructure provision.
1.3. Report Structure
The report is organized into six sections. Chapter 1 provides a brief introduction.
Chapter 2 examines the contextual framework of the report, exposes some of the key
issues and introduces the theoretical framework that is explored later in the text.
Chapter 3 explores the literature surrounding sustainable development in the mining
industry and some of the frameworks related to management best practice. Chapter 4
outlines the methodology that was adopted and provides a brief overview of how data
was collected.
Chapter 5 examines the evidence whether Lebowa provides sustainable economic
development to the local community. This is conducted through the analysis of four
primary levels of economic impact: procurement, social and infrastructure provision,
employment and contribution to the national economy. Chapter 6 provides
recommendations and conclusions and exposes potential areas for future research.
3
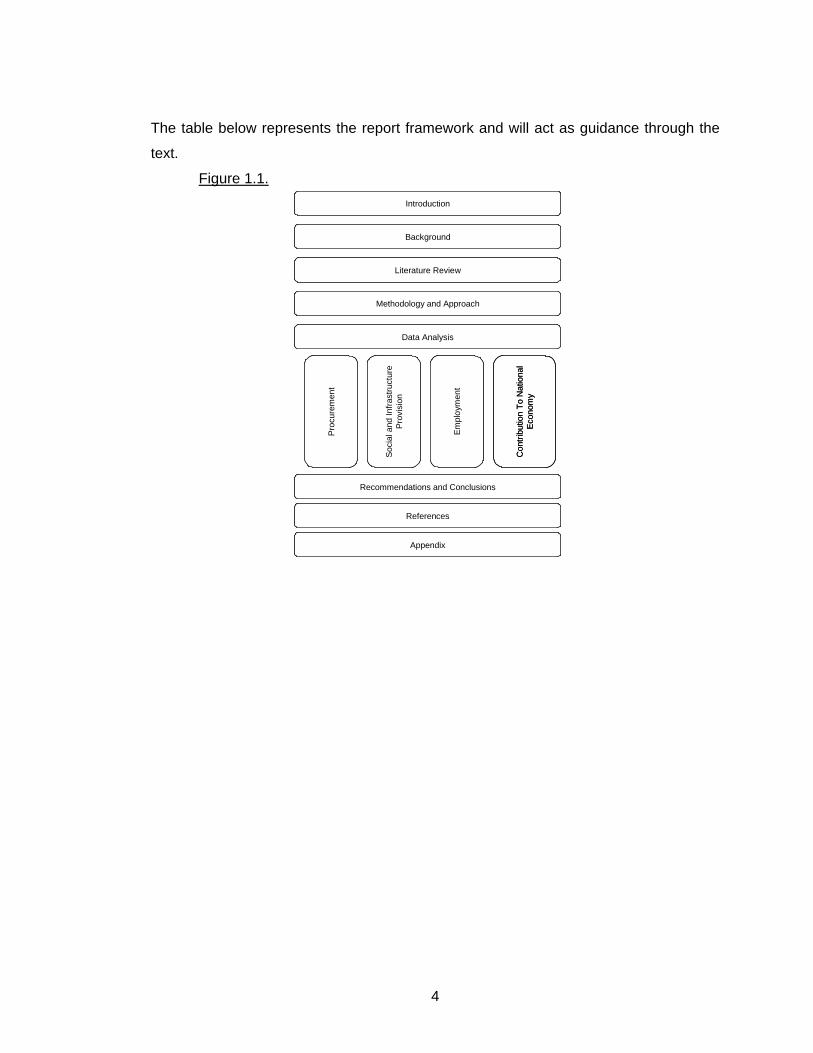
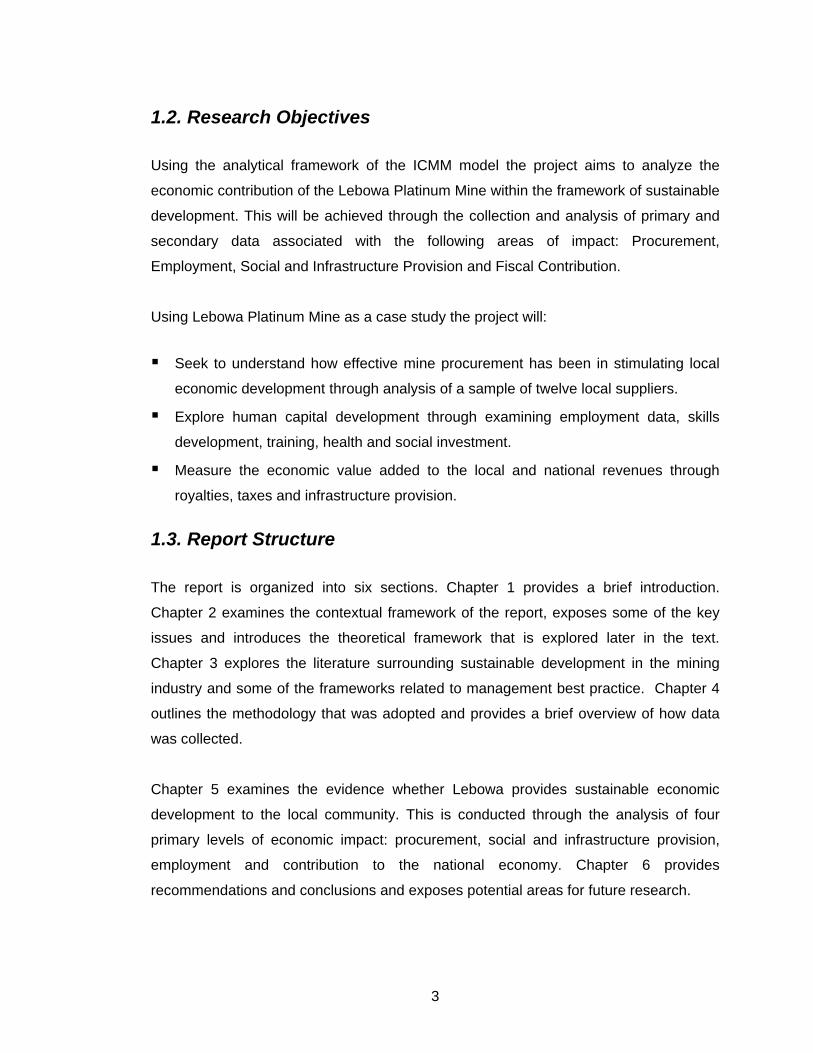
The table below represents the report framework and will act as guidance through the
text.
Figure 1.1.
Background
Methodology and Approach
Literature Review
Data AnalysisPr
ocur
emen
t
Empl
oym
ent
Soci
al a
nd In
frast
ruct
ure
Prov
isio
n
Recommendations and Conclusions
References
Appendix
Con
tribu
tion
To N
atio
nal
Econ
omy
Introduction
Background
Methodology and Approach
Literature Review
Data AnalysisPr
ocur
emen
t
Empl
oym
ent
Soci
al a
nd In
frast
ruct
ure
Prov
isio
n
Recommendations and Conclusions
References
Appendix
Con
tribu
tion
To N
atio
nal
Econ
omy
Introduction
4
Chapter 2: Background
2.1. Corporate Sustainable Development
The terms Corporate Social Responsibility,
Sustainability, Sustainable Development and
Corporate Responsibility all broadly refer to the
same concept which covers environmental,
social and economic performance in varying
levels of detail (KPMG: 2005). The World
Business Council for Sustainable Development
(2004) cited by KPMG (2005:p10) defines
Sustainable Development as “the commitment
of business to contribute to sustainable
economic development, working with
employees, their families, the local community
and society at large to improve their quality of
life”.
Background
Methodology and Approach
Literature Review
Data Analysis
Proc
urem
ent
Empl
oym
ent
Soci
al a
nd In
frast
ruct
ure
Pro
visi
on
Recommendations and Conclusions
References
Appendix
Con
tribu
tion
To N
atio
nal
Eco
nom
y
Introduction
Background
Methodology and Approach
Literature Review
Data Analysis
Proc
urem
ent
Empl
oym
ent
Soci
al a
nd In
frast
ruct
ure
Pro
visi
on
Recommendations and Conclusions
References
Appendix
Con
tribu
tion
To N
atio
nal
Eco
nom
y
Introduction
This concept has increasingly demanded priority on corporate agendas and is rapidly
becoming a requirement to do business. According to the University of Amsterdam and
KPMG (2005:p7) the number of large international companies producing separate
corporate responsibility reports has tripled since 1993. KPMG (2005:p9) state that over
52% of the worlds top 250 companies on the global Fortune 500 produce separate in-
depth corporate responsibility reports along with their annual financial statements. The
reason given for this rise was both economic and ethical. Economic drivers included the
proliferation (KPMG 2005:p4) of such factors such as building a good brand, positioning
as employer of choice, reinforcing market position, building strong relationships with
financial markets and increasing shareholder value.
Mining and resource companies rank particularly highly in terms of measurement and
reporting of corporate responsibility which may in part reflect the high level of scrutiny
they receive and high level of impact they have on the communities within which they
operate (Jimena 2006: p8). Within this context international public and private sector
5
bodies3 are increasingly engaging with business and governments to influence not only
reporting but also policy formulation and implementation. For effective engagement
organizations require common understanding on the concept, however Van Zyl
(2005:p4) maintains that this is not that easy as there are currently about 60 different
definitions of the term sustainable development in circulation. The mostly widely used is
the definition offered by the Brundtland Commission delivered on behalf of the World
Commission on Economic Development: “to meet the needs of the present generation
without compromising the ability of future generations to meet theirs” (Brundtland 1987:
p43). Sustainable development including the practice of corporate responsibility is
widely regarded as consisting of three separate elements: Economic, Social and
Environmental. While this paper focuses on the economic component of sustainability
the three concepts are closely interdependent. Bansal (2004 p198) maintains that if any
one of the three principles are not supported, economic development will not be
sustainable
Mineral resources are non-renewable and mines have lifecycles only as long as they
remain economically viable (Auty 1998). Hence within the mining sector much of the
activity surrounding sustainable development is characterised around “action today that
influences outcomes in the future” (Phillips et al: 2004:p13) - when mining activity has
concluded. Sustainable development theory follows: as a natural resource is exploited
so wealth is created within an economy. Sustainability requires recognition that wealth
in the form of resources, systems, knowledge and skills improves the lives of people in
numerous ways (Whisler 2003: p757). Economic development if managed in a
sustainable manner will offset the effects of the depletion of the natural resource
through development of industry, infrastructure, education and services as is illustrated
in the diagram below.
3 Some examples include: International Council on Metals and Mining, United Nations Council on Trade and Development, World Bank, International Finance Corporation, International Development Research Centre
6
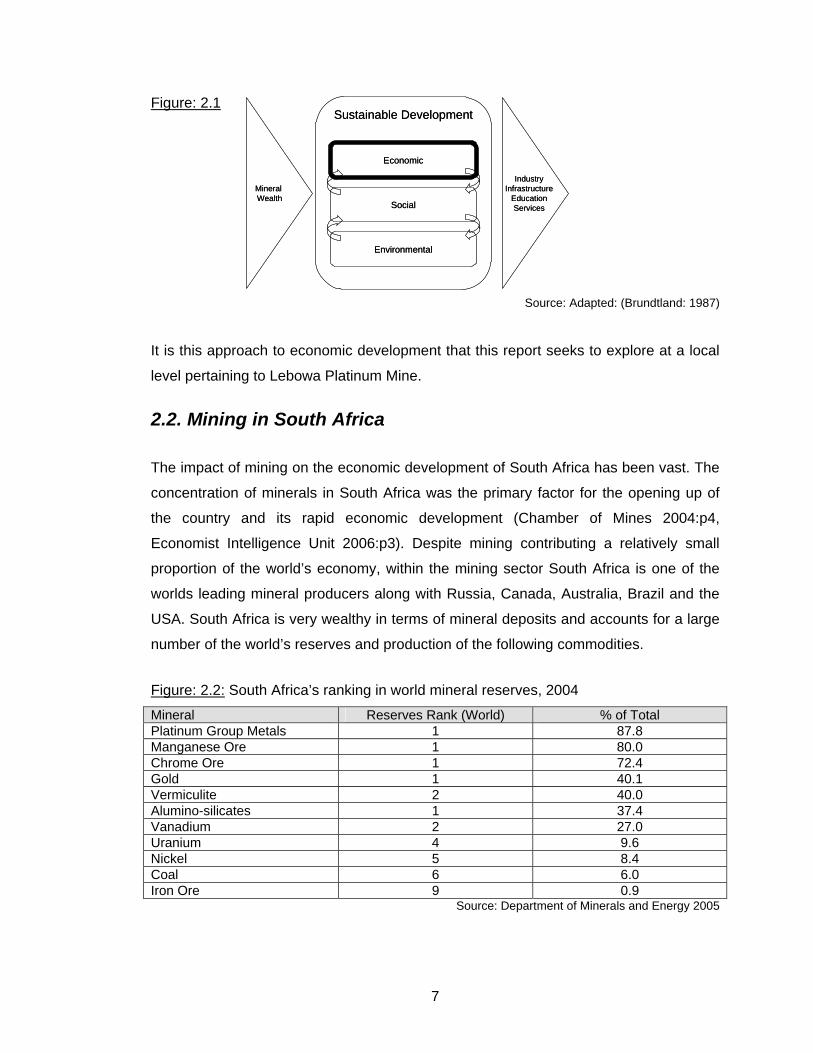
Figure: 2.1 Sustainable Development
Economic
Mineral Wealth
Social
Environmental
IndustryInfrastructure
EducationServices
Sustainable Development
Economic
Mineral Wealth
Social
Environmental
IndustryInfrastructure
EducationServices
Source: Adapted: (Brundtland: 1987)
It is this approach to economic development that this report seeks to explore at a local
level pertaining to Lebowa Platinum Mine.
2.2. Mining in South Africa
The impact of mining on the economic development of South Africa has been vast. The
concentration of minerals in South Africa was the primary factor for the opening up of
the country and its rapid economic development (Chamber of Mines 2004:p4,
Economist Intelligence Unit 2006:p3). Despite mining contributing a relatively small
proportion of the world’s economy, within the mining sector South Africa is one of the
worlds leading mineral producers along with Russia, Canada, Australia, Brazil and the
USA. South Africa is very wealthy in terms of mineral deposits and accounts for a large
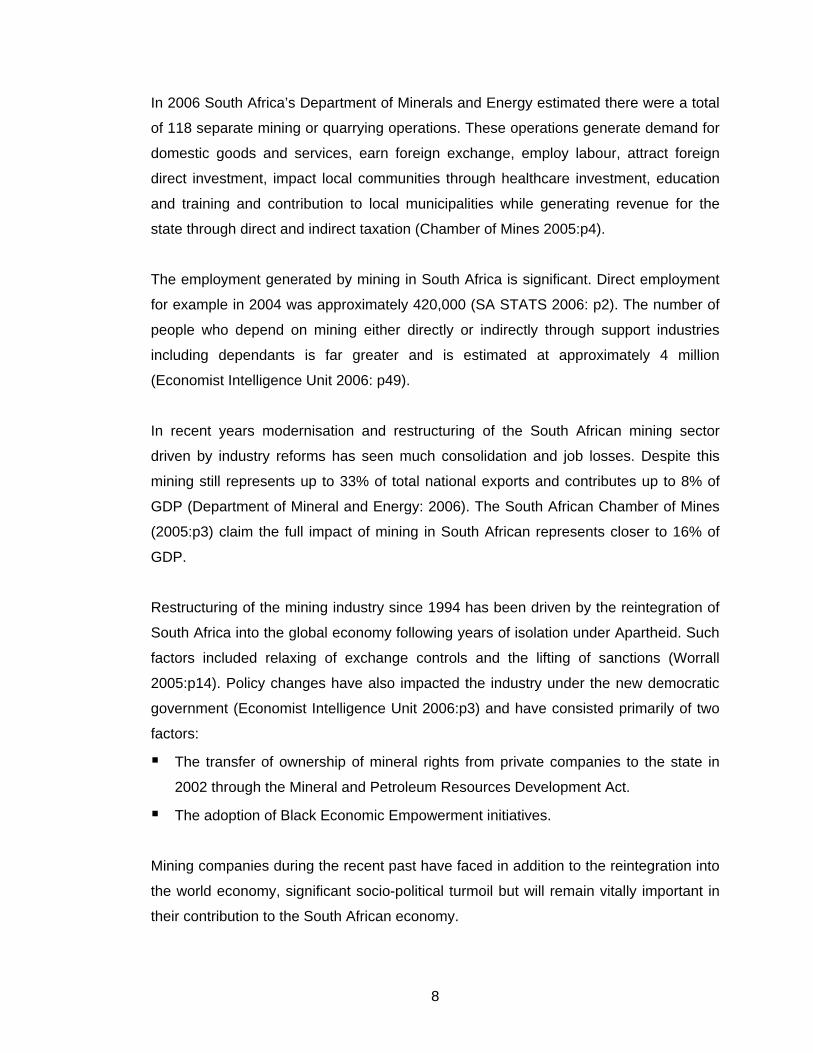
number of the world’s reserves and production of the following commodities.
Figure: 2.2: South Africa’s ranking in world mineral reserves, 2004
Mineral Reserves Rank (World) % of Total Platinum Group Metals 1 87.8 Manganese Ore 1 80.0 Chrome Ore 1 72.4 Gold 1 40.1 Vermiculite 2 40.0 Alumino-silicates 1 37.4 Vanadium 2 27.0 Uranium 4 9.6 Nickel 5 8.4 Coal 6 6.0 Iron Ore 9 0.9
Source: Department of Minerals and Energy 2005
7
In 2006 South Africa’s Department of Minerals and Energy estimated there were a total
of 118 separate mining or quarrying operations. These operations generate demand for
domestic goods and services, earn foreign exchange, employ labour, attract foreign
direct investment, impact local communities through healthcare investment, education
and training and contribution to local municipalities while generating revenue for the
state through direct and indirect taxation (Chamber of Mines 2005:p4).
The employment generated by mining in South Africa is significant. Direct employment
for example in 2004 was approximately 420,000 (SA STATS 2006: p2). The number of
people who depend on mining either directly or indirectly through support industries
including dependants is far greater and is estimated at approximately 4 million
(Economist Intelligence Unit 2006: p49).
In recent years modernisation and restructuring of the South African mining sector
driven by industry reforms has seen much consolidation and job losses. Despite this
mining still represents up to 33% of total national exports and contributes up to 8% of
GDP (Department of Mineral and Energy: 2006). The South African Chamber of Mines
(2005:p3) claim the full impact of mining in South African represents closer to 16% of
GDP.
Restructuring of the mining industry since 1994 has been driven by the reintegration of
South Africa into the global economy following years of isolation under Apartheid. Such
factors included relaxing of exchange controls and the lifting of sanctions (Worrall
2005:p14). Policy changes have also impacted the industry under the new democratic
government (Economist Intelligence Unit 2006:p3) and have consisted primarily of two
factors:
The transfer of ownership of mineral rights from private companies to the state in
2002 through the Mineral and Petroleum Resources Development Act.
The adoption of Black Economic Empowerment initiatives.
Mining companies during the recent past have faced in addition to the reintegration into
the world economy, significant socio-political turmoil but will remain vitally important in
their contribution to the South African economy.
8
2.3. Anglo Platinum and Lebowa Mine
The Anglo Platinum Group is a subsidiary owned 78% by Anglo American Plc. Anglo
Platinum Group comprises of the holding company Anglo Platinum Ltd and the wholly
owned subsidiaries: Rustenburg Platinum Mine, Potgietersrust Platinum Limited and
Lebowa Platinum Mines Limited (LPM). Its operations include six mines, two smelters, a
base metal refinery and precious metals refinery situated in the Limpopo and North
West Provinces of South Africa.
The company was the world’s largest supplier of platinum in 2005 contributing 38%4 of
total world production and by the end of 2006 plans to complete a multi-year expansion
enabling it to deliver 3.5 million ounces. Anglo Platinum also has interests or is currently
prospecting in Canada, China, Zimbabwe, Brazil and Russia.
Anglo Platinum mines, refines and markets platinum and other platinum group metals
(PGM: palladium, iridium, ruthenium, osmium, gold and base metals such as nickel,
copper and cobalt). The refined PGM product is sold through medium term contracts to
a limited number of distributors and manufacturers such as Johnson Matthey Plc,
Engelhard Corporation, Umicore SA, Toyota Motor Corporation, Tanaka Kikinzuko
Kogyo and Degussa Metals Catalysts Cerdec (dmc2). Platinum group metals are
primarily used for emissions control in auto catalyst production. Platinum is also used in
jewellery production, high technology industry, electrical, chemical and petroleum
refining (Cawthorn 1999:p2).
Lebowa Platinum Mine (LPM) is located approximately 300km north east of Pretoria
within the Limpopo province on the eastern fringes of the Bushveld igneous complex. It
has direct access to the Merensky and UG2 reefs which in addition to PGM also
contains gold, nickel and copper. (Ackhurst: 2006). The mine has been operational
since 1967 and was acquired by Anglo Platinum in 1995. Mining authorisation covers
an area of 10,185 hectares which is spread over five farms: Middelpunt,
Umkoanesstad, Brakfontein, Diamant and Zeekoegat (LPM 2006:p2). LPM’s production
has varied widely over its lifespan due to varying yields and availability of water (Ireton:
2006). In 2004 LPM milled 1.7million tons of rock and produced 117,000 ounces of
4 http://www.angloplatinum.com/
9
platinum group metals (Ackhurst: 2006). The mine is currently expanding production
through two major projects, the replacement of the primary vertical shaft and the
expansion of a hillside shaft. The mine has an expected additional 80 years of operation
utilising its current method of breast extraction (Ackhurst: 2006). LPM was suggested
as a good opportunity to analyse sustainable development through the economic
impact5 that the mine had on its community due to the following reasons (Bullock:
2006):
The location of the mine in an area of high poverty with relatively low levels of
economic development.
High rate of community unemployment and low skill levels.
LPM is economically isolated from major centres and outside “well” developed
infrastructure.
Mine management has recently changed and increased focus has been given to
community engagement and sustainable development.
2.4. The ICMM Resource Endowment Toolkit
This research report was guided by the theoretical framework of the Resource
Endowment Project of the International Council on Mining and Metals (ICMM). The
ICMM is a CEO led organization dedicated to sustainable development and comprises
the world’s largest mining companies as well as commodity bodies (ICMM: 2006). The
goal of the ICMM is to understand how large scale mining in “low and middle income
countries can enhance the socio-economic development of host countries” (ICMMa: p3).
The work is being conducted in partnership with the World Bank Group and United
Nations Council on Trade and Development (UNCTAD).
The Resource Endowment Project by way of an “assessment toolkit” prescribes a wide
variety of research questions used to develop a detailed understanding of the socio-
economic impacts of mining. The framework approaches mining operations first from a
national perspective, examining governance and macroeconomic management as well
as the impact that mining has on these structures. Such variables as national economic
5 Defined “as any increase or decrease on the productive potential of the economy” (Phillips et al 2004:p4)
10
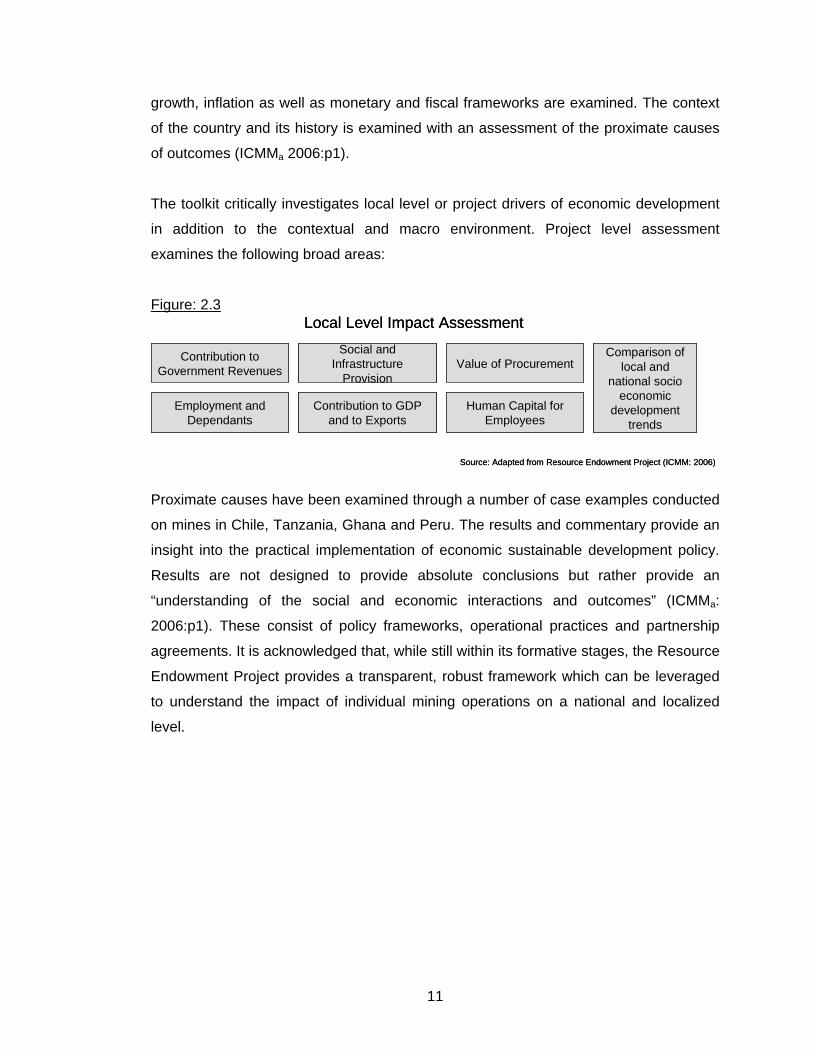
growth, inflation as well as monetary and fiscal frameworks are examined. The context
of the country and its history is examined with an assessment of the proximate causes
f outcomes (ICMMa 2006:p1).
macro environment. Project level assessment
xamines the following broad areas:
o
The toolkit critically investigates local level or project drivers of economic development
in addition to the contextual and
e
Figure: 2.3
Proximate causes have been examined through a number of case examples conducted
on mines in Chile, Tanzania, Ghana and Peru. The results and commentary provide an
insight into the practical implementation of economic sustainable development policy.
Results are not designed to provide absolute conclusions but rather provide an
“understanding of the social and economic interactions and outcomes” (ICMMa:
2006:p1). These consist of policy frameworks, operational practices and partnership
agreements. It is acknowledged that, while still within its formative stages, the Resource
Endowment Project provides a transparent, robust framework which can be leveraged
to understand the impact of individual mining operations on a national and localized
level.
Contribution to Government Revenues
Employment and Dependants
Human Capital for Employees
Value of ProcurementSocial and
InfrastructureProvision
Contribution to GDP and to Exports
Comparison of local and
national socio economic
development trends
Local Level Impact Assessment
Source: Adapted from Resource Endowment Project (ICMM: 2006)
Social and Infrastructure
Provision
Contribution to Government Revenues Value of Procurement
Employment and Dependants
Contribution to GDP and to Exports
Human Capital for Employees
Comparison of local and
national socio economic
development trends
Local Level Impact Assessment
Source: Adapted from Resource Endowment Project (ICMM: 2006)
11
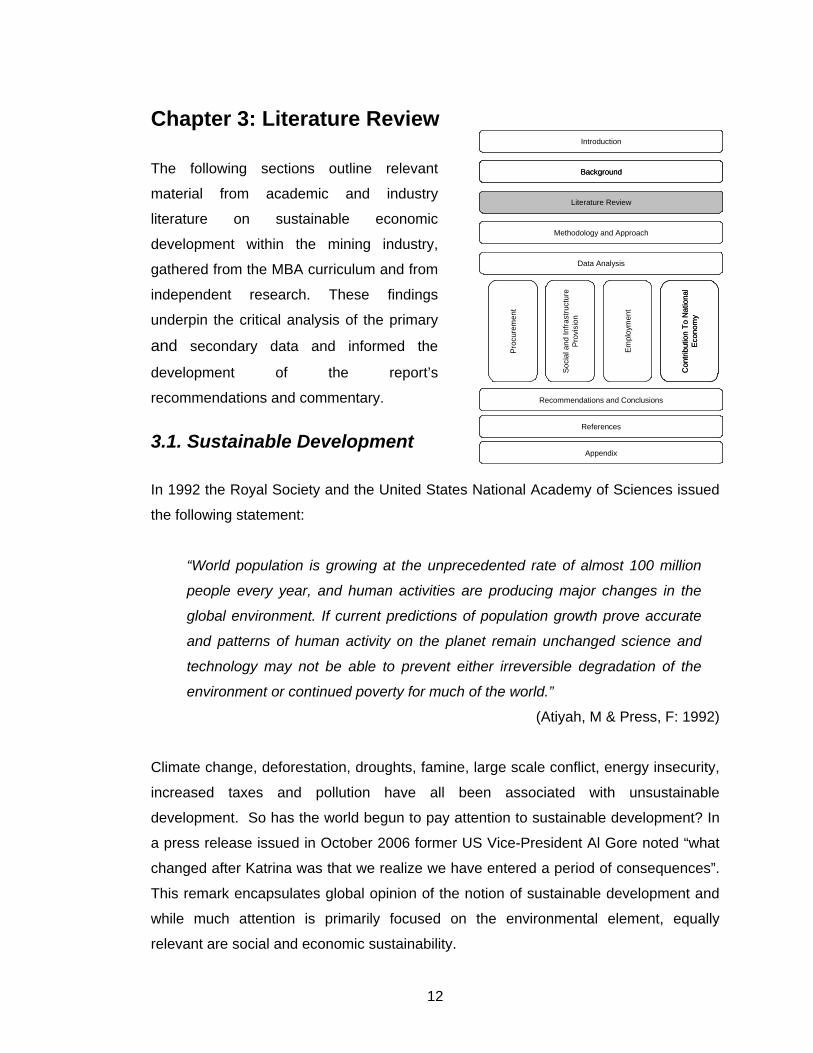
Chapter 3: Literature Review
The following sections outline relevant
material from academic and industry
literature on sustainable economic
development within the mining industry,
gathered from the MBA curriculum and from
independent research. These findings
underpin the critical analysis of the primary
and secondary data and informed the
development of the report’s
recommendations and commentary.
Background
Methodology and Approach
Literature Review
Data Analysis
Pro
cure
men
t
Empl
oym
ent
Soci
al a
nd In
frast
ruct
ure
Pro
visi
on
Recommendations and Conclusions
References
Appendix
Con
tribu
tion
To N
atio
nal
Econ
omy
Introduction
Background
Methodology and Approach
Literature Review
Data Analysis
Pro
cure
men
t
Empl
oym
ent
Soci
al a
nd In
frast
ruct
ure
Pro
visi
on
Recommendations and Conclusions
References
Appendix
Con
tribu
tion
To N
atio
nal
Econ
omy
Introduction
3.1. Sustainable Development
In 1992 the Royal Society and the United States National Academy of Sciences issued
the following statement:
“World population is growing at the unprecedented rate of almost 100 million
people every year, and human activities are producing major changes in the
global environment. If current predictions of population growth prove accurate
and patterns of human activity on the planet remain unchanged science and
technology may not be able to prevent either irreversible degradation of the
environment or continued poverty for much of the world.”
(Atiyah, M & Press, F: 1992)
Climate change, deforestation, droughts, famine, large scale conflict, energy insecurity,
increased taxes and pollution have all been associated with unsustainable
development. So has the world begun to pay attention to sustainable development? In
a press release issued in October 2006 former US Vice-President Al Gore noted “what
changed after Katrina was that we realize we have entered a period of consequences”.
This remark encapsulates global opinion of the notion of sustainable development and
while much attention is primarily focused on the environmental element, equally
relevant are social and economic sustainability.
12
Sustainable development is not a new concept. Granville (2002:p12) noted that the
concept of sustainable development emerged during the late 1800’s and the pollution
caused by industrial activity. Fitzgerald et al (1995), claim the concept of sustainable
development results from a deepening global consensus on the requirement for
development to be sustainable over the long term and not to reap the benefits today, at
the expense of future generations. In response to this notion, world leaders have
increasingly aligned political agendas with sustainability orientated programmes. In the
public sector through intervention, governments are implementing regulatory
frameworks which make sustainable development financially viable (Picket-Baker
2004:p2). Public sector bodies accounted for most of the activity around sustainable
development in the mid to late nineties but the focus has swung now to business to play
a larger role (Dyllick and Hockerts 2002:p131). Butt (2003:p3) argues the alliance goes
further than a public private partnership and for sustainability concepts to deliver results
the definition needs to be extended to include “society” as a whole.
Representative of business’s increasing role in sustainable development is the trend
toward corporate performance reporting using such frameworks as the triple bottom line
(“3BL”). In agreement with Bruntlands’ (1987:p43) definition of the three pillars of
sustainable development 3BL reports against economic, social and environmental
parameters. Corporate social responsibility (CSR) is how business accounts for its
economic, social and environmental impacts and may encompass several frameworks
other than 3BL. According to Charter et al (2002:p15) CSR can range from mere
compliance with regulation to holistic, integrated and strategic approaches to
sustainable development. According to Hamann (2003:p238) practicing corporate social
responsibility actually represents “enlightened self interest”. Michael Porter as cited in
Charter et al (2002:p19) refers to the “win-win” concept where improved sustainability
actually leads to improved marketplace performance.
Despite this notion Parker et al (2004:p9) claim very few mining businesses have taken
account of the overall impact of their operations and furthermore lack models to assess
the impact they have. Parker et al (2004:p8) outlines economic impact as a particular
challenge for business and focuses on the impact of several industries, including mining
due to their potential for contribution to sustainability.
13
3.2. Sustainable Development in the Mining Industry
Numerous essential elements of survival in modern society rely on minerals extracted
through mining (Parker et al 2004:p9). Hilson & Murch (2000:p4) however maintain that
few industries within the world economy have such a profound impact on sustainable
development as mining and the extractives industry in general.
While exploitation of finite mineral resources is inherently unsustainable (Eggert
2001:p4), the economic wealth generated through mining has the capability to have
deep environmental and social impacts. The unsustainably of exploiting finite mineral
deposits is actually misleading claims Eggert (2001:p4) who offers three reasons for
this:
Through technological innovation mining companies are able to discover or mine
reserves that would otherwise be technically or financially unfeasible.
While mining itself is unsustainable, recycling sustains much of the benefit
generated by mining.
Most importantly - the wealth generated by mining if invested correctly can provide
indefinite benefits through education, healthcare and infrastructure.
Eggert (2001:p5) concludes that sustainable mining can lead to the generation of a
renewable source of human well being. “Sustainable mining” delivers economic
wellbeing in a socially just way that does not diminish environmental quality (Eggert
2001:p5)
Implementation of sustainable development in mining may appear a vague and
complicated notion when considering context and the multi stakeholder environment.
However according to Bansal (2005:p198) mining firms are able to operationalise
corporate sustainable development in ensuring success through: Environment:
Reducing the size of their “ecological footprint”; Social: Proactively assessing,
managing and engaging with all stakeholders (not just financial shareholders) including
the natural environment and always acting in societies’ best interests and Economic:
Creating and capturing value. Captured value is then transferred to shareholders
through dividends, consumers through its products and to employees through wages
and salaries.
14
Many proponents of sustainable development argue that implementation within the
mining industry is highly contextual and highly localised (Parker et al 2004:p25, Van Zyl
2005:p4). Due to these factors Van Zyl (2005:p4) claims that implementation must be
based on a set of compatibility concepts. Central to Van Zyl (2005), Parker et al (2004)
and Auty (1998:p487) is localization and in particular community level focus through
effective social engagement.
3.3. The Importance of Developing Social Engagement
Parker et al (2004) undertook research across four industry sectors into the linkages
and drivers behind business and economic development within the framework of the
three pillars of sustainable development. Cross-sectoral analysis assisted in developing
business strategy and management process to inform corporations and shape
successful development. The research relies heavily on case examples and is focused
on the mining sector. Parker et al (2004: p20) reinforces the significance of economic
development at the community level building on the work by Auty (1998) which
highlights the importance of social capability within mineral driven sustainable
development. Parker et al (2004:p16) provides three primary contextual factors for the
focus on the community level:
Mining investment is “front-loaded” and if social and political circumstances
deteriorate, there is no option to relocate the operation elsewhere.
Mining has an important impact on local communities who have little influence on
markets or shareholders but who can significantly disrupt operations through their
actions.
The remote nature of an increasing number of mines, far from the central
government are necessitating increasingly a social license to operate within affected
rural communities.
In addition to Parker et al (2004), Auty’s work (1998: p487) also established a bias in
favour of a “social license to operate” which firms require particularly for mining
operations. To develop a social license to operate Auty suggests an independent
“social audit” so as to mediate between a mine and a local community. This audit helps
develop social license by tracing revenue flows, compliance with environmental
15
standards, the benefit of community compensation payments and helps through
transparency to develop greater trust. Hamann (2003:p239) argues the notion of social
engagement by business underpins the ultimate success of economic development.
This evolves to a stage where civil society regards business as a vital partner for
sustainable development (Bansal: 2005).
Auty (1998:p487) further argues that an effective “social audit” will through the
transparency it generates serve to reduce the capability of actors to engage in rent-
seeking behaviour. Rent seeking defined by Krueger (1974:p291) as the “process by
which an individual, organization, or firm seeks to gain through manipulation of the
economic environment, rather than through trade and the production of added wealth”.
This does not lead to sustainable development argues Auty (1998:p488) as it
encourages heightened dependence by the community on the depleting mineral asset
and causes a misallocation of resources by the company. Social audit argues Auty
(1998:p499) reduces rent-seeking behavior by creating “transparency and consensus
on the deployment of mineral rents”. Rent-seeking behavior and the limits of corporate
social responsibility are topics frequently debated by corporate leaders (Vogel
2005:p17). The business benefit for “getting it right” far outweighs doing nothing or
“getting it wrong” and Vogel (2005:p18) argues successful social engagement within the
context of sustainable development is the new “competitive reality” firms face.
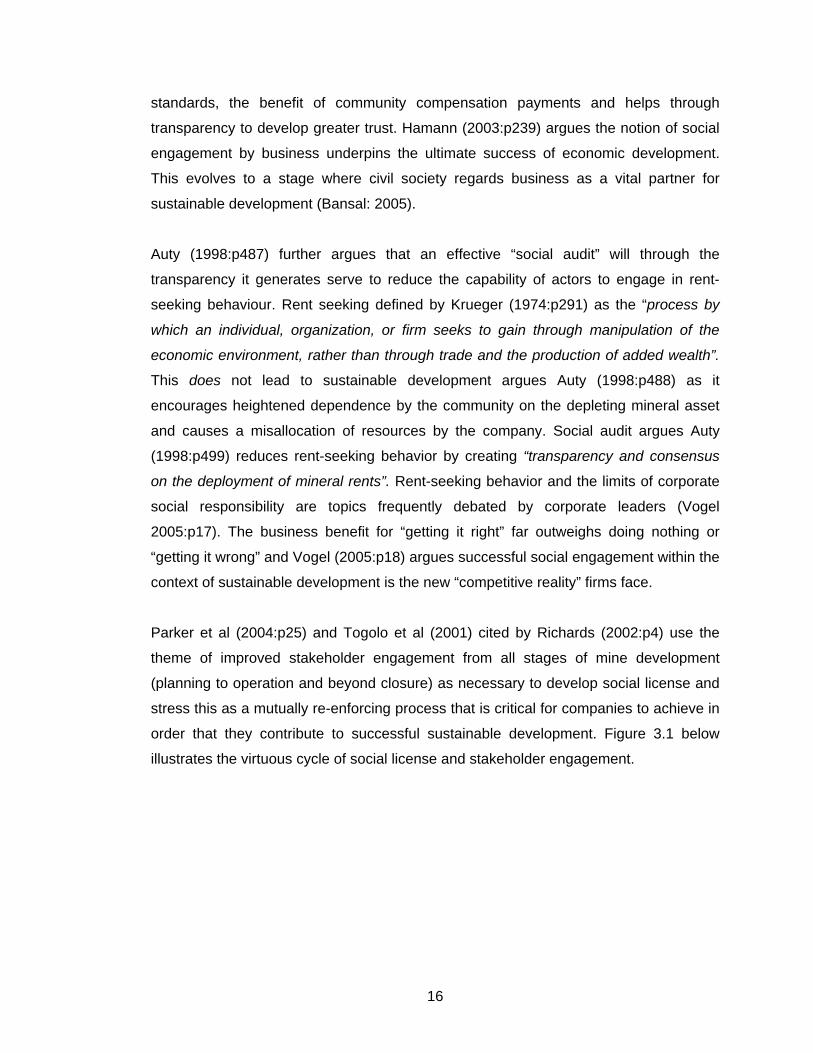
Parker et al (2004:p25) and Togolo et al (2001) cited by Richards (2002:p4) use the
theme of improved stakeholder engagement from all stages of mine development
(planning to operation and beyond closure) as necessary to develop social license and
stress this as a mutually re-enforcing process that is critical for companies to achieve in
order that they contribute to successful sustainable development. Figure 3.1 below
illustrates the virtuous cycle of social license and stakeholder engagement.
16

Figure: 3.1:
ImprovedStakeholderEngagement
Development of SocialLicense
Successful Sustainable Development
ImprovedStakeholderEngagement
Development of SocialLicense
Successful Sustainable Development
Source: Adapted: Parker et al (2004:p25)
The work of Fox (2001:p33) emphasizes that improving stakeholder engagement
means communities should be directly invited to consultation to voice concerns and
these should be treated with respect and acted upon. While Richards (2002:p5) concurs
with multi-stakeholder engagement, his work stresses the importance of identifying
“legitimate stakeholders” who represent the communities and not outside interests.
Effective social engagement with legitimate stakeholders’ representative of
communities underpins economic development as it actively “develops society that
existed before or builds up around a mine as it evolves” (Richards 2002:p5). Auty
(1993) argues engagement with communities may require internalizing of the welfare
function which serves to develop the “social capital” of local communities so they in turn
can better represent their interests.
Parker et al (2004:p17) emphasize that sustainable economic development initiated
through effective social engagement is hugely determined by context. Successful
sustainable development practice cannot simply be transported from one operation to
the next. It is the context that forms the engagement and that will determine what steps
are required for success. Acknowledging the importance of context is the requirement
to develop and maintain partnerships particular to each setting.
3.4. The Relevance of Partnership and Linkages
Direct economic impacts of mining on local communities are represented by factors
such as direct employment, procurement/supply chain activity, infrastructure
contribution and social development. Eggert (2001: p22) notes that a major factor that
greatly increases economic development is the indirect impact through connections to
17
other parts of the local economy. These connections include both backward linkages or
purchase of inputs and forward linkages representing downstream mineral processing
activity. The net impact of forward and backward linkages are referred to as the
multiplier effect. Eggert (2001: p22) defines a multiplier as “the total effect of an
economic activity (direct, indirect and induced) divided by the initial direct effect”
The larger the multiplier the larger the economic impact but Eggert (2001:p23) notes
that the size of the multiplier is highly dependant on situational factors and warns that
social and economic costs and benefits need to be considered. Multipliers are
influenced by the proportion of money invested that is spent within a region. Money
spent within a region for example stimulates economic activity and money spent outside
a region does not. While Parker et al (2004) focus on the social drivers behind creation
of linkages, Eggert (2001:p23) stresses structural factors as more important. Such
examples include:
The size of the region.
The region’s industry structure.
The location of a region.
The optimal multiplier for a mine is highly dependant on the structural factors and is
determined by context. McMahon and Remy (2001:p35) argue that structural factors
often mean both mines and communities fail to account for the full economic impact of
mining development. For example how is the economic impact of environmental
damage accounted for?
Parker et al (2004: p8) suggest government are critical stakeholders to generate a
successful impact through acting to mitigate difficulties in pricing of intangibles.
Partnership by mining companies with all relevant stakeholders to develop social capital
Auty (1998:p489) claims is crucial. McMahon and Remy (2001:p34) claim the evidence
suggests that success at the community level is more likely when there is direct
engagement with government. Engagement with government however should not
preclude detailed baseline studies of communities before mining which Auty
(2003:p670) outlines is central to developing social capital.
18
Otto (2004:p23) argues that economic linkages can be maximised by government
engagement through regulation, for example employment. Regulation surrounding the
employment of local workers helps develop linkages and increases the impact of the
multiplier. Government engagement applies similarly to other areas such as
procurement, fiscal contribution and social and infrastructure investment. Parker et al
(2004:p9) point out that while engaging with government is often overlooked it is
important to note that central, local and regional government do not always share the
same development goals or priorities as local communities. To maximise economic
impact business, government and civil society need to collaborate to better understand
their different priorities and in so doing create increased value. Sir Mark Moody-Stuart
(2006) chairman of Anglo American notes that it is “vital trust is built between
companies, NGOs and the public at large”.
3.5. Regional Development and Mining
A broad perspective of mining over time suggests a drastic evolution of the industry and
its impact on local communities. Eggert (2001:p33) outlines 2 models which help
provide a basic conceptual understanding of mining and its impact driven by industrial
development, technological innovation, economic growth and world trade.
3.5.1. The Strong Linkage Model
In the latter half of the eighteenth century and beginning of the nineteenth century
mines were primarily located close to industrial and population centres. Minerals
extracted were processed locally and used in production or consumed. Eggert
(2001:p34) claims this led to strong economic linkages as the mines relied heavily on
local and regional inputs and the markets that they provided. Mining technology
consisted of more basic techniques and didn’t rely on specialist skills sought from
further a field. Relatively high transportation costs discouraged long distance
transportation of low value products (Eggert 2001:p34). Consequently mining primarily
through structural factors played important roles in local economic development.
Radetzki (1982) cited by Eggert (2001:p34) notes that Chicago and Birmingham in the
late eighteenth and early nineteenth centuries illustrated strong linkages in the iron and
19
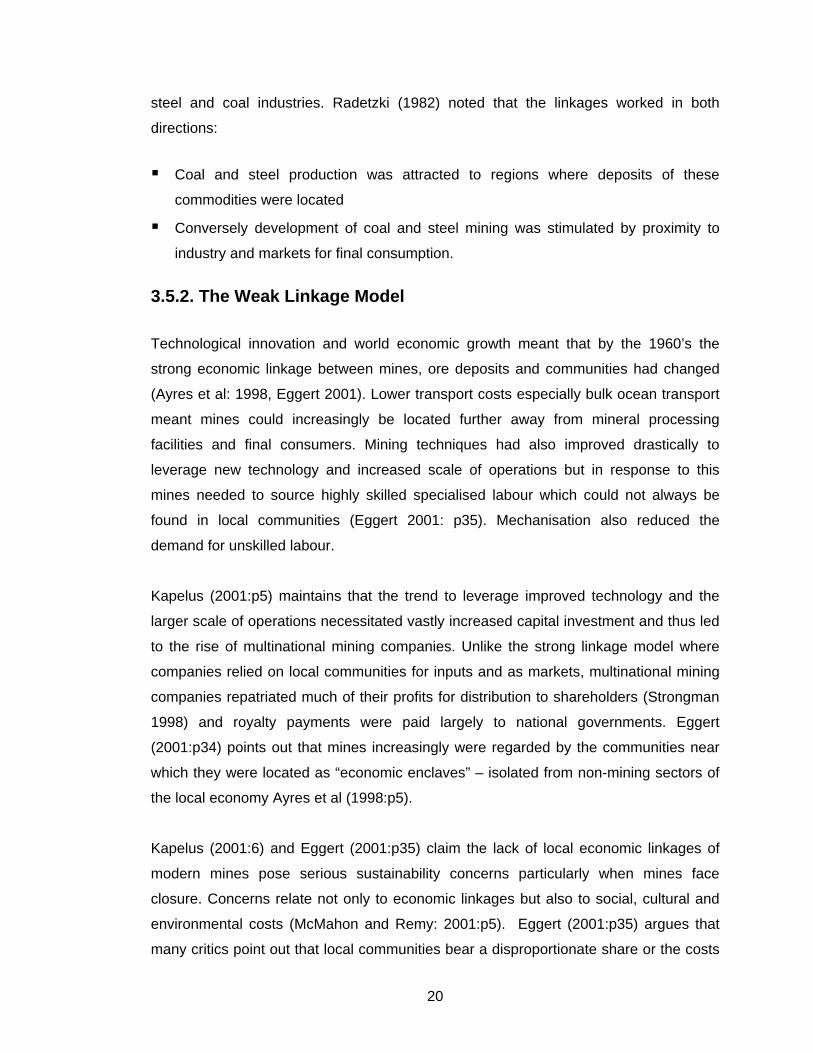
steel and coal industries. Radetzki (1982) noted that the linkages worked in both
directions:
Coal and steel production was attracted to regions where deposits of these
commodities were located
Conversely development of coal and steel mining was stimulated by proximity to
industry and markets for final consumption.
3.5.2. The Weak Linkage Model
Technological innovation and world economic growth meant that by the 1960’s the
strong economic linkage between mines, ore deposits and communities had changed
(Ayres et al: 1998, Eggert 2001). Lower transport costs especially bulk ocean transport
meant mines could increasingly be located further away from mineral processing
facilities and final consumers. Mining techniques had also improved drastically to
leverage new technology and increased scale of operations but in response to this
mines needed to source highly skilled specialised labour which could not always be
found in local communities (Eggert 2001: p35). Mechanisation also reduced the
demand for unskilled labour.
Kapelus (2001:p5) maintains that the trend to leverage improved technology and the
larger scale of operations necessitated vastly increased capital investment and thus led
to the rise of multinational mining companies. Unlike the strong linkage model where
companies relied on local communities for inputs and as markets, multinational mining
companies repatriated much of their profits for distribution to shareholders (Strongman
1998) and royalty payments were paid largely to national governments. Eggert
(2001:p34) points out that mines increasingly were regarded by the communities near
which they were located as “economic enclaves” – isolated from non-mining sectors of
the local economy Ayres et al (1998:p5).
Kapelus (2001:6) and Eggert (2001:p35) claim the lack of local economic linkages of
modern mines pose serious sustainability concerns particularly when mines face
closure. Concerns relate not only to economic linkages but also to social, cultural and
environmental costs (McMahon and Remy: 2001:p5). Eggert (2001:p35) argues that
many critics point out that local communities bear a disproportionate share or the costs
20
of mining, for which they are not compensated furthermore they do not participate in
decision making regarding the mine. The evolution of mining from strong to weak
linkage models poses serious concerns for communities and regional development and
improves the necessity to understand sustainable development.
3.6. Sustainable Development Frameworks and Management Models
3.6.1. Sustainable Development Assessment Tool
Parker et al (2004:p5) and Hamann (2003:p244) both outline the formative stage
development of management practice and theory surrounding sustainable economic
development and call for greater guidance and models to assist business in identifying
and accounting for its impacts. The adoption of one particular framework for economic
sustainable development should not undermine any other but rather look to improve
transparency and help firms better understand the drivers within either contexts. Parker
et al (2004) argues in favour of the “Sustainable Assessment Tool” a model which
focuses on developing social license and community engagement as a pre-
requirements for achieving sustainable economic development. The framework used is
highly localised and allows managers to measure sustainability on a continuum based
on eleven categories of analysis. These include national, regional and local context,
company-community engagement, company culture, environment and social impact
assessment, financial investment and fiscal contributions, community investment and
economic development, facility siting, employment, sourcing and procurement,
management systems and closure.
Each one of the above variables is then scored resulting in a “sustainability footprint”
which is capable of expressing a mines sustainable development performance (Parker
et al 2004: p45). The idea is to score highly in each domain resulting in a large
sustainability footprint. For illustrative purposes Figure 3.2 below displays uniform
scores in each domain (5 out of a possible 9):
21

Figure: 3.2: The Sustainable Development Assessment Tool
0
1
2
3
4
5
6
7
8
9National, Regional and Local Context
Company-Community Enagagement
Company Culture
Environment and Social Impact Assessment
Financial Investment and Fiscal Contribution
Community Investment and Economic DevelopmentFacility Siting
Employment
Sourcing and Procurement
Management Systems
Closure
Sustainability0
1
2
3
4
5
6
7
8
9National, Regional and Local Context
Company-Community Enagagement
Company Culture
Environment and Social Impact Assessment
Financial Investment and Fiscal Contribution
Community Investment and Economic DevelopmentFacility Siting
Employment
Sourcing and Procurement
Management Systems
Closure
Sustainability
Despite outlining a wide variety of analysis areas Parker et al (2004) have a bias toward
project level and the social element of socio-economic development. The impact of
structural, national and regional influences and financial performance is under played
as is the legacy associated with an existing operation.
3.6.2. Resource Endowment Toolkit
The ICMM (2006: p1) framework focuses on documenting drivers of “development
effectiveness” through a detailed understanding of national policy conditions,
operational practices and partnership requirements that lead to sustainable outcomes.
Unlike Parker et al (2004) The Resource Endowment Toolkit integrates to a greater
degree non-project level impacts such as macroeconomic environment, policy
conditions and the impact mining in turn has on these. The ICMM framework through
assessment of causes and outcomes of a wide variety of actors associated with a
mining operation provides a potentially deeper understanding of project level impacts
through maintaining scope to expand outside the theoretical framework – dependant on
context. Saunders et al (2003) argues this is vital particularly when evaluating social
qualitative data. The figure below outlines the ICMM framework including details
particularly on project level assessment which is the focus of this paper.
22
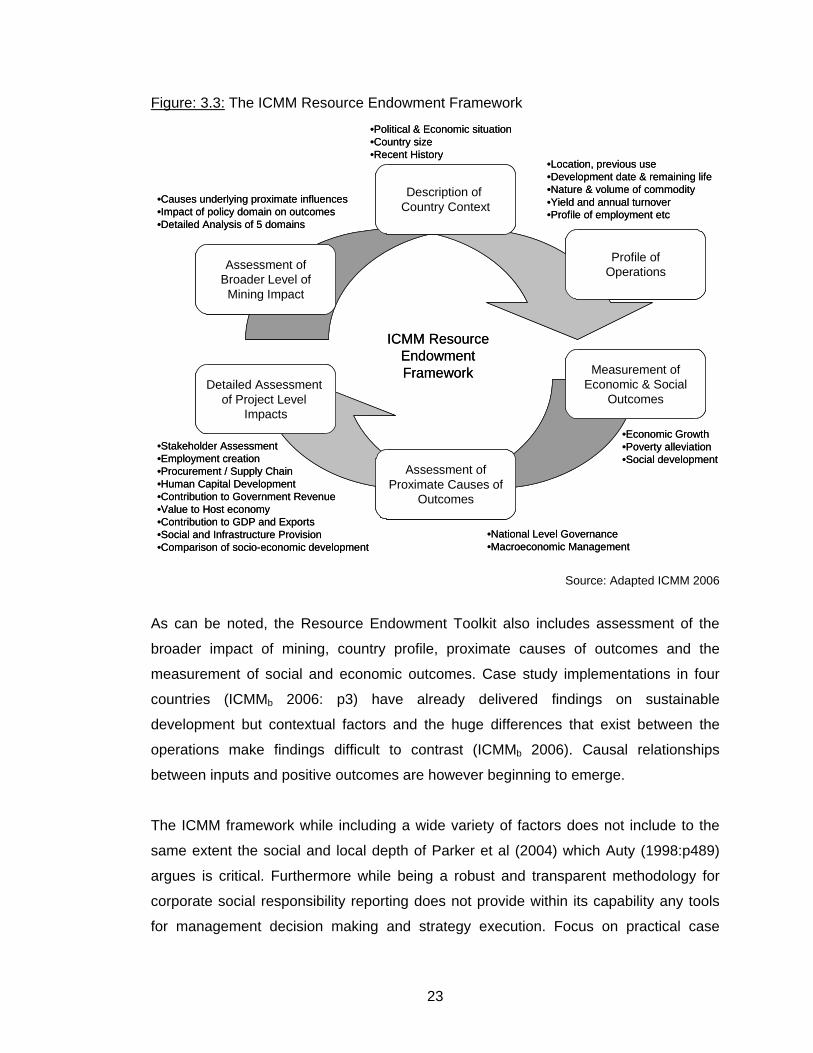
Figure: 3.3: The ICMM Resource Endowment Framework
Description of Country Context
Profile ofOperations
Assessment ofProximate Causes of
Outcomes
Assessment ofBroader Level ofMining Impact
Measurement ofEconomic & Social
OutcomesDetailed Assessment
of Project Level Impacts
ICMM ResourceEndowmentFramework
•Stakeholder Assessment•Employment creation•Procurement / Supply Chain•Human Capital Development•Contribution to Government Revenue•Value to Host economy•Contribution to GDP and Exports•Social and Infrastructure Provision•Comparison of socio-economic development
•Political & Economic situation •Country size•Recent History
•Location, previous use•Development date & remaining life•Nature & volume of commodity•Yield and annual turnover•Profile of employment etc
•Economic Growth•Poverty alleviation •Social development
•National Level Governance•Macroeconomic Management
•Causes underlying proximate influences•Impact of policy domain on outcomes•Detailed Analysis of 5 domains
Source: Adapted ICMM 2006
As can be noted, the Resource Endowment Toolkit also includes assessment of the
broader impact of mining, country profile, proximate causes of outcomes and the
measurement of social and economic outcomes. Case study implementations in four
countries (ICMMb 2006: p3) have already delivered findings on sustainable
development but contextual factors and the huge differences that exist between the
operations make findings difficult to contrast (ICMMb 2006). Causal relationships
between inputs and positive outcomes are however beginning to emerge.
The ICMM framework while including a wide variety of factors does not include to the
same extent the social and local depth of Parker et al (2004) which Auty (1998:p489)
argues is critical. Furthermore while being a robust and transparent methodology for
corporate social responsibility reporting does not provide within its capability any tools
for management decision making and strategy execution. Focus on practical case
23
studies to build deeper understanding of positive and negative outcomes allows the
framework to develop increased credibility and it itself relies on partnerships (ICMM,
World Bank, United Nations Council on Trade and Development). The objective of the
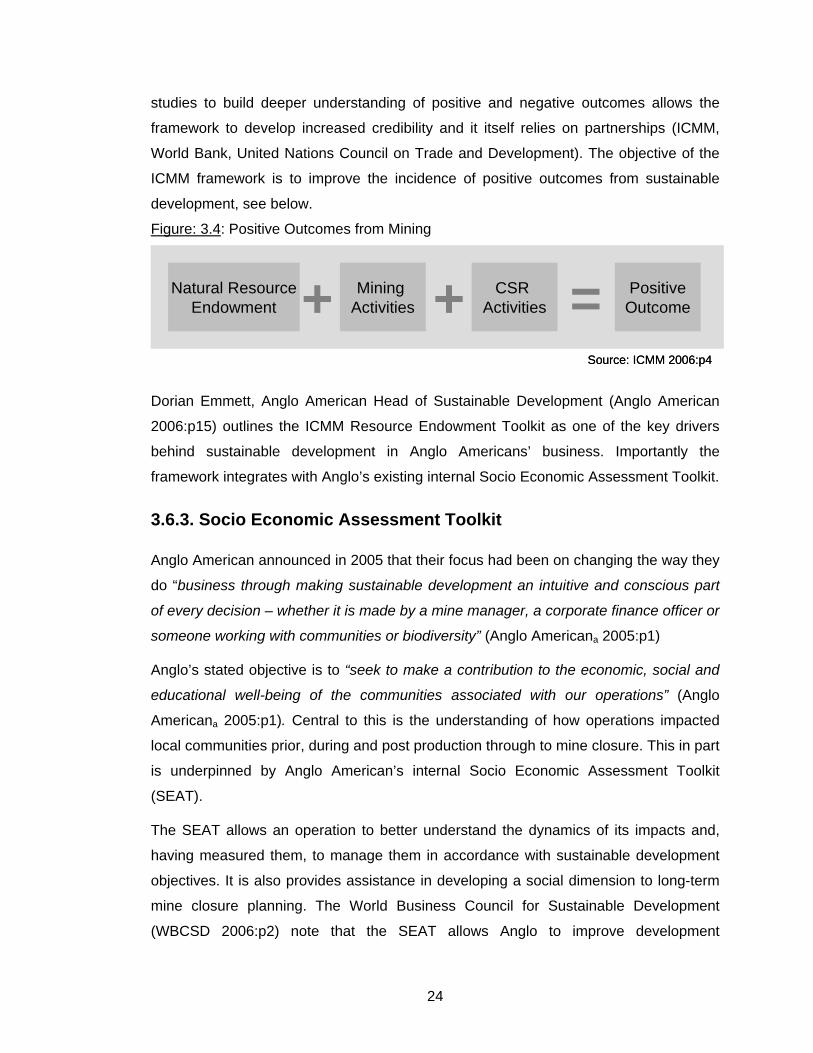
ICMM framework is to improve the incidence of positive outcomes from sustainable
development, see below.
Figure: 3.4: Positive Outcomes from Mining
+ + =Natural ResourceEndowment
Mining Activities
CSR Activities
PositiveOutcome
Source: ICMM 2006:p4
+ + =Natural ResourceEndowment
Mining Activities
CSR Activities
PositiveOutcome
Source: ICMM 2006:p4
Dorian Emmett, Anglo American Head of Sustainable Development (Anglo American
2006:p15) outlines the ICMM Resource Endowment Toolkit as one of the key drivers
behind sustainable development in Anglo Americans’ business. Importantly the
framework integrates with Anglo’s existing internal Socio Economic Assessment Toolkit.
3.6.3. Socio Economic Assessment Toolkit Anglo American announced in 2005 that their focus had been on changing the way they
do “business through making sustainable development an intuitive and conscious part
of every decision – whether it is made by a mine manager, a corporate finance officer or
someone working with communities or biodiversity” (Anglo Americana 2005:p1)
Anglo’s stated objective is to “seek to make a contribution to the economic, social and
educational well-being of the communities associated with our operations” (Anglo
Americana 2005:p1). Central to this is the understanding of how operations impacted
local communities prior, during and post production through to mine closure. This in part
is underpinned by Anglo American’s internal Socio Economic Assessment Toolkit
(SEAT).
The SEAT allows an operation to better understand the dynamics of its impacts and,
having measured them, to manage them in accordance with sustainable development
objectives. It is also provides assistance in developing a social dimension to long-term
mine closure planning. The World Business Council for Sustainable Development
(WBCSD 2006:p2) note that the SEAT allows Anglo to improve development
24
opportunities that flow from its operations. Anglo American (2006:p38) claim the tool
has enabled it to improve social performance and capacity building particularly at its
mature operations. Key principles of the SEAT include (WBCSD 2006:p3):
Identification of key social and economic impacts that require management.
Assessment of existing initiatives and providing guidance should improvements be
necessary.
Provide guidance in developing a Community Engagement Plan.
Provide an analytical framework that allows operations to understand their overall
sustainability performance.
Ensuring that best practice is captured and shared within the company.
Provide a planning tool to manage the mines social and eco nomic impact including
social investment and mine closure.
d in 2005 Anglo American was awarded the ACCA award for
ustainable Reporting.
generated for shareholders through effective sustainable development, but the tool is
In accordance with Parker et al (2004) the SEAT framework focuses heavily on
community engagement and management of social investment as key factors in
improving economic development. In addition to Richards (2002:p5) the framework also
highlights the importance of identifying the “legitimate stakeholders” and the potential
negative influence of outside interests. SEAT provides a holistic analytical and
managerial framework to sustainable development integrating social, economic and
environmental elements relevant to specific operations. (See Appendix 13 for a brief
outline of the SEAT framework). The framework aims to leverage partnerships vital to
sustainability success (Auty 2003:p489) and is open to continuous improvement
(WBCSD 2006:p4) signifying a proactive and transparent approach. Part of the
implementation of SEAT involves annual reporting thus socio-economic development
initiatives by Anglo become transparent and may serve to improve trust by local
communities and contribute to improved “social licence” (Auty 1998, Hamann
(2003:p239). To this en
S
While the framework serves to provide a sound managerial platform for measurement
and decision making it does not easily integrate corporate wide financial principles such
as shareholder value maximisation. SEAT does refer to the long term benefits
25
absent of capabilities that allow management to integrate these with local socio-
economic objectives. Kaplan and Norton (1996:p147) note that the “objective of any
measurement system should be to motivate all managers and employees to implement
successfully the business … strategy”
3.6.4. The Balanced Scorecard and Sustainable Balanced Scorecard
The Balanced Scorecard framework, developed by Kaplan and Norton (1992:p71) was
designed to address imbalances of traditional management performance reporting and
control that had previously consisted of financial reporting only. The Balanced
Scorecard was designed as a strategic management tool that like the ICMM approach
(2006:p1) looked at both input or internal processes and outcomes. Kaplan and Norton
(1993:p135) argued that traditional management performance measurement lacked the
ability to include other important dimensions that had great impact on business and that
were relevant to balance the financial perspective. Kaplan and Norton’s (1993)
framework approached reporting using a “top down” method driven by corporate
strategy while SEAT based its methodology on a “bottom-up” approach as it was
focused on the operation level.
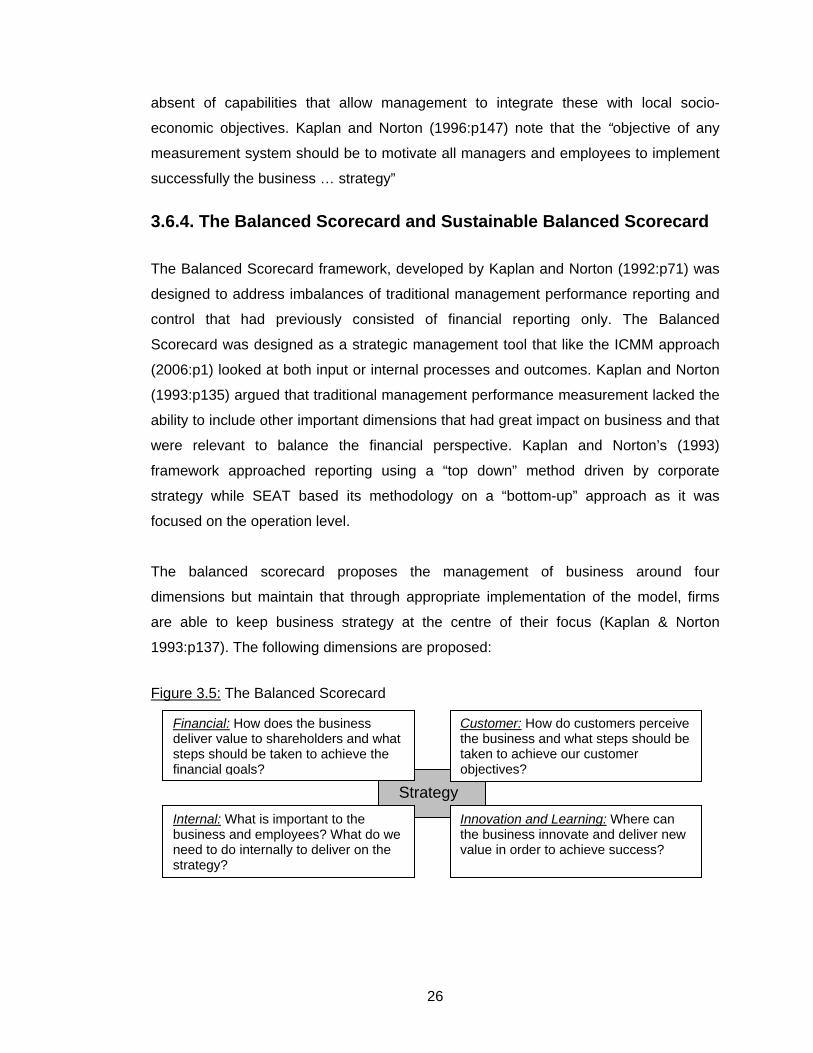
The balanced scorecard proposes the management of business around four
dimensions but maintain that through appropriate implementation of the model, firms
are able to keep business strategy at the centre of their focus (Kaplan & Norton
1993:p137). The following dimensions are proposed:
Figure 3.5: The Balanced Scorecard
Strategy Innovation and Learning: Where can the business innovate and deliver new value in order to achieve success?
Internal: What is important to the business and employees? What do we need to do internally to deliver on the strategy?
Customer: How do customers perceive the business and what steps should be taken to achieve our customer objectives?
Financial: How does the business deliver value to shareholders and what steps should be taken to achieve the financial goals?
26
The balanced scorecard allows strategy implementation to be a virtuous cycle of
implementation, measurement and adaptation. Importantly it is not only owned by top
management but central to workers at all levels (Kaplan and Norton 1993: p139).
Measurement takes place along a continuum with regards to: objectives, targets and
initiatives within each perspective (Financial, Customer, Internal & Innovation and
Learning) which allows localisation of strategy taking account of context which Parker et
al (2004:p9) argues is vital. Worrall (2005: p29) argues that a deep understanding of
cause and effect relationships can be developed by this approach. Through doing so
management is capable of effective decision making more closely aligned with firm
strategy, through effective interpretation of lag and lead indicators within each of the
four perspectives.
Critically firms are able to link different dimensions together in the fulfilment of corporate
strategy such as shareholder value maximisation. Neither the Resource Endowment
Toolkit, Socio-Economic Assessment Toolkit nor the Sustainable Development Tool
offers such a capability. The balanced scorecard approach enables firms to better
understand the impact of improved employee relations on financial performance or
customer satisfaction. Worrall (2005:p29) points out the balanced scorecard provides a
link so that firms can better understand how “soft” or intangible goals translate into hard
tangible results. This becomes particularly relevant in assessment and management of
intangibles such as social impact which Auty (1998: p487) argues is critical for
successful economic impact.
The balanced scorecard approach provides a stronger bias than Parker et al (2004)
toward financial measurement and is able to better integrate with the macro
environment. (Worrall 2005:p30) argues that this delivers greater flexibility, the ability to
reference past performance in planning scenarios and flexibility in delivering to a
corporate strategy. Despite this a common critique of the balanced scorecard is that
while it recognises the four dimensions, it does not reflect adequately environmental or
societal elements and thus is not applicable to sustainable development. Social
engagement and linkages (Parker et al 2004:p25, Auty 1998:p488, Richards 2002:p4)
are vital for economic sustainable development yet the balanced scorecard does not
directly include these.
27
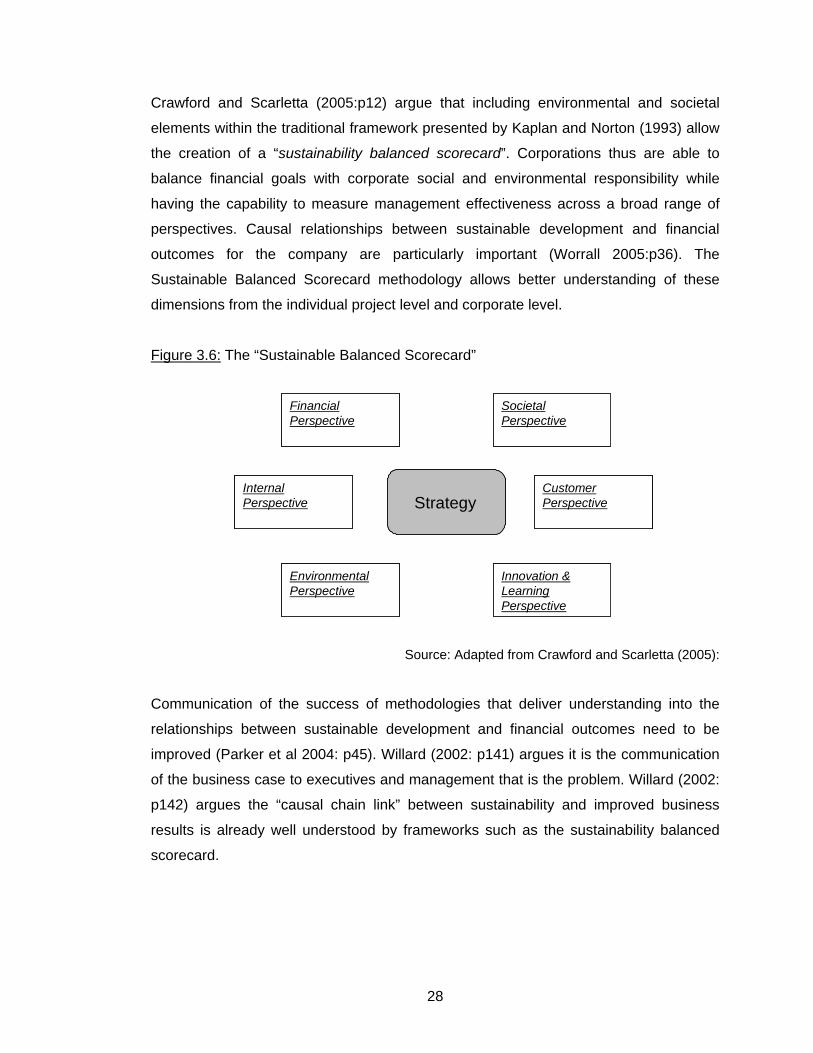
Crawford and Scarletta (2005:p12) argue that including environmental and societal
elements within the traditional framework presented by Kaplan and Norton (1993) allow
the creation of a “sustainability balanced scorecard”. Corporations thus are able to
balance financial goals with corporate social and environmental responsibility while
having the capability to measure management effectiveness across a broad range of
perspectives. Causal relationships between sustainable development and financial
outcomes for the company are particularly important (Worrall 2005:p36). The
Sustainable Balanced Scorecard methodology allows better understanding of these
dimensions from the individual project level and corporate level.
Figure 3.6: The “Sustainable Balanced Scorecard”
StrategyInternal Perspective
Financial Perspective
Customer Perspective
Innovation & Learning Perspective
Societal Perspective
Environmental Perspective
StrategyInternal Perspective
Financial Perspective
Customer Perspective
Innovation & Learning Perspective
Societal Perspective
Environmental Perspective
Source: Adapted from Crawford and Scarletta (2005):
Communication of the success of methodologies that deliver understanding into the
relationships between sustainable development and financial outcomes need to be
improved (Parker et al 2004: p45). Willard (2002: p141) argues it is the communication
of the business case to executives and management that is the problem. Willard (2002:
p142) argues the “causal chain link” between sustainability and improved business
results is already well understood by frameworks such as the sustainability balanced
scorecard.
28
3.7 Summary
The literature review has enabled an overview of a number of important concepts
relating to the research. An overview of the concept of sustainable development and in
particular within the mining industry formed a strong theoretical background. Social
engagement, partnerships and linkages and their prominence in developing positive
outcomes for sustainable development were discussed in specific reference to the
mining industry. Regional development and the weak vs. strong linkage model provided
a longitudinal view of mining and the impact on economic development. Finally the
theoretical management framework’s offered by the Sustainable Development
Assessment Tool, the Resource Endowment Toolkit, the Socio-Economic Assessment
Toolkit and the Balanced Scorecard and Sustainable Balanced Scorecard were
discussed. The Sustainable Balanced Scorecard in particular provided compelling
motivation for use in the context of economic sustainable development as it was able to
provide management with the capability to link the societal and environmental aspects
of mining with the requirement to be commercially viable as an operation.
29
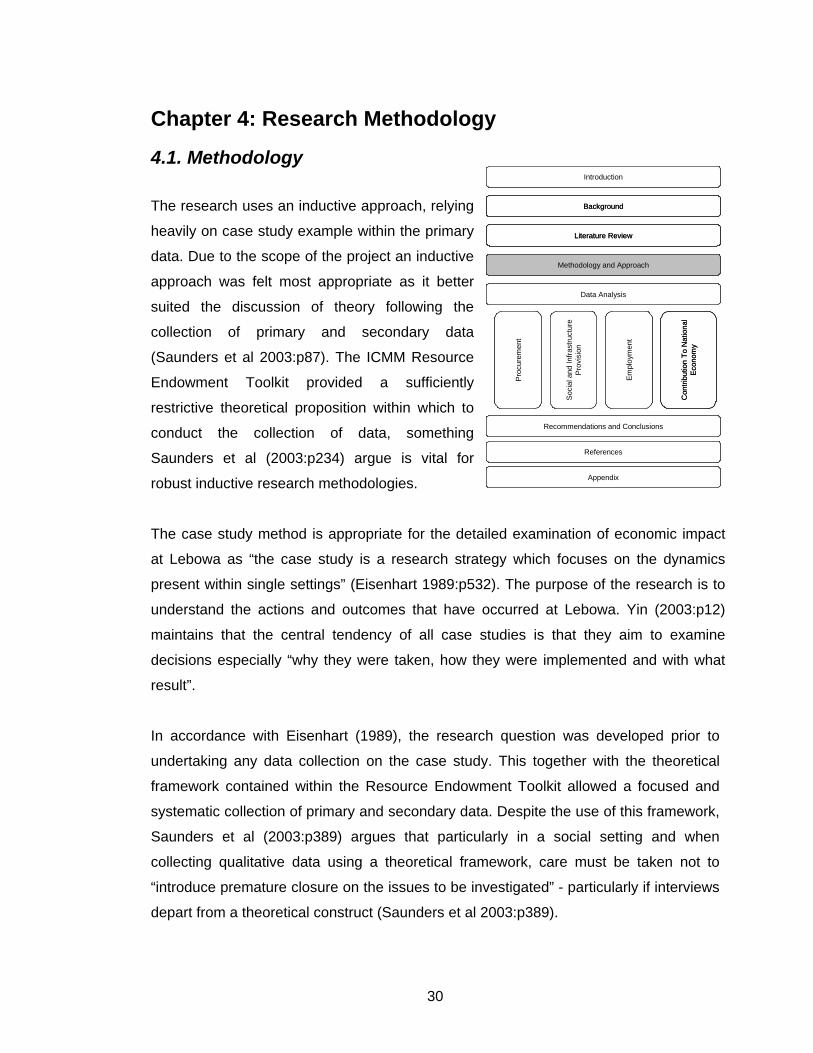
Chapter 4: Research Methodology
4.1. Methodology
The research uses an inductive approach, relying
heavily on case study example within the primary
data. Due to the scope of the project an inductive
approach was felt most appropriate as it better
suited the discussion of theory following the
collection of primary and secondary data
(Saunders et al 2003:p87). The ICMM Resource
Endowment Toolkit provided a sufficiently
restrictive theoretical proposition within which to
conduct the collection of data, something
Saunders et al (2003:p234) argue is vital for
robust inductive research methodologies.
Background
Methodology and Approach
Literature Review
Data Analysis
Proc
urem
ent
Empl
oym
ent
Soc
ial a
nd In
frast
ruct
ure
Pro
visi
on
Recommendations and Conclusions
References
Appendix
Con
tribu
tion
To N
atio
nal
Econ
omy
Introduction
Background
Methodology and Approach
Literature Review
Data Analysis
Proc
urem
ent
Empl
oym
ent
Soc
ial a
nd In
frast
ruct
ure
Pro
visi
on
Recommendations and Conclusions
References
Appendix
Con
tribu
tion
To N
atio
nal
Econ
omy
Introduction
The case study method is appropriate for the detailed examination of economic impact
at Lebowa as “the case study is a research strategy which focuses on the dynamics
present within single settings” (Eisenhart 1989:p532). The purpose of the research is to
understand the actions and outcomes that have occurred at Lebowa. Yin (2003:p12)
maintains that the central tendency of all case studies is that they aim to examine
decisions especially “why they were taken, how they were implemented and with what
result”.
In accordance with Eisenhart (1989), the research question was developed prior to
undertaking any data collection on the case study. This together with the theoretical
framework contained within the Resource Endowment Toolkit allowed a focused and
systematic collection of primary and secondary data. Despite the use of this framework,
Saunders et al (2003:p389) argues that particularly in a social setting and when
collecting qualitative data using a theoretical framework, care must be taken not to
“introduce premature closure on the issues to be investigated” - particularly if interviews
depart from a theoretical construct (Saunders et al 2003:p389).
30
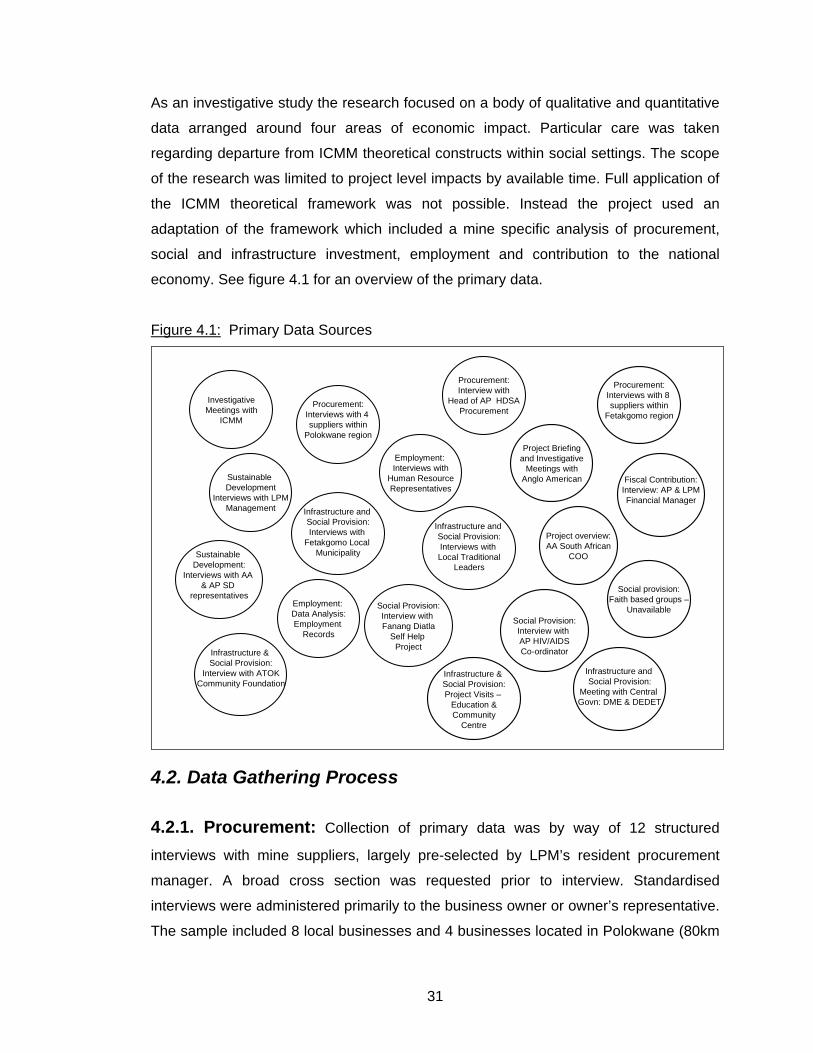
As an investigative study the research focused on a body of qualitative and quantitative
data arranged around four areas of economic impact. Particular care was taken
regarding departure from ICMM theoretical constructs within social settings. The scope
of the research was limited to project level impacts by available time. Full application of
the ICMM theoretical framework was not possible. Instead the project used an
adaptation of the framework which included a mine specific analysis of procurement,
social and infrastructure investment, employment and contribution to the national
economy. See figure 4.1 for an overview of the primary data.
Figure 4.1: Primary Data Sources
InvestigativeMeetings with
ICMM
Employment: Interviews with
Human ResourceRepresentatives
Project Briefingand Investigative
Meetings withAnglo American Fiscal Contribution:
Interview: AP & LPMFinancial Manager
Infrastructure & Social Provision:
Interview with ATOKCommunity Foundation
Social Provision:Interview with Fanang Diatla
Self Help Project
Infrastructure and Social Provision:Interviews with
Fetakgomo Local Municipality
Procurement:Interviews with 8 suppliers within
Fetakgomo regionProcurement:
Interviews with 4 suppliers within
Polokwane region
Sustainable Development:
Interviews with AA & AP SD
representatives
Procurement:Interview with
Head of AP HDSAProcurement
Infrastructure and Social Provision:
Meeting with Central Govn: DME & DEDET
Sustainable Development
Interviews with LPMManagement
Project overview:AA South African
COO
Infrastructure and Social Provision:Interviews with Local Traditional
Leaders
Social Provision:Interview with AP HIV/AIDSCo-ordinator
Employment: Data Analysis:Employment
Records
Infrastructure & Social Provision:Project Visits –
Education &Community
Centre
Social provision:Faith based groups –
Unavailable
4.2. Data Gathering Process
4.2.1. Procurement: Collection of primary data was by way of 12 structured
interviews with mine suppliers, largely pre-selected by LPM’s resident procurement
manager. A broad cross section was requested prior to interview. Standardised
interviews were administered primarily to the business owner or owner’s representative.
The sample included 8 local businesses and 4 businesses located in Polokwane (80km
31
from mine). Prior knowledge by the resident procurement manager (pre-contact via
telephone) about the research, allowed “convenience sampling” an approach which
Saunders et al (2003:p119) argues can provide better quality data when using a case
study approach. The procurement interviews consisted of three sections. Section 1
focused on the company’s background, industry and makeup, Section 2 focused on the
companies current performance including turnover and employment levels and Section
3 focused on future investment and economic outlook as well as any problems the
business was experiencing. (See Appendix 10: for a sample questionnaire).
While the sample was not representative of the mine supply chain, skewed 75% in
favour of locally owned SMME’s which only represent 14% of current total procurement
(Ditchfield 2006) - the sample did provide a deeper understanding of local level impacts
and linkages, vital to economic impact (Auty 1998: p500). Several of the local business
owners had also directly benefited from LPM business development training (Phasha
2006) and this provided an opportunity to explore not only procurement but also the
results of social development and indirect employment. Following initial interviews, the
LPM resident procurement manager assisted with follow-up and clarification of several
data issues. Secondary research of journals (Journal of Mining Development, Journal of
Development Economics and Management Review Journal etc), research reports (Auty
1998, Parker et al 2004, Richards 2002 etc) and industry material (MMSD, WBCSD,
ICMM, SACOM) facilitated improved understanding and context surrounding economic
impacts.
Mine procurement data from 2004 – 2006 YTD was also provided by Anglo Platinum
which formed the basis of several analytics. Procurement data proved difficult to
manipulate and in the end was of limited use due to the relative short duration and large
volume of irrelevant detail. The objective was to build a body of evidence surrounding
the impact of LPM’s procurement activities and assess whether this was contributing to
local economic development.
32
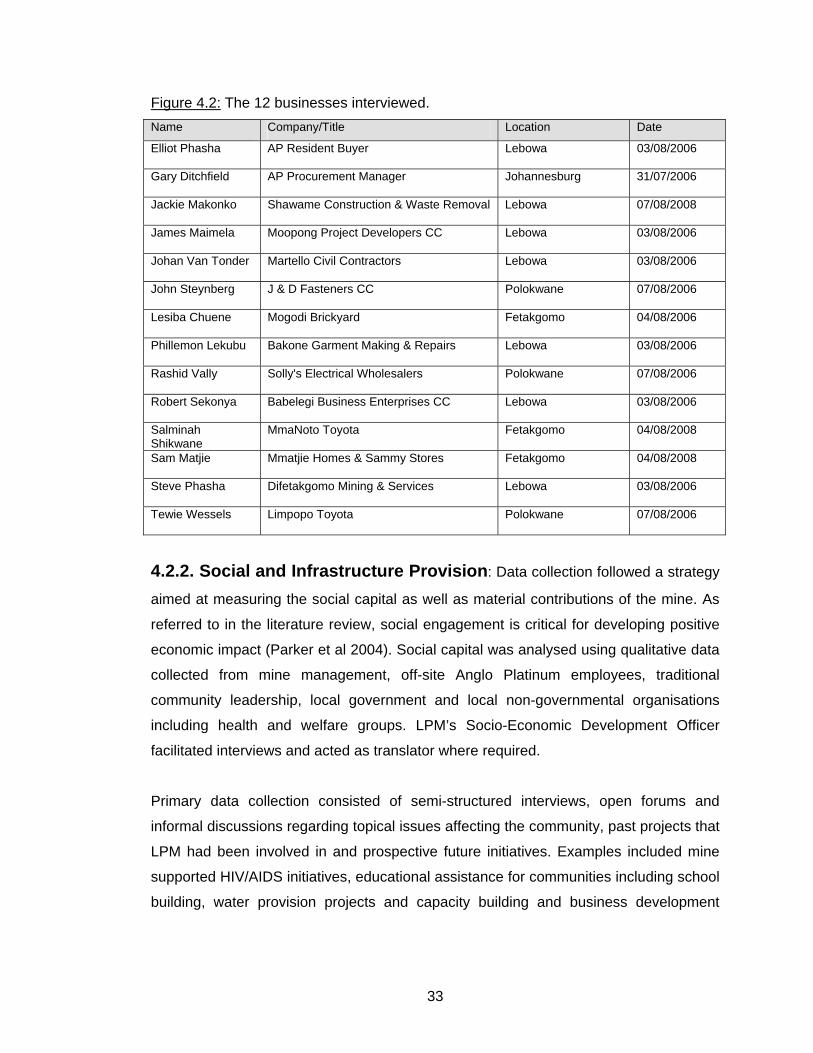
Figure 4.2: The 12 businesses interviewed. Name Company/Title Location Date
Elliot Phasha AP Resident Buyer Lebowa 03/08/2006
Gary Ditchfield AP Procurement Manager Johannesburg 31/07/2006
Jackie Makonko Shawame Construction & Waste Removal Lebowa 07/08/2008
James Maimela Moopong Project Developers CC Lebowa 03/08/2006
Johan Van Tonder Martello Civil Contractors Lebowa 03/08/2006
John Steynberg J & D Fasteners CC Polokwane 07/08/2006
Lesiba Chuene Mogodi Brickyard Fetakgomo 04/08/2006
Phillemon Lekubu Bakone Garment Making & Repairs Lebowa 03/08/2006
Rashid Vally Solly's Electrical Wholesalers Polokwane 07/08/2006
Robert Sekonya Babelegi Business Enterprises CC Lebowa 03/08/2006
Salminah Shikwane
MmaNoto Toyota Fetakgomo 04/08/2008
Sam Matjie Mmatjie Homes & Sammy Stores Fetakgomo 04/08/2008
Steve Phasha Difetakgomo Mining & Services Lebowa 03/08/2006
Tewie Wessels Limpopo Toyota Polokwane 07/08/2006
4.2.2. Social and Infrastructure Provision: Data collection followed a strategy
aimed at measuring the social capital as well as material contributions of the mine. As
referred to in the literature review, social engagement is critical for developing positive
economic impact (Parker et al 2004). Social capital was analysed using qualitative data
collected from mine management, off-site Anglo Platinum employees, traditional
community leadership, local government and local non-governmental organisations
including health and welfare groups. LPM’s Socio-Economic Development Officer
facilitated interviews and acted as translator where required.
Primary data collection consisted of semi-structured interviews, open forums and
informal discussions regarding topical issues affecting the community, past projects that
LPM had been involved in and prospective future initiatives. Examples included mine
supported HIV/AIDS initiatives, educational assistance for communities including school
building, water provision projects and capacity building and business development
33
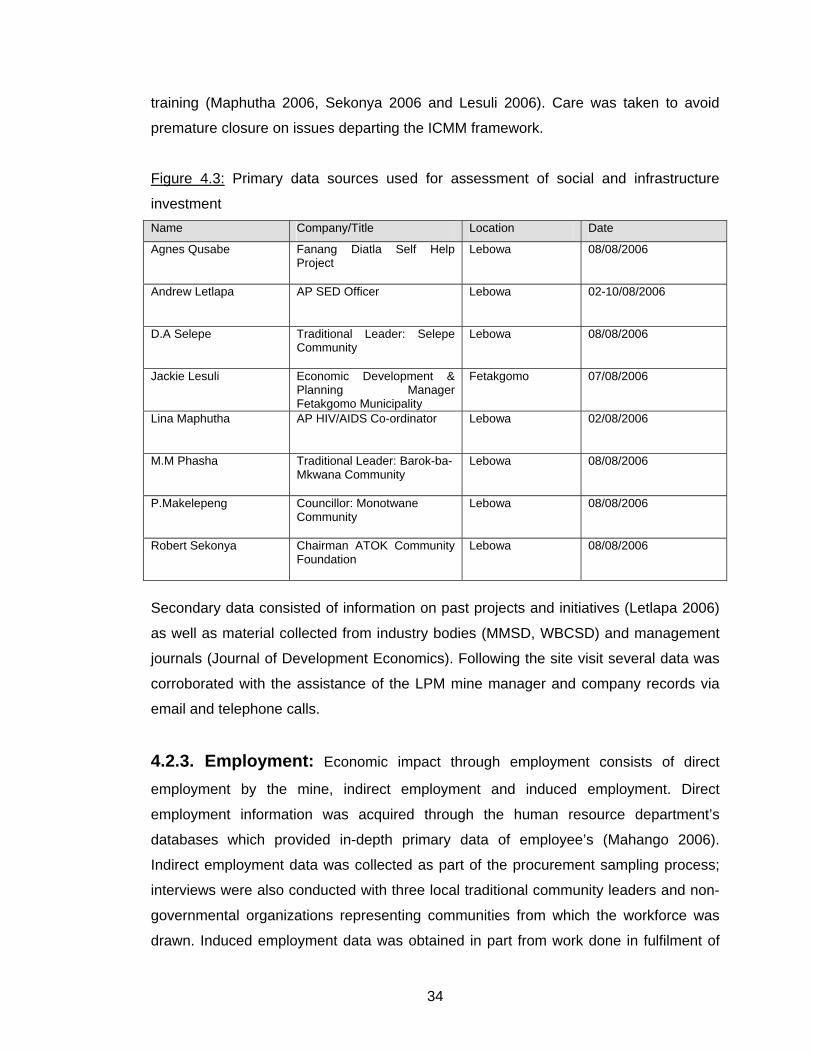
training (Maphutha 2006, Sekonya 2006 and Lesuli 2006). Care was taken to avoid
premature closure on issues departing the ICMM framework.
Figure 4.3: Primary data sources used for assessment of social and infrastructure
investment Name Company/Title Location Date
Agnes Qusabe Fanang Diatla Self Help Project
Lebowa 08/08/2006
Andrew Letlapa AP SED Officer Lebowa 02-10/08/2006
D.A Selepe Traditional Leader: Selepe Community
Lebowa 08/08/2006
Jackie Lesuli Economic Development & Planning Manager Fetakgomo Municipality
Fetakgomo 07/08/2006
Lina Maphutha AP HIV/AIDS Co-ordinator
Lebowa 02/08/2006
M.M Phasha Traditional Leader: Barok-ba-Mkwana Community
Lebowa 08/08/2006
P.Makelepeng Councillor: Monotwane Community
Lebowa 08/08/2006
Robert Sekonya Chairman ATOK Community Foundation
Lebowa 08/08/2006
Secondary data consisted of information on past projects and initiatives (Letlapa 2006)
as well as material collected from industry bodies (MMSD, WBCSD) and management
journals (Journal of Development Economics). Following the site visit several data was
corroborated with the assistance of the LPM mine manager and company records via
email and telephone calls.
4.2.3. Employment: Economic impact through employment consists of direct
employment by the mine, indirect employment and induced employment. Direct
employment information was acquired through the human resource department’s
databases which provided in-depth primary data of employee’s (Mahango 2006).
Indirect employment data was collected as part of the procurement sampling process;
interviews were also conducted with three local traditional community leaders and non-
governmental organizations representing communities from which the workforce was
drawn. Induced employment data was obtained in part from work done in fulfilment of
34
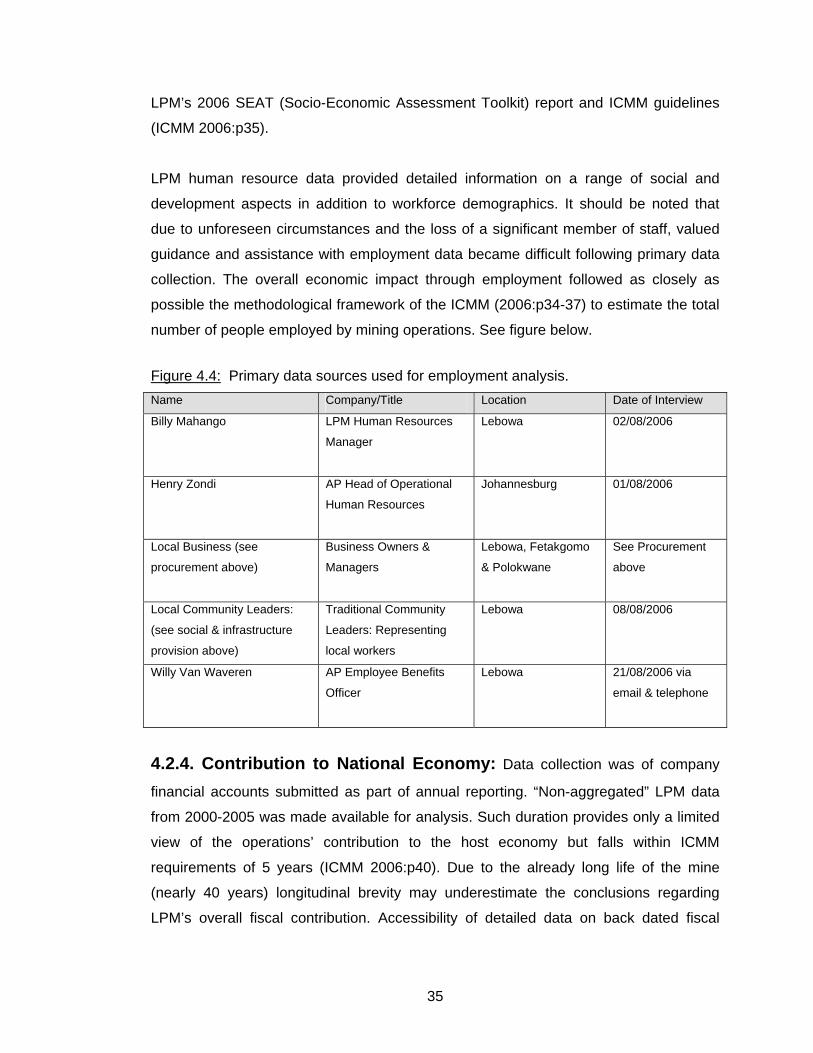
LPM’s 2006 SEAT (Socio-Economic Assessment Toolkit) report and ICMM guidelines
(ICMM 2006:p35).
LPM human resource data provided detailed information on a range of social and
development aspects in addition to workforce demographics. It should be noted that
due to unforeseen circumstances and the loss of a significant member of staff, valued
guidance and assistance with employment data became difficult following primary data
collection. The overall economic impact through employment followed as closely as
possible the methodological framework of the ICMM (2006:p34-37) to estimate the total
number of people employed by mining operations. See figure below.
Figure 4.4: Primary data sources used for employment analysis. Name Company/Title Location Date of Interview
Billy Mahango LPM Human Resources
Manager
Lebowa 02/08/2006
Henry Zondi AP Head of Operational
Human Resources
Johannesburg 01/08/2006
Local Business (see
procurement above)
Business Owners &
Managers
Lebowa, Fetakgomo
& Polokwane
See Procurement
above
Local Community Leaders:
(see social & infrastructure
provision above)
Traditional Community
Leaders: Representing
local workers
Lebowa 08/08/2006
Willy Van Waveren AP Employee Benefits
Officer
Lebowa 21/08/2006 via
email & telephone
4.2.4. Contribution to National Economy: Data collection was of company
financial accounts submitted as part of annual reporting. “Non-aggregated” LPM data
from 2000-2005 was made available for analysis. Such duration provides only a limited
view of the operations’ contribution to the host economy but falls within ICMM
requirements of 5 years (ICMM 2006:p40). Due to the already long life of the mine
(nearly 40 years) longitudinal brevity may underestimate the conclusions regarding
LPM’s overall fiscal contribution. Accessibility of detailed data on back dated fiscal
35

payments over a range of 10 years was understandably difficult for the finance
department (Broodryk 2006).
The ICMM methodology includes a comprehensive list of fiscal payments including
dividends, royalties and taxes and other charges. Due to the project level focus
contribution to the national economy by downstream activities while recognised as
significant, did not form part of the study. Such examples include contribution to GDP,
foreign exchange earnings and fiscal contributions made by downstream activities. The
ICMM methodology was followed for project level contributions and was completed for
the most recent tax year: 2005. (See Appendix 6: Fiscal Contributions for a full
breakdown of inputs and Figure 4.5 below for data sources).
Figure 4.5: Primary data sources used to assess contribution to national revenue. Name Title Where Date
Dolf Broodryk Manager Corporate Accounting Johannesburg 31/07/2006
Jacques
Steenkamp
Financial Manager Lebowa Platinum
Mine
Polokwane 11/08/2006
Ian Emsley Advisor Carbon Management and
Sustainable Development
London 10/10/2006 via email
4.3. Access and Confidentiality: All interviews were done on a voluntary basis. During all interviews the objectives of the
research were clearly explained (through the use of a translator if required) and
interviewees were given an opportunity to review the ICMM guidelines. Access to the
findings and sponsors of the research (Anglo-American Plc and Imperial College
London) were made clear prior to interview and the interviewee was given an
opportunity to ask any questions. An effort was made to explain the research was
independent of LPM. Where appropriate interviewee’s were asked if conversations
could be recorded for accuracy. An assurance was made not to disclose sensitive
financial and business information to competitors and as such it was confirmed the
report was purely for consumption by Anglo American employees and would not be
publicly available. During community discussions, while an effort was made to allow
attendees to speak freely, a translator was necessary who was an LPM employee. It is
not anticipated this influenced findings as the subject matter was familiar from prior
36

interactions. Saunders et al (2003:p131) explain that deception and consent are central
features required in ethical qualitative data collection and it was felt these were best
addressed through the appropriate use of the LPM representative during interviews.
37
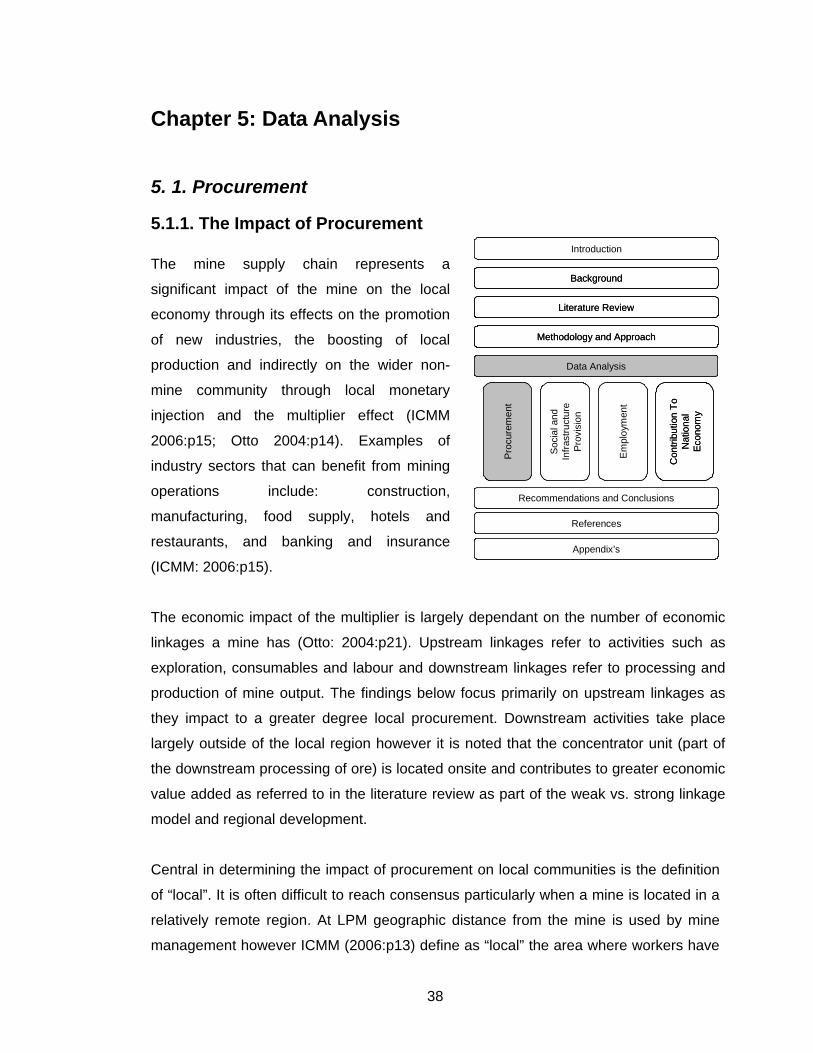
Chapter 5: Data Analysis
5. 1. Procurement
5.1.1. The Impact of Procurement The mine supply chain represents a
significant impact of the mine on the local
economy through its effects on the promotion
of new industries, the boosting of local
production and indirectly on the wider non-
mine community through local monetary
injection and the multiplier effect (ICMM
2006:p15; Otto 2004:p14). Examples of
industry sectors that can benefit from mining
operations include: construction,
manufacturing, food supply, hotels and
restaurants, and banking and insurance
(ICMM: 2006:p15).
Background
Methodology and Approach
Literature Review
Data Analysis
Proc
urem
ent
Em
ploy
men
t
Soc
ial a
nd
Infra
stru
ctur
e Pr
ovis
ion
Recommendations and Conclusions
References
Appendix’s
Con
tribu
tion
To
Nat
iona
l Ec
onom
y
Introduction
Background
Methodology and Approach
Literature Review
Data Analysis
Proc
urem
ent
Em
ploy
men
t
Soc
ial a
nd
Infra
stru
ctur
e Pr
ovis
ion
Recommendations and Conclusions
References
Appendix’s
Con
tribu
tion
To
Nat
iona
l Ec
onom
y
Introduction
The economic impact of the multiplier is largely dependant on the number of economic
linkages a mine has (Otto: 2004:p21). Upstream linkages refer to activities such as
exploration, consumables and labour and downstream linkages refer to processing and
production of mine output. The findings below focus primarily on upstream linkages as
they impact to a greater degree local procurement. Downstream activities take place
largely outside of the local region however it is noted that the concentrator unit (part of
the downstream processing of ore) is located onsite and contributes to greater economic
value added as referred to in the literature review as part of the weak vs. strong linkage
model and regional development.
Central in determining the impact of procurement on local communities is the definition
of “local”. It is often difficult to reach consensus particularly when a mine is located in a
relatively remote region. At LPM geographic distance from the mine is used by mine
management however ICMM (2006:p13) define as “local” the area where workers have
38
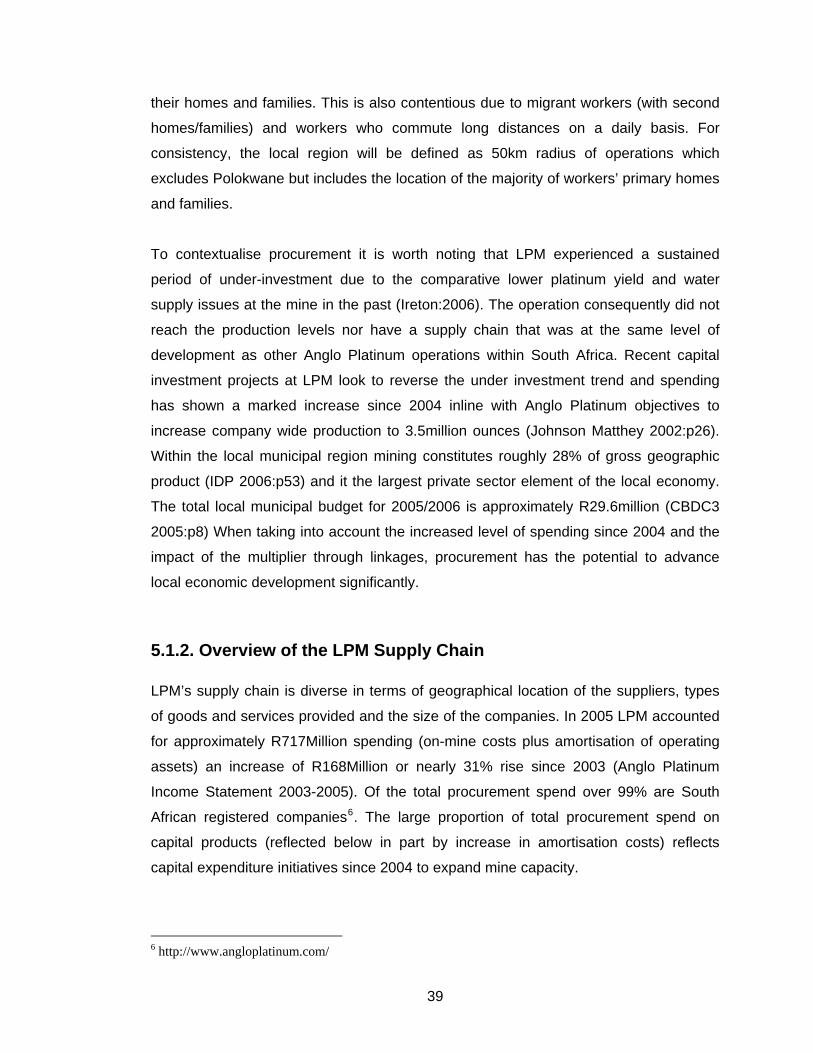
their homes and families. This is also contentious due to migrant workers (with second
homes/families) and workers who commute long distances on a daily basis. For
consistency, the local region will be defined as 50km radius of operations which
excludes Polokwane but includes the location of the majority of workers’ primary homes
and families.
To contextualise procurement it is worth noting that LPM experienced a sustained
period of under-investment due to the comparative lower platinum yield and water
supply issues at the mine in the past (Ireton:2006). The operation consequently did not
reach the production levels nor have a supply chain that was at the same level of
development as other Anglo Platinum operations within South Africa. Recent capital
investment projects at LPM look to reverse the under investment trend and spending
has shown a marked increase since 2004 inline with Anglo Platinum objectives to
increase company wide production to 3.5million ounces (Johnson Matthey 2002:p26).
Within the local municipal region mining constitutes roughly 28% of gross geographic
product (IDP 2006:p53) and it the largest private sector element of the local economy.
The total local municipal budget for 2005/2006 is approximately R29.6million (CBDC3
2005:p8) When taking into account the increased level of spending since 2004 and the
impact of the multiplier through linkages, procurement has the potential to advance
local economic development significantly.
5.1.2. Overview of the LPM Supply Chain LPM’s supply chain is diverse in terms of geographical location of the suppliers, types
of goods and services provided and the size of the companies. In 2005 LPM accounted
for approximately R717Million spending (on-mine costs plus amortisation of operating
assets) an increase of R168Million or nearly 31% rise since 2003 (Anglo Platinum
Income Statement 2003-2005). Of the total procurement spend over 99% are South
African registered companies6. The large proportion of total procurement spend on
capital products (reflected below in part by increase in amortisation costs) reflects
capital expenditure initiatives since 2004 to expand mine capacity.
6 http://www.angloplatinum.com/
39
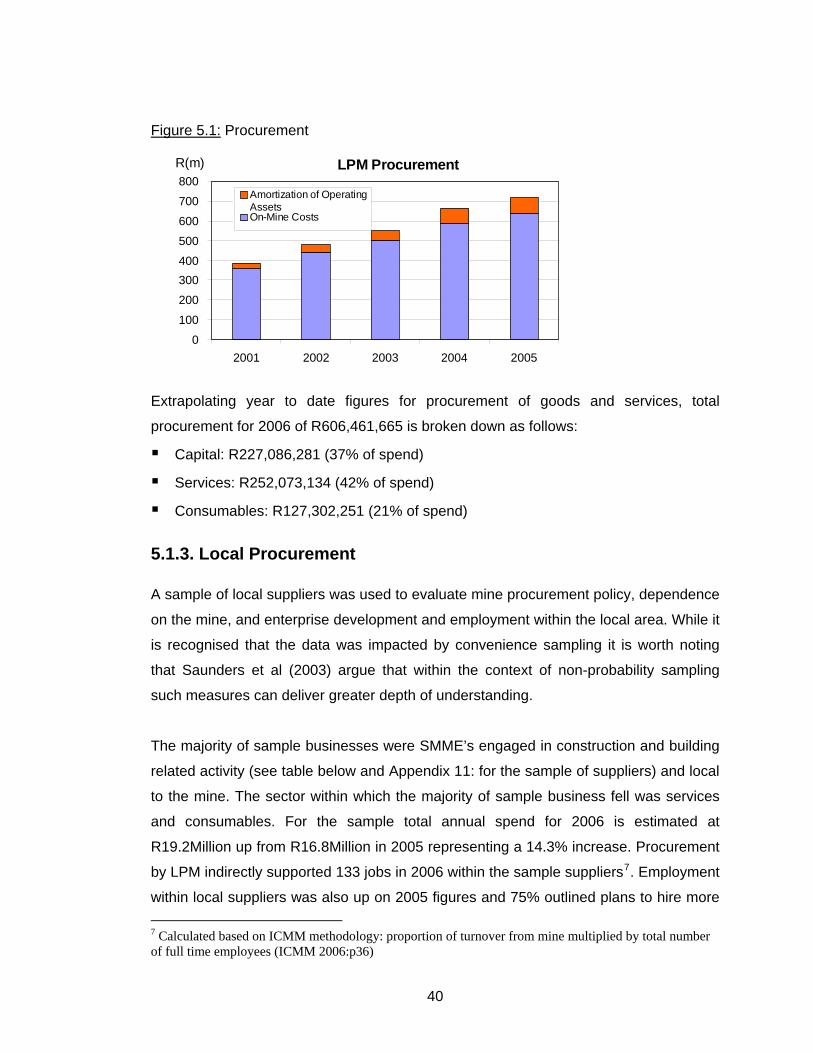
Figure 5.1: Procurement
LPM Procurement
0
100
200
300400
500
600
700
800
2001 2002 2003 2004 2005
Amortization of OperatingAssetsOn-Mine Costs
R(m)
Extrapolating year to date figures for procurement of goods and services, total
procurement for 2006 of R606,461,665 is broken down as follows:
Capital: R227,086,281 (37% of spend)
Services: R252,073,134 (42% of spend)
Consumables: R127,302,251 (21% of spend)
5.1.3. Local Procurement A sample of local suppliers was used to evaluate mine procurement policy, dependence
on the mine, and enterprise development and employment within the local area. While it
is recognised that the data was impacted by convenience sampling it is worth noting
that Saunders et al (2003) argue that within the context of non-probability sampling
such measures can deliver greater depth of understanding.
The majority of sample businesses were SMME’s engaged in construction and building
related activity (see table below and Appendix 11: for the sample of suppliers) and local
to the mine. The sector within which the majority of sample business fell was services
and consumables. For the sample total annual spend for 2006 is estimated at
R19.2Million up from R16.8Million in 2005 representing a 14.3% increase. Procurement
by LPM indirectly supported 133 jobs in 2006 within the sample suppliers7. Employment
within local suppliers was also up on 2005 figures and 75% outlined plans to hire more 7 Calculated based on ICMM methodology: proportion of turnover from mine multiplied by total number of full time employees (ICMM 2006:p36)
40
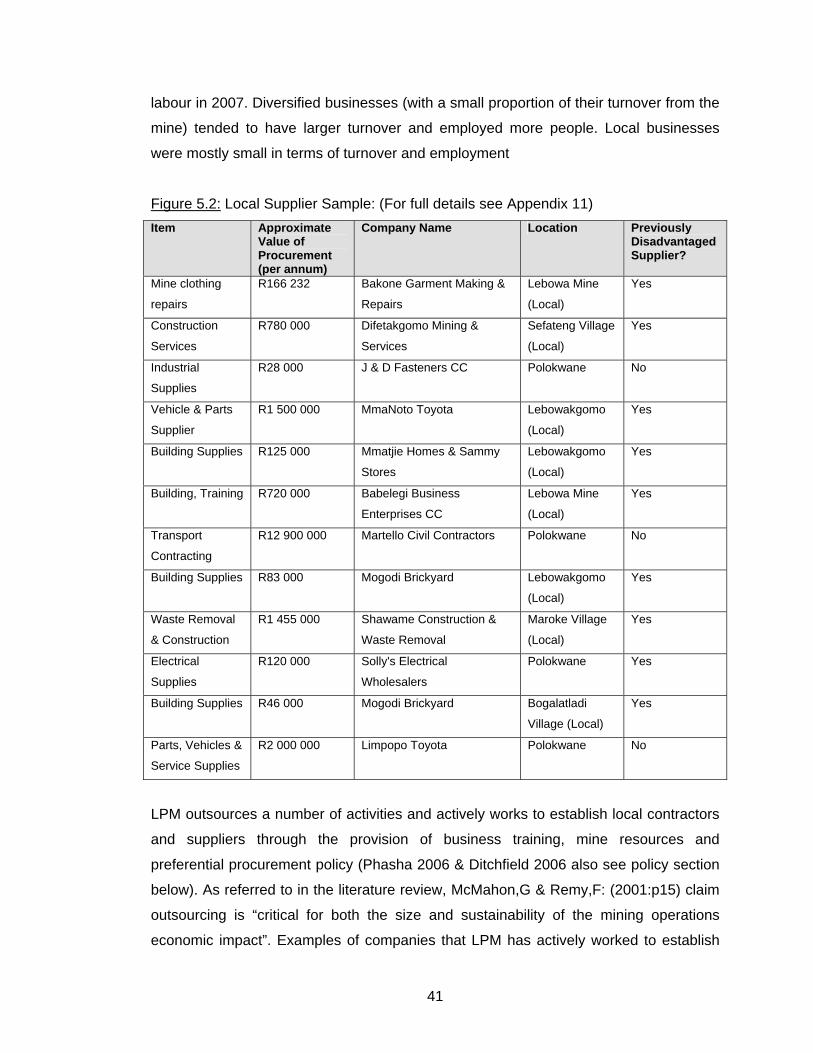
labour in 2007. Diversified businesses (with a small proportion of their turnover from the
mine) tended to have larger turnover and employed more people. Local businesses
were mostly small in terms of turnover and employment
Figure 5.2: Local Supplier Sample: (For full details see Appendix 11) Item Approximate
Value of Procurement (per annum)
Company Name Location Previously Disadvantaged Supplier?
Mine clothing
repairs
R166 232 Bakone Garment Making &
Repairs
Lebowa Mine
(Local)
Yes
Construction
Services
R780 000
Difetakgomo Mining &
Services
Sefateng Village
(Local)
Yes
Industrial
Supplies
R28 000 J & D Fasteners CC
Polokwane No
Vehicle & Parts
Supplier
R1 500 000 MmaNoto Toyota Lebowakgomo
(Local)
Yes
Building Supplies R125 000 Mmatjie Homes & Sammy
Stores
Lebowakgomo
(Local)
Yes
Building, Training R720 000 Babelegi Business
Enterprises CC
Lebowa Mine
(Local)
Yes
Transport
Contracting
R12 900 000 Martello Civil Contractors Polokwane No
Building Supplies R83 000 Mogodi Brickyard
Lebowakgomo
(Local)
Yes
Waste Removal
& Construction
R1 455 000 Shawame Construction &
Waste Removal
Maroke Village
(Local)
Yes
Electrical
Supplies
R120 000 Solly's Electrical
Wholesalers
Polokwane Yes
Building Supplies R46 000 Mogodi Brickyard
Bogalatladi
Village (Local)
Yes
Parts, Vehicles &
Service Supplies
R2 000 000 Limpopo Toyota Polokwane No
LPM outsources a number of activities and actively works to establish local contractors
and suppliers through the provision of business training, mine resources and
preferential procurement policy (Phasha 2006 & Ditchfield 2006 also see policy section
below). As referred to in the literature review, McMahon,G & Remy,F: (2001:p15) claim
outsourcing is “critical for both the size and sustainability of the mining operations
economic impact”. Examples of companies that LPM has actively worked to establish
41
include Difetakgomo Mining and Services (business development training, favourable
contract terms and equipment provided), Bakone Garment Making (business
development training provided) and Shawame Construction (business development
training provided). Non-local (Polokwane) based suppliers stated business from the
mine had decreased in the past 2 years (J&D Fasteners, Solly’s Electrical & Limpopo
Toyota). Non-previously disadvantaged suppliers expressed concerns for being able to
win future mine tenders (J&D Fasteners & Martello Civil Contractors). Early indicators
suggest a bias favouring local previously disadvantaged suppliers however the
evidence collected could not conclusively confirm this.
42% of the sample companies had only been in existence since 2002, and did not
posses skilled workers – defined as workers with technical skills or qualifications within
a certain field. LPM procurement noted this was a hindrance in expansion of
procurement spend with local suppliers (Ditchfield 2006). In response evidence notes
that 50% of the sample interviewed cited LPM business development or tender
preparation training as a key factor enabling them to compete for contracts. All local
suppliers interviewed outlined plans for expansion through either hiring more labour or
investing in capacity in 2007.
5.1.4. Capital Expenditure Projects LPM has experienced major capital investment in the past three years with the sinking
of new access shafts and capacity expansion at Brakfontein Merensky (R95.7million
replacement project) and Middlepunt Hill (R43.7million extension project). The main
shaft at Lebowa currently requires miners to travel up to 4km underground on foot,
before reaching places of work, impacting production efficiency significantly (Van
Vuuren 2006).
To date approximately R349Million8 has been spent on the expansion representing an
increase of 47% in property, plant and equipment investment. Vendors providing
services have largely consisted of Johannesburg based specialist project management,
contracting and construction suppliers. Examples include Skelton and Plummer
Projects with total spend of over R25Million, Highveld PFS with R8.6Million and SAN
8 Anglo Platinum LPM Annual Accounts: 2003, 2004, 2005- Income Statement, Annexure A, Note 11
42
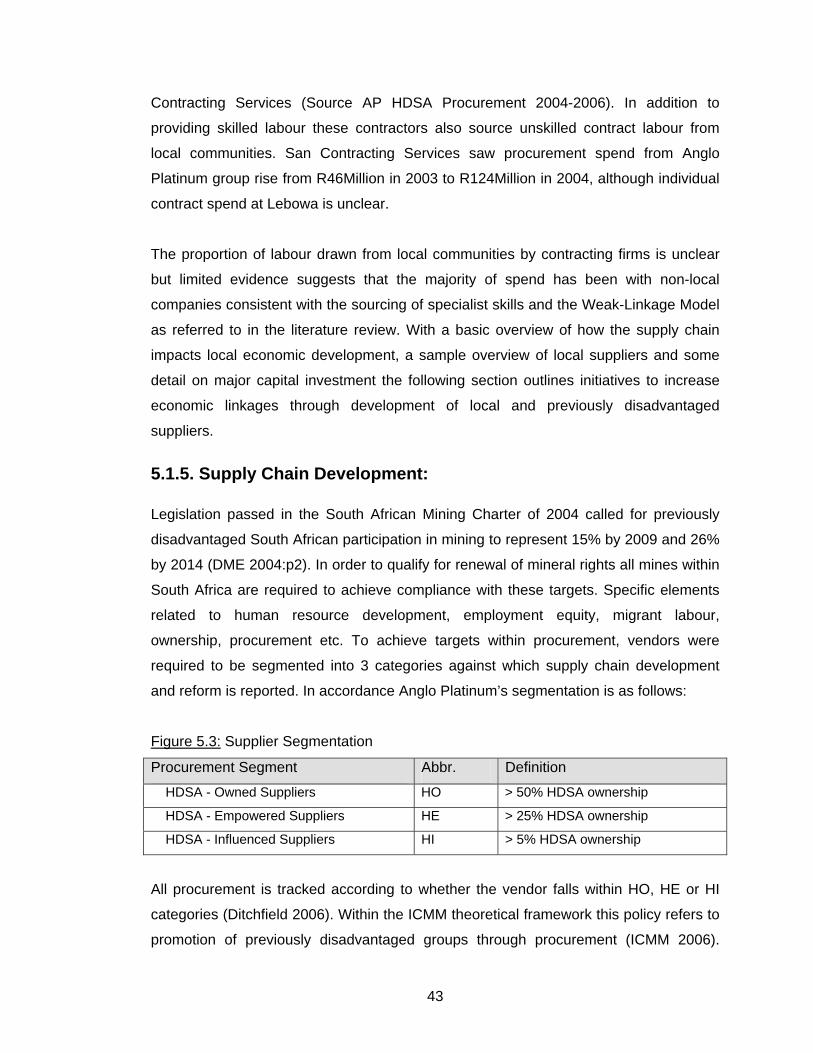
Contracting Services (Source AP HDSA Procurement 2004-2006). In addition to
providing skilled labour these contractors also source unskilled contract labour from
local communities. San Contracting Services saw procurement spend from Anglo
Platinum group rise from R46Million in 2003 to R124Million in 2004, although individual
contract spend at Lebowa is unclear.
The proportion of labour drawn from local communities by contracting firms is unclear
but limited evidence suggests that the majority of spend has been with non-local
companies consistent with the sourcing of specialist skills and the Weak-Linkage Model
as referred to in the literature review. With a basic overview of how the supply chain
impacts local economic development, a sample overview of local suppliers and some
detail on major capital investment the following section outlines initiatives to increase
economic linkages through development of local and previously disadvantaged
suppliers.
5.1.5. Supply Chain Development: Legislation passed in the South African Mining Charter of 2004 called for previously
disadvantaged South African participation in mining to represent 15% by 2009 and 26%
by 2014 (DME 2004:p2). In order to qualify for renewal of mineral rights all mines within
South Africa are required to achieve compliance with these targets. Specific elements
related to human resource development, employment equity, migrant labour,
ownership, procurement etc. To achieve targets within procurement, vendors were
required to be segmented into 3 categories against which supply chain development
and reform is reported. In accordance Anglo Platinum’s segmentation is as follows:
Figure 5.3: Supplier Segmentation
Procurement Segment Abbr. Definition
HDSA - Owned Suppliers HO > 50% HDSA ownership
HDSA - Empowered Suppliers HE > 25% HDSA ownership
HDSA - Influenced Suppliers HI > 5% HDSA ownership
All procurement is tracked according to whether the vendor falls within HO, HE or HI
categories (Ditchfield 2006). Within the ICMM theoretical framework this policy refers to
promotion of previously disadvantaged groups through procurement (ICMM 2006).
43
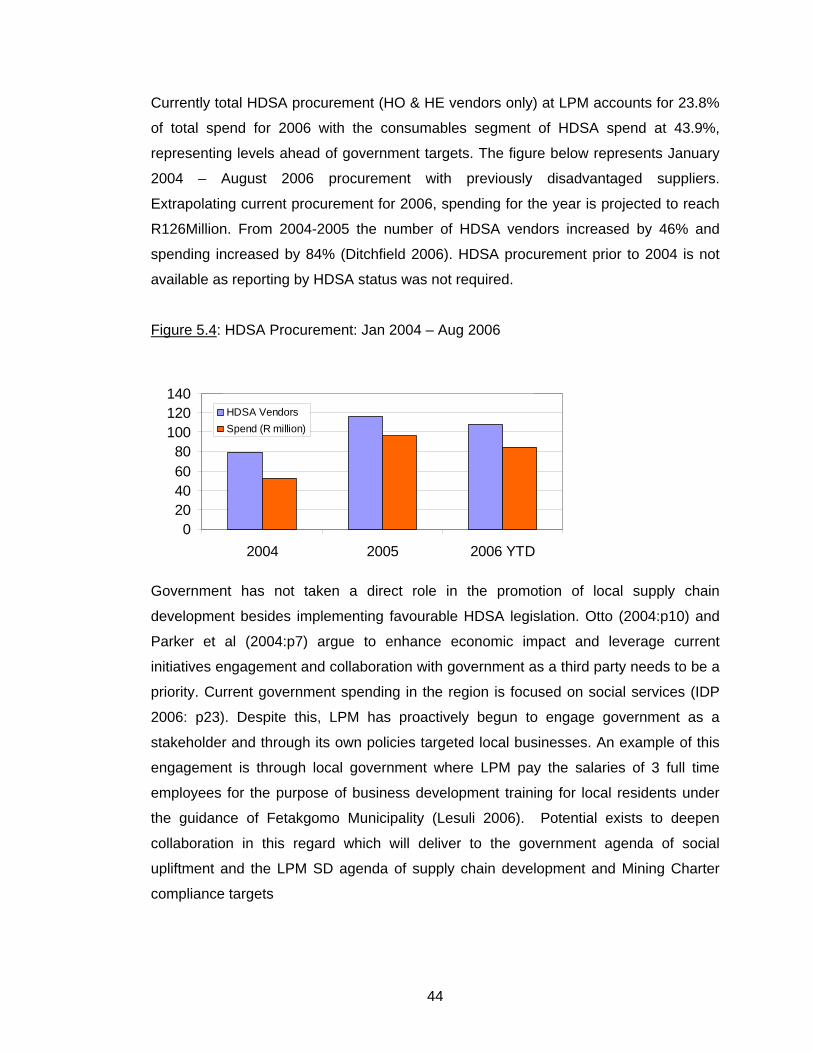
Currently total HDSA procurement (HO & HE vendors only) at LPM accounts for 23.8%
of total spend for 2006 with the consumables segment of HDSA spend at 43.9%,
representing levels ahead of government targets. The figure below represents January
2004 – August 2006 procurement with previously disadvantaged suppliers.
Extrapolating current procurement for 2006, spending for the year is projected to reach
R126Million. From 2004-2005 the number of HDSA vendors increased by 46% and
spending increased by 84% (Ditchfield 2006). HDSA procurement prior to 2004 is not
available as reporting by HDSA status was not required.
Figure 5.4: HDSA Procurement: Jan 2004 – Aug 2006
HDSA Procurement 2004 - August 2006
020406080
100120140
2004 2005 2006 YTD
HDSA VendorsSpend (R million)
Government has not taken a direct role in the promotion of local supply chain
development besides implementing favourable HDSA legislation. Otto (2004:p10) and
Parker et al (2004:p7) argue to enhance economic impact and leverage current
initiatives engagement and collaboration with government as a third party needs to be a
priority. Current government spending in the region is focused on social services (IDP
2006: p23). Despite this, LPM has proactively begun to engage government as a
stakeholder and through its own policies targeted local businesses. An example of this
engagement is through local government where LPM pay the salaries of 3 full time
employees for the purpose of business development training for local residents under
the guidance of Fetakgomo Municipality (Lesuli 2006). Potential exists to deepen
collaboration in this regard which will deliver to the government agenda of social
upliftment and the LPM SD agenda of supply chain development and Mining Charter
compliance targets
44

A trial procurement policy was recently implemented at LPM together with one other AP
mine. The policy is designed to stimulate the development of local and previously
disadvantaged (HDSA) suppliers and to speed up the rate of change within
procurement through capacity building (Ditchfield 2006). Suitable suppliers will be
granted “preferred vendor status”. The trial procurement policy is to ensure future
compliance with the Mining Charter that by 2007, 20% and by 2012, 30% of
discretionary procurement will be with HDSA suppliers (Anglo Platinum 2006: p3). If
the policy proves successful AP has the intention to expand the framework across the
group. Central to the policy are the following initiatives (Ditchfield 2006) – See also
Appendix 14:
Preferential treatment of local vendors.
Preferential treatment of HDSA vendors (AP keeps a database of HDSA accredited
vendors which currently numbers 1039: July 2006).
Assistance for local companies on how to prepare and submit tenders.
Encouragement through labour brokers for the sourcing of local contract labour.
Inclusion for community interests in procurement favours smaller contract sizes which
typically require more management time and challenge operational efficiency (Parker et
al 2004:p23). During supplier interviews a number of local small businesses expressed
that they had been excluded previously from the supply chain and not afforded the
opportunity to compete on mine tenders.9 The trial procurement policy in place at LPM
addresses this issue by aiming to increase “single source” contracts through the
resident buyer (Ditchfield 2006, Phasha 2006). According to Anglo Platinum’s trial
procurement framework (Anglo Platinum 2006:p3); to allow local HDSA suppliers
preferential access to contracts, the local procurement manager or resident buyer is
empowered to award smaller sized contracts based on a weighting system.
The trial of this policy has been successful in stimulating local economic HDSA
participation, through the increased awarding of contracts to local SMME’s and the
growing number of HDSA registered vendors. From 2004 until 2006 HDSA registered
vendors at LPM have increased from 95 to 134 (Company records August 2006).
9 Several local business owners felt mine contracts were previously reserved exclusively for businesses with relationships with mine management, typically White Owned Businesses from outside of the local area and they were granted contracts unfairly.
45
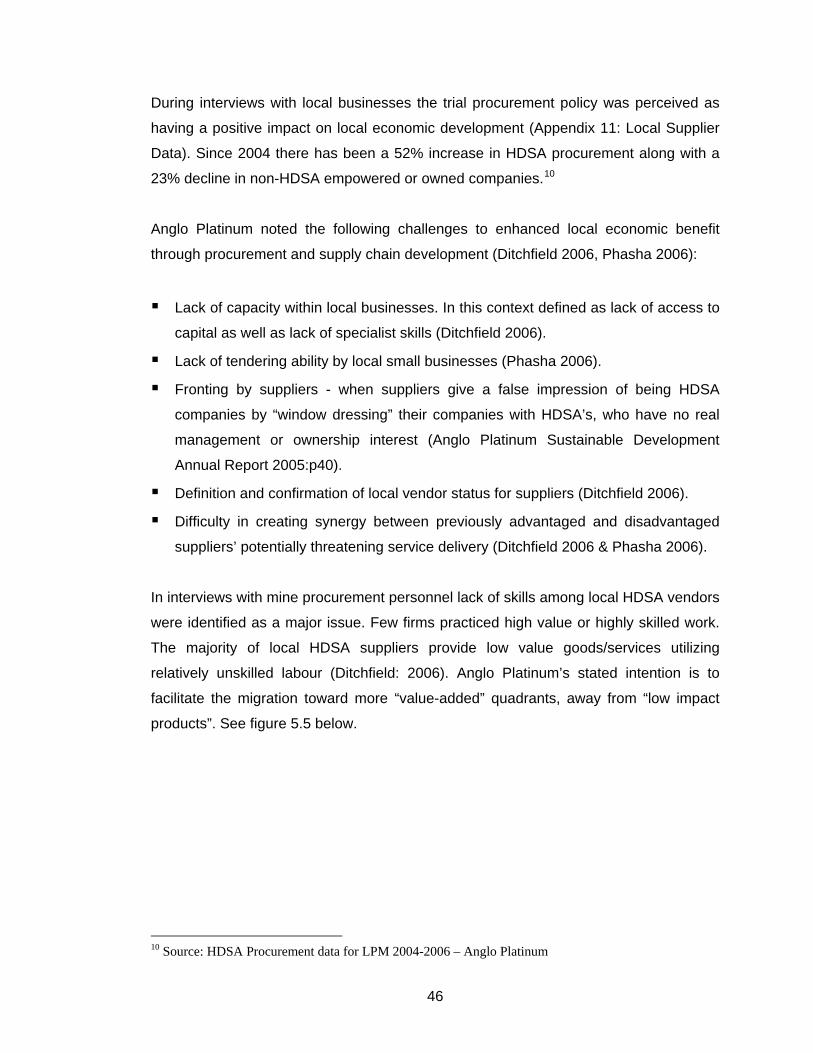
During interviews with local businesses the trial procurement policy was perceived as
having a positive impact on local economic development (Appendix 11: Local Supplier
Data). Since 2004 there has been a 52% increase in HDSA procurement along with a
23% decline in non-HDSA empowered or owned companies.10
Anglo Platinum noted the following challenges to enhanced local economic benefit
through procurement and supply chain development (Ditchfield 2006, Phasha 2006):
Lack of capacity within local businesses. In this context defined as lack of access to
capital as well as lack of specialist skills (Ditchfield 2006).
Lack of tendering ability by local small businesses (Phasha 2006).
Fronting by suppliers - when suppliers give a false impression of being HDSA
companies by “window dressing” their companies with HDSA’s, who have no real
management or ownership interest (Anglo Platinum Sustainable Development
Annual Report 2005:p40).
Definition and confirmation of local vendor status for suppliers (Ditchfield 2006).
Difficulty in creating synergy between previously advantaged and disadvantaged
suppliers’ potentially threatening service delivery (Ditchfield 2006 & Phasha 2006).
ore “value-added” quadrants, away from “low impact
products”. See figure 5.5 below.
In interviews with mine procurement personnel lack of skills among local HDSA vendors
were identified as a major issue. Few firms practiced high value or highly skilled work.
The majority of local HDSA suppliers provide low value goods/services utilizing
relatively unskilled labour (Ditchfield: 2006). Anglo Platinum’s stated intention is to
facilitate the migration toward m
10 Source: HDSA Procurement data for LPM 2004-2006 – Anglo Platinum
46
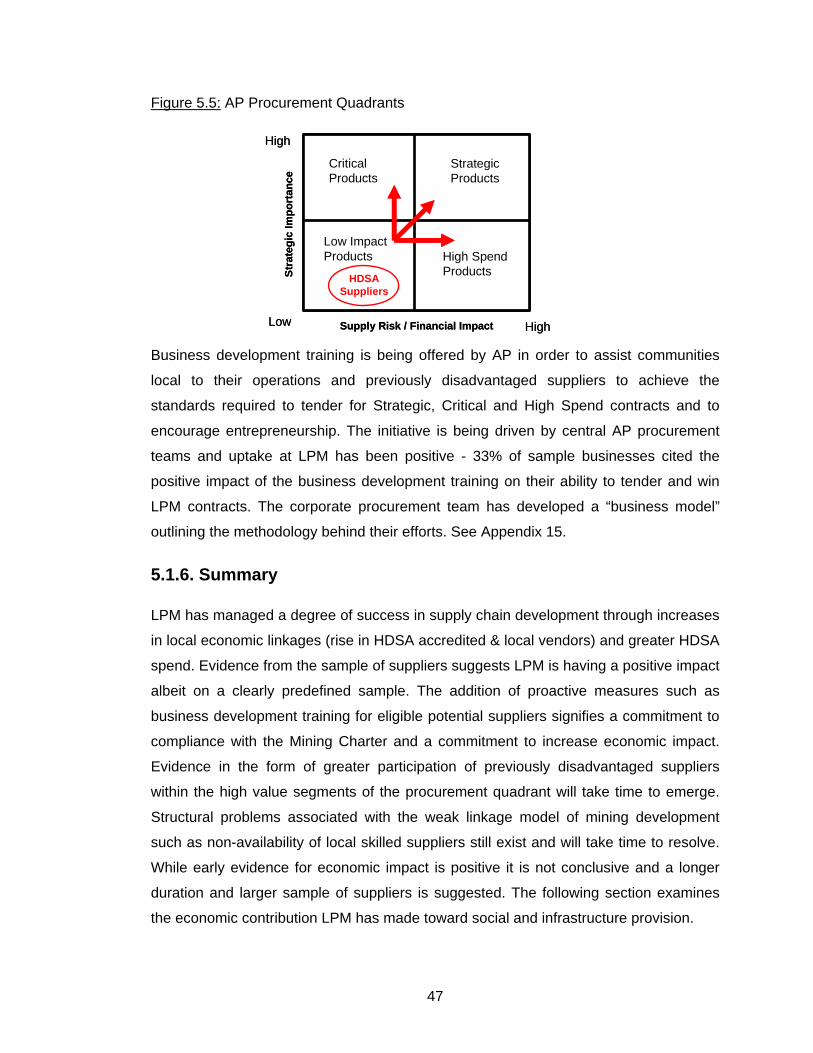
Figure 5.5: AP Procurement Quadrants
StrategicProducts
Critical Products
High SpendProducts
Low ImpactProducts
HDSASuppliers
Supply Risk / Financial Impact
Stra
tegi
c Im
port
ance
High
High
Low
StrategicProducts
Critical Products
High SpendProducts
Low ImpactProducts
HDSASuppliers
Supply Risk / Financial Impact
Stra
tegi
c Im
port
ance
High
High
Low
Business development training is being offered by AP in order to assist communities
local to their operations and previously disadvantaged suppliers to achieve the
standards required to tender for Strategic, Critical and High Spend contracts and to
encourage entrepreneurship. The initiative is being driven by central AP procurement
teams and uptake at LPM has been positive - 33% of sample businesses cited the
positive impact of the business development training on their ability to tender and win
LPM contracts. The corporate procurement team has developed a “business model”
outlining the methodology behind their efforts. See Appendix 15.
5.1.6. Summary LPM has managed a degree of success in supply chain development through increases
in local economic linkages (rise in HDSA accredited & local vendors) and greater HDSA
spend. Evidence from the sample of suppliers suggests LPM is having a positive impact
albeit on a clearly predefined sample. The addition of proactive measures such as
business development training for eligible potential suppliers signifies a commitment to
compliance with the Mining Charter and a commitment to increase economic impact.
Evidence in the form of greater participation of previously disadvantaged suppliers
within the high value segments of the procurement quadrant will take time to emerge.
Structural problems associated with the weak linkage model of mining development
such as non-availability of local skilled suppliers still exist and will take time to resolve.
While early evidence for economic impact is positive it is not conclusive and a longer
duration and larger sample of suppliers is suggested. The following section examines
the economic contribution LPM has made toward social and infrastructure provision.
47
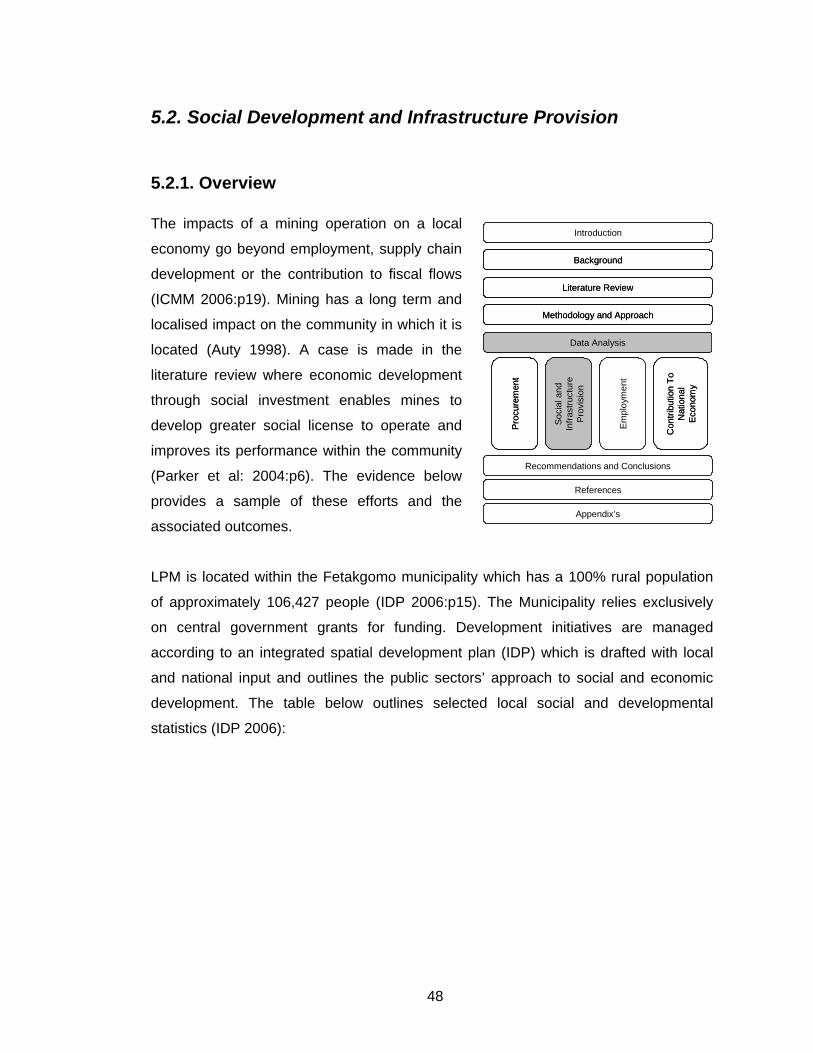
5.2. Social Development and Infrastructure Provision
5.2.1. Overview The impacts of a mining operation on a local
economy go beyond employment, supply chain
development or the contribution to fiscal flows
(ICMM 2006:p19). Mining has a long term and
localised impact on the community in which it is
located (Auty 1998). A case is made in the
literature review where economic development
through social investment enables mines to
develop greater social license to operate and
improves its performance within the community
(Parker et al: 2004:p6). The evidence below
provides a sample of these efforts and the
associated outcomes.
Background
Methodology and Approach
Literature Review
Data Analysis
Proc
urem
ent
Empl
oym
ent
Soci
al a
nd
Infra
stru
ctur
e Pr
ovis
ion
Recommendations and Conclusions
References
Appendix’s
Con
tribu
tion
To
Nat
iona
l Ec
onom
y
Introduction
Background
Methodology and Approach
Literature Review
Data Analysis
Proc
urem
ent
Empl
oym
ent
Soci
al a
nd
Infra
stru
ctur
e Pr
ovis
ion
Recommendations and Conclusions
References
Appendix’s
Con
tribu
tion
To
Nat
iona
l Ec
onom
y
Introduction
LPM is located within the Fetakgomo municipality which has a 100% rural population
of approximately 106,427 people (IDP 2006:p15). The Municipality relies exclusively
on central government grants for funding. Development initiatives are managed
according to an integrated spatial development plan (IDP) which is drafted with local
and national input and outlines the public sectors’ approach to social and economic
development. The table below outlines selected local social and developmental
statistics (IDP 2006):
48
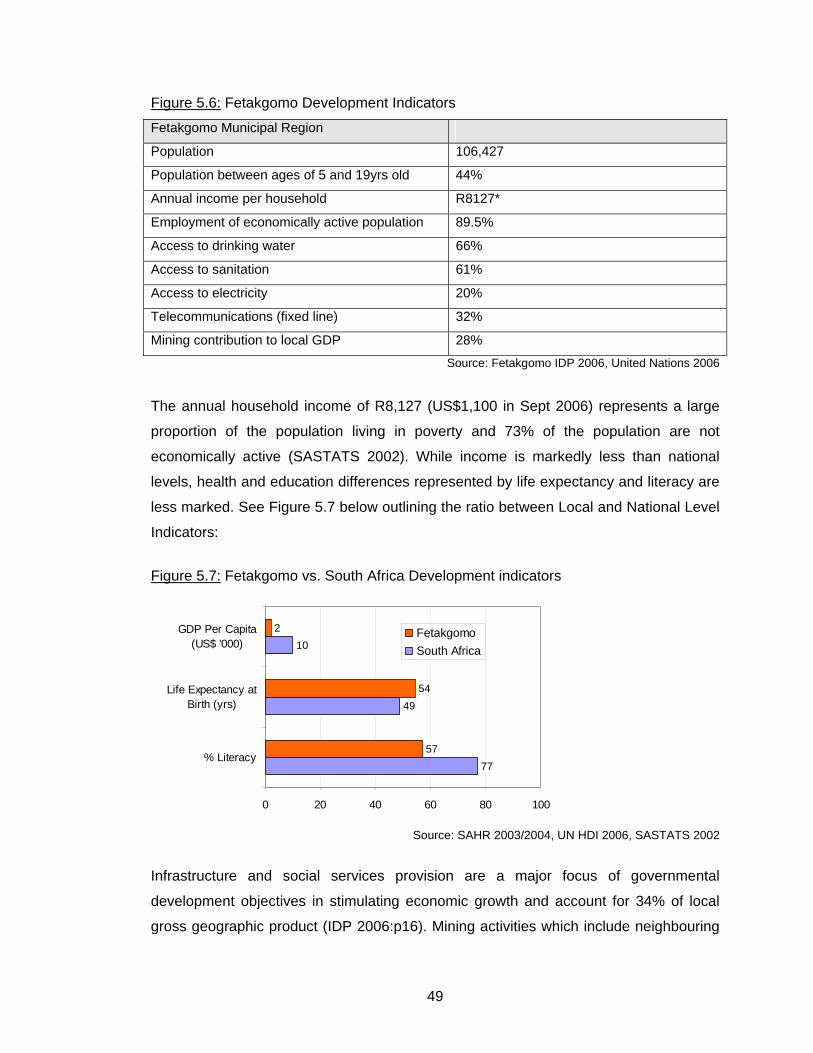
Figure 5.6: Fetakgomo Development Indicators
Fetakgomo Municipal Region
Population 106,427
Population between ages of 5 and 19yrs old 44%
Annual income per household R8127*
Employment of economically active population 89.5%
Access to drinking water 66%
Access to sanitation 61%
Access to electricity 20%
Telecommunications (fixed line) 32%
Mining contribution to local GDP 28%
Source: Fetakgomo IDP 2006, United Nations 2006
The annual household income of R8,127 (US$1,100 in Sept 2006) represents a large
proportion of the population living in poverty and 73% of the population are not
economically active (SASTATS 2002). While income is markedly less than national
levels, health and education differences represented by life expectancy and literacy are
less marked. See Figure 5.7 below outlining the ratio between Local and National Level
Indicators:
Figure 5.7: Fetakgomo vs. South Africa Development indicators
77
49
10
57
54
2
0 20 40 60 80 100
% Literacy
Life Expectancy atBirth (yrs)
GDP Per Capita(US$ '000)
FetakgomoSouth Africa
Source: SAHR 2003/2004, UN HDI 2006, SASTATS 2002
Infrastructure and social services provision are a major focus of governmental
development objectives in stimulating economic growth and account for 34% of local
gross geographic product (IDP 2006:p16). Mining activities which include neighbouring
49
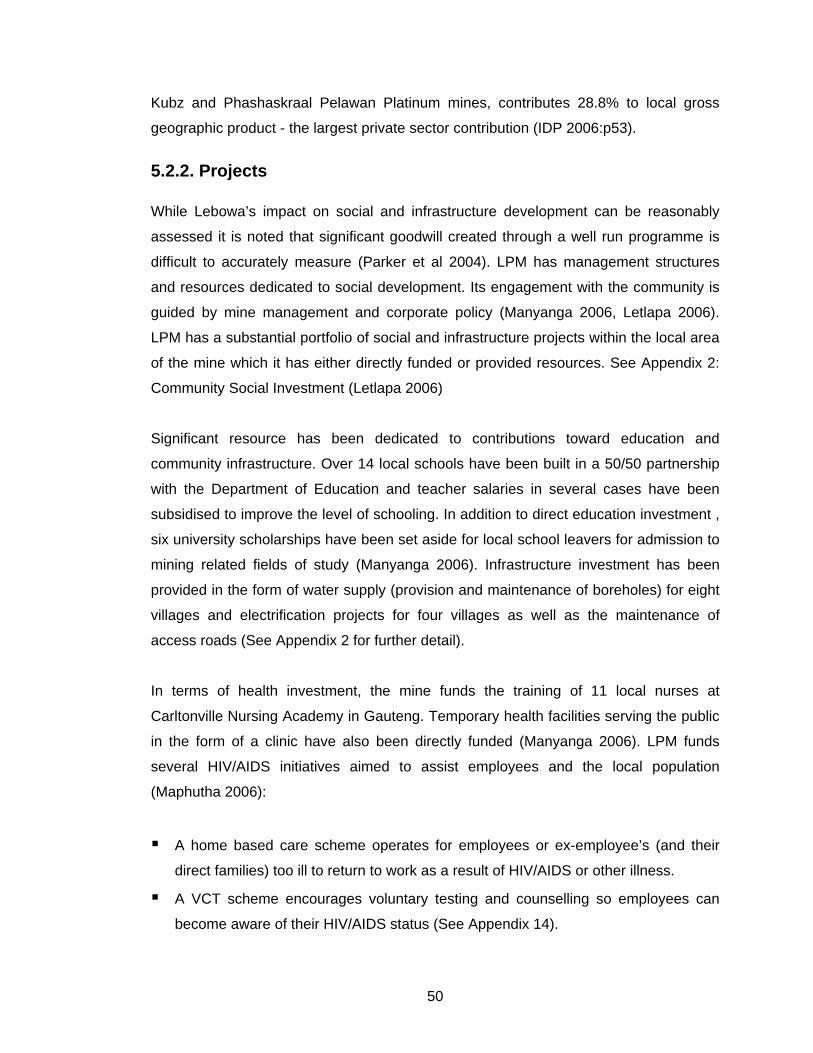
Kubz and Phashaskraal Pelawan Platinum mines, contributes 28.8% to local gross
geographic product - the largest private sector contribution (IDP 2006:p53).
5.2.2. Projects While Lebowa’s impact on social and infrastructure development can be reasonably
assessed it is noted that significant goodwill created through a well run programme is
difficult to accurately measure (Parker et al 2004). LPM has management structures
and resources dedicated to social development. Its engagement with the community is
guided by mine management and corporate policy (Manyanga 2006, Letlapa 2006).
LPM has a substantial portfolio of social and infrastructure projects within the local area
of the mine which it has either directly funded or provided resources. See Appendix 2:
Community Social Investment (Letlapa 2006)
Significant resource has been dedicated to contributions toward education and
community infrastructure. Over 14 local schools have been built in a 50/50 partnership
with the Department of Education and teacher salaries in several cases have been
subsidised to improve the level of schooling. In addition to direct education investment ,
six university scholarships have been set aside for local school leavers for admission to
mining related fields of study (Manyanga 2006). Infrastructure investment has been
provided in the form of water supply (provision and maintenance of boreholes) for eight
villages and electrification projects for four villages as well as the maintenance of
access roads (See Appendix 2 for further detail).
In terms of health investment, the mine funds the training of 11 local nurses at
Carltonville Nursing Academy in Gauteng. Temporary health facilities serving the public
in the form of a clinic have also been directly funded (Manyanga 2006). LPM funds
several HIV/AIDS initiatives aimed to assist employees and the local population
(Maphutha 2006):
A home based care scheme operates for employees or ex-employee’s (and their
direct families) too ill to return to work as a result of HIV/AIDS or other illness.
A VCT scheme encourages voluntary testing and counselling so employees can
become aware of their HIV/AIDS status (See Appendix 14).
50
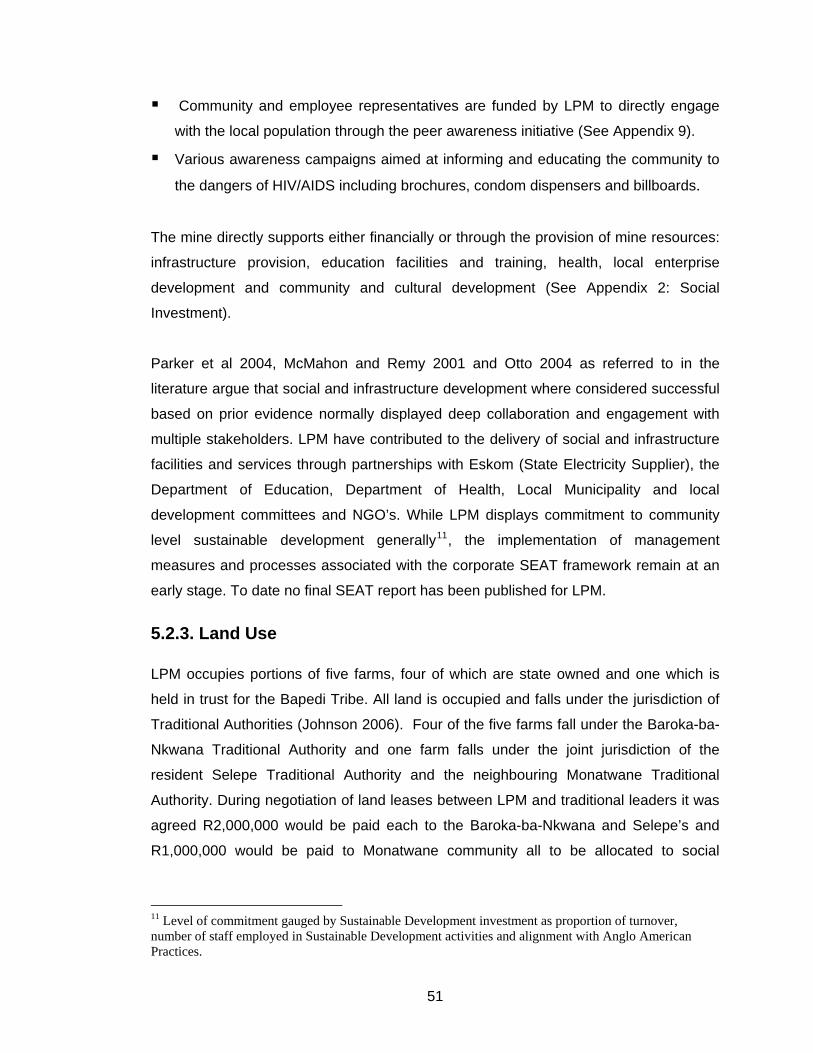
Community and employee representatives are funded by LPM to directly engage
with the local population through the peer awareness initiative (See Appendix 9).
Various awareness campaigns aimed at informing and educating the community to
the dangers of HIV/AIDS including brochures, condom dispensers and billboards.
The mine directly supports either financially or through the provision of mine resources:
infrastructure provision, education facilities and training, health, local enterprise
development and community and cultural development (See Appendix 2: Social
Investment).
Parker et al 2004, McMahon and Remy 2001 and Otto 2004 as referred to in the
literature argue that social and infrastructure development where considered successful
based on prior evidence normally displayed deep collaboration and engagement with
multiple stakeholders. LPM have contributed to the delivery of social and infrastructure
facilities and services through partnerships with Eskom (State Electricity Supplier), the
Department of Education, Department of Health, Local Municipality and local
development committees and NGO’s. While LPM displays commitment to community
level sustainable development generally11, the implementation of management
measures and processes associated with the corporate SEAT framework remain at an
early stage. To date no final SEAT report has been published for LPM.
5.2.3. Land Use LPM occupies portions of five farms, four of which are state owned and one which is
held in trust for the Bapedi Tribe. All land is occupied and falls under the jurisdiction of
Traditional Authorities (Johnson 2006). Four of the five farms fall under the Baroka-ba-
Nkwana Traditional Authority and one farm falls under the joint jurisdiction of the
resident Selepe Traditional Authority and the neighbouring Monatwane Traditional
Authority. During negotiation of land leases between LPM and traditional leaders it was
agreed R2,000,000 would be paid each to the Baroka-ba-Nkwana and Selepe’s and
R1,000,000 would be paid to Monatwane community all to be allocated to social
11 Level of commitment gauged by Sustainable Development investment as proportion of turnover, number of staff employed in Sustainable Development activities and alignment with Anglo American Practices.
51
upliftment projects (Johnson 2006). Prior to this compensation for land use is unclear.
Annual land rental payable under current agreement (Sept 2005 till Sept 2006):
Nkwana Community is R280,677.22
Selepe Community R27,693.29
Monatwane Community R27,693.29
In interviews with local traditional leadership (Ghoshi’s) several issues regarding land
use emerged. Due to a land ownership dispute between rival factions, beneficiaries of
land rent and compensation payments have not received payment. Payments relate to
R2,000,000 (for Baroka-ba-Nkwana & Selepe communities) and R1,000,000
(Monatwane community) for loss of use of farmland. LPM has abided by its obligations
and paid all monies into representative attorney’s escrow accounts. Legal procedure
has dictated that until the ownership issues are resolved, no compensation will be
available to the affected communities (Johnson 2006). The process to resolve this issue
has frustrated local residents to the degree where action against the mine has been
threatened (interview with Local Traditional Leadership August 2006). In addition to
compensation for land use, environmental concerns were raised by affected
communities due to dust pollution as a result of the recently enlarged slimes dam.
5.2.4. Community Engagement Current LPM management have adopted different methods used previously in
engagement with local communities. The current mine manager initiated individual
meetings with local community leaders in order to improve access to mine
management, facilitate greater transparency and help engender relations (Manyanga
2006). In addition selected local community leaders were invited to visit mine facilities to
witness first hand the underground operations. LPM mine management hired a
dedicated Communication Officer who produces a monthly newsletter aimed at creating
greater awareness of the mine in the community (Manyanga 2006). This was in
response to poor perceptions of the mine within the community especially amongst
young people (Manyanga 2006). Engagement with traditional leadership in the past was
through the Socio-Economic Development officer and now is directly through the Mine
Manager.
52
Conflicting priorities from different local communities have in the past undermined
community relations (Mahango: 2006). Current mine management have encouraged
the development of greater consensus and prioritisation of social needs through
chairing working sessions, providing mine facilities and food and transport to traditional
leaders (Mahango 2006, Letlapa 2006). The result has been a prioritised list of projects
with an increased level of stakeholder consensus (See Appendix 12). While these
events in themselves do not stand as evidence of improved community relations,
community leadership representatives who attended interviews and forums agreed
access to mine management had improved and they felt they were being heard. (See
Appendix 1 for list of community representatives).
5.2.5. Resettlement and Compensation LPM has a resettlement policy based on the guidelines of the World Bank, the South
African Chamber of Mines and the Safeguard Policies of the International Finance
Corporation. At present two projects at LPM have required the relocation of local
settlements: the expansion of the slimes dam and the Brakfontein shaft project. The
slimes dam required the relocation of 20 families, any family living adjacent to the newly
constructed slimes dame qualified (Pather 2006). A total of R846,063 was spent on
relocation to Mecklenberg township, some 20km away – on average R42,303 per
family. Once resettlement was complete, no further compensation payments were
made nor were any further resettlement demands received (Pather: 2006).
For the second project; the replacement of the Brakfontein shaft, resettlement and
compensation were approached differently - based on the experience of the slimes
dam. Currently relocation is required by LPM for all dwellings within 500m of the shaft
portals totalling 32 homes. Relocation however is being considered for homes within a
1,000m radius which would include up to 118 households (Pather 2006). Compensation
and details of the relocation are thus still to be decided.
53
5.2.6. Summary LPM’s contribution in social and infrastructure investment is vast when considering net
funds invested as well as resources assigned to community engagement and
sustainable development. Community engagement as referred to in the literature review
(Auty 1998 & Richards 2002) and especially in the case of LPM is pivotal in achieving
success in economic development. The high levels of poverty and low development
suggests low social capital by the community. By engaging in dialogue with key
stakeholders mine management has initiated deeper consensus in decision making.
Internalisation of parts of the welfare function (through its health and social investment
initiatives) as referred to by Auty (1998:p487) should deliver improved trust. Key to
generating social license and transparency will be in working with government as a
stakeholder to resolve the question of land ownership and compensation payments.
The following section examines the effect of employment.
54
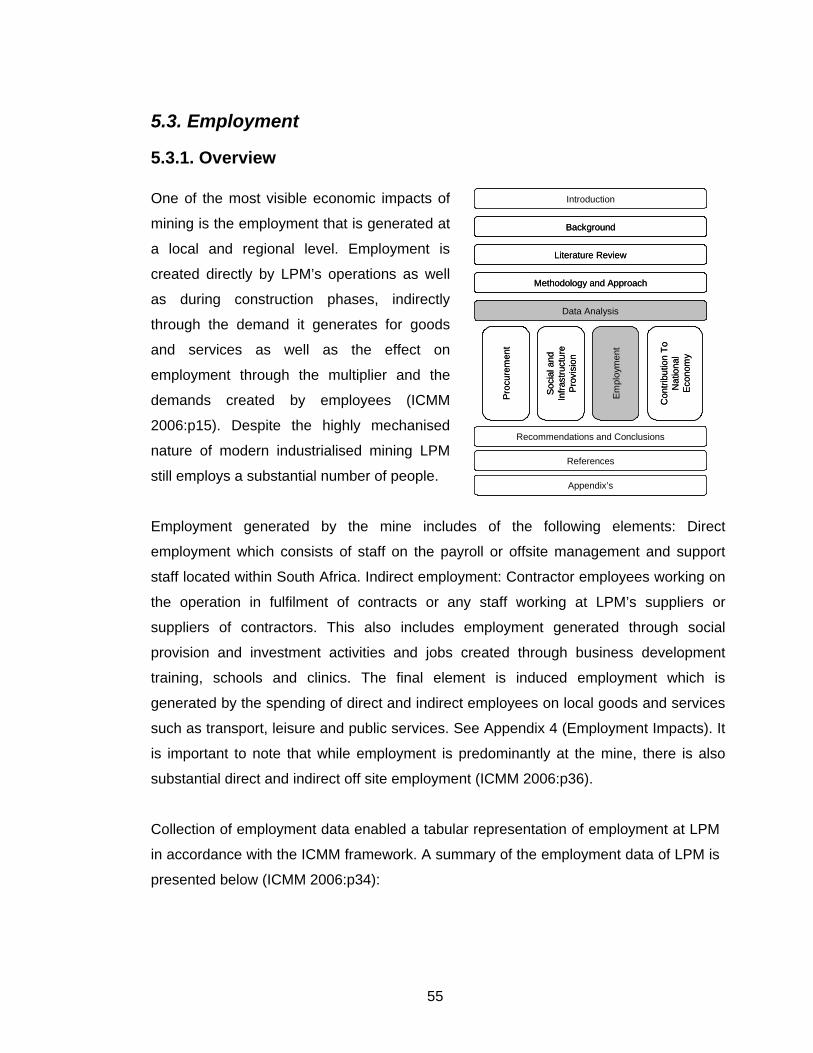
5.3. Employment
5.3.1. Overview One of the most visible economic impacts of
mining is the employment that is generated at
a local and regional level. Employment is
created directly by LPM’s operations as well
as during construction phases, indirectly
through the demand it generates for goods
and services as well as the effect on
employment through the multiplier and the
demands created by employees (ICMM
2006:p15). Despite the highly mechanised
nature of modern industrialised mining LPM
still employs a substantial number of people.
Background
Methodology and Approach
Literature Review
Data Analysis
Proc
urem
ent
Empl
oym
ent
Soci
al a
nd
Infra
stru
ctur
e Pr
ovis
ion
Recommendations and Conclusions
References
Appendix’s
Con
tribu
tion
To
Nat
iona
l Ec
onom
y
Introduction
Background
Methodology and Approach
Literature Review
Data Analysis
Proc
urem
ent
Empl
oym
ent
Soci
al a
nd
Infra
stru
ctur
e Pr
ovis
ion
Recommendations and Conclusions
References
Appendix’s
Con
tribu
tion
To
Nat
iona
l Ec
onom
y
Introduction
Employment generated by the mine includes of the following elements: Direct
employment which consists of staff on the payroll or offsite management and support
staff located within South Africa. Indirect employment: Contractor employees working on
the operation in fulfilment of contracts or any staff working at LPM’s suppliers or
suppliers of contractors. This also includes employment generated through social
provision and investment activities and jobs created through business development
training, schools and clinics. The final element is induced employment which is
generated by the spending of direct and indirect employees on local goods and services
such as transport, leisure and public services. See Appendix 4 (Employment Impacts). It
is important to note that while employment is predominantly at the mine, there is also
substantial direct and indirect off site employment (ICMM 2006:p36).
Collection of employment data enabled a tabular representation of employment at LPM
in accordance with the ICMM framework. A summary of the employment data of LPM is
presented below (ICMM 2006:p34):
55
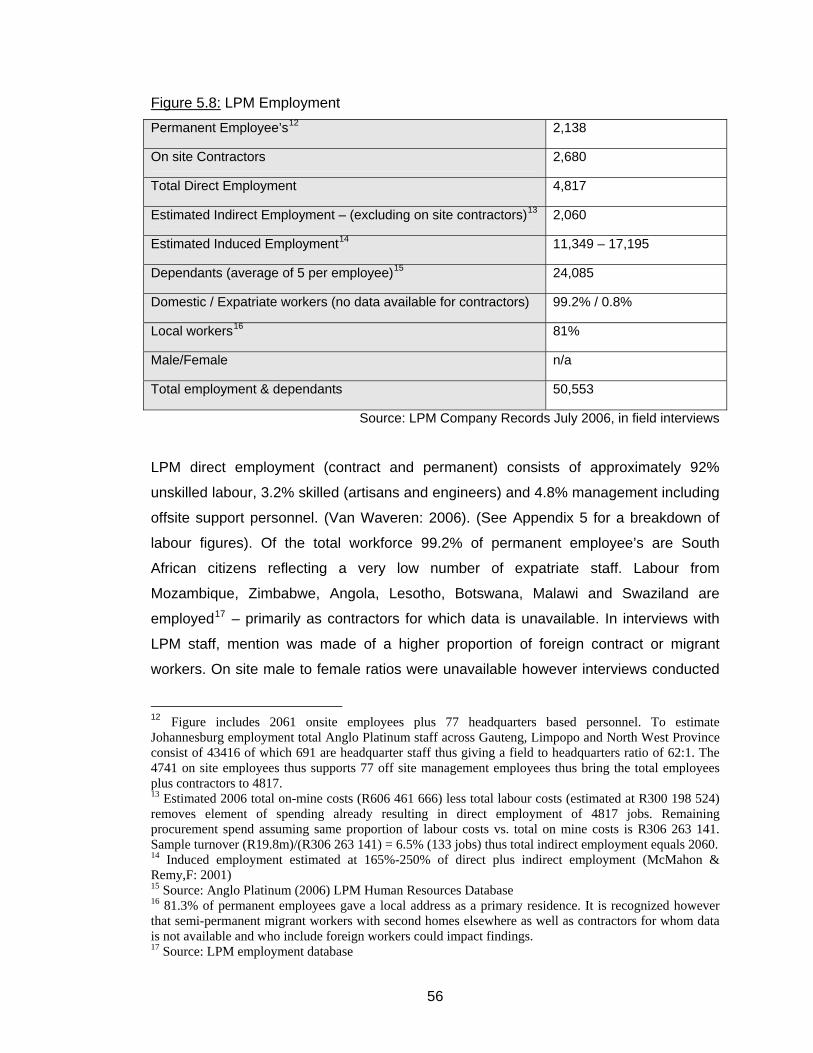
Figure 5.8: LPM Employment
Permanent Employee’s12 2,138
On site Contractors 2,680
Total Direct Employment 4,817
Estimated Indirect Employment – (excluding on site contractors)13 2,060
Estimated Induced Employment14 11,349 – 17,195
Dependants (average of 5 per employee)15 24,085
Domestic / Expatriate workers (no data available for contractors) 99.2% / 0.8%
Local workers16 81%
Male/Female n/a
Total employment & dependants 50,553
Source: LPM Company Records July 2006, in field interviews
LPM direct employment (contract and permanent) consists of approximately 92%
unskilled labour, 3.2% skilled (artisans and engineers) and 4.8% management including
offsite support personnel. (Van Waveren: 2006). (See Appendix 5 for a breakdown of
labour figures). Of the total workforce 99.2% of permanent employee’s are South
African citizens reflecting a very low number of expatriate staff. Labour from
Mozambique, Zimbabwe, Angola, Lesotho, Botswana, Malawi and Swaziland are
employed17 – primarily as contractors for which data is unavailable. In interviews with
LPM staff, mention was made of a higher proportion of foreign contract or migrant
workers. On site male to female ratios were unavailable however interviews conducted
12 Figure includes 2061 onsite employees plus 77 headquarters based personnel. To estimate Johannesburg employment total Anglo Platinum staff across Gauteng, Limpopo and North West Province consist of 43416 of which 691 are headquarter staff thus giving a field to headquarters ratio of 62:1. The 4741 on site employees thus supports 77 off site management employees thus bring the total employees plus contractors to 4817. 13 Estimated 2006 total on-mine costs (R606 461 666) less total labour costs (estimated at R300 198 524) removes element of spending already resulting in direct employment of 4817 jobs. Remaining procurement spend assuming same proportion of labour costs vs. total on mine costs is R306 263 141. Sample turnover (R19.8m)/(R306 263 141) = 6.5% (133 jobs) thus total indirect employment equals 2060. 14 Induced employment estimated at 165%-250% of direct plus indirect employment (McMahon & Remy,F: 2001) 15 Source: Anglo Platinum (2006) LPM Human Resources Database 16 81.3% of permanent employees gave a local address as a primary residence. It is recognized however that semi-permanent migrant workers with second homes elsewhere as well as contractors for whom data is not available and who include foreign workers could impact findings. 17 Source: LPM employment database
56
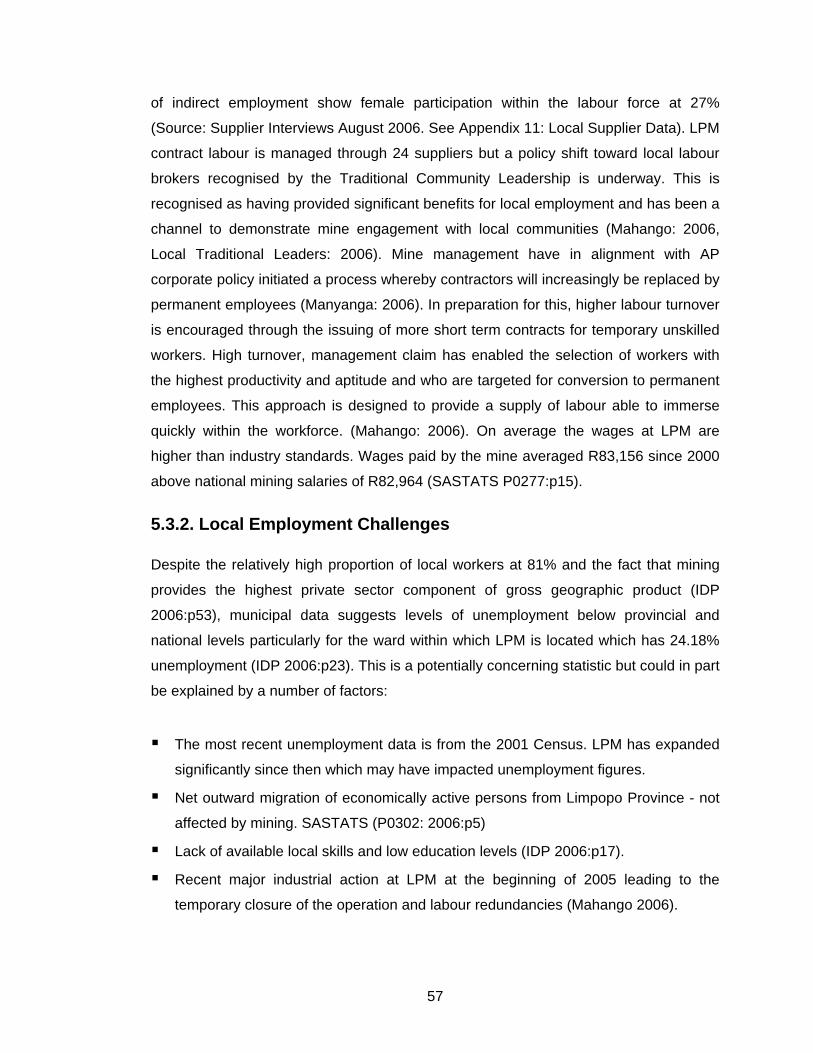
of indirect employment show female participation within the labour force at 27%
(Source: Supplier Interviews August 2006. See Appendix 11: Local Supplier Data). LPM
contract labour is managed through 24 suppliers but a policy shift toward local labour
brokers recognised by the Traditional Community Leadership is underway. This is
recognised as having provided significant benefits for local employment and has been a
channel to demonstrate mine engagement with local communities (Mahango: 2006,
Local Traditional Leaders: 2006). Mine management have in alignment with AP
corporate policy initiated a process whereby contractors will increasingly be replaced by
permanent employees (Manyanga: 2006). In preparation for this, higher labour turnover
is encouraged through the issuing of more short term contracts for temporary unskilled
workers. High turnover, management claim has enabled the selection of workers with
the highest productivity and aptitude and who are targeted for conversion to permanent
employees. This approach is designed to provide a supply of labour able to immerse
quickly within the workforce. (Mahango: 2006). On average the wages at LPM are
higher than industry standards. Wages paid by the mine averaged R83,156 since 2000
above national mining salaries of R82,964 (SASTATS P0277:p15).
5.3.2. Local Employment Challenges Despite the relatively high proportion of local workers at 81% and the fact that mining
provides the highest private sector component of gross geographic product (IDP
2006:p53), municipal data suggests levels of unemployment below provincial and
national levels particularly for the ward within which LPM is located which has 24.18%
unemployment (IDP 2006:p23). This is a potentially concerning statistic but could in part
be explained by a number of factors:
The most recent unemployment data is from the 2001 Census. LPM has expanded
significantly since then which may have impacted unemployment figures.
Net outward migration of economically active persons from Limpopo Province - not
affected by mining. SASTATS (P0302: 2006:p5)
Lack of available local skills and low education levels (IDP 2006:p17).
Recent major industrial action at LPM at the beginning of 2005 leading to the
temporary closure of the operation and labour redundancies (Mahango 2006).
57
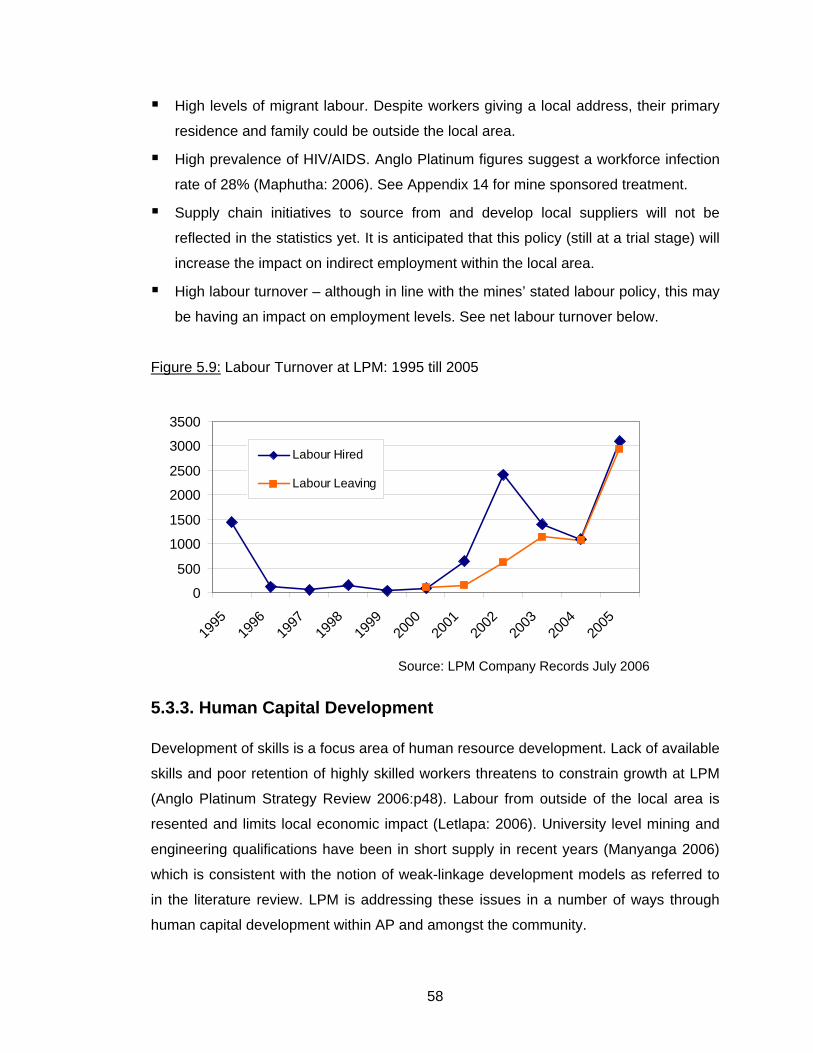
High levels of migrant labour. Despite workers giving a local address, their primary
residence and family could be outside the local area.
High prevalence of HIV/AIDS. Anglo Platinum figures suggest a workforce infection
rate of 28% (Maphutha: 2006). See Appendix 14 for mine sponsored treatment.
Supply chain initiatives to source from and develop local sup pliers will not be
mines’ stated labour policy, this may
reflected in the statistics yet. It is anticipated that this policy (still at a trial stage) will
increase the impact on indirect employment within the local area.
High labour turnover – although in line with the
be having an impact on employment levels. See net labour turnover below.
Figure 5.9: Labour Turnover at LPM: 1995 till 2005
Labour Turnover at LPM
500
1000
1500
2000
2500
3000
3500
0
1995
1996
1997
1998
1999
2000
2001
2002
2003
2004
2005
Labour Hired
Labour Leaving
Source: LPM Company Records July 2006
s as referred to
ure review. LPM is addressing these issues in a number of ways through
5.3.3. Human Capital Development Development of skills is a focus area of human resource development. Lack of available
skills and poor retention of highly skilled workers threatens to constrain growth at LPM
(Anglo Platinum Strategy Review 2006:p48). Labour from outside of the local area is
resented and limits local economic impact (Letlapa: 2006). University level mining and
engineering qualifications have been in short supply in recent years (Manyanga 2006)
which is consistent with the notion of weak-linkage development model
in the literat
human capital development within AP and amongst the community.
58
LPM has launched a scholarship programme whereby local school children are
specifically targeted through the offer of six dedicated University scholarships per year
(Manyanga: 2006). LPM will fund school leavers with the aim of improving local skilled
labour supply. To date, no local school children have obtained entry level grades to
university and no scholarships have been awarded. In an effort to address this,
management are planning publicity events within the community to break the perception
of mining as a low skilled profession amongst school children. Skills development is a
priority for compliance with the Mining Charter. Within the labour force there are a
number of corporate wide initiatives such as the ABET (Adult Basic Education and
Training) programme which aims to enable all eligible employees to have a basic
literacy level. Various peer education and mentorship initiatives are underway within the
ine particularly in regard to development of previously disadvantaged employees
tside of LPM
providing graduates with a marketable skill. 22 Students annually graduate from this
employees are responsible for conducting training.
m
(HDSA’s) in line with corporate objectives.
In addition to skills development the retention of highly skilled workers is posing a
problem. Reasons given on exit interviews are lack of amenities and remote nature of
the mine with limited housing opportunities (Mahango: 2006). LPM human resources
point out that the difficulty in retention impacts promotion of appropriately skilled
workers. An attempt to improve retention of skilled labour is currently underway. One
approach has been to provide transport for approximately 120 employee’s daily from
Polokwane (80km away). In 2001 a practical training school was opened at LPM and
employees were offered the opportunity to obtain rock blasting certificates. Courses are
delivered in a practical environment and the certification is recognized ou
facility and 3 full time
5.3.4. Summary Employment offers LPM many challenges in trying to attract and retain skilled personnel
as well as developing a pipeline of future labour supply. The employment policy aimed
at increasing the proportion of permanent and local workers with a greater relationship
with local labour brokers will take time to produce results. The impact of indirect
employment cannot be under estimated – the sample of local suppliers referred to in
procurement includes 133 employees who derive their jobs indirectly from the mine.
Total employment (direct, indirect & induced) is estimated at between 18227 and 24073
59

full time equivalent jobs. This is significant within the low income community where the
mine is located. Deeper analysis regarding total employment impacts and drivers is
required. Implementation of AA’s SEAT framework may improve understanding of
employment in the local community. The following section presents evidence gathered
of the contribution to national revenue.
60
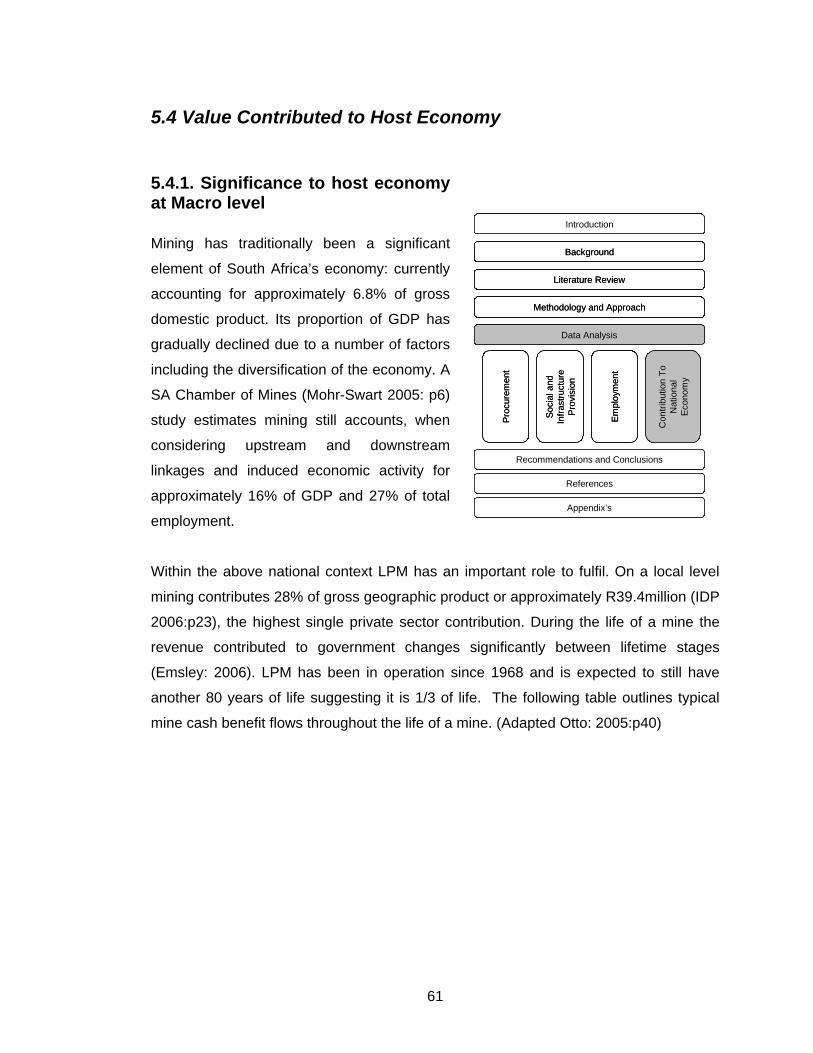
5.4 Value Contributed to Host Economy
5.4.1. Significance to host economy at Macro level
Background
Methodology and Approach
Literature Review
Data Analysis
Pro
cure
men
t
Empl
oym
ent
Soci
al a
nd
Infra
stru
ctur
e Pr
ovis
ion
Recommendations and Conclusions
References
Appendix’s
Con
tribu
tion
To
Nat
iona
l Ec
onom
y
Introduction
Background
Methodology and Approach
Literature Review
Data Analysis
Pro
cure
men
t
Empl
oym
ent
Soci
al a
nd
Infra
stru
ctur
e Pr
ovis
ion
Recommendations and Conclusions
References
Appendix’s
Con
tribu
tion
To
Nat
iona
l Ec
onom
y
Introduction
Mining has traditionally been a significant
element of South Africa’s economy: currently
accounting for approximately 6.8% of gross
domestic product. Its proportion of GDP has
gradually declined due to a number of factors
including the diversification of the economy. A
SA Chamber of Mines (Mohr-Swart 2005: p6)
study estimates mining still accounts, when
considering upstream and downstream
linkages and induced economic activity for
approximately 16% of GDP and 27% of total
employment.
Within the above national context LPM has an important role to fulfil. On a local level
mining contributes 28% of gross geographic product or approximately R39.4million (IDP
2006:p23), the highest single private sector contribution. During the life of a mine the
revenue contributed to government changes significantly between lifetime stages
(Emsley: 2006). LPM has been in operation since 1968 and is expected to still have
another 80 years of life suggesting it is 1/3 of life. The following table outlines typical
mine cash benefit flows throughout the life of a mine. (Adapted Otto: 2005:p40)
61
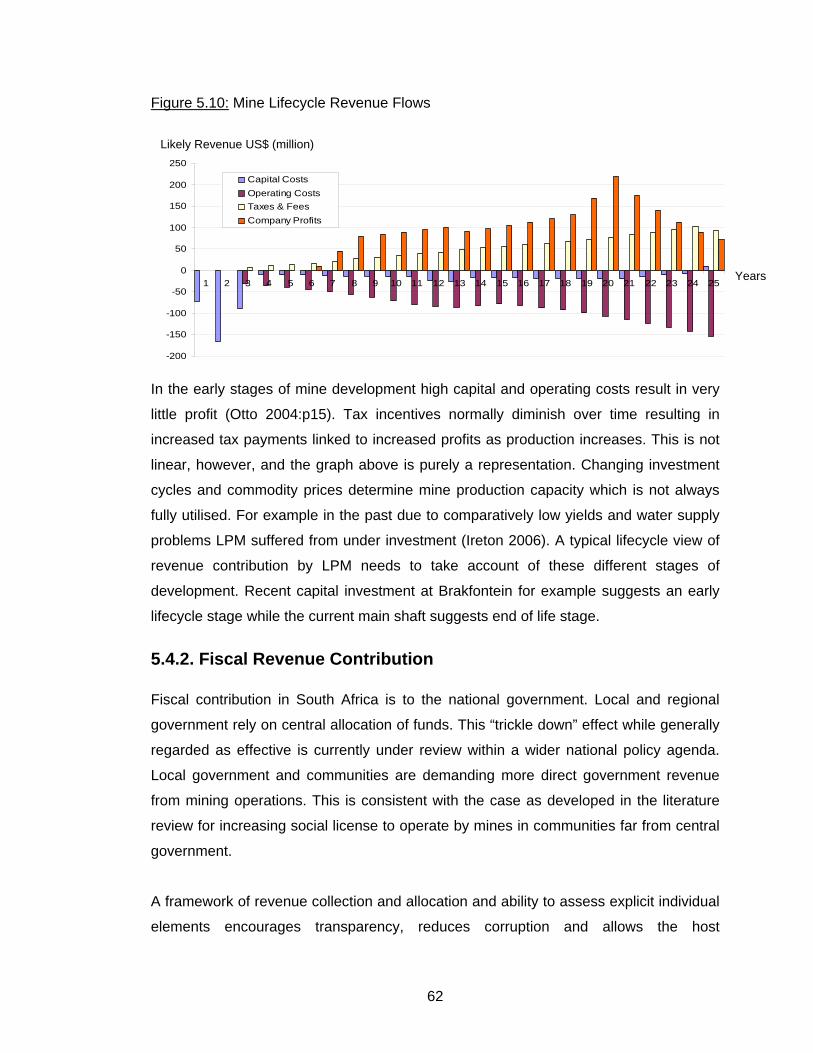
Figure 5.10: Mine Lifecycle Revenue Flows
-200
-150
-100
-50
0
50
100
150
200
250
1 2 3 4 5 6 7 8 9 10 11 12 13 14 15 16 17 18 19 20 21 22 23 24 25
Capital CostsOperating CostsTaxes & FeesCompany Profits
Mine Lifecycle Revenue FlowsLikely Revenue US$ (million)
Years
In the early stages of mine development high capital and operating costs result in very
little profit (Otto 2004:p15). Tax incentives normally diminish over time resulting in
increased tax payments linked to increased profits as production increases. This is not
linear, however, and the graph above is purely a representation. Changing investment
cycles and commodity prices determine mine production capacity which is not always
fully utilised. For example in the past due to comparatively low yields and water supply
problems LPM suffered from under investment (Ireton 2006). A typical lifecycle view of
revenue contribution by LPM needs to take account of these different stages of
development. Recent capital investment at Brakfontein for example suggests an early
lifecycle stage while the current main shaft suggests end of life stage.
5.4.2. Fiscal Revenue Contribution Fiscal contribution in South Africa is to the national government. Local and regional
government rely on central allocation of funds. This “trickle down” effect while generally
regarded as effective is currently under review within a wider national policy agenda.
Local government and communities are demanding more direct government revenue
from mining operations. This is consistent with the case as developed in the literature
review for increasing social license to operate by mines in communities far from central
government.
A framework of revenue collection and allocation and ability to assess explicit individual
elements encourages transparency, reduces corruption and allows the host
62
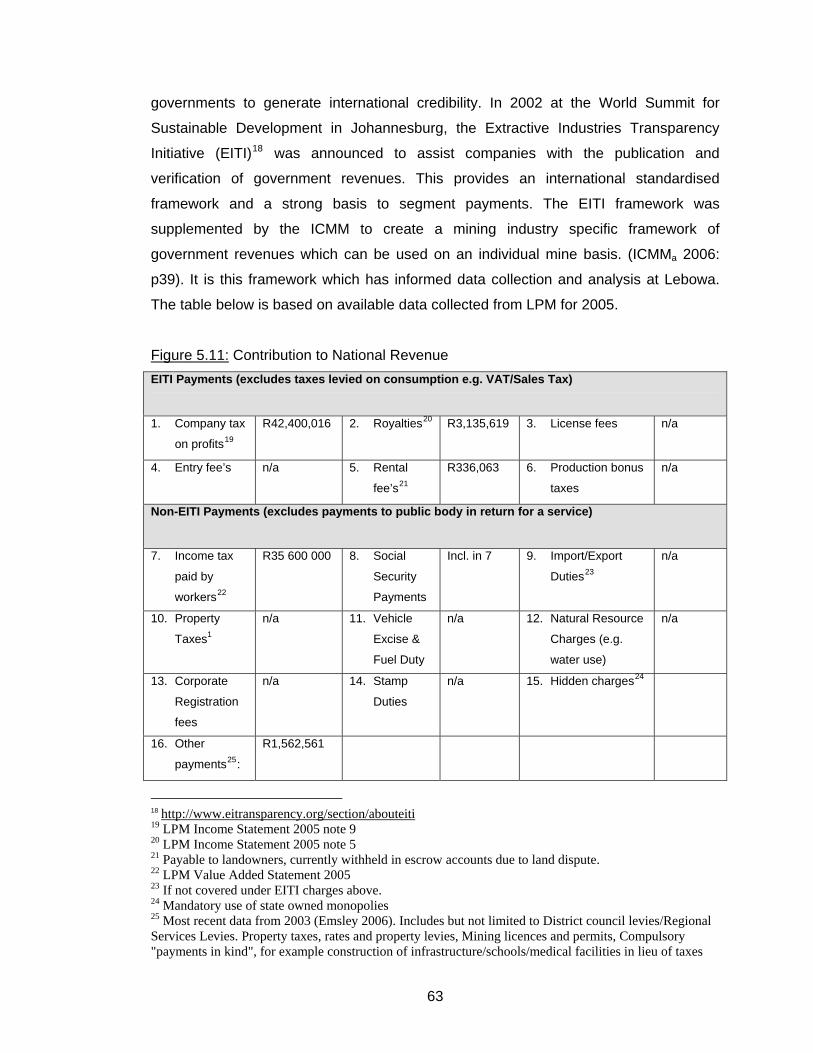
governments to generate international credibility. In 2002 at the World Summit for
Sustainable Development in Johannesburg, the Extractive Industries Transparency
Initiative (EITI)18 was announced to assist companies with the publication and
verification of government revenues. This provides an international standardised
framework and a strong basis to segment payments. The EITI framework was
supplemented by the ICMM to create a mining industry specific framework of
government revenues which can be used on an individual mine basis. (ICMMa 2006:
p39). It is this framework which has informed data collection and analysis at Lebowa.
The table below is based on available data collected from LPM for 2005.
Figure 5.11: Contribution to National Revenue EITI Payments (excludes taxes levied on consumption e.g. VAT/Sales Tax)
1. Company tax
on profits19
R42,400,016
2. Royalties20 R3,135,619 3. License fees n/a
4. Entry fee’s n/a 5. Rental
fee’s21
R336,063 6. Production bonus
taxes
n/a
Non-EITI Payments (excludes payments to public body in return for a service)
7. Income tax
paid by
workers22
R35 600 000 8. Social
Security
Payments
Incl. in 7 9. Import/Export
Duties23
n/a
10. Property
Taxes1
n/a 11. Vehicle
Excise &
Fuel Duty
n/a 12. Natural Resource
Charges (e.g.
water use)
n/a
13. Corporate
Registration
fees
n/a 14. Stamp
Duties
n/a 15. Hidden charges24
16. Other
payments25:
R1,562,561
18 http://www.eitransparency.org/section/abouteiti 19 LPM Income Statement 2005 note 9 20 LPM Income Statement 2005 note 5 21 Payable to landowners, currently withheld in escrow accounts due to land dispute. 22 LPM Value Added Statement 2005 23 If not covered under EITI charges above. 24 Mandatory use of state owned monopolies 25 Most recent data from 2003 (Emsley 2006). Includes but not limited to District council levies/Regional Services Levies. Property taxes, rates and property levies, Mining licences and permits, Compulsory "payments in kind", for example construction of infrastructure/schools/medical facilities in lieu of taxes
63
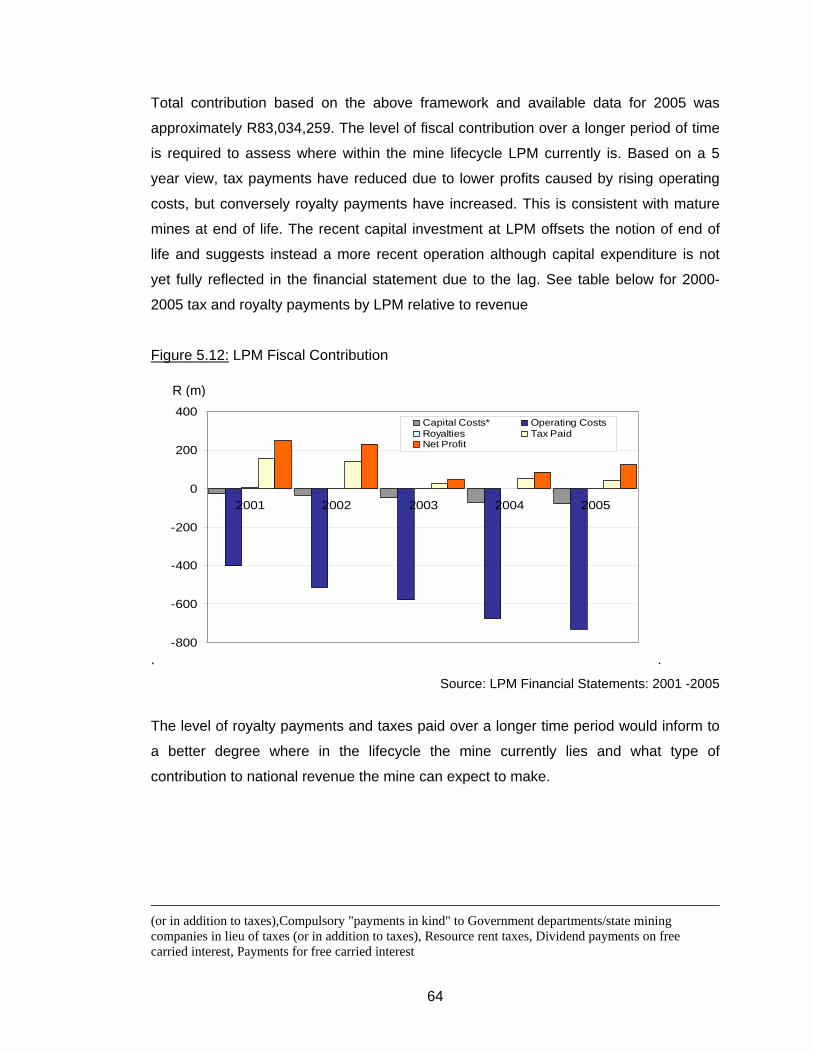
Total contribution based on the above framework and available data for 2005 was
approximately R83,034,259. The level of fiscal contribution over a longer period of time
is required to assess where within the mine lifecycle LPM currently is. Based on a 5
year view, tax payments have reduced due to lower profits caused by rising operating
costs, but conversely royalty payments have increased. This is consistent with mature
mines at end of life. The recent capital investment at LPM offsets the notion of end of
life and suggests instead a more recent operation although capital expenditure is not
yet fully reflected in the financial statement due to the lag. See table below for 2000-
2005 tax and royalty payments by LPM relative to revenue
Figure 5.12: LPM Fiscal Contribution
.-800
-600
-400
-200
0
200
400
2001 2002 2003 2004 2005
Capital Costs* Operating CostsRoyalties Tax PaidNet Profit
.
R (m)
Source: LPM Financial Statements: 2001 -2005
The level of royalty payments and taxes paid over a longer time period would inform to
a better degree where in the lifecycle the mine currently lies and what type of
contribution to national revenue the mine can expect to make.
(or in addition to taxes),Compulsory "payments in kind" to Government departments/state mining companies in lieu of taxes (or in addition to taxes), Resource rent taxes, Dividend payments on free carried interest, Payments for free carried interest
64
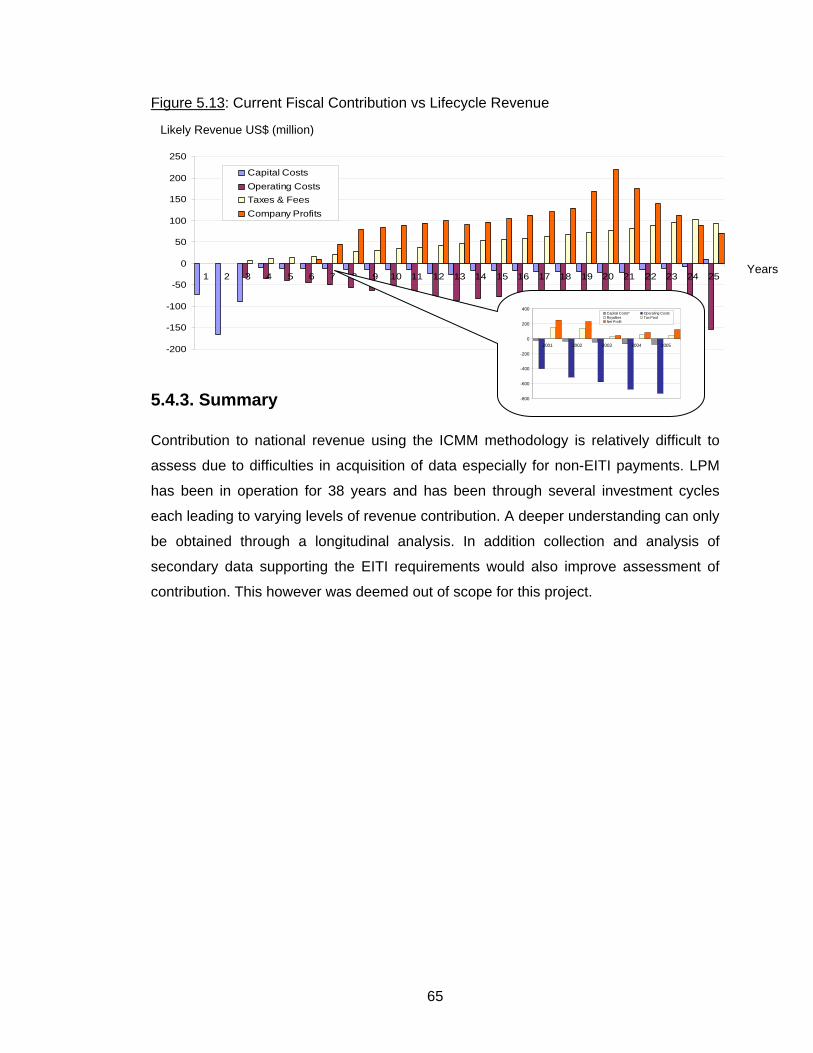
Figure 5.13: Current Fiscal Contribution vs Lifecycle Revenue
-200
-150
-100
-50
0
50
100
150
200
250
1 2 3 4 5 6 7 8 9 10 11 12 13 14 15 16 17 18 19 20 21 22 23 24 25
Capital CostsOperating CostsTaxes & FeesCompany Profits
Likely Revenue US$ (million)
Years
-800
-600
-400
-200
0
200
400
2001 2002 2003 2004 2005
Capital Costs* Operating CostsRoyalties Tax PaidNet Profit
5.4.3. Summary Contribution to national revenue using the ICMM methodology is relatively difficult to
assess due to difficulties in acquisition of data especially for non-EITI payments. LPM
has been in operation for 38 years and has been through several investment cycles
each leading to varying levels of revenue contribution. A deeper understanding can only
be obtained through a longitudinal analysis. In addition collection and analysis of
secondary data supporting the EITI requirements would also improve assessment of
contribution. This however was deemed out of scope for this project.
65
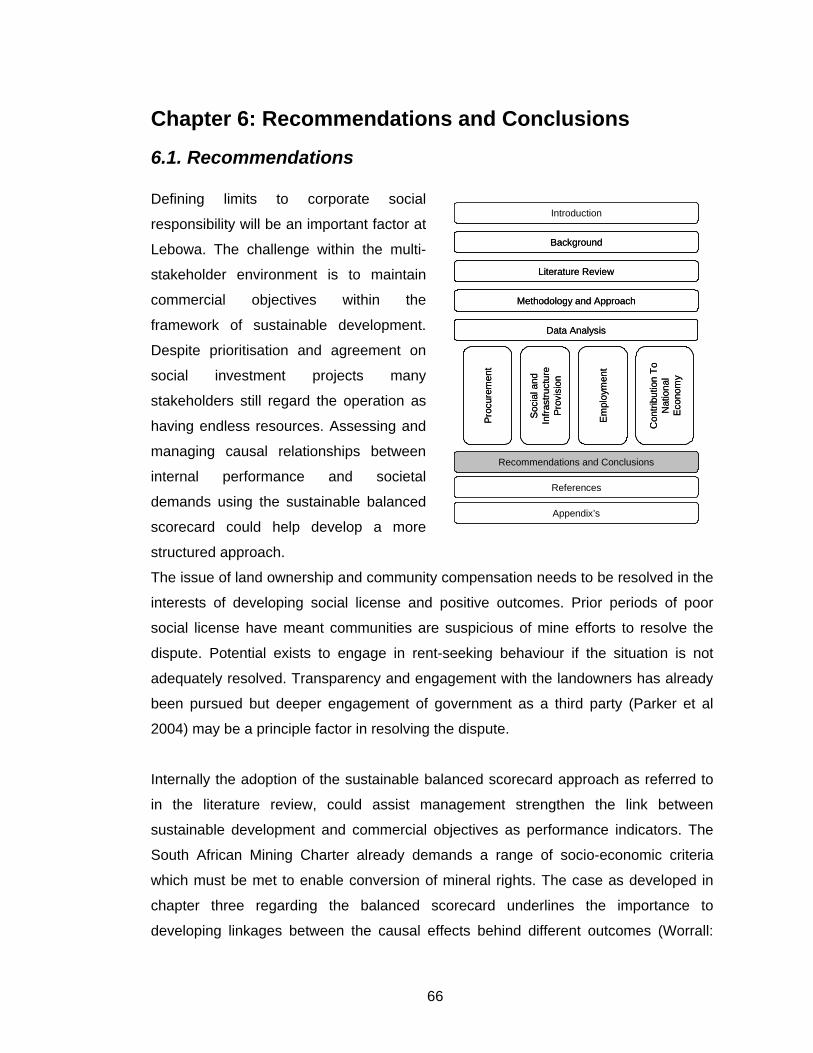
Chapter 6: Recommendations and Conclusions
6.1. Recommendations Defining limits to corporate social
responsibility will be an important factor at
Lebowa. The challenge within the multi-
stakeholder environment is to maintain
commercial objectives within the
framework of sustainable development.
Despite prioritisation and agreement on
social investment projects many
stakeholders still regard the operation as
having endless resources. Assessing and
managing causal relationships between
internal performance and societal
demands using the sustainable balanced
scorecard could help develop a more
structured approach.
Background
Methodology and Approach
Literature Review
Data Analysis
Proc
urem
ent
Em
ploy
men
t
Soc
ial a
nd
Infra
stru
ctur
e Pr
ovis
ion
Recommendations and Conclusions
References
Appendix’s
Con
tribu
tion
To
Nat
iona
l Ec
onom
y
Introduction
Background
Methodology and Approach
Literature Review
Data Analysis
Proc
urem
ent
Em
ploy
men
t
Soc
ial a
nd
Infra
stru
ctur
e Pr
ovis
ion
Recommendations and Conclusions
References
Appendix’s
Con
tribu
tion
To
Nat
iona
l Ec
onom
y
Introduction
The issue of land ownership and community compensation needs to be resolved in the
interests of developing social license and positive outcomes. Prior periods of poor
social license have meant communities are suspicious of mine efforts to resolve the
dispute. Potential exists to engage in rent-seeking behaviour if the situation is not
adequately resolved. Transparency and engagement with the landowners has already
been pursued but deeper engagement of government as a third party (Parker et al
2004) may be a principle factor in resolving the dispute.
Internally the adoption of the sustainable balanced scorecard approach as referred to
in the literature review, could assist management strengthen the link between
sustainable development and commercial objectives as performance indicators. The
South African Mining Charter already demands a range of socio-economic criteria
which must be met to enable conversion of mineral rights. The case as developed in
chapter three regarding the balanced scorecard underlines the importance to
developing linkages between the causal effects behind different outcomes (Worrall:
66
2005). This will enable economic sustainable development and commercial
performance through appropriate allocation of resources across the operation. Human
capital development (internal perspective) through training could potentially be further
improved by integrating the scholarship development programme (additional weekend
maths and science classes) with the mining school/training centre. This will improve
scalability and deliver productivity improvements for LPM and also allow greater
participation by regular illiterate miners while not impacting work schedules e.g.
Saturday classes. This approach also has scope to utilise existing trainers who could
benefit from training to deliver more types of skills, not only mining related courses.
Subsidised transport may provide relief in the short term but LPM needs to evaluate
more structured retention incentives for highly skilled workers. This could include
structured remuneration packages, bonus payments, improved lifestyle facilities and
rotation based schemes with other AP mines. Such incentives structured appropriately,
deliver to the societal perspective and internal perspective of the sustainable balanced
scorecard and corporate financial perspective through improved production.
Improved awareness of mining operations within the local community is required. Steps
by current management to take traditional leadership onsite and expose operations
generated positive feedback from communities and may improve transparency of the
operation26 and impact perceptions among school goers (societal perspective).
Government engagement (National and Local) has been proactive on the part of mine
management and despite being in a formative stage has yielded generally positive
outcomes. According to recent research (Parker et al 2004, McMahon and Remy 2001
& Otto 2002) these relationships drastically amplify the effectiveness of corporate
efforts. Engagement with all levels of government must be encouraged and formalized
where appropriate rather than on an adhoc basis. Consistent with the balanced
scorecard this will enable the establishment of cause and effect indicators and strategic
feedback (Kaplan and Norton 1999: p270) allowing continuous improvement.
Efforts to stimulate local supply chain may benefit from improved engagement by LPM
with previously advantaged suppliers. As the case was built in the literature
governments increasingly intervene to make sustainable development financially viable
26 Interview with Traditional Leadership of Phasha, Selepe and Monatwane Communities 08 August 2006
67
through policy intervention (Picket-Baker 2004:p2). Such policy stances by LPM could
be investigated for procurement where partnerships are rewarded and the loss of
valuable skills avoided.
6.2. Review of Research Question Evidence considered above suggests contributions to economic development in all four
areas particularly procurement and social and infrastructure provision. Importantly LPM
is beginning to build social license through community engagement and this over time
will be increasingly relevant in developing economic impact and creating sustainable
development. The evidence considered only provides a brief overview of the economic
impacts and on several portions of the research, as highlighted the data is inconclusive.
6.3. Economic Impact and Sustainability A case is made in the literature review for community engagement, social license and
linkages as drivers of economic sustainable development. Available data suggested
evidence of this existed but this remains inconclusive. Particular mention needs to be
made of the social license being created during the community engagement and project
prioritisation process followed by mine management for social investment. This
represents a step change from prior sustainable development efforts.
The literature review on linkages and partnerships and available primary evidence
collected to assess the impact of procurement suggests much progress is being made
in this area. Sampling error (use of convenience sample) constrains the evidence
slightly in regard to local procurement but the extent to which linkages are being
developed represent partnership with local municipality, businesses and government on
an increasing scale. Mine procurement policy although only at a trial stage at Lebowa
suggests a focused approach to improving the economic impact of procurement for
local communities.
Employment by LPM delivers significant economic impact despite high turnover and
issues in attracting skilled labour. Community engagement, the shift to local labour
brokers and university scholarships for local children may increase the impact of
68
employment on the local community over time. Human capital development at LPM can
offer significant benefits within the community of Fetakgomo.
6.4. Implications for Corporate Strategy
Anglo American’s sustainable development strategy described by Chairman Mark
Moody-Stewart is focused around “changing the way we do business through making
sustainable development an intuitive and conscious part of every business decision”.
Management process and behaviour across the organisation needs to include
economic, social and environmental considerations, which (Worrall 2005:p59) argues
requires a focused and proactive approach. Anglo American’s sustainable development
strategy is controlled by a central unit which is responsible for strategy formulation,
implementation and monitoring. Reporting against sustainable development objectives
takes place regularly and reports are publicly available. Anglo American is a signatory
on a variety of codes of conduct but acknowledges that sustainable development is an
ongoing process and encourages continuous improvement.
Lebowa Platinum Mine while comprising a very small element of Anglo American’s
global operations offers a number of important outcomes in regards to Anglo’s SD
strategy implementation in South Africa. Preliminary evidence collected on
procurement, employment, social and infrastructure provision and fiscal contribution
points to improving economic impact. The approach through which this has been
achieved suggests success in adoption of a holistic SD approach. Important within the
context of Lebowa is the role played by community engagement and social license
where stakeholders have increasingly had opportunities to participate in decision
making. This approach runs in contrast to recent media surrounding alleged community
marginalization by AP at other operations (Spoor 2006). Negative outcomes have the
potential to disrupt operations and isolate stakeholders.
Delivering sustainable economic development through improved stakeholder
engagement will in addition be important in achieving compliance with the South African
Mining Charter to enable conversion to new order mineral rights. Corporate strategy will
be designed to achieve compliance and thus sustainable development’s role will
become increasingly significant as a competitive advantage.
69
6.5. Limitations and Future Research
To fully reflect the contribution of Lebowa mine to sustainable economic development
requires dedicated research with the collection of high quality primary data over a
predetermined time frame. In practice this was difficult to achieve within the available
time and scope of the project despite Anglo Platinum’s strong support. Issues were
revealed in the data collection and analysis stages of the project despite the robust
sampling methodology of the ICMM framework and being granted access to most
stakeholders. On several occasions sufficient data was not available. Fiscal contribution
for example is very difficult to meaningfully assess over a period of only 5 years when
the mine has been operational for nearly 40 years. In addition access to faith based
leadership was not possible and improved sampling of labour representatives could
have produced different insights.
Theoretical models described in the literature provide robust frameworks for analysis
and broad scope. The analysis and development of causal relationships is complex,
among multi-stakeholders and requires vast amounts of data. The sample size used for
local suppliers could be improved to better represent the supply chain, but this data is
also important for employment, social investment and fiscal contribution and it is
interrelated. Sampling cannot focus on separate areas but needs to take a holistic
approach.
Key to drawing conclusions is contextual knowledge and this was difficult to acquire in a
short period of time. Aspects of qualitative data gathering were challenging since the
context of the mine needed to be well understood before attempting to document social
and community data. This is difficult to address through prior secondary research alone.
Importantly too is that the remote nature of the operation made data collection and
follow-up challenging at times. Future research would benefit from better understanding
of causal inter-relationships, making a wider collection of primary data and improving
sampling sizes. A focus on developing contextual knowledge should be made prior to
analysis and this would invariably involve extended field research.
70
6.6. Conclusion
The case is built early in the document for the possibility of adopting the Sustainability
Balanced Scorecard (SBSC) as a framework of choice in the management of
sustainable development at LPM. SD frameworks such as the ICMM’s Resource
Endowment Toolkit provide robust assessment methodology but critically are not
intended for the inclusion of variables designed to maintain commercial viability. The
SBSC will deliver improved management clarity regarding cause and effect
relationships surrounding SD while assisting internal company commercial
prerogatives. The SBSC allows a clearer understanding of the development of social
license to operate which would represent lower input costs and increased profits while
uplifting the local community. The six perspectives of the SBSC are inter-related and all
require management. Achievement of the strategy for local economic development
involves many actors working in synergy and traditional SD frameworks need to include
commercial elements to ensure the process itself is both holistic and sustainable.
.
71
References
1. Anglo Americana (2005) Report to Society 2005: Anglo American A climate of
Change. Pgs 1-62.
2. Anglo American (2006) Presentation on Anglo American’s Sustainable Development
Performance 2005/6. 05 June 2006. Pgs 1 – 46.
3. Anglo Platinum Ltd (2001, 2002, 2003, 2004, 2005) Annual Report and Sustainable
Development Report
4. Anglo Platinum Ltd (2006) Group Policy Supply Chain: Historically Disadvantaged
South African (HDSA) Preferred Procurement Policy. Version 1.3 – DRAFT
5. Anglo Platinum Ltd (2004) Business Development Support Training: Black
Economic Empowerment Presented at Mokopane: 30 March 2004
6. Atiyah, M and Press, F (Online) February 1992, The Royal Society and the US
Nationals Academy of Sciences on Population Growth, Resource Consumption and
a Sustainable World, RS and NAS Joint Statement, Available at:
http://dieoff.org/page7.htm (Accessed 16 November 2006)
7. Auty, Richard M. (1993). Sustaining Development in Mineral Economies: The
Resource Curse Thesis. London: Routledge
8. Auty, Richard M (1998) Social Sustainability in Mineral Driven Development. Journal
of International Development. Vol 10, pgs.487 – 500.
9. Auty, Richard M Ed (2003) Resource Abundance and Economic Development.
Journal of International Development. Vol. 15, Issue 5. Oxford University Press.
10. Ayres, R; Jeroen C; Van den Bergh, J & Tinbergen Institute. (1998) Viewpoint:
Weak versus Strong Sustainability. Tinbergen Institute, Rotterdam, 1998.
72
11. Bansal, P (2005) Evolving Sustainability: A Longitudinal Study of Corporate
Sustainable Development. Strategic Management Journal, vol. 26 pgs. 197-218.
12. Binns T. Nel E. (2002) Supporting Local Economic Development in Post-Apartheid
South Africa. Routledge Taylor & Francis Group. Published in ‘Local Economy’,
2002, Vol. 17, No. 1, 8–24
13. Brown K Ed (1997) Mineral Driven Development. Annual Conference of the
Development Studies Association. Volume 10, Issue 4
14. Butt, A (2003) Emerging UK Sustainability / CSR Consulting Market, MBA, Imperial
College, London
15. Cawthorn, R (1999) The Platinum and Palladium Resources of the Bushveld
Complex. South African Journal of Science 95, November/December 1999, pgs 1-9.
16. Charter, M; Peattie, K; Ottman, J; Polonsky, M (2002) Marketing and Sustainability.
Centre for Business Relationships, Accountability, Sustainability and Society in
association with the Centre for Sustainable Design, 2002.
17. Chamber of Mines. (2004) Mining: An in-depth discussion of Mining issues in South
Africa. Produced by the Chamber of Mines of South Africa. 2004/11
18. Chevalier, P (2003) Mining, Metals and Sustainable Development. Canadian Mining
Journal, Jun 2003, pgs 24 -27.
19. Crawford, D & Scaletta, T (2005) The Balanced Scorecard and Corporate Social
Responsibility: Aligning values for profit. CMA Management, Oct, 2005
20. Davis, GA (1999) The minerals Sector, Sectoral analysis and Economic
Development, Division of Economics and Business, Colorado School of Mines,
Pergamon, pgs 1-12.
21. Department of Minerals and Energy (2006) The South African Minerals Industry
2004-2005: http://www.dme.gov.za/minerals/sami_2005.stm
73
22. Department of Health (2004) South African Health Review 2003/2004. Published by
Health Systems Trust July 2004. Pgs 1-442. http://www.hst.org.za
23. Dyllick, T. and Hockerts, K. (2002). "Beyond the business case for corporate
sustainability." Business Strategy and the Environment 11(2): 130-141
24. Economist Intelligence Unit (2006) South Africa Country Profile. Pgs 1-88.
www.eiu.com
25. Eisenhart, K (1989) Building Theories from Case Study Research. The Academy of
Management Review, vol. 14, no. 4, pg 532.
26. Fisman, R; Heal, G & Nair, V (2006) Corporate Social Responsibility: Doing Well by
Doing Good? Olin School of Business, Washington University. Pgs 1-33.
27. Fitzgerald, P; McLennan, A & Munslow B (1995) Managing Sustainable
Development in South Africa. Oxford University Press. Cape Town
28. Fox, FD (2001).Public Education and Community outreach: Mining Environment
Management, May 2001, pgs 33-34.
29. Grant, R (2005) Contemporary Strategy Analysis, Fifth Edition, Blackwell
Publishing; 66-126
30. Granville, A. (2003). “Sustainable Development and Mining: Contradiction or
confirmation?” Minerals and Energy Policy Centre (MEPC)
31. Gylfason, Thorvaldur (2000). Natural resources, education and economic
development. CEPR Discussion Paper 2594.
32. Hilson, G & Murck (2000) Sustainable Development in the Mining Industry:
Clarifying the Corporate Objective. Imperial College: TX Huxley School of
Environment, Earth Science and Engineering & Department of Earth Sciences,
University of Toronto at Mississauga
74
33. Hamann, R (2003) Mining Companies Role in Sustainable Development: the “why”
and “how” of corporate social responsibility from a business perspective, Carfax
Publishing, Journal of Development Southern Africa, Vol. 20, No. 2, pgs 1-19
34. International Council on Mining and Metalsa, United Nations Council on Trade and
Development, The World Bank (April: 2006) The Resource Endowment Toolkit: the
Challenge of Mineral Wealth – Using resources to foster sustainable development;
pgs 1-48
35. International Council on Mining and Metalsb, United Nations Council on Trade and
Development, The World Bank (2006) Synthesis of four Country Case Studies –
The Challenge of Mineral Wealth: Using resource Endowments to foster
Sustainable Development. Pgs. 1- 76.
36. Jimena, J (2006) The Rocky Road to Sustainable Development. Canadian Mining
Journal, Feb 2006, pgs 8-9.
37. Jimena, J (2006) Measuring Your Responsibilities. Canadian Mining Journal, June
2006, pg. 8.
38. Johnson Matthey Plc (2002) Platinum Market Review – Creating Growth in an
Expanding Market. Pgs 1-22.
39. Kapelus, P (2001) Mining and Minerals Sustainable Development Southern Africa:
Mining and Society. African Institute of Corporate Citizenship, August 2001. pgs 1-
34.
40. Kaplan, R. S. & Norton, D.P. (1992). "The Balanced Scorecard - Measures that
drive performance." Harvard Business Review (January-February): 71-79.
41. Kaplan, R. S. & Norton, D.P. (1993). "Putting the Balanced Scorecard to work."
Harvard Business Review (September-October): 134-147.
75
42. Kaplan, R. S. & Norton, D.P. (1996). “The Balanced Scorecard: Translating Strategy
into Action.” Boston, MA, Harvard Business School Press.
43. KPMG (2006) International Survey of Corporate Responsibility Reporting 2005.
KPMG Global Sustainability Services & Universiteit van Amsterdam. Pgs 1-55.
44. Krueger, AO (1974) The Political Economy of the Rent-Seeking Society, American
Economic Review, 64, 291-303
45. LPM (2006) Draft SEAT Report: pgs H1-H32. Lebowa Platinum Mine
46. Matthews, C (2006) Empowerment in Platinum Sector boosted by Three Deals.
Business Day, 24 Oct 2006.
47. McMahon, G & Remy, F (2001) Large Mines and the Community: Socioeconomic
and Environmental effects in Latin America, Canada and Spain, International
Development Research Centre/World Bank; pgs.1-38.
48. Marota, MC et al (2006) Integrated Development Plan – Review 2006/2011.
Fetakgomo Local Municipality. Pgs 1 - 75.
49. Mohr-Swart, M (2005) The South African Perspective: Mining Sector. Proceeds of
2nd Meeting on Sustainable Consumption and Production. South African Chamber of
Mines. 5 – 8 September 2005.
50. Murdy, W (2006) Developing the Art of Benefit Extraction. Business Day, Sept. 20
2006, pg 15.
51. Nigam, A et al (2000) Investing in People: Sustainable Communities through
improved Business Practice – A community Development Resource Guide for
Companies. International Finance Corporation, Environment Division. Pgs 1-88
52. Otto, J (2004) What are the Benefit Streams from Mining: Only Taxes?, Lecture :
Institute of Global Resources Policy and Management – Colorado School of Mines;
pgs 1-47
76
53. Parker, R et al (Dec 2004) Business and Economic Development: Mining Sector
Report by Institute of Social and Ethical Accountability, Business for Social
Responsibility and Brody, Wiser, Burns; pgs 1-52.
54. Pather, Y ([email protected]) (07/09/2006) Re: Resettlement Costs LPM.
Email to Kirkwood, K ([email protected])
55. Richards, J (2002) Sustainable Development and the Minerals Industry. Society of
Economic Geologists, January 2002
56. Richards, Jeremy P (2002) Sustainable Development and the Minerals industry,
pages 2-3. Society of Economic Geologists newsletter January 2002, University of
Alberta
57. Rose, R (2006) Minister slates Mines for Lack of transformation. Business Day, 10
Oct 2006, pg 13.
58. Sachs, Jeffrey D., Warner, Andrew M. (1999). The Big Push: Natural Resource
booms and growth, Journal of Development Economics, Vol 59 (1999) pgs. 43 -76.
59. Saunders, M; Lewis, P & Thornhill, A (2002) Research Methods for Business
Students. FT Prentice Hall 3rd Edition.
60. Spoor, R Interviewed by 702 and Cape Talk .World at Six (09 August 2006) 18h10
Channel 702
61. Statistics South Africa (2006) Mid-Year Population Estimates 2006. P0302. 01
August 2006
62. Statistics South Africa (2006) Quarterly Employment Statistics. P0277. 27 June
2006.
63. Strongman, J (1998) Mining and the Community – From Enclave to Sustainable
Development. Proceedings of a conference arranged by the World Bank, Metal
77

Mining Agency of Japan, Papua New Guinea Department of Mineral Resources,
PNG Chamber of Mines and Petroleum, July 26-28, Madang, Papua New Guinea
64. Swanson DL (1995) Addressing a Theoretical Problem by Reorienting the
Corporate Social Performance Model, Academy of Management Review, Vol. 20,
No. 1 (Jan., 1995), pp. 43-64
65. United Nations (2006) Human Development Report. Published by United Nations
Development Programme by Palgrave Macmillan. New York
66. Van Zyl, D (2005) Defining Sustainable Development: Not as Easy as it Sounds.
Engineering and Mining Journal. July/August 2005. pgs. 4-6.
67. Vogel, D (2005) The Market for Virtue: The Potential and Limits of Corporate Social
Responsibility. The Brookings Institution, Washington DC
68. Whisler, SJ (2003) Economic Development, The Partner of Sustainability.
Proceedings of an Address at 26th Mining Convention Arequipa Peru, 16/09/2003
69. Willard, B (2002) The Sustainability Advantage: Seven Business Case Benefits of a
Triple Bottom Line. New Society Publishers
70. World Business Council for Sustainable Development (2006) Dedicated to making a
Difference: Anglo American’s Socio-Economic Assessment Toolbox. Conches,
Geneva. Pgs 1-10.
71. Worrall, L (2005) Understanding the contribution of Small Business Development to
Sustainable Development in the South African Mining Industry, Imperial College
MBA Dissertation, Imperial College; pgs. 1-18
72. Yin, RJ (2003) Case Study Research: Design and Methods. Third Edition, Vol, 5
Sage Publications.
78
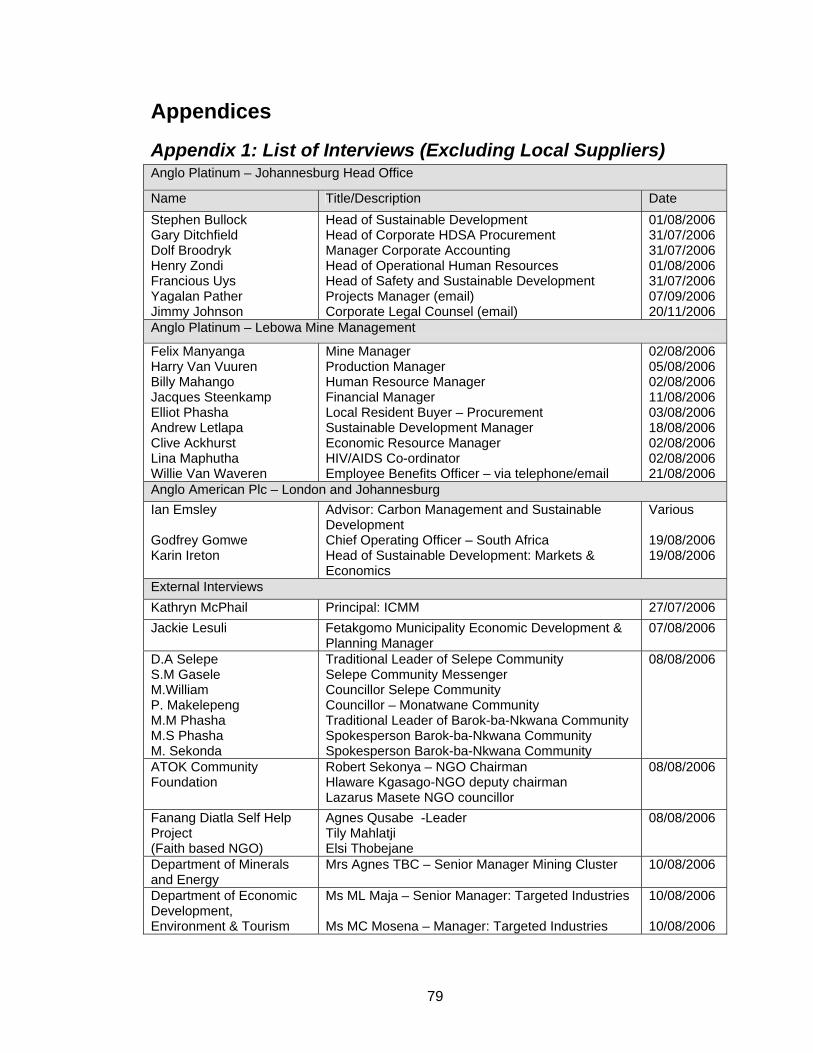
Appendices
Appendix 1: List of Interviews (Excluding Local Suppliers) Anglo Platinum – Johannesburg Head Office
Name Title/Description Date Stephen Bullock Gary Ditchfield Dolf Broodryk Henry Zondi Francious Uys Yagalan Pather Jimmy Johnson
Head of Sustainable Development Head of Corporate HDSA Procurement Manager Corporate Accounting Head of Operational Human Resources Head of Safety and Sustainable Development Projects Manager (email) Corporate Legal Counsel (email)
01/08/2006 31/07/2006 31/07/2006 01/08/2006 31/07/2006 07/09/2006 20/11/2006
Anglo Platinum – Lebowa Mine Management
Felix Manyanga Harry Van Vuuren Billy Mahango Jacques Steenkamp Elliot Phasha Andrew Letlapa Clive Ackhurst Lina Maphutha Willie Van Waveren
Mine Manager Production Manager Human Resource Manager Financial Manager Local Resident Buyer – Procurement Sustainable Development Manager Economic Resource Manager HIV/AIDS Co-ordinator Employee Benefits Officer – via telephone/email
02/08/2006 05/08/2006 02/08/2006 11/08/2006 03/08/2006 18/08/2006 02/08/2006 02/08/2006 21/08/2006
Anglo American Plc – London and Johannesburg Ian Emsley Godfrey Gomwe Karin Ireton
Advisor: Carbon Management and Sustainable Development Chief Operating Officer – South Africa Head of Sustainable Development: Markets & Economics
Various 19/08/2006 19/08/2006
External Interviews Kathryn McPhail Principal: ICMM 27/07/2006 Jackie Lesuli Fetakgomo Municipality Economic Development &
Planning Manager 07/08/2006
D.A Selepe S.M Gasele M.William P. Makelepeng M.M Phasha M.S Phasha M. Sekonda
Traditional Leader of Selepe Community Selepe Community Messenger Councillor Selepe Community Councillor – Monatwane Community Traditional Leader of Barok-ba-Nkwana Community Spokesperson Barok-ba-Nkwana Community Spokesperson Barok-ba-Nkwana Community
08/08/2006
ATOK Community Foundation
Robert Sekonya – NGO Chairman Hlaware Kgasago-NGO deputy chairman Lazarus Masete NGO councillor
08/08/2006
Fanang Diatla Self Help Project (Faith based NGO)
Agnes Qusabe -Leader Tily Mahlatji Elsi Thobejane
08/08/2006
Department of Minerals and Energy
Mrs Agnes TBC – Senior Manager Mining Cluster 10/08/2006
Department of Economic Development, Environment & Tourism
Ms ML Maja – Senior Manager: Targeted Industries Ms MC Mosena – Manager: Targeted Industries
10/08/2006 10/08/2006
79
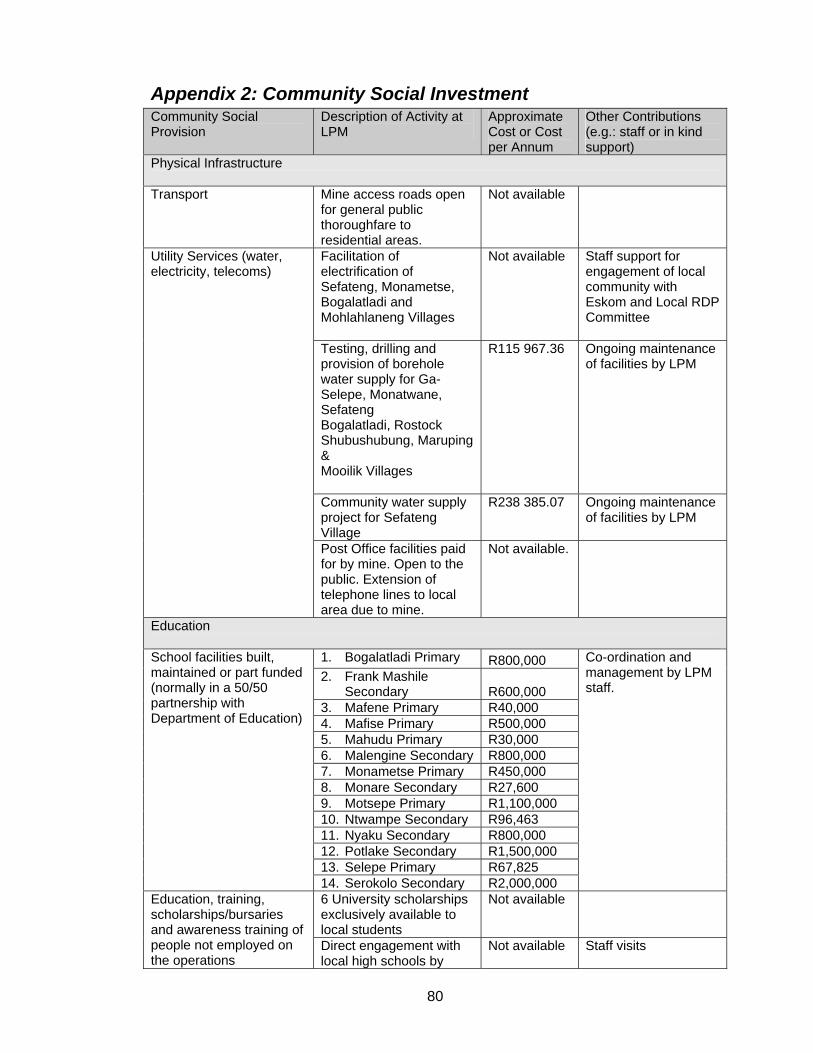
Appendix 2: Community Social Investment Community Social Provision
Description of Activity at LPM
Approximate Cost or Cost per Annum
Other Contributions (e.g.: staff or in kind support)
Physical Infrastructure Transport Mine access roads open
for general public thoroughfare to residential areas.
Not available
Facilitation of electrification of Sefateng, Monametse, Bogalatladi and Mohlahlaneng Villages
Not available Staff support for engagement of local community with Eskom and Local RDP Committee
Testing, drilling and provision of borehole water supply for Ga-Selepe, Monatwane, Sefateng Bogalatladi, Rostock Shubushubung, Maruping & Mooilik Villages
R115 967.36 Ongoing maintenance of facilities by LPM
Community water supply project for Sefateng Village
R238 385.07
Ongoing maintenance of facilities by LPM
Utility Services (water, electricity, telecoms)
Post Office facilities paid for by mine. Open to the public. Extension of telephone lines to local area due to mine.
Not available.
Education
1. Bogalatladi Primary R800,000 2. Frank Mashile
Secondary R600,000 3. Mafene Primary R40,000 4. Mafise Primary R500,000 5. Mahudu Primary R30,000 6. Malengine Secondary R800,000 7. Monametse Primary R450,000 8. Monare Secondary R27,600 9. Motsepe Primary R1,100,000 10. Ntwampe Secondary R96,463 11. Nyaku Secondary R800,000 12. Potlake Secondary R1,500,000 13. Selepe Primary R67,825
School facilities built, maintained or part funded (normally in a 50/50 partnership with Department of Education)
14. Serokolo Secondary R2,000,000
Co-ordination and management by LPM staff.
6 University scholarships exclusively available to local students
Not available Education, training, scholarships/bursaries and awareness training of people not employed on the operations
Direct engagement with local high schools by
Not available Staff visits
80
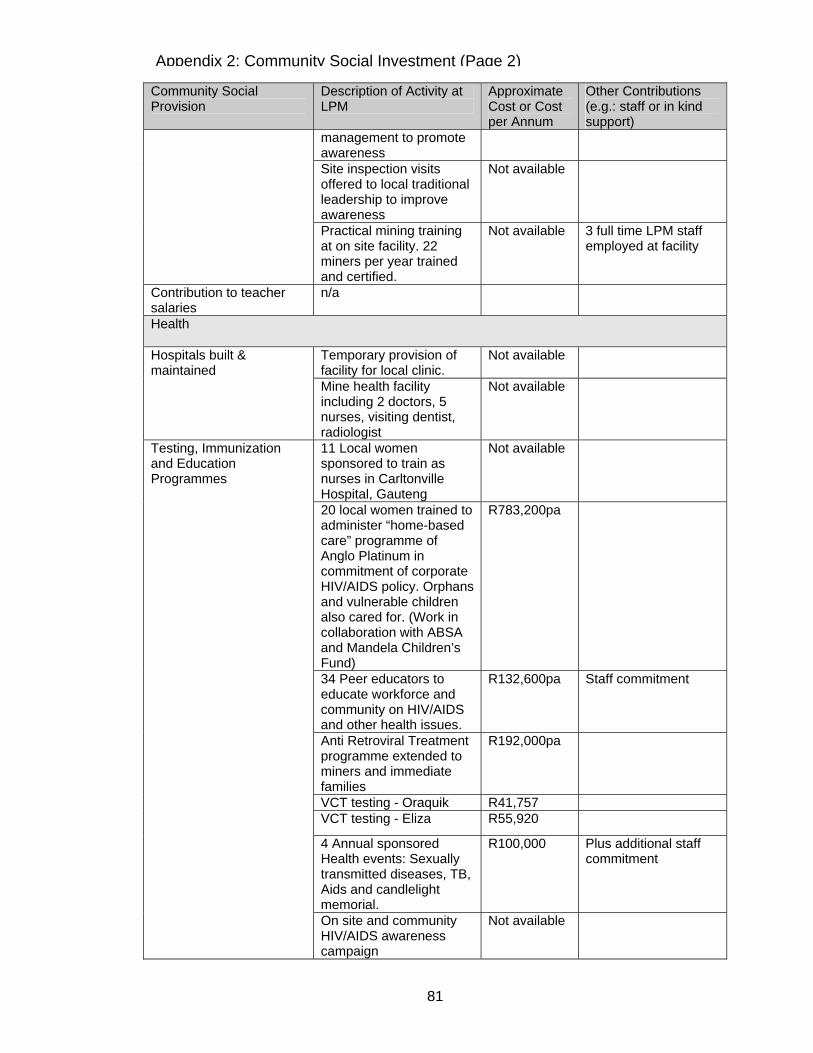
Community Social Provision
Description of Activity at LPM
Approximate Other Contributions Cost or Cost (e.g.: staff or in kind per Annum support)
management to promote awareness Site inspection visits offered to local traditional leadership to improve awareness
Not available
Practical mining training at on site facility. 22 miners per year trained and certified.
Not available 3 full time LPM staff employed at facility
Contribution to teacher salaries
n/a
Health
Temporary provision of facility for local clinic.
Not available Hospitals built & maintained
Mine health facility including 2 doctors, 5 nurses, visiting dentist, radiologist
Not available
11 Local women sponsored to train as nurses in Carltonville Hospital, Gauteng
Not available
20 local women trained to administer “home-based care” programme of Anglo Platinum in commitment of corporate HIV/AIDS policy. Orphans and vulnerable children also cared for. (Work in collaboration with ABSA and Mandela Children’s Fund)
R783,200pa
34 Peer educators to educate workforce and community on HIV/AIDS and other health issues.
R132,600pa Staff commitment
Anti Retroviral Treatment programme extended to miners and immediate families
R192,000pa
VCT testing - Oraquik R41,757 VCT testing - Eliza R55,920
4 Annual sponsored Health events: Sexually transmitted diseases, TB, Aids and candlelight memorial.
R100,000 Plus additional staff commitment
Testing, Immunization and Education Programmes
On site and community HIV/AIDS awareness campaign
Not available
Appendix 2: Community Social Investment (Page 2)
81
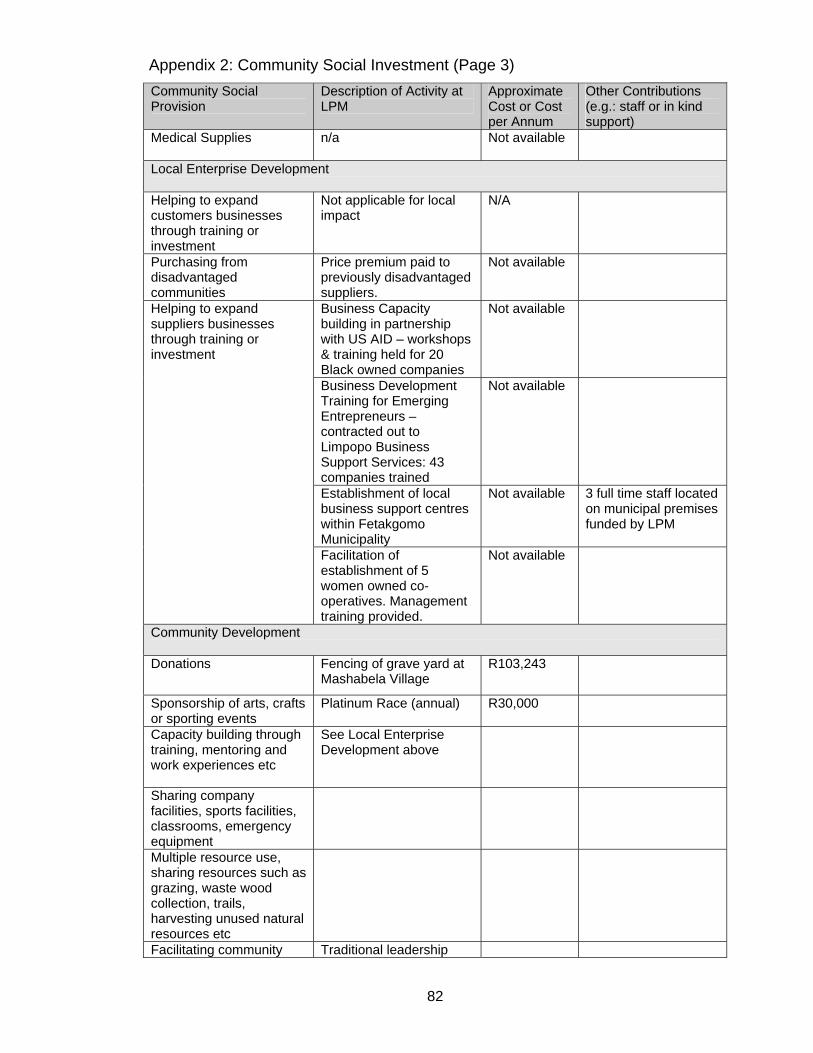
Community Social Provision
Description of Activity at LPM
Approximate Other Contributions Cost or Cost (e.g.: staff or in kind per Annum support)
Medical Supplies n/a
Not available
Local Enterprise Development Helping to expand customers businesses through training or investment
Not applicable for local impact
N/A
Purchasing from disadvantaged communities
Price premium paid to previously disadvantaged suppliers.
Not available
Business Capacity building in partnership with US AID – workshops & training held for 20 Black owned companies
Not available
Business Development Training for Emerging Entrepreneurs – contracted out to Limpopo Business Support Services: 43 companies trained
Not available
Establishment of local business support centres within Fetakgomo Municipality
Not available 3 full time staff located on municipal premises funded by LPM
Helping to expand suppliers businesses through training or investment
Facilitation of establishment of 5 women owned co-operatives. Management training provided.
Not available
Community Development Donations Fencing of grave yard at
Mashabela Village R103,243
Sponsorship of arts, crafts or sporting events
Platinum Race (annual) R30,000
Capacity building through training, mentoring and work experiences etc
See Local Enterprise Development above
Sharing company facilities, sports facilities, classrooms, emergency equipment
Multiple resource use, sharing resources such as grazing, waste wood collection, trails, harvesting unused natural resources etc
Facilitating community Traditional leadership
Appendix 2: Community Social Investment (Page 3)
82
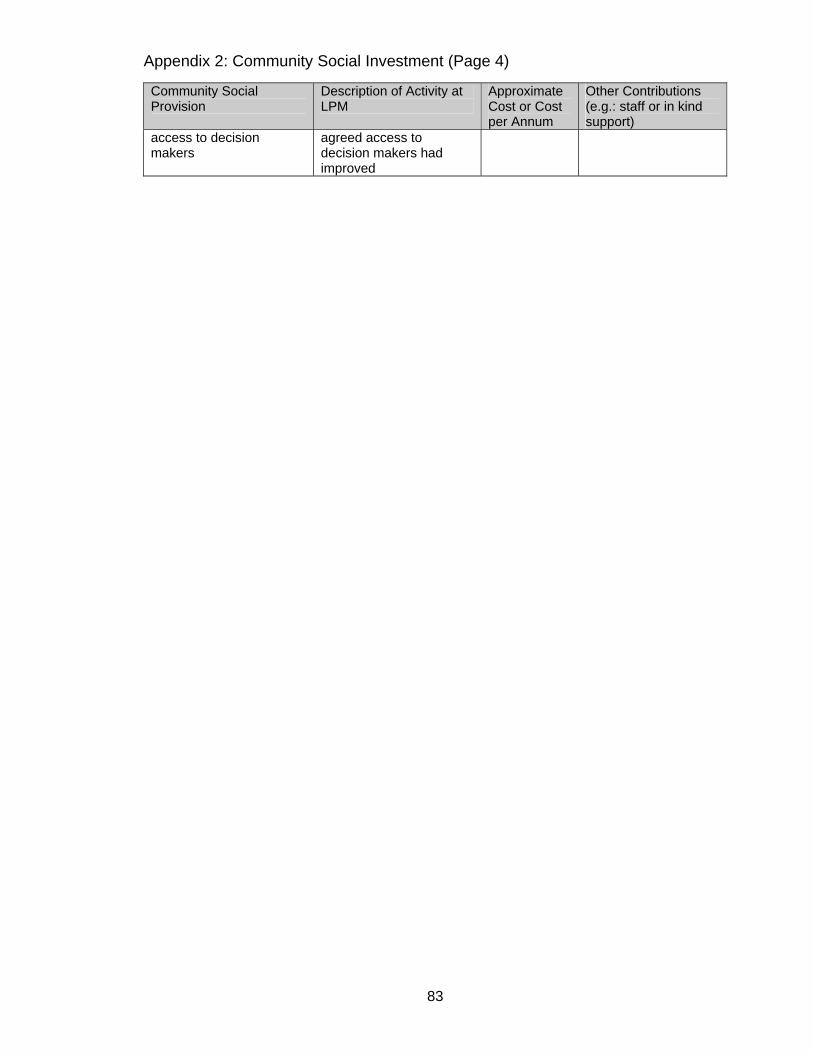
Appendix 2: Community Social Investment (Page 4)
Community Social Provision
Description of Activity at LPM
Approximate Other Contributions Cost or Cost (e.g.: staff or in kind per Annum support)
access to decision makers
agreed access to decision makers had improved
83
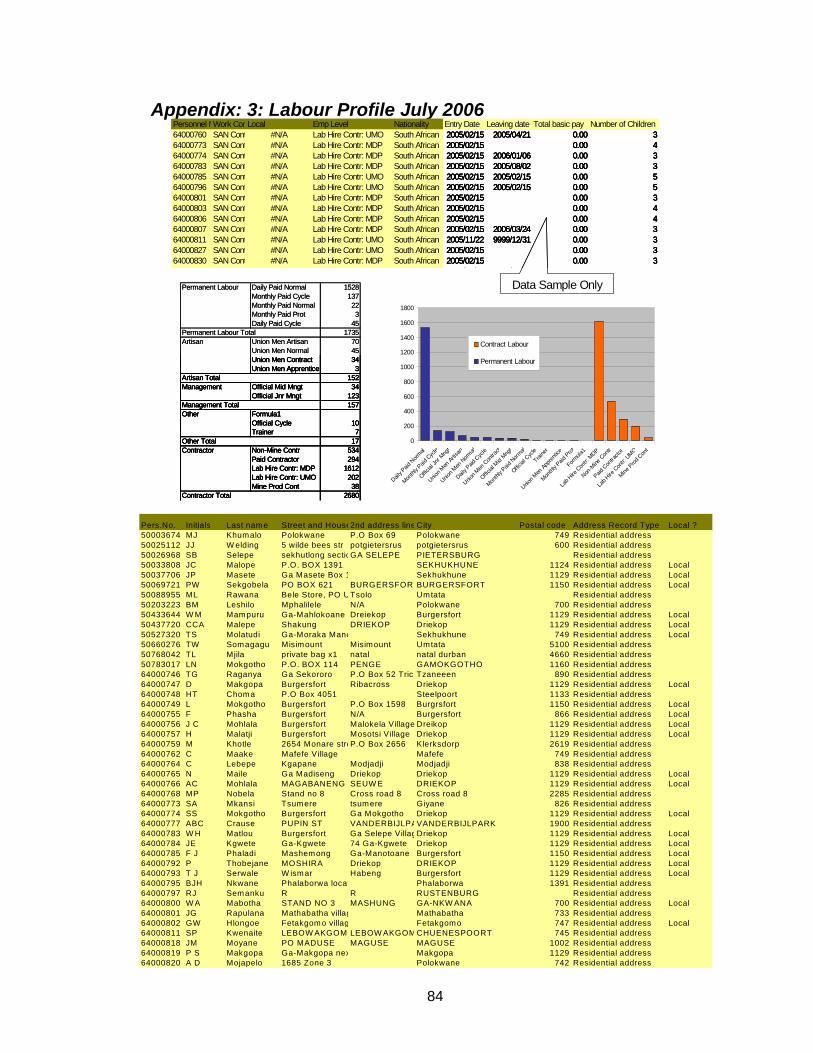
Appendix: 3: Labour Profile July 2006
Personnel NWork ConLocal Emp Level Nationality Entry Date Leaving date Total basic pay Number of Children64000760 SAN Cont #N/A Lab Hire Contr: UMO South African 2005/02/15 2005/04/21 0.00 364000773 SAN Cont #N/A Lab Hire Contr: MDP South African 2005/02/15 0.00 464000774 SAN Cont #N/A Lab Hire Contr: MDP South African 2005/02/15 2006/01/06 0.00 364000783 SAN Cont #N/A Lab Hire Contr: MDP South African 2005/02/15 2005/08/02 0.00 364000785 SAN Cont #N/A Lab Hire Contr: UMO South African 2005/02/15 2005/02/15 0.00 564000796 SAN Cont #N/A Lab Hire Contr: UMO South African 2005/02/15 2005/02/15 0.00 564000801 SAN Cont #N/A Lab Hire Contr: MDP South African 2005/02/15 0.00 364000803 SAN Cont #N/A Lab Hire Contr: MDP South African 2005/02/15 0.00 464000806 SAN Cont #N/A Lab Hire Contr: MDP South African 2005/02/15 0.00 464000807 SAN Cont #N/A Lab Hire Contr: MDP South African 2005/02/15 2006/03/24 0.00 364000811 SAN Cont #N/A Lab Hire Contr: UMO South African 2005/11/22 9999/12/31 0.00 364000827 SAN Cont #N/A Lab Hire Contr: UMO South African 2005/02/15 0.00 364000830 SAN Cont #N/A Lab Hire Contr: MDP South African 2005/02/15 0.00 364000834 SAN Cont #N/A Lab Hire Contr: UMO South African 2005/02/15 2005/03/02 0.00 564000845 SAN Cont #N/A Lab Hire Contr: UMO South African 2005/02/16 0.00 364000852 SAN Cont #N/A Lab Hire Contr: MDP South African 2005/02/16 0.00 464000853 SAN Cont #N/A Lab Hire Contr: UMO South African 2005/02/15 2005/04/12 0.00 464000855 SAN Cont #N/A Lab Hire Contr: UMO South African 2005/02/15 2005/04/12 0.00 564000860 SAN Cont #N/A Lab Hire Contr: MDP South African 2005/02/15 2006/06/23 0.00 6
Permanent Labour Daily Paid Normal 1528Monthly Paid Cycle 137Monthly Paid Normal 22Monthly Paid Prot 3Daily Paid Cycle 45
Permanent Labour Total 1735Artisan Union Men Artisan 70
Union Men Normal 45Union Men Contract 34Union Men Apprentice 3
Artisan Total 152Management Official Mid Mngt 34
Official Jnr Mngt 123Management Total 157Other Formula1
Official Cycle 10Trainer 7
Other Total 17Contractor Non-Mine Contr 534
Paid Contractor 294Lab Hire Contr: MDP 1612Lab Hire Contr: UMO 202Mine Prod Cont 38
Contractor Total 2680
0
200
400
600
800
1000
1200
1400
1600
1800
Daily P
aid N
ormal
Monthl
y Paid
Cyc
le
Official
Jnr M
ngt
Union M
en Artis
an
Union M
en N
ormal
Daily P
aid C
ycle
Union M
en C
ontra
ct
Official
Mid
Mngt
Monthl
y Paid
Norm
al
Official
Cyc
le
Traine
r
Union M
en Ap
prenti
ce
Monthl
y Paid
Prot
Form
ula1
Lab H
ire C
ontr:
MDP
Non-M
ine C
ontr
Paid C
ontra
ctor
Lab H
ire C
ontr:
UMO
Mine Prod
Con
t
Contract Labour
Permanent Labour
Data Sample Only
Personnel NWork ConLocal Emp Level Nationality Entry Date Leaving date Total basic pay Number of Children64000760 SAN Cont #N/A Lab Hire Contr: UMO South African 2005/02/15 2005/04/21 0.00 364000773 SAN Cont #N/A Lab Hire Contr: MDP South African 2005/02/15 0.00 464000774 SAN Cont #N/A Lab Hire Contr: MDP South African 2005/02/15 2006/01/06 0.00 364000783 SAN Cont #N/A Lab Hire Contr: MDP South African 2005/02/15 2005/08/02 0.00 364000785 SAN Cont #N/A Lab Hire Contr: UMO South African 2005/02/15 2005/02/15 0.00 564000796 SAN Cont #N/A Lab Hire Contr: UMO South African 2005/02/15 2005/02/15 0.00 564000801 SAN Cont #N/A Lab Hire Contr: MDP South African 2005/02/15 0.00 364000803 SAN Cont #N/A Lab Hire Contr: MDP South African 2005/02/15 0.00 464000806 SAN Cont #N/A Lab Hire Contr: MDP South African 2005/02/15 0.00 464000807 SAN Cont #N/A Lab Hire Contr: MDP South African 2005/02/15 2006/03/24 0.00 364000811 SAN Cont #N/A Lab Hire Contr: UMO South African 2005/11/22 9999/12/31 0.00 364000827 SAN Cont #N/A Lab Hire Contr: UMO South African 2005/02/15 0.00 364000830 SAN Cont #N/A Lab Hire Contr: MDP South African 2005/02/15 0.00 364000834 SAN Cont #N/A Lab Hire Contr: UMO South African 2005/02/15 2005/03/02 0.00 564000845 SAN Cont #N/A Lab Hire Contr: UMO South African 2005/02/16 0.00 364000852 SAN Cont #N/A Lab Hire Contr: MDP South African 2005/02/16 0.00 464000853 SAN Cont #N/A Lab Hire Contr: UMO South African 2005/02/15 2005/04/12 0.00 464000855 SAN Cont #N/A Lab Hire Contr: UMO South African 2005/02/15 2005/04/12 0.00 564000860 SAN Cont #N/A Lab Hire Contr: MDP South African 2005/02/15 2006/06/23 0.00 6
Permanent Labour Daily Paid Normal 1528Monthly Paid Cycle 137Monthly Paid Normal 22Monthly Paid Prot 3Daily Paid Cycle 45
Permanent Labour Total 1735Artisan Union Men Artisan 70
Union Men Normal 45Union Men Contract 34Union Men Apprentice 3
Artisan Total 152Management Official Mid Mngt 34
Official Jnr Mngt 123Management Total 157Other Formula1
Official Cycle 10Trainer 7
Other Total 17Contractor Non-Mine Contr 534
Paid Contractor 294Lab Hire Contr: MDP 1612Lab Hire Contr: UMO 202Mine Prod Cont 38
Contractor Total 2680
0
200
400
600
800
1000
1200
1400
1600
1800
Daily P
aid N
ormal
Monthl
y Paid
Cyc
le
Official
Jnr M
ngt
Union M
en Artis
an
Union M
en N
ormal
Daily P
aid C
ycle
Union M
en C
ontra
ct
Official
Mid
Mngt
Monthl
y Paid
Norm
al
Official
Cyc
le
Traine
r
Union M
en Ap
prenti
ce
Monthl
y Paid
Prot
Form
ula1
Lab H
ire C
ontr:
MDP
Non-M
ine C
ontr
Paid C
ontra
ctor
Lab H
ire C
ontr:
UMO
Mine Prod
Con
t
Contract Labour
Permanent Labour
Personnel NWork ConLocal Emp Level Nationality Entry Date Leaving date Total basic pay Number of Children64000760 SAN Cont #N/A Lab Hire Contr: UMO South African 2005/02/15 2005/04/21 0.00 364000773 SAN Cont #N/A Lab Hire Contr: MDP South African 2005/02/15 0.00 464000774 SAN Cont #N/A Lab Hire Contr: MDP South African 2005/02/15 2006/01/06 0.00 364000783 SAN Cont #N/A Lab Hire Contr: MDP South African 2005/02/15 2005/08/02 0.00 364000785 SAN Cont #N/A Lab Hire Contr: UMO South African 2005/02/15 2005/02/15 0.00 564000796 SAN Cont #N/A Lab Hire Contr: UMO South African 2005/02/15 2005/02/15 0.00 564000801 SAN Cont #N/A Lab Hire Contr: MDP South African 2005/02/15 0.00 364000803 SAN Cont #N/A Lab Hire Contr: MDP South African 2005/02/15 0.00 464000806 SAN Cont #N/A Lab Hire Contr: MDP South African 2005/02/15 0.00 464000807 SAN Cont #N/A Lab Hire Contr: MDP South African 2005/02/15 2006/03/24 0.00 364000811 SAN Cont #N/A Lab Hire Contr: UMO South African 2005/11/22 9999/12/31 0.00 364000827 SAN Cont #N/A Lab Hire Contr: UMO South African 2005/02/15 0.00 364000830 SAN Cont #N/A Lab Hire Contr: MDP South African 2005/02/15 0.00 364000834 SAN Cont #N/A Lab Hire Contr: UMO South African 2005/02/15 2005/03/02 0.00 564000845 SAN Cont #N/A Lab Hire Contr: UMO South African 2005/02/16 0.00 364000852 SAN Cont #N/A Lab Hire Contr: MDP South African 2005/02/16 0.00 464000853 SAN Cont #N/A Lab Hire Contr: UMO South African 2005/02/15 2005/04/12 0.00 464000855 SAN Cont #N/A Lab Hire Contr: UMO South African 2005/02/15 2005/04/12 0.00 564000860 SAN Cont #N/A Lab Hire Contr: MDP South African 2005/02/15 2006/06/23 0.00 6
Personnel NWork ConLocal Emp Level Nationality Entry Date Leaving date Total basic pay Number of Children64000760 SAN Cont #N/A Lab Hire Contr: UMO South African 2005/02/15 2005/04/21 0.00 364000773 SAN Cont #N/A Lab Hire Contr: MDP South African 2005/02/15 0.00 464000774 SAN Cont #N/A Lab Hire Contr: MDP South African 2005/02/15 2006/01/06 0.00 364000783 SAN Cont #N/A Lab Hire Contr: MDP South African 2005/02/15 2005/08/02 0.00 364000785 SAN Cont #N/A Lab Hire Contr: UMO South African 2005/02/15 2005/02/15 0.00 564000796 SAN Cont #N/A Lab Hire Contr: UMO South African 2005/02/15 2005/02/15 0.00 564000801 SAN Cont #N/A Lab Hire Contr: MDP South African 2005/02/15 0.00 364000803 SAN Cont #N/A Lab Hire Contr: MDP South African 2005/02/15 0.00 464000806 SAN Cont #N/A Lab Hire Contr: MDP South African 2005/02/15 0.00 464000807 SAN Cont #N/A Lab Hire Contr: MDP South African 2005/02/15 2006/03/24 0.00 364000811 SAN Cont #N/A Lab Hire Contr: UMO South African 2005/11/22 9999/12/31 0.00 364000827 SAN Cont #N/A Lab Hire Contr: UMO South African 2005/02/15 0.00 364000830 SAN Cont #N/A Lab Hire Contr: MDP South African 2005/02/15 0.00 364000834 SAN Cont #N/A Lab Hire Contr: UMO South African 2005/02/15 2005/03/02 0.00 564000845 SAN Cont #N/A Lab Hire Contr: UMO South African 2005/02/16 0.00 364000852 SAN Cont #N/A Lab Hire Contr: MDP South African 2005/02/16 0.00 464000853 SAN Cont #N/A Lab Hire Contr: UMO South African 2005/02/15 2005/04/12 0.00 464000855 SAN Cont #N/A Lab Hire Contr: UMO South African 2005/02/15 2005/04/12 0.00 564000860 SAN Cont #N/A Lab Hire Contr: MDP South African 2005/02/15 2006/06/23 0.00 6
Permanent Labour Daily Paid Normal 1528Monthly Paid Cycle 137Monthly Paid Normal 22Monthly Paid Prot 3Daily Paid Cycle 45
Permanent Labour Total 1735Artisan Union Men Artisan 70
Union Men Normal 45Union Men Contract 34Union Men Apprentice 3
Artisan Total 152Management Official Mid Mngt 34
Official Jnr Mngt 123Management Total 157Other Formula1
Official Cycle 10Trainer 7
Other Total 17Contractor Non-Mine Contr 534
Paid Contractor 294Lab Hire Contr: MDP 1612Lab Hire Contr: UMO 202Mine Prod Cont 38
Contractor Total 2680
0
200
400
600
800
1000
1200
1400
1600
1800
Daily P
aid N
ormal
Monthl
y Paid
Cyc
le
Official
Jnr M
ngt
Union M
en Artis
an
Union M
en N
ormal
Daily P
aid C
ycle
Union M
en C
ontra
ct
Official
Mid
Mngt
Monthl
y Paid
Norm
al
Official
Cyc
le
Traine
r
Union M
en Ap
prenti
ce
Monthl
y Paid
Prot
Form
ula1
Lab H
ire C
ontr:
MDP
Non-M
ine C
ontr
Paid C
ontra
ctor
Lab H
ire C
ontr:
UMO
Mine Prod
Con
t
Contract Labour
Permanent Labour
Data Sample Only
Pers.No. Initials Last name Street and House2nd address line City Postal code Address Record Type Local ?50003674 MJ Khumalo Polokwane P.O Box 69 Polokwane 749 Residential address50025112 JJ W elding 5 wilde bees str potgietersrus potgietersrus 600 Residential address50026968 SB Selepe sekhutlong sectioGA SELEPE PIETERSBURG Residential address50033808 JC Malope P.O. BOX 1391 SEKHUKHUNE 1124 Residential address Local50037706 JP Masete Ga Masete Box 1 Sekhukhune 1129 Residential address Local50069721 PW Sekgobela PO BOX 621 BURGERSFORTBURGERSFORT 1150 Residential address Local50088955 ML Rawana Bele Store, PO UTsolo Umtata Residential address50203223 BM Leshilo Mphalilele N/A Polokwane 700 Residential address50433644 W M Mampuru Ga-Mahlokoane Dreiekop Burgersfort 1129 Residential address Local50437720 CCA Malepe Shakung DRIEKOP Driekop 1129 Residential address Local50527320 TS Molatudi Ga-Moraka Mano Sekhukhune 749 Residential address Local50660276 TW Somagagu Misimount Misimount Umtata 5100 Residential address50768042 TL Mjila private bag x1 natal natal durban 4660 Residential address50783017 LN Mokgotho P.O. BOX 114 PENGE GAMOKGOTHO 1160 Residential address64000746 TG Raganya Ga Sekororo P.O Box 52 TrichTzaneeen 890 Residential address64000747 D Makgopa Burgersfort Ribacross Driekop 1129 Residential address Local64000748 HT Choma P.O Box 4051 Steelpoort 1133 Residential address64000749 L Mokgotho Burgersfort P.O Box 1598 Burgrsfort 1150 Residential address Local64000755 F Phasha Burgersfort N/A Burgersfort 866 Residential address Local64000756 J C Mohlala Burgersfort Malokela Village Dreikop 1129 Residential address Local64000757 H Malatji Burgersfort Mosotsi Village Driekop 1129 Residential address Local64000759 M Khotle 2654 Monare streP.O Box 2656 Klerksdorp 2619 Residential address64000762 C Maake Mafefe Village Mafefe 749 Residential address64000764 C Lebepe Kgapane Modjadji Modjadji 838 Residential address64000765 N Maile Ga Madiseng Driekop Driekop 1129 Residential address Local64000766 AC Mohlala MAGABANENG SEUW E DRIEKOP 1129 Residential address Local64000768 MP Nobela Stand no 8 Cross road 8 Cross road 8 2285 Residential address64000773 SA Mkansi Tsumere tsumere Giyane 826 Residential address64000774 SS Mokgotho Burgersfort Ga Mokgotho Driekop 1129 Residential address Local64000777 ABC Crause PUPIN ST VANDERBIJLPAVANDERBIJLPARK 1900 Residential address64000783 W H Matlou Burgersfort Ga Selepe VillagDriekop 1129 Residential address Local64000784 JE Kgwete Ga-Kgwete 74 Ga-Kgwete Driekop 1129 Residential address Local64000785 F J Phaladi Mashemong Ga-Manotoane Burgersfort 1150 Residential address Local64000792 P Thobejane MOSHIRA Driekop DRIEKOP 1129 Residential address Local64000793 T J Serwale W ismar Habeng Burgersfort 1129 Residential address Local64000795 BJH Nkwane Phalaborwa locat Phalaborwa 1391 Residential address64000797 RJ Semanku R R RUSTENBURG Residential address64000800 W A Mabotha STAND NO 3 MASHUNG GA-NKW ANA 700 Residential address Local64000801 JG Rapulana Mathabatha villag Mathabatha 733 Residential address64000802 GW Hlongoe Fetakgomo villag Fetakgomo 747 Residential address Local64000811 SP Kwenaite LEBOW AKGOM LEBOW AKGOMCHUENESPOORT 745 Residential address64000818 JM Moyane PO MADUSE MAGUSE MAGUSE 1002 Residential address64000819 P S Makgopa Ga-Makgopa nex Makgopa 1129 Residential address64000820 A D Mojapelo 1685 Zone 3 Polokwane 742 Residential address
84
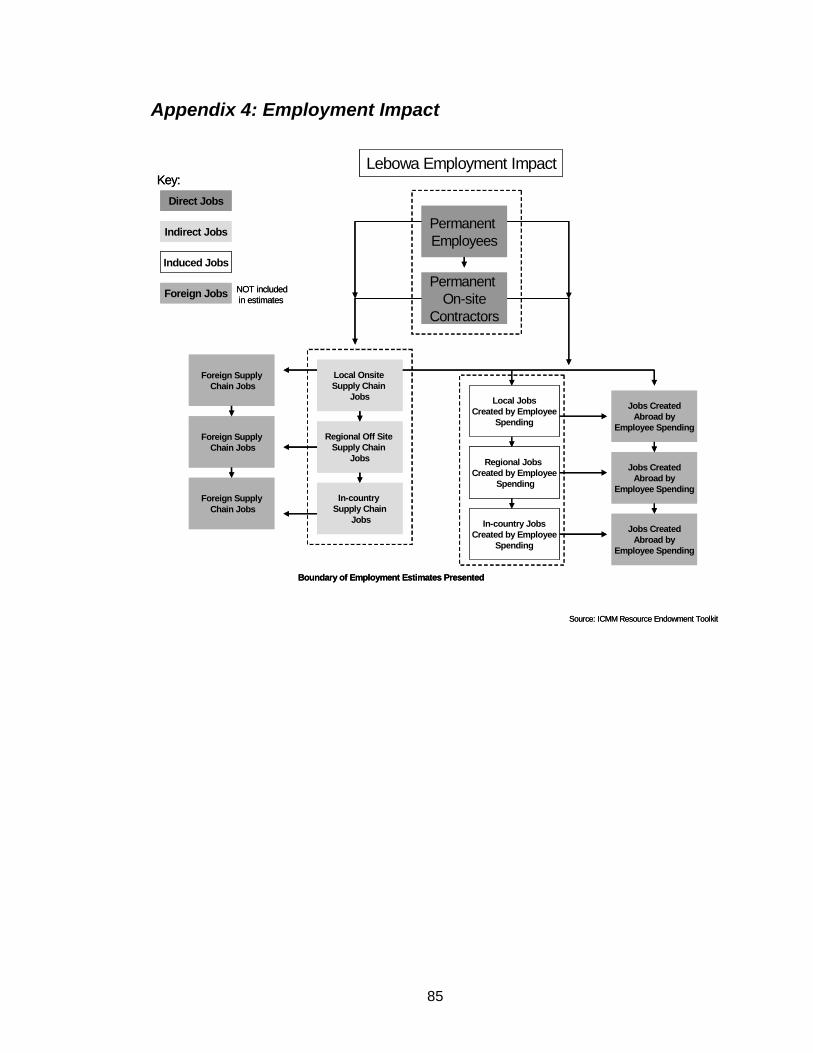
Appendix 4: Employment Impact
Permanent Employees
Permanent On-site
Contractors
Local Onsite Supply Chain
Jobs
Regional Off Site Supply Chain
Jobs
In-country Supply Chain
Jobs
Foreign SupplyChain Jobs
Foreign SupplyChain Jobs
Foreign SupplyChain Jobs
Local JobsCreated by Employee
Spending
Regional Jobs Created by Employee
Spending
In-country JobsCreated by Employee
Spending
Jobs CreatedAbroad by
Employee Spending
Jobs CreatedAbroad by
Employee Spending
Jobs CreatedAbroad by
Employee Spending
Boundary of Employment Estimates Presented
Direct Jobs
Indirect Jobs
Foreign Jobs
Induced Jobs
Lebowa Employment Impact
Source: ICMM Resource Endowment Toolkit
Key:
NOT includedin estimates
Permanent Employees
Permanent On-site
Contractors
Local Onsite Supply Chain
Jobs
Regional Off Site Supply Chain
Jobs
In-country Supply Chain
Jobs
Foreign SupplyChain Jobs
Foreign SupplyChain Jobs
Foreign SupplyChain Jobs
Local JobsCreated by Employee
Spending
Regional Jobs Created by Employee
Spending
In-country JobsCreated by Employee
Spending
Jobs CreatedAbroad by
Employee Spending
Jobs CreatedAbroad by
Employee Spending
Jobs CreatedAbroad by
Employee Spending
Boundary of Employment Estimates Presented
Lebowa Employment Impact
Source: ICMM Resource Endowment Toolkit
Direct Jobs
Indirect Jobs
Foreign Jobs
Induced Jobs
y:
NOT includedin estimates
Ke
85
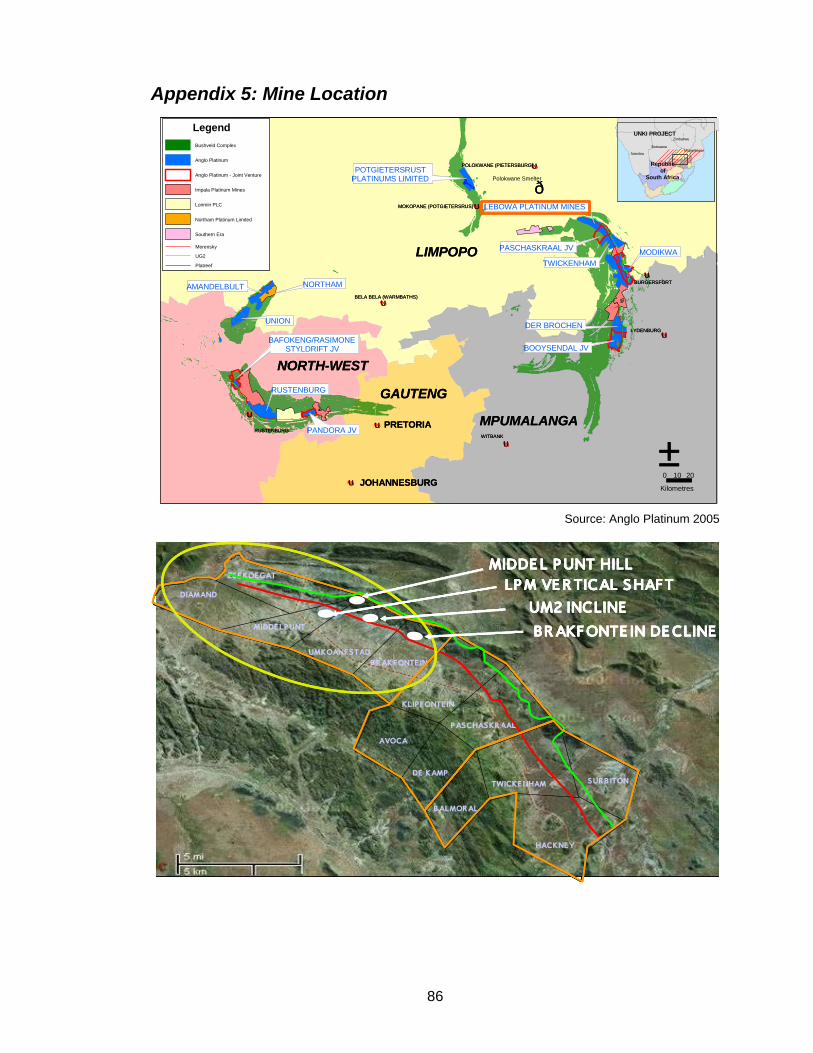
Appendix 5: Mine Location
%U
Source: Anglo Platinum 2005
%U
%U
%U
%U
%U
%U
%U
%U
AMANDELBULT
UNION
BAFOKENG/RASIMONESTYLDRIFT JV
RUSTENBURG
POTGIETERSRUSTPLATINUMS LIMITED
TWICKENHAM
DER BROCHEN
LEBOWA PLATINUM MINES
ð
LIMPOPO
MPUMALANGA
GAUTENG
NORTH-WEST
RUSTENBURGPRETORIA
WITBANK
MOKOPANE (POTGIETERSRUS)
POLOKWANE (PIETERSBURG)
BELA BELA (WARMBATHS)
JOHANNESBURG
NORTHAM
PANDORA JV
BOOYSENDAL JV
MODIKWA
BURGERSFORT
LYDENBURG
PASCHASKRAAL JV
LegendBushveld Complex
Anglo Platinum
Anglo Platinum - Joint Venture
Impala Platinum Mines
Lonmin PLC
Northam Platinum Limited
Southern Era
Merensky
UG2
Platreef
UNKI PROJECT
Botswana
Zimbabwe
MozambiqueNamibia
±
Republicof
South AfricaPolokwane Smelter
0 2010
Kilometres
%U
%U
%U
%U
%U
%U
%U
%U
%UAMANDELBULT
UNION
BAFOKENG/RASIMONESTYLDRIFT JV
RUSTENBURG
POTGIETERSRUSTPLATINUMS LIMITED
TWICKENHAM
DER BROCHEN
LEBOWA PLATINUM MINES
ð
LIMPOPO
MPUMALANGA
GAUTENG
NORTH-WEST
RUSTENBURGPRETORIA
WITBANK
MOKOPANE (POTGIETERSRUS)
POLOKWANE (PIETERSBURG)
BELA BELA (WARMBATHS)
JOHANNESBURG
NORTHAM
PANDORA JV
BOOYSENDAL JV
MODIKWA
BURGERSFORT
LYDENBURG
PASCHASKRAAL JV
LegendBushveld Complex
Anglo Platinum
Anglo Platinum - Joint Venture
Impala Platinum Mines
Lonmin PLC
Northam Platinum Limited
Southern Era
Merensky
UG2
Platreef
UNKI PROJECT
Botswana
Zimbabwe
MozambiqueNamibia
±%U
%U
%U
%U
%U
%U
%U
%U
%UAMANDELBULT
UNION
BAFOKENG/RASIMONESTYLDRIFT JV
RUSTENBURG
POTGIETERSRUSTPLATINUMS LIMITED
TWICKENHAM
DER BROCHEN
LEBOWA PLATINUM MINES
ð
LIMPOPO
MPUMALANGA
GAUTENG
NORTH-WEST
RUSTENBURGPRETORIA
WITBANK
MOKOPANE (POTGIETERSRUS)
POLOKWANE (PIETERSBURG)
BELA BELA (WARMBATHS)
JOHANNESBURG
NORTHAM
PANDORA JV
BOOYSENDAL JV
MODIKWA
BURGERSFORT
LYDENBURG
PASCHASKRAAL JV
LegendBushveld Complex
Anglo Platinum
Anglo Platinum - Joint Venture
Impala Platinum Mines
Lonmin PLC
Northam Platinum Limited
Southern Era
Merensky
UG2
Platreef
UNKI PROJECT
Botswana
Zimbabwe
MozambiqueNamibia
±
Republicof
South AfricaPolokwane Smelter
0 2010
Kilometres
MIDDELPUNT
UMKOANESTADBRAKFONTEIN
KLIPFONTEIN
PASCHASKRAAL
TWICKENHAM
HACKNEY
SURBITON
AVOCA
DE KAMP
B ALMORAL
ZEEKOEGAT
DIAMANDLPM VERTICAL SHAFT
BRAKFONTE IN DECLINEUM2 INCLINE
MIDDEL PUNT HILL
MIDDELPUNT
UMKOANESTADBRAKFONTEIN
KLIPFONTEIN
PASCHASKRAAL
TWICKENHAM
HACKNEY
SURBITON
AVOCA
DE KAMP
B ALMORAL
ZEEKOEGAT
DIAMANDLPM VERTICAL SHAFT
BRAKFONTE IN DECLINEUM2 INCLINE
MIDDEL PUNT HILLLPM VERTICAL SHAFT
BRAKFONTE IN DECLINEUM2 INCLINE
MIDDEL PUNT HILLLPM VERTICAL SHAFT
BRAKFONTE IN DECLINEUM2 INCLINE
MIDDEL PUNT HILL
86
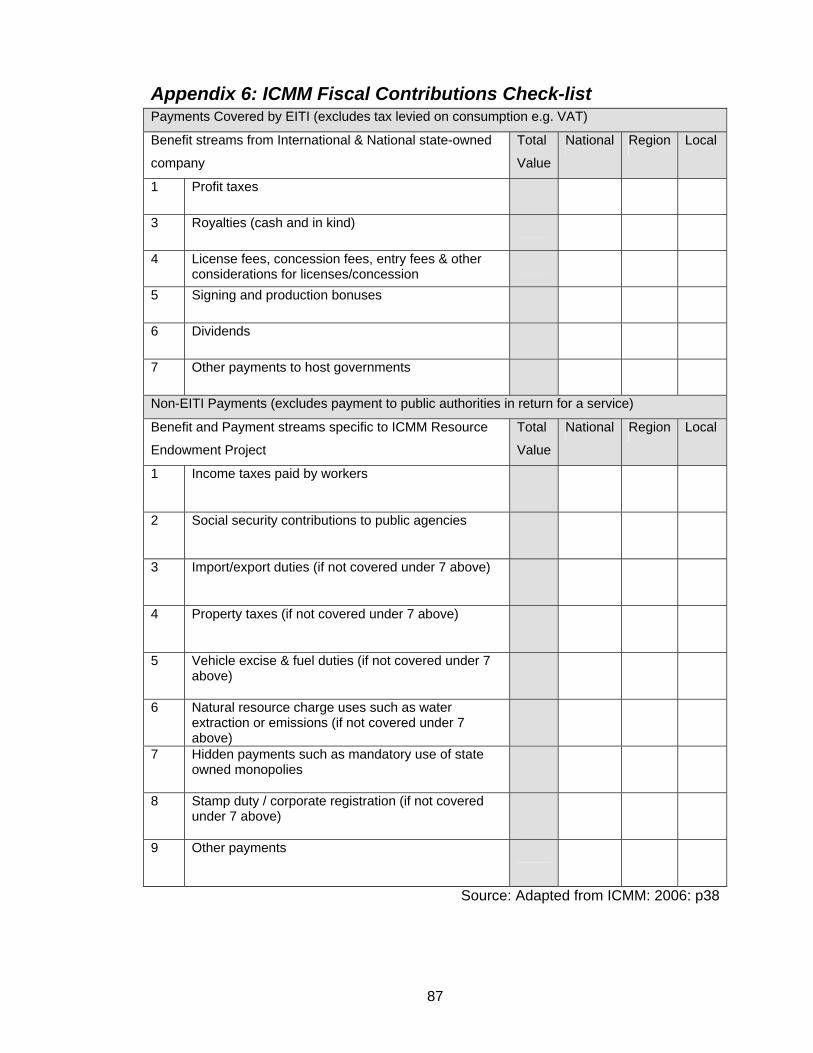
Appendix 6: ICMM Fiscal Contributions Check-list Payments Covered by EITI (excludes tax levied on consumption e.g. VAT)
Benefit streams from International & National state-owned
company
Total
Value
National Region Local
1 Profit taxes
3 Royalties (cash and in kind)
4 License fees, concession fees, entry fees & other considerations for licenses/concession
5 Signing and production bonuses
6 Dividends
7 Other payments to host governments
Non-EITI Payments (excludes payment to public authorities in return for a service)
Benefit and Payment streams specific to ICMM Resource
Endowment Project
Total
Value
National Region Local
1 Income taxes paid by workers
2 Social security contributions to public agencies
3 Import/export duties (if not covered under 7 above)
4 Property taxes (if not covered under 7 above)
5 Vehicle excise & fuel duties (if not covered under 7 above)
6 Natural resource charge uses such as water extraction or emissions (if not covered under 7 above)
7 Hidden payments such as mandatory use of state owned monopolies
8 Stamp duty / corporate registration (if not covered under 7 above)
9 Other payments
Source: Adapted from ICMM: 2006: p38
87
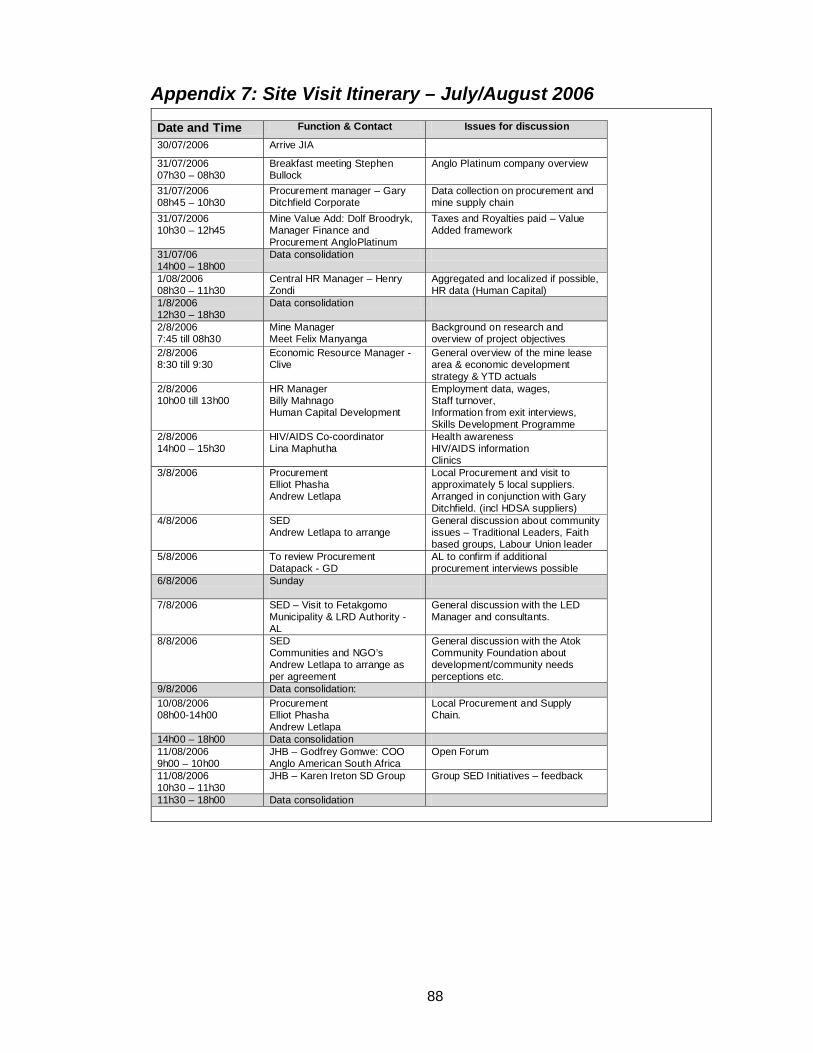
Appendix 7: Site Visit Itinerary – July/August 2006 Date and Time Function & Contact Issues for discussion
30/07/2006 Arrive JIA
31/07/2006 07h30 – 08h30
Breakfast meeting Stephen Bullock
Anglo Platinum company overview
31/07/2006 08h45 – 10h30
Procurement manager – Gary Ditchfield Corporate
Data collection on procurement and mine supply chain
31/07/2006 10h30 – 12h45
Mine Value Add: Dolf Broodryk, Manager Finance and Procurement AngloPlatinum
Taxes and Royalties paid – Value Added framework
31/07/06 14h00 – 18h00
Data consolidation
1/08/2006 08h30 – 11h30
Central HR Manager – Henry Zondi
Aggregated and localized if possible, HR data (Human Capital)
1/8/2006 12h30 – 18h30
Data consolidation
2/8/2006 7:45 till 08h30
Mine Manager Meet Felix Manyanga
Background on research and overview of project objectives
2/8/2006 8:30 till 9:30
Economic Resource Manager - Clive
General overview of the mine lease area & economic development strategy & YTD actuals
2/8/2006 10h00 till 13h00
HR Manager Billy Mahnago Human Capital Development
Employment data, wages, Staff turnover, Information from exit interviews, Skills Development Programme
2/8/2006 14h00 – 15h30
HIV/AIDS Co-coordinator Lina Maphutha
Health awareness HIV/AIDS information Clinics
3/8/2006 Procurement Elliot Phasha Andrew Letlapa
Local Procurement and visit to approximately 5 local suppliers. Arranged in conjunction with Gary Ditchfield. (incl HDSA suppliers)
4/8/2006 SED Andrew Letlapa to arrange
General discussion about community issues – Traditional Leaders, Faith based groups, Labour Union leader
5/8/2006 To review Procurement Datapack - GD
AL to confirm if additional procurement interviews possible
6/8/2006 Sunday
7/8/2006 SED – Visit to Fetakgomo Municipality & LRD Authority - AL
General discussion with the LED Manager and consultants.
8/8/2006 SED Communities and NGO’s Andrew Letlapa to arrange as per agreement
General discussion with the Atok Community Foundation about development/community needs perceptions etc.
9/8/2006 Data consolidation: 10/08/2006 08h00-14h00
Procurement Elliot Phasha Andrew Letlapa
Local Procurement and Supply Chain.
14h00 – 18h00 Data consolidation 11/08/2006 9h00 – 10h00
JHB – Godfrey Gomwe: COO Anglo American South Africa
Open Forum
11/08/2006 10h30 – 11h30
JHB – Karen Ireton SD Group Group SED Initiatives – feedback
11h30 – 18h00 Data consolidation
88
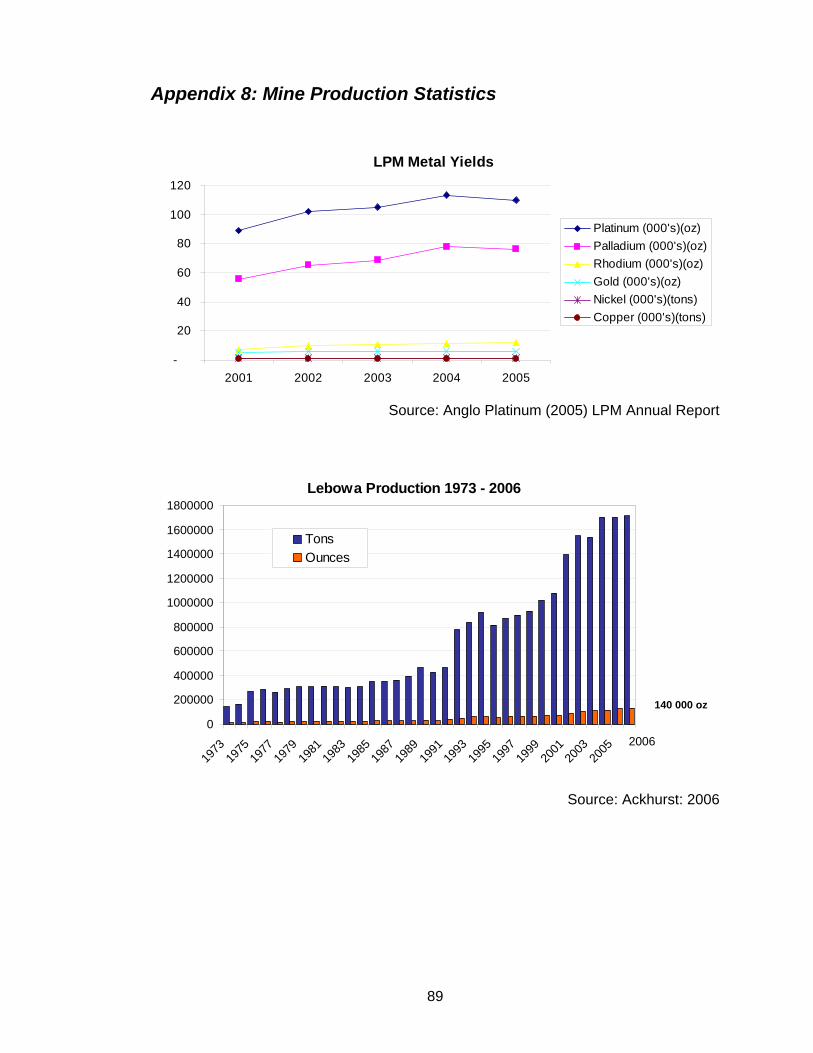
Appendix 8: Mine Production Statistics
LPM Metal Yields
-
20
40
60
80
100
120
2001 2002 2003 2004 2005
Platinum (000's)(oz)Palladium (000's)(oz)Rhodium (000's)(oz)Gold (000's)(oz)Nickel (000's)(tons)Copper (000's)(tons)
Source: Anglo Platinum (2005) LPM Annual Report
Lebowa Production 1973 - 2006
0
200000
400000
600000
800000
1000000
1200000
1400000
1600000
1800000
1973
1975
1977
1979
1981
1983
1985
1987
1989
1991
1993
1995
1997
1999
2001
2003
2005
TonsOunces
2006
140 000 oz
Source: Ackhurst: 2006
89
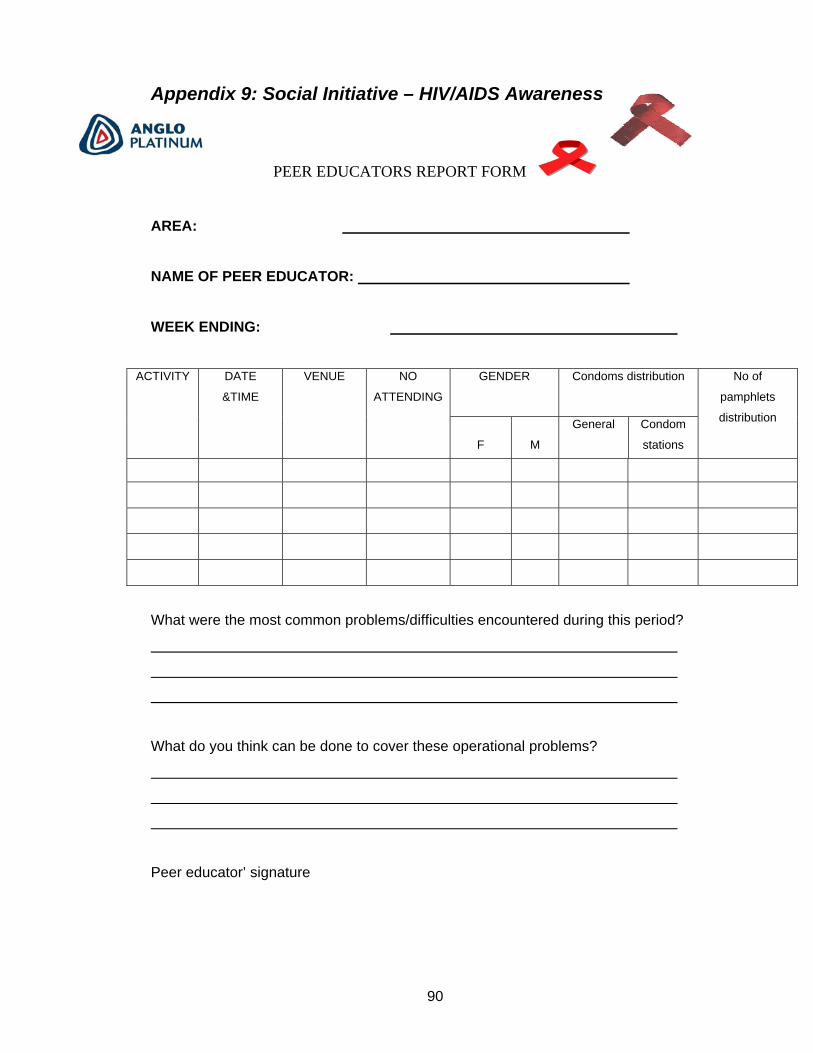
Appendix 9: Social Initiative – HIV/AIDS Awareness
PEER EDUCATORS REPORT FORM
AREA: NAME OF PEER EDUCATOR: WEEK ENDING:
GENDER
Condoms distribution
ACTIVITY DATE
&TIME
VENUE NO
ATTENDING
F
M
General Condom
stations
No of
pamphlets
distribution
What were the most common problems/difficulties encountered during this period?
What do you think can be done to cover these operational problems?
Peer educator’ signature
90
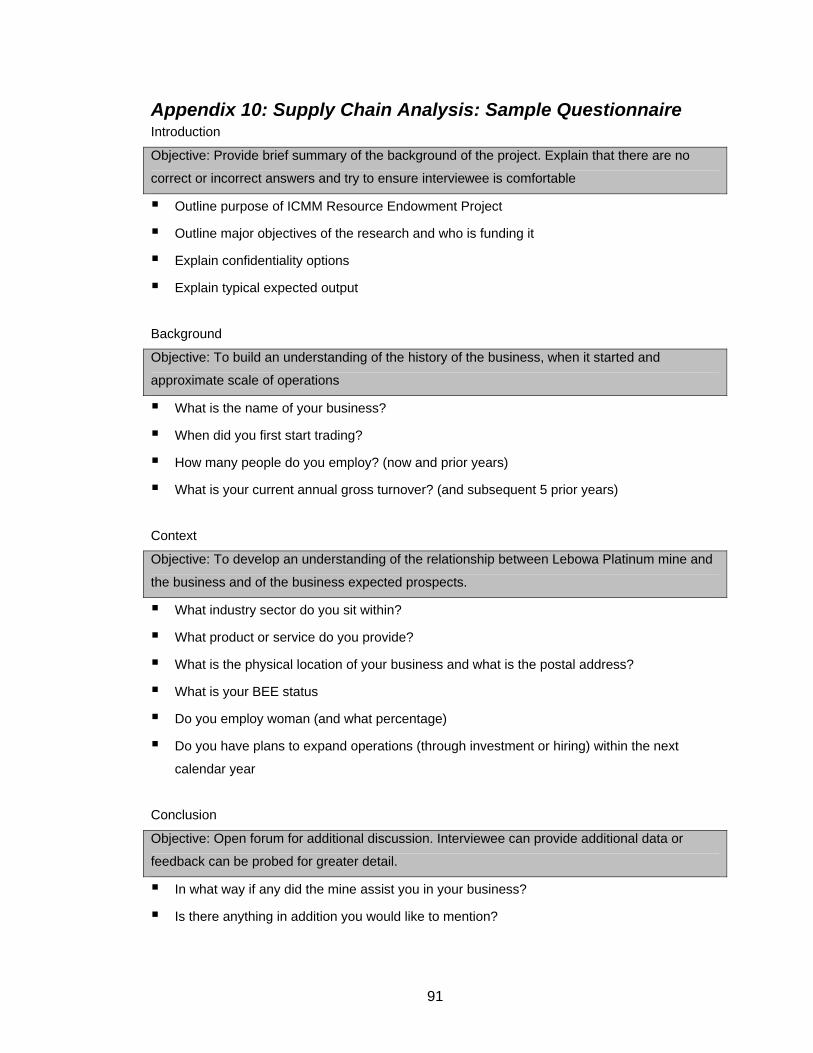
91
Appendix 10: Supply Chain Analysis: Sample Questionnaire Introduction
Objective: Provide brief summary of the background of the project. Explain that there are no
correct or incorrect answers and try to ensure interviewee is comfortable
Outline purpose of ICMM Resource Endowment Project
Outline major objectives of the research and who is funding it
Explain confidentiality options
Explain typical expected output
Background
Objective: To build an understanding of the history of the business, when it started and
ap roximate scale of operations p
What is the name of your business?
When did you first start trading?
How many people do you employ? (now and prior years)
r current annual gross turnover? (and subsequent 5 prior years) What is you
Context
Objective: To develop an understanding of the relationship between Lebowa Platinum mine and
the business and of the business expected prospects.
What industry sector do you sit within?
What product or service do you provide?
what is the postal address?
(and what percentage)
ave plans to expand operations (through investment or hiring) within the next
Con
What is the physical location of your business and
What is your BEE status
Do you employ woman
Do you h
calendar year
clusion
Objective: Open forum for additional discussion. Interviewee can provide additional data or
feedback can be probed for greater detail.
In what way if any did the mine assist you in your business?
Is there anything in addition you would like to mention?
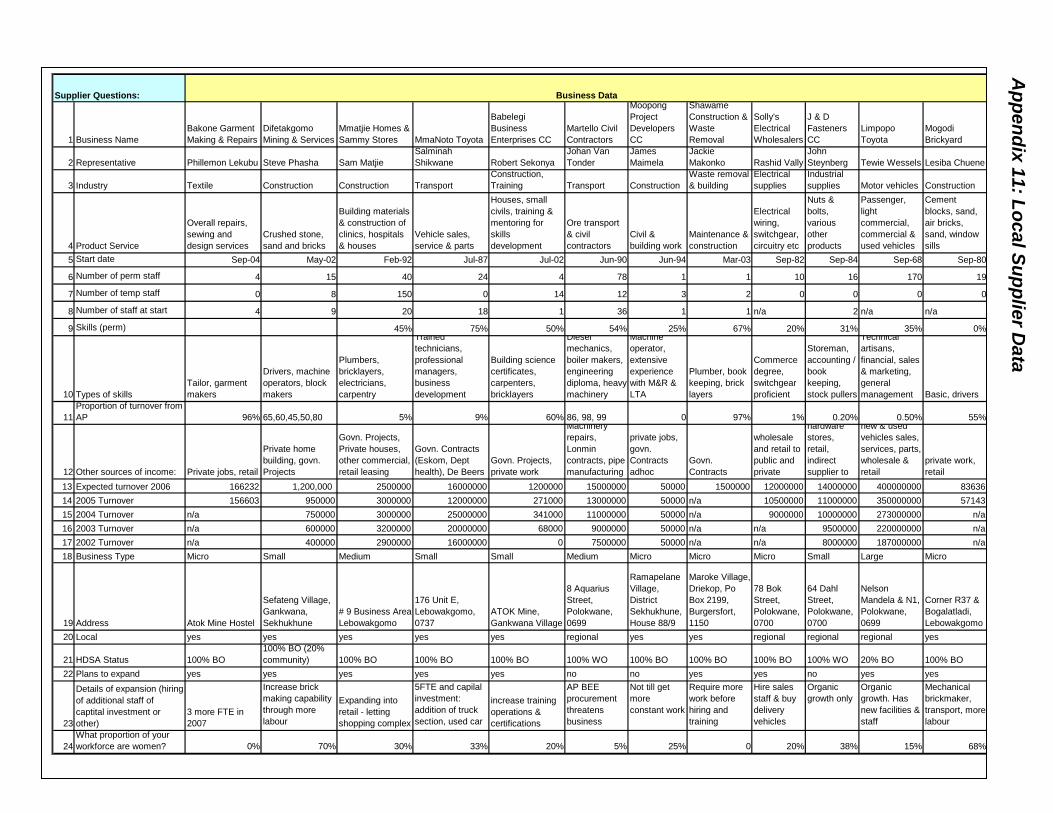
Appendix 11: Local Supplier D
ata
92
1 Business NameBakone Garment Making & Repairs
Difetakgomo Mining & Services
Mmatjie Homes & Sammy Stores MmaNoto Toyota
Babelegi Business Enterprises CC
Martello Civil Contractors
Moopong Project Developers CC
Shawame Construction & Waste Removal
Solly's Electrical Wholesalers
J & D Fasteners CC
Limpopo Toyota
Mogodi Brickyard
entative Phillemon Lekubu Steve Phasha Sam MatjieSalminah Shikwane Robert Sekonya
Johan Van Tonder
James Maimela
Jackie Makonko Rashid Vally
John Steynberg Tewie Wessels Lesiba Ch
ry Textile Construction Construction TransportConstruction, Training Transport Construction
Waste removal & building
Electrical supplies
Industrial supplies Motor vehicles Construction
t Service
Overall repairs, sewing and design services
Crushed stone, sand and bricks
Building materials & construction of clinics, hospitals & houses
Vehicle sales, service & parts
Houses, small civils, training & mentoring for skills development
Ore transport & civil contractors
Civil & building work
Maintenance & construction
Electrical wiring, switchgear, circuitry etc
Nuts & bolts, various other products
Passenger, light commercial, commercial & used vehicles
Cement blocks, saair bricks,sand, windowsills
date Sep-04 May-02 Feb-92 Jul-87 Jul-02 Jun-90 Jun-94 Mar-03 Sep-82 Sep-84 Sep-68 S
ber of perm staff 4 15 40 24 4 78 1 1 10 16 170
2 Repres uene
3 Indust
4 Produc
nd,
5 Start ep-80
6 Num 19
7 Num 0
8 Num
9 Skills (perm 0%
10 Types
ber of temp staff 0 8 150 0 14 12 3 2 0 0 0
ber of staff at start 4 9 20 18 1 36 1 1 n/a 2 n/a n/a
) 45% 75% 50% 54% 25% 67% 20% 31% 35%
of skillsTailor, garment makers
Drivers, machine operators, block makers
Plumbers, bricklayers, electricians, carpentry
Trained technicians, professional managers, business development
Building science certificates, carpenters, bricklayers
Diesel mechanics, boiler makers, engineering diploma, heavy machinery
Machine operator, extensive experience with M&R & LTA
Plumber, book keeping, brick layers
Commerce degree, switchgear proficient
Storeman, accounting / book keeping, stock pullers
Technical artisans, financial, sales & marketing, general management Basic, driv
on of turnover from 96% 65,60,45,50,80 5% 9% 60% 86, 98, 99 0 97% 1% 0.20% 0.50%
sources of income: Private jobs, retail
Private home building, govn. Projects
Govn. Projects, Private houses, other commercial, retail leasing
Govn. Contracts (Eskom, Dept health), De Beers
Govn. Projects, private work
ers
11ProportiAP 55%
12 Other
Machinery repairs, Lonmin contracts, pipe manufacturing
private jobs, govn. Contracts adhoc
Govn. Contracts
wholesale and retail to public and private
hardware stores, retail, indirect supplier to
new & used vehicles sales, services, parts, wholesale & retail
private workretail
ted turnover 2006 166232 1,200,000 2500000 16000000 1200000 15000000 50000 1500000 12000000 14000000 400000000 8urnover 156603 950000 3000000 12000000 271000 13000000 50000 n/a 10500000 11000000 350000000 5urnover n/a 750000 3000000 25000000 341000 11000000 50000 n/a 9000000 10000000 273000000urnover n/a 600000 3200000 20000000 68000 9000000 50000 n/a n/a 9500000 220000000urnover n/a 400000 2900000 16000000 0 7500000 50000 n/a n/a 8000000 187000000s Type Micro Small Medium Small Small Medium Micro Micro Micro Small Large Micro
s Atok Mine Hostel
Sefateng Village, Gankwana, Sekhukhune
# 9 Business Area Lebowakgomo
176 Unit E, Lebowakgomo, 0737
ATOK Mine, Gankwana Village
8 Aquarius Street, Polokwane, 0699
Ramapelane Village, District Sekhukhune, House 88/9
Maroke Village, Driekop, Po Box 2199, Burgersfort, 1150
78 Bok Street, Polokwane, 0700
64 Dahl Street, Polokwane, 0700
Nelson Mandela & N1, Polokwane, 0699
Corner R3Bogalatladi,Lebowakgom
yes yes yes yes yes regional yes yes regional regional regional yes
A Status 100% BO100% BO (20% community) 100% BO 100% BO 100% BO 100% WO 100% BO 100% BO 100% BO 100% WO 20% BO 100% BO
to expand yes yes yes yes yes no no yes yes no yes yesils of expansion (hiring
ional staff of estment or
)3 more FTE in 2007
Increase brick making capability through more labour
Expanding into retail - letting shopping complex
5FTE and capilal investment: addition of truck section, used car
,
13 Expec 363614 2005 T 714315 2004 T n/a16 2003 T n/a17 2002 T n/a18 Busines
19 Addres
7 &
o20 Local
21 HDS22 Plans
23
Detaof additcaptital invother
l ti
increase training operations & certifications
AP BEE procurement threatens business
Not till get more constant work
Require more work before hiring and training
Hire sales staff & buy delivery vehicles
Organic growth only
Organic growth. Has new facilities & staff
Mechanicbrickmaker, transport, mlabour
proportion of your force are women? 0% 70% 30% 33% 20% 5% 25% 0 20% 38% 15%
Business Dataons:
al
ore
24Whatwork 68%
Supplier Questi
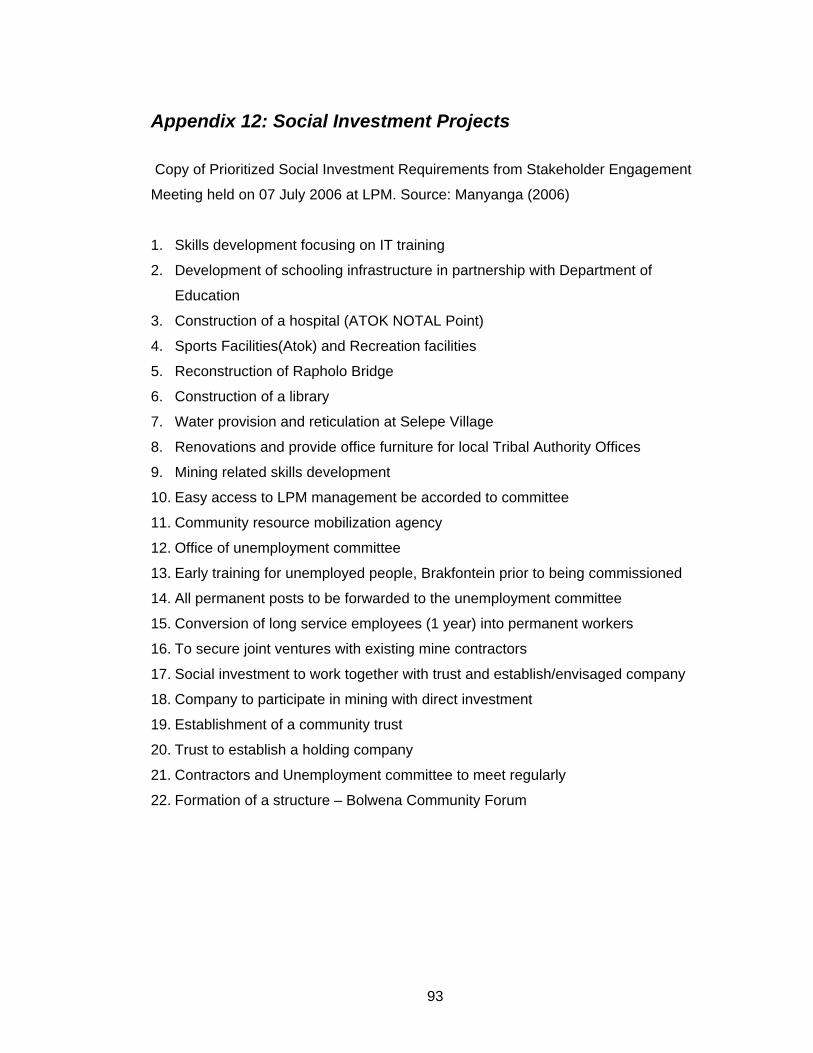
Appendix 12: Social Investment Projects
Copy of Prioritized Social Investment Requirements from Stakeholder Engagement
Meeting held on 07 July 2006 at LPM. Source: Manyanga (2006)
1. Skills development focusing on IT training
2. Development of schooling infrastructure in partnership with Department of
Education
3. Construction of a hospital (ATOK NOTAL Point)
4. Sports Facilities(Atok) and Recreation facilities
5. Reconstruction of Rapholo Bridge
6. Construction of a library
7. Water provision and reticulation at Selepe Village
8. Renovations and provide office furniture for local Tribal Authority Offices
9. Mining related skills development
10. Easy access to LPM management be accorded to committee
11. Community resource mobilization agency
12. Office of unemployment committee
13. Early training for unemployed people, Brakfontein prior to being commissioned
14. All permanent posts to be forwarded to the unemployment committee
15. Conversion of long service employees (1 year) into permanent workers
16. To secure joint ventures with existing mine contractors
17. Social investment to work together with trust and establish/envisaged company
18. Company to participate in mining with direct investment
19. Establishment of a community trust
20. Trust to establish a holding company
21. Contractors and Unemployment committee to meet regularly
22. Formation of a structure – Bolwena Community Forum
93
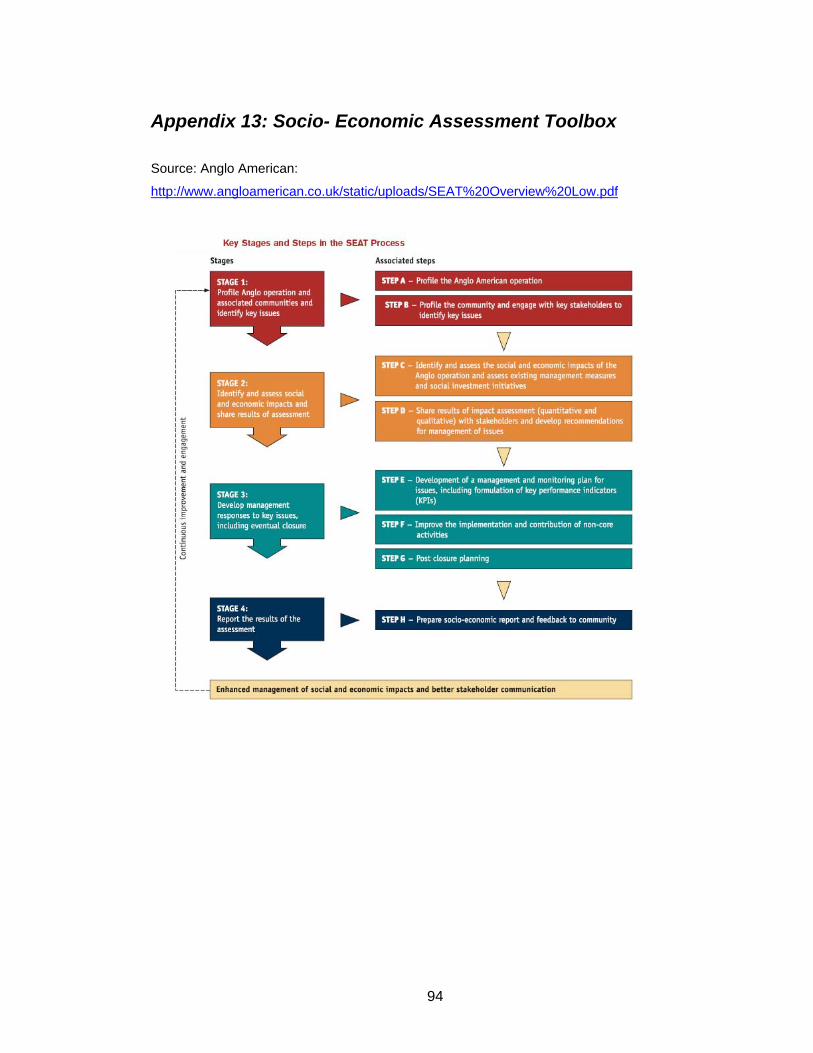
Appendix 13: Socio- Economic Assessment Toolbox Source: Anglo American:
http://www.angloamerican.co.uk/static/uploads/SEAT%20Overview%20Low.pdf
94

Appendix 14: VCT Initiatives at LPM (2006 YTD)
The Table above represents testing carried out at LPM in 2006 as part of the HIV/AIDS Voluntary Counseling and Testing Programme.
HIV/AIDS VCT Programme: LPM 2006 (till end June 2006)
VCT TEST POSITIVE NEGATIVE VCT TEST POSITIVE NEGATIVE
January 187 73 14 59 258 94 15 79ebruary 191 103 11 92 247 122 21 101
March 166 104 9 95 221 110 18 92ril 90 52 4 48 341 149 19 130y 157 110 11 99 488 224 37 187
ne 241 133 8 125 318 147 22 12
F
ApMa
5JuL 1576 751 57 518 1555TOTA 846 132 714
CONTRACTORSEMPLOYEES
95
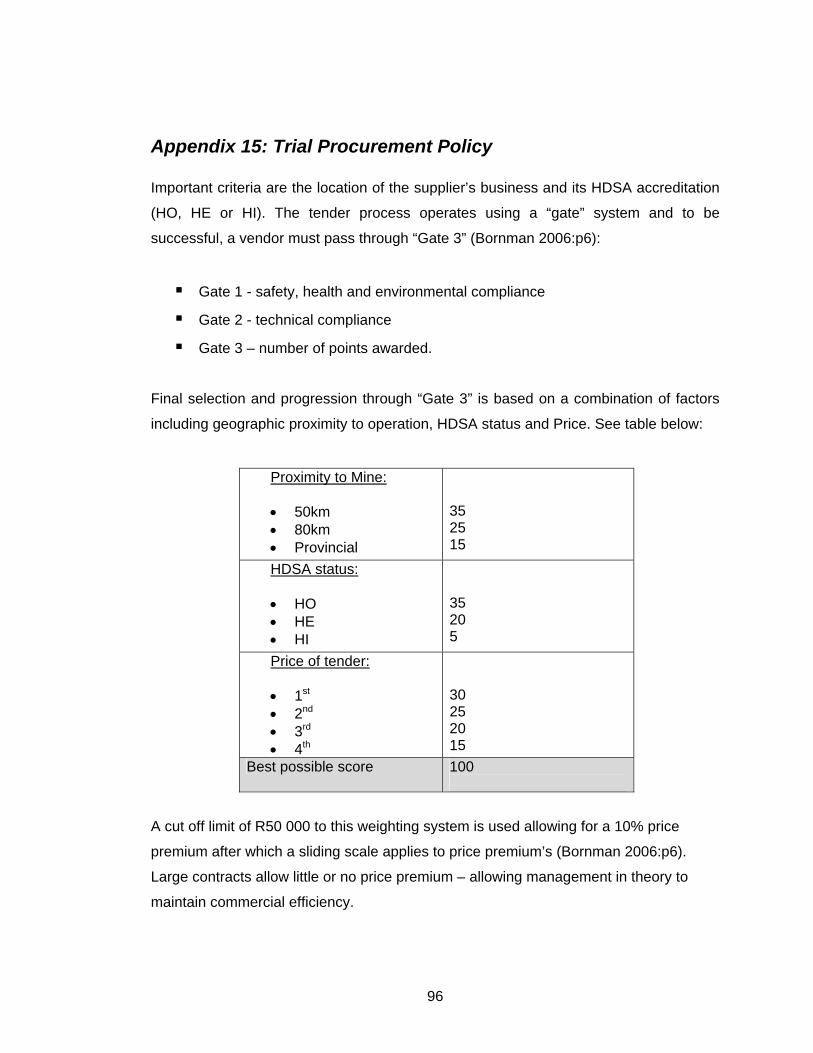
Appendix 15: Trial Procurement Policy Important criteria are the location of the supplier’s business and its HDSA accreditation
(HO, HE or HI). The tender process operates using a “gate” system and to be
successful, a vendor must pass through “Gate 3” (Bornman 2006:p6):
Gate 1 - safety, health and environmental compliance
Gate 2 - technical compliance
Gate 3 – number of points awarded.
Final selection and progression through “Gate 3” is based on a combination of factors
including geographic proximity to operation, HDSA status and Price. See table below:
Proximity to Mine: • 50km • 80km • Provincial
35 25 15
HDSA status: • HO • HE • HI
35
205
Price of tender:
st• 1 nd• 2 rd• 3 th• 4
30 25 20 15
Best possible score 100
A cut off limit of R50 000 to this weighting system is used allowing for a 10% price
premium after which a sliding scale applies to price premium’s (Bornman 2006:p6).
Large contracts allow little or no price premium – allowing management in theory to
maintain commercial efficiency.
96
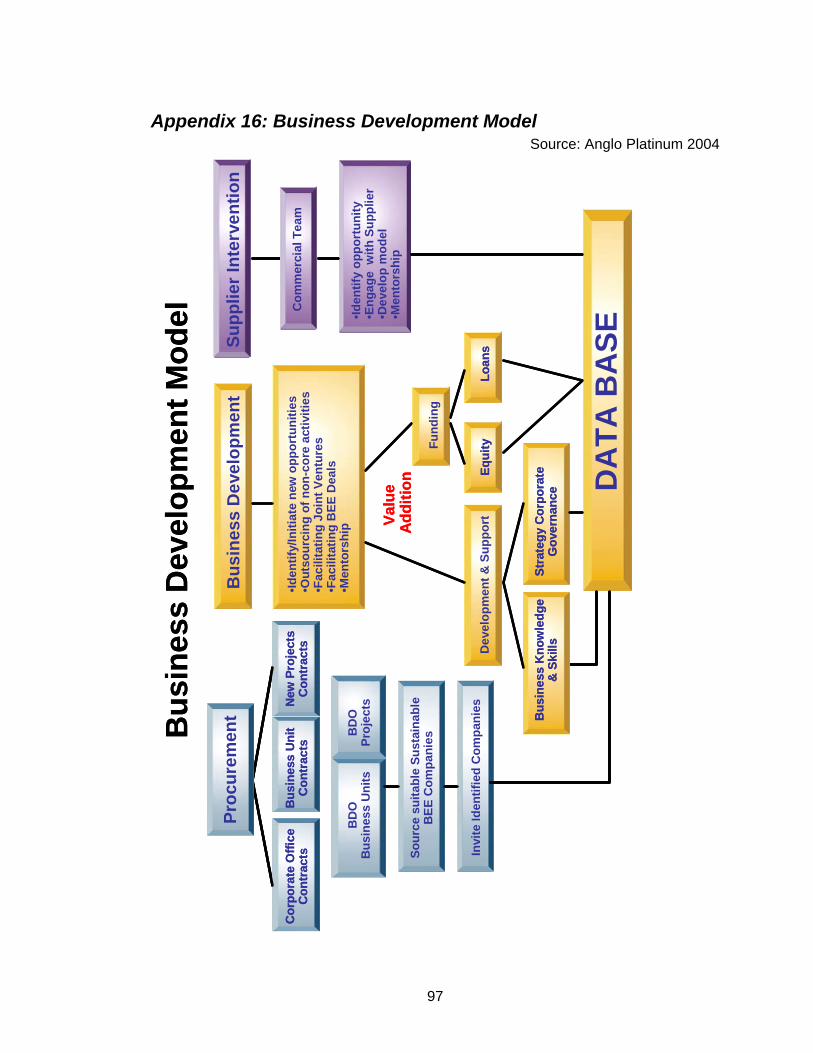
Appendix 16: Business Development Model Source: Anglo Platinum 2004
Cor
pora
te O
ffice
Con
trac
tsB
usin
ess
Uni
tC
ontr
acts
New
Pro
ject
sC
ontr
acts
BD
OB
usin
ess
Uni
tsB
DO
Proj
ects
Sour
ce s
uita
ble
Sust
aina
ble
BEE
Com
pani
es
Invi
te Id
entif
ied
Com
pani
es
•Iden
t•E
n•D
ev•M
e
ify o
ppor
tuni
tyga
ge w
ith S
uppl
ier
elop
mod
elnt
orsh
ip
Com
mer
cial
Tea
m
Proc
urem
ent
Bus
ines
s D
evel
opm
ent
DA
TA B
ASE
•Iden
tify/
Initi
ate
new
opp
ortu
nitie
s•O
utso
urci
ng o
f non
-cor
e ac
tiviti
es•F
acili
tatin
g Jo
int V
entu
res
•Fac
ilita
ting
BEE
Dea
ls•M
ento
rshi
p
Stra
tegy
Cor
pora
teG
over
nanc
eB
usin
ess
Kno
wle
dge
& S
killsDev
elop
men
t & S
uppo
rt
Fund
ing
Loan
sEq
uity
Valu
eAd
ditio
n
Bus
ines
s D
evel
opm
ent M
odel
Supp
lier I
nter
vent
ion
Cor
pora
te O
ffice
Con
trac
tsB
usin
ess
Uni
tC
ontr
acts
New
Pro
ject
sC
ontr
acts
BD
OB
usin
ess
Uni
tsB
DO
Proj
ects
Sour
ce s
uita
ble
Sust
aina
ble
BEE
Com
pani
es
Invi
te Id
entif
ied
Com
pani
es
Cor
pora
te O
ffice
Con
trac
tsB
usin
ess
Uni
tC
ontr
acts
New
Pro
ject
sC
ontr
acts
Cor
pora
te O
ffice
Con
trac
tsB
usin
ess
Uni
tC
ontr
acts
New
Pro
ject
sC
ontr
acts
BD
OB
usin
ess
Uni
tsB
DO
Proj
ects
Sour
ce s
uita
ble
Sust
aina
ble
BEE
Com
pani
es
Invi
te Id
entif
ied
Com
pani
es
•Iden
tify
oppo
rtun
ity•E
ngag
e w
ith S
uppl
ier
•Dev
elop
mod
el•M
ento
rshi
p
Com
mer
cial
Tea
m
•Iden
tify
oppo
rtun
ity•E
ngag
e w
ith S
uppl
ier
•Dev
elop
mod
el•M
ento
rshi
p
Com
mer
cial
Tea
m
Proc
urem
ent
Bus
ines
s D
evel
opm
ent
Bus
ines
s D
evel
opm
ent M
odel
Supp
lier I
nter
vent
ion
DA
TA B
ASE
DA
TA B
ASE
DA
TA B
ASE
•Iden
tify/
Initi
ate
new
opp
ortu
nitie
s•O
utso
urci
ng o
f non
-cor
e ac
tiviti
es•F
acili
tatin
g Jo
int V
entu
res
•Fac
ilita
ting
BEE
Dea
ls•M
ento
rshi
p
Dev
elop
men
t & S
uppo
rt
Fund
ing
Loan
sEq
uity
Loan
sEq
uity
Stra
tegy
Cor
pora
teG
over
nanc
eB
usin
ess
Kno
wle
dge
& S
kills
Stra
tegy
Cor
pora
teG
over
nanc
eB
usin
ess
Kno
wle
dge
& S
kills
Valu
eAd
ditio
n
97

98