ECONOMIC SURVEY ASIA AND THE FAR EAST - United ...
180
Economic Analysis and Survey Branch NATIONS ECONOMIC SURVEY OF ASIA AND THE FAR EAST 1960 Also issued as Vol. XI, No. 4 of the ECONOMIC BULLETIN FOR ASIA AND THE FAR EAST Bangkok 1961 UNITED
-
Upload
khangminh22 -
Category
Documents
-
view
3 -
download
0
Transcript of ECONOMIC SURVEY ASIA AND THE FAR EAST - United ...

Economic Analysis and Survey Branch
NATIONS
ECONOMIC SURVEYOF
ASIA AND THE FAR EAST
1 9 6 0
A lso issued as Vol. XI, No. 4 of the
ECONOMIC BULLETIN FOR A SIA AND THE FAR EAST
Bangkok
1 9 6 1
UNI TED

Since the 1957 issue, the Economic Survey o f Asia and the Far East has, in addition to part I on
the current economic situation of the region, contained a study on some m ajor aspect, or problem, of Asian
economy in part II, as below:
1957: Postwar problems of economic development
1958: Review of postwar industrialization
1959: Foreign trade of ECAFE prim ary exporting countries
1960: Public finance in the postwar period
UNITED NATIONS PUBLICATION
Sales Number: 61.I I .F.1
Price: US$3.00; 2 1 /— stg.; Sw. fr. 13.00
(or equivalent in other currencies)
i i
PREFATORY NOTE
The present Survey is the fourteenth in a series of reports prepared annually by the secretariat of the Economic Commission for Asia and the Far East. A major object of these Surveys, and of the quarterly Economic Bulletins which supplement them, is the analysis of recent economic developments in, and affecting, the countries of Asia and the Far East in so far as these developments are shaped by, and help to determine, their policies.
Following the usual pattern, part I of the present report reviews the economic situation in the ECAFE region in 1960, on the basis of the information available to the secretariat up to the time the survey was written (January 1961). Part II is devoted to a review of public finance in the postwar period — the increasing role of the public sector, government expenditure, government revenue
and fiscal policies.
The Survey is published solely on the responsibility of the secretariat, and the views expressed therein should not be attributed to the Commission or its member governments.
Bangkok, March 1961.
iii
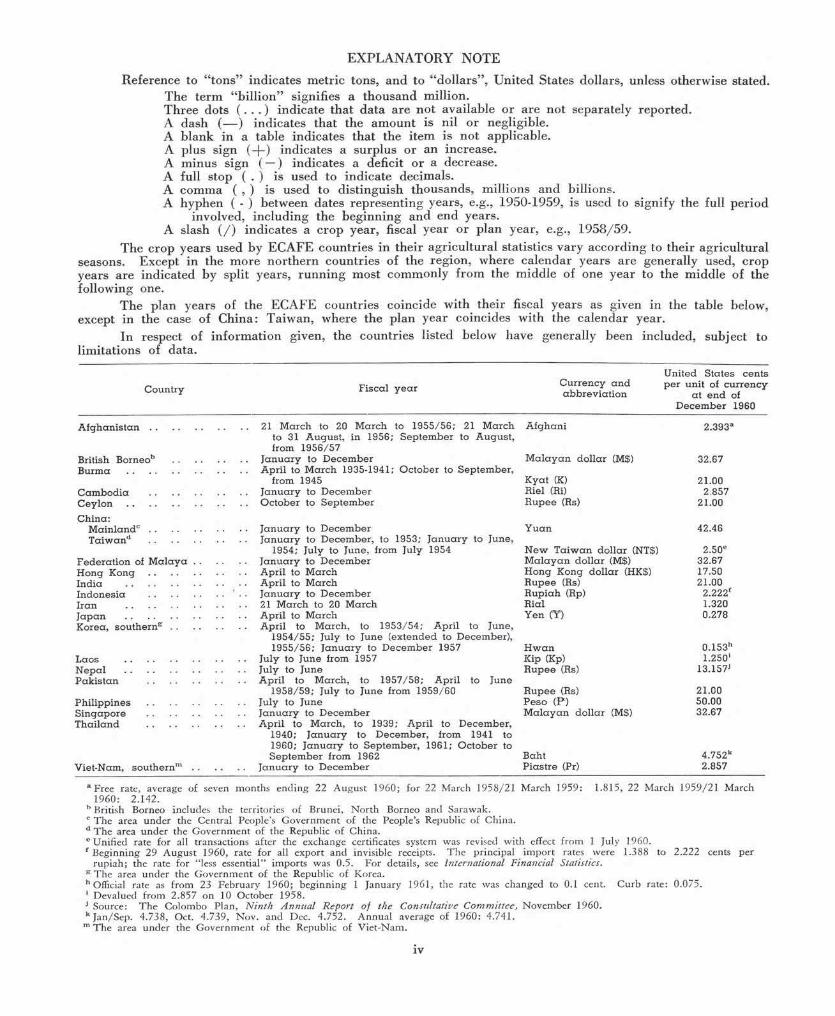
EX PLA N A TO R Y N O TE
Reference to “to n s” indicates m etric tons, and to “ dollars” , U nited States dollars, unless otherwise stated.The te rm “billion” signifies a thousand million.T hree dots ( . . . ) indicate th a t da ta are n o t available or are not separately reported.A dash (— ) indicates tha t the am ount is nil o r negligible.A b lank in a table indicates th a t the item is no t applicable.A plus sign (+ ) indicates a surplus or an increase.A m inus sign ( —) indicates a deficit o r a decrease.A full stop ( . ) is used to indicate decimals.A com m a ( , ) is used to d istinguish thousands, m illions and billions.A hyphen ( - ) between dates representing years, e.g., 1950-1959, is used to signify the full period
involved, including the beginning and end years.A slash ( / ) indicates a crop year, fiscal year or p lan year, e.g., 1958/59.
The crop years used by ECA FE coun tries in the ir ag ricu ltu ra l statistics vary according to the ir agricu ltura l seasons. Except in the m ore n o rth e rn countries of the region, where ca lendar years are generally used, crop years are indicated by split years, ru n n in g m ost com m only from the m iddle of one year to the m iddle of the following one.
The p lan years of the ECA FE countries coincide w ith the ir fiscal years as given in the table below, except in the case of C hina: Taiw an, where the p lan year coincides w ith the ca lendar year.
In respect of in form ation given, the countries listed below have generally been included, subject to lim itations of data.
United S ta tes centsFiscal y e a r C urrency a n d
ab b rev ia t io np e r unit of cu rrency
a t e n d of D ecem ber 1960
21 M arch to 20 M arch to 1955/56; 21 M arch to 31 A ugust, in 1956; Sep tem ber to A ugust, from 1956/57
A fghani 2.393a
Ja n u a ry to D ecem ber M a la y a n do lla r (M$) 32.67April to M arch 1935-1941; O ctober to Septem ber,
from 1945 K yat (K) 21.00 Ja n u a ry to D ecem ber Riel (Ri) 2.857
O ctober to Sep tem ber R upee (Rs) 21.00
Ja n u a ry to D ecem ber Y uan 42.46Ja n u a ry to D ecem ber, to 1953; J a n u a ry to June,
1954; July to June, from July 1954 N ew T a iw a n do lla r (NT$) 2.50eJa n u a ry to D ecem ber M a la y a n do lla r (M$) 32.67April to M arch H ong Kong do lla r (HK$) 17.50April to M arch R upee (Rs) 21.00
J a n u a ry to D ecem ber R u p iah (Rp) 2.222f21 M arch to 20 M arch Rial 1.320April to M arch Y en (¥) 0.278
April to M arch, to 1953/54; April to June, 1954/55; July to June (ex tended to December),1955/56; Ja n u a ry to D ecem ber 1957 H w an 0.153h
July to June from 1957 Kip (Kp) 1.250iJuly to June R u p ee (Rs) 13.157jA pril to M arch, to 1957/58; April to June
1958/59; July to June from 1959/60 R upee (Rs) 21.00
a Free rate, average of seven months ending 22 August 1960; for 22 March 1958/21 March 1959: 1.815, 22 March 1959/21 March 1960: 2.142.
b British Borneo includes the territories of Brunei, North Borneo and Sarawak. c The area under the Central People’s Government of the People’s Republic of China. d The area under the Government of the Republic of China.e Unified rate for all transactions after the exchange certificates system was revised with effect from 1 July 1960.f Beginning 29 August 1960, rate for all export and invisible receipts. The principal im port rates were 1.388 to 2.222 cents per
rupiah; the rate for “ less essential” imports was 0.5. For details, see International Financial Statistics. g T he area under the Government of the Republic of Korea.h Official rate as from 23 February 1960; beginning 1 January 1961, the rate was changed to 0.1 cent. Curb rate: 0.075.i Devalued from 2.857 on 10 October 1958.j Source: The Colombo Plan, Ninth A nnual Report of the Consultative Committee, November 1960. k Jan/Sep. 4.738, Oct. 4.739, Nov. and Dec. 4.752. Annual average of 1960: 4.741. m The area under the Government of the Republic of Viet-Nam.
iv
C ountry
A fghan istan
British BorneobBurm a .....................
C am bodia C eylon .....................C hina:
M ain landcT a iw a n d
Federation of M a lay a H ong KongInd ia .....................IndonesiaIran .....................J a p a n .....................Korea, sou therng . .
Laos .....................N e p a l .....................P ak is tan
PhilippinesS ingaporeT hailand
Viet-Nam, sou the rnm
PesoM a la y a n do lla r (M$)
BahtP ias tre (Pr)
July to June J a n u a ry to D ecem berApril to M arch, to 1939; A pril to D ecem ber,
1940; J a n u a ry to D ecem ber, from 1941 to 1960; J a n u a ry to Sep tem ber, 1961; O ctober to Sep tem ber from 1962
J a n u a ry to D ecem ber
50.0032.67
4.752k2.857

C O N T E N T S
PageIN TR O DUCTIO N .......................................................................................................................................................................................... 1
P a r t I. T h e ECAFE R e g i o n i n 1960Chapter
1. P r o d u c t i o n .......................................................................................................................................................................................... 5Agricultural production ................................................................................................................................................. 5Food production in relation to population t r e n d s .............................................................................................. 8Industrial p r o d u c t i o n ............................................................................................................................................................ 15
2. F o r e i g n t r a d e ................................................................................................................................................................................ 21General trends .................................................................................... ................................................................................. 21E x p o r t s .......................................................................................................................................................................................... 25I m p o r t s .......................................................................................................................................................................................... 36
3. A g g r e g a t e d e m a n d a n d a l l o c a t i o n o f r e s o u r c e s .............................................................................................. 40The trend of aggregate d e m a n d ....................................................................................................................................... 40N ational financial p o l i c i e s ................................................................................................................................................. 41Allocation of resources ................................................................................................................................................. 49
P a r t I I . P u b l i c F i n a n c e i n t h e P o s t w a r P e r i o d
4. T h e i n c r e a s i n g r o l e o f t h e p u b l i c s e c t o r ................................................................................................................... 53Historical s e t t i n g ...................................................................................................................................................................... 53Planning and the extension of state c o n t r o l ......................................................................................................... 54The size and growth of the public s e c t o r ................................................................................................................... 55The objectives for fiscal polic ies ............................................................................................................................. 57Explanatory note on sources, time reference and coverage and definitions of terms . . . . 63
5. Go v e r n m e n t e x p e n d i t u r e ........................................................................................................................................................... 65The volum e of governm ent e x p e n d i t u r e ................................................................................................................... 65The classification o f governm ent expenditure .............................................................................................. 69The size and growth o f governm ent investm ent .............................................................................................. 70Distribution of public investment ............................................................................................................................. 74Government expenditure on social services ......................................................................................................... 77Government expenditure on general s e r v i c e s ......................................................................................................... 81
6. Go v e r n m e n t r e v e n u e ...................................................................................................................................................................... 84The volum e of governm ent r e v e n u e ............................................................................................................................. 84Taxes on foreign trade ................................................................................................................................................. 86Taxes on internal t r a n s a c t i o n s ....................................................................................................................................... 91Taxes on incom e and wealth ....................................................................................................................................... 92
R ationalization of revenue system and a d m i n i s t r a t i o n .................................................................................... 101
7. F i s c a l p o l i c i e s ................................................................................................................................................................................104The emphasis in fiscal p o l i c i e s ....................................................................................................................................... 104Budget deficits ......................................................................................................................................................................105Impact of deficit financing on the e c o n o m y .........................................................................................................107Fiscal polic ies in operation: selected case s t u d i e s .............................................................................................. 109
A SIA N ECONOM IC ST A T IST IC S ................................................................................................................................................. 121
V

Page
6
10
11
17
21
22
23
2627
28
30
36
38
41
50
51
56
575859
67
67
68
7172
74
7579
80
LIST OF T A B L E S
P a r t I. T h e ECAFE R e g i o n i n 1960
1. ECAFE region: Production of food crops, 1948-1952 and 1956-1960 ................................................
2. ECAFE countries: Postwar trends in food supplies available for human c o n su m p tio n .....................
3. ECAFE countries: Calorie and protein content of postwar food s u p p l ie s ................................................
4. ECAFE region: Industrial production, 1957-1960 ..............................................................................................
5. W orld industrial production and foreign trade, 1957-1960 ............................................................................
6. ECAFE region: Balance of trade, 1958-1960 .......................................................................................................
7. Centrally planned economies of Asia: Foreign trade, 1957-1960 ..........................................................
8. ECAFE region: Exports, 1958-1960 .........................................................................................................................
9. ECAFE region: Production, volume of exports and prices of export commodities, 1959-1960
10. ECAFE countries: Exports of manufactured goods, 1957-1960 ...................................................................
11. Principal industrial countries of the world: Productivity, employment, wages and labour costs,1953-1958 ..............................................................................................................................................................
12. ECAFE region: Imports, 1958-1960 .........................................................................................................................
13. ECAFE region: Net trade in and supply of cereals, 1955-1960 .........................................................
14. ECAFE countries: Indices of money supply and prices, 1958-1960 .........................................................
15. ECAFE countries: Supply and allocation of aggregate resources, 1960 ................................................
16. ECAFE countries: Government expenditure under developmental heads, 1958-1960 ..............................
P a r t II. P u b l i c F i n a n c e i n t h e P o s t w a r P e r i o d
17. ECAFE countries: Share of public sector in gross national e x p e n d i tu re ................................................18. ECAFE countries: Income from public administration and d e f e n c e .........................................................
19. ECAFE countries: Government draft on the private s e c t o r ............................................................................20. ECAFE countries: Allocation of gross national product ............................................................................
21. ECAFE countries: Indices of growth of government expenditure, government revenue and prices,1958 ................................................................................................................................................................................
22. ECAFE countries: Government expenditure, 1950-1958 ............................................................................
23. Mainland China: Sectoral shares in national income, 1952-1957 ..........................................................
24. ECAFE countries: Government investment, 1950-1958 .....................................................................................
25. ECAFE countries: Share of investment in government expenditure, 1950-1958 ..............................
26. Japan: Trends in the volume and distribution of central government loans and investment, 1952-1959
27. ECAFE countries: Distribution of public investment, 1950-1959 ...................................................................
28. ECAFE countries: Functional distribution of government expenditure ................................................
29. Ceylon: Distribution of government expenditure, 1948-1958 ...................................................................
vi
Page
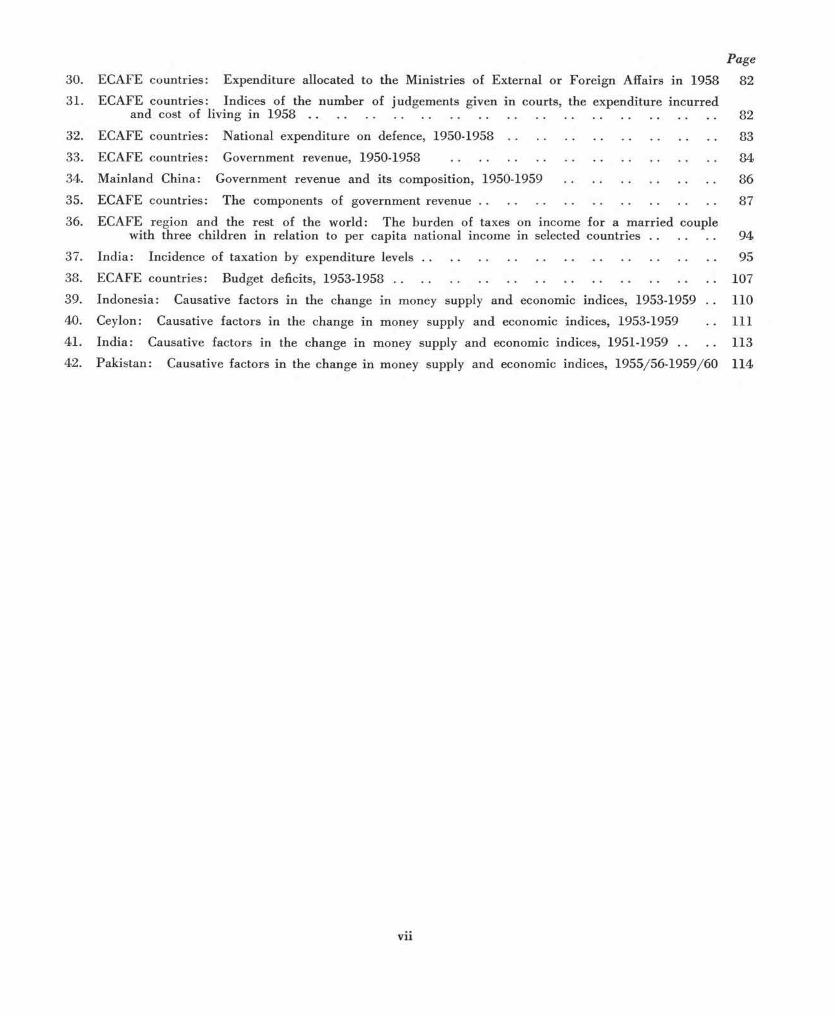
30. ECAFE countries: Expenditure allocated to the Ministries of External or Foreign Affairs in 1958 8231. ECAFE countries: Indices of the number of judgements given in courts, the expenditure incurred
and cost of living in 1958 .................................................................................................................................. 82
32. ECAFE countries: National expenditure on defence, 1950-1958 .................................................................. 83
33. ECAFE countries: Government revenue, 1950-1958 .................................................................................... 84
34. Mainland China: Government revenue and its composition, 1950-1959 ................................................ 86
35. ECAFE countries: The components of government r e v e n u e ........................................................................... 87
36. ECAFE region and the rest of the world: The burden of taxes on income for a m arried couplewith three children in relation to per capita national income in selected c o u n t r ie s .................... 94
37. India: Incidence of taxation by expenditure le v e ls ............................................................................................. 95
38. ECAFE countries: Budget deficits, 1953-1958 ...................................................................................................... 107
39. Indonesia: Causative factors in the change in money supply and economic indices, 1953-1959 . . 11040. Ceylon: Causative factors in the change in money supply and economic indices, 1953-1959 . . 111
41. India: Causative factors in the change in money supply and economic indices, 1951-1959 . . . . 113
42. Pakistan: Causative factors in the change in money supply and economic indices, 1955/56-1959/60 114
vii

LIST OF C H A R T S
1. ECAFE countries: T rend of per capita food production, 1952/53-1958/59 ....................................... 9
2. Principal regions of the world: Estimated per capita food supplies, 1934-1938 and 1948-1959 . . 9
3. Japan: Direction of international trade, 1953 and 1957-1960 ................................................................... 25
4. ECAFE countries: P er capita gross national product and government expenditure in United Statesdollars, 1958 .............................................................................................................................................................. 66
5. ECAFE countries: Government expenditure com pared with size of per capita gross national product,66 8591
viii
Page

INTRODUCTION
For most countries of the ECAFE region,1 1960 represented further improvement, although the rate of progress was not as striking as it had been in 1959 following upon the moderate setback of the preceding year. Agriculture and industry reached record levels of production. Earnings from exports were higher. More imports were obtained and restrictions on foreign trade and payments eased. However, the year ended worse than it began. Export markets turned soft. Harvest prospects indicated only a slight increase. Mainland China had a good harvest in late 1959, although 1960 crops were damaged by reportedly unprecedented natural calamities; the target of 10 per cent increase in agricultural output remained unfulfilled. Its industrial production, how-ever, continued to advance.
Although the 1959 autumn and 1960 spring and summer crops in the countries of the region yielded an increase over the bumper harvests of the previous year, the rate of rise of food production barely kept pace with the growth in population. Only through an increase in imports was per capita availability of cereals in 1960 maintained at the 1959 level.
In view of the fact that the year was selected by the Food and Agriculure Organization of the United Nations to launch its “Freedom from Hunger” campaign, the opportunity was taken to review the more long-term position of the region in respect of food consumption and nutritional levels. Per capita food production has perhaps not yet caught up with prewar levels. But net imports have increased sharply, with the result that there has been a slight increase in per capita food intake. The diet, how-ever, continues to lack variety and balance; cereals and other starchy foods predominate.
Nutritional aspects are, therefore, receiving greater attention in the formulation of national food policies and plans. Two broad patterns are discernible. Japan, for instance, is reaching levels of real per capita income at which the demand pattern calls for more protein and protective foods, parti-cularly livestock products and fish. But for countries at lower levels of income — that is, for the m ajority of the region’s population — food demand and production efforts are still concentrated on augmenting the supplies of basic starchy foods and pulses. The progress made so far has, on the whole, been poor.
1 For the coverage of the term “E C A FE reg ion” as em ployed in this report, see footnote 1, page 5.
The output of other prim ary products showed mixed trends in 1960. Total non-food agricultural production declined, whereas mining output rose. Up to the second or third quarter (for which information is available), more copra, petroleum, tin and iron ore, and less rubber, cotton, jute and tea were produced.
Manufacturing production continued to advance, stimulated by brisk demand. In the first half of 1960, the regional index was 22 per cent above the first half of 1959 and 11 per cent above the second half of 1959. The percentage gain was the most sub-stantial, not in the countries with lower base weights, but in Japan, the region’s pre-eminent industrial producer. Industrywise, the most striking increases were reported for metals and metal goods.
World trade, excluding the trade of the centrally planned economies with each other, also expanded in conformity with world industrial production. There was, however, a shift in favour of trade between industrial countries, rather than between industrial and the prim ary exporting countries. The combined imports of all industrial countries from the primary exporting countries have remained around $20-22 billion a year since 1957, whereas the annual rate of the trade of industrial countries with one another rose from $39 billion in 1957 to $51 billion in the first half of 1960. World economic growth has not increased the demand for the products of primary exporting countries as it has done for the products of industrial countries.
The improvement in the export earnings of the countries of the region was partly the result of an increase in export prices. In the first half of 1960, prices of rubber and jute rose over 20 per cent; export prices of cotton, tea and tin increased to a smaller extent. On the other hand, the prices of sugar, copra and rice fell, as a result of improved supplies. Crude petroleum prices were also lowered. Import prices rose, but only slightly. The region’s terms of trade improved during the first half of 1960; they were 4 per cent higher than in the first half of 1959. But they were not higher than in the second half of 1959 and, owing to the fall in prices in the latter part of 1960, the year as a whole may not show a gain over 1959. Imports, in the first nine months of the year, rose more than exports in terms of percentage increase; trade deficits, as a result, were enlarged. Nevertheless, the countries were able to increase their foreign assets on account of larger foreign aid.

2 Introduction
Aggregate monetary demand in the countries of the region was higher in 1960 than in 1959. Increased demand for government expenditure and increased private investment continue to be the m ajor factors exerting upward pressure; budget deficits and bank credits are relied upon to finance a significant proportion of this demand. Nevertheless, except in a few countries with special situations, internal stability was maintained. Government revenues have been rising and private savings increasing. Monetary policy has also come to play a more prominent (and more effective) role in several countries. To achieve external balance, countries are intensifying their efforts at export promotion and negotiations for foreign aid. At the same time — and this may not prove an unmixed blessing — they are liberalizing their trade and payments restrictions.
To sum up, the region had an increase in aggregate resources in 1960, largely owing to an increase in production and in imports, which more than made up for the diminution of domestic supplies represented by the rise in its exports. Governments seemed to have increased their claims, mostly for current purposes, as did the private sector for the purposes of investment. Even so, there was no apparent decline in per capita levels of food con-sumption; and some increase was evident in the availability of other consumer goods. As a result, price movements remained mild, either up or down, although concealed inflation in some countries came into the open as a result of the implementation of decontrol policies. But these price rises should prove quite temporary.
A feature of this year’s Survey is a review of postwar developments in the field of public finance. This review begins with an analysis of the forces that have shaped the growth in the size and influence of the public sector in the national economies of the countries of the region. Two m ajor trends emerge. Countries, particularly the newly developing ones, are giving a central place to planning as the mechanism most likely to ensure an efficient allocation and use of national resources. Secondly, the in-fluence or the role of the state is extending beyond the boundaries of public ownership and management.
The growth in the size and the functions of the public sector is reflected in the volume of government expenditure, which has risen both in absolute terms and as a percentage of the gross national product. In general, the more prosperous a country, the more it spends on its government in absolute terms, but this does not necessarily amount to a higher propor-tion of its gross national product.
The analysis of the distribution of government expenditure is made difficult by the absence of a consistent and comprehensive classification of budget-
ary data in functional terms. Broadly speaking, government expenditure is incurred in providing three types of services — economic, social and general. In the performance of economic services, governments have mainly aimed at promoting economic growth; this attempt is largely reflected in their spending on investment. Government investment in the postwar period seems to have predominated over private investment in a number of newly developing Asian countries; the higher allocation to public investment is a reflection not only of the scarcity of private (domestic or foreign) capital, but also of government awareness that the type of investments required cannot be made by the private sector in response to market forces or the profit motive. Governments have, in general, been in agreement in placing emphasis on public investment in the building up of the economic infrastructure — transport, power, irrigation, etc. Only in respect of investment in industry have they differed substantially — on the relative share of public versus private investment and of heavy versus light industries.
In allocating funds for social services, such as education, health, housing and community welfare, governments appear to have experienced difficulties in choosing between the apparently conflicting claims of economic development versus social welfare. There is, in fact, no real antithesis between the two; the expenditure on social services is incurred to service “ a deep and profound human need” , and should be judged on its own merits. An endorsement of such a view should not. however, be mistaken for an approval of indiscriminate give-aways by the govern-ment, which would result in an increase in aggregate consumption at the expense of saving and investment. Governments increasingly recognize the desirability of tempering their enthusiasm for income redistribution with concern for economic growth, since that alone is likely to prove of greater ultimate benefit to the poor than fiscal attempts aimed merely at reallocating current output.
The expenditure on general services, particularly on administration, is also growing. The growth appears to be due to the increase in population and to the increase in per capita consumption of the administrative services provided by the government. Defence spending has shown uneven trends, depending upon the security situation, internal or external, and upon the availability of foreign assistance.
Revenue policies in the postwar period were also assigned new tasks which have drastically changed the criteria by which they were traditionally evaluated. No doubt, revenue has grown in volume in almost all countries of the region. This growth in revenue, however, has been neither commensurate with the growth in expenditure, nor continuous throughout

Introduction 3
the period. The proportion of government revenue to gross national product seems to have stopped rising after a few initial spurts.
This stagnation of the revenue systems of the newly developing economies of Asia is somewhat disconcerting. At the present stage of their economic growth, it is essential that Asian countries have revenue systems which are progressive in relation to the growth in national income. As it is, the inflexi-bility of existing systems is largely explained by the predominance of taxation of foreign trade in the revenue structure. Imports of revenue-yielding items are being restricted in order to protect or encourage domestic production and to conserve foreign exchange for duty-free or low-duty imports of staple foods, raw materials and capital goods. The demand for the region’s exports, principally of prim ary products, remains weak and fluctuating. Export taxes, there-fore, cannot be counted upon to provide steady or increasing revenues; they have proved useful largely during export booms as anti-inflationary measures to siphon off windfall profits. The other methods of taxing foreign trade and payments — export mono-polies, exchange taxes, multiple exchange rates — all suffer from similar structural difficulties, both on the import and the export side.
A more fruitful avenue for revenue growth, in the context of rising levels of domestic production
and expanding income, is opened by taxes on domestic transactions and on income and wealth. The coun-tries have been exploiting these to an increasing extent. In the field of “ indirect” taxation, more and more commodities and services are being brought into the excise tax net, progressivity is being introduced in terms of the articles chosen for duty and the rates imposed, while spending, as such, is being curtailed by the imposition of “ general” sales taxes.
It is, however, the complex of “ direct” taxes on income, expenditure and wealth which provides, as its built-in features, most of the virtues sought of a good tax system: long-term growth and short-term flexibility in yields; equity as among taxpayers; and provision of incentives for saving and investment, and of deterrents from non-essential spending. Re-cognizing these advantages, many newly developing countries have introduced income taxation in the postwar period; those that had it previously have sought to make further refinements. Nevertheless, except in a few special cases, none of the newly developing economies has obtained from the group of income and wealth taxes more than a quarter of its total government revenue, as compared with about a half or more in the developed ones.
This underdevelopment is due to several factors. The taxes exclude from their coverage all but a small proportion of the population and of the national
income. Tax rates in the middle and lower ranges of assessed incomes remain low. There is large-scale avoidance of taxes by companies and by the upper income groups through legal exploitation of the loopholes provided by the limited definition of the tax base, namely, “taxable” profits, income or wealth. Finally, taxes are evaded. The evasion is encouraged partly by punitively high marginal rates of taxes on the upper brackets of personal income and partly by laxity in administration.
How can the countries remodel their revenue systems in such a way as to make them progressive in relation to national income? The measures for taxing the rich do not yield either the revenue or the net increase in national saving which is required for economic growth; taxing the poor may really hurt. The question has to be answered in the light of knowledge as to where exactly the rise in national income occurs, to whom the benefits go, and in what proportion. Current knowledge of the changes in the distribution of income and wealth in the newly developing countries of Asia, and of the volume and patterns of saving in the various income or occupa-tional groups, is mostly in general descriptive terms instead of being based on sound statistical founda-tions. It tends to be subjective and inaccurate.
However, it is possible that dependable informa-tion, arrived at from investigations of the type at present being undertaken in India, may reveal that the swell in national income has been so distributed as to add a dribble to the meagre incomes of the masses. In that event, a question may arise as to whether the masses should be further taxed on their necessities — such as salt, sugar, kerosene and matches — or on their incomes, which is what the land tax does. No categorical answer need be given at this stage; only certain guidelines can be set down. First, in the formulation of any such tax measures, the full incidence of the revenue-and-expenditure system as a whole ought to be taken into account rather than the incidence, progressive or otherwise, of the individual tax under consideration. Secondly, if the masses are truly at subsistence levels, there will not be much point in taxing them; taxation on human maintenance could not improve the prospects for economic growth. But, above the subsistence levels, there is a case for taking in taxes a small fraction of their existing incomes and an increased proportion of their incremental incomes to meet the imperative needs of economic and social development. If the failure to tax the lower income groups were to result in inflation, it is these groups who are likely to be the worse off.
In taxing the upper income groups several factors require to be taken into account. To the extent that the tax systems, in law and in practice, remain only

4 Introduction
superficially progressive, they offer a large area for remedial action. The scope of “ taxable” income and wealth could be enlarged, the loopholes plugged, tax assessment and collection machinery strengthened, and the penalties for tax evasion made more effective as deterrents. On the other hand, very high rates of taxes on the top income groups may not only lead to further tax evasion but may also be injurious to saving and investment in the private sector, which is an important consideration from the standpoint of economic growth. It may be noted that income and commodity taxes do not altogether succeed in reducing the consumption of the rich as they do of the lower and middle income groups; a large part of what the government obtains is of the nature of a transfer of savings from the private sector to itself. Therefore, in taking these savings the government needs to justify its action in terms of the use to which they are put in the public sector vis-à-vis their use in the private sector.
The task for fiscal and monetary policies has also been enlarged in scope and, in coping with the expanded responsibilities of the public sector, has grown more complex. The simple canons of a balanced budget on current account and of loans to finance productive public works have undergone a radical transformation in the course of being adapted to several economic and non-economic objectives. The foremost among the economic tasks set for fiscal policy in the postwar period, in conjunction with other aspects of economic policy, has been to see to
it that greater resources are freed to finance aggregate “non-consumption” , that is, government current and capital outlays and private investment outlays, all of which have grown. This involves a reduction in the national proportion, but not necessarily in the level of personal or private consumption; the prime concern should be to increase the incremental income- “non-consumption” ratio. The governments of ECAFE countries have also directed their fiscal policies towards m aintaining a balance on external account, counteracting short-term disturbances to economic stability, and diverting to the treasuries not only the resources that would have increased private consumption but also those which would have gone into private savings or private investment, so as to enable the governments to exercise a more “ direct” control over the allocation of national resources.
Not all these objectives have been consistent with one another, nor have the governments pursuing them been clear as to priorities. Remedying internal instability by an import surplus has created problems of external imbalance; cutting imports to save balance of payments has strengthened domestic inflation. The search for greater equality has resulted in streng-thening the already high propensities to spend on consumption at the expense of saving. The govern-ments have also differed as to the degree of emphasis to be placed upon each of the common objectives of their fiscal and other economic policies, as well as to the methods of attaining them.

PART I. THE ECAFE REGION IN 1960
C h a p te r 1
PRODUCTION
For the countries of the ECAFE region,1 the year I9602 continued the improvement noted in 1959. However, the advance of 1960 over 1959 was less striking than that of 1959 over the preceding year which had experienced an adverse harvest and a slow-down in industrial production. Agricultural production had increased by about 7 per cent in the 1958/59 season; it increased further in 1959/60 by only about 1 per cent.3 The year ended with forecasts that this slight improvement will be maintained during the 1960/61 season. Industrial production which had slowed down in 1958 to an increase of only 1 per cent — the lowest in the postwar years — recorded a rise of 19 per cent in1959 and a further 15 per cent in the first half of1960 over the average level of 1959. The centrally planned economy of mainland China,4 was reported to have increased the gross value of agricultural production in 1959 by 17 per cent over 1958—-the year of “ the Great Leap Forw ard” — but 1960,
1 In the text an d tables of this and the fo llow ing tw o chapters, the terms “E C A FE reg ion” an d “reg ion” , unless o therw ise speci-fied, are used to denote the p rivate enterprise economics of the region and exclude the centrally p lan n ed economies of m ain land C hina , n o rth ern K orea and n o r th e rn V iet-N am , for reasons m e n -tioned in footnote 4.
2 As this report was com pleted in January 1961, inform ation available to the secretariat on the second half of the year 1960 was necessarily fragm en ta ry ; da ta could generally be had for most countries only for the first ha lf of the year.
3 T h e indices p repared by the Food and A gricu ltu re O rg an iza -tion of the U nited N ations (F A O ) give increases of 4 and 3 per cent respectively fo r 1958 /5 9 and 1959 /60 . T h is is because the FA O indices include w heat, barley, tea an d ru bber p roduced in 1958 and 1959 respectively an d no t the 1959 an d 1960 production of these com m odities. For the purposes of this report, adjustm ents have been m ade tak ing the latter in to account.
4 In form ation w ith the U nited N ations on econom ic trends inthe centrally p lan n ed economies — m ain land C hina , no rthernKorea an d n o r th e rn V ie t-N am — is subject to im p o rta n t qualifica-tions as to availability, com parability an d verifiability. In respectof availability, a significant add ition to the existing in fo rm ation on m ain land C hina is the publication entitled Ten Great Years (Statis-tics of the Econom ic an d C ultu ra l A chievem ents of the People’s Republic of C h in a ) , com piled by the State Statistical Bureau (and published by the Fore ign L anguage Press, Pek ing , February 1960). T h e problem s posed by the d ata fro m these countries in respect of com parability and verifiability w ere explained in som e detail w ith reference to m ain land C hina in the Economic Survey o f Asia and the Far East, 1957. See chap ter 4, especially page 86.
according to official indications, was the worst year for natural calamities since 1949 when the People’s Republic was founded. M ainland China’s industrial production continued to advance.5
AGRICULTURAL PRODUCTION
F o o d
Food production in the ECAFE region in 1959/60 further improved by about 2 per cent. Cereal production in the ECAFE region in 1960 (including 1960 crops of wheat and barley and 1959/60 crops of all other cereals) rose by 1.5 per cent over the record crop of the previous year. The 1959/60 rice crop was up by 3 per cent from the good 1958/59 harvest, reaching an all-time record of 87 million tons.6 Production of wheat in 1960 was the largest in recent years; although only slightly higher than the record crop of 1959, it was 17 per cent greater than in 1958. The total output of other cereals7 was 2 per cent less than in the previous year. The output of rootcrops increased by more than 3 per cent over 1958/59; pulses increased sharply (by 31 per cen t).8 Although production of all sugar (in terms of raw sugar) remained about the same, centrifugal sugar in 1959/60 increased by 11 per cent over the level during the previous two seasons. All m ajor producers had a larger output except China: Taiwan, which had harvested a record crop in 1958/59, but owing to warm and moist weather at planting time and typhoon damage, the 1959/60 crop was 8 per cent below the peak level. Oilseeds output (in oil equivalent) declined by more than 5 per cent from 1958/59. The expansion of food products of animal origin appears to have continued in 1960, but on the whole at a slower rate than that of food crops.
5 A lthough industries processing agricultural m aterial were adversely affected.
6 Milled basis, converted fro m paddy to rice a t the rate of 68 per cent.
7 1960 crop of barley an d 1959 /6 0 crops of m aize, rye, oats, millets and so rghum .
8 N o t inc lud ing d ry beans, as 1959 /60 data are available for only four countries of the region.

6 P art I. The ECAFE Region in 1960
Table 1. ECAFE Region: Production of Food Crops, 1948-1952 and 1956-1960
(M illion tons)
Ite m and yearsa 1948-1952 1956 or 1957 or 1958 or 1959 or I960 oraverageb 1956/57b 1957/58 1958/59 1959/60 1960/61
Total c e r e a l s .............................. . . . 105.9 130.9 126.9 136.6 142.3Rice, m illed basis . . . . 65.3 81.0 74.9 84.5 87.3W h e a t ..................................... . . . 14.9 18.6 19.6 17.8 20.7 20.8M a i z e .......................... . . . 5.9 8.0 8.2 9.4 9.9B a r i e v ..................................... . . . 6.2 7.6 7.3 6.6 7.3 7.3O th er cerealsc . . . . . . . 13.6 15.7 16.9 18.3 17.1
Total root cropsd . . . . . . . 25.4 33.7 34.9 36.9 38.1Total pulsese .............................. . . . 7.1 9.2 9.9 8.9 8.8fEdible oilseed cropsg . . . 3.8 5.0 5.0 4.9 4.7
(in oil equ ivalen t)Sugarh ..................................... . . . 7.3 10.4 10.8 11.4 11.5
Source: Com piled by FA O fro m national publications o r fro m direct in fo rm ation supplied by governm ents to the FA O secretariat.
a FA O crop years.b Revised estimates. In c lu d in g available da ta fo r A fghan istan an d Iran . c Rye, oats, m ille t an d so rghum .d Potatoes, sw eet potatoes, an d yam s an d cassava, largely estim ated. e Chickpeas, lentils, d ry beans, d ry peas, an d b road beans.f E xc lud ing d ry beans; correspond ing 1 9 5 8 /5 9 p roduc tion was 6.7 m illion tons. e In c lud ing soybeans, g ro u n d n u ts , sesame, rapeseed, cottonseed, copra, olives an d olive oil, and
pa lm kernel an d p a lm oils. h C entrifugal an d non-cen trifugal cane and beet sugar, converted in to raw value.
Traditionally food deficit countries
Ceylon and India, among the food importing countries, experienced a decline in rice production (by 2 and 3 per cent respectively) in 1959/60. In Ceylon, the harvested area fell; in India, the decrease was mainly due to unfavourable weather at the time of sowing the winter crop and drought during the growing period. In the Philippines, although yields were somewhat lower due to typhoons, production, as in Laos, was almost at the same level as in 1958/59. Owing to the increase in domestic output over the last three years, the country has become self-sufficient in rice and has virtually ceased to be an importer. Increases, on the other hand, were impressive in the Federation of Malaya (22 per cent) and Pakistan (20 per cent) and moderate in Indonesia (3 per cent) and Japan (4 per ce n t) . The increase in the Federation of Malaya was due to a marked improvement in yields per hectare; it was expected that almost 70 per cent of the country’s requirements would be met from domestic production. Pakistan secured its increase by expanding the area under rice (at the expense of ju te ) , and as a result of good weather.
The output of wheat and maize was higher; it compensated partially for the declines in rice pro -duction in Ceylon and India, and augmented the cereal supply elsewhere. W heat increased in 1960 by only a fraction in India (although this was a 25 per cent increase over 1958) and by about 1
per cent in Pakistan. Maize production increased by 14 per cent in Ceylon, 7 per cent in India and in Indonesia, 25 per cent in Laos and 3 per cent in Pakistan; it declined in Japan (by 7 per cent), and also in the Philippines (by 3 per cent) where maize is second to rice as a foodcrop. The trends in other foodcrops were uneven. Other cereals appear to have declined in India (barley 3 per cent, millets 5 per cent and sorghum 10 per cent) and in Japan (oats 11 per cent). Output of non-cereal foodcrops increased. India and Indonesia had more centrifugal sugar; India produced a record output (up by 26 per cent over 1958/59) in response to favourable weather, expanded acreage and various government measures designed to encourage produc-tion of centrifugal sugar instead of gur. Ceylon had more dry beans and potatoes; Japan had appreciable increases in pulses and oilseeds; the Philippines, in addition to more sugar for export, had more root crops for domestic consumption.
Rice-exporting countries
The 1959/60 output of rice increased in all the traditionally exporting countries of the region except China: Taiwan. Taking all these countries together (but excluding mainland China), total production in 1959/60 was up by almost 7 per cent over the previous year. Individual percentage increases were 7 for Burma, 22 for Cambodia, 21 for Iran, 3 for Thailand and 15 for southern Viet-Nam; the production in southern Korea remained about the same; the decrease

Chapter 1. Production 7
in China: Taiwan, owi ng to bad weather, was 2 per cent. In Burma, the increase was achieved partly by the five-year “paddy expansion project” , which had commenced in 1956/57 and under which 300,000 hectares have been reclaimed and cultivated. The sharp increases in Cambodia and Iran were partly the result of the extension of irrigation and drainage facilities.
As in the traditionally food deficit countries, production of wheat and maize increased in the rice exporting countries as well; the only exception was Cambodia, which had much less maize (38 per cent). China: Taiwan had 5 per cent more wheat as a result of an extensive use of chemical fertilizers and organic matter, and Thailand 70 per cent more maize, due to an extension of area in response to high export demand. In Iran and southern Korea, the substantial 1959/60 increase in cereal production also included more wheat in 1959 than in 1958 — 15 per cent in Iran and 23 per cent in southern Korea. The output of non-cereal foodcrops was also larger in the rice- exporting countries. Soybean production increased sharply; it rose by 77 per cent in Cambodia and 21 per cent in China: Taiwan. Thailand also, in addition to more rice and maize, had slightly more oilseeds (groundnuts, cottonseed and sesame) and appreciably more root crops (including cassava).
Prospects for 1960/61
Only a slight advance in foodgrain production is expected in 1960/61, with countries sharing opposite trends. There were indications towards the close of 1960 that cereal production might just maintain the 1959/60 level, assuming the continuation of favourable conditions to the end of the season.
In the traditionally food deficit countries, as a whole, foodgrain production in 1960/61 was likely to maintain or exceed the 1959/60 level. In the rice- exporting countries, provisional estimates indicated some decrease in foodgrain production for 1960/61. Declines, owing to unfavourable weather, were apparently substantial in China: Taiwan, southern Korea and southern Viet-Nam. Increases in pro -duction were expected in Burma, Cambodia, and Thailand.
As to mainland China, the first official reports estimated that total “grain”9 production in 1959 reached 270 million tons, 8 per cent above the revised figure for 1958, but 2 per cent below the year’s target. Figures for individual grain crops have not yet been published. However, there were indications of losses in the 1960 harvest due to natural calamities, particularly the drought, which reportedly affected 60 million hectares of farm land,10 or about half the
9 Including the grain equivalent of potatoes.10 As compared with 43 million hectares in 1959 and 27 million
hectares in 1958.
total sown area in the country. Despite an increase in the area sown, output of summer crops, including wheat, early rice and various kinds of coarse grains, appeared to be about the same as, or only slightly below the output in 1959, which had totalled 69.5 million tons. In order to make up for the shortfall (from the plan targets) in the summer crops, an intensified drive for more grain production was launched. The area sown to autumn crops was greatly extended with special emphasis on coarse grains.11
O t h e r p r i m a r y p r o d u c t s
In 1959, the ECAFE region had contributed 90 per cent of the world’s estimated total tea production of 760,000 tons. This was an increase of less than1 per cent over the previous year. For the year 1960, indications were for a further small increase, although production in the first seven months had fallen by 1 per cent over the same period in 1959. In recent years, no notable change in area under tea has occurred in Ceylon and India, the main producing countries; expansion in output has been achieved mainly through higher yields. Ceylon had good weather which contributed to a 7 per cent rise in production during the first nine months of 1960 over the same period of the previous year. Produc-tion in Indonesia during the first seven months of 1960 increased by 3 per cent. South India, too, increased its production by more than 17 per cent during the first eight months of 1960 over the corresponding period of 1959. In northeastern India, on the other hand, output from January to September 1960 declined by 10.5 per cent owing to unfavourable weather, but was expected to pick up by the end of the year.
The level of copra production for 1960 in the region was forecast to increase by more than 14 per cent from a year earlier. Copra production in the Philippines had recovered rapidly from the damage caused by typhoons of December 1959 and January 1960. It was expected that the country’s output would exceed the previous year’s production by almost 28 per cent. In the Federation of Malaya, after adequate rains and high prices in 1959, output increased by 37 per cent in 1960 (January to June) over the corresponding period of 1959. Production of smallholders increased by almost 50 per cent while estate production showed moderate gains. In the other coconut producing countries of the region, the 1959 rainfall was favourable which contributed to the increased production in 1960.
11 T h e au tu m n harvest shou ld have been gathered by D ecem ber 1960, b u t no rep o rt o n the results was available; only it was officially adm itted th a t the p lanned increase o f 10 per cent was not attained.

8 P art I. The ECAFE Region in 1960
The cotton output of the region declined from 6.0 million bales12 in 1958/59 (August-July) to 5.12 million bales in 1959/60. Declines took place in India (21 per cent) and Thailand (20 per cent) where weather conditions were adverse; output increased in Burma (by 8 per cen t), southern Korea (by 17 per cent) and Pakistan (by 2 per cent) and remained stable in Afghanistan and Iran. M ainland China registered an increase of 3.5 per cent over 1958/59 to 9.0 million bales in 1959/60. For the 1960/61 season, output prospects in the region seemed to be better than those of a year earlier. The situation in India was generally favourable, with the total area estimated at 8 million hectares, which under normal conditions, would give a harvest of over 4 million bales — much larger than the 3.3 million bales in 1959/60. Similarly in Pakistan, crop prospects for 1960/61 were better due to good weather and the wider use of fertilizers under government subsidy.
In 1959/60 (July-June), the output of ju te and allied fibres in the region fell to 2.1 million tons, as against 2.4 million tons in 1958/59. In India and Pakistan — the m ajor producing countries — production was down by 17 and 11 per cent respectively, owing partly to unfavourable weather conditions during the growing and harvesting seasons, but mainly to an unfavourable ju te /rice price ratio at the time of planting. In Pakistan, the Govern-ment’s programme of assisting farm ers to adopt alternative crops was also a contributing factor; yields did not improve to offset the reduction in area. The prospects for the 1960/61 crop remained uncertain; Pakistan was expecting a better crop for 1960/61, but there was 15 per cent decrease in area under the crop in India.
In the first nine months of 1960, production of natural rubber in the region at 1.29 million tons was about 4.5 per cent lower than the corresponding 1959 output. This decrease was largely due to a decline of 13 per cent in Indonesia’s output. P ro -duction in Ceylon and the Federation of Malaya increased (by 13 and 2 per cent respectively) owing partly to the stimulation of higher prices13 earlier in the year and partly to the gradual coming into production of replanted or newly planted areas. In Ceylon, the government sponsored programme of replanting by smallholders was beginning to show results. In the Federation of Malaya, smallholders have been showing a greater interest in the replanting scheme than in the early stages of the programme. Under the new planting programme of the Federation, participating smallholders will be given an equivalent
12 Of 478 lbs net weight.13 However, the pronounced fall in prices between June and
November 1960 suggests that output in the last quarter will level off. Dem and, especially in the United States and the United Kingdom, was poorer than in 1959.
of US$135 per acre to finance their new plantings. In Cambodia, Thailand and southern Viet-Nam, new planting and replanting with high yielding strains is continuing.
FOOD PRODUCTION IN RELATION TO POPULATION TRENDS
Estimates indicate that in twelve countries of the region14 accounting for over 90 per cent of its population, total food production, from 1952/53 to 1958/59,15 increased by an average of 4 per cent annually, whereas population growth averaged 1.5 per cent per year.16 Thus there was a net gain through this period of 2.5 per cent annually in per capita food production. This gain can only be regarded as modest. It may also be noted that, according to the statistics available, per capita food production in the region in 1959/60 is estimated to be still somewhat below the level before the war, although this is by no means certain.
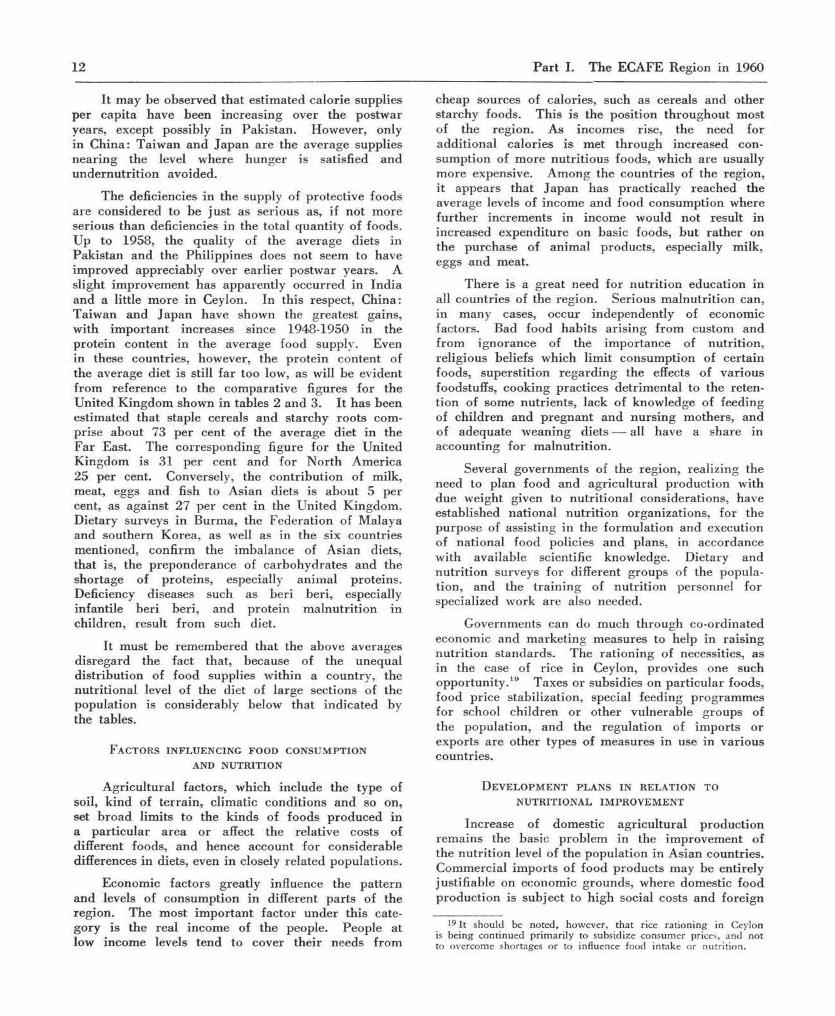
Chart 1 shows, for the twelve individual coun-tries, the trends in per capita food production for the same period. The curves show fluctuations from year to year due to the effect of weather on production, but over this period all the trend lines are sloping upwards indicating a rise in food production per head. Of the twelve countries, five— Burma, China: Taiwan, Iran, southern Korea and Thailand — are traditionally food exporting countries. Two of these — Burma and Thailand — with parti-cularly high export margins, adjusted their production to the requirements of their international markets rather than to the growth of their domestic demand. The food deficit countries, on the other hand, are increasing their production so as to arrive as near to self-sufficiency as possible. Japan shows the sharpest rise in per capita food production in chart 1, the Federation of Malaya and Iran being next in order of per capita rise. The trend lines of food production in several large countries — India, Indo-nesia and Pakistan — on the other hand, show only a moderate progress, and if Ind ia’s recent upward revision of its population growth is taken into account,
14 Burma, Ceylon, China: Taiwan, Federation of Malaya, India Indonesia, Iran, Japan, southern Korea, Pakistan, Philippines and Thailand.
15 See footnote 3 on page 5. The time reference in this section is only to FAO crop years which are also referred to as calendar years in FAO publications, 1952 alternating with the 1952/53 crop year.
16 As the upward revision of the growth rate of India’s popula-tion given in the D raft Outline of The T h ird Five Year Plan (published in New Delhi in June 1960) reached the United Nations secretariat too late for the revision of the tables in the m ajor FAO publication The State o f Food and Agriculture, 1960, the FAO data used in this section are on the high side in respect of the grow th in per capita production and consumption levels in India, and in the region, since India accounts for almost half the population of the region (excluding m ainland C hina).

Chapter 1. Production 9
C h a r t 1
ECAFE Countries: Trend of Per C ap ita Food Production, 1952 /53-1958/59
— 1956/57 = 100)
C h a r t 2
Principal Regions of th e W orld: Estimated Per C ap ita Food Supplies, 1934-1938 and 1948-1959
(Price w eighted indices, w orlda average for all food, average 1948-52 = 100)
NORTHAMERICA
W ES T E R NE U R O PE
L ATINAMERICA
NEARE A S T
Source: FA O : The State of Food and Agriculture, I960, (Rom e, 1960) page 152.
Livestock products Crop products
Source: FA O : The State of Food and Agriculture, 1960, (Rome, 1960) page 38.
a E xclud ing the Soviet U nion , eastern E urope and m ain land China. b E xclud ing m ain land C hina.
the rate of growth of per capita food production for the bulk of the population of the region would indeed make a poor showing.
F o o d s u p p l i e s a n d t h e n u t r i t i o n o f THE POPULATION
Food production increases in comparison with population growth reflect only the intensity or success of the production effort. The indices, however, do not reveal the extent to which adequate levels of food consumption and nutrition are being approached. For this purpose, account must be taken of the balance of imports and exports of food products, and of the nutritive value of the different types of foods in the diet.
FAO has made a chart (see chart 2) of per capita food supplies in the principal regions of the world (excluding the centrally planned economies) during the prewar period (1934-1938) and three postwar (1948-1952, 1953-1956, 1957-1959) periods.
Crop products and animal products have been dis-tinguished in the chart. Almost the entire ECAFE region is covered by the FAO grouping “ Far East” ; the countries left out are Afghanistan and Iran, which are included in the group of countries described as the “Near East” .
It is obvious from the chart how poor are the per capita levels of food consumption in Africa and in the Far East. In 1948-1952, the supplies of all food items available per head of population in the Far East were the smallest — less than half of the world average. Since then there has been some improvement. Per capita supplies were about 14 per cent greater in the period 1957-1959 than in the five years 1948-1952 and about 2.5 per cent greater than in the prewar years 1934-1938 when the region was a net exporter. On the other hand, it is noteworthy that, at present, net imports of foodgrains and animal food products into the region have increased at a much faster rate than domestic production, and
( Average 1952/53
1934- 38
1948- 52 1953- 56 1957-59
1934-38
1948- 521953-561957-59
1934-38
1948-521953- 561957-59
1934-38
1948-521953-561957-59
1934-38
1948 -52 1953-56 1957-59
1934-38
1948-52 1953-56 1957-59
1934-38
1948-521953-561957-59
Ceylon
China: Taiwan
Federation of Malaya
Indio
Indonesia
curves of annual indices
Ja p an
Korea, southern
Pakistan
Philippines
Thailand
Irend l ines
120
110
100
9 0
120
110
100
9 0
110
100
9 0
110
100
120
110
100
9 0
110
1009 0
80
110
100
9 0
110100
9 0
120
110
100
9 0
120
110
100
9 0
6 0
110
100
9 0
110too9 0
FAR E A S T b
A FR IC A
50 100 150 200 250 300 350
350300250200150100500
OCEANIA
10 P art I. The ECAFE Region in 1960
contributed to the relatively favourable development of the over-all food supply situation indicated by the chart.
The per capita availability of animal food products17 in 1957-1959 has increased by about 8 per cent over 1948-1952. Even though imports of these products have trebled, the present availability seems to be still somewhat less, on a per capita basis, than in the years just before the war.
To the extent that these data can be accepted, the general conclusion for the region may be drawn that while, on the whole, the quantitative level of food supplies per head prevailing in prewar years has been regained and slightly exceeded, the quality of the diet has not improved, and may have deteriorated somewhat as regards the intake of animal products. Such a generalization needs to be checked against more detailed information on changes in the nutritional standards of the population in individual countries. Types of food vary from country to country, and changes are unlikely to occur at the same rate everywhere.
17 E xtra caution m u st be exercised in using an im al p roduct statistics w hich are probably less reliable than crop statistics in this region.
National food balance sheets prepared for several successive periods provide the most comprehensive data for individual country analysis. The food balance sheet shows the per capita supply of foods in a country at the retail level, as given by total production, adjusted for imports and exports, changes in stocks and for any quantities utilized as animal feed, seed, or in industry. From these data the calorie value of the food supplies and their nutritive content can be calculated. Such balance sheets are available for only six countries of the region — Ceylon, China: Taiwan, India, Japan, Pakistan and the Philippines — so that further analysis must be limited to these.18
C h a n g e s i n l e v e l s o f f o o d c o n s u m p t i o n
Energy foods
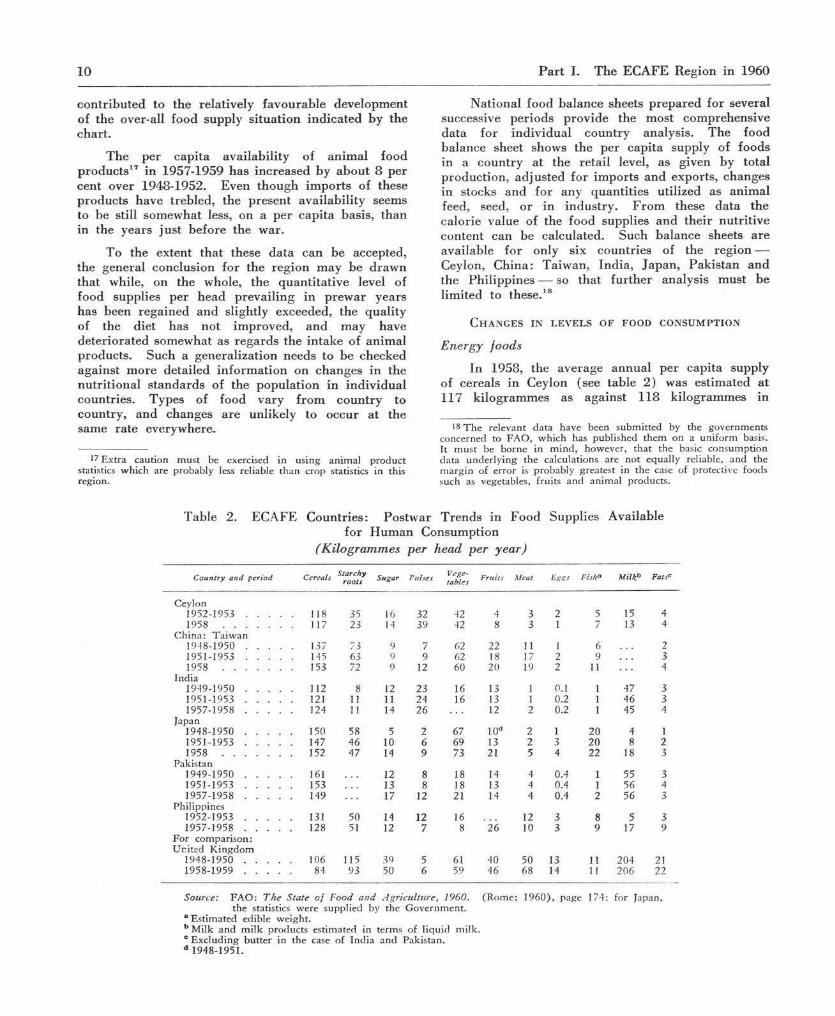
In 1958, the average annual per capita supply of cereals in Ceylon (see table 2) was estimated at 117 kilogrammes as against 118 kilogrammes in
18 T h e relevant da ta have been subm itted by the governm ents concerned to FA O , w h ich has published th em on a u n ifo rm basis. It m u st be borne in m in d , how ever, tha t the basic consum ption data u n d er ly ing the calculations are no t equally reliable, and the m arg in of erro r is probably greatest in the case of protective foods such as vegetables, fruits and an im al products.
Source: F A O : T he State o f Food and Agriculture, 1960. (R om e; 1960) , page 174: for Japan, the statistics w ere supplied by the G overnm ent.
a Estim ated edible w eight.b M ilk a n d m ilk p roducts estim ated in term s of l iquid milk. c E xc lud ing b u tte r in the case of Ind ia a n d Pakistan. d 1948-1951.
Country and period Cereals Starchyroots Sugar Pulses Vege-
tables Fruits Meat Eggs Fisha Milkb Fatsc
Ceylon1952-1953 . . . . 118 35 16 32 42 4 3 2 5 15 41958 ......................... 117 23 14 39 42 8 3 1 7 13 4
C hina : T a iw an1948-1950 . . . . 137 73 9 7 62 22 11 1 6 21951-1953 . . . . 145 63 9 9 62 18 17 2 9 31958 ......................... . 153 72 9 12 60 20 19 2 11 4
India1949-1950 . . . . 112 8 12 23 16 13 1 0.1 1 47 31951-1953 . . . . . 121 11 11 24 16 13 1 0.2 1 46 31957-1958 . . . . . 124 1 1 14 26 12 2 0.2 1 45 4
Japan1948-1950 . . . . . 150 58 5 2 67 10d 2 1 20 4 11951-1953 . . . . . 147 46 10 6 69 13 2 3 2 0 8 21958 ......................... . 152 47 14 9 73 21 5 4 22 18 3
Pakistan1949-1950 . . . . . 161 12 8 18 14 4 0.4 1 55 31951-1953 . . . . . 153 13 8 18 13 4 0.4 1 56 41957-1958 . . . . . 149 17 12 21 14 4 0.4 2 56 3
Philippines1952-1953 . . . . . 131 50 14 12 16 12 3 8 5 31 9 5 7 - 1 9 5 8 . . . . . 128 5 1 12 7 8 26 10 3 9 17 9
For com parison: U nited K in g d o m
1948-1950 . . . . 106 115 39 5 61 40 50 13 11 204 211 9 5 8 - 1 9 5 9 . . . . 84 93 50 6 59 46 68 14 11 206 22
Table 2. ECAFE Countries: Postwar Trends in Food Supplies Availablefor Human Consumption
(Kilogrammes per head per year)

Chapter 1. Production 11
1952-1953. Per capita supplies of starchy roots and sugar dropped, while fats remained at the same level. In China: Taiwan, per capita supply of cereals increased in 1951-1953 by almost 6 per cent over the 1948-1950 level to 145 kilogrammes and rose further in 1958 to 153 kilogrammes. The supply of starchy roots dropped to 63 kilogrammes in 1951- 1953, but increased to 72 kilogrammes in 1958, still about 1 per cent less than in 1948-1950. The decline in the consumption of starchy roots reflects a tendency to switch over to cereals as a preferred basic food. The level of sugar consumption remained the same during the period under review, while the fats supply increased gradually. In India, the average per capita supply of cereals in 1957-1958 increased by almost 2.5 per cent over 1951-1953 to a level of 124 kilogrammes, about 11 per cent more than in 1949- 1950. The energy food supply position was further improved in 1958, as per capita availabilities of starchy roots, sugar and fats increased over 1949- 1950.
In Japan, on the other hand, the average supply of cereals per head per year in 1958 at 152 kilogrammes was only slightly higher than the level of 150 kilogrammes in 1948-1950. At higher levels of average income the Japanese people were obtaining more calories from sugar, fish and dairy products. In Pakistan, the per capita supply of cereals declined to 149 kilogrammes in 1957-1958 from the high level of 161 kilogrammes in 1949-1960. However, sugar consumption increased, while fats were more or less maintained at the same level. The Philippines also experienced a decrease in per capita supply of cereals— from 131 kilogrammes in 1952-1953 to 128 in 1957-1958 — but an increase in the consumption of dairy products and fats.
Protective foods
The situation revealed in table 2 as regards changes in the available supplies per head of protein and protective foods in the six countries is also far from satisfactory. India and Pakistan, the two countries with the greatest reliance on dairy products, have barely been able to maintain their still low levels of dairy supplies per head in the postwar period, and their very low levels of consumption of meat, eggs, fish, vegetables and fruits have scarcely been raised. However, the supply of pulses per head has gone up slightly in both India and Pakistan. Ceylon has not been able to maintain its low levels of consumption of dairy products and eggs, but gained slightly between 1952-1953 and 1958 in per capita supplies of fish and pulses. In the Philippines, per capita supplies of fish and eggs, but not of meat and pulses, were maintained between the early and late ’fifties. There was a noticeable gain in supplies of dairy products.
Between 1948-1950 and 1958, China: Taiwan achieved an important increase in its supplies of meat, fish and eggs, although present levels, except perhaps of fish, are still low. The fairly good supply of vegetables was maintained and pulses — not so important in Taiwan — were increased. Over the same period, Japan achieved increases in per capita supplies of all groups of protein and protective foods, especially fish and dairy products, although the present consumption level of dairy products and meat remains low.
Table 3 presents a summary of the nutritive value of the per capita food supply at different periods in six countries of the region. The number of calories provided per head per day is a measure of the adequacy of the total food consumption in preventing hunger. The total amount of protein contained in the food supply, and the amount of protein contributed by animal products, indicate the quality of the diet. The calorie shortage in itself may not be severe enough to represent serious undernutrition, but may be accompanied by a protein intake sufficiently low to constitute malnutrition.
Table 3. ECAFE Countries: Calorie and Protein Content of Postwar Food Supplies
(Per head per day)
Country and period CaloriesTotal
protein (gram m es)
A n im a lprotein
(gram m es)
Ceylon1952-1953 1,990 42 61958 . . . 2,010 48 12
C hina: T a iw anPrew ar 1,870 45 161948-1950 1,980 43 81951-1953 2 ,140 50 121958 . . . 2,330 57 15
India1949-1950 . 1,640 43 51951-1953 1,750 47 61957-1958 1,800 47 6
JapanPrewar 2,050 55 71948-1950 . 2.095 49 91951-1935 . 1,870 58 131958 . . . 2,259 67 17
Pakistan1949-1950 . 2,040 49 81951-1953 . 2,010 47 81957-1958 . 2,010 49 8
Philippines1952-1953 . 1,960 43 101957-1958 . 1,980 36 11
For com parison: U nited K ingdom1948-1950 . 3,130 90 451958-1959 3,260 85 50
Source: FA O : The State o f Food and Agriculture, 1960, (R om e; 1960) , page 177; for Japan the statistics w ere supplied by the G overnm ent.
12 P art I. The ECAFE Region in 1960
It may be observed that estimated calorie supplies per capita have been increasing over the postwar years, except possibly in Pakistan. However, only in China: Taiwan and Japan are the average supplies nearing the level where hunger is satisfied and undernutrition avoided.
The deficiencies in the supply of protective foods are considered to be just as serious as, if not more serious than deficiencies in the total quantity of foods. Up to 1958, the quality of the average diets in Pakistan and the Philippines does not seem to have improved appreciably over earlier postwar years. A slight improvement has apparently occurred in India and a little more in Ceylon. In this respect, China: Taiwan and Japan have shown the greatest gains, with im portant increases since 1948-1950 in the protein content in the average food supply. Even in these countries, however, the protein content of the average diet is still far too low, as will be evident from reference to the comparative figures for the United Kingdom shown in tables 2 and 3. It has been estimated that staple cereals and starchy roots com-prise about 73 per cent of the average diet in the Far East. The corresponding figure for the United Kingdom is 31 per cent and for North America 25 per cent. Conversely, the contribution of milk, meat, eggs and fish to Asian diets is about 5 per cent, as against 27 per cent in the United Kingdom. Dietary surveys in Burma, the Federation of Malaya and southern Korea, as well as in the six countries mentioned, confirm the imbalance of Asian diets, that is, the preponderance of carbohydrates and the shortage of proteins, especially animal proteins. Deficiency diseases such as beri beri, especially infantile beri beri, and protein malnutrition in children, result from such diet.
It must be remembered that the above averages disregard the fact that, because of the unequal distribution of food supplies within a country, the nutritional level of the diet of large sections of the population is considerably below that indicated by the tables.
F a c t o r s i n f l u e n c i n g f o o d c o n s u m p t i o n
AND NUTRITION
Agricultural factors, which include the type of soil, kind of terrain, climatic conditions and so on, set broad limits to the kinds of foods produced in a particular area or affect the relative costs of different foods, and hence account for considerable differences in diets, even in closely related populations.
Economic factors greatly influence the pattern and levels of consumption in different parts of the region. The most im portant factor under this cate-gory is the real income of the people. People at low income levels tend to cover their needs from
cheap sources of calories, such as cereals and other starchy foods. This is the position throughout most of the region. As incomes rise, the need for additional calories is met through increased con-sumption of more nutritious foods, which are usually more expensive. Among the countries of the region, it appears that Japan has practically reached the average levels of income and food consumption where further increments in income would not result in increased expenditure on basic foods, but rather on the purchase of animal products, especially milk, eggs and meat.
There is a great need for nutrition education in all countries of the region. Serious malnutrition can, in many cases, occur independently of economic factors. Bad food habits arising from custom and from ignorance of the importance of nutrition, religious beliefs which limit consumption of certain foods, superstition regarding the effects of various foodstuffs, cooking practices detrimental to the reten-tion of some nutrients, lack of knowledge of feeding of children and pregnant and nursing mothers, and of adequate weaning diets — all have a share in accounting for malnutrition.
Several governments of the region, realizing the need to plan food and agricultural production with due weight given to nutritional considerations, have established national nutrition organizations, for the purpose of assisting in the formulation and execution of national food policies and plans, in accordance with available scientific knowledge. Dietary and nutrition surveys for different groups of the popula-tion, and the training of nutrition personnel for specialized work are also needed.
Governments can do much through co-ordinated economic and marketing measures to help in raising nutrition standards. The rationing of necessities, as in the case of rice in Ceylon, provides one such opportunity.19 Taxes or subsidies on particular foods, food price stabilization, special feeding programmes for school children or other vulnerable groups of the population, and the regulation of imports or exports are other types of measures in use in various countries.
D e v e l o p m e n t p l a n s i n r e l a t i o n t o
NUTRITIONAL IMPROVEMENT
Increase of domestic agricultural production remains the basic problem in the improvement of the nutrition level of the population in Asian countries. Commercial imports of food products may be entirely justifiable on economic grounds, where domestic food production is subject to high social costs and foreign
19 It should be noted, however, that rice rationing in Ceylon is being continued primarily to subsidize consumer prices, and not to overcome shortages or to influence food intake or nutrition.
Chapter 1. Production 13
exchange can be earned by using the land and other resources for producing agricultural or industrial products which have a competitive advantage in export markets. The importation of the United States food surpluses on concessional terms can also provide valuable assistance to countries of the region under certain circumstances, especially in setting up ade-quate national food reserves. Basically, however, emphasis must fall on larger and more efficient production from the domestic agricultural resources of the region.
It has been indicated above that the over-whelming preponderance of cereals and starchy foods in Asian diets forces attention upon the expansion of the livestock industries. However, it is here that the production problem is particularly acute. The expansion of some types of livestock production, such as cattle raising and dairy farming, are essen-tially long-term programmes which often depend upon the solution of technical problems. Quick-producing livestock, such as poultry and pigs, compete to some extent for grain still urgently needed for direct human consumption. For these reasons, some countries of the region have had to give attention to the improvement of nutrition, to some extent at least, by increasing the output of basic cereals and pulses. At the same time, plans are being laid for research and development in livestock industries, and for some pilot projects to prepare for more rapid expansion later.
In all countries of the region, greater importance is now being attached to nutritional aspects in the formulation of food policies and plans. However, two broad patterns are discernible. In Japan, nutritional planning is being closely integrated with agricultural and general economic development plan-ning. The country is reaching levels of real per capita income at which demand factors call for diversification of the diet by the inclusion of more protein and protective foods, especially fish and livestock products, at the same time as prospects of doing so have improved. On the other hand, in countries with low levels of income — constituting the bulk of the region’s population — food demand and food production are more strongly concentrated on increased supplies of basic starchy foods and pulses. An instance of this type of nutrition planning is provided by India.
In Japan, agricultural programming is being undertaken as an integral part of the new plan to double the national income in ten years, beginning in 1961. This plan was under consideration by the Japanese Government at the end of 1960. Agriculture was already lagging behind other industries in productivity per man and in per capita income, and was likely to be left further behind in such rapid national growth. The modernization of agriculture
had, therefore, been taken up as the m ajor point of the programming. In addition to speeding up labour productivity and effecting basic improvement in the structure of agriculture, the programme will promote a selective expansion of agricultural production in line with the changing demand for farm products in Japan. Under the plan, it is expected that the intake of protein will rise greatly while that of starchy foods will decline, so that the food consumption pattern will show a great change during the next decade. It has been estimated that per capita consumption of livestock products (meat, dairy products and eggs) and fruits would more than double by 1970, in comparison with the average of 1956-1958. In particular, per capita consumption of cow milk is expected to increase more than five times, and meat more than three times. Per capita consumption of sugar will be 60-70 per cent, fish 40 per cent and soybeans 30 per cent more than in 1956-1958. Per capita con-sumption of rice is expected to decrease after 1965, and wheat consumption to remain at the 1956-1958 level. Per capita consumption of potatoes for food will decrease by 30 per cent, while barley consumption for food will fall by 80 per cent. Thus, starchy foods will, in general, occupy a smaller share in the diet. These changes in the consumption pattern would result in a 15 per cent — that is from 2,237 to 2,566 — increase in per capita calorie intake per day from 1956-1958. It should in particular be noted that per capita consumption of total protein is expected to increase from 66 grammes to 83 grammes by 1970. Fats will also rise from 24 grammes to 54 grammes during the same period. The overall result would improve substantially the Japanese diet and represent a great stride towards attaining the nutritional standards of western European countries.
India, on the other hand, has emphasized the expansion of foodgrain production in order to meet first the quantitative or calorie deficiency in the national diet. Under its first five-year plan (April 1951-March 1956), it achieved considerable success; actual foodgrain (cereals and pulses) production reached 67 millions tons — a 27 per cent increase instead of the modest 14 per cent that had been planned. Extension of cultivation was the main factor responsible for a large part of the progress made, although the high level of output realized was also the product of good weather.
The second five-year plan (April 1956-March 1961) was thus framed in an atmosphere of optimism generated by two successive good crops in 1954/55 and 1955/56. According to the plan, foodgrain production was to be raised to 82 million tons — 22 per cent above the actual 1955/56 production. Stress was placed on increasing the production of supple-mentary foods of higher nutritive value, such as vegetables and fruits, milk and milk products, eggs

14 P art I. The ECAFE Region in 1960
and, to some extent, meat. Animal husbandry pro-grammes were to be intensified. Milk output was estimated to increase by 10 per cent in 1960/61 over the base period 1955/56. In connexion with the scheme for increased milk production, milk producers’ co-operatives were to be organized in villages to supply milk to urban areas, and to run creameries and milk drying plants.
The actual course of events, however, re-emphasized the critical importance of increasing foodgrain production. W ith only half the crop area having assured rainfall or irrigation facilities, food-grain availability in India remained a gamble on the weather; this was made obvious when production fell in 1957/58 6 per cent below, and rose in 1958/5911 per cent above, the base period (1955/56) of the plan. In any case, it was becoming clear that the progress made would fall short of the targets. On the other hand, attaining of the foodgrain targets remained critically important for stability of internal prices as well as for balance of payments. The country, therefore, entered into arrangements with the United States, reviewed in chapter 2,20 to obtain, under Public Law 480, substantial imports of wheat and rice, totalling about 17 million tons, over a period of four years from May 1960. This would give the Government the opportunity to build up national reserves and thus effectively m aintain price stability over the earlier period of its th ird five-year plan (April 1961-March 1966).
Nonetheless, the draft outline of the third plan, released in June 1960, reassigns a high priority to cereal production and agriculture in general. The target of foodgrain production — 102 to 107 million tons as against the approximately 75 million tons achieved by the end of the second five-year plan — appears to call for a rather sharp increase. It is, however, hoped that increased supply and utilization of fertilizers, the investment made in irrigation over the preceding decade, and the almost completed countrywide organization of extension services, will together bear fruit towards the end of the third five-year plan, and substantially increase domestic output of foodgrains.
Relieved somewhat from the anxiety on this front, the planners in India have given attention to the improvement of diet apart from reducing its total calorie deficiency. The recommendations of the All-India Nutrition Advisory Committee for a balanced diet for an adult call for 1,400 calories per day from cereals, 835 calories from foods rich in protein — pulses, fish, meat, eggs — and 830 calories from other sources, making a total of 3,065 per day. It is recognized by the authorities, however, that with the best effort possible, the availability
per adult per day in 1965/66 of supplementary and protective foods, such as milk, meat, eggs, fru it and vegetables will still fall short of the requirements for a balanced diet. In fact, it is only thought possible to increase the calorie intake from foods rich in protein to 565 calories per day and from other non-cereal sources to 425 calories. Of the remaining deficit in total calories, the draft th ird five-year plan calls for the supply of 1,740 calories per day from cereals, to provide an average daily intake per adult in 1965/66 of 2,730 calories (1,800 in 1957-1958). Thus, the target of the plan is to achieve a level of production of foodgrains to allow the daily consump-tion of about 15 ounces of cereals and 3 ounces of pulses per capita (or 17.4 ounces of cereals and 3.5 ounces of pulses per a d u lt) . This intake of food-grains is higher than the level recommended by the Nutrition Advisory Committee for a balanced diet, that is, 14 ounces of cereals and 3 ounces of pulses per day per adult. The aim under subsequent plans will be to increase greatly the per capita consumption of protective foods, so that the per capita consumption of cereals can be, to some extent, reduced.
Several other countries of the region — Ceylon, China: Taiwan, Indonesia, Pakistan, Philippines and Thailand — have also emphasized in their develop-ment plans the need to maintain an adequate supply of staple energy foods and, at the same time, to increase the intake of protein foods. The relative importance given to the two has depended on the basic situation with regard to domestic food produc-tion and imports, and the changes anticipated in the demand for various food items corresponding to the planned changes in the level of per capita incomes. Food importing countries, for example, Ceylon, Pakistan and the Philippines, have attached prime importance to the achievement of national self- sufficiency — or at least as near to it as possible — in respect of both food crops and food of animal origin. Estimates of demand have been based on income elasticities derived from family budget surveys con-ducted in urban and rural areas, as for example in China: Taiwan. All the plans aim at a more balanced diet; the percentage increases planned for fish, fruits, vegetables and livestock products are, in general, higher than those for cereals. However, because of the predominance of cereals in the diet, the planned increases in this field — although small in terms of percentage — remain critically important, particularly to the net importing countries.
It may also be noted that in many countries of the region new educational programmes on maternal and child health, home economics and social welfare, are oriented towards nutrition improvement. Also, programmes of school feeding, nutrition educa-tion, school gardening and periodic examinations of the nutritional state of school children are in progress20 See pp . 38 an d 39.
Chapter 1. Production 15
in different countries. Japan, for instance, has a national school lunch programme covering over 60 per cent of prim ary school children. Feeding pro-grammes and other nutritional activities are embodied in the nutrition education part of the mass education movement in Burma and the rural development programmes in Ceylon. In view of the dearth of reliable information on the nutritional status of Asian populations, significance attaches to the food research centres in India and the Philippines which undertake laboratory studies, clinical and field investigations or surveys on nutrition and food composition. Univer-sities in China: Taiwan, India, Indonesia, Japan, and the Philippines also conduct nutrition research pro-jects. In Japan, too, nutrition legislation has been enacted. Thus, in 1947, the Nutritionist Law was passed providing for the training of nutritionists. In 1952, the Nutritional Improvement Law was enacted, providing for the establishment of nutrition services (e.g. education, special feeding, etc.) at each health centre in the country.
Despite this evidence of wide interest and long- range objectives aimed at raising nutritional levels, the actual progress made so far has, on the whole, remained poor. Although food production has risen slightly faster than population, the per capita levels of total food supply in the region are still far too low, and are inadequate to maintain the health and welfare of the population. Moreover, the increase in the supply of protein and protective foods, especially of food of animal origin, which is essential if nutritional levels are to be raised, is proving particularly difficult to achieve.21
INDUSTRIAL PRODUCTION
T h e v o l u m e o f p r o d u c t i o n
The growth of industrial (mining and manu-facturing) output in the private enterprise economies of the region,22 which slackened in 1958, has since
resumed its upward movement; in the first half of 1960, it was 11 per cent over the level in the second half of 1959.23 As in the past, mining lagged behind manufacturing. Industrial production showed in-creases in all countries; Japan took the longest stride.
The weight distribution in the regional index of industrial production, as it stands, is such that production in Japan accounts for somewhat less than a half, and in India for somewhat less than a third. In this perspective of the region’s industrial produc-tion, progress in some of the other newly developing countries such as China: Taiwan, Federation of Malaya, Indonesia, southern Korea, Pakistan, the Philippines and Thailand tends to be dwarfed in comparison. Even though regular indices are not available for some of these countries, the scattered available evidence suggests, by and large, that governments have continued their efforts to press forward with industrial development. Attention was first being given to providing the infrastructure for industrial development, such as a power and trans-portation network, technical training and other related facilities. Most countries offered fiscal con-cessions and a wide variety of other inducements to both foreign and domestic capital to help develop industry. Industries producing construction materials and fertilizers, and light industries such as sugar, tobacco, beverages, textiles and pharmaceuticals were being developed in practically every country in the region. Even Iran was venturing beyond oil refining into other fields of industrial production. Active consideration was being given by the Governments of Ceylon and Singapore to industrialization in order to relieve unemployment. During the year under review, the Government of Singapore made plans to develop a large industrial estate with planned sites for heavy, medium and light industries and with the necessary water, power and gas connexions. Shipping berths and rail links were to be provided to meet increased transport requirements. A policy of in -creasing supplies of basic necessities such as textiles, was followed in Indonesia. Measures have been taken to pool similar industries to ensure a proper raw material distribution since 1959, when industries based on imported raw materials had experienced difficulties. The share of industry in the gross national product increased substantially in China: Taiwan, southern Korea and Pakistan.
23 T h e average an n u a l increase for the region in 1953-1959 was a little over 16 per cent. F o r the w orld as a w hole, excluding m ain land C h ina and eastern E urope, the average annual increase d u r in g this period w as estim ated a t a little less than 8 per cent. T h e reg io n ’s com paratively h ig h ra te of increase is largely ex-plained by the fact th a t p roduction started from a low base; the w eigh t of the region in the index of w orld industrial p roduction is less than 5 per cent, w hereas the region accounts for about 45 per cent of the popula tion of the w orld , exclud ing the Soviet U n ion and o ther centrally p lan n ed economies in eastern E urope and east Asia.
21 I t is against this background and the existence of sim ilar problems of food supply and nu trition affecting large populations in o ther regions th a t FA O launched the “F reed o m -fro m -H u n g er C am p a ig n ” in 1960. T h e C am paign was endorsed in O ctober 1960 by the U nited N ations G eneral Assembly w hich urged all m em ber governm ents an d the specialized agencies to support it in every appropriate way. T h e C am paign does no t replace cu rren t national and in ternational p rog ram m es for im prov ing food supplies and nutrition . Its purpose is to reinforce an d supplem ent such program m es, and to create a w orld clim ate of opinion , bo th w ith in an d outside governm ents, w h ich w ould enhance their effectiveness.
22 T h e regional index of industria l p roduction excludes small- scale industrial p roduction in m any countries and total industrial production in m ain land C hina . E xcept in Japan, w here, under existing labour and welfare legislation, da ta on small industries are collected on a continuous basis, arrangem ents for securing this type of inform ation rem ain unsatisfactory in o ther countries. Even though traditional handicrafts have declined in m any countries, small industry production has risen. Moreover, the national in -dices on w hich the regional index is bu ilt som ew hat understate the g ro w th as they have no t been revised to give d u e w eightage to the newly established industries w hich, in m any cases, have g row n m ore rapidly.

16 P art I. The ECAFE Region in 1960
In this process of industrialization, the growth possibilities of small-scale industry, as distinguished from large-scale industry on the one hand and handicrafts on the other, were being increasingly recognized. Apart from the efforts made to export some special items, such industries have been found highly useful in that they manufacture a wide variety of goods for which the demand has been growing. Sheltered from competition from the domestic o r-ganized sector and protected from competing products from abroad by fiscal and other means, the value of the output of small industrial enterprises increased in many countries. The small industries in many countries received help from the government in many ways including financing, marketing and guidance in production methods. Industry in mainland China was bifurcated into modern and primitive and both sectors were to be simultaneously developed. Com-munes, which, among their other activities, engaged in industrial production became widespread. Apart from manufacturing simpler items by labour which was otherwise unoccupied, urban communes under-took relatively unskilled work in sub-contracts with factories. A number of workers in factories was thereby released for more skilled work.
There was also a movement, in many countries, to increase productivity in small industry by ration-alizing and modernizing equipment and by using electricity provided by the expansion and extension of power grids. The latter accelerated the trend towards decentralization of industries to areas outside large cities and out of the predominantly urban or industrial zones. Electricity supplies were steadily increasing in the region. However, rural electrifica-tion was achieved to a satisfactory extent only in Japan and China: Taiwan. In India and Pakistan, even though power could not be brought to all the hundreds of thousands of villages, the establishment of various grids will help to provide power to the villages covered by the grids. The development of roads and other means of communication will further disperse and decentralize industry by opening up new areas and new work opportunities. Decentralization of industries is essential to the development of the relatively backward regions. This secures a rational use of national material and human resources. While the existing agglomeration of industrial installations cannot be dispersed, new industries may be located elsewhere, so that further strain on the available infrastructure can be avoided. Governments in framing their policies, have taken this problem into account and measures have been devised to correct the locational imbalance.
T h e p a t t e r n o f i n d u s t r i a l g r o w t h
A review of industry in the ECAFE region during 1960 indicates that, apart from the recovery of mining, some of the trends noticed in earlier years
became even more significant and were likely to introduce far-reaching changes in the composition of output and the direction of further industrial growth. The large investment undertaken for some years, especially in the iron and steel industry, has begun to bear fruit. It is true that small and medium-sized units in this line, established in some of the smaller countries in the region, experienced comparatively higher costs of production and were dependent in the first instance on scrap or imported pig iron, or consisted of rolling mills using imported billets. However, in several countries, the establishment of such units provided a base for further industrial development and helped in building up a technological tradition. Even so, virtually all steel production was accounted for by three countries — Japan, mainland China and India. The expansion of the heavy machine goods industry, with steel as the key lever, marked a new phase of growth.
Table 4 shows the pattern of growth of industrial production in the region (excluding the centrally planned econom ies). Mining production, in the first half of 1960, was only 5 per cent above the second half, and 11 per cent above the first half of 1959. The rate of increase in manufacturing was almost twice as high, thus further widening the lag between the indices of the two groups. To some extent, this lag is a reflection of the worldwide tendency for technological and industrial progress to move in the direction of economy in the use of prim ary materials in the manufacturing process. World manufacturing production has, as a result, increased faster than world output of prim ary products.
In manufacturing, the rate of expansion varied between the principal groups of industries. Textiles encountered rough going in the first half of 1960; the increase in production was only 1 per cent above that of the second half of 1959. The rate of expansion was the highest in the food group (up 25 per cent over the 1959 level for seasonal reasons, the increase being only 10 per cent over the first half of 1959), metal products (up 15 per cent), and chemicals and metals (both up 12 per cent). On the whole, industrial production picked up after the 1958 slow-down, and the upward phase experienced in 1959 extended into 1960 with the same momentum. Use of equipment that had been idle during 1958, and the coming into production or installation of additional capacity of a large number of industrial projects, contributed to the rise in production during the period under review.
M ining
The tin producing countries of the region in 1960 took advantage of the favourable demand conditions, and the progressive reduction and the final abolition of export quotas by the International
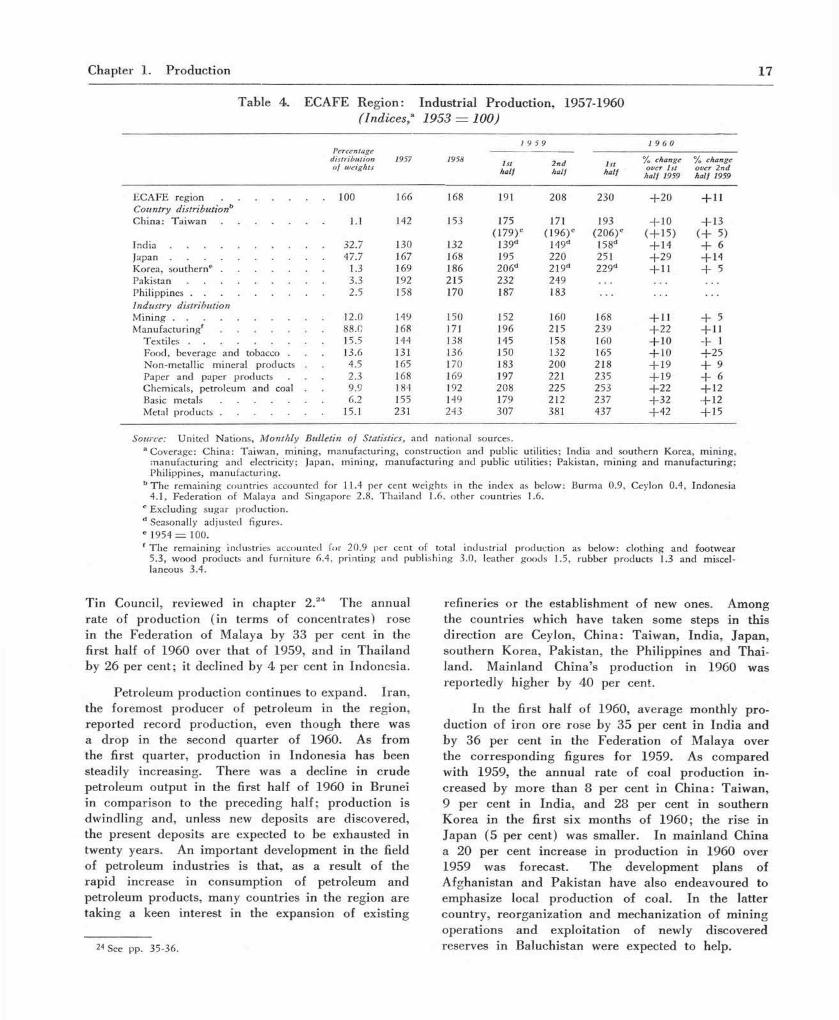
Chapter 1. Production 17
Table 4. ECAFE Region: Industrial Production, 1957-1960 (Indices,a 1953 = 100)
Percentage distribution o f w eights
1 9 5 9 I 9 6 0
1957 1958 1sthalf
2ndhall
1sthalf
% change over 1st
half 1959
% change over 2nd ha lf 1959
ECA FE r e g i o n ..................................... . 100 166 168 191 208 230 + 20 + 11Country distributionbC hina: T a i w a n .................................... 1.1 142 153 175 171 193 + 10 + 13
I n d i a ........................................................... 32.7 130 132(1 7 9 )c
139d(1 9 6 )c
149d(2 0 6 )c
158d( + 15)
+ 14( + 5)
+ 6Japan .......................................................... 47.7 167 168 195 220 251 + 2 9 + 14Korea, sou therne .................................... 1.3 169 186 206d 219d 229d + 11 + 5P a k i s t a n ................................................... 3.3 192 215 232 249P h i l i p p in e s .................................................. 2.5 158 170 187 183Industry distributionM i n i n g ......................................................... 12.0 149 150 152 160 168 + 11 + 5M anufac turingf ..................................... 88.0 168 171 196 215 239 + 2 2 + 11
T e x t i l e s .................................................. 15.5 144 138 145 158 160 + 10 + 1Food, beverage and tobacco . 13.6 131 136 150 132 165 + 10 + 2 5N on-m etallic m ineral products . 4.5 165 170 183 200 218 + 19 + 9Paper an d paper products 2.3 168 169 197 221 235 + 19 + 6Chemicals, petro leum and coal 9.9 184 192 208 225 253 + 2 2 + 12Basic m e t a l s .................................... 6.2 155 149 179 2 1 2 237 + 3 2 + 12Metal p r o d u c t s ..................................... 15.1 231 243 307 381 437 + 4 2 + 15
Source: United Nations, M onthly Bulletin o f Statistics, and national sources.a Coverage: China: T a iw an , m in ing , m anufacturing , construction and public utilities; India and southern Korea, m ining,
m anufac tu r ing and electricity; Japan, m in ing , m a n u fac tu r in g and public utilities; Pakistan, m in in g an d m anufacturing ; Philippines, m anufacturing .
b T h e rem ain ing countries accounted for 11.4 per cent w eights in the index as below: B urm a 0.9, Ceylon 0.4, Indonesia 4.1, Federation of Malaya and Singapore 2.8, T ha iland 1.6, o ther countries 1.6.
c E xclud ing sugar production. d Seasonally adjusted figures. e 1954 = 100.f T h e rem ain ing industries accounted for 20.9 per cent of total industrial p roduction as below: clo th ing and footwear
5.3, wood products and fu rn itu re 6.4, p r in ting and publish ing 3.0, leather goods 1.5, rubber products 1.3 an d miscel-laneous 3.4.
Tin Council, reviewed in chapter 2.24 The annual rate of production (in terms of concentrates) rose in the Federation of Malaya by 33 per cent in the first half of 1960 over that of 1959, and in Thailand by 26 per cent; it declined by 4 per cent in Indonesia.
Petroleum production continues to expand. Iran, the foremost producer of petroleum in the region, reported record production, even though there was a drop in the second quarter of 1960. As from the first quarter, production in Indonesia has been steadily increasing. There was a decline in crude petroleum output in the first half of 1960 in Brunei in comparison to the preceding half; production is dwindling and, unless new deposits are discovered, the present deposits are expected to be exhausted in twenty years. An important development in the field of petroleum industries is that, as a result of the rapid increase in consumption of petroleum and petroleum products, many countries in the region are taking a keen interest in the expansion of existing
2 4 S e e p p . 3 5 - 3 6 .
refineries or the establishment of new ones. Among the countries which have taken some steps in this direction are Ceylon, China: Taiwan, India, Japan, southern Korea, Pakistan, the Philippines and Thai-land. Mainland China’s production in 1960 was reportedly higher by 40 per cent.
In the first half of 1960, average monthly pro-duction of iron ore rose by 35 per cent in India and by 36 per cent in the Federation of Malaya over the corresponding figures for 1959. As compared with 1959, the annual rate of coal production in-creased by more than 8 per cent in China: Taiwan,9 per cent in India, and 28 per cent in southern Korea in the first six months of 1960; the rise in Japan (5 per cent) was smaller. In mainland China a 20 per cent increase in production in 1960 over 1959 was forecast. The development plans of Afghanistan and Pakistan have also endeavoured to emphasize local production of coal. In the latter country, reorganization and mechanization of mining operations and exploitation of newly discovered reserves in Baluchistan were expected to help.
18 P art I. The ECAFE Region in 1960
T extiles
In terms of capital invested, number of workers employed and value of output, textile industries rank high particularly in the newly developing countries of the region. However, this group of industries has recorded a low rate of growth in recent years. Of late, the attention given to modernization of equipment and replacement of obsolete machinery has led to increased capacity in production of cotton yarn and fabrics especially in India and Japan. The endea-vours to achieve self-sufficiency in many countries, as well as the entry of Hong Kong, southern Korea, Pakistan and mainland China into international markets, despite reduced total export trade in cotton textiles, have adversely affected the traditional sup-pliers.25 Exports are becoming more specialized with greater attention to quality and design.
The full force of the long-term stagnation of demand facing the cotton textile industry was not felt during the first half of 1960 owing to reduced availability of raw cotton. This partly explains why production moved forward only slightly in most countries.26 Even when the raw material position improves in 1960/61, as expected, the industry faces an uncertain future due to lack of markets to absorb output. With synthetic fibres steadily making inroads into existing markets, the cotton textile industry is likely to experience stiffer competition. The poten-tialities of expanding home markets, however, should not be underestimated. Lower production and distri-bution costs could redound to the advantage of the industry.
The jute industry was also handicapped owing to a shortage of raw material in 1959/60. This scarcity and resulting speculation drove up prices. The development of the industry in Burma, China (mainland and Taiw an), Philippines and Thailand did not affect the m ajor m anufacturing countries — India and Pakistan — which appeared to be well entrenched in world markets. To meet the serious competition from substitutes, the industry in India has embarked on a modernization programme to reduce production costs. Efforts were made during the year to improve weaving machinery and to change the composition of output in favour of high quality goods.
Food, beverages and tobacco
The sugar industry, which is predominant in this group, is subject to seasonal influences; it is in full swing in the first quarter and active in the
25 See Economic Survey o f Asia and the Far East 1958, pp. 13-14.26 In the earlier m onths of 1960, a serious shortage of cotton
also in m ainland China was reported to have been caused by insect pests in cotton growing areas, thereby slowing down the rate of growth of the textile industry.
second quarter of the year. In 1960, it had done considerably better only in India compared to its performance in the previous year. The improvement in the Philippines was moderate; on the other hand, production fell in China: Taiwan and Pakistan. The world sugar industry was facing adjustment problems as a result of political developments, such as the ban on imports of Cuban sugar into United States markets. This development helped China: Taiwan and the Philippines. The beverage and tobacco industries have been steadily growing in many countries.
Non-metallic mineral products
The cement, brick and tile, and glass industries, because of the booming demand for construction materials in the countries of the region together with simpler production techniques, availability of m a-terials, requirements of relatively less skilled labour, smaller amounts of capital, and the possibility of organizing production on a medium or small-scale, at least for some of these products, have been the favourites in many countries of the region which are taking their first steps in industrial development. The region’s production of cement — the most important of the non-metallic mineral products — increased from an average monthly production of 2.6 million tons in the second half of 1959 to 2.8 million tons in the first half of 1960. This increase was accounted for by Japan’s production alone, which was 1.6 and 1.8 million tons in the respective periods. Production in mainland China was in the range of one and a quarter million tons per month. The non-metallic mineral industries continued to be confronted by problems of transport shortages, rising handling and fuel costs and the lack of raw material surveys. In large countries such as mainland China and India, the industry was being widely dispersed in a number of places, in close proximity to raw materials or markets.
Paper and paper products
Production of paper is still in its infant stages, and Pakistan alone, apart from Japan, has developed the industry commensurate with its domestic needs. The production in Japan accounts for more than 85 per cent of the weight in the regional index; it slowed down since the second half of 1959, and the increase in the first half of 1960 was not high. The rate of production was roughly at about 2.4 million tons a year on the basis of monthly figures available for the first half of 1960. The demand in mainland China could not be met by modern factory production, and handmade paper output was increased to meet the shortage. Production in India, southern Korea and Thailand remains small.
Chapter 1. Production 19
Chemicals
Next to the metal product industries, the chemical industries have recorded one of the highest rates of growth in the region. Chemical fertilizers, soda, inorganic chemicals and other related products, which had long been the mainstay of the output of Japan’s industry, relatively decreased in importance in the last two years with the growth of new products such as petro-chemicals, organic synthetic chemicals and synthetic fibres. The investment in this industry was large and technological progress of a high order. China: Taiwan and India concentrated primarily on production of basic chemicals and fertilizers. P ro -duction of chemical fertilizers, acids, alkalis and synthetic rubber was to be increased in the 1960 production plan in mainland China. A feature of development in this country was the increase in the small-scale production of chemicals, notably sulphuric acid and pharmaceuticals, from indigenous raw materials. A large number of small chemical ferti-lizer plants had been built in the southwestern part of the country to meet the demands of agriculture. Progress in other countries was fairly widespread but it was confined to lines such as oils, pharmaceuticals, production of batteries, dry cells, etc., based on imported semi-finished products.
Base metals
Apart from pig iron and ferro-alloys, the manu-facture of steel also rose steeply. In Japan, the iron and steel industry made rapid strides, and monthly average production rose from 1.25 million tons in the first half of 1959 to 1.75 million tons in the first half of 1960. Improvements in technique in the direction of saving raw materials (the prices of which were increasing) and control of heat helped to keep costs down. Since 1956, the industry has been made technically more efficient, thereby resulting in a shift in production in favour of sheet steel, coated sheets and special steel tools. The greater processing of the products and the availability of better quality steel at comparatively lower prices led to an increase in the production of a wide range of goods, especially in industries producing electrical machinery, appliances, automobiles and industrial and communications equipment.
Production of steel in mainland China was expected to be around 18 million tons in 1960. The progress achieved is attributed to the rise in technical efficiency and to the large investment made in order to expand the industry in the integrated steel centres such as Anshan, Wuhan and Paotow. The range of finished products widened and included high quality steel, new varieties of rails, steel plates, steel tubes and high-grade rolled steel.
An increase of over 24 per cent was registered in the average monthly production of steel in India as from 1959 in the first half of 1960, when pro-duction rose from a monthly average of 206,000 tons to 255,000 tons. The rolling mill at Bhilai went into operation in November 1959. The other steel plants in the public sector, located at Durgapur and Rourkela, have also commenced production, and these, together with the planned expansion of the industry in the private sector, will raise the nation’s steel production capacity up to 6 million tons a year. However, it might take a year or two before full production is reached. With increased local pro-duction, iron and steel imports have been reduced. Among the manufactures, production of heavy and light structural rods increased substantially. Capital equipment and light engineering industries in India also received an impetus from the expansion of the iron and steel industry.
The other newly developing economies in the region, especially Burma, Ceylon, China: Taiwan, Indonesia, Iran, southern Korea, Pakistan, the Philippines and Singapore are in the initial stages of planning and development, and appear to encounter numerous difficulties due to lack of trained personnel, inadequate supplies of raw materials, smallness of the domestic market and no clear prospects of exports.
The growth in the zinc and copper industries was maintained, especially in Japan. Production of copper rose substantially in the Philippines. There was no significant increase in the region’s production of lead. Aluminium gained further ground especially in Japan and India in 1960, and production levels were the highest recorded.
Metal products
The structure of the metal product industries in Japan underwent fundamental changes. Production of durable consumer goods, such as television sets, radios, automobiles, motorcycles, bicycles, electrical goods and other household appliances steadily in-creased. On the demand side, the reduction in prices of durable consumer goods and the rise in incomes contributed to this development. The increase in domestic demand, in addition to the export demand, for a wide range of durable goods has reacted favourably on the capital goods industries, which recorded the high rate of increase of 36 per cent in the first half of 1960, as compared with the previous year. Demand for tooling machines rose rapidly over a wide field. An interesting development was that the input composition changed, taking in much more of the products of the related industries, such as iron and steel, non-ferrous metals, plastics, rubber, paints and also of highly processed goods, notably steel plates and special steel. This form of growth

20 P art I. The ECAFE Region in 1960
made it possible to develop the assembly of a large num ber of items in small and medium enterprises. Greater employment opportunities were available as the nature of work became more skilled, and wages increased; this, in turn, added to the demand for durable consumer goods.
Capital goods industries also fared well in India, where a significant increase in production was recorded in the first half of 1960, as compared with 1959, in machine tools, diesel engines, transport equipment and some other items of machinery. Production increased in a wide range of light industry products, such as bicycles and sewing machines and in m anufacture of industrial small components. The increase in capacity, during 1960, for the m anufacture of some items of machinery for textile, cement and paper industries was expected to replace imports. The shipbuilding industry also increased output, even though production fell far short of the needs of the country.
Machine goods production in mainland China, of late, has been increasingly directed to serving agriculture with a view to the technical transformation of that sector. The recent natural disasters have, to some extent, led to this line of thinking. The need to introduce skill and knowledge into rural areas has been stressed and many urban factories have established links with rural communes to meet their needs for equipment and technical know-how.
Developments in the metal and light engineering product industry in other countries of the region may be briefly touched upon. Production indices rose in China: Taiwan and in other countries. China: Taiwan, Indonesia, southern Korea, Pakistan and the Philippines strengthened their shipyards with special attention paid to the provision of repair facilities. The need to develop inter-island shipping in Indonesia and the Philippines led to a start in building coastal ships. The industry, however, is based on imports of engines and other components, such as steel plates.

Chapter 2
FOREIGN TRADE
GENERAL TREN D S
Continued expansion of industria l p roduction in 1960 provided fu rther stimulus to the expansion of world trade which, in 1959, had already picked up from the slump of 1958. In the first half of 1960, w orld1 exports, at an annual ra te of $111 billion, were 10 per cent over 1959. Exports of p rim ary exporting countries also rose, bu t only by 1 per cent to an annual ra te of $31 billion in the first half of 1960.
The rise in world trade accom panied the rise in world industria l production which, in the first half of 1960, was 5 per cent h igher than in 1959. Industria l countries increased the annual ra te of their im ports by 16 per cent, the most strik ing feature of this growth being that it was concentrated on im ports from other industria l countries ra ther than from prim ary exporting countries. The annual ra te of their im ports from other industria l countries rose in the first half of 1960 by 24 per cent over 1959 whereas tha t of the ir im ports from the prim ary exporting countries did not rise a t all. Even allowing for seasonality of trade, im ports of industria l countries from p rim ary exporting countries showed an increase of only 6 per cent over the first half of 1959.
Various reasons have been given to explain the lagging behind of the exports of prim ary exporting countries in the im port s tructure of the industrial countries. Consum er im ports are progressively shift-ing in favour of m anufactured consum er durables. In m anufac turing production there seems to be a trend tow ards in ternational specialization, whereby world exchange of m anufactured goods between industria l countries is being increased. Finally, technological progress tends to reduce the share of prim ary m aterials in the value of m anufactured goods and to provide substitutes for p rim ary m aterials themselves. As a result, even when world exports expand p a r i passu w ith world industrial activity, p rim ary p roducing countries are not able to m aintain their share .2
1 Excluding the Soviet Union and other centrally planned economies in eastern Europe and east Asia.
2 For a study of long-term stagnation of the exports of the primary exporting countries of the region see chapter 4 of theEconomic Survey o f Asia and the Far East, 1959.
Table 5. W orld Industria l P roduction and Foreign T rade, 1957-1960
I te m 1957 1958 1959 1959 1960 F irst h a lt F irst h a lf
Industrial Production (Index numbers of volume; 1959 = 100)North America . . . 96 89 100 . 100 104Western Europe . . . 92 94 100 98 109Japan ....................... 80 81 100 94 121W o r l d ....................... 93 91 100 98 105
Foreign Tradea Exports f.o.b.
W o r l d ....................... 99.8
(Value
95.1
in billion dollars)
100.6 47.7 55.5Primary exporting
countries . . . . 30.6 29.2 30.8 15.0 15.6Imports f.o.b.
All industrial countries From industrial
countries . . . 39.3 36.8 41.6 21.1 25.7From rest of the
world . . . .. 21.5 20.6 22.0 10.4 11.0North America
From industrial countries . . . 11.2 11.0 13.3 6.4 6.7
From rest of the world . . . . 6.8 6.7 7.1 3.5 3.5
Western Europe From industrial
countries . . . 26.4 24.6 27.0 14.1 18.0From rest of the
world . . . . 13.2 12.6 13.4 6.2 6.7Japan
From industrial countries . . . 1.68 1.17 1.38 0.66 0.90
From rest of the world . . . . 1.46 1.26 1.58 0.77 0.91
Source: United Nations, M onthly Bulletin of Statistics. a Excluding centrally planned economies.
ECAFE PRIMARY EXPORTING COUNTRIES
In 1960, the p r im a ry expor tin g countries of the region (excluding the centrally planned economies) fared better in their exports than the other p rim ary exporting countries of the world.3 W hereas total exports of all p rim ary exporting countries in the first half of 1960 were about 4 per cent h igher than in the first half of 1959, the exports of the p rim ary exporting countries of the region were 18 per cent higher. At an annual ra te of $7.6 billion for the nine-month period from January to September 1960, exports were 11 per cent above the corresponding period of 1959. Im ports which had been kept under
3 Excluding the centrally planned economies.

22 P art I. The ECAFE Region in 1960
control in 1959, following the sharp decline in exports in 1958, also shot up; at an annual ra te of $8.95 billion, they were 16 per cent over the first nine months of 1959.
Import prices showed a slightly upward trend in 1960; the export price indices in the first half of 1960 in several industrial countries exporting to the ECAFE prim ary exporting countries were some-what higher than in 1959 (United States 1 per cent, United Kingdom 2 per cent, Federal Republic of Germany 1 per cent and Japan 3 per c e n t) . How-ever, the rise in the import prices of goods from industrial countries was to some extent compensated for by a fall in import prices of rice. As a result, import unit values showed, on the whole, uneven trends. In the first half of 1960, they were higher than in 1959 in China: Taiwan, the Federation of Malaya and Singapore, Pakistan, Philippines, Thai-land and southern Viet-Nam, and remained at the same level or were lower than in 1959 in Ceylon, India, Indonesia and southern Korea.
Export unit values also rose in 1960; the only exceptions were China: Taiwan and possibly Burma (for which statistics are not available). China: Taiwan suffered the double disadvantage of lower prices for both sugar and rice. The low rice prices in Thailand were compensated for by higher prices of rubber, which replaced rice as the principal export item in the first eleven months of 1960. The terms of trade also improved, except for China: Taiwan, southern Viet-Nam and possibly Burma. The aggre-gate rise comes to about 4 per cent for the first half of 1960, as compared with the first half of 1959; the terms of trade deteriorated in the second half of the year with the fall in export prices— particularly of rubber and petroleum, two of the region’s most important prim ary exports.
The countries had sharply improved their trade balance in 1959 from a trade deficit of $1.61 billion in 1958 to a deficit of $0.87 billion in 1959; this was the result of restricted growth in imports and a comparatively larger expansion in exports (see table 6 ) . In the first nine months of 1960, as imports rose faster than exports, the balance of trade for the prim ary exporting countries of the region became more unfavourable; the deficit increased by $314 million over the deficit in the same period of1959. Favourable trading conditions continued for the Federation of Malaya, North Borneo and the Philippines; and these countries enjoyed an improved balance of trade. Other countries (except Brunei, China: Taiwan, Indonesia and Sarawak which ex-perienced a decline in export proceeds from the transit trade in crude or refined oil products) let their balance of trade deteriorate largely on account of a higher rate of increase in imports. These countries
Table 6. ECAFE Region: Balance of Trade, 1958-1960
(M illion dollars)
Balance o f trade
Country1958
January- 1959 September
1959
January-September
1960
Totala ................................. - 1 ,7 6 3 - 1,014 - 909 _ 1,490Brunei ........................ 80 80 61 50Burma ........................ 12 — 14 - 4C a m b o d i a ................... - 23 - 10 7 - 21Ceylon ........................ 2 - 53 - 52 - 24China: Taiwan . . . - 70 - 74 - 58 - 107Federation of Malaya. 75 239 163 211H ong Kong . . . . - 280 - 292 - 211 - 248I n d i a ............................ - 622 - 556 - 479 - 476Indonesia ................... 241 413 326 225
- 156 - 143 - 214 - 481Korea, southern . . - 362 - 264 - 196 - 191Laos ............................ - 26 - 12 9 - 9North Borneo . . . 1 7 5 6P a k i s t a n ........................ - 94 - 32 - 30 - 181P h i l ip p in e s ................... - 66 21 29 30S a r a w a k ........................ 10 25 21 17S i n g a p o r e ................... 196 - 153 - 119 - 140Thailand ................... - 84 - 60 - 44 - 40Viet-Nam, southern . - 177 - 150 - 109 — 107Total (excluding
Japan) . . . - 1,607 - 871 - 695 —1,009
Source: U n ited N ations M onthly Bulletin o f Statistics, and national sources.
a E xc lud ing A fghanistan , Iran an d N epal for w hich data are n o t available.
either had their trading balance converted into a deficit (Burma) or else their previous deficits increased (Cambodia, Hong Kong, southern Korea, Laos, Pakistan, Singapore and southern V iet-Nam ). The deficit in the balance of trade for some countries (Ceylon, India, southern Korea, Thailand and southern Viet-Nam) was reduced by an increase in the value of exports; only in Ceylon (and possibly in Laos) did the increase in exports go together with a reduction in imports.
Balance of payments data, even for the first half of the current year, are still preliminary and are available for only a few countries.4 In the first half of 1960, owing to a larger volume of exports and higher freight rates, payments abroad on account of transport and insurance increased substantially for these countries. On the other hand, the net current payments position on government account, indicating a retrenchment of non-trade government expenditure abroad, was more favourable in the first half of the current year than in the same period of 1959. Net payments on account of profits, dividends and interest on foreign private investment were slightly higher in the first half of the current year for Burma, Ceylon and the Philippines. In Indonesia, southern
4 B urm a, Ceylon. Indonesia , sou the rn K orea, Pakistan, the Philippines and T h a ilan d .
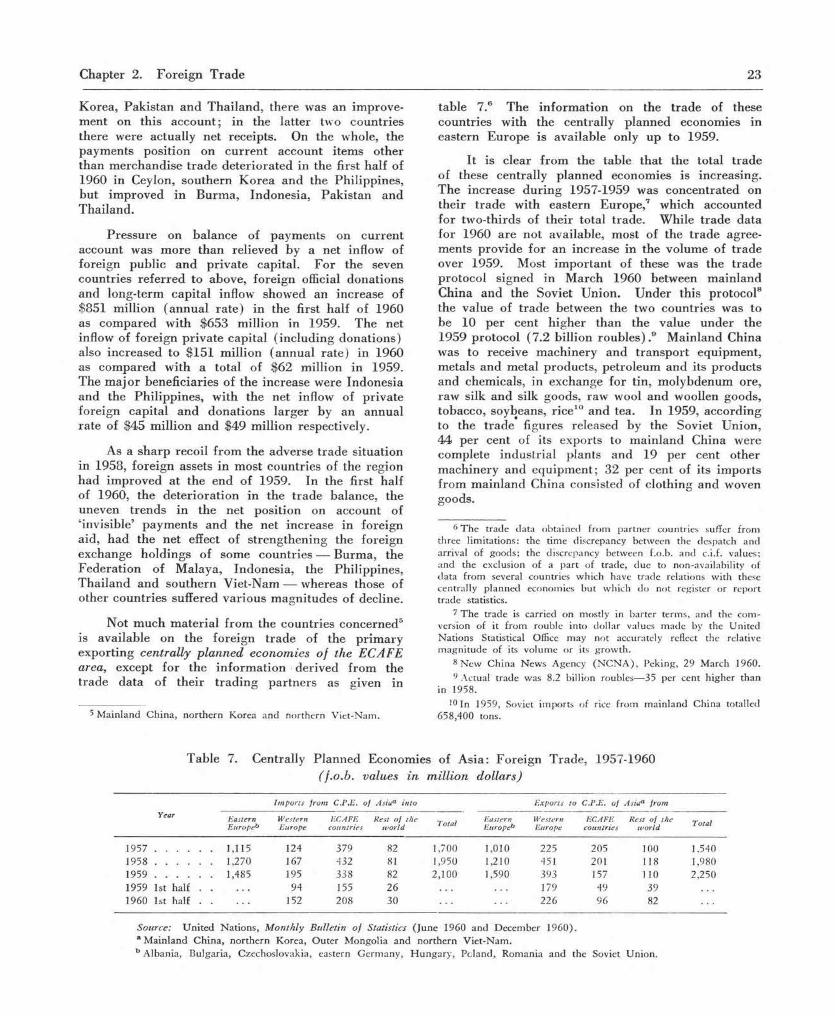
Chapter 2. Foreign Trade 23
Korea, Pakistan and Thailand, there was an improve-ment on this account; in the latter two countries there were actually net receipts. On the whole, the payments position on current account items other than merchandise trade deteriorated in the first half of 1960 in Ceylon, southern Korea and the Philippines, but improved in Burma, Indonesia, Pakistan and Thailand.
Pressure on balance of payments on current account was more than relieved by a net inflow of foreign public and private capital. For the seven countries referred to above, foreign official donations and long-term capital inflow showed an increase of $851 million (annual rate) in the first half of 1960 as compared with $653 million in 1959. The net inflow of foreign private capital (including donations) also increased to $151 million (annual rate) in 1960 as compared with a total of $62 million in 1959. The m ajor beneficiaries of the increase were Indonesia and the Philippines, with the net inflow of private foreign capital and donations larger by an annual rate of $45 million and $49 million respectively.
As a sharp recoil from the adverse trade situation in 1958, foreign assets in most countries of the region had improved at the end of 1959. In the first half of 1960, the deterioration in the trade balance, the uneven trends in the net position on account of ‘invisible’ payments and the net increase in foreign aid, had the net effect of strengthening the foreign exchange holdings of some countries — Burma, the Federation of Malaya, Indonesia, the Philippines, Thailand and southern Viet-Nam — whereas those of other countries suffered various magnitudes of decline.
Not much material from the countries concerned5 is available on the foreign trade of the primary exporting centrally planned economies o f the ECAFE area, except for the information derived from the trade data of their trading partners as given in
5 M a i n l a n d C h i n a , n o r t h e r n K o r e a a n d n o r t h e r n V i e t - N a m .
table 7.6 The information on the trade of these countries with the centrally planned economies in eastern Europe is available only up to 1959.
It is clear from the table that the total trade of these centrally planned economies is increasing. The increase during 1957-1959 was concentrated on their trade with eastern Europe,7 which accounted for two-thirds of their total trade. While trade data for 1960 are not available, most of the trade agree-ments provide for an increase in the volume of trade over 1959. Most important of these was the trade protocol signed in March 1960 between mainland China and the Soviet Union. Under this protocol8 the value of trade between the two countries was to be 10 per cent higher than the value under the 1959 protocol (7.2 billion roubles).9 Mainland China was to receive machinery and transport equipment, \ metals and metal products, petroleum and its products and chemicals, in exchange for tin, molybdenum ore, raw silk and silk goods, raw wool and woollen goods, tobacco, soybeans, rice10 and tea. In 1959, according to the trade figures released by the Soviet Union, 44 per cent of its exports to mainland China were complete industrial plants and 19 per cent other machinery and equipment; 32 per cent of its imports from mainland China consisted of clothing and woven goods.
6 T h e trade data obtained from partner countries suffer from three lim itations: the tim e discrepancy between the despatch and arrival of goods; the discrepancy between f.o.b. and c.i.f. values; and the exclusion of a pa r t of trade, due to non-availability of data from several countries w hich have trade relations w ith these centrally p lanned economies but w hich do not register or report trade statistics.
7 T he trade is carried on mostly in barter terms, and the com- version of it from rouble into dollar values m ade by the United N ations Statistical Office m ay n o t accurately reflect the relative m agn itude of its volum e or its grow th .
8 N ew C hina N ew s Agency (N C N A ) , Peking, 29 M arch 1960.9 Actual trade was 8.2 billion roubles— 35 per cent h igher than
in 1958.10 In 1959, Soviet im ports of rice from m ain land C hina totalled
658,400 tons.
Table 7. Centrally Planned Economies of Asia: Foreign Trade, 1957-1960 (f.o.b. values in million dollars)
Year
imports from C.P.E. of Asiaa into Exports to C.P.E. o f Asiaa from
Eastern Europeb
WesternEurope
ECAFEcountries
Rest o f the world Total Eastern
EuropebWesternEurope
ECAFEcountries
Rest o f the world Total
1 9 5 7 .................................. . 1 , 1 1 5 1 2 4 3 7 9 8 2 1 , 7 0 0 1,010 2 2 5 2 0 5 100 1 , 5 4 0
1 9 5 8 .................................. . 1 , 2 7 0 1 6 7 4 3 2 8 1 1 , 9 5 0 1,210 4 5 1 201 1 1 8 1 , 9 8 0
1 9 5 9 .................................. . 1 , 4 8 5 1 9 5 3 3 8 8 2 2,100 1 , 5 9 0 3 9 3 1 5 7 110 2 , 2 5 0
1 9 5 9 1 s t h a l f . 9 4 1 5 5 2 6 1 7 9 4 9 3 9
1 9 6 0 1 s t h a l f . 1 5 2 2 0 8 3 0 2 2 6 9 6 8 2
S o u rc e : U n i t e d N a t i o n s , M o n th ly B u lle tin o f S ta tis tic s ( J u n e 1 9 6 0 a n d D e c e m b e r 1 9 6 0 ) .
a M a i n l a n d C h i n a , n o r t h e r n K o r e a , O u t e r M o n g o l i a a n d n o r t h e r n V i e t - N a m .
b A l b a n i a , B u l g a r i a , C z e c h o s l o v a k i a , e a s t e r n G e r m a n y , H u n g a r y , P o l a n d , R o m a n i a a n d t h e S o v i e t U n i o n .

24 P art I. The ECAFE Region in 1960
The main characteristic of mainland China’s trade with the private enterprise economies of the world is an import surplus in the trade with western Europe financed to a m ajor extent by an export surplus to the ECAFE countries. In the first half of 1960, the trade with both these areas increased over the corresponding half of 1959.
In its trade with western Europe, mainland China moved towards a reduced imbalance by increasing its exports more than its imports. Its p rin -cipal trading partners in this region are the Federal Republic of Germany and the United Kingdom. The former, in the first nine months of 1960, exported 10 per cent less, but imported 22 per cent more from mainland China than in the first nine months of 1959. In the first ten months of 1960, the United Kingdom exceeded the level of its total trade with mainland China in the whole year 1959. The bulk of mainland China’s imports from western Europe consisted of ferrous and non-ferrous metals, machin-ery, wool tops and chemicals, while its exports were made up almost entirely of prim ary products such as oilseeds, tin and bristles.
Mainland China’s imports from other ECAFE countries in the first half of 1960 were almost twice those in the first half of 1959, whereas its exports were about a third higher. It thus reduced its imbalance in trade with this area also. The rise in import values was to a certain extent accounted for by a rise in raw material prices, particularly of rubber. The ratios of mainland China’s exports to its imports in 1960 were 9:1 (first ten months) in the trade with Hong Kong and 7:4 (first eight months) with the Federation of Malaya and Singa-pore. Mainland China, in its trade with Ceylon, in spite of a sharp increase in imports (61 per cent between the first ten months of 1959 and 1960) and a slight decrease in exports (8 per cent for the same period), retained an export surplus. On the other hand, it had a deficit in its trade with India.
The pattern of mainland China’s trade with other ECAFE countries consisted on the export side of foodstuffs (including rice in its trade with Ceylon and Indonesia) and light industry products — notably textiles — in exchange for its imports of metals (through Hong K ong), rubber (from Ceylon, the Federation of Malaya and Singapore) and tin (from the Federation of Malaya and Singapore). As for its trade with India, it exchanged chemicals and newsprint for jute goods.
During the year, mainland China signed a number of trade agreements. The most important among the agreements with countries in eastern Europe was the protocol with the Soviet Union noted above. Significant among its protocols or agreements with the rest of the world are those with the United
Arab Republic involving the purchase of Egyptian cotton, with Cuba involving an annual purchase of 500,000 tons of sugar for five years, with Guinea involving the purchase of coffee, industrial diamonds, coconut products and oilseeds, with Morocco for the purchase of phosphates and with Burma for the purchase of rice. Mainland China thus seems to be having both an import and export trade in rice.
J a p a n
In the first nine months of 1960, Japan’s exports reached an all-time peak annual rate of 3.9 billion dollars, thus exceeding by about 12 per cent the value of exports recorded in 1959. The actual value ($2.9 billion) was already larger than for the whole year 1958. A strong foreign demand for Japanese goods in high-income countries, assisted by an im-provement in export prices, was largely responsible for this unprecedented increase. Destination of exports, in the first half of the year, showed varying rates of increases. There was a sharp increase over 1959 in the annual rate of exports to western Europe (up by 24 per cent), and to Latin America (up by 17 per cent) ; Japan’s exports to its two principal markets — the United States (up by 4 per cent) and the ECAFE countries (up by 11 per cent) — increased relatively less. The exports to mainland China remained virtually at a standstill. Exports to eastern European countries, still comparatively very low (about 1 per cent), expanded by 10 per cent in the first half of the current year as compared with the previous year. '
In the first half of 1960, the products which showed large increases in the annual rates of exports were machinery (26 per cent over 1959), base metals and manufactures (up by 30 per cent), textile products — fibres (up by 15 per cent) and fabrics (up by 12 per cent) — and the nondescript group of other manufactured goods (up by 33 per cent). Exports of chemicals (up by 4 per cent) increased much less and transport equipment suffered a slight decline. Among individual items, wireless equipment, particularly transistor radios, and textile and heavy electrical machinery showed notably larger increases.
Imports rose more than exports; at an annual rate of $4.5 billion during the first nine months, they were 25 per cent above 1959, and were also at an all-time peak. Expansion in industrial pro-duction, increased investment demand and replenish-ment of inventories strengthened the import demand, in the first half of 1960, for raw materials, particularly scrap iron, coal, iron ore, textile fibres, crude rubber and raw hides. Imports from the United States, which accounted for about 35 per cent of the total, rose by 40 per cent. Imports from ECAFE countries (21 per cent in the first half of 1960) also rose at
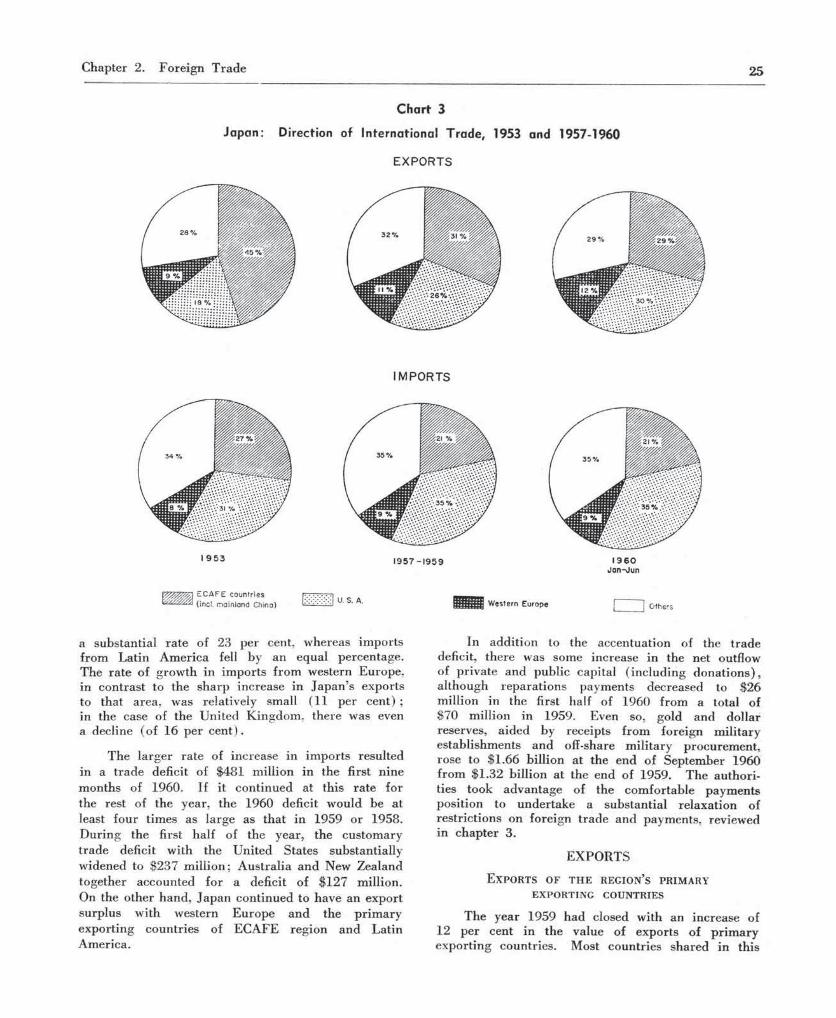
Chapter 2. Foreign Trade 25
C h a r t 3
J a p a n : Direction of In ternational Trade , 1953 and 1957-1960
E X P O R T S
a substantial rate of 23 per cent, whereas imports from Latin America fell by an equal percentage. The rate of growth in imports from western Europe, in contrast to the sharp increase in Japan’s exports to that area, was relatively small (11 per cent) ; in the case of the United Kingdom, there was even a decline (of 16 per cent).
The larger rate of increase in imports resulted in a trade deficit of $48 1 million in the first nine months of 1960. If it continued at this rate for the rest of the year, the 1960 deficit would be at least four times as large as that in 1959 or 1958. During the first half of the year, the customary trade deficit with the United States substantially widened to $237 m illion; Australia and New Zealand together accounted for a deficit of $127 million. On the other hand, Japan continued to have an export surplus with western Europe and the primary exporting countries of ECAFE region and Latin America.
In addition to the accentuation of the trade deficit, there was some increase in the net outflow of private and public capital (including donations), although reparations payments decreased to $26 million in the first half of 1960 from a total of $70 million in 1959. Even so, gold and dollar reserves, aided by receipts from foreign military establishments and off-share military procurement, rose to $1.66 billion at the end of September 1960 from $1.32 billion at the end of 1959. The authori-ties took advantage of the comfortable payments position to undertake a substantial relaxation of restrictions on foreign trade and payments, reviewed in chapter 3.
EXPORTS
E x p o r t s o f t h e r e g i o n ’s p r i m a r y
EXPORTING COUNTRIES
The year 1959 had closed with an increase of12 per cent in the value of exports of primary exporting countries. Most countries shared in this
IMPORTS
E C A F E coun tr ies ( incl. mainland China)
U. S. A. Western Europe Others
I 9 6 0J a n - J un
1 9 5 7 - 1 9 5 91 9 5 3
28%
9 %
18 %
45 %
3 2 % 31%
2 6 %11%
3 0 %12%
2 9 % 2 9 %
3 5 %
21 %
3 5 %9 %
3 5 %
9 %
3 5 %
21 %
34 %
8 % 31 %
2 7 %

2 6 P a r t I . T h e E C A F E R e g i o n i n 1 9 6 0
T a b l e 8 . E C A F E R e g i o n : E x p o r t s , 1 9 5 8 - 1 9 6 0
( f . o . b . v a lu e s i n m i l l i o n d o l la r s )
Country
Totala .....................................
1958
9 ,258
1959
10.588
195
January-June
4,810
9
July-September
2,731
0691
January-June
5,707
july- Sep tember
2,891
Change in 1960 over corresponding period of 1959 (per cent)
January- July- June September
+ 19 + 6B r u n e i ..................................... 106 101 52 25 43 22 — 17 — 12B u r m a ...................................... 193 223 99 70 141 48 + 4 2 — 31C a m b o d i a ................................. 53 60 27 16 28 21 + 4 + 3 1C e y l o n ...................................... 359 368 175 92 199 94 + 14 + 2China: T a i w a n ................... 156 157 94 24 86 30 — 8 + 2 5Federation of Malayab . . 616 807 352 217 482 247 + 3 7 + 1 4Hong K o n g ............................ 524 574 258 148 340 178 + 3 2 + 2 0I n d i a .......................................... 1.222 1.308 558 357 637 333 + 14 — 7I n d o n e s i a ................................. 755 872 431 207 434 195 + 1 — 6Japan ..................................... 2,877 3.457 1,540 884 1,845 1,049 + 2 0 + 1 9Korea, s o u t h e r n ................... 16 19 10 5 12 8 + 2 0 + 6 0L a o s .......................................... 1 1 0.4 0.3 0.6 0.2 + 4 4 — 33North B o r n e o ....................... 43 58 25 16 35 18 + 4 0 + 1 2Pakistan ................................. 302 321 141 72 207 77 + 4 7 + 7P h i l i p p i n e s ............................ 493 530 244 148 304 131 + 2 5 — 11S a r a w a k ................................. 152 174 86 45 86 39 — — 13Singaporeb ............................ 1,026 1.124 523 292 587 277 + 12 — 5T h a i l a n d ................................. 309 359 168 91 201 96 + 2 0 + 5Viet-Nam, southern . . . 55 75 26 22 39 28 + 5 0 + 2 7Total (excluding Japan) 6,381 7,131 3,270 1,847 3,862 1,842 + 18 —
Source: United Nations, M onthly Bulletin o f Statistics, and national sources. a Excluding Afghanistan, Iran and Nepal for which comparable data are not available. b Including trade between Singapore and Federation of Malaya.
e x p a n s i o n . T h e d i f f ic u l t i e s i n t h e f i r s t h a l f o f 1 9 5 9 o f r i c e e x p o r t i n g c o u n t r i e s ( B u r m a , C a m b o d i a , T h a i l a n d a n d s o u t h e r n V i e t - N a m ) a n d o f P a k i s t a n w e r e r e m o v e d , i n t h e s e c o n d h a l f o f t h e y e a r , b y a n i m p r o v e m e n t i n t h e d e m a n d f o r r i c e a n d t e x t i l e f i b r e s . A l l t h e s e c o u n t r i e s h a d c lo s e d t h e y e a r w i t h a n i n c r e a s e i n e x p o r t s .
I n t h e f i r s t h a l f o f 1 9 6 0 , t h e v a l u e o f e x p o r t s o f t h e p r i m a r y e x p o r t i n g c o u n t r i e s o f t h e r e g i o n w a s 1 8 p e r c e n t a b o v e t h e f i r s t h a l f o f 1 9 5 9 , a l t h o u g h i t w a s a l m o s t a t t h e s a m e le v e l a s i n t h e s e c o n d h a l f o f 1 9 5 9 . T h e s l o w - d o w n d o e s n o t a p p e a r t o b e s e a s o n a l . E x c e p t i n g t h e f e w c o u n t r i e s ( B r u n e i , L a o s a n d t h e P h i l i p p i n e s ) f o r w h i c h d a t a f o r t h e t h i r d q u a r t e r a r e p r o v i s i o n a l , t h e y i n d i c a t e a s l i g h t f a l l o f 0 .3 p e r c e n t b e t w e e n t h e t h i r d q u a r t e r s o f 1 9 6 0 a n d 1 9 5 9 .
K e e p i n g t h e a n a l y s i s w i t h i n t h e c o n f in e s o f c o m p a r i n g t h e f i r s t h a l v e s o f 1 9 6 0 a n d 1 9 5 9 , t h e v a l u e o f e x p o r t s w a s l o w e r i n t h e f i r s t h a l f o f 1 9 6 0 — d u e t o a d v e r s e f a c t o r s a f f e c t i n g t h e i r s p e c i f i c e x p o r t s — o n l y i n B r u n e i ( p e t r o l e u m ) a n d C h i n a : T a i w a n ( r i c e ) . O n t h e o t h e r h a n d , s i g n i f i c a n t i n c r e a s e s w e r e r e g i s t e r e d i n o t h e r c o u n t r i e s e x p o r t i n g r i c e ( B u r m a , T h a i l a n d a n d s o u t h e r n V i e t - N a m ) , r u b b e r
( C e y lo n , t h e F e d e r a t i o n o f M a l a y a a n d T h a i l a n d ) , t e a ( C e y l o n ) , c o p r a ( t h e F e d e r a t i o n o f M a l a y a , N o r t h B o r n e o a n d t h e P h i l i p p i n e s ) , s u g a r ( t h e P h i l i p p i n e s ) , t e x t i l e f i b r e s ( P a k i s t a n ) a n d m a n u f a c t u r e s t h e r e o f ( H o n g K o n g , I n d i a a n d P a k i s t a n ) , a n d m i n e r a l p r o d u c t s , i n c l u d i n g p e t r o l e u m ( I r a n ) , t i n ( t h e F e d e r a t i o n o f M a l a y a a n d T h a i l a n d ) a n d i r o n o r e ( t h e F e d e r a t i o n o f M a l a y a ) . A l t h o u g h I n d o n e s i a h a d a s t a k e i n s e v e r a l o f t h e s e e x p o r t c o m m o d i t i e s w h i c h d i d w e l l i n g e n e r a l , i t s e x p o r t s r e m a i n e d a b o u t t h e s a m e i n v a l u e a s i n t h e f i r s t h a l f o f 1 9 5 9 a n d d e c l i n e d i n t h e t h i r d q u a r t e r . T h e e n t r e p o t t r a d e ( H o n g K o n g a n d S i n g a p o r e ) a l s o s e e m s t o h a v e
b e e n b r i s k i n t h e f i r s t h a l f o f 1 9 6 0 a s c o m p a r e d w i t h t h e s a m e p e r i o d i n 1 9 5 9 .
T h e v o l u m e o f e x p o r t s o f p r i m a r y c o m m o d i t i e s i n c r e a s e d i n t h e f i r s t h a l f o f 1 9 6 0 o v e r t h e c o r r e s -
p o n d i n g p e r i o d o f 1 9 5 9 f o r a l l p r o d u c t s e x c e p t r u b b e r ( s e e t a b l e 9 ) . T h e d e c l i n e i n t h e v o l u m e o f r u b b e r e x p o r t s w a s p r i m a r i l y a c c o u n t e d f o r b y I n d o n e s i a , a l t h o u g h o t h e r p r o d u c e r s a l s o r e p o r t e d s m a l l e r q u a n t i -t i e s o f t h e i r r u b b e r e x p o r t s t h a n i n t h e f i r s t h a l f o f 1 9 5 9 . O n l y C e y lo n w a s a n e x c e p t i o n ; i t s r u b b e r e x p o r t s a r e p r i m a r i l y g o v e r n e d b y t h e t r a d e a g r e e m e n t w i t h m a i n l a n d C h i n a .

Chapter 2. Foreign Trade 27
Table 9. ECAFE Region: Production, Volume of Exports and Prices of Export Commodities, 1959-1960
Production Volum e o f exports Pricesa
Com m odity U nit Periodcompared
1960 or 1959/60
Change over preceding year
(per cent)
First half o f 1960
Change over first ha lf o f 1959
(per cent)
First half o f 1960
Change over first half o f 1959
(per cent)
A g r i c u l t u r a l p r o d u c t s
R u b b e r ........................................... 1 , 0 0 0 t o n s J a n - S e p t 1,290 — 4.5 854b — 7.3 120.17 + 29.6C o t t o n ........................................... 1 , 0 0 0 b a l e s A u g / J u l 5,125 — 14.5 511 + 12.6 28.43 + 9.9J u t e .................................................... 1 , 0 0 0 t o n s J u l / J u n 1,798 — 11.2 421 + 17.9 6.67c + 20.4cS u g a r d ........................................... 1 , 0 0 0 t o n s S e p / A u g 6,433 + 11.0 1,190 + 4.9 82.34 — 2.6T e a .................................................... m i l l i o n p o u n d s J a n - J u l 612 — 1.2 403 + 3.3 2.14 + 12.6C o p r a ........................................... 1 , 0 0 0 t o n s J a n / D e c 2,500 + 14.2 418e + 35.7 43.85f — 15.9fR i c e .................................................... 1 , 0 0 0 t o n s J u l / J u n 87,266 + 3.3 2,254 + 40.6 42.8 — 11.4
M i n e r a l p r o d u c t s
T i n ( I n t e r m s o f
c o n c e n t r a t e s ) . . 1 , 0 0 0 t o n s J a n - A u g 51 + 30.8 48g + 67.7 793.2 + 1.7I r o n o r e ................................... 1 , 0 0 0 t o n s J a n - J u n 9,999 + 34.9 4,254 + 15.1 40.00 —
P e t r o l e u m , c r u d e . . 1 , 0 0 0 t o n s J a n - J u n 37,155 + 10.3 1.67 — 2.3P e t r o l e u m p r o d u c t s . 1 , 0 0 0 t o n s J a n - J u n 29,857 + 27.9 11.75 + 1.1
M a n u f a c t u r e s
J u t e m a n u f a c t u r e s 1 , 0 0 0 t o n s J a n - J u l 797 + 6.0 385 — 0.3 47.3 + 11.8C o t t o n f a b r i c s . . . m i l l i o n m e t r e s J a n - M a r 2,183 + 5.4 960 + 6.7 56.8 + 13.6
Source: U nited N ations Food and A griculture O rganization , an d national sources. Cotton production— from In ternational Cotton Advisory Com m ittee. Rubber p roduction— from In ternational Rubber Study G roup. T ea production com prising four m ain produc ing countries: Ceylon, India, Indonesia and Pakistan.
a T h e fo llow ing prices are quoted : Rubber: N o .1 RSS, S ingapore, Straits cents per pou n d . Cotton: 289 F Pun jab SGF, K arachi, inc lud ing export tax, US cents per pound . Jute: Raw, w hite bo ttom , N arayanganj, US cents per m au n d . Sugar: C ane sugar, all k inds, f.o.b. T a iw an exports U S$ per ton. T ea: Leaf for export at Calcutta auction excluding export du ty and excise, Rs. per pound. Copra: Resocada, M anila , pesos per 100 kg. Rice: E xport f.o.b. Bangkok, w hite rice 5 % broken , £ pe r long ton. T in : m etal, L ondon -Cash, £ per long ton. Iron ore: Fe, 6 0 % f.o.b. Calcutta, Rs. per long ton. Petroleum , crude: K uw ait, export price, f.o.b. M ona al A hm ad i, 31-31 .9o API gravity, US dollars per barrel. Petroleum , products: U nited K ingdom , domestic price in “ Inner zones” delivered in bu lk , m in im u m 500 gallon lots;fuel oil, m ed ium , pence per gallon. Jute m anufactures: Hessian cloth 10 oz 40", dom estic export price a t Calcutta , Rs.per 100 yds. Cotton piecegoods: Japan, export price f.o.b heavy sh ir ting S /2 0 0 3 grey 38" , yen per yard.
b Exports fro m the F ederation of Malaya and Singapore are net of imports.c Refers to January-M arch only. d Centrifugal only.e Coconut oil and oil equ ivalen t of copra. f Refers to January-M ay only.g In c lud ing deliveries from m ines in the Federation of Malaya to smelters in Singapore, P enang and Butterw orth.
The trend in export prices was less even. Rubber and textile fibres fetched significantly higher prices. The extent of the rise in tea prices in Calcutta auctions (shown in table 9) was rather exceptional, affected as it was by the fall in northeast Indian output; tea prices elsewhere rose only moderately. Tin, crude petroleum and iron ore prices were relatively stable during the period, although tin was slightly higher and crude petroleum slightly lower than in the first half of 1959. On the other hand, the markets for rice, sugar and copra were soft; for rice and copra in particular, the sharp increase in the volume of exports was associated with significantly lower prices.
The developments in the second half of the year altered the picture of the first half; prices appeared to have become somewhat more unstable. Rubber and sugar prices reversed their course; that is, rubber fell and sugar rose. The same happened to jute and rice, but only for a while; jute fell at
first but rose again, whereas rice prices rose and then fell again. The stability of tin and crude petroleum prices in the first half of 1960 also gave way to accentuated movements; there was a sharp rise in tin and a significant cut in crude petroleum prices.
However, the volume and value of the export trade of the prim ary exporting countries, on the whole, continued to be buffeted in world markets by the brute forces of demand and supply. The demand for industrial raw materials was strengthened by the brisk economic activity in the industrial countries of the world in the period of recovery from the 1958 recession, although, towards the end of 1960, portents of yet another recession were visible on the horizon. Exports to the United States in 1959 had risen sharply (by 18 per cent) from 1958; the value in the first half of 1960 was higher (by 13 per cent) than in the corresponding period of 1959. Exports to Japan and to western Europe had also increased.

28 P a r t I. T he EC A FE Region in 1960
On the o ther hand , the decline in the sh a re of intra- regional tra d e am ong the p r im ary exporting countries of the region, w hich was noticed in 1958 an d 1959, seems to have been bare ly arrested . Both in 1959 and in the first ha lf of 1960, it was a shade less than 20 per cent of the total, w hereas it h ad accounted fo r 24 per cent in 1957 and 23 per cen t in 1958. The decline is partly the resu lt of the success achieved by the im porting countries in th e ir efforts to a tta in self-sufficiency in foodgrains, raw m ateria ls and textiles, and of the grow ing availability of alternative sources of supply. P a r ticu la r m ention m ay be m ade in th is connexion of the increased supply of raw cotton and w heat from the U nited States under Public Law 480.
In o rd e r to diversify th e ir export base fo r the sake of export stability and grow th, several p rim ary exporting countries of the reg ion have intensified the ir efforts to expand the ir expor ts o f m an u factured goods. To some extent, the increased exports a re a reflection also of increased m anufac tu ring capacity. Ind ia appears to have becom e a significant exporter of m anufactured goods; the share of m anufac tu res had steadily risen to 44 per cent in the first ha lf of 1960. C hina: T aiw an and P ak is tan have also ra th e r sharp ly increased the share of m anufac tu red goods in th e ir total exports (see table 1 0 ) . T he range of products exported has, however, rem ained lim ited, w ith textiles
(cotton an d ju te ) p redom inating . W hereas the textile exports of In d ia — the m a jo r textile exporting coun try am ong the p r im ary exporting countries of the region — have rem ained relatively sta tionary over the period since 1957, those of the new entrants to the w orld textile m arkets have been growing.
C o m p e t i t i v e s t r e n g t h o f J a p a n ’s e x p o r t s
W hereas w orld exports increased a t the average ra te of 6 per cent per annum d u ring 1953-1959, the ra te of annual increase in J a p a n ’s exports has been roughly 18 per cent. The increase has been achieved th ro u g h rad ica l changes in the p rew ar geographical d is tribu tion of trade. T he loss of Chinese and K orean m arkets, which provided the m ain outlet fo r Japanese exports in the p rew ar period, has tended to reduce the im portance of ECA FE countries in the export trad e of Ja p a n ; the chang ing structu re of Japan’s export goods has reduced it fu rther in the postwar period.
Ja p a n ’s exports to in d ustria l countries are, on the o ther hand , inc reasing ; in fact, alm ost half the to tal increase in J a p a n ’s exports from 1953 to 1959 was to in d ustria l countries. A m ong the industrial countries, th e U nited States has em erged as the p rinc ipa l b uyer of Japanese exports, although western Europe has also increased its share (see chart 3 ) .
Table 10. ECA FE C ountries: Exports of M anufactured Goods, 1957-1960(M ill io n do lla rs )
Source: Compiled by ECAFE secretariat from national sources.a Approximating as far as possible to SITC section 5 ,6,7, and 8, but excluding base and
precious metals. b Excluding re-exports.c Estimate based on 3 months, January-March.
C o u n tr y to ta la a n d m a jo r i te m s 1957 1958 1959 1959 1 s t h a l f
1960 1st h a l f
20(24)
8224(90)42
281(44)215
2958
(28)499c
(3 )c6c
368(30)
14(15)
4158(88)35
237(42)1842631
(22)2811(5)8
293(28)
33(21)
12353(89)72
544(42)426
6084
(26)7724(5)18
685(30)
19(12)
2
468(38)385
3831
( 10)2715(3)9
533(25)
13(9)3
528(38)429
4544
( 12)3810(2 )4
595(26)
China: T a i w a n .................................................(per cent of total e x p o r t s ) ............................of which: T e x t i l e s ..........................................
H ong Kongb ........................................................(per cent of total e x p o r t s ) ............................of which: T e x t i l e s ..........................................
I n d i a ............................................................................(per cent of total exports) .of which: T e x t i l e s ..........................................
L e a t h e r ..........................................Pakistan ...............................................................
(per cent of total e x p o r t s ) ............................of which: T e x t i l e s ..........................................
P h i l i p p in e s ...............................................................(per cent of total e x p o r t s ) ............................of which: W ood and cork manufactures .
Total of countries listed above (excludingH ong K o n g ) .................................................(per cent of total e x p o r t s ) ............................
Chapter 2. Foreign Trade 29
There have also been tem porary factors, such as the prolonged steel strike in the United States during 1959, which have contributed to some extent to an increase in exports of steel and steel manufactures from Japan. The relatively liberal policies pursued by the United States with regard to im ports have also contributed to this result. But the rise in exports has been prim arily due to Jap an ’s growing com-petitive strength and to her increasing ability to cut into the domestic and foreign markets of other industrial countries with a num ber of m anufactured products, such as transistor radios, cameras, toys, high-quality textiles and other high-income consumer goods. It will therefore be of interest, in the context of present developments, to examine the comparative cost factors that contribute to m aking Japan’s relative position advantageous and to attempt to examine how that position is likely to change in the next decade or two.
Japan depends on imports for a large part of the raw m aterials required for her industry. Some of the m ajor imports which have to be hauled from long distances have increased the raw m aterial costs in a number of cases. In 1959, the Japanese prices of some of these m ain imports were higher than prices in the United States; iron ore, by 32 per cent; coking coal, by 63 per cent; crude oil by 37 per cent; heavy oil, by 62 per cent; soda ash, by 62 per cent; and crude soybean oil, by 75 per cent. This heavy dependence on im ports of raw materials is a com-petitive disadvantage, at current rates of exchange, vis-à-vis many of the leading industrial countries.
The price problem of im ported raw materials is being tackled by the development of raw-material- saving techniques. In the m anufacture of iron, for example, not only has the size of blast furnaces been improved, but the coke used per ton of pig iron has been reduced considerably, year by year, until it is now said to be at about the lowest ratio in the world. The steel-making process has also been improved by using oxygen to reduce heat and to lower pig iron requirement. The success achieved in controlling heat has benefited many industries, notably, the cement industry. The increase in the size of electrolytic furnaces has benefited aluminium production. Improvements in tooling and designing have enabled the automobile industry to save on raw materials by reducing the bulk of many parts. The raw material problem has also been met by a switch-over from dearer to cheaper — or scarcer to more abundant -— raw materials. The electrolytic method and the use of coal are being displaced by the use of petroleum and natural gas, saving about 40 per cent of the coal requirem ents in 1959. This change-over, which has helped to save on costs, is rapidly growing in the iron and steel, glass and thermal
power generation industries. The development of domestic petro-chemical industries will also encourage this substitution.
Another favourable factor in recent years has been the lower costs of transportation. Freight costs account for a large part of the prices of some imports, such as petroleum and iron ore. This advantage is of course common to all the countries depending on m aritim e transport for their raw m aterial needs. But the lowering of freight rates has reduced the disadvantage suffered by Japan and other countries in this category vis-à-vis countries which are mainly or wholly dependent on domestic supplies of raw materials.
Cost inflation, which has pushed prices up, particularly in the United Kingdom, and to a lesser extent, in the United States and in the Federal Republic of Germany, has not affected Japan, as Japan ’s economic expansion since 1954 has on the whole been achieved under stable price conditions. However, the m ain reason for the relative cost- advantage has been that Japan has so far continued to be a labour-surplus economy.
Japan has abundant trained labour available at wages comparatively lower, at current rates of exchange, than in other countries. Also the rise in wages has fallen behind a remarkable rise in productivity. As a result, labour costs per unit of finished product actually fell during 1953-1958. But this phenomenon was not general. A high ra te of increase in productivity was experienced in the m achinery industries, particularly transportation m a-chinery, oil and coal products and chemicals. On the other hand, in light industries, notably, hides and skins, foodstuffs and lumber, the rise in labour productivity was negligible, if any, and labour costs were rising. Those industries which attracted larger investments or which were modernized, or which changed production to suit growing demand, showed impressive increases in productivity. Fixed assets per worker in many industries, such as iron and steel, automobiles, chemicals and oil refining, grew rapidly. The comparatively lower proportion of labour costs to the total resulted in larger profits, which were ploughed back to strengthen the industry. Even though wages at current prices increased by 5.5 per cent a year during 1953-1958, the rise was much lower than that in productivity. This development is in contrast with that in other industrial countries, where the average rate of increase in wages was higher than that in productivity (see table 11). It was only in Japan that wages did not keep pace with the rise in productivity during 1953-1959.
The relative lowness of the wages is, in part, a reflection of the artificiality of the current rates of exchange which, while it raises the prices of the
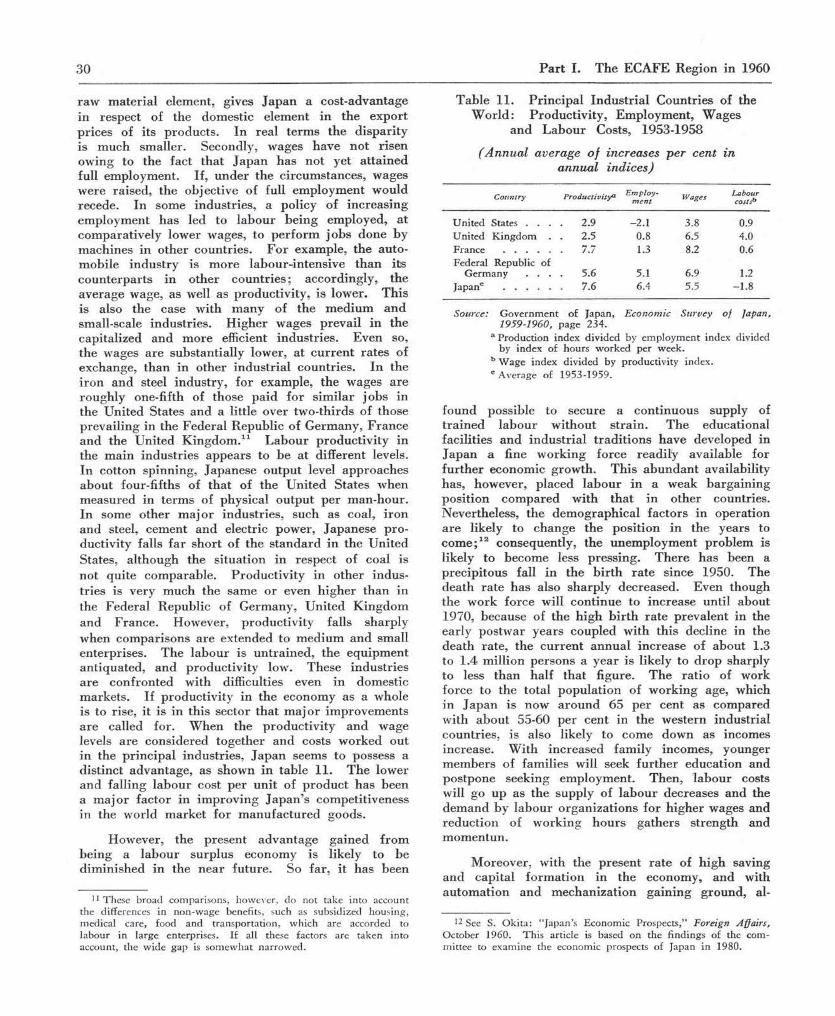
30 P art I. The ECAFE Region in 1960
raw m aterial element, gives Japan a cost-advantage in respect of the domestic element in the export prices of its products. In real terms the disparity is much smaller. Secondly, wages have not risen owing to the fact that Japan has not yet attained full employment. If, under the circumstances, wages were raised, the objective of full employment would recede. In some industries, a policy of increasing employment has led to labour being employed, at comparatively lower wages, to perform jobs done by machines in other countries. For example, the auto-mobile industry is more labour-intensive than its counterparts in other countries; accordingly, the average wage, as well as productivity, is lower. This is also the case with many of the medium and small-scale industries. Higher wages prevail in the capitalized and more efficient industries. Even so, the wages are substantially lower, at current rates of exchange, than in other industrial countries. In the iron and steel industry, for example, the wages are roughly one-fifth of those paid for similar jobs in the United States and a little over two-thirds of those prevailing in the Federal Republic of Germany, France and the United Kingdom.11 Labour productivity in the main industries appears to be at different levels. In cotton spinning, Japanese output level approaches about four-fifths of that of the United States when measured in terms of physical output per man-hour. In some other m ajor industries, such as coal, iron and steel, cement and electric power, Japanese pro-ductivity falls fa r short of the standard in the United States, although the situation in respect of coal is not quite comparable. Productivity in other indus-tries is very much the same or even higher than in the Federal Republic of Germany, United Kingdom and France. However, productivity falls sharply when comparisons are extended to medium and small enterprises. The labour is untrained, the equipment antiquated, and productivity low. These industries are confronted with difficulties even in domestic markets. If productivity in the economy as a whole is to rise, it is in this sector that m ajor improvements are called for. When the productivity and wage levels are considered together and costs worked out in the principal industries, Japan seems to possess a distinct advantage, as shown in table 11. The lower and falling labour cost per unit of product has been a m ajor factor in improving Japan’s competitiveness in the world market for m anufactured goods.
However, the present advantage gained from being a labour surplus economy is likely to be diminished in the near future. So far, it has been
11 T hese b road com parisons, how ever, do n o t take in to account th e differences in non -w ag e benefits, such as subsid ized housing , m edical care, food an d transporta tion , w hich are accorded to lab o u r in la rge enterprises. If all these factors are taken in to account, th e w id e gap is so m ew h at narro w ed .
Table 11. Principal Industrial Countries of the W orld: Productivity, Employment, Wages
and Labour Costs, 1953-1958
(A nnual average o f increases per cent in annual indices)
Country Producti vitya E m ploy-m ent W ages Labour
costsb
U n ited States . . . 2.9 - 2.1 3.8 0.9U nited K in g d o m . . 2.5 0.8 6.5 4.0F rance .................... 7.7 1.3 8.2 0.6F ederal R epublic o f
G erm an y . . . 5.6 5.1 6.9 1.2Japanc .................... 7.6 6.4 5.5 - 1.8
Source: G o v ern m en t o f Japan , Economic Survey o f ]apan,1959-1960, pag e 234.
a Production index divided by employm ent index divided by index of hours worked per week.
b W age index divided by productivity index. c Average of 1953-1959.
found possible to secure a continuous supply of trained labour without strain. The educational facilities and industrial traditions have developed in Japan a fine working force readily available for further economic growth. This abundant availability has, however, placed labour in a weak bargaining position compared with that in other countries. Nevertheless, the demographical factors in operation are likely to change the position in the years to com e;12 consequently, the unemployment problem is likely to become less pressing. There has been a precipitous fall in the birth ra te since 1950. The death rate has also sharply decreased. Even though the work force will continue to increase until about 1970, because of the high b irth rate prevalent in the early postwar years coupled with this decline in the death rate, the current annual increase of about 1.3 to 1.4 million persons a year is likely to drop sharply to less than half that figure. The ratio of work force to the total population of working age, which in Japan is now around 65 per cent as compared with about 55-60 per cent in the western industrial countries, is also likely to come down as incomes increase. W ith increased family incomes, younger members of families will seek further education and postpone seeking employment. Then, labour costs will go up as the supply of labour decreases and the demand by labour organizations for higher wages and reduction of working hours gathers strength and momentun.
Moreover, with the present rate of high saving and capital formation in the economy, and with automation and mechanization gaining ground, al-
12 See S. O k ita : “ Ja p an ’s E conom ic Prospects,” Foreign Affairs, O ctober 1960. T h is article is based on the find ings of the com -m ittee to exam ine the econom ic prospects of Japan in 1980.

Chapter 2. Foreign Trade 31
though the need for unskilled labour will diminish, shortages of highly trained labour, which are already being felt in some of the m odern industries, will develop. Japan has begun to move towards full employment and, in a decade or so, many changes may be expected in the labour market. Wages are likely to rise and be m ore and m ore akin to those prevailing in other leading industrial nations. The higher wages in the larger industries will influence the wage structure in the rest of the economy. Labour in other sectors will gravitate to better paid occupations, and modernization of the backward sectors will become necessary in order to keep the units efficient and to retain the needed labour.
On the other hand, with the high rates of capital investment and technological progress, a sharp rise in productivity is anticipated. The current moves towards increased liberalization and exposure of the economy to international competition will have a considerable impact on the structure of industry. First of all, those low productivity industries which are faced with obstacles in procuring raw materials at economic prices or which do not have efficient equipment to withstand competition will decline, unless they are able to improve the techniques of production in vogue at present. Secondly, it will become clearer in which industries Japan can develop sales in international markets. The export pattern has been changing in favour of high quality and highly processed goods. The markets for commodities re -quiring comparatively unskilled labour at relatively low wages, such as cotton yarn and cotton fabrics, are being lost to other countries in the region. On the other hand, Japan possesses advantages in labour- intensive exports requiring skilled labour, such as transistor radios, cameras, and some assembled p ro -ducts such as sewing machines and other consumer durables. Increased investments in these industries will be undertaken to make them stronger in world markets. Thirdly, the leading industries — notably heavy machinery and petro-chemicals — will be con-siderably strengthened with technological improve-ment so as to provide for increased exports as well as for domestic needs. A num ber of industries based on increased diversification and on higher processing of products of the expanded basic metals industry will be developed. The automobile industry and some of the durable consumer goods industries have benefited by this development and are now ready for technological improvement designed to raise produc-tivity. Brisk investments in their modernization are foreseen. Finally, the development of mass consump-tion in a num ber of goods previously limited to the higher income groups, as well as growing opportunity in export markets, will be a crucial factor in accelerating further industrial investment.
Thus, on balance, there appears little likelihood of a threat to Japan’s competitive strength in the near future. While wages may rise, sharp increases in productivity are anticipated. However, for the long-term future, it is impossible to forecast the net effects of these developments on Japanese cost structure vis-à-vis those in other industrial countries. If in the event Japan loses its comparative labour-cost advantage, could it compensate for this loss by its higher ra te of saving? W ould the high rate of saving (and investment) be maintained, if the dis-tribution of incomes were to change in favour of the working classes? Would technological progress in Japan keep pace with that in the other countries? Any prediction as to the long-term prospects of Jap an ’s exports would require answers to these questions. There is also another feature. The very advantage of ample labour supply and low labour costs which has favoured Japan vis-à-vis other industrial countries of the world may now be exploited by the newly developing economies — India and m ainland China, for instance — to the disadvant-age of Japan. Japan’s competitive advantage may, therefore, get sandwiched between pressures arising, on the one hand, from the developing economies with their labour-cost advantage and, on the other, from the industrial countries — including the United States and the Soviet Union — which possess a better raw material base and which may attain higher rates of technical progress.
P r i m a r y c o m m o d i t y t r e n d s 13
The supply of natural rubber tends to be inflexible in the short run, for it is dependent upon the quantity and quality of trees already planted in the producing countries. Over 90 per cent of world production of this commodity is in southeast Asia, with over two-thirds of it in two countries —- the Federation of Malaya (34 per cent of the world total in 1959) and Indonesia (35 per cen t). The Federation of Malaya, with state-promoted schemes of replanting and its research-boosted production, has been gradually closing the gap and threatens to overtake Indonesia as the world’s leading producer. In Indonesia, production, particularly on the estates, is falling.
In the long run, the demand for natural rubber is buoyed up by the growth of rubber-consuming industries, but modified by the growing substitution of synthetic rubber for natural rubber. Between 1949 and 1959, consumption of synthetic rubber grew over threefold whereas that of natural rubber increased only by a half. The rubber trade, in
13 T h e trade in rice, w h ich is p r im a rily in tra reg iona l, is d is-cussed in the section o n im ports together w ith o ther foodgrains; see pp . 37-39.

32 P art I. The ECAFE Region in 1960
recent years, has been influenced by the decisions of the United States and the United Kingdom to sell from their stockpiles and, also, by the growing but spasmodic purchases of the Soviet Union and mainland China in Singapore and London markets. In 1959, these two countries bought a total of 384,000 tons, or about 18 per cent of the total crop.
Between 16 October 1959 and 31 July 1960, the United States sold from its stockpiles a total of 86,400 tons.14 On 4 May 1960, the Disposals Act, providing for the sale of 477,500 tons from the United States Government strategic stockpile over a period of nine years, went into effect. The quantities which are to be released from time to time are to vary with prices, in order to avoid disrupting the market. The United Kingdom with much smaller stocks than the United States is also depleting its stocks; the extent of monthly sales from the govern-ment stockpile is to vary, as in the United States, with the price in the commercial market. The price- quantity schedules of releases in the two countries are shown below:
Due to a drop in Indonesian output, the ECAFE region produced 4.5 per cent less in the first nine months of 1960. Exports during the period declined by 11 per cent compared with the same period in the previous year, as against a decline in world consumption of natural rubber of about 3 per cent. There was an increase (by 10 per cent) in Ceylon’s exports; those to mainland China increased sharply. Net exports from Indonesia, the Federation of Malaya and Singapore and Thailand declined. The forecasts for the balance of the year predicted an easier supply situation. Synthetic rubber consumption was anti-cipated to increase by about 12 per cent, whereas natural rubber consumption was expected to decline by 5 per cent for the whole year 1960. P art of the natural rubber consumption would be met from stockpile releases.
From a low of 25.5 cents per pound (No. 1, RSS, New York spot price) in June 1958, prices had risen steadily through 1959 in response to a strong increase in demand for consumption in all the m ajor consuming areas. They reached their
14 E q u iva len t to 4 per cent of total p roduction of natural rubber in 1959.
1959 peak at 45 cents in November. During the first six months of 1960, as a result of the tight supply situation the average price of New York, No. 1, RSS, was 28 per cent higher than during the same period of 1959; the 1960 peak was reached at 45.6 cents in June. From July, prices began to fall; neither the Soviet Union nor m ainland China were in the market. By August, prices had reached the levels — 36 cents per pound in New York and 30.5 pence per pound in London — below which the previously unlimited releases from government stock-piles would begin to be restricted.
The demand for tea in the importing countries was considered likely to rise in 1960 in line with the population growth. Imports were higher in the United Kingdom (by 1 per cent in the first eleven months of 1960 as against the corresponding period of 1959), and in the United States (by 9 per cent in the first eight months) ; they declined, on the other hand, in Canada.
The production of tea, in the first seven months, was smaller, due particularly to the drop in output in northeast India. The tea market, on the whole, was uneventful in the first three quarters of 1960, except for a price rise in Calcutta auctions due to depletion of stocks. Prices in other markets were only moderately higher. The average import price at London auctions for the first nine months of 1960 was about 4 per cent higher than during the corres-ponding period of 1959.
As for (but to a lesser extent than) rice, rubber and tea, the region accounts for a m ajor portion (63 per cent in 1957) of the world supply of copra and coconut oil. After a sharp decline from 1957 to 1959, the supply of copra was expected to increase substantially in 1960. The forecast was for total world copra and coconut oil exports of 1.2 to 1.3 million tons in terms of oil in 1960, as against 0.98 million tons in 1959. W ith expanding production, coconut and copra exports of the region (in terms of oil) in the first half of 1960 increased substantially —- by 36 per cent from the corresponding period of 1959. Philippine shipments of copra — normally one third of the world total — were, in the first nine months of 1960, 46 per cent higher than in the corresponding period of 1959, whereas oil exports declined by 23 per cent; and, while exports of copra to the United States fell by 5 per cent, those to western Europe more than doubled during this period. Western Europe was rebuilding its stocks of copra and coconut oil, which were running low at the end of 1958 and which could not be built up in 1959 due to inadequate supplies.
Indonesian exports of copra, during the first half of 1960, increased by almost 2 per cent from the same period of 1959. Unregistered trade in
U nited States U nited K ingdom
M axim um M axim umPrice range disposals per Price range disposals per(U S cents per lb ) calendar quarter (pence per lb) calendar m onth
(long tons) ( lo n g tons)
Under 30 30 to less than 32 32 to less than 34 34 to less than 36 36 and above
none 9,000
18,000 27,000
no limit
Below 25to below 2725
27 to below 2828 to below 3030 and above
none 800
1,600 2,400
no limit
Chapter 2. Foreign Trade 33
copra is dim inishing; during the first half of 1960, officially reported exports of copra were estimated to be about two-thirds of the total, as against one-half in the corresponding period of the previous year. This trend was a result of improved prices paid to producers by national m arketing co-operatives. The rise in exports of copra from Indonesia in the first half of 1960 could have been greater bu t for a temporary embargo on copra shipments in January 1960 to increase domestic supply. The country’s total exports for the whole year 1960 were planned at 200,000 tons of copra, a level slightly above the average for 1958 and 1959.
The copra exports of Ceylon, which had fallen sharply between 1956 and 1958, and then risen in 1959, fell sharply again (by 22 per cent on the basis of oil) in the first ten months of 1960, but it appears that the decrease was due to a fall in the availability of copra for export ra ther than to a fall in output. In the first nine months of 1960, N orth Borneo increased by 43 per cent the level of copra exports in the corresponding period of the previous year; net exports from the Federation of M alaya and Singapore were 25,200 tons (oil equivalent) as against none at all a year earlier.
By 1960, the world’s demand for all fats and oils was expected to rise about a quarter above the 1952-1955 average, whereas the production of copra was expected to be only 4 per cent higher. Between 1958 and 1959, western European imports of coconut oil and copra fell 26 per cent, but United States imports rose by 8 per cent. The price of coconut oil (Straits per cent c.i.f. Europe) had risen from an average of £92 per long ton in 1956 to £133 in 1959. At that price it was feared that there would be a substitution of other oils for coconut oil in m anufacturing fat products, particularly as there was a shortage in supply. W ith some easing of supplies, prices came down in 1960. The average price of coconut oil in the United Kingdom and continental Europe during the first nine months of 1960 was 14 per cent lower (£114 per long ton) and in the United States 21 per cent lower than during the same period of 1959. Similarly, Philippine prices of copra in the first nine months of 1960 were 13 per cent lower than the corresponding prices of 1959. The maintenance of coconut oil price stability relative to the general level of fats and oil prices would seem to be the essential condition for a return to a satis-factory level of im port demand, since the slow-growing food uses will remain its main outlet. Prospects for the first half of 1961 indicate that there will be large supplies both of coconut oil and of competing fats and oils in the world m arket; prices can hardly be expected to rise.
The ECAFE region is a net im porter of sugar. Its exports in 1959 were 1.76 million tons — 930,000 tons from the Philippines, 730,000 tons from China: Taiwan, and small quantities from Indonesia and India. As these exports account for only 14 per cent of world exports, developments in the region have little influence on prices.
In 1960, exports from the region were higher than in the corresponding periods of 1959. The Philippines, in the first half of the year, increased its exports by almost 14 per cent. Inspite of lower output in the 1959/60 season, China: Taiwan’s exports in 1960 (January-Septem ber) increased by 4 per cent. Exports from Indonesia were 30,000 tons in 1960 (January-O ctober), 35 per cent higher than during the same period of 1959. On the other hand, exports from India fell, in spite of bigger output, owing to larger domestic consumption.
The world sugar price (Cuba, f.a.s., No. 4 con-tract) had fallen during the first half of 1959; in July, it reached 2.66 cents per pound — its lowest postwar level. Subsequently, it rose in response to quota reductions by the International Sugar Council, large purchases by the Soviet Union, and poor crop prospects in continental Europe, but remained below the Sugar Agreement minimum (3.25 cents per pound) until mid-1960.
At the beginning of July 1960, the United States reduced the rem ainder of Cuba’s im port quota for the year by 630,000 tons (700,000 short tons). This made available to other suppliers an additional market of over a million tons (700,000 short tons of the original Cuban quota, plus additional quantities which, in other circumstances, would have been allotted to C uba). On its side, the Cuban Govern-ment successively announced m inim um export prices of 3 and then 3.25 cents per pound and signed new substantial sugar export agreements with the Soviet Union and m ainland China. As a result of these developments, prices improved and remained around the Agreement’s minimum for most of the th ird quarter of 1960. In view of the new situation, the Sugar Council increased export quotas first to 100 and then to 105 per cent of the basic tonnages, and granted Cuba a “tolerance” of 700,000 tons over its current quota. The action of the Council and, more signi-ficantly, the increasingly optimistic prospects for the 1960/61 sugar crop, caused prices to weaken and, in late September, some countries were already offering beet sugar at prices well below the Cuban minimum.
W orld sugar production in 1960/61 is expected to be 2 to 3 million tons above the 1959/60 record output, the improvement in im porting countries being particularly noteworthy. Over a longer term, further

34 P art I. The ECAFE Region in 1960
increases may be expected. Consumption is also likely to increase, but it is improbable that demand for sugar will rise sufficiently to result in increases over present prices. On the other hand, the recent developments may bring forth far-reaching changes in the pattern of international sugar trade. However, until more is known of the policies of the m ajor countries involved, it is not possible to assess properly their implications for the sugar trade of the ECAFE region.
In spite of smaller jute crops, the jute m anu-facturing industry in 1959/60 (July-June) was more active than in the previous season in India and Pakistan and also in western Europe. Production of gunnies in India during 1959/60 was 3 per cent higher than in 1958/59. Owing to an increase of 5 per cent in mill consumption of jute during the same period, India increased considerably its imports of raw jute from Pakistan. Dispatch of gunnies for domestic consumption increased substantially (13 per cent) during 1959/60, but exports over the same period were down by 2.5 per cent. At the end of June 1960, stocks of gunnies were depleted.
Pakistan’s total exports of raw jute (including mesta cuttings) from July 1959 to June 1960 increased by 7 per cent over the previous season. Exports to India alone were at almost three times the level of the previous year. The ju te goods market in Pakistan was strong, and the mills turned out 26 per cent more in 1959/60 than in the previous season. The total export of gunnies during the same period was up by 43 per cent, and stocks were well run down.
There was a substantial improvement in jute prices during the first half of 1960, culminating in a post-Korean-war high of £144.3 per long ton (raw Pakistan mill first c.i.f. Dundee) in May 1960. The rise in price was due to the tight supply position of the current season and to apprehension regarding raw jute supplies in the 1960/61 season. Then, following less pessimistic forecasts, prices fell in the next two months to £122 in July. In August, how-ever, stability was attained at a level some 15-20 per cent below the May highs. Crops were late in coming to the markets, demand in India and Pakistan was strong, and carry-overs from the preceding season were small. Prices rose in September, as crop prospects again appeared poorer. In India there was anxiety over the next year’s raw jute supplies.
W orld (excluding the centrally planned econo-mies of Europe and Asia) cotton production in 1959/60 (August-July) increased by 6 per cent over 1958/59 to 31 million bales. However, the output of the region (excluding m ainland China) decreased, mainly owing to adverse weather conditions in India. Although m ainland China registered an increase of
almost 3.5 per cent over 1958/59, it increased its imports from Burma and received some — although reduced — imports from Pakistan.
In Japan, the yarn production curtailment instituted in 1958 was progressively relaxed in the 1959/60 season. Since all the sealed spindleage resumed production, cotton consumption during the 1959/60 season was estimated to be around 23 per cent higher. Imports of raw cotton increased by 30 per cent over 1958/59. In Pakistan, consumption went up by 3 per cent. Stocks at the beginning of the 1959/60 season were less by about 41 per cent than at the beginning of the previous season. In India, stocks on 1 August 1960 were down by 26 per cent from 1 August 1959. Cotton consumption in 1959/60 was estimated to be barely higher than in the previous season.
International trade in cotton for the season 1959/60 reached a new, all-time record. Contributory factors in the increase of trade were rising consump-tion demand, shortage of indigenous cotton in India, and the need for stocking up in net importing countries. W orld exports for 1959/60 were estimated to be almost 33 per cent more than in 1958/59. United States exports for the whole season were estimated to have increased by 158 per cent; there was a decline in exports from other countries, including Pakistan and India. The volume of exports of Pakistan in 1959/60 was 13 per cent lower, and of India (August-May) 36 per cent lower, than in the corresponding period of 1958/59. India other-wise was gradually changing from a net importer to a net exporter of cotton.
In 1959/60, cotton prices rose under the stimulus of expanding demand, although some levelling-off took place towards the end of the season. During the first half of 1960, international prices of all types, except United States growths, were higher than those of the same period of 1959.
Opening stock in 1960/61 amounted to 16.5 million bales as compared with 17.7 million bales a year earlier, taking into account a net export of 1.3 million bales to the countries of eastern Europe and m ainland China. It is not certain if stocks will fall further in 1960/61. It will depend on consump-tion, and on net exports to the centrally planned economies. As to prospects for trade for the 1960/61 season, it appeared unlikely that the record volume of world trade achieved in 1959/60 could be main-tained.
The prospects of raw cotton in India depend on the volume of indigenous production and on the demand for cotton textiles at home and for export. The prospects in Japan depend on the policies laid down by the Government regarding production cur-

Chapter 2. F o re ign T rad e 35
tailm ent and raw cotton p rocurem ent. In the U nited States, consum ption is expected to decline in 1960 /61 by about 3 p e r cent from the prev ious season. Elsewhere, consum ption is expected to continue at the h igh levels a tta ined in the prev ious season. In order to m a in ta in the 1 9 5 9 /6 0 ra te of consum ption in net im porting countries, it is estim ated th a t w orld im ports will have to be a t least 12 m illion bales, as against 15.2 m illion bales in 1959 /60 , on the assum ption th a t there will be a reduction in In d ia ’s production deficit an d th a t its im ports will be m a in -tained a t a m ore n o rm al level.
The balance of the trad e w ith eastern E urope and m ain land C hina is also of g rea t im portance to the rest of the w orld . D u rin g 1959 /60 , exports to these countries accounted fo r approxim ate ly 10 per cent of the w orld ’s to tal trade . A ny var ia tio n in net exports to these countries could a lter the w orld ’s cotton outlook.
The volum e of m inera l exports of the reg ion increased. E xports of iro n ore showed a fu r th e r increase in the first ha lf of 1960 of 15 per cent over1959 — this increase com ing m ain ly from the F ed e ra -tion of M a la y a ;15 b u t those from In d ia an d the Philippines declined. The m a jo r destina tion of the exports was Japan , whose to tal im ports of iron ore, s tanding at an annual ra te of over 14 m illion tons in the first six m onths of 1960, w ent up 36 per cent from 1959. Im ports from the Ph ilipp ines — form erly the largest supplier — held up over the decade of the ’fifties w ithout m uch increase, w hereas the F ed e ra -tion of M alaya an d In d ia 15 have increased th e ir share in J a p a n ’s im ports to becom e m a jo r suppliers. I ron ore is in d irect com petition w ith sc rap m etal, which is mostly pu rchased from the U nited States. The trend seems to be th a t iron ore im ports in to Jap an are increasing steadily while scrap exports from the United States fluctuate ra th e r violently w ith the business cycle. Ju d g in g from the u n it values of Japanese im ports, the prices of iro n ore do no t seem to have appreciably changed d u rin g the first ha lf of1960 from 1959.
P roduc tion of c rude p e tro le u m in I ra n rose in the first eight m onths of 1960 to a m onth ly average of 4 million tons as against 3.6 m illion tons in 1959. It also rose in Indonesia (u p by 17 per cent) bu t fell in Brunei (dow n by 13 p e r cent) d u rin g the first half of the year as com pared w ith 1959. E xports increased in volum e bu t p rices fell. T he basic reason for the fall in c rude petro leum prices in 1960 was the con tinuation of a trend , noted fo r som e time, of the grow th in supply ou ts tr ipp ing the g row th in demand. However, the im m ediate fac tors were com -petitive offers from the Soviet U nion of bo th crude
15 And the territory of Goa.
an d refined petro leum at cheaper prices. The oil com panies in several of the consum ing countries — w here they h ad also s ta rted refin ing operations — were u n d er pressure to reduce p rices .16 Unofficial p rices of M iddle East c rude petro leum h a d already com e down before they were officially lowered in two instalm ents, in A ugust and Septem ber 1960, by about 5 per cen t in all. T his action was delayed in o rder n o t to affect the royalties to the p roducing coun tries; the com panies instead g ran ted d iscounts to buyers. Only when it appeared th a t adverse factors would persist fo r some tim e to com e were the prices of c rude pe tro leum reduced a t the source. F a r Eastern oil p rices also cam e down in Septem ber 1960. T here were no paralle l decreases in the prices of the C arrib ean o r U nited States ind igenous crude p e tro -leum. T h is ind icates a fu r th e r d rif t in g ap a rt of the prices of c ru d e petro leum in the m a jo r p roducing areas of the world, bo th vis-à -vis one ano ther and from the prices in the U nited States to which, in the past, they used all to be geared. The decline in c rude petro leum prices does no t seem to have affected the prices of petro leum products.
W orld (exclud ing the centrally p lanned econo-m ies) p roduc tion of tin, in term s of concentrates, — at an annual ra te of 132,300 tons in the first nine m onths of 1960 — was 11 per cent h igher than in 1959. T in m etal p roduction a t 146,500 tons was h ig h e r by 29 per cent. E xports from the m a jo r p ro d u c in g countries were regula ted by the In te rn a -tional T in Council, which h ad g radually en larged the quotas since the 1958 tin crisis un til it abolished them w ith effect from the last q u a rte r of 1960. The quotas, before th e ir abolition , were increased from 20,000 (long) tons, in the last q u a rte r of 1958 and first q u a r te r of 1959, to 37,500 (long) tons in the second an d th ird q u arte rs of 1960. W ith increased dem and, an d the Bolivian export quo ta rem ain ing unfilled, the situa tion seemed to call fo r a fu rther enlargem ent of the quotas. However, the p roducing m em bers of the Council failed to agree upon the allocation of the increase ; a decision was, therefore, taken to leave a llocation to m arke t forces.
T he net exports of tin-in-concentrates from the p roducing countries of the reg ion excluding m ain land C hina — principally the F edera tion of M alaya, In d o -nesia and T ha iland — totalled 98,000 tons (annua l ra te ) in the first n ine m onths of 1960, an increase of 44 per cent over the level of the year 1959. All the m a jo r p roducers shared in the increase. Exports (annua l ra te ) from the F edera tion of M alaya in-
to process petroleum products from crude petroleum— lowered their crude petroleum prices in August 1960 by about 12 per cent below the Persian Gulf posted prices, thus saving the country the foreign exchange costs on imports of crude petroleum.
16 In India, the three companies— which had established refineries
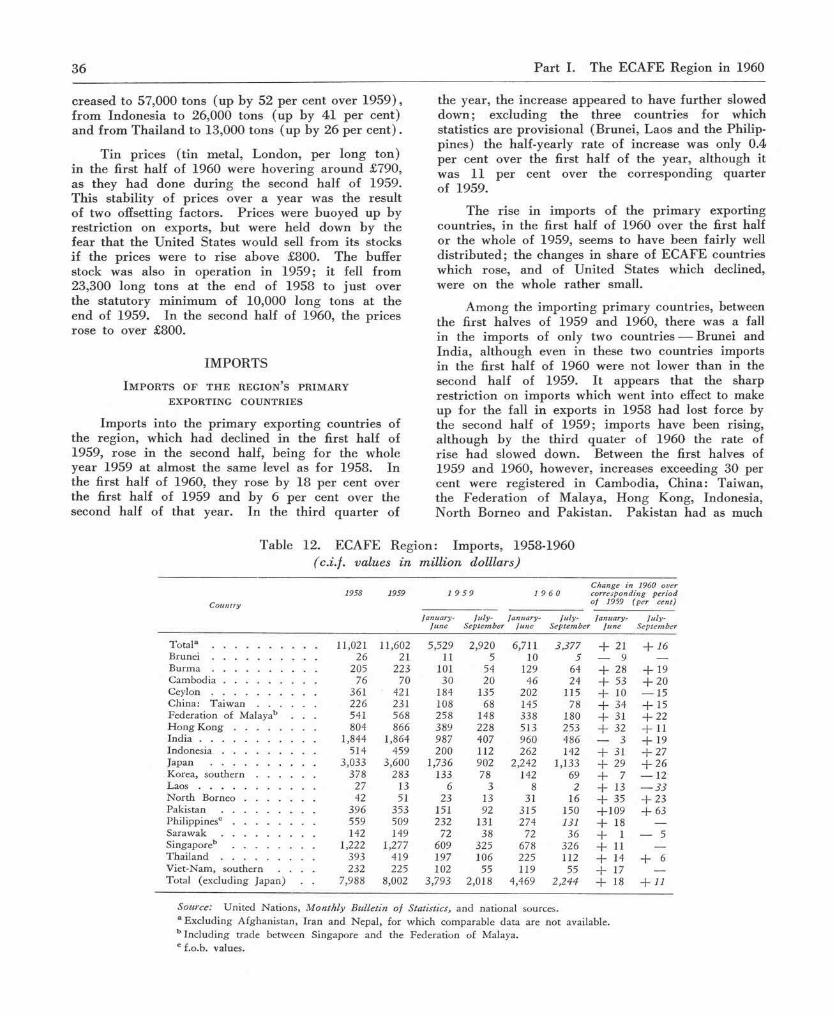
36 P a r t I. T he E C A FE Region in 1960
creased to 57,000 tons (u p by 52 per cent over 1 959), fro m Indonesia to 26,000 tons (up by 41 per cent) an d from T hailand to 13,000 tons (u p by 26 per cent) .
T in prices ( tin m etal, London, per long ton) in the first ha lf of 1960 were hovering a ro u n d £790, as they h ad done d u rin g the second ha lf of 1959. T his stability of prices over a year was the result of two offsetting factors. P rices w ere buoyed up by restric tion on exports, b u t were held down by the fear th a t the U nited States w ould sell from its stocks if the prices were to rise above £800. The buffer stock was also in operation in 1959; it fell from 23,300 long tons a t the end of 1958 to ju s t over the s ta tu to ry m in im um of 10,000 long tons a t the end of 1959. In the second half of 1960, the prices rose to over £800.
IM PO R TS
I m p o r t s o f t h e r e g i o n ’s p r i m a r y
E X PO RTIN G COU NTRIES
Im ports into the p rim ary exporting countries of the region, which h ad declined in the first ha lf of 1959, rose in the second half, being for the whole year 1959 a t a lm ost the sam e level as fo r 1958. In the first half of 1960, they rose by 18 per cent over the first half of 1959 and by 6 per cent over the second half of tha t year. In the th ird q u a rte r of
the year, the increase appeared to have fu rther slowed dow n; excluding the th ree countries fo r which statistics are provisional (B runei, Laos an d the Philip-p ines) the half-yearly ra te of increase was only 0.4 p er cent over the first half of the year, although it was 11 per cent over the correspond ing quarter of 1959.
T he rise in im ports of the p rim ary exporting countries, in the first ha lf of 1960 over the first half o r the whole of 1959, seems to have been fairly well d is tribu ted ; the changes in share of ECA FE countries w hich rose, and of U nited States which declined, were on the whole ra th e r small.
A m ong the im porting p rim ary countries, between the first halves of 1959 and 1960, there was a fall in the im ports of only two countries — Brunei and Ind ia , although even in these two countries imports in the first ha lf of 1960 were no t lower than in the second ha lf of 1959. I t appears tha t the sharp restric tion on im ports which w ent into effect to make up fo r the fall in exports in 1958 had lost force by the second half of 1959; im ports have been rising, although by the th ird qua te r of 1960 the rate of rise had slowed down. Between the first halves of 1959 and 1960, however, increases exceeding 30 per cent were reg istered in C am bodia, C hina: Taiwan, the F edera tion of M alaya, H ong Kong, Indonesia, N orth Borneo and P ak istan . P ak istan h ad as much
Table 12. ECA FE R egion: Im ports, 1958-1960 ( c.i.f. values in m illio n dolllars)
Totala ..................................... 11,021 11,602 5,529 2,920 6,711 3,377B r u n e i ...................................... 26 21 11 5 10 5
Burma 205 223 101 54 129 64C a m b o d ia ................................. 76 70 30 20 46 24C e y l o n ..................................... 361 421 184 135 202 115China: T a i w a n ................... 226 231 108 68 145 78Federation of Malayab . . 541 568 258 148 338 180H ong K o n g ............................ 804 866 389 228 513 253I n d i a .......................................... 1,844 1,864 987 407 960 486I n d o n e s i a ................................. 514 459 200 112 262 142Japan ...................................... 3,033 3,600 1,736 902 2,242 1,133Korea, s o u t h e r n ................... 378 283 133 78 142 69L a o s .......................................... 27 13 6 3 8 2N orth B o r n e o ....................... 42 51 23 13 31 16Pakistan ................................. 396 353 151 92 315 150Philippinesc ............................ 559 509 232 131 274 131S a r a w a k ................................. 142 149 72 38 72 36Singaporeb ............................ 1,222 1,277 609 325 678 326T h a i l a n d ................................. 393 419 197 106 225 112Viet-Nam, southern . . . 232 225 102 55 119 55Total (excluding Japan) 7,988 8,002 3,793 2,018 4,469 2,244
Source: United Nations, M onthly Bulletin o f Statistics, and national sources. a Excluding Afghanistan, Iran and Nepal, for which comparable data are not available. b Including trade between Singapore and the Federation of Malaya. c f.o.b. values.
+ 21— 9 + 28 + 53 + 10 + 34 + 31 + 32— 3 + 31 + 29 + 7 + 13 + 35 + 109 + 18 + 1 + 11 + 14 + 17 + 18
+ 16
+ 19 + 20— 15 + 15 + 22 + 11 + 19 + 27 + 26— 12— 33 + 23 + 63
— 5
+ 6
+ 11
Ja n u a ry - J u n e
Ju ly -S e p te m b e r
C h a n g e in 1960 o ver co rre sp o n d in g p e r io d o f 1959 (p e r ce n t)
1 9 6 01 9 5 9
C o u n try
1958 1959
January-J u n e
J u ly - S e p te m b e r
January-J u n e
J u ly -S e p te m b e r

Chapter 2. Foreign Trade 37
as a 109 per cent increase over the first half of1959 and a 56 per cent increase over the second half of the year. This was due to the larger provision made for the im port of capital goods and machinery, raw materials for local industry, and for selected items of consumer goods such as drugs and medicines which, in May 1960, were placed under an automatic licensing scheme. The export bonus scheme in tro-duced in 1959 also stimulated imports.
The rise in imports in ECAFE prim ary exporting countries in 1960 was obtained in a general climate of relaxation of im port restrictions, reviewed in chapter 3. The m ajor exceptions, owing to the concern caused by their falling reserves, were India, where im port policy became more restrictive, and Ceylon and Indonesia, where further measures were taken to restrain imports.
Capital goods and foodgrains are the most important among the im port goods in the prim ary exporting countries of the region. Im ports of capital goods and of m aterials chiefly required for capital goods had been drastically curtailed during the period of import decline (the second half 1957 and 1958) ; when imports rose, the corresponding rebound was also greater (7 per cent in 1959 over 1958 and, in the first half of 1960, 21 per cent over the first half and 10 per cent over the second half of 1959). The annual rate of such imports had declined to $3.3 billion in the second half of 1957 and to $2.8 billion in 1958; it rose to $3.0 billion in 1959 and to $3.4 billion in the first half of 1960, thus regaining the peak rate of the first half of 1957. Most of the primary exporting countries shared in this expansion; the notable exception was Indonesia, whose imports, which were around $300 million in 1956 and 1957, have since fallen short of $200 million a year.
F o r e i g n t r a d e i n c e r e a l s
The cereal situation in the im porting countries of the ECAFE region (including Japan) called for more imports. Although production was higher in several countries, there was demand for building up food reserves. As a result, net imports of cereals in the im porting countries of the region were expected to approximate 14.4 million tons for the whole year1960 as against 12.8 million tons in 1959. Exporting countries, with one or two exceptions, also had more to export; cereal exports, principally rice, were expected to rise to 4.1 million tons in 1960 from 3.7 million tons in 1959.
The rice trade is prim arily Asian both on the demand and supply sides. Asia accounts for over 90 per cent of world production and for over 60 per cent of the world’s gross exports and gross imports. The rice trade, however, is secondary to
production both in the exporting and the im porting countries. For instance, in Burma, almost three- quarters of the crop produced in 1957 was used for domestic consumption. India, in that year, was the w orld’s largest im porter of rice; but imports con-stituted only 2.5 per cent of domestic production. As a result, world trade in rice constitutes only a small fraction (4 per cent in 1959) of world production of rice.
Even this proportion is steadily falling; the growth in production is replacing trade. Production of the ECAFE region (outside m ainland China) rose from 65 million tons of milled rice during 1934-1938 to 84.5 million tons in 1958/59; exports had fallen from 9 million tons to 3.4 million tons in calendar year 1959. The year 1960 saw a rise in both production and exports, the latter in rising faster reversed, at least temporarily, the long-term trend of trade going counter to production. In 1959/60 world rice production, excluding centrally planned econo-mies, reached a new level of 99 million tons, or 4 per cent over the previous year. The region’s pro -duction also rose from 84.5 million tons in 1958/59 to 87.3 million tons, that is by 3 per cent, in 1959/60. The region’s exports in 1960 were estimated to rise by 12 per cent over 1959. Even so, the exports of United States rice to the countries of the region on concessional terms caused some of the traditionally exporting countries of the region to express concern.
There were larger export availabilities in and exports from these traditionally exporting countries of the region in 1960. In the first ten months of the year, Burma exported 1.7 million tons as against 1.5 million tons in the same period of 1959. In view of her future commitments for about 1.6 million tons with Ceylon, India and Indonesia, a tem porary suspension of further sales was imposed until the volume of the new crop could be ascertained. T hai-land exported 1.1 million tons in the first eleven months of the year, 14.5 per cent more than in the corresponding period of 1959, and had by that time signed government-to-government contracts for480,000 tons with Ceylon, China: Taiwan, Indonesia, Japan and Pakistan as against similar countracts for only 100,000 tons in 1959. In December, export premiums on private exports were lowered to clear the oncoming harvest. Other countries also had larger exports. Not only was the 1959/60 crop in southern Viet-Nam larger but there was a substantial carryover from 1959. Southern Viet-Nam exported306,000 tons and Cambodia 305,000 tons during the first nine months of 1960; both quantities were about 70 per cent more than in the corresponding period of 1959. Only China: Taiwan faced a difficult situation owing to a slightly smaller 1959 crop. Under its general trade agreement with Japan, it was scheduled to export about 150,000 tons of rice to
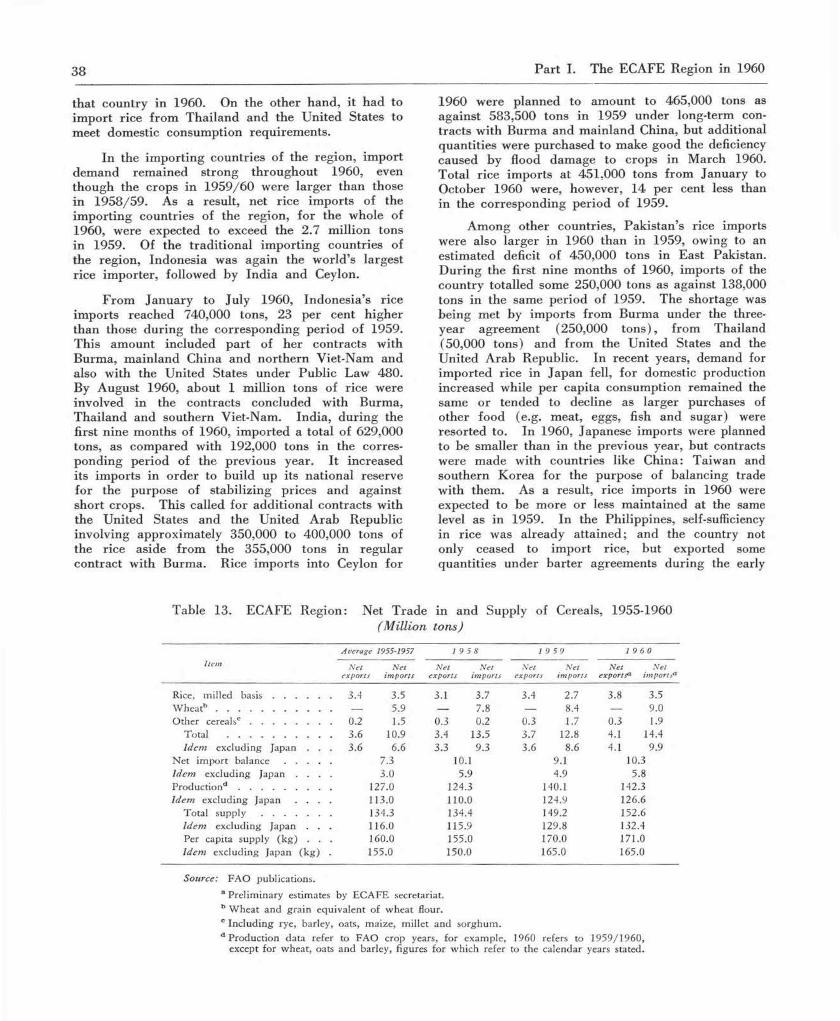
38 P art I. The ECAFE Region in 1960
that country in 1960. On the other hand, it had to im port rice from Thailand and the United States to meet domestic consumption requirements.
In the im porting countries of the region, import demand remained strong throughout 1960, even though the crops in 1959/60 were larger than those in 1958/59. As a result, net rice imports of the im porting countries of the region, for the whole of1960, were expected to exceed the 2.7 million tons in 1959. Of the traditional im porting countries of the region, Indonesia was again the world’s largest rice importer, followed by India and Ceylon.
From January to July 1960, Indonesia’s rice imports reached 740,000 tons, 23 per cent higher than those during the corresponding period of 1959. This amount included part of her contracts with Burma, mainland China and northern Viet-Nam and also with the United States under Public Law 480. By August 1960, about 1 million tons of rice were involved in the contracts concluded with Burma, Thailand and southern Viet-Nam. India, during the first nine months of 1960, imported a total of 629,000 tons, as compared with 192,000 tons in the corres-ponding period of the previous year. It increased its imports in order to build up its national reserve for the purpose of stabilizing prices and against short crops. This called for additional contracts with the United States and the United Arab Republic involving approximately 350,000 to 400,000 tons of the rice aside from the 355,000 tons in regular contract with Burma. Rice imports into Ceylon for
1960 were planned to amount to 465,000 tons as against 583,500 tons in 1959 under long-term con-tracts with Burma and mainland China, but additional quantities were purchased to make good the deficiency caused by flood damage to crops in March 1960. Total rice imports at 451,000 tons from January to October 1960 were, however, 14 per cent less than in the corresponding period of 1959.
Among other countries, Pakistan’s rice imports were also larger in 1960 than in 1959, owing to an estimated deficit of 450,000 tons in East Pakistan. During the first nine months of 1960, imports of the country totalled some 250,000 tons as against 138,000 tons in the same period of 1959. The shortage was being met by imports from Burma under the three- year agreement (250,000 tons), from Thailand (50,000 tons) and from the United States and the United Arab Republic. In recent years, demand for imported rice in Japan fell, for domestic production increased while per capita consumption remained the same or tended to decline as larger purchases of other food (e.g. meat, eggs, fish and sugar) were resorted to. In 1960, Japanese imports were planned to be smaller than in the previous year, but contracts were made with countries like China: Taiwan and southern Korea for the purpose of balancing trade with them. As a result, rice imports in 1960 were expected to be more or less maintained at the same level as in 1959. In the Philippines, self-sufficiency in rice was already attained; and the country not only ceased to import rice, but exported some quantities under barter agreements during the early
Table 13. ECAFE Region: Net Trade in and Supply of Cereals, 1955-1960(M illion tons)
ItemAverage 1955-1957 1 9 5 8 1 9 5 9 I 9 6 0
N et N et exports im ports
N e t N et exports im ports
N e t N et exports im ports
N e t N et exportsa im portsa
Rice, m illed b a s i s ......................... 3.4 3.5 3.1 3.7 3.4 2.7 3.8 3.5W h ea tb .................................................. — 5.9 - 7.8 — 8.4 — 9.0O th er cerealsc ................................... 0.2 1.5 0.3 0.2 0.3 1.7 0.3 1.9
T ota l ............................................. 3.6 10.9 3.4 13.5 3.7 12.8 4.1 14.4Idem exclud ing Japan . . . 3.6 6.6 3.3 9.3 3.6 8.6 4.1 9.9
N et im p o rt b a l a n c e .................... 7.3 10.1 9.1 10.3Idem exclud ing Japan . . . . 3.0 5.9 4.9 5.8P roduc tiond ........................................ 127.0 124.3 140.1 142.3Idem exclud ing Japan . . . . 113.0 110.0 124.9 126.6
T ota l s u p p l y .............................. 134.3 134.4 149.2 152.6Idem exclud ing Japan . . . 116.0 115.9 129.8 132.4Per capita supply (k g ) . . . 160.0 155.0 170.0 171.0Idem exclud ing Japan (k g ) . 155.0 150.0 165.0 165.0
Source: FA O publications.
a P re lim inary estimates by E C A F E secretariat. b W h ea t and g ra in equ ivalen t of w hea t flour.c Inc lu d in g rye, barley, oats, m aize , m ille t an d so rghum .d Produc tion da ta refer to FA O crop years, fo r exam ple, 1960 refers to 1959 /1960 ,
except for w heat, oats an d barley, figures fo r w h ich refer to the ca lendar years stated.

Chapter 2. Foreign Trade 39
part of 1960. However, as of October 1960, the Government ordered a stoppage to this barte r trade in view of apparently shorter national reserve.
Rice export prices during 1960 came under pressure of increased world supply; both trade and government-to-government contract prices were re -duced. From June to September 1960, however, Thai export prices rose sharply following the suspension of Burm a’s exports; and restrictions were placed on Thai shipments. The Thai export price of white rice (5 per cent brokens) reached £50 per ton in September, 3 per cent higher than a year earlier. Since then, Thai prices have fallen again (£47 per ton f.o.b. in October) but they still remained higher than in the early part of I960 .17
Wheat and wheat flour imports into the food deficit countries (Ceylon, India, Indonesia, Japan, Pakistan and the Philippines) rem ained large during the first half of 1960 and were expected to expand in the second half of the year. The increase in wheat production of the region in 1960 was small. Except for Japan which was expected to purchase on the m arket about 2.5 million tons for the whole year 1960, a large part of the imports into the region was under the United States Public Law 480. The United States is to supply wheat to India at an annual rate of 3 million tons over a period of four years
17 It may be noted that the international m arket in rice is divided into two categories: lower quality rice, which comprises one half of the world trade and is usually channeled under bilateral con-tracts between governments; and higher quality rice, which is handled by private traders. These categories are closely linked together since governments are usually able to control prices of rice traded in the private sector by such measures as floor prices and export taxes.
from May 1960. Aside from this, an additional 4 million tons will be shipped to build up national reserves in India. Similarly, Pakistan entered into a new agreement with the United States under Public Law 480 involving the im port of nearly one million tons in 1960.
Other cereals, such as barley, oats and rye, were imported mainly by Japan in 1959. In the first seven months of 1960, no imports were recorded. However, some im port of barley was expected in the latter part of 1960. Imports of maize, on the other hand, increased in Japan, India, the Federation of Malaya, Singapore and Hong Kong (which showed a reviving re-export t r a d e ) . Japan, in 1960, showed a pro-nounced shift to sources of maize within the region — Thailand and Cambodia — although a greater portion of its imports still came from the Union of South Africa, Argentina and the United States. In 1960, total net imports of cereals into Japan may thus account for approximately 45 per cent of the region’s net imports.
While Japan had larger food supplies per head, the increase in supplies in the prim ary exporting countries of the region in 1960 was barely enough to m aintain the per capita level of 165 kilogrammes of cereals attained in 1959. The maintenance of this level was achieved by these countries only by increas-ing their net imports (by 0.9 million tons) to a level of 5.8 million tons, which is just a shade below the very high level of net imports reached in 1958. The per capita level of supplies in these countries in 1959 and 1960, however, was about 10 per cent higher than in 1958, when a decline was experienced following a sharp fall in production.

C h a p t e r 3
AGGREGATE DEMAND A N D A LL O C A T IO N OF RESOURCES
TH E TREND OF AGGREGATE DEMAND
Aggregate monetary demand in the ECAFE region appears to have been higher in 1960 than in 1959. To a large extent, it was stimulated by two good harvests in succession, a further increase in industrial production, a rise in exports and the con-tinuation of the pressures of demand created by the excess of non-consumption1 outlays (on government current and capital expenditure and on private investment) over the financial resources released from consumption (through government revenue and private sav ing). This excess of non-consumption outlays over financial resources was manifested in budget deficits and expansion of bank credits. Except in a few countries, the increase in monetary demand was only partly offset by the rise in domestic output and imports. The latter were not increased as much as they could have been, as several countries took the opportunity of a favourable export situation and larger foreign aid to build up their external assets. Prices, on the whole, tended to rise, although, in some countries, the rise was hindered by controls and concealed by the unrealistic character of cost-of- living indices.
Budget deficits and credit expansion were the predominant elements in raising or sustaining demand in India, Indonesia and Pakistan. The experience of India in 1959 and 1960 was the reverse of that in 1954 and 1955. Although both periods were charac-terized by an expansion in output, the pressure of budget deficits and credit expansion had increased sharply during 1959-1960. As a result, prices rose in 1959-1960, whereas they had fallen during 1954- 1955. In Indonesia, although the monetary reform of August 1959 temporarily succeeded in containing the rise in the price level, prices continued to rise in the first half of 1960; the rise, however, seems to have been arrested somewhat in the second half of the year. Pakistan also had sharply increased budget deficits, which, combined with a relaxation of price controls, tended to raise domestic prices in spite of a significant rise in imports. The sharpness of the rise in the first half of 1960, as compared with the
first half of 1959, was partly a reaction from the precipitous decline in the latter period which followed upon the strong measures taken by the new Govern-ment to bring out hoarded stocks. Relaxation of price controls was also an im portant element in bringing out the suppressed inflation in Burma; the cost-of-living index rose sharply, although the increase in demand in 1960 was quite moderate, partly for seasonal reasons and partly owing to a reduced budget deficit and an im port surplus as against a balanced trade in 1959. China: Taiwan was another country where, although demand seems to have been stabilized in the first half of 1960, supply shortages, caused in this case by adverse weather, led to a sharp rise in prices. Similarly in southern Korea, political unrest contributed to a rise in prices, although demand had slackened in the first half of 1960.
Demand slackened also in the Philippines, partly for seasonal reasons and partly as a result of credit restrictions which had been imposed in 1959 and which remained in force until May 1960; the price rise was mainly due to the upward pressure exerted by tariff, exchange and excise revisions affecting imported and domestically produced goods. The gradual withdrawal of tariff concessions on imports from the United States, which began in the early part of 1959, is raising their prices. In 1960, United States goods paid 50 per cent of the standard import duties; the ratio will rise to 75 per cent in 1961 and to 90 per cent in 1964. In Afghanistan, the latest available data2 show a 7 per cent increase in money supply for 1958/59 fiscal year, largely to accommodate the increase in national output. The price level rose only 2 per cent. For 1959/60, a similar trend was observed, although detailed statistics are not available.
Japan, in 1959 and the early part of 1960, passed through another investment boom financed by an expansion in bank credit. The fall in money supply in the first half of 1960 was seasonal; the boom was associated with a mild rise in prices, which occurred in spite of the efforts by the Bank of Japan to restrain credit. Cambodia and Iran also showed symptoms of increased demand and rising prices.
1 For definitions of the terms — ‘non-consum ption’, ‘budget deficit’, ‘governm ent saving’, etc. — used in this chapter, see the explanatory note on pages 63-64.
2 Governm ent of Afghanistan, Ministry of Planning, Survey of Progress 1960 (Kabul; August 1960).
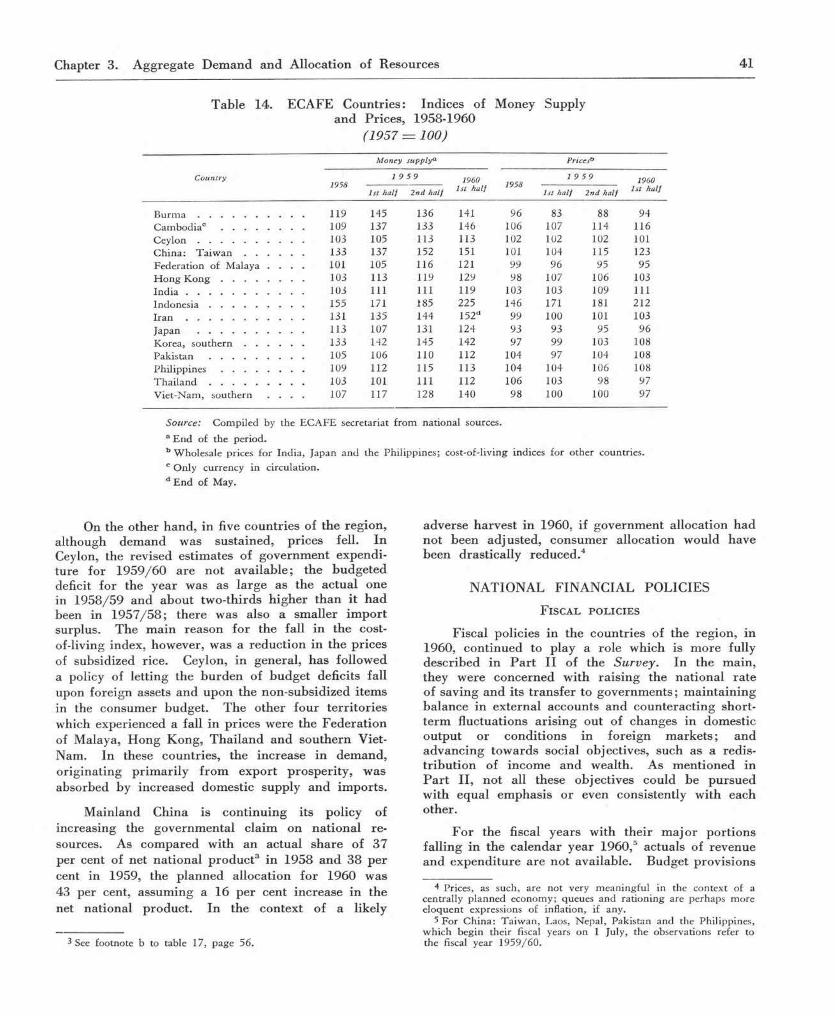
Chapter 3. Aggregate Demand and Allocation of Resources 41
Table 14. ECAFE Countries: Indices of Money Supply and Prices, 1958-1960
(1957 = 100)
C ountry
M oney supplya Pricesb
19581 9 5 9 I960
1st half 19581 9 5 9 I960
1st half1st half 2nd half 1st half 2nd ha lf
B u r m a ...................................... 119 145 136 141 96 83 88 94Cambodiac ............................. 109 137 133 146 106 107 114 116C e y l o n ...................................... 103 105 113 113 102 102 102 101China: T a i w a n ................... 133 137 152 151 101 104 115 123Federation of Malaya . . . 101 105 116 121 99 96 95 95H ong K o n g ............................. 103 113 119 129 98 107 106 103I n d i a ........................................... 103 111 111 119 103 103 109 111I n d o n e s i a ................................. 155 171 185 225 146 171 181 212I r a n ........................................... 131 135 144 152d 99 100 101 103Japan ...................................... 113 107 131 124 93 93 95 96Korea, s o u t h e r n ................... 133 142 145 142 97 99 103 108Pakistan ................................. 105 106 110 112 104 97 104 108P h i l i p p i n e s ............................. 109 112 115 113 104 104 106 108T h a i l a n d .................................. 103 101 111 112 106 103 98 97Viet-Nam, southern . . . 107 117 128 140 98 100 100 97
Source: Compiled by the ECAFE secretariat from national sources. a E nd of the period.b Wholesale prices for India, Japan and the Philippines; cost-of-living indices for other countries. c Only currency in circulation. d End of May.
On the other hand, in five countries of the region, although demand was sustained, prices fell. In Ceylon, the revised estimates of government expendi-ture for 1959/60 are not available; the budgeted deficit for the year was as large as the actual one in 1958/59 and about two-thirds higher than it had been in 1957/58; there was also a smaller im port surplus. The main reason for the fall in the cost- of-living index, however, was a reduction in the prices of subsidized rice. Ceylon, in general, has followed a policy of letting the burden of budget deficits fall upon foreign assets and upon the non-subsidized items in the consumer budget. The other four territories which experienced a fall in prices were the Federation of Malaya, Hong Kong, Thailand and southern Viet- Nam. In these countries, the increase in demand, originating prim arily from export prosperity, was absorbed by increased domestic supply and imports.
Mainland China is continuing its policy of increasing the governmental claim on national re-sources. As compared with an actual share of 37 per cent of net national product3 in 1958 and 38 per cent in 1959, the planned allocation for 1960 was 43 per cent, assuming a 16 per cent increase in the net national product. In the context of a likely
3 See footnote b to table 17, page 56.
adverse harvest in 1960, if government allocation had not been adjusted, consumer allocation would have been drastically reduced.4
NATIONAL FINANCIAL POLICIES
F i s c a l p o l i c i e s
Fiscal policies in the countries of the region, in1960, continued to play a role which is more fully described in P art II of the Survey. In the main, they were concerned with raising the national rate of saving and its transfer to governments; m aintaining balance in external accounts and counteracting short-term fluctuations arising out of changes in domestic output or conditions in foreign markets; and advancing towards social objectives, such as a redis-tribution of income and wealth. As mentioned in P art II, not all these objectives could be pursued with equal emphasis or even consistently with each other.
For the fiscal years with their m ajor portions falling in the calendar year 1960,5 actuals of revenue and expenditure are not available. Budget provisions
4 Prices, as such, are not very meaningful in the context of a centrally planned economy; queues and rationing are perhaps more eloquent expressions of inflation, if any.
5 For China: Taiwan, Laos, Nepal, Pakistan and the Philippines, which begin their fiscal years on 1 July, the observations refer to the fiscal year 1959/60.

42 P art I. The ECAFE Region in 1960
or revised estimates indicated deficits for all the countries of the region for which statistics are available. The deficits incurred or provided for were lower in Brunei, Burma, Indonesia, Japan, southern Korea, Thailand and southern Viet-Nam, about the same in Ceylon and higher in the Federation of Malaya, Hong Kong, India, Laos, Nepal, North Borneo, Pakistan, the Philippines, Sarawak, and Singapore. The small actual surplus in the 1958/59 fiscal year in Afghanistan was converted into a budget deficit for 1959/60 owing to sharp increases in developmental and total expenditure. Data on cash operations are available only for a few countries and for a few months in 1960. These indicated surpluses for Pakistan, a balance for Thailand and deficits for Ceylon, India, Japan and southern Korea.
Fiscal policy in m ainland China exhibits a reliance on state-owned enterprises to finance the needs of the Government. The budgeted expenditure for 1960, at 70 billion yuan, was a th ird higher than in 1959. The state-owned enterprises were to finance 93 per cent of the estimated expenditure (as against 91 per cent in 1959), and rural communes 6 per cent (as against 7 per cent in 1959) ; the balance — 1 per cent only — was to be obtained from “ other sources” . This large contribution of the state-owned enterprises symbolizes the virtual completion of the country’s transformation from a private enterprise economy to a socialist economy.
Taken as a whole, the 1960 fiscal picture in the countries of the region showed some improvement over that of the previous year. Except perhaps Laos, because of its peculiar dependence for defence on foreign aid, no country of the region appeared to face a critical situation in respect of government finance. Even Indonesia had a much better year than in 1959. Government revenues in almost all the countries of the region were buoyant, largely on account of increased domestic output and higher export earnings. There was also more of foreign aid.
Of course, there were as usual a few new taxes, some revision of older ones and announcements of new loans. The budget speeches of finance ministers contained familiar reiteration of the difficulties en-countered in balancing the budgets and the usual new (fiscal) year resolutions to seek a reduction in budgetary imbalance by means of economy in govern-ment expenditure and improvement in revenue collec-tion and administration.
Notable among the new tax measures were those taken in Ceylon and in Singapore; Singapore exhibit-ed somewhat the same pattern as Ceylon, although it was subject to restraints imposed by its “ free port” status.
Ceylon had already introduced, in its 1958/59 Budget, a whole gamut of wealth, expenditure and gifts taxes, in addition to modifications of its existing taxes on income and death duties. In the 1960/61 Budget, the income tax rates, of which the highest slab had been brought down to 60 per cent in 1958/59, were raised by a surcharge of 15 per cent. A few new taxes were also introduced. The land tax will be payable by individuals owning 100 acres or more of land. The professions tax will be payable by professionals — accountants, architects, consulting engineers, contractors for government work, doctors and lawyers — at rates varying according to their degree of specialized qualifications and to the length of their standing in private practice. In the legal profession, for instance, the rates are to vary from Rs 20 per year for a proctor to Rs 10,000 a year for a Queen’s counsel (Q.C.). Non-corporate enter-prises were tackled by an annual registration tax of Rs 250 per year for Ceylonese businessmen and Rs 1,000 per year for others. Companies were to pay an annual tax amounting to one half per cent of their registered share capital; only industrial and m anufacturing units approved by the Government were exempt from this tax. Non-nationals holding residence visas (excluding those employed by the Governmnent and local authorities or by enterprises with foreign investment approved by the Government, and their dependents) are to pay a levy of Rs 400 per person. There were also increases in motorcar registration fees and telephone rentals, and in import duties on motorcars, petrol, wrist watches,6 air- conditioning machinery, textiles, shoes and tobacco products. In other words, it was a catch-all system designed to get more revenue, most of it from the rich, from the non-nationals and from those assumed to be in a position to avoid or evade taxes. Foreign exchange saving, rather than revenue, was the major policy objective in raising the import duties.
Singapore followed a similar pattern. In addi-tion to the increases in personal income tax rates and to the broadening of the bases of taxable income, several new taxes were introduced in the Budget for1961. The City Council and Rural Board assessment will be replaced by a property tax. Business enter-prises — corporate as well as non-corporate — are to pay a registration tax, and professional persons in practice — lawyers, doctors, dentists, accountants, quantity surveyors, architects and engineers — are to pay a registration fee of M$ 250 plus a quarterly fee of M$ 125. Unlike those introduced in Ceylon, the fees are uniform, except for those due from pharmacists, who will pay a lower registration fee of M$100 and a quarterly fee of M$15. The assessment rates on Singapore’s rubber estates are to
6 Partly to prevent capital exports in the form of watches smug-gled into India.

Chapter 3. Aggregate Demand and Allocation of Resources 43
be increased to bring them into line with the rates prevailing in the Federation of Malaya. Other measures include a new stamp duty on im port and export declarations, increased duty on private lotteries and a passenger tax on em barking a ir travellers.
In December 1960, Sarawak had a bill before the Council Negri which sought to bring into force during 1961 a scheme of schedular income taxes similar to that operating in Hong Kong. The current income tax, applying only to limited liability com-panies, was to be replaced by taxes on property, salaries, profits and interest.
P r o p o s a l s f o r f i n a n c i n g n e w p l a n s
The year 1960 was m ore significant in connexion with national planning in ECAFE countries, as new plans were announced during the year for several countries — China: Taiwan, the Federation of Malaya, India, Pakistan, Singapore and Thailand. These countries have either announced the details of their full plans or indicated the magnitudes of investment for such plans. Cambodia started on its first five-year (1960-1964) plan in the year under review.
The most comprehensive among the plans an-nounced is the draft outline of the th ird five-year (1961/62-1965/66) plan released by the Government of India in June 1960. The draft th ird plan envisages a national investment of 102 billion rupees during the five years beginning 1 April 1960; of that total, the government sector will finance 62 billion rupees and the private sector 40 billion rupees. I t is estimated that about one-third of the estimated investment will involve payment in foreign currency.
The public sector outlay on schemes included in the plan7 is estimated at 72.5 billion rupees (62 billion rupees on investment and 10.5 billion rupees on current ou tlays). This sum would be 26.5 billlion rupees, or about 60 per cent, larger than the public sector outlay in the second plan. As usual, the Indian Government will rely on four main sources of financing, namely, (a) additional taxation, includ-ing measures to increase the surpluses of public enterprises, (b ) loans (“ from the public” ) plus small savings, (c) foreign aid and (d) money-creating deficits8 as below (in billion rupees) :
7 For an exp lanation of In d ian p la n n in g term ino logy , see foo t-note 9, page 72.
8 A ccording to the usage o f term s in this repo rt, the sum of( b) , (c) an d (d ) w o u ld be deficit f inancing ; in In d ia a n d Pak istan , the term “deficit f in an c in g ” is confined to (d ) only. See the ex -p lanatory note of P ar t II o f the Survey, p ag e 63.
Second five-year D raft th ird five- plan year plan
R evised estim ates Plan estim ates
1. A dd itiona l revenue fro m existing a n d n ew taxes an d o ther revenuem easures ............................................. 12.6 31.0
2. L oans an d sm all savings 11.8 14.0
3. F ore ign a i d ............................................. 9.8 22.0
4. M oney creation (“ deficit f in an c in g ”) 11.8 5.5
T o t a l 46.0 72.5
The largest anticipated increases in financial resources are in the fields of taxation and foreign assistance. On the other hand, the draft th ird plan makes smaller allowance for money-creating deficits, as it is recognized that the scope for monetary expansion remains limited for two reasons: first, the general price level is already rather h igh; and, secondly, there will not be sufficient foreign exchange resources to allow imports to cushion off the inflationary effects of monetary expansion, as they did under the second plan.
It may be supposed that, with the experience gained during the first two plans, the planning authorities in India are able to assess the domestic sources of financing with reasonably close accuracy. The m ain concern appears to be the enormous amount of foreign aid needed for the th ird plan, since its realization will have to depend on the aid policies of donor countries. In general, the present climate is favourable, but it could change.
In Pakistan, the second five-year (1960/61- 1964/65) plan requires an estimated total investment outlay of 19 billlion rupees, of which domestic resources are expected to contribute 11 billion and foreign aid and foreign private investment 8 billion rupees. The latter amount is intended partly to meet the foreign exchange costs of the plan (6.5 billion rupees) and partly to serve as balance of payments support of 1.5 billion rupees for increased imports outside the plan.
The second plan investment is 64 per cent larger than that of the first plan. Of the total of 19 billion rupees, Rs 11.5 billion will be financed by the Government; this amount will be 84 per cent larger than the government-financed program m e of Rs 6.25 billion9 in the first plan. The government resources for the program m e will be raised as follows (in billion rupees) :
9 E stim ate m a d e by the Pak istan P lan n in g C om m ission on the basis of the actuals fo r the first fo u r years (1 9 5 5 /5 6 -1 9 5 8 /5 9 ) of the first p lan .
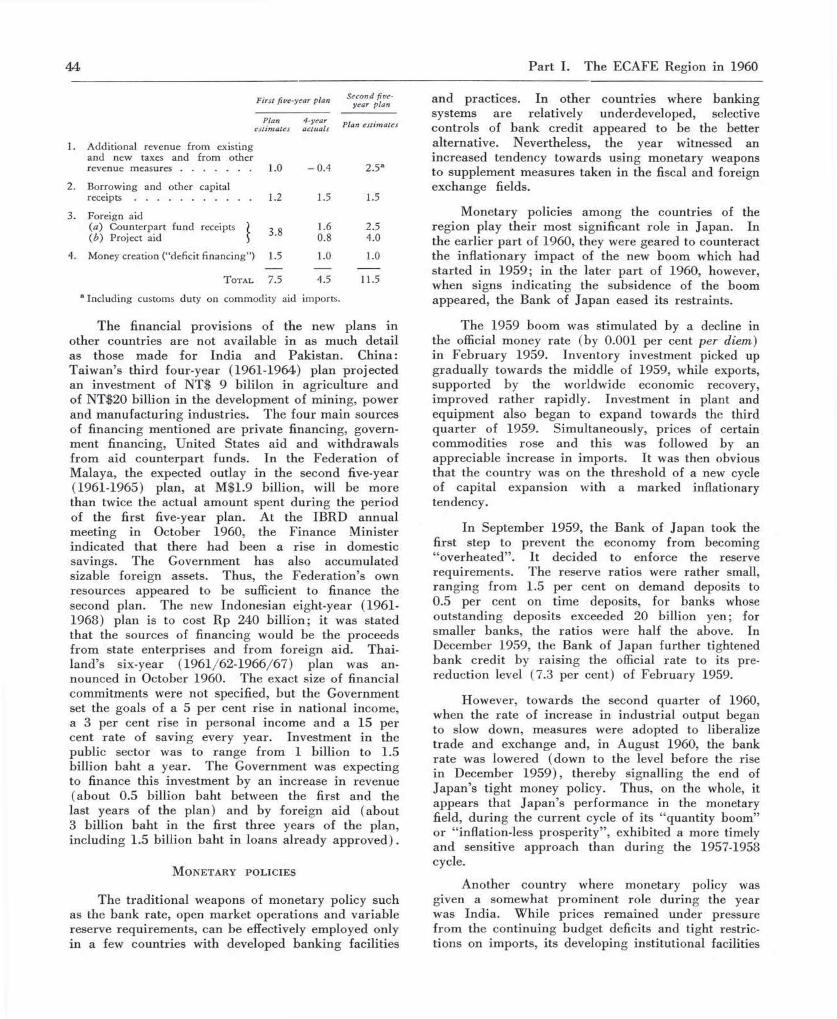
44 P art I. The ECAFE Region in 1960
First five-year plan
Plan 4-year estim ates actuals
Second five- year plan
Plan estim ates
1. Additional revenue from existingand new taxes and from other revenue m e a s u r e s ............................ 1.0 - 0 .4 2.5a
2. Borrowing and other capitalr e c e i p t s ............................................... 1.2 1.5 1.5
a Including customs duty on commodity aid imports.
The financial provisions of the new plans in other countries are not available in as much detail as those made for India and Pakistan. China: Taiwan’s third four-year (1961-1964) plan projected an investment of NT$ 9 bililon in agriculture and of NT$20 billion in the development of mining, power and manufacturing industries. The four main sources of financing mentioned are private financing, govern-ment financing, United States aid and withdrawals from aid counterpart funds. In the Federation of Malaya, the expected outlay in the second five-year (1961-1965) plan, at M$1.9 billion, will be more than twice the actual amount spent during the period of the first five-year plan. At the IBRD annual meeting in October 1960, the Finance Minister indicated that there had been a rise in domestic savings. The Government has also accumulated sizable foreign assets. Thus, the Federation’s own resources appeared to be sufficient to finance the second plan. The new Indonesian eight-year (1961- 1968) plan is to cost Rp 240 billion; it was stated that the sources of financing would be the proceeds from state enterprises and from foreign aid. T hai-land’s six-year (1961/62-1966/67) plan was an-nounced in October 1960. The exact size of financial commitments were not specified, but the Government set the goals of a 5 per cent rise in national income, a 3 per cent rise in personal income and a 15 per cent rate of saving every year. Investment in the public sector was to range from 1 billion to 1.5 billion baht a year. The Government was expecting to finance this investment by an increase in revenue (about 0.5 billion baht between the first and the last years of the plan) and by foreign aid (about 3 billion baht in the first three years of the plan, including 1.5 billion baht in loans already approved).
M o n e t a r y p o l i c i e s
The traditional weapons of monetary policy such as the bank rate, open market operations and variable reserve requirements, can be effectively employed only in a few countries with developed banking facilities
and practices. In other countries where banking systems are relatively underdeveloped, selective controls of bank credit appeared to be the better alternative. Nevertheless, the year witnessed an increased tendency towards using monetary weapons to supplement measures taken in the fiscal and foreign exchange fields.
Monetary policies among the countries of the region play their most significant role in Japan. In the earlier part of 1960, they were geared to counteract the inflationary impact of the new boom which had started in 1959; in the later part of 1960, however, when signs indicating the subsidence of the boom appeared, the Bank of Japan eased its restraints.
The 1959 boom was stimulated by a decline in the official money rate (by 0.001 per cent per diem) in February 1959. Inventory investment picked up gradually towards the middle of 1959, while exports, supported by the worldwide economic recovery, improved rather rapidly. Investment in plant and equipment also began to expand towards the third quarter of 1959. Simultaneously, prices of certain commodities rose and this was followed by an appreciable increase in imports. It was then obvious that the country was on the threshold of a new cycle of capital expansion with a marked inflationary tendency.
In September 1959, the Bank of Japan took the first step to prevent the economy from becoming “ overheated” . It decided to enforce the reserve requirements. The reserve ratios were rather small, ranging from 1.5 per cent on demand deposits to0.5 per cent on time deposits, for banks whose outstanding deposits exceeded 20 billion yen; for smaller banks, the ratios were half the above. In December 1959, the Bank of Japan further tightened bank credit by raising the official rate to its pre-reduction level (7.3 per cent) of February 1959.
However, towards the second quarter of 1960, when the rate of increase in industrial output began to slow down, measures were adopted to liberalize trade and exchange and, in August 1960, the bank rate was lowered (down to the level before the rise in December 1959), thereby signalling the end of Japan’s tight money policy. Thus, on the whole, it appears that Japan’s performance in the monetary field, during the current cycle of its “quantity boom” or “ inflation-less prosperity” , exhibited a more timely and sensitive approach than during the 1957-1958 cycle.
Another country where monetary policy was given a somewhat prominent role during the year was India. While prices remained under pressure from the continuing budget deficits and tight restric-tions on imports, its developing institutional facilities
3. Foreign aid(a) Counterpart fund receipts(b) Project aid
4. Money creation (“deficit financing”)
T o t a l
3.8
1.5
7.5
1.60.8
1.0
4.5
2.54.0
1.0
11.5

Chapter 3. Aggregate Demand and Allocation of Resources 45
in the monetary field are beginning to allow m onetary policy to be assigned an increasing role in controlling the inflationary pressures in the economy. In 1960, the general line of policy was to exercise overall credit restraint conjoined with action to restrain the flow of credit into specific sectors, particularly agriculture, so as to prevent speculative hoarding of foodgrains. In January , the Reserve Bank of India set credit ceilings in respect of advances made against paddy and rice by scheduled banks at the average level of credit in 1958 or 1959, whichever was higher. Branches of scheduled banks in new localities hitherto without banking facilities were limited to a maximum credit of Rs 100,000 against all foodgrains. The selective control of credit was reinforced by open market operations and variable cash reserves. The Reserve Bank for the first time exercised its statutory power to regulate reserve requirements, compelling the scheduled banks to m aintain additional balances equal to 25 per cent of the increase in total liabilities since 11 M arch 1960. A further notification was issued on 5 May, raising the requirement to 50 per cent. The scope of selective control of credit was extended to cover advances to stock brokers. A directive was issued by the Reserve Bank in M arch 1960, imposing a minimum m argin requirement of 50 per cent in respect of advances by scheduled banks against equity shares.
While monetary institutions are relatively less developed in other countries of the region, several of them made an attempt to employ the standard instruments of m onetary policy mostly to curb inflationary developments. In China: Taiwan, reserve requirements against demand deposits were raised together with the floatation of government bonds. The Bank of Taiwan also exercised greater care in its own loan policy. Counterpart operations were put on a sounder basis. In other words, monetary policies were co-ordinated with fiscal policies in government action designed to counteract the con-tinuous rise in the price level. In southern Korea, the Government’s effort to hold down prices mainly took the form of fixing a ceiling to money supply for each quarter of the year, which was done under the “ financial stabilization program m e” . For 1960, according to the “program m e” , money supply was not to be permitted to exceed the maximum of 228 billion hwan at the end of M arch 1960 or 230 billion hwan at the end of the year. It was also planned to keep United States aid counterpart fund expenditures within the total amount of counterpart collections.
In the Philippines, on the other hand, restrictive credit measures imposed in the fiscal year 1959 (July 1958/June 1959) were eased slightly in 1960, following the adoption of the exchange decontrol programme. In May 1960, certain items of bank assets were excluded from the computation of the
risk assets and the cash m argin requirements on import letters of credit were lowered. The rediscount quotas for commercial banks were also increased from 50 per cent to 100 per cent of their net worth.
Rediscount rates were raised in Ceylon but lowered in the Philippines. Ever since the end of the Second W orld W ar, Ceylon had continued with an unrealistic policy of cheap money. In August 1960, the Central Bank of Ceylon raised its interest rate from to 4 per cent on loans secured by the pledge of government securities, excepting when money was lent to finance imports of essential goods. The rise in the Central Bank rate was followed by the raising of lending rates by commercial banks. The Central Bank of the Philippines, on the other hand, lowered its rediscount rate from 6.5 to 6 per cent as part of the liberalization program m e of May 1960.
Another main avenue of credit policy, moral suasion and selective credit measures, was resorted to by Ceylon and Pakistan. The Central Bank of Ceylon issued instructions to restrict loans to com-panies financing hire-purchase transactions. The State Bank of Pakistan also sent directives to sche-duled banks to limit their advances against company shares and for imported m anufactured goods. They were also enjoined to restrict unsecured loans to any one party to a maximum of Rs 50,000.
A new development in inter-government monetary adm inistration was the signing of the new currency agreement in M arch 1960 between five territories of the M alayan Currency Area. Under their present m onetary set-up, established in 1950, these five territories — namely, the Federation of Malaya, the states of Brunei and Singapore, and the colonies of North Borneo and Sarawak— have a unified currency, the Malaya dollar, issued under the terms regulated by the United Kingdom Colonial Office. The Malayan dollars are to be backed by 100 per cent reserves in sterling, and the management of currency issue is vested in a common Currency Board for the five territories. Up to the end of 1959, the accumulated reserves of the Currency Board amounted to M$ 1,242 million, about 10 per cent in excess of the legal reserve requirement. The m ajority of the participat-ing territories had long felt the need for independent currency systems in order to use the foreign assets for economic development within these countries, rather than leave them invested abroad as currency backing.
The new currency agreement between these territories marked a significant step forward toward this end. The im portant decisions reached in the 1960 agreement were:

46 P art I. The ECAFE Region in 1960
1. The powers which in the 1950 agreement were granted to the United Kingdom Secretary of State for Colonies will now be vested in the Board itself and, for m ajor matters, policy decisions will lbe subject to the unanimous agreement of the five governments.
2. The Board will also have the power to invest up to M$300 million of the assets of the currency fund in publicly issued security of any of the participating governments, or in issues guarante-ed by the governments. A maximum rate of M$100 million for each of the first three years will be permitted when the agreement comes into force.
3. Any participating government may withdraw from the agreement after 18 months’ notice. In the event of such a withdrawal, the Board will have to be liquidated in due course.10
F o r e i g n e x c h a n g e p o l i c i e s
Most of the ECAFE countries are prim ary exporters and depend upon the imports of capital goods for the development of their production capacity. Balance of payments crises and exchange restrictions in the postwar period have had serious repercussions on their respective economies; in some countries, domestic prices have remained particularly sensitive to exchange fluctuations. Achieving balance in their external transactions has, therefore, been a prime object of financial policies. During 1960, some significant steps were taken to move further towards achieving this end.
The principal events affecting the exchange values of national currencies were the appreciation of the Afghani in the free market in Afghanistan by about 30 per cent vis-à-vis the dollar and the Indian rupee, and the further adjustments made to the NT dollar in China: Taiwan, the Indonesian rupiah, the hwan in southern Korea, the Nepalese rupee and the Philippine peso. The Indonesian measures are re-viewed in the next sub-section. In China: Taiwan, the exchange certificates system underwent further revisions in 1960. The Bank of Taiwan was authorized on 26 May 1960 to purchase from tourists and recipients of inward remittances foreign exchange at the free market rate of NT$ 40 to 1 dollar, while the official rate of NT$ 36.38 to the dollar remained unchanged for the foreign exchange requirements of government organizations. On 1 July 1960, the
10 T h e clause seems to have been inserted to accom m odate the F edera tion of Malaya. Since the establishm ent, in early 1959, of the C entral B ank of M alaya, it has been the a im of the G o v ern -m e n t of the F edera tion of M alaya to issue its o w n currency a t the earliest possible date . A lth o u g h the F edera tion G o v ern m en t has n o t g iven notice of its w ith d raw a l fro m the C urrency Board, it is expected th a t the a im w ill be realized w ith in the nex t few years.
exchange system was again revised and simplified, with a unified rate of NT$ 40 to the dollar for all transactions. Beginning 23 February 1960, the official rate of exchange in southern Korea was changed from 500 to 650 hwan per dollar; a further devaluation took place with effect from 1 January1961. The Nepalese rupee, after fluctuating freely, was officially pegged at 160 Nepalese rupees to 100 Indian rupees in May 1960. All official transactions are now to take place in Nepalese currency, although a few districts have been exempted owing to a lack of banking facilities.
In the Philippines, the policy adopted in 1960 was a continuation of the four-year programme of gradual exchange decontrol adopted in July 1959. Beginning with the establishment of a “margin fee” on sales of foreign exchange, the programme, in addition to decontrol, was designed to fix the external value of the peso at a more realistic rate. Two m ajor steps were taken in 1960 in this direction. On 25 April 1960, the Government introduced a “ free” market for about one-quarter of all exchange transactions. The “ free” market has been placed under the supervision of the Central Bank, which fixes the free m arket rate. During the first year of operation of the free market, all exchange proceeds from gold exports and from tourism were to flow into the free market. Seventy-five per cent of the exchange proceeds from all other sources were to continue being surrendered to the Government at the official buying rate of 2 pesos to a dollar and 25 per cent were to flow into the free market at the official free market rate of 3.20 pesos, thus giving a “composite ra te” of 2.30 pesos to a dollar. Foreign exchange was to be sold by the Government at the rate of 4 pesos to 1 dollar (the free market rate of 3.20 pesos plus a 25 per cent margin fee) to make it easier for the holders of regular dollar quotas to purchase the extra foreign exchange needed. Net profits of foreign companies could be transferred abroad at this free market rate.
In the second half of 1960, an attempt was made to reduce the gap between the effective buying and selling rates. On 12 September, the free market rate was reduced to 3.0 pesos to a dollar and on 28 November the m argin fee was reduced from 25 to 20 per cent. Under the new arrangement, the new market rate for the sale of foreign exchange becomes 3.6 pesos (free market rate of 3 pesos plus 20 per cent) for each dollar instead of 4 pesos. The “preferred” rate, adjusted at 2.4 pesos per dollar (official rate of 2 pesos plus 20 per cent) will remain valid for essentials, such as newsprint, canned milk and certain foodstuffs. Remittances to Filipino students in the United States taking technological or scientific courses and for the purchase of scientific equipment remain under the preferred rates. A

Chapter 3. Aggregate Demand and Allocation of Resources 47
special foreign exchange reserve of $5 million per year has been created to finance new Filipino industries at the preferred rate. Foreign investment remittances inw ard and remittances of Filipinos from abroad will, however, be converted at full free m arket rate. Foreign exchange will be bought by the Government at the rate of 3 pesos to a dollar for half the proceeds and 2 pesos for the rem ainder, thereby providing an effective rate of 2.50 pesos instead of 2.30 pesos. In try ing to avoid a straight-forward devaluation of the peso, the Philippines thus moved from a unitary to a multiple exchange rate system.
The prim ary exporting countries of the region, in order to increase their foreign exchange receipts, continued to make further efforts at export prom otion. The main features of export prom otion continued to be the provision of insurance and credit facilities, special bonuses, tax remissions, perm itting foreign exchange retention, and so on. China: Taiwan sought to encourage exports through an extension of the list of export industries entitled to low-interest loans, as well as the establishm ent of an export insurance scheme and a m ore liberal treatm ent of goods which could be taken out of the country by tourists. India, in intensifying its existing trade prom otion efforts, extended to new products the grant of licences for the im port of raw m aterials and accessories and, in some cases, of m achinery and equipment, against exports of finished products. A num ber of fiscal reliefs were introduced in the form of refund of taxes paid earlier on the m aterials and components used in the m anufacture of export products. In order to make prices m ore competitive, transport costs were in some cases reduced by allowing rebates on freight. Existing restrictions on a num ber of additional export commodities were relaxed. Export prom otion m ea-sures in Indonesia included the replacement of the 20 per cent exchange tax by the 10 per cent export tax mentioned in the next sub-section. In Pakistan, the Export Bonus Scheme introduced in 1959 was continued in 1960. Under this scheme, on exports other than those of traditional raw m aterials, exporters get a bonus in term s of foreign exchange either for imports or for foreign travel undertaken for business purposes.
W ith the improvement in the term s of trade, and with the increase in foreign reserves during 1959 and the first half of 1960, several countries in the region could afford to liberalize their foreign trade and exchange restrictions towards the later part of 1959 and early 1960. However, in Ceylon, Ind ia and Indonesia (reviewed in the next sub-section), ex-change restrictions had to be tightened.
In Burma and the Federation of M alaya, dis-crimination against dollar im ports had virtually been removed in 1959. In the Federation, with effect from
1 July 1960, im port restrictions on m otor vehicles, radio sets and watches from the dollar area and OEEC countries were abolished. Burma also put 16 “essential” items on the free im port list. In China: Taiwan, im ports were liberalized with the abolition of the “ quarterly im port commodities budget” .
Japan had the highest ra te of accumulation of foreign reserves in the ECAFE region during 1960. From the beginning of the year, several steps were taken aim ing at a m ore liberal convertibility of the Japanese yen and at a reduction of restrictions on im ports. D iscrim ination against dollar im ports was reduced. In June 1960, the Government announced a program m e designed to free 80-90 per cent of Japan’s im ports w ithin three years, and the current account foreign exchange transactions within two years. The present rate of free im ports is around 40-45 per cent. Im port commodities were divided into four groups according to priorities for liberalization. The use of the Japanese yen for the settlement of international transactions was perm itted as from 1 July 1960, and non-residents were authorized to establish freely convertible and freely transferable yen accounts in Japan. Capital exports are being encouraged, especially in the form of export credits and invest-ments in the newly developing countries.
In Pakistan also, measures were taken to relax the control on im ports. Im ports of industrial raw m aterials and other essential commodities for the second half of 1960 were put on the “ open general licence” basis. In the Philippines, cash m argin deposit requirem ents for im ports were relaxed in May 1960. The deposit against ‘essential consum er’ im ports was reduced from the full value to a half and the deposit against ‘essential producer’ imports or im ports of ‘raw m aterials of industrial establish-ments’ was reduced from a half to a quarter.
In Ceylon, on the other hand, tighter foreign exchange policies were adopted by the new Govern-ment in August 1960, so as to stop the continuing drain on foreign reserves. Ceylonese nationals were no longer to be given an allowance of £300 per head for foreign travel as from September 1960. Rem it-tances were further restric ted; higher duties were imposed on several im ported item s;11 the minim um m argin requirem ents for letters of credit for certain im ports were raised; and discrim inatory rates of interest were prescribed to restrain bank credit for financing certain imports.
In India, the foreign reserves position in the second half of 1960 was the most critical since Independence. The level of reserves reached a point below the “constitutional m inimum ” of Rs 1.6 billion, com pared with Rs 8.0 billion held in 1947 and Rs 7.46
11 See pag e 42.
48 P a r t I. The ECA FE Region in 1960
billion held a t the end of 1956. T he trad e deficit fo r the earlier m onths of the 1960 /61 fiscal year was also appreciable. In the half yearly review of exchange quotas fo r im ports, fu rth e r drastic cuts were im posed fo r the period beg inn ing from O ctober 1960.
F ore ign a id to the EC A FE countries showed a fu rth e r increase. C om m itm ents by the U nited States of a id to the Colombo P lan countries of the region, increased from $0.90 billion in 1 9 5 7 /5 8 an d $1.26 billion in 1 9 58 /59 to $1.54 b illion in 1959/60 . A ctual disbursem ents of U nited States a id to some of the ECA FE countries which a re n o t m em bers of the Colombo P lan — A fghanistan , C hina: T aiw an, I ra n and southern K orea — am ounted to $0.34 billion in the n ine m onths, Ju ly 1959-M arch 1960, as com pared w ith $0.51 billion in the whole of the fiscal year (Ju ly-June) 1958/59 . Loans and gran ts from the British Com m onw ealth countries — A ustralia , C anada, New Zealand and the U nited K ingdom — to the Colombo P lan countries to talled $0.12 billion, the sam e level as in 1958/59 . On the o ther hand, disbursem ents, net of repaym ents, of loans g ran ted by the In te rna tiona l B ank for R econstruction a n d Development am ounted to a negative figure fo r the countries of the reg ion (excluding Jap an ) in the first nine m onths of 1960 as against a net receipt of $85 m illion in 1959. J a p a n ’s repara tions paym ents to the countries of the region w ere also reduced .12
Inform ation on economic assistance from other countries is fragm entary and cannot be pieced together to indicate trends for the cu rren t year. Ind ia received aid from the Federal Republic of G erm any fo r a steel p lant and France provided C am bodia w ith a id for constructing the new port, Sihanoukville. A fghanistan, Ind ia and Indonesia seemed to be the m ain recipients of a id from the Soviet U nion and from other countries of eastern E urope in 1960. A id from m ain land China principally went to Cam -bodia, Ceylon, n o rthern K orea, Nepal and n o rth e rn Viet-Nam.
The im portan t m easures of b ila tera l a id a n -nounced du ring the year 1959 /60 or 1960 were: the Indo-U nited States agreem ent fo r the purchase of food under U nited States Public Law 480, involving a purchase of 17 m illion tons of foodgrains over a four-year (1960-1963) p e rio d ; the 2 billion rouble cred it to In d ia from the Soviet Union, p a r t of which will finance the co u n try ’s th ird five-year p la n ; the Soviet U nion’s loan of $250 million to Indonesia and its g ran t of $80 m illion to A fghanistan to build a 470-mile ro ad from the Soviet ra ilhead on the A fghan-Soviet b o rd er to the southern p a r t of A fghan istan ; and m ain land C hina’s offer to N epal of 100 million In d ian rupees to be utilized over the
next th ree years. The Indo-U nited States agreement on foodgrains is perhaps of the m ost critical im -portance to Ind ia . The substantia l food reserves which will be bu ilt up will, to a considerable extent, free the coun try from the concern experienced periodically du ring the last ten years over price instability a ris ing from fluctuations in the domestic p roduction of foodgrains and over the high foreign exchange costs of foodgra in im ports.
T he outstand ing event of 1960 in relation to m ultila teral in ternational a id was the signing of the Indus W ater T rea ty in Septem ber 1960 by Ind ia and P ak istan , w hich was b ro u g h t about th rou gh the p ro longed m edia tion of the In ternational Bank for R econstruction and Development ( IB R D ). It opened the way to the developm ent of the w ater resources of the Indus Basin, on which depends the livelihood of some 50 m illion people in the two countries.
T he T rea ty allocates to Ind ia the waters of the three E astern rivers — Ravi, Beas and S u tle j; except th a t d u rin g the trans ition period of 10 years or slightly longer which m ust elapse before the com-pletion of the works undertaken in Pakistan for replacem ent of the E astern river waters, Ind ia will continue to deliver to P ak istan w ater from those rivers in accordance w ith a schedule set up in the T reaty . I t also allocates the waters of the three W estern rivers — Indus, Jhelum and Chenab — to Pakistan , subject to the provision tha t some of these w aters m ay be used by Ind ia in areas upstream for the developm ent of irr iga tion and electric power an d fo r some other purposes.
The division of w aters between the two countries necessitates the construction of works to transfer w ater from the three W estern rivers to meet those irr ig a tio n needs of P ak istan which have hitherto been m et from the w aters of the three Eastern rivers. I t had become apparen t in the early stages of negotiations, tha t the costs of financing these systems of works in Ind ia and P ak istan would be fa r beyond the capacity of the two countries. IBRD, therefore, undertook the fo rm ulation of a p lan for financing pa rtic ipa tion by a num ber of governm ents interested in p rom oting econom ic development of the sub-continent. The to tal cost of the p rogram m e was estim ated at approxim ately $1.07 billion.
S im ultaneously, w ith the signing of the Indus W ater T reaty in Septem ber 1960, an international financial agreem ent was also executed in K arachi by the representatives of IBRD and all the governm ents13 partic ipa ting in the financing of this project. This agreem ent created an Indus Basin Development Fund to be adm inistered by IBRD. The F und will be
12 See page 25.13 Australia, Canada, Federal Republic of Germany, India, New
Zealand, Pakistan, United K ingdom and the United States.
Chapter 3. Aggregate Demand and Allocation of Resources 49
financed by the partic ipating governments with a contribution of about $640 million, excluding the contribution of approximately $174 million by India and $80 million by Pakistan out of the proceeds of the IBRD loan. The cost of the works in Pakistan will be financed out of the Indus Basin Development Fund; the actual implementation of the project rests with the W ater and Power Development Authority of West Pakistan. The foreign exchange costs of the works in India will, however, be met by a loan of $33 million from the United States Government and another of $23 million from IB R D ; the rupee expenditure will be borne by the Government of India.
I n d o n e s i a ’s c o n t i n u i n g c o m b a t w i t h i n f l a t i o n
The significance and immediate effects of the financial measures taken in Indonesia in August 1959 were discussed in the 1959 Survey.14 However, during the early months of 1960, the volume of currency in circulation, which is the m ain indicator of money supply in that country, continued to rise sharply. This rise was accompanied by a 25 per cent increase in the cost-of-living index for the first half of the year. In spite of drastic penalties for breaches of price control and currency regulations, the rising trend of price level and currency circulation did not level off until the middle of the year when the money supply tem porarily stopped increasing. This tem -porary stoppage was mainly the result of increased government revenue from export duties supported by the high price of export commodities, chiefly rubber, although the volume of rubber exports fell. The budget deficit was reduced, alleviating the pressure of the Government for further loans from the Central Bank, thus slowing down the expansion of currency issue. This brief respite provided the Government with an opportunity for making certain adjustments to its foreign exchange policy.
In August 1960, the Indonesian Government revised the high im port and export taxes introduced in August 1959. The 20 per cent exchange tax on incoming exchange receipts, and exchange surcharges on six grades of imports (taxable at the duty rate of 25 per cent up to 200 per cent) have been abolished. Imports have instead been reclassified into two groups: “essentials” and “less essentials” . The “essential im ports” are divided into three sub-categories: payments for the first sub-category, rice for instance, are to be made at the official rate (45 rupiahs to a dollar) ; the other two sub-categories are to pay the official rate plus exchange surcharges of 25 and 60 per cent. For the “ less essentials” , a new special exchange rate has been established,
14 Economic Survey of Asia and the Far East 1959, page 44.
fixed by the Bank Indonesia initially at Rp 200 to a dollar. No foreign exchange is to be made available for certain commodities with adequate domestic production. A new 100 per cent transfer tax is levied on certain service and capital payments. Thus a dollar is valued at six rates of exchange: four rates for imports— 45, 56.25, 72 and 200 rupiahs, excluding the im port duties; one rate for certain invisibles — 90 ru p iah s ; and one rate for exports — 45 rupiahs — disregarding the export tax. A four-fold classification of im port duties — duty free, 20 per cent, 30 per cent and 100 per cent — replaces the previous tariff rates. A uniform 10 per cent tax on all exports replaces the 20 per cent exchange tax.
However, towards the end of 1960, rubber prices dropped heavily, reducing government revenue and increasing the Government’s overdraft from the Central Bank. The currency circulation, which was m aintained at around Rp 30 billion for the first three quarters of the year, started a new upsurge surpassing the Rp 40 billion m ark by the middle of November I960 .15
ALLOCATION OF RESOURCES
In the year 1960, there was on the whole a large volume of resources available for allocation between the two principal sectors — namely, the government sector and the private sector; and for two principal uses — namely, consumption (or cur-rent expenditure in the case of government) and investment.
The increase in resources was due to an increase in domestic output and to a larger im port surplus. Apart from the territories for which no information is available, China: Taiwan was perhaps the only one where, 1959/60 agricultural production having fallen, there was a supply shortage. Southern Korea and Laos had short-term difficulties, supplies having been interrupted by unsettled conditions. Otherwise, the countries of the region had larger supplies; for most of them, 1960 was a second good year after the adverse situation which they had encountered in1958. Moreover, in this respect, it was an even better year than 1959, when imports had to be cut in several countries of the region following a decline in export earnings in 1958.
15 Following the monetary reform of August 1959, the currency reserves of Indonesia rose from 5 to about 35-40 per cent of the currency in circulation. The reserves rose due to the revision of the conversion ratio from Rp 11.40 to Rp 45 to 1 dollar at the same time as the am ount of currency in circulation was drastically reduced (see table 39 on page 110). Subsequent increase in cur-rency circulation had, however, brought down the coverage to a m uch lower percentage.
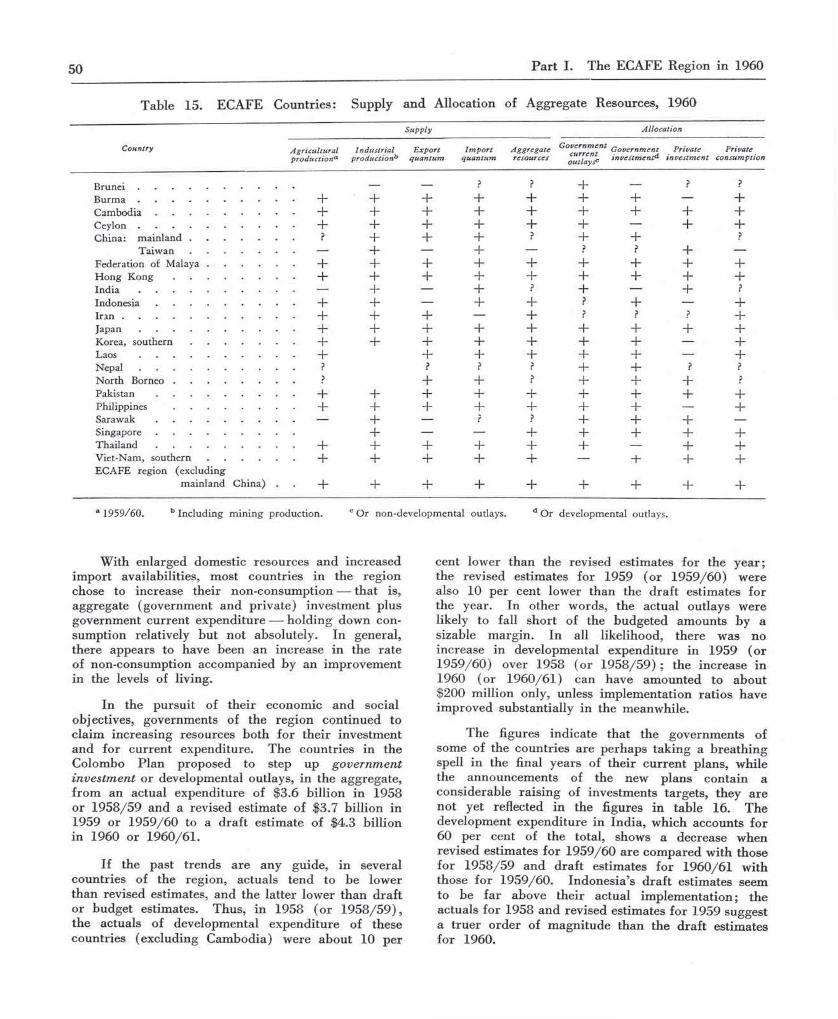
50 P a r t I. T he EC A FE Region in 1960
T able 15. EC A FE C ountries: Supply a n d A llocation of A ggregate Resources, 1960
Supply Allocation
Agricultural productiona
Industrial productionb
Exportquantum
Importquantum
Aggregateresources
Government current outlaysc
Government investmentd
Privateinvestment
Privateconsumption
— — ? ? + — ? ?
+ + + + + + + — ++ + + + + + + + ++ + + + + + — + +
? + + + ? + + ?+ — + — ? ? + —
+ + + + + + + + ++ + + + + + + + +
+ — + ? + — + ?+ + — + + ? + — +
+ + + — + ? ? ? ++ + + + + + + + +
+ + + + + + + — ++ + + + + + — +? ? ? ? + + ? ?? + + ? + + + ?
+ + + + + + + + ++ + + + + + + — +
+ — ? ? + + + —+ — — + + + + +
+ + + + + + — + ++ + + + + — + + +
+ + + + + + + + +
a 1959/60. b Including m ining production. c Or non-developmental outlays. d O r developmental outlays.
W ith enlarged dom estic resources an d increased im port availabilities, m ost countries in the region chose to increase th e ir non-consum ption — th a t is, aggregate (governm ent an d p riva te ) investm ent plus governm ent cu rren t expenditure — hold ing down con-sum ption relatively bu t no t absolutely. In general, there appears to have been an increase in the ra te of non-consum ption accom panied by an im provem ent in the levels of living.
In the pu rsu it of th e ir econom ic a n d social objectives, governm ents of the reg ion con tinued to claim increasing resources bo th fo r th e ir investm ent and fo r cu rren t expenditure. T he countries in the Colombo P lan proposed to step up g o vern m en t in ve s tm e n t or developm ental outlays, in th e aggregate, f rom an actual expenditure of $3.6 b illion in 1958 o r 1 9 5 8 /5 9 an d a revised estim ate of $3.7 b illion in1959 o r 1 9 59 /60 to a d ra f t estim ate of $4.3 b illion in 1960 o r 1960 /61 .
If the past trends a re any guide, in several countries of the region, actuals tend to be lower than revised estim ates, and the la tte r lower th an d ra f t o r budget estimates. Thus, in 1958 (o r 1 9 5 8 /5 9 ) , the actuals of developm ental expend itu re of these countries (excluding C am bodia) were abou t 10 per
cent lower than the revised estim ates for the yea r; the revised estim ates fo r 1959 (o r 1 9 5 9 /6 0 ) were also 10 per cent lower than the d ra f t estim ates for the year. In o ther w ords, the actual outlays were likely to fall sho rt of the budgeted am ounts by a sizable m arg in . In all likelihood, there was no increase in developm ental expend itu re in 1959 (o r 1959 /60 ) over 1958 (o r 1 9 5 8 /5 9 ) ; the increase in1960 (o r 1 9 6 0 /6 1 ) can have am ounted to abou t $200 m illion only, unless im plem entation ra tio s have im proved substantia lly in the m eanwhile.
The figures ind ica te th a t the governm ents of some of the countries a re perhaps tak ing a b rea th ing spell in the final years of th e ir cu rren t plans, while the announcem ents of the new plans con ta in a considerable ra is ing of investm ents targets , they a re n o t yet reflected in the figures in tab le 16. T he developm ent expenditure in Ind ia , w hich accounts fo r 60 per cent of the total, shows a decrease when revised estim ates fo r 1 9 5 9 /6 0 a re com pared w ith those fo r 1 9 5 8 /5 9 and d ra f t estim ates fo r 1960 /61 w ith those fo r 1959 /60 . Indonesia ’s d ra f t estim ates seem to be fa r above th e ir actual im p lem en ta tion ; the actuals for 1958 and revised estim ates fo r 1959 suggest a tru e r o rd e r of m agnitude than th e d ra f t estim ates fo r 1960.
C o u n try
B r u n e i .................................................B u r m a .................................................C a m b o d i a ..........................................C e y l o n .................................................China: m a in l a n d ............................
T a i w a n ............................Federation of Malaya . . . .Hong K o n g ...................................I n d i a .................................................I n d o n e s i a ..........................................I r a n ........................................................J a p a n .................................................Korea, s o u t h e r n ............................L a o s .................................................N e p a l .................................................N orth B o r n e o ...................................P a k i s t a n ..........................................Philippines ...................................S a r a w a k ..........................................S i n g a p o r e ..........................................T h a i l a n d ..........................................Viet-Nam, southern . . . . ECAFE region (excluding
m ainland China)

C h a p t e r 3 . A g g r e g a t e D e m a n d a n d A l l o c a t i o n o f R e s o u r c e s 5 1
T a b l e 1 6 . E C A F E C o u n t r i e s : G o v e r n m e n t E x p e n d i t u r e u n d e r D e v e l o p m e n t a l H e a d s , 1 9 5 8 - 1 9 6 0
( M i l l i o n d o l la r s a t c o n s t a n t r a t e s o f e x c h a n g e )
Country1958/59 or 1958 1959/60 or 1959 1960/61 or 1960
Revisedestimates Actuals Draft
estimatesRevised
estimates Draft estimates
Burmaa. . 85 92 92 113 103
Cambodia . . 38 46 25 Ceylon . . 137 100 113 108 109
Federation of Malaya . . . . . . 169 171 207 176 240 India . . 2,218 2,096 2,300 2,113 2,268
I n d o n e s i a ........................................... . . 398 125 334 143 403 Laos . . 27 11 32 15 25
N e p a l .................................................. . . 4 5 21 16 43 North Borneo . . 8 8 7 4 7
Pakistanb ........................................... . . 313 384 314 404 463P h i l i p p i n e s ........................................... . . 368 346 378 346 404
Sarawakc 10 9 12 12 13 Singapore 40 52 37 47 51 Thailand 82 82 146 68 64
Viet-Nam, southern . . . . . . 82 83 103 105 112
Total (excluding Cambodia) . . . 3,943 3,564 4,100 3,670 4,305
Source: The Colombo Plan: Eighth and N in th A nnua l Reports of the Consultative C om m ittee 1959 and 1960.
a Figures for Burma include capital expenditure of public enterprises. b April 1958-March 1959, April 1950-June 1960, July 1960-June 1961. c Data furnished by the Governm ent of Sarawak.
A s i m i l a r t r e n d c o u l d b e o b s e r v e d a l s o i n t h e c o u n t r i e s o f t h e r e g i o n w h i c h d o n o t f o r m p a r t o f t h e C o l o m b o P l a n a r e a . H o n g K o n g , J a p a n a n d s o u t h e r n K o r e a i n d i c a t e d l a r g e r d r a f t p r o v i s i o n s f o r c a p i t a l e x p e n d i t u r e t h a n t h e r e v i s e d e s t i m a t e s f o r t h e p r e v i o u s f i s c a l y e a r s . O n l y i n B r u n e i , p a r t l y r e f l e c t -i n g lo w e r r e c e i p t s f r o m o i l , w e r e t h e b u d g e t e d c a p i t a l o u t l a y s f o r 1 9 6 0 l o w e r t h a n t h e r e v i s e d e s t i m a t e s f o r 1 9 5 9 . F i s c a l d a t a o n A f g h a n i s t a n , C h i n a : T a i w a n a n d I r a n w e r e n o t a v a i l a b l e .
T h e v o l u m e o f p r i v a t e i n v e s t m e n t i s m o r e d i f f ic u l t to a s c e r t a i n . I n g e n e r a l , t h e i n c r e a s e d o u t l a y s o f t h e p u b l i c s e c t o r i n a c l i m a t e o f h i g h e r d o m e s t i c p r o d u c t i o n a n d m o r e l i b e r a l i m p o r t s , t e n d t o b e a c c o m p a n i e d b y a n in c r e a s e i n i n v e s t m e n t i n t h e p r i v a t e s e c to r . I n a d d i t i o n , s e v e r a l g o v e r n m e n t s a r e p u r s u i n g a p o l i c y o f “ u n l o a d i n g ” p u b l i c i n d u s t r i a l u n d e r t a k i n g s o n t h e p r i v a t e s e c t o r . T h e m a j o r s t i m u l a n t t o p r i v a t e i n v e s t m e n t i n t h e c o u n t r i e s o f th e r e g i o n , h o w e v e r , i s t h e c o n t i n u e d s u s t e n a n c e o f a h i g h le v e l o f d e m a n d u n d e r a p o l i c y o f p l a n n e d e c o n o m i c d e v e l o p m e n t .
D u r i n g 1 9 5 9 - 1 9 6 0 , J a p a n a p p e a r s t o h a v e p a s s e d t h r o u g h t h e m a j o r p h a s e s o f a n o t h e r c y c l e o f i n v e s t -m e n t b o o m a n d i t s s u b s i d e n c e . I t b e g a n t h e y e a r1 9 5 9 w i t h a m p l e e x c e s s c a p a c i t y a f t e r t h e r e c e s s i o n o f 1 9 5 8 . S t i m u l a t e d b y t h e r e d u c t i o n i n i n t e r e s t r a t e s i n F e b r u a r y 1 9 5 9 , i n v e n t o r y i n v e s t m e n t p i c k e d u p g r a d u a l l y t o w a r d s t h e m i d d l e o f 1 9 5 9 , w h i l e
e x p o r t s , w h i c h w e r e s u p p o r t e d b y w o r l d w i d e e c o n o m i c r e c o v e r y , i m p r o v e d q u i t e r a p i d l y . T o w a r d s t h e t h i r d q u a r t e r o f t h e y e a r , i n v e s t m e n t i n p l a n t a n d e q u i p m e n t a l s o b e g a n t o e x p a n d . T h i s e x p a n s i o n r e a c h e d i t s p l a t e a u i n t h e f i r s t q u a r t e r o f 1 9 6 0 ; a d o w n w a r d t r e n d w a s , h o w e v e r , a p p a r e n t t o w a r d s t h e f o u r t h q u a r t e r o f t h e y e a r .
I n d i a w a s a l s o e n j o y i n g c o n d i t i o n s o f b r i s k d e m a n d . I n t h e f i r s t h a l f o f 1 9 6 0 , a s c o m p a r e d w i t h 1 9 5 9 , d o m e s t i c p r o d u c t i o n o f b a s i c m e t a l i n d u s t r i e s w a s u p b y 1 7 p e r c e n t ( a l t h o u g h m e t a l p r o d u c t s w e r e d o w n b y 4 p e r c e n t ) , t r a n s p o r t e q u i p m e n t u p b y 2 1 p e r c e n t , a n d c e m e n t u p b y 1 4 p e r c e n t . T h e r e w a s a l s o a r e l a t i v e l y s m a l l i n c r e a s e ( 3 p e r c e n t i n t e r m s o f v a l u e ) i n i m p o r t s o f c a p i t a l g o o d s a n d o f m a t e r i a l s r e q u i r e d c h ie f l y f o r c a p i t a l g o o d s . S i n c e g o v e r n m e n t i n v e s t m e n t d o e s n o t a p p e a r t o h a v e i n c r e a s e d , a s i g n i f i c a n t p r o p o r t i o n o f t h e i n c r e a s e i n t h e s u p p l y o f i n v e s t m e n t g o o d s w a s a v a i l a b l e t o s u s t a i n p r i v a t e i n v e s t m e n t .
T h e o t h e r c o u n t r i e s o f t h e r e g i o n d e p e n d f o r t h e i r i n v e s t m e n t n e e d s , o t h e r t h a n f o r b u i l d i n g m a t e r i a l s , a l m o s t e n t i r e l y o n i m p o r t s . T h e v a l u e o f s u c h i m p o r t s i n 1 5 c o u n t r i e s o f t h e r e g i o n 16— e x c l u d -i n g I n d i a a n d J a p a n — t o t a l l e d $ 2 .2 b i l l i o n i n t h e f i r s t
16 Burma, Cambodia, China: Taiwan, Federation of Malaya, H ong Kong, Indonesia, southern Korea, Laos, North Borneo, Pakistan, Philippines, Sarawak, Singapore, Thailand and southern Viet-Nam.
52 P a r t I. T he E C A FE R egion in 1960
half of 1960 (an n u a l ra te ) as com pared w ith $1.9 b illion in 1959. T he largest increases w ere observed in P ak istan (82 per c e n t) , C am bodia (65 per c e n t) , N orth Borneo (38 per c e n t) , C hina: T aiw an (34 per cent) an d H ong K ong (28 per c e n t) . On the o ther hand , such im ports declined in B urm a (by 20 per c e n t) , Indonesia (15 per c e n t) , southern K orea (17 per cent) an d Laos (50 p e r c e n t) .
T he ou tpu t of bu ild ing m ateria ls was also up. T im ber p roduction for the whole reg ion was calculated to be 10 per cent h igher in 1 9 5 9 /6 0 than in the previous year. P roduction of cem ent in ten coun-tries of the reg ion (excluding Ind ia and Jap an ) was up by 9 per cent. T he indices of bu ild ing activity in the first half of 1960, as com pared w ith the first ha lf of 1959, ind icated a doubling of activity in H ong Kong, ra th e r sharp increases (over 30 per cent) in Singapore, T ha iland and southern Viet-Nam, an d a m oderate increase in C hina: T aiw an (13 per cent) an d Japan (22 per c e n t ) . There was a decline in bu ild ing activity indices in the Philipp ines (2 4 p e r cent) and southern K orea (5 p e r c e n t) .
All in all, i t appears th a t investm ent in m ost countries of the reg ion was up — on governm ent account only slightly an d on p riva te account sub -stantially.
C urrent g o vern m en t ex p en d itu re fo r defence, adm in istra tion an d social services, also went up, conform ing to the observations in P a r t I I of the S u rvey . Most countries of the region fo r w hich statistics are available — th a t is, all of them except A fghanistan, C hina: T aiw an, Indonesia , and I ra n — seem to have budgeted fo r a h ig h er cu rren t expendi-tu re (o r non-developm ental expenditure , accord ing to the classification em ployed by som e countries) for the fiscal years w ith th e ir m a jo r p a r t fa lling in 1 9 6 0 —-1 9 5 9 /6 0 in the case of Laos, Nepal, P ak istan and the Philippines, which begin th e ir fiscal years on 1 July. Southern Viet-Nam was the lone excep-tion. The sharpest increases w ere budgeted in N epal (46 per cent) and Laos (37 p e r c e n t) . B runei, H ong Kong, Ind ia , Japan , N orth Borneo, P ak is tan an d the Philipp ines had budgeted increases exceeding 10 per cen t; increases budgeted elsewhere were of a sm aller m agnitude.
The trends in p r iv a te con su m ption , as in p rivate investm ent, have again to be ascerta ined indirectly . The boom in Jap an was, of course, associated w ith an increase in consum er goods ou tpu t; p a rticu la rly significant was the increase in consum er durables. Even when m ore of the la tte r were exported , J a p a n ’s re ta ined dom estic p roduction of consum er goods was h igher. However, fam ily budget surveys of consum er expenditure do no t show m uch of an increase in real
term s. F o r the u rb a n popula tion , w hich constitutes a la rge p ro p o rtio n of the to tal, bo th consum er expend itu re an d u rb an consum er prices w ere up by approxim ate ly 5 p e r cent in Ju ly 1960 over a y ear ago. F o r th e ru ra l population , however, consum ption levels w ent u p ; in M ay 1960, th e ir consum er expend itu re was up by 7 per cent, w hereas ru ra l consum er prices w ere up only by 1.5 per cent as com pared w ith M ay 1959. Even if the farm ers m ade some purchases in u rb an areas, the ir consum p-tion levels were im proved in rea l term s.
In m ost o ther countries, consum ption levels can only be ascerta ined on the basis of indices of ag ricu ltu ra l and m anufac tu rin g p roduction an d of the value of im ports of consum er goods. F o r these countries, the supplies of staple foods an d textiles prov ide the m a jo r ind ica to rs of consum ption levels. Cereal supplies per head in 1960 w ere expected to be a t abou t the sam e level as in 1959; bu t they were considerab ly h ig h er th an in 1958.17 Textile p roduc-tion went u p ; there was also an increase in the value of im ports of consum er goods. As im p o rt p rices d id n o t increase substantia lly , consum ption levels, on the whole, ind ica ted an im provem ent over the previous year.
To sum up the reg iona l s ituation , th e re was an increase in aggregate resources in 1960, ow ing partly to a sligh t increase over the h igh level of ag ricu ltu ra l p roduction in 1959, and pa rtly to a substan tia l increase in m an ufac tu ring p roduction and in im ports w hich m ore than m ade up fo r the fall in domestic supplies represen ted by the rise in the reg io n ’s exports. As in 1959, the increase in aggregate resources m ade it possible to sustain increases in governm ent spending m ostly on cu rren t account and in p riva te expenditure on consum ption an d investm ent. However, govern-m ent and private expenditures continued to be balanced by budget deficits an d c red it expansion, w hich led to an increase in m oney supply, despite a grow ing tren d in m any countries to finance governm ent expend itu re by revenue an d p rivate investm ents by savings. E x ternal assets of th e region rose as the net resu lt of h ig h er exports, increased im ports an d la rg e r foreign aid. P rices, on the whole, tended to rise. In B urm a, C hina: T aiw an, Indonesia and L aos,18 they rose m ore than 5 p e r cent. T he m ovem ents — up o r down — in o ther countries were relatively m ild. E x ternal im balance fo r the m ost p a r t was tackled w ith quan tita tive restric tions; there was, however, a tren d tow ards im p o rt and exchange libera liza tion following upon an im provem ent in the balance of paym ents situation .
17 See table 13 on page 38.18 Prices in Laos rose only in the second half of the year.

PART II. PUBLIC FINANCE IN THE POSTWAR PERIOD
C h a p t e r 4
THE INCREASIN G ROLE O F TH E PUBLIC SECTOR
It is common knowledge that governments of to-day have grown m ore intimately involved in the social and economic life of nations practically all over the world. This study of the postwar trends in public finance, therefore, begins with a review of the forces which have shaped the growth in the functions assigned to the public sector in the countries of the ECAFE region. In the process a distinction is made between planning and state control, and between the size of the public sector and the area of its influence.
HISTORICAL SETTING
The postwar period in Asia witnessed a complete transformation in the political status of a num ber of countries and territories. Twelve of these gained their freedom,1 thus increasing the num ber of independent nations in the ECAFE region from six2 before the war to eighteen by 1959.
The metropolitan countries in their stewardship had largely concerned themselves with the m ain-tenance of law and order and the provision of basic welfare services. In the economic field, in accor-dance with the laissez-faire traditions of the late nineteenth century liberalism, the activities of the state had prim arily been concentrated on the con-struction (and m aintenance) of roads, railways, irrigation and other utilities. Direct participation in agricultural, industrial or commercial pursuits was rarely undertaken; the state restricted itself to the provision of basic facilities, including inform ation, education and research.
Of course, laissez-faire did not altogether reign supreme. The national interests of the metropolitan powers demanded that the state encourage economic pursuits aimed at procuring raw materials for their industries, and markets for their industrial products. The development of commercial crops— tea, rubber, jute— and the extraction of minerals— petroleum, iron ore, tin, antimony, tungsten, manganese— bear testi-mony to their efforts in this direction. Even so, the
1 B urm a, C am bodia , Ceylon, F ed era tio n of M alaya, Ind ia , In d o -nesia, K orea, Laos, Pak istan , P h ilipp ines, S ingapore an d V ie t-N am .
2 A fghanistan , C h ina , I ran , Japan , N epa l an d T h a ilan d .
development of the export and im port sector was to a large extent left to private enterprise; the state confined itself to the provision of transport and other facilities for the movement of the goods between hinterland and port.
The dynamic export production and foreign trade sectors were dominated by the nationals of the m etro-politan countries and certain im m igrant minorities. The mass of the indigenous population was engaged in subsistence agriculture and handicrafts. In agricul-ture, techniques remained antiquated, yields remained stagnant, and the producers remained on the verge of subsistence. Handicrafts were adversely affected by cheaper factory-made goods im ported from abroad. The establishment of peace and tranquility and the provision of welfare facilities led to an upsurge in population. Although m alnutrition generally, and famines and epidemics periodically, acted as a brake, the population kept on increasing, and, for lack of any other alternative, kept pressing on the meagre resources of the soil.
The independent nations also fared no better. Foreign impact had created a few industries and laid down a few railway lines in m ainland China. However, the country remained subject to periodic civil wars and encroachments on its sovereignty by m ajor western powers and Japan. Other independent countries remained more or less in the simple agrarian stage, except for isolated enterprises dominated by private foreign capital, of which an outstanding example was the exploitation of petroleum in Iran by the Anglo-Iranian Oil Company.
Japan alone constitutes an exception. F rom 1868 onwards, the twin objectives of building up a m ilitarily strong and economically prosperous nation led the state to participate in practically all phases of economic activity and community life. Before the tu rn of the century, prim ary education was made compulsory, a network of railroads was built and a system of development banks was established. Financed in the early years by land taxes and in the later years by other direct taxes, the Government remained closely associated with industrial activity; it built pilot units for coal, steel and textile produc-tion. The ties between the Government and the large
54 P art II. Public Finance in the Postwar Period
business houses— the zaibatsu— which were established in the Meiji era (1868-1912) grew steadily stronger until, in the nineteen-twenties, m ajor political parties were closely associated with big business firms.
In the period after the war, the governments of the under-developed countries of the region could not but assume a direct responsibility for pulling their economies out from a long-drawn stagnation. The vicious circle of low productivity, low incomes and low savings could not be broken by private enterprise alone; the population-resource ratio turned adverse in many countries. The predominant depen-dence of the working force on agriculture and the low rate of national saving required to be altered. More productive capital per head had to be provided if low productivity were to be raised. However, efforts in this direction had serious economic and social ramifications. The task entailed raising the productivity in agriculture and providing of social overhead capital. The former objective called for institutional changes in land ownership and in the division of produce from land. As regards the second objective, the m ajor characteristics of social overhead capital— long periods of gestation, the “lumpiness” of investment, and the indirect routes of pay-off— made them unsuitable for initiative by private enter-prise. Both the economic characteristics of invest-ment, and the societal changes called for, made it inevitable that the role for the public sector would be predominant.3
PLANNING AND THE EXTENSION OF STATE CONTROL
With the objective of economic and social development firmly in mind, the countries of the ECAFE region, in the postwar period, have stressed the need to make the most efficient use of national resources. The actual extent of planning has varied from country to country. Mainland China and other centrally planned economies of the region have attempted to implement plans affecting their entire economies. In other countries the plans deal only or mainly with the m ajor programmes to be imple-mented in the public sector and, in several of them, lay down production and investment targets for the private sector. The plan in Japan, on the other hand, started out as a set of economic projections over the plan period.
The concept of planning in the countries of the region has developed from separate sources. M ain-land China (and northern Korea and northern
3 See W .W . Rostow: The Stages o f Economic Growth (Cambridge University Press, 1960).
Viet-Nam) have drawn on the Marxist philosophy according to which the state is to be the only entrepreneur during the stage of transformation of the capitalist society into the socialist one. It is in pursuance of this politico-economic philosophy that the state assumes control over the entire economic apparatus. P lanning is a corollary, in the sense that, if the state is to be responsible for the physical allocation of the entire productive resources, there has to be a central plan of such allocation. In that sense, planning in the centrally planned economies in Asia, as in eastern Europe, has become a con-sequence of the “all-inclusive” role designed for the public sector.
The fountainheads of planning in other ECAFE countries spring from the post-Depression evolution of economic thinking and the practical experience in m anaging the wartime economies. Keynesian economics, as it has developed, assigns a central role to the public sector in the industrialized countries in levelling out the zigzags of private investment in order to avoid the trade cycles and in filling the gaps left by the secular deficiency in demand in order to avoid a high level of chronic unemployment. Private or personal consumption is assumed to be a stable function of incomes; the unstable element is private investment; the state has to adjust its outlays both on consumption and on investment if it wishes to achieve both a stable and high rate of employment.
The postwar policies of the industrially developed economies in North America and western Europe, and of Japan in Asia, have on the whole followed the stabilization directives for the public sector. Contrary to the prewar period, the postwar experience of these countries has, on the whole, been one of a relative excess of demand. The state has therefore not generally been called upon to make good a long-term deficiency in demand by a high rate of outlays designed to m aintain full employment. The newly developing countries, on the other hand, picked upon this aspect to frame their economic policies; these came to be based on the critical relationship between investment and the growth of national income. And, if the private sector was not forth-coming in the drive to secure the rate of investment which was deemed desirable, the state had to step in.
The experiences of the war had posed the problem in a practical way, both for the industrial economies and the under-developed ones. Govern-ments of the countries engaged in war were called upon to assume responsibility for the national allocation of resources in an attempt to squeeze out the optimum am ount that could be diverted to the

Chapter 4. The Increasing Role of the Public Sector 55
war effort. Thinking developed in this direction and the experience gained had a tremendous impact on the postwar policies of the under-developed countries. If, on a relatively sudden call, the economies could manage to divert 15-20 per cent of their output to purposes of destruction, why, in times of peace, could they not divert a higher figure than the traditional 5-7 per cent of their output in order to secure economic development? Could not the governments, as in wartime, plan the national allocation of resources in order to wage the infinitely more satisfying war against hunger, disease and poverty in general? It was symptomatic of this type of thinking that even before the war had ended, the pre-Independence Government of Ind ia4 and the then Government of China5 had set up m achinery to evolve plans of national development when peace was restored.
Peace and independence only strengthened the two legacies of the war— the centralized allocation of resources and state control. The two are not insepar-able except in m ainland China. The form er involves national planning, which may or may not imply a large share for the public sector in the actual control over resources. As to the latter, the countries have been more or less pragmatic in their approach. Except, again, in the centrally planned economies, where state control of almost the entire productive apparatus has been adopted on ideological grounds, the countries of the region have left both agriculture (constituting the bulk of their productive economy) and handicrafts and small-scale industry in private hands. Even in large-scale industry, the state has stepped in less on grounds of doctrine than of necessity, since private enterprise was either unwilling or unable to start off. As a result, the extension of the public sector has varied from country to country, though practically all have subscribed to the need for planning. The real reasons for the extension in the size of the public sector have lain in the very character of the social and economic investments called for in the process of economic growth. This, however, is not to deny that socialist thinking has played a part in strengthening the role of the state. Because of its political and moral appeal to the poor masses, several governments have declared that their economic objectives are directed towards atta in -ing a socialist society; no country, other than mainland China, however, has gone in wholeheartedly
4 It is also in teresting to note th a t this action of the G o v ern m en t followed the pub lication in 1944 o f the Bom bay P lan — o r the Tata-Birla P lan as i t is called. In o th e r w ords, p la n n in g in India has been no less a p ro d u c t of capitalist th an of socialist th ink ing , and th a t perhaps explains the a lm ost universal acceptance of p lan n in g by practically all shades of political op in ion in th a t country.
5 A p lan entitled the Draft Five Year Plan for Resource Develop-ment was pub lished ( in Chinese) in C h u n g k in g in D ecem ber1945.
for the elimination of private enterprise, for the sake of a socialist economy per se. If the state’s tentacles have spread, this has been the necessary consequence of the desire to telescope a hundred years’ progress into ten— or, in economic terms, quickly to increase — even double or treble— the traditional rate of national investment in a decade or less.
THE SIZE AND GROWTH OF THE PUBLIC SECTOR
There is no clear-cut measure of the absolute size of the public sector which would enable us to make inter-country comparisons or to show the trends over a time period. The present methods of national or social accounting permit four possibilities of measuring it. The first is to measure the claim of the public sector on the national wealth or resources such as manpower and the stock of real capital. A second would involve assessing the share of the public sector in the spending of the national income on goods and services for consumption and investment. A third measure would involve a computation of the contribution made by the public sector, in terms of wages of all public sector employees and profits of public corporations, to the national total of factor incomes. Finally, it may be possible to indicate the degree of income redistribution occasioned by the public sector, as measured by the magnitude of taxation and other transfer payments (net of receipts) from the private sector.
In any such measurement, however, there is the m ajor difficulty of defining what constitutes the public sector. The countries of the region differ consider-ably in the scope of their budgets or in the manner in which they classify them. The coverage of the public sector in terms of administrative authorities— the central, the state and local governments— or in terms of the inclusion or exclusion of public enterprises falling within the scope of each of these authorities, varies from country to country. Even the “publicness” of public enterprises shades off all the way from the wholly state-owned and state- operated enterprises to the substantially privately owned and privately operated activities. These difficulties are compounded by the absence of uniformity either in the definitions or in the methods of computation of the national accounts and by the varying degree of reliability of the basic data from which these accounts are prepared. In view of these difficulties, there is need for caution in interpreting the public finance data presented in this study for inter-country comparisons.6
6 F o r public finance d a ta an d the concepts used in the p resent s tudy , see the “E x p lana to ry no te on sources, t im e reference an d coverage an d definitions o f te rm s” , pp . 63-64.

56 P a r t I I . P ub lic F inance in the Postw ar Period
T he first of the fo u r m easures, nam ely, the public sector’s c laim on rea l n a tiona l wealth, could no t be obtained. W e have no clear m easure of the n a tio n ’s cap ita l resources— land, equipm ent, bu ild ings, etc.— an d canno t therefo re ascerta in the d ra f t m ade on them by the public sector. T he m easurem ent of the grow th of the w ork ing force em ployed in the public sector is also sub jec t to s ta tistical difficulties. Except, in th e case of Japan , an annual b reakdow n of m anpow er an d em ploym ent is no t available. T he occupational d is tribu tion of popula tion is available f rom the popula tion censuses fo r a few countries only on a decennial basis. T he nex t censuses a re scheduled to take place a ro u n d 1961; th e ir results would be ou t only by 1962 o r la ter. Even so, there a re difficulties of classification. A person em ployed in a public en terprise will be classified u nder the charac te r o r type of the industry ra th e r than as in public service, o r he m ay be classified accord ing to h is occupation— econom ist, accountant, etc.— ra th e r than as a public civil servant. Only those d irectly engaged in public adm in is tra tion an d defence p e r se w ill be accounted for. This will adm ittedly be an inadequate m easure of the claim m ade by the public sector on na tiona l m anpow er resources.
Table 17 presents the available da ta re la ting to the second of th e four m easures described, nam ely the share of the public sector in the na tiona l a llocation of the to tal supply of final (as d istinguished from in term ediate) goods an d services, inc lud ing those received in foreign aid. T he data presented are m ore tru ly indicative of the countries between two tim e periods; they are less tru ly representative of in te r-country differences owing to the incom pleteness of statistics of public enterprises. F o r m ain land C hina the statistics exclude “co-operative” an d “jo in t state- p riva te” sectors which were substantia lly under governm ent control. If these were included, the share of public sector would am ount to 97 per cent in 1957.7 F o r the o ther ten te rrito ries fo r w hich it was possible to m ake an assessment, the public sector’s c laim on goods and services, net of tran sfe r paym ents to the priva te sector, am ounted to between 10 and 30 p e r cent of the national to ta l in 1957 o r 1958. This provides a slightly w ider range th an th a t of the gross national p roduc t absorbed by the public sector in w estern E urope in 1957— between 15 and 25 p e r cent.
I t is c lear from table 17 th a t the share of the to tal p roduc t absorbed by public sector rose d u rin g the ’fifties in the countries of the EC A FE region. Only in the Ph ilipp ines d id it rem ain abou t the sam e as a resu lt of two offsetting tren d s: while o ther expenditures tended to c la im a la rg e r slice of the national cake, the share of public investm ent was
7 See table 23 on page 68.
reduced. H ere i t will suffice to po in t out only th e m a in elem ents accounting fo r the grow th in governm ent expend itu re elsewhere. A m ore detailed exam ination is left to the nex t chapter.
T able 17. EC A FE C ountries: S hare of Public Sector in Gross N ational E xpend itu re
(P e r cen t o f gross n ation al ex p en d itu re )
C o u n tr y a n d yea rT o ta l
g o v e r n m e n te x p e n d itu r e
C u rre n t a n d ca p ita l t ra n s fe r p a y m e n ts to p r iv a te sector
N e t c la im o f th e p u b l ic
sec to r
Burma1 9 5 1 ........................ 14.4 2.1 13.4a1958 ........................ 27.9 1.6 26.7a
Ceylon1950 ........................ 19.4 3.3 16.11958 ........................ 25.6 6.1 19.5
China: m ainlandb1950 . . . . 16.0 16.2c1958 . . . . 32.7 32.7cTaiwan1951 . . . . 25.4 0.4d 25.01958 . . . . 33.1 2.5 30.6
Indiae1950 ........................ 9.3 1.0 8.31958 ........................ 16.5 2.5 14.0
Indonesia1 9 5 1 ........................ 16.2 16.2c1958 ........................ 19.7 19.7c
Japan1950 ........................ 23.8 7.9 15.81958 ........................ 26.3 6.9 19.3
Korea, southern1953 ........................ 13.2 2.8 10.41958 ........................ 24.3 6.1 18.2
Pakistane, f1950 ........................ 9.7 0.4 9.31958 ........................ 15.3 1.5 13.8
Philippines1950 ........................ 11.2 1.1 10.01958 ........................ 11.4 0.9 10.5
Thailand1950 ........................ 10.81958 ............................ 14.2 2.1 12.1
Source: See the explanatory note, page 63.a Including inventory changes: + 1.2 per cent of gross national
expenditure in 1951 and + 0.4 per cent in 1958. b The concept of national income differs in m ainland China
from the one commonly used in private enterprise economies. It refers to material production only, and excludes economic activities not contributing directly to material production such as public administration and defence and personal and profes-sional services. T he estimates refer to net national income or product; they have been obtained indirectly by applying indices for the period 1950-1957 given on page 20 in the Ten Great Years (issued by the State Statistical Bureau and published by the Foreign Language Press, Peking 1960) to the official figures given by Li Fu-chun, C hairm an of the State Planning Com -mission, on page 37 of 10 October 1959 issue of the R ed Flag (in Chinese). According to the latter, national income in 1957 was given a t 32.2 billion yuan above that in 1952 and, in 1958, a t 32.3 billion yuan above that in 1957; calculated on the above basis, it would w ork out a t 92.9 billion yuan in 1957 and 125.2 billion yuan in 1958.
c Including transfer payments.d Excluding capital transfers, figures for which are not available. e N et national expenditure.f Expenditure includes net payments of state trading schemes;
net receipts are included under revenue.
13.4a 26.7a
16.119.5
16.2c32.7c
25.030.6
8.314.0
16.2c19.7c
15.819.3
10.4 18.2
9.313.8
10.010.5
10. 8c12.1
N e t c la im o f th e p u b l ic
sec to r
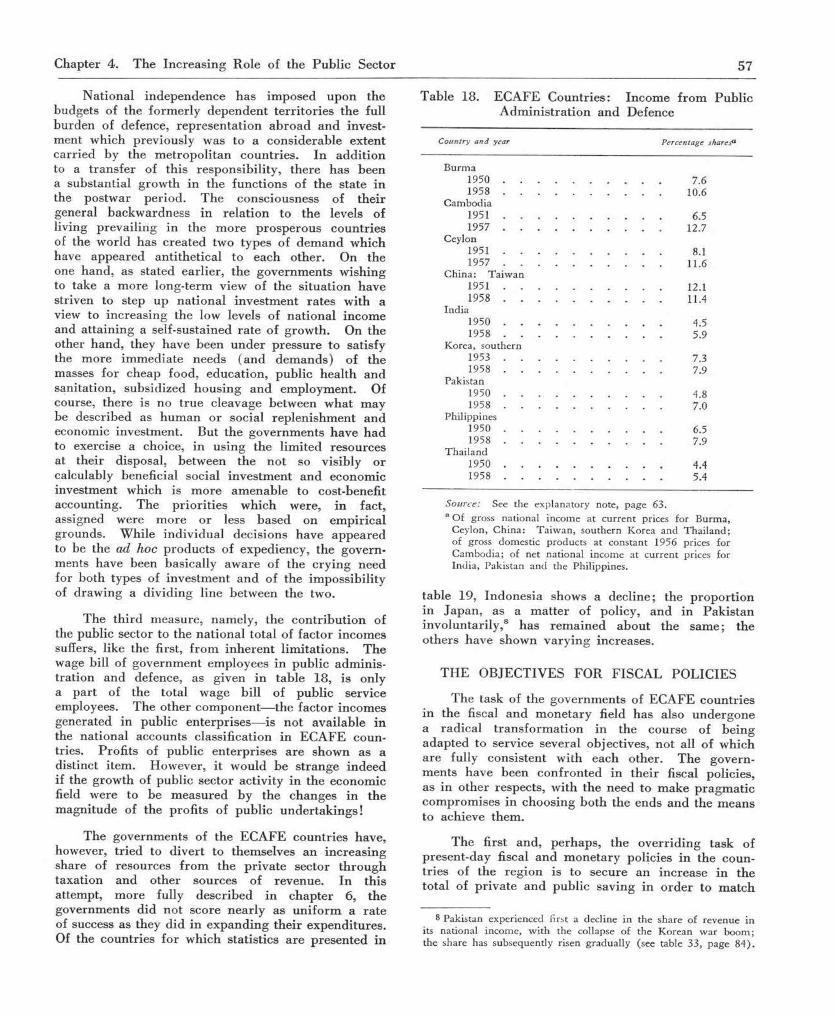
Chapter 4. The Increasing Role of the Public Sector 57
National independence has imposed upon the budgets of the formerly dependent territories the full burden of defence, representation abroad and invest-ment which previously was to a considerable extent carried by the metropolitan countries. In addition to a transfer of this responsibility, there has been a substantial growth in the functions of the state in the postwar period. The consciousness of their general backwardness in relation to the levels of living prevailing in the more prosperous countries of the world has created two types of demand which have appeared antithetical to each other. On the one hand, as stated earlier, the governments wishing to take a more long-term view of the situation have striven to step up national investment rates with a view to increasing the low levels of national income and attaining a self-sustained rate of growth. On the other hand, they have been under pressure to satisfy the more immediate needs (and demands) of the masses for cheap food, education, public health and sanitation, subsidized housing and employment. Of course, there is no true cleavage between what may be described as human or social replenishment and economic investment. But the governments have had to exercise a choice, in using the limited resources at their disposal, between the not so visibly or calculably beneficial social investment and economic investment which is more amenable to cost-benefit accounting. The priorities which were, in fact, assigned were more or less based on empirical grounds. While individual decisions have appeared to be the ad hoc products of expediency, the govern-ments have been basically aware of the crying need for both types of investment and of the impossibility of drawing a dividing line between the two.
The third measure, namely, the contribution of the public sector to the national total of factor incomes suffers, like the first, from inherent limitations. The wage bill of government employees in public adm inis-tration and defence, as given in table 18, is only a part of the total wage bill of public service employees. The other component— the factor incomes generated in public enterprises— is not available in the national accounts classification in ECAFE coun-tries. Profits of public enterprises are shown as a distinct item. However, it would be strange indeed if the growth of public sector activity in the economic field were to be measured by the changes in the magnitude of the profits of public undertakings!
The governments of the ECAFE countries have, however, tried to divert to themselves an increasing share of resources from the private sector through taxation and other sources of revenue. In this attempt, more fully described in chapter 6, the governments did not score nearly as uniform a rate of success as they did in expanding their expenditures. Of the countries for which statistics are presented in
Table 18. ECAFE Countries: Income from Public Adm inistration and Defence
C ountry and year Percentage sharesa
B u rm a1950 ...................................... ....................... 7.61958 ...................................... . . . . 10.6
C am bod ia1 9 5 1 ...................................... . . . . 6. 51957 ...................................... . . . . 12.7
Ceylon1 9 5 1 ...................................... . . . . 8.11957 ...................................... . . . . 11.6
C h in a : T a iw a n1 9 5 1 ...................................... . . . . 12.11958 ...................................... . . . . 11.4
Ind ia1950 ...................................... . . . . 4. 51958 ...................................... . . . . 5. 9
Korea, sou thern1953 ...................................... . . . . 7.31958 ...................................... . . . . 7.9
Pakistan1950 ...................................... . . . . 4.81958 ...................................... . . . . 7. 0
Philippines1950 ...................................... . . . . 6. 51958 ...................................... . . . . 7.9
T h a ilan d1950 ...................................... . . . . 4.41958 ...................................... . . . . 5. 4
Source: See the exp lanatory note, p age 63. a O f gross na tional incom e a t cu rre n t prices for Burm a,
Ceylon, C h in a : T a iw a n , sou the rn K orea an d T h a i la n d ; of gross dom estic p roducts a t constan t 1956 prices for C am bod ia ; of ne t national incom e a t c u rre n t prices for Ind ia , Pak istan an d the Philippines.
table 19, Indonesia shows a decline; the proportion in Japan, as a m atter of policy, and in Pakistan involuntarily,8 has remained about the same; the others have shown varying increases.
THE OBJECTIVES FOR FISCAL POLICIES
The task of the governments of ECAFE countries in the fiscal and monetary field has also undergone a radical transform ation in the course of being adapted to service several objectives, not all of which are fully consistent with each other. The govern-ments have been confronted in their fiscal policies, as in other respects, with the need to make pragmatic compromises in choosing both the ends and the means to achieve them.
The first and, perhaps, the overriding task of present-day fiscal and monetary policies in the coun-tries of the region is to secure an increase in the total of private and public saving in order to match
8 Pak istan experienced first a decline in the sha re o f revenue in its na tional incom e, w ith the collapse of the K orean w a r b oom ; the share has subsequen tly risen g rad u a lly (see table 33, p age 8 4 ) .

58 P a r t I I . Pub lic F inance in the Postw ar Period
T able 19. E C A FE C ountries: G overnm ent D ra ft on the P riv a te Sector
( P e r cen t o f g ross n ation a l p ro d u c t)
C o u n tr y a n d yearT o ta l
r e v e n u e
C u r r e n ttra n s fe r
p a y m e n ts
N e t tra n s fe r re c e ip ts on
c u r re n t a c c o u n t
Burma1951 . . . . 14.8 1.7 13.11958 . . . . 19.1 1.5 17.6
Ceylon1950 . . . . 15.4 3.3 12.11958 . . . . 22.8 6.1 16.7
China: mainland a ,b1950 . . . 15.3 15.3c1958 . . . 33.4 33.4cTaiwan1951 . . . 17.8 0.4 17.41958 . . . 21.9 0.6 21.3
Indiab1950 . . . . 8.4 1.0 7.41957 . . . . 10.5 1.9 8.6
Indonesia1951 . . . . 15.7 15.7c1958 . . . . 13.0 13.0c
Japan1950 . . . . 22.9 3.9 19.01958 . . . . 22.2 5.0 17.2
Korea, southern1953 . . . . 7.1 0.6 6.41958 . . . . 12.7 1.7 11.0
Pakistanb, d1950 . . . . 10.8 0.4 10.41958 . . . . 10.6 1.5 9.1
Philippines1950 . . . . 7.7 0.7 7.01958 . . . . 11.1 0.8 10.3
Thailand1950 . . . . 8.9 8.9c1958 . . . . 11.8 2.1 9.7
Source: See the explanatory note, page 63.a See footnote b of table b Net national product.
17 on page 56.
c Including current transfer payments.d See footnote f of table 17 on page 56.
the total of p rivate and public investm ent. If this objective is achieved, m onetary dem and fo r cu rren t expenditure, outside of the non-m onetized sector, will be controlled or regu la ted to m atch the supplies available. The grow th of the econom y can then take place u nder conditions of p rice stability .
In add ition to the rise in n a tiona l investm ent, h igher outlays a re incu rred by governm ents in the countries of the reg ion in a ttem pting to m eet the ir com m itm ents fo r cu rren t expenditures. I t m ay th e re -fore be of som e help if we can use a new concept, nam ely, aggregate non-consum ption9 to take into account the m agnitude no t only of n a tiona l investm ent bu t also of the cu rren t governm ent expenditure . In this connexion, the lite ra tu re on p lann ing in centrally p lanned econom ies suggests a parallel. Since, in
9 See the exp lanatory no te a t the end of this chap ter , p p . 63-64.
these econom ies, p ractically all investm ent is assum ed to be centralized in the public sector, governm ent revenue is budgeted to cover cu rren t governm ent requ irem ents plus na tiona l investm ent. T he govern-m ent secures th is “ non-saleable ou tpu t” directly from the na tiona l productive appara tus u nder its control. T he balance, know n as “ saleable ou tpu t” , is sold for personal consum ption at prices w hich would roughly equate its value w ith the m oney incom es p a id out as wages. If the state, a t a given m om ent, has an increased volum e of goods fo r the p rivate sector, it e ither ra ises wages or lowers prices of the saleable output. If there is less to go round , wages generally are no t low ered; prices are ra ised o r goods are ra tio n ed ; d istribu tive channels are clogged w ith short stocks and long queues. T he p riva te enterprise (or m ixed) econom ies are also in terested in m ain ta in ing a stable price level; the m onetary dem and in the p riva te sector fo r consum er goods an d services— the saleable ou tpu t of centrally p lanned economies— should m atch the available supply of these a t the curren tly p revailing prices.
The rise, shown in tab le 20, in the national p ro p o rtio n of spending on non-consum ption has crea ted p ressures of excess-dem and on consum ption outpu t in a lm ost all countries of the reg ion in the postw ar period . T he task of w ithdraw ing from total m oney incom es a percentage to equal non-consum ption outlays, has h a d to be shared between the private and the public sector. In m ost countries, Japan being a no tab le exception, the real savers in the private sector are businesses and not households. Business sav ing is com posed of funds re ta in ed in business for depreciation and investm ent. In A sian economies, econom ic activity is mostly organized on the basis of ind iv idual ow nership of small units. Peasant fa rm ing o r shopkeeping p redom inates in the economic struc ture . T he business saving of th is sector, over an d above w hat the fa rm ers o r shopow ners spend on m ain ta in ing the ir m eagre equipm ent, can hard ly be d istinguished from personal o r household saving. O rganized business, while grow ing, rem ains sm all; even in a relatively m ore industria lized country like Ind ia , ne t value added by th is sector was only 13 p e r cent of the net na tiona l p ro d u c t in 1957. P riva te sector saving, as a result, has rem ained small. It is upon the public sector, therefore , th a t the m a jo r task has fallen of low ering the p ro p ortio n of outlays on p rivate consum ption to the level which would equate it w ith the p ro p o rtio n of resources available for it in the economy.
It does no t quite follow th a t the need to lower the n a tiona l aggregate ra te of p riva te o r personal consum ption outlays necessarily calls fo r a decline in the cu rren t levels of consum ption in practice. The prob lem has, however, often been presented in a way w hich would seem to im ply th a t the under-

Chapter 4. The Increasing Role of the Public Sector 59
Table 20. ECAFE Countries: Allocation of Gross National Product(Per cent)
D om estic sector Foreign sector
C ountry a nd yearN on-consum ption Consum ption
G overnm ent current outlaya
G overnm entcapitaloutlaya
Privateinvestm en t
outlayTotal
Privateconsum ption
outlay
N e t exports o f good and
servicesb
Burma1 9 5 1 ................................. . . 8 5 8 21 73 61958 ................................. . . 16 10 12 38 68 -6
Ceylon1950 ................................. . . 10 6 3 19 76 51958 .................................
China: m ainlandc’ d . .11 8 4 23 80 -3
1950 ................... . . 14 3e1958 ................... . . 16 21 e — 37 63Taiw an1951 ................... . . 17 8 14 39 66 -51958 ................... . . 20 11 7 38 69 -7
Indiad1950 ................................. . . 5 3e 2e 10 90 _
1958 ................................. . . 7 7e 17 86 - 3Indonesia
1 9 5 1 ................................. . . 13 3 7 23 75 21958 ................................. . . 18 2 3 23 76 1
Japan1950 ................................. 11 5 21 37 61 21957 ................................. . . 10 9 23 42 59 -1
Korea, southern1953 ................................. . . 9 1 11 21 87 -81958 ................................. . . 14 4 9 27 82 - 9
Pakistand1950 ................................. . . 7 2 -11958 ................................. . . 9 5 -2
Philippines1950 ................................. . . 7 3 6 16 83 11958 ................................. . . 8 2 8 18 84 -2
Thailand1950 ................................. . . 9f 2f 51958 ................................. 9 3 -2
Source: See the explanatory note, page 63.a N et claim of the public sector; excluding transfer payments but including inventories. b Negative sign indicates net imports.c See footnote b of table 17 on page 56. Government current outlays refer to the state
budget only, and exclude the lowest level local government outlays on which no in-formation is available. Government investment includes also the outlays m ade outside the state budget, am ounting to 0.3 per cent of net national product in 1950 and 4 per cent in 1958. These outlays outside the state budget are, however, excluded- from all other tables (except table 27 on page 75), since, in other respects, statistical difficul-ties are encountered in going beyond the state budget.
d N et national product. e Net investment.
f Including transfer payments.
developed countries are forced to choose between reducing consumption and reducing investment, that is, if the latter is not to be sacrificed, to undergo a process of what is popularly described as one of “tightening the belt” . This need not be so. At such low levels of national productivity capital inputs — fertilizers, for instance— could be so planned as to result in substantial increases in output in relatively short periods. While a sizable proportion of these increases could be devoted to non-consumption, some share could also be devoted to raising consumption
levels. In other words, increasing national income could provide for both the rise in the levels of living and in the rate of non-consumption.
The postwar period has, in fact, witnessed such a trend in most of the newly developing ECAFE countries, although the situation has been widely divergent in the different countries. Among those experiencing favourable developments have been the countries, or individual sectors, where a rapid ex-pansion in output was secured by a critical injection
60 P art II. Public Finance in the Postwar Period
of some investment. Examples of this are Indian agriculture in the first five-year plan, or the plantation sectors in the economies of Ceylon and the Federation of Malaya. Even some social investments such as the measures taken for m alaria control contributed benefits out of all proportion to the amounts of expenditures involved. For instance, an augmentation of 20 per cent in the area of land available for rice growing in the Philippines has been attributed to the anti-malaria campaign.10 An unfavourable factor, on the other hand, has been the growth in the popula-tion which has been the by-product of the very investments in public health. For instance, the approximately 4 per cent average annual rise in the real national product of Ceylon between 1950 and 1957 was offset by an average annual rate of growth of over 2 per cent in the population.
The financial burden on the government, however, can be lightened if saving can be secured directly in non-monetary terms, in forms such as a physical levy on product or unpaid labour for investment projects. The centrally planned economies practise this method to an extent which makes their fiscal policies look somewhat insignificant; the wage bill remains lower than the value of total output to the extent that saleable output is lower than the total. Several of the private enterprise economies have also attempted to raise savings, in the context of their community development programmes, through unpaid services for public works of social or community benefit. The contribution of such services to the total of savings has, however, remained small.
The burden could also have been lightened if the governments of the private enterprise economies of the region could themselves have practised restraint in non-developmental expenditure which they have enjoined on their citizens. True, the governments have succeeded on the whole in raising the rate of private sector transfers to themselves. They have, however, been forced to use up a substantial p ropor-tion of resources so obtained for non-developmental requirements and retransfers to the private sector in the form of consumer subsidies, losses on public undertakings, and other expenditures of a redistri-butive character. If government saving could be defined as the excess of revenue over the total of non-investment expenditure (transfer payments and current expenditure on goods and services), it would emerge that the growth in government saving has fallen fairly short of the growth both in revenues and in the government claim on national product for investment. The shortfall would have been compensated if the governments were effective in
10 Statement by I.C. Fang, Regional Director, a t the m eeting of the Western Pacific Regional Committee of the W orld Health Organization in Manila, August 1960.
inducing the private sector to make a corresponding increase in saving over investment. In fact, their failure to increase public sector saving has been the m ajor cause of inflationary pressures that have plagued several countries of the region in the postwar period.
In addition to the problem of striking an internal balance between non-consumption resources and outlays, the countries of the region have been confronted with the problem of m aintaining a balance between their external receipts and payments. For the newly developing countries, the past growth in their exports has been, and future prospects are, handicapped by the demand and supply conditions affecting prim ary commodities in world markets; imports, in the meanwhile, have grown and are likely to continue growing at a faster pace than exports, in response to rising levels of living and stepped-up rates of investment.11 For these countries, this im-balance is critical for their economic growth, since they remain predominantly dependent on imports for their requirements of capital goods; the slower long-term growth in their exports creates acute problems of import financing. Japan’s economy is also basically dependent on its exports of finished manufactured products to finance its imports of raw materials and intermediate goods needed to keep its production going. The fiscal system of most countries of the region is, therefore, geared to the objective of m aintaining a balance in their external accounts; the importance given to fiscal vis-à-vis other policies, however, varies from country to country. Japan has relied prim arily on credit control and on other weapons of monetary policy; India and Pakistan, on the other hand, have depended on direct import and exchange controls. The instruments of fiscal policy employed to conserve balance of payments have also varied; Indonesia has practised differential exchange rates for exports and imports; Ceylon has levied taxes on merchandise imports.12
The measures employed to restore external balance may, however, be in conflict with the objective of preserving domestic stability. Policies designed to reduce import surpluses or bring about an export surplus, tend to add to inflation by reducing the volume of retained output at the same time as monetary demand is bottled up at home and thus presses on it. In fact, the countries of the region have often see-sawed between domestic inflation and balance of payments crises; in correcting one, they have slipped into the other. The task of remaining solvent in external transactions has required of them
11 See United Nations, Economic Survey o f Asia and the Far East, 1959, chapters 4 and 5.
12 ‘Invisible’ imports and capital transfers in Ceylon are subject to exchange control.

Chapter 4. The Increasing Role of the Public Sector 61
a delicate sense of tim ing and of balancing between the rival claims of internal stability and external balance.
In the perform ance of this task they have been considerably helped by the availability of foreign aid. This special feature of the postwar period is in some ways similar to, bu t in other ways quite distinct from, the prewar investment of the m etro-politan countries. Such saving has been made avail-able to almost all countries of the region largely in the form of institutional or inter-governmental grants and loans. The foreign sector statistics for 1957 or 1958 for all the countries of the region included in table 20, indicate a favourable change in their balance of payments position compared with what it was at the beginning of the ’fifties. The availability of foreign saving has helped the economic situation of the aid-receiving countries in three ways. It has enabled them to call for a smaller reduction in the proportion of resources available for consump-tion; the reduction between 1950 and 1958 was less than the increase in resources devoted to non-consumption to the extent that there was a net increase in goods and services received from abroad. This factor is strikingly illustrated by the statistics for Burma. Secondly, the balance of payments has been helped directly. Thirdly, counterpart receipts from the sale of aid goods have reduced the sum total of money incomes available for spending on consumption.
Among other objectives of the fiscal policies of ECAFE countries, that of restoring short-term stability, or compensatory fiscal policy as it is generally called, is also given a high priority. It consists in the attempt made by governments to adjust their revenues and expenditures in order to counteract the effects of short-term fluctuations in demand resulting from changes in the volume of production or exports, in the terms of trade, or in government or private sector spending. These com-pensatory policies, seeking essentially short-term stability, should be distinguished from the policies designed to raise the proportion of non-consumption outlays in the pursuit of economic growth under conditions of long-term stability. The latter generally operate only in one direction, viz. in the direction of curbing a chronic condition of excess demand, whereas compensatory policies are either anti-infla- tionary or anti-deflationary depending on the situation encountered. While all the countries of the region have practised compensatory fiscal policies to counter-act adverse short-term developments, Japan has assigned such policies a very im portant role. To obtain saving for long-term economic growth, it has depended more on the private sector and monetary policies in view of its well developed financial institutions.
A further aspect of fiscal policies, of great significance in the newly developing countries of the region, consists of the attempts made by the govern-ments to transfer to themselves not only the financial resources that would have otherwise been spent on private consumption but also those which would have been spent on private investment.
The latter are not required for purposes of m aintaining price stability, since stability could have been m aintained if the aggregate withdrawal of potential demand from consumption were to equal the value of resources devoted to non-consumption, irrespective of whether private sector savings were transferred to the public sector or not. It would not much matter for purposes of economic stability if the government financed all its expenditure by printing notes and the private sector its investment by bank credit, provided an equivalent amount of money was just hoarded by the private sector. So long as the hoarding is not brought out for spending, the conditions for m aintaining stability are met.
The governments of the countries of the region, however, attempt to take over, both in loans and in taxation, a part of the saving or potential saving in the private sector with a view to having direct control over the utilization of this saving. On the one hand, they provide a gamut of tax and other incentives to increase private saving in an attempt to raise the aggregate rate of non-consumption. Several of them, however, disapprove of the competition that the private sector sets up with the government in the use of this saving. Except for small personal saving, private sector saving is frequently neither lent to the government nor is it directed to priority projects. Business profits are generally “ploughed back” in the expansion of existing industries; only a very small proportion is available for setting up new industries. Other saving is often used for investments of low priority such as gold imports, luxury housing or consumer durables, or for speculative purchases of land or commodities. Idle money also comes out in bursts of dishoarding if there is the least threat to the price level. Both direct controls and taxation are, therefore, used to divert monetary resources with the intent to lure them away not only from consumption but also from the private sector into the hands of the government to be spent in accordance with the priorities established in the national develop-ment plans or programmes.
Finally, the fiscal systems of the ECAFE coun-tries are permeated with social objectives among which that of reducing inequalities of income and wealth is outstanding. I t can be argued that an increase in inequality raises savings, since the rich save a higher proportion of their incomes than the poor. It need not, however, be taken for granted that all
62 P art II. Public Finance in the Postwar Period
attempts to redistribute incomes and wealth will automatically reduce incentives. Even if monetary saving is reduced, a more egalitarian society may be considered as an augmentation of “hum an capital” resulting in higher productivity and increased output. The rich, on the other hand, may use their higher incomes and wealth in bidding for resources in an effort to increase luxury consumption or inessential or speculative investment. The epitome of this search for equality is progressive taxation of incomes and of commodities consumed by the rich. While pro- gressivity has been defended on economic criteria such as ability to pay, the desire to reduce economic inequalities has been the dominant motive and the more valid justification for it. Some countries have, however, been forced under political pressure to carry the quest for equality to extremes. Income taxes have been made so progressive that they seek to take away 80-90 per cent of marginal incomes in the upper income brackets. Income ceilings have been advocated if not implemented. Such excesses could only encourage tax avoidance and evasion and thereby defeat their very purpose. The general and praise-worthy objective of reducing inequality might be more effectively pursued by exploring methods other than exorbitantly high (and impractical) m arginal rates of income taxation; the disincentive effects, in respect of economic effort or payment of taxes, might be avoided.
On the expenditure side also, excessive zeal for equality has taken the form of subsidization of the economic and social services provided by the state, to the detriment of government (and national) saving, as noted above. The newly won independence has given the vote to a large electorate which, conscious of its political strength and made aware of the social consumption patterns of high-income economies, is demanding similar benefits irrespective of the capacity of the economy to afford them. The vote-conscious legislators have, in their turn, striven constantly to voice concern for the poor in demanding continual increases in public subsidies, at the same time as they have watered down measures to raise revenue from the poor. In doing so, they tend to overlook the possibility that a corresponding reduction in the resources for development might in jure the prospects for economic growth which, in the final event, would benefit the poor more than would most measures aimed at a redistribution of current output. Of course, equality up to a point in their tax and expenditure policies, would strengthen the forces for growth, but, if the promotion of it is carried to the extreme, it may do harm.
Thus, both economic and non-economic con-siderations have governed the expenditure and revenue policies of the governments of the ECAFE countries
in the postwar period. These policies are reviewed respectively in chapters 5 and 6. The final chapter goes beyond the subject of government expenditure and revenue, and reviews the operation of over-all fiscal policies and their impact, deterrent or stimula-ting, on the private sector in bringing its economic behaviour into line with national long-term and short-term objectives. It is in this context of the practical application of these policies that it can be clearly seen how the government of to-day has assumed a role extending far beyond the boundaries of the public sector; it has achieved an influence which is “ all-pervading” . In doing so it has employed both the “direct” and “ indirect” means.
The words “direct” and “ indirect” have been differently used in economic parlance. But the variety of definitions helps to illustrate the several connotations of the government’s role. At least two usages of the term can be distinguished. The first has relevance to the impact of governmental action on the m arket mechanism. “ Direct” actions (or controls) are those which interfere with the market mechanism. These are measures such as rationing and price controls. “ Indirect” measures are those which are inducive in action; instances of such measures are the monetary and fiscal controls. According to a somewhat similar usage, ail physical measures of allocation are called “direct” and all financial measures are described as “indirect” . But the second, and more common, distinction concerns the degree of actual participation by the government. According to this distinction, “direct” means of implementation are those where the governments take upon themselves to do what they want to have done. “ Indirect” means, then, would be those where the governments merely act so as to influence the private sector to do the jobs the governments want to have done. These means would include “all the arsenal of incentives and disincentives intended to induce, to influence and to change the size, shape and composi-tion of the private sector” 13 including physical and price controls designed to that same end. It is this distinction which is of prim ary importance in dis-tinguishing between the size and the role of the public sector. The role of the state in the postwar economic life of the nations of the ECAFE region, or, for that matter, in the other developed or under-developed regions of the world, is much bigger than its size; only in the centrally planned economies do the two tend to merge with each other.
13 U n ited N ations , “D ev elo p m en t Policies an d the M eans for Im p lem en ta tio n of D eve lopm en t P ro g ram m es , w ith special refe r-ence to E C A F E coun tries” , Econom ic Bulletin for Asia and the Far East, Vol. VII, N o . 3, N o v em b er 1956.
Chapter 4. The Increasing Role of the Public Sector 63
EXPLANATORY NOTE ON SOURCES, TIM E REFERENCE AND COVERAGE AND
DEFINITIONS OF TERMS
The statistical m aterial in this study, unless otherwise acknowledged, was compiled by the ECAFE secretariat from national budgets and accounts and publications relating to national income, from the United Nations publications, mainly the Statistical Yearbook 1959 and the Yearbook o f National Accounts Statistics 1959, and from the material supplied by the governments to the secretariat. Unless otherwise stated, figures of expenditure and revenue relate to actual outlays and receipts, rather than to budget or revised estimates. The time reference for national income is calendar years for Cambodia, Ceylon, China (m ainland and T aiw an), the Federation of Malaya (including Singapore up to 1953), Indonesia, southern Korea, the Philippines, Thailand and southern Viet-Nam; and fiscal years, beginning 1 April of the year stated for Hong Kong, India, Japan and Pakistan, and ending 30 September of the year stated for Burma. Budgetary data are for fiscal years as described in the section of Asian Economic Statistics. They refer either to calendar years, or years beginning with 21 March, 1 April or ending with 30 September of the year stated. In the case of countries such as the Philippines, where fiscal years change on 1 July, the statistics, for instance for 1958, when taken from the Budget documents, were the average of those for 1957/58 and 1958/59. Other pro rata adjustments were made in order to take into account fiscal periods which were shorter or longer than twelve months, when the dates of fiscal years were being altered.
The term “government” includes, in addition to the central government, local governments for m ain-land China and state governments for the Federation of Malaya, India and Pakistan; for other countries, only the central governments are included. As far as possible, the accounts of public enterprises are integrated under “government” transactions. The term “government expenditure” includes current and capital transfer payments to the private sector, but excludes, wherever possible, inventory changes; similarly, the term “ government investment” includes expenditure on fixed assets and on capital transfers such as purchase of land and houses and granting of loans and advances (net) but excludes changes in inventories held on general government account or in government enterprises. Following the practice in national income statistics, defence capital outlays are treated as current expenditures. Defence outlays financed by foreign military assistance, unless other-wise stated, are excluded from the coverage of “government expenditure” , since information on the magnitude of such assistance is not available. Total
and defence expenditures thus tend to be understated. The term “ government revenue” includes receipts from taxes, fees from licences granted or economic services provided, profits of government enterprises and income from government assets. It excludes from its coverage the proceeds from domestic borrowing and foreign aid, be it grants, loans or counterpart funds from the sale of aid goods. The term “government deficit” or “budget deficit” is corres-pondingly used to denote an excess of “ government expenditure” over “government revenue” , both defined as above; the term “ government surplus” or “budget surplus” would correspondingly denote an excess of “government revenue” over “ government expendi-ture” . A budget deficit, so defined, need neither be considered undesirable nor inflationary per se; its impact will depend on the method of its financing, the countervailing measures and policies pursued by the government and a number of other factors in the economy. That part of budget deficits, which is financed in such a way as would result in an increase in the money supply with the public, is referred to as “money creation on government account” . Several governments describe this portion of budget deficit as the deficit, or the financing of it as “ deficit financing” .
In the course of discussing fiscal policies, two more terms are used. The term “government saving” , following the practice in national income statistics, refers to an excess of government revenue over its current expenditure, whereas the term “budget deficit” measures the excess of revenue over total— current and capital— expenditure. Correspondingly, a gov-ernment is described as “dissaving” when its revenue falls short of its current expenditure. The second term used in discussing fiscal policies is “non-consumption” in its reference either to national resources or to national outlays. The national net supply of allocable or disposable resources of goods and services (production plus imports, including those received in foreign aid, minus exports) or the national total of outlays, including the value of non-monetary output, is assumed to be allocated to four principal purposes: government current expendi-ture, government investment, private investment and private consumption. For want of a better term ,14 the term ‘non-consumption’ is used to refer to both resources and outlays. It denotes the total of the first three allocations— that is, government current expenditure, government investment and private investment. The negative term thus indicates the sum-total not available for private or personal con-sumption. Such an extension of the investment and saving concepts, traditionally used in economic
14 T h e te rm non-saleable o u tp u t em ployed in th e centrally p lan n ed econom ies is unsu itab le , since the item s covered are, in fact, saleable in p riva te enterprise econom ies.

64 P art II. Public Finance in the Postwar Period
analysis, so as to include the resources claimed by, and money spent as, current government expenditure, facilitates a discussion of fiscal policies. The essen-tial condition for m aintaining price stability, if this usage is adopted, is an equality between the resources devoted to ‘non-consumption’ and the outlays incurred on it. Correspondingly, in the private sector, the supply of goods and services available for ‘consump-tion’ ought to be in balance with consumer spending.
The term ‘consumption’ is confined to the private sector only, although government current expenditure is quite generally described, in national income statistics, as ‘government consumption’. The former
is, however, preferred and the latter avoided in this study since not all the current expenditure of a government is for collective or community consump-tion. A part of the current expenditure, such as that on technical education, research, agricultural extension services, trade promotion, and on most social services, is predominantly investment rather than consumption in character.
A discussion of definitions thus leads us to the problems of classification. These are discussed in chapter 5.15
15 See pages 69-70.

C h a p t e r 5
G O V E R N M E N T EXPENDITURE
The expenditure of public money, reflecting as it does the utilization of resources by and through the government, involves the weighing of alternate means to promote the public good. In framing its budget, a government is obliged to decide how much of the national product shall be devoted to public expenditure and how much shall be left in the hands of individuals. It must decide what share of the total government expenditure shall go to each of the competing demands— education, defence, public in-dustry, administration, and so on. Each of these must be weighed against all of the rest in the light of some conception of the common good, with due allowance for political and other considerations. It is the purpose of this chapter to describe the choice that was actually made in various Asian countries over the last decade or so.
A country’s choice of a pattern of expenditure reflects an interplay of ideology and practical con-siderations. In a country where the political climate favours the welfare state, the government will generally spend more on the social services— educa-tion, health and welfare. Government expenditure on industrial investment will generally be larger in a primarily socialist country than in a country that believes in private enterprise. Nevertheless, the choice in expenditure is governed by a pragmatic approach. The choice of whether or not to spend government money on public health is not unin-fluenced by the presence or absence of an efficient system of private medical care; nor is a government’s decision of whether and where to invest in industry uninfluenced by the pattern of private entrepreneur-ship. It is not intended here to judge between the competing objectives or to assess the evaluation of its needs made by any government. All that is attempted is to show some of the patterns of expenditure and, where possible, to relate these patterns to the situations encountered within the countries.
The analysis of government expenditure in this chapter begins with an examination of the magnitude and the growth of the total expenditure of government. In an analysis of its components, difficulties are experienced owing to the lack of a consistent system of classification of budgetary data. The budgets and accounts are prepared traditionally in terms of administrative departments. In functional terms, the services provided by the government can be broadly
classified as economic services, social services and general services. In respect of economic services, an analysis of public investment is undertaken in view of its crucial importance to economic growth. An ascertainment of the size and growth of public investment precedes a discussion of its distribution between infrastructure, industry and agriculture and of government policies regarding the respective roles of the public and the private sector. Next, con-sideration is given to government expenditure on social services in areas such as education, public health, social welfare and community development, and a distinction is drawn between expenditure on what has been described as “hum an investment” and on “ welfare” measures aimed prim arily at securing a redistribution of incomes. Finally, the trends in government expenditure on general services, mainly those concerned with public administration and defence, are briefly reviewed.
THE VOLUME OF GOVERNMENT EXPENDITURE
An absolute measure of the magnitude of govern-ment expenditure could be obtained by reducing the total of such expenditure expressed in national currencies to some international unit of measurement such as the United States dollar, and by taking into account the differences in the size of the populations affected.
Apart from the unequal coverage of the public sector, which is particularly affected by a lack of uniformity with regard to the inclusion or exclusion of specific public enterprises, such a measurement involves conceptual and statistical pitfalls in the conversion of national units of currency into United States dollars. The current rates of exchange, at which such conversions are usually made, measure the parity between goods exchanged in foreign trade. They are less reliable as a reflection of the respective internal purchasing power of the national currencies. And the bulk of the purchases of national govern-ments— including their wage bills— is made within the countries concerned and not outside. Thus, a rupee in Ceylon, India or Pakistan, or a kyat in Burma, may indicate a higher volume of real resources than 21 cents in the United States.1 There
1 F or a careful s tudy of these prob lem s an d an a t tem p t to tackle them , see M ilton G ilbert an d I rv in g B. Kravis, A n International Comparison o f N ational Products and the Purchasing Power o f Currencies, O rg an iza tio n for E u ro p ean E conom ic Co-opera tion , (Paris, 19 54).

66 P art II. Public Finance in the Postwar Period
are also statistical limitations inherent in the con-version of currencies of countries which operate multiple exchange rates or allow them to fluctuate freely.
We may, however, relate the volume of govern-ment expenditure to the country’s capacity as expressed by its national product. As noted in chapter 4, this also is not free from limitations.
Subject to this reservation, the magnitude of government expenditure in the ECAFE region, excluding m ainland China for the moment, varied between US$10 and US$70 per head, or between 10 and 30 per cent of national product. While the absolute volume stands in sharp contrast with US$300-400 range per head in the prosperous indus-trial nations such as Sweden, the United Kingdom or the United States, most of these industrial countries nevertheless fall within the same category as ECAFE countries in respect of the percentage of the government draft on the total national product.
It is also true within the ECAFE region that the rich countries have the largest absolute amount of government expenditures per head. Japan, with a national income of $300 per capita, spends about $70 on the services provided by the Government, while Burma, with an income of only $45, spends $14 on government. Burma’s per capita national income itself is smaller than the per capita expenditure of Japan’s government sector! (See chart 4 ) .
C h a r t 4
ECAFE Countries: Per C a p i ta Gross N ational Product and Governm ent Expenditure in
United S ta tes Dollars, 1958a
A very different picture emerges when the share of government expenditure in national product is compared with the absolute size of the product, as in chart 5. The chart is difficult to interpret. If anything, it shows that there is no necessary relation-ship between the absolute size of national product and the draft made on it by the public sector. The results appear to be a product of diverse and offsetting influences. They may show countries in different stages of growth: the poorer countries engage in large initial expenditures preparing for a take-off, whereas the richer ones can afford the “luxuries” of collective consumption. It may also mean that, irrespective of the level of national product, some items of expenditure remain more or less fixed. The requirements of the administrative machine and the defence forces, and the need to m aintain an adequate school system or a network of roads— all of these may be in part independent of per capita national income, so that the financial burden entailed becomes inversely related with the level of national income.
The chart also brings out that the higher range — 21 to 30 per cent of the national product— has been reached only by a few countries such as Burma, Ceylon, China: Taiwan, Japan and southern Korea. The share of the government in the national allocable resources of India, Indonesia, Pakistan, the Philip-pines and Thailand, which together accounted for over two-thirds of the population of the region excluding m ainland China, is in the 11-20 per cent range. While the governments of these countries, particularly in India and Pakistan, have endeavoured to play the leading role in the process of economic
C h a r t 5
ECAFE C ountr ies : G overnm ent Expenditure C om pared with Size of Per C ap i ta
Gross N ationa l Product, 1958a
a 1957 for Cambodia and the Federation of Malaya. b Net national product.
a 1957 for Cambodia and the Federation of Malaya. b Net national product.
Government Expenditure Per C ap ita
320
300
280
260
240
220
200
180
160
14 0
120
100 8 0
6 0 40
2 0
Philippines
Indonesia
Korea, southern
Ceylon
ThailandCambodia
China: Taiwan
10 20 30 5 0 6 0 70 8 0 9 0
Federation of Malaya
240
40
Philippines
10 28
IndiabPakistanb
Burma
II
I
II
i
I
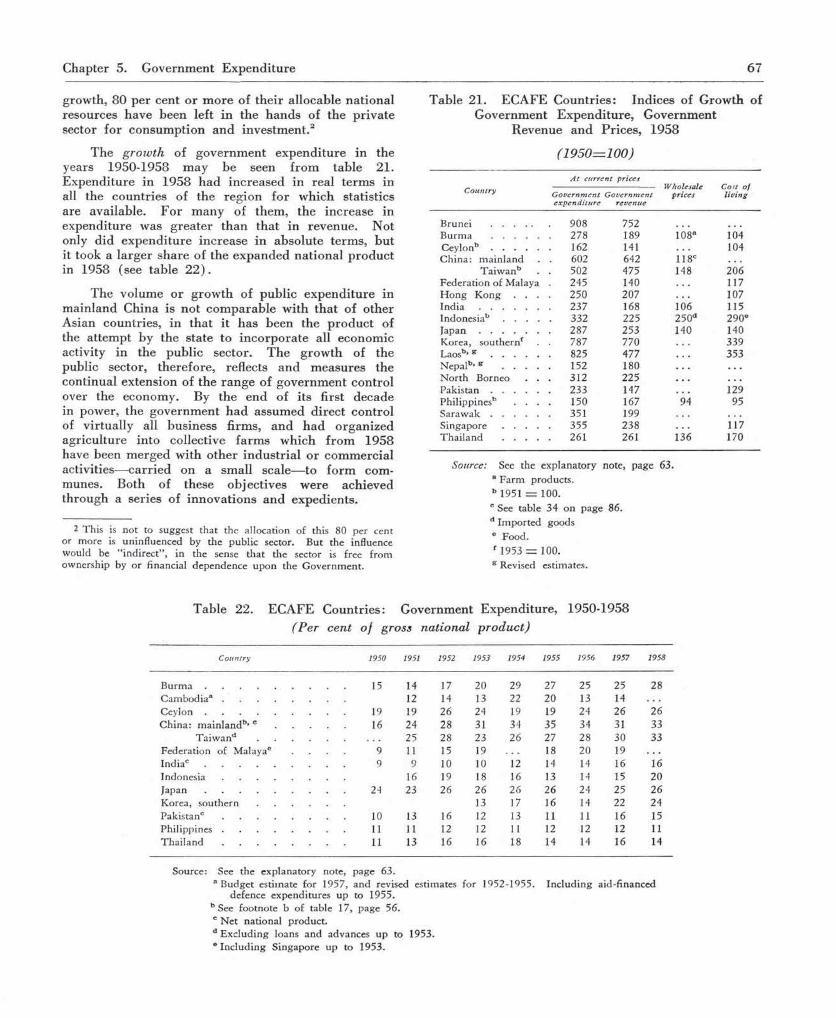
Chapter 5. G overnm ent E xpend itu re 67
growth, 80 per cent o r m ore of th e ir allocable na tional resources have been left in the hands of the private sector fo r consum ption an d investm ent.2
The g ro w th of governm ent expenditu re in the years 1950-1958 m ay be seen fro m table 21. E xpenditure in 1958 h ad increased in real te rm s in all the countries of the reg ion fo r w hich statistics are available. F o r m any of them , the increase in expenditure was g rea te r th an th a t in revenue. Not only d id expend itu re increase in absolute term s, bu t it took a la rger share of the expanded national product in 1958 (see table 2 2 ) .
The volum e or grow th of public expend itu re in m ain land C hina is no t com parab le w ith th a t of o ther Asian countries, in th a t it has been the p ro d u c t of the a ttem pt by the state to inco rp o ra te all econom ic activity in the public sector. T he growth of the public sector, therefore , reflects an d m easures the continual extension of the ran g e of governm ent control over the econom y. By the end of its first decade in power, the governm ent h a d assum ed d irec t contro l of virtually all business firms, an d h ad organized agricu lture into collective fa rm s w hich fro m 1958 have been m erged w ith o ther industr ia l o r com m ercial activities— carr ied on a sm all scale— to fo rm com -munes. Both of these objectives w ere achieved through a series of innovations an d expedients.
2 This is not to suggest that the allocation of this 80 per centor more is uninfluenced by the public sector. But the influencewould be “ indirect” , in the sense that the sector is free fromownership by or financial dependence upon the Government.
Table 21. EC A FE C ountries: Indices of G row th of G overnm ent E xpend itu re , G overnm ent
Revenue an d Prices, 1958
( 1 9 5 0 = 1 0 0 )
C o u n tr y
A t c u r re n t p ricesW h o lesa le
p r ic e sC ost o f l iv in gG o v e r n m e n t
e x p e n d itu r eG o v e r n m e n t
re ve n u e
Brunei ................ 908 752Burma ................... 278 189 108a 104Ceylonb ................... 162 141 104China: m ainland 602 642 118c
Taiw anb 502 475 148 206Federation of Malaya 245 140 117H ong Kong . . . 250 207 107I n d i a ........................ 237 168 106 115Indonesiab . . . . 332 225 250d 290eJ a p a n ........................ 287 253 140 140Korea, southernf 787 770 339Laosb , g ................... 825 477 353Nepalb ,g . . . . 152 180North Borneo . . 312 225P a k i s t a n ................... 233 147 129Philippinesb . . . 150 167 94 95S a r a w a k ................... 351 199Singapore . . . . 355 238 117Thailand . . . . 261 261 136 170
Source: See the explanatory note, page 63. a Farm products. b 1951 = 100. c See table 34 on page 86. d Imported goods e Food. f 1953 = 100.g Revised estimates.
Table 22. EC A FE C ountries: G overnm ent E xpend itu re , 1950-1958 ( P er cen t o f g ross n ation al p ro d u c t)
C o u n tr y 1950 1951 1952 1953 1954 1955 1956 1957 1958
B u r m a ........................................... 15 14 17 20 29 27 25 25 28Cambodiaa ................................... 12 14 13 22 20 13 14C e y l o n ........................................... 19 19 26 24 19 19 24 26 26China: m ainlandb,c 16 24 28 31 34 35 34 31 33
Taiw and . . . . 25 28 23 26 27 28 30 33Federation of Malayae 9 11 15 19 18 20 19Indiac ........................................... 9 9 10 10 12 14 14 16 16I n d o n e s i a .................................... 16 19 18 16 13 14 15 20J a p a n ........................................... 24 23 26 26 26 26 24 25 26Korea, southern . . . . 13 17 16 14 22 24Pakistanc .................................... 10 13 16 12 13 11 11 16 15P h i l ip p in e s .................................... 11 11 12 12 11 12 12 12 11T h a i l a n d ................................... 11 13 16 16 18 14 14 16 14
Source: See the explanatory note, page 63.a Budget estimate for 1957, and revised estimates for 1952-1955. Including aid-financed
defence expenditures up to 1955. b See footnote b of table 17, page 56. c N et national product. d Excluding loans and advances up to 1953.e Including Singapore up to 1953.

68 P art II. Public Finance in the Postwar Period
Broadly speaking, the policy of mainland China towards business firms was implemented in a sequence of steps that enabled the Government to retain the skill of the entrepreneur class during the period when an administrative system was being created to replace it. In the years immediately following the revolution, the state limited its control to “bureaucratic capital-ism”, defined as covering those industries which were already state-owned under the previous regime. The rest of the industry was left in private hands, although considerable assets passed into government hands in the form of fines imposed on the private sector in the course of the “ Five-Anti” campaign3 which was launched in 1952. The state also established new firms and acquired existing firms; it exercised control over the market for the produce of industry. Finally, from 1954, private enterprise was reorganized into “state-capitalist” enterprise, a partnership between private owners and the state, which was the penulti-mate stage before complete nationalization. By 1957, almost all business, even retail trade, that was not entirely state-owned took this form. Officially, this metamorphosis was accomplished through the “ light breeze and gentle ra in” policy of inducing business-men to prove their acceptance of the revolution by voluntarily introducing the changes which might otherwise call for compulsion.
Similarly, agriculture passed from peasant p ro -prietorship to collectives, and then to communes. In the period of reconstruction, the Government limited its activity to reducing indebtedness, expro-priating the landlords and redistributing land to the poorer peasants. Gradually in the early and mid- ’fifties, there was a transition to mutual-aid groups and co-operatives and then to over 700,000 collective farms covering an average of one hundred and sixty families per farm. The collectives still allowed individual peasants to own their houses and small plots of land. Finally in the “ great leap forw ard” of 1958, the collectives were themselves fused into about 26,000 communes with an average of 5,000 families each. The collectivization of agriculture in effect meant the complete proletarianization of the peasant community.
The overriding principle of agricultural policy was to extract the largest possible quantity of resources from the agricultural sector in order to feed an ever-growing num ber of industrial workers and to provide an export surplus to finance capital imports. A system of communes was established to serve this aim in two ways: it was considered particularly amenable to technical change in agri-culture, and suitable for mobilizing the full labour of the agricultural community at a minimum cost to the state. The Chinese land redistribution in
3 A gainst bribery, tax evasion, theft of state assets, chea ting in labour an d m ateria l and the leakage of state econom ic secrets.
the period of reconstruction pulverized the landlord class which was the m ajor source of opposition, without antagonizing the great m ajority of peasants. Subsequent stages of communization, which would have met with strong opposition if introduced pre-cipitously, were then brought about with a minimum of conflict.
The results of the series of measures designed to introduce the socialist pattern of society are clearly brought out in table 23. In the period 1952-1957, the share of the private sector in “national income” fell from 78.7 to 2.8 per cent.
Table 23. Mainland China: Sectoral Shares in National Income, 1952-1957
(Per cent of national incom e)a
Year Sta te-ow ned Co-operative econom y econom yb
Joint state- private
econom yCapitalisteconom y
Indiv idualeconomy
1952 . .. . 19.1 1.5 0.7 6.9 71.81953 . ,. . 23.9 2.5 0.9 7.9 64.81954 . ,. . 26.8 4.8 2.1 5.3 61.01955 . .. . 28.0 14.1 2.8 3.5 51.61956 . .. . 32.2 53.4 7.3 — 7.11957 . .. . 33.2 56.4 7.6 — 2.8
Source: State Statistical B ureau, Ten Great Years, (Foreign L an g u ag e Press, P ek ing 1960) , page 42.
a See footnote b of table 17 on page 56. b F ro m 1955 o n w ard m ost of the “co-operatives” were
transfo rm ed fro m the “ elem entary fo rm ’” (co-opera-tives p ro p e r) to the “ advanced f o rm ” (collectives in f a c t ) .
Indonesia has also witnessed increased state participation in economic activity in the pursuit of the political objective of “ guided democracy” with its corollary of “ guided economy” and the politico- economic policies of nationalization. The sharp increase, however, in the proportion of national product absorbed by the Government in 1958 was the result of higher defence outlays to cope with the rebellion. Nevertheless, faced with a failure to increase revenue in real terms, and forced to practise deficit financing resulting in an inflationary situation, the Government appears to have attempted to let the real wages of its employees slide (although their num bers might have swollen), and contracted the volume of expenditure on investment and on some of its norm al obligations, at the same time as it increased the scope of its other responsibilities.
The growth of public expenditure in the other countries of the region has been a product not only of expansion in the scope of the traditional functions of government but also of the assumption of new responsibilities, which were reviewed in general in chapter 4, and which will be reviewed in detail in this chapter.

Chapter 5. Government Expenditure 69
The growth, of course, has been somewhat uneven over the period. On the whole, it has tended to accompany the growth in national income, although rising a little faster. However, within this general trend, it has shown accelerating or decelerating tendencies which appear to have been generated in response to changes in balance of payments, fiscal revenue, domestic price levels, or, in one or two cases, to the feeling that the government had already overstretched itself in relation to its material and administrative resources. The governments confront-ed with such policy decisions appear to have taken a breathing spell before they resumed their policy of taking an ever larger share of the national product. On the other hand, the unevenness in the share also reflects the sizable fluctuations in gross national product in countries which are prim arily agricultural.
THE CLASSIFICATION OF GOVERNMENT EXPENDITURE
The components of government expenditure are broadly arranged in two systems of classification. Of m ajor importance is the functional classification which illustrates the priorities which governments assign to the financial demands for their various functions or areas of endeavour. This classification sets out the importance, and changes in importance, of the expenditure on economic services, such as those relating to agriculture, industry and commerce, social services, such as health, education and housing, and general services, such as defence, administration and justice. In doing so, it illustrates the government’s assessment of political and social needs and objectives.
The second classification is obtained in the course of outlining the transactions by and through the public sector in the system of national accounts. Here, the m ajor emphasis is on the distinction between current and capital outlays, and between transfer payments to the private sector and payments made to it for goods and services rendered. In achieving their end-products, current outlays leave no assets; they thus yield a set of once-and-for-all services. Capital expenditure, on the other hand, creates new facilities which yield a stream of continuous or recurring services.
Unlike the functional classification, the classi-fication of government expenditure into current and capital transactions and transfer and factor payments — or economic classification, as it is sometimes called -—has no purposive connotations. It does not reflect any value judgements on the part of the governments as to the desirability of one spending agency or one type of expenditures versus the other; current expenditure may be as necessary for the public good
as capital expenditure, or transfer payments to the private sector as relevant as government sector outlays.4
From this point of view, the economic classifica-tion serves a limited purpose; it provides but a link in the chain of economic sector accounts for the entire community. It is in relation to the society or economy as a whole that it is of prime importance to inquire how far the national annual supply of resources was used up to satisfy current wants and what proportion was “saved” or “ invested” to augment the supply at a future date. While the assets created by the community are of cardinal importance for the analysis of its functioning and growth, the increase in the assets of the public sector per se is of less interest. The capital expenditure of the government is not significant for the stream of services that they would provide to the government in the fu ture; it has to be assessed in relation to the growth-productive potential that it creates for the community at large.
The ability to provide for the growth of income for the community is, however, not exclusively confined to capital expenditure, nor is all capital expenditure equally or even truly growth-promoting. In recognition of the latter limitation, national income statisticians prefer to exclude defence capital expendi-ture from the combined capital account of the community. On the other hand, several items of current expenditure, such as technical training or m alaria control, may possess significant growth potential.
Dissatisfied with the definitions of current and capital expenditure, several countries of the region, India and Pakistan in particular, have tended to move away from the durability criterion of classi-fication to the more pertinent one of distinguishing expenditure which may be described as non-relevant and relevant to economic uplift or growth. Since these outlays have been budgeted in the context of economic and social development plans, they have tended to classify government expenditures into developmental and non-developmental outlays. If the various technicalities are ignored, developmental outlays in India include, in addition to investment outlays, the recurrent expenditure made necessary by investment programmes in the plan; construction for general administrative services as well as defence capital outlay, on the other hand, have been excluded.
4 “ W h a t is chiefly of in terest is the econom ic n a tu re of the effects (o n em p lo y m en t an d level of econom ic activity) p roduced by d ifferen t types of g o v e rn m en t transactions an d the ir m ag n itu d e . T h e political an d social purposes involved are, in this context, im m a te r ia l” . A M anual for Economic and Functional Classifica-tion o f G overnm ent Transactions, U n ited N ations (N e w Y ork , 1 958), p .33.

70 P art II. Public Finance in the Postwar Period
In Pakistan, the definition of development expendi-ture has varied in the two five-year plans. In the first plan, it covered not only gross fixed investment, but also recurring and non-recurring costs of all new schemes in the fields of health, village aid and other social services. The definition adopted in the course of the drafting of the second five-year plan was changed so as to exclude recurring costs of schemes with the exception of items such as spending on popularizing, distributing and subsidizing fertilizers, or payments of salaries to agricultural extension workers engaged on schemes specifically included in the plan. The coverage was expanded to include local bodies. In the ten-year plan in Ceylon and the three-year programme of social and economic development in the Philippines, on the other hand, development expenditure is generally defined as total expenditure on economic and social services, irres-pective of whether the outlays are current or capital. This illustrates the complications encountered in basing the analysis of government expenditure on any classificatory scheme.
In the data most readily available, such as in the statistical appendix to the ECAFE Surveys, there is an admixture of functional and economic criteria of classification. First, a distinction is made using the latter criteria in listing all investment as a total irrespective of its functional distribution; the remain-ing outlays are subclassified according to functions or services provided. It has not been possible to work out an economic-functional cross-classification for the several countries and years covered by the analysis in this study.5 If attempted, such a cross-classification would have sought to divide the expendi-ture prim arily under three functions (or areas of government activity) viz. economic services, social services and general services with sub-categories as desired. Each of the functions— and its sub-category — would have been then classified into current and capital outlays, and further subdivided into factor payments or payments for goods and services p u r-chased, and transfer payments to the private sector for consumption or investment. Governmental a t-tempts at a functional-economic reclassification of their budgets and accounts have so far consisted of only a few exploratory studies.6
5 O w in g to the expend itu re of effort involved, only a functional classification for one year w as a ttem pted for n ine countries of the region. See table 28 on page 79.
6 See “ Reclassification of G o v ern m en t E xpend itu res an d Receiptsin Selected C o un tr ies” ( E / C N . 11 /B R W .2 /L .3 ) , subm itted as aw o rk in g paper to the second B udge t Reclassification W ork sh ip held in B angkok in S ep tem ber 1957, an d “D eve lopm en t of B udget Reclassification W o rk in the E C A F E R eg ion” ( E / C N .1 1 /B R W .3 / L .3 ) , subm itted to the th ird W ork sh ip in B angkok in A u g u s t 1960.
The plan of analysis followed in the ensuing pages is, therefore, an expedient to suit statistical convenience.7 It begins with a consideration of aggregate public investment or development outlays. It excludes defence capital outlays as their value to future needs— even for defence purposes— remains uncertain. The development outlays for India and Pakistan also exclude construction for such items as government offices; they include, on the other hand, several items of a current nature. Owing to the varying coverages, inter-country comparisons of public investment are not pressed too far.
The analysis of public investment is aimed at indicating the salient features of efforts of government to respond to its prime concern, viz. the achievement of national economic growth. In the field of economic services, unlike in those of social or general services provided by the government, investment expenditure more nearly represents the achievements of its aims. The limitations in correlating govern-m ent’s public investment with its growth-promoting effort have been outlined above. If, however, the correlation is not over-stretched, the many errors— of commission and of omission— can be ignored and prime attention given to public investment outlays as being of cardinal importance for economic growth — and that for three reasons. First, government activity in the economies of ECAFE countries is significantly directed to the promotion of economic growth; secondly, government capital formation is a substantial proportion of national capital formation; and, finally, a large part of this capital formation accounts for the bulk of its growth-promoting effort. It is true that investment and growth promotion effort, if graphically represented as two superimposed circles, would not both enclose exclusively the same area; however, the area common to both would also be the bulk of the area enclosed by either of them.
The analysis of public investment expenditure is followed by that of government expenditure on social and general services, in terms of aggregate outlays rather than of investment only. Current expenditure, in these fields, is deemed no less significant than capital expenditure for the realization of the desired objectives.
THE SIZE AND GROWTH OF GOVERNMENT INVESTMENT
Three m ajor trends are discernible in govern-ment investment in ECAFE countries in the postwar period, although there are individual exceptions to the trends described and variations among countries
7 T h e “ city-states” o f H o n g K o n g an d S ingapore are excluded f ro m detailed t rea tm en t since a significant p a r t of the ir governm ent outlays is m un ic ipa l in character . M unic ipal outlays, in their tu rn , are only inadequa te ly covered in the d a ta fo r o ther countries.

Chapter 5. Government Expenditure 71
sharing a sim ilar trend. F irst, government investment has claimed an increasing share of the national product, and of national investment. Secondly, the share of investment in total government expenditure (including transfer paym ents) has risen. And finally, several countries show a trend towards a decentraliza-tion in favour of the implementation of government- financed investment by provincial or local govern-ments, public enterprises, or even the private sector.
The countries of the region are all interested in stepping up their growth rates; to that end, they all pursue a policy of raising national rates of investment. The share o f the public sector in the national product and in national investment also went up in the process, as shown in table 24. While total government outlay in most newly developing ECAFE countries, with the notable exception of m ainland China, was within the range of 10-30 per cent of the national product observed in the advanced industrial countries of the world (Japan included), the share of public invest-ment in national capital form ation in the Asian countries (Japan included) was, on the whole, higher. In the western industrial countries, public investment varied between one-fifth to two-fifths of total national investment; in Asia, it ranged from about one-quarter to over two-thirds. M ainland China, with its p rac-tical elimination of private investment, is, of course, on quite a different footing. Public investment policies in Japan have been directed to m aintaining a high rate of growth for the economy as a whole and have been focussed upon areas where private investment is slack in coming forward.
The expansion of public investment in the newly developing countries has been directed largely towards the form ation of economic and social overheads, which is regarded as an essential prerequisite to general economic development. It is interesting to note that, besides being high, the increase in the share of public investment over the years was much greater than, for example, in Latin America. This was so because the need for the types of investment usually undertaken by the public sector loomed larger in Asia than in m any Latin American countries where such investment had already been carried out on an appreciable scale in the first half of the century. Needless to say, dom inant ideologies, political con-siderations and natural endowment, as well as the level of development already attained, played an im portant role in determ ining economic policies, and, within this general fram e— decisions on public sector investment.
Although public investment, during the last decade, kept increasing at a brisk pace in most countries of the region, and often outstripped the rate of expansion of private investment, the trend lacked consistency in some countries; the decline in recent years in Burma reflects im portant changes in economic policy. Indeed, except in the case of m ainland China, which forms a category of its own, a consistent and deliberate drive to increase public investment, to broaden its scope and to rely upon it as the main lever of economic development could be observed only in India. Indonesia, while giving preference to public investment, was afflicted with unsettled condi-tions during the period under review, which prevented effective implementation of government programmes.
Table 24. ECAFE Countries: Government Investment, 1950-1958
Source: See the explanatory note, page 63.a See footnote b table 17, page 56 and footnote c of table 20 on page 59. b N et national product.c Excluding loans and advances up to 1953. d 1951. e Including Singapore up to 1953.f 1957. g 1953.
C ountry
1950
B u rm a ...................................Ceylon ...................................C h in a : m a in la n d a , b . . .
T a iw a n c . . . . Federa tion o f M alayae . . .In d iab ........................................Indonesia ..............................Japan ........................................K orea, so u th e rn . . . .Pak istanb ..............................P h i l i p p i n e s ..............................T h a ilan d ..............................
3.56.32.4
1.92.7
8.8
1.73.22.1
4.05.43.85.22.52.92.7
10.5
3.32.73.8
6.38.4 6.15.8 4.13.02.5
10.3
3.83.13.9
6.17.49.45.44.13.21.9
11.32.93.5 3.03.5
12.05.6
10.26.4
4.4 3.3 9.15.03.02.53.5
12.16.3
11.18.4 2.65.5 2.3
10.35.6 2.12.7 2.6
10.48.3
15.77.3 2.8 6.1 2.0 8.93.8 2.52.82.3
9.57.3
13.69.53.37.11.6
10.28.95.2 2.6 4.7
10.48.4
17.111.2
7.11.7
11.08.04.82.1 3.2
3472
43d386028d5441g
44
4870
1007328f71 37 41 64
26
Per cent of national
in vestm en t
1950 19581958195719561955195419531951 1952
Per cent o f gross national product
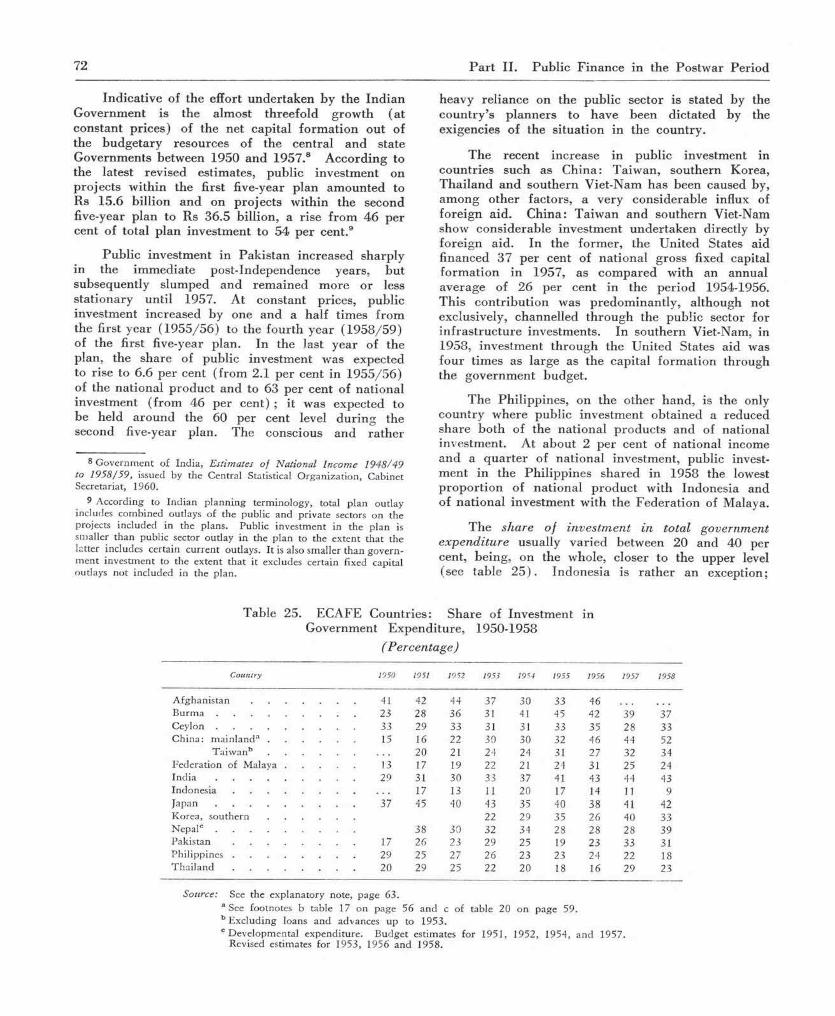
72 P art II. Public Finance in the Postwar Period
Indicative of the effort undertaken by the Indian Government is the almost threefold growth (at constant prices) of the net capital formation out of the budgetary resources of the central and state Governments between 1950 and 1957.8 According to the latest revised estimates, public investment on projects within the first five-year plan amounted to Rs 15.6 billion and on projects within the second five-year plan to Rs 36.5 billion, a rise from 46 per cent of total plan investment to 54 per cent.9
Public investment in Pakistan increased sharply in the immediate post-Independence years, but subsequently slumped and remained more or less stationary until 1957. At constant prices, public investment increased by one and a half times from the first year (1955/56) to the fourth year (1958/59) of the first five-year plan. In the last year of the plan, the share of public investment was expected to rise to 6.6 per cent (from 2.1 per cent in 1955/56) of the national product and to 63 per cent of national investment (from 46 per cent) ; it was expected to be held around the 60 per cent level during the second five-year plan. The conscious and rather
8 G o vernm en t of India , Estimates of National Income 1948/49 to 1958/59, issued by the Central Statistical O rgan iza tion , Cabinet Secretariat, 1960.
9 A ccording to Ind ian p la n n in g term inology, total p lan outlay includes com bined outlays of the public an d private sectors on the projects included in the plans. Public inves tm ent in the p lan is sm aller th an public sector outlay in the p lan to the extent tha t the la tter includes certain cu rren t outlays. I t is also sm aller th an g o vern -m e nt investm ent to the extent tha t it excludes certain fixed capital outlays n o t included in the plan .
heavy reliance on the public sector is stated by the country’s planners to have been dictated by the exigencies of the situation in the country.
The recent increase in public investment in countries such as China: Taiwan, southern Korea, Thailand and southern Viet-Nam has been caused by, among other factors, a very considerable influx of foreign aid. China: Taiwan and southern Viet-Nam show considerable investment undertaken directly by foreign aid. In the former, the United States aid financed 37 per cent of national gross fixed capital formation in 1957, as compared with an annual average of 26 per cent in the period 1954-1956. This contribution was predominantly, although not exclusively, channelled through the public sector for infrastructure investments. In southern Viet-Nam, in 1958, investment through the United States aid was four times as large as the capital formation through the government budget.
The Philippines, on the other hand, is the only country where public investment obtained a reduced share both of the national products and of national investment. At about 2 per cent of national income and a quarter of national investment, public invest-ment in the Philippines shared in 1958 the lowest proportion of national product with Indonesia and of national investment with the Federation of Malaya.
The share o f investment in total government expenditure usually varied between 20 and 40 per cent, being, on the whole, closer to the upper level (see table 25 ). Indonesia is rather an exception;
Table 25. ECAFE Countries: Share of Investment in Government Expenditure, 1950-1958
( Percentage )
Country 1950 1951 1952 1953 1954 1955 1956 1957 1958
A f g h a n i s t a n .............................. . . 41 42 44 37 30 33 46B u r m a ............................................. . . 23 28 36 31 41 45 42 39 37C e y l o n ............................................. . . 33 29 33 31 31 33 35 28 33C hina : m a in la n d a . . . . . . 15 16 22 30 30 32 46 44 52
T a iw a n b . . . . 20 21 24 24 31 27 32 34Federa tion of M alaya . . . 13 17 19 22 21 24 31 25 24I n d i a ............................................. . . 29 31 30 33 37 41 43 44 43I n d o n e s i a ..................................... 17 13 11 20 17 14 11 9J a p a n ............................................. . . 37 45 40 43 35 40 38 41 42K orea, sou thern . . . . 22 29 35 26 40 33N epalc ............................................. 38 30 32 34 28 28 28 39P a k i s t a n ..................................... . . 1 7 26 2 3 29 25 19 23 33 31P h i l i p p i n e s ..................................... . . 29 25 2 7 26 23 23 24 22 18T h a i l a n d ..................................... 20 29 25 22 20 18 16 29 23
Source: See the explanatory note , page 63.a See footnotes b table 17 o n page 56 a n d c o f table 20 on p age 59. b E x c lu d in g loans an d advances u p to 1953.c D eve lopm en ta l expenditu re . B udge t estimates fo r 1951, 1952, 1954, an d 1957.
Revised estimates fo r 1953, 1956 a n d 1958.

Chapter 5. Government Expenditure 73
its budgetary and other difficulties brought investment down to a low level of 9 per cent of total government spending. Other countries nearer the lower limit are the Federation of Malaya, the Philippines and Thai-land, countries which share the outlook that, under their present circumstances as well as in their ultimate development, the private sector could be relied upon to bring about a more efficient utilization of national resources than the public sector.
In mainland China, as the state budget came gradually, through the process of socialization of industry and commerce, to encompass almost the entire national industry and trade (with the exclusion only of small enterprises run by people’s com m unes), the investment component of state expenditure rose. The annual rate of expansion has, however, been uneven. There have been periods (1951-1953, 1955- 1956 and 1958) when it increased over the previous year; these were followed by periods of levelling off (1954) or even decline (1957 and also 1959, when the proportion declined to 51 per cen t). However, over the ten-year period, a high and sustained investment effort has been maintained.
In India, the growth of capital outlays outpaced the growth of current expenditures; a sharp increase took place during 1954-1955. Pakistan raised its investment proportion during 1951-1954, reduced it in the next two years, and raised it sharply again in 1957-1958. In the Philippines, on the other hand, capital formation decreased from one th ird of the government outlay in 1949 and one quarter during 1951-1953 to around a fifth thereafter, in view of budgetary difficulties and in pursuance of the official policy of giving a freer hand to private capital and market forces.
It seems that governmental capital expenditure tends to fluctuate more sharply than current expendi-ture. The latter is less amenable to reduction. Thus, a bad crop or an adverse tu rn in the terms of trade is much more likely to induce a country to go slow in capital outlays rather than to cut down current expenditure. On the other hand, increased public investment often went together with an increase in foreign aid. This need not imply that foreign aid was directly channelled into investment; it is more probable that the influx of foreign aid enabled the countries to devote more of their own resources to capital formation.
It is of some interest to note that a decentral-ization o f public capital outlays, as well as of certain current outlays of a developmental character, has been taking place in several countries. An increasing share of public investment has been undertaken, in countries with a federal structure, by state or p ro-vincial and local authorities. This trend has been
particularly marked in m ainland China and Pakistan, but is also visible in Burma and Thailand. Mainland China’s investment made by local authorities (and a few public enterprises) outside the State Budget increased its share of national product from 0.3 per cent in 1950 to 4 per cent in 1958, whereas investment in the State Budget increased its share from 2 to 17 per cent.10 In Pakistan, from 1956/57 to 1958/59, capital expenditure by the state governments more than doubled, and their share in aggregate government investment rose from 33 to 43 per cent. In Thailand, investment by provincial and municipal authorities went up from 9 per cent of public investment in 1952 to 13 per cent in 1956. In India, however, the shares of plan outlays by the centre and the states have not changed m uch; slightly more than one half of the plan outlays in the public sector is being undertaken by the centre, and somewhat less than one half by the states.
Decentralization of public investment has been even more marked in favour of public enterprises. In mainland China, investment by public enterprises is almost fully included in the state budget. The status and the functions of public enterprises elsewhere vary considerably as between different countries, and even between different time periods within the same countries. Comparisons, therefore, can only be approximate. In China: Taiwan and India, public enterprises accounted for over two-thirds of govern-ment investment in 1958; the share in Burma was about a half, in southern Korea about two-fifths, in Ceylon about a third, in Pakistan about a quarter, and in Thailand about a fifth of government capital outlays.
On the whole, investment by public enterprises or government corporations increased at a consider-ably quicker pace than total public investment or investment by general government. In India, for instance, between 1948/49 and 1956/57, the capital expenditure of an extensive range of government enterprises, such as industrial undertakings, irrigation and power projects, railways, road transport, a ir transport, shipping, etc., rose practically twice as fast as that of general government.11 Similar trends could be observed also in Burma where public enterprises increased their share in total government investment from 34 per cent in 1950 to 55 per cent in 1958; in China: Taiwan, their share went up from 59 to 67 per cent between 1951 and 1958.
A further aspect of investment decentralization is the provision of public capital grants and loans to private industry for investment. In some Latin American countries, such as Mexico, Cuba and
10 See table 20 and footnote c of table 20 on page 59.11 Estimates o f National Income, 1948/59 to 1958/59, op. cit.

74 P art II. Public Finance in the Postwar Period
Ecuador, public loans to private enterprise have reached considerable proportions.12 In Asia, however, such medium-term and long-term loans to the private sector are an im portant feature of public investment only in Japan, in southern Korea and, to a lesser extent, in the Philippines.
In Japan, in the early ’fifties, loans were on the increase because the Government provided a large am ount of working capital to various government credit agencies in order to help them meet an acute shortage of private capital. In 1952-1953, for instance, the total of loans to the private sector was m ore than three times as high as direct investment by the central Government (see table 2 6 ). Sub-sequently, there was an increase in the share of direct investment by government departments, espe-cially in the development of small and medium industries, housing, roads and other public works; the supply of funds to the private sector contracted sharply during 1954-1956, but thereafter experienced an upturn, and during 1957-1959 exceeded the level of 1952-1953, although the 1952-1953 proportion to total investment was not reached. However, the distribution of fiscal investment since 1954 indicates an im portant change. The supply of loans to Japan’s key industries declined, while they increased in the field of foreign trade, small business, housing and economic development of local interest. In brief, the focusing of fiscal funds on general private investment became less im portant; the spotlight remained on areas traditionally less attractive to
Table 26. Japan: Trends in the Volume and Distribution of Central Government
Loans and Investment, 1952-1959(Billion yen ; annual average o f fiscal years)
V olum e and d istribution 1952-1953 1954-1956 1957-1959
Loans to private s e c to r ........................ 159 110 193Key i n d u s t r i e s ................................... 94 27 42Foreign t r a d e ........................................ 3 14 18Sm all an d m ed ium -sized businesses 18 27 63A gricu ltu re , forestry an d fisheries 25 19 23H o u s i n g .................................................. 20 22 36Local d e v e l o p m e n t ......................... — 1 11
Government direct investm ent . . 48 77 154Public w orksa ................................... 2 5 25T ransporta t ion an d
com m unications ......................... 33 33 51Industr ia l d e v e l o p m e n t .................... 12 30 48H o u s i n g .................................................. — 9 30
T o t a l 207 187 347
Source: G o v ern m en t of Japan, E conom ic P lan n in g Agency, Economic Survey o f Japan, 1958/59, p .213.
a M ainly roads.
private capital. As a m atter of fact, the roles have been reversed; the municipal sector in Japan in recent years, has been relying on funds borrowed from the private sector to finance public investment.
In the newly developing countries of the region, with the exception of the Philippines, public lending has increased. Virtually all medium and long-term loans granted to the private sector by the government and government lending agencies, such as the indus-trial or investment finance corporations in India and Pakistan, are for industrial investment. However, as agricultural credit was mostly confined to short-term crop loans, specialized institutional facilities for granting medium and long-term loans have been created in Burma, Pakistan, the Philippines and in several other countries of the region. In India, additional funds have been provided to the co-opera-tive credit societies and to the land mortgage banks both by the Reserve Bank and by the largest commercial bank,13 which was nationalized with the principal objective of extending banking facilities to rural areas.
DISTRIBUTION OF PUBLIC INVESTMENT
The aggregate levels of public investment as well as the distribution patterns thereof have varied from country to country— the differences being attributable to natural endowment, the stage of economic growth and the economic policies pursued. Despite the differences in all these factors, certain features appear more or less common to a num ber of countries. There was, for example, a very rapid growth in demand for infrastructure investment in transport, communications and energy, and considerable invest-ment was undertaken in order to fill the gap between needs and existing capacities. Also, the problem of expanding food supplies and prim ary exports loomed large, and efforts were made to achieve greater production through investment in irrigation facilities, land reclam ation and improvement in agricultural inputs. On the other hand, the stress on public investment in m anufacturing industries varied greatly from country to country, and also over time, during the period under review. In m ainland China, India and Pakistan and, to some extent, in Burma before 1955, public investment assumed a predominant role in the context of broad industrialization programmes. However, only m ainland China and India gave priority to the development of heavy industries. As pressure for investment in economic fields became increasingly felt, a relatively slight decrease in capital outlays for social purposes could be noted in several countries.
12 S e e U n i t e d N a t i o n s , W o r l d E c o n o m i c S u r v e y 1 9 5 9 , p . 8 9 .13 T h e Im peria l B ank of In d ia w h ich has been renam ed the
State B ank of India .

Chapter 5. Government Expenditure 75
Table 27. ECAFE Countries: Distribution of Public Investment, 1950-1959(Per cent o f total investment)
C ountryTransport a nd com -
m unica tions
Construc-tion
A gricu l-ture Industry E nergy H ealth &
education O ther
Burma ........................ . . 30 16a 15 16 15 5b 3Ceylon ........................ . . 22 13 35 3 8 11 8China: m ainlandc . . . . 15 3 9 -------51 ----- 6 16Indiad ............................ . . 32 e 29 13 8 16 2P h i l ip p in e s ................... . . 40 3 22 6 e 15 14T h a i l a n d ........................ 43 9 19 4 8 12 5
Source: For m ainland China: Ten Great Years, op.cit.; for other countries: United Nations, W orld Economic Survey 1959, p .85.
a Including education and health. b Welfare services only.c 1952-1958. Including investment m ade outside the state budget by local authorities
and enterprises. See footnote c of table 20 on page 59. d Spending under development plan rather than actual investment; general administra-
tive construction is not considered part of the development plan.e Included under other heads.
The expenditure on infrastructure has, of neces-sity, been the largest in investment outlays in most government budgets of the region, as in this field private enterprise could be expected to show least initiative, and that for three reasons. First, it requires large outlays in single projects of investment. Laying down a road or a railway line or developing ports may require an amount of capital which, in these countries and in many other countries of the world, would be beyond the capacity of the private sector. Secondly, such outlays need a relatively long time before they start paying off, and even the pay-off is spread over a very long period. Finally, the investment has to be made in projects which, while highly beneficial to the community as a whole, cannot be or should not be operated to yield direct profits. These economic characteristics of infrastructure in-vestment, therefore, makes it suitable only for public initiative. And, since it remains crucial for general economic development, several countries of the region have allocated as much as 40-50 per cent of their investment budgets to projects in the field of trans-portation, communications and energy. Only Ceylon has chosen to devote 30 per cent since the country was rather well endowed with railroad facilities provided during the development by British capital of its plantation crops for exports. While total public investment in Indonesia remained low, a switch appears to have been made in favour of infrastructure investment; the share of power, irrigation and communications rose from 27 per cent in 1956 to 64 per cent in 1958 at the expense of investment in agriculture, industry, m ining and social welfare.
Mainland China, unlike other countries in the region, did not have to adjust its outlays in relation to the private sector. It therefore went into industry
straightaway with about ha lf14 of its total investment outlays. Since the state possesses almost total control over all productive assets, the share of industry in aggregate public investment could be interpreted to mean that the country devoted half of its investment resources to industry, which may not be out of tune with the distribution of investment that can be ex-pected at the stage of development attained.
Of its allocations to industry between 1952 and 1958, m ainland China devoted 85 per cent to heavy industry, and the balance to light industry. The larger allocation to heavy industry seems to be a common feature of economic development in large countries, irrespective of their economic philosophy. Influenced by the existence of vast markets, they have chosen to base their development programmes on considerations of self-sufficiency. There is, there-fore, a preference for the creation of heavy industry which will provide the wherewithal to put up light industries which in turn could provide consumer goods. This preference for roundaboutness, as also the possession of domestic iron ore, led both mainland China and India (the latter in the course of its second five-year plan) to stress steel and machine- building industries.
With the exception of these two countries, the emphasis on public participation in industry has been confined to construction materials or light consumer or producer goods. Investment outlays involving heavy construction activity created a demand and search for locally produced building materials.
14 Including coal m ining and electricity. See also footnote e of table 28 on page 79.

76 P art II. Public Finance in the Postwar Period
Simple consumer or producer goods, often of import- replacement type, were also the favourites, preferably for initiation in the private sector, but, if that was not forthcoming, then in the public sector.
Pakistan had perhaps the most successful ex-perience in getting economic development going, starting with light industries in the public sector. Although industrial investment performance fell short of plan targets owing to balance of payments difficul-ties, the actual results achieved were impressive. In the public sector, the Pakistan Industrial Development Corporation (PID C) established a num ber of indus-trial projects including cotton and jute mills, paper, newsprint and board factories, and plants for the production of fertilizers, DDT, penicillin, dyes, etc. The achievements of the first five-year plan have created a favourable climate for industrial growth; accelerated development is expected during the second plan period.
In their enthusiasm for the public sector, govern-ments have at times been conservative in estimating the pace at which the private sector could implement the task allotted to it in the field of industry. In India, for instance, the private sector exceeded the plan targets both in the first and second five-year plans. Industrial investment in the public sector fell short by 47 per cent of the target in the first five-year plan; the target in the second five-year plan appears likely to be achieved as a result of the Government, confronted with foreign exchange difficulties, imple-menting policies aimed at directing resources to the public sector. As the 1959 ECAFE Survey pointed out, government controls in India in 1958 were tightened up in favour of “core” projects, which were mostly in the public sector. The increased share taken by the public sector both in internal resources— through taxation— and in external resources— through foreign exchange allocation— led to a decrease in the amount of capital that could be raised in capital markets by companies in the private sector15 and a lower share for private imports. Capital investment, involving imports of capital goods, was permitted only if the private sector could itself secure credit facilities abroad for its individual projects.16 In fact, the Government appeared to be content with the substantial performance by the private sector, even though that was lower than the potential m aximum.17
15 G o v ern m en t of Ind ia , Appraisal and Prospects o f the Second Five Year Plan, 1958, p . 64.
16 Pak istan also appears to have fo llow ed a sim ilar policy.17 “All available in fo rm ation suggests th a t the o rgan ized p rivate
sector in industry , m in in g , p lan ta tions, electricity u n der tak ings an d t ran sp o rt o ther th a n railw ays has invested in the first h a lf of the p la n itself as m u c h as it was expected to invest over the w hole o f the P lan p e r io d ” , Reserve Bank, o f India Bulletin, January 1959, “ Som e Reflections on O u r D om estic E co n o m y ,” a ta lk by the G overnor of the Bank.
Burma, China: Taiwan and the Philippines have, on the other hand, chosen to withdraw from public sector participation in industry in favour of private enterprise. In Burma, for instance, public investment had more than doubled between 1953 and 1955, and more than 70 per cent of the additional investment was channelled into industry. However, since 1956, financing and management difficulties, and also a changed emphasis in favour of giving the private sector a chance, restricted public investment in industry to the completion of projects already begun. In fact, between the fiscal years 1956/57 and 1958/59, the share of industry in total public investment was reduced from 12 to 7 per cent. Similarly, in the Philippines, government investment in commerce and industry grew from 16 per cent of the total in 1950 to 31 per cent in 1955, but dwindled thereafter to a mere 3 per cent in 1959. Pakistan is also placing reduced emphasis on public sector investment in industry in its second five-year plan. By the end of M arch 1959, the PIDC had transferred to the private sector 28 out of the 48 “projects” that it had by then completed.
Ceylon, on the other hand, has wavered in its policy on public enterprise with successive changes in its Government. The pre-Independence Govern-ment had inherited, as a legacy from the war, about a dozen small factories designed to replace imports which had been curtailed during the war. It reviewed its industrial policy in 1945, and followed thereafter a policy of directly owning and operating “basic” industries. The mission organized by the Interna-tional Bank for Reconstruction and Development criticized this policy rather harshly.18 Following this criticism, in 1955, the Government adopted the policy that its role should be only that of a sponsoring agency which would make up for the lack of venturesomeness on the part of the private sector in investing in industry. Once the enterprises get off to a good start, the Government should transfer them to private capital. In pursuing this policy, govern-ment investment in industry decreased from 5 per cent of the total in 1947/48 to less than 1 per cent in 1955/56. The emphasis, however, changed again with the advent of a new Government in 1956. The existing state-sponsored government corporations were converted into state industrial corporations. The Government undertook the task not only of “setting up” but also of “carrying on” industrial undertakings.
18 “ W e can n o t escape the conclusion th a t the M inistry of Indus-tries, in ten t on b u ild in g b ig factories of its o w n , has had its atten-tion d iverted f ro m m o re fu n d am en ta l areas of public service such as tra in in g technologists an d skilled w orkers , affo rd ing technical an d o ther a id to existing industries, an d en courag ing enlistm ent of p riva te capital an d energies tow ards deve lopm en t of a sounder p a tte rn of diversified sm all industries w h ich the country needs.” The Economic D evelopm ent o f Ceylon, (Johns H opk ins Press, 1953), p . 514.

Chapter 5. Government Expenditure 77
In consequence, government investment in industry went up again— to 7 per cent of total government investment in 1957/58.
It is agriculture,19 however, that has received the highest priority after transportation and com-munications in the investment plans of many Asian governments. The objectives here were to augment domestic food supplies and prim ary exports. In this field, Ceylon put well over one-third of its public investment effort. While the programmes for deve-loping its export crops with public subsidies yielded considerable dividends, they did not meet with equal success in the m ajor aspect of the public sector effort— the opening up of new land, in the Dry Zone in the north and the east, for colonization and rice cultivation with a view to replacing imports. The projects in this area were not governed prim arily by economic considerations; social welfare, and income and population redistribution, were perhaps the main motives. The economic results achieved were, therefore, not commensurate with the costs incurred.
National self-sufficiency in food, or at least the nearest point to it, was the objective of the agricul-tural investment policy in India and Pakistan also. The first five-year plan of India devoted one th ird of its plan outlay to undertakings (such as irrigation, multiple-purpose river schemes) designed to stimulate agricultural production. Only 5 per cent went to industry. The favourable results achieved at the end of the plan led the planners to believe that they had underestimated the nation’s capacity to increase food production. The food emergency was considered to be over; the sense of urgency was lost. In the second five-year plan, therefore, while the target rate of increase was considerably raised, the emphasis was shifted to industrialization, especially to the develop-ment of heavy industry. The second plan will be ending in M arch 1961, and indications are that the agricultural target will not be hit, although output had increased by 35 per cent between 1949/50 and 1958/59. The proposed outline of the th ird five-year plan, therefore, in raising the food production target still further reassigns a high priority to public investment in agriculture and to factories producing chemical fertilizers.
19 Capital outlays often und eres t im a te the total effort m a d e to increase agricu ltu ra l p roduc tion . A p a r t of the investm en t consists of subsidies g iven to the p rivate sector in o rder to enable it to im prove or increase agricu ltu ra l inpu ts such as fertilizers an d seeds, or of d irect public sector ex p end itu re o n extension services. In bu d g e t classifications of several countries these efforts are classi-fied as c u rre n t expenditures. S im ilarly , even am o n g capital o u t -lays, those on the es tab lishm ent o f fertilizer factories o r on the construction of roads are described as inves tm en t in industry o r transporta tion a lth o u g h such outlays m ay be u n d e r ta k e n w ith the u ltim ate in ten t of increasing agricu ltu ra l p roduction .
Similar changes in emphasis are observable also in Pakistan where, over the five-year period of its first plan, there was practically no increase in agri-cultural production. As a result, the second five-year plan is assigning a higher priority to investment that will raise food production. Even in m ainland China, a trend is visible in recent years towards expanding the share of agriculture in total investment.
Thailand, on the other hand, has been reducing agricultural investment. The country was rewarded with very satisfactory results in terms of production but was confronted with soft export markets for rice; once the projects in hand were completed, it p ro-gressively cut down its investment in agriculture and irrigation from about 40 per cent of the total in 1952 to 15 per cent in 1957. In implementing a policy of general retrenchment, the Philippines, too, having completed several of its projects, sharply cut its spending on the development of agriculture and natural resources from 30 per cent of total capital outlays in 1958 to 22 per cent in 1959.
GOVERNMENT EXPENDITURE ON SOCIAL SERVICES
In the field of social services, the traditional distinction between current and capital expenditure is of limited use; current expenditure is as representa-tive or fruitful of the desired objectives as capital expenditure, perhaps even more so. The investment effort in the area of public health has to be measured not only in terms of hospital buildings put up but also in terms of the provision made for the supply (and train ing) of doctors and nurses and of the expenditure on preventive measures and medicines. Similarly, the provision made for the supply of teachers and text books may be no less important than that made for building schools. In fact, it is possible to save on school buildings through such arrangements as double shifts, as in China: Taiwan, or open a ir schools, as in North Borneo or in some of the states in India. The distinction between current outlays and capital formation loses its point when applied to the expenditure on hum an beings; both can be regarded as investment directed towards quality augmentation or replenishment of human capital.20
20 T h e te rm “ h u m a n in v es tm e n t” is far fro m satisfactory in th a t i t is “ an a tte m p t to incorporate in to the language o f econom ic analysis certa in social activities th a t are not, as a ru le , carried o u t p rim a rily fo r econom ic purposes, a l th o u g h a t the sam e tim e they can have ex trem ely im p o rta n t econom ic effects. Inocu la tion o f ch ild ren agains t polio m ay pay off econom ically, b u t th a t is n o t the p u rpose of the inocu lation . . . E conom ic investm en t criteria a re n o t easy to use in relation to h u m a n in ves tm en t." Econom ic Bulletin fo r Asia and the Far East, D ecem ber 1959, p. 26.
78 P art II. Public Finance in the Postwar Period
There are, however, serious practical difficulties in isolating and evaluating expenditure on social services. In government budgets, this expenditure tends to be dispersed among a variety of departments. A study on social expenditure in India found an underestimation of 50 per cent for central government spending on social services and 20 per cent for the states governments “ owing to the fact that the classification in the budgets is based prim arily on departments rather than on functions or purposes.” 21 Secondly, the outlays have to be evaluated in terms of total national effort, including the activities of non-profit institutions, households and enterprises in the private sector. While government expenditure may predominate in services such as prim ary educa-tion or public health programmes, public and private efforts in most other social services are intertwined to a varying degree. Housing and social welfare activities such as the care of the old and the crippled remain predominantly private sector concerns in most countries of the region. Data on private efforts are, however, extremely difficult to obtain for social services; indicators other than expenditure allocation -—such as numbers of doctors or teachers— have to be used in order to ascertain the volume of national resources devoted to social services and its distribu-tion between the public and the private sectors.
In allocating funds to social services, the govern-ments of the region have often encountered the problem of “choosing” between economic development and social welfare. Historically, it is true that, in the industrial countries, the improvement in economic conditions preceded the advance in social welfare; this does not, however, mean that they cannot go together. In the newly developing countries of Asia, the knowledge of and contact with advanced social welfare schemes in the developed countries, have already created a demand for social services from the masses— conscious of their political strength in coun-tries like Ceylon— at a time when resources are also required for economic development. The mixed feelings of preference for economic expenditure and of reluctant submission to the diversion of resources to social services are explicitly expressed, for instance, by the President of the Philippines in his Budget Message presenting the country’s Five-year (1959- 1963) fiscal plan: “the choice would be to provide more funds for the maximum promotion of economic development and to restrict the expansion of social services until such time as additional funds can be generated from the increase in national income occasioned by agricultural and industrial development.
21 “A n E xplora tory S tudy of Social E xpend itu res in In d ia ,” a p ap er subm itted to the fifth session of the E C A FE W o rk in g Party on E conom ic D eve lopm en t an d P lan n in g . See Economic Bulletin for Asia and the Far East, D ecem ber 1959, p. 34.
However, the m andatory nature of social development expenditures precludes the full adoption of the approach.” 22
Expenditure on social services, however, goes towards the servicing of an essential social need. While finance ministers are, and always will be, confronted with unpleasant choices in having to allocate m arginal expenditure between what appear to be equally good alternatives, they have, on the whole, attempted to achieve a practical and pragmatic compromise which, lacking precise criteria and a better name, is generally described as “a balanced approach to economic and social development.”
In terms of government resources devoted to social services, Ceylon, Japan and the Philippines rank the foremost among the countries of the region. Social services account for 38 per cent of government outlay in Ceylon, 32 per cent in the Philippines and 30 per cent in Japan (see table 28 ). Government outlay, as a whole, accounts for 26 per cent of national product in Ceylon and 25 per cent in Japan; in other words, the public sector expenditure on social services in Ceylon is as high as 10 per cent and in Japan about 8 per cent of the gross national product. Because of the low proportion of Philip-pine government expenditure to national product, the share of government-provided social services in that country comes to less than 4 per cent. These outlays are in addition to private sector outlays which are higher perhaps in Japan than in Ceylon. Reliable estimates are not available, but the total national allocation would be around 15 per cent of the national product in the two countries. This can be contrasted with India or Pakistan. Total social service expendi-ture in these countries took only 16-18 per cent of government expenditure and less than 3 per cent of net national products. If private sector outlay is reckoned at about the same as public sector outlay, the national allocation would be less than 6 per cent or about 40 per cent of the proportion devoted in Ceylon or Japan. Even allowing for the respective differences in internal purchasing power of national currencies and their rates of exchange with each other, expenditure in India and Pakistan on social services in absolute terms (4 United States dollars per head) compares quite unfavourably with the amount spent (19 dollars per head) in Ceylon. Only part of the difference is accounted for by Ceylon’s relatively greater prosperity; to a m ajor extent, the difference expresses a deliberate preference for social services in Ceylon, a country which otherwise is poorer than Japan, but spends roughly the same proportion of its national product and a higher proportion of its public sector outlay on these services.
22 T h e P res iden t’s B udget Message to the F o u rth Congress of the Republic of the Philippines, Second Session, M anila 1959, p. 20.
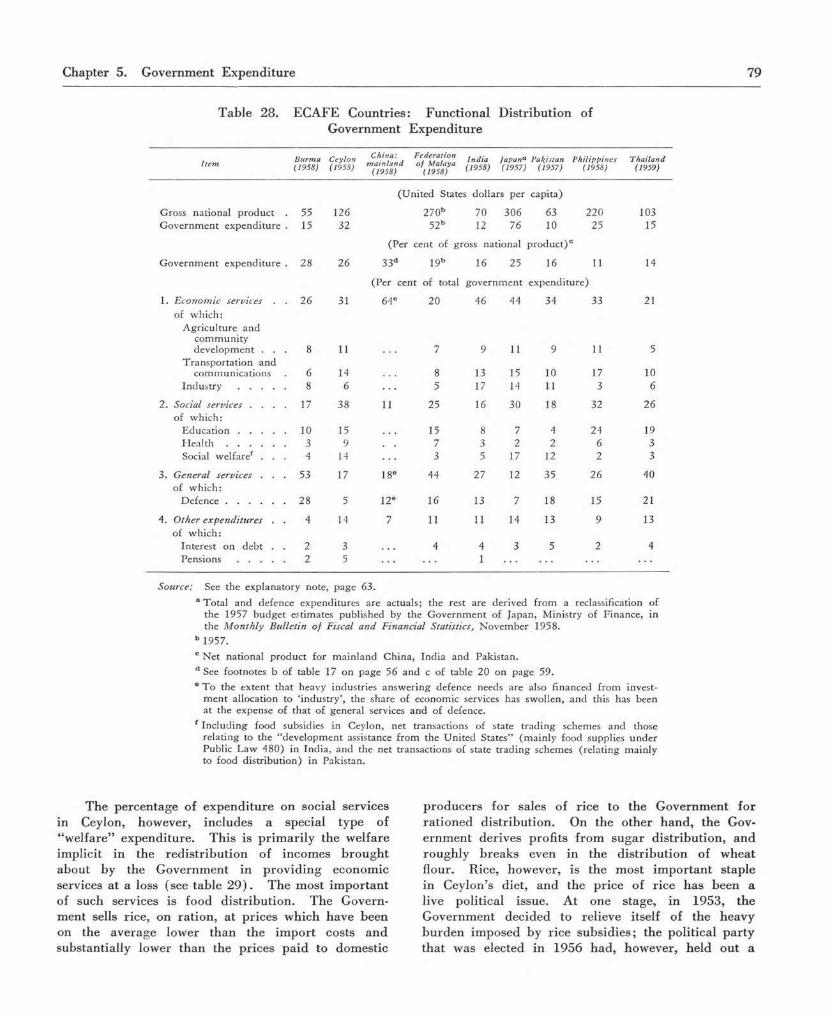
Chapter 5. Government Expenditure 79
Table 28. ECAFE Countries: Functional Distribution of Government Expenditure
I tem Burm a(1958)
Ceylon(1958)
China:m ain land
(1958)
Federation o f Malaya
(1958)
India 1958)
Japana(1957)
Pakistan(1957)
Philippines(1958)
T hailand(1959)
Gross n a tiona l p ro d u c t 55 126
(U n ited States dollars per
270b 70 306
capita)
63 220 103G o v ern m en t expend itu re 15 32 52b 12 76 10 25 15
G o v ern m en t expend itu re 28 26
(Per
33d
cent of gross na tional p ro d u c t)
19b 16 25 16
c
1 1 14
1. Econom ic services . 26 31
(P e r cen t of total g o v e rn m en t expend itu re )
64e 20 46 44 34 33 21of w h ich :
A g ricu ltu re an d c o m m u n ity d ev e lopm en t . . . 8 11 7 9 11 9 11 5
T ra n sp o rta t io n an dcom m unications 6 14 8 13 15 10 17 10
Industry .................... 8 6 5 17 14 11 3 62. Social services . . . . 17 38 11 25 16 30 18 32 26
of w h ich :E d u c a t i o n .................... 10 15 15 8 7 4 24 19H e a l t h ......................... 3 9 7 3 2 2 6 3Social w elfaref . . . 4 14 3 5 17 12 2 3
3. General services . . . 53 17 18e 44 27 12 35 26 40of w h ich :
D e f e n c e ......................... 28 5 12e 16 13 7 18 15 214. Other expenditures . . 4 14 7 11 11 14 13 9 13
of w h ich :In terest o n d eb t . . 2 3 4 4 3 5 2 4Pensions .................... 2 5 1
Source: See the exp lanatory note , page 63.
a T o ta l an d defence expenditu res are actuals; the rest are derived f ro m a reclassification of the 1957 b u d g e t estimates pub lished by the G o v ern m en t of Japan , M inistry of F inance, in the M onthly Bulletin o f Fiscal and Financial Statistics, N o v em b er 1958.
b 1957.
c N e t national p ro d u c t fo r m a in la n d C h ina , Ind ia an d Pakistan .
d See footnotes b of table 17 o n page 56 an d c of table 20 on p age 59.
® T o the ex ten t th a t heavy industries an sw erin g defence needs are also financed fro m invest-m e n t allocation to ‘in d u s try ’, the share of econom ic services has sw ollen, a n d this has been a t the expense of th a t of general services an d of defence.
f In c lu d in g food subsidies in Ceylon, ne t transactions of state t r a d in g schemes a n d those re la t ing to the “ deve lopm en t assistance f ro m the U n ited States” (m a in ly food supplies u n d e r Public L aw 480) in Ind ia , an d the ne t transactions of state t r a d in g schemes (re la t in g m ain ly to food d istr ib u tio n ) in Pakistan.
The percentage of expenditure on social services in Ceylon, however, includes a special type of “welfare” expenditure. This is prim arily the welfare implicit in the redistribution of incomes brought about by the Government in providing economic services at a loss (see table 2 9 ). The most im portant of such services is food distribution. The Govern-ment sells rice, on ration, at prices which have been on the average lower than the im port costs and substantially lower than the prices paid to domestic
producers for sales of rice to the Government for rationed distribution. On the other hand, the Gov-ernment derives profits from sugar distribution, and roughly breaks even in the distribution of wheat flour. Rice, however, is the most im portant staple in Ceylon’s diet, and the price of rice has been a live political issue. At one stage, in 1953, the Government decided to relieve itself of the heavy burden imposed by rice subsidies; the political party that was elected in 1956 had, however, held out a

80 P a rt II. Public Finance in the Postwar Period
Table 29. Ceylon: Distribution of Government Expenditure, 1948-1958
Item 1948 1949 1950 1951 1952 1953 1954 1955 1956 1957 1958
(Indices o f values at constant 1948 prices 1948 = 100)Gross national p ro d u c t . 100 106 125 136 146 144 149 158 149 159 166G o v ern m en t expend itu re . 100 113 115 121 178 163 132 141 169 198 202
(Per cent o f gross nat iona l product)
G o v ern m en t expend itu re . 21 22 19 19 26 24 19 19 24 26 26
(Per cent o f government expenditure)
Econom ic servicesa . . . 29 30 26 27 29 27 28 31 26 23 26Social servicesa . . . . 25 25 27 25 23 26 31 30 29 26 27G eneral services . . . . 12 12 13 13 9 13 15 15 14 14 17Incom e red istribution:
Food subsidies . . . 13 8 4 15 21 11 1 3 7 8 8D irect relief . . . . 3 4 3 3 3 2 2 1 2 3 3Losses on public
u n der tak ings . . . 4 6 5 4 3 6 5 5 4 5 5O th er item sb . . . . 9 8 7 7 6 7 9 9 9 8 11
T o t a l 29 26 19 29 34 26 17 18 22 24 27U nallocablec . . . . 5 7 15 6 5 8 9 6 9 14 3
Source: C om piled f rom the C entral B ank of C eylon: A nnual Report for 1959, (C olom bo, 1960). See also the exp lanatory note , page 63.
a N et of incom e red istribution . b In c lud ing pensions an d interest on public debt. c Inc lu d in g gran ts to local bodies an d financial transactions.
promise to restore these subsidies in its election manifesto. The implementation of this promise by the new Government costs about 8 per cent of total public sector expenditure in the country.23
Ceylon is perhaps an extreme example. It nevertheless illustrates the pressures that are building up in many countries of the region in favour of taking out a larger proportion of the national product in the form of a higher level of living and using up in the process the wherewithal for development. While a good case can be made for giving high priority to expenditure on social services, even in the limited context of aiming at economic growth, the countries of the region would be well advised to keep down to the minimum such redistributive expenditures which favour spendthrift consumption at the expense of development or investment. India
23 In ad d ition to these subsidies, an outlay a m o u n tin g to 5 per cent of total expend itu re is be ing incu rred in covering the op e ra t-in g losses o r g o v e rn m en t enterprises, p rincipally the railw ays an d the n ew ly nationalized bus services. T hese losses are suffered u n d e r pressure f ro m o rgan ized w orkers fo r h ig h e r wages, w hich h av e increased in real term s since 1957, an d f ro m the consum ers for low er prices o f public utility services. E ven the econom ic objectives such as lan d se ttlem ent o r food p roduc tion have been overshadow ed by objectives of incom e red istr ibu tion ; co lonization schemes h ave proved expensive o w in g to the inclusion of elaborate h ousing schem es. T h e rents charged (an d on ly partia lly collected) have been uneconom ic; the m a in tenance b u rd en w hich could have been easily shifted to the tenants continues to rest w ith the G overnm ent.
and Pakistan, on the other hand, have, perhaps, gone to the other extreme in practising economy on social services.
In attempting to expand the scope of social services in their development expenditure, the coun-tries of the region have put emphasis on more or less similar courses of action, although the magnitude of the resources devoted or the time schedules for implementation of the program m es have varied.
In the field of education, the countries have attempted not only to keep pace with the estimated increase in school-age population, but also to increase the proportion of actual enrolment in schools. Most of the plans have looked forward to reaching com-pulsory and universal prim ary education, if not within the current plan periods, at least, in some foreseeable periods beyond them. While progress made in this direction, on the whole, has been satisfactory, the countries have not felt happy at the advance in the provision of facilities for technical training at the high school and university levels. Although the greatest need has been for training foremen and engineers, teachers and doctors, the targets have by no means been reached. For instance, Indonesia’s five-year (1956-1960) development plan envisaged producing 7,775 engineers and technicians and 1,070 doctors; in the three years from 1956 to 1958, only 537 of the former and 249 of the latter had graduated from the country’s science and medical faculties.

Chapter 5. Government Expenditure 81
The development programmes in the field of public health have laid emphasis on environmental sanitation in order to improve health, particularly in rural areas which are altogether lacking in any such facilities. Second in the line of importance, though not necessarily in terms of the volume of expenditure, is the control and eradication of the long-familiar scourges such as malaria, yaws and tuberculosis. Third in the line comes the improvement of existing medical facilities, such as hospitals and medical equipment, and the train ing of doctors, nurses, midwives, etc. The progress in public health, as in education, has been uneven. The disease eradication programme has been an outstanding success; in Ceylon, for instance, the death rate from malaria declined sharply from 2 per thousand in 1946 to 2 per hundred thousand in 1958. The achievement of targets in other fields has been less spectacular and lower than expected.
Other social welfare programmes for public sector expenditure have included provision of housing to low-income groups, resettlement of refugees, rehabilitation of the old, of the physically or mentally handicapped, and of orphaned children. Housing, however, has been a serious competitor to economic projects; the ECAFE region has experienced a critical shortage of construction materials which are required for roads, dams, factory and office buildings as well as for houses. The housing problem is generally the most acute in urban areas; the outlay on housing has been most significant in the two “city-states” of the region— Hong Kong and Singa-pore. The high capital-output ratio in housing has made some countries such as India give a rather low priority to it; others, Ceylon and Pakistan for instance, appear to consider it of m ajor importance. Roughly 20 per cent of the total plan outlay is allocated to housing in the Ten Year Plan of Ceylon, and 13 per cent in the second five-year plan of Pakistan.
In their social and economic development p ro-grammes, most countries of the ECAFE region have placed a great emphasis on rural com m unity develop-ment. This approach rests mainly on the conviction that the organized and effective use of the forces latent in the people can significantly supplement the direct efforts of the governments to promote economic growth, and thus smooth the process of social change implicit in the structural transformation of the traditional rural economy. The earlier programmes leaned heavily on social objectives such as mass education, or the provision of general social ameni-ties, but more recently, as illustrated by the trends in India and Pakistan, community development programmes have been conceived of as relatively long-term programmes with multiple— social, cultural, economic and civic— objectives and a wide range of
means to achieve them. By the end of 1959, sixteen countries were implementing community development programmes with varying emphasis and coverage. The current programmes in Ceylon, China: Taiwan, India and southern Viet-Nam had covered by then more than half of the total num ber of their respective villages24 with outlays ranging from 4 to 6 per cent of total public sector expenditure.
GOVERNMENT EXPENDITURE ON GENERAL SERVICES
The expenditure on general services has been growing, almost in line with the growth in total expenditure. The growth is more marked in the field of public adm inistration; defence outlays have shown irregular movements depending on the security problems encountered and the availability of foreign assistance. Japan and Ceylon, with relatively smaller outlays on defence, spend on general services the lowest proportion among the countries of the region (see table 2 8 ) .25 The expenditure of the rest varies from a quarter to a half.
The reasons for the increase in public adminis-tration outlays have been the increase in population in all countries and, in several of them, in per capita consumption of the administrative services provided by the government. The number of offences investi-gated by the police and the number of civil and criminal cases tried by public courts between 1950 and 1955 in India increased by 16 per cent; the population of the territory administered increased by only half as much. P art of the work of adm inistra-tion has increased through the need to operate diverse controls. Another stream contributing to the volume of administrative outlays has been that of the growing claims for representation abroad, with the increase in the number of embassies, legations, and consulates, and of international conferences at all levels and in all fields. It is, however, difficult to make an assessment of the growth in real terms from the available data on expenditure at current prices (see table 30 ). Prices in the domestic sector would hardly be relevant in any effort to deflate the expenditure incurred primarily outside the countries concerned. There is, however, little doubt about the increase in real terms.
To a certain extent, the growth in the expendi-ture on general administration is out of proportion to the growth in functions. The main constituent of the rise in such spending has been the wage bill in public services. The rates of emoluments in the
24 U n ited N ations , C om m unity Development and Economic Development, (D ecem ber 1 9 60), P a r t I, page 7.
25 M ain land C h in a ’s expenditu res are perhaps u ndersta ted . See foo tno te e of table 28 on p ag e 79.

82 P a r t I I . Public F inance in the Postw ar Period
Table 30. E C A FE C ountries: E xpenditure A llocated to the M inistries of External
o r F ore ign A ffairs in 1958
Source: See the explanatory note, page 63. a 1957 in relation to 1953. b 1955.
civil service have perhaps not gone up in real term s anyw here except in Ceylon; it m ay be th a t num bers have swollen in accordance with P a rk inson ’s law, by which adm in is tra tion continues to grow on its own irrespective of the functions to be perform ed. W ork is created to provide em ploym ent to new en tran ts and p rom otions to those a lready in. The “ law ” appears to be opera ting in this p a r t of the w orld as anyw here else.
Defence outlays, being lim ited to governm ents, ind icate the full na tional allocation of resources to that purpose. Table 32 accordingly presents defence expenditures bo th in re la tion to to tal governm ent expenditure an d to na tional p roduc t. T he year-to- year fluctuations in the p roportion to na tional p roduct need not be exclusively a ttr ib u ted to changing policies; it m ay be th a t the national p roduct is fluctuating m ore sharp ly in response to the changes in conditions affecting p roduction o r exports.
The trend in defence expenditure , on the whole, has been uneven. The whole postw ar period has been one in which several countries of the ECAFE area have been afflicted with the necessity of spending a considerab le p roportion of the ir resources on military outlays. One fac tor m ak ing fo r such outlays is the full assum ption of defence responsibility by the national governm ents from the m etropolitan countries, p articu la rly in C am bodia, Ceylon, the Federation of M alaya, Laos, S ingapore and sou thern Viet-Nam. The countries have also com e to feel relatively more insecure w ith reg a rd to the ir borders. Since the Second W orld W ar ended, several countries of the reg ion have actually been involved in w ar operations in K orea and Viet-Nam. Ind ia and Pakistan were also involved in lim ited a rm ed conflict in the late ’forties. P ara lle l to the w ars across o r over the b o rde rs were the w ars w ithin them . Civil wars or in te rna l rebellions at one tim e or the other have afflicted Burm a, China, the F edera tion of Malaya, Indonesia and the Philippines. Even when military opera tions were concluded, the conflicts were not fully resolved, and the countries have been keeping their m ilita ry expenditure at a fairly h igh level.
T he general feeling of insecurity has led several countries of the region to partic ipa te in jo in t defence a rrangem ents with o ther nations. The statistics of m ilita ry assistance received are no t generally avail-able. It is difficult, too, to ascerta in whether such assistance has reduced the b u rden of national defence, o r increased it by req u ir in g m atching local spending o r follow-up outlays. It is im possible to predict w hether governm ents would or would not have under-taken th e ir defence com m itm ents of the magnitude they d id if foreign assistance were no t available. If we can presum e th a t they w ould have done so in any case, then foreign m ilitary assistance clearly released resources fo r o ther purposes, including the general im provem ent of the levels of living in the countries concerned. Laos provides the extreme exam ple w here defence expenditure, financed p ri-m arily by foreign assistance, has taken a negligible share of the governm ent budget. Foreign military a id spending was also of some economic value to the receiving coun tries; ro ad im provem ent in Thailand is a case in point. On the o ther hand , it is possible th a t countries m ay have increased the allocation of dom estic resources to defence in a ttem pting to match th e ir own spending with foreign m ilitary assistance. C ountries no t accepting such assistance may have also been tem pted to keep up with the ir neighbours in the defence field by o rd e r in g the latest military equipm ent involving heavy obsolescence and by pay ing fo r it in valuable foreign exchange. It is difficult to d isentangle from the m ere budget figures of na tional outlays on defence— w hether rising or falling— the vary ing estim ations of defence needs
C o u n tr yN u m b e r o f
ju d g e m e n ts g iv e n
E x p e n d i tu r e on ju s t ice a n d p o lic e
Cost o f l iv in g
C e y l o n ............................ 103 200 108China: Taiwana . . . 110 266 133Federation of Malaya . 184 117Indiab ............................ 116 143 95Pakistan ........................ 323 129Philippines ................... 172 103S in g a p o r e ........................ 300 117
C o u n tr y I n d e x : 1950 = 100
Burma . . . . 240C e y l o n .......................................... . . . . 334China: Taiwan . . . . . . . . 184aI n d i a .......................................... . . . . 205bI n d o n e s i a ................................... . . . . 252cP a k i s t a n ................................... . . . . 266bP h i l i p p in e s ................................... . . . . 167
Source: See the explanatory note, page 63. a 1957 in relation to 1953. b Only current expenditure. c 1952 = 100.
Table 31. ECAFE C ountries: Indices of the N um ber of Judgm ents Given in Courts,
the Expenditure Incu rred and Cost of L iving in 1958
( 1 9 5 0 = 1 0 0 )

Chapter 5. Government Expenditure 83
Table 32. ECAFE Countries: National Expenditure on Defence, 1950-1958
C ountry 1950 1951 1952 1953 1954 1955 1956 1957 1958
B u r m a .............................. 24 26Per cent of total governm ent e 29 32 29 26
xpenditure27 28 28
C a m b o d iaa .................... 24 30 35 63 45 35 28 25C e y l o n .............................. 1 1 1 3 3 3 3 2 5C h in a : m a in la n d b . . 42 43 26 26 24 24 20 19 12
T a iw a n . . . 42 33 32 38 37 36 34 35Federa tion of M alaya . 2 24 25 23 21 18 15 16 16I n d i a ................................... 20 20 19 19 17 14 13 15 13I n d o n e s i a ......................... 16 19 18 16 13 14 15 20Japan .............................. 12 9 9 9 8 7 7 7 7Korea, so u the rn . . . 48 44 38 37 30 30Laosc .............................. 3 5 3 4Pak istan ......................... 39 36 32 29 26 37 31 18 20P h i l i p p i n e s .................... 15 19 20 18 17 16 14 14 15T h a i l a n d ......................... 13 15 19 18 18 15 14 22 21V ie t-N am c ,d . . . . 69 71 79 73 45
B u r m a .............................. 3.8 3.7Per
5.0cent o f gross national product
6.2 8.3 6.9 6.9 6.8 7.7C a m b o d iaa .................... 2.8 4.2 4.7 13.5 8.8 4.4 4.0C e y l o n .............................. 0.2 0.2 0.3 0.6 0.6 0.5 0.6 0.6 1.1C h in a : m a in la n d e , f . 6.7 10.2 7.2 8.2 7.9 8.3 6.9 5.9 4.0
T a iw a n . . . 10.7 9.0 8.7 10.0 10.0 9.9 10.1 11.5Federa tion of M alaya . 3.3 2.9 3.1In d iae .............................. 1.9 1.9 1.9 1.9 2.1 1.9 1.9 2.4 2.1I n d o n e s i a ......................... 5.0 3.7 4.5 3.8 3.2 3.0 3.6 6.2J a p a n .............................. 2.8 2.1 2.2 2.3 2.2 1.8 1.6 1.8 1.7Korea, so u the rn . . . 6.4 7.5 5.8 5.4 6.7 7.3Pakistan d’ e . . . . 3.8 4.7 5.2 3.5 3.1 3.9 3.4 2.8 3.1P h i l i p p i n e s .................... 1.7 2.1 2.3 2.0 1.9 1.8 1.7 1.7 1.7T h a i l a n d ......................... 1.4 2.0 2.9 2.9 3.1 2.0 1.9 3.6 2.9
Note: D efence expend itu re excludes the vo lum e of fo re ign assistance o n w h ich d a ta are not available. See also the exp lanatory note , page 63.
a See foo tno te a of tab le 22 o n page 67. b See foo tno te e o f tab le 28 o n page 79. c B udge t estimates.d O n ly so u th e rn V ie t-N am f ro m 1956 on ; inc lu d in g outlays financed by foreign aid. e N e t na tional p roduct. f See footnote b of table 17 on page 56.
made from time to time by governments and of the reductions or spurts which were induced by the availability of foreign assistance to them or to their neighbours. Nor is it possible to assess the magnitude of the economic gains which were secured as by-products of military outlays. The fall in the proportion of defence to total government expenditure in some of the countries may only mean that a decreased share was borne by the domestic govern-ment vis-à-vis foreign aid. Similarly, the decline in the share of defence expenditure in m ainland China, in recent years, is apparently the counterpart of the expansion of the government budget resulting from increasing governmental control over the economy. Moreover, a portion of the expenditure on heavy industry is of military significance. The fall is more moderate in relation to the national product; the significant decline in 1958 is again the statistical
corollary of the sharp rise in national income from the “ Great Leap Forw ard” of that year. The rise in Indonesia in 1958 could be explained by the rebellion. Still, on the whole, the rising trend in the proportion of resources devoted to defence outlays seems to have been arrested; the proportion seems to have been stabilized in a num ber of countries at or around the ratios reached in 1955-1956. Although it is an improvement over the previous situation this is not altogether satisfactory. The implication remains that these governments have been forced to increase the volume of their resources devoted to defence in the same proportion as they have increased their outlays on social and economic development. They have not found it possible to allocate a progressively larger proportion of their increasing total expenditure to purposes more creative of human happiness and welfare.

C h a p t e r 6
G O V E R N M E N T REVENUE
The revenue systems in most countries are built up haphazard. In ECAFE countries, they show the influence of historical accidents, emulation of the tax systems of metropolitan or other advanced countries, and the ad hoc responses to the specific situations encountered. However, the criteria by which they were supposed to be judged— such as the Smithian canons of taxation— have themselves undergone a drastic change in the last twenty or thirty years. Many countries have effected considerable changes in their revenue systems to make them more serviceable for the tasks of fiscal policy outlined in chapter 4. They have attempted to use them to increase the long-term ratio of national non-consumption to income, to influence the balance of payments, to channel resources into the public sector so as to give greater control over their utilization, to counteract short-term fluctuations in economic activity and to reduce the large— and may be growing— inequalities of income and wealth. This chapter reviews the salient characteristics of the existing revenue systems in the ECAFE countries, assesses their merits and limitations, and explores the means of enhancing their effectiveness in realizing these objectives. The impact of revenue policies, however, should be evaluated not in isolation, but in conjunction with the expenditure policies reviewed in chapter 5.
THE VOLUME OF GOVERNMENT REVENUE
Undoubtedly, government revenue in the coun-tries of the region grew in volume between 1951 and 1958 (see table 21 on page 6 7 ). The only exception has been Indonesia, where internal disturbances have seriously affected revenue collection by the govern-ment; revenue appears to have fallen in real terms. The growth of revenue elsewhere has, in a majority of cases, been smaller than that in expenditure. Among the few cases where revenue has grown in the same or greater measure than expenditure, the latter continues to be in excess of revenue.
Only a few countries, such as Burma, Ceylon, China (m ainland and T aiw an), the Federation of Malaya and Japan obtain one-sixth or more of their national product in revenue (see table 3 3 ). The proportion is relatively smaller for Japan than for the advanced industrial countries of North America or western Europe. There is considerable disparity even among the poor and newly developing countries. Whereas m ainland China raises one-third, and Burma, Ceylon, China: Taiwan and the Federation of Malaya between one-sixth and a quarter of national income in revenue, the proportion for the rest remains between only 11 and 13 per cent of the national
Table 33. ECAFE Countries: Government Revenue, 1950-1958 (Per cent o f gross national product)
Country 1950 1951 1952 1953 1954 1955 1956 1957 1958
B u r m a ............................ 17 15 17 17 22 23 15 20 19Cambodiaa ................... 11 14 11 14 13 12 12C e y l o n ............................ 15 19 21 20 21 21 25 24 23China: m ainlandb’ d 15 26 29 31 36 35 32 33 33
Taiwan . . . 18 20 17 19 19 20 20 22Federation of Malayac. 12 14 16 15 17 18 17Indiad ............................ 8 9 8 8 9 10 10 11 11I n d o n e s i a ........................ 16 15 16 12 12 13 12 13Japan ............................ 23 22 22 22 22 20 21 22 22Korea, southern . . . 7 9 8 8 11 13Pakistand ........................ 11 13 11 10 8 9 9 10 11P h i l i p p i n e s ................... 8 10 11 10 11 11 10 11 11T h a i l a n d ........................ 9 10 11 12 13 11 12 12 12
Source: See the explanatory note, page 63.a Revised estimate for 1952 and budget estimates for 1953-1957. b See footnote b of table 17 on page 56. c Including Singapore up to 1953. d Net national product.

C hapter 6. G overnm ent Revenue 85
income. Of course, each coun try h as its own specific advantages an d prob lem s; even so, countries with sim ilar types of econom y such as B urm a an d T ha iland or Ceylon an d the Federa tion of M alaya show considerable d isparity in the revenue they raise. Despite In d ia ’s progress in o ther d irections, its fiscal system has rem ained under-developed to the extent that the coun try ranks am ong the lowest in term s of the percentage of revenue collected to its na tional income.
The percentage of na tiona l p roduct ob ta ined by governments as revenue has, on the whole, increased, although the increase in percentage is m uch less strik ing than the increase in the volum e of revenues. However, bo th in m agn itude an d in grow th, the results of the efforts m ade by governm ents to tran sfe r to themselves resources to defray th e ir com m itm ents have lagged beh ind the increase in these com m itm ents. This is no t to m ain ta in th a t revenue ought to strike a balance w ith expenditure . If governm ent revenue does no t rise p a r i passu w ith governm ent expenditure , the difference has to be m ade up by a correspondingly greater rise in p riva te saving than in private investment. Such a rise was obtained, in fact, th rough ‘fo rced’ saving as is reflected in the rise in levels of prices an d cost of liv ing fo r all countries except the Philippines, as show n in table 21 .1 The relative im pact of governm ent deficits on dom estic price levels, and the m easures th ro u g h which the rise in them was sought to be conta ined, will be discussed m ore fully in chap ter 7.
In Japan , the share of governm ent revenue to total na tional incom e has rem ained rem arkab ly stable. This developm ent is the outcom e of two offsetting influences. On the one hand , the Japanese G overn-ment has pursued a policy of con ta inm ent of the public sector from d irect p a rtic ipa tion in the func-tioning of the na tiona l econom y. On the o ther hand , for various reasons, it has no t succeeded in cu rb ing expenditure, which has been c la im ing an increased share of the national p ro d u c t.2 In the field of revenue, however, the G overnm ent has been periodically low ering taxes on personal incom es and corporate profits as inducem ents to the p rivate sector to increase investm ent and exports. Despite these measures, revenue has risen w ith the continued prosperity of the Japanese econom y; some of the com m odity taxes on consum ption goods have b rough t in significant am ounts.
The sharpest rise in governm ent revenue in relation to the national p roduc t took place in m ain land China. F o r a time, considerable revenues were
1 It m ay be no ted that, o w in g to the K orean w ar, the base year 1950 w as itself a year of h ig h prices in several of the countries listed in table 21.
2 See U n ited N ations, Econom ic Bulletin For Asia and the FarEast, Septem ber 1960, p . 29.
ob ta ined by the new G overnm ent from confiscation of dom estic and foreign p rivate assets, collection of back taxes an d im position of fines fo r tax evasion. But, as tim e went on, the socialization of p riva te industria l a n d com m ercial enterprises, reviewed in chap te r 5, becam e the m ore im portan t element. Between 1951 and 1959, to tal revenue grew m ore than fourfo ld , whereas, accord ing to official indices, “ p rices” rem ained s tab le; the share of profits from state en terprises in to tal revenue increased from 24 to 61 per cent. W hile the volum e of ag ricu ltu ra l taxes and in dustr ia l and com m ercial taxes has grown, the ir share has fallen. These taxes are also payable by state en terprises an d by the com m unes. T he paym ents m ade by state en terprises fo r taxes, together w ith the profits t ran sfe rred to revenue, ra ised the to tal con tr ibu tion of these en terprises from 49 per cent of governm ent revenue in 1951 to 92 per cent in 1959.3 Obviously, the state derives m ost of the revenues requ ired d irectly f ro m its contro l over the p roductive a p p a ra tu s ; it has to ra ise revenue from “ o ther sources” to the tune of only abou t 8 per cent of non-consum ption o r non-saleable output, o r 4 per cent of consum ption o r saleable output. No w onder th a t despite the sharp increase in non-consum ption output, the price level in m ain land C hina has rem ained stable since 1951; however, the stability is u n im portan t from an econom ic standpoin t. The question of p rice stability is quite different in a centrally p lanned econom y; p rices are so adm inistered as to equate m oney incom es w ith consum ption or saleable output. P rice stability becomes a problem only if saleable output is to be reduced. If, however, total ou tpu t is increasing, an ever-larger slice of the increase can be taken out as non-saleable ou tpu t w ithout causing undue concern as to the consequences of m one ta ry dem and on the p rice level.
W hile, on the one hand , J ap an has sought to conta in the expansion of the public sector and, on the o ther hand , m a in land C hina has gone all the w ay in the opposite d irection, the rest of the countries of the reg ion— all of them private enterprise economies in v ary ing stages of under-developm ent—- have grapp led in the m iddle g ro u n d w ith the problem s of ra is ing the percentage of na tiona l income collected fo r governm ent revenue. Indonesia has no t succeeded. The progress in m any o ther countries has rem ained unim pressive. T here has been some increase in the percentage of revenue to national income, b u t the figures in table 33 give a p ic tu re of relative stagnation after in itia l spurts ra th e r than one of a con tinu ing growth.
3 Po I-po (the then Finance Minister of the Central People’s G overnm ent): “Report on the 1953 Budget” Ta K u n g Pao (H ong K ong), 18 February 1953; Li Hsien-nien (the present Finance M inister): “Report on 1959 State Accounts and 1960 State Budget” , Peking Review , 5 April 1960.

86 P a r t I I . Public F inance in the Postw ar Period
T able 34. M ain land C hina: G overnm ent Revenue and its C om position, 1950-1959
1950 . . . . 100 100.0 29 . . . 13 121951 . . . . 199 117.9 . . . 24 141952 . . . . 269 118.1 35 15 5 33 121953 . . . . 334 116.6 38 12 5 35 101954 . . . . 402 117.1 34 12 4 38 121955 . . . . 417 117.8 32 11 4 41 121956 . . . . 441 117.2 35 10 4 47 41957 . . . . 476 118.3 36 10 4 46 41958 . . . . 642 118.3 34 8 3 52 31959 . . . . 831 29 6 3 61 1
Sources: Ten Great Years, Peking 1960. T u n g Chi K u n g Tso ( Statistical B ulle tin ), 29 June 1957.Tsai Cheng ( Public F inance), 5 August 1957. Li H sien-nien (Finance Minister): “Report on the Final State Accounts for 1958 and the Draft State Budget for 1959”, Peking Review , 29 April 1959; “Report on the Final State Accounts for 1959 and the Draft State Budget for 1960” , Peking Review , 5 April 1960; “China’s Great Financial Achievements D uring the Past Ten Years”, Peking Review , 24 November 1959. Shen Ping: “Industrial and Commercial Taxation in Recent Ten Years” and Li Shu-teh: “Agricultural Taxation in Recent Ten Years”, both in Great Financial Achievem ents o f the People's Republic o f China in the Past Ten Years, Peking, 1959. State Statistical Bureau’s C om - m unique on the F ulfilm ent of the 1955 Economic Developm ent Plan, Statistical Press, Peking, 1956. Shang Ping: “Prices and People’s Living Standard in China”, Ta K ung Pao, H ong Kong, 1 October 1958.
This stagnation gives some cause fo r concern. How is it tha t the newly developing private en terprise economies of A sia find it difficult to ob ta in p ro -gressively la rger slices of the ir increased incom es for non-consum ption, even assum ing th a t vo lun tary p r i -vate saving has risen p a r i passu w ith governm ent revenue? M ainland C hina has tackled the problem th rough physical contro l over the en tire productive process. Can the private en terprise economies, w ithin the political range of possibilities open to them , adap t the ir fiscal systems and m onetary institu tions in such a way as to im prove the present p roportion of non-consum ption to na tional incom e? Even w ith th e ir built-in flexibility an d p rogression , existing incom e taxes have not con tribu ted to any m ateria l extent to ra ising the p roportion of na tional incom e taken in revenue. How can the fiscal systems be adap ted to m ake them m ore progressive in relation to na tional incom e? Any a ttem pt to answ er the question im m ediately raises the query as to how the rise in na tional incom e gets d istribu ted . In fo rm ation on the subject is m eagre and inadequate . In d ia has begun a fresh search fo r sources of additiona l tax revenue by launch ing an in q u iry to ascerta in who benefited from the grow th in nationa l incom e d u rin g its first two five-year p lans and the spending an d saving pa tte rns of the beneficiaries. P en d in g the availability of m ore dependable in fo rm ation , an attem pt is m ade in the following pages to review, in the light of easily accessible m ateria l, the revenue
structu re of the ECA FE countries, no t only in respect of its past and present function ing bu t also of its potentialities fo r adap ta tion to the p rim e task which the governm ents of the countries have set fo r it, viz. th a t of ra ising the ra tio of non-consum ption in o rd e r to secure a h igh rate of economic grow th under conditions of long-term stability.
TA X ES ON FO R EIG N TRA D E
W ith the exception of Jap an and the “ free” ports of H ong K ong and S ingapore,4 almost all countries of the region depend to a substantial extent fo r the ir revenue on taxation of im ports, exports or foreign exchange and on profits of export monopolies o r m onopolistic d is tribu tion of im ported items. F ore ign trad e is the p redom inan t provider, accounting fo r abou t two-fifths of total revenue or m ore in A fghanistan , B runei,5 Burm a, Ceylon, the Federation of M alaya, Indonesia , Iran , Laos, N orth Borneo, S araw ak and T hailand . A lthough, generally, total revenue is grow ing, the share of revenue from taxes on foreign trade and paym ents is falling in several countries.
4 T he ports are really not “free” for all commodities; excise taxes on gasolene, liquor and tobacco, for instance, are collected at the customs shed.
5 See footnote 14 on page 92.
Y ea r
T o ta lre v e n u e
W h o lesa lep r ic e s
In d ic e s : 1950 = 100I n d u s t r ia l a n d
co m m e rc ia l ta x e s
A g r ic u l tu r a lta x
O th e rta xe s
C o m p o s it io n o f g o v e rn m e n t re ve n u e ( P er ce n t o f to ta l r e ve n u e )
P ro fit o f sta te e n te rp r ise s
a n d serv icesOther

C hapter 6. G overnm ent Revenue 87
T able 35. EC A FE C ountries: T he C om ponents of G overnm ent Revenue (P er cent of total revenue)
Source: See the explanatory note, page 63.a Brunei: royalties from oil; Burma: contributions from the state-managed boards; Cambodia: fees on entries and exits;
Indonesia: taxes on foreign exchange; Iran: 1949/50: oil revenue; 1958/59: oil revenue and monopoly profits; southern Korea: taxes on foreign exchange; Thailand: rice prem ium and profits of the Rice Bureau.
b Charges and fees for services, royalties and rents and other income from property, income from land sales, interest received, etc.
c Included under taxes on internal transactions. d Revised estimates or provisional results. e Including some receipts from excise and turnover taxes. f Budget estimates.
.sesirpretne tnemnrevog fo stiforp dna snoitcasnart lanretni no sexat ”rehto“ rednu dedulcnI gh Including gross receipts of railways.i Including gross receipts of posts and telegraphs and electricity departments.
Profits of government enterprises
Other revenuebCountry Year
Taxes on foreign trade
Importtaxes
Exporttaxes
Other taxesa
Excise and sales
taxes
Taxes on internal transactions
Fiscalmonopolies
Othertaxes
Taxes on income and wealth
Texes on persons
Taxes on companies Land
816
4 2
1411173019 29 1120 17 241415
65
8317
4
4 6 14
8225
87
11h, i 4i
2
c
263
201712191411 10
91112 17 29 29 12 1729
185
137
103
1
1
11510
14 75 5 5 1 1
123
2231
1
67
2810
14224
39
12
---------- 2 1 -----------11
11181829
785 9 3 3
30 2327 40 12 23 34
7 2031 17 21
628
28
114225133
22
464213212250
2
816
17 1018 10
127
23
1020
45
30 30
678 7 3 33 2
2114 7 356347 2 2 356 68 9 7 3 7
1816
5846
1023
96
1314
84
7976
1116
10151714
912
1721
5 46
101510
159
19
2628
77
7
8 10
22
4913
116
10
3522
89
13 25147
Afghanistan . . . .
B r u n e i ........................
B u r m a ........................
C a m b o d ia ...................
C e y l o n ........................
China: Taiwan . .
Federation of Malaya
H ong Kong . . . .
I n d i a ............................
I n d o n e s i a ...................
I r a n ............................
Japan ........................
Korea, southern . .
L a o s ............................
Nepal ........................
North Borneo . . .
P a k i s t a n ...................
Philippines . . . .
S a r a w a k ...................
S in g a p o r e ...................
T h a i l a n d ...................
Viet-Nam, southern .
19511956 1951 1958 1950 1958 1952d 1958f1950 19581951 1958 1950 1958 1950 19581950 19581951 1958 1949f 1958d 1950 19581949 1958 1951f 1958f 1952f 1958d1950 1958 19501957 19501958 1950 1958 1950 1958 1950 1958
1952f 1958f
----------- 3 9 ------------------------3 9 -------------
33
2228
1
33
35303310
-------41e--------4
gg
40341253
7
715
22728
3417
102
131
24 3125 17 14 33 36
168
148
-------2 1 --------— 2 3 -------
4035
2718
-------48 —2 0
16262630
272955
5016
852
46
1268533137
23

88 Part II. Public Finance in the Postwar Period
The attempt by the governments of the countries of the region to restrict the use of foreign exchange only to essential needs has resulted in the curtailing of all imports except those of consumer necessities and of producer goods; both these items are admitted either duty free or with low duty. Imports of all other items are restricted either through import controls or by steep taxes in countries relying on fiscal methods to cut imports. Protective tariffs also restrict imports of goods competing with domestic production. In fact, in many newly developing countries of the region, economic growth is based on a policy of import substitution of consumer goods, causing restrictions to be placed on the imports of several revenue-yielding items such as textiles.
Quite apart from saving foreign exchange and protecting domestic industries, tax rates on relatively less essential consumer imports went up as part of the general attempt to restrict consumer spending and to introduce the principle of progression in the field of indirect taxes. Either the consumer, particularly the rich consumer, stopped spending money on imported amenities or luxuries altogether or else he paid high taxes to the government. However, since the demand for many of these goods, except perhaps for motor-cars,6 is highly price sensitive, the revenues either fell or increased only slightly; restrictive effects were more substantial; to that extent, the government was helped in its attempt to improve the balance of payments position. The outlet of import spending having been plugged, problems arose elsewhere. The incomes which would have been spent on paying for imports and for taxes on imports were left in the hands of consumers for spending on domestically produced goods or for saving. The marginal propensity to save, however, has remained small; the reducton of spending on imports only intensified the bidding for the domestic supply of goods and services. In other words, while the balance of payments position improved, domestic inflationary forces were strengthened.
Several countries of the region also attempted to explore the revenue potentialities of the export trade in primary products. This they have done by means of export duties, by penalty exchange rates on export commodities, or by a government monopoly of export marketing. On an average, taking good and bad years together, revenue collected from all types of taxes on exports formed roughly over a half of the total revenue in Iran, over a third in Indonesia, between a third and a quarter in Burma, Ceylon, the Federation of Malaya and Sarawak, and about
6 T h e d em an d for m otor-cars appears to be less price elastic th a n one w o u ld tend to th in k ; possession of a car has becom e a status sym bol. F o r the h ig h e r priced cars, im ports of w h ich have been restricted in several countries, fantastically h ig h prices are reported to have been offered fo r the few th a t are available.
a fifth in North Borneo and Thailand. The propor-tions, although lower, were still of some significance in China: Taiwan, India and Pakistan.
The revenue from exports is a function of the trade in the primary products of the region, which reveals two special features in the period since the end of the Korean war. First, on the whole, the demand grew only slowly; petroleum is the only notable exception. The supply situation was also far from satisfactory. War damage, unsettled conditions and growing internal demand for food and for raw materials slowed down the increase in export avail-abilities. The second special feature of the export trade in primary products of the ECAFE countries was its tendency to experience sharp fluctuations in volume and prices. The fluctuations were caused on the supply side by domestic factors, and on the demand side by booms or recessions in the primary importing industrial countries.7
The revenue from exports, therefore, has been subject to large fluctuations. In fact, the secondary effects of a change in export conditions influence revenues from other sources as well. Thus, for instance, when the demand for exports is strong, increased export earnings lead to larger imports. Even import controls tend to be relaxed during an export boom, leading to a more than proportionate rise in revenue from import taxes. Export prosperity is also reflected, in course of time, in increased revenue from income taxes and excise and sales taxes.
As a consequence, the revenue system, on the whole, has shown a high and progressive correlation with the movements of foreign trade. And this is a possible explanation for the lack of progressivity of the revenue system in relation to national income. It is predominantly dependent on taxation of foreign trade, and reflects, in large measure, the weakness of the region’s primary export trade in world markets since the end of the Korean war.
Export taxes have, however, achieved consider-able importance as anti-inflationary devices. During the period when export demand for their primary products was extraordinarily strong, the governments of several countries of the region raised the tax rates in order to siphon off excess purchasing power to themselves rather than allow it to go to the private sector and set up an additional demand for locally produced goods and services or imports. The countries used both sliding-scale duties or specific taxes the rates of which were changed by adminis-trative action from time to time. The variation in rates permitted the duties to be lowered when export markets were sluggish. However, as anti-deflationary
7 See United Nations, Economic Survey of Asia and the Ear East1959, chapter 4.

Chapter 6. Government Revenue 89
devices, export taxes are not equallly suitable. The taxes when lowered still act as a drag on exports; at the most, they could be abolished. Very few countries went further and granted export subsidies. The rare instances are the price support measures for jute and cotton in Pakistan, and for copra, sugar and other “weak” commodities in Indonesia.
Several methods, other than straightforward taxation, were tried by countries of the region, which had the effect of taxing (o r subsidizing) imports, exports or exchange transactions. Most of the measures were devised to serve several purposes, among which conserving the balance of payments and preserving domestic stability were the principal ones. Considerations of increasing revenue were often of minor relevance in the initiation and implementation of these measures.
An im portant device for insulating the economy from export fluctuations was the export marketing mechanism adopted in Burma and Thailand in respect of rice, in China: Taiwan in respect of sugar, and in Indonesia in respect of copra. Since these items, in the countries concerned, are of importance to the community as food items in the consumer budget and as sources of producer incomes, the governments sought to maintain domestic price stability by establishing monopoly procurement and insulating the economy from the sharp fluctuations in their prices in export markets. The experiment with rice marketing secured substantial revenues to the Govern-ments of Burma and Thailand, since world prices of rice remained well above the domestic prices paid to the rice growers.
The revenue collected from exports in Burma reached its peak between 1952/53 and 1954/55 when it provided about half of the total revenue. The State Agricultural M arketing Board in Burma (SAMB), which has a monoply of rice exports, made a direct purchase of paddy from the producers, or rice from the mills, at a price which remained unchanged from 1948 to 1955/56. As the export price of rice went on rising, the profits of the SAMB rose from about 28 per cent of the export price of rice in 1947/48 to 47 per cent in 1952/53. Since then, it has fallen, resulting in lower profits for the SAMB per ton of rice exported. The SAMB pays income taxes on its profits and makes an additional direct contribution to government revenue from the balance.
The rice marketing monopoly in Thailand was less strict than in Burma. Thailand, unlike Burma, used a combination of multiple exchange rates, flexible export duties, and exports on government account. The procurement operations of the Govern-ment’s Rice Bureau were not as effective as in Burm a;
in order to induce deliveries, the Government began giving up the monopoly; it allowed a certain proportion of private exports of rice if the exporter delivered the balance to the Rice Bureau. The private exporter was also allowed to retain and sell on the free market the foreign exchange earned on his export volume to the extent that the prices received by him were higher than the government-to-government contract prices. On the other hand, a charge— the so-called premium— was made when the private exporter obtained his export licence. In other words, the system contained government procurement and sale at profit, private exporter procurement and sale at two rates of profit— one consisting of the difference between his cost and the government-to-government contract price converted in baht at official exchange rates, and the other of the difference between his sale price and the government-to-government contract price converted at free market exchange rates— and a system of export duties on private exports. The Government relinquished its rice monopoly in 1955, and the trade was turned over entirely to private merchants under a system of export licensing. The domestic price of rice has since risen; government revenues have fallen.
Similarly the copra monopoly of Indonesia fell through on grounds of procurement difficulties. Unlike the rice monopolies, the Copra Fund of Indonesia operated at a loss during periods, such as 1948-1949, when world copra prices fell below the prices paid to domestic producers. It appears that the Fund encountered difficulties at both ends. When the export prices were above domestic prices, the Fund could not procure supplies; when export prices were below the Fund’s prices, it incurred large losses. The Fund was replaced by a purely marketing co-operative in 1957.
The sugar marketing monopoly of China: Taiwan was caught in the problem of m aintaining a parity between sugar and rice prices, which put it in a financial squeeze, during 1952-1953 prior to the establishment of the International Sugar Agreement in 1954.
The cotton and ju te price support schemes in Pakistan during the post-Korean-war slump were purely anti-deflationary measures. Faced with an adverse export situation which led to a fall in domestic prices below an established “floor” price, government agencies offered to buy up unlimited quantities at the “ floor” prices in an effort to safeguard growers and traders against further declines.8 The operation of these schemes posed problems of financial losses and surplus disposals to the Cotton and Jute Boards
8 T h is is qu ite s im ilar to the g o v e rn m en t purchases of raw cotton in the U n ited States.
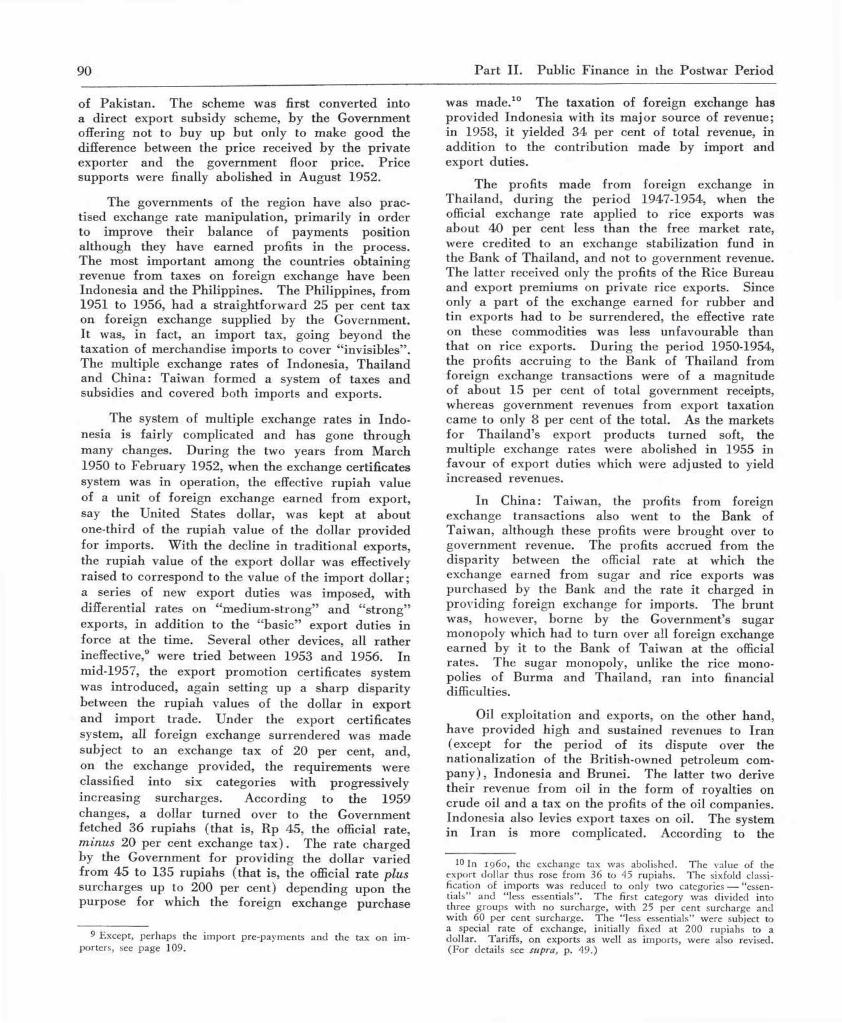
90 P a r t II . Public F inance in the Postw ar Period
of P ak istan . The scheme was first converted into a d irect export subsidy scheme, by the Governm ent offering no t to buy up b u t only to m ake good the difference between the p rice received by the p rivate exporter an d the governm ent floor price . P rice supports were finally abolished in A ugust 1952.
The governm ents of the reg ion have also p ra c -tised exchange ra te m anipu la tion , p r im arily in o rder to im prove the ir balance of paym ents position a lthough they have earned profits in the process. The m ost im p o rtan t am ong the countries ob ta in ing revenue from taxes on foreign exchange have been Indonesia an d the Philippines. The Philippines, from 1951 to 1956, had a stra igh tfo rw ard 25 per cent tax on foreign exchange supplied by the G overnm ent. I t was, in fact, an im port tax , going beyond the taxation of m erchandise im ports to cover “ invisibles” . The m ultiple exchange ra tes of Indonesia , T ha iland and C hina: Taiw an form ed a system of taxes and subsidies and covered both im ports and exports.
The system of m ultiple exchange rates in In d o -nesia is fa irly com plicated and has gone th ro u g h m any changes. D uring the two years from M arch 1950 to F eb rua ry 1952, when the exchange certificates system was in operation , the effective ru p iah value of a unit of foreign exchange earned from export, say the U nited States dollar, was kept a t abou t one-third of the ru p iah value of the dollar p rovided fo r im ports. W ith the decline in trad itiona l exports, the ru p iah value of the export dollar was effectively ra ised to correspond to the value of the im port do llar; a series of new export duties was im posed, w ith differential ra tes on “ m edium -strong” and “ strong” exports, in add ition to the “basic” export duties in force a t the time. Several o ther devices, all ra th e r ineffective,9 were tr ied between 1953 an d 1956. In m id-1957, the export p rom otion certificates system was in troduced , again setting up a sharp d isparity between the ru p iah values of the dollar in export an d im port trade. U nder the export certificates system, all foreign exchange su rrendered was m ade subject to an exchange tax of 20 per cent, and, on the exchange provided , the requ irem ents were classified in to six categories w ith progressively increasing surcharges. A ccord ing to the 1959 changes, a do llar tu rn ed over to the Governm ent fetched 36 rup iahs ( th a t is, Rp 45, the official rate, m inu s 20 per cent exchange t a x ) . The ra te charged by the Governm ent fo r p rov id ing the do llar varied from 45 to 135 ru p iah s ( th a t is, the official ra te p lu s su rcharges up to 200 per cent) depend ing upon the purpose fo r w hich the foreign exchange purchase
9 Except, perhaps the import pre-payments and the tax on im -porters, see page 109.
was m ade .10 The taxation of fo reign exchange has provided Indonesia w ith its m a jo r source of revenue; in 1958, it y ielded 34 p e r cent of to ta l revenue, in add ition to the con tribu tion m ade by im port and export duties.
The profits m ade from foreign exchange in T hailand , d u rin g the period 1947-1954, when the official exchange ra te applied to rice exports was abou t 40 per cent less th an the free m arket rate, were cred ited to an exchange stabilization fund in the B ank of T hailand , and not to governm ent revenue. The la tter received only the profits of the Rice Bureau and export prem ium s on p rivate rice exports. Since only a p a r t of the exchange earned for rubber and tin exports h ad to be su rrendered , the effective rate on these com m odities was less unfavourable than th a t on rice exports. D uring the period 1950-1954, the profits accru ing to the Bank of T hailand from foreign exchange transactions were of a m agnitude of about 15 per cent of total governm ent receipts, w hereas governm ent revenues from export taxation cam e to only 8 per cent of the total. As the markets fo r T h a ilan d ’s export p roducts tu rn ed soft, the m ultiple exchange rates were abolished in 1955 in favour of export duties which were ad justed to yield increased revenues.
In C hina: Taiw an, the profits from foreign exchange transactions also went to the Bank of Taiw an, a lthough these profits were b rough t over to governm ent revenue. The profits accrued from the d isparity between the official ra te at which the exchange earned from sugar and rice exports was purchased by the Bank and the ra te it charged in p rov id ing foreign exchange for im ports. The b run t was, however, borne by the Governm ent’s sugar m onopoly w hich had to tu rn over all foreign exchange earned by it to the Bank of Taiw an at the official rates. The sugar monopoly, unlike the rice m ono-polies of B urm a and Thailand , ran into financial difficulties.
Oil exploitation and exports, on the other hand, have provided h igh and sustained revenues to Iran (except fo r the period of its dispute over the na tiona liza tion of the British-owned petroleum com -p a n y ) , Indonesia and Brunei. T he latter two derive th e ir revenue from oil in the form of royalties on c rude oil an d a tax on the profits of the oil companies. Indonesia also levies export taxes on oil. The system in I ra n is m ore com plicated. A ccording to the
10 In 19 6 0 , the exchange tax was abolished. The value of the export dollar thus rose from 36 to 45 rupiahs. The sixfold classi-fication of imports was reduced to only two categories — “essen-tials” and “less essentials” . The first category was divided into three groups with no surcharge, with 25 per cent surcharge and with 60 per cent surcharge. T he “ less essentials” were subject to a special rate of exchange, initially fixed at 2 0 0 rupiahs to a dollar. Tariffs, on exports as well as imports, were also revised. (For details see supra, p. 49.)

Chapter 6. Government Revenue 91
agreement reached in 1954 between the Iranian Government, the National Iranian Oil Company (NIOC) and a group of international oil companies known as the Consortium, the latter pay to the Government and the National Iranian Oil Company one-half of the difference between the posted price of the oil taken by the Consortium and the cost of production of crude oil. The payment is made to the oil company in the form of crude oil, or its value at posted prices, up to about one-eighth of the payment due; the balance is paid to the Government as income tax. The NIOC also receives one-third, and the Government two-thirds, of the tax on refinery operations. The NIOC in its own turn has to turn over to the Government any surplus left from its share after meeting expenses which are subject to government scrutiny. In the period since 1955 oil revenues have come to well over one-half of the total receipts of the Iranian Treasury.
How does taxation on foreign trade stand with respect to providing growth of revenue? Undoubted-ly, as disincentives to dissipation of foreign exchange or as counter-measures to cyclical fluctuations, the various measures described here have indeed been helpful. Their significance is more limited for the long-term problem of increasing government revenue. Given a policy of economic development, the high- revenue-yielding imports of amenities and luxuries will continue to be curtailed drastically; permitted imports of basic necessities and producer goods could be highly taxed but, in general, it may not be desirable to do so. Export markets have, in the long run, turned soft; the revenue potential from export taxation is not high. In 1960, even crude oil prices had come down.11 The rice producers who did well for nearly a decade after the war have been, for some time, finding difficulties in selling rice; an increased volume is disposed of only at lower prices. Other commodities are in a still more vulnerable position. In any case, exports will remain, to a large extent, subject to demand conditions beyond the control of the exporting countries; revenue from this source can be counted upon to be neither growing nor dependable. Export monopolies and multiple exchange rates have also lost their steam; only in Burma and Indonesia do they remain of some consequence.
Even apart from the question of yields, taxation of exports is rather indiscriminate in its impact on producers— the small in relation to the large and the efficient in relation to the inefficient. It is, of course, administratively convenient, which is a great merit; it has, on the other hand, drawbacks as regards
11 I t is still too early to p red ic t w h e th e r this m eans th a t the role of pe tro leum as a source of increasing revenues is a th in g of the past.
incentives and equity. In the long run, the problem of finding a solution which will make the revenue system more progressive in relation to national income— one which will increase the incremental output-revenue ratio— will have to be tackled by reducing the present preponderant dependence of the fiscal system on foreign trade and by giving it a re-orientation.
TAXES ON INTERNAL TRANSACTIONS
Internal taxation of commodities and services, in the postwar period, was increased in several countries of the region to serve three main purposes: raising of revenue, curtailment of consumption (especially of luxuries), and saving on imports. The general principle in commodity or service taxes for raising revenue is that they should be levied on commodities or services with a low price-elasticity and high income-elasticity of demand. The low price-elasticity would secure a more than propor-tionate increase in revenues when prices are raised; the high income-elasticity would do so as incomes increase. The attempt to increase revenue from taxation of commodities, to some extent, caused price rises on a broad general front, but the main objective has been the withdrawal of spending power from the private sector in an effort to control inflationary pressures. If the increase in government expenditure was not in its turn induced by increased revenues, the transfer from the private sector to the government would at first raise the prices of goods taxed but would prevent the initial rise from spinning into a spiral of spending, higher incomes and more spending.
The possibility of practising differential taxation makes commodity taxation secure both a restriction of consumption of inessential items and a diversion of productive resources from taxed goods to other goods. The generally practised methods of taxing luxuries and exempting capital goods are attempts in this direction. The success in this field depends again on the elasticities of demand and supply. A greater elasticity in both would secure a more effective restriction of consumption and a diversion of production from the commodity taxed. It would follow, therefore, that the items which are big revenue yielders are not the ones which would effectively restrict consumption; on the other hand, the items which are responsive in this direction would not be revenue-yielding.
The third purpose, viz., that of restriction of imports, is attained directly through import taxes. Here again, if the duties are really successful, revenue yields are small. Some of the import taxes, in countries where there is some domestic production of items similar to imports, are collected as excise taxes. If the imported items alone are taxed, or are

92 P art II. Public Finance in the Postwar Period
taxed more highly than domestically produced goods, they have a protective effect, and they assist in improving the balance of payments position.
Subject to these considerations, the attempt to increase revenue has led to a steepening of the tax rates on the traditional favourites of finance ministers — tobacco, liquor, gasolene, motor-cars and enter-tainments. Revenue from taxes on liquor, and that from the extremely steep tax rates on narcotics, is being sacrificed in several countries in an attempt to prohibit their consumption altogether. Tobacco, being price-inelastic, is a good revenue yielder; income-elasticity is introduced by differential taxation of the different brands. For example, the indigenous bidi of the Indian or Pakistani worker is taxed more lightly than the western-type cigarette. China: Taiwan, Japan and Thailand collect tobacco revenue not as excise duties but through fiscal monopolies. Gasolene also satisfies the criteria of low price- elasticity and high income-elasticity to some extent; however, since the poor cannot afford cars and the import of cars for the rich is being restricted in order to improve the balance of payments, revenues have not risen to high levels.
The revenue from excise taxes has increased, however, not so much from increased consumption or increased rates of duty (although both these factors account for some part of it) on the traditional items, as from getting a wide range of items in the tax net. In India, for instance, the items which were not subject to excise taxes in 1948/49 yielded 24 per cent, and the items which were not taxed in 1938/39 yielded 71 per cent of the total revenue from excise taxes in 1953/54.12
The attempt directly to curtail general spending as distinct from spending on individual commodities, has given an increasing importance to general sales taxes or turnover taxes. The general sales taxes levied by the governments of ECAFE countries are not quite general; they are, in fact, an expanded version of excise taxes. Food and basic necessities are usually exempted from sales taxes; differential rates are charged on other items— depending on whether they are amenities of luxuries.
The curtailment of spending is brought about by sales taxes in two ways. The ability to spend is curtailed by taking spending power away from the consumers; the incentive to spend is weakened, since the consumer is given the choice to reduce his tax liability. The sales taxes, in this respect, have an advantage over income taxes in that they can catch persons who are able to avoid or evade income taxes. They would also catch spending out of
12 Government of India, Report o f the Taxation Enquiry C om -mission, Vol. II (N ew Delhi 1955), p.259.
accumulated wealth. The real motive for the sales taxes in the newly developing economies of Asia lies in its catching not the rich, but the poor and middle income groups, who pay no income tax at all or very little, if any, and who, in their spending, are more price-sensitive.13
Sales taxes tend to be levied at various stages, the choice being a matter of administrative con-venience. In general, a one-stage tax at a relatively higher rate is to be preferred to a tax with multiple stages and low rates. Burma, Indonesia and Pakistan have adopted single-stage taxes— the former two after experimenting with turnover taxes on successive transactions from the first dealer to the final customer. The taxes are levied on imports at the import stage and on domestic products for internal consumption at the manufacturing or wholesale stage as is done in Pakistan. Basic food items are exempt; other necessities are treated leniently and taxed at around 5 per cent; luxury goods are taxed more severely— at 10 per cent in Indonesia, 12.5 per cent in Pakistan and 15 per cent in Burma. India is also attempting to streamline its sales tax system, which being a state subject, varies from state to state. The state of M adras has a “ general” sales tax with a multi-point system and several exemptions and differential rates including one-point taxation on some items. The state of Bombay has modified its multi-point sales tax (introduced in 1953/54) to a two-point tax. The states of West Bengal and Bihar, on the other hand, have preferred the single-point sales tax. Japan has a combination of excise and sales taxes. Manufac-turers pay a tax when goods are moved out of warehouses and retailers also pay a tax on 70 items listed in the commodity tax law.
TAXES ON INCOME AND WEALTH
It is evident from table 35 that all the newly developing countries of the region rely to a greater extent on the taxes on commodities and services— the so-called “ indirect taxes”-—than on taxes on incomes and wealth. Only in Japan, do the latter add up to nearly half of the total revenue.14 Even so, the proportion in Japan is lower than in several other economically advanced countries of the world. Even if we consider land taxes as gross income taxes, as is done in table 35, the proportion of “direct” taxes to the total comes to around one-third in Hong Kong, between 20 and 30 per cent in Ceylon, India,
13 The popularity of the sales tax in advanced countries, on the other hand, has been, to some extent, due to a feeling that any further steepening of income taxes would have disincentive effects.
14 T he significant proportion in Brunei under this head in table 35 reflects m ainly taxation of profits of the oil company, which was already taken note of in the earlier section on taxes on foreign trade (see page 90).
Chapter 6. Government Revenue 93
Indonesia, southern Korea, Nepal, Pakistan, Sarawak and Singapore, and lower fractions in the other countries of the region.15
Among the “ direct” taxes, those on incomes of persons, including jurid ical persons, are the most important. Taxes on wealth or property, on the other hand, collect a very low amount of revenue. Even where they are levied, their application has remained limited and their rates have been low.
T h e p r e s e n t s t a t u s o f i n c o m e t a x e s
The income tax was already in existence before the war in Burma, Ceylon, m ainland China, India, Indonesia, Japan, Pakistan and the Philippines. In Burma-India-Pakistan, it has been in continuous existence since 1886. The Philippine income tax dates back to 1913. In territories such as Brunei, China: Taiwan, the Federation of Malaya, Hong Kong, southern Korea, Nepal, N orth Borneo, Sarawak, Singapore and Thailand, it is a postwar innovation. The tax in Nepal is the youngest; it was introduced in the 1959/60 Budget.
Income taxes in most countries are levied on global incomes— that is, on incomes earned by residents as well as non-residents within their geographic jurisdictions and those of residents earned abroad. In Burma, India and Pakistan, income from agriculture is exempt from the income tax adminis-tered by the central government; it is supposed to be covered by land taxes levied by state governments. However, in an attempt to obtain more revenue and to introduce progressivity in the operation of the land tax, several of the state governments have also introduced agricultural income taxes. The income tax systems of these three countries have several other special features.16
Since 1947, the Japanese income tax system is based on estimated taxation and self-assessment. This is distinct from the present Burma-Ceylon-India- Pakistan system or the Japanese system before 1947, when income tax was assessed by the government
15 T h e sha rp rise in B u rm a reflects m ain ly a change in account-ing; f ro m 1 9 5 3 /5 4 the state m a rk e tin g boards w ere req u ired to pay incom e taxes on their profits . As a result, the share o f incom e taxes in total revenue w en t u p an d th a t o f ‘o th er taxes on foreign trad e’ w en t d o w n . S im ilar changes have also affected th e s tru c-tural classification in table 35 in respect of several o th er countries.
16 E xcept for som e recen t changes, the system , as it operated th rough m ost o f the p ostw ar period , w as a tw o-tie r system of incom e- an d supertaxes in respect of bo th ind iv iduals an d co m -panies. Secondly, the H in d u u n d iv id ed fam ily , a u n i t of co n -siderable significance in the business o rg an iza tio n o f the H in d u com m unity , received special t rea tm en t. T h e re w as no tax a llo w -ance for fam ily size; there w as d ifferen tia tion betw een earned an d unearned incom e; an d , finally , insofar as co m pany incom es w ere d istributed to ind iv iduals as d iv idends, a tax rebate was g iven on personal incom e tax liabilities o f the shareholders in consideration of a p a r t of the tax — the “ incom e ta x ” b u t n o t th e “ su p e rtax ” — paid by the com panies.
income-tax department on the actual income of the previous year. Under the self-assessment system, the taxpayer estimates his income in the taxable year, computes his tax liability, files a return and pays the estimated tax. Final adjustments are made on the basis of actual results. The tax on wages, interest and dividends and on certain types of business income is withheld at source. The Japanese system of taxation on personal incomes, and that of Ceylon, the Philippines and several other countries, have graduated rates rising in smooth progression all the way from the lowest to the highest income bracket on which the tax is due; this is less complicated than the two-tier system of personal income- and supertaxes in Burma, India and Pakistan prio r to 1960. Under the Japanese system of exemptions from taxable personal income, a basic exemption is given for the taxpayer himself, and additional exemptions in declining amounts are given for his dependents. Ceylon operates the quotient system in this regard; a bachelor has one-and-a-half quotient, a m arried couple two, and additional quotients at the rate of half a quotient for each child up to a maximum of four children, bringing the maximum of quotients to four per family. Taxable income is divided according to the num ber of quotients; each quotient is assessed at the rates applicable. In this way, m arginal rates are reduced for persons with larger family responsibilities. India recently made some small adjustments to favour persons with dependents. As in Burma, and in India and Pakistan until recently, Japanese shareholders, in the assessment of their tax liabilities on personal incomes, are given credit in respect of a part of the taxes paid by the companies.
The income tax systems in other countries com-bine most of the general features of the income-tax system— tax exemption limits, allowances, exemptions or tax credits for dependents, progressive rates, and differential treatment of individuals and companies. The tax in Brunei and Sarawak is only applicable to companies. The large revenue from the profits of the oil company in Brunei has made taxes on personal income unnecessary. The Hong Kong tax is composed of taxes on four schedules: property, salaries and annuities, profits, and interest; the new tax in Nepal covers only salaries and buisness profits. Both these systems fall short of a full income tax. In southern Korea, many other refinements in income taxation are sacrificed in order to tax income at the time it is earned, or as soon as possible after it is earned.
With its advantages of flexibility and progression not only between different taxpayers but between successive changes in the volume of incomes poten-tially subject to taxation, income taxes appear to provide the most suitable weapon for implementing
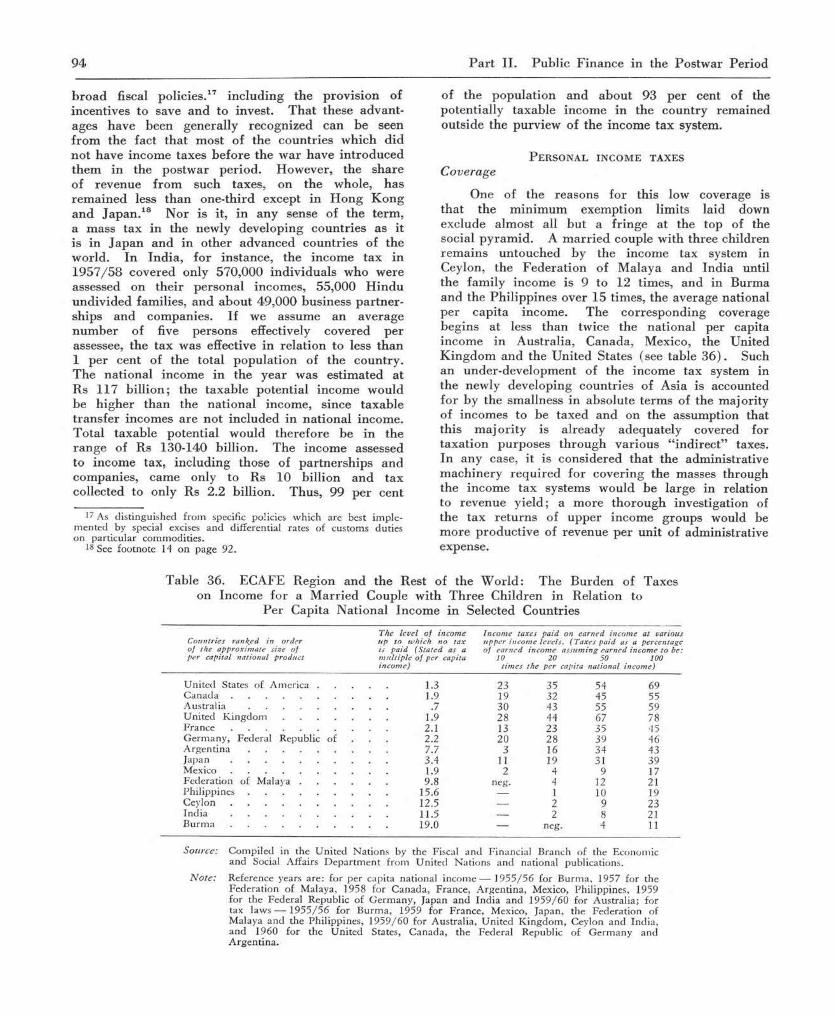
94 P art II. Public Finance in the Postwar Period
broad fiscal policies.17 including the provision of incentives to save and to invest. T hat these advant-ages have been generally recognized can be seen from the fact that most of the countries which did not have income taxes before the w ar have introduced them in the postwar period. However, the share of revenue from such taxes, on the whole, has remained less than one-third except in Hong Kong and Japan .18 Nor is it, in any sense of the term, a mass tax in the newly developing countries as it is in Japan and in other advanced countries of the world. In India, for instance, the income tax in 1957/58 covered only 570,000 individuals who were assessed on their personal incomes, 55,000 Hindu undivided families, and about 49,000 business partner-ships and companies. If we assume an average num ber of five persons effectively covered per assessee, the tax was effective in relation to less than 1 per cent of the total population of the country. The national income in the year was estimated at Rs 117 billion; the taxable potential income would be higher than the national income, since taxable transfer incomes are not included in national income. Total taxable potential would therefore be in the range of Rs 130-140 billion. The income assessed to income tax, including those of partnerships and companies, came only to Rs 10 billion and tax collected to only Rs 2.2 billion. Thus, 99 per cent
17 As d istinguished f ro m specific policies w h ich are best im ple- merited by special excises an d differential rates of custom s duties on p articu la r com m odities.
18 See footnote 14 o n p age 92.
of the population and about 93 per cent of the potentially taxable income in the country remained outside the purview of the income tax system.
P e r s o n a l i n c o m e t a x e s
Coverage
One of the reasons for this low coverage is that the minimum exemption limits laid down exclude almost all but a fringe at the top of the social pyramid. A m arried couple with three children remains untouched by the income tax system in Ceylon, the Federation of Malaya and India until the family income is 9 to 12 times, and in Burma and the Philippines over 15 times, the average national per capita income. The corresponding coverage begins at less than twice the national per capita income in Australia, Canada, Mexico, the United Kingdom and the United States (see table 36). Such an under-development of the income tax system in the newly developing countries of Asia is accounted for by the smallness in absolute terms of the majority of incomes to be taxed and on the assumption that this m ajority is already adequately covered for taxation purposes through various “ indirect” taxes. In any case, it is considered that the administrative machinery required for covering the masses through the income tax systems would be large in relation to revenue yield; a more thorough investigation of the tax returns of upper income groups would be more productive of revenue per unit of administrative expense.
Table 36. ECAFE Region and the Rest of the W orld: The Burden of Taxes on Income for a M arried Couple with Three Children in Relation to
Per Capita National Income in Selected Countries
Countries ranked in order o f the approxim ate size of per capital national product
T he level o f incom e up to w hich no tax is paid ( Sta ted as a m u ltip le o f per capita incom e)
Incom e taxes paid on earned incom e at various upper incom e levels. (T axes paid as a percentage o f earned incom e assum ing earned incom e to be:
10 20 50 100tim es the per capita national incom e)
U nited States of A m erica . . . . 1.3 23 35 54 69C anada ............................................................ 1.9 19 32 45 55A u s t r a l i a .................................................... .7 30 43 55 59U nited K i n g d o m ..................................... 1.9 28 44 67 78France ............................................................ 2.1 13 23 35 45G erm any , Federal Republic of 2.2 20 28 39 46A r g e n t i n a .................................................... 7.7 3 16 34 43Japan ............................................................ 3.4 11 19 31 39M e x i c o ............................................................ 1.9 2 4 9 17Federation of M a l a y a .............................. 9.8 neg. 4 12 21P h i l i p p i n e s .................................................... 15.6 1 10 19C e y l o n ............................................................ 12.5 — 2 9 23Ind ia ............................................................ 11.5 — 2 8 21B u r m a ............................................................ 19.0 — neg. 4 11
Source: C om piled in the U n ited N ations by the Fiscal an d F inancia l B ranch o f the Econom ic an d Social Affairs D e p a r tm e n t f ro m U nited N ations an d national publications.
Note: Reference years are: fo r per capita national in c o m e — 1 9 5 5 /5 6 for B urm a, 1957 for the Federa tion o f M alaya, 1958 for C anada, F rance , A rgen tina , Mexico, Philippines, 1959 fo r the F ederal R epublic of G erm an y , Japan an d Ind ia a n d 1 9 5 9 /6 0 for A ustralia ; for tax l a w s — 1 9 5 5 /5 6 for B urm a, 1959 fo r F rance , Mexico, Japan, th e Federa tion of M alaya an d the P h ilippines, 1 9 5 9 /6 0 fo r A ustralia , U n ited K in g d o m , Ceylon an d Ind ia, an d 1960 for the U n ited States, C anada , the Federal Republic of G erm any and A rgen tina .

Chapter 6. G overnm ent Revenue 95
V arious aspects of the p rob lem have to be considered here. F irst, any effort in a poo r coun try to raise savings a t the expense of consum ption will have to ob ta in these from the p o o r ; the s tan d ard of m in im um taxable capacity m igh t have to be p laced at a lower level. As fo r th e re be ing no taxable
capacity in the low-income groups ow ing to the incidence of ind irec t taxation , there is no clear evidence. In Ind ia , fo r instance, the incidence survey ca rr ied ou t by the In d ian T ax ation E n q u iry Com-m ission gave the following results:
T able 37. In d ia : Incidence of T axa tion by E xpend itu re Levels (T a x as p er cent o f to ta l ex p e n d itu re )
M o n th ly h o u s e h o ld e x p e n d i tu r e le v e l
Rs.1-50
R s.51-100
R s .101-150
Rs.151-300
A b o v e R s . 300
A l le x p e n d itu r e
lev e ls
R u r a l .................................................. 2.2 2.3 2.7 2.8 4.4 2.9U r b a n .................................................. 3.3 4.4 5.1 5.1 8.3 5.9Rural and urban combined . 2.4 2.7 3.1 3.3 5.6 3.6
Source: Government of India, Report of the Taxation Enquiry Commission, Vol. I, page 69.
The nationa l incom e in 1953 /54 , the y ea r of the inqu iry , was Rs 280 p e r head and the average size of the household in the survey w as 5 persons; m onthly incom e of the na tiona l average fam ily was, therefore, a ro u n d Rs 120 per m onth . On th is reckoning, only the first two groups constitu ted sub-average incom e-groups. On them the b u rd en of indirect taxation was less th an 3 per cen t; if the redistributive effects of governm ent expend itu re a re taken into account, they p a id prac tica lly no net taxation and, in so far as persons in these groups were on “ subsistence” levels, r igh tly so. On the o ther hand, the question arises if it is possible to raise m ore taxes from the average or above-average groups, either by low ering the incom e-tax exem ption limits or by selecting fo r ind irec t taxa tion items im portan t in their consum ption patte rn . T he lower taxa tion in the ru ra l a reas is perhaps com pensated by land taxes, the incidence of w hich in the p resent circum stances is on the poorer sections of the ru ra l com m unity . It is the u rb an com m unity w hich seems to perm it some, a lthough not m uch, scope fo r ra is ing the proportion of taxes levied. T here is some po in t in the contention of tax ad m in is tra to rs th a t ad m in is tra -tive difficulties are involved in such a m ove: we shall refer to them la te r .19 T here is, on the o ther hand , a distinct advantage in low ering the tax exem ption limit. If the tax exem ption lim it rem ains, say a t Rs 6,000 as is the case a t p resen t in P ak istan , incomes between Rs 6,000 and 7,500 earned by small and m edium traders m ay escape taxa tion altogether, since it is difficult to be definite abou t the incom e-tax liability of any such person. If, however, the lim its were down to Rs 2,000, such persons w ould have been forced to rep o rt some incom e and thus pay taxes which they are a t p resen t able to evade. Of course, the transition will have to com e abou t g radually ; the exem ption lim its will have to be
19 See infra, pp . 102-103.
low ered and adm in is tra tive m achinery bu ilt up over a num ber of years in a step-by-step process.
T ax rates
W hile m ost of the incom e tax systems of the under-developed countries show very h igh (an d only partia lly effective) personal incom e tax rates at the top, the average ra te of tax applicable to the incomes of persons taxed is m uch sm aller than in the advanced countries. T he m a rr ie d couple w ith th ree children, m entioned above, in Ceylon, the Federa tion of M alaya, In d ia and the Philipp ines pays only 8-12 per cent, an d in B urm a only 4 per cent, of the assessed incom e in taxes when the fam ily incom e is m ore than fifty tim es the na tiona l per cap ita income. On the o ther hand , a s im ilar fam ily un it w ith only ten tim es the na tiona l per cap ita incom e in the Federa l Republic of G erm any, the U nited States, A ustra lia and the U nited K ingdom pays from 20 to 30 per cent, of its assessed incom e in incom e and w ealth taxes (see table 3 6 ) . In Ind ia , in 1 9 5 7 /5 8 the “h a rsh ” taxes— taxes tak ing away m ore than half of the assessed personal incom es— affected only abou t 7,000 assessees, o r abou t 35,000 persons,— tha t is, less than one person in ten thousand . T here is little doub t th a t th is apex h ad a lready exploited the available avenues for avoidance and evasion, reducing the “harshness” in re la tion to the ir to ta l incom es as d istinguished from “ taxable incom es” . The m in im um disclosed taxable incom e of th is g roup was abou t two h undred tim es the national per cap ita incom e; those w ith incomes above the exem ption lim its b u t below the 200-time level pa id on an average only 9 per cent of the ir assessed incom es in personal incom e taxes. T ak ing in to account, therefore , the na tional average level of liv ing in the coun try and the incidence of existing ind irec t taxes— th a t is, an add itional 6 p e r cent accord ing to table 37— it canno t be said th a t e ither the tax coverage is extensive o r the rates, in the ir prac tica l application , a re harsh .
96 P art II. Public Finance in the Postwar Period
Tax base
Of course, the tax systems show ra ther high rates for the upper brackets of assessed income. Even when they have recently been brought down, the highest m arginal rates on earned incomes of persons in India remain at 77 per cent, in Pakistan at 75 per cent and in Ceylon at 60 per cent. Never-theless, the income tax systems are only superficially progressive;20 in practice, the rich are able to avoid the tax through legal “ loopholes” and in most countries, to evade it through administrative deficien-cies. The “ loopholes” on personal (and company) income taxation generally lie in the definition of the tax base, namely “ taxable income” . Profits on the sale of capital assets— capital gains as they are called — were not taxable until recently in most countries; even so, they pay lower rates. As capital assets appreciate particularly in inflationary periods, profits are realized on their sale. Under the British system, these profits are not taxed on the principle that it is the fruit of the tree, and not the tree itself, which should be subject to tax. However, from an economic standpoint, or from that of the property owners, there is no distinction between income from property (which is ordinarily taxable) and income from th - 3
sale of this property (which is not, or which is subject to a lower tax ), except to the extent that the capital gain is ascribable to genuine currency depreciation over the holding period of the asset. Other “loop-holes” include the escape from personal income tax liability through undistributed profits in closely held companies or trusts. The share values go up as reserves are piled up; in the event of sale at appreciated values, the profits realized can be passed off as capital gains. A third “ loophole” is the system of perquisites such as office-provided cars, living accommodation, travel, or expense accounts in general, which are charged off to business expenses, but which may not truly be “expenses that are wholly, exclusively and unavoidably incurred in earning the profits of the year.”21 Death duties are also avoided by gifts to beneficiaries made during the lifetime of the giver.22 All these loopholes have been so universally exploited
20 H e n ry Sim ons, before the w ar, called this a “subtle k in d of m oral and intellectual dishonesty . . . a g ra n d schem e of deception w hereby eno rm ous surtaxes a re voted in exchange for prom ises th a t they will n o t be m a d e effective. T h u s the politicians m ay p o in t w ith p r ide to the rates, w h ile quietly r e m in d in g the ir w ealthy constituents of the loopholes.” Personal Income Taxation, (C hicago, 1 938), p .219, qu o ted by N icholas K aldo r: Indian Tax Reform , p .11. In Asia, there is perhaps less of deception th a n a g en u in e m isu n d e rs ta n d in g on the p a r t of the politicians.
21 K aldor, op. cit., p . 66.
22 W hile top m arg in a l rates of incom e tax could well be low ered, there is a case for s teepening the inheritance taxes; an d since pro- gressivity should affect n o t the dead b u t the liv ing , the b ene-ficiaries could be taxed progressively on the basis of am o u n t received over the years, irrespective of w h e th e r th a t w as an inheritance o r a gift.
that there is a considerable amount of truth in the popular aphorism that taxable income is the only luxury the rich canot afford.
To plug several of these loopholes, as well as to evolve a tax system which would encourage saving and investment but discourage consumption, the Governments of Ceylon and India took a series of measures containing an adjustment of the rates of taxes on personal income, and new taxes on capital gains, on net wealth, on personal expenditure and on gifts. These are to be assessed as a single operation on the basis of a single comprehensive return provided by the taxpayer. In adopting these measures, the Ceylon Government did not bring down the higher rates of income tax to 45 per cent—the level recommended as the maximum.23 This made the burden on the upper income levels considerably higher than was necessary to secure revenue without severely impinging on incentives or putting a strain on honesty. India, too, did not lower the income tax rates to the extent recommended; on the other hand, the new measures were much milder than the original proposals.24 The integration and the interdependence of the scheme as a whole were vitiated. This was due, to some extent, to the not altogether unjustified apprehension that the unavoidable initial administra-tive difficulties would prevent the new taxes from m aking up the revenue loss which would result from an abandonment of the well-established top income- tax rates.
Not only is the tax being legally avoided. There is widespread evasion. The actual extent of this malpractice is a matter of speculation in several countries. In India, however, an attempt was made to put a value to it. According to one estimate,25 the tax annually evaded was on income totalling Rs 5.8 billion, or about three-quarters of the income assessed to tax in 1955/56, and that the magnitude of the revenue lost through evasion was of the order of Rs 2-3 billion, as compared with Rs 1.8 billion collected from all classes of assessees in that year. The Central Board of Revenue of India estimated the income evading tax assessment at about 40 per cent of the first estimate. Even the lower estimate suggests that income evading income tax was about 30 per cent of the income assessed to tax, and that revenue lost might be well over one-half.26
23 K aldor, N .: Suggestions for a Comprehensive Reform of Direct Taxation, G o v ern m en t of Ceylon, 1960, page 7.
24 K aldor, N .: Indian Tax Reform , op. cit., page 2.
25 Ibid., pages 103-106.
26 In Pak istan also, the vo lun tary disclosures, in response to the tw o -m o n th am nesty g ran ted in N ovem ber 1959, indicated tha t the tax evaded each year exceeded ha lf of the incom e tax collected.

Chapter 6. Government Revenue 97
C o m p a n y i n c o m e t a x e s
In advanced countries, a considerable proportion of economic activity is organized in the form of limited liability companies; company profits provide a m ajor source of revenue. The importance of this sector in the newly developing countries is rather small, although it is growing. Two ideas permeate the subject of company taxation. The first is that a company is nothing but “ an aggregate of a num ber of shareholders banded together for the achievement of some common purpose under limited liability; it is sufficient to impose the (personal) income tax upon the shareholder . . . and needless to impose the tax upon corporate income,”27 The second view is that since “the general law of the land entitles a corpora-tion with a personality of its own and regards it as an entity distinct from the shareholders who are its members, a corporation owes a duty to pay the corporation tax on its income apart from the income tax on the shareholders’ income.” 27 The two-tier system of company taxation in Burma and Japan, and in India and Pakistan until recently, pursues both these ideas. The two tiers consist of an “ income” tax and a “super” or “corporation” tax ; while the former is refunded as a tax credit on the personal income taxes of shareholders in respect of the dividends received by them, the “corporation tax” is not so refundable. W ith effect from 1960/61, India and Pakistan have abolished the tax rebate; the two taxes— income tax and supertax— for practical purposes, will be operated as if there was only one non-refundable corporation tax.
Corporate taxes are generally levied at a flat rate on all companies. Several countries, however, levy a slightly lower rate on companies earning smaller amounts. The rates vary. In general, they are not as high as in the United States (52 per cent). Where a rebate is given to shareholders on their personal income tax, their real incidence is even smaller than what the rates suggest. The rates in Indonesia rise from 40 to 52.5 per cent. India and Pakistan charge a flat 45 per cent (with the abolition of the tax rebate) ; N orth Borneo a flat 40 per cent; Brunei and Sarawak a flat 30 per cent; Japan two rates of 33 and 38 per cent and southern Korea of 17 and 22 per cent.
The administration of corporate income taxes is being tightened up in many countries by a more vigilant scrutiny of “ deductible expenses” . The more technical problems, however, in this field of taxation relate to the treatment of inter-company distribution of ownership and dividends, assessment of deprecia-tion and valuation of fixed assets and inventories,
27G o vernm en t of Japan, Outline o f National Tax in Japan 1957, p. 18.
particularly in a period of changing prices, and the treatment of business losses during the life time and at the time of winding up of companies.
While the governments have been in general enthusiastic in taxing company profits in the private sector, they have not been equally vigilant or successful in increasing or taxing the profits of their expanding public enterprises. Most of the profits in the column under government enterprises in table 35 are from some variant of fiscal monopolies; the strictly commercial enterprises are generally making losses on their operations. As we saw in chapter 5, the enterprises come under pressure from the workers for uneconomically high wages from their “model” employer— the state— and for uneconomically low prices from the consumers. An example of such tendencies is provided by Ceylon in recent years. If the governments were to continue their policies of fostering public undertakings, there is an obvious need for changing the present price and wage policies in such a way as would enable undertakings to earn profits, unless doing otherwise is a matter of state policy. There is also a need to tighten up adminis-trative expenses.28
I n c e n t i v e s f o r t h e p r i v a t e s e c t o r
In respect of tax levels, the question of their implications for incentives is often presented in the general form that high taxes put a damper on output. This simple assertion needs closer examination. Of course, businessmen have always complained about the adverse effects of the income tax throughout the history of its operation, irrespective of whether it was a penny or a shilling in the pound; every rise in it would, it was forecast, b ring down economic doom. And still, most of the developed economies have come to accept the fairly high rates of income (and company) taxes as quite norm al; once these rates are accepted as such, they stop being disincen-tives. It is not the general level of taxation, therefore, that is injurious to economic productivity; it is rather the sharp steepening of the rates, or the absence of tax discrimination between those who play the game according to the rules and those who do not. A generally low level of taxation may increase some saving and some investment; it may also increase consumption and speculation. And, by reducing government revenue it may have the net effect of lowering the national rate of saving and investment. It would indeed seem a wiser policy to adopt in
28 The “perks” for officials in public undertakings often match those in the private sector; the former, in addition, enjoy the security of tenure and easy transferability in the event of things going wrong, neither of which is available to the same extent to their counterparts in private enterprise.
98 P art II. Public Finance in the Postwar Period
general a high average level of taxation and give discriminatory relief, in ample measure, to those who save and invest according to the priorities set in the national plans or programmes of economic develop-ment. Of course, a generally high level of taxation on incomes should not be mistaken for punitively high rates on the top income brackets; these, as we saw, would only encourage tax evasion.
The most potent instruments for encouraging personal saving are really the taxes on spending, such as sales taxes, various commodity taxes and the expenditure tax. These provide the negative incentives to save, since tax liability can be avoided by refraining from spending. Among the positive measures of incentive provision in personal income taxation are the deductions allowed, up to a specified limit, for contributions to life insurance premia and to certain other savings schemes. Interest received from postal deposits or government bonds is also tax-exempt in serveral countries.
It is taxation of business incomes, however, which has, as its special feature, the system of incentives that are woven into it in order to encourage non-distribution of income as dividends and its reinvestment. In respect of the former, however, the governments have to find a practical compromise between two opposite aims; non-distribution is desirable as a mode of saving in an inflationary situation; given high rates of personal income taxation in the upper income brackets, it may be used for income tax avoidance. As result, the legislation in several countries enforces an upper limit to non-redistribution at the same time as it penalizes the distribution of dividends. A distinction is also made between closely held companies, which have a greater incentive to practise non-distribution of dividends in order to avoid personal income taxes, and loosely held companies, where the shareholder is not a partner in any real sense but only the owner of “ a piece of paper with a market value” . In Asia, at present, not many of the companies can be strictly described as loosely held.
Among the specific incentives to invest may be mentioned the provision for a tax holiday for a specified num ber of years for desired types of investment. The applicability of the tax holiday provision is confined to “new and necessary” indus-tries in the Philippines, or “ approved industrial” projects in Ceylon, India and Pakistan. Pakistan also makes the further stipulation that the industries concerned should be those “ using wholly or mainly raw materials produced in Pakistan.” The laws in Ceylon and India provide the statutory tax holiday, for a period of five years. In Pakistan the tax holiday is for four years in the developed areas of West Pakistan and six years in East Pakistan and in the
less developed areas of West Pakistan. The tax holiday in Afghanistan and in Japan is for three years, in Burma also for three years with a possible partial exemption for an additional period. In some coun-tries, for example, in the Federation of Malaya, the period varies with the amount of capital invested. The Philippine law (originally approved in 1946), however, granted the concession only for a period of four years. The law was amended in 1953 making the concessions valid as follows: complete tax holiday up to the end of 1958, and progressive increases in tax liability through 10 per cent in 1959, 25 per cent in 1960, 50 per cent in 1961, 90 per cent in 1962 to full tax liability in 1963 and thereafter. However, no assessee was to enjoy any proportion of tax exemption for a period exceeding six years. Ceylon and India put an upper limit to the income that could claim tax holiday; tax exemption applies to profits of “ approved” industrial undertakings in Ceylon only up to 5 per cent, and in India up to 6 per cent of the capital employed in the undertaking. The Philippine law exempts the “new and necessary” industries from liability in respect of all taxes during the holiday period ; Ceylon, India and Pakistan exempt them only in respect of direct taxes.
To provide concessions to investors whose savings are to be attracted to useful enterprises, Ceylon, the Federation of Malaya and India also exempt dividends paid out of exempt profits from liability in respect of personal income tax.
Another incentive provision in the tax systems of the countries of the region is the allowance of higher and accelerated depreciation for fixed invest-ment in approved channels. This incentve receives added weight from the fact that an enterprise which follows a policy of continuing investment will indefinitely retain this benefit, whereas its effect for enterprises not doing so, although still substantial, will be limited to a postponement of tax liability tantamount to an interest-free loan to the undertaking equal to the amount of the tax differential in the initial period. The concession enables the companies to write off the assets earlier than would otherwise be possible. However, the total tax paid over a num ber of years is the same, since the tax liability of the undertaking will be higher in later years as the depreciation allowance is reduced. In some countries, for example, the Federation of Malaya which provides for both types of incentives, the law permits the postponement in the use of these special investment concessions until after the tax holiday period so as to protect the former from being absorbed by the latter.
In Ceylon and India, the accelerated depreciation allowance was replaced by a system of development rebates, under which depreciation allowance is granted

Chapter 6. Government Revenue 99
in excess of the orginal cost of fixed assets. In Ceylon, an outright development rebate equal to 20 per cent of the cost is granted for all new plant and machinery installed in a business undertaking in any year; the rate of concession is 40 per cent where the enterprise is considered essential for the economic progress of the country. In India the rate is 25 per cent; in Japan it is as high as 50 per cent. The development rebate is in addition to the normal depreciation allowances available for these assets. While the accelerated depreciation allowances have the effect of only postponing the tax liability, the development rebate is a direct tax relief to the enterprise and does not reduce the written down value of the asset on which depreciation is later allowed.
Recognizing the importance of stimulating the self-financing of industrial expansion, some countries provide tax incentives for the reinvestment of profits. Thus, in Burma, profits reinvested within one year are exempt from income tax. Pakistan, the tax exemption is subject to the condition that profits be reinvested within one year of their accrual and that not more than 40 per cent of them be distributed.
Because of its special importance to the economy, the promotion of exports is given special tax con-cessions in Japan. Amounts transferred to reserves to provide for export losses are deductible as business expenses in computing the taxable income of com-panies. Special deductions were also in vogue during some periods when a small fraction of the value of export contracts could be set apart as a tax-free allowance.
Although concessions to provide incentives to save and to invest have been built into the tax systems of most countries, it is questionable if they have made much difference either way. To some extent this is due to the fact that legal concessions lose their meaning if the effective tax levels are low or if easier avenues permit tax avoidance or evasion. A more important factor, however, is that tax incentives are rather a delicate instrument of economic policy; they can be effective only if the general climate is favourable to private investment. Tax liability is only one of several factors taken into account in arriving at investment decisions; although it is an important consideration, it is not necessarily the most important one. If the concessions are to be effective, they have to be co-ordinated with other factors having a bearing on private investment. The most powerful incentive for private investment in the postwar period has perhaps been provided by the aggregative effect of fiscal policy on the level of effective demand in the economy and by the assurance that the demand will continue to expand and that competing products from abroad will be shut off by protective tariffs. It is factors such as these which are more pertinent in influencing private decisions
than the specific concessions mentioned above. How-ever, it must not be overlooked that these concessions have advantages when superimposed on other m ea-sures enabling the revenue system to service more efficiently the requirements of economic growth.
S o c i a l s e c u r i t y t a x e s
Another means of tapping revenue from the growing organized sector of the community is p ro-vided by social security taxes. While company taxes would tax company income as a whole, and personal income taxes affect the incomes of salaried company officials, directors and shareholders, a large part of increasing worker incomes are likely to remain outside the purview of these taxes, even if the exemption limits were lowered. On the other hand, the state is likely to be called upon, as noted in the previous chapter, to enlarge the scope of its social services not only to cover the traditional fields of education and public health but also to offer benefits covering unemployment, sickness and retirement. Assuming that these expenditures will have to be met, there is a strong case for getting some revenue from the workers in the form of social security contributions when they are in employment. Several countries have already made a beginning with social security or similar taxation in recent years; the system appears to be well developed only in Japan and in Ceylon where the annual contributions from the private sector come to around 3 and 1 per cent respectively of the national income.29 Ceylon is also experimenting with crop insurance, which may be described as an application of social security princi-ples to the rural area. Like income taxes, social security taxes have a built-in flexibility; in periods of prosperity or inflation net receipts tend to go up; in times of unemployment, there are net payments. This would assist in m aintaining short-term stability. With the growth in the coverage of the organized sector, the revenues are also likely to grow.
L a n d t a x e s
Agriculture is the source of livelihood for a large m ajority of the population of the under-developed countries of the ECAFE region. In an attempt to reach this group for revenue, farm ing has been subject to a variety of taxes. Agricultural incomes are taxed under the central income tax in
29 Social security taxes are also well developed in L atin A m erica; C hile collects 4.5 p e r cent, an d B razil, Costa Rica an d D om in ican Republic ab o u t 1 p er cent, of national incom e as con tribu tions f ro m the p riv a te sector. T h e operations a re generally o rg an ized u n d e r separa te agencies, w ith sem i-in d ep en d en t pow ers of tax a -tion , inves tm en t of fu n d s an d d isbursem ents o f benefits. In L atin A m erica , the investm ents have generally been m ad e in real estate; s im ilar investm ents in A sia m ay relieve the g o v e rn m en t of the load o f p ro v id in g h o u sin g facilities fo r low er incom e groups, a l th o u g h th ere is scope for re -o rien tin g investm ent f ro m real estate to industria l projects.
100 P art II. Public Finance in the Postwar Period
Ceylon, Indonesia, the Philippines and Thailand, and under the state income tax in Pakistan and in several states in India. However, a more common form of agricultural taxation in the ECAFE region, as well as in the Middle East, is the tax on farm output. I t is prim arily a tax on the staple crop, but that is often extended to include livestock, fruit trees, vegetable gardens, etc.
There are two m ain types of taxation of farm output according to the method of its assessment and collection. The older one of the two is that of crop-sharing between the cultivator and the state. The tax is assessed on the basis of actual harvest and collected in kind or in cash. Such an actual output tax is in operation at present in China (mainland and Taiwan) and Korea (northern and so u th ern ). The second method common to Burma, India, Nepal and Pakistan is a combination of output and property taxes. The annual output is taxed, however, not according to current yields but according to the long-term charges fixed in cadastral assessments made periodically— every 20 or 30 years— with the tax base of gross or net output in one single year, or an average of several years preceding the year in which the assessment was made. As a tax on incomes, the land tax is a highly regressive tax; the burden is smaller for higher incomes, and varies inversely with the changes in income over the relatively long period during which a given settlement remains valid. In certain parts of India and Pakis-tan, land settlement was made in perpetuity at the end of the eighteenth century. The tax burden in these ‘permanent settlement’ areas has become mean-ingless over this length of time; with successive transfers of ownership, it has already got capitalized in land values.
Both Thailand and the Philippines tax land on its capital value. While income to be derived from property is an im portant element of its value, the difference between this property tax and the trad i-tional land tax of India and Pakistan is in the tax base. Since capital value is the base of the former tax, values arising from factors other than agricultural yields are taken into account, including actual prices paid for land. The taxes also apply to urban areas where land is used for housing. The land tax in India and Pakistan is generally confined to agricultural output; property characteristics such as irrigation facilities and quality of soil are taken into considera-tion only as indicators of output.
As it stands, land tax, among the fiscal systems of the countries of the region, is of importance only in Nepal. In 1950, it accounted for more than half of the country’s total revenue; by 1958, the tax had given pride of place to customs duties. The tax in the plains in the south — the Tarai areas — is the
ordinary land tax assessed and payable in cash, whereas in the hills it is assessed in kind but collected in cash, at prices which are a fraction of market prices, since the assessment prices have not been revised for about half a century. To increase revenue, the Government of Nepal, in its 1959/60 Budget, introduced surcharges on the land tax and abolished the Birta system, which was a system of tax free gifts by the state to individuals who had the right in perpetuity to collect land taxes from the landowners, but who had no corresponding obligation to pay anything to the Government for the privilege enjoyed. Both these measures were designed to arrest the fall in revenue from land taxes; in the present context of economic development of the country, land tax alone offers the most promising field of augmenting national saving.
The cadastral land taxes have the great demerit of being inflexible. Their share in total revenue has fallen; in the combined revenues of India and Pakistan, for instance, it fell from 13 per cent in 1938/39 to 7 per cent in 1957/58. In fact, agricul-tural taxation, which is the oldest form of taxation in the history of public finance, has provided low potentials of growth, unless agriculture was of a type where it had to be carried on in large units such as plantations or its products had to pass through the customs shed prior to export. Taxation of small “ subsistence” or largely non-marketed outputs of a large num ber of peasant cultivators— practised for centuries— has given rise to complexities in tenurial systems and property rights, and to extortionate and iniquitous taxation of the small tenant cultivator, not so much for the benefit of the state as of the intermediaries between him and the state. Any attempt to alter the basis of land taxation, therefore, gives rise to serious problems of administration, equity and incidence. No one is in favour of taxing the subsistence farmer if he is really that; on the other hand, both the wartime rise in real prices, and postwar increase in output resulting from investments in agriculture — largely at public expense — have brought about a rise in agricultural incomes in real terms, which has not been tapped for revenue except in the export-orientated economies.
The question of what can be done to tax this increase in agricultural incomes revolves around the difficulty of ascertaining the beneficiaries of the rise. As far as export trade is concerned, governments have been able to tap the increment through export taxes, marketing boards, discriminatory exchange rates and other similar measures. But in the case of cultivation for domestic consumption, there is a presumption, but no accurate information, that the benefits have accrued to producers, who have increased their own consumption and who have received higher prices on what they have chosen to sell. There is again

Chapter 6. Government Revenue 101
a difference of opinion here as to the extent to which the gain has gone to the subsistence farm er or to the landowner or moneylender.
This question of tapping the increase in agricul-tural incomes for revenue received the attention of the inquiries into taxation by a Commission in India and by a Committee in Pakistan. The Indian Commission also made the attempt noted above30 to study the difference in incidence of all taxation as between urban and rural population and as between the several income groups. Its findings were that, on incomes below the income tax exemption limits, the level of tax incidence in urban areas was higher than in rural areas, although the difference between the two was “not quite as great as is often believed” . On the other hand, the disparity was large in respect of incomes subject to the central income tax. The Commission therefore concluded: “there appears to be greater room for increased taxation of higher rural incomes, if the country is to have a more satisfactory picture of incidence.” 31
In the context of rising output and increasing price levels, one way of taxing agricultural incomes would be by price-fixing of agricultural produce, letting real prices but not the real incomes of producers fall. This has, in fact, been done in Burma and Thailand, where governments have been able to keep domestic prices of rice below export prices in order to secure revenue. The price-fixing of agricul-tural produce intended for domestic consumption will not be revenue-yielding; but it will serve one of the major objectives of fiscal policy, namely, the m ain-tenance of long-term stability. The prices could be pegged at fairly stable levels by controls over trans-portation and sale, physical procurement of supplies and maintenance of buffer stocks, as have been tried in India and in other countries of the region. If these methods are successful, stabilization is secured directly rather than through a fiscal intervention.
This is not to deny the considerable scope which the present land tax system permits for its ration-alization to yield more revenue. India and Pakistan have made attempts to expand the purview of their taxation on incomes to include agricultural incomes. But, since the exemption limits exempt all but a minor group and since the rates have been relatively low, yields have remained small. Apart from revenue considerations, agricultural income taxes are intended to introduce progressivity in land taxes; another method by which this is sought to be done is progressive surcharges on the land tax. A second source of revenue is provided by betterment taxes levied on property benefiting directly from develop-
30 See table 37 on page 95.31 Report o f the Taxation E nquiring Commission, op. cit., Vol. I,
p. 78.
ment projects such as irrigation works.32 If, however, land values rise from general economic development or from inflationary conditions or speculative demand, capital gains taxes could be used to catch the increment in land values. Private investment and utilization of land could also be stimulated by taxes on unimproved or unutilized land. However, none of these taxes is likely to bridge the large gap between the rise in agricultural incomes and the trend of revenues from land taxes.
RATIONALIZATION OF REVENUE SYSTEM AND ADM INISTRATION
To sum up, contrary to what has often been generally believed, taxable limits— whatever they are — have not been reached in the newly developing countries which indeed possess a revenue potential sizably greater than what they have so far exploited. On the whole, they succeeded well in taxing transac-tions in foreign trade, although this source, as we saw above, is not likely to provide growing revenues. The tax systems, on the other hand, were not as effective in improving the balance of payments; considerations of revenue have been in conflict with those of saving foreign exchange. The balance of payments problem was more effectively tackled by direct controls.
In respect of counteracting short-term distur-bances to stability, the relative under-development and the time-lag between the earning of income and its assessment have made taxation of incomes less effective than what could be expected from it in view of its built-in flexibility for this purpose. The governments had greater success with export taxes as an anti-inflationary device in times of export boom; they counteracted deflationary situations through an expansion of expenditure rather than through tax reduction. Nor was the income tax system fully effective in promoting investment or channeling it in desired directions; the promotional incentives lost their attractiveness and the deterrents their punch owing to the restricted scope of the tax system in general and the wide-open possibilities for tax avoidance and evasion.
For the prime task of raising national rates of saving, taxes on internal transactions in commodities and services and on domestic incomes and wealth provide the most suitable fields for further exploita-tion. In the process, the question of tax incidence and discrimination between the poor and the well-off has to be seen from new angles. It is not possible to give a categorical answer to the query if the poor
32 India is experiencing some resistance in the East Punjab state in collecting betterment levies on lands benefiting from the Nangal project.

102 P art II. Public Finance in the Postwar Period
in the newly developing economies of Asia provide further tax potentials, until a basis is prepared giving factual information on whether and what the poor have gained from the rise in national income, and the incidence of existing taxes on their incomes and spending.
However, we may clarify some points. There is one real problem. The pre-occupation with questions of incidence, when carried to the extreme and applied to every individual tax, is likely to lead the tax system eventually into losing revenue and making it regressive in relation to national income if the bulk of the rise in the national income goes to increase, although by a little, the small incomes of the poor. In such circumstances, seeking progressivity may lead to a regressive tax system. Indeed, it is not the incidence of an individual tax but that of the tax- and-expenditure system as a whole which should matter in this regard. Taxing a few necessities, or lowering income-tax exemption limits, or devising schemes of rural taxation will make the tax system more progressive in relation to the national income; it will raise incremental income— “non-consumption” ratio for the economy as a whole. If the poor have little choice between paying taxes and remaining in “disguised unemployment” or suffering inflation, they will be better off paying the taxes.
There is also the question of definition as to who precisely constitute the “poor” and what con-stitutes “poverty” in the context of Asia. One way of defining poverty would be to reckon as poor all the family units with less per capita income than the national average. Those above the average could then be distinguished as middle income groups or the rich on the basis of a certain multiple, say ten times, of the per capita national income. Thus, if the average family size is reckoned to be five persons in all income groups, persons earning less than five times the national per capita income could be described as the poor; those earning from five up to fifty times as the middle classes; and those earning more than that as the well-off. If then, the poor, on this definition, remain still on the “subsistence” level, they should not be taxed. Any taxation of persons at subsistence levels would impinge on human capital and would be highly injurious to economic growth. If, on the other hand, the taxpayer has crossed the Rubicon, even if his income be still below the average levels, there is a case for touching him for some portion of his income, and a strong case for tapping an increased portion of his incremental income.
As for the well-off, they need to be dealt with, but a little more carefully. To the extent that they are, in effect, lightly taxed, despite the high rates on top brackets of ‘taxable income’, there is ample
scope for getting more out of them. This can be done by redefining ‘taxable income’, by taxing wealth and spending, by plugging all the legal loopholes and by taking more effective measures aimed at catching tax evasion, like those taken in Pakistan when the new Government came into power. On the other hand, the tendency to overtax should be avoided for two reasons. First, it will only encourage tax evasion. At the top levels of income, when the marginal tax burden is 90 per cent, a tax avoidance or evasion worth one unit of currency has for the taxpayer a value equal to earning ten units. Secondly,— and this is rather important— such taxation may be injurious to saving. In India, for instance, more than half of the tax revenues from personal income taxes in 1957/58 was collected from only 7,000 individuals, each of whom was assessed as having a minimum of two hundred times the national per capita income. Even assuming that there was no tax avoidance or evasion and that the income reported was their only income, these people would still be left with enough wealth, if not enough income, after paying their taxes, to permit luxury consumption. Income taxa-tion and even commodity taxation does not seriously affect the consumption levels of the truly rich. So the net result would hardly be a reduction in consumption. Direct controls, rather than fiscal measures, may perhaps be more effective. The taxes do not increase the national total of savings; they merely transfer the savings of the rich to the government. Such transfer is often advocated on the argument that it would curb speculative investment; but, if the rates are really high, the speculators might as well take their chances on cheating the tax collector. Compulsory, punitive and unrequited transfers of bona fide savings to the government, on the other hand, would have adverse effects on incentives to earn, save and invest in the private sector. It may well be that the governments are motivated by considerations of national priorities in investment and by a belief that in view of these priorities the targets of investment in the public sector need to be filled even at the expense of investment in the private sector. It would, however, be regrettable if the availability of revenues were only to encourage the governments to indulge in extravagant consump-tion or give-away redistribution at the expense of private saving and investment.
The expansion in the scope of the revenue system, advocated above, requires a strengthening of the revenue assessment and collection machinery. In Burma, India and Pakistan, the stagnant land tax absorbs administrative resources out of proportion to its yield; income and excise or sales taxes, on the other hand, are only inadequately enforced. A great deal of the administrative burden could be reduced by simplifying the tax structure. Thus, if capital gains were treated as ordinary income, there would

Chapter 6. Government Revenue 103
be no need to verify whether an income was a capital gain or not. If an accessions tax on beneficiaries was introduced, it would obviate the need to have both the inheritance taxes and gift taxes. There is also a great m erit in built-in cross-checking in the Kaldor proposal of a comprehensive return, filed once a year by the taxpayer, on his wealth, income and spending. Strengthening of the cadre, and mechan-ization in the offices, would go a long way to avoid delays in assessment and collection. If it is desired to extend the scope of income taxes to cover lower income groups, tax forms and assessment methods could be simplified. The taxes could be collected from employees by having them withheld at the source. Small traders or businessmen could be assessed on their gross income. Self-assessment under oath could be m ade the general rule for non-wage incomes, and tax tables for ready reckoning distri-buted as is done in Japan; presumptive assessments could be levied on defaulters by tax officers unless the assessees were to prove their lower liabilities for tax by producing accounts and books. Some simplified accounting system could be evolved, and standard forms incorporating such a system could be distributed to educate taxpayers in bookkeeping.
These administrative improvements are relevant not only in the field of low-income taxation; they have ramifications over the entire range of fiscal ad-ministration in under-developed countries. Illiteracy
is, of course, an im portant problem, but not the big bugbear it is made out to be. The land tax, in operation for centuries in several countries of the region, has, in fact, involved the taxation of illiterate ru ra l masses; whole revenue cadres have been built up in the course of its administration. Unfortunate-ly, the land tax is inflexible and regressive from the point of view of fiscal development; if need be, it could be abolished altogether, and the administrative resources released could be redirected to administer a simplified, more rational and flexible system of income, property and commodity taxes on the lines reviewed on these pages. Of course, there would still be tax evaders, but cases of tax evasion discovered could be punished more serverely to deter others from practising fraud. At the moment, the discoveries of evasion are so infrequent, and the penalties on the evasion discovered so lenient, that the taxpayers, particularly self-employed professionals like doctors or lawyers and businessmen, can easily take a chance on not being caught at all or being let off lightly if caught. Special tax courts, instead of the ordinary legal machinery for civil suits, may be instituted and the legal processes tailored to deal expeditiously with the specific problems of tax evasion. A stricter supervision of the lucrative profession of company accountants and tax advisers or consultants might also b ring to light the deficiencies of tax legislation and its practical application and adm inis-tration.

C h a p t e r 7
FISCAL POLICIES
The failure of governments of the region, review-ed in chapter 6, to increase revenue in proportion to the increase in their expenditure resulted, in most countries, in the emergence or enlargement of their budget deficits.1 Under certain limited conditions budget deficits were in no way antithetical to the pursuit of the objective of long-term economic growth; but, in many countries and over most of the postwar period under consideration, budget deficits were a contributory factor to inflationary conditions. It is in the latter context that the governments can be said to have been confronted with the awkward choice of slowing down economic development,2 or suffering inflation.
The persistence of inflationary conditions affected also the balance of payments and vice-versa. Where foreign trade was free of controls, inflation increased imports and adversely affected exports, resulting in balance of payments deficits. However, such an outlet was available to only a few countries. In most countries, im port reductions only strengthened the inflationary forces let loose by the national increase in non-consumption spending. The countries were forced to find the delicate mid-point between internal stability and external balance; they generally swung from one extreme to the other.
Fiscal policies also tackled the compensatory role of levelling up the inflationary or deflationary zigzags of domestic investment or of foreign trade. These were essentially short-term problems; they were of importance in the economies which are significantly dependent on foreign trade such as Ceylon or the Federation of Malaya, or in the industrial economy of Japan which experienced the trade cycles charac-teristic of the private enterprise industrial economies of North America and western Europe. These short-term instability problems should be distinguished from the problem of long-term instability which arose mainly in terms of inflationary conditions from the prim e failure of fiscal and monetary policies to reduce total outlays on consumption in order to bring them in balance, at currently prevailing prices, with the resources available for consumption.
1 For a definition of the terms ‘governm ent deficit’ or ‘budget deficit’, ‘governm ent saving’ and ‘money creation on governm ent account’, see the explanatory note on page 63.
2 Of course, it was not quite necessary that only developmental expenditure should have been reduced; there was plenty of scope for the reduction of less essential expenditure.
The governmental attempt to direct to itself the maximum of resources possible, so far as it was made through revenue measures, was described in chapter 6. In addition, the governments resorted to borrowing. Only a portion of this borrowing was a genuine transfer of resources; the balance represented no saving on the part of the community and resulted only in strengthening the inflationary forces. The governments were also helped insofar as they were able to run down foreign assets or to mobilize foreign saving. The availability of such foreign saving to ECAFE countries increased sharply in the postwar period. It helped by increasing the real resources, by im proving the balance of payments position and by withdrawing in counterpart funds a portion of monetary demand.
The ramifications of the pursuit of economic equality in the expenditure and revenue policies of governments were described in chapters 5 and 6. But this was not the only non-economic objective that fiscal policies were employed to serve. Other non-economic objectives included the strengthening of military potentials to avert a war or to cope with civil strife, and making societal changes, such as altering the institutions of land ownership, transform-ing the capitalist economy into a socialist one, or the opposite one of strengthening private initiative and enterprise.
TH E EM PHASIS IN FISCAL POLICIES
The importance attached to the different economic and non-economic objectives varied considerably from country to country, depending upon its political and adm inistrative organization, ideological background and the weight attached to economic progress relative to other considerations. These considerations far transcended the boundaries of pure economic calculus, and in several instances, at least in the short run, created a conflict with the purely economic objective of achieving a high rate of growth, although the conflict was not always explicitly recognized or admitted. In most cases, both economic and non-economic objectives remained intermingled without proper co-ordination. In China: Taiwan, southern Korea, Laos and southern Viet-Nam, national defence received priority in the shaping of fiscal policy on the expenditure side; in mainland China, priority was given to socialist transform ation of the economy; in the Federation of Malaya, Hong Kong and in the

Chapter 7. Fiscal Policies 105
Philippines, revenue and expenditure policies were framed with the prim e objective of aiding and encouraging private enterprise to secure economic development; in Ceylon and India, development was sought within the framework of an increasing role for the public sector.
In the purely economic field, with the emergence and enlargement of budget deficits there remained a divergence between the ideal of achieving a high rate of capital form ation and economic growth in the economy and that of m aintaining economic stability. In this regard, a simple distinction is sometimes drawn between these twin objectives of fiscal policy, and consequently between the types of fiscal policy to be used in the under-developed and developed countries. It is argued that the industrially advanced countries, having attained the stage of self-sustaining growth, are prim arily concerned with the problem of m aintaining stability for which they employ com-pensatory fiscal policies. The prim e objective of fiscal policy in the under-developed countries, on the other hand, is to initiate the process of growth and to accelerate its pace through a substantial increase in the rate of investment in the economy. Fiscal policy is, therefore, to be used directly to increase capital formation in the public sector, and indirectly to induce an increase in private saving and investment and its redirection into desired channels.
The above is an over-simplified presentation of a rather complicated issue, and ignores the basic dilemma facing all countries in the formulation of their economic policies. The industrially advanced countries cannot disregard the importance of m ain-taining a high rate of growth; they do, in fact, assess carefully the impact of stabilization measures on the growth rate. Underlying even their swings of short-term compensatory fiscal policies is a desire to maintain long-term stability conditions which are deemed essential for a high rate of growth. Similarly, the newly developing countries cannot think of growth in continuing inflationary conditions; nor are they quite free to follow their uphill task without changing gears to suit the undulating course of short-term fluctuations in their economic situation.
Among ECAFE countries, postwar policies in Japan show as great an emphasis, if not a greater one, on economic growth as is evident in a number of the newly developing countries in the region. The latter, on the other hand, have had to be constantly vigilant to keep inflation under control. They also passed through a phase of anti-deflationary stabiliza-tion programmes in the postwar period designed to stem the decline in economic activity when the Korean war boom burst or when exports sharply fell as in 1958.
The difference in the fiscal policy objectives between the developed and the newly developing countries, therefore, is one of relative emphasis. The over-all objective is the same, namely, the attainment of the optimum rate of growth consistent with a reasonable degree of long-term as well as short-term stability. The under-developed countries naturally tend to lay prim ary emphasis on development goals, but are forced to pay heed to considerations of stability by the logic of economic circumstances.
Pursuing the objective of economic development has, to a large extent, meant the use of revenue and expenditure policies in all the countries of the region to make possible a high rate of saving and capital formation in the economy together with a rising share for the public sector. Some aspects of the problem of resource allocation between public sector consumption and public sector investment and the mobilization of resources for the government through alternative revenue measures were described in chapters 5 and 6. In this chapter, the discussion is prim arily in aggregative terms relating to the twin flows of income and expenditure together, dis-covering the emergence, magnitude and growth of budget deficits and analysing the impact thereof on the rest of the economy— on the balance of payments and on domestic price levels, and the fiscal measures employed to remedy some of the adverse elements in the situation. The significance of fiscal measures depends on the possibility of combining them with other measures such as credit control and price and distribution controls. There would thus naturally be variations, discussed in the following pages, in the employment of fiscal policy in individual countries; certain broad patterns are, however, discernible.
BUDGET DEFICITS
The countries of ECAFE region, in their attempts to use fiscal policy for directly augmenting the proportion of non-consumption in the economy, had to face the basic problem of rising pressures of demand on the limited resource base. This has been generally reflected in budget deficits in a num ber of countries. Efforts to balance government budgets were circumscribed by limitations of both an adm inistrative and economic nature. As analysed earlier in chapter 6, the m ajor limitations on the revenue side were the low average levels of per capita income, inadequate taxation of the rich, and political and administrative problems encountered in taxing the poor in countries which are poor altogether.
The deficiencies on the revenue side were compounded by problems on the expenditure side. Expenditure grew substantially with the increase in population, urbanization and growth of the economy. As it is, social services expected from and promised
106 P art II. Public Finance in the Postwar Period
by national governments of the region also increased. Current government expenditure continued to grow, therefore, in responding to the problems presented by a developing economy and a changing society.
As a result, deficit financing was relied upon to take care of a substantial part of government outlays. Borrowing from the central banks combined with secondary credit expansion by commercial banks exercised an expansionary influence on money incomes and effective demand at home. The inflationary pressure could be worked off only partly through balance of payments deficits, depending upon the availability of foreign aid or foreign exchange reserves; the pressure not thus eliminated resulted in an expansion of disposable monetary incomes, and was reflected, generally though not always, in a rise in money supply and price levels. The weight of domestic inflationary pressure varied with the m agni-tude of budget deficits, the availability of foreign aid or past accumulations of exchange reserves and the employment and effectiveness of countervailing monetary and non-monetary controls.
This seemingly unavoidable sequence of events may give the impression that budget deficits, and to a certain extent the expansion in money supply and the rise in price levels, simply followed from some basic or institutional inadequacy in the fiscal systems of under-developed countries and did not form a segment of the complex of fiscal policies in ECAFE countries. It is, however, clear that fiscal imbalance was to some extent the result of questionable policy assumptions. As shown earlier, revenue collected still forms only a small percentage of national income in a number of countries. The tax systems also failed to mobilize a significantly increasing proportion of additional incomes created in the process of development. Similarly on the expenditure side, levels of administrative, defence and social service expenditure could have been partially adjusted to modify the size of budget deficit. It is generally over-looked that, to the extent that deficit financing results in an inflationary rise in domestic prices, it is no less regressive than taxes which hurt the poor relatively more than the rich. The decision not to levy higher taxes in general, or taxes on the poor in particular, in favour of larger budget deficits may have been merely an economic mistake or a political compromise. It is true that any alternative course might have been fraught with practical difficulties. Nevertheless, the size, if not the existence, of budget deficits was a matter of deliberate decision, not always arrived at in the light of purely economic considerations.
However, as we saw in chapter 4, it is not the balancing of public sector accounts per se which matters. In fact, there are two types of situation
where a government deficit, leading to an increase in money supply, would be quite consistent with the objectives of economic growth and stability.
It is, for instance, possible to consider a part of the expansion in money supply as monopoly profits — which are “ taxes” according to fiscal terminology— since the government alone can issue money; or it may be considered as a voluntary gift to the government from the community. To the extent that a community at a given time is willing to hold a large volume of liquid money, either in response to an increase in the monetized sector of the economy or to a rise in the national levels of economic activity, the goods and services obtained by the government, in initially issuing money, become a free gift to it. Predicting such an increase in the demand for holding money, planning authorities in Burma, Ceylon, India and Pakistan have counted a certain amount of monetary expansion among the financial resources for their plan outlays.
The second case is provided by short-term situations where a fall in money incomes arising from deflationary conditions in domestic or foreign trade is counteracted by money-creating budget deficits. India, for instance, experienced certain recessionary tendencies in the economy towards the end of its first five-year plan; the Government thereupon decided to increase the rate of development expenditure and money creation on government account in the fourth year (1954/55) of the plan, mainly to “compensate” for the inadequacy of effective demand in the economy.3 There was, in this case, no conflict between the short-term policy of stability and long-range goal of development.
“ Deficit financing” , or more precisely money creation, is often advocated for newly developing economies, or justified on the grounds that it is a measure to divert real resources to the government sector for a specific purpose such as public investment. It is misleading, however, to establish a correlation between money creation and just one component of government expenditure. Money creation, like all revenue items, is only a financial mechanism used for transferring real re-sources to the government sector, and cannot be related to any one item of expenditure as separated from other items.
Budget deficits have been a feature of fiscal operations in almost all the countries of ECAFE region (see table 3 8 ) .4 The m ajor exception is mainland China, where surpluses were registered in all years
3 See table 41 o n p ag e 113.4 T h e period of th e K orean w a r boom an d of its im m ediate
a f te rm a th has been ig nored in th e table in o rd er to b rin g o u t the m o re reg u la r pa tte rns o f bu d g e ta ry im balance.

Chapter 7. Fiscal Policies 107
Table 38. ECAFE Countries: Budget Deficits, 1953-1958
Country 1953 1954 1955 1956 1957 1958
(P e r cen t of g o v e rn m en t expend itu re )B u r m a ......................... 11 26 15 42 20 31C e y l o n ......................... 14 -1 0 -11 - 3 10 11C hina: m a in la n d . . - 1 - 6 - 1 6 - 7 - 2
T a iw a n . . 27 27 30 28 32 34Federation o f M alaya 28 26 8 12 12 22India ......................... 20 24 29 31 33 36I n d o n e s i a .................... 13 23 13 8 20 34Japan ......................... 17 15 21 12 11 15Korea, sou the rn . . 47 47 47 42 53 48L a o s .............................. 29 43 63 58 42 64Pakistan .................... 20 29 14 21 38 30Philippines . . . . 14 6 9 15 5 4T h a i l a n d .................... 27 27 23 15 26 17V ie t-N am a . . . . 29 68 67 40
(Per cent of gross national product)B u r m a ......................... 2.2 7.5 4.1 10.4 4.8 8.7Ceylon .................... 3.5 -2 .0 --2.1 -0 .8 2.6 2.8C hina: T a iw an . . 6.2 7.1 8.1 7.8 9.4 11.2Federation o f M alaya. 3.5b 1.5 2.4 2.2Ind iac ......................... 2.0 2.9 4.0 4.3 5.3 6.0I n d o n e s i a .................... 2.4 3.8 1.7 1.1 3.0 6.7Japan ......................... 4.5 3.9 5.5 2.9 2.6 4.1Korea, sou the rn . . 6.2 8.1 7.4 6.0 11.9 11.6Pakistanc .................... 2.4 3.5 1.6 2.3 6.0 4.6Philippines . . . . 1.6 0.7 1.1 1.8 0.6 0.4T h a i l a n d .................... 4.4 4.8 3.2 2.1 4.3 2.5
Source: See the exp lanatory note, page 63. a See footnote d of table 32 o n page 83. b Inc lud ing Singapore. c N et na tional p roduct.
between 1953 and 1958, with the exception of 1956. The existence of a budget surplus in m ainland China, however, does not mean the same thing as it does in the other countries of the region. The surplus does not necessarily represent a withdrawal of cash from the economy, since it is credited to the People’s Bank which, in its turn, uses it to finance the working capital requirem ents of the state-operated enterprises. The People’s Bank, operating both as a central bank and as a commercial bank, can use not only government surpluses but its own power to issue notes in the discharge of its function of financing state-operated enterprises. The over-all picture may, therefore, indicate a net money creation on govern-ment account, even if the government budget shows a surplus.
The m agnitude and the trends of budget deficits in other countries of the region have been caused by the developments and the policies affecting government expenditures and revenues described in chapters 5 and 6. In only four countries— Ceylon, the Federation of Malaya, Japan and the Philippines — out of the thirteen countries which showed budget deficits in 1957 or 1958 (see table 38) were the deficits smaller than either a th ird of government outlay or 5 per cent of gross national product.
Following the practice adopted by national income statisticians, the discussion of budget deficits m ay be followed by that of government saving, which describes the excess of government revenue over its current or non-investment expenditure. It could be observed that not all governments which incurred budget deficits were able to invest in an amount equal to or larger than budget deficits. In 1958, for instance, southern Korea and Indonesia incurred budget deficits respectively of one half and one-third of total government expenditure; investment outlays were one-third in southern Korea and less than one-tenth in Indonesia.5 These countries thus provide examples of government dissaving; that is, even the current expenditure of their governments could not be covered by revenue. In several other countries, however, there was some government saving, although it was not enough to finance the full public investment. In Ceylon, in 1958, for instance, while government investment constituted about one-third of government expenditure, budget deficit was only I I per cent.
IM PACT OF DEFICIT FINANCING ON THE ECONOMY
D o m e s t i c f i n a n c i n g o f b u d g e t d e f i c i t s
The im pact of a budget deficit on the national economy depends substantially on the method of financing employed. Budget deficits may be financed by domestic borrow ing from the public, from com-mercial banks and from the central bank. Borrowing from the public in the domestic market, insofar as it reduces private spending, transfers real resources to the government. Borrowing from the commercial banks would result in a decline in the liquidity of the banks and should tend to reduce commercial bank lending to the private sector. On this pre-sumption, it is included in borrowing from the public in India. In most ECAFE countries, however, the central banks have pledged themselves to support the security markets, so that commercial banks regard their holdings of government securities as cash. Under such conditions or where banks hold a high ratio of cash to deposits, government borrowing from commercial banks has the same results as borrowing from the central banks, except that the latter creates a base for secondary expansion of credit.
W ith regard to government borrowing from the public, borrow ing of small savings is perhaps the method of financing deficits which has the most direct impact in reducing m onetary demand for consumption output. In the newly developing ECAFE countries, savings are scattered over a large area and a large population in small amounts, and require to be pooled. Several governments, through the operation
5 S e e su p ra , t a b l e 2 5 o n p a g e 7 2 .

108 P art II. Public Finance in the Postwar Period
of their small savings schemes, have been able to attract to their treasuries these savings which would otherwise not have materialized at all or which would have remained inactive for a time as currency hoards (or been diverted to gold imports) only to come out in bursts of dishoarding if the price level were to be the least bit threatened. In Ceylon, India and Pakistan, as in Japan, there is a remarkably well- developed network of savings institutions attached to the postal organization. As the postal system attempted to reach the smallest and the remotest administrative unit, savings institutions were made available throughout the country. Post-office savings banks provided banking facilities for small depositors whom commercial banks were unable to reach, and attracted the small savings of peasants and craftsmen. In addition, savings certificates were sold for varying maturities ranging from 5 to 10 years at rates of interest rising with the period. The interest as well as the principal were usually payable at the end of the period. Recently, postal insurance schemes have been added to the variety of savings media provided under the postal savings schemes.6
During the postwar period, despite an increase — substantial as it was in India and Pakistan— the net volume of small savings channelled annually to the treasuries forms less than one per cent of the national income in the newly developing ECAFE countries. This failure to rise to a more significant proportion stems from the basic fact that small savings are collected from the relatively poorer sections of the community whose saving m argin is small and whose consumption propensities are high. To a large extent, however, the inadequate return in the form of interest earnings has exercised a restraining influence. Where interest payments at simple rates of 5 or 6 per cent are deferred for five to ten years, the net compounded rates work out still lower; they are indeed low as compared with the true rate of interest in the economy, namely, the rate which reflects the scarcity of capital to be loaned for such a length of time, as well as the actual interest rates prevailing outside the artificially supported govern-ment bond markets.
E x t e r n a l f i n a n c i n g o f b u d g e t d e f i c i t s
Financing budget deficits by foreign exchange holdings of the country or by net inflow of foreign aid and loans, provides additional means in real resources, and helps to create an offsetting balance
6 A significant fo rm of sm all sav ing is the p rem ia tow ards social security schemes w h ich generally cover g o v e rn m en t servants only, a l th o u g h recently the scope of these schem es has been ex tended to cover w orkers in p lan ta tions an d large industria l establishm ents. Since there is com pulsory p a y m e n t an d no direc t or quid pro quo obligation to repay, the receipts p a r tak e of the n a tu re of taxes, an d w ere discussed u n d e r taxes o n incom e in chap te r 6, page 99.
of payments deficit. If the government uses foreign exchange acquired through any of these means to im port goods and services from abroad, there is no increase in effective demand at home. On the other hand, the government may decide to make purchases in the home market, raising effective demand, which is satisfied by letting an import surplus emerge. This in turn is financed by a decline in foreign exchange reserves. In both forms, the final result is the same, although in the latter situation effective demand is raised temporarily. In either case, the net domestic impact of the budget deficit is reduced by the size of the balance of payments deficit, which may be financed by foreign aid or by the running down of reserves.
The amount of external economic aid to ECAFE countries in the six-year period ending with 1958/59 is estimated to have averaged at an annual rate of $1.1 billion,7 of which four-fifths was in the form of grants.8 The value of both grants and loans to ECAFE countries tended to rise in the six years for almost all countries.
The increase in foreign aid was the result of increasing international interest in promoting econo-mic growth of under-developed countries and the growing ability of industrially developed countries to provide assistance. Developments in the Asian countries themselves also enlivened interest in the subject of foreign aid. The absorptive capacity for foreign aid was considerably increased by the growth policies pursued by various countries, the improve-ment of administrative machinery and the assumption of direct responsibilities by governments for providing the nucleus of economic development.
Relative to their size and population, Cambodia, China: Taiwan, southern Korea, Laos and southern Viet-Nam are among the largest recipients of foreign public aid. The aid financed most or all of the budget deficits in these countries; it even exceeded the deficits in several years. Per capita aid, in countries with larger populations and with heavier economic development commitments, is growing, but continues to be small. In these and other newly developing countries, depletion of foreign assets was combined in varying proportions with foreign aid to finance the balance of payments deficits which went together with budget deficits. Countries like
7 T his figure excludes the aid received by the centrally planned econom ies o f the reg ion . T h e m o st significant of the credits was received by m a in la n d C h ina f ro m the Soviet U n ion d u r in g the eight-year period of 1950-1957; this c red it was of the o rder of 5.3 billion yu an o r abou t 3 per cen t of the recip ient country’s govern-m e n t revenue d u r in g this period .
8 P redom inance o f g ran ts , w h ich characterized earlier years has, how ever, been reduced so m ew h at in im portance in the recent years. A ll the sam e, for the reg ion as a w hole gran ts still rem ain the m a jo r source of fo re ign public econom ic assistance.
Chapter 7. Fiscal Policies 109
Indonesia, which could not fall back upon foreign assets to offset their budget deficits, experienced inflationary pressures in their domestic economy; others, like Ceylon, m aintained fairly stable domestic price levels at the expense of their foreign assets. The ogre of inflation raised his head only when an attempt was made to arrest the fall by a cut in imports.
FISCAL POLICIES IN OPERATION: SELECTED CASE STUDIES
Having considered, in general terms, the impact of budget deficits in relation to the methods employed in raising domestic finance and in relation to the balance of payments situation, influenced as it was by increasing foreign aid, we may now proceed to a somewhat more detailed review of the actual operation of fiscal policies in the economies of the region. A few case studies below illustrate the variety of situations encountered and the degree of efficacy of the fiscal measures employed. These case studies do not pretend to be comprehensive reviews of all the angles of the specific economic situations or all the measures employed by governments to tackle them as a whole. The situations are viewed only from the vantage point of fiscal policies; other factors are discussed only insofar as they hindered or helped the operation or impact of these policies. In countries like Japan, with well-developed monetary institutions and the heavy reliance of industry on bank borrowing, monetary policies, on the whole, had more potent effect than fiscal policies; in countries like India, the m ajor reliance was placed on controls — covering imports, foreign exchange, capital issues, prices and physical distribution of foodgrains or of essential producer goods such as steel and cement. The present study does not review the full arsenal of the anti-inflationary (or anti-deflationary) arm a-ment; it is an appraisal of only the main weapons of fiscal policy.
* * *
The policy of financing budget deficits by money creation is fraught with danger. Unless the m agni-tude of such deficits is kept within reasonable limits and is adjusted periodically to take the changing economic climate into account, serious pressures may emerge. Foreign exchange reserves can only be drawn upon to the extent of past accumulations which are generally small in the countries of the region. Attempts to preserve foreign exchange, to which the country is soon driven, bottle up inflation within the country giving rise to progressive increases in the cost of living, wages, and cost of production. The operation of this vicious spiral, although delayed by price controls, can hardly be checked unless domestic
production rises, even if only with a time lag. Other-wise, where national output is not rising or is rising at a slow pace, the increase in the price level may gain momentum as the government is forced to resort to larger deficits in an attempt to divert to itself a constant or rising magnitude of real resources.
The experience of Indonesia during the last decade provides an illustration of the expansion of government current expenditure while investment both in the public and private sectors was reduced (see table 20 on page 59). Government outlays resulted in sizable budget deficits, which rose from 13 per cent of government expenditure in 1953 to 34 per cent in 1958, or from 2.4 to 6.7 per cent of national income; the size of money creation on government account increased from Rp 2.5 billion to Rp 10.9 billion (see table 3 9 ). Various instruments were employed to finance government expenditure in 1953 and 1954; the only money-reducing measure was the prepayments required from importers. These amounted to a forced loan to the Government, so long as the volume of imports was maintained at a given level or continued to increase; if, on the other hand, it decreased as it did in 1956, it was then tantam ount to a loan repayment and was expansionary in effect. Other “methods of financing” pursued during these two years— a revaluation of the gold stock, borrowing from the central bank, new issue of treasury currency, and reduction in cash balances of the Government— were all expansionary in character. In 1955, the budget deficit was financed by a tax on importers. All foreign importers, and later all Indonesian importers, were required to deposit with the Government a fixed sum of money, refundable only if import operations were discontinued. This measure was responsible for the tem porary respite from inflation in 1956. This tax, like the import prepayments, was only a once-and- for-all receipt; it could not bring in recurring revenue. The Government making net refunds of import prepayments, central banks again financed the govern-ment deficits which resumed their upward course. The deficits mounted in 1957 and in 1958; during 1958, economic conditions reached their nadir since the collapse of the Korean war boom in early 1952. The main cause was the rebellion which, although crushed militarily, had serious economic repercus-sions. The disrupting effects of internal strife only added to the problems of a continuing fall in prices of m ajor exports and the dislocation in the transport and banking system which followed the Government’s assumption first of management and later of owner-ship of certain Dutch enterprises resulting in a mass exodus of Dutch managers and technicians. “To-gether these developments brought increased budget expenditures, reduced tax revenues, diminished foreign exchange earnings, delays in the development pro-

110 P a r t II . Pub lic F inance in the Postw ar Period
gram m e, a n d general d e te rio ra tio n .” 9 Investm ent outlay in 1958 fell to only 9 p e r cent of governm ent expend itu re hav ing risen to 20 p e r cent in 1954; it declined even in te rm s of absolute volum e.
T he rise in budget deficits was largely transla ted in to an increase in m oney supply in Indonesia as fu r th e r ba lance of paym ents deficits could n o t be in cu rred to any substan tia l extent. B eginning w ith the onset of the post-K orean-w ar recession, the Indonesian balance of paym ents position h ad been continuously u n d er pressure . T he heavy d ra in on reserves forced the G overnm ent to give h ig h p rio rity to the p reservation of ex ternal s tab ility in fo rm ula ting econom ic policies. Som e of these policies, fo r exam ple im p o rt su rcharges and advance deposits fo r im ports, attacked the basic p rob lem of a h igh level of effective dem and an d had the effect of reducing p ressu re on bo th the balance of paym ents an d the dom estic price level. However, o ther policies directed tow ards export p rom otion th ro u g h m easures such as reductions in export duties helped the ba lance of paym ents situa tion a t the expense of governm ent revenue.
T able 39 shows the various facto rs causative of the increase in the level of m oney supply in Indonesia . T he significant role of fiscal factors em erges; except in 1954, m oney creation on governm ent account was la rger than the increase in m oney supply. The ra te
9 Benjamin Higgins in his Introduction to Douglas S. Paauw:Financing Economic D evelopm ent: the Indonesian Case, 1960, p. 42.
of increase in m oney supply h ad slowed down d u rin g 1955 an d 1956 w ith the contraction in the size of governm ent deficits u n d er the stabilization p rogram m e. But, w ith the de te rio ra tion in the in te rna l political situa tion an d the increasing need fo r defence spending, the deficit again increased considerab ly d u rin g 1957 an d 1958, reaching record levels.
W ith such large m agnitudes of budget deficits financed by m onetary expansion , even an analysis in crude quantity-of-m oney term s m ay approxim ately describe the course of the in te rna l price s ituation; the price indices continued to rise in Indonesia, a lthough w ith a tim e lag and a t a slower pace than m oney supply.
T he s itua tion de terio ra ted fu rther in 1959; it was n o t so m uch a p ressure on balance of payments, as a con tinu ing rise in in te rna l prices, which was the resu lt of “ falling im ports, dom estic business d iso rgan ization , declining estate production, specula-tive psychological tendencies lead ing to capital flight an d a steeply r is ing m oney supply due largely to m o un ting budget deficits” .10 In A ugust 1959, a series of m onetary m easures was pu t in to effect sim ul-taneously , inc lud ing a form al change in the exchange ra te . A fu r th e r once-and-for-all financial gift to the G overnm ent was sought by the dem onetization of the R p 500 a n d R p 1,000 banknotes by 90 per cent in the sam e fash ion as the 1950 m easure which had
10 United Nations, Economic Survey o f Asia and the Far East 1959, p. 45.
Table 39. Indonesia : Causative Fac to rs in the Increase in M oney Supply an d Econom ic Indices, 1953-1959
I te m 1953 1954 1955 1956 1957 1958 F irs th a l f
1 9 5 9
T h ir dq u a r te r
F o u r thquarter
(Billion rupiahs)Money creation on account of the public
s e c t o r ........................................................ + 2 .4 5 + 3 .3 4 + 1.76 + 2 .2 7 + 5 .8 3 + 10.86 + 5.06 — 2.74Money creation on balance of payments
a c c o u n t ........................................................ — 1.56 — 0.27 + 1.03 — 1.82 — 1.02 + 0.58 — 1.57 + 2 .7 7Money creation on account of credit
expansion to the private sector . — 0.05 + 0 .4 3 — 1.29 + 0 .9 9 + 2 .2 4 — 0.85 — 0.17 + 1.37M isce llan eo u s ................................................. + 0 .0 4 — 0.03 — 0.38 — 0.28 — 1.53 — 0.14 — 0.31 — 9.03aChange in money supply . . . . + 0.88 + 3 .4 7 + 1.12 + 1.16 + 5 .5 2 + 10.45 + 3 .0 1 — 7.62 +5.51
(Indices: 1952 = 100)
Gross national productb ............................ 106 115 118 122 131 127 129Money supplyc .......................................... 113 168 185 203 287 445 490 375 528Cost of living, D jakartac (food) 112 124 168 165 257 302 315 331 342Wholesale pricesc (imported goods) 108 134 149 154 209 347
Source: Bank of Indonesia: annual Reports and quarterly Bulletins.a Including demonetized currency and frozen bank accounts under the monetary reform of August 1959. b A t constant 1955 prices. c E nd of the period.
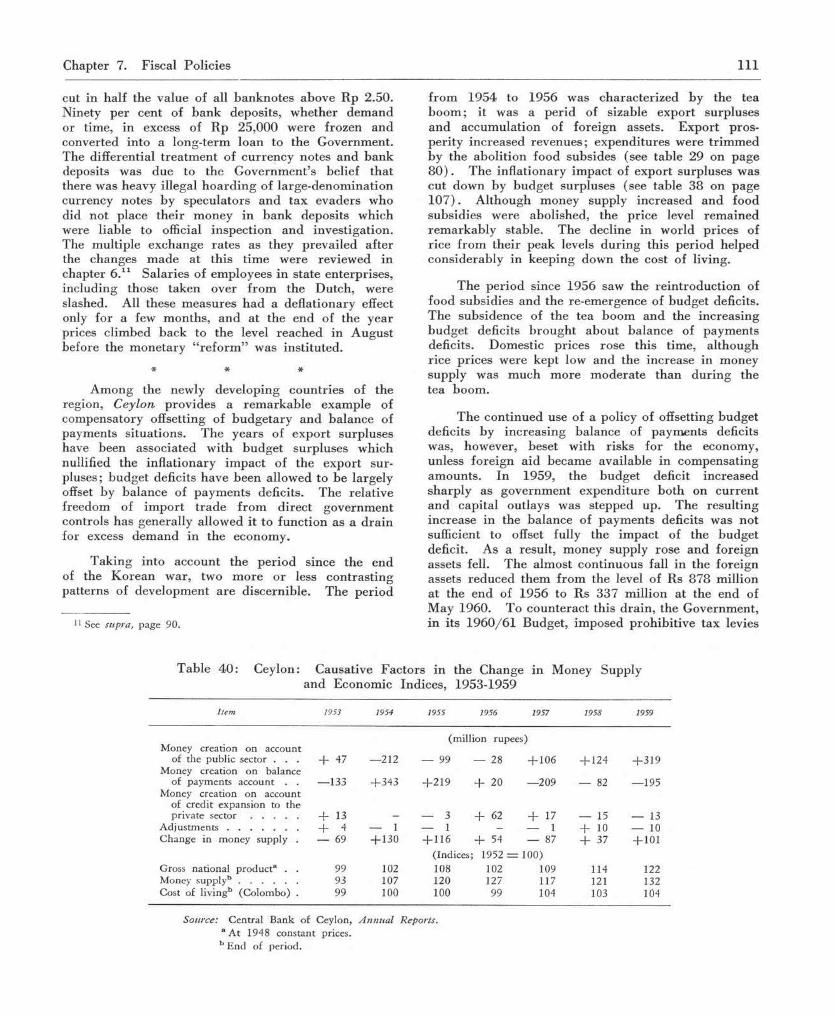
Chapter 7. Fiscal Policies 111
cut in half the value of all banknotes above Rp 2.50. Ninety per cent of bank deposits, whether demand or time, in excess of Rp 25,000 were frozen and converted into a long-term loan to the Government. The differential treatment of currency notes and bank deposits was due to the Government’s belief that there was heavy illegal hoarding of large-denomination currency notes by speculators and tax evaders who did not place their money in bank deposits which were liable to official inspection and investigation. The multiple exchange rates as they prevailed after the changes made at this time were reviewed in chapter 6.11 Salaries of employees in state enterprises, including those taken over from the Dutch, were slashed. All these measures had a deflationary effect only for a few months, and at the end of the year prices climbed back to the level reached in August before the monetary “reform ” was instituted.
* * *
Among the newly developing countries of the region, Ceylon provides a remarkable example of compensatory offsetting of budgetary and balance of payments situations. The years of export surpluses have been associated with budget surpluses which nullified the inflationary impact of the export su r-pluses; budget deficits have been allowed to be largely offset by balance of payments deficits. The relative freedom of import trade from direct government controls has generally allowed it to function as a drain for excess demand in the economy.
Taking into account the period since the end of the Korean war, two more or less contrasting patterns of development are discernible. The period
11 See supra, p age 90.
from 1954 to 1956 was characterized by the tea boom; it was a perid of sizable export surpluses and accumulation of foreign assets. Export pros-perity increased revenues; expenditures were trimmed by the abolition food subsides (see table 29 on page 80 ). The inflationary impact of export surpluses was cut down by budget surpluses (see table 38 on page 107). Although money supply increased and food subsidies were abolished, the price level remained remarkably stable. The decline in world prices of rice from their peak levels during this period helped considerably in keeping down the cost of living.
The period since 1956 saw the reintroduction of food subsidies and the re-emergence of budget deficits. The subsidence of the tea boom and the increasing budget deficits brought about balance of payments deficits. Domestic prices rose this time, although rice prices were kept low and the increase in money supply was much more moderate than during the tea boom.
The continued use of a policy of offsetting budget deficits by increasing balance of payments deficits was, however, beset with risks for the economy, unless foreign aid became available in compensating amounts. In 1959, the budget deficit increased sharply as government expenditure both on current and capital outlays was stepped up. The resulting increase in the balance of payments deficits was not sufficient to offset fully the impact of the budget deficit. As a result, money supply rose and foreign assets fell. The almost continuous fall in the foreign assets reduced them from the level of Rs 878 million at the end of 1956 to Rs 337 million at the end of May 1960. To counteract this drain, the Government, in its 1960/61 Budget, imposed prohibitive tax levies
Table 40: Ceylon: Causative Factors in the Change in Money Supply and Economic Indices, 1953-1959
I te m 1953 1954 1955 1956 1957 1958 1959
M oney creation on account of the pub lic sector . . . + 47 —212
M oney creation o n balance o f pay m en ts accoun t . . — 133 + 3 4 3
M oney creation o n account of cred it expansion to the p r iva te s e c t o r .................... + 13
A d j u s t m e n t s .............................. + 4 — 1C h a n g e in m o n ey supply . — 69 + 130
Gross national p ro d u c ta . . 99 102Money supplyb ......................... 93 107Cost of liv ingb (C o lom bo) . 99 100
(m illion rupees)
— 99 — 28 + 106 + 124 + 3 1 9
+ 2 1 9 + 20 — 209 — 82 — 195
— 3 + 62 + 17 — 15 — 13— 1 - — 1 + 10 — 10+ 116 + 54 — 87 + 37 + 101
(Indices:; 1952 = 100)108 102 109 114 122120 127 117 121 132100 99 104 103 104
Source: C en tra l B ank of Ceylon, A nnual Reports. a A t 1948 constan t prices. b E n d o f period .

112 P a r t I I . Pub lic F inance in the P ostw ar P eriod
on inessential m erchand ise im p o rts ; invisible im ports w ere severely curta iled th ro u g h the tightening-up of exchange con tro l. H owever, it is no t quite certa in w hether fiscal m easures alone will suffice. Suppose they are effective an d save foreign exchange by reducing the im ports of the com m odities taxed to such an extent th a t governm ent revenue from the taxed item s decreases. In the context of Ceylon, in th a t case, m oney th a t would have reduced governm ent deficits an d p a id fo r im ports of taxed goods, would now be available in the hands of the public. This m oney would be spent e ither a t hom e, an d thus increase the domestic im pact of governm ent deficits, o r ab ro ad — on fu r th e r im ports of item s w hich are no t as highly taxed— an d thus defeat the objective of im port saving.
Ceylon also a ttem pted to operate a co u n te r-cyclical fiscal policy d u rin g the two complete export cycles which the coun try experienced between 1950 and 1957. I t h ad some success on the revenue side; the revenue structure in Ceylon— depending largely on the taxa tion of foreign trad e and the m atching repercussion of changes in foreign trad e on receipts from other taxes, reviewed in chapter 6— has shown a ra ther h igh degree of responsiveness to the operation of contra-cyclical fiscal policies. G overnm ent ex-penditure, particu larly on investment, on the o ther hand , moved in the w rong d irec tion ; it tended to increase du ring boom periods, and the increase slowed dow n or even changed into a decrease d u rin g the dow nw ard phase of the cycles. This behav iour was q u ite con tra ry to the d ictates of com pensatory financing.
fo r m oney-creating deficits in the belief th a t a new instrum ent had been m ade available to p lan economic developm ent. T he Bom bay P lan of 1944 was one m anifestation of th is line of th inking . However, in the p rep ara tio n of the c o u n try ’s official first five-year p lan, ne t m oney c reation was kept alm ost negligible. I t was felt by the P lan n in g Com m ission tha t m oney c rea tion on governm ent account should not, unless special c ircum stances arose, exceed Rs 2.9 billion. As th is am ount corresponded to the p lanned depletion of sterling balances, no net increase in m oney supply was involved. As th ings tu rn ed out, however, h igher dom estic p roduction , pa rticu la rly in the agricu ltu ra l sector in 1 9 5 3 /5 4 — the m id-year of the p lan — com bined w ith the effects of post-K orean-w ar recession in in te rn a tio n a l m arkets, p roduced a considerable slack in the econom y at the then cu rren t level of investm ent. Both investm ent and the level of m oney c reation were ra ised in the subsequent two years. A ccord ing to the P lan n in g Com m ission, governm ent outlay on the first five-year p lan d u rin g the first th ree years of its operations totalled Rs 8.7 billion. The level of governm ent developm ent expenditure was stepped up in the last two years to Rs 11.4 b illion .12 A t the sam e time, m oney creation on governm ent account rose from a sm all ne t decrease of Rs 114 m illion d u rin g the first th ree years of the p lan to an increase of Rs 2.9 b illion d u rin g the last two years (see table 4 1 ) . Balance of paym ents recorded only a m inor deficit d u rin g 1954 and a small surplus d u rin g 1955; the d ra f t on the co u n try ’s sterling balances was sm aller than orig inally estim ated under the p lan . As a result, m oney supply increased by abou t a fifth. However, w ith sufficient food to go round , p rice level a t the end of the first p lan period Was low er th an a t the beginning.
The fa ith in m oney crea tion grew, although the policy h ad succeeded only u nder special c ircum -stances; the second five-year p lan allocated it a la rger share. T he p lan aim ed at a to tal outlay of Rs 48 billion —- Rs 38 billion fo r capital fo rm ation and Rs 10 billion in cu rren t outlays of a recu rrin g charac te r. Rs 12 billion, o r 25 p e r cent of the resources needed for financing this plan, were to be o b ta ined th ro u g h m oney-creating deficits in the public sector.
T he P lan n in g Com m ission h ad antic ipated a reduction of sterling balances by Rs 2 billion to finance balance of paym ents deficits. T his reduction w as in add ition to the balance of paym ents deficit to be financed by foreign aid . A ctual experience, however, ind icated th a t a lthough the balance of paym ents deficits cam e out substantia lly la rger than o rig inally p rov ided for, budget deficits pu t consider-
12 Government of India, R eview o f the First Five-Year Plan,(1957), p. 23.
W hile budget deficits have becom e a regu lar fea tu re of fiscal policies in m ost countries of the region, only in a few countries could the balance of paym ents deficits be used fully to offset the domestic im pact of budget deficits. In m any countries, p a r t of the budget deficits rem ained uncom pensated by a deficit in the balance of paym ents.
In In d ia , a policy of sizable balance of paym ents deficits was feasible in early years of its p lanned developm ent because of the substan tia l foreign ex-change reserves accum ulated d u rin g the w ar period. To the extent th a t these reserves w ere used fo r the im port of cap ital goods, there was m erely a shift f rom one p a rticu la r type of na tional investm ent to ano ther an d of a m ore p roductive form . L ater, the accelerated flow of foreign g ran ts and loans enabled the coun try to continue th is policy despite heavily reduced exchange reserves.
In Ind ia , the experience w ith m oney c reation on governm ent account in o rd e r to d ivert na tional resources to the w ar effort had stim ulated enthusiasm
* * *

Chapter 7. Fiscal Policies 113
Table 41. India : Causative Factors in and Economic Indices,
the Change in 1951-1959a
Money Supply
I temFirst five-year plan Second five-year planb
1951 1952 1953 1954 1955 1956 1957 1958 1959
M oney creation o n account of the pub lic s e c t o r ............................................................ — 426 + 4 5 2 — 140 + 1,020
(m illion rupees)
+ 1,857 + 2 ,9 9 7 + 4 ,9 5 6 + 3 ,3 1 4 + 2 ,5 4 9Money creation o n balance of paym ents
a c c o u n t ............................................................ — 1,611 + 6 + 2 9 3 — 230 + 161 — 2,193 — 2,598 — 539 + 159M oney creation o n accoun t o f c red it
expansion to th e p r iv a te sector . + 567 — 144 — 83 + 134 + 1,053 + 894 — 1,712 — 1,315 — 671A d j u s t m e n t s ..................................................... — 279 — 705 — 223 + 342 — 434 — 412 + 113 — 361 — 14C hange in m o n ey supp ly . . . . — 1,749 — 391 + 2 9 3 + 1,266 + 2 ,6 3 7 + 1,286 + 759 + 1,099 + 2 ,0 2 3
N et national p ro d u c tc .............................. 103 107 113(Indices; fiscal year
116 1181950 = 100)
124 123 132M oney supplyd ............................................. 91 89 91 97 110 117 121 126 138Cost of liv ingd ............................................. 105 100 107 103 97 102 110 113 120W holesale pricese ...................................... 109 96 99 95 87 98 103 106 109
Source: Reserve B ank o f In d ia : A nnua l Reports on Currency and Finance. a Fiscal years b eg in n in g 1 A pril. b F irs t fo u r years. c A t constan t 1 9 4 8 /4 9 prices. d E n d o f th e period . e C a le n d a r years; 1 9 5 0 = 100.
able pressures on the economy. While these, to some extent, were expected, various factors— some domestic and some external— combined to heighten the stresses and strains in the system earlier than was anticipated.
The second five-year plan commenced with a substantial carry-over of demand overhang from the last two years of accelerated investment financed by budget deficits in the first plan period. Food pro-duction had receded from the high level attained in 1953/54. In foreign trade, im port prices were on the uptrend in 1955 and in the first half of 1956; terms of trade worsened. The effects of these developments, together with the difficulties created by the Suez crisis at the time the second plan got into operation, were felt in the increased costs of development programmes.
The nature of the plan itself was a factor in accentuating the pressures generated by its mode of financing. The emphasis on the expansion of in -dustry led to the creation of new money incomes largely in the urban areas where it could more readily be available to the banking system as a base for credit expansion. This was in contrast to the emphasis on agriculture during the first plan, where “savings” were more likely to be held in the form of currency hoards. The decline in agricultural production also shifted the distribution of incomes against ru ra l areas. The increased production of producer goods induced further investment demand in the private sector of the economy, which in turn was reflected in higher demand for bank credit. This
demand could be met easily as new money created by the Government in financing its deficits flowed into the banking system as deposits.
The net increase in money incomes is indicated by the increase in money supply during the first two years of the second five-year plan by Rs 2 billion or roughly 10 per cent, which revealed a much slower rate of increase than the rates leading up to a total rise of 66 per cent in money supply anticipated for the five-year period of the second plan.13 The increase in domestic money incomes was contained at this level by running down the foreign exchange reserves by a substantially larger amount than was originally planned. However, even this modest increase in money incomes, coupled with the decline in agricul-tural output in 1957/58, proved a source of strain for the economy. Prices rose.
Plan outlays were readjusted in the light of these developments, and priorities were redefined; the plan was cut down to the “hard core” , reducing, in effect, its size by Rs 3 billion. As roughly Rs 15 billion had already been invested during the two years of the plan, this implied a cut of about 9 per cent for the balance of the plan period. The reduction in real terms was in fact larger, as the cost of projects
13 A n increase of abou t 25 per cen t in m oney supply was deem ed essential to finance the 25 per cent rise in national incom e a n t i -cipated over the p lan period . In fact, a la rger m one ta ry expansion was ind ica ted as necessary to m eet the transaction d em an d from increasing m o ne tiza tion o f the econom y an d the d e m a n d for la rger cashholdings, particu larly in the rural sector.
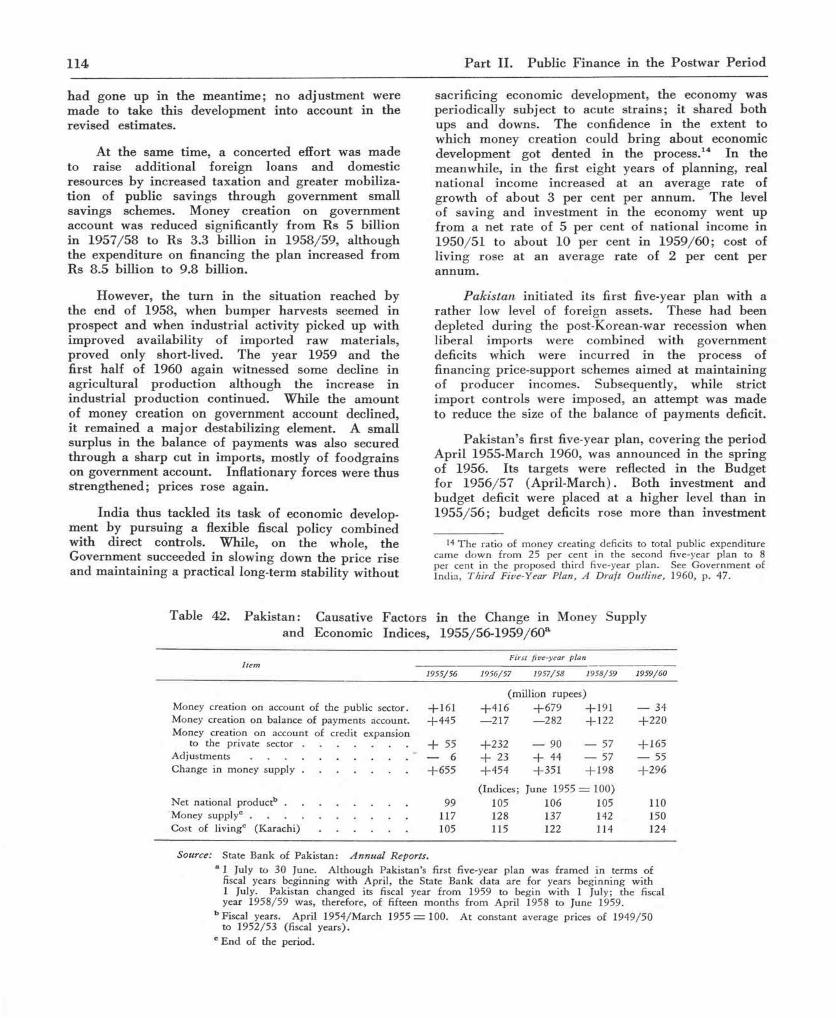
114 P a r t I I . Pub lic F inance in the P ostw ar P e riod
h ad gone up in the m ean tim e; no ad ju s tm en t w ere m ade to take th is developm ent in to account in the revised estim ates.
A t the sam e tim e, a concerted effort was m ade to ra ise ad d itiona l fore ign loans an d dom estic resources by increased taxa tion and g rea te r m obiliza-tion of public savings th ro u g h governm ent small savings schemes. M oney crea tion on governm ent account was reduced significantly from Rs 5 b illion in 1 9 5 7 /5 8 to Rs 3.3 b illion in 1958 /59 , a lthough the expend iture on financing the p lan increased from R s 8 .5 billion to 9.8 billion.
However, the tu rn in the situa tion reached by the end of 1958, when bum per harvests seemed in prospect an d w hen in d ustria l activ ity picked up w ith im proved availability of im ported raw m ateria ls, p roved only short-lived. T he year 1959 an d the first ha lf of 1960 again w itnessed some decline in ag ricu ltu ra l p roduction a lthough th e increase in industria l p roduction continued. W hile the am ount of m oney creation on governm ent account declined, it rem ained a m a jo r destabilizing element. A small surplus in the balance of paym ents was also secured th ro u g h a sh arp cut in im ports, m ostly of foodgra ins on governm ent account. In fla tionary forces were thus s trengthened; prices rose again.
In d ia thus tackled its task of econom ic develop-m ent b y p u rsu ing a flexible fiscal policy com bined w ith d irec t controls. W hile, on the whole, the Governm ent succeeded in slowing down the price rise and m ain ta in ing a prac tica l long-term stab ility w ithout
sacrific ing econom ic developm ent, the econom y was period ically subject to acute s tra in s ; it shared both ups an d downs. T he confidence in the extent to w hich m oney creation could b r in g abou t economic developm ent got dented in the process.14 In the m eanw hile, in the first eight years of p lanning , real n a tiona l incom e increased a t an average ra te of g row th of abou t 3 per cent per annum . T he level of saving an d investm ent in the econom y went up from a net ra te of 5 p e r cent of n a tiona l incom e in 1950 /51 to abou t 10 per cent in 1 9 5 9 /6 0 ; cost of liv ing rose a t an average ra te of 2 per cent per annum .
P ak is tan in itia ted its first five-year p lan w ith a ra th e r low level of foreign assets. These h ad been depleted d u rin g the post-K orean-w ar recession when liberal im ports were com bined w ith governm ent deficits w hich were incu rred in the process of financing price-support schemes a im ed at m ain ta in ing of p ro d u cer incom es. Subsequently , while stric t im p o rt contro ls w ere im posed, an a ttem pt was m ade to reduce the size of the balance of paym ents deficit.
P ak is tan ’s first five-year p lan , covering the period A pril 1955-M arch 1960, was announced in the sp ring of 1956. Its ta rge ts were reflected in the Budget fo r 1 9 5 6 /5 7 (A p ril-M arch ) . Both investm ent an d budget deficit w ere p laced at a h ig h er level th an in 1 9 5 5 /5 6 ; budget deficits rose m ore than investm ent
14 The ratio of money creating deficits to total public expenditure came down from 25 per cent in the second five-year plan to 8 per cent in the proposed third five-year plan. See Governm ent of India, T hird Five-Year Plan, A D raft Outline, 1960, p. 47.
Table 42. P ak is tan : Causative Facto rs in the Change in M oney Supply an d Econom ic Indices, 1 9 5 5 /5 6 -1 9 5 9 /6 0 a
F irs t f iv e -y e a r p la nI te m
1 9 5 5 /5 6 1 9 5 6 /5 7 1 9 5 7 /5 8 1 9 5 8 /5 9 1 9 5 9 /6 0
(m illion rupees)M oney creation on account of the pub lic sector. + 161 + 4 1 6 + 679 + 191 — 34M oney creation on balance o f paym en ts account. + 4 4 5 — 217 — 282 + 122 + 2 2 0M oney creation o n account of cred it expansion
to the p rivate s e c t o r ............................................. + 55 + 2 3 2 — 90 — 57 + 165A d j u s t m e n t s ................................................................... — 6 + 23 + 44 — 57 — 55C hange in m oney s u p p l y ............................................. + 6 5 5 + 4 5 4 + 3 5 1 + 198 + 2 9 6
(Indices; June 1955 = 100)N e t national p ro d u c tb .................................................... 99 105 106 105 110M oney supp lyc ................................................................... 117 128 137 142 150Cost of liv ingc ( K a r a c h i ) ...................................... 105 115 122 114 124
Source: State Bank of Pakistan: A nnua l Reports.a 1 July to 30 June. A lthough Pakistan’s first five-year plan was framed in terms of
fiscal years beginning w ith April, the State Bank data are for years beginning with 1 July. Pakistan changed its fiscal year from 1959 to begin with 1 July; the fiscal year 1958/59 was, therefore, of fifteen months from April 1958 to June 1959.
b Fiscal years. April 1954/M arch 1955 = 100. A t constant average prices of 1949/50 to 1952/53 (fiscal years).
c E nd of the period.

Chapter 7. Fiscal Policies 115
because of the rising expenditure on procurement and subsidization of foodgrains. A record budget deficit of Rs 1.5 billion— roughly three times the deficit in 1956/57— was incurred in 1957/58 (April-March) when investment expenditure was raised from some-what less than Rs 600 million to Rs 1.3 billion. The balance of the rise took place in non-development expenditure, prim arily on food subsidies.
The record deficit caused a strain on both the domestic and foreign trade sectors. The cost of living index at Karachi rose by 10 per cent in 1956/57 (July-June) and by another 6 per cent in the following year. The general rise in price level was probably much larger, as the cost of living index, heavily weighted in favour of food groups, was stabilized through rationed food supplies at subsidized rates. In foreign trade and balance of payments, absorption of export commodities in the domestic market due to a high level of effective demand brought about larger deficits than planned. Foreign exchange re-serves touched a low level of Rs 726 million in September 1958 when they were deemed barely sufficient to provide cover for the currency.
The 1958/59 budget deficit was, therefore, reduced by 25 per cent; it was of the same size as in 1957/58, but spread over a period of fifteen months (April 1958-June 1959). This reduction was secured through an increase in taxation, an improvement in revenue collection, a cut in subsidies, and economy in non-development expenditure. Investment outlay was also reduced to some extent. This over-all financial control, combined with credit restraint and other policies in the field of commerce and industry, was successful in bringing down the Karachi cost of living in June 1959 to a level below that of June 1957. This fall in prices was, to some extent, the consequence of dishoarding of stocks, and other impact effects of the strict measures taken by the new Government. Prices rose in 1959/60 (July- June), as the precipitous decline of late 1958 and early 1959 was corrected and a surplus achieved in the balance of payments by tightening up of imports and prices and movement of wheat in west Pakistan decontrolled. This last measure, which went into effect in May 1960, ra ise d the prices of foodgrains used in the compilation of the cost-of-living index.
On the whole, Pakistan, like India, has kept economic development in view. Its deficit financing has been tempered by the concern to m aintain a degree of stability, although price levels remained under pressure, mainly because agricultural produc-tion, particularly food production, did not rise. The policies pursued in both countries, however, remained products of expediency. The tone in any given year was set by the food situation on the domestic side and by conditions that were confronted in export
markets; economic policies had constantly to be improvised to meet threats of domestic inflation or a crisis in the balance of payments. For most of the time, and to a large extent, the outcome of the policies evolved remained a gamble— on the weather, on the changes in the terms of trade and on the availability of foreign aid.
* * *
Japan occupies a unique position in the region as the one country which had attained substantial industrial growth in the prewar period. Japan’s experience in the postwar period is, therefore, com-parable more with the industrially developed countries of North America and western Europe than with other countries of the ECAFE region. Having completed its recovery by the early ’fifties, Japan entered the phase of its growth where cyclical fluctuations, characteristic of private enterprise industrial econo-mies, constituted a m ajor economic problem. Fiscal policy had, therefore, to be geared to make adjust-ments to short-term factors disturbing economic stability.
The quest for stability and the consequent need to use compensatory fiscal policies was only one aspect of Japan’s economy. In another respect, Japan’s problems were somewhat similar to those of the newly developing countries of the ECAFE region. Japan, despite a highly industrialized economy, shared with them the fundamental problem of a basic im-balance between population and resources. Prewar Japan had worked out a stable pattern of factor proportions in its economic structure based on foreign trade and colonies, and was confronted with a big change at the end of the war, since capital had been destroyed and colonies lost, whereas the work force was growing rapidly. The basic problem of Japan, as in other countries of the region, was therefore the achievement of a high ra te of development designed to absorb the growth in the labour-force. It was an urgent and pressing problem as a low rate of growth would be powerless to solve a severe unemployment or under-employment problem, but too high a rate, while contributing most to improve the employment situation, would bring about inflationary pressures at home and imbalance in external payments.
This was the fundamental dilemma faced by fiscal policy in postwar Japan, as in other ECAFE countries. It was possible to pursue purely com-pensatory fiscal policies, which, in this background, would have merely achieved price and balance of payments stability at the cost of domestic stagnation; they were, however, adjusted to fit in with the long-range perspective of economic growth.

116 P art II. Public Finance in the Postwar Period
The monetary and fiscal history of Japan since the end of the Second W orld W ar can be broken down into two periods; the period up to 1954 of acute situations and drastic remedies, and the period since 1954 of “ inflationless prosperity” .
In the former period, anti-inflationary policies were pursued in order to counteract, first, the postwar inflation and later the inflation under the impact of the war operations in Korea. The postwar inflation was halted in 1949 by the adoption of a policy of outright deflation under the Dodge Plan. In the 1949/50 Budget, sometimes known as the “super-balanced budget” , an attempt was made to consolidate and extend budget control over special accounts which were responsible for much of the government deficit. Government expenditure was reduced; investment programmes in public works, railways and com-munications were curtailed. The use of United States aid counterpart funds was restricted to currency stabilization and economic rehabilitation; its use for foreign trade subsidization was forbidden. This in effect meant an increase in taxation and the tailoring of the expenditure to the amounts collected in revenue.
The disinflation ended as abruptly as it had begun with the outbreak of hostilities in Korea in June 1950. There was a sharp expansion of foreign demand not only for “special procurement” require-ments of the United Nations forces for the war in Korea, but also from the rest of the world for Japanese manufactures. Exports increased from the second quarter to the fourth quarter of 1950 by about 60 per cent; a small export surplus was registered for the first time in the second half of1950. Off-shore and other procurement brought in additional foreign exchange in 1951. Since imports were controlled, the accruals of foreign exchange were used to increase credits to the commercial banks to finance increased trade and industrial activity. With the profits gained from the Korean war boom, Japan-ese industry pressed home the advantage and engaged in a modernization programme. The Government relaxed import restrictions in order to facilitate this investment expansion and to reduce inflationary pressures. It also provided investment funds through several financial institutions established during this period. Commercial banks also continued to lend to industry. The Korean war had demonstrated the need to expand production capacity, and the Govern-ment was determined to play an active part in achieving results in this direction; investment loans and advances rose from 14 per cent of total government expenditure in 1948/49 to 23 per cent in 1949/50, 37 per cent in 1950/51 and 40 per cent in 1951/52. In all other respects, its expenditure policy underwent a radical change to cope with the new problem of inflation. The Government curtailed its expenditure, particularly on price adjustment
subsidies.15 The Bank rale was also raised early in1951. Nevertheless, the wholesale price index rose by about 50 per cent in the first year after the outbreak of the Korean war.
The position, however, changed radically from the middle of 1952. The increase in national economic activity— caused by widespread investment demand in public and private sectors, including the demand for accumulating inventories — led to a worsening of trade balance. Foreign exchange re-serves, which had exceeded the billion dollar mark in 1952, fell to $700 million in 1953. Inflation had made it difficult to m aintain a high level of exports. Output that might have been available for export was absorbed within the country. High prices reduced the competitiveness of many of the products, and encouraged imports. As a countermeasure, therefore, the budget outlay for the fiscal year 1954 was cut; and an attempt was made to balance receipts and expenditures. The use of the bond market to finance outlays was avoided. Surplus funds collected earlier were not released. The main cut now affected fiscal investments and loans. More im portant than these fiscal measures, however, were the monetary measures; a tight money policy was introduced in October 1953; credit was cut and the Bank rate was raised twice from 7 per cent in early 1954 to 8.5 per cent by June 1954. The reliance of industry for funds on banks, and of banks on the Central Bank, helped the disinflationary monetary policy to be put across without much difficulty. The job was effectively done. Wholesale prices declined; the gap at current rates of exchange between domestic and foreign prices narrowed, and exports became more competitive in world markets. The lower level of domestic demand also encouraged exports. The gradual removal of restrictions on imports of Japanese goods in the Sterling Area countries allowed Japan to gain an increasing share in many markets. These favourable developments helped to produce, annually from 1954 to 1956, an export surplus in the balance of payments although the receipts from special procurement ex-penditures declined.
The period of almost continuous boom since 1954 was made possible by the utilization of the capacity, built up during the Korean war boom, to meet the demand for exports without fresh investments that would have given rise to inflationary forces. Concurrently, rapid advances in productivity made more goods and services available. The economy had gathered momentum. It was, from now on, possible to finance expansion from current savings without recourse to deficit financing or an increase in bank credit. As the larger industries increased their
15 T hese subsidies, w h ich had accounted fo r 22 per cent of g o v e rn m e n t ex p en d itu re in 1 9 4 9 /5 0 , fell to 8 p e r cen t in 1950/51 an d to on ly 3 p e r cent in 195 1 /5 2 .

Chapter 7. Fiscal Policies 117
internal resources for investment, the direction of government investment and loans in the 1955 and1956 budgets shifted in favour of small and medium-sized industries (see table 26 on page 74). Govern-ment investment was increased in the so-called foundations of the economy as a qualitative supple-ment to private capital. Attention was also paid to strengthening foreign trade financing. Tax reforms were introduced in order to encourage saving and capital accumulation at all levels of income. Balanced budgets and avoidance of bond issue were the official policy in these two budgets.
The use of current savings for investment curbed excessive domestic demand and avoided inflationary conditions. The steady and substantial increase in imports was also anti-inflationary. All these factors kept prices steady, and for the first time in the postwar period in Japan, the Government succeeded in keeping monetary demands for consumption and non-consumption in the country within the limits set by available resources. The receipts from exports, instead of generating sizable new investment as during the Korean war boom or increasing consumption, were absorbed by the banking system. Deposits with banks increased relatively more than loans, borrowing from the Bank of Japan declined, and interest rates were reduced. Both financial stability and growth had been achieved hand in hand.
The first half of 1957 again witnessed an investment and inventory boom, and the balance of payments worsened. An emergency policy, this time to improve the balance of payments, was put into effect. Interest rates were raised in May, and restrictions were placed on importers by increasing advance deposit requirements and curtailing the availability of credit facilities to them. Foreign exchange allocations for some of the raw materials, such as cotton and wool, were reduced in the latter half of 1957. The Government, in its budgets for1957 and 1958, aimed at a surplus without increasing the tax burden. Government investment was post-poned or staggered; restraint was exercised in granting fiscal loans. Disbursements were kept to the needed minimum.
The policy succeeded too well; the economy, in fact, slipped into a recession in 1958. The credit squeeze really hurt. Inventories declined; idle indus-trial capacity increased; and unsold stocks of m anu-factured goods piled up. The trade imbalance had already changed into a payments surplus in the first quarter of the year; the need was now for an anti-recession policy. The Bank of Japan reduced the Bank rate twice during the year, and gradually relaxed the restrictions on bank credit expansion. Govern-ment loans to the private sector were again on the increase. Central and local governments raised and
moved forward some of the expenditure on public works to step up activity.
The expansionary effects of government expendi-ture encouraged further growth and precautionary measures were taken to prevent a resumption of inflationary pressures. The reserve requirements ratio was fixed for the first time in September 1959 and the discount rate was increased in December. The growing demand for Japanese manufactures abroad and the rising domestic demand provided the neces-sary impetus for increased industrial production in 1960. The export expansion, however, had become steadier, even though investment demand continued to be high. The Bank of Japan reduced the Bank rate in August, indicating that some re-laxation was now possible. There was a general move to liberalize imports. The 1960 budget was larger than that of the previous year by about 10 per cent, and attached importance to public works projects and expenditure which would improve land conservation and agriculture. A 14 per cent increase in loans and investments was also planned. This increase of public outlay was calculated to make up for the slower rates of growth in private industry and trade.
The emphasis among objectives of fiscal and monetary policies in Japan has thus gradually shifted during the postwar years. In the period immediately after the war, the chief preoccupation was the search for stability and the ending of the rampant inflation. A parallel and an equally important aim was to promote investment both in the private and public sectors, even if this gave rise to inflationary pressures in the short run. When prices finally threatened to get out of hand, a drastic deflation was introduced in 1949. Anti-inflationary policies were pursued during the boom period of the Korean war.
The private sector, which had been sustained by the Government till this period, was from now on set on its own feet, and was given government aid only as and when necessary. Fiscal and monetary policies aimed only at providing the basic conditions of stability which would enable the private sector to maintain a high level of economic activity. Apart from the current expenditure which showed a secular upward trend, the Government, especially in the later ’fifties, was in a position to increase the total volume of expenditure and stimulate economic activity, or reduce it so as to avoid inflationary conditions. When the economy sagged, the Government took prom pt action to set it on the m arch again; monetary and fiscal restrictions went into effect if inflationary conditions developed and the price level came under pressure.
It may, however, be noted that postwar business “ recessions” in Japan have been of much shorter duration and need not even be called so in the

118 P art II. Public Finance in the Postw ar Period
accepted sense of the term . There was never a serious fall in consum ption. On the contrary , consumption rose steeply through the years, and was an element providing stability. Government expendi-ture expanded in m any directions; the increase was distributed all over the country through local government spending. Effective dem and did not become a lim iting factor. The so-called recessions were periods ra ther of readjustm ent or of levelling off of expansion rates. W hen imbalances were observed in the trade sector or when the volume of investments grew beyond the level that could be sustained, they were quickly corrected.
The current endeavour of the Japanese economy is to press forw ard in the pursuit of economic growth with stability. As in any developed private enterprise economy, adjustments will continually be called for. Government planning has of late attem pted to assist the private sector by fram ing projections of how economic growth may affect the various industries and other key activities in the next few years. These projections, without being planned targets, are intended to influence individual decisions in the private sector to be taken in conform ity with the anticipated aggregate pattern of growth.
* * *
Fiscal policy assumes a completely different significance in a centrally planned economy. It is no longer designed to influence and modify indirectly the allocation and distribution of available resources, but to attack the problem of allocation directly according to the objectives and in the light of priorities set by the government. The planners are in a position to go behind the financial magnitudes and make assessments in real term s; the government predetermines the ratio of non-consumption or non- saleable output in the economy.
Despite the state ownership of most productive capacity and the central allocation of resources, centrally planned economies are not altogether immune from the basic problem of a developing economy, namely, how to achieve a rapid rate of growth without creating inflationary pressures in the economy. If all goods and services were subject to direct distribution by government agencies, no problem of inflationary pressures and imbalances would arise. However, as a rule, consumer goods and labour are not directly allocated in centrally planned economies but are exchanged for money. Hence the need for a financial plan as a counterpart to the plan for the physical allocation of resources, and for fiscal operations as a check on the emergence of distortions in the relationship between money flows and availabilities of goods and services constituting the saleable output.
M ainland China evolved its fiscal policy to cope with the problems of transition from a private enterprise economy to a socialist economy and of the adjustm ent of this policy to the task of economic development. In 1949, when the Central People’s Government assumed control over m ainland China, it had to face the problem of rehabilitating a badly war-torn under-developed economy in which the means of production were by and large privately owned (see table 23 on page 6 8 ). The war with Japan (1937-1945) and the civil war that followed it had seriously damaged industry, agriculture and transport, and the economy had by 1949 reached a stage of hyper-inflation. The first task of the new Government was quite simply to restore as quickly as possible the norm al processes of economic life. D uring this period, therefore, it operated a conservative fiscal rehabilitation program m e on the lines fam iliar in other countries of the region and gave a high priority to achieving and m aintaining a budget surplus. The measures included the institution of a unified and simplified taxation system, and the adoption of a comprehensive program m e for centralizing control over national revenue and expenditure. Expenditure was reduced under various economy drives, and austerity standards of pay for government employees were introduced through the “public supplies” system under which the Government provided daily necessities and a lim ited sum of disposable money. There was a large issue of “Victory Bonds” in commodity equivalent units instead of m onetary units; the strain on government finance was also relieved by a Soviet loan. On the supply side, a network of large monopolistic state-trading companies was formed to keep the supply channels running. These state- trad ing companies proved a powerful instrum ent of fiscal policy in collecting agricultural surplus in the form of profits.
While this program m e was continuing, the Government in m ainland China entered the Korean w ar in October 1950 and inflationary pressures were accentuated. Considerable efforts were made by the Government to counter these pressures. High taxa-tion, large profits of state-trading monopolies and the “army-donation cam paign” were all used to increase revenues. The government sector was ex-tended through the “Five-Anti” campaign referred to in chapter 5 .16 Efforts were also m ade to reduce expenditure; national subventions to local govern-ments were curtailed. These measures were successful in converting the deficit in 1950 to surpluses in 1951 and 1952.
The stabilization period was followed by the initiation of the first five-year plan in 1953. During the subsequent period, while both total expenditure
16 See supra, page 68.

Chapter 7. Fiscal Policies 119
and its proportion directed to capital expenditure were raised every year, an attempt was made to maintain the overall financial balance with the help mainly of larger profits “ earned” by the expanding socialized sector of the economy. At the end of1955, however, it was realized that the investment programme had been lagging behind the plan targets; considerable increase was made in expenditure in1956, with the result that a sizable deficit was reported in that year’s budget. This was accompanied by an increase in note circulation. As saleable output was reduced directly by larger investment outlays, dis-tortions in the supply-demand relationship in the economy outside the direct control of the Government were bound to emerge. There was a general shortage of subsidiary food items such as meat and egg products, of other consumer goods such as cotton and woollen cloth, leather shoes, paper and bicycles, and of producer goods such as pig iron, steel, timber and cement. This m aladjustm ent between supply and demand for a num ber of commodities led to the establishment of free markets operated under the leadership of state commercial enterprises or supply and m arketing co-operatives. The effect was to allow peasants to sell, in towns, their own production of minor local products and products from their second-ary occupations; the petty merchants were permitted to deal in goods not under state control in trade between urban and ru ral areas; and producers were left free to transact business direct with consumers, and vice versa. In the same year, the policy of “free and selective” purchases by state commercial departments from state and jo in t state-private indus-trial enterprises was also initiated to induce the
production of a larger variety of improved quality consumer goods at appropriate prices to meet the diversified demand.
Finally, an increase in wages had to be granted. The average pay of workers and employees in state departments and enterprises was raised by 14 per cent in 1956. As a result of this decision, the average wage for such workers and employees was reported to have risen in 1956 by 37 per cent over 1952.17
As it was realized that inflationary pressures were tending to create serious problems, investment programmes were cut in 1957, and emphasis in production was shifted to consumer goods industries. It was decided by the Government that, in 1956 and 1957 — the last two years of the plan, the ratio between investment in heavy and light industry should be lowered to 7:1 as against 8:1 as originally planned. This change in emphasis, besides increasing supplies of saleable output, was designed to augment government revenue through larger profits of light industrial undertakings.
The result was the restoration of the over-all surplus in the state budget, although it was obtained at a slightly reduced level of total expenditure. This policy of obtaining surpluses was carried through the years 1958 and 1959, years which were aided by a sharp increase in output.18
17 Ten Great Years, op. cit., p . 216.
18 I t m ust, how ever, be rem em bered th a t budgetary surpluses in m a in lan d C h in a are of a d ifferen t category from those in the countries of the region. See supra, pages 106-107.


ASIAN ECONOMIC STATISTICS
List of Tables
121
PageRegional statistics
1. Regional statistical s e r ie s ...............................................................................................................................................122Population and employment
2. Area and p o p u la t io n .........................................................................................................................................................1243. Crude ra tes of live births and deaths per annum .........................................................................................1254. Employment ..................................................................................................................................................................126
National accounts5. National in co m e ..................................................................................................................................................................1266. Industrial origin of net domestic product ....................................................................................................... ...1277. Expenditure on gross domestic product ....................................................................................................... ...1288. Composition of gross domestic capital formation .........................................................................................129
Production9. Index numbers of agricultural production ....................................................................................................... ...130
10. Area and production of selected agricultural commodities ................................................................... ...13111. Index numbers of industrial p ro d u c tio n ................................................................................................................ ... 13312. Production of selected com m odities............................................................................................................................. 13413. Construction — New b u i ld in g ...................................................................................................................................... 137
Transport14. Volume of traffic: railways, sea-borne shipping and civil a v ia t io n .......................................................... ... 13715. Railways: Length and rolling stock ................................................................................................................ ... 13916. Roads: Motor vehicles in u s e ...................................................................................................................................... 140
External trade17. Value of exports and imports & balance of trade ..........................................................................................14118. Direction of international trade ..............................................................................................................................14219. Composition of imports ................................................................................................................................................14620. Composition of exports ................................................................................................................................................14821. Value of imports by principal commodity groups ..........................................................................................14922. Value of exports by principal commodities an d /o r commodity groups .....................................................15123. Quantity of exports of m ajor commodities ...........................................................................................................15324. Index numbers of quantum, unit value and term s of trade ................................................................... ....15425. Balance of p a y m e n ts ..................................................................................................................................................... ....155
Prices and wages26. Index numbers of wholesale p r i c e s ..............................................................................................................................15827. Index numbers of prices received and paid by farm ers .................................................................................15928. Price quotations of m ajor export commodities ...................................................................................................15929. W a g e s .....................................................................................................................................................................................16130. Index numbers of cost of living ..............................................................................................................................161
Currency and banking31. Currency and banking ................................................................................................................................................162
Public finance32. Government revenue and expenditure ................................................................................................................ ....16633. Major components of tax r e v e n u e ..............................................................................................................................16734. Major components of government expenditure ...................................................................................................169
UNITS AND SYMBOLS EMPLOYEDUnless otherwise stated “tons” relate to metric tons, and “dollars” relate to United States dollars.The following symbols have been used throughout:* = 12 months beginning 20-23 March of the year stated. . = not applicable,‡ = 12 months beginning April of the year stated. ... = not available,† = 1 2 months ending September of the year stated. — = nil or negligible.ø = 12 months ending June of the year stated. r = revised figures from this issue.Mn = million. Figures in italics are provisional or unofficial.I, II, III, and IV for quarters of years. Figures in brackets are from national sources.Substantial breaks in the homogeneity of a series are indicated either by a horizontal line across the column
or by vertical double lines in a row of figures.
SOURCESTo ensure comparability, data compiled or published by the United Nations Statistical Office have been
incorporated wherever feasible; m aterial supplied by governments, publications of governments, of the United Nations specialized agencies and of international commodity study groups have been used as additional sources.
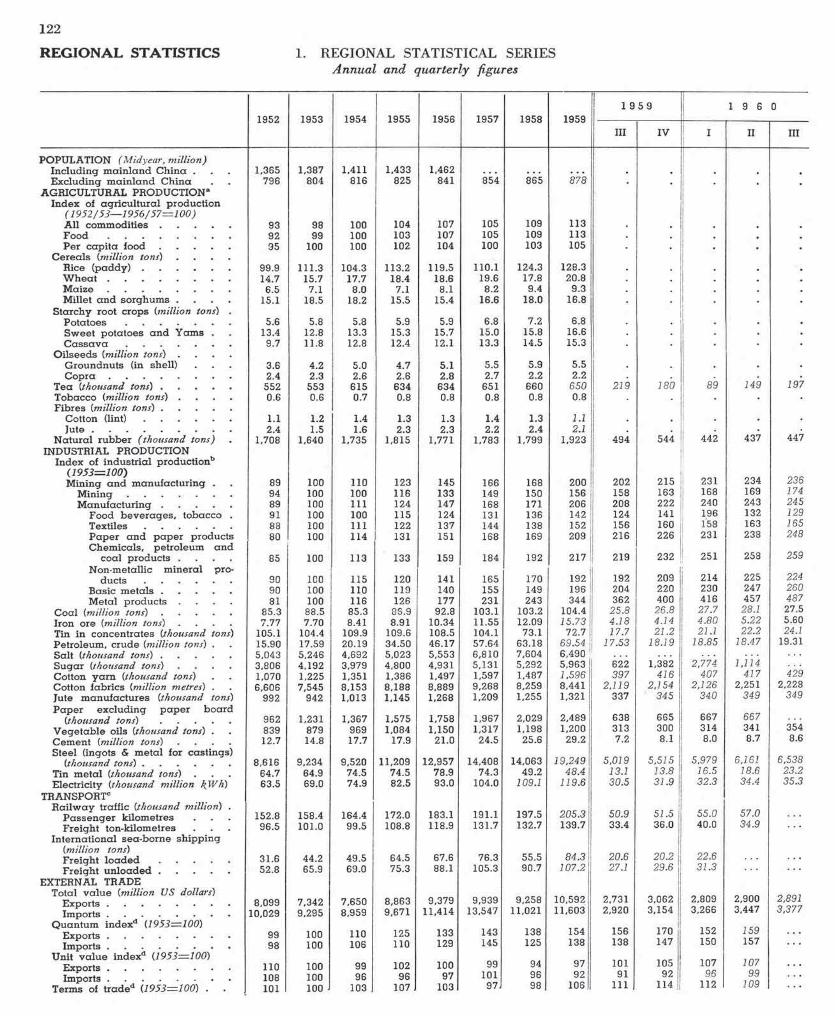
122
REGIONAL STATISTICS 1. REGIONAL STATISTICAL SERIESAnnual and quarterly figures
1952 1953 1954 1955 1956 1957 1958 19591 9 5 9 1 9 6 0
III IV I II III
POPULATION ( Midyear, m illion)Inc lud ing m a in la n d C h in a . 1,365 1,387 1,411 1,433 1,462 . . . . . .
Exclud ing m a in la n d C h ina 796 804 816 825 841 854 865 878 .
aNOITCUDORP LARUTLUCIRGAIndex of ag ric u l tu ra l p roduction
(1952 /53— 1 9 5 6 /5 7 = 1 0 0 )All c o m m o d i t i e s ............................. 93 98 100 104 107 105 109 113F o o d .................................................. 92 99 100 103 107 105 109 113P er c a p i ta fo o d ............................ 95 100 100 102 104 100 103 105
C e rea ls (million tons) . . . .Rice ( p a d d y ) .................................... 99.9 111.3 104.3 113.2 119.5 110.1 124.3 128.3W h e a t .................................................. 14.7 15.7 17.7 18.4 18.6 19.6 17.8 20.8M a i z e .................................................. 6.5 7.1 8.0 7.1 8.1 8.2 9.4 9.3Millet a n d so rg h u m s . . . . 15.1 18.5 18.2 15.5 15.4 16.6 18.0 16.8
S ta rch y root crops (million tons) .P o t a t o e s .......................................... 5.6 5.8 5.8 5.9 5.9 6.8 7.2 6.8S w ee t p o ta to es a n d Y am s . 13.4 12.8 13.3 15.3 15.7 15.0 15.8 16.6C a s s a v a .......................................... 9.7 11.8 12.8 12.4 12.1 13.3 14.5 15.3
O ilseed s (million tons) . . . .G roundnu ts (in shell) 3.6 4.2 5.0 4.7 5.1 5.5 5.9 5.5C o p r a ................................................. 2.4 2.3 2.6 2.6 2.8 2.7 2.2 2.2
197T ea (thousand t o n s ) ............................ 552 553 615 634 634 651 660 650 219 180 89 149T obacco (million tons) . . . . 0.6 0.6 0.7 0. 8 0. 8 0. 8 0.8 0. 8F ibres (million t o n s ) ............................
Cotton ( l i n t ) ................................... 1.1 1.2 1.4 1.3 1.3 1.4 1.3 1.1J u t e ........................................................ 2.4 1.5 1.6 2.3 2.3 2.2 2.4 2.1
447N a tu ra l ru b b e r ( thousand tons) 1,708 1,640 1,735 1,815 1,771 1,783 1,799 1,923 494 544 442 437INDUSTRIAL PRODUCTION
Index of industria l p roduc tionb ( 1953= 100 )
234 236M ining a n d m an u fac tu r in g . 89 100 110 123 145 166 168 200 202 215 231M i n i n g .......................................... 94 100 100 116 133 149 150 156 158 163 168 169 174M a n u f a c t u r i n g ............................ 89 100 111 124 147 168 171 206 208 222 240 243 245
Food b e v e ra g e s , tobacco . 91 100 100 115 124 131 136 142 124 141 196 132 129T e x t i l e s ................................... 88 100 111 122 137 144 138 152 156 160 158 163 165P a p e r a n d p a p e r p roducts 80 100 114 131 151 168 169 209 216 226 231 238 248C hem icals, p e tro leum a n d
259coal p roducts . . . . 85 100 113 133 159 184 192 217 219 232 ! 251 258Non-metallic m in e ra l p ro -
225 224ducts ................................... 90 100 115 120 141 165 170 192 192 209 214Basic m e t a l s ............................ 90 100 110 119 140 155 149 196 204 220 230 247 260M etal products . . . . 81 100 116 126 177 231 243 344 362 400 416 457 487
C oal (million t o n s ) ............................ 85.3 88.5 85.3 86.9 92.8 103.1 103.2 104.4 25.8 26.8 27.7 28.1 27.5Iron ore (million tons) . . . . 7.77 7.70 8.41 8.91 10.34 11.55 12.09 15.73 4.18 4.14 4.80 5.22 5.60Tin in concen tra tes (thousand tons) 105.1 104.4 109.9 109.6 108.5 104.1 73.1 72.7 17.7 21.2 21.1 22.2 24.1Petroleum , c rude (million tons) . 15.90 17.59 20.19 34.50 46.17 57.64 63.18 69.54 17.53 18.19 18.85 18.47 19.31Salt (thousand t o n s ) ............................ 5.043 5,246 4,692 5,023 5,553 6,810 7,604 6,490
1,114S u g a r (thousand tons) . . . . 3,806 4,192 3,979 4,800 4,931 5,131 5,292 5,963 622 1,382 2,774429Cotton y a rn (thousand tons) 1.070 1,225 1,351 1,386 1,497 1,597 1,487 1,596 397 416 407 417
Cotton fab rics (million metres) . 6,606 7,545 8,153 8,188 8,889 9,268 8,259 8,441 2.119 2,154 2,126 2,251 2,228Jute m an u fa c tu re s (thousand tons) 992 942 1,013 1,145 1,268 1,209 1,255 1,321 337 345 340 349 349P a p e r exclud ing p a p e r b o a rd
638 665 667 667(thousand t o n s ) ............................ 962 1,231 1,367 1,575 1,758 1,967 2,029 2,489354V e g e ta b le oils (thousand tons) . 839 879 969 1,084 1,150 1,317 1,198 1,200 313 300 314 341
C em ent (million tons) . . . . 12.7 14.8 17.7 17.9 21.0 24.5 25.6 29.2 7.2 8.1 8.0 8.7 8.6Steel (ingots & m e ta l for cas tings)
5,019 5.515 5,979 6,161 6,538(thousand to n s ) .................................... 8,616 9,234 9,520 11,209 12,957 14,408 14,063 19,249Tin m eta l (thousand tons) 64.7 64.9 74.5 74.5 78.9 74.3 49.2 48.4 13.1 13.8 16.5 18.6 23.2E l e c t r i c i t y (th o u s a n d m il l io n k W h ) 63.5 69.0 74.9 82.5 93.0 104.0 109.1 119.6 30.5 31.9 32.3 34.4 35.3
TRANSPORTcR a ilw a y traffic (thousand million) .
205.3 50.9 51.5 55.0 57.0P a ss e n g e r k ilom etres 152.8 158.4 164.4 172.0 183.1 191.1 197.5F re igh t ton-kilom etres 96.5 101.0 99.5 108.8 118.9 131.7 132.7 139.7 33.4 36.0 40.0 34.9
In te rn a tio n a l sea -b o rn e sh ip p in g(million tons)
84.3 20.6 20.2 22.6F re igh t l o a d e d ............................ 31.6 44.2 49.5 64.5 67.6 76.3 55.5F re igh t u n l o a d e d ............................ 52.8 65.9 69.0 75.3 88.1 105.3 90.7 107.2 27.1 29.6 31.3
EXTERNAL TRADET o ta l v a l u e (million US dollars)
2,731 3,062 2,809 2,900 2,8918 099 7,342 7.650 8,863 9,379 9,939 9,258 10,5929,295 8,959 9,671 11,414 13,547 11,021 11,603 2,920 3,154 3,266 3,447 3,377
Q u an tu m in dexd (1953=100)156 170 152 159E x p o r t s ..................................................
I m p o r t s ..................................................99 100 110 125 133 143 138 15498 100 106 110 129 145 125 138 138 147 150 157
Unit v a lu e indexd (1953= 100)97 101 105 107 107E x p o r t s .................................................. 110 100 99 102 100 99 94
I m p o r t s .................................................. 108 100 96 96 97 101 96 92 91 92 96 99Term s of t r a d e d (1953= 100) . 101 100 103 107 103 97 98 106 111 114 112 109
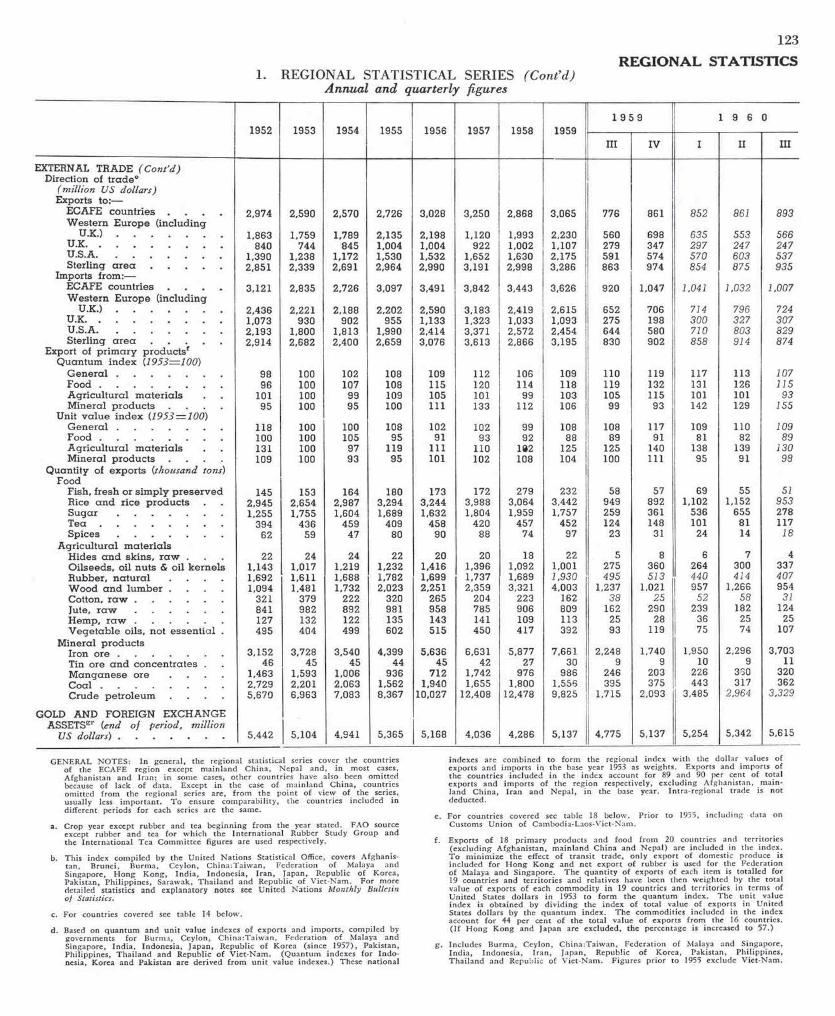
123
1. REGIONAL STATISTICAL SERIES (C ont’d ) A nnual and quarterly figures
REGIONAL STATISTICS
1952 1953 1954 1955 1956 1957 1958 19591 9 5 9 1 9 6 0
III IV I II III
EXTERNAL TRADE (C on t’d ) Direction of t r a d e e
( million US dollars) Exports to:—
ECAFE countries . . . . 2,974 2,590 2,570 2,726 3,028 3,250 2,868 3,065 776 861 852 861 893W estern Europe (including
U . K . ) ........................................... 1,759 1,789 2,135 2,198 1,120 1,993 2,230 560 698 635 553 566U.K. . . . . . . . . 840 744 845 1,004 1,004 922 1,002 1,107 279 347 297 247 247U.S.A.................................................. 1,390 1,238 1,172 1,530 1,532 1,652 1,630 2,175 591 574 570 603 537Sterling a r e a ............................. 2,851 2,339 2,691 2,964 2,990 3,191 2,998 3,286 863 974 854 875 935Imports from:—-ECAFE countries . . . . 3,121 2,835 2,726 3,097 3,491 3,842 3,443 3,626 920 1,047 1,041 1,032 1,007W este rn Europe (including
U . K . ) ........................................... 2,436 2,221 2,188 2,202 2,590 3,183 2,419 2,615 652 706 714 796 724U.K....................................................... 1,073 930 902 955 1,133 1,323 1,033 1,093 275 198 300 327 307U.S.A................................................... 2,193 1,800 1,813 1,990 2,414 3,371 2,572 2,454 644 580 710 803 829Sterling a r e a ............................. 2,914 2,682 2,400 2,659 3,076 3,613 2,866 3,195 830 902 858 914 874
fstcudorp yramirp fo tropxEQ uan tum index (1953=100)
G e n e r a l ........................................... 98 100 102 108 109 112 106 109 110 119 117 113 107F o o d ................................................. 96 100 107 108 115 120 114 118 119 132 131 126 115A gricu ltura l m ate r ia ls 101 100 99 109 105 101 99 103 105 115 101 101 93M ineral p roduc ts . . . . 95 100 95 100 111 133 112 106 99 93 142 129 155
Unit v a lu e in d ex (1953 = 100)G e n e r a l .......................................... 118 100 100 108 102 102 99 108 108 117 109 110 109F o o d ................................................. 100 100 105 95 91 93 92 88 89 91 81 82 89A gricu ltu ra l m a te r ia ls 131 100 97 119 111 110 102 125 125 140 138 139 130M ineral p roduc ts . . . . 109 100 93 95 101 102 108 104 100 111 95 91 98
Q uantity of exports (thousand tons) Food
Fish, fresh or s im p ly p re se rv e d 145 153 164 180 173 172 279 232 58 57 69 55 51Rice a n d rice p roducts 2,945 2,654 2,987 3,294 3,244 3,988 3,064 3,442 949 892 1,102 1,152 953S u g a r ........................................... 1,255 1,755 1,604 1,689 1,632 1,804 1,959 1,757 259 361 536 655 278T e a .................................................. 394 436 459 409 458 420 457 452 124 148 101 81 117S p i c e s ........................................... 62 59 47 80 90 88 74 97 23 31 24 14 18
A gricultural m a te r ia lsH ides a n d skins, r a w . 22 24 24 22 20 20 18 22 5 8 6 7 4O ilseeds, oil nu ts & oil kernels 1,143 1,017 1,219 1,232 1,416 1,396 1,092 1,001 275 360 264 300 337R ubber, n a tu ra l . . . . 1,692 1,611 1,688 1,782 1,699 1,737 1,689 1.930 495 513 440 414 407W ood a n d lu m b er . . . . 1,094 1,481 1,732 2,023 2,251 2,359 3,321 4,003 1,237 1,021 957 1,266 954Cotton, r a w ................................... 321 379 222 320 265 204 223 162 38 25 52 58 31Jute, r a w ................................... 841 982 892 981 958 785 906 809 162 290 239 182 124Hem p, r a w .................................... 127 132 122 135 143 141 109 113 25 28 36 25 25V e ge tab le oils, not e sse n tia l . 495 404 499 602 515 450 417 392 93 119 75 74 107
M ineral p roductsIron o r e .......................................... 3,152 3,728 3,540 4,399 5,636 6,631 5,877 7,661 2,248 1,740 1,950 2,296 3,703Tin ore a n d concen tra tes . 46 45 45 44 45 42 27 30 9 9 10 9 11M a n g a n ese ore . . . . 1,463 1,593 1,006 936 712 1,742 976 986 246 203 226 350 320C o a l .................................................. 2,729 2,201 2,063 1,562 1,940 1,655 1,800 1,556 395 375 443 317 362C rude pe tro leum . . . . 5,670 6,963 7,083 8,367 10,027 12,408 12,478 9,825 1,715 2,093 3,485 2,964 3.329
GOLD AND FOREIGN EXCHANGEASSETSgr (end of period, million
US d o lla rs) ........................................... 5,442 5,104 4,941 5,365 5,168 4,036 4,286 5,137 4,775 5,137 5,254 5,342..
5,615
GENERAL N O TES: In general, the reg iona l sta tis tica l series cover the countries o f the ECAFE region except m a in land C h ina, N epal and, in most cases, A fghan istan and Iran ; in some cases, o ther countries have also been om itte d because o f lack o f data. Except in the case o f m a in land C h ina, countries om itted fro m the reg iona l series are, fro m the p o in t o f v iew o f the series, usually less im p o rta n t. T o ensure co m parab ility , the countries in c luded in d iffe ren t periods fo r each series are the same.
a. Crop year except rubber and tea beg in n in g fro m the year stated. FAO source except rubber and tea fo r w h ich the In te rn a tio n a l Rubber Study G roup and the In te rn a tio n a l Tea C om m ittee figures are used respectively.
b. Th is index com piled by the U n ited N a tions S ta tistica l Office, covers A fghan is -tan, B rune i, Burm a, Ceylon, C h ina :T a iw an , Federation o f Malaya and Singapore, H o ng K o ng , In d ia , Indonesia, Ira n , Japan, R epublic o f Korea, Pakistan, P h ilipp ines , Sarawak, T h a ila n d and Republic o f V ie t-N am . F o r more detailed statistics and exp lanatory notes see U n ited N a tions M onth ly B ulletin of Statistics.
c. For countries covered see table 14 below.
d. Based on quan tum and u n it value indexes o f exports and im ports , com piled by governments fo r Burm a, Ceylon, C h ina :T a iw an , Federation o f Malaya and Singapore, In d ia , Indonesia, Japan, Republic o f Korea (since 1957), Pakistan, P h ilipp ines, T ha ila nd and Republic o f V ie t-N a m . (Q uantum indexes fo r In d o -nesia, Korea and Pakistan are derived fro m u n it value indexes.) These nationa l
indexes are com bined to fo rm the reg iona l index w ith the d o lla r values o f exports and im ports in the base year 1953 as we ights. Exports and im ports o f the countries inc luded in the index account fo r 89 and 90 per cent o f to ta l exports and im ports o f the region respectively, exc lud ing A fghan is tan, m a in -land C h ina, Ira n and N epal, in the base year. In tra -re g iona l trade is not deducted.
e. F o r countries covered see table 18 below . P rio r to 1955, in c lu d in g data on Customs U n ion o f Cambodia-Laos-V iet-N am .
f. Exports o f 18 p r im a ry products and food fro m 20 countries and te rrito ries (exc lud ing A fghan is tan, m a in land C h ina and N epa l) are inc luded in the index. T o m in im iz e the effect o f tra n s it trade, o n ly export o f dom estic produce is inc luded fo r H o n g K o ng and net export o f rubber is used fo r the Federation o f M alaya and Singapore. The q u a n tity o f exports o f each item is to ta lled fo r 19 countries and te rr ito r ie s and relatives have been then w e ighted by the to ta l value o f exports o f each com m od ity in 19 countries and te rr ito r ies in terms o f U n ited States do lla rs in 1953 to fo rm the quan tum index. The u n it value in dex is obtained by d iv id in g the index o f to ta l value o f exports in U n ited States do lla rs by the quan tum index. The com m odities included in the index account fo r 44 per cent o f the to ta l value o f exports fro m the 16 countries. ( I f H ong K o ng and Japan are excluded, the percentage is increased to 57.)
g. Includes Burm a, Ceylon, C h ina :T a iw an , Federation o f Malaya and Singapore, In d ia , Indonesia, Iran , Japan, Republic o f Korea, Pakistan, Ph ilipp ines, T h a ila n d and Republic o f V ie t-N am . Figures p r io r to 1955 exclude V ie t-N am .
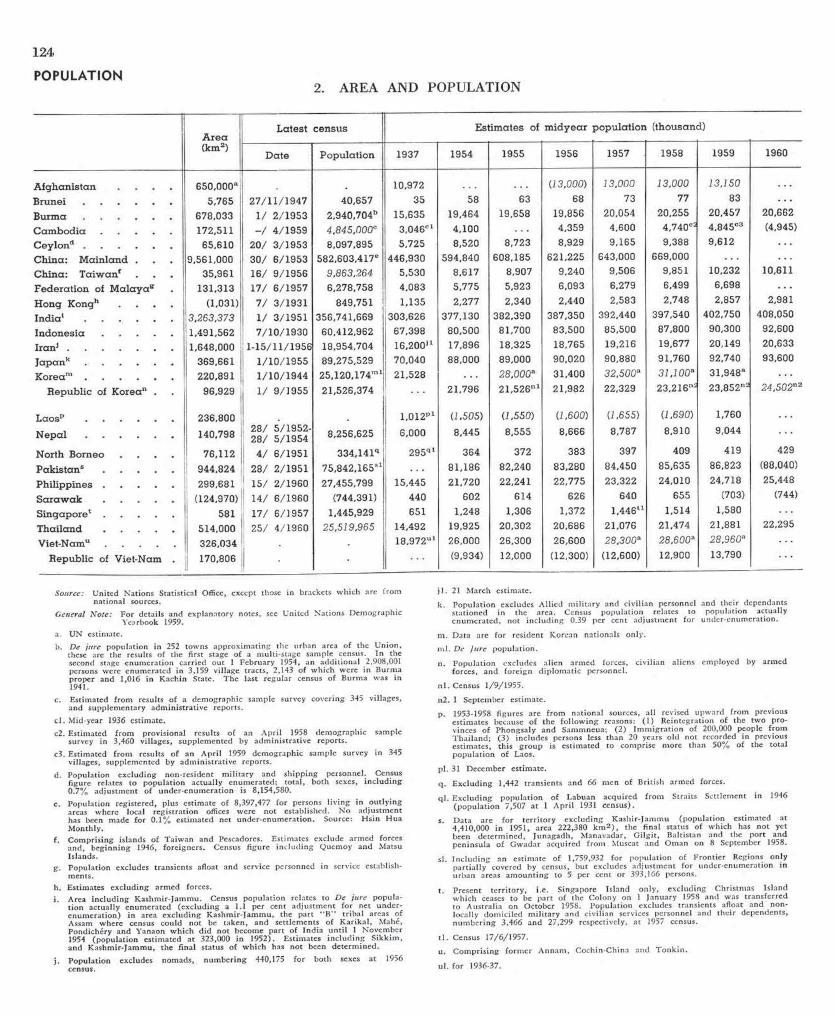
124
POPULATION2. A R E A A N D P O P U L A T IO N
A re a(km2)
L atest cen su s E stim ates of m id y e a r p o p u la t io n (thousand)
D ate Popu la tion 1937 1954 1955 1956 1957 1958 1959 1960
A fg h a n is tan . . . . 650,000a 10,972 (13,000) 13,000 13.000 13,150B r u n e i .................................... 5,765 27 /1 1 /1 9 4 7 40,657 35 58 63 68 73 77 83B u r m a .................................... 678,033 1 / 2 /1953 2,940,704b 15,635 19,464 19,658 19,856 20,054 20,255 20,457 20,662C a m b o d i a ............................. 172,511 - / 4 /1959 4,845,000c 3,046cl 4,100 4,359 4,600 4,740c2 4,845c3 (4,945)C ey lond .................................... 65,610 2 0 / 3 /1953 8,097,895 5,725 8,520 8,723 8,929 9,165 9,388 9,612C hina: M a in la n d . 9,561,000 3 0 / 6 /1953 582,603,417e 446,930 594,840 608,185 621,225 643,000 669,000C hina: T a iw a n f 35,961 16 / 9 /1956 9,863,264 5,530 8,617 8,907 9,240 9,506 9,851 10,232 10,611F ed e ra t io n of M a la y a g 131,313 1 7 / 6 /1957 6,278,758 4,083 5,775 5,923 6,093 6,279 6,499 6,698H ong Kongh . . . . (1,031) 7 / 3/1931 849,751 1,135 2,277 2,340 2,440 2,583 2,748 2,857 2,981In d ia i . . . . . . 3.263.373 1 / 3/1951 356,741,669 303,626 377,130 382,390 387,350 392,440 397,540 402,750 408,050I n d o n e s i a ............................ 1,491,562 7 /1 0 /1930 60,412,962 67,398 80,500 81,700 83,500 85,500 87,800 90,300 92,600Iran j ........................................... 1,648,000 1-15/11/1956 18,954,704 16,200j 1 17,896 18,325 18,765 19,216 19,677 20,149 20,633J a p a n k ................................... 369,661 1 /10 /1955 89,275,529 70,040 88,000 89,000 90,020 90,880 91,760 92,740 93,600K oream .................................... 220,891 1 /10/1944 25,120,174ml 21,528 28.000a 31,400 32,500a 31,100a 31,948a
R epublic of K orean . 96,929 1 / 9/1955 21,526,374 21,796 21,526nl 21,982 22,329 23,216n2 23,852n2 24,502n2
L aosp ................................... 236,800 1,012pl (1,505) (1,550) (1 ,600) (1,655) (1,690) 1,760N e p a l ................................... 140,798 2 8 / 5/1952-
2 8 / 5 /1954 8,256,625 6,000 8,445 8,555 8,666 8,787 8,910 9,044
North Borneo . . . . 76,112 4 / 6/1951 334,141q 295ql 364 372 383 397 409 419 429P a k is ta n s ............................ 944,824 2 8 / 2/1951 75,842,165s1 81,186 82,240 83,280 84,450 85,635 86,823 (88,040)P h i l i p p i n e s ............................ 299,681 15 / 2 /1960 27,455,799 15,445 21,720 22,241 22,775 23,322 24,010 24,718 25,448S a r a w a k ............................ (124,970) 14/ 6/1960 (744,391) 440 602 614 626 640 655 (703) (744)S in g a p o re t ............................ 581 1 7 / 6 /1957 1,445,929 651 1,248 1,306 1,372 1,446t1 1,514 1,580T h a i l a n d ............................ 514,000 2 5 / 4 /1960 25,519,965 14,492 19,925 20,302 20,686 21,076 21,474 21,881 22,295Viet-Namu ............................ 326,034 18,972ul 26,000 26,300 26,600 28,300a 28 ,600a 28,960a
R epublic of Viet-Nam . 170,806 (9,934) 12,000 (12,300) (12,600) 12,900 13,790
Source: United Nations Statistical Office, except those in brackets w hich are from national sources.
General Note: For details and explanatory notes, see United N ations Demographic Yearbook 1959.
a. UN estimate.b. De jure population in 252 towns approxim ating the urban area of the Union,
these are the results of the first stage o f a multi-stage sample census. In the second stage enum eration carried out 1 February 1954, an additional 2,908,001 persons were enum erated in 3,159 village tracts, 2,143 o f w hich were in Burma proper and 1,016 in K achin State. The last regular census of Burm a was in 1941.
c. Estimated from results o f a dem ographic sample survey covering 345 villages, and supplem entary adm inistra tive reports.
c l . Mid-year 1936 estimate.c2. Estimated f rom provisional results of an April 1958 dem ographic sample
survey in 3,460 villages, supplem ented by adm inistra tive reports.c3. Estimated from results o f an A pril 1959 dem ographic sample survey in 345
villages, supplem ented by adm inistra tive reports.d. Population excluding non-resident m ilitary and shipping personnel. Census
figure relates to popula tion actually enum erated; total, both sexes, inc lud ing 0.7% adjustm ent of under-enum eration is 8,154,580.
e. Population registered, plus estimate of 8,397,477 for persons living in outly ing areas w here local registration offices w ere no t established. N o ad justm ent has been m ade for 0.1% estim ated net under-enum eration . Source: H sin H ua Monthly.
f . C om prising islands o f Ta iw an and Pescadores. Estimates exclude arm ed forces and, beginning 1946, foreigners. Census figure inc lud ing Quemoy and Matsu Islands.
g. Population excludes transients afloat and service personned in service establish-ments.
h. Estimates excluding arm ed forces.i. Area inc lud ing K ashm ir-Jam m u. Census popula tion relates to De jure popu la-
tion ac tually enum erated (excluding a 1.1 per cent ad justm ent for net u n der-enum eration) in area excluding K ashm ir-Jam m u, the part “ B” tr iba l areas of Assam w here census could no t be taken, and settlem ents of K arikal, Mahe, Pondichéry and Yanaon w hich d id no t become part of Ind ia un ti l 1 November 1954 (popula tion estim ated a t 323,000 in 1952). Estimates inc lud ing Sikkim , and K ashm ir-Jam m u, the final s tatus of w hich has not been determ ined.
j . Population excludes nom ads, num bering 440,175 for both sexes a t 1956 census.
j l . 21 March estimate.
k. Population excludes Allied m ilitary and civilian personnel and the ir dependants s tationed in the area. Census popu la tion relates to popula tion actually enum erated , not inc lud ing 0.39 per cent ad justm ent for under-enum eration.
m . D ata are for resident Korean nationals only.m l. De Jure popula tion .
n. Population excludes alien arm ed forces, civilian aliens employed by arm ed forces, and foreign d ip lom atic personnel.
n l . Census 1 /9 /1955 .
n2. 1 September estimate.
p. 1953-1958 figures are from national sources, all revised upw ard from previous estimates because o f the fo llow ing reasons: (1) Reintegration of the tw o pro-vinces of Phongsaly and Sam m neua; (2) Im m igra t ion of 200,000 people from Tha iland; (3) includes persons less than 20 years old no t recorded in previous estimates, this g ro u p is estim ated to comprise m ore than 50% of the total popu la tion of Laos.
p 1. 31 Decem ber estimate.
q . Excluding 1,442 transients and 66 m en of British arm ed forces.
q l. Excluding popula tion of Labuan acqu ired from Straits Settlem ent in 1946 (popula tion 7,507 a t 1 A pril 1931 census).
s. D ata are for te rrito ry excluding K ashir-Jam m u (popula tion estim ated at 4,410,000 in 1951, area 222,380 k m 2 ) , the final status of which has n o t yet been determ ined , Junagadh , M anavadar, G ilgit, Baltistan and the port and peninsula of G wadar acquired from Muscat and O m an on 8 September 1958.
s1. Includ ing an estim ate o f 1,759,932 for popula tion of Frontier Regions on ly partia lly covered by census, but excludes ad justm ent for under-enum eration in u rban areas am oun ting to 5 per cent or 393,166 persons.
t. Present te rrito ry , i.e . S ingapore Island only, excluding Christm as Island w hich ceases to be p a r t of the Colony on 1 January 1958 and was transferred to A ustralia on October 1958. Population excludes transients afloat and non- locally domiciled m ilitary and civilian services personnel and the ir dependents, num bering 3,466 and 27,299 respectively, at 1957 census.
t l . Census 17/6 /1957.u. Com prising form er A nnam , Cochin-China and T onkin .
u l. for 1936-37.
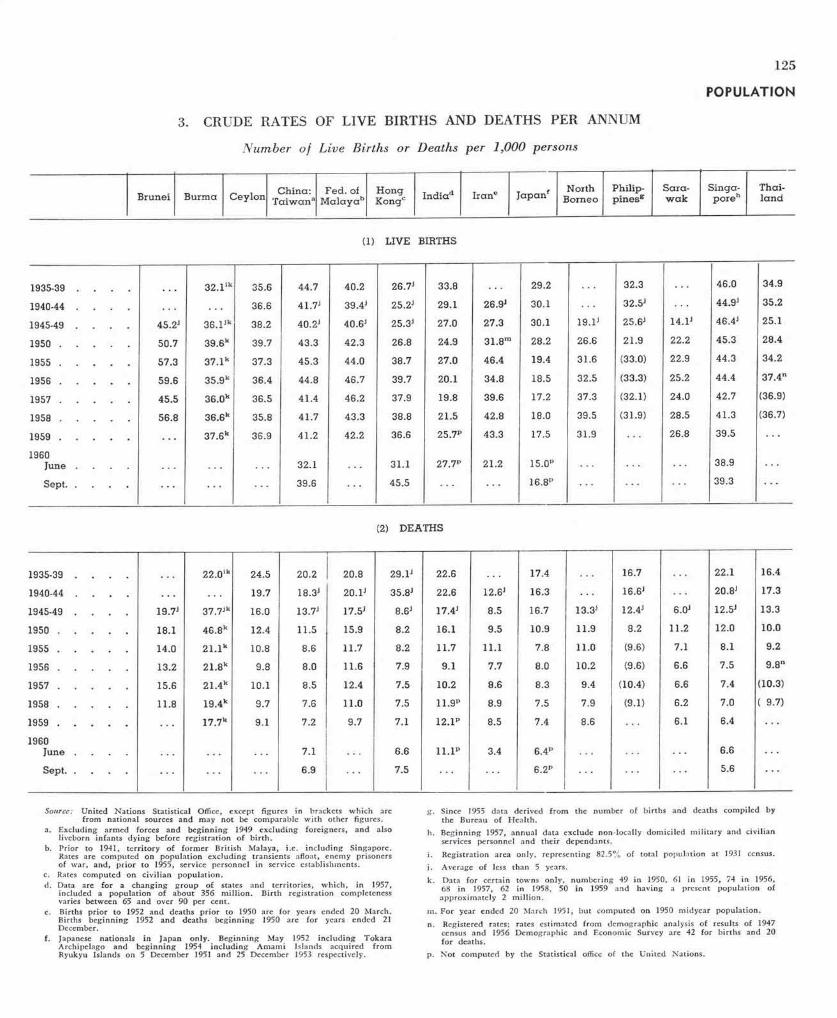
POPULATION
3. CR U D E RA TES O F L IV E B IR T H S A N D D EA TH S P E R ANN U M
N u m b e r o f L iv e B irths o r D eath s p e r 1 ,0 0 0 persons
Brunei B urm a C eylon C hina:T a iw a n a
Fed. of M a la y a b
H ongK ongc In d ia d Ira n e J a p a n f North
BorneoPhilip-p in esg
S a ra -w a k
Singa-p o re h
T hai-la n d
(1) LIVE BIRTHS
1935-39 . . . . 32.1ik 35.6 44.7 40.2 26.7j 33.8 29.2 32.3 46.0 34.9
1940-44 . . . . 36.6 41.7j 39.4j 25.2j 29.1 26.9j 30.1 32.5j 44.9j 35.2
1945-49 . . . . 45.2j 36.1lk 38.2 40.2j 40.6j 25.3j 27.0 27.3 30.1 19. 1j 25.6j 14.1j 46.4j 25.1
1950 ............................ 50.7 39.6k 39.7 43.3 42.3 26.8 24.9 31.8m 28.2 26.6 21.9 22.2 45.3 28.4
1955 ............................ 57.3 37.1k 37.3 45.3 44.0 38.7 27.0 46.4 19.4 31.6 (33.0) 22.9 44.3 34.2
1956 ............................ 59.6 35.9k 36.4 44.8 46.7 39.7 20.1 34.8 18.5 32.5 (33.3) 25.2 44.4 37.4n
1957 ............................ 45.5 36.0k 36.5 41.4 46.2 37.9 19.8 39.6 17.2 37.3 (32.1) 24.0 42.7 (36.9)
1958 ............................ 56.8 36.6k 35.8 41.7 43.3 38.8 21.5 42.8 18.0 39.5 (31.9) 28.5 41.3 (36.7)
1959 ............................ 37.6k 36.9 41.2 42.2 36.6 25.7P 43.3 17.5 31.9 26.8 39.5
1960June . . . . 32.1 31.1 27.7P 21.2 15.0P 38.9
Sept......................... 39.6 45.5 16.8P . . . 39.3
(2) DEATHS
1935-39 . . . . 22.0ik 24.5 20.2 20.8 29.1j 22.6 17.4 16.7 22.1 16.4
1940-44 . . . . 19.7 18.3j 2 0 .1j 35.8j 22.6 12 . 6j 16.3 16.6j 20.8j 17.3
1945-49 . . . . 19.7j 37.7ik 16.0 13.7j 17.5j 8 .6 j 17.4j 8.5 16.7 13.3j 12.4j 6.0j 12.5j 13.3
1950 ............................ 18.1 46.8k 12.4 11.5 15.9 8.2 16.1 9.5 10.9 11.9 8.2 11.2 12.0 10.0
1955 ............................ 14.0 21. l k 10.8 8.6 11.7 8.2 11.7 11.1 7.8 11.0 (9.6) 7.1 8.1 9.2
1956 ............................ 13.2 21.8k 9.8 8.0 11.6 7.9 9.1 7.7 8.0 10.2 (9.6) 6.6 7.5 9.8n
1957 ............................ 15.6 21.4k 10.1 8.5 12.4 7.5 10.2 8.6 8.3 9.4 (10.4) 6.6 7.4 (10.3)
1958 ............................ 11.8 19.4k 9.7 7.6 11.0 7.5 11.9 p 8.9 7.5 7.9 (9.1) 6.2 7.0 ( 9.7)
1959 ............................ 17.7k 9.1 7.2 9.7 7.1 12.1p 8.5 7.4 8.6 6.1 6.4
1960June . . . . 7.1 6.6 11 .1p 3.4 6.4P 6.6
Sept......................... 6.9 7.5 6 .2 P 5.6
Source: U nited N ations Statistical Office, except figures in brackets w hich are from national sources and m ay no t be comparable w ith o ther figures.
a. Excluding arm ed forces and beg inn ing 1949 exclud ing foreigners, and also liveborn infants dying before registration o f birth .
b. Prior to 1941, te rrito ry o f form er British Malaya, i.e. inc luding Singapore. Rates are com puted on popula tion excluding transients afloat, enemy prisoners of w ar, and , p r io r to 1955, service personnel in service establishments.
c. Rates com puted on civilian popula tion .d. Data are for a chang ing g roup o f states and territories, w hich , in 1957,
included a popula tion of about 356 m illion . B irth registration completeness varies between 65 and over 90 per cent.
e. Births prio r to 1952 and deaths p rio r to 1950 are for years ended 20 March. Births beginning 1952 and deaths beg inn ing 1950 are for years ended 21 December.
f. Japanese nationals in Japan only. Beginning May 1952 inc lud ing Tokara Archipelago and beg inn ing 1954 inc lud ing A m am i Islands acquired from Ryukyu Islands on 5 December 1951 and 25 December 1953 respectively.
g. Since 1955 data derived from the num ber of births and deaths com piled by the Bureau of H ealth.
h. Beginning 1957, annual data exclude non-locally domiciled m ilitary and civilian services personnel and the ir dependants.
i. Registration area only, representing 82.5% of total popula tion a t 1931 ccnsus.j . Average o f less than 5 years.k. Data for certain towns only, num bering 49 in 1950, 61 in 1955, 74 in 1956,
68 in 1957, 62 in 1958, 50 in 1959 and having a present popula tion of approxim ately 2 million.
m . For year ended 20 March 1951, bu t com puted on 1950 m idyear popula tion .n . Registered rates; rates estimated from dem ographic analysis of results of 1947
census and 1956 D em ographic and Economic Survey are 42 for births and 20 for deaths.
p. N o t com puted by the Statistical office of the United Nations.
125
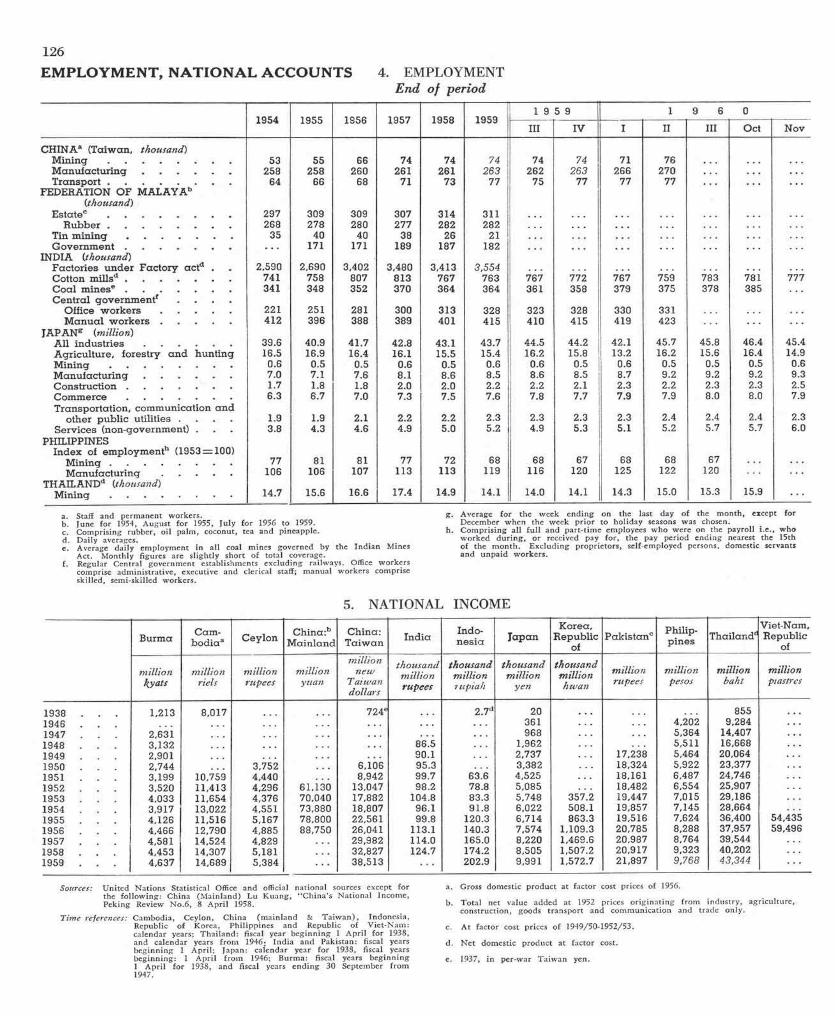
126
EMPLOYMENT, N ATIO NAL ACCOUNTS 4. EM PLOYMENTE nd o f period
1954 1955 1956 1957 1958
-------------
19591 9 5 9 1 9 6 0
III IV I II III Oct Nov
CHINAa (T aiw an , thousand)M i n i n g .................................................. 53 55 66 74 74 74 74 74 71 76M a n u f a c t u r i n g .................................... 258 258 260 261 261 263 262 263 266 270T r a n s p o r t .................................................. 64 66 68 71 73 77 75 77 77 77
FEDERATION OF MALAYAb(thousand)
E sta tec .................................................. 297 309 309 307 314 311R u b b e r .................................................. 268 278 280 277 282 282
Tin m i n i n g ........................................... 35 40 40 38 26 21G o v e r n m e n t ........................................... 171 171 189 187 182
INDIA (thousand)Fac to ries u n d e r F a c to ry ac td . 2,590 2,690 3,402* 3,480 3,413 3,554Cotton millsd ........................................... 741 758 807 813 767 763 767 772 767 759 783 781 777C o a l m inese ........................................... 341 348 352 370 364 364 361 358 379 375 378 385C e n tra l g o v e rn m en tf . . . .
Office w o r k e r s ............................ 221 251 281 300 313 328 323 328 330 331M a n u a l w o r k e r s ............................. 412 396 388 389 401 415 410 415 419 423
JAPANg (m illion)All i n d u s t r i e s ................................... 39.6 40.9 41.7 42.8 43.1 43.7 44.5 44.2 42.1 45.7 45.8 46.4 45.4A gricu ltu re , fo restry a n d h u n tin g 16.5 16.9 16.4 16.1 15.5 15.4 16.2 15.8 13.2 16.2 15.6 16.4 14.9M i n i n g .................................................. 0.6 0.5 0.5 0.6 0.5 0.6 0.6 0.5 0.6 0.5 0.5 0.5 0.6M a n u f a c t u r i n g ................................... 7.0 7.1 7.6 8.1 8.6 8.5 8.6 8.5 8.7 9.2 9.2 9.2 9.3C o n s t r u c t i o n .......................................... 1.7 1.8 1.8 2.0 2.0 2.2 2.2 2.1 2.3 2.2 2.3 2.3 2.5C o m m e r c e .......................................... 6.3 6.7 7.0 7.3 7.5 7.6 7.8 7.7 7.9 7.9 8.0 8.0 7.9T ransporta tion , com m unication a n d
o ther pub lic utilities . . . . 1.9 1.9 2.1 2.2 2.2 2.3 2.3 2.3 2.3 2.4 2.4 2.4 2.3Serv ices (non-governm ent) . 3.8 4.3 4.6 4.9 5.0 5.2 4.9 5.3 5.1 5.2 5.7 5.7 6.0
PHILIPPINESIndex of em ploym en th (1953 = 100)
M i n i n g ................................................. 77 81 81 77 72 68 68 67 68 68 67M a n u f a c t u r i n g ............................ 106 106 107 113 113 119 116 120 125 122 120
THAILANDd ( thousand)M i n i n g ................................................. 14.7 15.6 16.6 17.4 14.9 14.1 14.0 14.1 14.3 15.0 15.3 15.9
a. Staff and perm anent w orkers.b. June fo r 1954, A ugust fo r 1955, Ju ly fo r 1956 to 1959.c. C o m pris ing rubber, o i l pa lm , coconut, tea and pineapple.d . D a ily averages.e. Average d a ily em ploym ent in a l l coal m ines governed by the In d ia n M ines
A ct. M o n th ly figures are s lig h t ly short o f to ta l coverage.f . Regular C entra l governm ent establishments exc lud ing ra ilw ays. Office w o rkers
comprise adm in is tra tive , executive and c le rica l staff; m anual w o rkers com prise s k ille d , sem i-sk illed w orkers.
g . Average fo r the week e n d ing on the last day o f the m on th , except fo r December w hen the week p r io r to h o liday seasons was chosen.
h. C o m p ris in g a l l f u l l and p a rt-tim e employees w h o w ere on the p a y ro ll i.e ., who w o rke d d u r in g , o r received pay fo r , the pay period end ing nearest the 15th o f the m o n th . E xc lu d in g p rop rie to rs , self-em ployed persons, domestic servants and u npa id w o rkers.
5. NATIONAL INCOME
Burm a C am -b o d ia a C eylon C h in a :b
M ain lan dC hina:
T a iw a n In d ia Indo-n e s ia J a p a n
Korea,R epublic
ofP a k is ta n c Philip-
p in es T h ailan d dViet-Nam,Republic
of
millionkyats
millionriels
millionrupees
millionyuan
m illion new
Taiwan dollars
thousandmillionrupees
thousandm illionrupiah
thousandmillion
yen
thousandmillionhwan
millionrupees
millionpesos
m illionbaht
millionpiastres
1938 . . . 1,213 8,017 724e 2.7d 20 8551946 . . . 361 4,202 9,2841947 . . . 2,631 968 5,364 14,4071948 . . . 3,132 86.5 1,962 5,511 16,6681949 . . . 2,901 90.1 2,737 17,238 5,464 20,0641950 . . . 2,744 3,752 6,106 95.3 3,382 18,324 5,922 23,3771951 . . . 3,199 10,759 4,440 8,942 99.7 63.6 4,525 18,161 6,487 24,7461952 . . . 3,520 11,413 4,296 61,130 13,047 98.2 78.8 5,085 18,482 6,554 25,9071953 . . . 4,033 11,654 4,376 70,040 17,882 104.8 83.3 5,748 357.2 19,447 7,015 29,1861954 . . . 3,917 13,022 4,551 73,880 18,807 96.1 91.8 6,022 508.1 19,857 7,145 28.6641955 . . . 4,126 11,516 5,167 78,800 22,561 99.8 120.3 6,714 863.3 19,516 7,624 36,400 54,4351956 . . . 4,466 12,790 4,885 88,750 26,041 113.1 140.3 7,574 1,109.3 20,785 8,288 37,957 59,4961957 . . . 4,581 14,524 4,829 29,982 114.0 165.0 8,220 1,469.6 20,987 8,764 39,5441958 . . . 4,453 14,307 5,181 32,827 124.7 174.2 8,505 1,507.2 20,917 9.323 40,2021959 . . . 4,637 14,689 5,384 38,513 202.9 9,991 1,572.7 21,897 9,768 43,344
Sources: U n ite d N a tions S ta tis tica l Office and o ffic ia l na tion a l sources except fo r a. Gross dom estic p ro d u c t at fa c to r cost prices o f 1956.the fo llo w in g : C h ina (M a in la n d ) L u K u ang , “ C h in a ’s N a tio n a l Incom e,P eking Review N o .6 , 8 A p r i l 1958. b . T o ta l net value added a t 1952 prices o r ig in a t in g fro m in d u s try , a g ricu ltu re ,
. . cons truc tion , goods tran spo rt and com m un ica tion and trade o n ly .T im e references: Cam bodia, C eylon, C h ina (m a in la nd & T a iw a n ), Indonesia,
R epublic o f Korea, P h ilipp ines and Republic o f V ie t-N a m : c A t facto r cost prices o f 1949/50-1952/53.calendar years; T h a ila n d : fiscal year be g in n in g 1 A p r i l fo r 1938,and calendar years fro m 1946; In d ia and Pakistan: fiscal years dom estic p ro d u c t at fa c to r cost,b eg inn ing 1 A p r i l; Japan: calendar year fo r 1938, fiscal yearsbeg in n in g : 1 A p r i l f ro m 1946; B urm a: fiscal years b e g in n in g e- 1937, in per-w ar T a iw an yen.1 A p r i l fo r 1938, and fiscal years e nd ing 30 September fro m 1947.
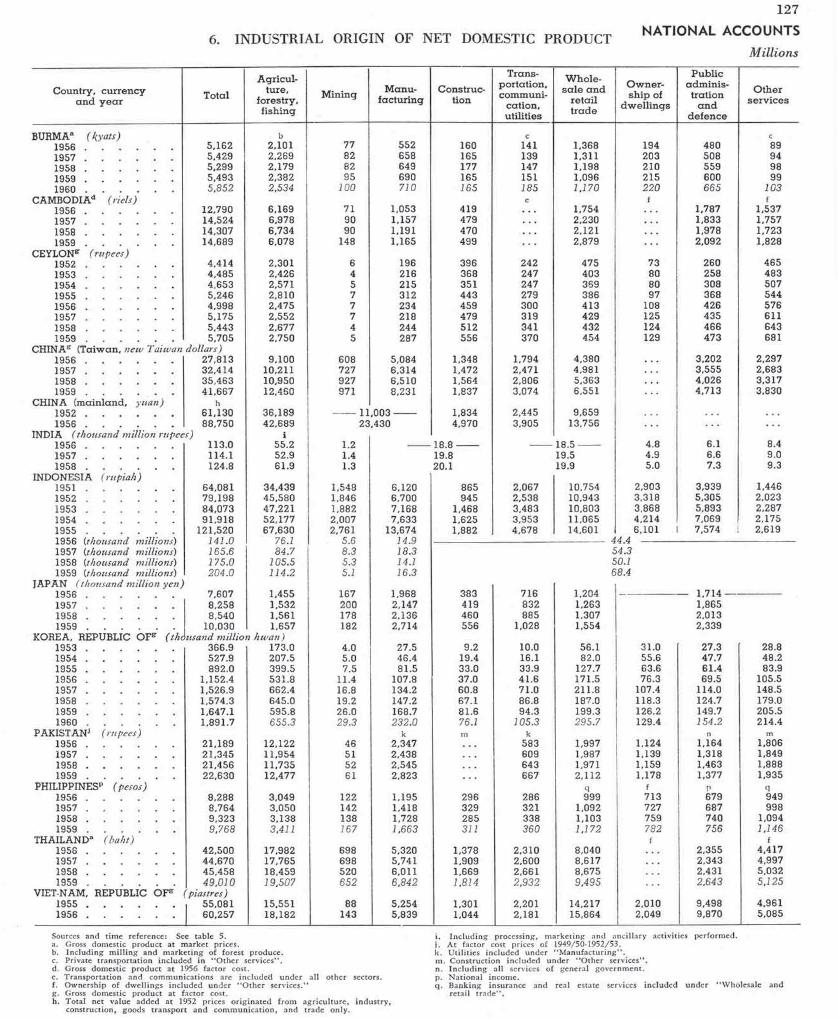
6. IN D U S T R IA L O R IG IN O F N E T D O M ESTIC PR O D U C T
127
NATIONAL ACCOUNTSM illion s
Country, cu rren cy a n d y e a r Total
A gricul-ture,
forestry,fishing
M ining M a n u -facturing
Construc-tion
T rans-portation ,com m uni-
cation ,utilities
W h o le -s a le and
re ta il t rad e
BURMAa (kyats) b c1956 ................................... 5,162 2,101 77 552 160 141 1,3681957 ................................... 5,429 2,269 82 658 165 139 1,3111958 ................................... 5,299 2,179 82 649 177 147 1,1981959 ................................... 5,493 2,382 95 690 165 151 1,0961960 ................................... 5,852 2,534 100 710 165 185 1,170
CAMBODIAd (riels) e1956 ................................... 12,790 6,169 71 1,053 419 1,7541957 ................................... 14,524 6,978 90 1,157 479 2,2301958 ................................... 14,307 6,734 90 1,191 470 2,1211959 ................................... 14,689 6,078 148 1,165 499 2,879
CEYLONg (rupees)1952 ................................... 4,414 2,301 6 196 396 242 4751953 ................................... 4,485 2,426 4 216 368 247 4031954 ................................... 4,653 2,571 5 215 351 247 3691955 ................................... 5,246 2,810 7 312 443 279 3861956 ................................... 4,998 2,475 7 234 459 300 4131957 ................................... 5,175 2,552 7 218 479 319 4291958 ................................... 5,443 2,677 4 244 512 341 4321959 ................................... 5,705 2,750 5 287 556 370 454
CHINAg (Taiw an, new Taiwan dollars)1956 ................................... 27,813 9,100 608 5,084 1,348 1,794 4,3801957 ................................... 32,414 10, 211 727 6,314 1,472 2,471 4,9811958 ................................... 35,463 10,950 927 6,510 1,564 2,806 5,3631959 ................................... 41,667 12,460 971 8,231 1,837 3,074 6,551
CHINA (m ainland, yuan) h1952 ................................... 61,130 36,189 ------- 11 ,003------- 1,834 2,445 9,6591956 ................................... 88,750 42,689 23,430 4,970 3,905 13,756
INDIA (thousand million rupees) i1956 ................................... 113.0 55.2 1.2 ----- 1 8 .8 ------ ----- 18 .5-------1957 ................................... 114.1 52.9 1.4 19.8 19.51958 ................................... 124.8 61.9 1.3 20.1 19.9
INDONESIA (rupiah)1 9 5 1 ................................... 64,081 34,439 1,548 6,120 865 2,067 10,7541952 ................................... 79,198 45,580 1,846 6,700 945 2,538 10,9431953 ................................... 84,073 47,221 1,882 7,168 1,468 3,483 10,8031954 ................................... 91,918 52,177 2,007 7,633 1,625 3,953 11,0651955 ................................... 121,520 67,630 2,761 13,674 1,882 4,678 14,6011956 (thousand millions) 141.0 76.1 5.6 14.91957 (thousand millions) 165.6 84.7 8.3 18.31958 (thousand millions) 175.0 105.5 5.3 14.11959 (thousand millions) 204.0 114.2 5.1 16.3
JAPAN ( thousand million yen )1956 ................................... 7,607 1,455 167 1,968 383 716 1,2041957 ................................... 8,258 1,532 200 2,147 419 832 1,2631958 ................................... 8,540 1,561 178 2,136 460 885 1,3071959 ................................... 10,030 1,657 182 2,714 556 1,028 1,554
KOREA, REPUBLIC O Fg ( th ousand million h w a n )1953 ................................... 366.9 173.0 4.0 27.5 9.2 10.0 56.11954 ................................... 527.9 207.5 5.0 46.4 19.4 16.1 82.01955 ................................... 892.0 399.5 7.5 81.5 33.0 33.9 127.71956 ................................... 1,152.4 531.8 11.4 107.8 37.0 41.6 171.51957 ................................... 1,526.9 662.4 16.8 134.2 60.8 71.0 211.81958 ................................... 1,574.3 645.0 19.2 147.2 67.1 86.8 187.01959 ................................... 1,647.1 595.8 26.0 168.7 81.6 94.3 199.31960 ................................... 1,891.7 655.3 29.3 232.0 76.1 105.3 295.7
PAKISTANj (rupees) k m k1956 ................................... 21,189 12,122 46 2,347 583 1,9971957 ................................... 21,345 11,954 51 2,438 609 1,9871958 ................................... 21,456 11,735 52 2,545 643 1,9711959 ................................... 22,630 12,477 61 2,823 667 2,112
PHILIPPINESp (pesos) q1956 ................................... 8,288 3,049 122 1,195 296 286 9991957 ................................... 8,764 3,050 142 1,418 329 321 1,0921958 ................................... 9,323 3,138 138 1,728 285 338 1,1031959 ................................... 9,768 3,411 167 1,663 311 360 1,172
THAILANDa (baht)1956 ................................... 42,500 17,982 698 5,320 1,378 2,310 8,0401957 ................................... 44,670 17,765 698 5,741 1,909 2,600 8,6171958 ................................... 45,458 18,459 520 6,011 1,669 2,661 8,6751959 ................................... 49,010 19,507 652 6,842 1,814 2,932 9 ,495
VIET-NAM, REPUBLIC O Fg (piastres)1955 .................................... 55,081 15,551 88 5,254 1,301 2,201 14,2171956 ................................... 60,257 18,182 143 5,839 1,044 2,181 15,864
O w n er-sh ip of
dw e llings
194203210215220
f
73808097
108125124129
4.84.9 5.0
2,9033,3183,8684,2146, 101
31.055.663.6 76.3
107.4118.3 126.2129.4
1,1241,1391,1591,178
f713727759782
f
2,0102,049
Publica d m in is-tra tion
a n ddefence
480508559600665
1,7871,8331,9782,092
260258308368426435466473
3,2023,5554,0264,713
6.16.67.3
3,9395,3055,8937,0697,574
O therse rv ice s
89949899
103f
1,5371,7571,7231,828
465483507544576611643681
2,2972,6833,3173,830
8.49.09.3
1,4462,0232,2872,1752,619
28.848.283.9
105.5148.5 179.0205.5 214.4
m1,8061,8491,8881,935
q949998
1,0941.146
f4,4174,9975,0325.125
4,9615,085
Sources and time reference: See table 5.a. Gross domestic product a t m arke t prices.b. Including m i ll ing and m arke ting of forest produce.c. Private transportation inc luded in “ O ther services” .d. Gross domestic product a t 1956 factor cost.e. Transportation and com munications are inc luded u nder all other sectors.f. Ownership of dwellings inc luded under “ O ther services.”g. Gross domestic product a t factor cost.h. Total net value added a t 1952 prices orig inated from agriculture, industry,
construction, goods tran spo rt and com m unication , and trade only.
i. Inc lud ing processing, m arke ting and ancillary activities perform ed. j. A t factor cost prices of 1949/50-1952/53.k. Utilities inc luded under “ M anufacturing” .m . Construction inc luded under “ O ther services” .n. Inc luding all services of general governm ent.p. N ational income.q. Banking insurance and real estate services inc luded under “ Wholesale and
retail t rade” .
44.454.3 50.168.4
c
1,7141,8652,0132,339
27.3 47.761.469.5
114.0124.7149.7154.2n

NATIONAL ACCOUNTS
7. E X P E N D IT U R E ON GROSS D O M ESTIC PR O D U C TM illions
C onsum ption ex p en d itu re
G e n e ra l P r iv a te g o v e rn -
m ent
G rossfixed
c a p i ta lform ation
In c rea sein
stocks
Exports le ss
im ports of g o o d s
a n d se rv ice s
G ross dom estic p ro d u c t
a t m ark e t p rices
Less ind irec t ta x n e t
ofsu b s id ie s
Lessd e p re c ia -
tion
Less ne t factor
incom e p a y m e n ts
a b ro a d
Net na tio n a l p roduct a t factor
cost (national income)
BURMA (kyats)1956 ................................... 3,383 688 952 — 22 161 5,162 — 394 — 290 — 12 4,4661957 .................................... 3,865 746 1,018 67 — 267 5,429 — 545 — 302 — 1 4,5811958 .................................... 3,606 846 1,135 48 — 336 5,299 — 514 — 318 — 14 4,4531959 .................................... 3,600 875 1,015 110 — 107 5,493 — 506 — 325 — 25 4,6371960 ................................... 3,986 971 1,034 51 — 190 5,852 — 344
CEYLON (rupees)1953 ................................... 3,672 619 475 27 — 77 4,717 — 232 — 71 — 38 4,3761954 ................................... 3,555 599 436 34 374 4,997 — 344 — 56 — 47 4,5511955 ................................... 3,969 629 549 50 412 5,608 — 362 — 18 — 61 5,1671956 ................................... 3,762 809 550 34 — 12 5,143 — 145 — 57 — 55 4,8851957 ................................... 4,127 856 661 — 262 5,382 — 207 — 295 — 51 4,8291958 ................................... 4,145 924 683 — 89 5,663 — 220 — 221 — 41 5,1811959 ................................... 4,448 960 806 — 158 6 ,0 5 6a — 328 — 300 — 44 5,384
CHINA (T aiw an, new Taiwa 1956 ...................................
n dollars) 23,032 6,132 4,007 851 — 1,667 203,23 — 4,489 — 1,767 — 5 26,041
1957 ................................... 26,994 7,125 5,044 1,209 — 2,323 38,049 — 5,635 — 2,369 — 63 29,9821958 ................................... 28,818 8,296 6,381 1,193 — 3,074 41,673 — 6,210 — 2,613 — 23 32,8271959 ................................... 33,436 9,798 8,478 1.240 — 4,451 48,697 — 7,030 — 3,132 — 22 38,513
INDIA ( thousand million rupe 1956 ...................................
es)7.9 — 4.1 — 7.7 0.1 113.1
1957 ................................... 9.2 — 4.5 — 8.9 — 114.0
JAPANb )ney noillim dnasuoht( 1956 ................................... 5,510 945 2,231 722 — 68 9,339 — 873 — 789 — 32 7,5741957 ................................... 5,970 987 2 ,727 468 — 15 10,136 — 965 — 942 — 39 8,2201958 ................................... 6,298 1,081 2,773 32 230 10,415 — 1,049 — 1,050 — 35 85051959 ................................... 6,837 1,177 3,510 890 149 12,561 — 1,183 — 1,263 — 39 9,991
KOREA, REPUBLIC O F (th 1953 ...................................
ousand million 337.9
h w an)36.8 28.6 17.3 — 36.9 383.7 — 16.8 — 15.4 5.7 357.2
1954 ................................... 457.3 66.3 62.0 12.7 — 37.8 560.5 — 32.6 — 26.0 6.2 508.11955 ................................... 807.2 97.9 107.2 16.1 — 91.8 936.6 — 44.6 — 42.3 13.6 863.31956 ................................... 1,154.2 133.4 128.5 — 31.3 — 178.7 1,206.1 — 53.7 — 56.8 13.7 1,109.31957 ................................... 1,371.5 204.6 200.9 45.5 — 206.8 1,615.7 — 88.8 — 71.5 14.2 1,469.61958 ................................... 1,394.7 250.6 219.4 10.4 — 168.3 1,706.8 — 132.5 — 81.1 14.0 1,507.21959 ................................... 1,437.7 294.3 265.0 — 29.9 — 127.1 1,840.0 — 192.9 — 88.9 14.5 1,572.7
PHILIPPINES (pesos)1956 ................................... 7,873 800 777 95 — 8 9,537 — 677 — 441 — 131 8,2881957 ................................... 8,523 853 890 146 — 293 10,119 — 747 — 480 — 128 8,7641958 ................................... 8,950 911 851 38 — 84 10,666 — 748 — 487 — 108 9,3231959 ................................... 9,109 931 901 90 + 130 11,161 — 742 — 522 — 129 9,768
THAILANDb (baht)1956 ................................... 29,400 4,400 5,322 561 — 200 42,500 — 2,417 — 2,125 — 200 37,757
1957 ................................... 33,579 3,151 6,434 788 — 520 44,670 — 2,893 — 2,233 — 253 39.291
1958 ................................... 35,233 4,710 6,670 443 — 1,495 45,458 — 2,983 — 2,273 — 150 40,052
1959 ................................... 37,657 5,122 7,334 638 — 1.288 49,010 — 3 ,216 — 2,450 — 136 43,208
VIET-NAM, REPUBLIC OF 1955 ...................................
(piastres ) 53,625 14,058 4,912 — 8,331 64,264 — 6,338 — 2,845 — 646 54,435
1956 ................................... 59,266 13,208 4,021 — 7,076 69,419 — 6,335 — 2,827 — 761 59,496
Sources and tim e reference: see table 5.
a. Includ ing statistical discrepancy.
b. Items do n o t reconcile on account of statistical discrepancy.
128

NA TIONAL A C C O U N T S
8. COMPOSITION OF GROSS DOMESTIC CAPITAL FORMATION
Millions
Sources and t im e reference: see table 5.
a. Increase in stocks o f local governm ent enterprises is inc luded under f ixed capital fo rm a tion .
129
Country, currency and. y e a r
G rossdom esticc ap i ta l
form ation D w ell ingsNon-
re s id en t ia lbu ild in g s
By ty p e of c a p i ta l goods
O th e r construc-tion a n d
w orks
T ransporte q u ip m e n t
M a ch in e rya n d
equ ip m en t
Priv a tee n te r -p r ise s
Publicco rpo ra -
tions
F I X E D C A P I T A L F O R M A T I O N
In c rea sein
stocksG e n e ra lg o v e rn -
m en t
G o v e rn -m en ten te r -p r ises
By ty p e of p u rc h a s e r
BURMA (kyats)1956 . . . .1957 . . . .1958 . . . .1959 . . . .1960 . . . .
CEYLON (rupees)1953 . . . .1954 . . . .1955 . . . .1956 . . . .1957 . . . .1958 . . . .1959 . . . .
9301,085 1,183 1,1251,085
502.3469.5 598.7583.6660.6 682.6 805.5
601616664615
182.2217.1 302.0297.4313.5355.5375.2
143.599.2
124.4133.0 187.8149.1206.4
351402471400
42.326.915.012.912.927.0 49.7
107.0 92.3
107.3 101.5146.4151.0 174.2
433509600456454
230.1191.5 250.3 246.9 320.0312.2438.5
353297296335
580
244.9244.0298.4302.9 340.6370.4367.0
166212239224
226748
11051
27.334.050.033.8
CHINA (Taiwan, new Taiwan dollars)1956 .1957 .1958 .1959 .
INDONESIA (rupiah)1951 . . . .1952 . . . .1953 . . . .1954 . . . .1955 . . . .1956 . . . .1957 . . . .1958 . . . .1959 . . . .
JAPAN ( thousand million yen )1956 . . . .1957 . . . .1958 . . . .1959 . . . .
KOREA, REPUBLIC OF (thousand million hw an)1953 . . . .1954 . . . .1955 . . . .1956 . . . .1957 . . . .1958 . . . .1959 . . . .
PHILIPPINES (pesos)1956 . . . .1957 . . . .1958 . . . .1959 . . . .
THAILAND ( baht)1952 . . . .1953 . . . .1954 . . . .1955 . . . .1956 . . . .1957 . . . .1958 . . . .1959 . . . .
45.974.7
123.3246.4
97.2229.8235.1
8721,036
889991
4,2965,0945,2836,6895,8837,2227,1127,972
7.014.7 20.0 22.621.730.242.2
123140113120
9.320.130.843.529.6 55.0 67.4
90112
98124
6.010.926.160.732.655.7 60.0
223232208213
1,1791,8311,8451,8741,9392,6062,7593,033
2,7062,9363,0963,0993,3833,8283,9104.301
2,3242,5832,5732,7193,2815,3455,3645,432
654858986
1,095911814849
1.062
9071,3261,3821,1591,130
275456840
411327342
1,716561788443638
13153350
210217175163
95146
3890
554658643688
245298332338
96108100106
1.96.6
10.827.515.220.2 20.9
4.49.7
19.546.629.4 58.374.5
24.950.5 84.1
119.896.6
146.1181.8
1.77.3
13.2 40.4 17.730.233.2
2.04.29.9
40.714.243.150.0
17.3 12.7 16.1 45.5
— 31.310.4
— 29.9
8511,2091,1931,240
722.5 467.7
32.5889.5
681.6835.3908.0
1,066.6
1,8002,0001,6583,1202,8122,8752,7523,0712,232
649944
1,2721,952
1,5812,0112,5782,793
1,7772,0892,5313,733
4,6406,3206,1804,2664,8975,1424,8485,2286,653
1,548.9 1,891.71,864.92.443.0
1,7122,1642,6653,785
252398587503
a
2,050.82,513.52,544.83,233.5
8291 ,1211,780
2,0431,0381,3231,405
615685
1,005
179.7213.5 228.1 276.1
4,8586,2537,5749,718
6,4408,3207,8387,3867,7098,0177,6008,2998,885
2 ,953.0 3,194.7 2,805.44,399.1

130
PRODUCTION
9. INDEX NUMBERS OF AGRICULTURAL PRODUCTION
1952/53— 1 9 5 6 /5 7 = 1 0 0
Total w orld(excl. C h in a F a r E as t C hina:
T a iw a nF e d e r a - Korea, Philip-
p in esUSSR a n d E as te rn
(excl.China)
B urm a C ey lon tion of M a la y a
In d ia In d o n e s ia Ja p a n R epublicof
P a k is ta n T hailand
Europe)
ALL COMMODITIES
1952/53 . . 96 93 102 94 95 95 90 93 96 86 99 93 891953/54 . . 98 98 98 95 96 93 100 98 85 105 97 98 1061954/55 . . 99 100 96 101 99 99 101 105 94 105 102 99 861955/56 . . 102 104 96 108 101 105 102 102 114 106 98 101 1051956/57 . . 105 107 107 102 109 108 107 103 110 98 104 109 1141957/58 . . 104 105 93 106 115 108 103 105 114 107 101 111 951958/59 . . 106 109 107 110 120 110 108 108 118 111 100 114 1071959/60 . . 112 113 113 110 118 117 109 109 124 115 106 115 112
FOOD
1952/53 . . 95 92 102 97 95 90 90 89 97 86 96 94 891953/54 . . 99 99 98 90 97 89 101 98 85 107 100 99 1081954/55 . . 99 100 96 101 99 101 101 106 94 104 103 100 841955/56 . . 102 103 97 113 100 103 102 102 114 106 96 101 1051956/57 . . 105 107 108 99 108 116 106 104 110 98 104 107 1141957/58 . . 105 105 92 101 114 114 102 105 114 108 101 110 911958/59 . . 110 109 109 106 119 111 108 111 119 113 99 114 1041959/60 . . 112 113 115 109 116 121 109 112 126 116 106 114 108
CEREALS
1952/53 . . 97 90 101 99 94 102 86 89 98 92 96 95 911953/54 . . 101 101 96 77 98 94 106 98 84 112 102 98 1141954/55 . . 97 99 97 108 102 95 100 110 94 105 104 98 791955/56 . . 101 103 98 122 97 97 103 101 117 102 90 103 1011956/57 . . 104 107 108 94 108 112 106 102 105 90 107 105 1151957/58 . . 104 103 87 107 112 114 100 102 108 101 104 100 791958/59 . . 112 109 110 124 115 102 111 111 111 104 99 116 991959/60 . . 114 115 117 121 113 125 112 111 118 107 115 115 103
PER CAPUT FOOD PRODUCTION
1952/53 . . 98 95 104 102 102 95 93 92 99 87 99 98 931953/54 . . 100 100 98 92 101 90 102 100 86 107 102 101 1101954/55 . . 99 100 96 101 99 102 101 106 94 104 103 100 841955/56 . . 100 102 98 110 97 102a 101 101 113 106 94 98 1031956/57 . . 102 104 106 95 101 111 104 101 108 96 102 103 1101957/58 . . 100 100 90 94 103 105 98 99 111 105 97 103 861958/59 . . 103 103 105 97 104 99 102 102 114 108 94 103 971959/60 . . 103 105 109 96 98 104 103 100 119 109 99 100 99
PER CAPUT CEREAL PRODUCTION
1952/53 . . 100 93 103 105 102 107 89 91 101 94 99 100 951953/54 . . 102 102 97 79 102 96 107 99 85 112 103 100 1161954/55 . . 97 99 97 108 102 95 100 111 94 105 104 98 791955/56 . . 100 102 97 119 94 96a 101 100 116 101 89 101 1001956/57 . . 101 104 106 89 101 107 103 99 103 88 105 100 1111957/58 . . 99 98 85 99 101 105 97 96 105 98 100 93 751958/59 . . 105 103 105 112 100 91 106 102 107 99 94 105 921959/60 . . 105 107 112 108 95 108 105 99 112 100 107 101 94
Source: FAO.General N o te : Food crops com prise the fo llo w in g : Cereals, sugar, ro o t crops, pulses, oilseeds, f ru its , vegetables, and livestock and d a iry products. Cereals
in c lu d in g : r ice , w heat, m aize, m ille t , sorghum , barley, oats, rye .C om m od ities o the r than food in c lu d in g : tobacco, fibres, in d u s tr ia l oilseeds, rubber, and bevesage crops.
a. N o t com parable to previous series fro m th is year fo rw a rd because o f the use o f a new p opu la tion series.

PRODUCTION10. AREA AND PRODUCTION OF SELECTED AGRICULTURAL COMMODITIES
Production (1,000 tons)
RICE (paddy)A f g h a n i s t a n ...........................................B r u n e i .........................................................B u r m a ..................................................C a m b o d i a ...........................................C e y l o n ..................................................China: M a i n l a n d .............................
T a i w a n .............................Federation of M a la y a . . . .Hong Kong ...........................................I n d i a .........................................................I n d o n e s i a ...........................................I r a n .........................................................J a p a n .........................................................Korea, Republic o f .............................L a o s .........................................................N e p a l .........................................................North B o r n e o ....................................P a k i s t a n ..................................................P h i l i p p i n e s ...........................................S a r a w a k ..................................................T h a i l a n d ..................................................Viet-Nam, R epublic of . . .
WHEATA f g h a n i s t a n ...........................................China: M a i n l a n d .............................
T a i w a n .............................I n d i a .........................................................I r a n .........................................................J a p a n .........................................................Korea, R epublic o f .............................P a k i s t a n ..................................................
BARLEYI n d i a .........................................................I r a n .........................................................J a p a n .........................................................Korea, R epublic o f .............................P a k i s t a n ..................................................
MAIZEB u r m a ..................................................C a m b o d i a ...........................................China: T a i w a n .............................I n d i a .........................................................Indonesia ...........................................J a p a n .........................................................P a k i s t a n ..................................................P h i l i p p i n e s ...........................................T h a i l a n d ..................................................Viet-Nam, R epublic of . . .
SUGARCANEB u r m a ..................................................China: M a in lan d
T a i w a n .............................Indiaa .................................................Indonesia ...........................................J a p a n .........................................................P a k i s t a n ...........................................P h i l i p p i n e s ....................................T h a i l a n d ..................................................Viet-Nam, R epublic of
POTATOESChina: T a iw a n .............................I n d i a .........................................................J a p a n .........................................................Korea, Republic o f .............................P a k i s t a n ..................................................
MILLET & SORGHUMBurma ( m i l l e t ) ....................................C e y l o n ..................................................China: T a iw a n .............................I n d i a .........................................................J a p a n .........................................................Korea, R epublic o f .............................P a k i s t a n ..................................................
SWEET POTATOES & YAMSC e y l o n ..................................................China: T a iw a n .............................I n d i a .........................................................I n d o n e s i a ...........................................J a p a n .........................................................Korea, R epublic o f .............................P h i l i p p i n e s ...........................................Viet-Nam, R epublic of . . .
A re a (1,000 hec ta re s)
1948-52 1956 1957 1958 1959 1960 1948-52 1956 1957 1958 1959 1960
2,488
13,500
16,073
3,739
7,4604,812
9,8902 ,5001,531
3,938
2,647904
2,301
151
28
1,165401
35
897a
2,808
6,120
755448
6,8431,449
737
2,308 903
3144,71312,402
52615,6263,255
5201,066
6614,4193,668
987,2755,311
429,9293,1031,459
1183,915
2,7151,0002,308
818 141
12217
3,6732 ,101
104488989317
26
(1,118)13,931
76,2427,659b
14,331
4,417a824a
3,252(288)
915,466
8858
562
272,8941,5552,7196,981
401835384
316 2
6,5901,183
763113,700
2,356 714
3346,26111,968
43514,9913,254
5221,202
5612,0283,685
1027,0504,594
2,10028,950
407,8652,7001,261
993,601
2,274950
2,076714171
266912
3,4352,634
111474
1,01618629
(1,057)13,5258,093
71,5847,257b
228(15,668)
4,309a761a
32,356 3,395
317 276
32
816,716
10476
526
322,9581,0633,1036,370
397849
35,2311,410
65286,800
2,287799
3037,92611,448
48014,3283,086
4991,089
4712,8953,203
805,6653,192
23,65036
9,4032,8001,330
1333,664
2,872980
2,160720131
23100
93,0851,860
97449856137
18
(1,321)10,2017,522
69,9247,247b
22415,117
4,147a870a
31,9983,372
349261
39149
15,3479588
462
272,6931, 1122,6536,227
351812293
36,4641,530
57482,450
2,226786
2843,55511,403
44013,6232,506
5501,043
5613,7413,346
808,2973,412
24,80027
8,7602,7001,375
1333,392
2,8151,0002,340
837146
27140
113,0781,965
8345689511531
1,2508,6557,083
69,0516,796b
235(12,842)
9,5373,830a
484a
31,7252,749
272262
3714
813,923
10090
628
472,5681,1102,6387,073
364828245
3336
5,4811,372
57058,188
1,682635
37 33,383
9,441424
11,9912.924
5401.134
4212,3992,767
986,8462,469
1,700 15,912
136,0871,8601,375
923,685
2,3847 6 7
2,020594150
2873
72,1651,536
57384696
3130
1,0764,3804,727
53,8658,266
9510,1167,700
990
1,6472,451
227
5617
612,045
13392
581
38 2,100
8941,6726,074
271465
4,283
825
7,200
3,308
9,3043,306
5,6853,244
12,751
602(124)
5,124
3,326
838
255
5073
1,845269
32
2,087
(506)
225
18275
34,0341,385
477
776378
932,918
7,197259
3,2891,113
6501,295
319,7633,324
(109)5,2263,086
2,000
2312,531
601(125)
4,921
3,336
893780217
56100
4,2322,307
48485
1,313199 27
(38)
(99)2,095
8510231131
27
353200(47)
166
35,14860
1651,261
11226223382366c52
19075
2103
3,9981,247
50232,761
778357
932,956
6,990223
3,2421,108
6961,335
319,1023,329
1105,1082,432
2,00026,637
2311,857
595127
4,609
3,055
910775252
5458
94,2322,702
49461
1,33312531
(36)
(101)1,944
978
52423413125
333205
4944
153
1 036,095
68166
1,246
1122917544935948
191
33,8681,260
46132,257
783365
932,151
6,798250
3,2321,049
6071,295
319,2623,154
814,4432,719
27,55520
13,589
61 5 144
4,743
3,531
928815213
54100
83,9742,087
48435
1,7169620
36
(98)2,056
907
50723012731
321209
5744
1583510
35,21571
1601,132
12229148404364
4619059
24,0481,250
43633,329
784360
932,277
6,702280
3,2251,097
5501.300
309,0872,768
805,7622,540
27,28616
12,3672,900
657123
4,559
3,4181,000
978790218
55130
83,7582,232
49 433
1,7878228
28
(91)2,050
947
419235121
18
1286208
4840
1824210
34,74378
1651,476
12230156384386
4618950
33,7581,127
37326,819
762341
1630,092
5,876220
2,9961.050
8251.295
33 9,003 2,350
1985,2111,814
23,04914
9,2902.080
74395
4,218
3,128757982624223
6348
53,3492 ,020
40393969
34 25
15 183
(101 )1,672
674
30417057
237209
42
19839
932,499
117176
1,423
16232146256402
42113
131
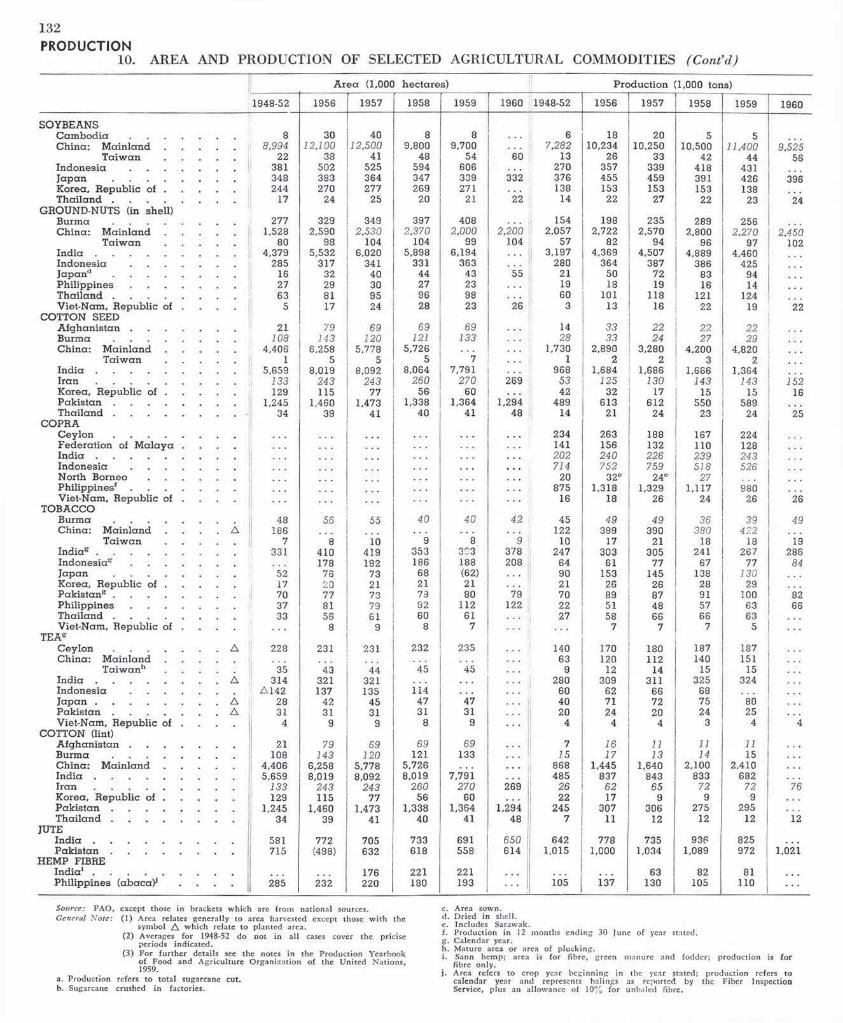
132PRODUCTION
10. AREA AND PRODUCTION OF SELECTED AGRICULTURAL COMMODITIES (C ont’d)
Source: FA O , except those in brackets w h ic h are f ro m na t iona l sources.General N o te : (1 ) Area relates generally to area harvested except those w i t h the
symbol w h ic h rela te to planted area.(2) Averages fo r 1948-52 do no t in a l l cases cover the pric ise
periods indicated.(3) F or fu r th e r details see the notes in the P roduct ion Yearbook
o f Food and A g r ic u l tu re O rgan izat ion o f the U n ited Nations, 1959.
a. Product ion refers to to ta l sugarcane cut.b. Sugarcane crushed in factories.
c. Area sown.d. D r ie d in shell.e. Includes Sarawak.f . P roduct ion in 12 months end ing 30 June o f year stated.g. Calendar year.h. Mature area o r area o f p luck ing .i . Sann hemp; area is fo r f ibre, green m anure and fodder; p roduct ion is fo r
f ib re only .j . Area refers to crop year beg inn ing in the year stated; p roduct ion refers to
calendar year and represents balings as reported by the F iber Inspection Service, plus an allowance o f 10% fo r unbaled f ibre.
A re a (1,000 hec ta re s) Production (1,000 tons)
1948-52 1956 1957 1958 1959 1960 1948-52 1956 1957 1958 1959 1960
SOYBEANSC a m b o d i a ............................C h ina: M a in la n d
T a iw a naisenodnI
J a p a n ....................................K orea, R epublic of .T h a i l a n d ....................................
GROUND-NUTS (in shell)B u r m a ....................................C h ina : M a in land
T a iw a nI n d i a ..........................................In do n es ia ............................J a p a n d ...................................P h i l i p p i n e s ............................T h a i l a n d ...................................Viet-Nam, R epublic of .
COTTON SEEDA f g h a n i s t a n ............................B u r m a ...................................C h ina: M a in lan d
T a iw a nI n d i a ..........................................I r a n ..........................................K orea, R epublic of .P a k i s t a n ...................................T h a i l a n d ...................................
COPRAC e y l o n ...................................F ed e ra t ion of M a la y a .I n d i a ..........................................In dones ia ............................North Borneo . . . .Ph ilipp inesf ............................Viet-Nam, Republic of .
TOBACCOB u r m a ...................................C hina: M ain land
T a iw a nInd iag ..........................................In dones iag ............................J a p a n ...................................Korea, R epublic of .P a k is tan g ...................................P h i l i p p i n e s ............................T h a i l a n d ...................................Viet-Nam, R epublic of .
.
.
88 ,994
22381348244
17
2771,528
804,379
285162763
5
21108
4,4061
5,659 133
129 1, 245
34
48186
7331
5217703733
3012,100
38 502 383 270
24
3292,590
985,532
31732298117
79143
6,2585
8,019243115
1,46039
56
8410178
76 2077 81 56
8
4012,500
41 525 364 277
25
3492,530
1046,020
34140 30 95 24
69120
5,7785
8,092243
771,473
41
55
10419192
7321737961
9
89,800
48594347269
20
3972,370
1045,898
3314427 9628
69121
5,7265
8,064260
561,338
40
40
9353186
6821799260
8
89,700
54606339271
21
4082 ,000
996,194
36343239823
69133
77,791
27060
1,36441
40
8383188(62)2180
11261
7
60
332
22
2,200104
55
26
. . . 269
1,29448
42
9378208
79122
67,282
13 270 376 138
14
1542,057
573,197
2802119 60
3
1428
1,7301
9685342
48914
234141202714
20 875
16
45122
10247
649021702227
1810,234
26357455153
22
1982,722
824,369
36450 18
10113
3333
2,8902
1,684125
32613
21
263156240752
32e1,318
18
49399
17303
61153
268951 58
7
2010,250
33339459153
27
2352,570
944,507
3877219
11816
2224
3,2802
1,686130
17612
24
188132226759
24e1,329
26
49390
21305
7714526874866
7
510,500
42418391153
22
2892,800
964,889
3868316
12122
2227
4,2003
1,666143
15550
23
167110239518
27 1,117
24
36380
18241
67138
28 91 57 66
7
511,400
4443142613823
2562,270
974,460
4259414
12419
2229
4,8202
1,364143
15 589
24
224128243526
98026
39422
18267
77130
291006363
5
9.52556
396
24
2.450102
22
15216
25
26
49
19286
84
8266
TEAgC e y l o n ...................................C hina: M ain lan d
T a iw a n hI n d i a ..........................................In do n es ia ............................J a p a n ..........................................P a k i s t a n ...................................Viet-Nam, R epublic of .
COTTON (lint)A f g h a n i s t a n ............................B u r m a ...................................C h ina: M a in landI n d i a ..........................................I r a n ..........................................K orea, R epublic of .P a k i s t a n ...................................T h a i l a n d ...................................
228
35314
A1422831
4
21108
4,4065,659
133129
1,24534
231
43321137
4231
9
79143
6,2588,019
243115
1,46039
231
44 321 135
45 31
9
69120
5,7788,092
24377
1,47341
232
45
1144731
8
69 121
5,726 8,019
260 56
1,338 40
235
45
4731
9
69133
7,791270
601,364
41
269
1,29448
14063
9280
604020
4
715
868485
2622
2457
170120
12309
627124
4
1617
1,445837
6217
30711
180112
14311
667220
4
1113
1,640843
659
30612
187140
15325
687524
3
1114
2,100833
729
27512
187151
15324
8025
4
1115
2,410682
729
29512
. . .
4
76
12
JUTEI n d i a ...........................................P a k i s t a n ...................................
HEMP FIBREIn d ia i ..........................................P h ilipp ines (a b a c a ) j
581715
285
772(498)
232
705632
176220
733618
221180
691558
221193
650614
6421,015
105
7781,000
i 37
7351,034
63130
9361,089
82105
825972
81110
1,021
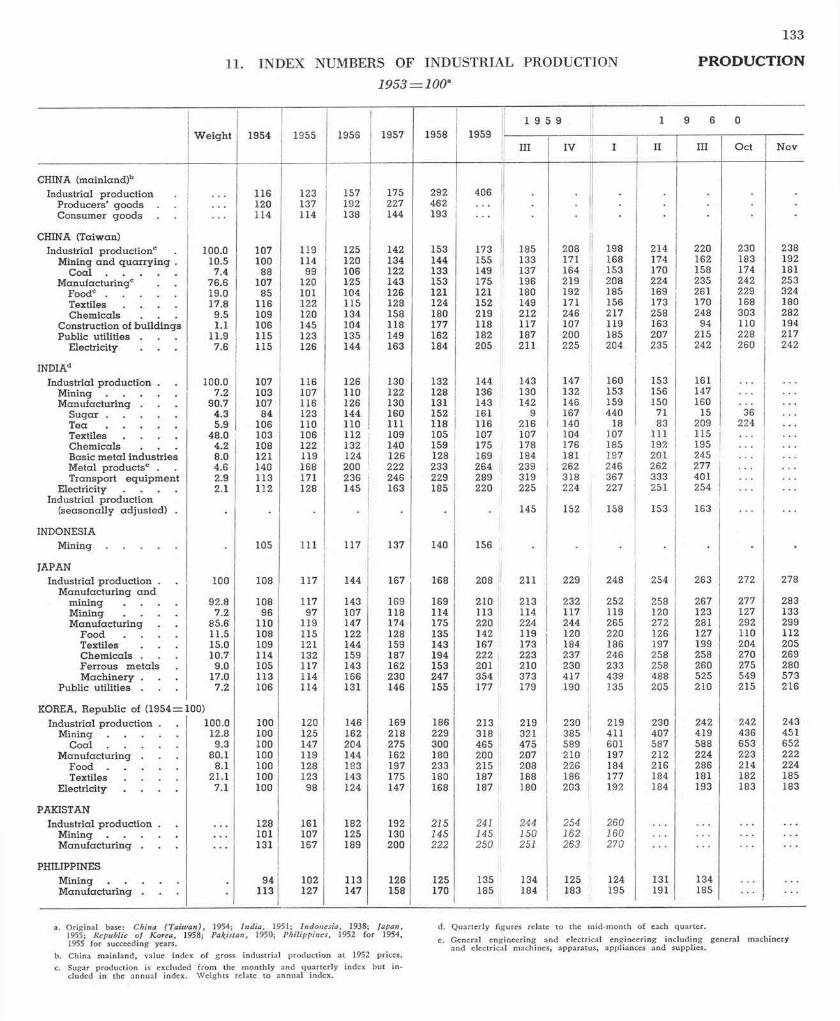
11. INDEX NUMBERS OF INDUSTRIAL PRODUCTION 1953 = 100a
W eig h t 1954 1955 195S 1957 1958 19599 5 9 1 0 6 9 1
III IV I II III O ct N ov
CHINA (m ainland)b Industrial p roduction . . . . 116 123 157 175 292 406
Producers' goods . . . . 120 137 192 227 462 .
Consum er goods . . . . . 114 114 138 144 193 .
CHINA (Taiwan)Industrial p roduc tionc . 100.0 107 119 125 142 153 173 185 208 198 214 220 230 238
Mining a n d q u a r ry in g . 10.5 100 114 120 134 144 155 133 171 168 174 162 183 192C o a l ............................ 7.4 88 99 106 122 133 149 137 164 153 170 158 174 181
M anufacturingc . . 76.6 107 120 125 143 153 175 196 219 208 224 235 242 253Foodc ............................ 19.0 85 101 104 126 121 121 180 192 185 169 261 229 324Textiles . . . . 17.8 116 122 115 128 124 152 149 171 156 173 170 168 180C hem icals . . . 9.5 109 120 134 158 180 219 212 246 217 258 248 303 282
Construction of bu ild ings 1.1 106 145 104 118 177 118 117 107 119 163 94 110 194Public utilities . . . 11.9 115 123 135 149 162 182 187 200 185 207 215 228 217
Electricity . . . 7.6 115 126 144 163 184 205 211 225 204 235 242 260 242
INDIAdIndustrial p roduc tion . . 100.0 107 116 126 130 132 144 143 147 160 153 161 .......................
M i n i n g ............................ 7.2 103 107 110 122 128 136 130 132 153 156 147 .......................M anufacturing . . . 90.7 107 116 126 130 131 143 142 146 159 150 160
S u g a r ............................ 4.3 84 123 144 160 152 161 9 167 440 71 15 36T e a ............................ 5.9 106 110 110 111 118 116 216 140 18 83 209 224Textiles . . . . 48.0 103 106 112 109 105 107 107 104 107 111 115 . . . C hem icals . . . 4.2 108 122 132 140 159 175 178 176 185 192 195 . . . Basic m eta l industr ie s 8.0 121 119 124 126 128 169 184 181 197 201 245M etal p roduc tse . . 4.6 140 168 200 222 233 264 239 262 246 262 277 Transport e q u ip m e n t 2.9 113 171 236 246 229 289 319 318 367 333 401 ......................
Electricity . . . . 2.1 112 128 145 163 185 220 225 224 227 251 254 .......................Industrial p roduction
(seasonally ad jus ted ) . 145 152 158 153 163 . . .
INDONESIAM i n i n g ............................ 105 111 117 137 140 156 .
JAPANIndustrial p roduction . . 100 108 117 144 167 168 208 211 229 248 254 263 272 278
M anufacturing a n dm ining . . . . 92.8 108 117 143 169 169 210 213 232 252 258 267 277 283Mining . . . . 7.2 96 97 107 118 114 113 114 117 119 120 123 127 133M anufactu ring . . 85.6 110 119 147 174 175 220 224 244 265 272 281 292 299
Food . . . . 11.5 108 115 122 128 135 142 119 120 220 126 127 110 112Textiles . . . 15.0 109 121 144 159 143 167 173 184 186 197 199 204 205C hem icals . . . 10.7 114 132 159 187 194 222 223 237 246 258 258 270 269Ferrous m eta ls . 9.0 105 117 143 162 153 201 210 230 233 258 260 275 280M ach ine ry . . . 17.0 113 114 166 230 247 354 373 417 439 488 525 549 573
Public utilities . . . 7.2 106 114 131 146 155 177 179 190 135 205 210 215 216
KOREA, R epublic of (1954 = 100) Industrial p roduction . . 100.0 100 120 146 169 186 213 219 230 219 230 242 242 243
M i n i n g ............................ 12.8 100 125 162 218 229 318 321 385 411 407 419 436 451C o a l ............................ 9.3 100 147 204 275 300 465 475 589 601 587 588 653 652
M anufacturing . . . 80.1 100 119 144 162 180 200 207 210 197 212 224 223 222F o o d ............................ 8.1 100 128 183 197 233 215 208 226 184 216 286 214 224Textiles . . . . 21.1 100 123 143 175 180 187 188 186 177 184 181 182 185
Electricity . . . . 7.1 100 98 124 147 168 187 180 203 192 184 193 183 183
PAKISTANIndustrial p roduction . . . . . 128 161 182 192 215 241 244 254 260
M i n i n g ............................. . . . 101 107 125 130 145 145 150 162 160M anufacturing . . . . . . 131 167 189 200 222 250 251 263 270
PHILIPPINESM i n i n g ............................ 94 102 113 126 125 135 134 125 124 131 134 .......................M anufacturing . . . 113 127 147 158 170 185 184 183 195 191 185 .......................
d. Q uarte r ly figures relate to the m id -m o n th o f each quarter.
e. General eng ineering and e lectrica l eng ineering in c lu d in g general m achinery and electr ica l machines, apparatus, appliances and supplies.
a. O rig ina l base: China (T a iw a n ) , 1954; Ind ia , 1951; Indonesia , 1938; Japan, 1955; Republic o f Korea, 1958; Pakistan , 1950; Philippines, 1952 fo r 1954, 1955 fo r succeeding years.
b. China m a in land, value index o f gross in d u s tr ia l p roduc t ion at 1952 prices.c. Sugar product ion is excluded f ro m the m o n th ly and qua r te r ly index bu t in -
cluded in the annual index. W eights relate to annual index.
133
PRODUCTION

134
PRODUCTION 12. PRODUCTION OF SELECTED COM M ODITIESM onthly averages or calendar months Thousand tons
1954 1955 1956 1957 1958 19591 9 5 9 9 1 6 0
III IV I II III Oct Nov
TEA9.31 nolyeC14.4 14.2 15.0 15.6 15.6 12.1 15.9 16.9 19.1 13.7 12.0 20.7
China: Mainland 7.7 9.0 10.0 9.3 11.8China: Taiwan 1.6 1.1 1.1 1.3 1.1 1.7 1.0 2.7 1.1 1.3 1.2 1.2 1.1India 24.4 25.3 25.2 25.4 27.0 26.7 47.9 30.5 4.6 24.4 44.4 51.4 31.9
aisenodnI3.9 3.6 3.5 3.9 3.9 3.7 3.2 4.1 3.5 4.0 3.4 4.0 4.1Pakistan 2.1 2.0 2.1 1.8 2.2 2.3 3.9 2.7 0.2 0.9 2.8 3.6 2.7
NATURAL RUBBERa0.2 aidobmaC2 3 2.7 2.6 2.8 2.9 3.2 4.1 1.9 2.9 3.4 3.7 4.6
Ceylon 8.0 7 9 8.1 8.3 8.5 7.8 8.2 10.7 8.4 7.2 7.3 9.3 7.0
Fed. of Malaya & Singapore 49.5 54.1 53.1 54.1 56.2 59.1 62.9 63.2 59.1 54.9 63.4 64.1 57.8
India 1.8 1. 9 2.0 2.0 2.1 2.0 2.1 2.8 1.6 1.7 2.2 2.6 3.1Indonesia 62.5 62.1 58.1 58.0 52.0 61.1 58.1 70.3 49.8 51.6 45.1 55.0 36.2Sarawak 2.0 3.3 3.4 3.5 3.3 3.7 4.6 4.1 4.1 5.3 4.5 2.3 2.7Thailand 9.9 11.0 11.3 11.3 11.6 14.4 15.7 13.9 16.1 12.4 11.5 14.4 14.5
Viet-N am , R epublic of . . . 4.6 5.5 5.9 5.8 6.0 6.3 6.8 9.0 2.9 6.9 7.2 7.1 9.6
COAL279,6 dnalniaM :anihC8,192 9,197 10,833 22,500 28,983
China: Taiwan 177 197 211 243 265 297 274 325 304 339 314 347 361Federation of Malayab 19 17 15 13 6 6 6 8 2 — —- — ---India 3,123 3,237 3,339 3,683 3,839 3,982 3,910 3,959 4,327 4,361 4,158 4,339Indonesia 75 68 69 60 51 53 56 60 19 19Iran 21 20 16 15 14Japan 3,560 3,535 3,880 4,311 4,139 3,938 3,920 4,040 4,098 4,138 4,169 4,320 4,660Korea, Republic of 74 109 151 203 223 345 352 436 446 435 435 484 483Pakistanc 47 45 55 44 51 61 55 59 64 68 58Philippines 10 11 13 16 9 12 12 13 14 11
Viet-Nam , R epublic of . . . — 1.0 1.7 1.7 1.6 1.8 1.3 2.1 3.2 3.0 2.4
NATURAL GAS ( million cubic metres)5.19 dienurB98.1 119.0 133.8 133.5 148.2 150.4 147.7 135.1 138.4 133.6
China: Taiwan 2.22 2.16 2.27 2.40 2.18 2.19 1.93 2.66 1.76 2.28 2.34 2.08 2.11Indonesiad 132.0 159.0 170.0 181.0 174.0 186.0 186.6 185.6 193.0 198.0Japan 11.8 13.0 14.7 20.6 30.7 42.2 41.6 47.4 58.0 54.9 59.8 65.7Pakistan — 24.6 36.2 45.6 52.8 54.8 57.3 47.7 69.2
PETROLEUM, CRUDEe993 ienurB438 470 450 434 450 458 437 403 381 372
Burma 15 18 19 33 39 44 46 46 45 42 49 48China: Mainland 66 81 97 122 189 308China: Taiwan 0.41 0.28 0.25 0.21 0.18 0.15 0.13 0.19 0.14 0.17 0.19 0.18 0.16Indonesia 898 982 1,061 1,289 1,342 1,518 1,585 1,600 1,632 1,745Iran 292 1,358 2,195 2,999 3,401 3,831 3,735 3,908 4,173 3,957 4,273 5 ,045 4,714
Japan 25 26 26 27 31 34 34 38 39 41 44 47 52Pakistan 22 23 24 25 25 26 26 28Sarawak 6 6 6 6 5 5 5 5 5 5
IRON OREf301 ayalaM fo noitaredeF124 207 252 237 318 395 316 375 489 588 569 397
Hong Kong 8 10 10 8 9 10 10 11 10 9 10 8 9India 333 361 359 391 483 656 624 746 888 903 871 854Japang 136 126 159 187 167 207 231 233 211 238 259 247Korea, Republic of 3 2 5 15 22 23 25 19 26 26 37 35 44Pakistan 0.1 ___ 0.6 2.0 0.7 0.2 1.0 —
P h i l i p p i n e s ........................................... 119 119 120 112 92 103 111 81 89 96 94 95
TIN CONCENTRATES (tons)86 amruB94 67 59 102 102 102 102 122 122 122 122 122
China: Mainland 644 1,016 1,186 1,354 1,524 1,778 1,778 1,778 2,030 2,030 2,030 2,030 2,030
Federation of Malaya 5,139 5,186 5,274 5,020 3,256 3,177 3,149 3,740 4,150 4,322 4,429 4,796 4,590Indonesia 3,036 2,825 2,545 2,347 1,968 1,830 1,727 2,119 1,626 1,910 2,075 2,082 1,978Japan 61 76 79 80 94 83 74 91 75 81 81 81
Laos 9 21 20 23 26 25 25 25 31 31 31 31T h a i l a n d .................................................. 828 933 1,057 1,145 654 820 815 976 1,064 1,000 994 1,034 1,061
SALT7.7 amruB8.4 7.2 9.7 9.2
China: Mainland 407 628 412 690 867 920China: Taiwan 30.7 35.1 25.4 32.3 36.6 35.8 3.4 40.8 55.2 31.8 15.5 39.6 50.5India 229.9 252.2 276.5 307.0 350.1 264.9 244.4 58.8 162.1 594.3 246.5 128.4Indonesia 10.9 3.8 9.1 28.9 19.6 26.2 17.8 87.1Japanh 35.4 46.1 52.3 69.3 88.2 97.1 118.4 94.1 77.3 74.9Korea, Republic of 15.0 29.5 16.4 30.8 36.4 32.5 68.1 34.7 0.3 47.1 64.9 41.9 15.0Pakistan 33.6 33.8 32.8 38.3 29.9 24.0 25.7 28.6 34.2Philippines 4.0 6.7 5.3 8.6 11.6 14.5
T h a i l a n d .................................................. 18.5 19.7 20.6 21.9 35.6 38.3 38.3 38.3 27.5 27 .5 27.5
V i e t - N a m , R e p u b l i c o f . . . . . . 6.4 5.0 6.6 5.1 5.1 1.3 1.8

135
12. PRODUCTION OF SELECTED COMM ODITIES (C ont’d ) PRODUCTIONsnot dnasuohT shtnom radnelac ro segareva ylhtnoM
SUGARiA f g h a n i s t a n ...........................................B u r m a ..................................................China: M a i n l a n d .............................China: T a iw a n .............................I n d i a .........................................................I n d o n e s i a ...........................................I r a n .........................................................Korea, Republic o f .............................P a k i s t a n ..................................................P h i l i p p i n e s ...........................................T h a i l a n d ..................................................Viet-Nam, R epublic of . . .
COTTON YARNB u r m a ..................................................China: M a i n l a n d .............................China: T a iw a n .............................Hong Kong ...........................................I n d i a .........................................................J a p a n .........................................................Korea, R epublic o f .............................P a k i s t a n ..................................................P h i l i p p i n e s ...........................................
COTTON FABRICS (M n metres) Ceylon (Mn sq. metres) . . . .China: M a i n l a n d .............................China: T a iw a n .............................I n d i a .........................................................I n d o n e s ia ..................................................Japan (Mn sq. metres) . . . . Korea, R epublic of (Mn sq. metres)P a k i s t a n ..................................................P h i l i p p i n e s ...........................................T h a i l a n d ..................................................
JUTE MANUFACTURESChina: T a iw a n .............................
(Gunny b a g s , M n pieces) .I n d i a .........................................................P a k i s t a n ..................................................Thailand (G unny b a g s , M n pieces)
PAPERJChina: M a i n l a n d .............................China: T a iw a n .............................I n d i a .........................................................J a p a n .........................................................Korea, Republic o f .............................P a k i s t a n ..................................................T h a i l a n d ..................................................
VEGETABLE OILSChina: M ain land : E dible oil . China: T aiw an : E dible oil Federation of M a la y a : C oconut oil
P a lm o i l .............................India: Edible oil (V anaspati) . Indonesia: P a lm oil . . . .Japan: Coconut o i l .............................
O thers .............................Pakistan: V e g e ta b le oil Philippines: C oconut oil Singapore: C oconut oil .
SUPERPHOSPHATES'kChina: T a iw a n .............................I n d i a .........................................................J a p a n .........................................................P a k i s t a n ..................................................
AMMONIUM SULPHATEChina: T a iw a n .............................I n d i a ........................................................J a p a n .........................................................P a k i s t a n ..................................................
1954
0.422.0057.853.591.959.8
7.0 1.66.4
108.43.6
0.05
0.1569.6
1.93.3
59.038.7
1.77.3
0.06
0.4435.8
13.8 3813.8 2228.0
26.5 1.1
0.7578.6
4.5 0.05
70.22.5 8.7
101.70.5
0.17
88.8 0.7 8.24.6
19.514.11.6 9.0 0.9
12.2 3.2
6.58.9
143.5
0.428.9
172.9
1955
0.501.5059.866.9
136.871.4
6.9 3.2 8.0
103.73.1
0.13
0.1260.02.1 3.5
61.634.9 2.2
10.4 0.05
0.4363.3
13.6 3884.2
2108.4
34.5 0.93.1
0.9087.0
7.5 0.28
69.9 2.8
10.1 116.1
0.61.1
0.17
97.1 0.8 8.04.8
22.1 13.8
2.3 13.01.2
13.32.8
6.76.3
149.6
0.433.3
177.4
1956 1957 1958 1959
0.401.5867.3 64.6
165.165.5
6.95.2 7.4
97.03.3
0.17
0.1279.4 2.03.8
63.241.1 2.6
11.4 0.07
0.6480.8
11.6 4044.4
24210.238.1
1.44.4
1.0592.512.1 0.36
83.23.6
10.4129.6
0.61.4
0.25
89.7 0.9 9.24.7
21.613.7 2.0
15.11.4
17.73.4
8.46.9
171.5
0.632.9
193.6
0.402.6872.076.5
170.069.0 6.8 2.6 9.4
85.84.2
0.09
0.1470.3
2.34.0
67.343.1
3.4 12.0 0.07
0.4420.8
13.0 4054.7
26813.840.2 1.24.1
1.0187.212.6 0.40
101.75.0
10.7145.7
0.71.7
0.23
91.71.08.25.0
25.513.4
2.416.3
1.527.8
4.1
8.612.0
155.3
1.332.1
206.7
0.393.4075.072.2
165.764.5
9.24.3
13.8 100.6
6.10.41
0.2092.2
2.34.4
63.736.6
3.713.0 0.06
0.5475.0
12.2 3754.6
21810.443.9 0.9
0.7389.914.5 0.45
135.8 6.0
13.1147.4
1.01.4
0.23
104.21.16.7 6.0
25.0 12.32.2
19.91.7
19.1 2.6
8.7 14.0
146.5 0.09
1.532.5
217.51.7
0.383.3194.274.0
176.371.3
9.25.0
14.2 122.6
6.7 2.74
0.30124.7
2.65.2
65.039.7
4.0 14.6 0.09
0.6625.0
13.0 374 3.4
23011.047.3 0.8
1.4189.019.00.47
141.77.1
15.0181.9
1.8 1.6
0.22
121.71.15.7 6.1
26.811.52.8
20.62.3
15.81.7
9.921.1
153.9 0.13
1.832.9
219.53.6
1 9 5 9
III IV I II III Oct
1 9 6 0
Nov
74.0
6.2
2.99
3.6
48.14.4
15.6
28410.7
0.7687.320.3
9.8
216.72.71.9
2.56.8 7.7
2.6
11.1
179.1
2.4
39.020.0
4.1
3.60
3.6
64.447.3
4.0
0.9
15.1374
27810.4
0.3
0.2385.921.3
8.218.5
221.92.81.5
1.65.96.9
16.911.54.2
24.53.3
2.5
11.3
179.7
2.4
190.3
12.5146.7
6.50.2
9.2 5.03
0.33
3.66.7
67.146.2
4.0
0.07
0.9
15.2 394
27010.4
0.3
1.1791.623.6
7.918.0
211.52.1
2.36.37.5
24.913.5
4.121.9
2.5
2.1
10.824.7
155.7
1.732.2
205.3
7.2116.7
71.6
4.48.2
9.2 5.73
0.29
3.46.2
63.246.7
4.3
0.06
0.9
14.9 377
27011.0
0.4
1.5392.022.7
8.3 17.4
201.81.91.5
0.96.3 8.1
28.911.7
4.0 20.6
2.9
1.9
10.627.7
188.2
1.729.7
198.04.0
182.9479.4
4.7 28.0
225.19.2
4.43
0.30
2.8 5.6
63.944.1
3.915.4 0.07
0.8
13.2 3754.9
25210.3 48.2
0.6
1.4789.422.4
7.5 18.0
193.12.31.6
1.05.57.0
32.9 10.0
3.4 21.8
2.5
1.8
7.731.5
189.80.16
1.732.4
205.44.1
67.4213.421.1
5.7 12.1
141.26.7
2.93
0.38
2.85.7
67.1 43.6
4.015.3 0.11
0.613.4 3783.7
24510.547.5 0.6
1.7691.2 21.8 0.47
7.717.5
193.32.1 1.1
0.22
1.26.06.1
28.311.9
3.419.32.4
2.3
10.124.0
154.00.11
1.932.0
194.63.5
8.1171.2
4.40.6
22.96.7
2.97
0.32
2.75.3
65.139.6
4.015.2 0.09
0.6
12.9 3783.0
228 11.0 47.50.8
1.1991.1 20.0 0.47
7.016.2
185.81.91.8
0.22
1.4 6.67.0
24.713.4 2.2
24.5 2.3
1.9
10.126.7
132.8
1.732.9
218.73.0
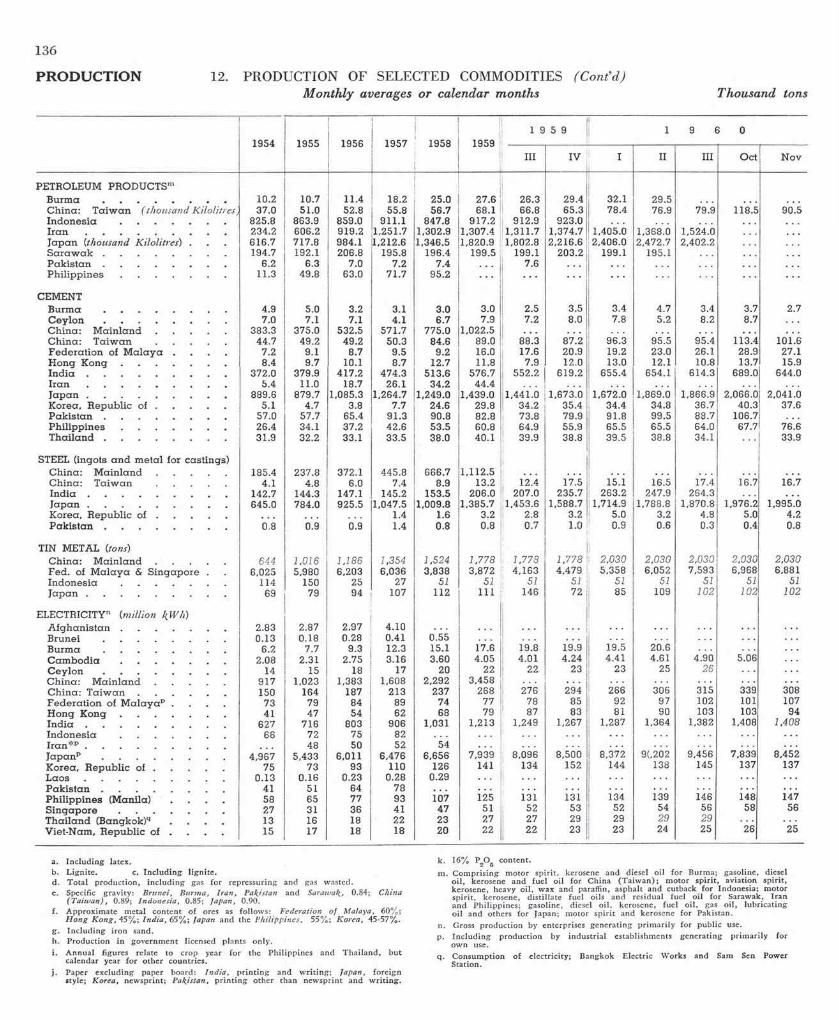
136
PRODUCTION 12. PRODUCTION OF SELECTED COMMODITIES (C ont’d )M onthly averages or calendar m onths Thousand tons
1954 1955 1956 1957 1958 19591 9 59 19 60
III IV I II III Oct Nov
PETROLEUM PRODUCTSmB u r m a .................................................. 10.2 10.7 11.4 18.2 25.0 27.6 26.3 29.4 32.1 29.5C hina: T a iw a n ( thousand Kilolitres) 37.0 51.0 52.8 55.8 56.7 68.1 66.8 65.3 78.4 76.9 79.9 118.5 90.5In d o n es ia ........................................... 825.8 863.9 859.0 911.1 847.8 917.2 912.9 923.0
Iran 234.2 606.2 919.2 1,251.7 1,302.9 1,307.4 1,311.7 1,374.7 1,405.0 1,368.0 1,524.0Ja p a n (thousand Kilolitres) . 616.7 717.8 984.1 1,212.6 1,346.5 1,820.9 1,802.8 2,216.6 2,406.0 2,472.7 2,402.2S a r a w a k .................................................. 194.7 192.1 206.8 195.8 196.4 199.5 199.1 203.2 199.1 195.1P a k i s t a n .................................................. 6.2 6.3 7.0 7.2 7.4 7.6P h i l i p p i n e s ........................................... 11.3 49.8 63.0 71.7 95.2
CEMENTB u r m a .................................................. 4.9 5.0 3.2 3.1 3.0 3.0 2.5 3.5 3.4 4.7 3.4 3.7 2.7C e y l o n .................................................. 7.0 7.1 7.1 4.1 6.7 7.9 7.2 8.0 7.8 5.2 8.2 8.7C hina: M a i n l a n d ............................ 383.3 375.0 532.5 571.7 775.0 1,022.5C hina: T a iw a n ............................ 44.7 49.2 49.2 50.3 84.6 89.0 88.3 87.2 96.3 95.5 95.4 113.4 101.6F ed e ra tio n of M a la y a . . . . 7.2 9.1 8.7 9.5 9.2 16.0 17.6 20.9 19.2 23.0 26.1 28.9 27.1H ong Kong ........................................... 8.4 9.7 10.1 8.7 12.7 11.8 7.9 12.0 13.0 12.1 10.8 13.7 15.9I n d i a ........................................................ 372.0 379.9 417.2 474.3 513.6 576.7 552.2 619.2 655.4 654.1 614.3 689.0 644.0I r a n ......................................................... 5.4 11.0 18.7 26.1 34.2 44.4J a p a n ........................................................ 889.6 879.7 1,085.3 1,264.7 1,249.0 1,439.0 1,441.0 1,673.0 1,672.0 1,869.0 1,866.9 2,066.0 2,041.0Korea, R epublic o f ............................ 5.1 4.7 3.8 7.7 24.6 29.8 34.2 35.4 34.4 34.8 36.7 40.3 37.6P a k i s t a n ................................................. 57.0 57.7 65.4 91.3 90.8 82.8 73.8 79.9 91.8 99.5 88.7 106.7P h i l i p p i n e s .......................................... 26.4 34.1 37.2 42.6 53.5 60.8 64.9 55.9 65.5 65.5 64.0 67.7 76.6T h a i l a n d ................................................. 31.9 32.2 33.1 33.5 38.0 40.1 39.9 38.8 39.5 38.8 34.1 33.9
STEEL (ingots a n d m eta l for castings)C hina: M a i n l a n d ............................ 185.4 237.8 372.1 445.8 666.7 1,112.5China: T a iw a n ............................ 4.1 4.8 6.0 7.4 8.9 13.2 12.4 17.5 15.1 16.5 17.4 16.7 16.7I n d i a ........................................................ 142.7 144.3 147.1 145.2 153.5 206.0 207.0 235.7 263.2 247.9 264.3J a p a n ........................................................ 645.0 784.0 925.5 1,047.5 1,009.8 1,385.7 1,453.6 1,588.7 1,714.9 1,788.8 1,870.8 1,976.2 1,995.0Korea, R epublic o f ............................ 1.4 1.6 3.2 2.8 3.2 5.0 3.2 4.8 5.0 4.2P a k i s t a n ................................................. 0 8 0.9 0.9 1.4 0.8 0.8 0.7 1.0 0.9 0.6 0.3 0.4 0.8
TIN METAL (tons)C hina: M a i n l a n d ............................ 644 1,016 1,186 1,354 1,524 1,778 1,778 1,778 2,030 2,030 2,030 2.030 2,030Fed. of M a la y a & S ingapo re . 6,025 5,980 6,203 6,036 3,838 3,872 4,163 4,479 5,358 6,052 7,593 6,968 6,881In donesia .......................................... 114 150 25 27 51 51 51 51 51 51 51 51 51J a p a n ........................................................ 69 79 94 107 112 111 146 72 85 109 102 102 102
ELECTRICITYn (million kW h)A f g h a n i s t a n .......................................... 2.83 2.87 2.97 4.10
0.55B r u n e i ................................................. 0.13 0.18 0.28 0.41
Burma 6.2 7.7 9.3 12.3 15.1 17.6 19.8 19.9 19.5 20.6C a m b o d i a .......................................... 2.08 2.31 2.75 3.16 3.60 4.05 4.01 4.24 4.41 4.61 4.90 5.06C e y l o n ................................................. 14 15 18 17 20 22 22 23 23 25 26C hina: M a i n l a n d ............................ 917 1,023 1,383 1,608 2,292 3,458
315 339 308C hina: T a i w a n .................................... 150 164 187 213 237 268 276 294 266 306F ed e ra t io n of M a la y a p . . . . 73 79 84 89 74 77 78 85 92 97 102 101 107H ong K ong ...........................................I n d i a .........................................................
41 47 54 62 68 79 87 83 81 90 103 103 94627 716 803 906 1,031 1,213 1,249 1,267 1,287 1,364 1,382 1,408 1.408
In d o n es ia ........................................... 66 72 75 82I ra n * p ......................................................... 48 50 52 54
7,839 8,452J a p a n p .................................................. 4,967 5,433 6,011 6,476 6,656 7,939 8,096 8,500 8,372 9, 202 9,456K orea, R epublic o f ............................ 75 73 93 110 126 141 134 152 144 138 145 137 137L a o s ......................................................... 0.13 0.16 0.23 0.28 0.29
Pakistan 41 51 64 78146 148 147Ph ilipp ines (Manila) . . . . 58 65 77 93 107 125 131 131 134 139
S i n g a p o r e ........................................... 27 31 36 41 47 51 52 53 52 54 56 58 56T h a ilan d (Bangkok)q . . . . 13 16 18 22 23 27 27 29 29 29 29
26 25Viet-Nam, R epublic of . . . 15 17 18 18 20 22 22 23 23 24 25
a. In c lu d in g la tex.b. L ig n ite . c. In c lu d in g l ig n i te .d. T o ta l p roduct ion , in c lu d in g gas fo r repressuring and gas wasted.e. Specific g rav ity : Brunei, B urm a, Iran , Pakistan and Sarawak, 0.84; China
(T a iw a n ) , 0.89; Indonesia, 0.85; Japan, 0.90.f. A p prox im ate m eta l content o f ores as fo l low s : Federation o f Malaya, 60%;
H o n g K o n g , 45% ; Ind ia , 65%; Japan and the Philippines, 55%; Korea, 45-57%.g. In c lu d in g iro n sand.h. Product ion in government licensed p lants on ly .i . A n n u a l figures relate to crop year fo r the Ph ilipp ines and T ha ila nd , bu t
calendar year f o r o ther countries.j . Paper exc lud ing paper board: Ind ia , p r in t in g and w r i t in g ; Japan, fo re ign
style; Korea, new spr in t; Pakistan, p r in t in g o ther than new spr in t and w r i t in g .
k . 16% P2O5 content.m . C o m pr is ing m o to r sp i r i t , kerosene and diesel o i l fo r Burm a; gasoline, diesel
o i l , kerosene and fu e l o i l fo r Ch ina (T a iw a n ) ; m o to r s p i r i t , av ia tion sp i r i t , kerosene, heavy o i l , w ax and paraffin, asphalt and cutback fo r Indonesia; m oto r sp i r i t , kerosene, d is ti l la te fue l oils and residual fue l o i l fo r Sarawak, I ran and Ph ilipp ines; gasoline, diesel o i l , kerosene, fue l o i l , gas o i l , lu b r ica t ing o i l and others fo r Japan; m oto r s p i r i t and kerosene fo r Pakis tan.
n . Gross p roduct ion by enterprises generating p r im a r i ly fo r pub l ic use. p. In c lu d in g p roduc t ion by in d u s tr ia l establishments generating p r im a r i ly fo r
ow n use.q. C onsum ption o f e lec tr ic i ty ; Bangkok E lec tr ic W orks and Sam Sen Power
Station.

13713. CONSTRUCTION— NEW BUILDING P R O D U C T IO N , T R A N S P O R T
M onthly averages or calendar months
1954 1955 1956 1957 1958 19591959 0691
III IV I II III Oct N ov
Ceylon: com ple teda(Floor a r e a — thousand sq metres') R e s i d e n t i a l ........................................... 7.22 6.72 6.49 5.97 1.88 3.95 3.81 4.67N o n - r e s i d e n t i a l .................................... 2.70 2.02 2.20 2.54 1.46 3.08 3.38 3.13
China: T aiw an: com ple ted(Floor a r e a — thousand sq metres) P u b l i c ......................................................... 4.81 6.15 4.71 5.68 8.41 6.26 3.47 6.71 9.72 14.22 4.04 4.51 16.13P r i v a t e .................................................. 25.67 32.73 23.55 26.67 35.85 24.13 26.58 20.96 20.93 27.28 20.28 23.24 34.62
Hong Kong: com ple ted(Cost— thousand H ong K ong dollars) R e s i d e n t i a l ........................................... 4,236 8,902 8,654 10,267 10,489 13,982 12,788 18,243 23,456 23,812 22,662 15,463 9,794Industrial ........................................... 671 862 815 1,016 2,330 1,488 1,903 1,688 2,571 3,388 1,931 2,450 696C o m m e r c i a l ........................................... 886 336 1,438 1,204 2,438 1,279 410 3,950 3,597 1,833 14,961 5,500 291O t h e r s .................................................. 1,807 1,845 2,197 1,696 4,847 1,746 1,963 2,820 1,934 4,806 2,967 1,688 4,297
Japan: s ta rted(Floor a r e a — thousand sq metres) R e s i d e n t i a l ........................................... 1,400 1,454 1,752 1,870 1,933 2,145 2,327 2,362 1,847 2,599 2,474N o n - r e s i d e n t i a l .................................... 1,367 1,328 1,665 1,775 1,593 2,093 2,201 2,512 2,092 2,700 3,177
Korea, Republic of: perm its is su e d (Floor a r e a — thousand sq metres) R e s i d e n t i a l ........................................... 13b 27 22 37 60 85 57 27 76 72 57 35N o n - r e s i d e n t i a l .................................... 53b 65 66 67 83 98 74 56 86 59 60 51
Philippines:c perm its is su ed (Value— thousand pesos)R e s i d e n t i a l ........................................... 850 1,295 1,596 1,732 1,807 1,547 1,386 1,321 970 1,599 1,435 2,125 1,225N o n - r e s i d e n t i a l .................................... 1,620 1,857 2,298 3,122 2,193 3,364 2,590 3,955 2,886 3,214 2,107 1,225 1,777
Singapore: com ple ted ( N um ber o f dw elling units Publicd .................................................. 239 279 184 124 340 127Privatee ................................................. 120 200 186 156 145 134 211 48 61 49 38 23 19
Thailand:f perm its is su e d (N u m b er o f b R e s i d e n t i a l ...........................................
b ) sgnidliu 214 244 201 204 226 163 149 158 213 261 201 183 103
N o n - r e s i d e n t i a l .................................... 72 72 64 44 27 21 10 28 31 32 29 26 17Viet-Nam,g Republic of
(Floor a r e a — thousand sq metres) A partm ents . ............................. 12.75 6.36 7.10 4.41 7.99 10.21 12.66 15.32 9.22 7.19 9.45H o u s e s .................................................. 11.22 5.10 3.35 3.92 5.23 8.11 8.78 6.85 16.51 11.28 14.09O t h e r s .................................................. 4.09 2.10 2.82 1.99 2.80 4.20 8.37 3.16 3.66 4.68 4.64
era hcihw aera ytic ni detcerc sgnidliub edulcxe serugif ylretrauq dna ylhtnoM .e .semehcs gnidliub rednu sgnidliub fo sralucitrap gnidulcxE .ab. December. c. M an i la on ly . no t available, d. Compris ing bu i ld ings erected by o r on beha lf o f Pub lic W orks Department, f . Bangkok on ly .
Housing and Development Board and C i ty Council . g. Saigon-Cholon only .
14. VOLUME OF TRA FFIC: RAILWAYS, SEA-BORNE SH IPPIN G AND CIVIL AVIATIONM onthly averages or calendar months
1954 1955 1956 1957 1958 19599591 0691
I I I I V I II I I I O c t Nov
RAILWAYSaPassenger-kilom etres (million)
...........................................†tamruB 57 66 70 79 89 108 103 126 131C a m b o d i a ........................................... 4 5 6 7 6 6 6 6 7 8 7 4C eylon† ........................................... 116 115 123 127China: T a i w a n ............................ 186 211 237 287 308 303 272 311 324 297Hong Kong .................................... 6 7 9 10 9 11 10 12 14 14 11 14 12Fed. of M a la y a a n d S ingapo re 47 49 50 52 49 50 47 59 52 49 49 46India‡ ................................................. 5,040 5.039 5,469 5,584 5,617 5,885 5,401 5,680 6,346 6,474I n d o n e s i a ........................................... 335 421 388 395 460 552I r a n .................................................. 34 39 37 72 128Ja p a n ‡ .................................................. 7,253 7,603 8,173 8,437 8,851 9,516 9,591 9,430 9,758 10,187Korea, Republic of . . . 325 309 337 286 348 372 382 397 390 391 408 536North B o r n e o ................................... 0.83 0.92 1.25 1.33 1.33 1.38 1.33 1.31 1.49 1.51Pak is tan ‡ ........................................... 772 788 860 901 905 960 955 919 985 984 1,028P h i l i p p i n e s 0 .................................... 35 37 43 49 58 62 56 67 64 78 57T h a i l a n d ........................................... 196 167 155 164 164 154 126 147 217 222 164 184 173Viet-Namb ........................................... 11 II 31 32 37 36 43 43 48 50 48 41
Freight ton-kilometres (m illion )...........................................†tamruB 44 53 51 52 52 59 60 55 71
C a m b o d i a ........................................... 5 2 4 5 5 7 5 6 8 6 8 3C eylon† ........................................... 22 22 24 25 22 25 27 28 24 25China: T a i w a n ............................ 122 137 142 159 158 155 118 170 170 172Fed. of M a la y a a n d S in g ap o re 32 33 37 36 32 46 50 55 60 59 60Hong Kong .................................... 0.33 0.51 0.65 0.57 0.66 0.75 0.75 1.02 0.74 0.84 1.11 1.27 1.20India‡ .................................................. 4,351 4,613 5,203 5,963 6,158 6,552 6,229 6,319 7,821 5,981I n d o n e s i a ........................................... 81 88 87 87 89 87I r a n .................................................. 99 104 113 125 121 161 151 167 167 170Ja p a n ‡ .................................................. 3,277 3,500 3,859 3,971 3,727 4,088 3,841 4,431 4,115 4,362 4,283Korea, R epublic of . . . 155 156 169 197 204 234 221 261 245 254 260 255North B o r n e o ................................... 0.25 0.25 0.33 0.33 0.33 0.31 0.30 0.32 0.29Pak is tan ‡ ........................................... 4 4 9 469 529 557 5 9 6 613 498 608 695 687 589 713P h i l i p p i n e s 0 .................................... 12 13 12 13 17 15 15 15 16 19 1 7
T h a i l a n d ........................................... 57 65 76 85 91 100 8 7 97 115 113 97 88 100Viet-Namb ........................................... 12 || 7 5 7 7 10 10 12 13 15 14
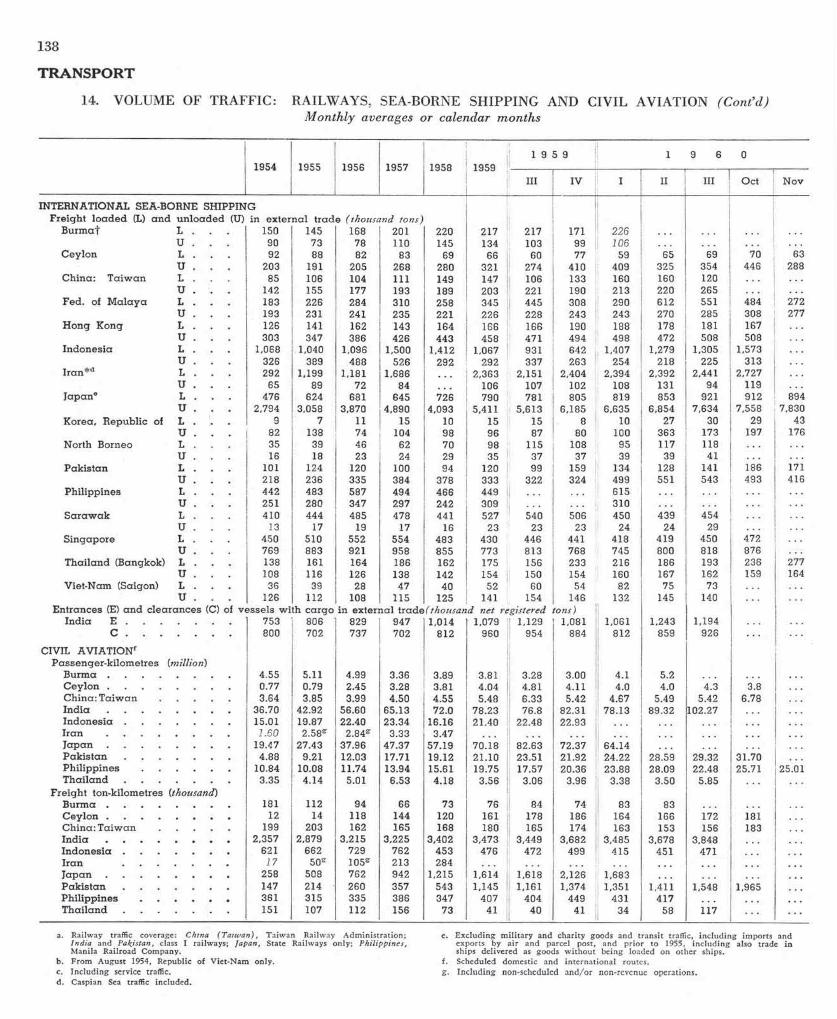
138
TRANSPORT
14. VOLUME OF TRAFFIC: RAILWAYS, SEA-BORNE SH IPPIN G AND CIVIL AVIATION (C ont’d ) M onthly averages or calendar months
1954 1955 1956 1957 1958 19591959 0691
III IV I II III Oct Nov
INTERNATIONAL SEA-BORNE SHIPPING F re igh t lo a d e d (L) a n d u n lo a d e d (U)
B urm a† L.in ex te rnal trade
150
145 )snot dnasuoht(
168
201 220 217 217 171 226U . . . 90 73 78 110 145 134 103 99 106
C eylon L . . . 92 88 82 83 69 66 60 77 59 65 69 70 63U . . . 203 191 205 268 280 321 274 410 409 325 354 446 288
C hina: T a iw a n L . . . 85 106 104 111 149 147 106 133 160 160 120U . . . 142 155 177 193 189 203 221 190 213 220 265
Fed . of M a la y a L . . . 183 226 284 310 258 345 445 308 290 612 551 484 272U . . . 193 231 241 235 221 226 228 243 243 270 285 308 277
H o n g Kong L . . . 126 141 162 143 164 166 166 190 188 178 181 167U . . . 303 347 386 426 443 458 471 494 498 472 508 508
In d o n e sia L . . . 1,068 1,040 1,096 1,500 1,412 1,067 931 642 1,407 1,279 1,305 1,573U . . . 326 389 488 526 292 292 337 263 254 218 225 313
I ra n * d L . . . 292 1, 199 1,181 1,686 2,363 2,151 2,404 2,394 2,392 2,441 2,727U . . . 65 89 72 84 106 107 102 108 131 94 119
Ja p a n e L . . . 476 624 681 645 726 790 781 805 819 853 921 912 894U . . . 2,794 3,058 3,870 4,890 4,093 5,411 5,613 6,185 6,635 6,854 7,634 7,558 7,830
Korea, R epublic of L . . . 9 7 11 15 10 15 15 8 10 27 30 29 43U . . . 82 138 74 104 98 96 87 80 100 363 173 197 176
North Borneo L . . . 35 39 46 62 70 98 115 108 95 117 118U . . . 16 18 23 24 29 35 37 37 39 39 41
P a k is tan L . . . 101 124 120 100 94 120 99 159 134 128 141 186 171U . . . 218 236 335 384 378 333 322 324 499 551 543 493 416
Philipp ines L . . . 442 483 587 494 466 449 615U . . . 251 280 347 297 242 309 310
S a ra w a k L . . . 410 444 485 478 441 527 540 506 450 439 454U . . . 13 17 19 17 16 23 23 23 24 24 29
S ingapore L . . . 450 510 552 554 483 430 446 441 418 419 450 472U . . . 769 883 921 958 855 773 813 768 745 800 818 876
T h ailan d (Bangkok) L . . . 138 161 164 186 162 175 156 233 216 186 193 236 277U . . . 108 116 126 138 142 154 150 154 160 167 162 159 164
Viet-Nam (Saigon) L . . . 36 39 28 47 40 52 60 54 82 75 73U . . . 126 112 108 115 125 141 154 146 132 145 140
slessev fo )C( secnaraelc dna )E( secnartnEIn d ia E ...............................
w ith c a rg o 753 806
edart lanetxe ni829
947
ten dnasuoht( 1,014 1,079
r egistered tons) 1,129 1,081 1,061 1,243 1,194
c . . . 800 702 737 702 812 960 954 884 812 859 926
CIVIL AVIATIONf P assenger-k ilom etres
B urm a . . . .(million)
4.55 5.11 4.99 3.36 3.89 3.81 3.28 3.00 4.1 5.2C eylon . . . . 0.77 0.79 2.45 3.28 3.81 4.04 4.81 4.11 4.0 4.0 4.3 3.8C hina: T a iw a n 3.64 3.85 3.99 4.50 4.55 5.48 6.33 5.42 4.67 5.49 5.42 6.78In d ia . . . . 36.70 42.92 56.60 65.13 72.0 78.23 76.8 82.31 78.13 89.32 102.27In d o n es ia . 15.01 19.87 22.40 23.34 16.16 21.40 22.48 22.93I ra n . . . . 1.60 2.58g 2.84s 3.33 3.47J a p a n . . . . 19.47 27.43 37.96 47.37 57.19 70.18 82.63 72.37 64.14P a k is tan 4.88 9.21 12.03 17.71 19.12 21 .1 0 23.51 21.92 24.22 28.59 29.32 31.70Philipp ines 10.84 10.08 11.74 13.94 15.61 19.75 17.57 20.36 23.88 28.09 22.48 25.71 25.01T h ailan d . 3.35 4.14 5.01 6.53 4.18 3.56 3.06 3.96 3.38 3.50 5.85
Fre igh t ton-kilom etres (thousand) B u r m a .................................................. 181 112 94 66 73 76 84 74 83 83C ey lon . . . . 12 14 118 144 120 161 178 186 164 166 172 181C hina: T a iw a n 199 203 162 165 168 180 165 174 163 153 156 183In d ia . . . . 2,357 2,879 3,215 3,225 3,402 3,473 3,449 3,682 3,485 3,678 3,848In d o n e s ia . 621 662 729 762 453 476 472 499 415 451 471Iran 17 50s 105g 213 284Ja p a n . . . . 258 508 762 942 1,215 1,614 1,618 2,126 1,683P a k is ta n 147 214 260 357 543 1,145 1,161 1,374 1,351 1,411 1,548 1,965
361 315 335 386 347 407 404 449 431 417T h ailan d 151 107 112 156 73 41 40 41 34 58 117
a. Ra ilw ay traffic coverage: China ( T a iw a n ) , Ta iw an Ra ilw ay A d m in is t ra t io n ; Ind ia and Pakistan, class I ra ilways; Japan, State Railways on ly ; Philippines, M anila Ra ilroad Company.
b. F rom August 1954, Republic o f V ie t-N a m only .c. In c lu d in g service traffic.d. Caspian Sea traffic included.
e. E xc lud ing m i l i ta r y and cha r ity goods and t rans it traffic , in c lu d in g im ports and exports by a i r and parcel post, and p r io r to 1955, in c lu d in g also trade in ships delivered as goods w i th o u t being loaded on o ther ships.
f . Scheduled domestic and in te rna t ion a l routes.g. I n c lu d in g non-scheduled a n d /o r non-revenue operations.

15. RAILW AYS: LENGTH AND ROLLING STOCKa
139
TRANSPORT
LENGTH O F RAILWAYS (km) NUMBER O F LOCOMOTIVESb
1938 1948 1955 1956 1957 1958----------------------
1959 1960 1938 1948 1955 1956 1957 1958 1959 1960
Burma 3,314 2,911 2,787 2,885 2,921 2,969 2,990 2,990 369 274 312 312 312 303 303 303
Cambodia 339 385 385 385 385 385 385 385 24 24 24 24 24 24
Ceylon 1,530 1,438 1,446 1,446 1,446 249 236 270 273 276 277
China: M ain land 27,171 29,237 29,862 31,193
China: T aiw an . 882 917 950 950 959 959 973 205 253 252 252 250 250
Fed. of M a lay a . 1,730 2,092 2,092 2,092 2,092 2,092 201 193 196 200 199 187
Hong Kong . 36 36 36 36 36 36 36 17 19 16 18 16 12 12
India . . . . 59,472 49,322 50,498 50,610 50,785 51,060 51,338 51,551 8,488 8,194 8,803 9,288 9,719 10,093 10,393 10,534
Indonesia 7,332 3,617 6,640 6,640 6,640 6,640 6,640 1,273 584e 1,065 1,066 1,073 1,125 1,209
Iran . . . . . . . 2,567 3,234 276 262 341 361
Japan . . . . 17,934 19,752 20,046 20,093 20,186 20,276 20,357 20,402 6,283 5,474 5,425 5,387 5,406 5,334
Korea, Republic of 2,558 2,846 2,910 2,938 2,949 2,978 2,976f 656 527 528 546 528 465 318f
North Borneo . 209 187 187 187 187 11 16 19 19 19
Pakistan . 11,162 11,336 11,335 11,333 11,333 16,144 16,199 1,286 1,317 1,252 1,270 1,293 1,326 1,350
Philippines 866 962 964 964 92 105 166 133 133
Thailand . 3,100 3,213 3,377 3,471 3,471 3,494 3,494 200 339 387 380 380 380 373
Viet-Nam, Rep. of 2,569 968 1,127 1,020 1,265 1,323 1,364 121 123 123 123 122
NUMBER OF PASSENGER CARSc NUMBER OF W A G O N Sd
1938 1948 1955 1956
_
1957 1958 1959 1960 1938 1948 1955 1956 1957 1958 1959 1960
Burma 1,167 479 742 733 819 935 977 854 9,690 6,912 7,511 7,475 8,680 9,349 9,427 8,709
Cambodia 47 47 47 47 47 58 . 392 392 392 390 390 459
China: T aiw an . 498 456 571 578 640 638 4,654 5,703 5,530 5,368 5,332 5,701
Fed. of M a lay a . 289 327 337 353 370 373 4,967 4,938 5,185 5,134 5,222 5,355
Hong Kong 44 35 48 55 51 51 51 51 90 227 227 215 210 210 210
India . . . . 26,338 20,979 23,335 23,880 24,604 25,317 26,638 27,888 221,509 214,320 234,187 243,192 269,878 292,105 304,198 306,714
Indonesia 3,600 2 , 021 3,041 3,033 3,085 3,136 3,027 . . . 27,247 16,690 23,127 23,169 23,386 22,988 22,956
Iran . . . . 136 163 183 3,383 3,898 4,667 4,737
Japan . . . . 14,154 14,406 14,730 15,564 16,082 104,404 104,022 104,917 108,988 107,851
Korea, Republic of 1,321 974 1,144 1,158 1,153 1,259 l,331f 9,318 11,934 11,522 10,593 9,963 9,793 9,541f
North Borneo . 22 36 40 41 41 80 141 143 130 132
Pakistan . 2,987 2,681 2,720 2,762 2,773 4,343 4,607 34,702 41,329 38,878 39,090 40.292 41,622 45,711
Philippines 258 144 152 142 140 2,089 2,280 2,250 2,063 1,978
Thailand . 322 453 660 658 777 816 811 3,833 5,436 6,212 6,599 6,912 6,950 7,057
Viet-Nam, Rep. of 188 208 217 219 262 . . . 978 1,077 1,068 1,068 1,372
a. The figures show stock under the con tro l o f the ra ilways o f the coun try i.e. the stock o f the ra ilways plus tha t h ire d f ro m , less that leased to, others. Stock on short te rm loan to o r f ro m other countries is no t con-sidered to be leased or h ired . The ra ilways to w h ic h the figures re fer are those open to pub l ic traffic exc lud ing urban and suburban tramways, cable and fun icu la r ra ilways. Priva te ly-owned stock registered in the ra i lw a y adm in is tra tion is considered to be unde r the con tro l o f the ra i lw a y in ques-tion. The t im e o f year to w h ic h the stock refers is the end o f the w o rk in g year.
b. L ocom otives : A l l vehicles w i th engines o r m o to r and m otive power o r w i th moto rs o n ly (e lec tr ic locomotives) designed exclusively fo r tran spo rt in g them -selves and hau l in g other vehicles. Excludes railcars.
c. Passenger cars: A l l passenger ca rry ing cars in c lu d in g railcars, baggage cars and ra ilw ay-ow ned postal vans.
d. W agons ( fre ig h t cars): A l l goods-carry ing wagons exc lud ing baggage vans and wagons used exclusively fo r service traffic.
e. E xc lu d in g locomotives unde r repair.f . As a t N ovem ber 1960.
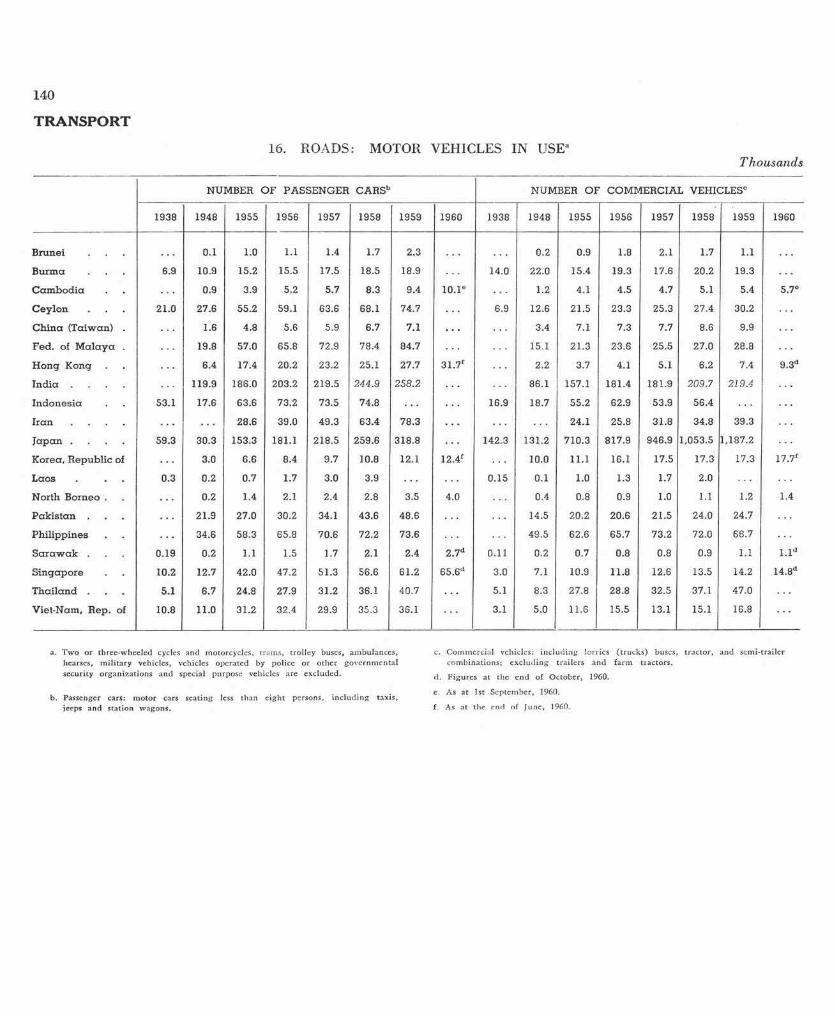
140
TRANSPORT
16. ROADS: MOTOR VEHICLES IN USEaThousands
NUMBER O F PASSENGER CARSb
1938 1948 1955 1956 1957 1958 1959 1960 1938 1948 1955 1956 1957 1958 1959 1960
Brunei 0.1 1.0 1.1 1.4 1.7 2.3 0.2 0.9 1.8 2.1 1.7 1.1
Burm a 6.9 10.9 15.2 15.5 17.5 18.5 18.9 14.0 22.0 15.4 19.3 17.6 20.2 19.3
C a m b o d ia 0.9 3.9 5.2 5.7 8.3 9.4 10.1e 1.2 4.1 4.5 4.7 5.1 5.4 5.7°
C ey lon 21.0 27.6 55.2 59.1 63.6 68.1 74.7 6.9 12.6 21.5 23.3 25.3 27.4 30.2
C h in a (Taiwan) . 1.6 4.8 5.6 5.9 6.7 7.1 3.4 7.1 7.3 7.7 8.6 9.9
Fed . of M a la y a . 19.8 57.0 65.8 72.9 78.4 84.7 15.1 21.3 23.6 25.5 27.0 28.8
H ong Kong 6.4 17.4 20.2 23.2 25.1 27.7 31.7f 2.2 3.7 4.1 5.1 6.2 7.4 9.3d
In d ia . . . . 119.9 186.0 203.2 219.5 244.9 258.2 86.1 157.1 181.4 181.9 209.7 219.4
Ind o n e sia 53.1 17.6 63.6 73.2 73.5 74.8 16.9 18.7 55.2 62.9 53.9 56.4
Ira n . . . . 28.6 39.0 49.3 63.4 78.3 24.1 25.8 31.8 34.8 39.3
Ja p a n . . . . 59.3 30.3 153.3 181.1 218.5 259.6 318.8 142.3 131.2 710.3 817.9 946.9 1,053.5 1,187.2
Korea, R epublic of 3.0 6.6 8.4 9.7 10.8 12.1 12.4f 10.0 11.1 16.1 17.5 17.3 17.3 17.7f
L aos 0.3 0.2 0.7 1.7 3.0 3.9 0.15 0.1 1.0 1.3 1.7 2.0
North Borneo . 0.2 1.4 2.1 2.4 2.8 3.5 4.0 0.4 0.8 0.9 1.0 1.1 1.2 1.4
P a k is ta n . 21.9 27.0 30.2 34.1 43.6 48.6 14.5 20.2 20.6 21.5 24.0 24.7
Philipp ines 34.6 58.3 65.8 70.6 72.2 73.6 49.5 62.6 65.7 73.2 72.0 66.7
S a r a w a k . 0.19 0.2 1.1 1.5 1.7 2.1 2.4 2.7d 0.11 0.2 0.7 0.8 0.8 0.9 1.1 l . l d
S in g ap o re 10.2 12.7 42.0 47.2 51.3 56.6 61.2 65.6d 3.0 7.1 10.9 11.8 12.6 13.5 14.2 14.8d
T h a ilan d . 5.1 6.7 24.8 27.9 31.2 36.1 40.7 5.1 8.3 27.8 28.8 32.5 37.1 47.0
Viet-Nam, Rep. of 10.8 11.0 31.2 32.4 29.9 35.3 36.1 3.1 5.0 11.6 15.5 13.1 15.1 16.8
NUMBER OF COMMERCIAL VEHICLESc
a. T w o o r three-wheeled cycles and motorcycles, trams, tro l le y buses, ambulances, hearses, m i l i ta ry vehicles, vehicles operated by police o r other governm enta l security organizations and special purpose vehicles are excluded.
b. Passenger cars: m oto r cars seating less than e igh t persons, in c lu d in g taxis, jeeps and station wagons.
c. C om m erc ia l vehicles: in c lu d in g lo rr ies ( tru cks ) buses, trac to r, and sem i-tra iler com binations; exc lud ing tra ile rs and fa rm tractors.
d. Figures a t the end o f O ctober, 1960.
e. As at 1st September, 1960.
f. As at the end o f June, 1960.
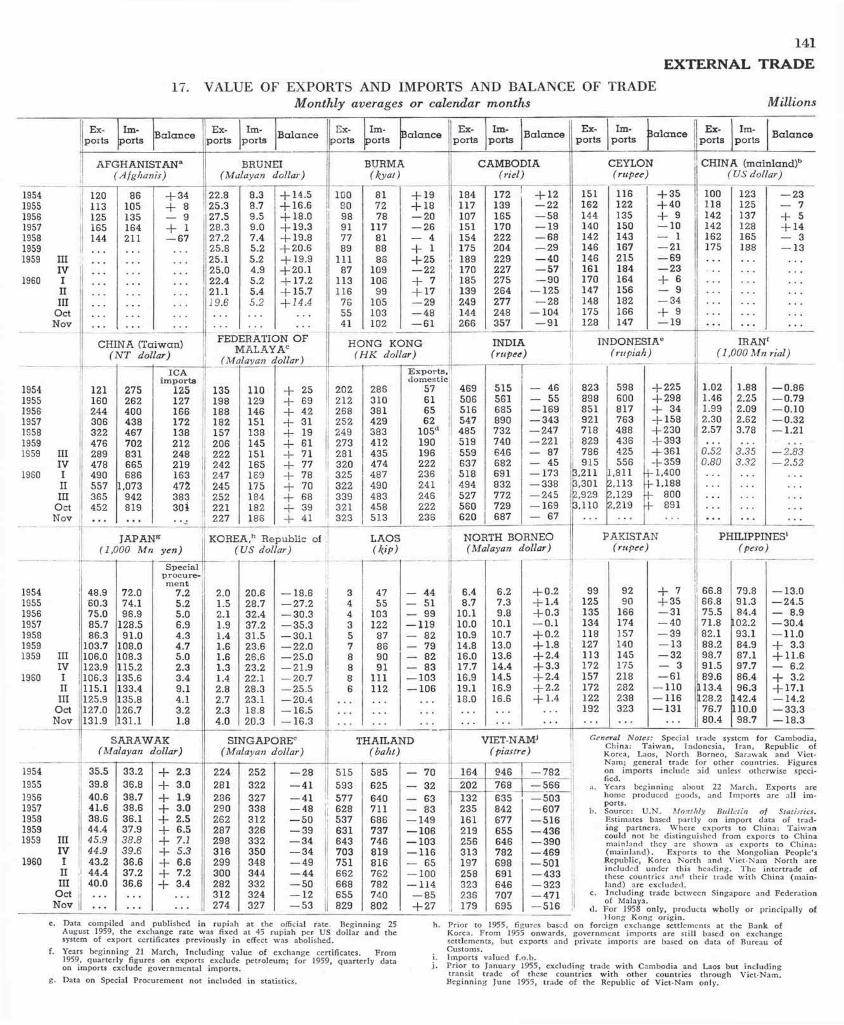
141
EXTERNAL TRADE
17. VALUE OF EXPORTS AND IMPORTS AND BALANCE OF TRADE M onthly averages or calendar months Millions
e. Data compiled and published in rup ia h at the official rate. B eg inn ing 25 August 1959, the exchange rate was f ixed at 45 rup ia h per US do l la r and the system o f export certificates prev ious ly in effect was abolished.
f. Years beg inn ing 21 March, In c lu d in g value o f exchange certif icates. F rom 1959, quarte r ly figures on exports exclude petro leum ; fo r 1959, qua r te r ly data on im ports exclude governmental im ports .
g. Data on Special Procurement not inc luded in statistics.
H o ng Ko ng o r ig in .h. P r io r to 1955, figures based on fo re ign exchange settlements at the Bank o f
Korea. F rom 1955 onwards, government im por ts are s t i l l based on exchange settlements, bu t exports and private im ports are based on data o f Bureau o f Customs.
i. Impo rts valued f.o.b.j . P r io r to January 1955, exc lud ing trade w i th Cambodia and Laos b u t in c lud ing
transit trade o f these countries w i th other countries th ro ugh V ie t-N am . B e g inn ing June 1955, trade o f the Republic o f V ie t -N a m only.
Ex-ports
Im-ports B a lance Ex-
portsIm -
ports B a lan ce Ex-ports
Im-ports B alance Ex-
portsIm-
ports B a lan ce Ex-ports
Im-ports Balance Ex-
portsIm-
ports B a lan ce
AFGHANISTANa(A f g h a n i s )
BRUNEI( M a la y a n d o l la r )
BURMA(kyat)
CAMBODIA(riel)
CEYLON( rupee )
b)dnalniam( ANIHC)rallod SU(
1954195519561957195819591959 III
IV1960 I
IIIII
Oct Nov
120113125165144
86105135164211
+ 34 + 8— 9 + 1— 67
22.825.327.528.3 27.2 25.8 25.125.022.421.119.6
8.3 8.7 9.5 9.07.45.25.2 4.95.25.45.2
+ 14.5 + 16.6 + 18.0 + 19.3 + 19.8 + 20.6 + 19.9 + 20.1 + 17.2 + 15.7 + 14.4
10090 9891 77 89
11187
113116765541
817278
117818886
10910699
105103102
+ 19 + 18 — 20 — 26— 4 + 1 + 25— 22 + 7 + 17— 29— 48—61
184 117 107 151 154 175
189 170185 139 249 144 266
172139165170222204229227275264277248357
+ 12 — 22—58— 19—68— 29—40 - 5 7— 90
— 125— 28
— 104 — 91
151162144140142146146 161 170147148 175 128
116122135150143167215184164156182166147
+ 35 + 40 + 9 — 10 — 1 — 21— 69—23 + 6— 9—34+ 9—19
100118142142162175
123125137128165188
— 23— 7 + 5 + 14— 3— 13
CHINA (Taiwan) ( N T dollar)
FEDERATION OFM ALAYAc HO N G KONG
(H K dollar)INDIA (rupee)
INDONESIAe( rupiah ) (1,
IRAN000 Mn
Erial)
1954195519561957 1S58 1959
III 9591IV
1960 IIIIII
OctNov
----------
121160244306322476289478490557365452
275262400438467702831665686
1,073942819
ICAimports
125 127 166 172 138 212 248 219 163 472 383 30 i
135198188182157206222242247245252221227
110129146151138145151165169175184182188
+ 25 + 69 + 42 + 31 + 19 + 61 + 71 + 77 + 78 + 70 + 68 + 39 + 41
i 202 212 268 252 249 273 281320 325322 339321323
288310381429383412435474487490483458513
Exports,domestic
57616562
105d190196222236241246222236
469506516547485519559 637 518 494 527560 620
515561685890732740646682691832772729687
— 46— 55— 169— 343—247— 221— 87— 45— 173—338— 245— 169— 67
823898851921718829786915
3,2113,3012,9293,110
598600817763488436425556
1,8112,1132,1292,219
+ 225 + 298 + 34 + 158 + 230 + 393 + 361 + 359
+ 1,400 f 1,188 f 800 f 891
1.021.461.992.302.57
0.520.80
1.882.252.092.623.78
3.353.32
— 0.86— 0.79—0.10— 0.32—1.21
—2.83—2.52
gNAPAJ(1,000 M n yen)
KOREA.h R epublic of (U S dollar)
LAOS(kip)
NORTH BORNEO ( Malayan dollar)
PAKISTAN ( rupee )
iSENIPPILLIHP( peso )
--------------
195419551956195719581959
III 9591IV
1960 IIIIII
Oct Nov
48.960.3 75.0 85.786.3
103.7 106.0123.9 106.3 115.1125.9 127.0131.9
72.074.1 96.9
128.5 91.0
108.0108.3 115.2135.6133.4 135.8126.7 131.1
Specialprocure-ment
7.25.25.0 6.94.34.75.02.33.49.14.13.21.8
2.01.5 2.1 1.9 1.41.6 1.61.31.4 2.8 2.7 2.3 4.0
20.628.732.437.231.523.626.623.2 22.128.3 23.118.820.3
— 18.6— 27.2— 30.3— 35.3— 30.1— 22.0— 25.0— 21.9— 20.7— 25.5— 20.4— 16.5— 16.3
344 3578 8 86
4755
103122
87869091
111 112
— 44— 51— 99— 119— 82— 79— 82— 83— 103— 106
6.48.7
10.110.010.914.8 16.0 17.716.9 19.1 18.0
6.27.39.8
10.110.713.013.614.414.5 16.916.6
+ 0.2 + 1.4 + 0.3 — 0.1 + 0.2 + 1.8 + 2.4 + 3.3 + 2.4 + 2.2 + 1.4
------------— --------
99125135134118127113172157172122192
9290
166174 157 140 145175 218 282 238 323
+ 7 + 35— 31— 40— 39— 13— 32— 3— 61
— 110 — 116 — 131
66.866.875.5 71.8 82.1 88.2 98.791.589.6
113.4 128.276.7 80.4
79.891.384.4
102.293.184.987.197.786.4 96.3
142.4110.0
98.7
— 13.0— 24.5— 8.9—30.4—11.0 + 3.3 + 11.6 — 6.2 + 3.2 + 17.1— 14.2—33.3— 18.3
SARAW AK ( Malayan dollar)
SINGAPOREc( Malayan dollar)
DNALIAHT( baht )
V jMAN-TEl)ertsaip (
General N otes: Special trade system fo r Cambodia, Ch ina: Ta iw an , Indonesia, I ran , Republic of Korea, Laos, N o r th Borneo, Sarawak and Viet- N am ; general trade fo r other countries. Figures on im por ts inc lude a id unless otherwise speci-fied.
a. Years beg inn ing about 22 March. Exports are home produced goods, and Im ports are a l l im -ports.
b. Source: U .N . M onthly Bulletin o f Statistics. Estimates based par t ly on im p o r t data o f t rad -in g partners. Where exports to Ch ina: Ta iw an could no t be d is tinguished f ro m exports to Ch ina m a in land they are shown as exports to China: (m a in la n d ) . Exports to the M ongol ian People’s Republic, Korea N o r th and V ie t -N am N o r th are inc luded under this heading. The in tertrade o f these countr ies and the ir trade w i th China (m a in -la nd) are excluded.
c. In c lu d in g trade between Singapore and Federation o f Malaya.
d. For 1958 on ly , products w h o l ly or p r in c ip a l ly o f
195419551956195719581959
III 9591IV
1960 IIIIII
Oct Nov
35.539.840.641.638.644.445.944.9 43.244.4 40.0
33.236.838.738.636.137.938.839.636.637.236.6
+ 2.3 + 3.0 + 1.9 + 3.0 + 2.5 + 6.5 + 7.1 + 5.3 + 6.6 + 7.2 + 3.4
224281286290262287298 316299300 282 312 274
252322327338312326 332 350 348 344 332 324327
— 28 - 4 1—41 - 4 8 —50— 39—34—34—49— 44— 50—12 — 53
515593577628537631643703751662668655829
585625640711686737746819816762782740802
— 70 164 946 — 782— 32— 63— 83— 149—106— 103—116— 65—100 — 114
— 85 + 27
202 768 — 566132235 161 219 256 313 197 258 323236 179
635842677655646782698691646707695
— 503—607—516—436— 390—469—501— 433— 323— 471—516

142
EXTERNAL TRADE18. DIRECTION OF INTERNATIONAL TRADE
Quarterly averages or quarters Million dollars
A re a of origin for imports a n d a re a
of destina tion for exports
Y eara n d
Q u arte r
BURMA CAMBODIA CEYLON CHINA:T aiw an
FEDERATION OF MALAYA H O NG KONG INDIA INDONESIAb
Exp. Imp. Exp. Imp. Exp. Imp. Exp. Imp. Exp. Imp. Exp. Imp. Exp.----Imp. Exp. Imp.
1. 1953 59.4 44.2 82.3 84.5 31.9 45.5 75.2------------
73.1 120.8 170.6 279.0 300.2 210.0 191.2All countries 1954 62.1 51.1 95.0 73.4 23.3 52.8 76.2 66.1 120.3 164.9 295.6 323.8 214.0 157.3
1955 56.7 45.2 10.0 11.9 101.8 76.7 30.8 50.2 112.3 78.1 127.5 180.0 319.1 353.4 236.4 157.81956 61.5 49.4 9.3 13.7 91.1 85.8 29.6 48.4 117.0 186.2 163.0 221.2 312.8 427.2 220.5 213.31957 52.5 74.0 12.9 14.6 88.3 94.7 37.1 53.1 114.2 90.0 149.8 243.0 337.5 538.6 242.4 199.21958 45.3 50.8 13.9 18.7 86.7 90.1 39.0 56.6 101.7 81.3 141.1 211.5 304.0 453.7 188.8 128.31959 55.7 55.7 14.4 16.5 88.8 105.3 39.2 57.9 136.4 83.3 157.3 229.8 327.0 465.9 218.1 114.7III 66.6 54.3 16.2 19.6 89.5 135.0 23.7 68.5 147.6 86.7 159.5 238.5 352.2 457.4 209.2 111.9IV 58.6 68.8 14.5 19.5 97.9 101.8 39.5 54.9 158.1 96.7 179.6 261.2 397.2 469.3 239.0 146.3
1960 I 71.4 67.0 15.9 23.6 104.3 103.7 40.4 56.6 171.6 100.2 184.6 270.4 321.7 441.4 214.1 120.7II 70.5 62.4 11.9 22.5 88.4 98.0 46.0 88.5 165.7 102.9 179.9 264.1 313.5 524.3 219.9 140.9III 21.4 23.7 90.7 113.7 30.1 77.7 175.8 111.7 192.8 267.8 314.4 560.4 196.5
2. 1953 45.0 22.9 16.6 34.9 21.8 17.5 13.5 35.2 90.0 93.4 54.4 42.5 72.2 78.2ECAFE 1954 52.2 26.3 19.0 32.6 18.8 20.7 14.0 31.9 72.5 76.1 48.7 62.4 86.0 64.8countriesa 1955 40.4 22.0 4.3 7.4 15.4 35.0 25.6 18.0 16.1 38.7 69.0 91.7 62.4 70.2 81.1 48.0(including 1956 45.5 23.1 3.3 8.8 17.4 39.6 23.0 19.9 20.7 40.6 93.1 115.6 55.5 76.6 85.2 77.0Japan) 1957 39.0 35.8 5.3 8.3 15.9 43.6 28.9 20.6 28.2 43.4 75.8 120.7 56.7 97.0 105.6 68.8
1958 34.1 26.4 4.9 9.5 8.5 38.8 31.2 25.2 26.3 40.5 62.9 114.9 54.0 86.2 88.2 51.81959 38.7 29.8 5.0 8.7 9.9 42.4 32.3 26.7 34.7 42.2 57.3 119.8 61.8 72.0 91.5 50.0III 52.4 30.0 3.8 12.3 10.3 54.5 16.0 32.0 39.8 44.4 57.2 126.0 70.9 67.8 91.3 41.9IV 37.3 38.2 7.0 10.3 11.1 45.8 34.8 26.2 40.5 51.5 67.5 140.5 69.6 92.3 90.9 70.6
0691 I 51.7 34.0 6.3 11.2 19.6 43.5 30.1 23.1 41.9 53.9 65.3 139.2 57.1 83.7 82.4 63.1II 4.8 9.3 9.5 43.3 35.9 30.7 42.6 54.3 59.5 130.3 61.1 83.7 99.3 67.0III 8.4 12.5 11.9 52.1 2 0.6 34.5 47.5 62.4 63.5 134.1 53.1 78.9 90.6
3. 1953 11.2 7.3 0.5 3.6 14.5 13.5 5.0 1.9 9.7 16.8 14.2 6.5 9.4 31.8Ja p a n 1954 14.6 11.2 0.8 4.0 11.9 17.6 5.3 2.2 5.0 20.3 8.6 8.8 12.5 34.2
1955 11.4 9.6 0.1 1.2 0.6 5.2 18.3 15.3 7.3 3.6 6.4 23.0 13.8 16.9 18.3 21.61956 9.4 8.2 0.4 2.6 0.8 6.0 11.0 17.6 9.8 3.8 13.9 35.5 15.7 22.9 18.4 33.41957 5.9 17.7 0.3 2.4 1.4 6.8 13.1 17.6 14.4 3.6 10.0 33.4 14.4 28.6 10.0 30.01958 2.5 12.2 0.1 3.3 2.0 8.2 16.3 22.4 13.4 3.2 5.2 26.1 13.6 20.8 6.8 17.41959 2.1 12.6 0.6 2.2 2.2 7.8 16.3 23.4 24.6 4.5 10.1 33.7 18.1 21.5 8.3 17.1III 1.3 10.1 0.6 3.8 2.1 6.2 3.9 28.4 28.9 4.9 10.4 35.1 20.0 13.5 5.1 16.0IV 1.5 18.1 1.5 2.0 1.8 9.3 19.3 23.0 29.6 5.2 12.3 40.2 17.6 20.3 10.6 21.8
1960 I 2.9 13.0 1.6 3.5 4.1 8.4 16.7 19.2 28.7 6.7 12.3 41.1 18.1 20.1 9.9 14.0II 0.3 2.7 2.7 8.2 19.8 27.3 29.5 6.0 8.9 42.9 22.3 28.4 7.8 26.6III 1.0 4.2 2.4 9.0 8.9 30.7 33.4 6.9 9.2 38.2 13.7 27.3 8.8
4. 1953 6.4 16.9 30.4 27.3 3.9 6.3 36.8 28.3 10.5 50.9 102.7 127.8 74.2 65.2W estern 1954 5.4 20.2 34.8 24.2 1.4 4.5 37.2 27.2 10.6 42.4 122.2 144.2 71.6 52.0Europe 1955 8.8 18.8 3 .1 3.7 38.8 26.6 1.7 3.5 58.3 31.4 15.9 41.6 126.6 159.2 79.3 60.4(in c lu d in g UK) 1956 7.6 18.9 3.1 3.0 35.8 30.2 1.8 4.5 54.8 36.4 18.6 46.9 130.6 219.6 80.8 75.8
1957 4.9 27.2 3.3 4.4 31.6 29.2 1.3 4.9 50.0 36.5 20.7 61.2 119.3 265.6 78.0 73.61958 4.4 17.1 3.8 7.3 37.8 30.4 1.5 4.9 42.8 31.9 24.9 46.9 116.2 190.9 47.4 42.21959 8.9 18.2 4.8 5.9 36.4 35.9 2.2 5.6 50.5 32.0 29.7 50.5 126.1 206.9 72.0 34.7III 8.6 17.9 5.0 5.1 23.7 29.4 2.7 7.6 53.2 33.5 29.4 53.8 132.0 198.8 70.0 38.0IV 11.6 21.8 5.4 6.7 40.0 38.6 3.2 6.3 61.0 36.1 33.8 54.7 167.5 206.3 89.7 44.6
1960 I 10.3 21.8 5.7 8.9 39.3 33.8 1.7 5.5 73.1 34.8 36.6 59.1 125.0 198.8 68.0 30.5II 4.5 10.1 37.5 40.3 1.5 13.0 72.3 37.4 39.6 61.1 103.6 242.0 47.7 41.4III 6.9 6.4 35.3 32.2 3.1 8.1 74.7 38.4 40.6 57.9 116.4 220.2 33.7
5. 1953 4.4 11.8 20.4 19.0 2.1 2.0 18.5 23.1 5.2 20.8 78.5 74.2 4.4 13.5United 1954 3.9 12.5 26.4 15.4 0.7 1.3 14.9 21.3 7.1 16.2 93.1 79.2 9.8 8.5Kingdom 1955 4.8 11.5 0.2 0.1 26.5 16.2 0.9 0.6 26.5 24.1 11.0 19.3 88.3 84.8 23.0 8.7
1956 4.6 10.4 0.1 0.2 26.3 18.3 0.7 0.8 23.2 27.2 13.0 22.4 96.7 109.1 19.6 12.91957 3.2 15.7 — 0.2 24.1 19.4 0.3 0.8 24.6 26.8 14.7 29.2 84.5 125.2 17.6 11.41958 3.4 9.4 0.1 0.4 29.7 21.8 0.2 1.0 20.7 24.5 17.2 23.2 87.3 88.5 24.0 6.81959 4.9 10.7 — 0.2 25.2 26.0 0.4 0.9 19.2 21.4 20.2 25.1 90.4 90.7 47.7 7.6III 4.7 10.2 — 0.2 16.7 21.8 0.4 0.9 24.1 22.5 19.5 26.2 98.1 94.7 47.5 7.9IV 6.5 13.4 0.3 0.2 27.3 29.3 0.8 0.9 20.6 21.9 22.8 27.4 123.3 95.3 58.2 10.3
1960 I 5.3 11.8 0.2 0.5 27.8 22.4 0.3 1.0 24.0 24.0 24.7 29.9 87.7 96.0 48.3 8.0II 0.2 0.5 27.1 24.1 0.3 1.1 30.3 26.0 27.2 29.8 69.4 114.7 16.5 12.1III 0.8 0.6 25.2 22.3 0.6 1.4 22.2 25.5 28.5 27.7 89.2 100.7 10.4
6. 1953 __ 0.2 0.2 0.6 __ — 1.5 0.2 — 1.0 1.8 2.0 1.1 1.4E aste rn 1954 0.2 0.6 0.1 0.6 — —. 1.9 0.2 — 1.0 2.8 4.0 1.8 3.3Europe 1955 5.6 0.4 — — 0.1 0.4 — — 2.1 0.2 •— 0.8 2.2 4.2 6.7 7.2
1956 5.6 3.8 — — 0.1 0.4 — — 4.7 0.3 — 0.8 9.1 13.8 3.0 2.81957 4.4 5.2 — — 0.3 0.4 — — 3.4 0.4 — 0.6 12.6 19.8 2.2 1.61958 2.8 3.4 .— . 0.2 0.3 0.4 — . -— 9.6 0.2 — 0.4 16.0 17.7 2.7 1.01959 2.4 2.5 0.2 0.5 1.7 1.3 -— — 1 8 . 7 0.2 — 0.5 22.5 16.2 5.0 1.9
III 1.2 2.0 0.7 0.5 0.3 0.5 .— . — 20.0 0.2 — 0.8 21.9 16.4 7.5 2.0IV 0.5 2.5 0.2 0.8 0.6 0.8 — . — 20.1 0.4 — 0.6 30.4 17.9 8.7 1.8
1960 I 3.2 4.6 — 1.4 2.0 0.8 —. — 9.9 0.3 — 0.8 22.9 13.6 6.0 1.9II 0.4 1.0 4.0 1.1 — — 15.5 0.2 — 0.8 26.5 15.9 6.6 2.0III 2.7 1.7 0.9 1.9 — — 15.5 0.2 — 0.8 19.3 21.9 10.9
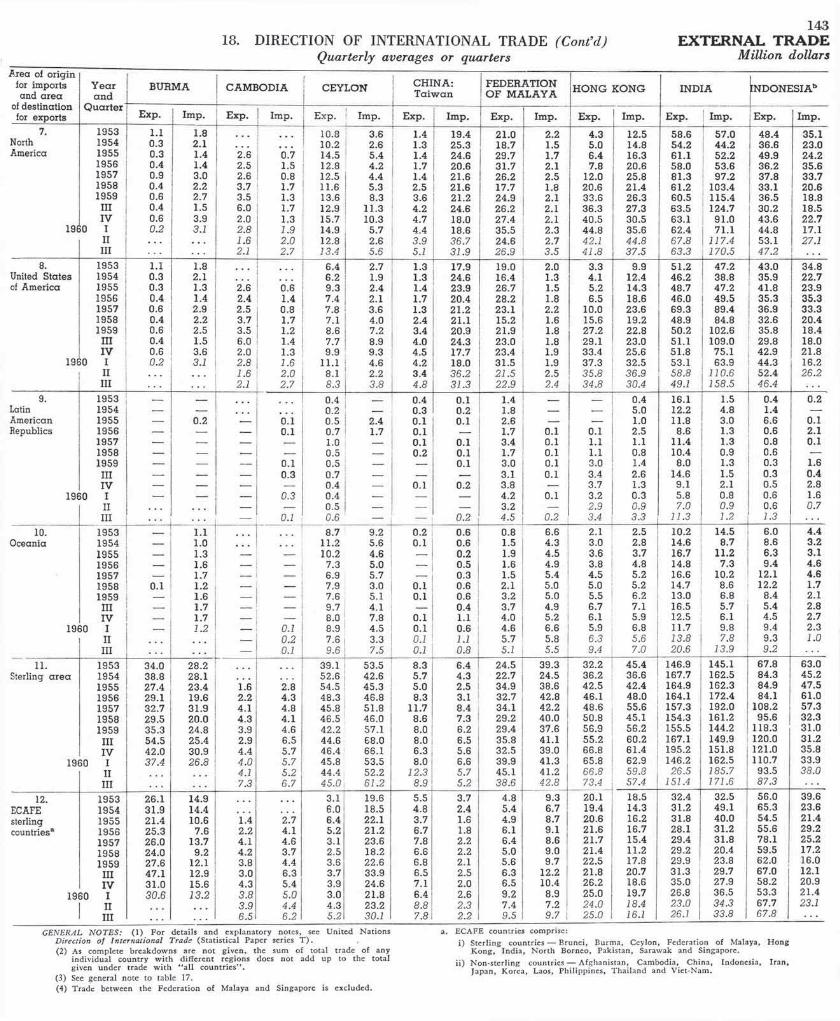
18. DIRECTION OF INTERNATIONAL TRADE (C o n t’d ) Q uarterly averages or quarters
1 4 3EXTERNAL TRADE
M illion dollars
Area of origin for imports and a rea
Y e a ra n d
BURM A C A M B O D IA C E Y LO N C H IN A :T a iw a n
F E D E R A T IO N O F M A L A Y A H O N G K O N G IN D IA IN D O N ESIA b
of destination for exports
Q u a r te rE xp . Im p . E xp . Im p. Exp. Im p . E xp . Im p . E xp . Im p . E xp . Im p . E xp . Im p . E xp . Im p .
7. 1953 1.1 1.8 10.8 3.6 1.4 19.4 21.0 2.2 4.3 12.5 58.6 57.0 48.4 35.1North 1954 0.3 2.1 10.2 2.6 1.3 25.3 18.7 1.5 5.0 14.8 54.2 44.2 36.6 23.0America 1955 0.3 1.4 2.6 0.7 14.5 5.4 1.4 24.6 29.7 1.7 6.4 16.3 61.1 52.2 49.9 24.2
1956 0.4 1.4 2.5 1.5 12.8 4.2 1.7 20.6 31.7 2.1 7.8 20.6 58.0 53.6 36.2 35.61957 0.9 3.0 2.6 0.8 12.5 4.4 1.4 21.6 26.2 2.5 12.0 25.8 81.3 97.2 37.8 33.71958 0.4 2.2 3.7 1.7 11.6 5.3 2.5 21.6 17.7 1.8 20.6 21.4 61.2 103.4 33.1 20.61959 0.6 2.7 3.5 1.3 13.6 8.3 3.6 21.2 24.9 2.1 33.6 26.3 60.5 115.4 36.5 18.8
III 0.4 1.5 6.0 1.7 12.9 11.3 4.2 24.6 26.2 2.1 36.3 27.3 63.5 124.7 30.2 18.5IV 0.6 3.9 2.0 1.3 15.7 10.3 4.7 18.0 27.4 2.1 40.5 30.5 63.1 91.0 43.6 22.7
1960 I 0.2 3.1 2.8 1.9 14.9 5.7 4.4 18.6 35.5 2.3 44.8 35.6 62.4 71.1 44.8 17.1II 1.6 2.0 12.8 2.6 3.9 3 6 . 7 24.6 2.7 42.1 44.8 6 7 . 8 117.4 53.1 27.1
III 2.1 2.7 13.4 5 . 6 5.1 31.9 2 6 . 9 3.5 41.8 37.5 63.3 170.5 47.2
8. 1953 1.1 1.8 6.4 2.7 1.3 17.9 19.0 2.0 3.3 9.9 51.2 47.2 43.0 34.8United States 1954 0.3 2.1 6.2 1.9 1.3 24.6 16.4 1.3 4.1 12.4 46.2 38.8 35.9 22.7of America 1955 0.3 1.3 2.6 0.6 9.3 2.4 1.4 23.9 26.7 1.5 5.2 14.3 48.7 47.2 41.8 23.9
1956 0.4 1.4 2.4 1.4 7.4 2.1 1.7 20.4 28.2 1.8 6.5 18.6 46.0 49.5 35.3 35.31957 0.6 2.9 2.5 0.8 7.8 3.6 1.3 21.2 23.1 2.2 10.0 23.6 69.3 89.4 36.9 33.31958 0.4 2.2 3.7 1.7 7.1 4.0 2.4 21.1 15.2 1.6 15.6 19.2 48.9 84.8 32.6 20.41959 0.6 2.5 3.5 1.2 8.6 7.2 3.4 20.9 21.9 1.8 27.2 22.8 50.2 102.6 35.8 18.4
III 0.4 1.5 6.0 1.4 7.7 8.9 4.0 24.3 23.0 1.8 29.1 23.0 51.1 109.0 29.8 18.0IV 0.6 3.6 2.0 1.3 9.9 9.3 4.5 17.7 23.4 1.9 33.4 25.6 51.8 75.1 42.9 21.8
1960 I 0.2 3.1 2.8 1.6 11.1 4.6 4.2 18.0 31.5 1.9 37.3 32.5 53.1 63.9 44.3 16.2II 1.6 2.0 8.1 2.2 3.4 3 6 . 2 21.5 2.5 35.8 3 6 . 9 5 8 . 8 110.6 52.4 2 6 . 2
III 2.1 2.7 8.3 3.8 4.8 31.3 22.9 2.4 34.8 30.4 49.1 158.5 46.4
9. 1953 __ __ 0.4 0.4 0.1 1.4 — — 0.4 16.1 1.5 0.4 0.2Latin 1954 __ __ 0.2 0.3 0.2 1.8 — -— 5.0 12.2 4.8 1.4
0.1American 1955 __ 0.2 ___ 0.1 0.5 2.4 0.1 0.1 2.6 — — 1.0 11.8 3.0 6.6Republics 1956 __ __ 0.1 0.7 1.7 0.1 — 1.7 0.1 0.1 2.5 8.6 1.3 0.6 2.1
1957 __ __ __ ___ 1.0 __ 0.1 0.1 3.4 0.1 1.1 1.1 11.4 1.3 0.8 0.11958 __ __ ._ __ 0.5 __ 0.2 0.1 1.7 0.1 1.1 0.8 10.4 0.9 0.6 —1959 _ __ 0.1 0.5 __ __ 0.1 3.0 0.1 3.0 1.4 8.0 1.3 0.3 1.6III __ 0.3 0.7 __ ___ __ 3.1 0.1 3.4 2.6 14.6 1.5 0.3 0.4IV ___ 0.4 __ 0.1 0.2 3.8 — 3.7 1.3 9.1 2.1 0.5 2.8
1960 I __ ___ 0.3 0.4 __ __ __ 4.2 0.1 3.2 0.3 5.8 0.8 0.6 1.6II __ 0.5 __ — 3.2 — 2.9 0 . 9 7 . 0 0 . 9 0.6 0 . 7
III — 0.1 0.6 — — 0.2 4.5 0.2 3.4 3 . 3 11.3 1.2 1.3
10. 1953 1.1 8.7 9.2 0.2 0.6 0.8 6.6 2.1 2.5 10.2 14.5 6.0 4.4O ceania 1954 __ 1.0 11.2 5.6 0.1 0.6 1.5 4.3 3.0 2.8 14.6 8.7 8.6 3.2
1955 1.3 __ __ 10.2 4.6 — 0.2 1.9 4.5 3.6 3.7 16.7 11.2 6.3 3.11956 1.6 __ __ 7.3 5.0 __ 0.5 1.6 4.9 3.8 4.8 14.8 7.3 9.4 4.61957 1.7 __ __ 6.9 5.7 —. 0.3 1.5 5.4 4.5 5.2 16.6 10.2 12.1 4.6
1958 0.1 1.2 ___ __ 7.9 3.0 0.1 0.6 2.1 5.0 5.0 5.2 14.7 8.6 12.2 1.7
1959 1.6 ___ __ 7.6 5.1 0.1 0.6 3.2 5.0 5.5 6.2 13.0 6.8 8.4 2.1III 1.7 __ 9.7 4.1 __ 0.4 3.7 4.9 6.7 7.1 16.5 5.7 5.4 2.8IV 1.7 __ 8.0 7.8 0.1 1.1 4.0 5.2 6.1 5.9 12.5 6.1 4.5 2.7
1960 I 1.2 0.1 8.9 4.5 0.1 0.6 4.6 6.6 5.9 6.8 11.7 9.8 9.4 2.3II 0.2 7.6 3.3 0.1 1.1 5.7 5.8 6 . 3 5 . 6 13.8 7.8 9.3 1.0
III 0.1 9.6 7.5 0.1 0.8 5.1 5 . 5 9.4 7.0 20.6 13.9 9.2
11. 1953 34.0 28.2 39.1 53.5 8.3 6.4 24.5 39.3 32.2 45.4 146.9 145.1 67.8 63.0
Sterling a r e a 19541955
38.827.4
28.123.4 1.6 2.8
52.654.5
42.645.3
5.75.0
4.32.5
22.734.9
24.538.6
36.242.5
36.642.4
167.7164.9
162.5162.3
84.384.9
45.247.5
1956 29.1 19.6 2.2 4.3 48.3 46.8 8.3 3.1 32.7 42.8 46.1 48.0 164.1 172.4 84.1 61.0
1957 32.7 31.9 4.1 4.8 45.8 51.8 11.7 8.4 34.1 42.2 48.6 55.6 157.3 192.0 108.2 57.3
1958 29.5 20.0 4.3 4.1 46.5 46.0 8.6 7.3 29.2 40.0 50.8 45.1 154.3 161.2 95.6 32.3
1959 35.3 24.8 3.9 4.6 42.2 57.1 8.0 6.2 29.4 37.6 56.9 56.2 155.5 144.2 118.3 31.0
IIIIVIIIIII
54.5 25.4 2.9 6.5 44.6 68.0 8.0 6.5 35.8 41.1 55.2 60.2 167.1 149.9 120.0 31.2
42.0 30.9 4.4 5.7 46.4 66.1 6.3 5.6 32.5 39.0 66.8 61.4 195.2 151.8 121.0 35.8
1960 37.4 26.8 4 . 0 5.7 45.8 53.5 8.0 6.6 39.9 41.3 65.8 62.9 146.2 162.5 110.7 33.94.1 5.2 44.4 52.2 12.3 5.7 45.1 41.2 66.8 59.8 26.5 185.7 93.5 38.07.3 6.7 45.0 61.2 8.9 5 . 2 38.6 42.8 73.4 57.4 151.4 171.6 87.3
12.ECAFEsterlingcountriesa
1953 26.1 14.9 3.1 19.6 5.5 3.7 4.8 9.3 20.1 18.5 32.4 32.5 56.0 39.6
195419551956195719581959IIIIVIIIIII
31.921.425.326.0
14.410.6
7.613.7
1.42.24.1
2.74.14.6
6.06.45.23.1
18.5 22.1 21.223.6
4.83.76.77.8
2.41.61.82.2
5.4 4.9 6.16.4
6.78.7 9.1 8.6
19.420.621.621.7
14.3 16.2 16.715.4
31.231.828.129.4
49.1 40.031.2 31.8
65.354.555.6 78.1
23.621.429.225.2
24.0 9.2 4.2 3.7 2.5 18.2 6.6 2.2 5.0 9.0 21.4 11.2 29.2 20.4 59.5 17.2
27.6 12.1 3.8 4.4 3.6 22.6 6.8 2.1 5.6 9.7 22.5 17.8 29.9 23.8 62.0 16.0
47.1 12.9 3.0 6.3 3.7 33.9 6.5 2.5 6.3 12.2 21.8 20.7 31.3 29.7 67.0 12.1
196031.030.6
15.613.2
4.33.83.9
5.45.04.4
3.93.04.3
24.621.823.2
7.16.48.8
2.02.62.3
6.59.27.4
10.48.97.2
26.225.024.0
18.619.718.4
35.0 26.823.0
27.936.534.3
58.253.3 67.7
20.921.423.1
6.5 6.2 5.2 30.1 7.8 2.2 9 . 5 9 . 7 25.0 16.1 26.1 33.8 67.8
GENERAL N O TE S: (1 ) F or details and explanatory notes, see U n ited N a tions Direction o f International Trade (Statistica l Paper series T ) .(2) As complete breakdowns are n o t g iven, the sum of to ta l trade o f any
in d iv id u a l country w i th d i f fe ren t regions does no t add up to the tota l g iven under trade w i th “ a l l countr ies” .
(3) See general note to table 17.(4) Trade between the Federation o f Malaya and Singapore is excluded.
a. ECAFE countries comprise:i ) S ter ling countries — Brune i, Burma, Ceylon, Federation o f Malaya, H o ng
K o ng , Ind ia , N o r th Borneo, Pakistan, Sarawak and Singapore.i i ) N o n -s te r l ing countries — Afghan istan, Cambodia, Ch ina, Indonesia, Iran ,
Japan, Korea, Laos, Ph ilipp ines, T ha iland and V ie t-N am .
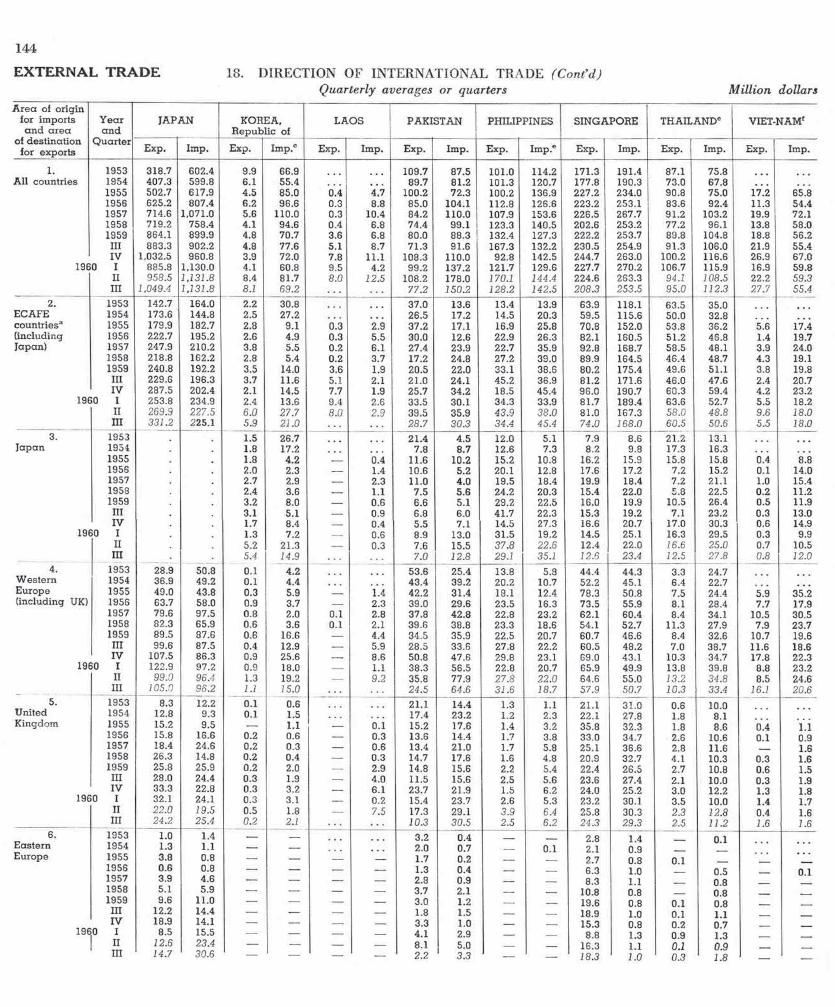
1 4 4
EXTERNAL TRADE 18. DIRECTION OF INTERNATIONAL TRADE (Cont’d )Quarterly averages or quarters Million dollars
A rea of origin for imports a n d a re a
of destina tion for exports
Y eara n d
Q u arte r
JAPAN KOREA. R epublic of
LAOS PAKISTAN PHILIPPINES SINGAPORE THAILANDc VIET-NAMf
Exp. Imp. Exp. Im p.c Exp. Imp. Exp. Imp. Exp. Imp.e Exp. Imp. Exp. Imp. Exp. Imp.
1. 1953 318.7 602.4 9.9 66.9 109.7 87.5 101.0 114.2 171.3 191.4 87.1 75.8All countries 1954 407.3 599.8 6.1 55.4 __ 89.7 81.2 101.3 120.7 177.8 190.3 73.0 67.8
1955 502.7 617.9 4.5 85.0 0.4 4.7 100.2 72.3 100.2 136.9 227.2 234.0 90.8 75.0 17.2 65.81956 625.2 807.4 6.2 96.6 0.3 8.8 85.0 104.1 112.8 126.6 223.2 253.1 83.6 92.4 11.3 54.41957 714.6 1,071.0 5.6 110.0 0.3 10.4 84.2 110.0 107.9 153.6 226.5 267.7 91.2 103.2 19.9 72.11958 719.2 758.4 4.1 94.6 0.4 6.8 74.4 99.1 123.3 140.5 202.6 253.2 77.2 96.1 13.8 58.01959 864.1 899.9 4.8 70.7 3.6 6.8 80.0 88.3 132.4 127.3 222.2 253.7 89.8 104.8 18.8 56.2III 883.3 902.2 4.8 77.6 5.1 8.7 71.3 91.6 167.3 132.2 230.5 254.9 91.3 106.0 21.9 55.4IV 1,032.5 960.8 3.9 72.0 7.8 11.1 108.3 110.0 92.8 142.5 244.7 263.0 100.2 116.6 26.9 67.0
1960 I 885.8 1,130.0 4.1 60.8 9.5 4.2 99.2 137.2 121.7 129.6 227.7 270.2 106.7 115.9 16.9 59.8II 958.5 1,131.8 8.4 81.7 8.0 12.5 108.2 178.0 170.1 144.4 224.6 263.3 94.1 108.5 22.2 59.3
III 1.049.4 1,131.8 8.1 69.2 77.2 150.2 128.2 142.5 208.3 253.5 95.0 112.3 27.7 55.4
2. 1953 142.7 164.0 2.2 30.8 37.0 13.6 13.4 13.9 63.9 118.1 63.5 35.0ECAFE 1954 173.6 144.8 2.5 27.2 26.5 17.2 14.5 20.3 59.5 115.6 50.0 32.8countriesa 1955 179.9 182.7 2.8 9.1 0.3 2.9 37.2 17.1 16.9 25.8 70.8 152.0 53.8 36.2 5.6 17.4(including 1956 222.7 195.2 2.6 4.9 0.3 5.5 30.0 12.6 22.9 26.3 82.1 160.5 51.2 46.8 1.4 19.7Japan) 1957 247.9 210.2 3.8 5.5 0.2 6.1 27.4 23.9 22.7 35.9 92.8 168.7 58.5 48.1 3.9 24.0
1958 218.8 162.2 2.8 5.4 0.2 3.7 17.2 24.8 27.2 39.0 89.9 164.5 46.4 48.7 4.3 19.11959 240.8 192.2 3.5 14.0 3.6 1.9 20.5 22.0 33.1 38.6 80.2 175.4 49.6 51.1 3.8 19.8III 229.6 196.3 3.7 11.6 5.1 2.1 21.0 24.1 45.2 36.9 81.2 171.6 46.0 47.6 2.4 20.7IV 287.5 202.4 2.1 14.5 7.7 1.9 25.7 34.2 18.5 45.4 96.0 190.7 60.3 59.4 4.2 23.2
1960 I 253.8 234.9 2.4 13.6 9.4 2.6 33.5 30.1 34.3 33.9 81.7 189.4 63.6 52.7 5.5 18.2II 269.9 227.5 6.0 27.7 8.0 2.9 39.5 35.9 43.9 38.0 81.0 167.3 58.0 48.8 9.6 18.0
III 331.2 225.1 5.9 21.0 28.7 30.3 34.4 45.4 74.0 168.0 60.5 50.6 5.5 18.0
3. 1 953 1.5 26.7 21.4 4.5 12.0 5.1 7.9 8.6 21.2 13.1Jap an 1954 1.8 17.2 7.8 8.7 12.6 7.3 8.2 9.8 17.3 16.3
1955 1.8 4.2 __ 0.4 11.6 10.2 15.2 10.8 16.2 15.9 15.8 15.8 0.4 8.81956 2.0 2.3 __ 1.4 10.6 5.2 20.1 12.8 17.6 17.2 7.2 15.2 0.1 14.01957 2.7 2.9 __ 2.3 11.0 4.0 19.5 18.4 19.9 18.4 7.2 21.1 1.0 15.41958 2.4 3.6 __ 1.1 7.5 5.6 24.2 20.3 15.4 22.0 5.8 22.5 0.2 11.21959 3.2 8.0 __ 0.6 6.6 5.1 29.2 22.5 16.0 19.9 10.5 26.4 0.5 11.9III 3.1 5.1 __ 0.9 6.8 6.0 41.7 22.3 15.3 19.2 7.1 23.2 0.3 13.0IV 1.7 8.4 0.4 5.5 7.1 14.5 27.3 16.6 20.7 17.0 30.3 0.6 14.9
I960 I 1.3 7.2 0.6 8.9 13.0 31.5 19.2 14.5 25.1 16.3 29.5 0.3 9.9II 5.2 21.3 0.3 7.6 15.5 37.8 22.6 12.4 22.0 16.6 25.0 0.7 10.5III 5.4 14.9 7.0 12.8 29.1 35.1 12.6 23.4 12.5 27.8 0.8 12.0
4. 1953 28.9 50.8 0.1 4.2 53.6 25.4 13.8 5.8 44.4 44.3 3.3 24.7W estern 1954 36.9 49.2 0.1 4.4 43.4 39.2 20.2 10.7 52.2 45.1 6.4 22.7Europe 1955 49.0 43.8 0.3 5.9 — 1.4 42.2 31.4 18.1 12.4 78.3 50.8 7.5 2 4 . 4 5.9 35.2(including UK) 1956 63.7 58.0 0.9 3.7 — 2.3 39.0 29.6 23.5 16.3 73.5 55.9 8.1 28.4 7.7 17.9
1957 79.6 97.5 0.8 2.0 0.1 2.8 37.8 42.8 22.8 23.2 62.1 60.4 8.4 34.1 10.5 30.51958 82.3 65.9 0.6 3.6 0.1 2.1 39.6 38.8 23.3 18.6 54.1 52.7 11.3 27.9 7.9 23.71959 89.5 87.6 0.6 16.6 — 4.4 34.5 35.9 22.5 20.7 60.7 46.6 8.4 32.6 10.7 19.6III 99.6 87.5 0.4 12.9 __ 5.9 28.5 33.6 27.8 22.2 60.5 48.2 7.0 38.7 11.6 18.6IV 107.5 86.3 0.9 25.6 __ 8.6 50.8 47.6 29.8 23.1 69.0 43.1 10.3 34.7 17.8 22.3
1960 I 122.9 97.2 0.9 18.0 __ 1.1 38.3 56.5 22.8 20.7 65.9 49.9 13.8 39.8 8.8 23.2II 99.0 96.4 1.3 19.2 __, 9.2 35.8 77.9 27.8 22.0 64.6 55.0 13.2 34.8 8.5 24.6III 105.0 96.2 1.1 15.0 24.5 64.6 31.6 18.7 57.9 50.7 10.3 33.4 16.1 20.6
5. 1953 8.3 12.2 0.1 0.6 21.1 14.4 1.3 1.1 21.1 31.0 0.6 10.0United 1954 12.8 9.3 0.1 1.5 17.4 23.2 1.2 2.3 22.1 27.8 1.8 8.1K ingdom 1955 15.2 9.5 — 1.1 — o.i 15.2 17.6 1 . 4 3.2 35.8 32.3 1.8 8.6 0.4 1.1
1956 15.8 16.6 0.2 0.6 — 0.3 13.6 14.4 1.7 3.8 33.0 3 4 . 7 2.6 10.6 0.1 0.91957 18.4 24.6 0.2 0.3 — 0.6 13.4 21.0 1.7 5.8 25.1 36.6 2.8 11.6 — 1.61958 26.3 14.8 0.2 0.4 — 0.3 14.7 17.6 1.6 4.8 20.9 32.7 4 . 1 10.3 0.3 1.61959 25.8 25.9 0.2 2.0 — 2.9 14.8 15.6 2.2 5.4 22.4 26.5 2.7 10.8 0.6 1.5III 28.0 24.4 0.3 1.9 — 4.0 11.5 15.6 2.5 5.6 23.6 27.4 2.1 10.0 0.3 1.9IV 33.3 22.8 0.3 3.2 _. 6.1 23.7 21.9 1.5 6.2 24.0 25.2 3.0 12.2 1.3 1.8
1960 I 32.1 24.1 0.3 3.1 — 0.2 15.4 23.7 2.6 5.3 23.2 30.1 3.5 10.0 1.4 1.7II 22.0 19.5 0.5 1.8 __ 7.5 17.3 29.1 3.9 6.4 25.8 30.3 2.3 12.8 0.4 1.6III 24.2 25.4 0.2 2.1 10.3 30.5 2.5 6.2 24.3 2 9 . 3 2.5 11.2 1.6 1.6
6. 1953 1.0 1.4 __ __ 3.2 0.4 — — 2.8 1.4 . — 0.1Eastern 1954 1.3 1.1 — _ 2.0 0.7 — 0.1 2.1 0.9 — —
Europe 1955 3.8 0.8 — — — — 1.7 0.2 — — 2.7 0.8 0.1 — — —1956 0.6 0.8 — — — — 1.3 0.4 — — 6.3 1.0 .— 0.5 — 0.11957 3.9 4.6 — — — — 2.3 0.9 — — 8.3 1.1 — 0.8 — —1958 5.1 5.9 — — — — 3.7 2.1 — — 10.8 0.8 — 0.8 — —
1959 9.6 11.0 — — . — — 3.0 1.2 — — 19.6 0.8 0.1 0.8 -— —
III 12.2 14.4 — — — — 1.8 1.5 — — 18.9 1.0 0.1 1.1 — —
IV 18.9 14.1 — — — — 3.3 1.0 — .— 15.3 0.8 0.2 0.7 — —1960 I 8.5 15.5 — — — — . 4.1 2.9 — — 8.8 1.3 0.9 1.3 — —
II 12.6 23.4 — — — .— 8.1 5.0 — — 16.3 1.1 0.1 0.9 — —III 14.7 30.6 -— — — — 2.2 3.3 — — 18.3 1.0 0.3 1.8 — —

145
18. DIRECTION OF INTERNATIONAL TRADE (Con t’d) Quarterly averages or quarters
EXTERNAL TRADEM illion dollars
Area of o rig in for im ports an d a r e a
of des tina tion for exports
Y eara n d
Q u a r te r
JAPAN KOREA, R epublic of
LAOS PAKISTAN PHILIPPINES SINGAPORE CDNALIAHT VIET-NAMf
Exp. Imp. Exp. Im p.c Exp. Imp. Exp. Imp. Exp. Imp.e Exp. Imp. Exp. Imp. Exp. Imp.
7. 1953 65.2 242.4 7.6 27.8 7.4 4.2 69.6 90.6 24.1 10.3 17.7 14.6North 1954 83.2 266.0 3.5 23.0 . . 6.1 6.2 62.4 85.4 25.3 11.9 14.0 11.5America 1955 134.8 255.5 1.8 62.1 __ 0.3 8.4 8.6 60.3 93.6 37.9 11.8 26.6 13.4 4.0 8.0
1956 164.5 358.6 2.7 82.1 __ 0.9 8.5 6.8 61.0 79.2 28.0 15.1 21.0 14.9 2.1 15.6
1957 183.5 495.6 1.0 98.6 __ 1.5 9.8 34.4 56.7 88.5 27.0 12.6 18.3 17.9 2.8 16.6
1958 214.6 339.4 0.7 83.0 __ 0.9 8.3 31.0 68.2 76.2 19.4 10.6 14.4 17.5 1.3 14.4
1959 315.5 372.4 0.6 37.8 0.5 9.8 25.8 73.6 61.9 30.2 11.2 22.2 18.9 1.6 15.2
III 344.3 378.4 0.7 51.5 __ 0.4 7.7 28.9 90.0 64.4 37.2 11.0 30.3 18.3 1.0 14.5IV 362.0 374.3 0.7 28.3 ___ 0.7 12.9 21.3 40.3 66.2 31.1 10.4 17.2 20.3 1.7 20.4
1960 I 318.4 487.3 0.8 27.3 — 0.6 10.6 40.1 60.7 68.9 32.7 10.9 19.5 19.9 0.4 17.9II 346.5 462.5 1.1 32.6 __ 0.4 9.6 48.0 94.7 75.6 26.5 15.2 12.3 20.4 1.4 16.1
III 336.9 491.1 1.1 29.2 6.5 45.3 55.5 67.4 20.0 18.6 11.8 20.5 1.3 14.8
8. 1953 58.5 189.4 7.6 24.0d 7.2 4.1 69.0 87.8 20.2 9.5 17.5 14.2United States 1954 70.7 212.3 3.5 21.9d 6.0 5.2 61.6 81.6 21.2 10.9 13.6 11.0of A m erica 1955 114.3 193.5 1.8 60.9d __ 0.3 7.7 8.0 60.0 89.0 32.4 10.7 26.2 12.8 4.0 7.9
1956 137.9 266.8 2.7 81.2d — 0.9 7.8 6.5 60.6 75.1 23.2 13.5 20.8 14.2 2.1 15.2
1957 151.6 406.6 1.0 98.5d __ 1.5 9.6 30.1 56.2 84.3 22.4 11.4 18.1 16.9 2.8 16.4
1958 173.1 264.4 0.7 82.5d __ 0.9 7.9 27.0 67.6 73.2 15.8 9.5 14.0 16.8 1.3 13.7
1959 262.8 279.0 0.6 35.5 __ 0.4 8.3 20.9 73.2 57.9 23.8 10.2 22.2 17.6 1.6 14.6
III 284.4 280.6 0.7 48.7 __ 0.4 5.6 24.4 88.9 60.7 29.2 10.1 30.3 17.2 1.0 13.8IV 310.3 274.0 0.7 25.7 __ 0.6 10.7 16.0 39.8 60.0 25.1 9.7 17.2 17.4 1.7 19.4
I960 I 266.4 397.1 0.8 24.8 __ 0.6 9.9 35.1 60.5 65.7 25.1 9.8 19.5 19.1 0.4 17.6
II 281.8 386.2 1.1 30.5 __ 0.4 8.6 46.4 94.3 72.1 21.3 13.7 12.1 19.9 1.4 14.4
III 275.4 396.8 1.1 28.3 5.3 43.4 55.0 63.0 18.0 14.3 11.9 19.8 1.3 13.9
9. 1953 26.1 66.2 __ 0.5 0.5 — 2.8 0.2 3.7 0.1 — —Latin 1954 50.3 77.2 — 0.3 0.9 — 3.0 0.7 4.9 0.2 0.1 —American 1955 44.8 60.7 — 0.3 — — 1.6 — 3.6 0.7 8.1 0.2 0.2 —Republics 1956 41.0 87.3 __ 0.2 — — 0.9 — 3.8 1.2 4.9 0.4 0.2 — — 0.4
1957 37.3 77.1 __ — — — 1.2 2.8 3.6 0.9 9.2 0.4 0.2 0.1 0.1 0.2
1958 48.4 64.7 — — — — 0.8 0.4 2.6 1.2 5.6 0.3 — 0.1 — 0.6
1959 56.0 81.3 — 0.1 — — 1.9 — 2.5 1.4 7.3 0.2 0.1 — — 0.5
III 66.1 84.9 ___ 0.2 — — 2.8 — 3.4 0.4 8.6 0.3 0.2 — — 0.5IV 71.8 97.7 __ __ __ — 2.3 — 4.1 2.5 7.7 0.1 0.1 — — 0.9
1960 I 58.2 58.9 __ __ — — 1.5 — 2.6 1.2 9.6 0.2 0.4 — — 0.2II* 72.5 66.1 __ __ __ — 1.1 — 2.8 1.7 7.7 0.3 — 0.5 — 1.2
III 66.5 82.7 — — — — 2.5 — 4.1 1.5 7.5 3.2 — 2.1 — 0.9
10. 1953 3.6 50.2 .__ 3.4 1.4 0.5 0.2 0.3 15.5 7.4 — 1.0O ceania 1954 8.8 34.0 ___ 0.7 1.6 0.5 0.2 0.8 15.3 7.2 — 0.6
1955 17.2 50.8 __ 0.2 — — 1.4 0.6 0.3 1.3 17.4 7.8 0.1 0.8 — 0.2
1956 10.8 71.6 ___ 0.1 — — 0.6 0.6 0.3 1.4 19.8 9.1 0.1 1.0 — 0.11957 14.6 109.4 __ __ __ — 0.5 4.6 0.2 2.7 16.1 10.2 0.2 1.2 — 0.1
1958 19.9 65.0 __ 0.2 — — 0.6 0.9 0.2 2.8 11.5 9.0 0.2 1.0 — 0.2
1959 25.5 84.9 __ 2.0 — 0.1 1.8 0.9 0.3 2.8 12.8 9.5 0.4 1.1 — 0.1
III 29.3 82.9 __ 0.9 — — 2.5 0.9 0.2 3.3 14.9 10.9 0.5 1.2 — 0.1IV 32.4 99.3 __ 4.1 — 0.1 2.2 1.4 0.5 3,6 13.5 8.8 0.4 1.2 — 0.3
I960 I 26.0 98.9 __ 2.0 — — 1.6 2.4 0.4 1.9 15.2 9.5 0.6 1.0 —II 37.6 93.6 __ 2.0 — — 1.4 3.5 0.3 2.7 16.1 10.2 0.2 1.5 — 0.1
III 52.1 96.1 — 7.4 — — 3.2 4.0 0.7 2.5 15.8 10.1 0.3 1.0 _11. 1953 79.0 150.6 0.8 7.4 37.0 23.4 2.3 6.0 67.3 71.8 39.9 30.3
Sterling a r e a 1954 122.8 108.4 0.7 10.8 33.6 32.6 2.4 10.2 70.1 69.6 32.1 22.51955 160.2 147.2 0.5 5.0 — 0.4 38.5 25.9 2.6 12.1 85.3 79.1 35.7 26.7 2.4 3.51956 171.2 204.4 0.7 2.2 0.1 1.7 32.4 20.7 4.0 12.4 84.8 87.3 38.8 40.0 0.6 2.31957 201.7 280.4 1.2 1.2 0.1 2.0 30.3 37.6 3.8 17.2 78.1 82.3 4 3 . 9 35.9 1.4 3.31958 199.9 197.8 0.5 1.6 0.1 1.3 24.9 29.4 2.6 14.6 6 2 . 2 84.2 38.7 33.0 2.1 3.81959 215.0 276.4 0.5 6.4 3.5 3.3 36.1 25.5 4.0 13.7 66.4 76.0 4 2 . 6 3 2 . 2 3.8 3.6III 217.3 279.2 0.9 5.3 4.9 4.3 32.5 25.3 4.1 14.0 70.3 80.2 41.7 29.3 2.9 4.1TV 2 7 2 . 1 312.7 0.7 10.1 7.5 6.5 54.6 39.2 3.1 17.5 70.6 78.3 46.9 37.5 4.2 4.0
1960 I 221.0 320.9 1.3 7.0 9.3 0.6 44.1 36.0 4.1 15.3 72.1 80.6 49.7 30.4 3.9 3.8II 260.1 282.4 1.1 5.8 7.9 8.3 47.5 44.6 8.0 21.0 77.0 86.7 43.8 33.9 5.0 2.7III 292.4 279.2 0.7 5.5 33.5 45.5 6.2 21.0 73.3 81.6 51.7 32.3 6 . 3 3.2
12. 1953 47.8 82.1 0.7 3.3 13.2 6.6 0.6 4.5 26.0 29.0 37.8 19.1ECAFE 1954 72.0 60.2 0.6 8.5 11.6 6.3 0.7 6.7 27.2 21.2 28.0 13.7sterling 1955 87.3 74.6 1.0 3.8 — 0.2 16.9 5.5 0.7 7.3 25.5 31.7 31.6 17.0 1.9 2.3countriesa 1956 99.2 92.2 0.5 1.6 — 1.3 13.8 4.6 1.6 7.1 29.1 34.6 34.5 26.6 0.6 1.2
1957 111.0 105.2 1.0 0.9 0.1 1.4 12.0 11.1 1.4 8.2 30.9 31.4 38.0 21.9 1.3 1.51958 94.9 78.0 0.3 0.8 0.1 0.9 5.4 10.4 0.6 5.6 23.8 31.9 31.5 21.2 1.8 1.91959 101.5 101.0 0.3 2.2 3.5 0.4 11.2 7.6 1.3 4.8 24.6 32.3 34.8 19.8 3.0 2.0III 93.9 119.3 0.6 2.5 5.0 0.3 11.6 7.4 0.7 4.2 25.7 32.4 36.0 17.5 2.0 2.0IV 136.9 108.3 0.4 2.8 7.5 0.3 16.6 12.4 1.8 6.4 26.4 36.5 34.5 23.5 2.6 1.8
1960 I 108.3 114.2 1.0 1.8 9.3 0.4 19.5 6.9 0.7 6.4 26.9 34.6 42.9 19.1 2.0 2.0II 132.8 120.8 0.6 2.0 7.9 0.7 20.5 8.6 2.5 7.9 28.2 35.1 38.9 18.8 3.9 0.9III 138.5 125.1 0.4 2.1 14.2 8.5 2.1 7.5 28.1 37.3 41.9 17.9 4.7 1.6
b. Figures fo r trade w ith the Netherlands are as fo llo w s :— c. F igures p r io r to 1955 to r R epublic o f Korea ana 1956 f o r Tha iland arc derived fro m trade re tu rns o f pa rtne r countries. To ta ls fo r geographical and currency areas m ay n o t be com plete.
d. In c lu d in g some im p o rts o f a id goods fro m countries o ther than the U n ited States.
e. Im p o rts valued f.o .b .f . See footno te j to table 17.
1953Exp.48.4
Im p .22.4 1959 I
Exp.2.9
Im p .4.2
1954 41.3 16.4 I I 2.9 2.81955 37.7 17.7 I I I 1.9 4.81956 42.9 22.8 IV 1.5 5.41957 40.7 19.6 1960 I 0.6 3.81958 7.8 8.3 II 0.4 4.91959 2.3 4.3 I I I 0.6
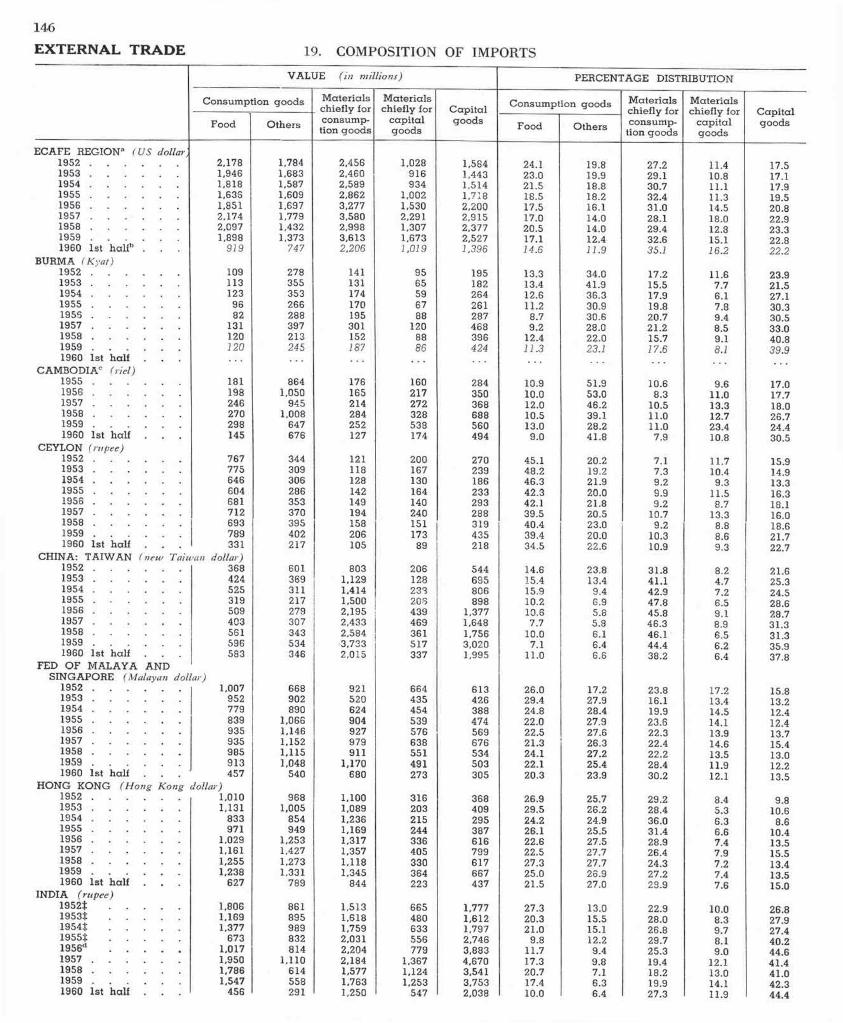
146
EXTERNAL TRADE 19. COMPOSITION OF IMPORTS
VALUE ( in millions) PERCENTAGE DISTRIBUTION
C onsum ption goods M ateria ls chiefly for
M ateria ls chiefly for C ap ita l
C onsum ption g oods M ate r ia ls chiefly for
M ateria ls chiefly for C ap ita l
Food O thers c onsum p-tion g oods
c ap i ta lgoods
goods Food O th ers consum p-tion g oods
cap i ta lg oods
g oods
ECAFE REGIONa (U S dollar,1952 1953 1954 1955 1956 1957 1958 1959 1960 1st h a lfb . . .
2,1781,9461,8181,6361,8512,1742,0971,898
919
1,7841,6831,5871,6091,6971,7791,4321,373
747
2,4562,4602,5892,8623,2773,5802,9983,6132,206
1,028916934
1,0021,5302,2911.3071,6731.019
1,5841,4431,5141,7182,2002,9152,3772,5271.396
24.123.021.518.517.517.020.517.114.6
19.819.9 18.8 18.2 16.114.014.0 12.411.9
27.229.130.732.431.028.129.4 32.6 35.1
11.4 10.8 11.1 11.314.5 18.0 12.815.116.2
17.517.117.919.5 20.822.9 23.3 22.822.2
BURMA (K yat)1952 1953 1954 1955 1956 ............................1957 1958 1959
1091131239682
131120120
278355353266288397213245
141131174170195301152187
9565596788
1208886
195182264261287468396424
13.313.4 12.6 11.2
8.79.2
12.4 11.3
34.041.9 36.330.9 30.628.0 22.0 23.1
17.215.5 17.9 19.820.721.215.717.6
11.67.76.17.89.48.59.18.1
23.921.5 27.1 30.330.5 33.040.839.9
1960 1st h a lf . .CAMBODIAc (riel)
1955 1956 1957 1958 1959 1960 1st ha lf . .
181198246270298145
8641,050
9451,008
647676
176165214284252127
160217272328538174
284350368688560494
10.910.012.010.513.0
9.0
51.953.0 46.239.128.2 41.8
10.68.3
10.511.011.0
7.9
9.611.013.312.723.410.8
17.017.718.026.724.430.5
CEYLON (rupee)1952 1953 1954 1955 1956 1957 1958 1959 1960 1st half
767775646604681712693789331
344309306286353370395402217
121118128142149194158206105
200167130164140240151173
89
270239186233293288319435218
45.148.246.342.3 42.1 39.540.439.434.5
20.219.221.920.021.820.523.020.022.6
7.1 7.39.2 9.99.2
10.79.2
10.3 10.9
11.710.49.3
11.58.7
13.38.8 8.69.3
15.914.913.316.3 18.1 16.0 18.621.722.7
CHINA: TAIW AN (new1952 1953 1954 1955 1956 1957 1958 1959 1960 1st ha lf
Taiw an dollar)368424525319509403561596583
601369311217279307343534346
8031,1291,4141,5002,1952,4332,5843,7332,015
206128233206439469361517337
544695806898
1,3771,6481,7563,0201,995
14.6 15.4 15.9 10.210.6 7.7
10.07.1
11.0
23.813.4
9.4 6.95.85.8 6.16.4 6.6
31.841.142.947.845.846.346.144.438.2
8.24.77.26.59.1 8.96.56.2 6.4
21.625.324.528.628.731.331.3 35.937.8
FED OF MALAYA AND SINGAPORE (Malayan
1952 1953 1954 1955 1956 1957 1958 1959 1960 1st ha lf . .
rallod1,007
952779839935935985913457
668902890
1,0661,1461,1521,1151,048
540
921520624904927979911
1,170680
664435454539576638551491273
613426388474569676534503305
26.029.4 24.8 22.022.521.324.122.120.3
17.227.9 28.427.9 27.626.3 27.225.423.9
23.8 16.119.9 23.622.322.4 22.228.4 30.2
17.213.414.514.113.914.6 13.511.912.1
15.813.212.412.4 13.715.4 13.012.213.5
HO NG KONG (H o n g Kong1952 1953 1954 1955 1956 1957 1958 1959 1960 1st h a lf . . .
dollar)1,0101,131
833971
1,0291,1611,2551,238
627
9681,005
854949
1,2531,4271,2731,331
789
1,1001,0891,2361,1691,3171.3571,1181,345
844
316203215244336405330364223
368409295387616799617667437
26.929.524.2 26.122.622.527.3 25.021.5
25.7 26.224.925.527.527.727.726.9 27.0
29.228.4 36.031.428.926.424.3 27.228.9
8.45.36.3 6.67.4 7.9 7.27.4 7.6
9.810.6
8.610.413.515.513.413.5 15.0
INDIA ( rupee)1952 ‡. . . . 1953‡ . . . . 1954‡ . . . . 1955‡ . . . . 1956‡ . . . .1957 1958 1959 1960 1st h a lf . .
1,8061,1691,377
6731,0171,9501,7861,547
456
861895989832814
1,110614558291
1.5131,6181,7592,0312,2042,1841,5771,7631,250
665480633556779
1,3671,1241,253
547
1,7771,6121,7972,7463,8834,6703,5413,7532,038
27.320.3 21.0
9.811.717.320.717.4 10.0
13.0 15.515.112.2 9.4 9.8 7.16.36.4
22.9 28.0 26.8 29.725.319.4 18.219.9 27.3
10.08.39.78.19.0
12.113.014.1 11.9
26.827.927.440.2 44.641.4 41.042.344.4

19. COM POSITION OF IM PORTS (C ont'd)
147
EXTERNAL TRADE
VALUE (in millions) P E R C E N T A G E NOITUBIRTSID
C onsum ption g oods M ate r ia ls chiefly for consum p-tion g oods
M ateria ls chiefly for
cap i ta l goods
C a p ita lnoitpmusnoC g oods M ateria ls
chiefly forM ateria ls chiefly for C a p ita l
Food O thers goods Food O thers consum p-tion goods
c ap i ta lgoods
goods
INDONESIA ( rup iah) 30.6 14.5 5.9 26.41952 .................................... 2,432 3,302 1,565 631 2,850 22.61953 .................................... 1,455 2,651 1,542 500 2,435 16.9 30.9 18.0 5.8 28.4
1954 .................................... 1,030 2,021 1,418 459 1,977 14.9 29.3 20.5 6.6 28.61955 .................................... 649 1,992 1,535 670 1,902 9.6 29.5 22.8 9.9 28.2
1956 .................................... 1,950 2,497 1,873 817 2,569 20.1 25.7 19.3 8.4 26.5
1957 .................................... 1,466 2,046 1,965 748 2,850 16.2 22.5 21.7 8.2 31.4
1958 .................................... 1,328 1,177 1,155 547 1,578 23.0 20.3 20.0 9.4 27.3
1959 .................................... 1,139 792 1,130 600 1,563 21.8 15.2 21.6 11.5 29.9
1960 1st ha lf . . . 3,204 2,450 2,305 793 2,983 27.3 20.9 19.6 6.8 25.4
JAPAN (yen)1952 .................................... 214,299 20,980 344,199 113,052 37,818 29.3 2.9 47.1 15.5 5.2
1953 .................................... 217,474 28,477 413,497 136,775 66,264 25.2 3.3 47.9 15.9 7.7
1954 .................................... 231,598 20,821 412,705 125,824 72,677 26.8 2.4 47.8 14.6 8.41955 .................................... 220,038 20,033 457,778 134,706 56,477 24.7 2.3 51.5 15.2 6.3
1956 .................................... 197,594 19,904 581,071 283,656 71,973 17.1 1.7 50.4 24.6 6.2
1957 .................................... 204,676 24,008 643,824 484,232 175,288 13.3 1.6 42.0 31.6 11.5
1958 .................................... 187,950 21,298 547,312 189,225 144,101 17.2 2.0 50.2 17.4 13.2
1959 .................................... 174,007 22,297 653,789 292,914 150,192 13.4 1.8 50.5 22.6 11.6
1960 1st h a lf . . . 87,027 13,157 416,318 211,620 78,011 10.8 1.6 51.6 26.3 9.7
KOREA, R epublic ofe (h w a n )12.9 26.8 12.0 4.4
1952 .................................... 3,095 910 1,884 843 312 43.91953 .................................... 9,849 2,543 7,169 1,345 1,423 44.1 11.4 32.1 6.0 6.4
1954 .................................... 3,318 5,947 10,661 2,665 5,177 11.9 21.4 38.4 9.6 18.6
1955 .................................... 5,423 11,609 22,814 2,392 5,971 11.2 24.1 47.3 5.0 12.4
1956 .................................... 5,415 10,472 11,528 1,453 5,935 15.5 30.1 33.1 4.2 17.1
1957 .................................... 11,059 8,758 11,124 1,975 4,952 29.2 23.1 29.4 5.2 13.1
1958 .................................... 8,485 9,901 17,012 2,689 5,477 19.5 22.7 39.0 6.2 12.6
1959 .................................... 17,711 12,802 108,620 23,733 29,586 9.2 6.7 56.4 12.3 15.4
1960 1st ha lf . . . 11,741 6,778 73,355 12,719 15,901 9.7 5.6 60.9 10.6 13.2
LAOSc (k ip )1955 .................................... 182 205 63 67 146 27.5 30.9 9.5 10.1 22.01956 .................................... 216 467 125 119 308 17.5 37.8 10.1 9.7 24.9
1957 .................................... 203 555 144 188 344 14.2 38.7 10.0 13.1 24.0
1958 .................................... 198 357 86 99 297 19.1 34.4 8.3 9.6 28.61959 .................................... 238 254 110 159 261 23.3 24.9 10.8 15.5 25.5
1960 1st h a lf . . . 173 176 67 109 142 25.9 26.4 10.1 16.3 21.3
NORTH BORNEO )rallod nayalaM( 1952 .................................... 20.5 18.0 5.1 8.2 18.5 29.1 25.6 7.3 11.7 26.3
1953 .................................... 18.1 22.7 9.2 5.2 14.8 25.9 32.4 13.1 7.4 21.11954 .................................... 17.5 26.3 9.3 4.4 14.9 24.1 38.3 12.8 6.1 20.7
1955 .................................... 22.7 28.5 13.5 5.8 16.7 26.0 32.7 15.5 6.7 19.11956 .................................... 30.5 34.6 21.3 6.9 22.0 26.5 30.0 18.4 6.0 19.11957 .................................... 28.0 32.0 23.7 8.2 24.1 24.1 27.6 20.4 7.1 20.81958 .................................... 30.4 37.1 27.7 7.8 24.8 23.8 29.0 21.7 6.1 19.41959 .................................... 29.2 46.1 29.7 14.1 35.4 18.9 29.8 19.2 9.1 22.91960 1st ha lf . . . 16.0 25.5 18.4 7.8 25.9 17.1 27.2 19.7 8.3 27.7
PAKISTANf (rupee)1952 .................................... 113 588 451 188 415 6.5 32.8 26.0 10.8 23.91953 .................................... 35 126 152 107 208 5.6 20.1 24.2 17.0 33.11954 .................................... 32 160 187 129 398 3.5 17.7 20.6 14.2 43.91955 .................................... 28 178 164 155 412 3.0 19.0 17.5 16.5 44.01956 .................................... 258 331 195 291 616 15.3 19.6 11.5 17.2 36.41957 .................................... 677 194 229 291 706 32.3 9.3 10.9 13.9 33.6
1958 .................................... 560 129 183 303 709 29.7 6.9 9.7 16.1 37.61959 .................................... 332 207 187 306 649 19.8 12.3 11.1 18.2 38.61960 1st ha lf . .. . 273 190 166 247 6 25 18.2 12.6 11.1 16.4 41.7
PHILIPPINESg (peso)30.6 19.9 8.8 22.41952 .................................... 154 258 168 74 189 18.3
1953 .................................... 153 294 164 103 200 16.7 32.2 17.9 11.3 21.91954 .................................... 158 302 168 112 225 16.4 31.3 17.4 11.6 23.31955 .................................... 205 314 181 125 272 18.7 28.6 16.5 11.4 24.81956 .................................... 176 222 169 132 314 17.4 21.9 16.7 13.0 31.01957 .................................... 217 242 225 120 425 17.6 19.7 18.3 9.8 34.61958 .................................... 236 194 231 85 377 21.0 17.3 20.5 7.6 33.61959 .................................... 137 154 248 91 390 13.4 15.1 24.4 8.9 38.21960 1st h a lf . . . 91 70 127 45 213 16.7 12.8 23.3 8.2 39.0
SARAWAK (Malayan dollar)7.8 73.0 1.9 4.61952 .................................... 48.2 30.0 279.6 7.4 17.7 12.6
1953 .................................... 43.7 44.4 271.3 6.7 28.8 11.1 11.2 68.7 1.7 7.31954 .................................... 46.2 42.8 273.1 6.9 27.5 11.7 10.8 68.9 1.7 6.91955 .................................... 51.8 45.1 305.3 8.7 29.3 11.8 10.2 69.4 2.0 6.61956 .................................... 52.3 45.2 325.9 9.7 30.1 11.3 9.7 70.4 2.1 6.51957 .................................... 54.8 39.8 330.8 9.3 27.9 11.8 8.6 71.5 2.0 6.11958 .................................... 48.4 37.3 312.5 8.7 25.1 11.2 8.6 72.3 2.0 5.81959 .................................... 55.8 46.2 309.5 10.5 30.9 12.3 10.2 68.3 2.3 6.81960 1st h a lf . . . 28.1 26.7 137.7 5.8 19.0 12.9 12.3 63.4 2.7 8.7

148EXTERNAL TRADE 19. COM POSITION OF IM PORTS (C ont’d)
G E N E R A L N O T E R E L A T IN G TO TABLES 19 a nd 20: T o ta l o f the five groups o f im ports o r exports do not add up to to ta l im ports o r exports published in na t iona l trade returns, because (1) in a few countries a small part o f the im ports o r exports ( in no case more than 4 % ) are n o t in c luded in the com -m o d ity trade statistics published by governments, and (2) o f round ing . Per-centage d is tr ib u t io n refers to percentages o f the totals o f the five groups o f commodit ies.
a. Regional totals in US dollars in c lu d in g a l l countries listed in the table. Im po rts o f In d ia in fiscal years are added to im ports o f o ther countries in calendar years.
VALUE ( in millions) PERCENTAGE DISTRIBUTION
C onsum ption g o ods M ate r ia ls chiefly for
M ateria ls ch iefly for
c a p i ta l g oods
C a p ita lgo ods
C onsum ption g oods M ate r ia ls ch iefly for
M ateria ls chiefly for C a p ita l
Food O th ers consum p-tion goods Food O th ers consum p-
tion g o odsc a p ita lgoods
goods
THAILAND1952 .
( Baht)710 2,147 476 427 1,661 13.1 39.6 8.8 7.9 30.6
1953 . 630 2,274 546 478 2,049 10.5 38.0 9.1 8.0 34.31954 . 640 2,540 670 572 2,217 9.6 38.3 10.1 8.6 33.41955 . 618 2,936 822 670 2,233 8.5 40.3 11.3 9.2 30.7
1956 . 662 2,867 913 674 2,489 8.7 37.7 12.0 8.9 32.71957 . 694 2,831 1.026 897 2,993 8.2 33.5 12.2 10.6 35.51958 . 781 2,566 1,005 862 2,933 9.6 31.5 12.3 10.6 36.01959 732 2,966 1,131 880 3,274 8.2 33.0 12.6 9.8 36.4I960 1st h a lf . . 287 1.512 587 502 1.857 6.0 31.9 12.4 10.6 39.1
VIET-NAM,1952h
R epublic of (piastre)1.018 4,302 1,338 712 1.864 11.0 46.6 14.5 7.7 20.2
1953h 1,332 5,531 1,607 951 1,766 11.9 49.4 14.4 8.5 15.81954h 1,464 5,979 1,806 1,067 1,983 11.9 48.6 14.7 8.7 16.11955 . 1,075 4,847 1,285 663 1,342 11.7 52.6 13.9 7.2 14.61956 . 987 3,738 1,057 604 1,231 13.0 49.0 13.9 7.9 16.21957 . 911 4,193 1,724 1,175 2,084 9.0 41.6 17.1 11.6 20.71958 . 834 3,004 1,292 932 2,063 10.2 37.0 15.9 11.5 25.41959 830 2.455 1.340 1.097 2.139 10.6 31.2 17.0 14.0 27.2
1960 1st h a l f . . 473 1.150 767 649 1.128 11.3 27.6 18.4 15.6 27.1
b. E xc lud ing Burma.c. Figures fo r 1952-1954 are in c luded under V ie t-N am .d. A n n u a l rate based on 9 months Ap ri l-Decem ber; except food w h ic h is 12
m onths beg inn ing A p r i l 1956 to M arch 1957.e. Figures fo r 1952-1958 exc lud ing fo re ign aid. F rom 1959 onwards figures
in c lu d in g fo re ign aid.f . P r io r to 1956, figures re la t ing to p r iva te account only .g. f .o .b . value.h. In c lu d in g Cambodia and Laos.
20. COM POSITION OF EXPORTS
VALUE (in millions) PERCENTAGE DISTRIBUTION
Consum ptiongoods
M ateria ls chiefly for
consum ption goods
M ate r ia ls chiefly for
c a p ita l g o ods
C a p ita lgoods
C onsum ptiongoods
M ate r ia ls chiefly for
consum ption goods
M ateria ls chiefly for
ca p ita l goods
C a p ita lg oods
FED. OF MALAYA ANDSINGAPORE (Malayan dollar)
58.6 22.2 3.91952 ........................................................ 581 2,233 844 148 15.31953 ........................................................ 718 1.497 581 115 24.7 51.4 20.0 3.91954 ........................................................ 732 1,576 535 83 24.5 52.8 19.9 2.8
1955 ........................................................ 723 2,551 669 87 17.9 63.3 16.6 2.2
1956 ........................................................ 810 2,349 748 105 20.2 58.6 18.6 2.61957 ........................................................ 824 2,301 730 125 20.7 57.8 18.3 3.21958 ........................................................ 785 2,118 507 114 22.3 60.1 14.4 3.21959 ........................................................ 707 2,871 556 111 16.7 67.6 13.1 2.6
1960 1st h a l f ................................... 355 1,563 368 62 15.1 66.6 15.7 2.6HO NG KONG (H o ng K ong dollar)
28.8 6.3 8.11952 ........................................................ 1,642 834 183 235 56.71953 ........................................................ 1,601 803 88 235 58.7 29.5 3.2 8.6
1954 ........................................................ 1,376 804 73 164 56.9 33.3 3.0 6.8
1955 ........................................................ 1,503 733 92 203 59.4 29.0 3.6 8.01956 ........................................................ 1,887 803 156 353 59.0 25.1 4.9 11.0
1957 ......................................................... 1,933 617 155 311 64.1 20.5 5.1 10.31958 ........................................................ 2,072 532 108 276 69.3 17.8 3.6 9.21959 ......................................................... 2,329 506 170 272 71.1 15.4 5.2 8.31960 1st h a l f ................................... 1,430 253 115 143 73.7 13.0 5.9 7.4
INDIA ( rupee)62.9 24.7 11.1 1.31952 .................................................... 3,598 1,411 637 77
‡t3591 ................................................. 3.604 1,028 570 47 68.7 19.6 10.8 0.91954? .................................................. 4,215 1,225 386 48 71.7 20.9 6.6 0.81955‡ .................................................. 3,755 1,673 414 51 63.7 28.4 7.0 0.91956a .................................................. 4,093 1,172 447 51 71.0 20.3 7.8 0.91957 ......................................................... 3,995 1,606 723 51 62.7 25.2 11.3 0.81958 ......................................................... 3,857 1,277 532 40 67.6 22.4 9.3 0.71959 ......................................................... 4,099 1,420 585 54 66.5 23.1 9.5 0.91960 1st h a l f ................................... 1,838 738 348 52 62.2 24.9 11.8 1.1
JAPAN (yen )13.5 7.7 33.81952 ......................................................... 204,255 61,431 35,073 153,633 45.0
1953 ......................................................... 227,743 70,497 30,915 128,264 49.8 15.4 6.8 28.01954 ......................................................... 294,816 98,871 39,016 153,763 50.3 16.8 6.7 26.21955 ......................................................... 344,881 109,389 63,405 204,264 47.7 15.2 8.8 28.31956 ......................................................... 422,755 115,440 78,690 275,719 47.4 12.9 8.8 30.91957 ......................................................... 479,637 143,211 67,115 330,615 47.0 14.0 6.6 32.41958 ......................................................... 477,241 129,267 62,034 358,954 46.5 12.6 6.0 34.91959 ......................................................... 570,410 163,689 62,481 443,396 46.0 13.2 5.0 35.81960 1st h a l f .................................... 296,246 93,526 29,323 240,922 44.9 14.2 4.4 36.5
G E N E R A L N O T E : see table.a. An nua l rate based on 9 months Apri l-Decem ber.

149EXTERNAL TRADE
21. VALUE OF IM PORTS BY PR IN C IPA L COMMODITY GROUPSMonthly averages or calendar months Millions
19 5 9 1 06 91954 1956 1957 1958 19591955
III IV I II III O ct Nov
BRUNEI ( Malayan dollar)1.07 1.13F o o d .........................................................1.24 1.40 1.35 1.16 1.10 1.06
Mineral fuels, lub rican ts a n dre la ted m a t e r i a l s ............................0.51 0.24 0.21 0.29 0.25 0.21 0.16 0.18C h e m i c a l s ...........................................0.32 0.32 0.34 0.42 0.41 0.29 0.34 0.30T e x t i l e s ..................................................0.18 0.15 0.21 0.17 0.15 0.10 0.10 0.10
1.53 1.30 1.46 1.55 1.11 0.68 0.71 0.86Transport eq u ip m en t . . . .0.79 0.51 0.70 0.58 0.55 0.34 0.38 0.26Other m anu fac tu red goods3.45 3.29 3.93 3.25 2.40BURMA (kyat)
10.8F o o d ........................................................10.3 8.0 6.8 10.9 10.0 10.0 . . .4.6 5.4 7.1 10.3 5.4 6.5 9.8
T e x t i l e s ..................................................24.1 16.6 22.4 33.0 15.8 22.9 26.0 32.0 38.612.7Base m etals a n d m an u fa c tu re s9.4 8.4 6.9 14.1 9.8 9.2 9.0 10.7 9.1
M a c h i n e r y ...........................................7.8 7.3 10.1 12.0 15.7 12.7 12.3 18.7 9.4 16.0Transport eq u ip m en t . . . .4.6 5.7 6.3 11.2 6.7 6.5 7.0Other m anu fac tu red goods11.2 9.3 9.7 13.9 9.2 9.7 10.8CAMBODIA (riel)
25.3 23.2 28.0F o o d .........................................................10.0 15.1 16.5 20.5 22.5 24.8 21.7 20.6Beverages a n d tobacco22.8 9.0 5.2 6.7 8.0 6.8 4.5 8.8 8.1 8.9 7.0Mineral fuels, lu b rica n ts a n d
6.5 28.7re la ted m a t e r i a l s .............................13.6 11.8 9.9 5.3 3.5 25.5 48.7 18.2 17.5T e x t i l e s ..................................................26.9 27.8 33.4 35.0 40.1 25.0 27.3 35.2 91.5 50.4 52.3Base m eta ls a n d m an u fa c tu re s10.1 13.1 13.6 20.0 23.4 26.0 29.4 26.5 62.8 24.2 20.3M a c h i n e r y ...........................................5.6 11.3 16.1 11.9 29.0 20.6 19.8 30.5 45.1 35.6 25.3Transport eq u ip m en t . . . .8.5 8.7 9.7 9.1 22.6 13.3 10.3 20.5 21.4 24.5 23.4CEYLON (rupee)aa
59.6 50.7 79.3 53.1 62.3F o o d ........................................................53.8 50.3 56.7 59.4 57.8 65.7 91.2 71.0C ereals a n d c e re a l p re p a ra tio n s33.0 26.1 28.3 29.0 26.0 33.0 59.4 33.4 24.0 19.0 38.5 17.0 31.9M ineral fuels, lu b ric a n ts a n d
11.2 12.6 13.5 6.9re la ted m a t e r i a l s .............................9.9 12.0 10.6 18.7 11.8 12.6 14.2 11.4 16.76.1 7.6 8.2 10.1 8.7 11.2 12.6 12.3 10.9 11.5 10.1 11.9 9.3
12.2 11.3 13.4 13.6 15.1 14.2 12.6 17.3 14.2 14.8 15.5 21.0 14.35.7 7.1 8.7 9.5 10.6 12.8 12.9 13.0 10.8 11.0 11.2 12.7 14.4
Transport eq u ipm en t . . . .4.8 5.9 6.9 7.3 8.9 14.7 13.8 16.2 15.7 16.6 11.0 8.5 6.8Other m an u fac tu red goods20.0 21.8 25.1 25.3 24.1 30.2 30.2 35.0 32.2 34.6 34.7 35.1 27.0CHINA: T a iw a n (new Taiwan dollar)
48.4 144.1 33.7 82.5F o o d .........................................................43.7 26.6 42.2 33.6 46.7 49.6 46.8 71.9Crude m ate ria ls , ined ib le , excep t
182.7 191.4 244.5f u e l s ..................................................66.9 63.5 92.1 107.4 93.0 138.5 164.7 116.0 136.5Oil-seeds, oil nu ts a n d oil k e rn e ls17.5 19.0 23.3 25.0 20.4 28.8 38.8 21.8 24.3 30.2 51.7 56.7Textile fibres, r a w . . . .31.8 31.8 37.1 43.7 41.8 55.6 61.6 42.7 64.5 90.5 80.9 103.8Mineral fuels, lu b rican ts a n d
71.7 84.0 29.6 13.1re la ted m a t e r i a l s ............................9.3 21.3 26.2 46.3 36.6 49.0 53.9 40.2C h e m i c a l s ...........................................47.6 44.8 75.7 62.1 103.2 146.1 200.5 121.6 129.3 109.1 192.3 119.6Base m eta ls a n d m an u fac tu re s29.0 25.9 45.7 48.0 47.9 77.9 92.9 73.2 67.6 89.6 113.3 77.9M a c h i n e r y ...........................................33.5 43.8 60.6 74.9 76.2 134.0 164.7 123.5 100.6 278.9 235.6 128.9Transport eq u ip m en t . . . .8. 6 8. 0 14.2 16.6 23.3 39.1 46.7 56.0 30.5 92.2 58.1 66.0Other m an u fac tu red g oods26.4 21.4 30.6 37.3 28.9 42.2 39.7 43.4 64.7 53.1 56.0 69.2FEDERATION OF MALAYAb(Malayan dollar)F o o d .........................................................35.1 39.8 43.7 44.0 44.0 42.5 45.9 45.7 44.7 45.1 49.1 44.6
C ereals a n d c e re a l p re p a ra tio n s12.0 14.5 15.6 15.5 15.8 15.6 17.2 17.7 14.1 15.9 19.1Crude m ate ria ls , ined ib le , excep t
26.9 31.4 31.2f u e l s ..................................................11.5 14.1 16.5 17.3 15.2 17.6 17.8 23.7 28.0Metal ores a n d sc ra p . . . .3.9 5.3 5.9 7.3 4.4 5.1 5.3 6.3 6.8 10.6 16.6Mineral fuels, lu b rica n ts a n d
10.7 13.4 14.1 9.6re la ted m a t e r i a l s .............................9.6 10.5 11.3 12.5 11.2 10.7 10.8 10.87.4 8.9 8.3 8.4 7.3 8.3 8.6 9.5 11.0 8.7 9.7
M a c h i n e r y ...........................................8.2 8.3 10.6 11.7 10.4 11.7 1 11.4 15.4 14.0 14.7 15.8 26.3Transport e q u ip m e n t . . . .4.1 6.2 8.6 8.6 8.0 8.4 9.8 10.0 10.3 12.7 11.9 Other m an u fac tu red goods19.6 23.7 26.8 27.3 22.5 24.5 24.5 27.4 28.3 28.8 29.6INDIA (rupee)aF o o d ........................................................80.4 94.6 84.7
a162.5 1,488 128.9 137.2 109.2 75.0 77.1 143.7 6 4.2 55.7
Crude m ate ria ls , ined ib le , excep t74.5 101.4 147.7 149.5 100.1 90.6fuels . . . . . . . .72.7 94.2 99.6 93.5 66.7 78.6 84.9
Cotton r a w a n d w a s te .47.9 44.6 44.7 40.5 25.6 29 .0 30.0 21.8 42.1 85.6 85.7 33.5 40.3
Petroleum a n d p roduc ts72.5 78.3 90.4 89.6 63.2 65.0 62.4 88.9 78.4 55.8 54.4 46.1 56.3
C h e m i c a l s ...........................................41.9 44.0 49.0 64.0 54.4 71.0 80.3 60.9 72.8 71.3 71.6 71.7 57.5
Base m eta ls a n d m an u fa c tu re s45.3 69.0 131.2 191.2 125.6 120.2 101.6 124.7 114.5 156.8 158.7 164.1 126.9
M a c h i n e r y ...........................................Transport eq u ip m en t . . . .
75.7 76.9 127.5 194.1 157.4 163.5 158.0 178.6 161.4 207.7 197.8 180.0 202.1
31.7 56.2 64.4 63.2 49.6 58.7 49.5 46.1 41.6 59.2 46.0 50.4 44.6
Other m an u fa c tu red g oods55.8 68.2 90.8 66.4 43.8 44.3 42.5 43.1 43.6 45.9 52.6 42.4 43.0
INDONESIA (rupiah)Live an im als , food p roducts , b e v e r -
631.1 448.4 422.0 597.2ag es a n d tobacco . . . .96.0 63.2 177.2 133.0 114.8 99.1 80.6 142.4Chemicals a n d a ll ied p roduc ts36.9 53.4 55.9 59.9 43.2 50.7 56.4 48.1 116.7 115.8 191.6 184.3Textiles, a p p a re l a n d foo tw are173.9 175.4 202.2 165.8 101.6 84.5 66.1 125.8 437.6 620.7 620.3 556.6
Base m eta ls a n d m an u fa c tu re s63.2 72.2 80.4 1 1 1 . 4 53.4 60.4 70.0 67.3 138.0 203.2 188.3 196.8
M achinery a n d tran sp o rt e q u ip -98.8 233.6 442.1 433.1 344.5ment ..................................................116.2 102.4 145.7 134.7 88.5 82.2r 71.7
BRUNEI ( Malayan dollar)F o o d .........................................................Mineral fuels, lu b rican ts a n d
re la ted m a t e r i a l s ............................C h e m i c a l s ...........................................T e x t i l e s ..................................................M a c h i n e r y ...........................................Transport eq u ip m en t . . . . Other m anu fac tu red goods
BURMA (kyat)F o o d ........................................................C h e m i c a l s ...........................................T e x t i l e s ..................................................Base m eta ls a n d m an u fa c tu re sM a c h i n e r y ...........................................Transport eq u ip m en t . . . . Other m anu fac tu red goods
CAMBODIA (riel)F o o d .........................................................B everages a n d tobacco Mineral fuels, lub rican ts a n d
re la ted m a t e r i a l s .............................T e x t i l e s ..................................................Base m eta ls a n d m an u fa c tu re sM a c h i n e r y ...........................................Transport eq u ip m en t . . . .
CEYLON (rupee)aF o o d ........................................................
C ereals a n d c e re a l p re p a ra tio n s M ineral fuels, lu b r ican ts a n d
re la ted m a t e r i a l s .............................C h e m i c a l s ...........................................T e x t i l e s ..................................................M a c h i n e r y ...........................................Transport eq u ipm en t . . . . O ther m an u fac tu red goods
CHINA: T a iw a n ( new Taiwan dollar)F o o d ........................................................Crude m ate ria ls , ined ib le , excep t
f u e l s ..................................................Oil-seeds, oil nu ts a n d oil k e rn e ls Textile fibres, r a w . . . .
M ineral fuels, lu b rican ts a n dre la ted m a t e r i a l s ............................
C h e m i c a l s ...........................................Base m eta ls a n d m an u fac tu re sM a c h i n e r y ...........................................Transport eq u ip m en t . . . . Other m an u fac tu red g oods
FEDERATION OF MALAYAb(Malayan dollar)F o o d .........................................................
C erea ls a n d c e re a l p re p a ra tio n s Crude m ate ria ls , ined ib le , excep t
f u e l s ..................................................Metal ores a n d sc ra p . . . . Mineral fuels, lub r ican ts a n d
re la ted m a t e r i a l s .............................T e x t i l e s ..................................................M a c h i n e r y ...........................................T ransport eq u ip m en t . . . . O ther m an u fac tu red goods
INDIA (rupee)aF o o d ........................................................C rude m ate ria ls , ined ib le , excep t
f u e l s ..................................................Cotton r a w a n d w a s te .
Petroleum a n d p roduc tsC h e m i c a l s ...........................................Base m eta ls a n d m an u fa c tu re sM a c h i n e r y ...........................................Transport eq u ip m en t . . . . Other m an u fa c tu red g oods
INDONESIA (rupiah)Live an im als , food p roducts , b e v e r -
ag es a n d tobacco . . . . Chemicals a n d a ll ied p roduc ts Textiles, a p p a re l a n d foo tw are Base m eta ls a n d m an u fac ture s M achinery a n d tran sp o rt e q u ip -
m ent ..................................................

1 5 0
E X T E R N A L T R A D E
2 1 . V A L U E O F I M P O R T S B Y P R I N C I P A L C O M M O D I T Y G R O U P S ( C o n t ’d )M o n t h l y a v e r a g e s o r c a l e n d a r m o n t h s M i l l i o n s
1 9 5 9 1 9 6 01954 1955 1956 1957 1958 1959
III IV I II III Oct Nov
O th e r m a n u fa c tu re d g o o d s JAPA N (thousand m illion yen )
F o o d .......................................................... 19.30 18.34 16.47 17.06 15.66 14.50 14.11 13.18 13.93 15.08 17.43 16.52 16.50C e re a ls a n d c e re a l p r e p a r a t io n s 14.66 13.20 11.08 9.36 9.43 8.69 8.52 7.45 7.32 8.82 9.67S u g a r a n d s u g a r p r e p a r a t io n s 3.39 3.64 4.02 5.08 3.85 3.40 3.40 2.89 4.03 3.17 3.90 1.82 2.97
C ru d e m a te r ia ls , in ed ib le , excep tf u e l s ................................................... 33.78 36.77 51.31 60.29 38.98 52.04 54.11 58.18 69.90 66.79 64.43O il s e e d s , oil n u ts & oil k e rn e ls 2.91 4.41 4.01 4.23 4.04 4.93 5.14 4.70 7.57 4.52 5.91C ru d e r u b b e r .................................... 1.30 2.24 2.66 3.05 2.59 4.25 4.86 4.98 6.57 5.37 5.34 4.56 4.25Textile fib res, r a w . . . . 18.54 17.57 23.16 23.86 18.23 19.56 16.86 21.14 26.27 25.40 20.07 16.44 19.43M e ta l o res a n d s c ra p 5.13 5.57 13.70 20.78 7.73 14.89 17.19 17.24 19.10 19.92 21.47 21.09 19.76
M in e ra l fuels, lu b r ic an ts a n dre la te d m a t e r i a l s ............................. 8.02 8.67 12.38 20.39 15.43 16.69 15.89 19.33 21.25 21.01 22.34 22.85 24.39
C h e m i c a l s ............................................ 1.92 2.41 4.90 5.50 4.99 6.69 6.65 7.47 8.03 7.96 7.56 7.79 8.94
KOREA, R ep u b lic of (h w a n )dF o o d .......................................................... 276 555 452 922 707 1,266 1,450 1,401 1,597 2,316 2,746 2,102 2,201
C e re a ls a n d c e re a l p r e p a r a t io n s 122 78 65 558 198 855 784 799 984 1,457 1,645 1,342 1,140B e v e ra g e s a n d to b ac co 126 188 220 224 174 1 — — 1 3 1 — —C ru d e m a te r ia ls , ined ib le , excep t
f u e l s ................................................... 106 115 120 206 440 3,665 3,779 4,295 4,185 5,458 4,878 4,704 6,367C h e m i c a l s ............................................ 351 693 370 325 492 4,281 6,562 3,224 4,075 7,898 4,813 3,163 2,789T e x t i l e s ................................................... 604 1,273 663 345 392 1,082 855 1,363 1,319 1,238 1,699 1,532 2,186M a c h i n e r y ............................................ 203 276 254 262 309 1,460 1,367 2,149 1,388 2,200 1,762 1,766 1,594T ra n sp o r t e q u ip m e n t . . . . 113 52 79 48 42 308 73 40 42 32 37 53 18O th e r m a n u fa c tu re d g o o d s 461 862 711 711 889 1,879 1,929 1,836 2,209 3.229 2,845 2,616 3,415
LAOS (k ip )F o o d .......................................................... 15.2 18.0 17.0 16.5 19.8 17.6 24.9 25.5 32.3
C e re a ls a n d c e re a l p r e p a r a t io n s 7.4 10.5 6.2 3.4 3.3 1.5 6.3 5.9 6.3P e tro leum p r o d u c t s ............................. 2.3 4.0 4.8 8.5 14.9 16.4 17.5 21.7 26.2C h e m i c a l s ............................................ 2.9 5.6 8.4 4.5 4.7 5.1 6.7 4.3 7.5T e x t i l e s ................................................... 9.1 23.0 26.0 11.6 11.7 12.8 12.3 9.2 8.8M a c h i n e r y ............................................ 3.9 6.9 7.8 8.3 8.9 7.5 5.8 11.6 8.4T ranspo r t e q u ip m e n t . . . . 3. 5 12.0 18.7 10.1 6.9 12.8 5.2 1 7.8 5.0O th e r m a n u fa c tu re d g o o d s 11.5 24.6 28.1 16.5 57.7 155.6 12.6 22.2 18.1
NORTH BORNEO M alayan dollar) F o o d .......................................................... 1.46 1.89 2.54 2.33 2.53 2.43 2.59 2.57 2.53 2.80 2.99M inera l fuels, lu b r ic an ts a n d
r e la te d m a t e r i a l s ............................. 0.48 0.44 0.51 0.48 0.40 1.43 1.35 1.62 1.28 1.13 1.44C h e m i c a l s ............................................ 0.24 0.32 0.41 0.44 0.44 0.58 0.64 0.63 0.56 0.74 0.59T e x t i l e s ................................................... 0.46 0.53 0.69 0.55 0.47 0.50 0.49 0.59 0.67 0.68 0.76M a c h i n e r y ............................................ 0.70 0.57 0.68 0.89 0.96 1.62 1.73 2.07 2.16 3.03 2.23T ra n sp o r t e q u ip m e n t . . . . 0.25 0.24 0.51 0.45 0.51 0.56 0.50 0.60 0.72 1.07 0.79O th e r m a n u fa c tu re d goods 1.17 1.59 2.01 2.02 1.96 2.24 2.25 2.52 2.34 2.76 2.90
PAKISTAN (rupee )eM in era l o i l s ............................................ 8.3 9.5 8.3 7.4 7.3 13.9 17.3 21.9 17.8 27.1 23.6 30.9C h e m i c a l s ............................................ 6.5 7.0 8.5 10.5 10.8 9.0 9.2 14.7 11.0 18.0 17.3 21.1Iron a n d s te e l m a n u fa c tu re s 5.6 8.3 15.5 18.8 19.7 14.2 8.8 17.3 23.6 22.5 28.7 31.1M a c h i n e r y ............................................ 22.9 20.8 26.3 26.5 26.2 28.2 27.6 30.5 53.8 71.7 39.3 44.4T ranspo r t e q u ip m e n t . . . . 3. 7 4. 1 7. 7 9. 5 10.7 9.4 9.8 12.0 11.5 17.6 16.5 27.2
PHILIPPINES (peso)fF o o d .......................................................... 13.2 17.1 14.7 18.0 19.6 11.4 12.2 13.5 14.0 16.2 15.5 12.1 10.6
C e re a ls a n d c e re a l p re p a ra t io n s 4.3 6.2 4.4 6.3 8.7 3.9 3.6 5.2 4.0 4.6 5.1 3.0 0.6M in era l fuels, lu b r ic a n ts a n d
r e la te d m a t e r i a l s ............................. 9.0 9.0 8.7 9.6 10.2 9.9 10.1 11.2 9.2 9.6 7.1 5.4 4.2C h e m i c a l s ............................................ 6.4 7.3 6.5 9.5 8.5 9.8 9.2 12.0 9.9 9.3 7.8 9.3 9.7T e x t i l e s ................................................... 13.7 14.2 9.9 12.9 9.0 6.4 6.0 7.7 5.2 5.4 5.0 4.3 6.1M a c h i n e r y ............................................T ran sp o r t e q u ip m en t . . . .
10.3 12.4 16.1 18.0 16.3 17.9 18.1 19.9 18.7 19.7 16.1 13.0 15.54.2 5.0 4.8 5.6 4.8 4.6 5.0 4.5 5.3 5.7 17.7 44.8 29.6
re la te d m a t e r i a l s ............................. 22.40 24.93 26.80 27.38 25.87 25.42 24.92 22.48 21.21 20.48C h e m i c a l s ............................................ 0.70 0.82 0.79 0.80 0.83 0.97 1.12 1.21 1.30 1.30T e x t i l e s ................................................... 0.57 0.61 0.54 0.47 0.42 0.61 0.63 0.84 0.95 0.74M a c h i n e r y ............................................ 1.19 1.21 1.20 1.20 1.03 1.42 1.59 1.62 1.69 1.44T ra n sp o r t e q u ip m e n t . . . . 0.36 0.37 0.45 0.38 0.36 0.37 0.45 0.54 0.48 0.66O th e r m a n u fa c tu re d g o o d s 2.10 2.37 2.38 2.13 2.00 2.49 2.67 2.67 3.09 2.69
O th e r m a n u fa c tu re d g o o d s SA R A W A K (Malayan dollar)
F o o d ..........................................................M in e ra l fuels, lu b r ic an ts a n d
19.7
3.85
21.7
4.32
20.1
4.36
24.7
4.57
19.7
4.04
19.2
4.65
20.6 21.8
5.35
17.5
4.69
22.9
4.99
19.2
5.62
16.2 18.7
M a c h i n e r y ............................................T ra n sp o r t e q u ip m e n t .O th e r m a n u fa c tu re d goods
3.771.552.54
3.290.682.41
3.930.925.68
7.261.41
15.26
9.111.154.42
8.961.645.93
7.472.086.79
6.891.627.13
9.631.719.05
8.651.59
10.52
9.443.988.85
13.47 11.22
IRA N * (r ia l)cFood, b e v e r a g e s a n d to b a c c o .
S u g a r ...................................................T e a ...........................................................
C h e m i c a l s ............................................T e x t i l e s ...................................................B ase m e ta ls a n d m a n u fa c tu re s .M a c h i n e r y ............................................T ra n sp o r t e q u ip m e n t . . . .
127.694.7 25.471.8
128.8170.2 185.4101.2
146.3 78.858.673.6
117.3 230.5 237.2 129.1
326.2 189.178.661.8
270.4185.0230.3151.4
371.4180.1137.8
88.7312.3288.6298.0169.2
180.1124.2 128.5
390.2565.2 279.8
151.2 93.3
198.2
483.6861.7381.7
162.079.3
229.7
513.0 1,094.0
372.0
160.090.3
162.7
520.0710.0231.7

21. VALUE OF IMPORTS BY PRINCIPAL COMMODITY GROUPS (Cont’d)Monthly averages or calendar months
151EXTERNAL TRADE
Millions
1954 1955 1956 1957 1958 19591 9 5 9 1 9 6 0
III IV I II III O c t N o v
44.7 45.2 50.5 50.0 53.2 48.4 43.7 52.8 52.1 43.9 47.211.7 11.7 13.3 12.1 15.9 11.1 9.7 11.7 11.6 11.8 12.1
30.7 59.5 54.9 57.0 50.8 72.9 74.3 86.3 85.4 76.3 60.927.8 51.0 46.4 45.6 41.2 62.6 65.1 77.5 75.6 66.1 51.4
43.7 50.0 59.1 65.2 55.8 50.0 54.4 45.2 43.3 49.2 54.712.7 17.9 17.9 17.6 22.0 18.0 15.4 17.2 19.5 17.4 17.2
7.9 10.3 12.2 13.5 12.3 11.4 12.6 11.4 13.1 13.3 14.44.9 6.2 7.6 9.0 7.8 6.3 6.8 6.8 7.0 10.7 7.8
25.7 30.2 34.1 37.7 33.3 31.0 31.3 29.5 33.8 35.0 34.8
53.3 51.5 55.2 57.8 65.1 61.0 73.9 62.0 51.9 57.9 64.1 66.3 63.9
47.5 57.0 64.6 77.3 75.1 78.7 81.8 94.5 74.4 92.4 98.0 56.2 94.5
43.9 48.1 54.5 62.8 63.1 76.5 78.9 75.1 71.5 85.9 82.9 72.7 78.5
105.0 113.4 120.3 113.7 102.0 115.8 108.4 126.0 115.2 91.4 107.5 136.9 129.8
71.1 65.3 73.8 85.2 93.6 124.5 129.6 156.6 155.7 111.9 102.9 109.2 135.0
4 4 .6 48.7 53.1 73.7 61.4 58.8 5 9.7 48.1 60.9 76.1 81.5 59.3 50.8
168.7 191.1 173.8 189.7 184.1 184.4 154.3 175.8 213.3 185.3 189.9 187.4 195.3
122.0 89.6 82.2 75.9 69.5 69.2 56.5 88.5 84.5 73.3 79.5 66.7 45.041.0 33.7 35.0 44.6 46.8 51.8 49.1 56.7 49.9 68.4 41.7 78.4 22.5
190.1 111.2 123.5 128.7 108.5 73.9 64.7 84.6 74.5 55.2 60.3 71.7 112.476.2 65.4 49.2 83.9 63.0 75.2 78.1 101.8 84.0 101.3 82.5 101.6 62.349.3 52.3 32.6 58.3 53.4 42.0 45.5 54.6 39.9 39.2 34.2 39.0 67.3
GENERAL N O TE : See table 6.a. 1954 figures fo r Ceylon, 1954 to 1956 figures fo r In d ia , reclassified by ECAFE
Secretariat, m ay no t con fo rm exactly to the new c lassification be g in n in g fro m 1955 and 1957 respectively.
b. In c lu d in g trade w ith Singapore.c. P rio r to 1956, transaction values converted fro m fo re ig n currency to ria ls at
the o ffic ia l rate o f exchange and e xc lu d in g the value o f exchange certificates; beg inn ing 1956, in c lu d in g the value o f exchange certificates.
aid. F rom 1959 onwards figuresd. F igures fo r 1954-1958, e xc lud ing fo re ig n in c lu d in g fo re ig n a id .
e. F igures p r io r to 1956, re la tin g to p riva te account on ly . F rom 1956 onwards figures in c lu d in g governm ent account.
f. Im p o rts valued f.o .b .g. E xc lu d in g trade w ith the Federation o f Malaya.h. See foo tno te j to table 17.
22. VALUE OF EXPORTS BY PRINCIPAL COMMODITIES AND/OR COMMODITY GROUPSMonthly averages or calendar months Millions
1955 1956 1957 1958 19591 9 5 9 1 9 6 0
1954III O ct N o vIII IV I II
23.4021.85 23.91 25.78 26.14 25.04 24.38 24.580.12 0.33 0.35 0.20 0.18 0.34 0.34 0.45
84.7 84.9 52.079.4 68.1 72.3 66.7 56.9 62.8 84.2 58.72.4 2.7 3.7 3.1 2.2 3.0 2.1 2.5 4.7 0.62.0 1.8 2.8 5.6 4.3 5.7 6.2 6.2 5.9 7.84.2 3.2 4.3 2.1 1.3 1.8 2.0 1.7 4.1 3.4 1.93.8 4.9 5.2 3.9 2.9 3.5 4.0 3.7 2.9 2.3
67.1 48.8 96.269.5 9.3 20.6 55.8 64.6 67.1 57.8 63.416.9 12.5 15.9 14.8 18.7 18.1 10.4 36.6 24.0 12.5 27.134.3 51.1 42.2 47.7 51.2 57.9 97.2 40.8 62.9 47.9 89.4
93.6 99.5 87.0 85.1 94.2 87.1 90.2 97.4 93.7 89.8 94.2 100.1 84.718.2 19.0 18.0 13.3 13.6 20.3 22.5 22.4 12.5 14.6 19.1 20.8 10.923.8 29.2 24.4 25.0 21.5 24.8 20.6 25.1 48.0 27.0 20.3 38.6 17.6
91.0 4.1 48.49.4 37.3 34.4 37.0 54.4 70.9 — — —10.7 12.3 18.4 16.2 26.3 43.5 45.2 41.2 32.0 54.8 61.0 33.512.1 7.0 10.2 11.8 13.1 21.0 13.3 37.2 19.1 12.5 19.0 21.270.2 79.6 127.6 191.0 166.8 193.4 81.3 125.3 267.7 263.4 108.4 166.7
75.3 132.0 114.8 108.7 99.8 143.5 154.1 174.7 169.4 156.2 147.9
1.8 2.7 4.3 5.5 5.2 8.3 11.7 7.3 7.2 15.2 15.9
7.218.4
7.219.3
8.328.4
7.726.6
7.319.7
6.824.5
8.024.5
7.229.3
7.036.8
6.434.3
7.548.5
144.8 131.2 157.6b
149.3 160.3 161.8 191.0 230.7 149.4 99.8 161.0 222 .3 255.9
109.4 94.3 118.5 102.8 113.8 105.3 133.1 165.9 77.4 41.1 114.0 154.1 190.9
12.0 8.8 7.7 7.0 7.4 8.5 7.8 13.8 21.1 12.4 10.2 14.7 12.3
73.2 98.3 84.2 103.8 85.1 97.7 96.8 101.5 99.1 107.1 68.3 81.8 75.2
5.7 5.6 5.1 5.8 6.0 8.9 8.5 10.3 10.6 10.0 5.3 6.9 3.1
15.4 28.9 20.9 15.6 17.7 13.6 15.9 9.7 9.7 9.1 5.8 2.4 4.2
7.44.7
31.24.1
17.44.5
9.54.6
6.23.7
11.64.1
11.44.8
21.34.6
7.25.1
13.34.9
10.4 6.6
7.95.4
3.26.8
18.2 19.0 18.7 18.1 15.3 24.0 27 .0 27 .7 23.7 22 .8 18.8 19.1 18.3
59.7 53.0 51.9 57.2 43.9 55.1 60.7 75.8 55.5 51.1 50.8 49.6 50.4
101.229.3
102.9 94.6 49.6 49.6 55.5 59.6 5 6.1 54 .2 63.6 64.7 59.1 74.3
31.3 30.9 109.7 81.1 75.2 81.4 85.4 6 9.6 89.6 95.5 90.4 101.8
BRUNEI ( Malayan dollar)Crude p e t r o l e u m ............................N atural r u b b e r ...................................
BURMA (kyat)Rice a n d p r o d u c t s .............................N atural r u b b e r ....................................T e a k ........................................................R aw c o t t o n ..........................................Base m etals a n d ores . . . .
CAMBODIA (riel)R i c e ........................................................M a i z e ........................................................Natural r u b b e r ...................................
CEYLON (rupee)T e a ........................................................Coconut a n d p roduc ts . . . .Natural r u b b e r ....................................
CHINA (Taiwan, new Taiwan dollar)R i c e .........................................................Fruits, fresh, d ried a n d p re se rv e dT e a ........................................................Sugar .........................................................
FEDERATION OF MALAYAa (Malayan dollar)N atural r u b b e r ...................................Iron o r e ..................................................V egetable o i l s ...................................Tin m e t a l ..................................................
INDIA (rupee)bF o o d ........................................................
T e a ........................................................S p i c e s ..................................................
Crude m ateria ls , ined ib le , excep tf u e l s ..................................................Hides a n d skins, u n d re sse d Cotton r a w a n d w a s te .
Vegetable o i l s ....................................C h e m i c a l s ...........................................Leather a n d m an u fac tu re s Cotton y a rn a n d fabrics Jute y a rn a n d fab rics . . . . Other m an u fac tu red goods
SINGAPORE g)rallod nayalaM(F o o d ........................................................
C ereals a n d c e re a l p re p a ra t io n s Crude m ateria ls , ined ib le , except
f u e l s ..................................................Crude r u b b e r ....................................
Mineral fuels, lu b rican ts a n dre la ted m a t e r i a l s .............................
T e x t i l e s .................................................M a c h i n e r y ...........................................Transport eq u ip m e n t . . . . Other m an u fac tu red goods
THAILAND (baht)F o o d ........................................................Mineral fuels, lub rican ts a n d
re la ted m ate r ia ls . . . .C h e m i c a l s ...........................................T e x t i l e s .................................................M a c h i n e r y ..........................................Transport equ ipm en t . . . . Other m an u fac tu red goods
VIET-NAM (piastre)hF o o d ........................................................Petroleum a n d p roductsT e x t i l e s .................................................M a c h i n e r y ...........................................Transport eq u ip m e n t . . . .

152EXTERNAL TRADE
22 . VALUE OF EXPORTS BY PRINCIPAL COMMODITIES AND/OR COMMODITY GROUPS (Cont’d)Monthly averages or calendar months Millions
1954 1955 1 956 19 5 7 195 8 19591 9 5 9 1 96 0
III IV I II III O c t N o v
37.955.1
2 5 7 .658 .4
21 5 .3
2 9 .74 0 .4
4 1 0 .0 56 .9
2 0 5 .0
28 .34 3 .3
3 4 2 .760 .5
24 2 .5
28 .442 .9
332 .052 .9
28 7 .7
23 .619.9
2 4 8 .23 5 .9
2 6 8 .2
19.230 .2
3 9 6 .63 4 .0
2 1 9 .8
16.312 .2
38 8 .629 .8
21 5 .3
2 0 .05 6 .3
5 1 4 .540 .499 .3
108 .8150 .9
1 ,543 .8186.8818 .1
105.9 97 .4
1 ,645 .6157.5752 .9
9 9 .092 .0
1 ,255 .6183.7788.1
103 .7115.4
1,304.1144.990 1 .9
125.521 5 .216 7 .310 4 .6
97 .8139 .57 8 3 .8104 .7
113 .2 139 .7
1 ,325 .7105.3
124 .7160 .4
1,608.1123 .2
13 5 .3 124 .5
1 ,904 .9110 .4
1 3 9 .6
123.1
36.0
116.3
2 3 2 .0
143 .0
3.922 .23
3.982 .27
5 .323 .62
5 .3 63 .66
6 .9 25 .1 3
7 .6 35 .3 5
8 .4 25 .98
9 .797.31
6 .6 34 .08
6.844 .36
7 .294 .7 4
1 1 .3 78 .9 8
8.515 .2 6
2 .50 1.54 2 .37
16 .507 .51 3 .86 2 .20 9 .2 2
2 .941.742 .82
17 .5511 .61
3 .8 33 .57
12 .97
2 .8 61.653.21
20 .8110 .24
5 .079 .5 6
16 .76
2 .79 1.743 .7 9
2 4 .4 49 .706 .2 1
12 .752 0 .1 2
2 .2 71 .134 .1 3
2 1 .1 7 11 .1 5
7 .0 811 .912 0 .1 0
3 .281.985.01
2 2 .7 812 .0511 .1613 .3427 .0 0
3 .80 2 .4 4 4 .38
2 2 .4 8 11 .84
11.81 12 .62 29 .6 2
4 .2 42 .894 .9 4
27 .4 914 .5415 .3414 .8832 .1 7
3.081.885 .25
23 .4 813 .1912 .0813 .1526 .6 4
3 .632 .2 35.21
25 .0 815 .8014 .5710 .2732 .2 9
4 .082 .7 45 .2 3
2 7 .9 817.89 15 .68 13.6048 .9 0
4 .5 33 2 .8 518 .8 5
2 4 .7 3
4 .3 63 0 .4 82 0 .2 2
3 5 .0 7
67 43 58 152 159 251 122 24 7 25 6 549 784 823 2 ,261
4 2 73226
5 6 64 765
8 4236
108
58 62 4
169
5 9 01
165
74 411
161
8 6 311
172
49 316
194
6 8530
187
1,27434
53 3
1,63333
41 7
1,46129
173
1,8084 5
30 9
1.000 .7 50.59
0 .281.340 .74
0 .1 31.500 .63
0 .5 81 .600 .4 9
1 .072 .110 .29
3 .001 .860 .30
0 .962 .230 .2 0
0 .1 23.420.41
0 .323 .570 .32
0.09 0 .2 4 0 .1 3 0 .5 8 0 .8 4 0 .42 0 .31 i 0 .51 0 .13
1.152 .031.46
1.183 .841.81
1.943 .362 .18
2 .0 03 .102 .63
2 .6 82 .7 43 .0 3
2 .933 .925 .09
3.193.986 .11
3 .355 .026 .52
3 .154.266 .08
3 .944 .427.46
3 .574 .0 37.21
3.945 .429 .1
3.52.8
2.958 .033 .6
5 .62.6
4.56 2 .63 0 .3
5.93.3
2 .065 .22 7 .6
8 .63.4
2 .87 0 .02 0 .0
4 .0 3 .4
2 .45 6 .710.1
5 .16 .8
3.14 1 .7
8.53.75.7
5 .982 .3
4.84 .55 .7
2 .862 .619.5
6 .66.8
56 .430.110.2
8 .2
0.145 .7
9.42 .4 4.2
0.8109.9
4.76.94.6
26 .717.6
4.43.65.9
24 .717.7
4 .6 4 .3 6.9
2 8 .516.8
5.86.38.1
28.113.8
6 .56.6 7 .5
29 .919.3
4 .86.1
11 .6
29 .818.8
6 .5 7 .0
13.4
37 .314.3
6 .5 8 .9
16.6
36 .715.7
6 .8 6 .2
13.5
28 .219.1
9 .27.1
14.0
3 1 .732.4
6.58 .2
18.7
33.912.7
6.07.7
13.0
28 .08.26.45.6
14.4
21 .222 .3
5.85.6
14.2
3 .642 .8 71.16
2 .646 .64 1.83
2 .055 .861.59
1.446 .2 01.63
1.265.111.63
1.518 .042.59
2 .0 79 .883 .06
1.1710.81
3.63
1.1713.97
3.70
1.6710.18
3.38
2 4 .4 6 26 .7 4 2 8 .8 5 30 .51 2 7 .8 3 28 .2 6 2 7 .3 0 25 .5 2 2 3 .3 2 22 .1 9
66 .229 .4
4.516 .3
11 5 .931 .2
3.916 .9
102 .036 .2
3.911 .6
9 5 .536 .9
4 .711.1
8 5 .83 0 .2
3 .64 .0
125.328 .6
3.30.4
134.627.0
3.50.2
147 .72 5 .7
4 .00.1
130.426 .3
3.50.4
131.026 .0
4.40.2
109.825.8
3.30.4
2 5 7 .292 .417.631.1
261 .115 0 .2
2 2 .036 .7
2 3 8 .41 2 7 .2
2 5 .542 .3
30 1 .911 7 .2
2 1 .84 4 .3
2 4 8 .011 0 .6
19.92 1 .2
215 .9194 .7
20 .436 .2
182.622 1 .7
20 .351 .5
6.4122 1 1 .8
26 .9 43 .6
2 1 9 .526 7 .8
2 8 .74 7 .4
2 2 1 .7206 .1
3 5 .339.9
23 2 .3195 .4
31 .0 4 7 .3
132.4192.6
23.826.1
1 8 8 .21 8 3 .9
2 4 .044 .6
64 .26 8 .7
26 .2122 .7
1.1107 .0
5 9 .314 0 .8
4 0 .610 3 .5
69 .2136 .8
100.1143.3
73.9 2 2 0 .1
76 .3108.5
114 .3126.1
96.3194.1
40 .7151.1
49 .3102.1
G EN ER AL N O T E : Sec table 6.a. In c lu d in g trade w ith Singapore.b. F igures fo r 1954 to 1956, reclassified by EC AFE Secretariat, m ay n o t con fo rm
exactly to the new classification fro m 1957.c. F igures p r io r to 1956, re la tin g to p riva te account o n ly . F rom 1956 onw ards,
figures in c lu d in g governm ent account.
d. E x c lu d in g trade w ith the Federation o f Malaya.e. Baht va lue is obta ined by co nve rting fo re ig n currencies at free m arke t b uy ing
rate .f . See foo tn o te j table 17.
INDONESIA (rupiah)T e a .........................................................C o p r a .........................................................N a tu ra l r u b b e r ....................................Tin ore ..................................................Pe tro leum a n d p roduc ts
IRAN* (rials)Fruits, fresh, d r ied a n d p re se rv e dR a w c o t t o n ...........................................Pe tro leum a n d p roduc ts C arp e ts , h a n d m a d e . . . .
JAPAN (thousand million yen)F o o d .........................................................
F ish a n d fish p re p a ra tio n s . C ru d e m ate ria ls , in ed ib le except
f u e l s .................................................Textile fibres, r a w . . . .C h e m i c a l s ..........................................T e x t i l e s .................................................B ase m eta ls a n d m an u fac tu re sM a c h i n e r y ..........................................T ransport eq u ip m en t . . . . O the r m an u fac tu red goods
KOREA, R epublic of (hw an)F o o d ........................................................C rude m ate ria ls , ined ib le except
f u e l s .................................................C h e m i c a l s ..........................................M anufactu red goods . . . .
LAOS (kip)W ood a n d l u m b e r ............................Tin o r e .................................................G um s a n d r e s i n s ............................P lan ts for u se in m edic ine a n d
p e r f u m e r y ..........................................NORTH BORNEO (Malayan dollar)
C o p r a ........................................................R u b b e r .................................................T i m b e r .................................................
PAKISTAN (rupee)cT e a .........................................................R aw j u t e ..................................................R aw c o t t o n ..........................................R a w w o o l ..........................................H ides a n d s k i n s ...................................
PHILIPPINES (peso)C oconut a n d coconut p re p a ra tio n s S u g a r a n d re la te d products F ibres a n d m an u fac tu re s . M inerals a n d m eta ls . . . . Logs, lu m b er a n d tim ber .
SARAW AK (Malayan dollar)P e p p e r ..................................................R u b b e r ..................................................Timber, s a w n a n d logs M ineral fuels, lub rican ts a n d
re la ted m a t e r i a l s ............................SINGAPORE (Malayan dollar)d
R u b b e r ..................................................M ineral f u e l s ...................................V e g e ta b le o i l s ....................................Tin m e t a l ..................................................
THAILAND (baht)eR i c e .........................................................N a tu ra l r u b b e r ....................................T e a k .........................................................Tin o re a n d co n cen tra tes .
VIET-NAM (p iastre)fRice a n d p r o d u c t s .............................N a tu ra l r u b b e r ....................................

2 3 . Q U A N T I T Y O F E X P O R T S O F M A J O R C O M M O D I T I E S E X T E R N A L T R A D E
snot dnasuohT shtnom radnelac ro segareva ylhtnoM
19 5 4 1955 1956 1957 1958 1 9591 9 5 9 1 9 6 0
III IV I II III O c t N o v
129 .6 1 41 .5 162.1 155 .7 127 .7 150 .4 192 .9 154 .4 2 0 9 .9 2 0 5 .4 126 .1 8 2 .3
2 4 .7 8 .4 5 .8 19.2 21 .2 2 0 .2 17.9 20 .9 3 1 .7 26 .1 44 .8 2 9 .3 2 2 .73 .0 14 .2 9.1 10.1 14.9 13.3 — 17.1 0.8 9 .2 — —
83.5 102 .6 105.1 130 .8 8 8 .8 9 1 .5 7 9 .2 100 .6 100 .7 106.9 111 .0 6 2 .3 7 8 .014 .6 6.8 0 .4 15 .7 9 .8 20 .8 3 0 .3 22 .9 24 .2 4 1 .3 36 .8 15.0 19.9
4 3 .5 48 .8 5 0 .0 6 2 .4 68 .1 6 1 .2 25 .6 4 0 .3 91 .1 86 .4 35 .4 47 .216.4 7 .0 4.1 2 .6 0.9 1.3 0.9 1.8 0 .7 7 .8
17 .7 14 .7 1 4 .1 12 .2 7 .4 3.3 1.4 11.8 2.1 2 .5 5 .0 1.07 2 .4 77 .2 74 .4 59 .1 80 .8 7 7 .8 56 .9 6 7 .4 84 .1 128 .4 5 0 .6 4 0 .2 86 .5
13 .6 13.6 13.2 13 .3 14.3 15.0 15.1 16.1 15.6 15.5 16.7 16.1 13.71 .3 0.6 0 .9 1.0 1.0 1.2 0.8 2 .2 1.0 0 .9 1.0 1.2
16 .8 13.6 19.5 16 .5 18.9 17 .7 21 .7 2 6 .6 13.0 7 .0 17.7 2 4 .3 2 9 .23 .4 2 .4 2.9 3 .0 2 .9 2 .5 2.1 2 .5 2 .8 2 .9 3.0 3.11 .4 1.2 0.9 0 .9 0 .6 0 .7 0.9 0 .7 0 .7 0 .8 0 .7 0 .7 1.40 .8 0.4 0 .8 0 .3 0 .4 0 .5 0 .6 1.2 0 .5 — —
1,2 2 0 ‡ 1 ,174 1 ,048 1 ,083 1 ,003 1 ,087 1 ,032 1 ,093 1 ,079 91 8 82 3 1 ,174 4 8 781 1 749 87 8 8 56 8 8 7 9 79 96 3 1 ,152 9 3 9 1,226 111
8 .3 11.8 10 .3 6 .4 5 .2 8 .2 7.1 8 .5 4 .3 5 .2 7 .7 10.7 6 .1
3.7 4 .8 6.0 4 .7 3 .4 1.8 2.1 2.1 1.3 1.4 1 .7 1.4 3 .515.8 12.5 13.8 15 .4 6 .2 7 .0 2.1 14.0 9 .8 5 .7 6 .4 10.2
1.4 1.9 3.2 3 .4 3 .7 3 .2 3.8 3 .6 3.3 4 .8 5 .04 5 .5 48 .4 5 9 .8 5 7 .6 50 .0 41.1 54.1 54 .6 40 .0 49 .4 61.1 53 .6 4 0 .6
3 .0 2 .9 2 .7 3 .7 2 .3 1.4 1.5 2.1 1.4 2.0 1.1 1.3 1.9
2 .2 2 .2 2.2 2 .9 3 .8 3.9 4 .5 3.5 5.1 2 .6 6 .4 4 .5 6.111 .7 10.5 10.4 10.8 11.0 8 .6 8 .2 11.4 7 .0 8 .6 10.6 11.7
2.1 2 .3 2 .4 1.9 1.9 2.0 1.9 1.8 2 .5 2.8 3.1 3.1 2.0
2 .5 14.8 2 .8 0 .4 0 .6 4 .7 1.1 8.9 2.5 2.1 1.0 0.1 1.0
0.1 0 .1 0.1 0 .1 0 .1 0 .1 0.11.0
0.20.8
0.21.0
0.21.0
0.2 0.1 0.11.0 1.0 1.0 1.1 0 .9 1.0 1.0 1.0 1 .0
4.82 .0 2 .2 2 .4 2 .6 2 .8 2 .8 3 .4 3.5 2.9 1.9 3 .3 3 .07 .6 8.2 7 .3 8 .0 7 .7 7 .8 6 .9 7 .6 13.3 6.9 5.8 11.8 5 .5
3 5 .3 37 .9 3 6 .6 38 .9 39 .0 4 3 .3 45 .7 43 .3 41 .8 37 .3 39 .5 40 .6 45.161 .7 61.1 5 6 .6 56 .4 5 0 .5 60 .0 57.1 69 .3 48 .4 50 .4 43 .6 53 .4 3 4 .7
1.4 1.7 1.7 1.7 1.7 1.9 1.9 2 .2 1.9 1.8 1.8 1.9 1.61.9 3 .3 3.5 3 .5 3 .3 3 .7 4 .6 4 .0 4 .3 5 .3 4 .4 2.7 2 .6
13.1 15.6 15 .7 16.1 17.2 19.3 20 .7 19.5 11.2 16.6 15.6 8.1 20 .49 .9 11.0 11.3 11 .3 11 .6 14.4 15.7 13.9 16.1 12.3 12.9 14.4 14.54 .6 5 .2 5 .3 6.1 5 .7 6.1 7.6 6 .6 6 .2 4 .3 7 .7 6.9 5 .0
2.3 7.9 5.9 3 .4 6.1 4.9 5 .7 2 .9 3 .5 3 .0 1.5 0.4 0 .83.0 3 .7 3.2 3 .3 3 .6 3.4 1.2
11.8 14.0 10.9 9 .6 8.1 4 .5 3.7 2 .2 8 .5 12.5 6 .4 1.9
5 4 9 4 4 11 43 158 349 238 211 29 5 1861, 172 1 ,228 1 ,183 1 ,262 1 ,166 1 ,118 1 ,320 941 1 ,029 1 ,293 1 ,332 1 ,602 1, 1881, 117 991 1 ,032 1 ,217 93 6 91 7 9 1 3 90 6 2 ,2 9 6 2 ,8 8 6 2 ,791 6 ,4 9 5 5 ,151
2.7 5.0 4 .5 4 .5 4 .2 3 .2 2.6 2 .8 3.0 3.1 2 .711.3 11 .5 9 .8 13 .7 15.4 16.4 16.7 16.9 14.9 19.2 22 .8 23 .4 23 .365 .6 56 .9 56 .7 67 .1 4 7 .4 64 .6 68 .6 9 2 .5 5 9 .3 52 .8 52 .8 51.1 54 .289 0 79 .3 87 .9 102 .3 86 .8 88 .0 87 .4 101.2 84 .2 83 .4 100 .3 118.5 110 .5
74 .3 81 .8 7 1 .5 6 5 .4 75 .5 6 7 .4 54 .0 96 .8 79 .8 6 0 .6 41 .4 82 .867 .8
8.2
7 9 .6
9 .3
67 .9
10.2
|| 65 .9
9 .6
|| 6 7 .2
8 .4
73 .2
8.1
83 .4
7.6
80 .9
7 .6
57 .3
10.2
71 .2
7 .4
76 .7
7 .6
63 .8
8.8
73 .0
8.1
a. Beginning June 1955, Republic of Viet-Nam only.b. In terms of oil equivalent.c. Net exports.d. Excluding trade between Singapore and Federation of Malaya.
e. Excluding Federation of Malaya rubber transhipped at Singapore.f. Annual data: 12 months ending 21 July of year stated.g. Deliveries from mines in the Federation of Malaya to smelters in Singapore,
Penang and Butterworth.
1 5 3
52
2 ,8 7 48 0 6
79
2 ,6 8 99 3 5
71
2 ,6 3 81 ,052
725 ,0 4 92 ,3 1 81 ,130
1 1 22 ,7 9 61 ,553
54 8
1 1 73 ,1 1 81 ,560
85 4
1 463 , 194 1 ,5651, 195
15 23 ,8 6 21 ,9171 ,018
1 1 84 ,4 8 72 ,2 6 71 ,125
884 ,9 2 22 ,0 0 21 ,002
13 54 ,8 0 52 ,3 2 51 ,103
1115 ,459
64 5
1 895 ,2 4 3
1 ,027
3 ,1 3 42 ,8 1 6
3 ,2 0 42 ,821
4 ,3 9 91 ,806
4 ,2 5 21 ,763
3 ,2 1 26 6 7
3 ,7 2 749
3 ,6 7 82 3
4 ,4 5 616
5 ,6 4 5 59
5 ,2 8 434
7 ,2 7 598
6 ,9 4 7129
7 ,4 0 883
3 982 358 2 7
4 3 32 6 880 8
46 923 98 7 7
4 5 520 6
1 ,301
421172
1 ,122
44 8183881
45918376 2
43 7195411
40 3 178
1 ,246
381190
1 ,099
3721807 7 6 1 ,412
RICEB u r m a .........................................................C a m b o d i a .................................................C h in a ( T a i w a n ) .........................................T h a i l a n d .........................................................V ie t-N a m a .................................................
SUGARC h in a ( T a i w a n ) .........................................I n d i a .................................................................I n d o n e s i a .........................................................P h i l i p p i n e s .................................................
TEAC e y l o n .........................................................C h in a ( T a i w a n ) .........................................I n d i a .................................................................I n d o n e s i a .........................................................J a p a n .................................................................P a k i s t a n .........................................................
HIDES & SK IN SI n d ia (t o n s ) .................................................P a k i s t a n (th o u s a n d p ieces ) .
C O P R A b & C O C O N U T O ILC e y l o n .........................................................F e d e r a t i o n o f M a l a y a c,d
(c o c o n u t o i l ) .........................................I n d o n e s i a ( c o p r a ) .................................N . B o r n e o .................................................P h i l i p p i n e s .................................................S i n g a p o r e ( c o c o n u t o il)c
PA LM O IL F e d e r a t i o n o f M a l a y a c,d .I n d o n e s i a .........................................................S i n g a p o r e c .................................................
G R O U N D N U T S b & O ILI n d i a .................................................................
N A TU R A L RU BB ERB r u n e i .........................................................B u r m a .........................................................C a m b o d i a .................................................C e y l o n .........................................................F e d e r a t i o n o f M a l a y a c,d .I n d o n e s i a .........................................................N . B o r n e o .................................................S a r a w a k .........................................................S in g a p o r e c , e .................................................T h a i l a n d .........................................................V ie t-N a m , R e p u b l i c o f . . .
CO TTO N , R A WI n d i a .................................................................I r a n f .................................................................P a k i s t a n .........................................................
C O T T O N Y A R N (tons)F e d . of M a l a y a a n d S i n g a p o r e d .H o n g K o n g .................................................J a p a n .................................................................
C O T T O N P IE C E G O O D S (m illio n sq . m etres)F e d . of M a l a y a a n d S i n g a p o r e d .H o n g K o n g .................................................I n d i a (m ill io n m e tres) . . . .J a p a n .................................................................
JUTEP a k i s t a n ( r a w ) .........................................I n d i a ( b a g a n d c lo th ) . . . .
HEMP, R A WP h i l i p p i n e s .................................................
TIN C O N C E N T R A T E S (tons)B u r m a .........................................................F e d e r a t i o n of M a l a y a g . . . .I n d o n e s i a .........................................................T h a i l a n d .........................................................
TIN M ETA L (tons)F e d e r a t i o n o f M a l a y a c,dS in g a p o r e c .................................................
PETROLEUM & P R O D U C T S B ru n e i ( c ru d e o il o n ly ) . . . . F e d . of M a l a y a a n d S i n g a p o r e d . I n d o n e s i a .........................................................

EXTERNAL TRADE24 INDEX NUMBERS OF QUANTUM, UNIT VALUE AND TERMS OF TRADE
1953=100a
1 9 5 9 1 9 6 0
1952 1954 1955 1956 1957 1958 1959 III IV I II III Oct Nov
A . Quantum
BURMA
. ...
137104 122 104 88 132 82 127 111115 132 146 165 153 118 152 194 150
CEYLON 142 121 108Im ports:b G e n e ra l . 96 99 97 106 112 113 125 150 132 118 107Exports:b G e n e ra l . 97 103 109 104 99 107 105 111 111 113 104 116 128 95Im ports (Central Bank, index ) 99 93 96 105 111 112 126 154 132 123 108 140 120 107
C o nsum er goods . 98 89 95 106 107 115 122 157 130 123 101 142 111 105C a p ita l g oods 104 103 104 102 125 102 139 151 140 128 134 134 155 121
Exports (Central Bank, index) 97 103 109 102 100 106 104 107 110 120 103 111 128 91CHINA (Taiwan)
116 106 162Im ports (ordinary and 1CA) 81 105 98 94 102 113 125 156E x p o r t s .................................... 67 69 86 83 97 118 111 56 102 121 130
FEDERATION OF MALAYA a n d SINGAPOREc137 148 145 138 140I m p o r t s ....................................
E x p o r t s ....................................116 | |107 128 140 139 139 139109 ||110 118 127 130 130 130 135 137 128 124 134
INDIAI m p o r t s ....................................E x p o r t s ....................................
108 118 125 | | 147 168 151 159 153 154 148 176 166100 105 115 | | 1 1 0 119 108 119 130 144 106 101 105
JAPANdImports: G e n e ra l . Exports: G e n e ra l .
7492
104133
109174
138208
172232
142240
179285
178289
193334
218286
218308
230332
215337
228355
PHILIPPINESIm portse ...................................E x p o r t s ...................................
90107
111111
125121
115135
137127
121140
106139
106158
122140
108135
121177
112142
124131
110131
THAILANDI m p o r t s ....................................E x p o r t s ...................................
82102
10396
110113
113119
121131
118109
128121
128121
141136
140139
130123
131121
124122
VIET-NAMfI m p o r t s ...................................E x p o r t s ...................................
103123
113113
1190 || 132
7785
95155
82122
85164
85197
99221
86147
84201
80262
93186
B. Unit Value
BURMAI m p o r t s ................................... 115 93 89 82 91 98 85 90 85 ............................................... .......................E x p o r t s ................................... 94 77 62 62 60 62 57 56 54 ............................................................................
CEYLONIm ports:b G e n e ra l . . . 110 88 89 99 92 83 91 89 86 88 94 87 88 89Exports:b G e n e ra l . . . 98 112 117 109 104 102 107 105 112 111 110 103 106 104Im ports (Central Bank, index) 108 92 86 90 95 87 86 88 87 88 87 88 87 89
C onsum er goods . . . 107 91 84 85 89 81 83 86 87 84 83 84 83 85C ap ita l goods . . . 113 95 97 107 114 105 98 98 99 101 101 100 102 100
Exports (Central Bank index) 98 111 116 109 104 102 107 106 112 112 111 103 107 105CHINA (Taiwan)
Im ports (ordinary and 1CA) 111 108 111 106 110 106 99 97 95 106 97 ........................................E x p o r t s ................................... 113 105 110 105 116 100 90 85 93 82 88 . . .
FEDERATION OF MALAYA a n d SINGAPOREcI m p o r t s .................................... 108 I I 90 92 91 96 91 93 96 97 102 103 99
E x p o r t s .................................... 125 II 04 120 1101
105 95 115 119 126 135 135 124
INDIAI m p o r t s .................................... 109 97 95 || 99 107 100 98 88 95 98 99 97 ......................E x p o r t s .................................... 109 107 98 || 102 102 101 99 100 101 108 109 112 . . .
INDONESIAI m p o r t s .................................... 110 91 91 89 88 96 83 78 89 94 .................................................................E x p o r t s .................................... 113 96 110 103 99 89 88 110 120 101
JAPANdIm ports . . . . • • 114 96 94 97 103 89 83 84 82 86 85 82 82 80
E x p o r t s .................................... 108 96 91 94 97 94 95 96 97 97 98 99 99 97
KOREA,g R epublic of (1957=100)100 92 86 85 85 85 85 82 81 81
i mports • • • • • • •••
E x p o r t s ......................................... . . . 100 82 90 92 96 104 103 105 105 105
PAKISTANhI m p o r t s .................................... 102 98 105 112 124 134 129 130 130 132 135 .........................................E x p o r t s ................................... 142 107 104 98 105 97 90 87 91 90 101 . . . • • • • • •
PHILIPPINESIm nortse • • 105 96 96 97 100 102 104 108 105 105 106 106 114 108
E x p o r t s .................................... 82 89 81 83 84 87 94 93 97 99 95 90 87
THAILANDImports . . 97 105 106 106 109 105 104 105 105 105 105 107 106
E x p o r t s .................................... 102 111 109 100 99 102 108 109 107 112 112 114 111
VIET-NAMfImports . 8 1 101 95 90 99 93 86 85 88 89 91 90 85Imports • • • • • •
E x p o r t s .................................... 88 94 99 92 97 85 85 84 91 87 82 80 80
154

24.
155EXTERNAL TRADE
INDEX NUMBERS OF QUANTUM, UNIT VALUE AND TERMS OF TRADE (Cont’d) 1953 = 100a
1952
B U R M A ................................... 82
1954
p83
1955
ercentage
70
1956
c.of u n it val
76
1957
Termue index
66
1958
s of trof exports
63
1959
adeto u n it va
67
1 9
III
lue index
63
5 9
IV
of imports
64
I
1
II
9 6
III
0
| Oct | Nov
121 117C E Y L O N ................................... 89 127 132 110 109 123 118 118 130 126 117 119Ceylon (Central Bank index) 90 121 134 121 110 117 123 120 129 127 127 117 122 118
CHINA (Taiwan) . . . . 102 97 99 99 105 94 90 87 98 77 91FEDERATION OF MALAYA
and SINGAPORE . 116 104 130 121 109 104 124 124 130 133 132 126
INDIA ............................... 100 110 103 103i 95 101 101 113 107 111 111 115INDONESIA . . 103 106 120 116 112 93 106 142 136 108
121 122J A P A N ............................................. 94 100 96 97 94 106 114 114 118 113 115 121
100 90 105 108 114 122 121 128 130 131
PAKISTAN . . . 139 109 99 88 85 72 70 67 70 68 7584 276 85PHILIPPINES . . 78 93 85 85 84 85 90 86 92 94 90
THAILAND . 106 106 103 95 91 97 104 104 102 106 107 107 104VIET-NAM ................................... 109 93 11104 102 98 91 99 99 104 97 91 89 95 . . .
a. O rig in a l base: Burm a, A p r 1936-Mar 1941 fo r the period p r io r to 1953, 1952 since 1953; China: Taiwan, 1952; Ceylon, 1948; Federation o f Malaya and Singapore, 1938 fo r period p r io r to 1953, 1952 since 1953; Ind ia , A p r 1952 /M ar 1953 p r io r to 1960, 1958 since I960; Indonesia , 1950; Japan, 1950; Republic o f Korea, 1957; Pakistan, A p r 1948 /M ar 1949; Philippines, 1955; Thailand, 1953; Viet-Nam , 1949.
b. A l l trade indexes since 1950 except the annual im p o r t p rice in dex have been computed on a fixed base (1948) we ights m ethod. The annual im p o r t p r ic e index has been com puted by us ing m o v in g cu rre n t we ights .
c. F igures fro m 1953, though lin k e d to previous figures, have d iffe ren t trea t-m ent in im p o rts and exports o f petro leum products.
d. Indexes com piled by M in is try o f Finance.e. Based on f.o .b . im p o r t prices.f . See footnote j to table 17.g . Index in term s o f U.S. do lla rs .h. Im po rts exc lud ing land trade. Index in term s o f U.S. dollars.i . Calendar year fro m 1956.
25. BALANCE OF PAYMENTS
1957 1958 1959F irs t h a l f
1959 19601957 1958 1959
F irs t h a lf
1959 1960
G oods a n d s e rv ic e s . Exports , m a in ly c.i.f. Im ports , m a in ly c.i.f. T ra n sp o rta t io n a n d
in s u ra n c e . . . . In v es tm en t in c o m e .O t h e r ..............................
D onations, p r iv a te a n do f f i c i a l ..............................
P riv a te c a p i ta l Official a n d b a n k c a p i t a l
L ong-term c a p i ta l : O fficial lo a n s A m orfiza tion
Short-term c a p i ta l : P a y m e n t & c l e a r in g
a g r e e m e n ts O th e r l ia b i l i t ie s . F o re ig n e x c h a n g e
h o ld in g s M o n e ta ry g o ld
Net e rro rs a n d o m iss io n s
A F G H A N IS T A N a (million Afghanis)66.2
1,984.5-1 ,966 .3
— 3.2— 31.5
82.7
126.0
571.4— 64.7
— 190.10.6
— 68.2— 13.1— 427.9
— 868.5 1,722.7
-2 ,532.8
— 28.7— 42.6
12.9
94.2— 0.3
657.0— 105.9
10.40.3
— 136.8
349.0
G o o d s a n d s e rv ic e s . E x p o rts ,b f.o .b. . Im p o rts ,b m a in ly c.i.f. . T ra n s p o r ta t io n a n d
i n s u r a n c e . . . . G o v e rn m e n t , n . i .e . .O t h e r ..............................
P r iv a te d o n a t io n s .P r iv a te c a p i t a l . . . . O ffic ia l d o n a t io n s .O ffic ia l a n d b a n k c a p i t a l
L o n g -te rm c a p i ta l :D r a w in g s o n lo a n s .O t h e r ..............................
S h o rt- te rm c a p i ta l :N e t IM F p o s i t io n O th e r l ia b i l i t ie s . U n io n B a n k a s s e t s . C o m m e rc ia l b a n k
a s s e t s . . . . G o v e r n m e n t a s s e t s . S ta te A g r ic u l tu ra l
M a rk e t in g B o a rd 's a c c o u n ts r e c e iv a b le
M o n e ta ry g o ld N e t e r ro r s a n d o m iss io n s
B U R M A ( million kyats)
— 536 1,154
— 1,555
— 4— 108 — 22— 25
3181400
114— 3
95153
53— 20
8
— 23
— 52 934
— 834
2— 121— 33— 16
6133
— 83
84— 3
— 14— 8— 99
— 22 — 16
— 5
12
— 48 1,118
— 994
— 3— 139— 29— 13
17 97
— 37
61— 14
— 19 88
— 77
12— 36
— 52
— 17
— 103 375
— 377
— 3— 72— 26— 7
250
— 37
21— 3
44— 97
8— 18
7
96
7 5
670— 5 2 8
— 10— 30— 27— 7
244
— 144
74— 31
— 45— 7 7
— 10— 33
— 22
30
G oods a n d s e rv ic e s . Exports,b f.o.b. . Im ports ,b c.i.f. T ra n sp o rta t io n a n d
in s u ra n c e . . . . In v estm en t in c o m e .O t h e r ..............................
P riva te d o n a t io n s .P riva te c a p i t a l . . . . Official d o n a t io n s .Official a n d b a n k c a p i t a l
Long-term c a p i ta l : Portfolio s e c u r i t ie s N et lo a n r e p a y m e n t
b y U.K. . . . IBRD lo a n sO t h e r ..............................
Short-term c a p i ta l :N et IMF p o s it io n O th e r l ia b i l i t ie s . F o re ig n a s s e t s :
G o v e rn m e n t & C e n -tra l B a n k . C o m m e rc ia l b a n k s
M o n e ta ry g o ld .Net e rro rs a n d o m iss io n s
C E Y L O N ( million rupees)— 156 1,669
— 1,764
44— 53— 52— 66— 38
27233
— 45
2223
— 9
— 103
19455
— 130 1,624
- 1 ,7 1 3
76— 41— 76— 78— 4
55173
23
142
22
116— 4
— 16
— 194 1,773
-1,956
73— 37— 47— 56
244
204
48
104
38
— 36 24
10313
— 52 895c
— 887c,d
— 13c— 17— 30— 33
23 __ d
76
— 6
138
2
365
— 14
— 83 913c
— 933c,d
— 15c— 20 — 28 — 22
132d
84
— 17
37
6
87— 2
6
G o o d s a n d s e rv ic e s . E x p o rts , f .o .b . . Im p o rts , m a in ly c.i.f. . G o v e rn m e n t , n .i .e . .O t h e r ..............................
P r iv a te d o n a t io n s .P r iv a te c a p i t a l . . . . O ffic ia l d o n a t io n s . O ffic ia l a n d b a n k c a p i t a l
L o n g -te rm c a p i ta l : O ffic ia l l o a n s
r e c e iv e dO t h e r ..............................
S h o rt- te rm c a p i ta l :P a y m e n t a g r e e m e n t s O th e r l ia b i l i t ie s . B a n k s ' d e p o s i ts
a b r o a d . . . . O th e r fo re ig n a s s e t s M o n e ta ry g o ld .
N e t e r ro r s a n d o m iss io n s
C H IN A : T a iw a n (million U.S. dollars)— 96.3
148.3— 244.7— 1.2
1.3 0.1 9.1
58.3 29.7
38.3— 3.5
13.20.3
— 20.32.6
— 0.9— 0.9
— 124.9 155.8
— 273.5— 4.7— 2.5
14.4 35.948.220.2
41.6— 6.1
- 0.7 7.0
- 17.4- 2.9- 1.3
6.2
- 123.0 156.9
- 2 6 4 .0— 9.8— 6.1
9.8 13.539.160.1
42.90.2
- 0.67.8
4.33.52.00.5
— 48.6 93.7
— 132.0— 6.3— 4.0
6.9— 0.9
38.04.5
11.2
— 0.5
— 18.2 — 0.1
10.4 — 0.3
2.0 0.1
— 54.286.4
- 1 3 3 .8— 2.9— 3.9
3.110.4 38.0
2.3
9.4— 0.6
- 9.8- 7.9
11.3- 0.1
0.4
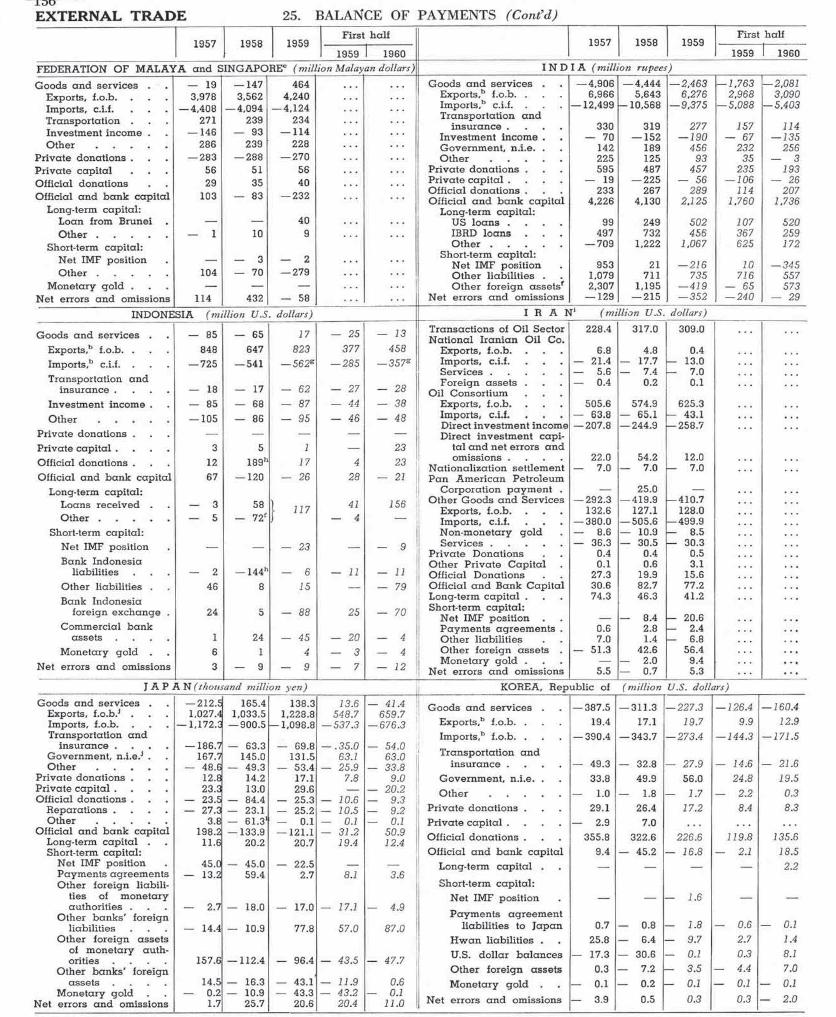
1 5 6
E X T E R N A L T R A D E 2 5 . B A L A N C E O F P A Y M E N T S ( C o n t ’d )
YALAM FO NOITAREDEF
G o o d s a n d s e r v i c e s .
19 5 7
A a n d
— 19
1958
5 IN G A P C
— 147
1959
)REe ( m i l
4 6 4
F i r s
1959l io n M alay
h a l f
196 0a n d o l la r s ) I N D
G o o d s a n d s e r v i c e s .
1957
I A ( m i l l
— 4 ,9 0 6
195 8
io n r u p e e
— 4 ,4 4 4
1959
s)— 2 .4 6 3
F i r s t
1959
— 1 .7 6 3
h a l f
1960
— 2.081
E x p o r t s , f .o .b . 3 ,9 7 8 3 ,5 6 2 4 ,2 4 0 E x p o r t s , b f .o .b . . 6 ,9 6 6 5 ,6 4 3 6 ,2 7 6 2 ,9 6 8 3 ,0 9 0
I m p o r t s , c .i .f . — 4 ,4 0 8 — 4 ,0 9 4 — 4 ,1 2 4 I m p o r t s , ” c .i .f . — 1 2 ,4 9 9 - 1 0 , 5 6 8 — 9 .3 7 5 — 5 .0 8 8 — 5 .4 0 3
T r a n s p o r t a t i o n . 271 23 9 23 4 T r a n s p o r t a t i o n a n d i n s u r a n c e . . . . 33 0 319 2 7 7 15 7 114
I n v e s t m e n t i n c o m e . — 146 — 93 — 114 I n v e s t m e n t i n c o m e . — 70 — 152 — 1 9 0 — 67 — 1 3 5O t h e r ................................. 28 6 23 9 22 8 G o v e r n m e n t , n . i . e . . 142 189 4 5 6 2 3 2 25 6
P r i v a t e d o n a t i o n s . — 28 3 — 28 8 — 27 0 O t h e r ................................. 2 2 5 125 9 3 3 5 — 3P r i v a t e c a p i t a l 56 51 56 P r i v a t e d o n a t i o n s . 59 5 4 8 7 4 5 7 2 3 5 1 9 3
O f f i c i a l d o n a t i o n s 29 35 40 P r i v a t e c a p i t a l . . . . — 19 — 2 2 5 — 56 — 106 — 26
O f f i c ia l a n d b a n k c a p i t a l 103 — 83 — 23 2 O f f i c i a l d o n a t i o n s . O f f i c i a l a n d b a n k c a p i t a l
23 34 ,2 2 6
26 74 ,1 3 0
2 8 92 .1 2 5
1141 ,7 6 0
2 0 71 ,7 3 6
L o n g - t e r m c a p i t a l :40
L o n g - t e r m c a p i t a l :L o a n f r o m B r u n e i — — U S l o a n s . . . . 99 249 5 0 2 1 0 7 5 2 0O t h e r ................................. — 1 10 9 IB R D l o a n s 4 9 7 7 32 4 5 6 3 6 7 2 5 9
S h o r t - t e r m c a p i t a l : O t h e r ................................. — 7 09 1 ,222 1 ,0 6 7 6 2 5 1 7 2
N e t IM F p o s i t i o n — — 3 — 2 S h o r t - t e r m c a p i t a l : N e t IM F p o s i t i o n 95 3 21 — 2 1 6 1 0 — 3 4 5
O t h e r ................................. 104 — 70 — 279 O t h e r l i a b i l i t i e s . 1 ,079 711 7 3 5 7 1 6 5 5 7M o n e t a r y g o l d . — — — O t h e r f o r e i g n a s s e t s f 2 ,3 0 7 1 ,195 — 4 1 9 — 65 5 7 3
N e t e r r o r s a n d o m i s s i o n s 114 43 2 — 58 N e t e r r o r s a n d o m i s s i o n s — 129 — 2 15 — 3 5 2 — 2 4 0 — 29
I N D O N E S I A ( m i l l io n U .S . d o l la r s ) I R A N i ( m i l l i o n U .S . d o lla r s )
G o o d s a n d s e r v i c e s . — 85 — 65 17 — 25 — 13 T r a n s a c t i o n s o f O i l S e c t o r 2 2 8 .4 3 1 7 .0 3 0 9 .0N a t i o n a l I r a n i a n O i l C o .
E x p o r t s ,b f .o .b . . 848 6 47 8 2 3 3 7 7 4 5 8 E x p o r t s , f .o .b . 6 .8 4 .8 0 .4I m p o r t s , b c.i.f. . — 7 25 — 541 — 5 6 2 g — 2 8 5 — 3 5 7 s I m p o r t s , c .i .f . — 2 1 .4 — 17.7 - 13.0
S e r v i c e s ................................. — 5 .6 — 7 .4 — 7.0T r a n s p o r t a t i o n a n d
— 18 — 17 — 62 — 27 — 2 8F o r e i g n a s s e t s . — 0 .4 0 .2 0.1
i n s u r a n c e . . . . O i l C o n s o r t i u mI n v e s t m e n t i n c o m e . — 85 — 68 — 87 — 44 — 3 8 E x p o r t s , f .o .b . 5 0 5 .6 5 7 4 .9 62 5 .3
O t h e r ................................. — 105 — 86 — 9 5 — 46 — 4 8 I m p o r t s , c .i .f . — 6 3 .8 — 65.1 — 43 .1D i r e c t i n v e s t m e n t i n c o m e — 2 0 7 .8 — 2 4 4 .9 — 2 5 8 .7
P r i v a t e d o n a t i o n s . — — — — — D ir e c t i n v e s t m e n t c a p i -P r i v a t e c a p i t a l . . . . 3 5 1 .— 2 3 t a l a n d n e t e r r o r s a n d
O f f i c ia l d o n a t i o n s . 12 1 89h 17 4 23 o m i s s i o n s . . . . N a t i o n a l i z a t i o n s e t t l e m e n t
22 .0 — 7.0
54 .2 — 7 .0
12.0 — 7.0
O f f i c ia l a n d b a n k c a p i t a l 67 — 120 — 26 2 8 — 21 P a n A m e r i c a n P e t r o l e u mL o n g - te r m c a p i t a l : C o r p o r a t i o n p a y m e n t . — 25 .0 —
L o a n s r e c e i v e d . — 3 58 117 41 156 O t h e r G o o d s a n d S e r v i c e s E x p o r t s , f .o .b .
— 2 9 2 .3 132 .6
— 4 1 9 .9 127.1
— 4 1 0 .7 1 2 8 .0
O t h e r ................................. — 5 — 7 2 f — 4 — I m p o r t s , c .i.f. — 3 8 0 .0 — 5 0 5 .6 — 4 9 9 .9S h o r t - t e r m c a p i t a l : N o n - m o n e t a r y g o l d — 8 .6 — 10.9 — 8 .5
N e t IM F p o s i t i o n ___ — 23 — 9 S e r v i c e s ................................. — 3 6 .3 — 3 0 .5 — 3 0 .3P r i v a t e D o n a t i o n s 0 .4 0.4 0.5
B a n k I n d o n e s i a O t h e r P r i v a t e C a p i t a l 0.1 0 .6 3.1l i a b i l i t i e s — 2 — 14 4 h — 6 — 11 — 11 O f f i c i a l D o n a t i o n s 2 7 .3 19.9 15.6
O t h e r l i a b i l i t i e s . 46 8 15 __ — 79 O f f i c i a l a n d B a n k C a p i t a l 30 .6 8 2 .7 7 7 .2
B a n k I n d o n e s i a L o n g - t e r m c a p i t a l . 74 .3 4 6 .3 4 1 .2
f o r e i g n e x c h a n g e . 24 5 — 88 2 5 — 70 S h o r t - t e r m c a p i t a l : N e t IM F p o s i t i o n — 8 .4 - 2 0 .6
C o m m e r c i a l b a n k24 — 4 5 — 2 0
P a y m e n t s a g r e e m e n t s . 0 .6 2.8 - 2 .4a s s e t s . . . . 1 — 4 O t h e r l i a b i l i t i e s 7.0 1.4 - 6 .8
M o n e t a r y g o l d . 6 1 4 — 3 — 4 O t h e r f o r e i g n a s s e t s . — 5 1 .3 4 2 .6 5 6 .4
N e t e r r o r s a n d o m i s s i o n s 3 — 9 — 9 — 7 — 12M o n e t a r y g o l d .
N e t e r r o r s a n d o m i s s i o n s 5 .5— 2 .0 — 0 .7
9 .45 .3 . . .
J A P A N ( th o u s a n d m i l l io n y e n ) K O R E A , R e p u b l i c o f ( m i l l io n U .S . d o l la r s )
G o o d s a n d s e r v i c e s . . — 212.5 165 .4 1 38 .3 1 3 .6 — 4 1 .4 G o o d s a n d s e r v i c e s . — 3 8 7 .5 — 3 1 1 .3 — 2 2 7 .3 — 1 26 .4 — 160 .4E x p o r t s , f .o .b . j . . . 1 ,0 2 7 .4 1 ,0 3 3 .5 1 ,2 2 8 .8 5 4 8 .7 6 5 9 .7
1 2 .9I m p o r t s , f .o .b . . . . — 1 ,1 7 2 .3 — 9 0 0 .5 — 1 ,0 9 8 .8 — 5 3 7 .3 — 6 7 6 .3 E x p o r t s ,b f .o .b . . 19 .4 17.1 1 9 .7 9 .9T r a n s p o r t a t i o n a n d I m p o r t s , ” f .o .b . . — 3 9 0 .4 — 3 4 3 .7 — 2 7 3 .4 — 1 4 4 .3 — 1 7 1 .5
i n s u r a n c e . . . . — 186.7 — 6 3 .3 — 69 .8 — .3 5 .0 — 5 4 .0G o v e r n m e n t , n . i . e . J . . 167.7 145.0 1 3 1 .5 63.1 6 3 .0 T r a n s p o r t a t i o n a n d
— 2 7 .9 — 1 4 .6 — 2 1 .6O t h e r .................................— 48 .6 — 4 9 .3 — 5 3 .4 — 2 5 .9 — 3 3 .8 i n s u r a n c e . . . . — 4 9 .3 — 32 .8P r i v a t e d o n a t i o n s . . . 12.8 14.2 17.1 7.8 9 .0 G o v e r n m e n t , n . i . e . . 3 3 .8 49 .9 5 6 .0 2 4 .8 19 .5P r i v a t e c a p i t a l . . . . 23 .3 13.0 2 9 .6 — — 2 0 .2 O t h e r ................................. — 1.0 — 1.8 — 1 .7 — 2 .2 0 .3O f f i c ia l d o n a t i o n s . . . — 23 .5 — 8 4 .4 — 2 5 .3 — 1 0 .6 — 9 .3
R e p a r a t i o n s . . . . — 27 .3 — 23.1 — 2 5 .2 — 1 0 .5 — 9 .2 P r i v a t e d o n a t i o n s . 29 .1 2 6 .4 1 7 .2 8 .4 8 .3
O t h e r ................................. 3 .8 — 6 1 .3 k — 0.1 — 0.1 — 0.1 P r i v a t e c a p i t a l . . . . — 2. 9 7. 0O f f i c ia l a n d b a n k c a p i t a l 198.2
L o n g - te r m c a p i t a l . . 11.6— 133.9
20 .2— 121.1
2 0 .7— 3 1 .2
19.45 0 .912 .4
O f f i c i a l d o n a t i o n s . 35 5 .8 3 2 2 .6 2 2 6 .6 1 1 9 .8 1 35 .6
S h o r t - t e r m c a p i t a l : O f f i c i a l a n d b a n k c a p i t a l 9 .4 — 4 5 .2 — 1 6 .8 — 2.1 18 .5N e t IM F p o s i t i o n . 45 .0 — 4 5 .0 — 22 .5 — — L o n g - t e r m c a p i t a l .
S h o r t - t e r m c a p i t a l :
__ __ __ — 2 .2P a y m e n t s a g r e e m e n t s — 13.2 O t h e r f o r e i g n l i a b i l i -
59 .4 2 .7 8.1 3 .6
t i e s o f m o n e t a r y N e t IM F p o s i t i o n — — — 1 .6 — —a u t h o r i t i e s . . . — 2 .7
O t h e r b a n k s ' f o r e i g n— 18.0 — 17.0 — 17.1 — 4 .9
P a y m e n t s a g r e e m e n t
l i a b i l i t i e s . . . — 14.4 — 10.9 77 .8 5 7 .0 8 7 .0 l i a b i l i t i e s t o J a p a n 0.7 — 0.8 — 1 .8 — 0 .6 — 0.1
O t h e r f o r e i g n a s s e t s H w a n l i a b i l i t i e s . 2 5 .8 — 6.4 — 9 .7 2 .7 1.4of m o n e t a r y a u t h -o r i t i e s . . . . 157 .6 — 112 .4 — 9 6 .4 — 4 3 .5 — 4 7 .7
U .S . d o l l a r b a l a n c e s — 17.3 — 3 0 .6 — 0.1 0 .3 8.1
O t h e r b a n k s ' f o r e i g n O t h e r f o r e i g n a s s e t s 0 .3 — 7.2 — 3 .5 — 4.4 7 .0
a s s e t s . . . . 14 .5 — 16.3 — 43 .1 — 1 1 .9 0 .6 M o n e t a r y g o l d . — 0.1 — 0 .2 — 0.1 — 0.1 — 0.1M o n e t a r y g o l d . . — 0 .2 — 10.9 — 4 3 .3 — 4 3 .2 — 0.1
— 3.9 0 .5 0 .3 0 .3 — 2 .0N e t e r r o r s a n d o m is s i o n s 1.7 2 5 .7 2 0 .6 2 0 .4 1 1 .0 N e t e r r o r s a n d o m i s s i o n s

25. BALANCE OF PAYMENTS (C on t’d )
157
EXTERNAL TRADE
First ha lf First ha lf1957 1958 1959 1957 1958 1959
1959 1960 1959 1960
PAKISTAN (m illion rupees) PHILIPPINES ( million pesos)
Goods a n d se rv ice s . — 770 — 973 — 497 — 240 — 572 G oods a n d se rv ice s . — 424 — 206 25 109 26Exports,b f.o.b. . 1,708 1,392 1,587 728 932Imports,b p riv a te f .o .b .. — 811 — 807 — 715 — 319 — 1,488 Exports, f.o.b. . 864 966 1.062 535 609Transportation a n d
insu rance . . . . — 90 — 85 — 88 — 29 — 72 Im ports, f.o.b. - 1 ,2 3 3 — 1,155 — 1.022 — 454 — 545Government, n.i.e. . O t h e r ............................
— m205,1— 75
m164,1 —— 13
— 1,284 4
— 628m 7
47n10
T ran sp o rta tio n a n d in su ra n c e . . . . — 162 — 136 — 98 — 44 — 55
Private donations . 5 — 6 10 10 — 3Private cap ita l . . . . 29 — 3 10 — 3 — 2 Investm en t incom e . — 128 — 107 — 129 — 27 — 79Official dona tions .Official a n d b a n k cap ita l
261469
473534
469 — 2
231 — 6
336194 G overnm ent, n .i.e. . 206 184 166 84 78
Long-term cap ita l: O t h e r ............................. 29 42 46 15 18Loans rece iv ed . 249 189 448 353 250
P riv a te d o n a tio n s .Official re p ay m en ts . — 139 — 56 — 58 — 21 — 42 13 35 34 9 15U.K. securities — 16 254 — 307 — 227 — 42 P riv a te c a p ita l . . . . 96 40 48 — 14 75
Short-term capita l:Net IMF position — — — — — 60 Official d o n a tio n s . 109 77 68 28 20Liabilities . . . . State B ank (issue
157 133 — 31 — 115 52 Official a n d b a n k c a p ita l 253 40 — 58 — 66 — 80
Dept.) a sse ts . 276 — 28 — 110 — 39 289 Long-term c a p i ta l . — 56 31 76 5 — 1A dvance p a y m e n ts to
US G overnm ent — 30 34 Short-term cap ita l:S tate Bank (Banking N et IMF position — — — 30 — 10 — 6
Dept.), Com m ercialb a n k s a n d o ther O th e r liab ilities . 86 2 — 70 — 78 — 17institutions' a sse ts O th e r fo re ign a sse ts 191 15 — 36 17 — 43a n d v a lu a tio n cor-rectionp — 28 12 62 45 — 244 M o n e ta ry go ld . 32 — 8 2 — — 13
M onetary go ld . — — 4 — 6 — 3 — 10 N et erro rs a n d om issions — 47 14 — 117 — 66 — 56Net errors a n d om issions 5 — 25 10 9 47
THAILAND (million US dollars) VIET-NAM, R epublic of (million piastres)
Goods a n d se rv ices . — 36.3 — 78.7 — 60.0 - 28.8 — 19.6 G oods a n d se rv ice s — 6,422 — 5,184 — 5,931Exports, f.o.b. 390.1 307.0 358.1 167.3 200.8 Exports, f.o.b. 3,119 2,009 2,165Imports, c.i.f. — 404.7 — 385.5 — 417.5 - 196.1 — 223.6 Im ports, c.i.f. — 8,570 — 6,379 — 7,610Non-m onetary gold — 5.1 — 1.1 — — — 0.1 S e r v i c e s ............................ — 971 — 814 — 486Governm ent, n.i.e. . 5.8 9.1 9.3 3.5 3.5 P riv a te d ona tions . 725 405 481O t h e r ............................ — 22.4 — 8.2 — 9.9 - 3.5 — 0.2 P riv a te c a p ita l 109 — 20 21
Private donations . — 9.3 — 1.3 3.1 1.7 1.1 Official dona tions 5,324 5,648 5,920Private c ap ita l . . . . 2.6 4. 7 6.4 3.2 2.2 ICA d irec t g ra n ts . 4,259 4,356 5,781Official dona tions . 35.0 25.3 39.9 20.2 21.3 US indirect g ra n ts . 927 992 94Official a n d b a n k cap ita l 13.0 28.4 2.7 0.5 — 18.6 O t h e r ............................ 138 300 45
Long-term capita l: Official a n d b a n k c a p ita l 199 — 651 — 495Loans rece iv ed . 28.2 14.9 23.1 9.7 15.6 Long-term cap ita l:Official re p ay m en ts . — 6.3 — 4.4 — 13.4 - 8.4 — 8.9 ICA lo an s . . . . 119 667 89
O t h e r ............................ — 1.8 — 1.1 — 2.8 0.4 — 1.5 O th e r long-term a sse ts — — — 2Short-term cap ita l: Short-term cap ita l:
Net IMF position — 8.1 N et IMF position — — — 18
1.8 P iastre liab ilities to USLiabilities . . . . 3. 2 9.2 6.8 — 5.1 G ov ern m en t . 552 — 143 283Sterling b a la n c e s 1.3 — 7.0 - 9.4 - 4.4 0.7 C om m ercia l b a n k s . — 275 — 26 — 20U.S. do lla r b a la n c e s - 9.6 21.4 — 1.2 - 1.9 — 19.9 N a tio n a l b a n k foreignOther fo reign a sse ts - 0.6 1.4 - 2.8 - 1.7 0.5 a s s e t s ............................. — 196 — 991 — 836M onetary gold — — 8.1 — — M o n e ta ry go ld . — 1 — 158 9
Net errors a n d om issions - 5.0 21.6 7.9 3.2 13.6 N et e rrors a n d om issions 65 | — 198 4
GENERAL NO TES: (1 ) N o sign indicates c red it, m inus sign indicates debit. For fore ign balances o r fo re ign assets unde r short-te rm offic ial and bank capital, no sign indicates decrease, m inus sign indicates increase. (2) Statistics on goods and services, merchandise im ports and exports are on a net basis.
a. Years beg inn ing about 22 March.b. Figures based on exchange con tro l record.c. Partly f.o.b. and p a r t ly c . i. f .d. Official grants in k in d are om itted .e. Data cover transactions o f the Federation o f Malaya and o f Singapore w i th
the rest o f the w o r ld bu t exclude trade between the tw o areas.f. Includes Reserve Bank ’s ho ld ings o f lo ng -te rm securit ies.g. F.o.b.
h. The cancella tion o f trade debts owed to Japan (177 m i l l io n US dollars) is inc luded as a c red it in officia l donations; tha t pa rt o f the debt tha t was con-solidated in 1952 (60 m i l l io n US dollars) is entered as a decrease in long-te rm l iab i l i t ie s and the rem a inder as a decrease in short-te rm l iab il it ie s .
i. Years beg inn ing 21 March.j . Goods purchased by U N forces unde r the special p rocurem ent program me
are inc luded in “ G overnment, n . i .e . ” k . In c lu d in g w a ive r o f trade cla ims on Indonesia (63.7 thousand m i l l io n y e n ) . m . Includes governm ent im ports .n. G overnm ent im po rts are inc luded w i th pr iva te im p o r ts . p. Reinvested earnings f ro m fo re ign d irec t investm ent are om itted .

158
PRICES 26. INDEX NUMBERS OF WHOLESALE PRICES 1953=100a
1954 1955 1956 1957 1958 19591 9 5 9 1 9 6 0
III IV I II III Oct Nov
BURMAAll ag r icu ltu ra l p ro d u ce 100 96 99 114 112 103 105 111 106 110C e r e a l s .................................................. 101 107 103 103 102 110 115 124 107 111Non-food ag ric u ltu ra l p ro d u ce 114 107 103 124 137 121 112 115 121 118
CHINA (Taipei)188 188G e n e ra l i n d e x .................................... 102 117 132 141 143 158 160 166 172 179 182
Food 105 114 123 135 142 165 168 177 186 195 203 215 213A p p a r e l .................................................. 94 110 106 105 107 118 119 120 121 121 119 118 118M etals a n d e lec tr ica l m a te r ia lsb . 102 158 190 197 189 186 187 188 190 206 202 197 198Building m a t e r i a l s ............................. 105 115 153 163 148 166 160 171 198 212 170 161 159
M an u fac tu red p ro d u c ts . . . . 104 120 143 162 158 167 167 174 178 184 180 180Industria l m a t e r i a l s ............................. 100 116 138 163 163 191 191 195 198 201 196 193
INDIA 121 121G e n e ra l i n d e x .................................... 96 88 99 104 107 110 112 114 114 117 120Food a r t i c l e s ........................................... 92 80 93 100 105 111 113 114 110 112 116 114 113Industria l r a w m ate r ia ls 97 91 105 110 107 112 113 116 122 129 128 137 138M an u fac tu red artic le s . . . . 102 101 106 109 110 111 111 114 118 121 122 126 127
In term ed ia te p roduc ts 99 99 112 110 111 113 111 118 123 127 133 132 134F in ish ed p roduc ts . . . . 102 101 106 109 110 111 111 113 117 120 122 125 126
INDONESIA (D jakarta)(im ported goods)
145 135 160All a r t i c l e s ........................................... 109 247P r o v i s i o n s ........................................... 110 144 146 178 244Textile g o o d s .................................... 110 169 118 137 248C h e m i c a l s .......................................... 109 151 137 141 208M e t a l s ................................................. 98 115 135 169 234
IRAN (Teheran)138 141 140G e n e ra l i n d e x ................................... 118 115 123 123 119 123 122 128 129 134
Domestic p r o d u c t s ............................ 124 117 124 131 133 146 144 155 153 156 155 151Im ported p r o d u c t s ............................ 107 105 96 88 82 85 86 87 92 93 92 95 97Exported p roduc tsc ............................ 117 116 136 134 125 121 120 123 123 135 144 151 152
JAPANG e n e ra l i n d e x ................................... 99 98 102 105 98 99 99 101 101 100 101 102 102Edible fa rm p roduc ts . . . . 112 112 109 112 117 116 116 116 117 120 119 115 115T e x t i l e s ................................................. 92 87 88 82 75 77 78 80 78 76 76 77 77
Chemicals 93 90 94 95 88 85 85 86 86 87 90 87 86M etal a n d m ach in e ry . . . . 94 97 116 119 103 105 106 106 106 105 104 103 102Building m a t e r i a l s ............................ 104 96 104 115 107 110 109 113 112 111 113 119 123
Producer g oods ................................... 96 95 103 107 98 99 99 100 99 99 99 100 101C onsum er g o o d s ............................ 103 101 100 102 99 100 100 102 103 103 104 103 103
KOREA, R epublic of (1 9 5 5 = 1 0 0 )156 163 169 165 162G e n e ra l i n d e x ................................... 100 132 153 143 147 152 153
Foods ........................................................ 100 141 168 145 138 146 136 142 161 174 162 153M etal p roduc ts a n d m ac h in e ry 100 130 162 159 176 179 187 192 200 193 193 191B u ild in g m a t e r i a l s .............................. 100 121 135 144 165 166 191 188 196 195 192 192Fibre a n d fibre p roduc ts . 100 122 127 126 128 131 140 138 131 136 141 145Producer g oods ................................... 100 138 156 156 174 179 190 192 194 193 192 194C onsum er g o o d s ............................ 100 129 152 138 136 141 138 141 151 160 154 149
PHILIPPINES (Manila)106 109 113 112G e n e ra l i n d e x .................................... 95 92 95 99 103 104 104 106 107
Food 97 95 96 102 105 98 98 100 99 101 103 115 113C rude m a t e r i a l s .................................... 88 84 90 92 99 117 112 119 122 115 113 112 113
Chemicals 95 88 88 93 96 100 100 100 100 99 95 95 95M an u fac tu red goods . . . . 96 92 100 103 104 110 112 114 115 112 113 112 112
Domestic p r o d u c t s ............................. 94 92 94 98 101 101 101 103 104 103 106 110 109Exported p r o d u c t s .............................Im ported p r o d u c t s .............................
8897
8192
84100
88106
98110
111120
105123
110125
113125
106126
105126
106127
107128
THAILAND (Bangkok)113 115 109 114 115 115G e n e ra l i n d e x .................................... 98 114 117 118 123 115 117
A gricu ltu ra l p ro d u ced . . . . Foodstuffsd ...........................................
9896
136108
130116
130115
143122
134111
133114
135105
133110
12899
133107
136106
132109
Clothes 99 102 101 101 101 101 100 100 100 101 102 102 102M e t a l ............................................................ 97 126 139 141 108 116 116 123 123 123 122 120 118Construction m a te r ia ls . . . . 103 104 103 105 103 103 103 104 104 104 103 102 102
VIET-NAM (Saigon-Cholon)G e n e ra l i n d e x .................................... 105 117 122 123 124 113 123 117 113 121 129 133 136
Rice a n d p a d d y ....................................R a w m a t e r i a l s ....................................
83117
99145
113131
106139
119126
76138
104139
87152
77159
87169
109154
120148
126140
Sem i-finished p ro d u c ts . . . . 120 123 131 138 129 126 127 128 123 121 126 128 135M an u fac tu red products 120 124 121 111 117 111 114 115 118 121 123 129 138
Local p r o d u c t s ....................................Im ported p r o d u c t s .............................
100 116 123 121 123 106 119 110 106 116 125 128 131121 121 124 130 131 129 130 130 131 132 139 1 4 4 149
a. O r ig in a l base: B urm a, 1938-40; C hina: T a iw an, Jan-June 9137 p r io r to 1959. 1956 since 1959 except indexes o f m anufactu red products and in d u s tr ia l materia ls fo r w h ich the base is 1951; Ind ia , A p r 1952 /M ar *1953; Indonesia, 1938; Japan, 1952; Republic o f Korea, and P hilippines, 1955; T hailand , A p r 1938 /M ar 1939; V ie t-N a m , 1949.
b. B e g inn ing 1959, meta ls and manufactures thereof.c. E xc lud ing petro leum .d. A g r ic u ltu ra l produce in c lu d in g paddy, r ice meal, copra, rubber, etc.; foodstuffs
in c lu d in g m i l le d r ice, po rk , bananas, etc.

1 5 9
2 7 . I N D E X N U M B E R S O F P R I C E S R E C E I V E D A N D P A I D B Y F A R M E R S 1 9 5 3 = 1 0 0 a
P R I C E S
1954 1955 1956 1957 1958 1959 1959 5 9 0691 9 6
III IV II I
III Oct N ov
CHINA (Taiwan)Prices rece iv ed b y fa rm ers (R) 92 102 110 122 122 136 138 150 167 190Prices p a id b y fa rm ers (P) . 93 101 111 118 i 120 132 133 141 159 182
C ultivation cost 93 106 113 120 I125 136 135 146 166 179Domestic expend itu re 92 100 109 117 117 130 132 139 156 183
Ratio (R)÷ (P) . . . . 99 100 99 103 102 103 104 106 105 103INDIA (Punjab)
Prices rece iv ed b y fa rm ers (R) 94 78 97 104 107 115 107 107 114 106Prices p a id b y fa rm ers (P) . 98 86 96 104 i 108 117 114 114 119 113
C ultivation cost 92 79 91 95 105 116 110 110 117 110Domestic e x p en d itu re 102 91 99 110 111 118 116 117 121 116
Ratio (R)÷ (P) . . . . 96 90 101 100 99 98 9 4 93 96 94INDIA (W est B engal, 1954= 100)
Prices re ce iv e d b y fa rm ers (R) 100 102 118 135 143 141 157 148 145 150Prices p a id b y fa rm ers (P) . 100 98 106 113 119 120 1 2 5 124 122 124
C ultivation cost 100 98 103 105 111 116 122 118 113 116Domestic e x p en d itu re 100 97 108 118 124 122 126 128 127 128
Ratio (R) ÷ (P) . . . . . 100 105 111 119 120 117 126 119 119 122JAPANb (Apr 1953-Mar 1954 )001= 100)
Prices rece iv ed b y fa rm ers (R) 98 95‡ 98 99 97 97 97 98 93 95 98Prices p a id b y fa rm ers (P) . 103‡ 101‡ 102 105 103 103 103 104 105 105 106
Cultivation cost 102‡ 9 8 t 98 102 100 97 96 97 98 99 100Domestic e x p en d itu re 103‡ 103‡ 103 106 105 107 107 108 108 108 109
Ratio (R)÷ (P) . . . . 96 94‡ 97 94 94 941
94 94 89 91 93
a. Original base: China (Taiwan) 1952; India, Punjab, Sep 1938/Aug 1939; West b. Index numbers of commodity prices in 473 towns or villages. Annual figuresBengal, 1939; japan, Apr 1951/Mar 1952. prior to 1956 relate to fiscal year April to March.
2 8 . P R I C E Q U O T A T I O N S O F M A J O R E X P O R T C O M M O D I T I E S
1 9 5 9 0691 9 6U nit 1953 1954 1955 1956 1957 1958 1959
III IV I II III Oct Nov
RICEBurma £ per L .to n 60.0 49.0 41.1 35.6 34.2 37.0 32.9 32.7 32.0 32.0 32.0 32.0 33.0 33.0C am bodia R i per 100 kg. 375 337 379 335 382 356 359 363 360 345 416 453 445C h in a :T a iw a n N T$ per m .ton 3,527 3,133 2,634 3,776 3,644 3,643 5,309 — 5,311 5,312 5,239 — __T hailand | £ per L . ton 63.4 57.3 50.5 48.9 49.8 53.1 47.7 48.4 45.7 43.8 41.9 47.5 47.0 46.0
SUGARC hina (Taiwan) US$ per ton 98.2 104.9 104.6 104.3 139.3 98.4 84.4 82.8 85.8 81.3 83.4 91.9India Rs.per m aund 28.4 31.1 28.1 27.9 30.8 32.5 36.0 35.7 37.0 37.5 37.5 37.5 37.5 37.5Indonesia -gk 001 rep.pR 285 308 306 302 350 418 440 440 440 440 440 440 440Philippines Peso per picul 15.2 14.9 13.8 14.0 14.8 15.3 14.9 15.1 15.0 14.5 15.9 17.5 18.2 18.3
TEACeylon Rs. per lb. 1.92 2.61 2.20 2.19 1.87 1.72 1.95 2.06 2.19 2.05 1.82 2.05 2.22China: T a iw an N T $ per k g. 9.64 11.25 11.49 11.96 10.08 12.67 16.20 17.84 15.04 17.88 16.55 19.21 18.01India Rs. per lb. 2.00 3.18 3.05 2.58 2.63 2.52 2.43 2.68 2.54 2.33 2.52 2.97 2.73 2.63Indonesia Rp.per 100 kg- 1,037 1,469 1,459 1,072 1,097 1.116 1,039 1,012 881 4,417 4,240
PEPPERC am bodia Ri .per 63.42 kg- 6,238 4,663 3,507 4,350 4,771 3,465 2,827 2,783 3,092 3,875 4,200 5,200 4,875 5,425India Rs.per m aund 285.9 162.4 131.6 110.9 77.7 71.7 100.2 95.0 119.2 205.2 235.8 241.1 200.0 190.2Indonesia Rp.per 100 kg. 2,583 1,478 745 551 469 457 492 480 615 2,674 3,992S a ra w ak M $ per picul 313.7 159.6 109.6 70.2 69.5 66.9 82.6 — 88.5 — 190.4 182.4 181.8S ingapore M $ per picul 395.3 204.8 135.6 94.7 72.8 69.8 93.4 88.7 138.3 230.2 192.8 182.5 144.i 154.4
HIDESP ak istan Rs.per 28 lbs.a 21.61 25.54 31.72 29.49 29.08 29.24 04.36 117.03 20.00 125.56 120.00 113.33 113.00 L17.50
SKINSIndia Rs.per 100 pcs. 336.0 320.0 287.6 300.4 353.1 336.9 392.9 388.3 433.3 441.7 379.2 306.2 225.0 250.0Pak istan Rs.per 100 pcs. 178.7 208.2 211.9 254.6 287.4 252.5 301.5 365.8 331.2 380.6 429.2 326.2 304.0 297.5
GROUNDNUTSIndia Rs.per m au n d 29.11 21.36 15.94 24.42 25.34 25.15 28.58 30.36 28.78 30.64 32.49 35.09 37.20 34.09
COPRACeylon Rs. per candy 267.2 246.8 209.5 212.2 239.8 264.8 302.6 299.8 313.7 323.0 295.4 264.2 247.5 239.8Federation of
M a la y a M $ per picul 35.30 30.68 26.38 25.70 26.85 35.13 41.29 38.83 41.00 40.33 33.33 31.00 28.25 28.50Indonesia Rp.per 100 kg. 219 194 193 178 156 179 237 221 240 777 806Philippines peso per 100 k g. 36.62 30.76 27.12 26.02 28.43 37.70 46.66 39.20 45.20 46.70 38.23 36.79 33.38 37.81Singapore M $ per picul 37.59 32.55 28.14 27.45 27.34 33.89 40.89 37.73 40.27 40.67 33.72 30.38 28.05 28.09
RUBBER.NATURALCeylon Rs. per lb. 1.54 1.51 1.51 1.46 1.30 1.42 1.47 1.45 1.49 1.65 1.42 1.46 1.41Indonesia Rp.per 100k g. 565 545 888 821 746 641 804 838 905 3,731 3.877Singapore M Cents per lb. 67.44 67.30 14.16 96.76 38.75 80.25 01.28 103.68 116.36 16.09 124.25 03.46 95.09 87.23T hailand Baht per k g . 7.30 8.17 13.59 11.25 10.87 10.33 13.92 14.93 15.92 17.34 17.74 16.18 14.39 13.65United
Kingdom Pence per lb. 19.7 19.8 32.9 28.1 25.9 23.4 29.4 30.0 33.6 33.6 36.0 29.9 27.8 25.6

P R I C E S 2 8 . P R I C E Q U O T A T I O N S O F M A J O R E X P O R T C O M M O D I T I E S ( C o n t ’d )
U nit 1953 1954 1955 1956 1957 1958 195919 5 9 1 9 6 0
III IV I II III O ct N o v
TIMBERB u rm a K .p e r cu .ton 929 876 921 923 889 874 861 850 899 924 1,095F e d e r a t io n of
M a l a y a M $per 50 cu .ft. 148.2 149.4 156.6 158.2 144.6 143.3 127.9 122.1 139.5 152.8 155.9 161.7 156.1 150.4N o r th B o rn eo M $per 50 cu .ft. 118.3 82.9 77.9 77.5 66.1 64.7 74.6 75.7 90.9 90.9 96.8 89.3P h i l ip p in e s Peso per
1,000 bd.jt. 109 117 114 112 105 102 106 104 114 124 124 120 117 113T h a i la n d B aht per cu. m . 2,436 3,023 3,614 4,098 4,090 3,867 3,956 3,958 4,001 3,964 4,107 4,662 4,474 4,732
W O O L , R A W P a k is ta n Rs. per lb. 2.09 2.25 2.15 2.70 2.77 2.06 2.33 2.52 2.30 2.46 2.51 2.67
CO TTO N , R A W B u rm a K . per lb. 1.08 1.34 1.33 1.00 1.14 1.01 0.86 0.90 0.90 1.19I n d ia Rs.per 784 lbs. 710.0 734.0 635.8 786.7 766.7 732.0 767.6 794.0 — 840.0 840.0 840.0 — -—P a k is ta n Rs. per m a u n d 67.1 78.7 79.6 88.8 87.0 81.9 74.2 75.1 82.5 89.9 90.0 94.2
JUTE, R A W I n d ia Rs. per 400 lbs. 132 148 172 173 207 192 190 192 198 199 248 230 322 318P a k i s t a n Rs. per 400 lbs. 106 135 150 187 214 188 190 186 198 217 272U n ite d
K in g d o m £ per L . ton 96 102 98 103 114 110 111 108 111 115 133 125 185 198H EM P, R A W
P h i l ip p in e s Peso per p icu l 38.4 28.8 31.0 37.4 46.8 39.2 57.6 61.6 60.8 66.9 63.0 59.5G R O U N D NUT
OIL In d ia Rs. per quarter 22.34 15.38 11.92 17.82 19.11 18.79 20.50 21.83 20.23 22.08 23.23 24.23 25.88 23.58
PA LM OIL I n d o n e s ia R p .per 100 k g . 214 204 220 233 232 212 217 207 217 861 809
C O C O N U T OIL C e y lo n Rs. per L . ton 1,519 1,454 1,156 1,168 1,256 1,396 1,688 1,751 1,736 1,756 1,608 1,349 1,263 1,251P h il ip p in e s Peso per kg- 0.69 0.57 0.48 0.45 0.47 0.66 0.80 0.70 0.77 0.80 0.71 0.65 0.60 0.66S in g a p o re M $ per p icu l 59 55 44 44 46 54 65 61 64 64 54 48 45 45
RA Y O N YARN J a p a n Y e n per lb. 229 209 173 172 171 151 148 150 152 147 147 147 147 147
CO TTO N PIECE G O O D S I n d ia Rs. per lb. 1.89 1.88 1.80 1.94 2.04 1.81 1.84 1.85 1.90 || 2.59 2.59 3.08J a p a n Y e n per yd . 60 57 50 54 48 42 53 53 59 60 54 54 54 51
JUTE M A N U -FA CT U RE S In d ia (b ag ) Rs.per 100 bags 98.8 111.8 115.6 111.2 114.6 98.6 98.1 101.5 105.0 113.2 131.0 137.3 168.1 176.2I n d ia (h e ss ia n ) Rs.per 100 yd . 46.1 47.2 45.0 43.0 44.3 43.0 42.4 42.2 42.8 43.9 50.8 48.9 58.7 59.3
TINI n d o n e s ia R p .per m .to n 19,377 14,215 14,986 16.078 16,011 15.649 15.757 15,915 16.063 65,325 69,773 65.434 64 ,478S in g a p o r e M $ per picul 363.9 353.6 365.5 387.0 373.2 369.3 396.9 399.8 393.1 389.9 388.6 401.4 396.0 395.5T h a i la n d Baht per kg . 20.3 26.9 28.2 28.8 28.9 28.0 31.6 32.3 30.9 32.1 31.7 30.9 — 32.1
PETROLEUM,CRUDEI n d o n e s ia R p .per m .to n 76 160 160 163 163 181 181 174 196 510 518 543 501S a r a w a k M $ per m .to n 64 65 63 61 64 65 60 - 59 — 59 59 59
PETROLEU MPRO D U C TSI n d o n e s ia Rp. per litre 0.33 0.32 0.30 0.31 0.30 0.32 0.31 0.30 0.33 0.98 0.98 0.93 1.07
SPECIFICATIONS:RICE: Burma — Average of export contract prices f.o.b. white rice, No. 1 small
mills special ngasein. Cambodia—Wholesale prices of white rice No. 1—25% broken, at Phnom—Penh. China: Taiwan—Unit value of export of rice and paddy. Thailand—Export price f.o.b. Bangkok, white rice 5% broken; prior to 1955 export contract price f.o.b.
SUGAR: China: Taiwan — Monthly average price of all kinds of sugagr f.o.b. Taiwan ports. India — Wholesale prices, D. 28 Kanpur. Indonesia — Domestic wholesale prices of white sugar, Djakarta. Philippines — Wholesale prices of centrifugal sugar, Manila.
TEA: Ceylon—Average weekly auction prices of weighted average for three grades of black tea in Colombo. China: Taiwan — Unit value of export of black tea. India—Export price at Calcutta auctions, leaf, all types. Indonesia —Export prices f.o.b. for B.O.P., O.P., P.S. and B.P.
PEPPER: Cambodia — Wholesale prices, black ex-store. India — Wholesale prices, ungarbled (alleppey) Calcutta. Indonesia — Export prices, f.o.b. black Lam- pong. Sarawak — Unit value of exports of black pepper. Singapore — Average wholesale prices, black Lampong.
HIDES: Pakistan — Average wholesale prices of Karachi unframed arsinicated mixed 12/40 lbs. (buffalo), Karachi, since August 1959 10/40 lbs.
SKINS: India — Wholesale prices of raw goat skin, average quality, Calcutta. Pakistan — Average wholesale prices of sheep skin, Papra (dewooled all primes), Karachi.
GROUNDNUTS: India — Wholesale prices of ground nuts, machine shelled, Cuddalore.
COPRA: Ceylon — f.o.b. prices for all grades. Federation of Malaya — Whole-sale prices, sundried. Indonesia — Export prices f.o.b. mixed. Philippines — Wholesale prices, resecada, Manila. Singapore — Wholesale prices, sundried.
RUBBER, NATURAL: Ceylon—Unit value of exports of rubber sheet. Indonesia —Export prices f.o.b. R.S.S. 1 and Crepe 1. Singapore—Buyers’ midday prices,f.o.b. Singapore No. 1 RSS in bales. Annual prices are the averages of daily prices. Thailand— Unit value of exports of rubber smoked sheet. Annual figures relate to whole kingdom, monthly and quarterly figures relate to Port of Bangkok only. United Kingdom — domestic/import price cif London, No. 1 RSS.
TIMBER: Burma — Unit value of teak exports. Federation of Malaya — Unit
value of net exports of timber. North Borneo — Unit value of sawn logs for 1953-1954; sawn logs and veneer logs, non-coniferous from 1955 to date. Philippines — Unit value of exports of logs and lumber. Thailand — Unit value of exports of teak board. Annual figures relate to whole kingdom, monthly and quarterly figures relate to Port of Bangkok only.
WOOL, RAW: Pakistan — Unit value of exports.COTTON, RAW: Burma — Unit value of exports. India — Wholesale prices,
Jarilla M.G.F. at Bombay prior to August 1959; at Madhya Pradesh 25/32" for August 1959 to December 1959; at Madhya Pradesh 26/32" for subsequent period. Pakistan — Monthly average wholesale prices of 289 F. Punjab R.G. Karachi.
JUTE, RAW: India — Domestic price at Calcutta, raw lightnings. Pakistan — Domestic/export f.o.b. Chittagong, raw, baled, export firsts. United Kingdom — Domestic/import price c. and f. Dundee, Pakistan mill firsts.
HEMP, RAW: Philippines — Domestic/export price at Manila, Manila Hemp,Grade G.
GROUND-NUT OIL: India — Wholesale prices, naked, Bombay.PALM OIL: Indonesia — Export prices f.o.b.COCONUT OIL: Ceylon — f.o.b. prices for all grades. Philippines — Wholesale
prices, Manila. Singapore — f.o.b. Singapore.RAYON YARN: Japan — Export prices f.o.b. viscose, 120 denier hank, 1st
gradeCOTTON PIECE GOODS: India — Wholesale prices of grey standard shirting
(dyeing grey standard shirting since 1960) 35" X 38 yds. Bombay. Japan — Export prices f.o.b., heavy shirting s/2003 grey 38"
JUTE MANUFACTURES: India — Export prices of bags, B-twills lbs.44 X 26 " (22 X 26" since April 1960) f.a.s. Calcutta. India— Domestic/export prices of hessian cloth 10̂ oz. 40" Calcutta.
TIN: Indonesia — Unit value of exports of tin and tin ore. Singapore — Export prices ex-works. Thailand — Unit value of exports of tin ore and tin in concentrates. Annual figures relate to whole kingdom, monthly and quarterly figures relate to Port of Bangkok only.
PETROLEUM, CRUDE: Indonesia — Unit value of exports of crude petroleum. Sarawak — Unit value of exports of crude petroleum.
PETROLEUM PRODUCTS: Indonesia— Unit value of exports of motor spirit. a Since 1959, Rs per 82 lbs.
1 6 0

2 9 . W A G E S B a s e f o r i n d e x n u m b e r s , 1 9 5 3 a
1 6 1
P R I C E A N D W A G E S
1954 1955 1956 1957 1958 19591 9 5 9 1 9 6 0
III IV I II III O c t N o v
CEYLONIn d ex of w a g e s
T e a a n d r u b b e r e s t a t e w o r k e r s b 102 106 107 108 110 110 110 110 110 109 107 108 109G o v e rn m e n t w o r k e r s (C olom bo)c 100 104 106 109 125 125 125 125 125 125 125 125 125
CHINA (T a iw an )In d ex of e a r n in g s d
M i n i n g ..................................................... 105 131 174 227 243 246 248 254 262 270 267M a n u f a c t u r i n g .............................. 111 125 141 155 165 177 172 183 200 203 209
INDIAW a g e s o r e a r n i n g s (rupees)
C otton m illse (B o m b ay , m o n th ly ) 95.4 94.8 98.8 104.2 111.6 116.4 118.3 120.4 119.2 118.8 119.7 118.6C o a l m in e s f ( Ja h r ia , w eek ly ) . 14.2 14.2 17.4 20.5 22.0 22.8 22.6 23.1 23.1 23.7 23.6 24.0
JAPANIn d ex of e a r n i n g s g
101 108 118 137 140 145 159 166 132 141 168 136 139M a n u f a c t u r i n g .............................. 105 109 120 124 127 138 139 171 120 141 152 126 132
D a ily m o n e y w a g e s of a g r i c u l tu r a l la b o u r , m a le (yen) . . . . 285 301 308 323 337 348 353 361 328 384 382
KOREA, R e p u b lic ofW a g e s h (thousand hw an)
M i n i n g .....................................................M a n u f a c t u r i n g ...............................
26.7 27.8 32.7 32.6 34.6 34.1 34.0 36.6 40.4 38.520.3 21.7 23.4 23.3 23.8 24.5 25.5 26.9 27.4 25.8
PHILIPPINES In d ex of w a g e s 1 (M an ila )
Sk illed ............................................. 101 101 101 101 104 106 106 107 106 106 106U n s k i l l e d ............................................. 99 102 103 102 103 103 103 103 103 104 104
a. Original base: Ceylon, 1939; China (Taiwan), June 1949; Japan, 1955; Philip- pines, 1955.
b. Daily rates of minimum wages (basic wages plus special allowance).c. Monthly wage rates for unskilled male workers in government employment.d. Daily average of wages and allowances including payment in kind.e. Monthly minimum basic wages plus dearness allowance.f. Average weekly earnings (basic wages plus dearness allowance and other pay-
ments) of underground miners and loaders in coal mines.
g. Average monthly cash earnings per regular worKer.h. Total monthly average earnings of production workers based on the payroll
reports collected from representative sample establishments throughout the country engaged in mining and manufacturing (excluding tobacco and salt manufacturing).
i. Daily average wage rates of all classes of workers.
3 0 . I N D E X N U M B E R S O F C O S T O F L I V I N G 1 9 5 3 = 1 0 0 a
1954 1955 1956 1957 1958 195919 5 9 1960
III IV I II III O c t N o v
A . A l l i t e m s
BURMA: R a n g o o n .............................. 95 99 106 112 108 96 97 100 101 111 111CAMBODIA: P h n o m -P e n h 108 121 127 127 135 141 143 147 148 147 153 155 156CEYLON: C o l o m b o .............................. 100 99 99 101 103 104 103 104 104 101 100 102 103CHINA: T a i p e i ...................................... 102 112 123 133 134|| 146 152 153 157 170 181 183 183FED. O F M A L A Y A b .............................. 94 91 92 96 95 92 91 91 || 92 91 91 91 91H O N G K O N G ............................................. 98 95 97 98 96 104 108 100 102 100 99 100 97INDIAC (interim i n d e x ) .............................. 95 91 99 105 109 114 117 118 115 116 99 118 118INDONESIA: D ja k a r t a d . . . . | |100 106 102 119 136I R A N ............................................................ 118 122 130 139 138 152 150 155 159 163 164 166 168JA PAN ( u r b a n ) ............................................. 106 105 106 109 108 110 110 111 112 113 115 116 114KOREA: S e o u l ...................................... 137 | |231 284 350 339 353 356 363 368 388 391 386 377LAOS: V i e n t i a n e ...................................... 123 125 141 174 187 199 199 187 191 191PAKISTANc K a r a c h i . . . . 98 94 97 106 110 106 108 112 114 114 114 114 113
N a r a y a n g a n j . 84 85 99 104 110 109 112 112 111 114 114 114 113PHILIPPINES: M a n i la . . . . 99 98 100 102 105 104 105 107 105 106 111 114 113S I N G A P O R E ............................................. 93 91 92 94 92 92 91 92 92 92 91 91 91THAILAND: B a n g k o k . . . . 100 105 111 118 125 119 118 114 116 114 121 123 117VIET-NAM: S a i g o n .............................. 113 124 139 133 130 133 134 131 130 128 133 132 136
B . F o o d
BURMA: R a n g o o n .............................. 94 97 104 115 110 95 97 101 102 115 118CAMBODIA: P h n o m -P e n h 103 119 130 129 141 143 146 146 145 143 147 149 151CEYLON: C o l o m b o .............................. 100 99 97 99 100 99 98 100 99 95 92 94 96CHINA: T a i p e i ...................................... 102 108 126 137 138|| 154 166 163 169 188 202 205 201FED. O F M A L A Y A .............................. 90 87 88 93 91 88 88 88 89 87 91 98 98H O N G K O N G ............................................. 95 90 95 95 93 106 111 98 102 98 96 98 94INDIA (in terim i n d e x ) .............................. 93 84 96 103 108 115 118 118 114 114 118 116 116INDONESIA: D ja k a r t a d . . . . 106 141 161 177 258 ||100 104 98 110 124I R A N ............................................................ 114 114 121 126 120 135 132 137 143 146 147 149 151JAPAN (u r b a n ) ............................................. 108 105 105 108 106 107 108 108 108 110 114 114 110KOREA: S e o u l ...................................... 116 || 206 282 339 310 308 316 314 326 363 375 360 337LAOS: V i e n t i a n e ...................................... 122 118 122 157 176 189 189 172 174 175PAKISTAN: K a r a c h i .............................. 98 95 100 113 117 113 116 119 122 121 122 123 123
N a r a y a n g a n j 79 80 97 102 105 105 108 110 109 111 112 111 111PHILIPPINES: M a n i la . . . . 99 98 101 105 111 107 107 111 106 109 115 124 123S I N G A P O R E ............................................. 91 88 89 91 87 86 84 88 87 85 84 83 84THAILAND: B a n g k o k . . . . 98 103 108 117 126 116 116 110 113 111 121 123 115VIET-NAM: S a i g o n .............................. 107 121 140 129 125 124 126 121 120 115 123 119 125
1949; Indonesia, July 1938 prior to 1959, 1959 for subsequent years; Japan, 1951 for period prior to 1955, 1955 for subsequent years; Republic of Korea, 1955; Laos, Dec 1948; Federation of Malaya, Jan 1949 prior to 1960, 1959 since 1960; Pakistan, Apr 1948/Mar 1949; Philippines, 1955; Singapore, 1939; Thailand Apr 1938/Mar 1939; Republic of Viet-Nam, 1949.
b. Excluding house rent prior to 1960.c. Excluding house rent.d. Beginning 1959, base 1959 = 100.
GENERAL NOTES: All figures refer to working class expenditures except for the following countries: Burma, low and middle income group of households; China (Taiwan), public servants prior to 1959, beginning 1959, major city consumers’ prices; Hong Kong, clerical and technical workers; Indonesia, ployees; Japan, urban population; Republic of Korea, salaried workers and wage earners; Laos, middle class; Singapore, low income clerks and labourers; Thai-land, low salaried workers and civil servants.
a. Original base: Burma, 1958; Cambodia, 1949; Ceylon, 1952; China: Taiwan, Jan-Jun 1937 prior to 1959, 1956 since 1959; Hong Kong, Mar 1947; India,

1 6 2
C U R R E N C Y A N D B A N K I N G 3 1 . C U R R E N C Y A N D B A N K I N GE n d o f p e r i o d
1959 1 9 6 0
1 9 5 4 19 5 5 19 5 6 195 7 1958 1959III IV I II III O c t N o v
B U R M A (m il l io n k y a ts )M o n e y s u p p l y ................................. 8 4 2 1 ,116 1 ,343 1 ,106 1 ,311 1 ,485 1 ,566 1 ,485 1,599 1 ,560 1 ,503 1 ,486 1 ,465
C u r r e n c y : n e t a c t i v e . 5 67 7 2 5 83 0 7 4 6 8 5 3 1 ,021 1 ,070 1,021 1 ,156 1 ,089 1,0 10 9 9 6 986D e p o s i t m o n e y . . . . 2 7 5 391 51 3 3 60 4 5 8 4 6 4 4 9 6 4 6 4 4 4 3 471 49 3 49 0 479
P r i v a t e t i m e d e p o s i t s ( C o m m e r c i a l164 158b a n k s ) .................................................. 77 122 103 100 118 21 2 130 2 12 156 144 162
G o v e r n m e n t d e p o s i t s 2 97 24 8 24 8 2 8 2 28 1 2 6 2 336 2 62 306 3 0 3 292 268 263U n i o n B a n k of B u r m a 183 130 117 77 50 4 8 5 5 48 53 40 45 34 31C o m m e r c i a l B a n k a 114 118 131 2 0 5 231 2 1 4 281 21 4 25 3 2 6 3 24 7 2 3 4 232
B a n k c l e a r i n g s ................................. 199 2 4 6 29 3 31 7 2 7 0 289 32 3 30 2 329 386 347 286 299F o r e i g n a s s e t s ................................. 64 3 5 4 0 6 5 2 4 4 6 5 7 6 6 4 2 691 64 2 59 9 729 66 5 6 7 5 675
U n i o n B a n k of B u r m a 5 5 5 4 1 5 5 3 5 3 8 2 49 0 56 8 60 8 5 68 5 1 3 6 4 5 58 3 600 60 3C o m m e r c i a l b a n k s 88 124 117 64 86 74 83 74 86 84 82 75 72
C l a i m s o n p r i v a t e s e c t o r359 355 365 358( c o m m e r c i a l b a n k s ) . 21 2 21 6 2 5 0 3 43 270 3 0 5 26 5 30 5 39 6
C l a i m s o n g o v e r n m e n t . 5 4 3 941 1 ,020 1 ,002 1 ,185 1 ,375 1 ,399 1 ,375 1 ,426 1 ,238 1 ,260 1 ,285 1,191U n i o n B a n k of B u r m a b . 388 65 2 6 6 2 7 6 2 71 0 7 9 7 7 7 3 79 7 90 8 7 2 3 709 7 27 662C o m m e r c i a l b a n k s 155 289 3 58 240 4 7 5 5 7 8 62 6 57 8 51 8 5 1 5 551 5 5 8 5 33
R a t e s o f i n t e r e s t (% p e r a n n u m )1.35 1.75 1.75C a l l m o n e y r a t e . . . . 0 .98 1.27 0 .94 1 .42 1.60 1.08 1.00 1.33 1.50 1.50
Y ie ld o f l o n g t e r m g o v ' t b o n d s c 3 .00 3 .00 3 .00 3 .00 3 .0 0 3 .00 3 .00 3 .00 3 .00 3 .00 3 .00 3.00 3 .00E x c h a n g e r a t e ( s e l l in g ) . 4 .8 0 8 4 .7 7 8 4 .8 0 8 4 .7 7 5 4 .7 8 5 4 .7 9 0 4 .7 8 0 4 .7 9 0 4 .7 7 5 4 ,7 7 5 4 ,7 6 5 4 ,7 6 0 4 ,768
C A M B O D IA (m il l io n riels)M o n e y s u p p l y
C u r r e n c y : i n c i r c u l a t i o n . 99 9 1 ,058 1 ,355 1 ,472 1 ,799 1 ,775 1 ,799 2 ,1 0 0 1 ,985 2 ,1 0 3 2 ,0 3 4 2 ,017
D e m a n d d e p o s i t s i n c o m m e r c i a l1 ,280 1 ,444 1 ,562 1 ,490b a n k s ......................................... 1 ,035 1 ,104 6 9 3 88 5 1 ,143 1 ,063 1 ,143
P r i v a t e t im e d e p o s i t s 37 15 84 76 159 159 159 22 9 25 4 2 77 279651B a n k c l e a r i n g s ................................. 27 3 4 4 6 4 1 2 481 5 2 0 5 7 0 6 1 3 62 6 68 4 686 73 8 719
F o r e i g n a s s e t s ................................. 1 ,968 2 ,559 2 ,911 3 ,4 4 2 3 ,5 0 5 3 ,7 1 8 3 ,7 0 5 3 ,951 3 ,7 8 0 3 ,9 2 0 3 ,8 4 3B a n q u e N a t i o n a l e d u C a m b o d g e 1 ,751 2 ,4 5 4 2 ,7 5 6 3 ,3 6 6 3 ,5 6 6 3 ,5 5 2 3 ,5 6 6 3 ,7 6 5 3 ,6 3 6 3 ,748 3 ,670 3 ,706C o m m e r c i a l b a n k s 21 7 105 155 76 139 165 139 185 144 168 172
C l a i m s o n p r i v a t e s e c t o r . 329 5 6 3 81 2 7 7 6 1 ,147 9 66 1 ,147 1 ,264 1 ,421 1 ,648 1 ,629C l a i m s o n g o v e r n m e n t b y B a n q u e
1 ,014 1 ,014 1 ,014 1 ,014 1,014N a t i o n a l e d u C a m b o d g e 1 ,014 1 ,014 1 ,014 1 ,014 1 ,114 1 ,014 1 ,014C E Y L O N (m il l io n rupees)
1 ,186 1,161 1 ,172 1 ,203 1,212 Money supply 94 7 1 ,062 1 ,118 1 ,032 1 ,067 1 ,169 1,120 1 ,169C u r r e n c y : n e t a c t i v e . 34 2 38 4 4 0 1 4 3 5 5 3 0 5 6 5 550 5 6 5 5 7 8 59 4 58 0 5 92 595
D e p o s i t m o n e y . . . . 60 5 67 7 7 17 59 7 5 3 7 6 0 4 56 9 60 4 60 8 56 7 59 3 611 617
P r i v a t e t im e d e p o s i t s 41 8 45 0 5 10 5 5 8 6 1 7 6 8 7 6 5 3 6 8 7 68 5 72 5 7 43 749 761
G o v e r n m e n t d e p o s i t s 69 116 176 128 164 100 108 100 102 66 87 87 57
C e n t r a l B a n k of C e y l o n . 16 42 67 12 28 18 21 18 14 12 12 8 8
C o m m e r c i a l b a n k s 53 74 109 116 136 81 87 81 8 8 53 75 79 49
B a n k c l e a r i n g s ................................. 6 8 4 75 8 7 3 5 7 30 661 7 1 4 72 2 7 4 4 72 6 731 761 7 5 0 742
B a n k d e b i t s d ......................................... 1 ,107 1 ,060 1 ,063 1,111 97 0 1 ,050 1 ,056 1,022 1 ,116 1 ,084 1 ,122 1 ,125 9 92
F o r e i g n a s s e t s (net) . . . . 638 85 7 878 669 5 8 0 389 4 6 4 38 7 39 3 32 2 2 6 7 2 80 245
C e n t r a l B a n k o f C e y l o n . 5 2 4 65 5 7 3 6 5 79 49 2 3 1 5 388 3 1 5 30 2 2 5 0 169 172 142
C o m m e r c i a l b a n k s 113 200 143 90 88 75 77 75 93 72 99 107 102
C l a i m s o n t h e p r i v a t e s e c t o r ( c o m m e r c i a l b a n k s ) 24 7 25 6 3 44 399 4 3 6 4 5 8 4 6 2 4 58 48 6 4 9 3 501 4 93 48 7
C l a i m s o n g o v e r n m e n t . C e n t r a l B a n k o f C e y l o n .
6 1 727
59 618
6 7 211
7 5088
90 6261
1,1815 1 4
1 ,0604 0 5
1 ,1815 1 4
1 ,169501
1 ,2285 8 4
1 ,32767 8
1 ,3646 97
1 ,387703
O t h e r b a n k s ................................. 59 0 57 8 661 6 65 64 5 6 6 7 65 5 6 67 668 6 4 4 649 6 6 7 68 4
R a t e s o f i n t e r e s t ( % p e r a n n u m )1.50 1.50 1.75 2 .25 2.00 2.00C a l l m o n e y r a t e . . . . 0 .5 0 0 .50 0 .50 1.08 1.25 1.42 1.50
T r e a s u r y b i l l r a t e . . . . 1.59 0 .79 0.68 0.88 1 .54 1.93 2 .00 2 .01 2 .23 2 .44 2 .48 2 .60 2.60
Y ie ld o f l o n g t e r m g o v ’t b o n d s e 3 .79 3 .13 3 .04 2 .99 2.91 2 .76 2 .7 4 2 .70 2 .65 2 .61 2 .87 3 .48 3.49
E x c h a n g e r a t e ( s e l l in g ) 4 .7 9 5 4 .7 7 2 4 .8 0 0 4 .7 6 5 4 .7 5 5 4 .7 5 3 4 .7 5 0 4 .7 5 7 4 .7 5 2 4 .7 6 5 4 .7 6 0 4 .7 5 5 4 .7 5 4
C H IN A : T a i w a n : (m i l l io n n e w T a iw a n d o lla r s )5 ,981 5 ,8 9 2 5 ,9 2 7 6 ,0 1 4 5 ,909 6 ,007M o n e y s u p p l y .................................
C u r r e n c y : n e t a c t i v e .2 ,1 0 3 2 ,6 3 6 3 ,261 3 ,9 3 8 5 ,2 3 8 5 ,981 5 ,3 7 71 ,340 1 ,604 1 ,883 2 ,2 2 8 2 ,9 2 7 3 ,2 7 7 2 ,9 1 4 3 ,2 7 7 3 ,0 6 0 3 ,1 2 7 3 ,1 1 3 3 ,0 4 3 3 ,0 4 7
D e p o s i t m o n e y . . . . P r i v a t e t im e d e p o s i t s
7 63 1 ,032 1 ,378 1 ,710 2 ,3 1 0 2 ,7 0 4 2 ,4 6 3 2 ,7 0 4 2 ,8 3 2 2 ,800 2 ,901 2,866 2 ,9608 8 7 1 ,0 10 1 ,049 1 ,473 2 ,6 8 7 3 ,4 7 6 3 ,2 7 9 3 ,4 7 6 3 ,6 8 3 3 ,9 1 0 4 ,3 1 6 4 ,4 4 7 4 ,5 4 3
G o v e r n m e n t d e p o s i t s 8 10 99 8 1 ,295 1 ,606 1 ,738 1 ,955 2 ,061 1 ,955 2 ,1 4 3 2 ,298 2 ,3 0 5 2 ,321 2 ,317
B a n k of T a i w a n . . . . 7 4 3 8 26 1 ,167 1 ,441 1 ,551 1 ,727 1 ,837 1 ,727 1 ,885 2 ,0 7 0 2 ,0 4 2 2 ,081 2 ,104
O t h e r b a n k s ................................. 67 172 128 164 188 22 8 22 4 22 8 25 7 22 6 26 3 241 20 7
C o u n t e r p a r t f u n d s . . . . 631 1 ,405 1 ,485 1 ,6 5 1 r 1 ,5 5 3 r 1 ,8 3 5 r 2 ,2 4 5 r 1 ,8 3 5 r 1, 5 8 7 r 1 ,809 2 ,1 2 2 2 ,1 8 6 2,431
B a n k c l e a r i n g s ................................. 1 ,720 2 ,8 8 7 3 ,8 5 7 5 ,1 2 1 5 ,4 1 0 6 ,8 9 2 6 ,8 1 3 7 ,9 8 9 7 ,9 9 3 8 ,7 9 7 8 ,7 9 4 8 ,5 7 2 9 ,006
F o r e i g n a s s e t s (net)B a n k of T a i w a n . . . . 134 5 0 4 52 8 6 4 9 1 ,708 1 ,524 1 ,439 1 ,524 1 ,691 1 ,992 2 ,1 0 3 2 ,1 6 9 2 ,180
C l a i m s o n p r i v a t e s e c t o r f,r B a n k of T a i w a n . . . .
1 ,207 1 ,960 2 ,1 9 8 3 ,0 4 3 4 ,1 2 2 5 ,6 8 4 5 ,6 4 3 5 ,6 8 4 6 ,02 1 6 ,3 3 7 6 ,4 7 3 6 ,5 0 3 6 ,662
167 4 0 2 4 7 0 731 1 ,023 1 ,091 1 ,227 1,091 1 ,016 1,201 1 ,128 1 ,135 1 ,136 Other banks 1, 116 1 ,646 1 ,816 2 ,4 0 0 3 ,391 4 ,5 9 3 4 ,4 1 6 4 ,5 9 3 5 ,0 0 5 5 ,1 3 6 5 ,3 4 5 5 ,3 6 7 5 ,526
C l a i m s o n g o v e r n m e n t g .B a n k of T a i w a n . . . .
1 ,4771 ,445
1 ,6871 ,652
2 ,0 2 01 ,974
2 ,3612 ,311
2 ,3 7 42 ,2 8 6
2 ,6 0 43 ,2 9 3
2 ,4 5 92 ,1 9 5
2 ,6 0 42 ,2 9 3
2 ,6 9 02 ,3 8 2
2 ,7212 ,3 9 4
2 ,9 2 42 ,6 1 3
2 ,9 3 52 ,6 3 2
3 ,0662 ,7 7 7
O t h e r b a n k s ................................. 32 35 46 50 88 311 2 6 5 311 3 08 3 26 311 3 0 3 289
C l a i m s o n o f f ic i a l e n t i t i e s f,r 1 ,672 2 ,0 4 6 2 ,5 6 3 2 ,9 0 5 3 ,3 5 0 3 ,7 0 7 3 ,731 3 ,7 0 7 3 ,5 9 9 3 ,5 7 9 3 ,866 4 ,0 2 4 4 ,1 8 7
B a n k o f T a i w a n . . . . 1 ,582 1 ,948 2 ,4 7 3 2 ,8 2 7 3 ,2 4 8 3 ,6 0 8 3 ,5 9 4 3 ,6 0 8 3 ,4 3 3 3 ,4 2 6 3 ,661 3 ,731 3 ,862
C o m m e r c i a l b a n k s 90 98 9 0 78 102 99 137 99 166 153 20 5 2 9 3 325

163
31. CURRENCY AND BANKING ( C o n t’d ) CURRENCY A ND BANKINGEnd o f period
1954 1955 1956 19571 9 5 9 1 9 6 0
1958 1 9 5 9
III IV I II III O c t N o v
CHINA: T a iw a n : (m illion new Taiwan dollars) (C o n t’d )E x c h a n g e r a t e
Buy ing :S u g a r , R ice E x p o rts 15.55 20.35 20.35 20.35 36.08O th e r E x p o rts :
15.55 20.35 26.35 )G o v e r n m e n t .............................. 26.35 37.58 39.70 39.75 39.70 40.02 40.00 40.00 40.00 40.03P r i v a t e ...................................... 15.55 26.35 26.35
N o n - T r a d e ...................................... 15.55 21.95-29.05
24.6829.05
24.6829.05
36.08 37.58
Selling :G o v e rn m e n t Im p o rts 18.78 24.78 24.78 24.78 36.38 36.38 36.38 36.38 36.38 36.38
40.00 40.00 40.03O th e r I m p o r t s .............................. 18.78 32.28 32.28 32.28 37.78
40.02 40.00N o n - T r a d e ......................................
15 .65 18.78 24.78 24.78 24.78 36.38
37.7839.70 39.75 39.70
FEDERATION O F M A L A Y Aa n d S IN G A P O R E (million Malayan dollars)
1,4911,042
449510
1,865
1,4921,058
434545
2,030
1,5081,077
431553
1,928
1,5021,082
420566
1,874
M o n e y s u p p l y ......................................C u r re n c y : n e t a c t i v e . . . . D ep o s it m o n e y ..............................Time depositsBank debitsh Δ
1,068711357243
1,267861406338
1,438
1,268892376320
1,600
1,230889341305
1.679
1,237895345355
1,628
1,4301,016
414462
1,762
1,356963393434
1,724
1,4301,016
414462
1,862
1,4921,034
458483
1,939F o re ig n a s s e t s ......................................
C u r r e n c y B o a r d ..............................O th e r b a n k s ( n e t ) ..............................
1,291 1,542 1,468 1,375 1,460 1,749 1,657 1,749 1,789 1,823 1,807 1,801 1,823892 965 992 1,004 1,082 1,379 1,290 1,379 1,418 1,431 1,426 1,429 1,450399 577 476 371 378 370 363 370 371 392 381 372 373
C la im s o n p r iv a t e s e c to r .C la im s o n g o v e r n m e n t . . . . E x c h a n g e r a t e (par rate)
16299
3.06
19495
3.06
25298
3.06
279104
3.06
295113
3.06
372140
3.06
338143
3.05
372140
3.06
458147
3.05
455158
3.05
491163
3.05
494167
3.04
482168
3.05
H O N G K O N G (million H K dollars)M o n e y s u p p l y ......................................
C u r r e n c y n o te s : in c i r c u la t io n . 728 727 732 755 772 838 806 838 885 900 902 910 912
B an k c l e a r i n g s ..............................Δ 1,140 1,160 1,276 1,412 1,309 1,480 1,501 1,788 1,903 1,856 1,870 1,957 2,085
INDIA (thousand million rupees)27.0218.69
8.3314.97
26.3118.208.11
14.71
26.6118.23
8.3714.38
25.7618.437.33
14.71
M o n e y s u p p l y ......................................C u r re n c y : n e t a c t iv e . . . .D ep o s it m o n e y ..............................
P r iv a te t im e d e p o s i ts . . . .
18.3212.25
6.085.26
20.4713.86
6.616.13
21.7914.85
6.936.98
22.7615.27
7.498.93
23.5016.06
7.4311.40
25.2117.53
7.6713.98
24.3316.63
7.6813.73
25.2117.537.67
13.98
27.0318.61
8.3914.26
G o v e rn m e n t d e p o s i ts(R ese rv e B a n k of In d ia ) .
B a n k c l e a r i n g s ..............................Δ0.775.58
0.706.52
0.737.03
0.727.41
0.797.96
0.908.99
0.838.85
0.909.39
1.099.85
0.8710.06
0.869.74
0.9410.42
0.8210.78
F o re ig n a s s e t s (R e se rv e B a n k ofI n d i a ) .....................................................
C la im s o n p r iv a t e se c to r .C o m m e rc ia l b a n k s . . . . C o o p e ra t iv e b a n k s . . . .
C la im s o n g o v e r n m e n t . . . . R e s e rv e B a n k of I n d iaO th e r b a n k s ......................................T re a s u ry c u r r e n c y . . . .
7.716.165.950.21
12.116.044.981.09
7.757.046.780.26
14.057.135.741.18
6.48 8.848.48 0.36
16.939.825.961.15
4.1510.16
9.610.55
21.8814.13
6.631.12
3.0710.39
9.650.74
26.3316.35
8.841.14
3.3111.6410.57
1.0729.1517.3510.58
1.21
2.9911.3210.27
1.0528.4216.8210.45
1.16
3.3111.6410.57
1.0729.1517.3710.58
1.21
3.1513.1012.04
1.0630.04 18.74
9.991.31
2.7513.4212.22
1.2030.7019.0910.24
1.34
2.5713.4512.12
1.3329.8218.3110.22
1.29
2.6013.2911.93
1.3629.8718.66
9.901.31
2.5813.3311.98
1.3529.9218.74
9.881.30
R a te s of in te r e s t (% per annum) C a ll m o n e y r a t e . . . . Δ Y ie ld of lo n g - te rm g o v 't b o n d s i Δ
E x c h a n g e r a t e (se lling)
2.453.65
4.808
2.593.72
4.778
3.213.92
4.805
3.714.13
4.770
2.964.17
4.780
2.744.05
4.783
2.014.05
4.778
2.254.04
4.783
3.564.06
4.768
3.614.09
4.770
3.514.06
4.763
4.114.07
4.758
4.204.04
4.765
INDONESIA (thousand m illion rupiah)34.8926.38
8.500.18
14.7512.43
39.0630.09
8.960.19
18.2315.82
42.6431.5411.10
0.2018.3616.06
43.3431.9111.44
M o n e y s u p p l y ......................................C u r re n c y : n e t a c t iv e . . . .
D ep o s it m o n e y ..............................P r iv a te t im e d e p o s i ts . . . .F o re ig n a s s e t s ( n e t ) ..............................
B a n k I n d o n e s i a ..............................
11.127.473.640.271.731.15
12.238.653.590.332.771.95
13.399.374.020.291.680.90
18.9114.09
4.820.291.260.58
29.3719.87
9.490.342.482.15
34.8926.38
8.500.18
14.7512.43
24.7620.21
4.550.182.672.21
G ro ss fo re ig n a s s e t s . F o re ig n l ia b i l i t ie s j . . . .
O th e r b a n k s ......................................
2.891.740.58
3.501.550.79
2.901.990.76
2.551.970.68
2.480.330.33
13.501.072.32
2.530.320.46||
13.501.072.32
16.971.152.41
16.630.572.24
C la im s o n p r iv a t e s e c to r .B a n k I n d o n e s i a ..............................
2.830.46
4.020.86
4.930.86
4.470.77
6.561.77
13.082.46
8.902.33
13.082.46
17.002.96
18.563.63
Other banks 2.37 3.16 4.07 3.73 4.79 10.62 6.57 10.62 14.04 14.94
C la im s o n g o v e r n m e n t . . . . B a n k I n d o n e s i a ..............................
9.268.61
9.308.50
14.6912.30
20.7719.15
30.6028.46
34.3632.06
31.4429.09
34.3632.06
30.1227.73
32.5830.00 28.94 28.94 31.31
Other banks 0.02 0.02 1.53 0.67 1.03 0.90 1.07 0.90 0.86 1.04
T re a s u r y c u r r e n c y . . . . 0.63 0.78 0.86 0.95 1.11 1.40 1.27 1.40 1.53 1.54
E x c h a n g e r a te :P r in c ip a l e x p o r t r a t e . . . . 11.36 11.36 11.36- 22.7 30.3 36.0 36.0 36.0 36.0 36.0 45.0 45.0 45.0
P r in c ip a l im p o rt r a t e . . . . 11.44 11.48-22.95
13.5711.48-22.95
28.4-42.6
37.9-56.8
45 .0-67.5
45 .0-67.5
45 .0-67.5
45.0-67.5
45.0-67.5
45 .0-72.0
45 .0-72.0
45.0-72.0
O th e r im p o rt r a t e . . . . 15.26-22.89
34.42-57.38
28.68-57.38
56 .8-78.1
75.8-104.2
90.0- 135.0
90.0-135.0
90.0-135.0
9 0 .0-135.0
90.0- 135.0 200.0 200.0 200.0
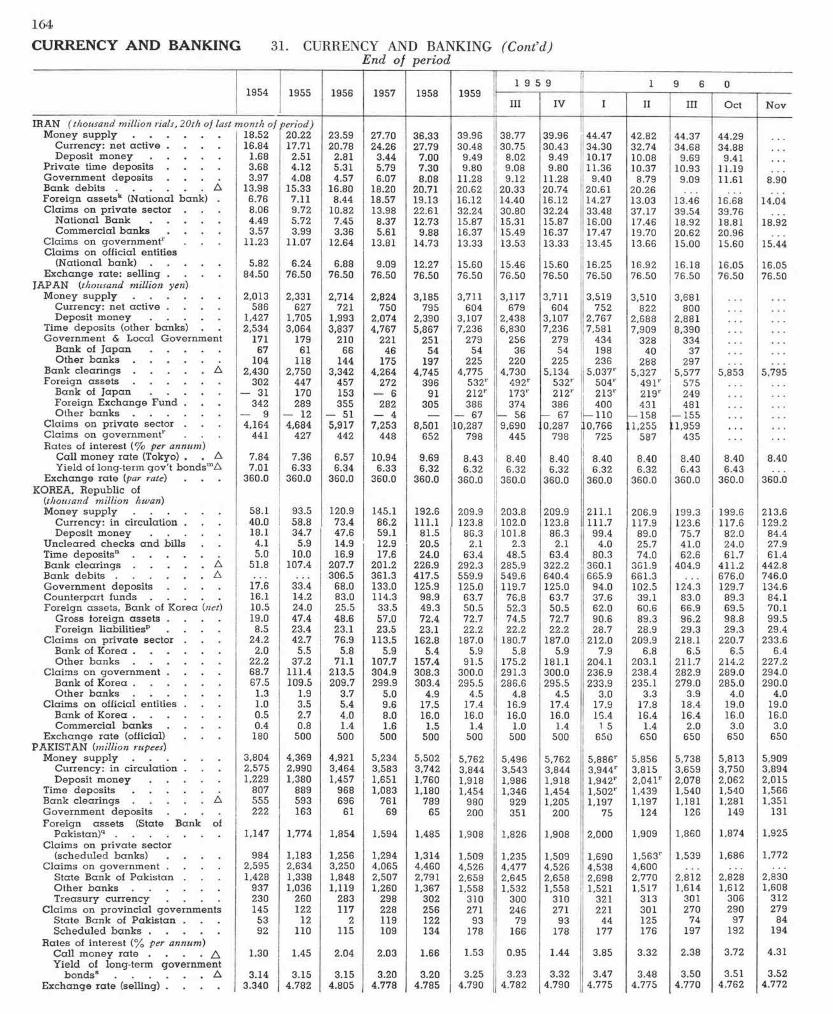
164
CURRENCY AND BANKING 31. CURRENCY AND BANKING (Cont’d)End of period
1954 1955 1956 1957 1958 19591 9 5 9 19 60
III IV I II III Oct Nov
IRAN ( thousand million rials, 20th of last M oney s u p p l y ...................................
m onth of 18.52
period ) 2 0 . 2 2 23.59 27.70 36.33 39.96 38.77 39.96 44.47 42.82 44.37 44.29
C urrency : ne t ac tive . 16.84 17.71 20.78 24.26 27.79 30.48 30.75 30.43 34.30 32.74 34.68 34.88Deposit m o n ey . . . . 1.68 2.51 2.81 3.44 7.00 9.49 8.02 9.49 10.17 10.08 9.69 9.41
P riv a te tim e deposits 3.68 4.12 5.31 5.79 7.30 9.80 9.08 9.80 11.36 10.37 10.93 11.19G overnm ent deposits 3.97 4.08 4.57 6.07 8.08 11.28 9.12 11.28 9.40 8.79 9.09 11.61 8.90B ank d e b i t s ................................... 13.98 15.33 16.80 18.20 20.71 20.62 20.33 20.74 20.61 20.26Foreign a sse tsk (N ational bank) 6.76 7.11 8.44 18.57 19.13 16.12 14.40 16.12 14.27 13.03 13.46 16.68 14.04C laim s on p r iv a te sector 8.06 9.72 10.82 13.98 22.61 32.24 30.80 32.24 33.48 37.17 39.54 39.76
N atio n a l Bank . . . . 4.49 5.72 7.45 8.37 12.73 15.87 15.31 15.87 16.00 17.46 18.92 18.81 18.92C om m ercial b an k s 3.57 3.99 3.36 5.61 9.88 16.37 15.49 16.37 17.47 19.70 20.62 20.96
C laim s on g overnm en tr 11.23 11.07 12.64 13.81 14.73 13.33 13.53 13.33 13.45 13.66 15.00 15.60 15.44C laim s on official entities
(National bank) . . . . 5.82 6.24 6.88 9.09 12.27 15.60 15.46 15.60 16.25 16.92 16.18 16.05 16.05E xchange ra te : se lling . 84.50 76.50 76.50 76.50 76.50 76.50 76.50 76.50 76.50 76.50 76.50 76.50 76.50
JAPAN (thousand million yen) M oney s u p p l y ............................ 2,013 2,331 2,714 2,824 3,185 3,711 3,117 3,711 3,519 3,510 3.681
C urrency : ne t active . 586 627 721 750 795 604 679 604 752 822 800Deposit m o n ey . . . . 1,427 1,705 1,993 2,074 2,390 3,107 2,438 3,107 2,767 2,688 2,881
Time deposits (other banks) 2,534 3,064 3,837 4,767 5,867 7,236 6,830 7,236 7,581 7,909 8,390G overnm ent & Local G overnm ent 171 179 210 221 251 279 256 279 434 328 334
B ank of J a p a n . . . . 67 61 66 46 54 54 36 54 198 40 37O ther b a n k s ............................ 104 118 144 175 197 225 220 225 236 288 297
B ank c l e a r i n g s ............................ 2,430 2,750 3,342 4,264 4,745 4,775 4,730 5,134 5,037r 5,327 5,577 5,853 5,795Foreign a s s e t s ............................ 302 447 457 272 396 532r 492r 532r 504r 491r 575
B ank of J a p a n . . . . — 31 170 153 — 6 91 212r 173r 212r 213r 219r 249Foreign E xchange Fund . 342 289 355 282 305 386 374 386 400 431 481
Other banks — 12 — 51 — 4 — — 67 — 56 - 67 -110 — 158 — 155C laim s on p r iv a te sector . 4,164 4,684 5,917 7,253 8,501 10,287 9,690 0,287 10,766 11,255 11,959C laim s on g overnm en tr 441 427 442 448 652 798 445 798 725 587 435R ates of in terest (% per annum)
C all m o n ey ra te (Tokyo) . 7.84 7.36 6.57 10.94 9.69 8.43 8.40 8.40 8.40 8.40 8.40 8.40 8.40Yield of long-term g ov 't bo n d sm 7.01 6.33 6.34 6.33 6.32 6.32 6.32 6.32 6.32 6.32 6.43 6.43
E xchange ra te (par rate) . 360.0 360.0 360.0 360.0 360.0 360.0 360.0 360.0 360.0 360.0 360.0 360.0 360.0KOREA, R epublic of
(thousand million hwan)M oney s u p p l y ............................ 58.1 93.5 120.9 145.1 192.6 209.9 203.8 209.9 211.1 206.9 199.3 199.6 213.6
C urrency: in c irculation . 40.0 58.8 73.4 86.2 111.1 123.8 102.0 123.8 111.7 117.9 123.6 117.6 129.2D eposit m oney . . . . 18.1 34.7 47.6 59.1 81.5 86.3 101.8 86.3 99.4 89.0 75.7 82.0 84.4
U n c lea red checks a n d bills 4.1 5.9 14.9 12.9 20.5 2.1 2.3 2.1 4.0 25.7 41.0 24.0 27.9Time depositsn ............................ 5.0 10.0 16.9 17.6 24.0 63.4 48.5 63.4 80.3 74.0 62.6 61.7 61.4B ank c l e a r i n g s ............................ 51.8 107.4 207.7 201.2 226.9 292.3 285.9 322.2 360.1 36 1.9 404.9 411.2 442.8Bank d e b i t s ................................... 306.5 361.3 417.5 559.9 549.6 640.4 665.9 661.3 676.0 746.0G overnm ent deposits 17.6 33.4 68.0 133.0 125.9 125.0 119.7 125.0 94.0 102.5 124.3 129.7 134.6C oun terpart funds . . . . 16.1 14.2 83.0 114.3 98.9 63.7 76.8 63.7 37.6 39.1 83.0 89.3 84.1Foreign a sse ts , Bank of Korea (net) 10.5 24.0 25.5 33.5 49.3 50.5 52.3 50.5 62.0 60.6 66.9 69.5 70.1
Gross foreign a sse ts . 19.0 47.4 48.6 57.0 72.4 72.7 74.5 72.7 90.6 89.3 96.2 98.8 99.5Foreign liabilitiesp 8.5 23.4 23.1 23.5 23.1 22.2 22.2 22.2 28.7 28.9 29.3 29.3 29.4
C laim s on p r iv a te sec tor . 24.2 42.7 76.9 113.5 162.8 187.0 180.7 187.0 212.0 209.9 218.1 220.7 233.6B ank of K o r e a ............................ 2.0 5.5 5.8 5.9 5.4 5.9 5.8 5.9 7.9 6.8 6.5 6.5 6.4O ther b a n k s ............................ 22.2 37.2 71.1 107.7 157.4 91.5 175.2 181.1 204.1 203.1 211.7 214.2 227.2
C laim s on governm en t . 68.7 111.4 213.5 304.9 308.3 300.0 291.3 300.0 236.9 238.4 282.9 289.0 294.0B ank of K o r e a ............................ 67.5 109.5 209.7 299.9 303.4 295.5 286.6 295.5 233.9 235.1 279.0 285.0 290.0O ther b a n k s ............................ 1.3 1.9 3.7 5.0 4.9 4.5 4.8 4.5 3.0 3.3 3.9 4.0 4.0
Claim s on official entities . 1.0 3.5 5.4 9.6 17.5 17.4 16.9 17.4 17.9 17.8 18.4 19.0 19.0B ank of K o r e a ............................ 0.5 2.7 4.0 8.0 16.0 16.0 16.0 16.0 16.4 16.4 16.4 16.0 16.0C om m ercial b a n k s 0.4 0.8 1.4 1.6 1.5 1.4 1.0 1.4 1 5 1.4 2.0 3.0 3.0
E x ch an g e ra te (official) 180 500 500 500 500 500 500 500 650 650 650 650 650PAKISTAN (million rupees)
M oney s u p p l y ............................ 3, 804 4,369 4,921 5,234 5,502 5,762 5,496 5,762 5,886r 5,856 5,738 5,813 5,909C urrency : in c irculation . 2,575 2,990 3,464 3,583 3,742 3,844 3,543 3,844 3,944r 3,815 3,659 3,750 3,894Deposit m o n ey . . . . 1,229 1,380 1,457 1,651 1,760 1,918 1,986 1,918 1 ,942r 2,041r 2,078 2,062 2,015
Time d e p o s i t s ............................ 807 889 968 1,083 1,180 1,454 1,346 1,454 1 ,502r 1,439 1,540 1,540 1,566Bank c l e a r i n g s ............................ 555 593 696 761 789 980 929 1,205 1,197 1,197 1,181 1,281 1,351G overnm ent deposits 222 163 61 69 65 200 351 200 75 124 126 149 131Foreign a sse ts (State Bank
Pak istan )q ...................................of
1, 147 1,774 1,854 1,594 1,485 1,908 1,826 1,908 2,000 1,909 1,860 1,874 1,925C laim s on p r iv a te sector
(scheduled banks) 984 1,183 1,256 1,294 1,314 1,509 1,235 1,509 1,690 1 ,563r 1,539 1,686 1,772C laim s on g overnm en t . 2,595 2,634 3,250 4,065 4,460 4,526 4,477 4,526 4,538 4,600
S tate Bank of P a k is tan . 1,428 1,338 1,848 2,507 2,791 2,658 2,645 2,658 2,698 2,770 2,812 2,828 2,830O th er b a n k s ............................ 937 1,036 1,119 1,260 1,367 1,558 1,532 1,553 1,521 1,517 1,614 1,612 1,608T rea su ry cu rrency 230 260 283 298 302 310 300 310 321 313 301 306 312
C laim s on p rov inc ia l governm ents 145 122 117 228 256 271 246 271 221 301 270 290 279S ta te Bank of P a k is tan . 53 12 2 119 122 93 79 93 44 125 74 97 84S c h e d u led b a n k s . . . . 92 110 115 109 134 178 166 178 177 176 197 192 194
R ates of in te rest (% per annum) C a ll m o n ey ra te . . . . 1.30 1.45 2.04 2.03 1.66 1.53 0.95 1.44 3.85 3.32 2.38 3.72 4.31Yield of long-term governm en t
b o n d ss ................................... 3.14 3.15 3.15 3.20 3.20 3 .25 3.23 3.32 3.47 3.48 3.50 3.51 3.52E x ch an g e ra te (selling) . . 3.340 4.782 4.805 4.778 4.785 4.790 4.782 4.790 4.775 4.775 4.770 4.762 4.772

1 6 5
3 1 . C U R R E N C Y A N D B A N K I N G ( C o n t ' d ) C U R R E N C Y A N D B A N K I N G E n d o f p e r i o d
1954 1955 1956 1957 1958 19591 9 5
III
9
IV I
1
II
9 6
III
0
O ct N o v
1.226 1,336 1,499 1,598 1,738 1,842 1,813 1,842 1,810 1,800 1,731 1,821 1,854676 670 718 781 818 894 822 894 875 853 888 896 903550 666 780 817 919 948 991 948 935 947 843 925 951526 586 658 803 868 1,032 976 1,032 1,029 1,035 1,087 1,112 1,124550 614 739 876 915 1,058 1,104v 1,050 1,127815 921 1,145 1,335 1,492 1,768 1,794 1,860 1,985 1,960 1,974 1,800127 185 274 166 224 278 288 278 351 390 349 385
26 52 105 54 153 207 216 207 256 297 273 306100 133 168 113 71 71 72 71 95 93 76 79545 418 450 201 182 311 319 311 316 407 437 450415 310 322 62 75 165 162 165 177 252 312 313 303130 108 128 139 107 146 157 146 139 155 125 137
935 1,106 1,254 1,513 1,588 1,779 1,703 1,779 1,810 1,806 1,872 1,884 1,898409 591 730 804 929 1,026 972 1,026 1,027 1,019 931 929160 226 268 376 462 501 494 501 506 528 537 559115 185 198 315 393 418 408 418 422 442 453 471
45 41 68 60 69 84 85 84 84 86 84 88 2.358 2.015
2.358 2 .015 2.015 2.015 2.015 2.519
2.0152.5192.015
2.5192.015
2.5192.015
2.5192.015
2.5192.015
2.5192.015
2.4182.015
6,437 7,227 7,728 8,197 8,452 9,083 8,458 9,083 9,313 9,153 9,411 9,554 9,7954,548 5,179 5,424 5,573 5,504 5,785 5,431 5,785 5,904 5,593 5,708 5,723 5,8401,888 2,048 2,304 2,624 2,948 3,298 3,027 3,298 3,410 3,560 3,702 3,832 3,955
632 776 1,192 1,469r 1,770 1,899 1,868 1,899 1,994 2,072 2,239 2,300 2,306583 516 588 639 679 880 843 880 926 928 984 983 1,039439 326 438 394 469 474 439 574 473 515 517 528 575144 190 150 245 212 407 404 407 453 413 467 455 464
2,230 2,598 2,816 3,095 3,451 3,764 3,481 3,811 4,121 3,765 3,790 3,8776,8643, 127 3,600 4,698 4,727 5,002 5,495 5,252 5,772 6,279 6,064 6,210 6,545
365 6,078 6,225 6,396 6,124 5,898 6,079 5,898 6,186 6,3214,759 5,065 5,401 5,303 5,203 5,335 5,203 5,340 5,388 5,415 5,493
67 - 80 - 31 - 4 -2 7 0 -1 1 6 - 2 7 0 -1 6 7 - 2 5 8 -3 2 2 -3 2 71,252 1,240 1,026 825 966 860 966 1,014 1,191
2,106 2,644 3,219 3,712 4,354 4,913 4,832 4,913 5,254 5,265 5,815 5,934 5,8856,070 4,616 5,165 5,641 6,058 6,589 5,993 6,589 6,606 6,272
4.48 4.482.27 2.26 2.28 2.27 2.91 2.99 2.99 2.99 2.99 2 .97r 2.9920.88 20.91 20.66 20.90 21.10 21.18 21.19 21.19 21.19 21.19 21.19 21.14 21.14
12.39 12.16 10.97 11.71 14.07 13.44 14.07 15.49 15.37 16.36 16.52 16.606.78 8.26 7.56 7.86 8.91 8.66 8.91 9.80 10.06 10.69 10.92 11.045.62 3.90 3.41 3.86 5.16 4.78 5.16 5.69 5.31 5.67 5.60 5.560.70 1.26 0.85 1.08 1.15 0.93 1.15 1.07 1.02 1.22 1.27 1.253.13 2.86 3.20 3.21 3.43 3.32 3.66 3.83 3.98 4.21 4.18 3.904.29 4.58 4.70 5.66 6.19 5.56 6.19 6.57 6.58 7.21 7.38 7.29
1.05 4.36 4.61 4.40 5.33 5.84 5.39 5.84 6.62 6.47 7.12 7.28 7.19-0 .0 6 -0 .0 4 0.30 0.33 0.35 0.17 0.35 0.25 0.12 0.09 0.10 0.10
1.62 1.81 3.22 3.01 3.67 3.62 3.67 3.99 4.15 4.35 4.18 4.1313.13 12.35 11.62 12.32 13.21 12.85 13.21 13.45 13.00 13.25 13.38 13.52
35.00 35.00 35.00 35.00 35.00 35.00 35.00 35.00 35.00 35.00 35.00 35.00 35.0073.00 73.50 73.50 73.50 73.50 73.50 73.50 73.50 73.50 73.50
GENERAL NOTE: Net active currency: Total currency outstanding less holdings in all banks including the central bank and in government treasuries. Currency in circulation: Total currency outstanding less holdings in all banks including the central bank. Deposit money: Private deposits in all banks, subject to cheque or withdrawable on demand, excluding inter bank liabilities. Govern-ment deposits: Including government currency holdings. Bank clearings: Total value of cheques and other collection items cleared through clearing houses. Claims on private sector: Claims by the banking system arising from the rendering of loans and advances, discounting of bills, the holding of securities in private companies, etc. Claims on government: Holdings of government bonds, treasury bills and government guaranteed securities by the banking system, plus circulation of treasury currency. Rates of interest: Rates prevail- ing in the capital city, except for India, where Bombay rates are used. Call money rate is inter-bank rate on money at call. Exchange rates are shown in unit of national currency per US dollar.For the detailed explanation see IMF: International Financial Statistics.
A Monthly averages or calendar months.a. Deposits of State Boards in State Commercial Bank (excluding the State
Agricultural Bank). b. Including a constant amount of 99 million kyats, which is the value of a
promissory note issued as cover for the currency issue.c. 5 year treasury bonds.d. Debits to demand deposits of private sector.
e. 3% national development loan 1965-1970 to earliest redemption date.f. Including bank’s holdings of stocks and debentures.g. Including the counterpart of post office demand deposits.h. Cheques sent out for local clearing and debits to current deposit accounts.i. Running yield of 3% consols 1986 to earliest redemption date.j. Payments agreement liabilities, mainly to Japan and the Netherlands.k. Foreign assets were revalued in May 1957. The revaluation proceeds (7 billion
rials) are held by the National Bank and are to be used for long term development.
m. Weighted yield (simple rate of interest) to latest redemption date of medium dated government bonds issued during the period stated.
n. Including deposits of local government and government institutions in com-mercial banks and non-governmental foreign currency deposits in Bank of Korea.
p. Clearing accounts with Japan.q. Including outstanding assets receivable from the Reserve Bank of India under
the partition agreements; excluding foreign assets of Banking Department.s. Yield to maturity of 3% bonds 1968.t. Total debits to checking account of private sector.u. Including a constant amount of 107 million pesos from 1952, representing the
difference between foreign assets transferred from the Treasury and its note and coin issue, for which the Bank assumed liability.
v. July.
PHILIPPINES (m illio n pesos)M o n e y s u p p l y ......................................
C u r re n c y : n e t a c t iv e . . . .D ep o s it m o n e y ...............................
P r iv a te tim e d e p o s i t s . . . .B a n k c l e a r i n g s ..............................B ank d e b i t s t ......................................G o v e rn m e n t d e p o s i t s r . . . .
C e n tr a l B a n k of th e P h i l ip p in e s P h il ip p in e N a t io n a l B a n k
F o re ig n a s s e t s (net) . . . .C e n tra l B a n k ......................................O th e r b a n k s ......................................
C la im s o n p r iv a t e s e c to r (o therb a n k s ) .....................................................
C la im s o n g o v e r n m e n t rC la im s o n o ffic ia l e n t i t ie s .
C e n tr a l B a n k of th e P h i l ip p in e s u O th e r b a n k s ......................................
E x c h a n g e r a t e (se lling ) . . . .
THAILAND (m illion baht)M o n e y s u p p l y ......................................
C u r re n c y : n e t a c t iv e . . . .D ep o s it m o n e y ..............................
Tim e d e p o s i t s ......................................G o v e rn m e n t d e p o s i t s r . . . .
B a n k of T h a i l a n d ..............................D ep o s it m o n e y b a n k s
B a n k c l e a r i n g s ..............................B an k d e b i t s .............................................F o re ig n a s s e t s ( n e t ) ..............................
B a n k of T h a i l a n d ..............................D ep o s it m o n e y b a n k sE x c h a n g e F u n d ..............................
C la im s on p r iv a t e s e c to r .C la im s o n g o v e r n m e n t . . . . T re a s u ry b ill r a t e (% per a n n u m ) E x c h a n g e r a t e (se lling ) . . . .
VIET-NAM, R e p u b l ic of ( thousand m illion piastre)M o n e y s u p p l y ......................................
C u r re n c y : n e t a c t iv e . . . .D ep o s it m o n e y ..............................
Tim e d e p o s i t s ......................................B a n k c l e a r i n g s ..............................F o re ig n a s s e t s ( n e t ) ..............................
B a n q u e N a t io n a l e d u V ie t-N a mO th e r b a n k s ......................................
C la im s o n p r iv a t e se c to r C la im s o n g o v e r n m e n t r E x c h a n g e r a te :
O ffic ia l r a t e ......................................C o n tro lled f re e r a t e . . . .
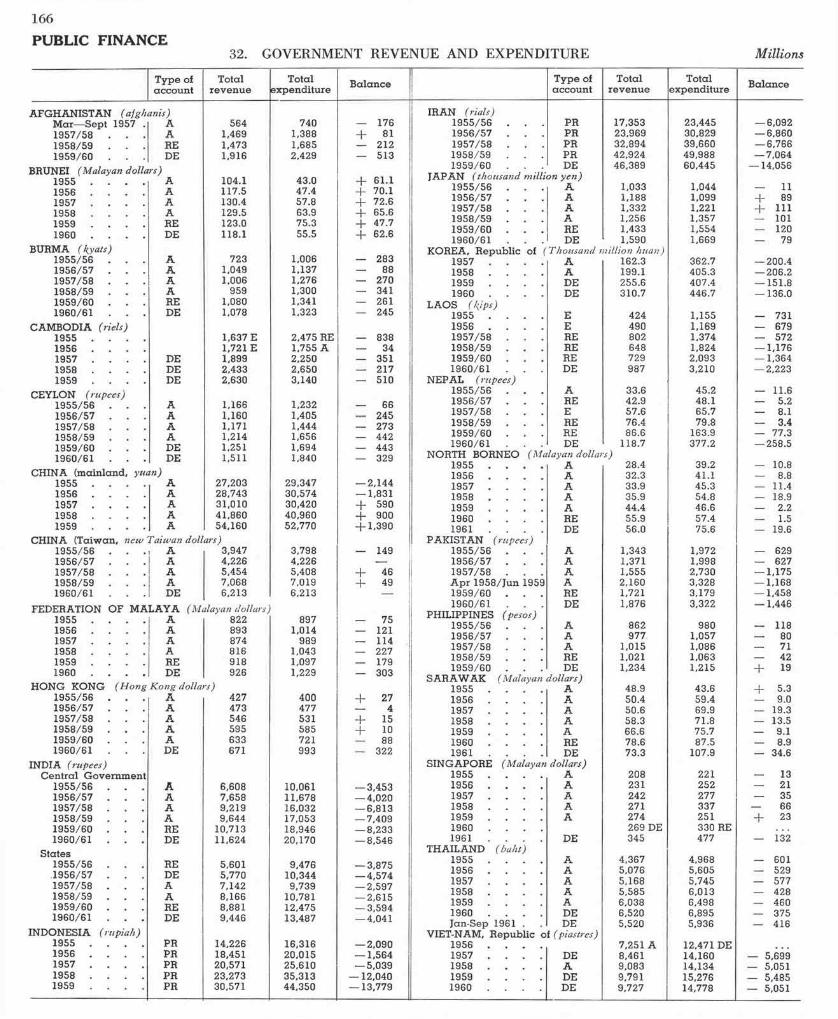
166
PUBLIC FINANCE32. GOVERNMENT REVENUE AND EX PEN D ITU RE M illions
T ype of a cco u n t
Totalr e v e n u e
T otalex p en d itu re B a lan ce T ype of
a cc o u n tTotal
re v e n u eTotal
ex p en d itu re B alan ce
AFGHANISTAN (a fghanis) M ar— Sept 1957 . 1957/58
A 564 740 — 176IRAN (rials)
1955/56 . . . PR 17,353 23,445 — 6,092A 1,469 1,388 + 81 1956/57 . . . PR 23,969 30,829 — 6,860
1958/59 . . . RE 1,473 1,685 — 212 1957/58 . . . PR 32,894 39,660 — 6,766
1959/60 . . . DE 1,916 2,429 — 513 1958/59 . . . PR 42,924 49,988 — 7,0641959/60 DE 46,389 60,445 — 14,056
BRUNEI )srallod nayalaM( 1955 . . . . A 104.1 43.0 + 61.1 JA PA N ( thousand million)
1955/56on yen)
A 1,033 1,044 — 111956 . . . . A 117.5 47.4 + 70.1 1956/57 A 1,188 1,099 + 891957 . . . . A 130.4 57.8 72.6 1957/58 A 1,332 1,221 + 1111958 . . . . A 129.5 63.9 + 65.6 1958/59 A 1,256 1,357 — 1011959 . . . . RE 123.0 75.3 + 47.7 1959/60 . . . RE 1,433 1,554 — 1201960 . . . . DE 118.1 55.5 + 62.6 1960/61 . . . DE 1,590 1,669 — 79
BURMA (kyats)— 283
KOREA, R epub lic of Thousand million huan)1955/56 . . . A 723 1,006 1957 . . . . A 162.3 362.7 — 200.41956/57 . . . A 1,049 1,137 — 88 1958 . . . . A 199.1 405.3 — 206.21957/58 . . . A 1,006 1,276 — 270 1959 . . . . DE 255.6 407.4 — 151.81958/59 . . . A 959 1,300 — 341 1960 . . . . DE 310.7 446.7 — 136.01959/60 . . . RE 1,080 1,341 — 261 LAOS (k ips)1960/61 . . . DE 1,078 1,323 — 245 1955 . . . . E 424 1,155 — 731
CAMBODIA (riels) 1956 . . . . E 490 1,169 — 6791955 . . . . 1,637 E 2,475 RE — 838 1957/58 . . . RE 802 1,374 — 5721956 . 1,721 E 1,755 A — 34 1958/59 . . . RE 648 1,824 — 1,1761957 . DE 1,899 2,250 — 351 1959/60 . . . RE 729 2,093 — 1,3641958 . . . . DE 2,433 2,650 — 217 1960/61 . . . DE 987 3,210 — 2,2231959 . . . . DE 2,630 3,140 — 510 NEPAL ( rupees)
— 11.61955/56 . . . A 33.6 45.2CEYLON (rupees)
1955/56 . . . 1956/57 . . . 1957/58 . . .
AAA
1,1661,1601,171
1,2321,4051,444
— 66— 245— 273
1956/57 . . . 1957/58 . . . 1958/59 . . . 1959/60
REERERE
42.957.6 76.48 6 . 6
48.165.779.8
163.9
— 5.2— 8.1— 3.4— 77.3
1958/59 . . . 1959/60 . . . 1960/61 . . .
ADEDE
1,2141,2511,511
1,6561,6941,840
— 442— 443— 329
1960/61 . . . NORTH BORNEO )srallod nayalaM(
1955 . . . .
DE
A
118.7s)
28.4
377.2
39.2
— 258.5
— 10.8CHINA (m ain land , yuan) 1956 . . . . A 32.3 41.1 — 8.8
1955 . . . . A 27,203 29,347 — 2,144 1957 . . . . A 33.9 45.3 — 11.41956 . . . . A 28,743 30,574 — 1,831 1958 . . . . A 35.9 54.8 — 18.91957 . . . . A 31,010 30,420 + 590 1959 . . . . A 44.4 46.6 — 2.21958 . . . . A 41,860 40,960 + 900 1960 . . . . RE 55.9 57.4 — 1.51959 . . . . A 54,160 52,770 + 1,390 1961 . . . . DE 56.0 75.6 — 19.6
CHINA (T aiw an, new Taiwan dollars) PAKISTAN (rupees)1,343 1,972 — 6291955/56 . . . A 3,947 3,798 — 149 1955/56 . . . A
1956/57 . . . A 4,226 4,226 1956/57 . . . A 1,371 1,998 — 6271957/58 . . . A 5,454 5,408 + 46 1957/58 . . . A 1,555 2,730 — 1,1751958/59 . . . A 7,068 7,019 + 49 A p r 1958/Jun 1959 A 2,160 3,328 — 1,1681960/61 . . . DE 6,213 6,213 — 1959/60 . . . RE 1,721 3,179 — 1,458
1960/61 DE 1,876 3,322 — 1,446FEDERATION OF MALAYA (Malayan dollars)
897 — 75 PHILIPPINES (pesos)1955 . . . . A 822 1955/56 A 862 980 — 1181956 . . . . A 893 1,014 — 121 1956/57 . . . A 977 1,057 — 801957 . . . . A 874 989 — 114 1957/58 A 1,015 1,086 — 711958 . . . . A 816 1,043 — 227 1958/59 RE 1,021 1,063 — 421959 . . . . RE 918 1,097 — 179 1959/60 . . . DE 1,234 1.215 + 191960 . . . . DE 926 1,229 — 303 SARAW AK (Malayan dollars)
HO NG KONG ( H ong K ong dollars) 1955 . . . . A 48.9 43.6 + 5.31955/56 . . . A 427 400 + 27 1956 . . . . A 50.4 59.4 — 9.01956/57 . . . A 473 477 — 4 1957 . . . . A 50.6 69.9 — 19.31957/58 . . . A 546 531 + 15 1958 . . . . A 58.3 71.8 — 13.51958/59 . . . A 595 585 + 10 1959 . . . . A 66.6 75.7 — 9.11959/60 . . . A 633 721 — 88 1960 . . . . RE 78.6 87.5 — 8.91960/61 . . . DE 671 993 — 322 1961 . . . . DE 73.3 107.9 — 34.6
INDIA ( rupees)C en tra l G overnm en t
SINGAPORE ( Malayan) 1955 . . . .
dollars)A 208 221 — 13
1955/56 . . . A 6,608 10,061 — 3,453 1956 . . . . A 231 252 — 211956/57 . . . A 7,658 11,678 — 4,020 1957 . . . . A 242 277 — 351957/58 . . . A 9,219 16,032 — 6,813 1958 . . . . A 271 337 — 661958/59 . . . A 9,644 17,053 — 7,409 1959 . . . . A 274 251 + 231959/60 . . . RE 10,713 18,946 — 8,233 1960 . . . .
DE269 DE 330 RE
— 1321960/61 . . . DE 11,624 20,170 — 8,546 1961 . . . . 345 477THAILAND (baht)
S ta tes 1955 . . . . A 4,367 4,968 — 6011955/56 . . . RE 5,601 9,476 — 3,875 1956 . . . . A 5,076 5,605 — 5291956/57 . . . DE 5,770 10,344 — 4,574 1957 . . . . A 5,168 5,745 — 5771957/58 . . . A 7,142 9,739 — 2,597 1958 . . . . A 5,585 6,013 — 4281958/59 . . . A 8,166 10,781 — 2,615 1959 . . . . A 6,038 6,498 — 4601959/60 . . . RE 8,881 12,475 — 3,594 1960 . . . . DE 6,520 6,895 — 3751960/61 . . . DE 9,446 13,487 — 4,041 Jan-Sep 1961 . DE 5,520 5,936 — 416
INDONESIA (rupiah) VIET-NAM, R epub lic of ( piastres)1955 . . . . PR 14,226 16,316 — 2,090 1956 . . . . 7,251 A 12,471 DE1956 . . . . PR 18,451 20,015 — 1,564 1957 . . . . DE 8,461 14,160 — 5,6991957 . . . . PR 20,571 25,610 — 5,039 1958 . . . . A 9,083 14,134 — 5,0511958 . . . . PR 23,273 35,313 — 12,040 1959 . . . . DE 9,791 15,276 — 5,4851959 . . . . PR 30.571 44,350 — 13,779 1960 . . . . DE 9,727 14,778 — 5,051

33. MAJOR COMPONENTS OF TAX REVENUE
167
PUBLIC FINANCE
Millions
T ype of a cco u n t
T otalre v e n u e
T axre v e n u e
T ax on incom e
a n d w e a lth
LandC ustom s d u tie s T ran sac -
tion a n dLicences,
s ta m p O th e rL an atax Total Im port
d u tie sExportdu tie s
con-sum ption
tax e s
duties, re -g istra tion fees, etc.
taxre v e n u e
AFGHANISTAN (afghanis) M ar— Sept 1957 1957/58 . . . . 1958/59 . . . . 1959/60 . . . .
AAREDE
5641,4691,4731,916
5201,2361,3091,407
158252244217
2444240
277706760885
37152183206
26596544
21231515
BRUNEI (Malayan dollars)1955 1956 1957 1958 1959 1960
AAAAREDE
104.1117.5130.4129.5123.0118.1
54.4 59.162.463.859.9 58.6
50.154.557.759.5 56.054.7
.—
4.04.34.44.03.5 3.4
3.84.24.33.93.4 3.3
0.20.10.10.10.10.1
—
0.20.30.30.30.40.4
0.1
0.1
BURMA (kyats)1955/56 . . . . 1956/57 . . . . 1957/58 . . . . 1958/59 . . . . 1959/60 . . . . 1960/61 . . . .
AAAAREDE
7231,0491,006
9591,0801,078
654909834715871881
224264228193228235
222528423536
214298279231305297
197279256208282275
171923232322
115147171170202207
161921142121
63156107658085
CAMBODIA ( riels)1955 1956 1957 1958 1959
EEEEE
1,6371,7211,8992,4332,630
1,2761,5481,5612,0962,251
97121111158168
2942171415
624361410639645
291347586558
70635387
288673673711733
132191190300333
106160160274357
CEYLON (rupees)1955/56 . . . . 1956/57 . . . . 1957/58 . . . . 1958/59 . . . . 1959/60 . . . . 1960/61 . . . .
AAAAREDE
1,1661,1601,1711,2141,2571,511
1,0341,0421,0441,0751,1131,348
314283279218209368
—
608628617696709769
286304292367389431
322324325 329 320 338
708193
108135140
232519252536
192536283535
FED. OF MALAYA )srallod nayalaM(1955 1956 1957 1958 1959 1960
A A A A RE DE
822893874816918926
677722695629736742
117148132126132163
—
486493475419518491
251276295282293342
235217180137225149
2224 27 2625 24
3439445051 54
1818178
1010
HONG KONG )srallod gnoK gnoH( 1955/56 . . . . 1956/57 . . . . 1957/58 . . . . 1958/59 . . . . 1959/60 . . . . 1960/61 . . . .
A A A A A DE
427473546595633671
307338377403427457
154171194212220224
—71808692
105139
71808692
105139
—
2831333432 31
464853535750
88
11121313
INDIA (rupees)C entral G overnm en t
1956/57 . . . . 1957/58 . . . . 1958/59 . . . . 1959/60 . . . . 1960/61 . . . .
AAAREDE
7,6589,2199,644
10,71311,624
4,9385,7545,5306,1186,767
1,4441,5381,6261,6491,973
—
1,7321,8001,3831,6001,600
1,4051,5091,1651,3821,411
327291218218189
1,7622,4162,5212,8693,194
States1955/56 . . . . 1956/57 . . . . 1957/58 . . . . 1958/59 . . . . 1959/60 . . . . 1960/61 . . . .
REDEAAREDE
5,6015,7707,1428,1668,8819,446
3,4953,6674,7205,3715.5405.541
651636860893931741
803927877919971
1,008
—
__
—
1,4881,5152,2402,7592,7912,883
425449542600616648
128140201200231261
INDONESIA ( rupiah)1955 1956 1957 1958 1959
PRPRPRPRPR
14,22618,45120.571 23,27330.571
9,86613,68313,79113,902
3,0813,1213,4573,9895,310
811111112
1,8602,2961,9901,829
2,172
1,1061,8721,7911,6441,856
754424199185316
4,7058,0337,9987,5925,024
98114147147137
114108188334365
IRAN (rials)1955/56 . . . . 1956/57 . . . . 1957/58 . . . . 1958/59 . . . . 1959/60 . . . .
PRPRPRPRDE
17,35323,96932,89442,92446,389
16,16123,05731,87039,91442,532
1,2141,5932,2414,1983,712
4,3165,3377,3029,985
11,138
10,631-16,12722,32725,73127,682

1 6 8
P U B L I C F I N A N C E3 3 . M A J O R C O M P O N E N T S O F T A X R E V E N U E snoilliM )d’tnoC(
T y p e of T o ta l T axT a x o n in c o m e
C u s to m s d u t ie s T ra n s a c -t io n a n d
L ic e n c e s ,s ta m p O th e r
L a n dIm p o rtd u t ie s
E x p o rtd u t ie s
c o n - d u t ie s , r e - ta xa c c o u n t r e v e n u e r e v e n u e a n d
w e a l tht a x T o ta l s u m p tio n
ta x e sg is t r a t io n fe e s , e tc .
r e v e n u e
JA P A N ( th o u sa n d m illion 1 9 5 5 /5 6 . . . . 1 9 5 6 /5 7 . . . . 1 9 5 7 /5 8 . . . . 1 9 5 8 /5 9 . . . . 1 9 5 9 /6 0 . . . . 19 6 0 /6 1 . . . .
y e n )AAAAREDE
1,0331,1881,3321,2561,4331,590
9361,0871,2491,1571,3011,472
481577628603665784
— 274651517989
428464570503557599
—
K O R EA , R e p u b lic of ( th o usand m ilA
ion h uan ) 162.3 136.0 26.7 27.7 23.8 35.5 2.8 19.5
7591...........................................1958 1959 1960
ADEDE
199.1255.6310.7
168.7222.7 265.9
32.242.451.0
20.220.318.5
29.632.241.1
41.250.960.4
4.87.69.1
40.7 69.385.8
L A O S ( k ip s )1955 1956 1 9 5 7 /5 8 . . . . 19 5 8 /5 9 . . . . 1 9 5 9 /6 0 . . . . 19 6 0 /6 1 . . . .
E 424 242 9 _ _ 100 100 .—. 115 11 7
E 490 464 44 — 251 251 — 129 33 7
REREREDE
802648729987
768586660808
259200112307
50385450
9681
N E PA L ( rupees)1 9 5 5 /5 6 . . . . 1 9 5 6 /5 7 . . . . 1 9 5 7 /5 8 . . . . 1 9 5 8 /5 9 . . . . 19 5 9 /6 0 . . . . 1960 /61 . . . .
AREEREREDE
33.6 42.957.6 76.486.6
118.7
57.552.977.9
18.415.5 28.4
12.618.523.5 27.9 28.233.5
. . .2.22.84.0 6.54.1 6.4
4.75.19.6
N O R TH B O R N EO )srallod nayalaM(1955 1956 1957 1958 1 9 5 9
A A A
28.432.333.9
20.723.123.9
1.93.03.0
0.10.10.1
16.518.018.9
9.511.512.9
7.0 6.56.0
— 0.40.50.6
1.81.51.3
AA
35.944.4
24.528.8
3.23.2
18.923.1
12.714.7
6.28.4 —
0.71.1
1.71.4
1960 RE 55.9 36.6 5.7 — 28.5 18.1 10.4 — 1.1 1.3
1 9 6 1 .............................. DE 56.0 34.0 5.6 — 25.8 18.0 7.8 — 1.1 1.5
PA K IST A N (rupees)1 9 5 5 /5 6 . . . . A 1,343 968 198 __ 509 222 6 33
1 9 5 6 /5 7 . . . . 1 9 5 7 /5 8 . . . . A p r 1 9 5 8 /Ju n 1959 . 1 9 5 9 /6 0 . . . .
AAARE
1,3711,5552,1601,721
9831,0331,3821,215
208250414299
6111
471421491458
263319419408
77
109
28354740
1960 /61 . . . . DE 1,876 1,280 299 1 451 508 9 12
PH ILIPPIN ES (pesos)1 9 5 5 /5 6 . . . . A 862 738 142 __ 247 247 — 135 190 24
1 9 5 6 /5 7 . . . . A 977 821 154 — 274 274 — 155 201 37
1 9 5 7 /5 8 . . . . A 1,015 812 162 — 262 262 — 170 180 38
1 9 5 8 /5 9 . . . . RE 1,021 803 167 — 219 219 — 178 167 72
1 9 5 9 /6 0 . . . . DE 1,234 1,058 175 — 432 432 — 182 175 94
S A R A W A K )srallod nayalaM( 1955 .............................. A 48.9 38.2 6.5 ___ 27.8 13.5 14.3 1.3 0.5 2.1
1956 .............................. A 50.4 37.8 7.3 — 26.0 13.9 12.1 1.3 0.6 2.61957 .............................. A 50.6 38.1 8.5 — 25.4 15.2 10.2 1.2 0.7 2.3
1958 .............................. A 58.3 43.2 12.1 — 25.8 16.7 9.1 1.4 1.2 2.71959 .............................. A 66.6 52.2 10.1 — 36.6 19.9 16.7 1.8 1.1 2.6
1960 .............................. RE 78.6 63.3 11.7 — 46.0 25.5 20.5 2.0 1.2 2.4
1 9 6 1 .............................. DE 73.3 56.9 13.2 — 38.3 23.3 15.0 2.2 1.2 2.0
S IN G A P O R E (M alayan dollars)68 68 181955 .............................. A 208 157 64 — — 3 4
1956 .............................. A 231 177 73 — 75 75 — 19 4 6
1957 .............................. A 242 189 70 — 85 85 — 21 6 7
1958 .............................. A 271 195 70 — 91 91 — 20 8 6
1959 .............................. A 274 202 80 — 88 88 — 21 8 5
1960 .............................. DE 269 209 73 — 100 100 — 21 9 6
1 9 6 1 .............................. DE 345 259 119 — 94 94 —- 25 10 11
TH A IL A N D (b a h t) 1955 A 4,367 3,990 312 ___ 1,648 1,296 352 1,189 193 648
1956 A 5,076 4,650 354 — 1,816 1,413 403 1,277 189 1,014
1957 A 5,168 4,681 380 — 1,901 1,490 411 1,233 196 971
1958 A 5,585 5,105 405 _ 1,907 1,614 293 1,561 241 99119 5 9 .............................. A 6,038 5,272 428 — 2,212 1,804 408 1,520 147 965
1960 DE 6.520 5,968 594 — 2,316 1,940 376 1,747 241 1,070
Ja n -S e p 1961 DE 5,520 4,979 513 — 1,975 1,706 269 1,392 155 944
VIET-NA M , R e p u b lic of )sertsaip( 1957 ..............................
DE 8,461 7,074 729 140 1,702 1,702 — 3,934 407 162
1958 .............................. A 9,083 8,129 470 140 2,223 2,223 — 4,498 798
1959 .............................. DE 9,791 7,798 520 142 2,406 2,406 — 3,176 1,554
1960 .............................. DE 9,727 7,244 530 2,054 2,054-
4,581 79

PUBLIC FINANCE
34. MAJOR COMPONENTS OF GOVERNMENT EXPENDITURE Millions
T ype of a ccoun t
Totalex p en d itu re D efence S ubsid ies Econom ic
se rv ice sS ocial
se rv ices
C ontribu-tions to
p ro v in c ia l a n d lo ca l
g o v n 'ts
O th ercu rren t
e x p en d itu reInvestm ent
Loansa n d
a d v a n c e s(net)
AFGHANISTAN ( afghanis)M ar— Sept 1957 A 740 194 69 62 163 2521957/58 . . . . A 1,388 444 177 121 272 3741958/59 . . . . A 1,685 547 232 156 329 4211959/60 . . . . DE 2,429 664 361 253 428 723
BRUNEI (Malayan dollars)1955 ............................ A 43.0 — — 3.2 2.9 — 13.1 --------23.8---------1956 ............................ A 47.4 — — 4.8 4.0 — 10.8 27.81957 ............................ A 57.8 — — 5.2 5.3 — 13.3 34.01958 ............................ A 63.9 — — 3.7 6.0 —- 12.6 41.61959 ............................ RE 75.3 — — 4.7 8.1 —- 11.4 51.11960 ............................ DE 55.5 — — 5.4 11.4 — 10.8 27.9
BURMA (kyats)1955/56 . . . . A 1,006 353 — 49 132 27 246 77 1221956/57 . . . . A 1,137 368 — 57 150 29 281 79 1731957/58 . . . . A 1,276 408 — 66 168 39 301 114 1801958/59 . . . . A 1,300 403 — 63 165 39 335 107 1881959/60 . . . . RE 1,341 439 — 62 177 26 340 151 1461960/61 . . . . DE 1,323 409 — 65 183 28 339 159 140
CAMBODIA (rials)1955 ............................ RE 2,475 1,107 89 399 16 728 1361956 ............................ A 1,755 610 -— 89 482 384 1901957 ............................ DE 2,250 640 — 129 661 485 3351958 ............................ DE 2,650 657 — 151 809 619 4141959 ............................ DE 3,140 827 — 179 956 642 536
CEYLON (rupees)1954/55 . . . . A 984 26 — 142 249 23 195 352 31955/56 . . . . A 1,232 30 80 133 282 24 260 344 791956/57 . . . . A 1,405 34 105 138 321 26 393 224 1641957/58 . . . . A 1,444 64 112 149 360 32 249 465 131958/59 . . . . A 1,656 72 146 173 421 35 348 405 561.959/60 . . . . DE 1,694 79 108 190 429 36 332 520 —1960/61 . . . . DE 1,840 86 200 206 466 37 366 460 19
FED. OF MALAYA (Malayan dollars)1955 ............................ A 897 160 — 35 158 — 325 -------------2 1 9 --------------
1956 ............................ A 1,014 148 — 57 166 — 331 3121957 ............................ A 989 161 — 61 172 — 347 2481958 ............................ A 1,043 162 — 46 216 — 365 2541959 ............................ RE 1,097 157 — 55 248 — 358 2791960 ............................ DE 1,229 140 — 61 265 — 389 374
HONG KONG (H ong K ong dollars)1955/56 . . . . A 400 24 — 40 91 — 123 108 141956/57 . . . . A 477 25 — 43 106 — 129 145 291957/58 . . . . A 531 28 — 48 120 — 151 162 221958/59 . . . . A 585 26 — 53 143 — 138 178 471959/60 . . . . A 721 36 — 63 183 — 209 189 411960/61 . . . . DE 993 35 — 80 240 — 230 322 86
INDIA ( rupees)C entra l G overnm en t
1956/57 . . . . A 11,678 2,174 13 657 2,872 3,162 2,8001957/58 . . . . A 16,032 2,828 258 1,009 3,047 5,219 3,6711958/59 . . . . A 17,053 2,787 166 1,241 3,467 5,522 3,8701959/60 . . . . RE 18,946 2,802 141 1,623 4,119 5,003 5,2581960/61 . . . . DE 20,170 3,100 119 2,069 4,600 5,045 5,237
States1955/56 . . . . RE 9,476 — 1,319 1,539 — 2,700 3,134 7841956/57 . . . . DE 10,344 — 1,530 1,742 — 2,673 3,758 6411957/58 . . . . A 9,739 — 1,540 1,820 — 2,983 2,964 4321958/59 . . . . A 10,781 — 1,738 2,051 — 3,452 2,772 7681959/60 . . . . RE 12,475 — 1,989 2,374 — 3,665 3,422 1,0251960/61 . . . . DE 13,487 — 2,333 2,593 — 3,833 3,061 1,667
INDONESIA (rupiah)1955 ............................ PR 16,316 3,937 1.476 1,564 8,424 9151956 ............................ PR 20,015 4,379 869 1,939 11,910 9181957 ............................ PR 25,610 6,051 1,082 2,334 15,078 1,0651958 ............................ PR 35,313 11,085 1,404 2,884 18,646 1,2941959 ............................ PR 44,350 14,071 1,927 3,124 23,279 1,949
IRAN (rials)1955/56 . . . . PR 23,445 5,298 510 — 8,797 8,185 6551956/57 . . . . PR 30,829 6,457 330 — 9,516 10,538 3,9881957/58 . . . . PR 39,660 8,378 464 — 14,084 16,604 1301958/59 . . . . PR 49,988 13,242 900 — 16,941 18,073 8321959/60 . . . . DE 60,445 17,005 920 — 21,383 19,637 1,500
169

170PUBLIC FINANCE
34. MAJOR COMPONENTS OF GOVERNMENT EX PEN D ITU R E (C ont’d ) Millions
T ype of a cco u n t
Totalex p en d itu re D efence S u bsid ies Econom ic
se rv ice sSocial
se rv ice s
C ontribu-tions to
p ro v in c ia l a n d lo ca l
g o v n 'ts
O th ercu rren t
e x p en d itu reInvestm en t
Loansa n d
a d v a n c e s(net)
JAPAN ( thousand million yen) 1955/56 . . . . A 1,044 148 7 359 182 185 152 111956/57 . . A 1.099 150 3 376 191 191 156 321957/58 . . A 1,221 176 32 408 233 198 170 41958/59 . . A 1,357 178 2 436 258 259 200 241959/60 . . RE 1,554 189 3 508 292 275 281 61960/61 . . DE 1,669 182 13 557 320 272 323 2
KOREA, R epublic of 1957 . . .
dnasuoht( usand m ill A
milli on h w an) 362.7 112.9 8.7 8.4 38.4 15.4 36.1 90.8 52.0
1958 . . . A 405.3 127.8 4.2 9.0 51.3 17.1 43.8 86.9 65.21959 . . . E 407.4 141.1 1.2 10.8 64.0 24.6 63.9 67.4 34.41960 . . . E 446.7 149.0 1.4 10.6 72.2 25.6 73.7 75.1 39.1
LAOS ( ki ps)587 211955 . . . E 1,155 36 — 76 168 1 266
1956 . . . E 1,169 49 — 108 265 1 344 344 581957/58 . . RE 1,374 4 592 7781958/59 . . RE 1,824 5 978 8411959/60 . . RE 2,093 8 884 1,2011960/61 . . DE 3,210 31 1,183 1,996
NEPAL ( rupees)18.6 12.61955/56 . . A 45.2 14.0
1956/57 . . RE 48.1 15.3 19.3 13.51957/58 . . E 65.7 15.9 31.1 18.71958/59 . . RE 79.8 14.3 34.0 31.51959/60 . . RE 163.9 13.4 71.6 78.91960/61 . . DE 377.2 15.5 102.6 259.1
NORTH BORNEO (Malaya 1955 ............................
(malaya n dollars) A 39.2 2.9 3.5 __ 8.8 24.0 —
1956 . . . A 41.1 — — 4.2 4.3 — 11.6 21.0 —1957 . . . A 45.3 — — 5.3 5.2 — 12.3 22.5 —1958 . . . A 54.8 __ __ 6.0 5.5 — 13.5 29.8 —-1959 . . . A 46.6 __ — 5.7 6.2 -— 15.3 19.4 —1960 . . . RE 57.4 —. .— 7.1 7.7 — 16.6 26.0 —1961 . . . DE 75.6 — — 8.3 9.2 — 17.6 40.5 —
PAKISTAN (rupees)297 3211955/56 . . A 1,972 821 30 32 471
1956/57 . . A 1,998 784 29 42 515 354 2741957/58 . . A 2,730 696 37 41 638 711 607A p r 1958/Jun 1959 . A 3,328 995 43 53 997 800 4401959/60 . . RE 3,179 965 47 41 597 911 6181960/61 . . DE 3,322 971 54 25 736 840 696
PH ILIPPIN ES (pesos)1955/56 . . A 980 166 122 268 56 85 2831956/57 . . A 1,057 157 158 282 61 110 2891957/58 . . A 1,086 181 147 315 74 134 2351958/59 . . RE 1,063 180 163 334 61 127 1981959/60 . . DE 1,215 185 191 363 70 151 255
SARAW AK )srallod nayalaM( 1955 ............................ A 43.6 0.1 5.6 5.2 — 14.5 17.7 0.51956 . . . A 59.4 __ — 7.3 10.6 — 16.5 23.3 1.71957 . . . A 69.9 — — 8.7 12.6 — 19.6 25.9 3.11958 . . . A 71.8 — — 9.0 14.2 — 19.1 28.7 0.81959 . . . A 75.7 — — 9.3 15.3 — 20.0 30.8 0.31960 . . . RE 87.5 — __ 10.6 16.4 — 21.3 39.1 0.11961 . . . DE 107.9 — — 12.3 17.8 — 25.2 52.3 0.3
SINGAPORE )srallod nayalaM( 1955 . . . A 221 10 12 63 __ 80 561956 . . . A 252 10 — 19 78 — 85 601957 . . . A 277 9 — 17 89 — 113 491958 . . . A 337 11 — 18 100 — 127 811959 . . . A 2 5 1 8 — 15 104 — 93 311960 . . . RE 330 8 — 16 109 — 85 1121961 . . . DE 477 8 — 24 156 — 102 187
T H A ILA N D (baht)1955 . . . A 4,968 855 — 100 355 79 2,500 1,079 —1956 . . . A 5,605 817 — 109 436 84 3,278 881 -—1957 . . . A 5,745 1,567 — 240 1,107 6 5 1,880 886 —1958 . . . A 6,013 1,390 — 304 1,497 47 1,813 962 —1959 . . . A 6,498 1,439 22 473 1 , 5 5 5 109 1,628 1,272 —1960 . . . DE 6,895 1,422 18 459 1,791 121 1,857 1,227 —Ja n -Sep 1961 DE 5,936 1,078 26 408 1,427 103 1,525 1,354 15
VIET-NAM, R epublic 1957 . . .
of )sertsaiP(
DE 14,160 6,362 684 1,057 1,355 4,335 367 __1958 . . . A 14,134 6,017 — 5,197 2,920 —1959 . . . DE 15,276 6,173 — 5,429 3,674 —1960 . . . DE 14,778 5,970 — 4,877 3,931

171
GENERAL NO TES:(fo r tables 32, 33 an d 34)
A = Accounts, E = Estim ates, D E = D ra f t estimates, RE = Revised estimates, PR = Provisional results.
F igures generally relate to central g o v e rn m e n t transactions only unless o therw ise stated.
In genera l, on ly the ne t results o f pub lic enterprises an d fiscal m onopolies are inc luded ; positive balances are sh o w n u n d e r revenue and negative balances u n d e r expend itu re . C urrency an d m in t t r a n -sactions are excluded . In teres t charges to pub lic enterprises an d entities are inc luded in revenue an d n o t deducted f ro m in terest paym ents on the ex p end itu re side.REVENUE
T ota l revenue: ex c lud ing proceeds f ro m loans, o ther fo rm s of borrow ing , g ran ts an d aid , transfers f ro m reserve funds, an d co u n te r-pa r t funds.
T ransac tion an d co n su m p tio n taxes: excise duties, tu rn o v e r taxes, sales taxes a n d en te r ta in m en t duties.EXPENDITURE
T ota l ex p en d itu re : inc lu d in g c u r re n t expend itu re , capital o u t -lays, an d loans an d advances (n e t) g ra n te d by the g o v e rn m en t bu t excludes deb t red em p tio n , con tr ibu tions to s in k in g fu n d s an d tran s-fers to reserve funds.
D efence: in c lu d in g defence capital ou tlay . E x p en d itu re o n m il i -tary pensions is inc luded in “ o th e r c u r re n t e x p en d itu re” .
E conom ic services: in c lu d in g cu rre n t ex p end itu re on agricu ltu re , forests, industr ia l developm en t, scientific an d technical research, i r r ig a -tion, public w orks, ports, l ig h t houses, com m erce , p la n n in g , etc.
Social services: inc lu d in g cu rren t ex p end itu re o n education , health , social w elfare , relief, etc.
C ontribu tions to p rov incial an d local g overnm en ts : inc lu d in g co n -tributions tow ards m ee tin g c u rre n t expenditu res.
Investm en t: covers capital outlays of public w orks dep a r tm en t, in c lud ing m a in tenance , an d of g o v e rn m e n t enterprises an d o ther departm en ts a n d g ran ts to provinces an d local au thoritie s for the sam e purposes.
Loans an d advances ( n e t ) : m ain ly g ran ted to provinces, local authorities, public a n d p riva te u n d e r tak in g s fo r capital outlay.
C O U N T R Y NOTES:(fo r tables 32, 33 an d 3 4 )
A F G H A N I S T A NT ransactions of postal a n d te lecom m unications arc inc luded on
a gross basis.E x p en d itu re : D efence: inc lu d in g total ex p end itu re of M inistry of
In terio r and T rib a l Affairs D ep ar tm en t. Investm en t: developm enta l expenditu re .BURMA
R evenue: o ther tax revenue in c lu d in g con tribu tions f ro m the State M a rk e tin g Boards. Japanese rep a ra tio n receipts are excluded. C AM BO DI A
R evenue: A n u m b e r o f transaction a n d co n sum ption taxes are included u n d e r custom s duties fo r 1955.
E xp en d itu re : 1956-1958, expenditu res financed by external aid are excluded.CEYLON
Revenue: T ax on incom e and w ea lth : in c lu d in g pension co n -tribution fro m g o v e rn m en t employees.
E x p end itu re : Subsidies: food subsidies only.C H I N A : M A I N L A N D
Sources: T u n g C h i K u n g T so (Statistical B u lle tin ) , issue N o. 12, 29 June 1957; T sa i C h e n g (F in a n c e ) , issue N o. 8, 5 A u g u s t 1957; F inance M in is ter’s accounts, Peop le’s D aily , P ek ing , 16 June 1956; T a k u n g Pao, P ek ing , 12 F eb ru a ry 1958.
Figures relate to the com bined receipts an d ex p end itu re of the central an d local governm ents .C H I N A : T A I W A N
R evenue: includes proceeds f ro m dom estic loans, o ther form s of bo rrow ing , g ran ts an d aid ; an d c o u n te rp a r t funds.
E xp en d itu re : in c lu d in g som e rep ay m en t of debt.FEDERATION OF M A L A Y A
Figures re late to th e com bined receipts an d ex p end itu re of the governm ents of the Federa tion an d the States an d Settlem ents. T r a n -sactions of postal an d te lecom m unications are inc luded on a gross basis.
E x p end itu re : inc lu d in g advances an d paym en ts to the W a r D am age F u n d . D efence: in c lu d in g the em ergency expend itu re o f the Police D ep a r tm en t. Investm en t an d loans an d advances ( n e t ) : public w orks, te lecom m unications a n d deve lo p m en t loan expend itu re . INDIA
C entral g o v e rn m en t: Revenue: exc lud ing taxes transferred to the states.
Expend itu re : exc lud ing transactions o f sta te t ra d in g schemes. Subsidies: loss o n im p o rte d steel. Investm en t: in c lu d in g capital transferred to d isplaced persons an d m in o r am o u n ts to p r iva te en te r -prises. Loans an d advances ( n e t ) : m ostly to sta te governm en ts , local governm ents, a n d g o v e rn m e n t enterprises.
PUBLIC FINANCE
States: T o ta l revenue: ex c lud ing loans b u t in c lu d in g g ran ts r e -ceived a n d taxes transferred f ro m the central g overnm en t.
E x p en d itu re : Social services: exp en d itu re o n education and h ea lth only . L oans an d advances ( n e t ) : loans to m unicipalities, local bodies, etc.IN D O N E SI A
All accounts a re show n “gross” i.e. certa in incom es directly r e -la ted to the various exp en d itu re item s have n o t been deducted fro m expenditu res.
Revenue: T ransactions an d co n sum ption taxes: in c lu d in g fo re ign exchange levies, except for 1959, fo r w h ich figures are n o t available.
E x p en d itu re : Econom ic services: in c lu d in g certa in capital ex-p enditu res of M inistry o f Econom ic Affairs a n d M inistry o f A g r icu l-tu re . Investm en t: covers total exp en d itu re o f M inistry of C o m m u n ic a -tion an d Public W o rk s an d E nergy . O th e r expend itu re : in c lud ing f inancing services, an d a substantia l a m o u n t o f expend itu re o n security m easures.IRAN
L an d tax : inc luded u n d e r T a x on incom e an d w ealth . O th er tax revenue : includes oil revenue, m onopoly profits etc.
E x p en d itu re : Investm en t: includes capital outlay o f P lan O rg a -n iza tion , o th e r d irec t capital ou tlay an d g ran ts for capital purposes. J A P A N
F igures represen t transactions of general account, special account for deb t m a n a g e m e n t an d special account for local gran ts an d shared taxes as w ell as o ther special accounts of adm in istra tive na tu re . Special accounts fo r trad in g , m an u fac tu r in g , b an k in g , insurance an d o th e r public u n d e r tak in g s are excluded . C apital transfers a re w holly inc luded .
E x p en d itu re : Social services: inc lu d in g social security, civil p e n -sions, etc. O th er cu r re n t expend itu re : inc lu d in g som e capital e x p en -d itu re . In v estm en t ex p end itu re on public w orks only. L oans and advances ( n e t ) : in c lu d in g purchases of securities.KOREA, REPUBLIC OF
Figures rep re sen t transactions of the w hole central g o v e rn m en t sector.
Revenue: L an d tax : inc lu d in g tax o n land incom e. O th er tax revenue: in c lu d in g tax on fo re ign exchange.
E x p en d itu re : Social Services: inc lud ing transfers to local school au thoritie s. L oans an d advances ( n e t ) : inc lud ing purchases of o w n e r -ship rights .LAOS
E x p en d itu re : Investm en t: the figure for 1955 includes an a m o u n t of 553.3 m illion kips financed d irectly by fo reign aid. D efence: ex c lud ing considerable am oun ts of defence expenditures finances by fo re ign aid. O th er c u rre n t expend itu re : includes a su b -stantial a m o u n t of unforeseen expenditu res, transporta tion expenses, etc. w h ich could n o t be d istributed .NEPAL
Revenue: T ransac tion an d consum ption taxes; excise duties only.E x p en d itu re : In vestm en t: developm enta l expenditu re .
P A KI ST ANRevenue: exc lud ing receipts fro m sales of foreign aid fu n d
supplies. T o ta l tax revenue: exc lud ing taxes transferred to state governm en ts .
E x p en d itu re : in c lu d in g expenditu res m et from railw ay, postal deve lopm en t an d o ther funds , exc lud ing currency capital outlays an d state t ra d in g schemes. Social services: expend itu re on education and health only. C on tr ibu tions to prov incia l an d local g overnm en ts : gran ts to states o ther th an those m e t fro m funds, m ain ly fo r developm en t b u t also genera l g ran ts for m ee tin g cu r re n t expenditures. PH ILI PP IN ES
R evenue: im p o rt duties: inc lude excise duties on im ports ; also inc lude fo re ign exchange tax in 1955 an d 1956. T ransaction a n d co n sum ption taxes: consist of excise taxes on dom estic p roducts an d forest p roducts . Licences, s tam p duties, registration fees, etc.: consist of licences an d business taxes, an d docu m en tary stamps. S IN GAP ORE
T h e m a in reason fo r the large increase of revenue and ex p en d i-ture fo r 1961 is the in teg ra tio n of the City C ouncil in to the C entral G overnm en t.T H A I L A N D
R evenue: T ax on incom e an d w ea lth ; incom e tax and au to m o -bile taxes only . O th e r tax revenue: inc lu d in g profits f rom rice export m onopoly , aliens an d g am b lin g fees.
E x p en d itu re : C ontr ibu tions to provincial an d local governm en ts: in c lu d in g pu rchase of cars a n d boats fo r fire contro l, repair an d m ain ten an ce of roads, bridges, etc. O th e r c u rre n t expend itu re : in c lu d -in g cost o f liv ing a llow ance to all g o v e rn m en t em ployees, bo th civil an d m ilita ry up to 1956, an d a m o u n tin g to 2,274 m illion b ah t in th a t year. B eg in n in g 1957 cost o f liv ing a llow ance to g o v e rn m e n t em ployees is d is tr ibu ted to the ap p ropria te heads.V I E T - N A M , REPUBLIC OF
E xp en d itu re : Investm ent: developm enta l expend itu re fo r 1958- 1960.