
Real and Financial Integration in East Asia
44
WORKING PAPER SERIES ON REGIONAL ECONOMIC INTEGRATION NO. 17 Real and Financial Integration in East Asia Soyoung Kim and Jong-Wha Lee June 2008
-
Upload
independent -
Category
Documents
-
view
4 -
download
0
Transcript of Real and Financial Integration in East Asia

WORKINGPAPER SERIESON REGIONALECONOMICINTEGRATION NO. 17
Real and Financial Integration in East Asia
Soyoung Kim and Jong-Wha LeeJune 2008


Soyoung Kim+ and Jong-Wha Lee++Real and Financial Integration in East Asia*
* The authors are grateful to Yunbai Kim and participants at the AEA/KAEA session, 2007 American Economic Association annual meeting for helpful comments and Fidelis Sadicon and Marshall Mays for data assistance. The views expressed in the paper are the authors’ and do not necessarily reflect the views and policies of ADB or its Board of Directors, or the governments that ADB members represent.+ Department of Economics, Korea University, Anam-Dong, Sungbuk-Gu, Seoul, Korea 136–701. Tel: +82-2-3290-2223, Email:[email protected].++ Office of Regional Economic Integration, Asian Development Bank, 6 ADB Avenue, Mandaluyong City, 1550 Metro Manila,Philippines. Tel.: 632-632-4900, E-mail: [email protected]
June 2008

The ADB Working Paper Series on Regional Economic Integration focuses on topics relating to regional cooperation and integration in the areas of infrastructure and software, trade and investment, money and finance, and regional public goods. The Series is a quick-disseminating, informal publication that seeks to provide information, generate discussion, and elicit comments. Working papers published under this Series may subsequently be published elsewhere. Disclaimer: The views expressed in this paper are those of the author and do not necessarily reflect the views and policies of the Asian Development Bank or its Board of Governors or the governments they represent. The Asian Development Bank does not guarantee the accuracy of the data included in this publication and accepts no responsibility for any consequence of their use. Use of the term “country” does not imply any judgment by the authors or the Asian Development Bank as to the legal or other status of any territorial entity. Unless otherwise noted, $ refers to US dollars. © 2008 by Asian Development BankJune 2008Publication Stock No. PPA202208
Contents
Abstract 1 I. Introduction 2
II. Price and Quantity Measures of Integration 4
A. Real Integration 4
1. Price Measures 4
2. Quantity Measures 5
B. Financial Market Integration 6
1. Price Measures 6
2. Quantity Measures 8
III. Macroeconomic Consequences 9
A. Cross-Country Correlation of Output and Consumption 9
B. Panel VAR Approach 10
C. Empirical Model 10
D. Data and Sample Periods 11
IV. Results for VAR Approach 12
A. Results for Output VAR 12
1. Impulse Responses 12
B. Consumption VAR 13
C. Extended Experiments 13
V. Conclusion 15
References 16
ADB Working Paper Series on Regional Economic Integration 34
Tables
1. Estimated AR-1 Coefficients of the Real Exchange Rate 18
2. Trade with Selected Economies in East Asia 19
3. Deviation from Covered Interest Parity 20
4. Correlation for Stock Prices in East Asia 21
5. Total Portfolio Investment in East Asia ($ billion) 22
6. Correlation of Output in East Asia 23
7. Correlation of Consumption in East Asia 24
8. Variance Decomposition of Individual Output Growth Rate 25
9. Variance Decomposition of Individual Consumption Growth Rate 25

Figures
1. Cross-Country Average Standard Deviation of Government Bond Yield Spread. 26
2. Cross-Country Average Standard Deviation of Overnight Interbank Rates. 27
3. Cumulative Impulse Responses to World and Regional Output Shocks for 10 East Asian Economies, 1990–1996. 28
4. Cumulative Impulse Responses to World and Regional Output Shocks for 10 East Asian Economies, 2000–2007. 28
5. Relative Cumulative Impulse Responses to World and Regional Output Shocks for 10 East Asian Economies. 29
6. Cumulative Impulse Responses to World and Regional Consumption (Net of Domestic Output) Shocks for 10 East Asian Economies,1990–1996. 29
7. Cumulative Impulse Responses to World and Regional Consumption (Net of Domestic Output) Shocks for 10 East Asian Economies, 2000–2007:2. 30
8. Relative Cumulative Impulse Responses to World and Regional Consumption (Net of Domestic Output) Shocks for 10 East Asian Economies. 30
9. Relative Cumulative Impulse Responses to World and Regional Output Shocks for 9 East Asian Economies. 31
10. Relative Cumulative Impulse Responses to World and Regional Consumption (Net of Domestic Output) Shocks for 9 East Asian Economies. 31
11. Cumulative Impulse Responses to World and Regional Output Shocks for 10 East Asian Economies in VECM Model, 1990–1996. 32
12. Cumulative Impulse Responses to World and Regional Output Shocks for 10 East Asian Economies in VECM Model, 2000–2007:2. 32
13. Relative Cumulative Impulse Responses to World and Regional Output Shocks in VECM Model for 10 East Asian Economies. 33

Abstract We examine the real and financial integration of East Asian economies, comparing the degree of real versus financial integration, the degree of global versus regional integration, and the extent of integration before versus after the 1997/98 financial crisis in East Asian economies. We analyze price and quantity measures of integration such as the size of intra-and interregional trade, cross-border financial assets, correlation of stock returns, and interest rate differentials. In addition, we adopt a panel VAR approach of investigating cross-country output inter-dependence and consumption relation in order to infer the macroeconomic consequences of real and financial integration on East Asian economies. The empirical investigations suggest that (i) using the quantity measure there is a significant increase in real integration within East Asia; (ii) real-side integration based on output linkage increased substantially after the Asian crisis, both regionally and globally; (iii) although quantity and price measures showed some degree of increased financial integration after the crisis, the cross-country consumption relation did not change much; (iv) the degree of regional financial integration within Asia is far smaller than the degree of global financial integration, based on the consumption-based measure; and (v) financial integration lags real integration, especially for regional integration within Asia. Keywords: trade and financial integration, global and regional integration, risk sharing, East Asia JEL Classification Codes: F15, F36, F41

2
I. Introduction After the 1997/98 financial crisis, the East Asian economies took various steps toward economic integration. As economies recovered dramatically from the crisis, the region took the opportunity to deepen market-led integration and policy-induced cooperation. On the real side, outward-oriented economic polices, such as lowering trade barriers and forming free trade agreements, continued to propel the region’s rapid expansion in international trade. The private-sector-driven vertical integration of production networks across countries has also contributed to greater trade integration, both at regional and global levels. On the financial side, governments have promoted cross-border financial transactions through financial market deregulation and capital account liberalization.1 Increasing economic integration in East Asia has far-reaching implications for the region and for the global economy. For example, it is often pointed out that increasing integration at the regional rather than global level can help the region ‘decouple’ from the global economy and better sustain fast growth, independently of the United States (US) or the European economies. Asia’s fast-rising share of global trade and finance has also been linked with the region’s rising political power in the global community. The purpose of this paper is to empirically investigate the degree of economic integration in East Asian economies. While rapid integration into regional and global markets has been a salient feature of the East Asian economies in recent decades, the extent, nature, and consequences of East Asian integration have not been clearly assessed. In particular, empirical evidence of the extent of real and financial integration and macroeconomic interdependence in East Asia has been limited and inconclusive.2 This paper fills this gap.
We focus on the following three comparisons of the extent of economic integration: (i) real versus financial market integration; (ii) regional (within East Asia) versus global (with the rest of the world) integration, and (iii) for the pre-crisis period versus the post-crisis period. Such analysis provides interesting insights. For example, regional trade agreements may enhance real regional integration, but impede integration into the global economy. Conversely, full integration into the global financial market may leave no incentive for integration with the regional financial market. With these comparisons, the analysis will address various issues, periodically raised in previous studies. First, studies such as ADB (2007) and IMF (2007) find that the degree of real integration (as measured by output co-movement) among the region’s economies has been increasing, due in part to an increase in intra-regional trade (in addition to common regional shocks and common policies). But it is not evident that the Asian economies have decoupled or that they have even become less interdependent on the global economy. Empirical studies differ on the extent to which Asian economies have become more autonomous. Some find that Asian business cycles have become more synchronized globally despite strengthened regional trade integration.3 Second, several studies showed evidence of limited extent of financial market integration in the region as a whole (Kim, Kim, and Wang, 2006, and Cavoli et al. 2004). Lee (2008) points out that the degree of regional financial integration lags real (trade) integration in
1 The Asian crisis prompted important policy dialogue and initiatives to strengthen financial and monetary integration at the
regional level such as the ASEAN+3 Chiang Mai Initiative (CMI) and Asian Bond Markets Initiative (ABMI). See ADB (2008). 2 See Cavoli et al. (2004), Poonpatpibul et al. (2006), and Ghosh (2006) for a survey of empirical evidence on financial integration
in East Asia. 3 See IMF (2007) for a survey.

3
East Asia. On the other hand, Kim, Lee and Shin (2007) documents that regional financial integration has deepened in recent years. Overall, there is no unambiguous definition or measure of financial integration in the literature, and it is still of question to what extent financial integration has progressed, along with trade integration, in the region. Third, some studies such as Eichengreen and Park (2004), Poonpatpibul et al. 2006, and Kim, Lee and Shin (2007) suggest that the East Asian financial markets are integrated relatively more with global markets than with each other, while Kim, Kim and Wang (2004) show mixed results on global versus regional risk sharing. To analyze these issues, we adopted various measures to gauge the extent of real and financial integration. Fully integrated real markets can be defined as a situation in which goods can move freely within an area; while fully integrated financial markets can be defined as a situation in which traders can transact financial assets freely within an area. Related to such definitions, two types of measures have been used. First, in fully integrated markets, prices across countries should be equalized, so some price measures can be examined. For the goods market, the price of the same good should be equalized across countries (net of transport costs). Using macro-level price data, we test if relative goods prices converge to a stable equilibrium as suggested by relative purchasing power parity (PPP). For the financial market, the return on the same characteristics of assets should be equalized across countries. We examine cross-country differentials and correlations of financial asset returns. Second, in the integrated markets, goods and financial assets can be freely traded across borders, so the volume of traded goods and financial assets can be considered. We document the size of trade volume and cross-border financial assets.4 We also examine macroeconomic measures such as cross-country output and consumption relation to infer the macroeconomic consequences of real and financial integration. The output relation can capture the inter-dependence of the real side of the economy as a consequence of real economic integration. Real and trade integration can increase the co-movement of output. Although both trade volume and trade structure are important to determining the influence of real and trade integration on the co-movement of output, empirical literature suggests that real and trade integration tend to increase the co-movement of output (Canova and Dellas, 1993 and Frankel and Rose, 1998). On the other hand, international risk sharing, mostly achieved through international financial markets, also tends to increase the co-movement of consumption across countries. As in many previous studies, we first document cross-country output and consumption correlations for a rough indication of macroeconomic interdependence. Then, for more precise inference, we adopt the VAR approach. The VAR approach has advantages over a simple correlation approach in various aspects. First, while a correlation approach does not disentangle the nature of shocks, the VAR approach can analyze these clearly. Hence, the approach is especially useful when we compare regional versus global integration. By identifying regional versus global shocks, we can clearly infer how an individual economy responds to each shock. Second, while a correlation approach shows only a measure of co-movement, we can clearly analyze the size of shocks and the effects given the size of the shock. For example, we can analyze how much individual output responds to a 1% increase in regional aggregate output, which may show the inter-dependence between countries better than a simple correlation of individual and aggregate output. Our analysis adopts a panel framework, combining quarterly
4 In addition to the price and quantity measures, a regulatory measure can be also used. Trade barriers in goods, including tariff
and non-tariff barriers, can be considered for goods markets while barriers to financial flows, for example, capital control measures, can be used for financial markets.

4
observations for 10 East Asian economies and the major industrialized (G7) economies for the pre-crisis and post-crisis period, which can increase the degree of freedom for the relatively short time span of the sample, and control the country-specific fixed factors.5 The rest of the paper is organized as follows. Section 2 shows the price and volume measures of integration. Section 3 shows cross-country consumption and output correlation briefly, and discusses a VAR approach that can better address the issue at hand. Section 4 shows the result of the VAR analysis. Section 5 concludes with a summary of results and future research agenda. II. Price and Quantity Measures of Integration This section examines how real and financial links have evolved over time in East Asia based on price and quantity measures. We focus on assessing the extent of regional and global integration of East Asian economies—both real and financial—largely in the decade since the Asian financial crisis. A. Real Integration
1. Price Measures The law of one price is widely recognized as a measure of the extent of market integration. In a fully integrated market, goods can move freely within an area. Hence, an arbitrage condition between goods markets implies that, as economies become more integrated, the price of comparable goods across countries tends to converge in terms of a common currency.
A few studies have been carried out to test law of one price at the micro level. For example, Crucini et al. (2005) examines good-by-good deviations from the law of one price for over 5,000 goods and services between European Union (EU) countries for the years 1975, 1980, 1985 and 1990. The evidence shows that absolute deviations from law of one price are large due to the lack of international tradability of goods and the cost share of non-traded inputs into production. Crucini and Shintani (2006) examine the dynamics of good-by-good real exchange rates using a micro-panel of 270 goods prices drawn from major cities in 63 countries. They find deviations from the law of one price are persistent. The median good has the half-life of about 1 year. At the macro-level, the law of one price is closely linked to the PPP hypothesis, which implies that the price level in same-currency terms should be equalized across borders. A vast number of studies have focused on the empirical verification of the PPP hypothesis. While PPP in absolute terms is clearly rejected in the data for various reasons (for example, the basket is different across countries), a considerable body of empirical work focuses on the test of the reversion of real exchange rates to a stable PPP equilibrium (the relative PPP). Most early studies failed to find evidence supporting relative PPP (see Rogoff, 1996 for a survey), but more recent studies show mixed results (for example, Taylor, 2001, 2002, Murray and Papell, 2002, Engel, 2000).
5 The 10 East Asian economies are the People’s Republic of China; Hong Kong, China; Indonesia; the Republic of Korea;
Malaysia; Philippines; Singapore; Taipei,China; Thailand; and Japan.

5
There has been no study to test the extent of goods market integration among Asian economies from micro-data. A lack of data has been a main impediment to this area of research. Instead of examining law of one price for each good at the micro level, we briefly examine the behavior of the real exchange rate to infer the speed of relative convergence in goods prices across countries. We estimate the AR-1 model of the (log of) real exchange rate and report the estimates of the AR-1 parameter. The higher the coefficient, the more persistent the real exchange rate, and the slower the parity reversion occurs after a shock deviating price levels across countries. Therefore, a higher coefficient may imply slower relative convergence in the price of goods across countries. The presence of non-tradables may generate a long-run trend in the real exchange rate (for example, the Balassa-Samuleson effect). But we would like to exclude such effects since we are more interested in the convergence of the price of tradables. Therefore, a linear time trend is included in the estimation.6 To construct the real exchange rate, the consumer price index is used. We consider monthly bilateral real exchange rates of the ten East Asian countries and the US for the period before the crisis (1990–1996) and after the crisis (2000–2007). Table 1 reports the estimates of the AR-1 coefficients with standard errors. In the bottom lows, the average for each country is calculated. In most cases, the estimated coefficient is high, confirming the high persistence of the real exchange rate found in the past studies. This indicates that it takes a lot of time for the cross-country deviation in the relative price level to converge to an equilibrium level, and seems to indicate that goods and services markets of the economies in the region are far from a single market. We don’t find clear evidence that the estimated AR-1 coefficient decreased during the post-crisis period. The estimate for the real exchange rate against Japan dropped in most countries. But excluding Japan, the estimate for the bilateral real exchange rate within Asian countries tended to increase in the post-crisis period. The estimate for the real exchange rate against the US also tended to increase. But an increase in the estimate in some cases does not necessarily imply that the degree of goods market integration falls because the difference in the nature of shocks across time, for example, may affect the result. On the other hand, when we compare the estimates for the bilateral real exchange rate within Asia and those for the real exchange rate against the US, the former was smaller than the latter during the post-crisis period, but they are of similar magnitude during the pre-crisis period. This result might suggest that the integration process within Asia was faster than the integration process with the US, although the different nature of shocks hitting the US and Asia might have led to such results.
2. Quantity Measures Quantity measures based on trade integration show substantial increases in real market integration in East Asia. East Asian economies have been more integrated in goods and services trade, both globally and regionally. Rapid trade liberalization has been a salient feature of East Asian growth. Trade openness in the nine emerging East Asian economies7—measured by the ratio of total trade in gross domestic product (GDP) —reached 95% in 2005, from 71% in 1990, and 21% in 1970. The share of East Asian trade in world GDP has grown more than four-fold during the last 35 years, currently exceeding over 20% of world trade volume. 6 The main results without time trend are qualitatively similar. 7 The nine East Asian economies throughout includes those in the list in the footnote above, excluding Japan.
6
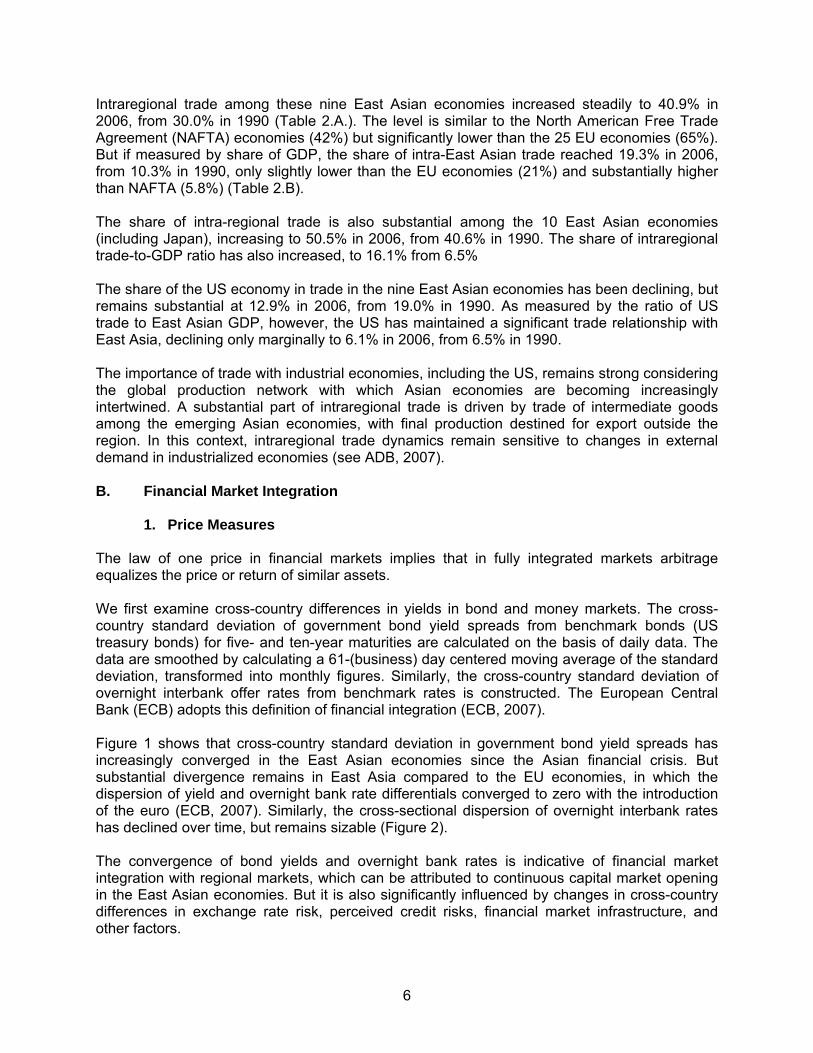
Intraregional trade among these nine East Asian economies increased steadily to 40.9% in 2006, from 30.0% in 1990 (Table 2.A.). The level is similar to the North American Free Trade Agreement (NAFTA) economies (42%) but significantly lower than the 25 EU economies (65%). But if measured by share of GDP, the share of intra-East Asian trade reached 19.3% in 2006, from 10.3% in 1990, only slightly lower than the EU economies (21%) and substantially higher than NAFTA (5.8%) (Table 2.B). The share of intra-regional trade is also substantial among the 10 East Asian economies (including Japan), increasing to 50.5% in 2006, from 40.6% in 1990. The share of intraregional trade-to-GDP ratio has also increased, to 16.1% from 6.5% The share of the US economy in trade in the nine East Asian economies has been declining, but remains substantial at 12.9% in 2006, from 19.0% in 1990. As measured by the ratio of US trade to East Asian GDP, however, the US has maintained a significant trade relationship with East Asia, declining only marginally to 6.1% in 2006, from 6.5% in 1990. The importance of trade with industrial economies, including the US, remains strong considering the global production network with which Asian economies are becoming increasingly intertwined. A substantial part of intraregional trade is driven by trade of intermediate goods among the emerging Asian economies, with final production destined for export outside the region. In this context, intraregional trade dynamics remain sensitive to changes in external demand in industrialized economies (see ADB, 2007). B. Financial Market Integration
1. Price Measures
The law of one price in financial markets implies that in fully integrated markets arbitrage equalizes the price or return of similar assets. We first examine cross-country differences in yields in bond and money markets. The cross-country standard deviation of government bond yield spreads from benchmark bonds (US treasury bonds) for five- and ten-year maturities are calculated on the basis of daily data. The data are smoothed by calculating a 61-(business) day centered moving average of the standard deviation, transformed into monthly figures. Similarly, the cross-country standard deviation of overnight interbank offer rates from benchmark rates is constructed. The European Central Bank (ECB) adopts this definition of financial integration (ECB, 2007). Figure 1 shows that cross-country standard deviation in government bond yield spreads has increasingly converged in the East Asian economies since the Asian financial crisis. But substantial divergence remains in East Asia compared to the EU economies, in which the dispersion of yield and overnight bank rate differentials converged to zero with the introduction of the euro (ECB, 2007). Similarly, the cross-sectional dispersion of overnight interbank rates has declined over time, but remains sizable (Figure 2). The convergence of bond yields and overnight bank rates is indicative of financial market integration with regional markets, which can be attributed to continuous capital market opening in the East Asian economies. But it is also significantly influenced by changes in cross-country differences in exchange rate risk, perceived credit risks, financial market infrastructure, and other factors.

7
Another, possibly more appropriate, price measure of financial integration examines whether the rates of return of comparable financial assets across countries are equalized after taking care of exchange rate risk. Covered interest parity indicates that if financial markets are perfectly integrated and domestic and foreign financial assets are perfect substitutes, the interest rate differential between domestic and foreign interest rates will be equivalent to the difference between the spot rate and the forward rate. Any deviation from the covered interest parity condition, or non-zero covered interest differential, can be generated from capital controls that restrict cross-border capital movements. Although other factors, such as differences in investment risks on default and temporary liquidity problems, can also generate non-zero interest differential, in general non-zero covered interest differential indicates the degree of financial market integration. The size of the covered interest differential measures the barriers to cross-border capital mobility. Table 3 reports the mean of the covered interest differential for 2000–2007 for each of the 10 East Asian economies using daily observations of 3-month interbank rates, spot exchange rates, and the corresponding forward rates. Absolute differentials, compared with the equivalent US and Japanese interbank rates, are presented to gauge the extent of Asian financial market integration with the US and among its own countries. The period average of the absolute magnitude shows that the differential compared to the US rate has been smaller than that compared to the Japanese interbank rate over the period, indicating that the degree of integration with global financial markets has been larger than the extent of regional financial integration. This has been a common feature of most Asian economies, with the notable exception of Taipei,China. Table 3 also presents the averages for the sub-periods of 2000–2003 and 2004–2007 for four Asian economies which have complete data. Differentials compared to US and Japanese rates have changed little over time, showing that the extent of integration of financial markets—either globally or regionally—has not increased over 2000–2007. Considering more diverse asset characteristics in the equities markets, the literature on stock market integration uses the co-movement of stock prices. If financial markets are more integrated, market movements may be more closely associated with each other. Table 4 shows cross-country correlation of the quarterly increase in the stock price index (in US dollars) for the two periods—pre-crisis period, 1990:Q2–1996:Q4 and post-crisis period, 2000:Q1–2007:Q2. The average of correlation coefficients for East Asian stock markets with the regional market (represented as EA10 including Japan) has increased over time from 0.27 in the pre-crisis period to 0.53 in the post-crisis period. The correlation with the US stock market has also increased in East Asia. On average, the correlation coefficient of the regional aggregate stock price (EA10) with the US stock price increased from 0.33 in the pre-crisis period to 0.53 post-crisis in East Asia. In sum, cross-country correlations of stock price indices show that East Asian stock prices have moved more closely with each other and with the US market since the crisis.
One caution in the interpretation of the correlation analysis is that correlation per se cannot identify the source of shocks—such as national, regional, and global common factors. The high pairwise correlation among East Asian stock prices could be explained by the fact that both stock prices are endogenous and respond to a third common factor. A more systematic empirical implementation is to estimate directly the explanatory power of foreign stock market returns on the domestic stock market return. Chai and Rhee (2005), using the variance decomposition approach, examine the extent to which the error variance of the stock market of each East Asian country is explained by local, regional, and global factors. They find that the importance of regional common factors has increased significantly since the financial crisis. But

8
the US market remains an important force for East Asian stock markets: it turns out that East Asian financial markets have closer ties with the US market than with each other.
2. Quantity Measures
Quantitative measures of financial integration show the extent of cross-border holdings of assets and liabilities. Table 5 shows cross-border holdings of total international portfolio assets and liabilities including equity portfolio and long-, and short-term debt securities in East Asia. Data on the geographical distribution of international portfolio asset holdings abroad and foreign holdings in the host country have recently been published by the International Monetary Fund (IMF). The IMF conducted the Coordinated Portfolio Investment Survey (CPIS) for the first time in 1997, and annually since 2001. The first CPIS involved 20 source economies, expanding in CPIS 2001 to 67 economies, including several offshore and financial centers. In each case, the bilateral positions of the source economies in 223 destination countries/territories are reported. Hence, although the People’s Republic of China (PRC) and Taipei,China do not report data on international asset holdings, their liabilities data are gathered from the bilateral position of the source economies. Table 5 shows that the total recorded level of portfolio asset holdings of 7 East Asian economies (excluding Japan, the PRC and Taipei, China) is about $324.8 billion in 2001 and increased about three-fold to $941.6 billion in 2006. For eight East Asian economies, including Japan, the amount has increased from $1.61 trillion to $3.29 trillion over the same period. Intraregional financial integration has been increasing. East Asian assets constituted 14.8% of total holdings for 7 East Asian economies in 2001 and 24.3% in 2006. In comparison, the US share declined to 14.5% by 2006, from19.6% in 2001. The seven East Asian economies are, therefore, now integrated more with each other than they are with the US. But because Japan holds very small investment in East Asian assets (2.0%) and invests more in the U.S (34.0%), the share of intra-regional asset holdings in total asset holdings of 8 East Asian economies is much lower (only 8.4%) than the US share (28.4%) in 2006. In addition, the size of assets holdings of the US in East Asia, even excluding Japan, increased both in level terms and as a ratio to GDP (see Table 5), which may imply that the degree of integration with the US increased. Table 5 also presents the geographical distribution of the total portfolio liabilities for East Asia. The general patterns are similar to those for portfolio asset holdings by East Asia. But most East Asian economies, except Hong Kong, China; Singapore; and Japan have a relatively larger volume of cross-border portfolio liabilities invested in their economies than the volume of assets invested abroad. Total portfolio liabilities for 9 East Asian economies amount to $1.2 trillion in 2006, increasing significantly from $338.4 billion in 2001. For 10 East Asian economies, including Japan, the amount has increased about three-fold to $2.7 trillion from $880.7 billion, over the same period. The intra-regional share of total liabilities for 9 East Asian economies increased to 18.6%, from 14.2%, over the same period. The intra-regional share is much smaller (9.6% in 2006) for 10 East Asian economies, because of Japan’s low investment in East Asia. The US has been the major source of portfolio investment in East Asia, consistently constituting about 37% over 2001–2006 in total international portfolio liabilities for 9 East Asian economies. In sum, the cross-border portfolio holdings data show that although intraregional financial integration among the East Asian economies has been increasing, it remains limited, falling

9
behind that of integration with global financial markets, especially when accounting for the small investment by Japanese investors in the region. When scaling portfolio holdings by GDP, Hong Kong, China and Singapore have relatively larger holdings of cross-border portfolio assets and liabilities, in terms of their GDP levels, compared to other economies (Table 5). For a typical East Asian economy, financial portfolio asset holdings amount to only a small fraction of GDP, while portfolio liabilities holdings constitute a relatively larger share of GDP. The average ratio of international portfolio asset (liabilities) holdings to GDP amounts to 4.5% (4.5%) for 9 East Asian economies and 2.9% (2.7%) for the 10 East Asian economies. III. Macroeconomic Consequences A. Cross-Country Correlation of Output and Consumption
We first examine the cross-country output and consumption correlation. Output co-movement may be regarded as a measure of real integration. Although the theory suggests that the degree of output co-movement depends on both trade volume and trade structure, empirical literature supports the idea that real and trade integration increases the cross-country co-movement of output. On the other hand, literature on international risk sharing suggests that the country-country co-movement of consumption (growth) includes important information on the degree of international risk sharing (which can be achieved mostly through financial market integration); the cross-country correlation of consumption growth rates tends to be higher as the degree of international risk sharing increases. Tables 6 and 7 present correlation coefficients of changes in quarterly real GDP and real consumption data for pairs of the 10 East Asian economies, for the East Asia region (10 economies) as well as the United States.
Comparing the pre-crisis period and the post-crisis period, the average of pairwise correlation coefficients between individual GDP and regional aggregate GDP for the 10 East Asian economies increased from -0.10 to 0.35. For all East Asian economies but Indonesia, the pairwise correlation coefficients increased significantly. The average of pairwise correlation coefficients between individual East Asian economies and US GDP also increased substantially from 0.05 to 0.25. This evidence supports the growing regional as well as global output interdependence of East Asian economies, which can be a result of increasing real integration—both regionally and globally—of East Asian economies. Compared to GDP, the increase in correlation coefficients of cross-country consumption among the regional economies between the periods before and after the crisis is less discernible. The average of pairwise correlation coefficients between individual East Asian economy and regional aggregate consumption increased from 0.05 in the pre-crisis period to 0.14 in the post-crisis period. While the increase was moderate for most pairwise consumption correlations, it was notably higher for the pairs among PRC, Hong Kong, China, and Taipei,China. In contrast, the average of pairwise correlation coefficients between individual East Asian economy and US GDP increased from 0.05 to 0.19, which is in magnitude comparable to the average increase in output correlation between individual East Asian economy and US GDP.

10
B. Panel VAR Approach A simple correlation approach does not provide a precise inference of real and financial integration, so we develop VAR models. VAR models can identify the relevant structural shocks, such as global and regional shocks, and analyze the effects of each shock on an individual variable in a more systematic way. We use panel structure to increase the degree of freedom because sample periods under consideration are relatively short. Let’s assume that an economy i (i=1,2,…,10) is described by the following structural form equation:
it
iit edyLG +=)( (1)
where G(L) is a matrix polynomial in the lag operator L, i
ty is an m×1 data vector, di is an m×1 constant matrix, m is the number of variables in the model, and i
te denotes a vector of structural
disturbances. By assuming that structural disturbances are mutually uncorrelated, )( itevar can
be denoted by Λ, which is a diagonal matrix where diagonal elements are the variances of structural disturbances. The individual fixed effect, di, is introduced to control for the country specific factors that are not included in the model. We are interested in examining the time-series relationship; by including the individual fixed effect, we exclude the cross-sectional information in the estimation. We pooled the data and estimated the following reduced form panel VAR with the individual fixed effects:
it
it
iit uyLBcy ++= −1)( , (2)
where ci is an m×1 constant matrix, B(L) is a matrix polynomial in the lag operator L, and
Σ=)( ituvar .
There are several ways of recovering the parameters in the structural form equation from the estimated parameters in the reduced form equation. The identification schemes under consideration impose recursive zero restrictions on contemporaneous structural parameters by applying Cholesky decomposition to the reduced form residuals, Λ, as in Sims (1980). C. Empirical Model To measure the extent of the real integration, we examine how aggregate world output shocks and aggregate East Asian output shocks affect individual output of East Asian economies. For that purpose, we construct a three variable VAR model. The variables are [Δ log YW, Δ log YA, Δ log Yi] where the contemporaneously exogenous variables are ordered first, YW is the world aggregate output, YA is the East Asian aggregate output, and Yi is an individual output of East Asian economies.8 The first two variables are included to identify the world aggregate output 8 Panel Unit root test by Im, Pesaran, and Shin (2003) shows that the null hypothesis of unit root in (log of) each variable is not
rejected at the 5% level. To be consistent with these results, we use the variables in (log) difference form. On the other hand, the panel co-integration test by Pedroni (1999) does not reject the null hypothesis of co-integration among these variables in some cases. In the extended experiment section, we consider the Vector Error Correction model in which the estimated co-integration relation among these variables is imposed.

11
shocks and the East Asian aggregate output shocks. The last variable is included to examine the effects of two shocks on the individual output of East Asian economies. The ordering of the variables can be regarded as a natural one. World aggregate output is treated as contemporaneously exogenous to regional aggregate output and individual country output. Regional aggregate output is treated as contemporaneously exogenous to individual country output. To measure the extent of financial integration, we use international consumption risk sharing theory. In a simple model of risk sharing, one country’s consumption growth rate depends more on aggregate consumption growth rate if there is more risk sharing across countries. We extend the theory to a case in which risk sharing with both Asian region and world can be considered as follows. To the extent that one country established risk sharing arrangements within the Asian region ( Aλ ), the consumption growth rate of the country follows the consumption growth rate of the aggregate consumption of Asia. Similarly, to the extent that one country established risk sharing arrangements with the world ( wλ ), the consumption growth rate of the country follows the consumption growth rate of the aggregate consumption of the world. The rest of the consumption growth rate of the country follows its income growth rate ( WA λλ −−1 ). This idea can be expressed as the following equation.9
By rearranging the equation, the following equation can be obtained:
Therefore, by examining how shocks to (Δ log CW - Δ log Yi ) and (Δ log CA - Δ log Yi), affect (Δ log Ci - Δ log Yi), we can infer the extent of international risk sharing. For that purpose, we construct a three-variable VAR model. The variables are [Δ log CW - Δ log Yi, Δ log CA - Δ log Yi, Δ log Ci - Δ log Yi]. Again, the ordering is natural. World aggregate consumption (net of domestic output) is treated as contemporaneously exogenous to regional aggregate consumption (net of domestic output) and individual country consumption (net of domestic output). Regional aggregate output (net of domestic output) is treated as contemporaneously exogenous to individual country output. 10 D. Data and Sample Periods We use quarterly data. We estimate the model for two sample periods. For the period after the Asian crisis, we use 2000:1–2007:2. For the period before the Asian crisis, we use 1990:1–1996:4. A constant term and two lags are assumed. 9 See Crucini (1999), and Asdurubali and Kim (2004, 2007) for the empirical test of incomplete risk sharing. 10 Panel Unit root tests by Im, Pesaran, and Shin (2003) show that the null hypothesis of unit root in (log of) each variable is not
rejected at 5% level. In addition, panel co-integration test by Pedroni (1999) rejects the null hypothesis of co-integration among these variables at the 5% level in most cases. To be consistent with these results, we use the variables in (log) difference form.
( ) ).log(1)log()log()log( itAWAtAWtWit YCCC Δ−−+Δ+Δ+=Δ λλλλα
( ) ( ) ( ))log()log()log()log()log()log( itAtAitWtWitit YCYCYC Δ−Δ+Δ−Δ+=Δ−Δ λλα

12
The world aggregate is constructed as the aggregate of G-7 countries, excluding Japan. The Asian aggregate is constructed as the aggregate of 10 Asian countries (A-10, the PRC; Hong Kong, China; Indonesia; Japan; the Republic of Korea (Korea); Malaysia; Philippines; Singapore; Taipei,China; Thailand) excluding own economy. IV. Results for VAR Approach A. Results for Output VAR
1. Impulse Responses Figures 3 and 4 report the cumulative impulse responses to global and regional output shocks for 16 quarters with 90% probability bands for the pre-crisis and the post-crisis periods, respectively. We construct cumulative impulse responses in order to easily see the effects on (log) level of each variable. The responding variables are denoted at the far left of each row of graphs while the names of shocks are denoted at the top of each column of graphs. For the pre-crisis period, world aggregate output shocks do not have much effect on domestic output. Positive Asian aggregate output shocks even have a negative effect on domestic output. On the other hand, for the post-crisis period, positive world aggregate output shocks and Asian aggregate output shock have significant positive effect on domestic output. This result suggests that real inter-dependence of Asian countries within the Asian region and with the world increased substantially after the financial crisis. In order to derive the degree of dependence, we calculate two ratios. (1) The ratio of cumulative impulse responses of individual output to cumulative impulse responses of world aggregate output in the presence of world aggregate output shocks. (2) The ratio of cumulative impulse responses of individual output to cumulative impulse responses of Asian aggregate output in the presence of Asian aggregate output shocks. In this way, we can infer by what percentage domestic output changes when world (or Asian) aggregate output changes by 1% in the presence of world (or Asian) aggregate output shocks at various horizons after the shock. Figure 5 reports the ratios for 16 quarters with 90% probability bands. The first and second columns of panels show the results for the pre-crisis and the post-crisis periods, respectively. The first and the second rows of panels show the results for world aggregate output shocks and Asian aggregate output shocks, respectively. The results show that the positive co-movement (or dependence) of individual output with the regional and world aggregate output increased substantially after the crisis and that the increase in the degree of dependence with regional aggregate output is as large as that with world aggregate output. For the post-crisis period, domestic output increases by about 50% of the size of Asian aggregate output increase in the presence of Asian aggregate output shocks for the long-horizon while domestic output increases by over 100% of the size of world aggregate output increase in the presence of world aggregate output shocks for the long-horizon. To examine the proportion of individual output growth fluctuations explained by world aggregate and regional aggregate shocks, we calculate the forecast error variance decomposition. Table 8 shows forecast error variance decomposition of individual output growth rates due to Asian aggregate output shocks and world aggregate output shocks for the pre- and post-crisis periods, with 90% probability bands in parenthesis.

13
From the results, we can see that the role of world aggregate shocks in explaining individual output fluctuations has increased significantly since the Asian crisis. Note also that the role of Asian aggregate shocks has decreased since the Asian crisis and the role of Asian aggregate shocks is larger than the role of world aggregate shocks before the Asian crisis, but positive Asian aggregate shocks have a negative effect on individual output (as found in impulse responses), which therefore does not imply that the degree of regional integration is high during the pre-crisis period. It’s also interesting that the role of world aggregate shocks is larger than that of Asian aggregate shocks after the Asian crisis. B. Consumption VAR Figures 6 and 7 report the cumulative impulse responses to world and regional consumption (net of domestic output) shocks for 16 quarters with 90% probability bands for the pre-crisis and the post-crisis periods, respectively. The responding variables are denoted at the far left of each row of graphs while the name of shocks are denoted at the top of each column of graphs. In both periods, world consumption shocks have a significant positive effect on individual consumption but regional consumption shocks do not have much effect on individual consumption. This suggests that the degree of regional financial integration is very small. As in the case of output VAR, the ratios of cumulative impulse responses are calculated. More specifically, (1) the ratio of cumulative impulse responses of individual consumption (net of individual output) to cumulative impulse responses of world aggregate consumption (net of individual output) in the presence of world aggregate consumption (net of individual output) shocks. (2) The ratio of cumulative impulse responses of individual consumption (net of individual output) to cumulative impulse responses of Asian aggregate consumption (net of individual output) in the presence of Asian aggregate consumption (net of individual output) shocks. As shown in equation (4), these ratios can be interpreted as the extent of risk sharing with the world and within Asia. Figure 8 reports the ratios for 16 quarters with 90% probability bands. The result for pre-crisis period is not much different from that for post-crisis period. The individual consumption does not change much in response to regional aggregate consumption shocks. On the other hand, in response to world aggregate consumption shocks, individual consumption changes about 30–50% of world aggregate consumption changes. This result confirms that risk sharing within Asia is very small but risk sharing with the world is far larger. The results for forecast error variance decomposition with 90% probability bands are reported in Table 9. The role of world aggregate consumption shocks in explaining individual consumption is larger than the role of Asian aggregate consumption shocks. We can also find that the role of world aggregate consumption shocks in explaining individual consumption growth rate has increased substantially. This seems to be due to the larger size of world aggregate consumption shocks during the post-crisis period (given that the relative cumulative responses of individual consumption to world aggregate consumption are not very much different for two periods). On the other hand, the role of Asian aggregate consumption shocks has decreased after the crisis.11
11 A larger role during the pre-crisis period seems to be due to the non-smooth effects of Asian aggregate consumption shocks on
individual consumption, as shown in Figure 6.

14
C. Extended Experiments In the basic experiment, Japan is included to construct the East Asian aggregate but is excluded in constructing the world aggregate. In this section, we consider an alternative construction of world and Asian aggregates. Here Japan is included to construct the world aggregate but excluded in constructing the East Asian aggregate. By doing so, we can compare the link with G-7 countries including Japan and the link with mostly emerging East Asian economies (excluding Japan). Figure 9 reports the ratios of cumulative impulse responses for output VAR.12 As in the previous case, real links with the world and region are very low before the crisis, but increased substantially after the crisis. However, compared with the previous case, the degree of real dependence with the world is smaller but that with the region is slightly larger during the post crisis period. This may imply that real synchronization with Japan is low. The increase in the degree of real dependence with the region is as large as that with the world (they are in a similar magnitude), as in the previous case. Figure 10 reports the ratio of cumulative impulse responses for consumption VAR. The main conclusion is similar to that in Figure 5. For both periods, regional integration is nil, but global integration is substantial. The international risk sharing property does not change much over time. Finally, while the co-integration tests tend to reject the null hypothesis of co-integrating relation among three variables in consumption VAR, they do not in output VAR. Therefore, we examine the robustness of the results by imposing the estimated co-integrating relation among three variables in the VAR model, that is, by constructing the VECM (Vector Error Correction) model. Figures 11 and 12 report the cumulative impulse responses for the pre-crisis and post-crisis period, respectively. Figure 13 reports the ratios. In general, the main conclusion does not change; in particular, the real inter-dependence both within Asia and with the world increased substantially after the crisis. V. Conclusion In this paper, we examine the real and financial integration of East Asian economies. In particular, we compare the degree of real versus financial integration, the degree of global versus regional integration (within Asia), and the degree of integration before and after the Asian crisis. For this purpose, we analyze various measures of integration, including price, quantity, and macroeconomic aggregate measures. We find that real integration in the region has been accelerating, as evidenced by increasing intraregional trade among East Asian economies. Yet, the share of global markets in Asian trade remains substantial, although it has been decreasing. The price measures of financial integration from cross-country government bond yields, overnight interbank rates, and stock prices show that the degree of integration of financial markets of East Asian economies increased substantially after the Asian crisis. However, the data on the covered interest differentials and cross-border financial asset holdings suggest that the extent of regional integration remains limited, falling behind that of integration with global financial markets.
12 Impulse responses graphs for the 1990–96 and the 2000–07 periods can be provided upon request to the authors.

15
Findings from panel VAR models suggest that the extent of real integration based on output linkage increased substantially both regionally and globally after the Asian crisis. The increase in the degree of regional dependence seems to be as large as that in the degree of global dependence. On the contrary, the extent of financial integration based on consumption linkage shows that the degree of financial integration does not change much and global integration is substantial but regional integration is nil. These results also suggest some answers and reconcilements of the questions and debates raised in the past studies. The degree of trade and real integration within Asian regions increased substantially, but Asian economies are not decoupled from global economy, and still depend much on global economy. The volume of cross-border financial assets within Asia increased substantially, which may imply the substantial increase in the degree of financial integration based on volume measures. However, international risk sharing within Asia is very far from complete, showing a discrepancy between inferences based on the volume measure and consumption-based measure of international risk sharing. This may explain some discrepancies in the results of some past studies.13 Overall, we find that the degree of regional financial integration lags the extent of real integration in East Asia, and that the financial markets in East Asia are integrated relatively more with global markets than with each other. There is strong skepticism as to whether Asian regionalism can move forward successfully from trade (real) to financial and monetary integration, as occurred in the European integration. It is often argued that Asia’s wide diversity of economic development and political interest and lack of formal institutional arrangements will hinder further successful integration in the region. Since the Asian crisis, East Asian economies have made major financial cooperation initiatives such as (i) the economic review and policy dialogue, (ii) the regional reserve pooling arrangement (Chiang Mai Initiative), and (iii) the development of local-currency bond markets (the Asian Bond Markets Initiative and the Asian Bond Fund). To enhance regional financial development and integration, financial cooperation efforts must be strengthened. Future research on the role and prospect of regional cooperation in promoting financial and monetary integration in the region would be of great interest.
13 In fact, some recent studies such as Kose, Prasad, and Terrones (2007) documented such a discrepancy between the volume
measure and consumption-based measure of international risk sharing, especially for emerging economies.

16
References
Asian Development Bank. 2008. Forthcoming. Emerging Asian Regionalism. Manila: Asian Development Bank. ———. 2007. Uncoupling Asia: Myth and Reality. Asian Development Outlook 2007. pp. 66–81. Asdrubali, P. and S. Kim. 2004. Dynamic Risk Sharing in the U.S. and Europe. Journal of Monetary Economics. 51(4). pp. 809-836. ———. 2007. Forthcoming. Incomplete Risk Sharing and Incomplete Inter-temporal Consumption Smoothing. Journal of Money, Credit and Banking. Chai, H. and Y. Rhee. 2005. Financial Integration and Financial Efficiency in East Asia. Mimeo. Canova, F. and H. Dellas. 1993. Trade Interdependence and the International Business Cycle. Journal of International Economics. 34. pp. 23–47. Cavoli, T., R. S. Rajan and R. Siregar. 2004. A Survey of Financial Integration in East Asia: Trends, Issues and Implications. University of Adelaide. Mimeo. Crucini, M. J. 1999. On International and National Dimensions of Risk Sharing. Review of Economics and Statistics. 81. pp. 73 –84. Crucini, M. J. and G.D. Hess. 2000. International and Intranational Risk Sharing. In Hess, G. D., and van Wincoop, E., eds. Intranational Macroeconomics. Cambridge: Cambridge University Press. pp. 37–59. Crucini, M. J., C. Telmer and M. Zachariuadis. 2005. Understanding European Real Exchange Rates. American Economic Review. 95. pp. 724–738. Crucini, M and M. Shintani. 2006. Persistence in Law-of-One-Price Deviations: Evidence from Micro-data. Vanderbilt University Working Paper. Eichengreen, B. and Y. C. Park. 2004. Why Has There Been Less Financial Integration in Asia Than in Europe? Monetary Authority of Singapore (MAS) Staff Paper. Engel, C. 2000. Long-Run PPP May Not Hold After All. Journal of International Economics. 51(2). pp. 243–73. European Central Bank. 2007. Financial Integration in Europe. ECB: Germany. Frankel, J. and A. Rose. 1998. The Endogeneity of the Optimum Currency Area Criteria. Economic Journal. 108. pp. 1009–1025. Ghosh, S. R. 2006. East Asian Finance: The Road to Robust Markets. Washington DC: The International Bank for Reconstruction and Development/The World Bank. pp. 1–217. Im, K. S., M.P. Pesaran and Y. Shin 2003. Testing for Unit Roots in Heterogeneous Panels. Journal of Econometrics. 115. pp. 53–74.

17
Kose, M.A., E.S. Prasad and M.E. Terrones. 2007. How Does Financial Globalization Affect Risk Sharing? Patterns and Channels. IMF Working Paper WP 07/238. Kim, S., S.H. Kim and Y. Wang. 2006. Financial Integration and Consumption Risk Sharing in East Asia. Japan and the World Economy. 18. pp. 143–157. ———. 2004. Global vs. Regional Risk Sharing in East Asia. Asian Economic Papers. 3(3). pp. 182–201. Kim, S., J-W. Lee and K. Shin. 2007. Regional and Global Financial Integration in East Asia. In B. Eichengreen, C Wyplosz and Y.C. Park. eds. Forthcoming. China, Asia and the New World Economy. UK: Oxford University Press. Lee, J.-W. 2008. Patterns and Determinants for Cross-border Financial Asset Holdings in East Asia. ADB Working Paper Series on Regional Economic Integration No. 13. Murray, C. J. and D. H. Papell. The Purchasing Power Parity Persistence Paradigm. Journal of International Economics. 56. pp.1–19. Poonpatpibul, C. S. Tanboon and P. Leelapornchai. 2006. The Role of Financial Integration in East Asia in Promoting Regional Growth and Stability. Bank of Thailand. Mimeo. Pedroni, P. 1999. Critical Values for Cointegration Tests in Heterogeneous Panels with Multiple Regressors. Oxford Bulletin of Economics and Statistics. 61. pp. 635–670. Rogoff, K. 1996. The Purchasing Power Parity Puzzle. Journal of Economic Literature. 34(2). pp. 647–668. Sims, C. A. 1980. Macroeconomics and Reality. Econometrica. 48(1). pp. 1-48. Taylor, A. M. 2001. Potential Pitfalls for the Purchasing Power Parity Puzzle? Sampling and Specification Biases in Mean-Reversion Tests of the Law of One Price. Econometrica. 69(2). pp. 473–98. ———. 2002. A Century of Purchasing Power Parity. Review of Economics and Statistics 84(1). pp. 139–50.

18
Table 1: Estimated AR-1 Coefficients of the Real Exchange Rate A. Jan 1990–Dec 1996
PRC HKG INO KOR MAL PHI SIN TAP THA JPN US
PRC … … … … … … … … … … … HKG … … 0.868
(.050) 0.946 (.032)
0.899 (.045)
0.877 (.047)
0.880 (.053)
0.656 (.170) … 0.969
(.041) 0.935 (.051)
INO … 0.868 (.050) … 0.891
(.052) 0.908 (.047)
0.909 (.045)
0.889 (.048)
0.648 (.175) … 0.980
(.037) 0.838 (.059)
KOR … 0.946 (.032)
0.891 (.052) … 0.958
(.033) 0.908 (.045)
0.898 (.045)
0.839 (.116) … 0.980
(.033) 0.956 (.036)
MAL … 0.899 (.045)
0.908 (.047)
0.958 (.033) … 0.840
(.058) 0.906 (.045)
0.538 (.191) … 0.978
(.037) 0.917 (.045)
PHI … 0.877 (.047)
0.909 (.045)
0.908 (.045)
0.840 (.058) … 0.854
(.052) 0.610 (.159) … 0.941
(.042) 0.900 (.044)
SIN … 0.880 (.053)
0.889 (.048)
0.898 (.045)
0.906 (.045)
0.854 (.052) … 0.531
(.185) … 0.989 (.035)
0.920 (.048)
TAP … 0.656 (.170)
0.648 (.175)
0.839 (.116)
0.538 (.191)
0.610 (.159)
0.531 (.185) … … 0.631
(.111) 0.594 (.179)
THA … … … … … … … … … … … JPN … 0.969
(.041) 0.980 (.037)
0.980 (.033)
0.978 (.037)
0.941 (.042)
0.989 (.035)
0.631 (.111) … … 0.986
(.038)
Average … 0.871 0.870 0.917 0.861 0.848 0.850 0.636 … 0.924 0.881 exc. JPN … 0.854 0.852 0.907 0.842 0.833 0.826 0.637 … … 0.866 B. Jan 2000–Dec 2007
PRC HKG INO KOR MAL PHI SIN TAP THA JPN US
PRC … 0.891 (.057)
0.903 (.042)
0.943 (.037)
0.867 (.055)
0.956 (.026)
0.788 (.060)
0.948 (.038)
0.921 (.033)
0.159 (.043)
1.017 (.028)
HKG 0.891 (.057) … 0.890
(.043) 0.928 (.036)
0.887 (.050)
0.975 (.025)
0.851 (.053)
0.928 (.039)
0.950 (.029)
0.096 (0.029)
0.971 (.030)
INO 0.903 (.042)
0.890 (.043) … 0.907
(.042) 0.893 (.042)
0.978 (.033)
0.920 (.040)
0.900 (.041)
0.948 (.041)
0.665 (.066)
0.871 (.042)
KOR 0.943 (.037)
0.928 (.036)
0.907 (.042) … 0.949
(.032) 1.010 (.034)
0.947 (.040)
0.834 (.053)
0.991 (.036)
0.413 (.100)
0.932 (.030)
MAL 0.867 (.055)
0.887 (.050)
0.893 (.042)
0.949 (.032) … 0.967
(.025) 0.883 (.045)
0.953 (.033)
0.938 (.030)
0.205 (.031)
1.002 (.024)
PHI 0.956 (.026)
0.975 (.025)
0.978 (.033)
1.010 (.034)
0.967 (.025) … 0.970
(.028) 0.982 (.028)
0.921 (.042)
0.643 (.051)
0.990 (.019)
SIN 0.788 (.060)
0.851 (.053)
0.920 (.040)
0.947 (.040)
0.883 (.045)
0.970 (.028) … 0.911
(.047) 0.949 (.030)
0.050 (.063)
0.940 (.036)
TAP 0.948 (.038)
0.928 (.039)
0.900 (.041)
0.834 (.053)
0.953 (.033)
0.982 (.028)
0.911 (.047) … 0.958
(.032) -.052
(.090) 0.937 (.034)
THA 0.921 (.033)
0.950 (.029)
0.948 (.041)
0.991 (.036)
0.938 (.030)
0.921 (.042)
0.949 (.030)
0.958 (.032) … 0.621
(.067) 0.971 (.023)
JPN 0.159 (.043)
0.096 (0.029)
0.665 (.066)
0.413 (.100)
0.205 (.031)
0.643 (.051)
0.050 (.063)
-.052 (.090)
0.621 (.067) … 0.923
(.034)
Average 0.820 0.822 0.889 0.880 0.838 0.934 0.808 0.818 0.911 0.311 0.955 ex.PRC,THA … 0.794 0.879 0.855 0.820 0.932 0.790 0.779 … 0.289 0.946
and JPN … 0.910 0.915 0.929 0.922 0.980 0.914 0.918 … … 0.949
Notes: (…) no data available. The figures indicate AR-1 coefficients of bilateral real exchange rate based on monthly data. Average is the simple average of correlations with nine East Asian economies (excluding own economy). A linear time trend is included.
Source: Authors’ calculation based on International Financial Statistics data.

19
Table 2: Trade with Selected Economies in East Asia A. As % of Total Trade
East Asia 9 Japan US 90 95 00 06 90 95 00 06 90 95 00 06
China, People’s Rep. of 42.3 29.7 28.5 29.8 14.5 20.4 17.5 11.8 10.2 14.5 15.7 14.9 Hong Kong, China 47.6 54.1 58.3 64.9 10.9 10.7 8.9 7.7 16.1 14.4 14.8 9.8 Indonesia 23.5 30.6 35.9 48.7 34.3 25.0 20.7 14.6 12.3 12.9 12.4 8.0 Korea, Rep. of 11.8 22.9 27.5 34.4 21.9 18.6 15.7 12.3 25.6 20.6 20.2 12.2 Malaysia 35.6 35.0 40.5 45.6 19.7 20.1 16.7 10.8 16.9 18.5 18.8 16.0 Philippines 22.0 27.1 36.1 43.9 19.0 19.8 16.7 15.0 26.6 25.1 24.5 17.3 Singapore 31.7 39.2 41.6 50.1 14.8 14.6 12.3 6.8 18.5 16.6 16.2 11.3 Taipei,China 19.2 29.0 32.2 43.6 20.0 20.2 19.1 14.7 28.2 21.9 20.8 12.9 Thailand 22.4 25.5 30.3 35.0 25.0 22.9 19.5 16.4 15.7 13.7 16.8 10.9
East Asia 9 30.0 35.0 37.5 40.9 18.2 17.7 15.4 11.4 19.0 17.0 17.4 12.9 Japan 28.3 38.8 39.9 43.5 n.a. n.a. n.a. n.a. 27.5 25.4 25.2 17.7 East Asia 10 (incl. Japan) 40.6 48.5 49.3 50.5 n.a. n.a. n.a. n.a. 22.3 19.6 19.5 13.9
Memo Items: EU-25 65.4 65.1 65.1 65.4 3.2 3.0 2.6 1.7 7.1 6.9 8.5 6.1 NAFTA 37.2 42.0 46.8 42.0 13.1 11.4 8.3 5.9 17.8 21.2 24.0 20.7
B. As % of GDP
East Asia 9 Japan US 90 95 00 06 90 95 00 06 90 95 00 06
China, People’s Rep. of 6.4 5.7 5.6 9.9 2.2 3.9 3.5 3.9 1.5 2.8 3.1 5.0 Hong Kong, China 51.0 68.7 71.8 111.5 11.7 13.6 10.9 13.2 17.2 18.3 18.2 16.8 Indonesia 4.5 5.9 10.4 13.8 6.5 4.8 6.0 4.1 2.3 2.5 3.6 2.3 Korea, Rep. of, 3.2 5.9 8.9 11.2 5.9 4.8 5.1 4.0 6.9 5.3 6.6 4.0 Malaysia 23.7 29.9 40.4 44.5 13.1 17.1 16.7 10.6 11.3 15.7 18.7 15.6 Philippines 5.3 8.2 17.3 18.4 4.5 6.0 8.0 6.3 6.4 7.6 11.7 7.2 Singapore 48.9 56.5 61.1 96.9 22.9 21.1 18.1 13.2 28.5 23.9 23.8 21.9 Taipei,China 7.1 11.4 14.5 25.5 7.4 7.9 8.6 8.6 10.4 8.6 9.3 7.5 Thailand 7.4 10.3 16.2 22.0 8.2 9.3 10.4 10.3 5.2 5.5 9.0 6.9
East Asia 9 10.3 13.6 15.4 19.3 6.2 6.9 6.3 5.4 6.5 6.6 7.1 6.1 Japan 2.4 2.9 3.7 6.1 n.a. n.a. n.a. n.a. 2.4 1.9 2.3 2.5 East Asia 10 (incl. Japan) 6.5 8.2 10.4 16.1 n.a. n.a. n.a. n.a. 3.6 3.3 4.1 4.4
Memo Items: EU-25 14.3 14.7 18.9 20.8 0.7 0.7 0.8 0.5 7.1 6.9 8.5 6.1 NAFTA 3.4 4.8 6.1 5.8 1.2 1.3 1.1 0.8 17.8 21.2 24.0 20.7
Note: Total trade is the average of export and import.
Source: Direction of Trade Statistics, International Monetary Fund.

20
Table 3: Deviation from Covered Interest Parity
vis-à-vis USD IBOR vis-à-vis JPY IBOR Economy Average, 2000–03
Average, 2004–07
Average, 2000–03
Average, 2004–07
China, People’s Rep. of 0.019 0.016 0.025 0.030
Hong Kong, China 0.002 0.006 0.023 0.020
Indonesia … 0.043 … 0.070
Korea, Rep. of … 0.005 … 0.030
Malaysia … 0.001 … 0.024
Philippines 0.280 0.275 0.299 0.295
Singapore 0.005 0.004 0.028 0.031
Taipei,China … 0.024 … 0.009
Thailand … 0.023 … 0.019
Japan 0.023 0.026 … …
Notes: (…) no data available. The figures indicate the period average of absolute daily values of covered interest differentials, that is, interest differential less forward discount, based on 3-month interbank offer rates vis-à-vis corresponding US or Japanese rates. Source: Authors’ calculation based on Bloomberg data.

21
Table 4: Correlation for Stock Prices in East Asia A. 1990:Q2–1996:Q4
PRC HKG INO KOR MAL PHI SIN TAP THA JPN US
PRC 1 0.24 0.06 -0.47 0 0.02 -0.26 -0.09 -0.33 -0.49 0.14 HKG 0.24 1 0.59 -0.06 0.69 0.53 0.62 0.18 0.48 -0.15 0.57 INO 0.06 0.59 1 -0.06 0.68 0.51 0.59 0.15 0.67 -0.10 0.58 KOR -0.47 -0.06 -0.06 1 0.04 0.07 0.15 0.39 0.10 0.33 -0.22MAL 0 0.69 0.68 0.04 1 0.70 0.74 0.36 0.72 0.18 0.48 PHI 0.02 0.53 0.51 0.07 0.70 1 0.78 0.63 0.65 0.17 0.49 SIN -0.26 0.62 0.59 0.15 0.74 0.78 1 0.44 0.74 0.27 0.58 TAP -0.09 0.18 0.15 0.39 0.36 0.63 0.44 1 0.16 0.34 0.33 THA -0.33 0.48 0.67 0.10 0.72 0.65 0.74 0.16 1 -0.03 0.35 JPN -0.49 -0.15 -0.10 0.33 0.18 0.17 0.27 0.34 -0.03 1 -0.03 Average -0.15 0.35 0.34 0.06 0.46 0.45 0.45 0.28 0.35 0.06 0.33
B. 2000:Q1–2007:Q2
PRC HKG INO KOR MAL PHI SIN TAP THA JPN US
PRC 1 0.25 0.13 0.03 0.34 0.22 0.26 0.15 0.02 0.23 0.28 HKG 0.25 1 0.43 0.55 0.56 0.53 0.75 0.69 0.49 0.63 0.66 INO 0.13 0.43 1 0.61 0.67 0.69 0.72 0.46 0.76 0.50 0.45 KOR 0.03 0.55 0.61 1 0.52 0.66 0.68 0.78 0.70 0.60 0.55 MAL 0.34 0.56 0.67 0.52 1 0.53 0.69 0.64 0.61 0.46 0.36 PHI 0.22 0.53 0.69 0.66 0.53 1 0.83 0.62 0.68 0.47 0.67 SIN 0.26 0.75 0.72 0.68 0.69 0.83 1 0.65 0.65 0.57 0.70 TAP 0.15 0.69 0.46 0.78 0.64 0.62 0.65 1 0.69 0.57 0.56 THA 0.02 0.49 0.76 0.70 0.61 0.68 0.65 0.69 1 0.54 0.49 JPN 0.23 0.63 0.50 0.60 0.46 0.47 0.57 0.57 0.54 1 0.53 Average 0.18 0.54 0.55 0.57 0.56 0.58 0.64 0.58 0.57 0.51 0.53
Note: The figures indicate pairwise correlation coefficients of quarterly increase in stock prices in US dollar terms over the period. Average is the simple average of correlations with nine East Asian economies (excluding own economy). Source: Authors’ calculation based on Bloomberg data.

22
Table 5: Total Portfolio Investment in East Asia ($ billion)
Assets in Liabilities from Year Economy
East Asia 9 Japan US
TOTAL East
Asia 9 Japan US TOTAL
China, People’s Rep. of … … … … 10.03 1.67 3.00 20.26
Hong Kong, China 23.10 9.25 39.25 205.60 5.49 6.12 32.05 96.69
Indonesia 0.15 0.00 0.25 0.72 1.01 0.16 1.84 5.55
Korea, Rep. of 1.54 0.18 3.76 8.03 8.33 5.83 34.47 76.78
Malaysia 0.78 0.02 0.21 2.28 9.77 2.54 4.26 22.59
Philippines 0.12 0.01 1.84 2.13 2.63 1.56 4.02 12.73
Singapore 22.03 10.55 18.01 105.24 3.52 2.13 22.82 50.70
Taipei,China … … … … 3.46 0.48 19.86 41.09
Thailand 0.25 0.00 0.29 0.83 3.72 1.04 2.70 12.01
East Asia 9 47.97 20.01 63.62 324.83 47.97 21.52 125.02 338.39
As % of total 14.8% 6.2% 19.6% 100.0% 14.2% 6.4% 36.9% 100.0%
Japan 21.52 n.a. 490.20 1,289.75 20.01 n.a. 197.84 542.31
East Asia 10 69.49 n.a. 553.82 1,614.59 67.98 n.a. 322.86 880.69
2001
as % of total 4.3% n.a. 34.3% 100.0% 7.7% n.a. 36.7% 100.0%
China, People’s Rep of … … … … 115.70 10.27 75.31 281.64
Hong Kong, China 139.80 18.84 64.87 592.48 28.91 11.72 87.52 233.68
Indonesia 0.29 0.00 0.11 1.51 5.74 0.92 14.07 38.91
Korea, Rep. of 9.78 2.62 30.41 83.52 32.76 9.11 123.88 280.52
Malaysia 2.67 0.25 0.82 7.19 18.30 1.55 15.40 59.38
Philippines 1.32 0.01 3.09 7.16 1.99 1.60 10.99 30.25
Singapore 74.27 6.50 37.09 244.58 12.48 7.50 52.73 126.08
Taipei,China … … … … 7.35 2.66 74.45 145.09
Thailand 0.96 0.01 0.36 5.14 5.86 1.19 13.05 37.80
East Asia 9 229.09 28.23 136.75 941.58 229.09 46.52 467.40 1,233.37
as % of total 24.3% 3.0% 14.5% 100.0% 18.6% 3.8% 37.9% 100.0%
Japan 46.52 n.a. 797.61 2,343.48 28.23 n.a. 585.57 1,434.92
East Asia 10 275.61 n.a. 934.36 3,285.06 257.32 n.a. 1,052.96 2,668.29
2006
as % of total 8.4% n.a. 28.4% 100.0% 9.6% n.a. 39.5% 100.0%
Note: (…) no data available.
Source: Coordinated Portfolio Investment Survey (CPIS), International Monetary Fund.

23
Table 6: Correlation of Output in East Asia A. 1990:Q2–1996:Q4
HKG INO KOR MAL PHI PRC SIN TAP THA JPN US East Asia 9
East Asia 10
HKG 1 0.10 -0.05 -0.02 -0.09 0.22 -0.14 -0.10 0.29 -0.16 -0.04 0.29 -0.13 INO 0.10 1 -0.32 -0.31 0.02 -0.18 -0.25 -0.18 0.07 0.25 0.02 -0.34 0.22 KOR -0.05 -0.32 1 0.16 0.19 -0.40 -0.01 0.25 0.21 -0.14 -0.18 -0.33 -0.19 MAL -0.02 -0.31 0.16 1 -0.10 -0.29 0.16 0.20 -0.05 0 -0.14 -0.28 -0.03 PHI -0.09 0.02 0.19 -0.10 1 -0.10 0.04 -0.22 0.07 0.18 0.45 -0.04 0.19 PRC 0.22 -0.18 -0.40 -0.29 -0.10 1 0.08 0.08 0.07 -0.29 0.21 -0.30 -0.32 SIN -0.14 -0.25 -0.01 0.16 0.04 0.08 1 0.09 -0.34 -0.21 0.07 -0.06 -0.23 TAP -0.10 -0.18 0.25 0.20 -0.22 0.08 0.09 1 0.16 -0.12 0.19 0.16 -0.11 THA 0.29 0.07 0.21 -0.05 0.07 0.07 -0.34 0.16 1 -0.06 -0.03 0.22 -0.05 JPN -0.16 0.25 -0.14 0 0.18 -0.29 -0.21 -0.12 -0.06 1 -0.09 n.a. -0.33 Avg. 0 -0.09 -0.01 -0.03 0 -0.09 -0.06 0.02 0.05 -0.06 0.05 -0.08 -0.10
B. 2000:Q1–2007:Q2
HKG INO KOR MAL PHI PRC SIN TAP THA JPN US East Asia 9
East Asia 10
HKG 1 0.26 0.27 0.43 0.39 0.31 0.73 0.61 0.25 0.34 0.43 0.62 0.57 INO 0.26 1 0.03 0.32 0.02 -0.01 0.26 0.03 0.40 0.13 0.12 0.14 0.20 KOR 0.27 0.03 1 0.39 0.27 -0.19 0.36 0.36 0.13 0.36 0.02 0.11 0.35 MAL 0.43 0.32 0.39 1 0.47 -0.02 0.42 0.43 0.31 0.55 0.21 0.41 0.62 PHI 0.39 0.02 0.27 0.47 1 0.27 0.40 0.38 0.16 0.18 0.16 0.50 0.37 PRC 0.31 -0.01 -0.19 -0.02 0.27 1 0.40 0.29 0.01 -0.20 0.38 0.16 -0.08 SIN 0.73 0.26 0.36 0.42 0.40 0.40 1 0.78 0.40 0.25 0.48 0.78 0.58 TAP 0.61 0.03 0.36 0.43 0.38 0.29 0.78 1 0.21 0.22 0.47 0.62 0.49 THA 0.25 0.40 0.13 0.31 0.16 0.01 0.40 0.21 1 0.07 0.12 0.24 0.18 JPN 0.34 0.13 0.36 0.55 0.18 -0.20 0.25 0.22 0.07 1 0.10 n.a. 0.18 Avg. 0.40 0.16 0.22 0.37 0.28 0.10 0.45 0.37 0.21 0.21 0.25 0.40 0.35
Notes: The figures indicate pairwise correlation coefficients of changes in quarterly real GDP. Average is the simple average of correlations with nine East Asian economies (excluding own economy). Sources: Bloomberg, CEIC, International Financial Statistics (International Monetary Fund), and national sources.

24
Table 7: Correlation of Consumption in East Asia A. 1990:Q2–1996:Q4
HKG INO KOR MAL PHI PRC SIN TAP THA JPN US East Asia 9
East Asia 10
HKG 1 -0.02 0.07 0.32 -0.07 -0.02 0.32 0.20 -0.43 -0.10 -0.03 0.02 -0.07 INO -0.02 1 0.21 0.45 0.13 -0.10 -0.34 -0.23 -0.09 0.25 -0.11 -0.06 0.18 KOR 0.07 0.21 1 -0.01 0.14 -0.54 0.01 -0.16 -0.02 0.13 -0.09 -0.44 -0.12 MAL 0.32 0.45 -0.01 1 -0.08 0.24 -0.31 -0.17 -0.07 0 -0.09 0.43 0.20 PHI -0.07 0.13 0.14 -0.08 1 -0.18 0.02 0.06 0.11 0.31 0.02 -0.13 0.20 PRC -0.02 -0.10 -0.54 0.24 -0.18 1 -0.23 0.19 0.09 0.03 0.36 -0.19 -0.01 SIN 0.32 -0.34 0.01 -0.31 0.02 -0.23 1 0.41 -0.15 -0.05 0.05 -0.31 -0.18 TAP 0.20 -0.23 -0.16 -0.17 0.06 0.19 0.41 1 -0.18 -0.01 0.36 0.06 0.02 THA -0.43 -0.09 -0.02 -0.07 0.11 0.09 -0.15 -0.18 1 0.17 0.09 0 0.12 JPN -0.10 0.25 0.13 0 0.31 0.03 -0.05 -0.01 0.17 1 -0.07 n.a. 0.14 Avg. 0.03 0.03 -0.02 0.04 0.05 -0.06 -0.03 0.01 -0.06 0.08 0.05 -0.07 0.05 B. 2000:Q1–2007:Q2
HKG INO KOR MAL PHI PRC SIN TAP THA JPN US East Asia 9
East Asia 10
HKG 1 0.13 0.17 0.19 0.39 0.34 0.58 0.71 -0.20 0.23 0.30 0.49 0.49 INO 0.13 1 -0.07 0.15 0.14 -0.32 0.10 0.11 -0.04 0.04 -0.11 -0.22 -0.12 KOR 0.17 -0.07 1 -0.03 -0.28 0.15 0.26 0.23 -0.46 0.10 0.22 0.17 0.17 MAL 0.19 0.15 -0.03 1 0.22 0.07 0.18 0.05 -0.40 (0.26) 0.22 0.08 -0.09 PHI 0.39 0.14 -0.28 0.22 1 0.13 -0.01 0.27 0.06 0.25 0.31 0.15 0.29 PRC 0.34 -0.32 0.15 0.07 0.13 1 0.11 0.42 -0.20 0.06 0.48 0.33 0.18 SIN 0.58 0.10 0.26 0.18 -0.01 0.11 1 0.55 -0.15 0.05 0 0.29 0.21 TAP 0.71 0.11 0.23 0.05 0.27 0.42 0.55 1 -0.09 0.07 0.35 0.53 0.38 THA -0.20 -0.04 -0.46 -0.40 0.06 -0.20 -0.15 (0.09) 1 0.12 -0.10 -0.32 -0.18 JPN 0.23 0.04 0.10 -0.26 0.25 0.06 0.05 0.07 0.12 1 0.21 n.a. 0.09 Avg. 0.28 0.03 0.01 0.02 0.13 0.09 0.19 0.26 -0.15 0.07 0.19 0.17 0.14
Notes: The figures indicate pairwise correlation coefficients of changes in quarterly real consumption. Average is the simple average of correlations with nine East Asian economies (excluding own economy). Sources: Bloomberg, CEIC, International Financial Statistics (International Monetary Fund), and national sources.

25
Table 8: Variance Decomposition of Individual Output Growth Rate Horizon 1990–1996 2000–2007:2
Asian Agg World Agg Asian Agg World Agg
1 quarter 4.2 (0.9, 8.8) 0.4 (0.0, 1.7) 0.4 (0.0, 1.6) 10.3 (4.9, 16.8)
4 quarters 5.5 (1.8, 10.0) 1.9 (0.4, 4.3) 6.2 (2.4, 11.0) 18.8 (12.0, 26.4)
8 quarters 6.3 (2.5, 11.0) 2.3 (0.6, 5.0) 8.0 (4.0, 13.1) 20.6 (13.5, 28.5)
16 quarters 6.5 (2.7, 11.5) 2.4 (0.7, 5.1) 8.7 (4.4, 14.1) 21.1 (13.8, 29.0)
Table 9: Variance Decomposition of Individual Consumption Growth Rate Horizon 1990–1996 2000–2007:2
Asian Agg World Agg Asian Agg World Agg
1 quarters 0.4 (0.0, 1.7) 6.8 (2.2, 12.7) 0.4 (0.0, 1.5) 14.6 (8.2, 21.3)
4 quarters 2.7 (0.6, 5.7) 7.4 (3.0, 13.0) 1.7 (0.3, 4.0) 15.7 (9.3, 22.3)
8 quarters 8.0 (2.8, 15.1) 7.9 (3.2, 14.1) 2.5 (0.6, 5.5) 16.0 (9.6, 22.7)
16 quarters 8.1 (2.9, 15.3) 8.0 (3.3, 14.3) 2.5 (0.6, 5.8) 16.0 (9.6, 22.6)

26
2.0
2.5
3.0
3.5
4.0
4.5
5.0
5.5
6.0
Mar-99 Mar-00 Mar-01 Mar-02 Mar-03 Mar-04 Mar-05 Mar-06 Mar-07
5- yr maturity 10-yr maturity
Basis points of avg. standard deviation
Figure 1: Cross-Country Average Standard Deviation of Government Bond Yield Spread
Source: Bloomberg.

27
Source: Bloomberg.
Figure 2: Cross-Country Average Standard Deviation of Overnight Interbank Rates
0
5
10
15
20
Mar-97 Mar-98 Mar-99 Mar-00 Mar-01 Mar-02 Mar-03 Mar-04 Mar-05 Mar-06 Mar-07
Basis points of avg. standard deviation

28
Figure 3: Cumulative Impulse Responses to World and Regional Output Shocks for 10 East Asian Economies, 1990–1996.
Cumulative Impulse responses (90% Bands), 1990-1996, A10R
espo
nses
of
DRY_G6I
DRY_A10I
DRYI
DRY_G6I DRY_A10I DRYI
0 5 10 15-0.2
-0.1
0.0
0.1
0.2
0.3
0.4
0.5
0.6
0 5 10 15-0.2
-0.1
0.0
0.1
0.2
0.3
0.4
0.5
0.6
0 5 10 15-0.2
-0.1
0.0
0.1
0.2
0.3
0.4
0.5
0.6
0 5 10 15-0.4
-0.2
0.0
0.2
0.4
0.6
0.8
0 5 10 15-0.4
-0.2
0.0
0.2
0.4
0.6
0.8
0 5 10 15-0.4
-0.2
0.0
0.2
0.4
0.6
0.8
0 5 10 15-0.50
-0.25
0.00
0.25
0.50
0.75
1.00
1.25
0 5 10 15-0.50
-0.25
0.00
0.25
0.50
0.75
1.00
1.25
0 5 10 15-0.50
-0.25
0.00
0.25
0.50
0.75
1.00
1.25
Cumulative Impulse responses (90% Bands), 2000-2007:2, A10
Res
pons
es o
f
DRY_G6I
DRY_A10I
DRYI
DRY_G6I DRY_A10I DRYI
0 5 10 15-0.1
0.0
0.1
0.2
0.3
0.4
0.5
0.6
0 5 10 15-0.1
0.0
0.1
0.2
0.3
0.4
0.5
0.6
0 5 10 15-0.1
0.0
0.1
0.2
0.3
0.4
0.5
0.6
0 5 10 150.0
0.2
0.4
0.6
0.8
1.0
1.2
0 5 10 150.0
0.2
0.4
0.6
0.8
1.0
1.2
0 5 10 150.0
0.2
0.4
0.6
0.8
1.0
1.2
0 5 10 15-0.2
0.0
0.2
0.4
0.6
0.8
1.0
1.2
0 5 10 15-0.2
0.0
0.2
0.4
0.6
0.8
1.0
1.2
0 5 10 15-0.2
0.0
0.2
0.4
0.6
0.8
1.0
1.2
Figure 4: Cumulative Impulse Responses to World and Regional Output Shocks for 10 East Asian Economies, 2000–2007.

29
Relative Cumulative Responses (90% Bands), A10, Output VAR
Y(i)/Y(W)
Y(i)/Y(R)
1990-1996 2000-2007:2
2 4 6 8 10 12 14 16-1.0
0.0
1.0
2.0
2 4 6 8 10 12 14 16-2.0
-1.0
0.0
1.0
2 4 6 8 10 12-1.0
0.0
1.0
2.0
2 4 6 8 10 12-2.0
-1.0
0.0
1.0
Figure 5: Relative Cumulative Impulse Responses to World and Regional Output Shocks for 10 East Asian Economies.
Cumulative Impulse responses (90% Bands), 1990-1996, A10
Res
pons
es o
f
DRCGI
DRCAI
DRCI
DRCGI DRCAI DRCI
0 5 10 15-0.50
-0.25
0.00
0.25
0.50
0.75
1.00
1.25
0 5 10 15-0.50
-0.25
0.00
0.25
0.50
0.75
1.00
1.25
0 5 10 15-0.50
-0.25
0.00
0.25
0.50
0.75
1.00
1.25
0 5 10 15-0.50
-0.25
0.00
0.25
0.50
0.75
1.00
1.25
0 5 10 15-0.50
-0.25
0.00
0.25
0.50
0.75
1.00
1.25
0 5 10 15-0.50
-0.25
0.00
0.25
0.50
0.75
1.00
1.25
0 5 10 15-0.5
0.0
0.5
1.0
1.5
2.0
2.5
0 5 10 15-0.5
0.0
0.5
1.0
1.5
2.0
2.5
0 5 10 15-0.5
0.0
0.5
1.0
1.5
2.0
2.5
Figure 6: Cumulative Impulse Responses to World and Regional Consumption (Net of Domestic Output) Shocks for 10 East Asian Economies, 1990–1996.

30
Cumulative Impulse responses (90% Bands), 2000-2007:2, A10
Res
pons
es o
f
DRCGI
DRCAI
DRCI
DRCGI DRCAI DRCI
0 5 10 15-0.2
0.0
0.2
0.4
0.6
0.8
1.0
1.2
1.4
0 5 10 15-0.2
0.0
0.2
0.4
0.6
0.8
1.0
1.2
1.4
0 5 10 15-0.2
0.0
0.2
0.4
0.6
0.8
1.0
1.2
1.4
0 5 10 15-0.2
0.0
0.2
0.4
0.6
0.8
1.0
1.2
0 5 10 15-0.2
0.0
0.2
0.4
0.6
0.8
1.0
1.2
0 5 10 15-0.2
0.0
0.2
0.4
0.6
0.8
1.0
1.2
0 5 10 15-0.50
-0.25
0.00
0.25
0.50
0.75
1.00
1.25
1.50
0 5 10 15-0.50
-0.25
0.00
0.25
0.50
0.75
1.00
1.25
1.50
0 5 10 15-0.50
-0.25
0.00
0.25
0.50
0.75
1.00
1.25
1.50
Figure 7: Cumulative Impulse Responses to World and Regional Consumption (Net of Domestic Output) Shocks for 10 East Asian Economies, 2000–2007:2.
Relative Cumulative Responses (90% Bands), A10, Consumption VAR
C(i)/C(W)
C(i)/C(R)
1990-1996 2000-2007:2
5 10 15-0.25
0.00
0.25
0.50
0.75
1.00
2 4 6 8 10 12 14 16-2.0
-1.0
0.0
1.0
2 4 6 8 10 12-0.25
0.00
0.25
0.50
0.75
1.00
2 4 6 8 10 12-2.0
-1.0
0.0
1.0
Figure 8: Relative Cumulative Impulse Responses to World and Regional Consumption (Net of Domestic Output) Shocks for 10 East Asian Economies.

31
Relative Cumulative Responses (90% Bands), A9, Output VAR
Y(i)/Y(W)
Y(i)/Y(R)
1990-1996 2000-2007:2
2 4 6 8 10 12 14 16-1.0
-0.5
0.00.5
1.0
1.5
2 4 6 8 10 12 14 16-1.5
-0.5
0.5
1.5
2 4 6 8 10 12-1.0
-0.5
0.00.5
1.0
1.5
2 4 6 8 10 12-1.5
-0.5
0.5
1.5
Relative Cumulative Responses (90% Bands), A9, Consumption VAR
Y(i)/Y(W)
Y(i)/Y(R)
1990-1996 2000-2007:2
5 10 15-0.250.00
0.250.50
0.751.00
2 4 6 8 10 12 14 16-6-4-2
02
4
2 4 6 8 10 12-0.250.00
0.250.50
0.751.00
2 4 6 8 10 12-6-4-2
02
4
Figure 9: Relative Cumulative Impulse Responses to World and Regional Output Shocks for 9 East Asian Economies.
Figure 10: Relative Cumulative Impulse Responses to World and Regional Consumption (Net of Domestic Output) Shocks for 9 East Asian Economies.

32
Cumulative Impulse responses, 1990-1996, A10, VECM
Res
pons
es o
f
DRY_G6I
DRY_A10I
DRYI
DRY_G6I
DRY_G6I
DRY_A10I
DRY_A10I
DRYI
DRYI
0 1 2 3 4 5 6 7 8 9 10 11 12 13 14 15-0.2
-0.1
0.0
0.1
0.2
0.3
0.4
0.5
0 1 2 3 4 5 6 7 8 9 10 11 12 13 14 15-0.2
-0.1
0.0
0.1
0.2
0.3
0.4
0.5
0 1 2 3 4 5 6 7 8 9 10 11 12 13 14 15-0.2
-0.1
0.0
0.1
0.2
0.3
0.4
0.5
0 1 2 3 4 5 6 7 8 9 10 11 12 13 14 15-0.4
-0.2
0.0
0.2
0.4
0.6
0.8
0 1 2 3 4 5 6 7 8 9 10 11 12 13 14 15-0.4
-0.2
0.0
0.2
0.4
0.6
0.8
0 1 2 3 4 5 6 7 8 9 10 11 12 13 14 15-0.4
-0.2
0.0
0.2
0.4
0.6
0.8
0 1 2 3 4 5 6 7 8 9 10 11 12 13 14 15-1.0
-0.5
0.0
0.5
1.0
1.5
2.0
2.5
0 1 2 3 4 5 6 7 8 9 10 11 12 13 14 15-1.0
-0.5
0.0
0.5
1.0
1.5
2.0
2.5
0 1 2 3 4 5 6 7 8 9 10 11 12 13 14 15-1.0
-0.5
0.0
0.5
1.0
1.5
2.0
2.5
Cumulative Impulse responses, 2000-2007:2, A10, VECM
Res
pons
es o
f
DRY_G6I
DRY_A10I
DRYI
DRY_G6I
DRY_G6I
DRY_A10I
DRY_A10I
DRYI
DRYI
0 1 2 3 4 5 6 7 8 9 10 11 12 13 14 15-0.1
0.0
0.1
0.2
0.3
0.4
0.5
0.6
0 1 2 3 4 5 6 7 8 9 10 11 12 13 14 15-0.1
0.0
0.1
0.2
0.3
0.4
0.5
0.6
0 1 2 3 4 5 6 7 8 9 10 11 12 13 14 15-0.1
0.0
0.1
0.2
0.3
0.4
0.5
0.6
0 1 2 3 4 5 6 7 8 9 10 11 12 13 14 15-0.25
0.00
0.25
0.50
0.75
1.00
1.25
0 1 2 3 4 5 6 7 8 9 10 11 12 13 14 15-0.25
0.00
0.25
0.50
0.75
1.00
1.25
0 1 2 3 4 5 6 7 8 9 10 11 12 13 14 15-0.25
0.00
0.25
0.50
0.75
1.00
1.25
0 1 2 3 4 5 6 7 8 9 10 11 12 13 14 15-0.2
0.0
0.2
0.4
0.6
0.8
1.0
1.2
1.4
0 1 2 3 4 5 6 7 8 9 10 11 12 13 14 15-0.2
0.0
0.2
0.4
0.6
0.8
1.0
1.2
1.4
0 1 2 3 4 5 6 7 8 9 10 11 12 13 14 15-0.2
0.0
0.2
0.4
0.6
0.8
1.0
1.2
1.4
Figure 11: Cumulative Impulse Responses to World and Regional Output Shocks for 10 East Asian Economies in VECM Model, 1990–1996.
Figure 12: Cumulative Impulse Responses to World and Regional Output Shocks for 10 East Asian Economies in VECM Model, 2000–2007:2.
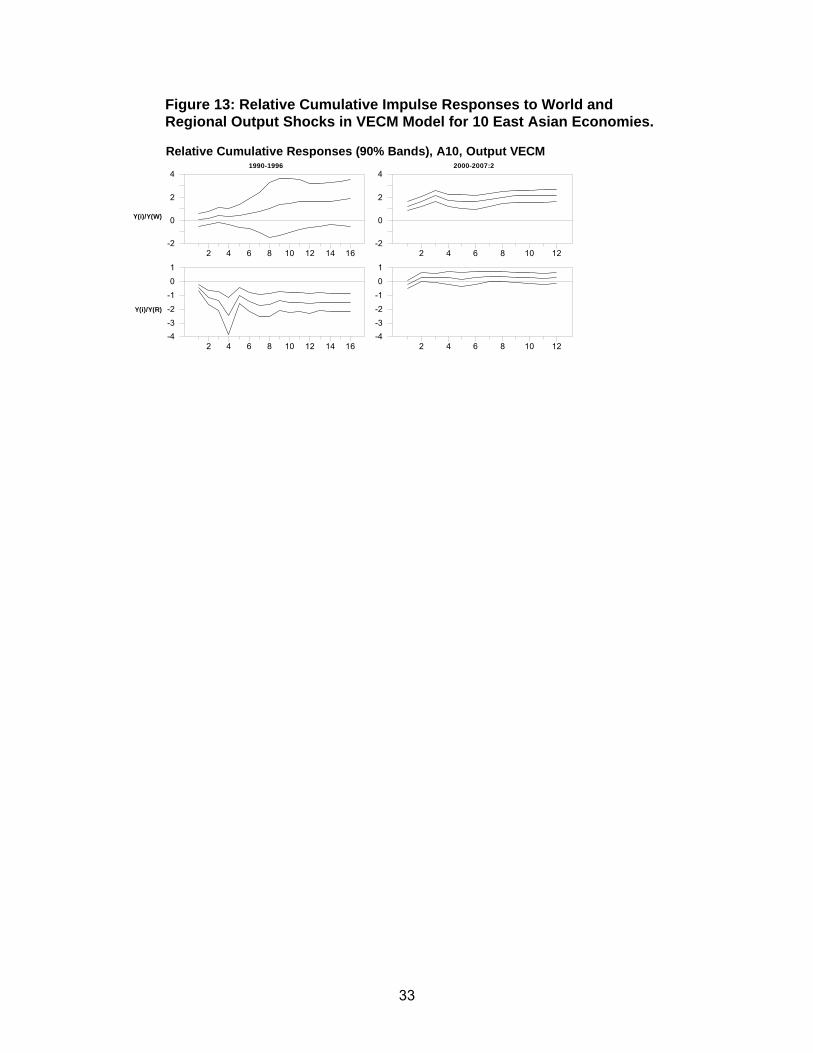
33
Relative Cumulative Responses (90% Bands), A10, Output VECM
Y(i)/Y(W)
Y(i)/Y(R)
1990-1996 2000-2007:2
2 4 6 8 10 12 14 16-2
0
2
4
2 4 6 8 10 12 14 16-4-3-2
-1
0
1
2 4 6 8 10 12-2
0
2
4
2 4 6 8 10 12-4-3-2
-1
0
1
Figure 13: Relative Cumulative Impulse Responses to World and Regional Output Shocks in VECM Model for 10 East Asian Economies.

34
ADB Working Paper Series on Regional Economic Integration*
1. “The ASEAN Economic Community and the European Experience” by Michael G. Plummer
2. “Economic Integration in East Asia: Trends, Prospects, and a Possible Roadmap” by Pradumna B. Rana
3. “Central Asia after Fifteen Years of Transition: Growth, Regional Cooperation, and Policy Choices” by Malcolm Dowling and Ganeshan Wignaraja
4. “Global Imbalances and the Asian Economies: Implications for Regional Cooperation” by Barry Eichengreen
5. “Toward Win-Win Regionalism in Asia: Issues and Challenges in Forming Efficient Trade Agreements” by Michael G. Plummer
6. “Liberalizing Cross-Border Capital Flows: How Effective Are Institutional Arrangements against Crisis in Southeast Asia” by Alfred Steinherr, Alessandro Cisotta, Erik Klär, and Kenan Šehović
7. “Managing the Noodle Bowl: The Fragility of East Asian Regionalism” by Richard E. Baldwin
8. “Measuring Regional Market Integration in Developing Asia: a Dynamic Factor Error Correction Model (DF-ECM) Approach” by Duo Qin, Marie Anne Cagas, Geoffrey Ducanes, Nedelyn Magtibay-Ramos, and Pilipinas F. Quising
9. “The Post-Crisis Sequencing of Economic Integration in Asia: Trade as a Complement to a Monetary Future” by Michael G. Plummer and Ganeshan Wignaraja
10. “Trade Intensity and Business Cycle Synchronization: The Case of East Asia” by Pradumna B. Rana
11. "Inequality and Growth Revisited" by Robert J. Barro
12. "Securitization in East Asia" by Paul Lejot, Douglas Arner, and Lotte Schou-Zibell
13. "Patterns and Determinants of Cross-border Financial Asset Holdings in East Asia" by Jong-Wha Lee
14. "Regionalism as an Engine of Multilateralism: A Case for a Single East Asian FTA" by Masahiro Kawai and Ganeshan Wignaraja
15. "The Impact of Capital Inflows on Emerging East Asian Economies: Is Too Much Money Chasing Too Little Good?" by Soyoung Kim and Doo Yong Yang
16. "Emerging East Asian Banking Systems Ten Years after the 1997/98 Crisis" by Charles Adams
* These papers can be downloaded from: (ARIC) http://aric.adb.org/reipapers/ or (ADB) http://www.adb.org/ publications/category.asp?id=2805


About the Asian Development Bank
ADB’s vision is an Asia and Pacific region free of poverty. Its mission is to help its developing member countries substantially reduce poverty and improve the quality of life of their people. Despite the region’s many successes, it remains home to two thirds of the world’s poor. Nearly 1.7 billion people in the region live on $2 or less a day. ADB is committed to reducing poverty through inclusive economic growth, environmentally sustainable growth, and regional integration.
Based in Manila, ADB is owned by 67 members, including 48 from the region. Its main instruments for helping its developing member countries are policy dialogue, loans, equity investments, guarantees, grants, and technical assistance. In 2007, it approved $10.1 billion of loans, $673 million of grant projects, and technical assistance amounting to $243 million.
About the paper
Soyoung Kim and Jong-Wha Lee find real integration in East Asia has been accelerating. Yet also point out that regional financial integration lags the extent of real integration, and that financial markets are relatively more integrated with global markets than with each other.
Asian Development Bank6 ADB Avenue, Mandaluyong City1550 Metro Manila, Philippineswww.adb.orgPublication Stock No. PPA202208 Printed in the Philippines