regional synthesis east asia and the pacific - in School
103
1 East Asia and the Pacific Regional Office Global Initiative on Out-of-School Children REGIONAL SYNTHESIS EAST ASIA AND THE PACIFIC November 2012
-
Upload
khangminh22 -
Category
Documents
-
view
2 -
download
0
Transcript of regional synthesis east asia and the pacific - in School

1
East Asia and the Pacific
Regional Office
Global Initiative on Out-of-School Children
REGIONAL SYNTHESIS EAST ASIA AND THE PACIFIC
November 2012
2
TABLE OF CONTENTS
ABBREVIATIONS ........................................................................................................................................................ 6
ACKNOWLEDGEMENTS ............................................................................................................................................. 8
EXECUTIVE SUMMARY .............................................................................................................................................. 9
CHAPTER 1: INTRODUCTION ................................................................................................................................. 10
GLOBAL INITIATIVE ON OUT OF SCHOOL CHILDREN ........................................................................................................... 10 SOCIO-ECONOMIC CONTEXT .............................................................................................................................................. 10 OVERVIEW OF EDUCATION IN EAST ASIA AND THE PACIFIC ................................................................................................ 12
Notable trends ........................................................................................................................................................ 12 Pre-primary education .......................................................................................................................................... 13 Primary Education ................................................................................................................................................. 13 Transition to Lower Secondary Education ......................................................................................................... 13 Secondary Education ............................................................................................................................................. 14 Gender ...................................................................................................................................................................... 14 Ethnicity ................................................................................................................................................................... 15
THE FIVE DIMENSIONS OF EXCLUSION ................................................................................................................................ 16
CHAPTER 2: PROFILES OF EXCLUDED CHILDREN ................................................................................................ 19
INTRODUCTION ................................................................................................................................................................ 19 Analytical Framework ........................................................................................................................................... 19 Basis of Data Sources Used in the Country Reports .......................................................................................... 21 Effect of Survey Time on OOSC .............................................................................................................................. 22 Education Systems of Different Countries .......................................................................................................... 23 UIS Data ................................................................................................................................................................... 23
DIMENSION 1: OOSC OF PRE-PRIMARY AGE ..................................................................................................................... 24 Disparities in Dimension 1.................................................................................................................................... 27
DIMENSIONS 2 AND 3: OOSC OF PRIMARY AND LOWER SECONDARY AGE .......................................................................... 30 Dimension 2: Primary age children out of school ............................................................................................. 30 Disparities in Dimension 2.................................................................................................................................... 33
DIMENSION 3: LOWER SECONDARY AGE CHILDREN OUT OF SCHOOL .................................................................................... 34 Disparities in Dimension 3.................................................................................................................................... 38 Number of Children in and out of School ............................................................................................................ 39 Attendance Rate of School Age Children ............................................................................................................. 40
DIMENSIONS 4 AND 5: CHILDREN AT RISK OF EXCLUSION ................................................................................................... 42 Dropout .................................................................................................................................................................... 44 Repetition ................................................................................................................................................................ 47 Over-age .................................................................................................................................................................. 48
ANALYTICAL SUMMARY OF PROFILES OF EXCLUDED CHILDREN ........................................................................................... 52 Dimension 1: Pre-primary school age children ................................................................................................. 53 Dimension 3: Lower secondary school age children ......................................................................................... 55
CHAPTER 3: BARRIERS AND BOTTLENECKS ........................................................................................................ 58
SOCIAL CULTURAL, DEMAND SIDE BARRIERS ...................................................................................................................... 59 Perception on the value of education .................................................................................................................. 59 Limited right-age entry to school ........................................................................................................................ 60 Gender bias and discrimination .......................................................................................................................... 60 Disability ................................................................................................................................................................. 62 Migration and lack of birth registration ............................................................................................................ 64
ECONOMIC DEMAND SIDE BARRIERS .................................................................................................................................. 65 Direct and indirect fees ......................................................................................................................................... 66 Health and Nutrition .............................................................................................................................................. 66 Natural disasters .................................................................................................................................................... 68

3
SUPPLY SIDE BARRIERS .................................................................................................................................................... 68 Access ....................................................................................................................................................................... 69 Water and Sanitation in Schools .......................................................................................................................... 70 Quality...................................................................................................................................................................... 71 Language ................................................................................................................................................................. 73 Lack of early childhood development services .................................................................................................. 73
POLITICAL, GOVERNANCE, CAPACITY AND FINANCING......................................................................................................... 74 Decentralization and governance ....................................................................................................................... 74 Education financing ............................................................................................................................................... 75
CHAPTER 4: POLICIES AND STRATEGIES .............................................................................................................. 78
SOCIAL CULTURAL, DEMAND-SIDE POLICIES AND STRATEGIES............................................................................................. 78 Community participation ...................................................................................................................................... 78 Promoting awareness on the importance of ECD and school readiness ........................................................ 79 Promoting gender equality in education............................................................................................................ 80 Disability ................................................................................................................................................................. 81 Birth certificate ...................................................................................................................................................... 83
ECONOMIC DEMAND SIDE POLICIES AND STRATEGIES ......................................................................................................... 84 Lowering the cost of Education ............................................................................................................................ 84 Increasing household income............................................................................................................................... 85 Health and nutrition .............................................................................................................................................. 87 Education for disaster risk management ........................................................................................................... 89
SUPPLY SIDE POLICIES AND STRATEGIES ............................................................................................................................ 90 Expanding access ................................................................................................................................................... 90 Quality...................................................................................................................................................................... 92 Language in education .......................................................................................................................................... 94 Expansion of Early Childhood Development ...................................................................................................... 96
GOVERNANCE AND FINANCING .......................................................................................................................................... 96 School based management ................................................................................................................................... 96 Education Financing .............................................................................................................................................. 97
CHAPTER 5: CONCLUSIONS ................................................................................................................................... 101
4
LIST OF FIGURES
FIGURE 1: FIVE DIMENSIONS OF EXCLUSION (5DE)............................................................................ 17
FIGURE 2: PERCENTAGE OF PRE-PRIMARY AGE CHILDREN NOT IN SCHOOL .......................................... 26
FIGURE 3: REGIONAL/PROVINCIAL VARIATION ON ATTENDANCE RATE (%) OF PRE-PRIMARY AGE
CHILDREN ..................................................................................................................................... 30
FIGURE 4: PERCENTAGE OF PRIMARY SCHOOL AGE CHILDREN IN AND OUT OF SCHOOL ..................... 32
FIGURE 5: MAXIMUM SUB-NATIONAL DIFFERENCES (%) FROM NATIONAL AVERAGES IN SCHOOL
ATTENDANCE OF PRIMARY AGE CHILDREN .................................................................................... 33
FIGURE 6: ATTENDANCE STATUS OF LOWER SECONDARY SCHOOL AGE CHILDREN ............................. 35
FIGURE 7: GENDER PARITY INDEX OF ON THE LOWER SECONDARY ANAR, PRIMARY GRADE
ATTENDANCE RATE AND OUT-OF-SCHOOL RATE .......................................................................... 37
FIGURE 8: PERCENTAGE OF SCHOOL ATTENDANCE RATE BY AGE........................................................ 41
FIGURE 9: GPI ON SCHOOL ATTENDANCE RATE BY AGE ..................................................................... 42
I. TIMOR-LESTE ................................................................................................................................ 44
II. VIET NAM ..................................................................................................................................... 45
FIGURE 10: PERCENTAGE OF DROPOUT CHILDREN IN VIET NAM ........................................................ 46
I. CAMBODIA .................................................................................................................................... 47
FIGURE 11: CHANCE OF HAVING A NUMBER OF REPEATS BEFORE COMPLETION OF A GRADE,
CAMBODIA .................................................................................................................................... 48
FIGURE 12: OVER-AGE BY GRADE ....................................................................................................... 50
FIGURE 13: PRIMARY AND LOWER SECONDARY GRADES OVER-AGE RATE IN VIET NAM BY PROVINCE
..................................................................................................................................................... 51
FIGURE 14 AND 15: CHANGE IN FINANCIAL COMMITMENTS TO EDUCATION, EAP COUNTRIES (2000-
2010) .......................................................................................................................................... 76
5
List of Tables TABLE 1: INFORMATION ON SURVEYS AND SURVEY TIME IN RESPECT TO ACADEMIC YEAR ................ 22
TABLE 2: AGE RANGES OF NATIONAL EDUCATION SYSTEMS ACCORDING TO THE INTERNATIONAL
STANDARD CLASSIFICATION OF EDUCATION................................................................................. 23
TABLE 3: UIS DATA ON OUT-OF-SCHOOL RATE ................................................................................. 24
TABLE 4: SCHOOL ATTENDANCE OF PRE-PRIMARY AGE CHILDREN .................................................... 25
TABLE 5: THE NUMBER OF OUT OF SCHOOL CHILDREN AT PRE-PRIMARY SCHOOL AGE .................... 25
TABLE 6: GENDER VARIATION IN SCHOOL ATTENDANCE RATE OF PRE-PRIMARY AGE CHILDREN ...... 27
TABLE 7: RELATIVE DEVIATIONS ON SCHOOL ATTENDANCE RATE OF PRE-PRIMARY AGE CHILDREN 28
TABLE 8: PRIMARY ANAR AND GPI ................................................................................................... 30
TABLE 9: PERCENTAGE OF OUT OF SCHOOL CHILDREN AT PRIMARY SCHOOL AGE ............................. 31
TABLE 10: DIFFERENCES FROM NATIONAL AVERAGES FOR PRIMARY ANAR ..................................... 33
TABLE 11: LOWER SECONDARY ANAR AND GPI ................................................................................ 34
TABLE 12: LOWER SECONDARY SCHOOL AGE ATTENDING PRIMARY GRADES AND GPI ..................... 34
TABLE 13: PERCENTAGE OF OUT OF SCHOOL CHILDREN AT LOWER SECONDARY SCHOOL AGE AND GPI
..................................................................................................................................................... 35
TABLE 14: VARIATION IN SCHOOL ATTENDANCE RATE OF LOWER SECONDARY AGE CHILDREN ......... 38
TABLE 15: MAXIMUM AND AVERAGE LEVELS OF DIFFERENCE BETWEEN NATIONAL AVERAGE AND SUB-
NATIONAL LEVELS OF OUT OF SCHOOL CHILDREN AT LOWER SECONDARY SCHOOL AGE .............. 38
TABLE 16: URBAN AND RURAL VARIATIONS IN LOWER SECONDARY OOSC RATE ............................. 39
TABLE 17: NUMBER OF OOSC RESPECTIVELY AT PRIMARY AGE AND AT LOWER SECONDARY AGE ... 39
TABLE 18: NUMBER OF OOSC AT PRIMARY AND LOWER SECONDARY SCHOOL AGE .......................... 40
TABLE 19: SCHOOL ATTENDANCE RATE BY AGE ................................................................................. 40
TABLE 20: COMPULSORY AGE BY LEVEL OF EDUCATION ...................................................................... 41
TABLE 21: GPI ON SCHOOL ATTENDANCE RATE BY AGE .................................................................... 42
TABLE 22: AVAILABILITY OF DATA FOR DROPOUT AND REPETITION ANALYSIS................................. 44
TABLE 23: CUMULATIVE DROPOUT RATE (%) IN TIMOR-LESTE ....................................................... 44
TABLE 24: SURVIVAL RATE (%) IN TIMOR-LESTE ............................................................................. 45
TABLE 25: CLASSIFICATION OF OOSC BY SCHOOL EXPOSURE IN TIMOR-LESTE ................................. 45
TABLE 26: PERCENTAGE OF DROPOUT CHILDREN IN VIET NAM ......................................................... 46
TABLE 27: EDUCATIONAL ATTAINMENT (GRADE) OF OOSC AGED 5 – 17 IN VIET NAM ................... 46
TABLE 28: CHANCE OF REPETITION (%) BEFORE COMPLETION OF A GRADE, CAMBODIA .................. 47
TABLE 29: OVER-AGE BY GRADE IN CAMBODIA .................................................................................. 49
TABLE 30: OVER-AGE BY GRADE IN INDONESIA.................................................................................. 49
TABLE 31: OVER-AGE BY GRADE IN THAILAND .................................................................................. 49
TABLE 32: OVER-AGE BY GRADE IN TIMOR-LESTE ............................................................................. 49
TABLE 33: OVER-AGE BY GRADE IN VIET NAM ................................................................................... 49
TABLE 34: OVER-AGE IN COUNTRIES .................................................................................................. 49
TABLE 35: PRIMARY OVER-AGE IN VIET NAM PROVINCES ................................................................. 51

6
ABBREVIATIONS
4Ps Programming Pantawid Pamailyang Pilipino (Philippines)
5DE Five Dimensions of Exclusion
ANAR Adjusted net attendance rate
APIS Annual Poverty Indicator Survey
ARMM Autonomous Region in Muslim Mindanao
BEIS Basic Education Information System
BESRA Basic Education Sector Reform Agenda
CMF Conceptual and Methodological Framework
CSES Cambodia Social-Economic Survey
CYS Child and Youth Survey
DepEd Department of Education
DORP Drop Out Reduction Program
DHS Demographic and Health Survey
EAP East Asia and the Pacific
ECCE Early childhood care and education
ECD Early Childhood Development
EDN End of Decade Notes
EFA Education for All
EFA-FTI Education for All – Fast Track Initiative
EGRA Early Grade Reading Assessment
EHCP Essential Health Care Program
EMIS Education Management Information System
FAO Food and Agriculture Organisation
GDP Gross domestic product
GER Gross enrolment rate
GMR Global Monitoring Report
GPI Gender parity index
HCMC Ho Chi Minh City
ILEGI Indonesia Local Education Governance Index
ISCED International Standard Classification of Education
LGUs Local Government Units
MDG Millennium Development Goal
MICS Multiple Indicator Cluster Survey
MLE Multi-lingual Education
MOET Ministry of Education and Training
MTB Mother-Tongue Based
NGOs Non-Governmental Organisations
NRP Nutritional Rehabilitation Programme
NSOs Non-State Organization
NTT Nusa Tenggara Timur (Province in Indonesia)
ODL Online Distance Learning
OECD Organisation for Economic Co-operation and Development
OOSC Out-of-school children
OOSC Out-of-School Children Initiative
PDL Printed Distance Learning
PISA Programme for International Student Assessment
PPP Purchasing power parity

7
PTA Parent-Teacher Association
PTR Pupil-Teacher Ratio
SBM School-based Management
SEAMEO Southeast Asian Ministers of Education Organization
SHNP School Health and Nutrition Program
SIPs School Improvement Plans
SSAs School Self Assessments
STRIVE Strenghtening the Implementation of Basic Education in Selected Provinces in Visayas
SUSENAS Survei Sosial Ekonomi Nasional (Indonesian Household Income and Expenditure
Survey)
TIMMS Trends in International Mathematics and Science Study
UIS UNESCO Institute for Statistics
UNDP United Nations Development Programme
UNESCO United Nations Educational, Scientific and Cultural Organization
UNICEF United Nations Children’s Fund
UNFPA United Nations Population Funds
USAID United States Agency for International Development
WASH Water, Sanitation and Hygiene
WFP World Food Programme
WHO World Health Organization

8
ACKNOWLEDGEMENTS
xxxxxxx
9
EXECUTIVE SUMMARY

10
CHAPTER 1: INTRODUCTION
GLOBAL INITIATIVE ON OUT OF SCHOOL CHILDREN
The Out of School Children (OOSC) Global Initative is a joint effort by UNICEF and the UNESCO Institute
for Statistics (UIS). The Initiative aims to accelerate efforts towards the goal of universal primary
education, placing the issue of out-of-school children (hereafter, OOSC) as a priority for realizing
Education for All (EFA) and the Millennium Development Goals.
Specifically, the goal of the OOSC Initiative is to address these challenges and to support countries in
achieving a breakthrough in reducing the number of out-of-school children. The specific objectives are
to:
1. Improve the statistical information and analysis regarding out-of-school children and develop
complex profiles of these children that reflect the multiple deprivations and disparities they
face in relation to education; and
2. Identify bottlenecks, analyze existing interventions related to enhanced school participation
and develop context-appropriate policies and strategies for accelerating and scaling enrolment
and sustaining attendance rates for the excluded and marginalized.
Twenty-five countries1 globally agreedto undertake the OOSC process in 2010. In the East Asia and
Pacific (EAP)2 Region, the four participating countries are Cambodia, Indonesia, the Philippines and
Timor-Leste. In addition, Thailand and Viet Nam have also initiated the OOSC and have carried out the
initial statistical analysis, which are referred to separately in a few sections as appropriate.. While this
Regional Report does provides an initial overview of the current situation on out-of-school children in
the EAP region, primarily as reported in GMR and the UIS Education Statistical Digests, it focuses mainly
on the findings from the four participating OOSC countries, drawing upon the in-depth analysis as
provided in the OOSC Country Reports.
SOCIO-ECONOMIC CONTEXT The East Asia and Pacific (EAP) region encompasses one-third of the world’s population – or around 2
billion people. It also contains over one-quarter of the world’s children – around 580 million children in
1 The participating countries are: Bangladesh, Bolivia, Brazil, Cambodia, Colombia, Democratic Republic of Congo, Ethiopia, Ghana, India, Indonesia, Kyrgyzstan, Liberia, Mexico, Morocco, Mozambique, Nigeria, Pakistan, Philippines, Romania, Sri Lanka, Sudan (North and South), Tajikistan, Timor-Leste, Turkey and Zambia. 2 UNICEF’s East Asia Pacific region is comprised of the 14 countries in the East Asia region and 14 Pacific Island Countries, as follows: Cambodia, China, Fiji, Indonesia, Korea DPR, Laos PDR, Malaysia, Mongolia, Myanmar, Papua New Guinea, the Philippines, Thailand, Timor Leste and Viet Nam; Pacific Island countries include: Cook Islands, Fiji, Kiribati, Marshall Islands, Micronesia, Niue, Nauru, Palau, Samoa, Solomon Islands, Tokelau, Tonga, Tuvalu and Vanuatu. Under UNESCO-UIS grouping, EAP region also includes New Zealand and Australia, while Mongolia is part of Central Asia region. In this report, East Asia Pacific refers to countries in UNICEF’s

11
total. The region stretches from Mongolia in the north to Tonga in the south, and from Western China to
the Cook Islands. The smallest country in East Asia and the Pacific, Niue, has 1,700 people while the
largest, China, has 1.3 billion people. There are around 30 million children born in the region every
year. The region has significant diversity and includes some of the fastest-growing economies in the
world as well as ten of the least-developed countries – six in the Pacific and four in East Asia. The Pacific
is a distinct sub-region within the wider region, with its unique characteristics, dynamics and
challenges.3
The global financial crisis continues to affect the economies in the East Asia and Pacific region in
varying ways. Following an expansion of 9.7 percent in 2010, GDP in developing East Asia and Pacific is
estimated to have slowed to 8.2 percent in 2011, and further easing to further to 7.8 percent is expected
in 2012 and 2013.4 Recovery from the Tohoku earthquake, tsunami in Japan and the flooding in
Thailand has been fairly quick, but weaker demand in developed countries for the region’s exports has
begun to influence regional growth. However, despite the persistently gloomy global environment and
the anticipated economic slowdown, growth in the East Asia and Pacific region is expected to remain
relatively robust due to strong domestic demand, substantial fiscal space for policy interventions, and
others.5
Poverty rates have declined in many countries, but inequality remains a critical issue throughout the
region. The Gini Index inMiddle Income Countries, such as the Philippines and Thailand, is over 40,
while less developed countries in the region have an Index just over 30 (although Cambodia as over
40%).6
Furthermore, inequality manifests in dimensions other than income poverty, particularly for children.
According to a recent UNICEF study on child poverty in seven EAP countries 7, a considerable
proportion of children are persistently deprived in one or more of non-monetary dimensions, such as
shelter, food, water, sanitation, education, health and information, which can have significant negative
consequences on a child’s development and future. In the seven EAP countries in the Study, over 30
million children suffer from at least one severe deprivation, and certain segments of the population
suffer acute deprivation across several dimenstion. Inequities between different ethnic groups,
between small and large households and between well-educated and poorly educated adults were some
of the most notable dimensions of inequity found.8
3 http://www.unicef.org/eapro/about.html 4 World Bank (2012). Global Economic Prospects: Uncertainties and Vulnerabilities. Vol.4, January, 2012. World Bank: Washington, D.C. 5 ibid. 6 World Bank Data. http://data.worldbank.org 7 Seven participating countries in the study included: Cambodia, Lao PDR, the Philippines, Thailand, Viet Nam and Vanuatu. See UNICEF (2011). Child Poverty in the East Asia and Pacific: Deprivations and Disparities, a Study of Seven Countries. UNICEF EAPRO. 8 ibid

12
OVERVIEW OF EDUCATION IN EAST ASIA AND THE PACIFIC
The region is also diverse in terms of its provision of education, with significant numbers of children
who are either out of school or at risk of dropping out due to poverty, ethnicity, or for other reasons as
outlined below. Based on existing regional data, one could believe that OOSC is a not a major issue in
the region, and that achievement of MDG education targets in the majority of countries means that all
children are receiving their rights to basic education. This is far from the case.
NOTABLE TRENDS
In the past decade, the regional education focus has been to target those learners who are still out of
school and have not completed the full cycle of primary education.9 Less focus has been placed on
providing quality education leading to successful education outcomes for all. From UIS data, it is
estimated that 5% of all primary aged children in East Asia and the Pacific are out of school10. UIS
estimates that 58% of these children will enter school late, and over-age enrolment is a significant
factor for children becoming OOSC in the region. In Lao PDR, primary enrolments of children of primary
school age had risen to around 89% in 2008, but due to the high repetition and dropout rates reported,
only 67% of students are estimated to complete the full five years of primary schooling11. Widespread
repetition and late age of enrolment in Cambodia has ralso esulted in a low survival rate to the last
grade of primary school. Though EMIS shows primary net enrolment for 2009 near 96%, high rates of
overage enrolment and repetition leading to drop out have led to a lower secondary gross enrolment
ratio of just 56%.12
Overall, trends in education attainment have varied considerably across the region, as exemplified by
the comparisons that can be made between Cambodia and Indonesia. Cambodia has had little increase
in educational attainment among the 25- to 44-year age group. These people were of school age during
the years of the civil war in Cambodia and during the Khmer Rouge regime. Men between 45 and 54
years old have even lower educational attainment than those who are older or younger, because many
educated men in this age group were victims of Khmer Rouge purges. A study by UIS (2011b) found
that the period of conflict in Cambodia not only interrupted the increase in educational attainment
levels that can be observed among older age groups, it also contributed to lowering the levels of
attainment among their children.13 Cambodia has managed to overcome gender disparity in
educational attainment among the youngest age group and has made important progress in improving
access to education, especially in rural areas but the country has education standards that lag behind
other countries in the region. In rural Cambodia, many children combine work with education, often to
9 UNESCO (2011) Regional Report on progress towards education for all in Asia and the Pacific Tenth Meeting of the High-Level Group on Education for All Jomtien, Thailand 22-24 March 2011 p 9. 10 UIS (2011) Global Education Digest 2011, Montreal: UIS 11 UIS (2011) Global Education Digest 2011, Montreal: UIS 12 UIS (2010) Global education Digest 2010, Montreal: UIS 13 UNESCO-UIS (2011) Technical Paper No. 7: The Quantitative Impact of Conflict on Education.

13
the detriment of their educational development. Improving the education of girls and women remains a
real challenge.14
PRE-PRIMARY EDUCATION
Although pre-primary access is increasing, there are still many children aged 3-5 (or other appropriate
ages based on the country’s ISCED15 0 classification) in the region without educational opportunities at
this level. Overall participation in pre-primary education for children over 3 has increased in East Asia
and the Pacific from 38% to 52% between 2000 and 2008.16 Among countries, gross enrolment ratios
range from less than 10% (e.g. Myanmar) to above 90% (e.g. Cook Islands, Thailand and Tuvalu).
However, the range of disparity within a country is equally large. Most countries view pre-primary
education as a necessary preparation for formal schooling, as an introduction to the mores of schooling
and especially as an introduction to literacy. Extending coverage of pre-primary education is a priority
education goal in most countries in East Asia and the Pacific.
Private pre-primary provision accounts for more than 99% of services in Fiji; Samoa; China, Hong-Kong
SAR; and Bhutan. Private provision encourages parental choice, competition and efficiency but risks the
exclusion of poor and marginalised children and may lead to the proliferation of poorly regulated low
quality preschools and increasing gaps in opportunity for the poor. . In all countries with significant
numbers of ethnic minorities, pre-primary provision for these groups is sadly lacking even though most
countries in the region have as national goals plans to increase pre-primary education coverage,
specifically for disadvantaged groups.
PRIMARY EDUCATION
Most countries are reaching or have reached universal primary education as defined by EFA. However
there are serious exceptions. GERs for primary education in the region ranged from 60% in Papua New
Guinea in 2008 to 127% in Cambodia The GPI for this region has remained stable at about 1.01,
indicating gender parity on average in primary education. Across the region, 18 out of 26 countries with
data for 2009 have achieved primary gender parity at national levels of education. Within this group,
four countries or territories - Cook Islands; China, Hong Kong SAR; Palau; and the Solomon Islands -
have been able to eliminate disparities that previously favoured boys17
TRANSITION TO LOWER SECONDARY EDUCATION
14 UNDP (2011) Human Development Report Cambodia http://www.un.org.kh/undp/knowledge/publications/cambodia-human-development-report-2011-the-future-for-rural-livelihoods-in-the-face-of-climate-change p 141 15 ISCED is the International Standard Classification of Education designed by UNESCO to facilitate comparisons of education statistics and indicators of different countries on the basis of uniform and international agreed definitions. 16 UNESCO (2011) Regional report on progress towards education for all in Asia and the Pacific Tenth Meeting of the High-Level Group on Education for All Jomtien, Thailand 22-24 March 2011 (Figure 3, p8) 17 UNESCO (2011) Global Education Digest 2011

14
In terms of transition from primary to secondary education there is a wide range of country
experiences in East Asia and the Pacific. In Myanmar, 77 percent of pupils complete primary school and
make the transition to lower secondary education.18 The transition from primary to lower secondary
education is a point of drop out for children. In addition to the additional costs, children and families
also face concerns over safety, quality and relevance, leading to doubt as to whether the returns on
investments justifies staying in school. Distances to secondary schools increase and the costs to be
borne by families for transportation, new uniforms, textbooks and additional school fees - even in
countries where schooling is legislated to be free of charge (Asia-Pacific EDN 2 and 3).
SECONDARY EDUCATION
At secondary level there have been huge increases in school populations across the region. The 2011
Global Education Digest states: ‘For East Asia and the Pacific19, between 1990-2009, enrolment in
secondary education increased from 96 million to 163 million. On the other hand, the secondary school-
age population for the region, mainly influenced by the increasing population in China, totaled 210
million in 2009, slightly less than the 214 million recorded in 1990. GER [Gross Enrolment Rate] rose
from 45% in 1990 to 78% in 2009 across East Asia and the Pacific, with participation of young women’s
secondary GER reaching 80% compared to 76% for young men. China doubled its education system’s
capacity over this period (100 million secondary students in 2009, compared to 52 million in 1991).
Indonesia and Viet Nam also increased secondary enrolment by 9 million and 6 million, respectively.’20
In East Asia and the Pacific, half of countries with available data have lower secondary education
graduation ratios exceeding 70%. Low graduation ratios (45 %or below) are found in Cambodia, Lao
PDR, and Vanuatu. In the region, girls complete lower secondary education at a higher ratio than boys
in most countries with available data. The reverse is observed in Cambodia and Lao PDR.
GENDER
In East Asia and the Pacific, the number of expected years of schooling rose from 10.3 to 12.0 between
1999 and 2009. In 2009, boys could expect 11.8 years of schooling compared to 12.1 years for girls –
meaning that in EAP, girls can now expect more years of schooling than boys
Only a few countries are at gender parity in educational attainment for their entire population,
including Fiji, Australia, Samoa and Tonga. In most other countries of the region, older women are less
likely to have completed primary, lower secondary or upper secondary education. The Philippines
stands out as the one country amongst UNICEF’s programme countries in EAP where women of all ages
18 UNESCO (2011) Global Education Digest 2011 19 “East Asia and the Pacific” region in the GED is the UNESCO regional grouping of EAP which excludes Mongolia and includes other countries such as New Zealand and Australia. 20 UNESCO (2011) Global Education Digest 2011, p.18 http://www.uis.unesco.org/Library/Documents/global_education_digest_2011_en.pdf p 18

15
have higher educational attainment than men at both primary and secondary levels, which is the result
of a long-running trend of higher school enrolment and retention rates among girls than boys.
Overall, in the past decade, there has been a reversal in gender patterns resulting in a small advantage
for girls. Out of 22 countries with data, 5 reached gender parity in 2009. This includes countries such as
Indonesia, which successfully removed barriers to girls’ secondary education, offering them equal
opportunities. However, gender disparities against girls remain acute in Cambodia (GPI of 0.9), Lao PDR
(0.81)). Even though they are less extreme than the barriers generally facing girls, it is nonetheless
important to note the disparities against boys. This is the case in China (GPI of 1.07), Cook Islands
(1.10), Fiji (1.07), Malaysia (1.07), Samoa (1.14), Thailand (1.08), the Philippines (1.08) and Mongolia
(1.08)21.
ETHNICITY
Numerous studies show that, across the region, ethnic minorities are among the most disadvantaged in
terms of access to education. In Cambodia, Viet Nam, Timor-Leste and Indonesia, education for ethnic
minorities is often of lower quality than in urban areas and equalities of opportunity are lost. For
example the UNICEF Cambodia publication, The Situation of women and children (2009) noted the
following, especially in two mountainous ethnic minority provinces, Ratanakiri and Mondulkiri:
1. Indigenous children are not provided with a culturally relevant curriculum and teachers
provide instruction exclusively in Khmer, not in local languages.
2. Consistent teacher absence, lack of teaching/learning materials, desks and other basic
equipment and lack of in-service training for teachers are widespread. Educational facilities are
inadequate or incomplete in seven of the villages with minimal infrastructure, and many lack
water and toilets. Children in the majority of the villages do not have access to the higher grades
of primary school.
3. Females have fewer educational opportunities. This was due to the emphasis on girls’
contribution to domestic chores and the livelihoods of their families, as well as early marriage.
As one study noted: “geographical remoteness aggravates girls’ disadvantages in schooling
because it is there where there is a deficit of schools, classrooms, teachers and teaching
materials on top of the poverty that afflicts most households in remote areas” (Gender
Mainstreaming Strategy in Education 2006-2010)
4. Indigenous communities have a low health status, particularly among women and children, who
experience high mortality and morbidity rates. High levels of poverty and food insecurity are
also apparent.
21 UNESCO (2011) Global Education Digest http://www.uis.unesco.org/Education/Pages/ged-2011.aspx
16
These findings are paralleled across a number of countries in the region. Governments need to respond
to the specific needs of students from different ethnic groups,although more and more countries in the
region, governments are rising to the challenge and their responsibilities in this area.
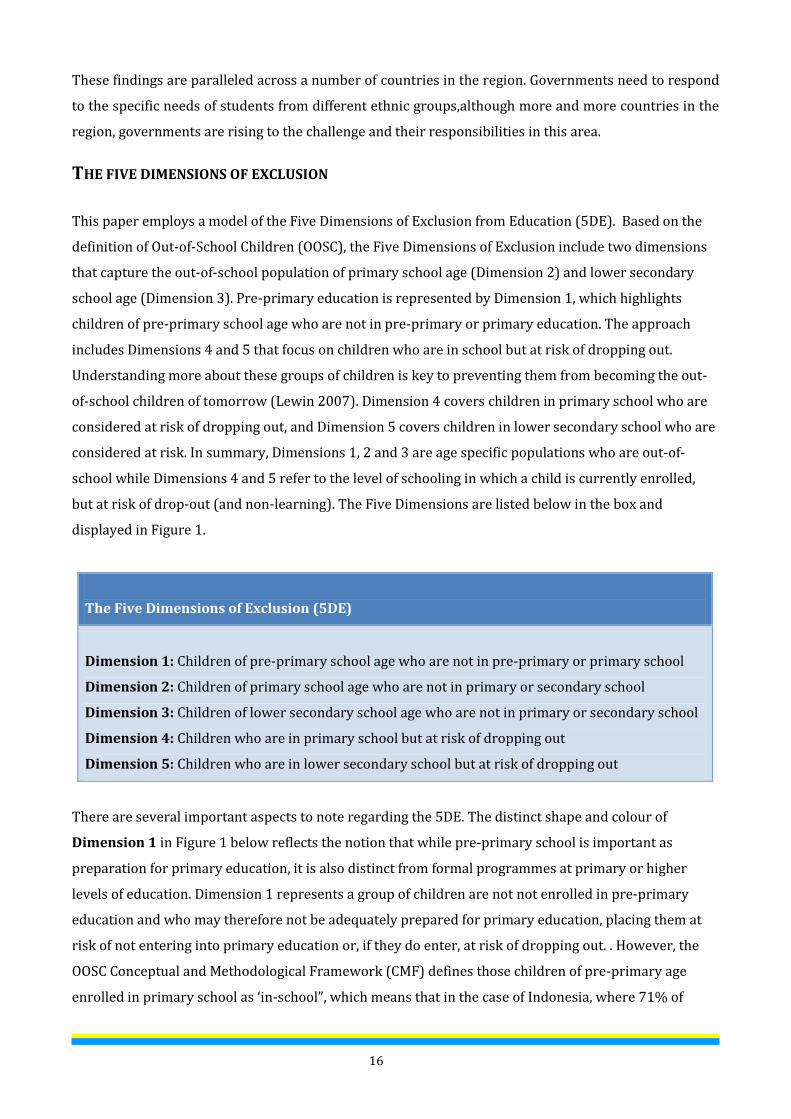
THE FIVE DIMENSIONS OF EXCLUSION
This paper employs a model of the Five Dimensions of Exclusion from Education (5DE). Based on the
definition of Out-of-School Children (OOSC), the Five Dimensions of Exclusion include two dimensions
that capture the out-of-school population of primary school age (Dimension 2) and lower secondary
school age (Dimension 3). Pre-primary education is represented by Dimension 1, which highlights
children of pre-primary school age who are not in pre-primary or primary education. The approach
includes Dimensions 4 and 5 that focus on children who are in school but at risk of dropping out.
Understanding more about these groups of children is key to preventing them from becoming the out-
of-school children of tomorrow (Lewin 2007). Dimension 4 covers children in primary school who are
considered at risk of dropping out, and Dimension 5 covers children in lower secondary school who are
considered at risk. In summary, Dimensions 1, 2 and 3 are age specific populations who are out-of-
school while Dimensions 4 and 5 refer to the level of schooling in which a child is currently enrolled,
but at risk of drop-out (and non-learning). The Five Dimensions are listed below in the box and
displayed in Figure 1.
The Five Dimensions of Exclusion (5DE)
Dimension 1: Children of pre-primary school age who are not in pre-primary or primary school
Dimension 2: Children of primary school age who are not in primary or secondary school
Dimension 3: Children of lower secondary school age who are not in primary or secondary school
Dimension 4: Children who are in primary school but at risk of dropping out
Dimension 5: Children who are in lower secondary school but at risk of dropping out
There are several important aspects to note regarding the 5DE. The distinct shape and colour of
Dimension 1 in Figure 1 below reflects the notion that while pre-primary school is important as
preparation for primary education, it is also distinct from formal programmes at primary or higher
levels of education. Dimension 1 represents a group of children are not not enrolled in pre-primary
education and who may therefore not be adequately prepared for primary education, placing them at
risk of not entering into primary education or, if they do enter, at risk of dropping out. . However, the
OOSC Conceptual and Methodological Framework (CMF) defines those children of pre-primary age
enrolled in primary school as ‘in-school”, which means that in the case of Indonesia, where 71% of

17
children age 6 enrol underage in Grade One, they are considered ‘in-school’ and therefore not included
in Dimension 1, even though they are not enrolled in age appropriate pre-primary school.
Figure 1: Five Dimensions of Exclusion (5DE)
Each of the out-of-school Dimensions 2 and 3 is divided into three mutually exclusive categories based
on previous or future school exposure: children who attended in the past and dropped out, children
who will never enter school, and children who will enter school in the future. Some OOSC of primary
and lower secondary age may be in pre-primary or non-formal education and these children should be
identified separately.
Children in Dimensions 4 and 5 – those in school but at risk of exclusion from education – are grouped
by the level of education they attend, regardless of their age: primary (Dimension 4) or lower secondary
(Dimension 5). This is different from Dimensions 2 and 3, which group out-of-school children by their
age: primary age (Dimension 2) and lower secondary age (Dimension 3). The framework thus covers
two different types of populations: the population of out-of-school children of school-going age, and the
population of at-risk pupils of any age in primary or lower secondary school.22
Reasons are found for barriers and bottlenecks for children out of school or at risk of dropping out. In
each of the OOSC National Reports and are summarized here are descriptions of various education
22 UNICEF & UIS (2011) Global Initiative on Out-of-School Children Conceptual and methodological framework (CMF) March 2011 Unpublished
Out of School
I
n school
Primary age children Lower secondary age children
Dimension 4
At risk of
dropping out of
primary school
Dimension 5
At risk of dropping
out of lower
secondary school
Dimension 2
Attended
but
dropped
out
Will never
enter
Will enter
late
Dimension 3
Attended
but
dropped
out
Will never
enter
Will enter
late
Dimension 1
Not in pre - primary school
Pre-primary
age children
Primary school students Lower secondary school students

18
policies and strategies related to out of school children is provided, along with a description of current
social protection programs. Ways forward are also suggested for children in East Asia and the Pacific
who are out of school and those at risk of dropping out, based on the National Reports and on existing
research. The methodology used in this study follows a life cycle approach. In Dimensions 1, 2 and 3,
children are included according to age. In Dimensions 4 and 5 children are included according the stage
of education, (i.e. primary or lower secondary), which they are currently attending. This regional
analysis will show patterns of exposure or otherwise to schooling or the lack of it, and describe the
reasons why children have never attended, have dropped out or at risk of dropping out of school in East
Asia and the Pacific.

19
CHAPTER 2: PROFILES OF EXCLUDED CHILDREN
INTRODUCTION
This chapter presents the profiles of Out of School Children in the East Asia and the Pacific Region. It is
the result of an exercise that extends the individual Country Reports carried out in recent months under
the OOSC programme. The chapter is primarily based on the findings of individual country reports.
Four countries in the EAP region (Cambodia, Indonesia, the Philippines and Timor-Leste) were part of
the initial OOSC Initiative, while recently, two more countries have requested to come on board and
have already drafted their statistical analysis. This chapter focuses on a synthesis and comparative
analysis of the four countries where the studies have been carried out, with some references to
Thailand and Viet Nam. The full list of the country reports and supporting documents can be seen in the
list of references.
No attempts have been made to generalize the results to other countries in the region or to extrapolate
regional estimates.
ANALYTICAL FRAMEWORK
“The Conceptual and Methodological Framework (CMF) categorizes Out of School Children (OOSC) into
five dimensions. Based on the definition of OOSC, the Five Dimensions of Exclusion include two
dimensions that capture the out-of-school population of primary school age (Dimension 2) and lower
secondary school age (Dimension 3). Pre-primary education is represented by Dimension 1, which
highlights children of pre-primary school age who are not in pre-primary or primary education. The
approach includes Dimensions 4 and 5 that focus on children who are in school but at risk of dropping
out.”23 This report follows the basic structure given by the CMF, and presents result of analysis in
sections on Dimension 1, Dimension 2 and 3, and Dimension 4 and 5.
The CMF guidelines suggest a list of table templates for the study of the OOSC profiles. Not all countries
however produced the entire list of tables. This is primarily due to the fact that the available survey
data does not provide all the necessary information. On the other hand, some countries created tables
that are not included in the CMF but are very useful in the understanding of OOSC children in those
countries. Additionally, tables from different countries are not always comparable even when they are
similar and on the same topic, as they were produced using existing data that do not strictly adhere to
CMF guidelines.
23 Conceptual and Methodology Framework (CMF).

20
To deal with the above issues, this report sets out a framework which is based on but not limited to the
CMF guidelines, and deals with each aspect individually. The framework can be described as follows:
The age and categories of children studied. The report follows the CMF guidelines and
categorizes OOSC children into the five dimensions which include children of pre-primary,
primary and lower secondary school ages. In some cases, the report further extends to include
children of all school ages (5-17) and beyond.
Indicators. The report lists the following prime indicators to be studied:
o Dimension 1: Pre-primary school attendance and OOSC;
o Dimension 2: Primary ANAR and OOSC;
o Dimension 3: Lower secondary ANAR, Lower secondary school age children attending
primary school, and OOSC;
o Attendance rate of school age children;
o Dimension 4 and 5: Dropout;
o Dimension 4 and 5: Repeaters;
o Dimension 4 and 5: Children who never attended school;
o Dimension 4 and 5: Over-age.
Disparities and deviations. The report studies disparities in gender, urban/rural,
region/province, ethnicity, wealth, and etc. In addition, the report endeavors to quantify the
severity of disparities using maximum and average deviations.
Because of the fact that different countries produced different tables based on available data, the report
handles the presentation of indicators differently. The Dimensions 1, 2 and 3 are presented with all
countries in a single table for comparison, but for Dimension 4 and 5, the report does use single tables,
but provides individual examples from the countries. Information on Dimension 4 and 5, which project
estimates of student enrolled but At Risk of drop-out, have not followed standard definitions from the
CMF for a variety of reasons, and hence much less open to comparability between the countries.
With regard to disparities and deviations, there are different ways data dispersion can be measured. A
typical method is to measure it with standard deviation. However, standard deviation is not suitable in
the analysis of this report, for the simple fact that standard deviation measures the dispersion against
the mean of the dispersion, but the dispersion in this report needs to be measured against a national
average figure. Although the national figure is an average performance over the entire nation, because
of the fact sub-national regions or other groups have different percentages of populations, the national
21
figure is never the simple mean, or average, of sub-national regional or other group performance data.
As such two deviation data, the average deviation and the maximum deviation, rather than standard
deviation, are chosen to form the set of figures that quantify the severity of dispersion in regional or
other groups’ performance.
The details as to how the deviations are calculated and the implication for national performance will be
explained below when pre-primary school age children are analyzed. The same method will then be
applied throughout the report.
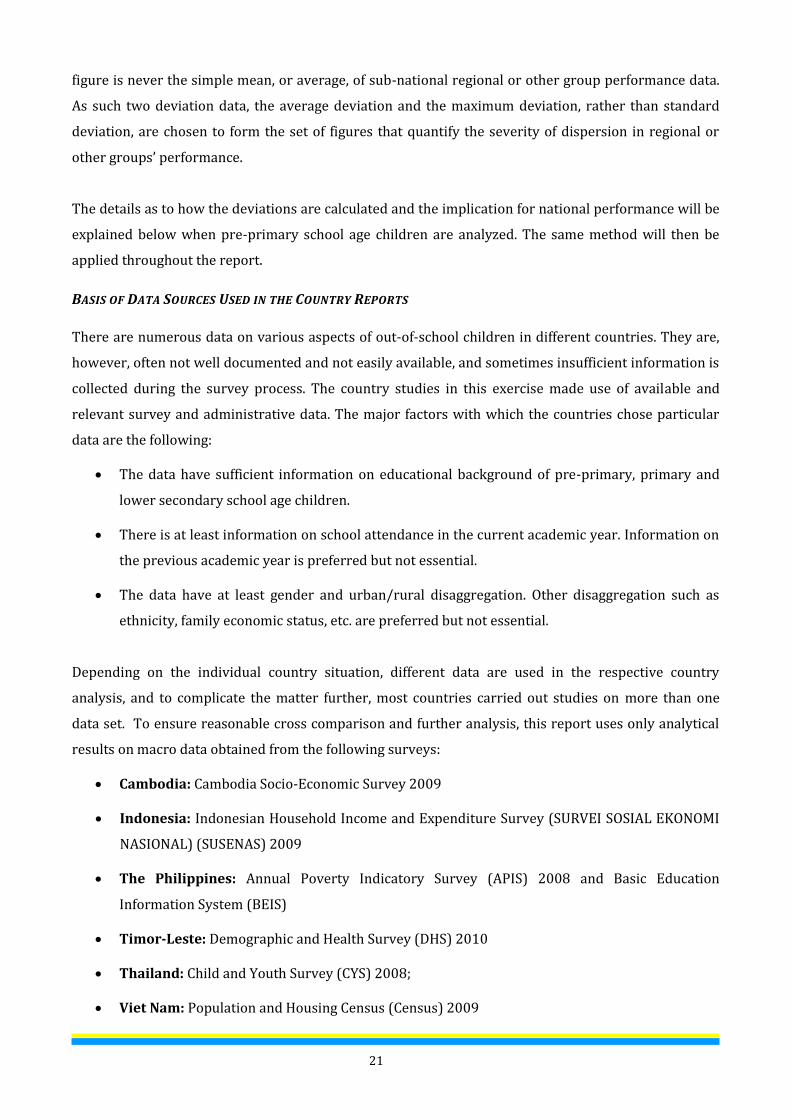
BASIS OF DATA SOURCES USED IN THE COUNTRY REPORTS
There are numerous data on various aspects of out-of-school children in different countries. They are,
however, often not well documented and not easily available, and sometimes insufficient information is
collected during the survey process. The country studies in this exercise made use of available and
relevant survey and administrative data. The major factors with which the countries chose particular
data are the following:
The data have sufficient information on educational background of pre-primary, primary and
lower secondary school age children.
There is at least information on school attendance in the current academic year. Information on
the previous academic year is preferred but not essential.
The data have at least gender and urban/rural disaggregation. Other disaggregation such as
ethnicity, family economic status, etc. are preferred but not essential.
Depending on the individual country situation, different data are used in the respective country
analysis, and to complicate the matter further, most countries carried out studies on more than one
data set. To ensure reasonable cross comparison and further analysis, this report uses only analytical
results on macro data obtained from the following surveys:
Cambodia: Cambodia Socio-Economic Survey 2009
Indonesia: Indonesian Household Income and Expenditure Survey (SURVEI SOSIAL EKONOMI
NASIONAL) (SUSENAS) 2009
The Philippines: Annual Poverty Indicatory Survey (APIS) 2008 and Basic Education
Information System (BEIS)
Timor-Leste: Demographic and Health Survey (DHS) 2010
Thailand: Child and Youth Survey (CYS) 2008;
Viet Nam: Population and Housing Census (Census) 2009
22
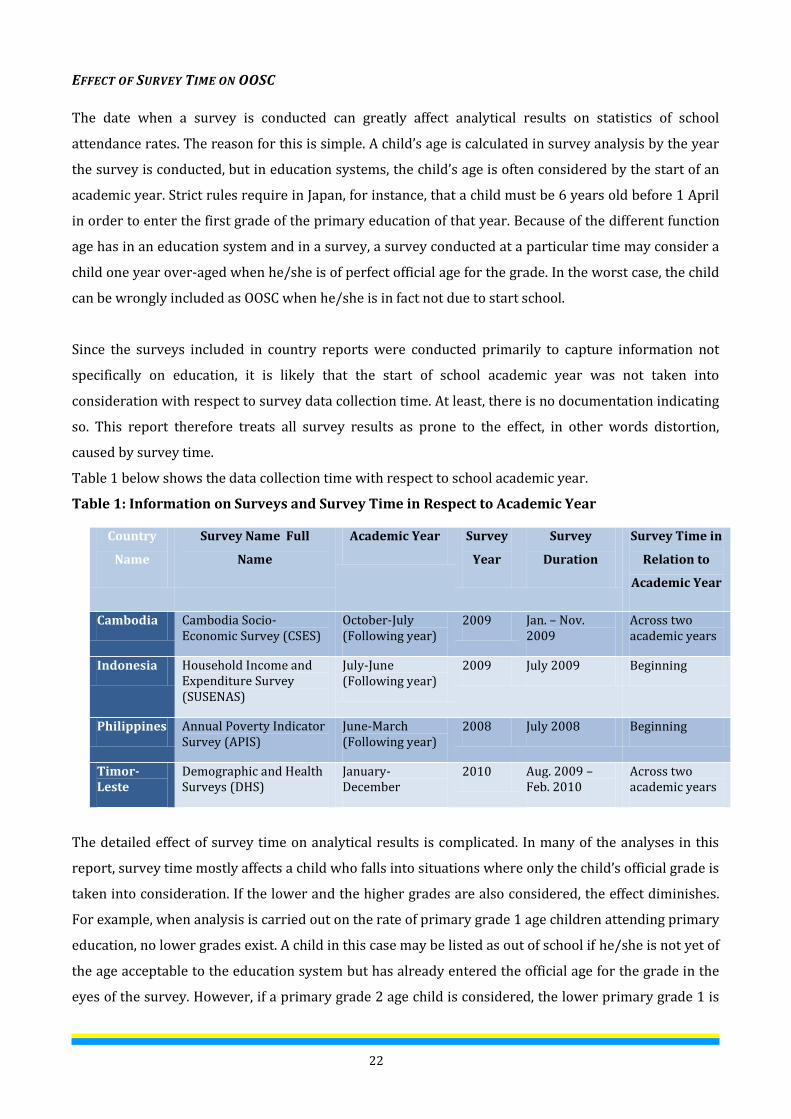
EFFECT OF SURVEY TIME ON OOSC
The date when a survey is conducted can greatly affect analytical results on statistics of school
attendance rates. The reason for this is simple. A child’s age is calculated in survey analysis by the year
the survey is conducted, but in education systems, the child’s age is often considered by the start of an
academic year. Strict rules require in Japan, for instance, that a child must be 6 years old before 1 April
in order to enter the first grade of the primary education of that year. Because of the different function
age has in an education system and in a survey, a survey conducted at a particular time may consider a
child one year over-aged when he/she is of perfect official age for the grade. In the worst case, the child
can be wrongly included as OOSC when he/she is in fact not due to start school.
Since the surveys included in country reports were conducted primarily to capture information not
specifically on education, it is likely that the start of school academic year was not taken into
consideration with respect to survey data collection time. At least, there is no documentation indicating
so. This report therefore treats all survey results as prone to the effect, in other words distortion,
caused by survey time.
Table 1 below shows the data collection time with respect to school academic year.
Table 1: Information on Surveys and Survey Time in Respect to Academic Year
Country
Name
Survey Name Full
Name
Academic Year Survey
Year
Survey
Duration
Survey Time in
Relation to
Academic Year
Cambodia Cambodia Socio-Economic Survey (CSES)
October-July (Following year)
2009 Jan. – Nov. 2009
Across two academic years
Indonesia Household Income and Expenditure Survey (SUSENAS)
July-June (Following year)
2009 July 2009 Beginning
Philippines Annual Poverty Indicator Survey (APIS)
June-March (Following year)
2008 July 2008 Beginning
Timor-Leste
Demographic and Health Surveys (DHS)
January-December
2010 Aug. 2009 – Feb. 2010
Across two academic years
The detailed effect of survey time on analytical results is complicated. In many of the analyses in this
report, survey time mostly affects a child who falls into situations where only the child’s official grade is
taken into consideration. If the lower and the higher grades are also considered, the effect diminishes.
For example, when analysis is carried out on the rate of primary grade 1 age children attending primary
education, no lower grades exist. A child in this case may be listed as out of school if he/she is not yet of
the age acceptable to the education system but has already entered the official age for the grade in the
eyes of the survey. However, if a primary grade 2 age child is considered, the lower primary grade 1 is
23
automatically included in the calculation for attendance in primary education, the birth date of the child
no longer matters and he/she is in school which ever date he/she was born. The analytical result will
not be affected by the time the survey is conducted.
In this way, survey time affects mainly the attendance rate (in particular ANAR) of children of pre-
primary school age, primary grade 1 age, and secondary grade 1 age. Any calculations resulting from
these statistics will need to be read with caution. This also affects the estimates of overage students,
whereby a student who is considered 2 years overage could in fact be either 1 or 3 years overage,
depending on the timing of the survey in relation to the school year.
The extent to which survey time affects the results of this report is not fully analyzed, since it is not
essential and additionally likely not possible. Instead, where necessary, the report addresses each issue
individually with explanations following tables.
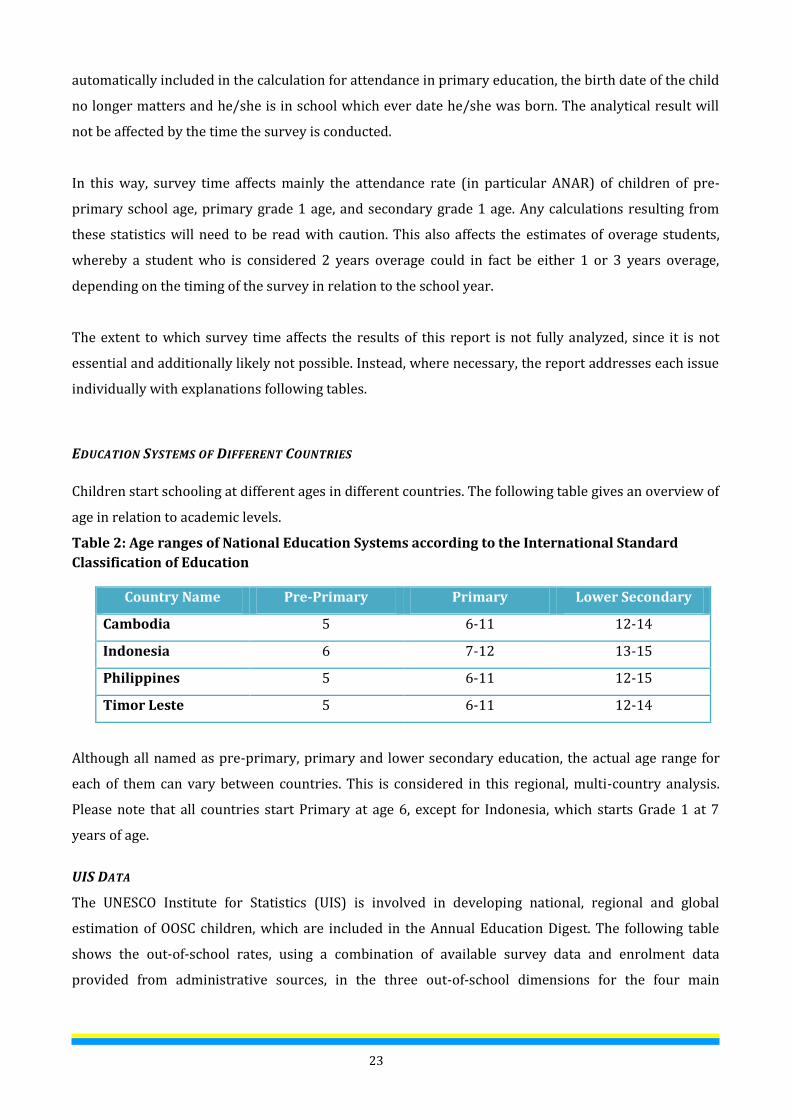
EDUCATION SYSTEMS OF DIFFERENT COUNTRIES
Children start schooling at different ages in different countries. The following table gives an overview of
age in relation to academic levels.
Table 2: Age ranges of National Education Systems according to the International Standard
Classification of Education
Country Name Pre-Primary Primary Lower Secondary
Cambodia 5 6-11 12-14
Indonesia 6 7-12 13-15
Philippines 5 6-11 12-15
Timor Leste 5 6-11 12-14
Although all named as pre-primary, primary and lower secondary education, the actual age range for
each of them can vary between countries. This is considered in this regional, multi-country analysis.
Please note that all countries start Primary at age 6, except for Indonesia, which starts Grade 1 at 7
years of age.
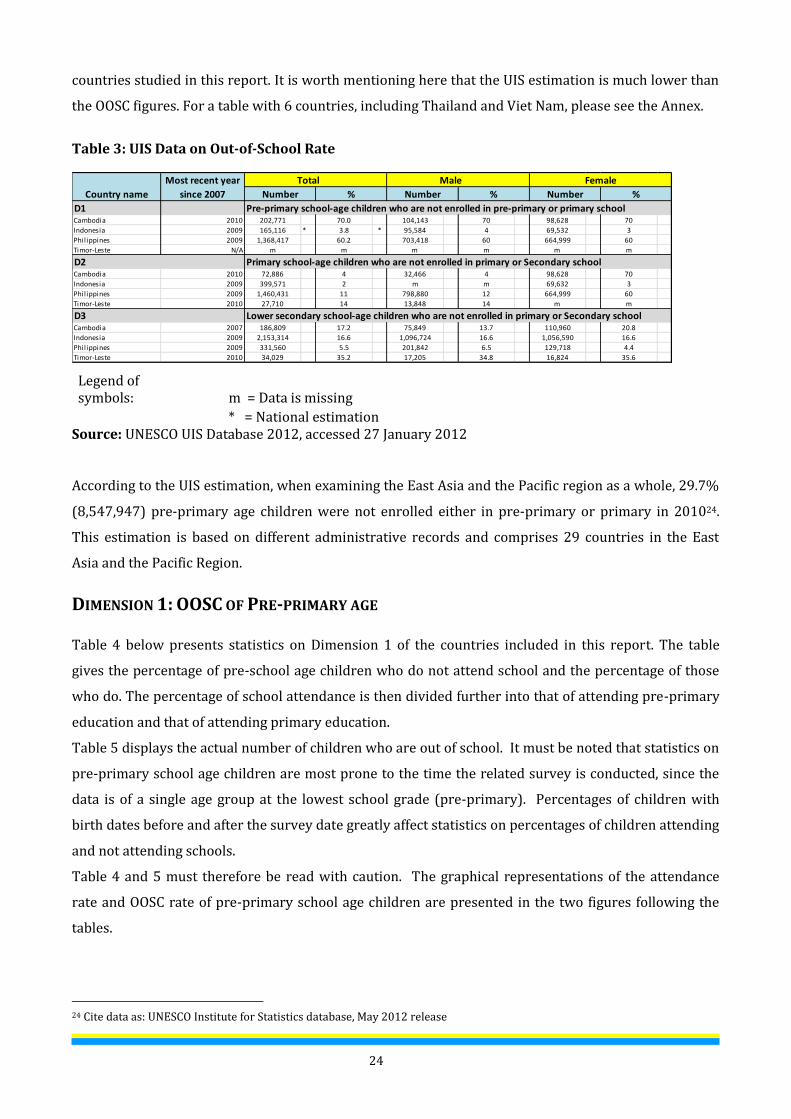
UIS DATA
The UNESCO Institute for Statistics (UIS) is involved in developing national, regional and global
estimation of OOSC children, which are included in the Annual Education Digest. The following table
shows the out-of-school rates, using a combination of available survey data and enrolment data
provided from administrative sources, in the three out-of-school dimensions for the four main
24
countries studied in this report. It is worth mentioning here that the UIS estimation is much lower than
the OOSC figures. For a table with 6 countries, including Thailand and Viet Nam, please see the Annex.
Table 3: UIS Data on Out-of-School Rate
Legend of symbols:
m = Data is missing
* = National estimation
Source: UNESCO UIS Database 2012, accessed 27 January 2012
According to the UIS estimation, when examining the East Asia and the Pacific region as a whole, 29.7%
(8,547,947) pre-primary age children were not enrolled either in pre-primary or primary in 201024.
This estimation is based on different administrative records and comprises 29 countries in the East
Asia and the Pacific Region.
DIMENSION 1: OOSC OF PRE-PRIMARY AGE Table 4 below presents statistics on Dimension 1 of the countries included in this report. The table
gives the percentage of pre-school age children who do not attend school and the percentage of those
who do. The percentage of school attendance is then divided further into that of attending pre-primary
education and that of attending primary education.
Table 5 displays the actual number of children who are out of school. It must be noted that statistics on
pre-primary school age children are most prone to the time the related survey is conducted, since the
data is of a single age group at the lowest school grade (pre-primary). Percentages of children with
birth dates before and after the survey date greatly affect statistics on percentages of children attending
and not attending schools.
Table 4 and 5 must therefore be read with caution. The graphical representations of the attendance
rate and OOSC rate of pre-primary school age children are presented in the two figures following the
tables.
24 Cite data as: UNESCO Institute for Statistics database, May 2012 release
D1 Pre-primary school-age children who are not enrolled in pre-primary or primary schoolCambodia 2010 202,771 70.0 104,143 70 98,628 70
Indonesia 2009 165,116 * 3.8 * 95,584 4 69,532 3
Philippines 2009 1,368,417 60.2 703,418 60 664,999 60
Timor-Leste N/A m m m m m m
D2 Primary school-age children who are not enrolled in primary or Secondary schoolCambodia 2010 72,886 4 32,466 4 98,628 70
Indonesia 2009 399,571 2 m m 69,632 3
Philippines 2009 1,460,431 11 798,880 12 664,999 60
Timor-Leste 2010 27,710 14 13,848 14 m m
D3 Lower secondary school-age children who are not enrolled in primary or Secondary schoolCambodia 2007 186,809 17.2 75,849 13.7 110,960 20.8
Indonesia 2009 2,153,314 16.6 1,096,724 16.6 1,056,590 16.6
Philippines 2009 331,560 5.5 201,842 6.5 129,718 4.4
Timor-Leste 2010 34,029 35.2 17,205 34.8 16,824 35.6
%Country name
Most recent year
since 2007
Total Male Female
Number % Number % Number

25
Table 4: School Attendance of Pre-Primary Age Children
Country Name Not attending school
Attending pre-primary school
Attending primary school
Attending either pre-primary or
primary
Total
Cambodia 68.7 6.6 24.7 31.3 Indonesia 17.6 10.4 71.9 82.3
Philippines 34.2 60.1 5.7 65.8 Thailand 2.9 94.9 2.2 97.1
Timor-Leste 82.3 5.6 12.1 17.7 Viet Nam 16.0 79.2 4.8 84.0
Male
Cambodia 70.3 5.9 23.8 29.7 Indonesia 18.7 10.6 70.7 81.3
Philippines 36.7 58.3 5.0 63.3 Thailand 3.2 94.8 2.0 96.8
Timor-Leste 83.7 5.1 11.1 16.2 Viet Nam 16.1 79.1 4.8 83.9
Female
Cambodia 67.1 7.3 25.6 32.9 Indonesia 16.4 10.3 73.2 83.5
Philippines 31.5 62.1 6.5 68.5 Thailand 2.5 95.0 2.5 97.5
Timor-Leste 80.8 6.0 13.2 19.2 Viet Nam 15.9 79.4 4.7 84.1
Table 5: The Number of Out of School Children at Pre-Primary School Age
Country Name Not attending schools Total Population % N
Cambodia 68.7 202,946 295,475 Indonesia 17.6 772,948 4,391,751 Philippines* 34.2 776,545 2,272,241 Thailand 2.9 26,713 933,234 Timor-Leste 82.3 27,451 33,362 Viet Nam 16 234,986 1,469,153
TOTAL 21.7 2,041,589 9,395,216
*Number calculated using UNPD population figure of the survey year

26
Figure 2: Percentage of pre-primary age children not in school
The summary of Table 4 and 5 can be drawn as follows:
In total, more than 1.7 million pre-primary school age children are out of school in the four
countries. This breaks down to 202,946 in Cambodia, 772,948 in Indonesia, 776,545 in the
Philippines, and 27,451 in Timor-Leste. In addition initial estimates find 26,713 in Thailand and
234,986 in Viet Nam.
The rate of pre-primary school age children attending school differs greatly between countries.
The same applies to the rate of OOSC.
The highest rate of school attendance is 82.3% in Indonesia (although Thailand and Viet Nam
can boast even higher rates) and the lowest 17.7% in Timor-Leste. -Cambodia also has the low
attendance rate of 31.3%.
In three (Philippines, Thailand and Viet Nam) of the four countries that have a relatively high
school attendance rate, and most pre-primary age children attend pre-primary education.
In Indonesia, however, 70% of pre-primary age children attend primary education, with only
10.4% actually attending pre-primary education. It is further estimated that in Indonesia25, at
the age of 5, 38.4% of children attend pre-primary school while 10.7% attend primary
education. This is due in part to the fact that enrolment in government primary schools is free,
whereas pre-primary is provided by private sector, thereby requiring parents to pay fees and
tuition .
25 Data from Indonesia country report.
0%
25%
50%
75%
100%
Thailand Viet Nam Indonesia Philippines Cambodia Timor-Leste
Attending pre-primary school Attending primary school Not attending school

27
Like Indonesia, the two countries with a low rate of attendance, Timor-Leste and Cambodia,
both have much higher percentage of pre-primary age children in primary education than in
pre-primary education.
There is some difference between male and female attendance rates, and without exception in
all countries boys have lower attendance rates than girls.
DISPARITIES IN DIMENSION 1
Although Table 4 above clearly displays the difference between boys and girls, the figures are in
absolute numbers and it is difficult to understand the magnitude of deviations for different sub-groups
from the national average. Table 6 below describes the deviations in terms of the Gender Parity Index.
Table 6: Gender Variation in School Attendance Rate of Pre-primary Age Children
The Maximum Deviation indicates the maximum difference between male or female and national
average, while the Average Deviation averages the differences between male and national average and
between female and national average. Both deviations, displayed in the table in red, are expressed as a
percentage of the relevant national average.
In Cambodia for example, the national average of pre-primary attendance rate is 31% with boys at
29.7% and girls at 32.9%. The maximum difference is between boys and the national average, which is
1.5979% (i.e. 1.6%), equivalent to 5.1% of the national average rate. On average, boys and girls deviate
from the national rate by 5.0%. Of the four OOSC Initative countries, the biggest deviation in gender
differences is in Timor-Leste, where boys’ attendance rate is 8.5% below national average and girl’s
8.5% above national average.
Variations exist to a much greater extent in other areas such rural/urban, region/provincial, religion,
wealth, etc. Unfortunately not all surveys included all these aspects in their study. Variation study not
only requires surveys with appropriate questionnaires, it also demands a higher number of households
surveyed and a higher degree of disaggregation when data is analyzed. Table 7 presents variations on
National
Average Male Female Male Female
Maximum
Deviation
(Absolute)
Average
Deviation
(Absolute)
Maximum
Deviation (%
of National
Average)
Average
Deviation (%
of National
Average)
Cambodia 31.3 29.7 32.9 -1.6 1.6 1.6 1.6 5.1 5.0
Indonesia 82.3 81.3 83.5 -1.0 1.2 1.2 1.1 1.5 1.3
Philippines 65.8 63.3 68.5 -2.6 2.7 2.7 2.6 4.1 4.0
Thailand 97.1 96.8 97.5 -0.3 0.3 0.3 0.3 0.3 0.3
Timor-Leste 17.7 16.2 19.2 -1.5 1.5 1.5 1.5 8.5 8.5
Viet Nam 84.0 83.9 84.1 -0.1 0.1 0.1 0.1 0.2 0.2
School Attendance Rate
Deviation from National
Average Male/ Female
Country
Name
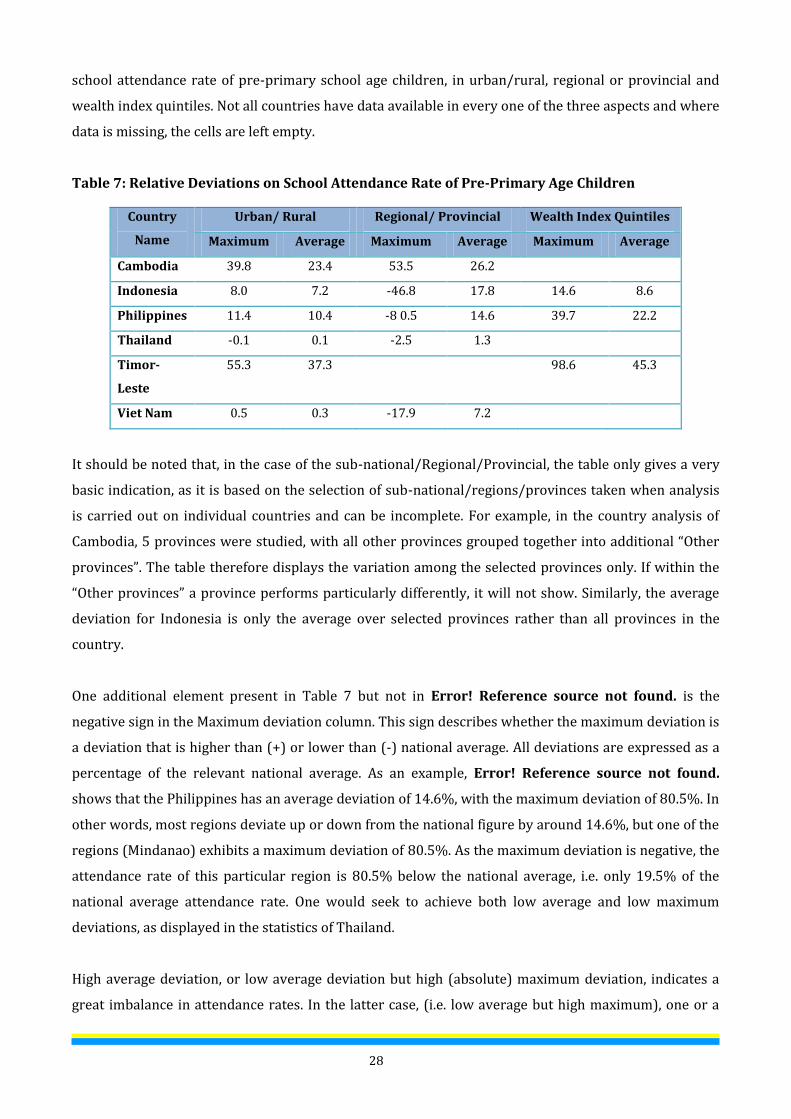
28
school attendance rate of pre-primary school age children, in urban/rural, regional or provincial and
wealth index quintiles. Not all countries have data available in every one of the three aspects and where
data is missing, the cells are left empty.
Table 7: Relative Deviations on School Attendance Rate of Pre-Primary Age Children
Country
Name
Urban/ Rural Regional/ Provincial Wealth Index Quintiles
Maximum Average Maximum Average Maximum Average
Cambodia 39.8 23.4 53.5 26.2
Indonesia 8.0 7.2 -46.8 17.8 14.6 8.6
Philippines 11.4 10.4 -8 0.5 14.6 39.7 22.2
Thailand -0.1 0.1 -2.5 1.3
Timor-
Leste
55.3 37.3 98.6 45.3
Viet Nam 0.5 0.3 -17.9 7.2
It should be noted that, in the case of the sub-national/Regional/Provincial, the table only gives a very
basic indication, as it is based on the selection of sub-national/regions/provinces taken when analysis
is carried out on individual countries and can be incomplete. For example, in the country analysis of
Cambodia, 5 provinces were studied, with all other provinces grouped together into additional “Other
provinces”. The table therefore displays the variation among the selected provinces only. If within the
“Other provinces” a province performs particularly differently, it will not show. Similarly, the average
deviation for Indonesia is only the average over selected provinces rather than all provinces in the
country.
One additional element present in Table 7 but not in Error! Reference source not found. is the
negative sign in the Maximum deviation column. This sign describes whether the maximum deviation is
a deviation that is higher than (+) or lower than (-) national average. All deviations are expressed as a
percentage of the relevant national average. As an example, Error! Reference source not found.
shows that the Philippines has an average deviation of 14.6%, with the maximum deviation of 80.5%. In
other words, most regions deviate up or down from the national figure by around 14.6%, but one of the
regions (Mindanao) exhibits a maximum deviation of 80.5%. As the maximum deviation is negative, the
attendance rate of this particular region is 80.5% below the national average, i.e. only 19.5% of the
national average attendance rate. One would seek to achieve both low average and low maximum
deviations, as displayed in the statistics of Thailand.
High average deviation, or low average deviation but high (absolute) maximum deviation, indicates a
great imbalance in attendance rates. In the latter case, (i.e. low average but high maximum), one or a

29
very few of the regions/groups have a very different attendance rate from the majority. However, it
should be noted that this analysis of disparities only refers to attendance. If one were to analyze the
quality of services in classrooms and schools, or the differences in outcomes from pre-primary
experience, the deviations could be considerably higher, although this will remain speculation until
further research is conducted in this area.
Further information can be found in the Appendix on the relationship between the attendance statistics
and the above table and how the maximum and the average deviation are calculated.
The main messages from Table 6 and 7 are as follows:
There is a great variation in school attendance rates between different areas and between
children with different economic background (wealth quintiles) in most of the countries. The
only exception is Thailand, although there is no wealth related information in the relevant
survey of the country.
In Cambodia and Timor-Leste, urban and rural areas show great difference in their attendance
rate. Urban areas perform much better than rural areas, with attendance rates at 139.8% in
Cambodia and 155.3% higher in urban Timor-Leste when compared to the respective national
average. A closer look at all the six countries shows that except in Thailand, all countries achieve
higher than national average attendance rates in urban areas. In Thailand the situation is the
opposite: the rural areas are slightly better than the urban areas.
Attendance rates in provinces in Cambodia vary greatly as the country shows a relatively high
average deviation figure. Cambodia’s capital Phnom Penh exhibits the greatest deviation from
the national average, with 53.5% more than average children’s attendance at the pre-primary
levels.
In the Philippines most regions only deviate slightly from the national average, but there is at
least one region that performs alarmingly poorly. The country report shows that the
Autonomous Region in Muslim Mindanao has only 12.85% of its pre-primary age children in
school, compared to the national average of 65.82%. The region’s attendance rate is only 19.5%
of the national average. Zamboanga Peninsula, although slightly better off than Mindanao, is
also considerably disadvantaged with an attendance rate of just 36% of the national average.
Statistics show that in Timor-Leste, wealth plays a great role in school attendance of pre-
primary children. The attendance rate of the richest category is almost double that of the
national average. In all three countries where wealth data are available, the richest category has
been shown to have a considerably higher attendance rate.

30
Figure 2 gives a graphical impression of regional/provincial variations on attendance rate of pre-
primary age children in pre-primary or primary education.
Figure 3: Regional/Provincial Variation on Attendance Rate (%) of Pre-Primary Age Children
DIMENSIONS 2 AND 3: OOSC OF PRIMARY AND LOWER SECONDARY AGE
The CMF defines that children of primary or lower secondary school age are considered as being in
school if they participate in primary or secondary education (ISCED levels 1, 2 and 3). Children of
primary or lower secondary age who do not participate in education programmes at ISCED levels 1, 2 or
3 are considered as being out of school, including those who are in pre-primary and non-formal
education.
DIMENSION 2: PRIMARY AGE CHILDREN OUT OF SCHOOL
8 below presents primary ANAR and its Gender Parity Index (GPI). This table, and also the subsequent
tables presented in this section, follow the strict definition of children in school, i.e. only primary and
lower secondary school age children are considered in the analysis, and only those who are currently
attending primary or secondary school are included as attending school. No other type of education,
such as NFE or Equivalency Programmes, are included here with regard to school attendance.
Table 8: Primary ANAR and GPI
Country Name
Male Female Total GPI
% Number % Number % Number
Cambodia 81.6 945,951 83.7 896,472 82.6 1,842,423 1.03 Indonesia 97.7 14,574,645 98.2 13,522,069 98.0 28,096,714 1.01
Philippines 89.7 7,019,635 91.9 6,701,210 90.8 13,720,845 1.02 Thailand 90.3 2,950,410 90.6 2,812,286 90.5 5,762,696 1.00
Timor-Leste* 71.2 100,708 72.9 96,088 72.1 196,796 1.02 Viet Nam 91.6 3,459,244 91.5 3,186,492 91.5 6,645,736 1.00
Total 29,050,593 27,214,618 56,265,211
* UNPD population figure of the survey year.
-60
-40
-20
0
20
40
60
Cambodia Indonesia Philippines Thailand Timor-Leste Vietnam
Regional or Provincial Variations on Attendance Rate of Pre-Primary Age Children at Pre-Primary or Primary
Schools
Avg. Deviation Max. Deviation

31
Number = Population of primary school age children Compared with Dimension 1, the tables of Dimension 2 are much less affected by the time the related
surveys are carried out. As was discussed earlier in Section 1, survey time has an impact only on the
group of children whose birthdate determines whether they are in or out of school. In primary ANAR,
this group is the lowest age group attending primary grade 1. When the country total/average ANAR is
calculated, the statistics of this age group merge with other age groups, and the distortion caused by
survey time is greatly reduced.
The Number column in the primary ANAR table contains the population of the related age group,
rather than the number of children in primary or secondary schools. In all of the countries except
Timor-Leste, this number is estimated with the survey micro data used. For Timor-Leste the UNPD
population projection was used to calculate the number corresponding to the percentage calculated
from DHS.
Table 9: Percentage of Out of School Children at Primary School Age
It must be noted that in Table 9, the Number is the estimated number of out of school children, not the population of the age group. Combining Table 8 and Table 9, one may state that in Cambodia, for example, the population of primary school aged children is 1,842,423, of which 81.6% are in primary or secondary schools and 18.4% are out of school. The number of out of school primary age children stands at 320,773.
% Number % Number % Number
Cambodia 18.4 174,452 16.3 146,320 17.4 320,773
Indonesia** 2.3 335,217 1.8 243,397 2.0 561,934
Philippines 10.3 720,106 8.1 544,964 9.2 1,265,070
Timor-Leste* 28.8 28,956 27.1 26,017 27.9 54,990
* Number calculated using UNPD population figure of the survey year.
Number = The number of primary school age children who are out of school
** Indonesia’s OOSC numbers are slightly different from the country report due to rounding.
Country NameMale Female Total

32
Figure 4: Percentage of Primary School Age Children In and Out of School
The main messages from Table 8 and Table 9 are as follows:
Out of the six countries, four achieve above 90% school attendance among primary school age
children, one just above 80% (Cambodia) and one just above 70% (Timor-Leste). In terms of out
of school children, in Timor-Leste, almost 30% of its primary school age children are out of
school. The figure in Cambodia is almost 20%, while in Philippines, Thailand and Viet Nam it is
close to 10%. Only Indonesia is an exception: only 2% of primary school age children are not
attending schools
The number of out of school children at primary age is: Cambodia 321,000, Indonesia 562,000,
the Philippines 1,265,000, and Timor-Leste 55,000. In total there are approximately 2,203,000
children at primary school age who are not attending any formal primary or secondary
education in these four countries. If we add the preliminary figures from Thailand and Viet Nam,
the total reaches nearly 3,315,000. .
As described in the CMF, the primary ANAR GPI is calculated by dividing the female by the male
ANAR. Values of the GPI between 0.97 and 1.03 are usually considered gender parity. If the GPI
for the ANAR is less than 0.97, girls are at a disadvantage. If the GPI for the ANAR is greater than
1.03, boys are at a disadvantage. It is clear that all countries listed have achieved gender parity.
0%
25%
50%
75%
100%
Indonesia Vietnam Philippines Thailand Cambodia Timor-Leste
Primary OOSC PrimaryANAR
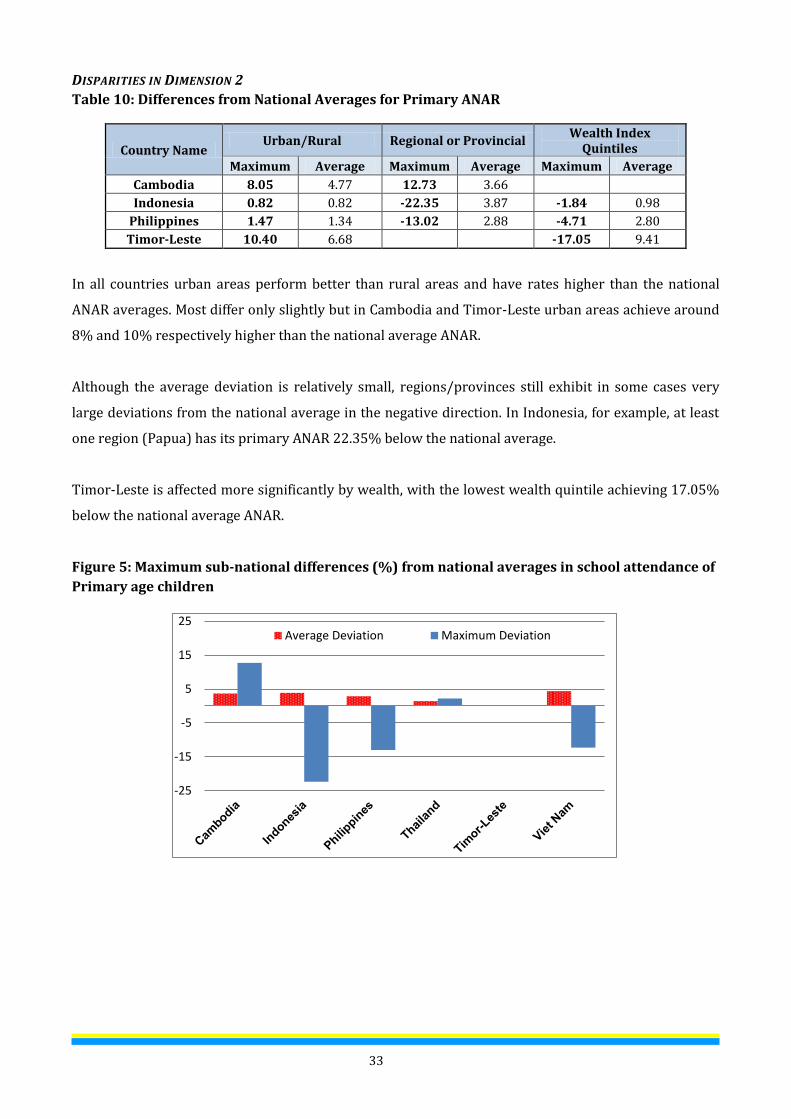
33
DISPARITIES IN DIMENSION 2
Table 10: Differences from National Averages for Primary ANAR
Country Name Urban/Rural Regional or Provincial
Wealth Index Quintiles
Maximum Average Maximum Average Maximum Average
Cambodia 8.05 4.77 12.73 3.66
Indonesia 0.82 0.82 -22.35 3.87 -1.84 0.98
Philippines 1.47 1.34 -13.02 2.88 -4.71 2.80
Timor-Leste 10.40 6.68 -17.05 9.41
In all countries urban areas perform better than rural areas and have rates higher than the national
ANAR averages. Most differ only slightly but in Cambodia and Timor-Leste urban areas achieve around
8% and 10% respectively higher than the national average ANAR.
Although the average deviation is relatively small, regions/provinces still exhibit in some cases very
large deviations from the national average in the negative direction. In Indonesia, for example, at least
one region (Papua) has its primary ANAR 22.35% below the national average.
Timor-Leste is affected more significantly by wealth, with the lowest wealth quintile achieving 17.05%
below the national average ANAR.
Figure 5: Maximum sub-national differences (%) from national averages in school attendance of
Primary age children
-25
-15
-5
5
15
25Average Deviation Maximum Deviation

34
DIMENSION 3: LOWER SECONDARY AGE CHILDREN OUT OF SCHOOL
Survey time affects the lower secondary ANAR in the same way as it affects the primary ANAR.
Distortion exists in the statistics of the lowest age group of the lower secondary school age children.
However, as this group merges with other age groups, the effect is reduced.
Table 11: Lower Secondary ANAR and GPI
Country Name Male Female Total
GPI % Number % Number % Number
Cambodia 31.4 501,574 35.1 460,926 33.1 962,499 1.12 Indonesia 77.9 6,930,719 82.2 6,451,510 80.0 13,382,229 1.06
Philippines 60.6 4,697,304 71.9 4,681,247 66.3 9,378,551 1.19 Thailand 75.0 1,543,961 79.5 1,467,430 77.2 3,011,390 1.06
Timor-Leste* 29.2 49,369 34.0 47,203 31.6 96,572 1.17 Viet Nam 77.8 3,156,877 80.4 2,908,223 79.1 6,065,100 1.03
* UNPD population figure of the survey year.
Number = Population of lower secondary school age children
The GPI in Error! Reference source not found.11 and also in subsequent tables is marked pink if it is
greater than 1.03. A GPI greater than 1.03 indicates that there is higher percentage of girls than boys in
school. When the GPI is below 0.97, it is marked blue, meaning more boys than girls are in school. A GPI
between 0.97 and 1.03 is left with no colour to represent gender parity.
Table 12: Lower Secondary School Age Attending Primary Grades and GPI
Country Name
Male Female Total GPI % Number % Number % Number
Cambodia 54.6 501,574 48.7 460,926 51.8 962,499 0.89
Indonesia 6.5 6,930,719 4.4 6,451,510 5.5 13,382,229 0.68
Philippines 26.1 4,697,304 20.5 4,681,247 23.3 9,378,551 0.79
Thailand 20.3 1,543,961 18.2 1,467,430 19.3 3,011,390 0.89
Timor-Leste*
57.4 49,369 51.8 47,203 54.6 96,572 0.90
Viet Nam 11.5 3,156,877 10.0 2,908,223 10.8 6,065,100 0.87
* UNPD population figure of the survey year. Number = Population of lower secondary school age children
Note that Error! Reference source not found.11 and Error! Reference source not found.12 both
have the population of lower secondary school age children in the Number column. In Error!
Reference source not found.13 however, the Number column contains the actual number of out of
school children. This is done to follow the convention given in the CMF guide.
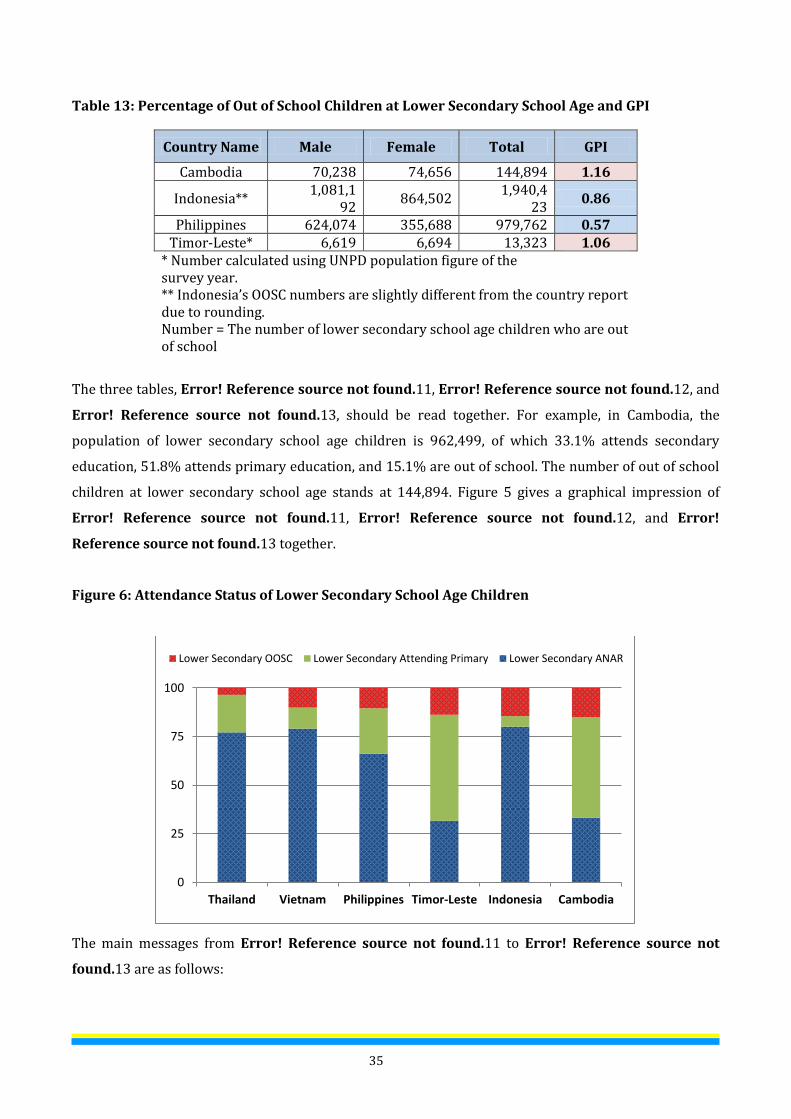
35
Table 13: Percentage of Out of School Children at Lower Secondary School Age and GPI
Country Name Male Female Total GPI
Cambodia 70,238 74,656 144,894 1.16
Indonesia** 1,081,1
92 864,502
1,940,423
0.86
Philippines 624,074 355,688 979,762 0.57 Timor-Leste* 6,619 6,694 13,323 1.06
* Number calculated using UNPD population figure of the survey year.
** Indonesia’s OOSC numbers are slightly different from the country report due to rounding. Number = The number of lower secondary school age children who are out of school
The three tables, Error! Reference source not found.11, Error! Reference source not found.12, and
Error! Reference source not found.13, should be read together. For example, in Cambodia, the
population of lower secondary school age children is 962,499, of which 33.1% attends secondary
education, 51.8% attends primary education, and 15.1% are out of school. The number of out of school
children at lower secondary school age stands at 144,894. Figure 5 gives a graphical impression of
Error! Reference source not found.11, Error! Reference source not found.12, and Error!
Reference source not found.13 together.
Figure 6: Attendance Status of Lower Secondary School Age Children
The main messages from Error! Reference source not found.11 to Error! Reference source not
found.13 are as follows:
0
25
50
75
100
Thailand Vietnam Philippines Timor-Leste Indonesia Cambodia
Lower Secondary OOSC Lower Secondary Attending Primary Lower Secondary ANAR

36
1. Lower secondary ANAR
The lower secondary ANAR varies between 31.6% (Timor-Leste) and 80% (Indonesia). In
other words, even in the best performing country, only 80% of the lower secondary age
children attend school appropriate to their age. In the worst performing country this
reduces to less than one third.
Girls are at a distinctive advantage when it comes to attending schools appropriate for their
age. In all countries (except Viet Nam), a higher percentage of girls than boys attend lower
secondary schools. In the Philippines, for every 100 boys attending lower secondary school
at the right age, 120 girls attend school at the right age. Viet Nam is the only the country that
achieves GPI within gender parity range.
2. Lower secondary school age children attending primary education
Many children fall behind the progress required of them. While they attend school, they are
not enrolled in secondary school which is appropriate for their age, but in primary schools
where they are over-aged.
The percentage of children of lower secondary age still in primary education ranges
between 5.5% in Indonesia and 54.6% in Timor-Leste. Cambodia is another country that
has over half of is lower secondary age children still in primary schools, while the figure in
the Philippines is 23.3%. In total, this equals some 32,856,341 children of lower secondary
school age still studying in primary school overage.
A distinctively higher percentage of boys than girls remain in primary schools. The GPIs are
universally below 0.97, indicating more boys than girls of lower secondary age attending
primary school. In Indonesia, for every 100 overage boys still in primary education, there
are 68 overage girls attending primary school.
3. Out of school children at lower secondary school age
The percentage of lower secondary school age children who attend neither secondary nor
primary education ranges between 3.5% in Thailand and 15.1% in Cambodia. For
Indonesia, the Philippines, Timor-Leste and Viet Nam, they have rates between 19-15% at
the lower secondary age. Their out-of-school rates are respectively 14.5%, 10.4%, 13.8%
and 10.1%.
In relation to gender parity, the countries can be classified into two groups. In the first
group, with Indonesia, the Philippines, Thailand, and Viet Nam, a much higher percentage of
boys than girls stay out of school. In the worst case, in Thailand the percentage of boys out

37
of school is almost double that of the girls (1/0.51 = 1.96). In the second group, with
Cambodia and Timor-Leste a, higher percentage of girls than boys stay out of school. In
Cambodia, for every 100 boys out of school, there are 116 girls out of school.
The numbers of out of school children in these countries are 145,000 in Cambodia,
1,940,000 in Indonesia, 980,000 in the Philippines and, 13,000 in Timor-Leste. . The total
number of OOSC children stands at approximately 3,078,000 (or 3,800,000 if we include
Thailand and Viet Nam).
Figure 7 depicts GPIs in different countries. The two red lines represent the upper and lower limits of
GPI to be considered gender parity. Any GPI figure falling out of this range indicates gender disparity.
The figures above the upper limit indicate a higher percentage of girls while figures below lower limit
indicate a higher percentage of boys.
Figure 7: Gender Parity Index of on the Lower Secondary ANAR, Primary Grade Attendance Rate
and out-of-school Rate
The graph clearly shows that a higher percentage of girls attend school at the right age and a higher
percentage of overage boys study in primary education. In the case of OOSC, Cambodia and Timor-Leste
have higher percentage of out-of-school girls, while Indonesia, the Philippines, Thailand, and Viet Nam
have a higher percentage of out-of-school boys.
0.4
0.6
0.8
1.0
1.2
1.4
Cambodia Indonesia Philippines Thailand Timor-Leste Viet Nam
Ge
nd
er
Par
ity
Ind
ex
ANAR GPI Attending Primary GPI OoSC Rate GPI
GPI = 1.0 GPI = 0.97

38
DISPARITIES IN DIMENSION 3
Table 14: Variation in School Attendance Rate of Lower Secondary Age children
Country Name
Urban/Rural Regional or Provincial
Wealth Index Quintiles
Maximum Average Maximum Average Maximum Average
Cambodia 69.0% 41.3% 106.4% 32.1% Indonesia 7.8% 7.3%
Philippines 11.1% 9.8% -28.3% 10.4% -29.4% 19.0% Thailand 2.5% 1.7% -7.8% 3.6%
Timor-Leste
43.1% 27.8%
69.8% 39.4%
Viet Nam 7.4% 4.9% -26.3% 14.4%
There are three significant finding here. First, the variation in urban and rural areas is much more
significant in the lower secondary ANAR than in the primary ANAR. In Cambodia, the urban ANAR is
69% higher than the national average, and in Timor-Leste it is 43% above the average. The other four
countries exhibit smaller differences between urban and rural but the figures are still between 4.9 and
10 percent for Indonesia, the Philippines and Viet Nam. Second, the sub-national variation in lower
secondary ANAR is significant. In the Cambodian capital Phnom Penh, the ANAR of 68.4% is 106.4%
higher than the national average of 33.1%. In other words, it is more than double that of the national
average. Third, wealth also has significant impact on the ANAR. For example in Timor-Leste, the richest
category fares the best in the attendance rate, achieving 69.8% higher than the national average. The
average deviation is also high, meaning the five categories of wealth achieve very different ANARs.
Table 15: Maximum and average levels of difference between national average and sub-national
levels of Out of School Children at Lower Secondary School Age
Country Name
Urban/Rural Regional or Provincial
Wealth Index Quintiles
Maximum Average Maximum Average Maximum Average
Cambodia -38.8% 23.2% 72.5% 20.5% Indonesia -29.5% 27.1% 80.8% 39.2% 82.9% 46.6%
Philippines -33.5% 29.8% -59.3% 23.4% 79.7% 51.5% Timor-Leste
-20.4% 13.2% 51.2% 26.2%
The urban areas have universally lower than national average rates of OOSC. The most significant one is
in Cambodia, where the rate of OOSC is almost 40% less in urban areas than in the country as a whole,
although the Philippines and Indonesia experience similar though slightly lower levels of disparity

39
between urban and rural areas. The detailed information of urban and rural performance in the rate of
out of school children at lower secondary school age can be seen in the next table.
Table 16: Urban and Rural Variations in Lower Secondary OOSC Rate
Country Name
Urban/Rural Lower
Secondary OoSC Rate
Deviation of OoSC
Rate
Deviation Relative to
National Average (%)
Average Deviation Relative to
National Average (%)
Cambodia
National Average 15.1% 23.2%
Urban 9.2% -5.8% -38.8%
Rural 16.2% 1.2% 7.7%
Indonesia
National Average 14.6%
27.1%
Urban 10.3% -4.3% -29.5% Rural 18.2% 3.6% 24.7%
Philippines
National Average 10.4% 29.8%
Urban 6.9% -3.5% -33.5%
Rural 13.2% 2.7% 26.0%
Thailand
National Average 3.5%
10.0%
Urban 3.0% -0.5% -14.6% Rural 3.7% 0.2% 5.4%
Timor-Leste
National Average 13.8% 13.2%
Urban 11.0% -2.8% -20.4%
Rural 14.6% 0.8% 6.0%
Viet Nam
National Average 10.1%
20.9%
Urban 6.9% -3.2% -31.6%
Rural 11.2% 1.0% 10.2%
Table 15 also depicts the regional/provincial variation of the lower secondary OOSC rate. The result is
significant. In one of the provinces (An Giang) selected for analysis in Viet Nam, the out of school rate
reaches almost two and half times that of the national average (24.7% compared to 10.1%). In another
province (HCMC), the OOSC rate is only 9%, close but below the national average.
The maximum deviation in the Philippines is shown to be -59.3%. This occurs in the National Capital
Region where the out of school rate is significantly lower than the national average. Only 4.3% of the
children are out of school, compared with 10.4% nationally. More research is needed to determine if the
higher levels of enrolment and attendance in urban areas are due to population migration, with
students attending in urban schools but their families still registered as living in rural areas.
NUMBER OF CHILDREN IN AND OUT OF SCHOOL
The next two tables present the number of children who are out of school in each of the countries. Table
17 gives the number of OOSC separately on primary school age and on lower secondary school age.
Table 17: Number of OOSC Respectively at Primary Age and at Lower Secondary Age
Country Name Primary School Age (Thousands)
Lower Secondary School Age (Thousands)
Male Female Total Male Female Total

40
Cambodia 174 146 321 70 75 145 Indonesia 335 243 562 1,081 865 1,940
Philippines 720 545 1,265 624 356 980 Timor-Leste 29 26 55 7 7 13
Total 1,258 960 2,203 1,782 1,303 3,078
Table 18 combines them together and displays the number for children at primary school age and
lower secondary school age as a whole.
Table 18: Number of OOSC at Primary and Lower Secondary School Age
Country Name
Primary and Lower Secondary School Age
(Thousands)
Male Female Total Cambodia 245 221 466 Indonesia 1,416 1,108 2,502
Philippines 1,344 901 2,245 Timor-Leste 36 33 68
Total 3,041 2,263 5,281
There are in total more than two million primary school age children who are out of school in the four
countries. At lower secondary school age, the number is over three million. When combined together,
the number of children who are at primary or lower secondary school age and do not attend any formal
school in these four countries in East Asia and the Pacific exceeds five million two hundred thousand.
ATTENDANCE RATE OF SCHOOL AGE CHILDREN
Sections 2.2 and 2.3 presented the school attendance rate of children at the pre-primary, primary and
lower secondary school age. The sections also followed the strict definition of formal schools given by
CMF. This section looks at school attendance rate of children between the age of 5 and 17. The statistics
are mostly based on answers to the survey question asking a child if he/she is currently attending
school. Unfortunately, no reference is made as to the type of school he/she may be attending. As an
example, if a child is attending religions education which is not counted as formal education, he/she will
still be included in this section as attending school. Although this is not in line with the Conceptual
Methodological Framework, we have no choice but to rely on the data available.
Overall, at the age of pre-primary, primary and lower secondary school, the percentage of children
attending non-formal education is relatively very small.
The two tables in the next two pages present respectively the two aspects of the attendance rate. One is
the attendance rate itself, and the other is the gender disparity GPI of the attendance rate. A figure is
presented to give a graphical representation of each of the tables.
Table 19: School Attendance Rate by Age

41
Country Name
5 6 7 8 9 10 11 12 13 14 15 16 17
Cambodia 31.3% 56.1% 80.2% 88.1% 93.3% 92.2% 93.9% 88.8% 87.2% 79.0% 66.8% 55.3% 44.9% Indonesia 49.1% 81.6% 97.1% 98.9% 99.0% 98.9% 98.4% 95.3% 92.2% 86.4% 77.0% 71.2% 58.1%
Philippines 65.8% 85.5% 95.4% 97.1% 97.6% 97.4% 97.1% 95.5% 92.3% 87.4% 82.7% 69.4% 55.9% Timor-Leste
17.7% 40.8% 68.2% 78.0% 83.9% 86.1% 87.9% 88.8% 86.1% 82.9% 80.3% 74.0% 72.0%
Figure 8: Percentage of School Attendance Rate by Age
Table 19 displays a universal phenomenon where the attendance rate is low at the age of 5, increases
quickly to reach relatively high between the ages of 8 and 12, and then declines gradually as age
increases. At the lower end at age 5, Timor-Leste fares the worst and Philippines the best, and at the
high end at age 17, Cambodia fares the worst and Timor-Leste the best. Timor-Leste seems to be
slightly different, in that its curve does not decline in the higher end of age as quickly as the other
countries, and also the increase at the lower end of age starts rather late.
Table 20: Compulsory age by level of education
Country Name Pre-Primary Primary Lower
Secondary Cambodia 5 6 - 11 12 - 14 Indonesia 6 7 - 12 13 - 15
Philippines 5 6 - 11 12 - 15 Thailand 5 6 - 11 12 - 14
Timor-Leste 5 6 - 11 12 - 14 Viet Nam 5 6 - 10 11 - 14
Cambodia and Timor-Leste are different from Indonesia and the Philippines in that age of highest
attendance rate is quite late. Timor-Leste reaches the highest attendance rate of 88.8% at the age of 12,
while Cambodia reaches the highest 93.9% at the age of 11. This is in comparison to the highest of 99%
at age 9 in Indonesia, 97.6% at age 9 in the Philippines, 99.8% at age 7 in Thailand, and 97.5% at age 8
in Viet Nam.
Cambodia
Indonesia Philippines
Timor-Leste
0
20
40
60
80
100
5 6 7 8 9 10 11 12 13 14 15 16 17
Pe
rce
nta
ge
Cambodia Indonesia Philippines Timor-Leste

42
One fact remains the same in all countries. After the age of 12, attendance rates start to decline, and
more and more children leave school as their age increases. The situation and statistics are very similar
across all four countries.
Table 21: GPI on School Attendance Rate by Age
Country Name
Aged 5
Aged 6
Aged 7
Aged 8
Aged 9
Aged 10
Aged 11
Aged 12
Aged 13
Aged 14
Aged 15
Aged 16
Aged 17
Cambodia 1.11 1.03 1.05 1.05 1.02 0.99 0.99 1.01 0.96 0.95 0.97 0.86 0.77
Indonesia 1.09 1.03 1.01 1.00 1.00 1.01 1.01 1.01 1.02 1.03 1.04 1.00 0.97
Philippines 1.08 1.01 1.02 1.00 1.02 1.01 1.01 1.03 1.05 1.08 1.12 1.16 1.12
Timor-Leste 1.19 1.21 0.98 1.05 0.98 1.03 0.99 0.99 1.00 0.98 1.01 0.99 1.03
Figure 9: GPI on School Attendance Rate by Age
Table 21 presents GPI of the attendance rate and a graphical impression is displayed in Figure 9. The
two dashed red lines represent the GPI upper and lower range of 1.03 and 0.97 for gender parity. The
statistics that are above the GPI 1.03 line represent a higher female attendance rate, while the statistics
below the GPI 0.97 line represent a higher male attendance rate. The figure gives a clear view of those
in and outside of this range. Ages at the lower and higher end fall out of gender parity, particularly at
the higher end of the ages. From above 12, all but Timor-Leste exhibit gender disparity. Cambodia has a
higher rate of male school attendance while the other 4 have a higher rate of female school attendance.
At the lower end of the age range, i.e. children aged 5, a higher percentage of female attend schools.
Disparities in Dimension 4 and 5
DIMENSIONS 4 AND 5: CHILDREN AT RISK OF EXCLUSION
Cambodia
Indonesia
Philippines
Timor-Leste
0.75
1.00
1.25
5 6 7 8 9 10 11 12 13 14 15 16 17Cambodia Indonesia
Philippines Timor-Leste

43
Dimensions 4 and 5 cover children in school who are At Risk of dropping out, in other words, the
potential OOSC of tomorrow. All children face some risk of dropping out, but not all do to the same
degree. The analysis of Dimensions 4 and 5 focuses on those children who are at the ‘greatest risk’ of
dropping out of school. Dimensions 4 concentrates on primary school students while Dimension 5 on
lower secondary school students.
There are various ways to analyze the population of children at risk. One simple method is to look at the
at-risk children of yesterday, that is, children who recently dropped out of school and projecting this on
current enrolment rates. Other methods of analysis include analysis of risk based on the repetition
rate in school and/or on the rate of over-age students for specific grades.
There are two issues, however, in the measurement of the above-mentioned indicators. Firstly, unlike
ANAR, questionnaires that produce data necessary for the calculation of dropout and repetition rates
are not always present in surveys. The repetition rate, for instance, requires attendance information of
two consecutive years but in many surveys only one year of information is available. The dropout rate,
too, strictly speaking, requires data of two years, although one year information can be used to estimate
some form of dropout. To make the issue more complicated, some surveys mix children who drop out
from school with those who never attended, forcing analysis to report dropout in a different way from
CMF recommended tables.
The second issue relates to over-age. Information required for the calculation of over-age rate is usually
available in surveys and the calculation itself is relatively easy. However, CMF does not include any
definition of over-age and there is also no template for the presentation of over-age rates. This results
in different countries calculating and presenting over-age very differently. The age included in over-age
range for instance can be 2+ years older in some studies but 3+ years older in some other studies. Over-
age rates can mean different things in different Country Reports, some being percentage of an age
group and some the percentage within a grade population. There are further complications when
considering the timing of the survey itself and how this can effect interpretation of being overage.
Probably because of the issues above, and the lack of discussion related to the over-age issue in the
CMF, there has also been little analysis in over-age in respect to gender, geographical location, and
ethnic minorities.
To deal with the above issues, this chapter presents Dimensions 4 and 5 in a different way from
Dimensions 2 and 3. In the presentation of dropout and repetition rates, instead of putting all countries
together in one table, this is only done where possible for overage estimates. For repetition and drop

44
out, examples are given only for individual countries and are not comparable. Each country is presented
individually, according to its own definition of indicators and tables. In the presentation of over-age,
however, rates have been recalculated to follow the same definition and are presented in the same
format, with all countries combined into one table.
DROPOUT
Error! Reference source not found. lists the availability of information on which the calculation of
dropout and repetition relies. To calculate the percentage of children who dropped out during the past
academic year, the attendance information on the current and the past year must be available. To
calculate the percentage of children who repeat, further information on the grade attended in the
current and the past years must also be available.
Table 22: Availability of Data for Dropout and Repetition Analysis
Country Name
Survey Name
Current Year
Attendance
Never Attended
Attended Previous
Year Attendance
Dropout in the Past Year
Dropout Before
Current Year
Repeat
Cambodia CSES Yes Yes Yes* Yes* Yes* Yes* No* Indonesia SUSENA Yes Yes Yes No No Yes** No
Philippines APIS Yes No No No No No No Thailand CYS Yes Yes Yes Yes Yes Yes Yes
Timor Leste
DHS Yes Yes Yes Yes Yes Yes Yes
Viet Nam Census Yes Yes Yes No No Yes No
Yes* = Information availabe but non-formal education is included.
No* = although there is information on previous years attendance but no grade information is given. Yes** = Questionnaires existing but no analysis is done.
As shown in the table, Cambodia has information on the attendance for the current and past year.
However the survey does not differentiate children who attend formal education from those who
attend non-formal education. There is also no information available on the grade attended in the
previous year, and as such, no repetition rate can be calculated. In Indonesia, the survey has no
information on the previous year’s attendance but the analysis of dropout is nevertheless carried out
using administrative data. The only countries that have full information are Thailand and Timor-Leste
but only Timor-Leste has tables ready in their national report. Thailand is still in process of completing
the full analysis for its National Report.
i. Timor-Leste
Table 23: Cumulative Dropout Rate (%) in Timor-Leste

45
Grade 1 Grade 2 Grade 3 Grade 4 Grade 5 Grade 6 Grade 7 Grade 8 Grade 9
Male 0.0 0.6 1.7 4.1 6.4 9.0 5.3 7.0 8.5
Female 0.0 1.1 2.9 5.3 7.3 9.0 6.2 7.4 8.1
Total 0.0 0.9 2.3 4.7 6.8 9.0 5.7 7.2 8.3
Table 24: Survival Rate (%) in Timor-Leste
Grade 1 Grade 2 Grade 3 Grade 4 Grade 5 Grade 6 Grade 7 Grade 8 Grade 9
Male 100.0 99.4 98.3 95.9 93.6 91.0 94.7 93.0 91.5
Female 100.0 98.9 97.1 94.7 92.7 91.0 93.8 92.6 91.9
Total 100.0 99.1 97.7 95.3 93.2 91.0 94.3 92.8 91.7
Table 25: Classification of OOSC by School Exposure in Timor-Leste
Primary school age
(Dimension 2) Lower Secondary School age
(Dimension 3)
Categories of OOSC (%) Male Female Total Male Female Total Total out-of-school children 27.80% 26.00% 26.90% 13.50% 14.40% 14.00%
Dropped out (% of OOSC) 4.70% 7.00% 5.80% 16.90% 11.20% 13.90% Expected to enter by age 17 (% of OOSC) 47.80% 43.00% 45.40% 3.20% 2.40% 2.90% Expected to never enter (% of OOSC) 47.50% 50.00% 48.80% 79.90% 86.40% 83.20%
The Table 24 and Error! Reference source not found. were calculated using template provided by UIS and Error! Reference source not found. is calculated by 100 minus the survival rate.
ii. Viet Nam
The Viet Nam survey provided no information on previous year’s attendance. However, the following
tables and figures provide a different but full picture of children who once attended but are currently
not attending, i.e. dropout children.
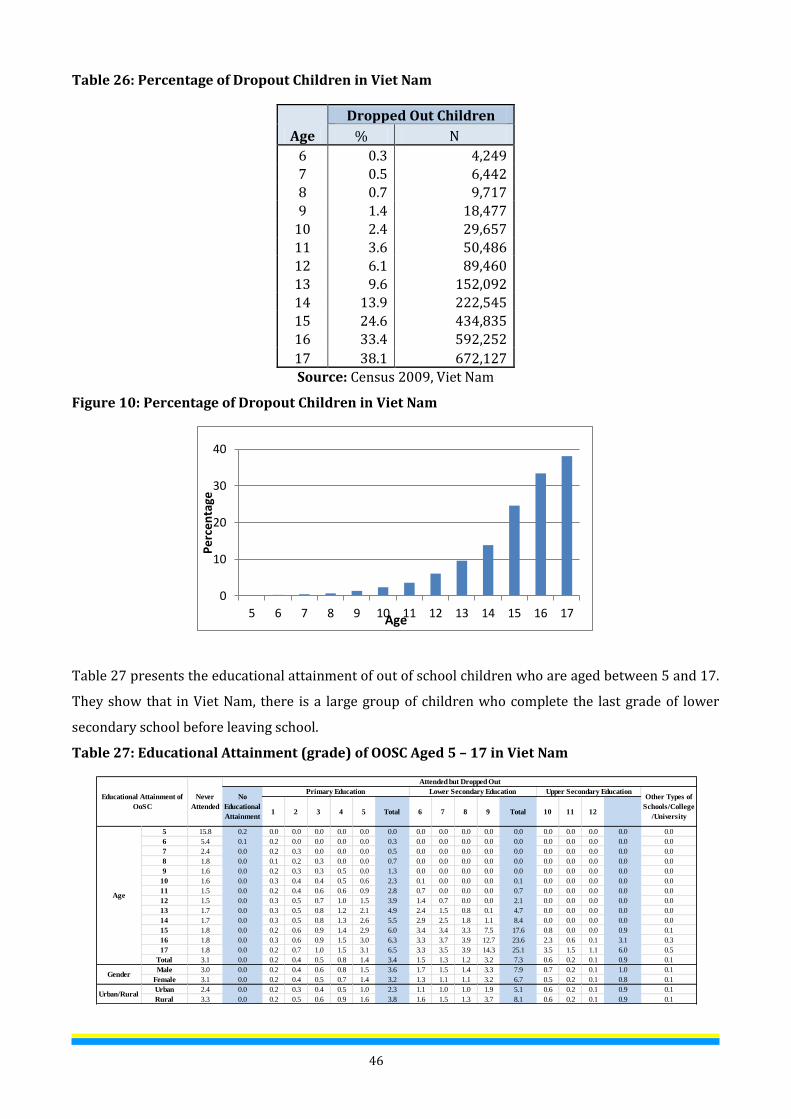
46
Table 26: Percentage of Dropout Children in Viet Nam
Age
Dropped Out Children
% N
6 0.3 4,249 7 0.5 6,442
8 0.7 9,717 9 1.4 18,477
10 2.4 29,657 11 3.6 50,486 12 6.1 89,460
13 9.6 152,092 14 13.9 222,545
15 24.6 434,835 16 33.4 592,252
17 38.1 672,127
Source: Census 2009, Viet Nam
Figure 10: Percentage of Dropout Children in Viet Nam
Table 27 presents the educational attainment of out of school children who are aged between 5 and 17.
They show that in Viet Nam, there is a large group of children who complete the last grade of lower
secondary school before leaving school.
Table 27: Educational Attainment (grade) of OOSC Aged 5 – 17 in Viet Nam
0
10
20
30
40
5 6 7 8 9 10 11 12 13 14 15 16 17
Pe
rce
nta
ge
Age
1 2 3 4 5 Total 6 7 8 9 Total 10 11 12
5 15.8 0.2 0.0 0.0 0.0 0.0 0.0 0.0 0.0 0.0 0.0 0.0 0.0 0.0 0.0 0.0 0.0 0.0
6 5.4 0.1 0.2 0.0 0.0 0.0 0.0 0.3 0.0 0.0 0.0 0.0 0.0 0.0 0.0 0.0 0.0 0.0
7 2.4 0.0 0.2 0.3 0.0 0.0 0.0 0.5 0.0 0.0 0.0 0.0 0.0 0.0 0.0 0.0 0.0 0.0
8 1.8 0.0 0.1 0.2 0.3 0.0 0.0 0.7 0.0 0.0 0.0 0.0 0.0 0.0 0.0 0.0 0.0 0.0
9 1.6 0.0 0.2 0.3 0.3 0.5 0.0 1.3 0.0 0.0 0.0 0.0 0.0 0.0 0.0 0.0 0.0 0.0
10 1.6 0.0 0.3 0.4 0.4 0.5 0.6 2.3 0.1 0.0 0.0 0.0 0.1 0.0 0.0 0.0 0.0 0.0
11 1.5 0.0 0.2 0.4 0.6 0.6 0.9 2.8 0.7 0.0 0.0 0.0 0.7 0.0 0.0 0.0 0.0 0.0
12 1.5 0.0 0.3 0.5 0.7 1.0 1.5 3.9 1.4 0.7 0.0 0.0 2.1 0.0 0.0 0.0 0.0 0.0
13 1.7 0.0 0.3 0.5 0.8 1.2 2.1 4.9 2.4 1.5 0.8 0.1 4.7 0.0 0.0 0.0 0.0 0.0
14 1.7 0.0 0.3 0.5 0.8 1.3 2.6 5.5 2.9 2.5 1.8 1.1 8.4 0.0 0.0 0.0 0.0 0.0
15 1.8 0.0 0.2 0.6 0.9 1.4 2.9 6.0 3.4 3.4 3.3 7.5 17.6 0.8 0.0 0.0 0.9 0.1
16 1.8 0.0 0.3 0.6 0.9 1.5 3.0 6.3 3.3 3.7 3.9 12.7 23.6 2.3 0.6 0.1 3.1 0.3
17 1.8 0.0 0.2 0.7 1.0 1.5 3.1 6.5 3.3 3.5 3.9 14.3 25.1 3.5 1.5 1.1 6.0 0.5
Total 3.1 0.0 0.2 0.4 0.5 0.8 1.4 3.4 1.5 1.3 1.2 3.2 7.3 0.6 0.2 0.1 0.9 0.1
Male 3.0 0.0 0.2 0.4 0.6 0.8 1.5 3.6 1.7 1.5 1.4 3.3 7.9 0.7 0.2 0.1 1.0 0.1
Female 3.1 0.0 0.2 0.4 0.5 0.7 1.4 3.2 1.3 1.1 1.1 3.2 6.7 0.5 0.2 0.1 0.8 0.1
Urban 2.4 0.0 0.2 0.3 0.4 0.5 1.0 2.3 1.1 1.0 1.0 1.9 5.1 0.6 0.2 0.1 0.9 0.1
Rural 3.3 0.0 0.2 0.5 0.6 0.9 1.6 3.8 1.6 1.5 1.3 3.7 8.1 0.6 0.2 0.1 0.9 0.1
Attended but Dropped Out
Lower Secondary Education Upper Secondary EducationOther Types of
Schools/College
/University
No
Educational
Attainment
Gender
Urban/Rural
Primary EducationEducational Attainment of
OoSC
Never
Attended
Age
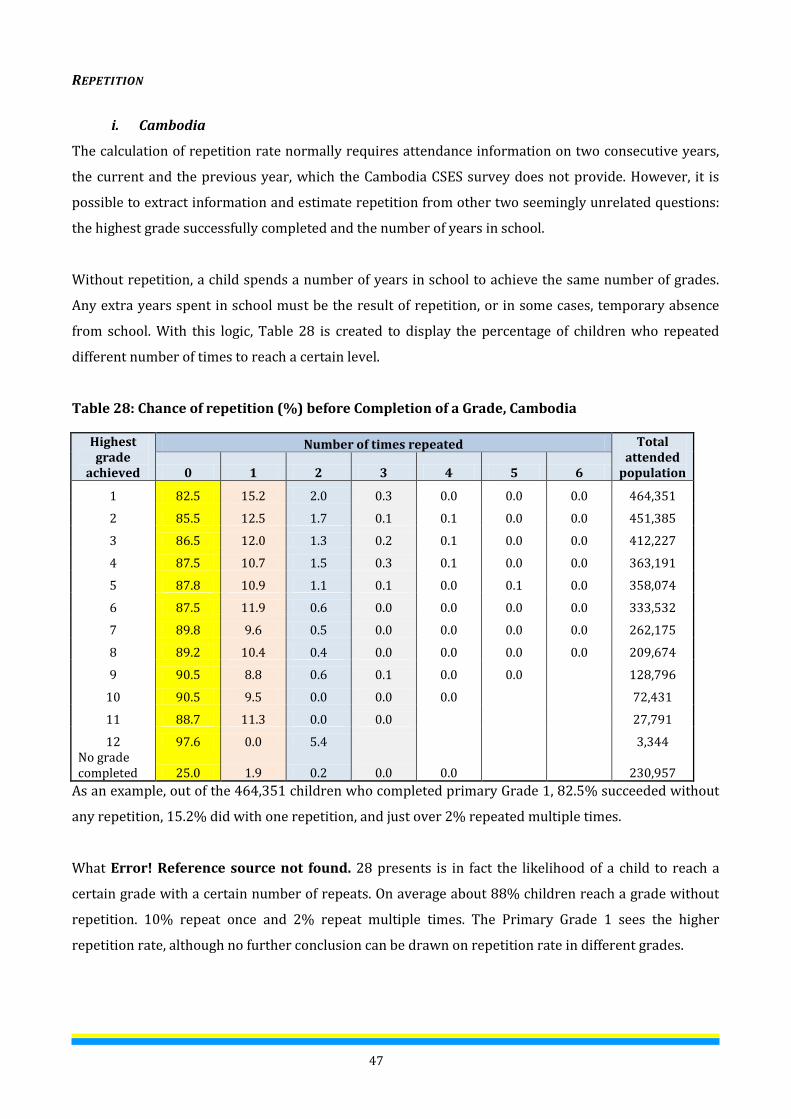
47
REPETITION
i. Cambodia
The calculation of repetition rate normally requires attendance information on two consecutive years,
the current and the previous year, which the Cambodia CSES survey does not provide. However, it is
possible to extract information and estimate repetition from other two seemingly unrelated questions:
the highest grade successfully completed and the number of years in school.
Without repetition, a child spends a number of years in school to achieve the same number of grades.
Any extra years spent in school must be the result of repetition, or in some cases, temporary absence
from school. With this logic, Table 28 is created to display the percentage of children who repeated
different number of times to reach a certain level.
Table 28: Chance of repetition (%) before Completion of a Grade, Cambodia
Highest grade
achieved
Number of times repeated Total attended
population 0 1 2 3 4 5 6
1 82.5 15.2 2.0 0.3 0.0 0.0 0.0 464,351
2 85.5 12.5 1.7 0.1 0.1 0.0 0.0 451,385
3 86.5 12.0 1.3 0.2 0.1 0.0 0.0 412,227
4 87.5 10.7 1.5 0.3 0.1 0.0 0.0 363,191
5 87.8 10.9 1.1 0.1 0.0 0.1 0.0 358,074
6 87.5 11.9 0.6 0.0 0.0 0.0 0.0 333,532
7 89.8 9.6 0.5 0.0 0.0 0.0 0.0 262,175
8 89.2 10.4 0.4 0.0 0.0 0.0 0.0 209,674
9 90.5 8.8 0.6 0.1 0.0 0.0
128,796
10 90.5 9.5 0.0 0.0 0.0
72,431
11 88.7 11.3 0.0 0.0
27,791
12 97.6 0.0 5.4
3,344 No grade completed 25.0 1.9 0.2 0.0 0.0 230,957
As an example, out of the 464,351 children who completed primary Grade 1, 82.5% succeeded without
any repetition, 15.2% did with one repetition, and just over 2% repeated multiple times.
What Error! Reference source not found. 28 presents is in fact the likelihood of a child to reach a
certain grade with a certain number of repeats. On average about 88% children reach a grade without
repetition. 10% repeat once and 2% repeat multiple times. The Primary Grade 1 sees the higher
repetition rate, although no further conclusion can be drawn on repetition rate in different grades.

48
Figure 11: Chance of Having a Number of Repeats before Completion of a Grade, Cambodia
OVER-AGE
This report defines that children are over-age if their age is two years or more than the age officially
declared for the grade. As an example, in Indonesia the age for primary grade 1 is 7. If the child is 9
years old or older, he/she can be assured of being over-age, as an 8 year old could have enrolled
coirrectly at age 7 and had a birthday while attending Grade 1.. However in Cambodia the age for
primary grade 1 is 6 and therefore only an 8 year old or older child is considered over-age. The tables in
this section do not give detailed ages but treat all ages according to the official age definition by the
respective country, which is tabled in Section 1.
There is a good reason why over-age is taken only from 2 or more years older. A child with date of birth
just before the survey date will be considered one year over-aged, even though he is attending grade
which is right for him. If this is not taken into consideration, over-age statistics will no doubt be over-
estimated. For children who are 2 or more years older than the right age for the grade, these children
are confirmed over-age children for the respective grade by at least one year.
On the other hand, if the over-age definition considers only children who are 2 or more years older, the
over-age statistics will be under-estimated. In between the two, this report chooses to calculate 2 or
more years older as over-age, and the statistics present an under-estimated over-age conclusion. The
tables must be read with this in mind.
Tables 29 to 34 present over-age by grade for each individual country. This is followed by a table that
consolidates the information. The individual country table is useful in that it presents a detailed age
spectrum over the most relevant ages of children in a grade.
15.2
12.5 12.0
10.7 10.9 11.9
9.6 10.4
8.8 9.5
2.0 1.7 1.3 1.5 1.1
0.6 0.5 0.4 0.6 0.0
0.3 0.1 0.2 0.3 0.1 0.0 0.0 0.0 0.1 0.0
0
4
8
12
16
1 2 3 4 5 6 7 8 9
Grade
Repeated once Repeated twice Repeated three times

49
Table 29: Over-Age by Grade in Cambodia
Cambodia 1 2 3 4 5 6 7 8 9 Under Age 0.0 9.5 8.1 7.7 7.6 7.6 9.0 10.0 10.3 Official Age 37.4 24.6 17.6 18.5 16.8 16.2 16.0 19.1 17.2
Official Age + 1
29.2 24.3 25.0 21.5 21.3 19.4 22.3 21.8 20.8
Over-Age 33.5 41.6 49.3 52.3 54.3 56.7 52.6 49.0 51.7
Table 30: Over-Age by Grade in Indonesia
Indonesia 1 2 3 4 5 6 7 8 9 Under Age 60.9 52.7 49.2 54.2 52.8 38.5 27.8 49.0 50.7 Official Age 31.7 35.8 37.8 33.6 33.5 51.6 53.2 37.2 33.3
Official Age + 1
4.3 8.3 9.5 8.4 10.1 6.8 13.4 9.5 11.3
Over-Age 3.2 3.2 3.4 3.8 3.7 3.1 5.7 3.8 3.9
Table 31: Over-Age by Grade in Thailand
Thailand 1 2 3 4 5 6 7 8 9 Under Age 2.2 3.2 3.1 3.4 2.8 3.0 3.2 3.5 3.1 Official Age 42.5 36.4 36.9 35.4 37.8 43.1 39.8 43.0 38.1
Official Age + 1
52.0 56.1 55.9 57.3 56.1 50.1 53.4 49.8 50.9
Over-Age 3.3 4.3 4.2 3.9 3.3 3.8 3.6 3.7 7.9
Table 32: Over-Age by Grade in Timor-Leste
Timor Leste 1 2 3 4 5 6 7 8 9 Under Age 12.3 14.3 10.3 9.5 7.9 7.8 5.1 8.8 7.1 Official Age 35.7 25.4 22.5 16.1 19.1 12.4 19.2 14.3 11.1
Official Age + 1
26.4 25.9 22.0 24.8 20.6 25.3 20.3 21.1 18.6
Over-Age 25.6 34.4 45.2 49.6 52.4 54.6 55.4 55.8 63.2
Table 33: Over-Age by Grade in Viet Nam
Viet Nam 1 2 3 4 5 6 7 8 9 Under Age 3.6 2.8 1.9 1.4 1.9 1.5 1.5 1.4 1.7 Official Age 62.2 58.6 61.2 61.2 58.9 59.3 58.8 60.4 58.6
Official Age + 1
27.4 30.5 29.1 28.1 29.6 29.3 30.4 29.7 30.6
Over-Age 6.8 8.1 7.7 9.3 9.6 9.8 9.3 8.5 9.1
Table 34: Over-Age in Countries
Over-Age Rate
1 2 3 4 5 6 7 8 9
Cambodia 33.5 41.6 49.3 52.3 54.3 56.7 52.6 49.0 51.7 Indonesia 3.2 3.2 3.4 3.8 3.7 3.1 5.7 3.8 3.9 Thailand 3.3 4.3 4.2 3.9 3.3 3.8 3.6 3.7 7.9
Timor Leste 25.6 34.4 45.2 49.6 52.4 54.6 55.4 55.8 63.2 Viet Nam 6.8 8.1 7.7 9.3 9.6 9.8 9.3 8.5 9.1

50
Figure 12: Over-Age by Grade
The main messages from over-age tables are as follows:
Cambodia and Timor-Leste have very high over-age figures, reaching their peaks at 56.7% in
Grade 6 in Cambodia and at 63% at Grade 9 in Timor-Leste. In most of the grades in these two
countries more than half of the children are over-age. This has unique policy and strategic
response implications.
Indonesia has a very high number of children who are under-aged. This is likely related to the
uncommon fact that the official age to start primary school is 7 in Indonesia rather than the
usual 6, and that Grade 1 is free whereas pre-primary is fee based. It is clear from the table that
parents in Indonesia send their children to school earlier than officially recommended and
hence the severe under-age level seen in the table, resulting in young children receiving
education which is not age appropriate.
Both Thailand and Viet Nam have relatively low number of over-age children in school. In
Thailand there is a higher percentage of children at the official age +1 rather than at the official
age, but in Viet Nam there is a higher percentage of children at the official age rather than the
official age +1. This difference does not give any meaning as the variation depends on the time
the survey is conducted in relation to academic year. The important and revealing data is the
statistics on over-age, i.e. 2 years or more than official age. In this respect, the over-age situation
is slightly higher in Viet Nam than in Thailand.
Cambodia
Indonesia Thailand
Timor Leste
Vietnam
0
10
20
30
40
50
60
70
1 2 3 4 5 6 7 8 9
Grade
Cambodia Indonesia Thailand Timor Leste Vietnam

51
Sub-national Regional Variation on Over-Age in Viet Nam
As mentioned earlier, over-age has not been analysed sufficiently in individual country reports. The Viet
Nam report, however, does include analysis on regional variation on over-age. The result is significant.
Table 35: Primary Over-Age in Viet Nam Provinces
Error! Reference source not found. presents provincial variation on over-age in primary schools. The
same definition is used to calculate deviations and both average and maximum deviations are in
relation to the Viet Nam national average. The table shows that Gia Lai province has 21.3% of its
primary age children who are over-age for the grade, a figure which exceeds 2.5 times that of the
national average. The average deviation is 70.1%, indicating provinces perform very differently. In the
best performing province HCMC, the over-age rate is only 3.4%, a figure that is only about 40% of the
national average.
Figure 13 presents over-age in lower secondary grades, compared with over-age in primary grades. It is
clear in some provinces such as Dien Bien and Gia Lai, over-age in grade increases in lower secondary
education.
Figure 13: Primary and Lower Secondary Grades Over-Age Rate in Viet Nam by Province
Vietnam
ProvincesVietnam Lao Cai
Dien
Bien
Ninh
ThuanKon Tum Gia Lai HCMC
Dong
ThapAn Giang Other
Over-Age
Avg.
Deviation
Over-Age
Max.
Deviation
Under Age 2.4 4.8 5.7 2.4 0.9 0.3 0.1 0.1 0.0 2.7
Official Age 60.4 50.9 44.6 54.3 53.3 45.5 70.5 59.9 55.6 60.6
Official Age + 1 29.0 30.8 29.1 29.8 32.3 32.8 26.1 30.9 31.6 28.9
Over-Age 8.2 13.5 20.7 13.5 13.5 21.3 3.4 9.2 12.7 7.9 70.1 158.8
0
10
20
30
Primary Grades Lower Secondary Grades

52
ANALYTICAL SUMMARY OF PROFILES OF EXCLUDED CHILDREN
The beginning of this chapter attempts to comprehend the status of the out-of-school children by
dimension of exclusions: out-of-school children in pre-primary, primary and lower secondary, as well
as those who are in school but at risk of dropping out for primary and lower secondary level. Moreover,
it examines the percentage of distribution for children who attends and not attends schools and
particularly scrutinizes the disparity patterns pertaining to gender, geographical and economic
quintiles. In Dimension 4 and 5, exemplifications of statistics from selected countries are presented to
focus on dropout, repeaters, never enrolled and overage.
In this analytical summary, we will highlight the summary table for statistics based on the key
indicators and available data. The key messages of each dimension further analyzes implications of the
evidence in order to build for the following chapters, which will discuss on the barriers and bottleneck
and education policies that would go around them.
In general, the pattern of the enrolment rate for pre-primary is low among the four countries, especially
for the children who attend pre-primary during their pre-primary age. The implication for this is that
they will become an overage in the latter stage of level of education and predominantly fall into the “At
Risk” category. For the primary level, most countries except Timor Leste have a high attendance rate.
However, the percentage of dropout, repetition, never enroll and overage are substantially high in some
countries, making disadvantage children becomes more excluded. For the secondary level, focus on
making children attend the secondary level at the right age, would greatly help those “At Risk”.
The key messages within this report can be summarized as follows:
Dimension Cambodia Indonesia Philippines Timor Leste
Dimension 1: Pre-primary
School attendance 31.3% 82.3% 65.85% 17.7%
Pre-primary age in pre-
primary level
6.6% 10.4% 60.1% 5.6%
Pre-primary age in primary
level
24.7% 71.9% 5.7% 12.1%
OOSC of Pre-Primary Age 68.7% 17.6% 34.2% 82.3%
Disaggregation by type of
disparity (Attending School)

53
Dimension Cambodia Indonesia Philippines Timor Leste
Gender (% Variation from
national value)
5% 1.3% 4% 8.5%
Urban vs rural (% Variation
from national value)
23.4% 7.2% 10.4% 37.3%
DIMENSION 1: PRE-PRIMARY SCHOOL AGE CHILDREN
The rate of pre-primary school age children attending schools differs greatly between countries.
The same applies to the rate of OOSC. The highest rate of school attendance in the four countries
is 82.3% in Indonesia and the lowest 17.1% in Timor Leste.
There are some differences between male and female attendance rates, and without exception
in all countries boys have lower attendance rates than girls.
In the two countries with low rates of attendance, Timor-Leste and Cambodia, there is a much
higher percentage of pre-primary age children in primary education than in pre-primary
education.
In three of the four countries with relatively high rates of attendance (Philippines, Thailand and
Viet Nam), more pre-primary age children attend pre-primary schools than primary schools. In
Indonesia, one of the four countries, this conclusion is reached only by lowering the pre-
primary age by one year to 5. At the official pre-primary age of 6, most children attend primary
education. However, the opposite is true in Indonesia, where Grade 1 starts at age 7 and over
70% of 6 year olds enroll in Grade 1 prematurely.
Urban areas achieve almost universally higher school attendance rates than rural areas.
Additionally there is a great variation in pre-primary school attendance rates between different
areas within a country and between children with different economic backgrounds (wealth
quintiles) in most of the countries. In some sub-national regions the attendance rate is as low as
20% of its national average, and in some wealth categories the attendance rate is as high as
double that of its national average.

54
Dimension Cambodia Indonesia Philippines Timor Leste
Dimension 2: Primary school
School attendance
ANAR 82.6% 98% 90.8% 72.1%
GPI 1.03 1.01 1.02 1.02
OOSC of Primary Age 17.45% 2% 9.2% 27.9%
Disaggregation by type of
disparity (Attending School)
Gender (% Variation from
national value)
Female Female Female Female
Urban vs rural (% Variation from
national value)
4.77% 0.82% 1.47% 6.68%
Dimension 2: Primary school age children
Out of the six countries, four achieve above 90% for school attendance among primary school
age children, one just above 80% (Cambodia) and one just above 70% (Timor Leste).
All 6 of the countries have achieved gender parity in primary education at national level.
The approximate number of out of school children at primary age is: Cambodia 321,000,
Indonesia 577,000, Philippines 1,265,000, Thailand 550,000, Timor Leste 55,000 and Viet Nam
562,000. In total, in these six countries, there are 3,330,000 children at primary school age who
are not attending any formal primary or secondary education.
Urban areas achieve a higher attendance rate than rural areas. The average deviation in primary
attendance is relatively small, however, although regions/provinces and also wealth quintiles
still exhibit in some cases about 20% deviation from the national average.
Dimension Cambodia Indonesia Philippines Timor Leste
Dimension 3: Lower Secondary ANAR, Lower secondary school age children attending primary school
and OOSC and Attendance rate of school age children
School attendance
Lower Secondary ANAR/ GPI 33.1%/ 1.12 80%/ 1.06 66.3%/ 1.19 31.6%/ 1.17

55
Dimension Cambodia Indonesia Philippines Timor Leste
Lower Secondary School age
attending primary/ GPI
51.8%/ 0.89 5.5%/ 0.68 23.3% 0.79 54.6%/ 0.9
OOSC of Pre-Primary Age/ GPI 15.1%/ 1.16 14.5%/ 0.86 10.4%/ 0.57 13.8%/ 1.06
Disaggregation by type of disparity
(Attending School)
Gender (% Variation from national
value)
Female Female Female Female
Urban vs rural (% Variation from
national value)
41.3% 7.3% 9.8% 27.8%
DIMENSION 3: LOWER SECONDARY SCHOOL AGE CHILDREN
The national lower secondary ANAR varies between 31.6% and 80.4%.
Boys are at a distinct disadvantage in attending schools appropriate for their age. In all
countries except one, a higher percentage of girls than boys attend lower secondary school.
Many secondary school age children fall behind the progress required of them. They attend
schools not at the level which is appropriate for their age, but in primary schools where they are
significantly over-age. The percentage of children of lower secondary age still in primary
education ranges between 5.5% in Indonesia to 54.6% in Timor-Leste.
A distinctively higher percentage of boys than girls remain in primary schools overage. In Timor
Leste, for every 1% of girls overage still studying in primary education, there are almost 1.5% of
overage boys. .
The percentage of lower secondary school age children who are out of school ranges between
3.5% in Thailand and 15.1% in Cambodia.
The numbers of out of school children in these countries are 144,895 in Cambodia, 1,949,736 in
Indonesia, 979,762 in Philippines, 686,899 in Thailand, 13,323 in Timor Leste, and 614,875 in
Viet Nam. The total number of OOSC children stands at 4,389,491.
Urban areas achieve a lower OOSC rate than rural areas, with higher percent of rural OOSC than
urban.
The sub-national/regional/provincial variation is now significant. In one of the countries, the
out of school rate in one of the provinces reaches almost two and half times of its national
average.

56
The variation with regard to wealth categories is also significant. The worst case has the
maximum deviation of 92.9% from its national average, with the average deviation of the five
wealth quintiles at 46.6% of the national average.
Dimension Cambodia Indonesia Philippines Timor Leste
Dimension 4 and 5: Dropout
Grade 1 0 4.4% 25.77% 5.1%**
Grade 2 0.9% 2.6% 4.6%**
Grade 3 2.3% 2.1% 4.7%**
Grade 4 4.7% 2.2% 5.4%**
Grade 5 6.8% 3.5% 5.4%**
Grade 6 9% 1.6% 2.6%**
Grade 7 5.7% 2.3% 20.57% 3.8%**
Grade 8 7.2% 2.2% 4.2%**
Grade 9 8.3% 3.7% 2.5%**
Dimension 4 and 5: Repeaters
Grade 1 15.2%* 7.6% n/a 30.3%**
Grade 2 12.5%* 4.2% n/a 17.7%**
Grade 3 12%* 3.6% n/a 16.7%**
Grade 4 10.7%* 2.8% n/a 13.2%**
Grade 5 10.9%* 1.9% n/a 10%**
Grade 6 11.9%* 0.2% n/a 4.4%**
Grade 7 9.6%* 0.5% n/a 5.6%**
Grade 8 10.4%* 0.5% n/a 2.5%**
Grade 9 8.8%* 0.2% n/a 1.8%**
Dimension 4&5: Never attended
school
11.64% n/a n/a n/a
Dimension 4&5: Overage
Grade 1 33.5% 3.2% n/a 25.6%
Grade 2 41.6% 3.2% n/a 34.4%
Grade 3 49.3% 3.4% n/a 45.2%
Grade 4 52.3% 3.8% n/a 49.6%
Grade 5 54.3% 3.7% n/a 52.4%
Grade 6 56.7% 3.1% n/a 54.6%
Grade 7 52.6% 5.7% n/a 55.4%
Grade 8 49% 3.8% n/a 55.8%
Grade 9 51.7% 3.9% n/a 63.2%
*Represent children who repeats once (see section 2.5.2) **Source: EMIS (most recent)

57
4. NUMBER OF OOSC CHILDREN
When the OOSC populations in four countries are combined there are in total more than two
million primary school age children who are out of school. At lower secondary school age, the
number exceeds three million. When combined together, the number of children who are at
primary or lower secondary school age and do not attend any formal school stands over 5
million.
2. School attendance rate of children aged 5 to 17
When the school attendance rate of school age children is displayed, the six countries exhibit
universally a dome shaped curve, with the lowest rates at the lower end of the age, high in the
middle, and low again at the higher end of the age.
The gender difference also indicates a similar picture. There is gender disparity at the low and
high end of the school-going ages but in the middle almost all countries achieve gender parity.
In all but one country, girls have an advantage in attending school. Only in Cambodia at the
higher end of the age range, there is a distinctively higher percentage of boys attending school.
3. Dimension 4 and 5: Over-age
In the five countries included in the study of over-age students, two displayed significant levels
of over-age. On average around 50% of Timorese children are over-aged in each grade. In
Cambodia, 63% of its grade 9 children are over-aged..
The other three countries also showed some level of over-age. In one of the countries over-age
is on average close to 10% in each grade, while the others have an average around 4%.
Even in countries where the average over-age rate is low, sub national regions or provinces may
still display a very high over-age level. In Viet Nam, for example, the national average over-age
in primary education is 8.2%, but in one of the provinces the over-age reaches 21.3%, a figure
exceeding 2.5 times of the national average. The average deviation is 70.1%, indicating
provinces perform very differently. In the best performing province HCMC, the over-age is only
3.4%, a figure that is only about 40% of the national average.
Over-age is an issue often over looked and much more study needs to be carried out in this area
as it has wide reaching implications for Education for All.

58
CHAPTER 3: BARRIERS AND BOTTLENECKS
This chapter discusses some of the most prominent barriers and bottlenecks to education in the region,
based on the analysis from the four initial countries participating in the OOSC initiative. The types of
barriers and bottlenecks that lead to exclusion from education vary by children’s profiles and contexts,
and a combination of barriers often interacts together to result in marginalization of children. As per
the OOSC Conceptual and Methodological Framework, barriers and bottlenecks are represented by four
categories: demand side socio-cultural barriers, demand side economic barriers, supply side barriers
and political, governance, capacity and financial bottlenecks. Demand-side barriers encompass
household and community factors including those pertaining to the child’s experiences and attitudes
toward schooling, as well as issues of affordability and cost. Supply-side barriers, on the other hand,
include the input capacities of the government to provide education. It should be noted, however, that
many demand-side barriers persist due to lack of systematic, supply side responses by government.
Hence, the distinction between the two types is not always clear.
In reviewing the National Reports and their analysis of barriers and bottlenecks, the following were
identified as the common themes and issues under the four categories.
Demand Side Barriers Supply Side Barriers Policy, Governance,
Capacity and Financing Social Cultural Economic
Perceptions on Value
of Education
Limited Right Age
Entry to Grade One
Gender Bias and
Discrimination
Disability
Migration and Lack of
Birth Registration
Direct and Indirect
Fees
Health and Nutrition
Natural Disasters
Access
Water and Sanitation
Facilities
Quality
Language
Lack of Early
Childhood
Development Services
Decentralization and
Governance
Education Financing

59
SOCIAL CULTURAL, DEMAND SIDE BARRIERS
Across East Asia and the Pacific, there are numerous factors and issues related to socio-cultural
barriers. Many of them are intertwined with one another and are magnified in the presence of economic
factors such as poverty. In this section, some of the most common factors and issues related socio-
cultural barriers are discussed, including perceptions on the value of education, perceptions on
children’s school readiness, gender-based bias and discrimination, and migration.
PERCEPTION ON THE VALUE OF EDUCATION
Education is not always seen as a valuable investment, especially for those who may be faced with
relatively high opportunity costs of education. For instance, poor families in rural areas whose children
may not have direct access to economic opportunities from schooling may believe that education yields
limited economic return.
However, while poverty may be assumed to be the main cause of low value of education, evidence
shows that the effects of poverty and wealth on preferences for education are not homogenous. Instead
there are other factors, such as limited relevance of education, that play a more critical role in shaping
household decisions on sending children to schools. For instance, in Timor-Leste, wealthier families
tend to believe the children will be better served by “learning from practice” in family businesses in
markets and stall than in schools that teach limited relevant skills, and therefore are more likely to pull
children out of schools. In Viet Nam and the Philippines, the stereotypical view that poor, ethnic
minority families have low value for education is also disputed, as ethnic minority groups themselves
report that it the limited relevance of education in its current form, including language of teaching and
low levels of learning, which is of greater concern.
In some cases, as in the Philippines, low parental education is cited as a key factor contributing to low
value for education. Generally, parental educational attainment and a child’s likelihood of success in
education are the most frequently cited causal relationships in literature, but as the Country Report
notes, there has been little done to help parents who have limited or not formal education, noting that
(UNICEF, 2011b):
“Not only do parents not have the experience to support their children’s education at
home in terms of helping with lessons, they also are extremely poor and cannot afford to
provide the basic needs of their children. In these cases it is unreasonable to expect
parents to be able to provide similar quality support as those that can be provided by a
more educated set. Teachers lament that the uneducated parents do not like to attend
PTA meetings or do not show up when guidance counselors call them in. This is
sometimes interpreted by school administrators26 as parents not caring about their
26 A study by SEAMEO (2007) goes so far as to question whether the DepEd may be discouraging parents with little education from being involved in their child’s education, which is both detrimental to the child’s motivation and disconnects an important segment of the community from the local schools.
Administrator
Highlight

60
children’s education, but upon prodding it was evident that often when they do attend
meetings they cannot really understand what is going on and feel alienated, and more
importantly, they do not have the luxury of taking a morning off from working in the
farm to see a guidance counselor. These are understandable situations and we should be
able to recognize when schools need to fill in where parents can truly not provide.”
As previously noted, some demand-side barriers such as low value of education materialize only in the
absence of effective supply-side response (i.e, providing learning material and teachers fluent in local
languages), highlighting the importance of better understanding the underlying factors and essential
responses related to them.
LIMITED RIGHT-AGE ENTRY TO SCHOOL
One of the factors associated with high rates of out-of-school children in early grades is not entering
school at the right age. In the Philippines, six and seven-year old children not in school comprised of
nearly 75 percent of all primary school age out-of-school children in the country. One of the key reasons
noted is the families’ and teachers’ perception on school readiness of children as there is a strong
belief that children of that age are “too young to go to school.” Some indications of “school readiness”, as
noted by teachers, include children’s ability to write their names, recognize letters and numbers, and
socialize with other children, many of which are said to be lacking among six-year old children. In large
part, this may be due to limited access to ECD services, but it also reflects the lack awareness on the
importance of ECD, as noted in the Philippines Country Report. Similarly, in Timor Leste, parents have
low expectations for learning for young children, and also note hunger and distance to schools as
reasons for delaying the enrollment of children in schools at the right age.
In Indonesia, on the other hand, early entry to school is a common barrier to education, with
approximately 72 percent of 6-year olds and 11 percent of 5-year olds are in primary education and
following curriculum designed for 7 year-old children. Children who live in urban areas, have educated
mothers and come from better-off households are more likely to enter school early, but prohibitive
cost of pre-primary education, which is mostly private, also means that most parents opt to send
children early for “free” and available formal education.
GENDER BIAS AND DISCRIMINATION
Significant strides have been made towards gender parity across the region, and at national levels,
enrolment gaps between boys and girls are minimal at primary levels. Nevertheless, various forms of
gender-based bias and discrimination still prevail, especially at lower secondary levels and specific sub-
regions within countries.
Administrator
Highlight
Administrator
Highlight
61
For girls, gender roles prescribed by traditions, such as caring for younger siblings and helping with
household chores, can disrupt a girl’s education, particularly if they come from poorer families. In
Timor Leste, a 2009 study by Plan International and UNICEF explains the child-rearing responsibilities
that are imposed upon girls often disrupts their education (Plan & UNICEF Timor-Leste (2009)):
As children become a little older, their older siblings are expected to care for them,
particularly through emotional and social support. Older sisters had a significant
role in caring for the social needs of very young children, moving into more physical
roles of bathing, caring for at night and taking to school once children moved into 4
– 6 years age group, reflecting the fact that family spacing may mean that older
sisters may not be that much older than the young children they are caring for.
(p37)
Local practices such as early marriage also exert pressure to drop out of school for girls in Timor
Leste, where thirty-seven percent of girls are married and have their first child by age 19. Early
marriage is also a major barrier to education for girls in Madurese communities in East Java or the West
Sulawesi of Indonesia, and for both girls and boys in the Ragalai ethnic minority communities in Ninh
Thuan, Viet Nam. A recent situation analysis of children in Ninh Thuan portrays the influence of early
marriage on education prospects for boys and girls in different ways27:
‘For girls, there may be pressure to marry at an early age, because upon marriage
boys come to live with the bride’s family, thus supplementing labour resources and
production capacity in the bride’s family. Raglai boys are commonly assigned to look
after the families cattle – in an immediate sense; therefore, this is one of the main
reasons for the high rate of withdrawal from school amongst Raglai boys28. At the
same time, this has deeper associations with the social and economic value attached
to cattle in Raglai society. The involvement of Raglai boys in caring for their families
cattle herd is bound up with their own future livelihood prospects. School
attendance – the demand for household labour – the values attached to cattle in
Raglai society – the perceptions of Raglai teenagers about the value of education and
their own future prospects – and broader maintenance of Raglai kinship relations
are, therefore, all deeply interwoven.’ (p68)
Gender-based violence within the family and in schools is also mentioned as a barrier to education in
Timor, Indonesia and Viet Nam. High levels of tolerance for family violence is reported in Timor Leste
and Indonesia, with women and girls bearing the brunt given they are often perceived to be in
subservient roles.
27 NinhThuan Provincial People’s Committee & UNICEF (2011 draft document) Analysis of the Situation of Children in NinhThuan Province 28Livestock extension programs in NinhThuan stipulate that credit and material support provided to households is conditional on not withdrawing children from school; however, this may be problematic if alternative labour is not available or if labour-saving techniques are not simultaneously introduced into livestock production systems (e.g. through stall feeding and establishing irrigated fodder banks).
Administrator
Highlight
Administrator
Highlight
Administrator
Highlight

62
In Timor Leste, a UNFPA study on gender-based violence found that many victims of gender-based
violence appearing before the courts were children under the age of 18.29 Girls in rural areas who live
far from schools are particularly vulnerable, and parents are reluctant to send them to schools due to
risks of sexual abuse and harassment on the way to school. In Viet Nam, discrimination, bullying and
violence occur in some schools and for specific students at risk, such as children with disabilities,
children whose parents are in prison, or children in some form of juvenile detention centers. Both
teachers and students are perpetrators of such violence.
Disadvantages of boys are also manifested in their lower attendance rates in lower secondary levels in
Cambodia, Indonesia, Thailand and the Philippines. Reasons for this so-called “reverse gender gap”
range widely. As noted in the Philippines Country Report, gender-based biases, such as low academic
expectations of parents and teacher preferences for female students, have adverse impact on boys’
educational outcomes.
DISABILITY
Since 1990 World Conference on Education for All in Jomtien, the issue of inclusive approaches to
education was highlighted. Over the last two decades, many countries reaffirm and strengthen the
basic provisions with an unequivocal call for inclusive education by amending laws and regulations to
echo the countries’ commitment to the Convention on the Rights of Persons with Disabilities (2008) on
the equal treatment basis.
In most cases, children with disability are excluded from the formal school because these children
require personalized teaching and learning in order to adjust themselves to respond to their future
needs and be self-reliance. Generally, these children need a better physical access, quality teaching and
learning, enabling environment from schools such as safe, secure and free from violence. Parents, peers
and community also need to have a positive attitude towards children with disabilities. Therefore,
when looking from the lens of disability, barriers in the supply side including a limited learning
opportunities and low quality inclusive education, lack of qualified teachers, irrelevance of assessment
and learning materials, and lack of monitoring and evaluation system restricts parents’ decision to send
their children to school. On the other hand, constraints pertaining to the demand side include stigma
and discrimination, and negative attitudes from family and society which push these children away
from completing the full cycle of education.
With the adoption of WHO’s (2009) social definition of disability, the concept of disability was placed in
the environment rather than with the person: with disability emerging from the interaction of functional
limitations with barriers in the environment. That is a person is disabled- not capable of fully participating
29 UNFPA, 2005. http://www.unfpa.org/women/docs/gbv_timorleste.pdf

63
in various aspects of society- if they have difficulties in functioning that are not accommodated for in the
environment- where environment is interpreted broadly as including the physical, cultural, and policy
environments.30 This definition puts the responsibility with the institution to modify the environment
so that a person with disability can access education and overcome environmental obstacles that are
reflected in government policies and regulations.
In Indonesia, monitoring children’s disability is done through a household survey. Based on SUSENAS
2003, statistic shows that 0.5% of children had a visual, hearing, speech, physical or mental disability
and among these 71% of disabled children aged 6-11 years were not in school. Children with
disabilities and their families report that they feel embarrassed to attend the local school or find it
unaffordable and impractical to have to go to a special school very far from home (UNICEF, 2011b).
Stigma associated with disability often makes inclusive education elusive, and discriminatory attitudes
adversely impact educational opportunities, especially if compounded by other major barriers, such as
distance to schools, from the supply-side.
In Cambodia, approximately 0.8% of all children aged 0-17 years old in 2008 were reported with
disability (approximately 44,000 children). However, it is assumed that this might be underreported
due to the challenges with the monitoring system and out of these, approximately 37% reported as
never attended school and 10% as dropped out.
The first national survey of disability in Timor-Leste’s primary schools was conducted in 2008 by Plan
International and covered 336 primary schools across the country to find out the number, type and
severity of the disabilities which primary students have. Nearly 2,000 students, or one in every 100
students, had a disability. Primary school children with a disability were not attending school either
because they had never attended, or had dropped out because of difficulties associated with their
disability. Twenty-four per cent of the children had an intellectual disability, and 21 per cent had a
physical disability. Those with more than one form of disability were classified as having complex
disabilities. There is no special provision in the education budget for children with disabilities, and
there is a strong social stigma attached to having disabled children and wasting family resources on
educating them. The report showed that children with milder disability are likely to start school on
time. However, these disabled children are repeating at least two grades and 41.6% of them are over-
age and dispersed across all grades, increasing in number at the higher grades.
30 Cuong, Nguyen Viet & Daniel Mont Does Parental Disability Matter to Child Education? Evidence from Viet Nam Hanoi: The World Bank East Asia and Pacific Region Poverty Reduction & Economic Management Sector Department (p 5) http://econ.worldbank.org/external/default/main?pagePK=64165259&theSitePK=469372&piPK=64165421&menuPK=64166322&entityID=000158349_20110801083520
Administrator
Highlight

64
In Viet Nam, the definition of disability has been refined to focus on the context for learning being
disabled rather than of the person and that is where only 10% of children with disabilities are in school.
The country factor in the importance of the issue of disability and tries to keep track on the data for
analysis. Viet Nam census includes questions on disability of major four functions: vision, hearing,
movement (walking) and cognition (learning or understanding). A person is defined as “Disabled” if
he/she has at least one of the mentioned four functions classified into “Unable”, while considered as
“Partial Disabled” if he said he has either “little and/or Very difficult” in any of the four functions, and
considered as “No Disability” if he/she has all abovementioned four functions classified into “No
difficulty”. The country report stipulates the disability dimension for all dimensions, whereby children
with disability are not attending pre-primary at 83.7% of population, 87.6% out of schools for children
at primary age, and 90.9% for children at lower secondary age. The barriers that children with
disabilities face are an extra barrier for all other barriers. The major barriers for the children with
disability includes the distance to school, language for children with disability especially those with the
hearing impaired person, lack of special trained teachers and lack of policy development cooperation
among different ministries.
MIGRATION AND LACK OF BIRTH REGISTRATION
High level of migration within and between countries in search for better employment and economic
prospects acts as another barrier to education. Moving from city to province, and vice versa, for
employment can be common, and among some overseas Filipino workers, choice to work abroad and
leave their family behind is based on their desire to earn enough to provide better education for their
children31. Still, numerous challenges arise for children who are left behind and cared for by their
extended families. A common outcome which often leads to dropouts, not only because of possible
neglect by guardians who are unable to provide sufficient care (i.e., through help with homework,
making sure children wake up on time or have supplies), but also the psychological impact of having
parents move away. Even when children migrate together with their parents, due to lack of
awareness about education systems, parents do not always enroll children in new locations in the
middle of the school year and end up holding their children back until the new school year begins.
Also, migrant families may not have official residential status in catchment area needed for school
enrolment, which can effectively deny access. In Viet Nam, according to the Dien Bien Situation
Analysis on Children (2010), teachers in some schools have been reported collecting registration forms
and requiring commune authorities to issue birth certificates in order to complete the required
documents before allowing migrant children to enrol.32
31 Edillon, R.G. (2008). The Effects of Parent’s Migration on the Rights of the Children Left Behind. Asia Pacific Policy Center Report. 32 Dien Bien Provincial People’s Committee & UNICEF, 2010. Situation Analysis of Children in Dien Bien Province. P. 103
Administrator
Highlight

65
In some cases, as seen in the Philippines, strict demands for birth certificates as requirement for school
entry is unrealistic for the poor and becomes a major policy/governance barrier to reaching out of
school children. In the Philippines, schools, especially in the provinces, are strict with birth certificates,
and inaccurate and inconsistent ages reported by parents from year to year can present challenges.
However, lack of birth registration is a widespread phenomenon, and the related costs of between
P100-P2000 to obtain one mean denied access to schools for the poor, especially those with many
siblings (UNICEF 2011c).
ECONOMIC DEMAND SIDE BARRIERS
Economic demand side barriers are economic factors of families that keep children away from school.
Poverty and high levels of inequality is the primary economic barrier in the region. East Asia and the
Pacific has had by far the strongest overall HDI performance of any region in the world, nearly doubling
average HDI attainment over the past 40 years, according to the Report’s analysis of health, education
and income data. Life expectancy in East Asia and the Pacific climbed to an average of 73 years in 2010
from 59 in 1970. In East Asia and the Pacific, the region’s literacy rates rose to 94 percent in 2010
compared to 53 percent in 1970.
However, UNDP’s Human Development Report 2010 notes that in East Asia, most countries have higher
income inequality today than was the case a few decades ago, due in part to widening gaps between
rural areas and the rapidly industrializing cities. In Indonesia, there has been steady reduction in the
percentage of population living in poverty, which was only interrupted during the Asian financial crisis.
The poverty headcount rate was 13% in 2010, according to SUSENAS, but the concentrations of poverty
found in NTT, Maluku, West Papua and Papua are much higher. In Viet Nam, disproportionate
representation of ethnic minority groups among the poor is persistent and, as discussed below, results
from an array of underlying disadvantages they face.
In the remainder of the section, multiple mechanisms in which poverty manifests to exclude children
from poor families are discussed, including direct and indirect fees, health and nutrition, child work and
natural disasters.
Administrator
Highlight
Administrator
Highlight
Administrator
Sticky Note
!!!!

66
DIRECT AND INDIRECT FEES
Most countries in the region have officially abolished school fees to provide free and compulsory
education at least at primary education level. However, various forms of direct and indirect fees to
households prevail in many countries and account for one of the major reasons for non-attendance and
dropout. In the Philippines, when children have no uniform, no allowance to buy food during snack
time, or no money to hand to the teacher for school projects, they feel ashamed (nahihiya/napapahiya)
enough to not want to come to school, even if the teacher and classmates are willing to contribute the
necessary support. . In Timor Leste, although education has been free since 2008, it is estimated that it
still costs about an extra $200 for each family.33 These costs include costs of learning materials and
uniforms and extra costs for school-based fees, snacks & lunches, and volunteer teachers. In Viet Nam,
many children leave school after completing their primary education because of the fact that their
parents cannot afford higher school expenses required for secondary (tuition fees, books, learning
equipment, transportation, per diem fees, contribution fees for school). At the secondary level, these
costs are double that of primary. There is also the notion that the government provides only the bare
minimum in public education, and in order to attain better quality education, including full day
schooling, they need to pay extra fees for tuition classes and/or coaching.
HEALTH AND NUTRITION
Indonesia and the Philippines are among the countries which contribute the most to the global burden
of stunting while Timor Leste has one of the highest level of stunting in the world.34 Severe poverty, no
sanitation and dirty drinking water, poor access to basic health services, and a monotonous diet devoid
of nutrients - is a key factor in children not developing to their full potential – or learning with
33Meeting with CARE International Timor-Leste March 29, 2011 34 UNICEF 2009, Tracking progress on child and maternal nutrition.
Poverty and ethnic minorities in Viet Nam
In Viet Nam, poverty, especially among minority groups, means that students and their families can’t depend on a permanent source of income and funds may not always be available to pay the costs of schooling. The World Bank’s Social Analysis Study of Ethnicity and Development in Viet Nam (2009) identifies six specific “pillars” of disadvantage that go a long way towards explaining why minorities remain poorer. These six primary factors include: lower levels of education; less mobility; less access to financial services; less productive lands; lower market access; and stereotyping and other cultural barriers. Community Leveling Mechanisms is the term use by the World Bank’s Social Analysis Study of Ethnicity and Development in Viet Nam (2009) to describe the ways in which social pressure is created in ethnic minority communities against excess economic accumulation. Cultural perceptions of social obligations and “shared poverty”; religious obligations that require economic expenditures; gender expectation grounded in different cultural models; and community ownership of land and assets when maintained as social practices can divert fami earning from children’s education. For ethnic minorities and others in remote areas, periods of low finances in families often caused by the failure of seasonal crops, pest infections and the vagaries of local market forces mean education for children is very hard to achieve. Source: UNICEF, 2011d.
Administrator
Highlight
Administrator
Highlight
Administrator
Highlight

67
maximum capcity in schools. Child malnutrition is one of the proxy indicators for poverty under the
Millennium Development Goal One, and there is a clear pattern showing that children from the poorest
quintiles are much more undernourished than children from the richest quintiles.The rates of stunting
in urban areas of EAP is 35. 35% in comparison with 23% in urban area.36
In the Asia-Pacific region, close to half a billion people are hungry, still live in poverty37 and in turn
suffer from under-nutrition. More specifically, 27 million children (0-59 months old) in the region are
chronically malnourished (stunted)38. Undernutrition has consequences for physical and intellectual
development, the ability to capitalize on educational and other opportunities, and ultimately adult
productivity and earnings. If not addressed during the first 2 years of life (the first “1000 days”), the
impact of stunting and anaemia on child physical and mental development is largely irreversible. From
the first year of life, children who are stunted or underweight for their age perform more poorly than
their normal-sized peers in cognitive and motor tasks and in school achievement (Grantham-McGregor,
Baker-Henningham, 2005)39.
Nutritional status has been found to be a significant determinant of enrolment and performance in
school: ‘children who are better nourished in the first years of life stay in school longer and learn more
per year of schooling’ (Damon and Glewwe, 2007)40. Studies from 79 countries show that every 10%
increase in stunting corresponds to an 8% drop in the proportion of children completing primary
school (Grantham-McGregor et al, 2007)41. Transitory or short-term hunger, common in children not
fed in the morning, has been shown to adversely affect learning by making concentrating and
performing complex tasks more difficult (Bundy et al, 2009)42. Children who are undernourished enroll
later and complete fewer years of schooling, while hunger in school prevents children from making the
most of their learning opportunities. Children who are hungry have been found to have shorter
attention spans, slower memory recall and less able to solve simple visual tasks (World Hunger Series
2006: Hunger and Learning, WFP, 2006).
Paragraph on what worm infestation does to ones learning capacity – and how severe are the levels of parasite/worm infestation in the 4 OOSC countries – or in the region.
35 Based on available data from Government Statistical Offices, Multiple Indicator Cluster Surveys (MICS) and Demographic Health Surveys (DHS) 36 UNICEF Progress for children: Achieving the MDGs with Equity, p. 16 37 FAO State of Food Insecurity in the World 2009 38 UNICEF State of the World’s Children 2012 39 Grantham-McGregor S, Baker-Heningham H. (2005) Review of evidence linking proten and energy to mental development. Public Health Nutrition; 8(7A):1191-201. 40 Damon A and P Glewwe, (2007), Three proposals to improve education in Latin American and the Caribbean: estimates of the costs and benefits of each strategy, Report to the Copenhagen Consensus Center and the Inter-American Development Bank. 41 Grantham-McGregor, et al. (2007). ‘Child development in developing countries 1: Developmental potential in the first 5 years for children in developing countries’, The Lancet, paragraph 369: 60-70, excerpts from p. 63. 42 Bundy, D. et al. (2009a), ‘Rethinking School Feeding: Social Safety Nets, Child Development and the Education Sector, World Food Program and the World Bank.

68
NATURAL DISASTERS
Many countries in the region experience adverse climactic conditions such as flooding and other natural
disasters, displacing households and their lives. Not only do disasters impose physical barriers to
school attendance, they are likely to increase poverty levels especially among those who are already
vulnerable, which can trigger dropout in the long run. “In Indonesia, where high impact earthquakes,
volcanoes and tsunamis take place alongside lower impact but persistent flooding and landslides, both
types of disaster contribute to an increase in the number of people living below the poverty line.
Concentrated high impact events over the last ten years had negative impacts on education, health and
poverty levels in Indonesia (increased infant mortality, reduced share of houses with access to
sanitation) and on education in the Philippines (increased drop-out rates and reduced achievement
rates for secondary school)”43.
The Indian Ocean earthquake and tsunami in 2004, Cyclone Nargis in 2008 and the Sichuan earthquake
in 2007 are just a few of the hundreds of disasters that have hit the region in the past decade. Thailand,
Myanmar and Indonesia have suffered economic setbacks resulting from the Asian tsunami. This kind
of disaster disrupts economic, social and cultural activities, and push significant numbers of families
just above the poverty line, whose children become even more vulnerable to education exclusion –
leading to dropout or significant disruption to schooling,. In Timor Leste, the impact of unseasonal
rains and natural disasters on the economy is significant, with nearly 6 percent drop in non-oil GDP
growth of the country in 2010 attributed to unseasonal rainfalls and floods on agricultural production44.
In Viet Nam, droughts, floods, landslides and salination of soils make education access and life in
general difficult, particularly in rural parts of the country. In An Giang province, the current Situation
Analysis of Children points out that children from “households affected by flooding are
especially…(vulnerable to) loss of schooling opportunities45” “Data from Indonesia shows that most
deaths and missing people recorded as a result of persistent low-impact disasters were in Tenggara
Timur; a province with poverty indicators and secondary school enrolment rates lower than the
national average, and child malnutrition and child mortality well above. .
SUPPLY SIDE BARRIERS
In this section, supply-side barriers to education are discussed. For the purposes of analysis, barriers
will be presented in terms of access and quality, although they are closely related. Barriers related to
language and ECD are highlighted separately, due to their significance in the region.
43 Fran Seballos, Thomas Tanner, Marcela Tarazona and Jose Gallegos (2011), ‘Children and Disasters: Understanding Impact and Enabling Agency’, p. 8. 44 International Monetary Fund, March 2011. IMF Timor-Leste Country Report No. 11/65 http://www.imf.org/external/pubs/cat/longres.aspx?sk=24696.0 45 An Giang Provincial People’s Committee & UNICEF (In Press). Situation Analysis of Children in An Giang Province.
Administrator
Highlight
69
Child Work as a result of low quality education As noted earlier, some demand side barriers may persist due to lack of appropriate supply-side mechanisms, rather than resulting directly from socio-cultural or economic factors inherent within families and communities. Child work, for instance, may appear to be result from poverty and economic pressures of families, but analysis from countries in the region reveal a different story and that the underlying trigger is often concerns related to relevance and quality of education. In Indonesia, there is no linkage between out of school children and child labor, as only 8 percent of working children aged 5-11 and about a quarter of those aged 12-14 are out of school. In the case of the Philippines, child labor exists is a result of, rather than as a cause, of dropout or non-enrolment. In urban areas in the Philippines, for example, interviews with parents and children reveal that decision to drop out comes before decision for children to work. That is, rather than being pulled out of school in order to work, they get involved in the work force because they have dropped out of school due to other reasons, such as high indirect costs of education and lack of relevance. In Timor Leste, analysis of the attendance data from DHS (2010) has shown that children from the highest wealth quintiles are often not in school, which required follow-up analysis and exploration. Such children are often children of merchants who contribute to family wealth through their labor contributions. If urban merchant families perceive that children are not learning a lot in school, parents make the decision to withdraw them for family labour and informal on the job training.
These findings suggest that treating child work as mainly an economic problem and addressing their educational rights through cost reduction and cash-based would have minimal impact in bringing children to school. Instead, broader efforts to improve perceptions of quality and relevance of education for both parents and children should be prioritized. At the same time, providing alternative modes of education for working children would be sensible to promote and facilitate re-entry into education for those that remain in the workforce.
ACCESS
For too many children, access to schools continues to be a challenge. In sparsely populated rural areas,
remoteness of schools is a major concern, as long distances to schools combined with poor or non-
existent roads and limited transportation options effectively keep children out of schools. In Viet Nam,
students in remote areas enrolled in primary education will travel, on average, 7-10 km to the nearest
commune primary school, and this distance has been on the rise (World Bank, 2011, Vol 2). Distance to
school and travel costs become especially critical, given there are few vehicles and no schools nearby.
Geographic barriers such as mountains and rivers, especially during the rainy seasons, impose
additional challenges. In Timor Leste, data from the 2007 Household Survey showed that travel time to
primary school in rural areas is about 30 minutes, on average. At the secondary level, the average
travel time rises to 70 minutes. The poor condition of rural roads also contributes to this barrier. The
average distance to primary schools in Indonesia is comparably less, at 2 km, but it is higher in remote
areas in Kalimantan (5 km), Maluku (7 km) and Papua (20 km). At the junior secondary level, the
average distance to school exceeds 10 km in Maluku and Kalimantan and 35 km in Papua, compared to
3 km in Javanese villages. Not surprisingly, proportion of out of school children in junior secondary
school age is highest in the Papua province, NTT and parts of Kalimantan and Sulawesi.
In urban areas, classroom shortage is a major concern, as existing schools are overcrowded and
double or triple shift classes are inevitable. In the National Capital Region of the Philippines, an
Administrator
Highlight
Administrator
Highlight
Administrator
Highlight

70
alarming 94 percent of students were enrolled in multi-shift classes in the 2009-2010 school year.
There also appears to be some association with late entry into schools, as 52 percent of students in
multi-shift classes are overage for Grade 1 compared to 41 percent in single-shift classes. Although
there is limited empirical evidence indicating student achievement suffering as a result of multi-
shifting, it can be reasonable to expect that rushing through the curriculum without sufficient support
may present stress to the learning situation46.
WATER AND SANITATION IN SCHOOLS
The availability of adequate water and sanitation facilities in schools also affect school enrolment,
and for disadvantaged children who are vulnerable to health risks and poor health, tendency to drop
out of school without WASH facilities increases. For girls entering menstrual age, lack of segregated
toilets is often a critical barrier that keeps them out of school. Although status of water and sanitation
in schools has been improving, conditions in remote and disadvantaged regions remain inadequate. The
joint UNICEF-SEAMEO Study of WASH in Schools provides insight into some of the gaps in both supply
and quality of facilities in countries, as follows47:
Timor Leste: In Timor-Leste, only about 43 percent of primary schools have adequate sanitation
facilities. Only 14.9 percent of all schools have latrines and 30.9 percent of the toilets that do exist in
primary schools are not segregated by sex. 70 percent of all primary schools have water available
and of these only 31.3 percent of the schools have water that is classified as good.48 Lack of
segregated toilets is one of the reasons that parents keep girls away from school and this is a
serious infrastructure need to keep disease and illness levels down.
Philippines: For the 2009-2010 school year, the average toilet to pupil ratio in public elementary
schools was 1:55, and approximately 79 percent of public primary schools have access to water
sources (e.g., local piped, well, rainwater, natural water, combination)
Viet Nam: Only 12% of public primary schools in Viet Nam have adequate sanitation facilities. The
survey conducted by the General Department of Preventive Medicine in 2007 revealed that of the
primary schools surveyed in 20 provinces, 80.1% have latrines but only 7.7% met the required
standards. The majority were not considered sanitary based on sanitation standards for 1)
construction, 2) operation and 3) maintenance. Over sixty percent (62.5%) of the schools have
sanitary-type latrines such as septic tank, pour-flush latrine, double-pit latrine, ventilated pit
latrine, and biogas tank that do not necessarily conform to standards. Most of the schools have
46 Caoli-Rodriguez, R. B. (2007). EFA Global Monitoring Report 2008: The Philippines country case study. Country profile
commissioned by UNESCO for the EFA Global Monitoring Report 2008, Education for ALL by 2015: Will We Make It?
Full report can be requested through [email protected]
47 UNICEF-SEAMEO Study of WASH in Schools. Draft forthcoming. 48 RDTL 2010 EMIS data Ministry of Education
Administrator
Highlight

71
septic tanks (45.9%), while close to twenty percent (19.9%) do not have latrines at all.
Approximately 83.7% of primary schools have access to water sources, but only about 35% of the
schools have hand-washing areas while only 26.5 % with sufficient have water for hand washing.
QUALITY
As previously noted, parents’ decision to keep children in school is closely related to their perceived
value of education and the expected returns from education. Hence, quality of education provided in
schools is crucial to bring and keep children in schools.
Findings from available learning achievement studies from countries point to significant gaps across
the region. The Programme for International Student Assessment (PISA) 2009, which assessed the
reading, science and mathematics performance of 15-year-old students, show that Thailand and
Indonesia were near or below 50 percent level of the average OECD scores in the three subjects (OECD
PISA Database). Similar results were produced for these countries in the 2007 Trends in International
Mathematics and Science Study, (TIMMS), which assesses the achievement of fourth and eighth grade
students in mathematics and sciences. A number of countries using models of the Early Grade Reading
Assessments (EGRA) approach to conduct sample-based assessments also point to critically low
reading levels; In Timor Leste, a 2009 study found that 70 per cent of students at the end of grade 1 and
40 per cent of students at the end of grade 2 could not read a single word; Two thirds of students in
grade 3 could not read with fluency49. In Viet Nam, the World Bank’s 2011 review of 2001 and 2007
learning achievement data in Mathematics and Language showed that even though there had been
growth in learning achievement over time improvement was still needed. Language results
demonstrated that 40% of students were still not learning at an independent level and 30% cannot
infer meaning from text. In Mathematics there were better results but 2007 students at the two lowest
skill levels were only slightly higher than those of 2001 indicating more work is needed. Differences
were even greater for remote vs. rural vs. urban students, and greater still for ethnic minorities50.
Limited supply and relevance of learning materials is another sign of low quality in education. In the
Philippines, in Mindanao where there are many Muslim learners, the acute shortage of school facilities
influences parents’ decisions to send their children to school and keep them there. Findings from
qualitative interviews with stakeholders suggest that shortages of classrooms, textbooks, and teachers
result in poorly motivated parents and pupils. It is the poorest families that need the most subsidies
from schools in the form of educational supplies and other inputs in order to increase the likelihood of
completion, and yet it is this region, Autonomous Region in Muslim Mindanao (ARMM) in particular,
that experiences the sharpest shortages in inputs. Even when provided, quality of textbooks can be
49 Basic grade 1 reading test in Tetum and Portuguese languages; administered to approximately 900 students in grades 1–3 in 40 schools 50 World Bank (2011) Viet Nam: High Quality Education for All Report No. 56085-VN Volume 2: Human Development Department East Asia and Pacific Region p. 42-63

72
inadequate, as errors, misalignment with curriculum and short instructional time are commonly found
(Lee, 2011).
At the national level, the aggregate teacher supply has steadily improved and is largely adequate in
most countries in the region. However, aggregate levels mask severe shortages of teachers in certain
regions within countries, mostly in remote, disadvantaged regions. In the Philippines, less than 40
percent of students are in schools of PTR of 45 and above at the national level, but the corresponding
figures for ARMM and CALABARZON increases to about 68 percent and 53 percent, respectively. In
ARMM, approximately 38 percent of students are in schools with PTR of 65 and above (UNICEF, 2011c).
There are various factors issues related to teacher supply in remote, disadvantaged areas, including
ineffective teacher allocation policies, low teacher remuneration and working conditions, and
insufficient candidate pool in local areas. In Indonesia, acute shortage of teachers in remote areas is
attributed to lack of adequate housing, poor transport and reluctance of appointed civil servants to
relocate. Even when teachers are posted, teacher absenteeism emerges as a significant concern in those
areas (UNICEF, 2011a). In Viet Nam, limited affirmative action for training of ethnic minority teachers
who are more likely to support adequate instruction to ethnic minority students contributes persistent
shortage of qualified teachers (UNICEF 2011d). As discussed later, such shortage of teachers who can
communicate with students, especially in the early years of schooling, effectively compromises access
to quality of learning among disadvantaged ethnic minority students in many countries across the East
Asia and Pacific.
The quality of teachers is undoubtedly the most important dimension of school quality. However,
available information in the region show that a large proportion of teachers, particularly in rural areas
face challenges meeting qualification levels required to teach. Despite increasing emphasis by training
programmes on promoting ‘learner-centred’ instructional practices to promote critical thinking and
problem-solving skills, some teachers are unable to translate those principles into practice in their
classroom (Lee, 2011). Teachers’ pedagogical skills and subject-matter knowledge are also limited in
many countries, as pre-service and in-service professional training remains weak. In Indonesia, for
instance, teacher aptitude tests administered to primary and secondary school teachers in 2008 found
that the proportion of correct answers made by primary school teachers was, on average, only 38 per
cent. For secondary school teachers, the average for the 12 subjects tested was 45 per cent, with scores
in math and language at 36 and 51 per cent, respectively51.
51 PMPTK (Directorate General for Improvement of Teachers and Education Professionals). Presentation on costs associated with the Teacher Law of 2005. Yogyakarta, Indonesia: August, 2008.
Administrator
Highlight

73
LANGUAGE
Across the East Asia Pacific, there is tremendous diversity of languages within countries, but textbooks
are provided only in selected dominant languages. Not surprisingly, textbooks written in a language
that is not understood by teachers and students significantly limit the quality of teaching and learning
process.
As will be discussed further in Chapter 4, notable progress has been made in a few countries to promote
mother tongue based bilingual education policies and programmes, most notably in the Philippines and
Viet Nam. However, great efforts are needed to ensure effective set of policies and strategies to support
mother tongue based bilingual education, including teacher development, material development and
distribution, is institutionalized.
For ethnic minorities, the challenges of supply of qualified teachers and relevant textbooks raised
earlier become more acute. For instance, textbooks that are not written in their mother tongue would
not be of great use. Yet, there are few textbooks provided with the language diversity in mind. In Timor
Leste, although the national language policy cites Portuguese and Tetum as the two official languages,
the first set of national textbooks to be developed is in Portuguese. Some of these textbooks, developed
in Portugal with Timor-Leste in mind, lie beyond the scope of experience for most children. Certainly,
these textbooks are beyond comprehension of children as less than 10 percent of families in Timor
Leste speak Portuguese at home. Fortunately, the first set of Tetum language textbooks for Grades 1-3,
the language spoken by 60 percent of the population, will be piloted in schools in 2012.
Just under 4 percent of all children in Cambodia spoke Khmer as their second language, with the largest
proportions living in Mondul Kiri and Ratanak Kiri. Indeed, a striking 61.6 percent of all children were
non-Khmer mother tongue speakers in Mondul Kiri and 70.1 percent in Ratanak Kiri. This is due to the
fact that the majority of children in these provinces belong to the following ethnic, indigenous or
language groups: Jorai, Rhade, Kachah, Tampuan, Brao, Kreung, Kraveth, Lun, Phnong, Stieng, Kraol1 as
well as Vietnamese and Chinese.52 Out of these non-Khmer mother tongue speaking children aged 6-17
years old, 41.1% have never attended schools and of those enrolled, 8.5% of them drop out in primary.
This implies that language and culture are barriers to access as well as to learning.
LACK OF EARLY CHILDHOOD DEVELOPMENT SERVICES
A growing body of research shows that investments in early childhood care and education is closely
associated with better success in later stages of education, as well as broader socioeconomic benefits,
including improved female labor participation rates, increased fertility rates and poverty reduction53.
Data from select countries in the region also confirm research findings that children who have had
ECCE experience are more likely to complete primary education, suggesting investments in children’s 52 Analysis of Children’s access to Education in Cambodia based on the 2008 population census. Key Findings (2011), National
Institute of Statistics, Ministry of Planning.
53 OECD Staring Strong III: A quality toolbox for early childhood education and care, OECD. 2012.
Administrator
Highlight
Administrator
Highlight
Administrator
Highlight
Administrator
Sticky Note
!!!!!!!

74
early years lead to better outcomes in the long run. Thus, ensuring opportunities to access quality ECCE
reduces the potential costs of early drop-out and repetition resulting from weak foundations.
However, access to early childhood development services remains largely insufficient.
The provision of early childhood service, typically 3-5 years old does not only relate to education issue,
but also to health and nutrition. National Policies on early childhood in EAP usually involve multiple
Ministries, including the Ministry of Education, of Public Health, of Social Development and others.
Inter-sectoral communication and coordination in developing a multi-sectoral and integrated ECD
policy is essential for implementation – and the Philippines is an excellent example of effective Naitonal
Coordinaoitn for
The lack of effective, well coordinated and pro-poor public-private partnership and private sector
investment on early childhood can make the equity gaps widen. In Indonesia, for example, the national
government provides only 0.6% of the total access to pre-primary education while the rest is provided
by private sector and communities organizations. “Because private centres offer ECCE regularly, the
principal strategy appears to be the delivery of services to these areas through integration with health
services (posyandu) and religious contexts (mosques, churches and viharas). The overall strategy is the
guidance of early childhood-related initiatives through advocacy and community involvement rather
than through direct policy formulation”.54
In Timor Leste, for example, the population of children is increasing along with the need to provide for
pre-school education across the whole country, but pre-school classrooms are short in supply. In the
Philippines, the recently implemented Universal Kindergarten program is expected to address the gap
and improve children’s school readiness, but ensuring quality services that are developmentally and
age-appropriate and delivered with appropriate teaching-learning approaches will be key to the
success of the program.
POLITICAL, GOVERNANCE, CAPACITY AND FINANCING
DECENTRALIZATION AND GOVERNANCE
Governance of education system has significant impact on the overall quality of education. In the East
Asia and Pacific, decentralization of the sector and school based management have been underway in
some countries with the aim to improve transparency and accountability of services. High evels of
decentralization has been most notable Indonesia and the Philippines, where the effects on student
outcomes have been varied. In Indonesia, for instance, the Indonesia Local Education Governance Index
(ILEGI)55 developed by BEC-TF revealed wide variations in service delivery by local governments
54 Asia-Pacific End of Decade Notes on Education for All: Early Childhood Care and Education, UNESCO and UNICEF (2012), p. 9 55 BEC-TF (2011a) developed the Indonesia Local Education Governance Index (ILEGI) to help monitor local government performance in education governance and service provision. The index captures several dimensions of governance, including: management control systems; management information systems; education service provision standards; transparency and accountability and; efficient resource use.
Administrator
Highlight

75
across the 50 districts surveyed56. The report argued that there has been little innovation in local
delivery of basic education services in ten years of reform, suggesting that the authorities, who are
furthest from their targets are also those in most need of central support to improve their management.
School-based management (SBM), in particular, has been central to the decentralization agenda in
both Indonesia and the Philippines, as it is the delegation of authority to the local level that can trigger
school and community mobilization to implement plans that can improve education outcomes,
including enrolment and attendance. Unfortunately, in the case of the Philippines, SBM has not been
fully rolled out across the country and even when grants are made available to the heads of schools,
related processes (including planning, disbursement and reporting of funds) need to be improved in
order to empower school heads57.
In Viet Nam decision-making is comparatively more centralized and a number of NGOs working in Viet
Nam decry the weakness of lower levels of management within the Viet Namese Education system,
while applauding the increased professionalism at the central government. Decentralized management
systems also depend on a combination of devolved authority and improved capacities, especially the
increased understanding and use of local data systems for planning and decision-making and
monitoring.
EDUCATION FINANCING
Levels of public expenditures for education ranges widely across countries in the East Asia Pacific
region, from about 2 percent of GDP in Cambodia to more than 11 percent in Timor Leste (See Figure
1). Since 2000, change in national spending has varied across countries, with modest but essential
increases in Cambodia and Indonesia while the Philippines andThailand registered declines. By
contrast, expenditures in advanced economies such as Japan and Australia remained relatively stable.
Timor Leste is a clear exception to the trend, with about 14 percent of GDP allocated for education, of
which a significant portion is capital expenditure. Overall, decreasing spending trend in transitional
economies such as Thailand and Philippines is worrying, and spending levels in Cambodia and Lao PDR
remain well below 4 percent, which may be insufficient considering the remaining challenges to
education for all in those countries.
56 BEC-TF (2011a) Governance matters to education outcomes – The Indonesia Local Education Governance Index (ILEGI): a score card of 50 local governments, Volumes 1 and 2, Basic Education Capacity Trust Fund
57 Albert, J. R. (2011). “Improvement of the Implementation Procedures and Management Systems for the Teacher Deployment and New Classroom Construction Programs of the Department of Education.” Study Prepared for Department of Budget and Management.

76
Figure 14 and 15: Change in financial commitments to education, EAP countries (2000-2010)
Source: UNESCO-UIS Database
More importantly than the absolute expenditure levels, however, equity of public expenditures in
education is a concern in many countries. While expenditure data by location is not available in all
countries, levels of inequities in public spending can manifest in disparities in educational access by
location, income, gender and ethnicity58. In the Philippines, for instance, secondary net enrolment rates
ranges widely by region, and public school enrolment is skewed in favor of richer households as
education level rises, with only 35 percent of secondary school students coming from the three poorest
quintiles59. In Viet Nam, rural-remote-urban differences in learning achievement are high, and
achievement levels of ethnic minorities are considerably low compared to those of the Kinh majority.
Efficiency in education is measured by how much the levels of input yield the desired outputs and
outcomes within the education sector; here, input is defined as the level of expenditures and outcomes
as enrolment rates and learning achievement levels.
External efficiency relates inputs to the levels of education outcomes measured by private and
social rates of return, such as increased earnings, greater social equality, reduced poverty, etc.
Internal efficiency, on the other hand, relates inputs to levels of education outputs, such as
completion rates and learning achievement.
Efficiency of spending can also be relatively high suggesting general sector inefficiencies in education.
In some countries, budget allocations by different education levels also suggest possible inefficiencies.
Levels of public spending in ECE level, for instance, is generally very low, with 8.8 percent of total public
education expenditures spent by Viet Nam being one of the highest levels in the region. This may
explain the considerably low access to pre-primary education in the region. Given that long-term
58 For more discussion on education expenditures in EAP, See Education Expenditures: Equity and Efficiency in EAP, UNICEF EARPO, Working Draft forthcoming. 59 Philippines: Public Expenditure Review: Strengthening Public Finance for More Inclusive Growth. 2011. World Bank, Manila, Philippines.
-
2.0
4.0
6.0
8.0
10.0
12.0
14.0
16.0
18.0
Figure 14: Total Public Expenditure on Education, as % of GDP
2000 2008 2010
-
5.0
10.0
15.0
20.0
25.0
30.0
Figure 15: Total public expenditure on education, as % of total government
expenditure
2000 2008 2010

77
benefits of investments in pre-primary education has been shown to be significant, such low levels of
spending in ECD may contribute to inefficiencies60.
Levels of investment in pre-primary education have critical implications for overall efficiency of budget
allocations in education, as long-term benefits of quality pre-primary investment have been shown to
be significant. Moreover, data from selected countries in the region shows that children who have had
early childhood care and education experience (ECCE) are more likely to complete primary education,
suggesting investments in children’s early years lead to better outcomes in the long run. Thus, ensuring
opportunities to quality ECCE reduces the potential costs of early drop-out and repetition resulting
from weak foundations. An increasing number of countries are beginning to prioritize ECCE funding, as
in the case of Lao PDR and Mongolia where ECCE was included in EFA-FTI, would lead East Asia and the
Pacific countries in the promising avenue to develop children’s readiness before they start their
primary education.
While public investments place heavy emphasis on primary education, the role and impact of private
or non-state providers is rapidly growing particularly in pre-primary and post-primary levels, in both
low and middle-income countries with potential significance in equity and efficiency of educational
opportunities. Broadly, non-state providers include two types: those that are financially aided by the
governments with grants-in-aid or subsidies and those that rely almost exclusively on student fees,
whether profit-oriented or not. Existence and effects of private spending and non-state engagement in
education, relatively high in countries like Indonesia, Philippines and Viet Nam- also suggest the need to
investigate the relevant implications they have on increasing disparities and on efficiency of education
expenditures.61
In some countries, governments actively seek private sector engagement with non-state sectors as a
means to addressing a range of policy objectives, including better service coverage, improved efficiency
and resource mobilization to supplement insufficient national budgets. As such, in the case of Thailand,
Philippines and Indonesia, partial financing of private schools by governments is a common feature,
particularly in secondary education, which helps free up public resources to invest due attention to
other priorities including primary education.
Investing in education is widely considered central to efforts to promote future success of individuals,
societies and nations at large. However, social inequalities and inequities remain a major driver in
creating disparities in the access to, and the quality of education. Factors such as gender, income,
location, language, ethnicity and disability produce a multiplicity of barriers to school entry and
survival rates. Furthermore, realizing equity and efficiency in education financing measures continues
to be a challenge.
60 OECD Staring Strong III: A quality toolbox for early childhood education and care, OECD. 2012. 61 Secondary education financing survey. 2010. Draft. UNESCO Bangkok.

78
CHAPTER 4: POLICIES AND STRATEGIES
In this chapter, specific policies and strategies, as identified in the National Report, have been employed
in response to the barriers and bottlenecks as identified in the previous chapter. For this Regional
Synthesis report, focus will be on identifying the common responses, specific good practices and
unique, noteworthy elements from the countries participating in the OOSC initiative and, where
possible, their impact and lessons learned. A summary of the key policies and strategies, aligned to the
four categories from the Conceptual and Methodological Framework, is provided in the table below.
Demand Side Barriers Supply Side Barriers Policy, Governance,
Capacity and
Financing
Social Cultural Economic
Community
Participation
Promoting awareness
on importance of ECD
Promoting gender
equality in education
Inclusive education for
children with
disabilities
Birth certificates and
accessible registration
Lower costs of
education
Increase household
income to afford
education
Improved health and
nutrition
Education for disaster
management
Expanding access to
school facilities
Improved quality
Language of education
Expansion of ECD
services
School based
management
Education financing
and fund flows
SOCIAL CULTURAL, DEMAND-SIDE POLICIES AND STRATEGIES
Based on the social cultural, demand-side barriers discussed in the previous chapter, policies and
strategies that aim to address those barriers are clustered as follows: promoting community
participation; ECD and school readiness; promoting gender equality; education for the disabled;
migration and birth registration.
COMMUNITY PARTICIPATION
As discussed, low parental perception of the value of education is partly a supply issue - relevance of
education - but the main reason lies in limited capacity among parents, especially those with limited
education, to engage in school processes to both understand and complement the benefits of education.
This implies the need to transform parental attitude, or at least to increase their capacity to engage in
Administrator
Highlight
Administrator
Highlight
Administrator
Highlight

79
education and the amount of time they interact with teachers, schools and their children’s learning
process.
The most widely adopted strategy in East Asia and Pacific to promote community participation has
been the adoption of the Child Friendly Schools (CFS) approach, especially efforts around the CFS
Dimension of Community, Parent and Child Participation. CFS schools are not only designed to be child-
seeking schools, where children who are not in school are actively sought out and brought into
education, they also actively promote local community participation in school planning, monitoring,
and other activities. In Indonesia, community participation is also emphasized as part of the school
based management process under the decentralization of administration of education and village
administrators cooperate with school management to visit houses to ensure that children are enrolled
and seek for reasons from those who do not enrol. In Timor-Leste, the National Human Development
Report 2011 also outlines the processes of decentralisation that are underway to increase local decision
making, which along with training in management for local officials, could lead the way for more
relevant service provision (UNICEF 2011c).
Under the Child Friendly School Framework, community, parent and student participation is a core
dimension and important element in the success that CFS initiatives have had in improving quality and
retention at school level. Two key strategies of this CFS dimension are School Self assessments (SSAs)
and School Improvement Plans (SIPs) which are closely related in terms of processes, The SSA involves
forming three groups of assessors (students, parents and school staff), who are organized to carry out
assessments of what they feel are the best and worst features of their school, often using simple formats
and tools to guide their discussions and reviews. Once completed, the three groups then share their
findings with each other in a school wide meeting, during which those features most in need of
improvement are identified and prioritized for follow up action. The SIP, which follows directly on from
the SSA, results in the development of a 1-3 year plan for improving specific aspects of the school often
linked with school grants systems, and providing an opportunity for all school level stakeholders a
chance to contribute to improving their school.
PROMOTING AWARENESS ON THE IMPORTANCE OF ECD AND SCHOOL READINESS
Key reasons for delayed entry to school, as discussed previously, were parental perception regarding
school readiness of children, which in turn is related to lack of awareness on the value of early
childhood care and development. In addition to providing access to ECD services (discussed under
4.3.4), improving parents’ recognition on the importance is crucial to expanding ECE access and school
readiness of young children. “The early years are identified as the period of development from the
prenatal period through birth to eight years of age when children grow and develop more rapidly than
in any other period in their lives. This is a period of rapid brain development and has been identified as
Administrator
Highlight
Administrator
Highlight

80
a “sensitive” or critical period when children are both receptive and vulnerable to environmental
stimulation and influences”.62
Numerous advocacy campaigns and interventions to raise awareness on value of ECD have been
implemented, in partnership with NGOs and development partners. In Indonesia, the compulsory age
for pre-primary school is children aged between 4-6 years old. However, only 38.4 percent of children
aged 5 attends pre-primary school and 10.7% attends primary schools, leaving 50.9% of children aged
5 out-of-school. For children aged 6, 9.6% attend the pre-primary level and 71.9% attend primary
schools underage, which leaves 18.4% defined as out-of-school. Although we see that there are 81.6%
of children by age 6 attend either pre-primary or primary education, there are only 48% of children
who have ECCE experience before they start their primary education. Therefore, village officials in
Indonesia play an important role to raise community awareness of the benefit of education, especially
at the early years.
In Indigenous communities, understanding and tackling prevailing myths and traditions can be a part of
the effort, as seen in the Philippines (UNICEF 2011b)
Among some indigenous populations there are beliefs that militate against child enrolment in
school. For example among the Matigsalug of the Ata Manobo tribe in the uplands of Bukidnon (in
Mindanao), there was a prevailing belief that if children went out to go to school, the children
would be eaten up by the kapre. The latter is believed to be a creature of the underworld that has
mythical powers to physically dominate human beings and is cause of great fear. Thus, in fear of
being devoured by the kapre even the parents of such tribes do not want to send their children to
school. This obstacle was overcome through advocacy to the parents by a local NGO that was given
support by a Manila-based NGO to undertake a program for preschool children.63
PROMOTING GENDER EQUALITY IN EDUCATION
Gender bias and discrimination, in the form of traditional gender roles, early marriage, gender based
violence and disadvantages of boys, hamper educational access for some children in the region. Various
programs to tackle gender-based barriers have been implemented in many countries, ranging from
scholarship programs for girls, to trainings on gender-responsive teaching. Success levels of programs
have varied, however, and as discussed in the OOSC Country Report of Timor Leste, it is important to
recognize that changing behaviours with regard to gender depend on more than a series of training
courses. A 2010 review of four NGO gender related projects in Timor Leste cautions against simplistic
analysis of changes in social behaviour, noting that:
62 The Early Years Ensuring a Child’s Right from the start, ARNEC, p. 3, Accessed on 18 September 2012: http://www.arnec.net/ntuc/slot/u2323/publication/Booklet%202%20-%20The%20Early%20Years.pdf 63 Personal conversation with Tribal Mission, an NGO working on an education project at the National Summit of Children’s Hour, UNILAB Bayanihan Center, 23 June 2011. This author is a member of the board of Children’s Hour.

81
There are immense structural limitations that mean that the impacts of NGO gender
programming tend to remain narrow and fragile;
The character of the gender projects provide both advantages and disadvantages in facilitating a
process of change to gender relations; and
Change is occurring at the intersection of customary, traditional and modern social systems.
The writers say that ‘ customary’ here refers to a worldview framed by local custom where local
authority is determined genealogically and the ancestral domain links the natural and the lived
world; ‘traditional’ (Trembath et al, 2010).
In some countries in East Asia, particularly, Malaysia, Mongolia, the Philippines and Thailand, net
enrolment ratios are lower for boys than for girls. More boys drop out than girls and there are gender
disparities in school participation as boys (57.7%) outnumber girls (42.3%) among OOSC aged 6 to 11
years. In the Philippines, it has been noted that home visitations by school personnel when boys
started disappearing from schools was a practical and effective enterprise. The suggestion was also
made in that boys who are covered by the Programang Pantawid Pamilyang Pilipino (4Ps) social
welfare program are given additional cash incentives to encourage their participation in school and to
put off their involvement in economic activities. In addition, improving teaching-learning processes to
ensure stimulating academic environment for boys will be instrumental to keeping them engaged and
in school.
More active responses against perpetrators of gender-based violence can also be seen in countries, with
passing of legislations related laws and policies on gender-based violence and domestic violence.
Again, however, as noted in the 2011 National Human Development Report of Timor Leste,
transforming societal attitude on gender-based issues takes time, as it is “difficult to bring perpetrators
to justice and families prefer the settle issues of domestic violence privately and without recourse to
law.” In Timor, Agencies like PRADET Timor-Leste (Psychosocial Recovery and Development East
Timor, or Recuperação no Desenvolvimentoba Trauma no Psisosocialiha Timor-Leste) works to deliver
services to community members experiencing mental illness and trauma, often arising from violence,
and the Fatin Hakmatek program has been developed to respond to forms of violence perpetrated by
men against women and children, including domestic violence, sexual assault and child abuse (usually
sexual in nature) (UNICEF 2011c).
DISABILITY
As discussed in the previous chapter that very few children with disabilities make it through school in
countries across East Asia and the Pacific due to both demand and supply-side barriers. Commonly, if
they do get to school they drop out early because of stigma, inadequate and inappropriate resources or
lack of transportation.
Administrator
Highlight

82
Ministries of Education in East Asia and the Pacific provide special centers and schools for disabled
children (some mainstreamed within regular classes) based on the “least restrictive environment” in
order to ensure that both barriers to supply and demand side are eradicated. In Indonesia, the
government has introduced a large number of special schools, but it cannot afford to offer this option at
a large scale in rural areas. Children with disabilities and their families often feel embarrassed to attend
the local school or find it unaffordable and impractical to have to go to a special school very far from
home.
In Viet Nam, the Ministry of Labour, Invalids and Social Affairs (2008) estimates the total number of
children with disabilities in the 0-18 years age group to be 662,000 (2.4 per cent of that age group). The
most common form of disability in children is mobility impairment, which affects one-third of children
with disabilities.64 However 75% of children with disabilities in Viet Nam are still out of school. Based
on recent surveys and clearer understanding of the situation, the Government of Viet Nam is now better
placed to prepare specific policies and practical responses, including teacher training and inclusive
school services, to ensure children with disabilities enroll in school and complete the basic education
cycle. The strong support from the legal framework such as Law and Decree on Persons with
Disabilities (in 2010 and 2012 respectively) and National Plan of Actions on People with Disabilities
2011-2020 is another supporting element that helps Viet Nam expands the availability of proper
learning opportunities for disabled children.
Cambodia is the first model Global Partnerships in Education (GPE) countries, which focus on the
identification of Out-of-School Children including disability screening in order to create targeted
interventions to increase enrollment and reduce/prevent drop out. This is the first attempt to conduct
a systematic research to calculate out of school and disability prevalence rates a sample size of 20,000
children across the country. The initial findings from this study highlights a comparative data taken
from the US census and Cambodian census that shows underreported disability numbers which often
make the governments overlook the magnitude of the problem. Based on the US Census, 54 million or
19% of total population whereas the Cambodia census shows that only 160,000 people or 1.3% of
population are people living with disability. The provision of equal access to educational services is
needed on the non-discrimination basis. In Cambodia, “more than half the [disabled] children had
access to educational services, of which almost half went to public schools. Most of these children had
mild levels of Down syndrome. The remaining families did not send their child to school for various
64 Quoted in UNICEF (2010) An analysis of the situation of children in Viet Nam Hanoi: UNICEF p24

83
reasons, including distance of the school from home, financial constraints, and the belief that the child is
unlikely to benefit from an education.”65
Clearly, there is a need to establish and strengthen systematic means to provide for the educational
needs of disabled children. Three strategies that have been recognized globally to improve disability
and inclusion policies are (1) teacher training in special needs education, (2) creation of accurate
databases and conducting surveys about the actual needs of special needs education and use the data
for programme and policy decision, and (3) community sensitization, including support to parents of
children with special needs.66
BIRTH CERTIFICATE
“Birth registration, the official recording of the birth of a child by the government, is a fundamental
human right and an essential means of protecting a child's right to an identity”.67 Efforts to improve
birth registration have been made across the region, as part of education as well as a child protection,
health, water and sanitation agenda, in order to track life events from birth to death. Children without
the proper registration are refused to access of their basic rights including education, health and other
social welfare.
Many countries in the East Asia and the Pacific impose tariff and regulation such as late fine and
judicious procedure, which are the main barriers to discourage parents from registering their children
on a timely manner. Those whose household are poor, live in the rural area and have limited access to
health care are most vulnerable to be able to access to education. 70% of Children from the richest
quintile in Cambodia have birth registration compared to those from the poor quintile (59%)68, and the
same patter applies to Indonesia with a more varying degree that 84% of Children from the richest
quintile compared to 23% for the poor.69 However, Thailand is one of the examples that try to change
the regulation not to refrain children with no birth registration to the access to their education. UNICEF
recommended that “In countries where fees have been removed, the perceived barriers of expense can
be mitigated by public awareness campaigns and innovative programmes such as mobile or house-to-
house registration campaigns at the national level. In countries where fees for birth registration and
late penalties still apply, interventions should be targeted at policy and legal reform”.70
65 René Ayala Moreira (2011). Intellectual Disability in Rural Cambodia: Cultural Perceptions & Families’ Challenges study in Boribor district and Kompong Chhnang Province. P. 33. 66 FTI (2008) The Road to 2015: Reaching the Education Goals FTI Washington http://www.globalpartnership.org/media/library/Annual_Report_2008_EFA_FTI.pdf 67 The ‘Right’ start to life: A Statistical Analysis of birth registration, 2005 (UNICEF) p. 1 68 Demographic Health Survey, 2005, Cambodia 69 Demographic Health Survey, 2007, Indonesia 70 Ibid. P. 24
Administrator
Highlight

84
In the case of the Philippines, the OOSC Country Report suggests that the Department of Education
(DepEd) work with the NSO and LGUs towards offering a discounted rate for birth certificates, so as to
enable the issuance of certificates at the school premises during enrolment to make it affordable and
convenient for parents.
ECONOMIC DEMAND SIDE POLICIES AND STRATEGIES
Various economic barriers are manifested to keep children out of school, including fees, health and
nutrition status, and natural disasters, with poverty as the main underlying factor. Responses to direct
and indirect fees as a barrier are usually one of two main types: those that seek to directly lower the
cost of education for households and those that aim to increase household income to cut the poverty
cycle. These are discussed below, followed by responses related to health and nutrition and natural
disasters.
LOWERING THE COST OF EDUCATION
“Experience in many countries shows that the household costs of schooling are a major barrier that
prevent children from accessing and completing quality basic education”71. Moreover, children from
poor families have a higher tendency to be affected by economic and social pressures, including
extended absentees which can lead to drop out. Therefore, lowering direct and indirect costs to
education (and providing incentives or scholarships) will significantly encourage children from poorer
families to access and complete their education. In Indonesia several strategies have been used to keep
children in school through times of financial crisis. To address the needs of poor families, JPS
Scholarships were provided to 4 percent of children attending primary school (i.e. two thirds of the
originally targeted 6 percent), 8.4 percent of children attending junior secondary school and 3.7 percent
of children attending senior secondary school. These scholarships were designed in recognition that
poor families may need state funds in order to attend schools (even if these schools are free) and that
schools servicing poor communities also tend to be under-resources. The JPS Scholarships were
discontinued but replaced by Special Assistance for Students (Bantuan Khusus Murid, BKM), which
reached its peak in 2004 when 20 percent of primary and 26 percent of junior secondary education
students received a scholarship. The scheme was renamed Scholarships for Poor Students (Beasiswa
untuk Siswa Miskin, BSM) in 2008. To address the needs of under-resourced schools, Special Assistance
for Schools (Bantuan Khusus Sekolah, BKS), a school-supporting block grant, was established with
71 Six steps to abolishing primary school fees – operational guide, The International Bank for Reconstruction and Development/ The World Bank (2009), Page 3
Administrator
Highlight
Administrator
Highlight
85
specific funding formulas to benefit poor schools. The BSM programme was reformed and expanded in
2005, and renamed as School Operational Assistance (Bantuan Operational Skolah, BOS).72
In Timor Leste, each year, the Alola Foundation73, provides scholarships for 1,000 students in 113 rural
schools in all 13 of the country’s districts. Scholarships cover school fees, books, uniforms and other
basic school items. School principals help identify potential scholarship recipients. When well-targeted,
these scholarships are very effective at ensuring disadvantaged children stay in school. However,
difficulties in receiving scholarships in a timely manner – such as at the beginning of the school year (to
buy uniforms and stationary), and in being responsive to short term financial shocks to families (such
as illness or deaths in the family), require monitoring and delivery systems that can be quite expensive.
INCREASING HOUSEHOLD INCOME
Social protection systems are now seen as an investment and an entitlement for both poor and non-
poor in a country. ‘Social protection is seen not simply as an ad hoc and temporary remedy, but as a
policy instrument with a clear rationale grounded in economic considerations and political, rights-
based notions.’74 There is also a focus on the notion of vulnerability as it relates both to poverty relief
and poverty prevention. At present, across most of Asia and the Pacific the coverage of social protection
is low, and typically confined to urban workers in government and the formal sector.
Viet Nam has a number of social protection programs including social insurance and social welfare
schemes, the latter including targeted benefit programs and special schemes for war veterans and
invalids among others. However the really poor in the Vietnamese community are often excluded from
assistance and there are low quality social services in poor areas. Migrants in urban areas also have
only limited access to such services. More recently a number of agencies and researchers have put
forward the notion of a family-based package of assistance, integrating and expanding existing
programs, to serve as a foundation on which additional benefits can be built. Depending on household
characteristics such as numbers of household members working or numbers and ages of children,
interventions are designed for the bottom 15% of households in terms of wealth and assume
nationwide implementation. UNICEF also makes the point that trained social workers and other care
workers are needed at local levels to ensure that needy families get access to welfare provision and use
these resources to benefit their children. For ethnic minorities, there are a number of poverty reduction
programs that specifically aim to promote education by providing incentives and subsidies, as well as
supplying financial support for transport and boarding support, either financial or the building of
boarding accommodation near schools. 75
72 UNICEF/UIS (2011) Out of School Children in Indonesia Jakarta : UNICEF Indonesia p 79 73See Alola Foundation http://www.alolafoundation.org/index.php 74 Babajanian, B. V. (2010) Social protection in Asia: the latest thinking and policy contours in Asian Development Bank (2010) Enhancing social protection in Asia and the Pacific: The proceedings of the regional workshop Mandaluyong City: Philippines: Asian Development Bank. P 535 75 Jones R., Tran Thi Hanh, Nguyen Anh Phong and Truong Thi Thu Trang (2009) A Mapping Exercise – Poverty Reduction Programmes and Policies in Viet Nam Hanoi: UNDP (pp 19-25)

86
Other social welfare subsidies to families require regular attendance in school as a requisite for
continued funding, with mechanisms in place to monitor attendance through links to reporting by
headmasters or school management committees. For example in Indonesia, the government has used a
set of traditional and innovative social protection programs that can have both direct and indirect
influence on education outcomes. The conditional cash transfer program, PKH, uses a Latin American
approach, byproviding resources to the mother or other female members of the household to reward
behaviors that improve health and education outcomes (enrolment and attendance). It has been
implemented on a pilot basis for 700,000 recipients and is currently being rolled out to 1,800,000
recipients. An impact evaluation on the first two years of the program suggests limited effects on
education outcomes, although these might have been underestimated because of initial implementation
problems.76Another Indonesian innovative community conditional cash transfer program, is known as
PNPM-Generasi. Communities receive a grant conditional on them presenting an investment plan that
shows how they will improve performance in terms of 12 health and education outcome indicators.
Although this has been implemented on a relative small scale (2,200 villages), the results from its
evaluation are already promising, especially for remote communities who use the funds to open lower
secondary schools frothier children.
In Timor Leste, Bolsa de Mae is a cash transfer programme for orphans and single parent households,
or households with two parents, one of whom is unable to work. The program is designed to support
families with monthly subsidy to needed to feed and educate their children, on the condition that the
identified child attends and successfully completes each level of schooling. It provides the following:
$5 for 8 months each year in primary school
$10 for 8 months each year in secondary school
$20 for 8 months each year in university
$30 for 8 months each year in university abroad
Since the inception of the Bolsa de Mae program in 2008, the number of beneficiaries receiving Bolsa de
Mae payments increased from 7,200 to 9,730 or USD663,750 to USD876,153 in 2009. 77 Data or
information on the impact of the program, however, is yet to be documented and needs to be studied to
understand its gaps and improvement needs. While there seems to be wide support among
communities to widen the scale of the program, there is also general consensus that proof of the
effectiveness of the program in yielding positive outputs may be stymied by lack of data and monitoring
systems and weak administrative capacities. According to one expert, lack of a good central data base
system to monitor impacts of other social protection schemes also present challenges to assessing the
cumulative impact the programs has had in alleviating poverty, but any effective monitoring of the
76 UNICEF/UIS (2011) Out of School Children in Indonesia Jakarta : UNICEF Indonesia 77South-South Cooperation: Lessons from Brazil on Conditional Cash Transfers. UNDP Timor Leste (2009). Available at: http://www.tl.undp.org/nloct09/newsmonthly%20octubre%202009/Lessons%20from%20Brasil%20on%20Conditional%20Cash%20Tranfer.htm
87
programmes will require serious resourcing. It has been noted that inter- and intra-ministerial
coordination remains a challenge that needs to be addressed for improved synergy among different
social welfare programs.78
The Philippines, with initial support from the WB and now from ADB, launched a major CCT program,
Bridge for the Filipino Family Program (Pantawid Pamilyang Pilipino Program or 4Ps), in 2008. This
program provides education grants totalling PhP300 per child per month for a period of 10 months per
year, up to a maximum of three children per family is available. Households must comply with the
following conditions: a). Children 3-5 years old must attend day care or pre-school classes at least 85
percent of the school days every month; and b) Children 6-14 years old must enroll in elementary or
high school and attend at least 85 percent of the time.79 By the end of 2009, the program reached
700,000 households across the country.80In addition some Local Government Units (LGUs, i.e. cities and
municipalities) also provide in-kind subsidies to children. The Pasig city government, for instance, has
provided free books (1:1 ratio), bags, shoes, and physical education uniforms to all its public
elementary school students for many years.
Overall, most countries in the region have yet to establish comprehensive social protection systems
directly linked to improving education outcomes that are cost effective with proven impact.81
HEALTH AND NUTRITION
Since it is well proven that stunting, micronutrient deficiencies and hunger have a detrimental effect on
cognitive development and school performance, it is reasonable to assume that the education sector
would be one of the sectors most likely to benefit from investing in school feeding and nutritional
supplementation programmes.. By the same token, it is also true that education is one of the sectors
most likely to have an impact on stunting reduction. Analyses of DHS and MICS surveys from several
countries (Bangladesh, Lao, Mongolia, and Nepal) indicate that after controlling for confounding factors,
parents’ education universally played a strong protective role in child nutritional status. This is
particularly true for mother’s education, where evidence shows that increasing education of the mother
translates into better nutritional status of her children. There is also evidence that providing school
meals helps keep girls in school longer especially if linked with a take home ration82.
Cash transfer programs, which alleviate some of the environmental risks associated with poverty and
undernutrition have been shown to reduce stunting and to improve behaviour and cognition (Cecchini
78 Ibid. 79 UNICEF/UIS (2011) Out of School Children in Philippines Manila: UNICEF Philippines p 69 80 Babajanian, B. V. (2010) Social protection in Asia: the latest thinking and policy contours in Asian Development Bank (2010) Enhancing social protection in Asia and the Pacific: The proceedings of the regional workshop Mandaluyong City: Philippines: Asian Development Bank. P 542 81 Babajanian, B. V. (2010) Social protection in Asia: the latest thinking and policy contours in Asian Development Bank (2010) Enhancing social protection in Asia and the Pacific: The proceedings of the regional workshop Mandaluyong City: Philippines: Asian Development Bank. P 546 82 Gelli A, Meir U, and Espejo F 2007. Does provision of food in school increase girls’ enrollment? Evidence from schools in sub-Saharan Africa Food and Nutrition Bulletin, 28 (2): 149-155

88
and Madariaga, 2011 and Nadeau et al, 2011)83,84. In many EAP countries, governments are trying to
implement food transfers and school feeding, health insurance schemes and both conditional and
unconditional cash transfers, to respond to the issue of poor health and stunting for children. In
Indonesia a number of conditional and unconditional cash transfer systems target the health and well-
being of children as well as their attendance at school. In addition, a national school feeding programme
(PMT-AS) or Program Makanan Tambahan Anak Sekolah) has resumed since 2009. The programme
provides grants to schools so that they can purchase locally prepared healthy snacks or meals. A small-
scale school feeding project has also been implemented by the World Food Programme (WFP) for a
number of years as part of its Nutritional Rehabilitation Programme (NRP). It is motivated by the belief
that, especially in the case of anaemia, almost all school children in Indonesia need additional
micronutrients, whether poor or middle income, rural or urban. The project offers fortified biscuits in
class every day to about 320,000 primary school students in two provinces (East Java and NTB) to
increase attendance and performance. 85 Further, programs to improve maternal, infant and young
child nutrition demonstrate the largest impacts in nutrition and development with the most
disadvantaged mothers and young children. Iron supplementation and deworming interventions have
been shown to improve nutrition and participation among preschool children.
In the Philippines, DepEd’s School Health and Nutrition Program (SHNP) endeavors to maintain and
improve the health of schoolchildren by preventing diseases, promoting health-related knowledge,
attitudes, skills, and practices. As well, sitting beside the 4Ps program is the Food for School Program
(FSP)86 and the Breakfast Feeding Program (BFP)87. While the FSP was found to have positive impact on
the beneficiaries, the FSP has been discontinued largely due to leakage of resources in the targeting
process.88
Another successful measure to advocate and mobilize resources for improving the health and well-
being of pre-school and school-aged children and help improve their performance in school at a low
cost is on deworming. Philippines have also made excellent progress with nation deworming
programmes, the Essential Health Care Program (EHCP) that promotes handwashing, toothbrushing
and deworming among pre-school and elementary students in collaboration with Philippines
government. The programme has proven the reduction in worm load by 50% from 66% infected with
83 Cecchini, S and A Madariaga, (2011), Conditional Cash Transfer Programmes: The Recent Experience in Latin American and the Caribbean, United Nations, ECLAC, Santiago, Chile. 84 Nadeau S, Kataoka N, Valerio A, Neuman MJ, Elder LK, (2011), Investing in young children: an early childhood development guide for policy dialogue and project preparation. Washington, DC: Inernational Bank for Reconstruction and Development/World Bank. 85 UNICEF/UIS (2011) Out of School Children in Indonesia Jakarta : UNICEF Indonesia p87 86 The FSP involved the provision of a kilo of rice to families who suffer from severe hunger through their children in DCCs and in preschool and Grade 1 in schools operated by DepEd. Aside from targeting day care pupils, the FSP also aims to mitigate hunger among poor families and improve school attendance of Grades I to III. 87 The BFP is a short-term hunger alleviation intervention for school children with no baon (school allowance) and who do not eat breakfast before leaving the home. The program aimed to improve the active learning capabilities of school children. Grade I and Grade II pupils in low performing schools were provided with breakfast in the form of specially formulated instant noodles. 88 UNICEF/UIS (2011) Out of School Children in Philippines Manila: UNICEF Philippines

89
intestinal worms to just 35%. UNICEF in Philippines cited that “Toothaches and diarrhea are among the
common ailments that cause children to miss school. Studies show that 7 out of 10 children aged 3-12
suffer from intestinal worms due to unhygienic practices that often lead to diarrhea and under-
nutrition. Research also shows that 97 percent of 6 year olds and 81 percent of 12 year olds have dental
caries”89. EHCP program caused a reduction of school absenteeism by 25%.
In Timor Leste, the National Strategic Plan states the objective to provide clean, piped water to all
government schools by 2020. This will certainly make schools healthier places to be. Timor Leste also
has a school feeding programme that is supported by the World Food programme, although
implementation has been slow and coverage reduced in more recent years due to budget constraints.
EDUCATION FOR DISASTER RISK MANAGEMENT
With a number of large-scale natural hazard (tsunamis, cyclones, floods, earthquake, droughts, and etc.)
having affected the region in recent years, most countries have developed some form of Education for
disaster management programme. In 2007, EAPRO region has developed a series of principles for
Disaster Management involving children that forms the basis for many of these programmes90, which
has later on been evolved to the concept of Disaster Risk Reduction in Education. Disasters pose great
economic threats to education completion across the region, both in terms of burden on families and
strains on national budgets and capacity to provide educational services. Therefore, embedding DRR in
Education at the policy level to address both school safety and disaster management will build a
foundation for a safeguarding the environment and ensuring social protection measures are in place
soon after disasters hit.
A number of positive examples of overcoming the potential disruptions to learning caused by disasters
exist. In Timor Leste, the Ministry of Education, together with UNICEF and Plan International, are
developing emergency preparedness programs and resources, focusing on threats from natural
disasters (i.e. tsunamis) and social conflict. This joint effort has developed ideas about interagency
communication during emergencies and ways of keeping educational services operational before,
during and after emergencies. As development partners note: It is anticipated that 2012, with its
national elections, will present some special challenges in the area of social unrest, and thus the cluster
will continue to develop ways in which education can anticipate and be resilient to both natural and man-
made emergencies.91
89 http://www.unicef.org/philippines/mediacentre_17977.html 90 UNICEF EAPRO (2007) The participation of children and young people in emergencies: A guide for relief agencies, based largely on experiences in the Asian tsunami response Bangkok: UNICEF EAPRO http://www.unicef.org/eapro/the_participation_of_children_and_young_people_in_emergencies.pdf 91 Ibid 42 p 14
Administrator
Highlight
Administrator
Highlight
90
Indonesia is another example of high impact risk country, located in the ring of fire - the most active
disaster prone area of the world – and affected annually by floods, tsunamis, earthquakes, volcanic
eruptions and landslides. However, with adequate emergency preparedness and readiness, disaster
does not necessarily cause a lasting negative impact to schooling. For example, In Indonesia, the school
participation at the primary level in high impact disaster areas, such as Yogyakarta, Jawa Tengah, and
Sumatera Barata, were higher after the earthquakes struck, with tent schools and mass enrolment
campaigns resulted in a positive impact.
SUPPLY SIDE POLICIES AND STRATEGIES
Improving both access and quality of education is vital to bring and keep children in schools who face
diverse set of barriers and bottlenecks. Strategies to respond to gaps in access and quality of schools
are discussed here, followed by specific focus on countries’ efforts around language in education and
provision of ECD.
EXPANDING ACCESS
In the previous chapter, barriers related to access included remoteness of schools, classroom shortages,
WASH facilities, and teacher supply were highlighted. A range of efforts are in place across the region
to respond to such barriers, from adoption of inclusive education and CFS policies and approaches, to
construction of new facilities, alternative modes of delivery and multi-grade classes.
In Viet Nam, multi-grade teaching with the building of smaller satellite schools in close proximity to
children’s homes, especially for the earliest years of schooling, has been an important innovation for
decades. Multi-grade can also be considered during the secondary education as there are many reasons
associated with distance of school from home, that cause drop out and non-enrolment. For children
involved in Child Labour or home based chores, various forms of alternative education is available
through continuing education centres, supplementary education in evenings, or participate in illiteracy
elimination classes in wards and communes. However, this form of education and classes are not
attractive to children for many reasons and successful completion rates are quite low.
Other types of alternative delivery modes are available to provide flexible learning opportunities to
those unable to access regular schools, including working children, migrant children and children living
in remote areas. The Indonesian government has introduced one roof primary-junior secondary
school: integrated basic education in the same premises with shared use of teaching resources; the
establishment of satellite classes of a main school in remote areas; open schools under the supervision
of a regular junior secondary school and normally run at times convenient to the students, many of
whom are at work; special service classes for children who have dropped out of school; non-formal
Administrator
Highlight
Administrator
Highlight
Administrator
Highlight

91
basic education and inclusive education with the enrolment of children with disabilities into standard
classrooms.92
Non-formal equivalence programme are also available in Indonesia and reaches over 200,000 students
annually with packages designed for equivalence and certification at Primary, Lower Secondary and
Upper secondary levels. As an alternative delivery programme, working children and drop-outs are
eligible to study independently and even on line, with an equivalency exam offered prior to certification
and diplomas being awarded. Issues remain in terms of quality, however, with only a third of students
who enroll actually passing the final exam and receiving their certification (EAP Equivalence
Programmes Desk Review).
In the Philippines, the Homeschooling system, either Online Distance Learning (ODL) or Printed
Distance Learning (PDL), involving the teaching of children at home, usually by their parents is
recognized by the DepEd provided that the parent-teacher is a college graduate and is able to provide at
least 4 hours of instruction per week for kindergarten to 7th grade.93 This is one way of overcoming the
issue of long distances to school. Other responses to distance from home to school include the Home
Schooling, and the Multi-grade Program in Philippine Education. Examples also exist of schools with
support from Local Government Units that provide transportation services and boarding facilities for
children and teachers who live far from their school.
In conflict-affected areas, the Bangsamoro Development Agency has developed a culture-responsive,
age and developmentally appropriate Islamic preschool curriculum to be used by Bangsamoro children,
especially in Mindanao. This Tahderiyyah curriculum has been developed and endorsed by Muslim
leaders, scholars, the MILF Tarbiya and the MILF Central Committee.94 Furthermore, in order to
counteract the large numbers of children not attending schools in ARMM in the Philippines DepED is
planning to institute a BRAC type program at community level for primary school age children.
Efforts to broaden access to education for children with disabilities are gaining momentum, but many
challenges remain. In Indonesia, the government has introduced a large number of special schools, but
it cannot afford to offer this option at a large scale in rural areas. Children with disabilities and their
families often feel embarrassed to attend the local school or find it unaffordable and impractical to have
to go to a special school very far from home. In Viet Nam, steps are being taken to help bring more
children with disabilities to schools, beginning with their identification and referral. The Ministry of
Labour, Invalids and Social Affairs(2008) estimates the total number of children with disabilities in the
0-18 years age group to be 662,000 (2.4 per cent of that age group). The most common form of
disability in children is mobility impairment, which affects one-third of children with disabilities.95
However 75% of children with disabilities in Viet Nam are still out of school.
92 UNICEF/UIS (2011) Out of School Children in Indonesia Jakarta : UNICEF Indonesia 93http://en.wikipilipinas.org/index.php?title=Homeschooling_and_open_universities_in_the_Philippines 94 UNICEF/UIS (2011) Out of School Children in Philippines Manila: UNICEF Philippines 95 Quoted in UNICEF (2010) An analysis of the situation of children in Viet Nam Hanoi: UNICEF p24

92
In the East Asia Pacific region, Cambodia presents some promising initiatives on inclusive education for
children with disabilities. A small scale initiative in one cluster school in Svay Tieb district in Svay Rieng
province is a good model which has now spread to 11 other provinces. The Inclusive Education
Program by Handicap International in Battambang, the Mainstreaming Inclusive Education project by
VSO, and the USAID-funded ESCUP for underserved populations) are also notable initiatives that
include children with disabilities within their target of reaching all disadvantaged, out-of-school
children. Children with disabilities are identified by community mapping, and then provided with all
the services they would need to enrol in school. This might include a referral to a hospital for surgery
for hernia, a modified bicycle for transportation to school, or a neighbouring schoolmate receiving
support to provide the student with disabilities a lift to school (USAID, 2006).96
QUALITY
Quality of education has become a central concern to governments across the region. There is growing
recognition on the importance of quality in ensuring continued demand for and participation in
education and as private sector employers increasingly complain about the low standards pf school
graduates. As discussed in the previous chapter, low levels of learning outcomes, poor teacher quality
and lack of resources are some of the critical gaps common in countries.
Across the region, assessment of learning achievement- essential to diagnose and improve education
outcomes- has been given insufficient attention, with only a handful of countries administering national
level assessments or participating in international assessments such as PISA and TIMSS. However,
efforts to assess levels of learning outcomes are increasing, from early grade reading to assessment of
academic and non-academic areas. In particular, a number of countries are using variations of the Early
Grade Reading Assessments (EGRA) approach to conduct sample-based assessments to better
understand the levels of reading abilities in early grades, which is a critical foundation that can affect
learning prospects in subsequent years in schools. Although theEGRA approach is neither a standard
that can be used for comparative analysis across countries nor necessarily a culturally relevant model
with which reading and literacy can be effectively measured, it has been a useful way to highlight and
bring focused attention to improving essential learning outcomes can be measured in the early grades.
In the Philippines, the Student Tracking System, developed and implemented with support from
UNICEF, is a useful tool that provides individual schools with an early warning for children who are at
risk of not learning and dropping out. It includes socio-cultural and economic background of each child
and his or her family, which helps identification of specific needs of individual students. In addition,
96 Reported in Kalyanpur , Maya, Kong Vichetra, Kong Kanitha, Un Siren, Lek Kongjian, Bo Vibol &Eng Muguek (2007) Including the excluded Integrating disability into the EFA Fast Track Initiative processes and National Education Plans in Cambodia Phnom Penh World Vision Cambodia p iii p 11
Administrator
Highlight
93
other school-community mechanisms, such as the Community-based Management System, are
implemented in select barangays nationwide regularly and collect data on the number of school-aged
children not in school.
For children who are not learning and, hence, at risk of dropping out, some remediation and support
programs should be made available. As teachers learn more about the role of interactive teaching and
learning, this will probably come to the fore. In some qualitative studies, students have complained
about their teachers’ lack of concern about their poor performance in class. When dropout or grade
repetition is the only response for low performing students, this not only results in lower efficiency in
education systems, but will ultimately lead to limited future life choices for individual students.
Improving teacher quality has been another focus area in the region’s efforts to quality
improvements. In Indonesia, policies on teacher upgrading and teacher certification are currently
being implemented with the objective of increasing the level of teacher qualifications and improving
deployment. The teacher upgrading policy focuses on strengthening teacher training institutions and
assisting teacher and supervisor clusters. The teacher certification program is not directly linked to
quality improvements, as many of the requirements to get certified are routine and not linked to
classroom teaching conditions. However, it is hoped that the teacher remuneration package that
accompanies certification will help attract more highly qualified people to the profession.
The government also provides a special allowance paid for teachers serving in remote areas, which
appears to have decreased teacher absenteeism rate from 20 percent in 2003 and to 15 percent in
2008. However, the absenteeism level for teachers in schools that received the allowances was still
higher than that for other schools. Some studies shows that teachers who were absent during school
time were mostly engaged in tasks outside school, sick, or attending to private business, suggesting the
need for improved management and accountability practices.97
In the Philippines, teachers’ competency development has been one of the key reform areas in the
current BESRA (Basic Education Sector Reform Agenda) programme. It was expected that by end of
2011, a competency-based systems for hiring, deployment, performance appraisal, promotion, and
continuous personal and professional development of teachers would be in place in all regions and
divisions nationwide.98
97 UNICEF/UIS (2011) Out of School Children in Indonesia Jakarta : UNICEF Indonesia 98 BESRA Progress Report, based on the final draft of the BESRA Implementation and Accountability Plan, 2010-2012; PPt, National Mancom Meeting, 23 February 2010.
Administrator
Highlight
94
In Viet Nam, MOET has turned its attention to the quality training of teachers and the development of a
set of professional teacher standards linked to the curriculum. The teacher professional standards are
also meant to be linked to revised pay scales for teachers, which once implemented, is hoped to
motivate teachers towards improved performance.
While these and many other strategies are being implemented to improve teacher standards and
performance, there is increasing understanding that teacher performance is affected by a range of
individual, social, cultural and economic factors that cannot be easily altered with disparate,
fragmented policies or more in-service teacher training programmes. Behavior change toward effective
teaching and learning processes should be recognized as a long- term investment, and should be
supported with a concerted effort by pre-service teacher training institutions and in-service
professional development providers. Strengthening school leadership is also essential to improving
overall quality of teachers and teaching-learning, as schools where principals are more actively engaged
in observing and guiding teachers are more likely to help student performance.99
Textbooks are one of the most essential inputs for quality learning, and sustained efforts are needed to
produce and distribute materials, particularly to remote, disadvantaged areas, in a timely manner.
Gender, language and culturally appropriate materials continue to remain a challenge. In Viet Nam
textbooks are printed by the central government and must be purchased by parents, which is usually
far more convenient in urban and semi-urban areas. Setting up national systems to print and distribute
textbooks in a timely and efficient manner usually require public private partnerships, for decentralized
printing and/or for streamlined distribution, which in turn requires changes to policies governing the
roles and functions of government and private sector partners.
LANGUAGE IN EDUCATION
As noted earlier. for ethnic minorities who do not speak the national language at home, learning from
teachers who do not speak their language and in a language that they do not speak are serious
impediments to learning and retention In the Philippines, the recent Order 74 by Department of
Education- “Institutionalizing Mother Tongue Based Multilingual Education”- has allowed for the use of
local languages to be used as the medium of instruction in preschool to at least grade 3. The policy
stipulates, among others, the integration of MLE in all subject areas and establishing the support system
for its implementation, including identifying resources to be tapped for the purpose and encouraging
the DepED regional directors and superintendents to create opportunities for orientation and training
on MLE.
99 World Bank (2011) Viet Nam: High Quality Education for All Report No. 56085-VN Volume 1: Human Development Department East Asia and Pacific Region p 16
95
MTB-MLE is being piloted in over 100 elementary schools involving 12 dominant languages in the
Philippines. Under K-12 Programme of DepED, Mother tongue is being adopted as a medium of
instruction starting in Kindergarten up to Grade 3 and as a separate subject in Grades 1 to Grade 3. The
on-going training program for Grade 1 teachers includes training on the implementation of MLE. While
local language materials and core textbooks still need to be developed, there is great hope that the high
levels of Grade 1 and 2 drop out and repetition will be reduced by this measure (DepEd Philippines,
2011).
In Viet Nam there are more than fifty four ethnic groups, and encompassing seven major language
families. Many ethnic groups are long standing and pre-date Viet Namese settlement; others are more
recent migrants to more distant and remote areas due to government resettlement policies. There have
been a number of efforts over the years to introduce mother tongue and bilingual education, as well as
efforts to introduce Viet Namese immersion programmes in pre-school. For children learning in Kinh
and reading in Kinh, there are at least two difficult tasks: learning in a new language and learning to
read and write. The Action Research for Mother Tongue Bilingual Education project (2008-2015)
has provided a positive model for education for ethnic minority children at primary level. Initial
assessments show that children are interested in school, drop out doesn’t occur and children can learn
in the language they use at home. This has already resulted in higher test scores in Math and Viet
Namese language skills for children. In Viet Nam and across the region, institutionalising mother tongue
language programmes in the early years of school is both difficult and necessary for ensuring equality
of access for children of ethnic minority background.
In Timor Leste, the Multilingual Mother Tongue-based languages policy has also been adopted by the
government and will be piloted in a number of areas (Oecusse, Lautem and Manatuto).100 Such broad
efforts to address the educational needs of ethnic minorities are greatly encouraging, and opportunities
of ethnic minorities are expected to dramatically improve in the coming years. At the same time,
however, careful documentation and evaluation of the lessons from mother-tongue based education
programs will be paramount to sustained, successful responses to the needs of disadvantaged ethnic
minorities, who face diverse set of barriers that require targeted, comprehensive support.
There is a lot of resistance to introducing mother tongue based education, It must also be recognized
that policies on language of instruction are fraught with political risk and nationalist tendencies. Many
political leaders fear that teaching children in local languages can weaken the role of the state or even
lead to succession movements and anti-national sentiments. Ethnic minority communities and parents
themselves are also suspicious of mother tongue based practices which they feel will further
marginalize their children – who they fear will not be able to master the national language and thereby
be further marginalized. While trhere is common acceptance that the use of mother tongue in schools
can result in strengthened cultural identity, more advocacy and evidence based policy debate is
100 Prime Minister explains Government’s policy on Mother Tongue in Parliament. Available at: http://timor-leste.gov.tl/?p=6454&lang=en
Administrator
Highlight
Administrator
Highlight

96
required to convince parents and policy makers alike that other tongue based education actually
strengthens students’ capacity to master the national language and to succeed in school.
EXPANSION OF EARLY CHILDHOOD DEVELOPMENT
Access to affordable ECD services are critical for child development as well as ensuring strong
foundations essential to future success in schools. As mentioned in the previous chapter, access to ECD
has important effects on school readiness, which in turn impacts right-age enrolment in schools, and
lowers the risks of repetition, drop out and overall student performance.
In the Philippines, the Senate has approved a bill, Kindergarten Education Act, which seeks to make pre-
school education mandatory, compulsory, and free in all public schools. It aims to institutionalize
kindergarten education into the basic education system. The Senate version prescribes a mother
tongue-based multilingual education as a medium of instruction for pre-school children.
In Timor Leste, in response to very low levels of early childhood participation, the National Education
Strategic Plan addresses the need for universal ECCD coverage, but a clear policy, standards, training
programs and national budget are required to take ECCD to scale and these have yet to be prepared.
In Indonesia, there are many possibilities for increasing pre-primary education access. The Ministry of
National Education supports a community-based Early Childhood Education and Development (ECED)
project for more than 700,000 children in 50 districts. The project operates in a way similar to PNPM-
Generasi: communities receive block grants according to a plan on how best to deliver early childhood
services. In parallel, the establishment of a national quality assurance and professional development
system is also being supported. There are still major challenges to address with the high levels of
underage enrolment in Grade One, which is primarily the result of primary school being fee free and
pre-schools being fee based.
In Viet Nam, the World Bank’s study on High Quality Education for All (2009) includes early childhood
education in its areas for policy reform as it is seen as an important period of time for learning,
especially for those who are outside the mainstream, such as those who are poor, migrants, or ethnic
minority. However even if it ranks highly in terms of policy and it has had a long history in Viet Nam’s
socialist society, there are still children who fall through this learning safety net an many of them are
amongst the marginalized.
GOVERNANCE AND FINANCING
SCHOOL BASED MANAGEMENT
As noted in the previous chapter, decentralization and, in particular, school based management has
been a notable trend in many countries across the region. Potential benefits of decentralization in
improving educational outcomes need to be supported with requisite improvements in local level
Administrator
Highlight

97
capacity and school based management. Some progress in these aspects is being made in countries,
albeit to varying degrees. In Indonesia, the Decentralized Basic Education 1- Management and
Governance project (2005-2011) assisted 1,300 schools to prepare and implement four-year school
development plans which was found to have led to better planning, greater community participation,
and improved transparency.101 Improving school-based management specifically, on the other hand,
seems to require a more complex and time-intensive investments, as studies find that empowering
inexperienced community members to execute complicated tasks, such as advising on teacher
management, is unlikely to happen without intensive set of inputs.
In the Philippines, the Strengthening the Implementation of Basic Education in Selected Provinces in the
Visayas (STRIVE), funded by the AUSAID has been implemented to build leadership and management
capacity among school heads and managers. A practical guideline for Dropout Reduction Program
(DORP) at the secondary level has also been developed as a means to promote more proactive school
based monitoring and management as a collaborative effort by school head, teachers, students, parents
and other stakeholders (UNICEF 2011b).
EDUCATION FINANCING
There has been increasing recognition that, in addition to more funding, better utilization of education
funding is needed to improve equity and efficiency of education systems. In Timor Leste, the National
Education Strategic Plan proposes funding of USD150 million in 2011 and reaching USD 388 million by
2030. This represents about 20 percent of total government budget, which would be similar to the
shares spent in countries like Indonesia, Thailand and the Philippines. In 2009, education share of
national budget was just 12 percent, however, suggesting that considerable effort would be required for
the government to implement the strategy102. The importance harnessing all available resources, such
as non-state providers such as civil society and religious organizations, is also recognized; the
Philippines OOSC Country Report calls for the need for systematic documentation and assessment of
the impact of their contribution to basic education.
To alleviate the burden of maintaining children in school, education ministries may institute a wide
range of schemes and incentives, such as school feeding, free or subsidized transport, special grants and
supplies. Governments may also endorse the provision of free uniforms, textbooks and stationary, or
monthly rations and incentives that are attached to attendance. In Mongolia and Cambodia, incentives
including free school meals and textbooks are provided to poor schools. In 2010, Fiji introduced a Free
Bus Fare for school students from poor communities.
In Indonesia, two innovative social protection policies stand out. The conditional cash transfer
101 DBE1 (2007) Implementing school-based management in Indonesia: the DBE1 experience 2005-2010 Impact Study, Decentralized basic education 1: management and governance, USAID. 102 The Development Partners Appraisal of the National Education Strategic Plan 2011-2030 and Recommendation for Re-endorsement of Timor-Leste for Accession to the Education for All (EFA) Fast Track Initiative. June, 2011. Dilli, Unpublished Paper.

98
programme known as PKH (Program Keluarga Harapan or Hopeful Family Programme) provides
money to the female primary caregiver, a reward for families whose school-age children, among other
things, enroll and stay in school. To complement this, the conditional cash transfer programme, known
as PNPM-Generasi (National Community Empowerment Program - Healthy and Smart Generation), was
established. Communities receive a sizable grant conditional on their presenting an investment plan
that can include establishing or improving junior secondary schools — an initiative that, thus far, has
shown real success in expanding access to junior secondary.
While many private schools cater to the wealthy, equal numbers of unregistered private schools are
providing valuable education services at affordable rates to the poor in countries throughout the
region. In Thailand, Philippines and Indonesia, partial financing of private schools, particularly at
secondary levels by governments is a common feature. The role of Public Private Partnerships (PPPs)
and Non-State Organizations (NSOs) is rapidly growing, particularly in pre-primary and post-primary
levels, in both low and middle-income countries, with potential significance for the equity and efficiency
of educational opportunities. Education ministries need to analyze whether government resources can
be used more efficiently by the private sector and NSOs in providing access to a quality education for
specific disadvantaged groups – including children who are very poor, live in remote communities or
who are disabled.
As discussed previously, various demand-side financing options, including scholarships and cash
transfers, are available across the region, with the anticipation that they would lead to improved equity
and efficiency within the education system as well as better outcomes. As noted, such strategies have
yet to be evaluated and documented, and improvements to the administrative capacities and
coordination mechanisms to ensure their effectiveness and sustainability in yielding positive
educational outcomes are required.

99
Key results for
education to
achieve
Potential Target
Groups
Investment case for targeted solutions
Increase
participation in and
access to primary
and secondary
education with
significantly
reduced disparities
Ethnic minorities
Street children Remote and rural
communities Children from
Isolated areas Children from
religious groups Girls Children with special
needs
Children affected by
disaster
Dropped out, slow
learners
Adoption of Child Friendly Schools approach to promote community participation Child Seeking Schools Awareness raising campaign on importance of ECD and School readiness Campaign to tackle gender-based barriers such as scholarship programs for girls, trainings
on gender-responsive teaching School construction in remote areas Special assistance for schools which are under-resourced. Conditional cash transfers and social protection linked to regular school attendance School feeding and/or food incentives for regular school attendance/ Food for School
programs Multi-grade teaching, with capacity and resource support in ‘incomplete’ schools Water, sanitation and hygiene in schools Mother tongue-based education with local language materials Increase provision of ethnic minority teachers and teachers’ aides Alternative delivery systems: independent tutorials/equivalency programmes/distance
learning School grants with pro-poor financing formulas Cost-sharing or loans will be introduced for higher education students and scholarships for
the poorest Review of within — and across — district resource allocation
Enactment of laws and decree that address an equal opportunities for disabled person to be
able to access to special centers and schools for disabled children based on the “least
restrictive environment”
Disaster Risk Reduction program
Non-formal equivalence programme/ online distance learning and certification at primary,
lower secondary and upper secondary level
Student tracking system
Improve the quality
of primary and
secondary
education systems
and the experience
and outcomes for
students
Ethnic minority groups
Street children Remote and rural
communities Children from
Isolated areas Children from
religious groups Girls Children with
disabilities
Headmaster and PTA training on School Self-Assessment, School Improvement Plans and child-friendly schools
Recruitment and training of local teachers In-service teacher training and up-grading programmes Development and distribution of textbooks and reading materials Water, sanitation and hygiene in Schools Mother Tongue Based Education Examination reform Education Management Information System (EMIS) analysis support School grants with pro-poor financing formulas
Essential Health Care program that promotes hand washing, tooth brushing and deworming
Multi-grade teaching
Improve
participation in
early childhood
care and education
programmes to lay
the foundation for
success in schooling
and a positive
impact on
children’s
development
Ethnic minority groups
Street children Remote and rural
communities Children from
Isolated areas Children from
religious groups Girls — or boys — in
some contexts Children with
disabilities
Early learning and child development through community-based or pre-school models
Conditional Cash Transfer and social protection School feeding and take-home rations EMIS and EFA Info analysis support Community-based home visiting programme and parenting education Disaster Risk Reduction in early childhood development (ECD) Mother tongue-based ECD programmes Increased salaries from government to care providers Expanded services through non-state providers Household incentives , traditional cash transfer schemes for families enrolled in ECD

100
Key results for
education to
achieve
Potential Target
Groups
Investment case for targeted solutions
Improve availability
of trained teachers
and appropriate
learning materials
for marginalized
and excluded
children
Ministry of Education, Teacher Training Department
Teacher Education Institutions
Pre-service teachers and teacher trainers
In-service teachers and teacher trainers
Public Service
Commissions
Training of in-service teachers on how to effectively use information communication technology (ICT) in education
Leveraging in-service teacher curriculum to be able to effectively use ICT in education. In-service teachers peer coaching programme Mother tongue-based education with local language materials Regular In-service and pre-service training Peer coaching for teachers programme

101
CHAPTER 5: CONCLUSIONS
This review of OOSC analysis from the four countries in EAP has shown that, with over 5 million
primary and secondary school age children remaining out of school in these four countries alone, much
more needs to be done to reach the goals of education for all. Analysis has also shown that there are
notable commonalities in the profiles of children who are educationally disadvantaged, beginning right
from the start, at pre-primary ages:
Children living in rural areas are less likely than those in urban areas to be in school at all levels,
but especially in pre-primary and lower-secondary levels. Generally, subnational (by region and
provinces) variations in school attendance rate can also be significant, as in the case of the
Philippines, where in one of its provinces, children are almost two and half times more likely to
be out of school compared to the national average.
Differences in school attendance rates by economic backgrounds are also significant especially
in pre-primary and lower-secondary levels.
There is near gender parity in primary levels in all countries, but boys are at a distinct
disadvantage in attending pre-primary schools and lower-secondary levels appropriate for their
age (with the exception of Viet Nam).
In many countries, a sizeable proportion of children are over-age for their grades, and hence, at
risk of dropping out, most notably in Cambodia and Timor Leste. Even where national rate of
over-age children is relatively low, subnational disparities can be high. Gender disparities also
prevail among over-age children, with generally more boys than girls of lower secondary age
attending primary schools.
Children with disabilities have severely limited access to education and ethnic minority
children, who often face multiple levels of disparities, also represent one of the most
disadvantaged groups in terms of school attendance.
At the same time, some exceptions to regional trends can be seen in some countries, based on various
issues and challenges unique to their contexts. For example:
In Indonesia, a high number of children are under-aged, possibly due to the comparatively late
official age of entry (age 7) and the fact pre-primary schools are mostly fee-based while primary
schools is free of charge. In contrast to other countries whose efforts need to be directed to

102
respond to the needs of over-age children, Indonesia would need to identify the necessary
responses for under-age children who are also at risk of dropping out.
In Cambodia, girls at the higher end of the age range are much less likely to be in school than
boys, suggesting the need to identify and respond to the underlying causes of disadvantages
that girls face in the country.
Overall, analysis shows that the common factors of disparities have less impact on school attendance in
primary compared to other levels, which could be a reflection that the vast efforts made towards
universal primary education are making a difference. However, certain groups of children (i.e., children
with disabilities and some ethnic minority children) are persistently over-represented among the
remaining proportion of OOSC, suggesting inequities remain a real barrier to realizing universal
primary education. Inequities that begin in pre-primary level and become prominent in secondary level
also have far-reaching impact on the achieving the goals of education for all.
The preceding chapters discussed the wide range of underlying issues and challenges that lead to
barriers to education for children, from socio-cultural and economic demand-side barriers to supply-
side barriers. The extent to which government policies and strategies have successfully responded to
them has similarly varied. For instance, many countries have made significant strides toward
improving community participation and raising awareness on gender parity in education. Policies and
programs for mother tongue-based education have also improved across the region, although sustained
efforts are needed to ensure progress in turning policies into practical actions for children in classroom.
Strategies like school-based management and demand-side financing programs remain ineffective in
many countries – either through improper targeting/monitoring delays in disbursement and difficulties
in reaching the most disadvantaged - and need to be strengthened. Accelerated efforts to support
groups that have received very little attention thus far (i.e., children with disabilities) are also essential,
and multi-sectoral responses to tackle barriers related to birth certification and migration would also
be important to promote better education outcomes.
The following outlines some key recommendations for countries to reduce the barriers and bottlenecks
to education:
1. Analyze the key risk dimensions that persistently exclude certain groups of children from
education, not only in access but also in learning, and institute innovative approaches to
education expand genuine opportunities to learning. Across the EAP, ethnic minorities and
children with disabilities face far greater risk of exclusion from education access than others.
Secondary school age boys are also significantly disadvantaged, not only in terms of access but also
from learning, leading to a large proportion of them being over-age and at risk of dropping out.
Complex set of economic and socio-economic challenges can further exacerbate situations for these
Administrator
Highlight
Administrator
Highlight

103
children who must deal with multiple levels of disparities. Clearly, rigorous analysis to identify the
various underlying causes of exclusion (i.e., poverty, distance, language) would be instrumental to
identifying critical solutions to address their needs. In many cases, innovative approaches and
alternative solutions would be needed to make a difference. Although such steps may be more cost-
intensive in the short term, the long-term benefits to societies of having education systems that are
inclusive and equitable will far exceed the costs.
2. Promote and expand quality ECD provisions, particularly for the disadvantaged, to improve
equity in overall education outcomes. In most countries, ECD and pre-primary education access
is heavily affected by family background such as wealth, as provisions remain largely fee-based and
insufficient in number. Hence, lack of access to effective pre-primary education is often the starting
point of inequities that affect children from poor and disadvantaged families in their educational
endeavors in primary and beyond. Without strong foundations set in early years, children face
challenges in learning and development in subsequent years. Problems associated with under-age
entry to schools, as seen in Indonesia, is often a result of limited access to affordable ECD services as
well. Hence, expanding access to ECD by leveraging non-state providers and employing innovative
delivery modes could be one of the most efficient means to improve equitable educational outcomes
at all levels.
3. Invest in improving quality of education as an integral strategy to breaking down barriers to
access to education. Access and quality in education are closely linked, and as discussed earlier,
quality of learning - or lack thereof - is often cited as a key reason why parents draw children out of
school. Other symptoms of poor quality education, like high repetition and over-age enrolment, are
prevalent in some countries. Promoting better quality education would be paramount to ensure
that those students who are at-risk of dropping out remain in schools and interested in learning.
Improving the quality of teachers and their teaching and learning practices; textbook development,
including in minority languages; textbook distribution; social-emotional learning; and gender-
responsive practices, are some of the critical strategies needed to curb number of children out of
school.
4. Strengthen education and social protection systems to improve overall efficiency and equity
in education. In the context of continuing global economic recession, the importance of better
efficiency and of protecting children of disadvantaged populations will be more acute than before.
Decentralization and school-based management are being employed in many countries as a means
to improve system efficiency, but much broader efforts to strengthen human resource and systemic
capacity (i.e., M&E, management skills) in education systems will be crucial to their effectiveness in
yielding in positive education outcomes. Effective social protection schemes, like conditional cash
transfers are also being introduced in some countries, but greater investments are needed to design
and target programs to address the barriers affecting those most in need.