Asia-Pacific -Hotels & Motels MarketLine Industry Profile Hotels & Motels in Asia-Pacific
36
Asia-Pacific - Hotels & Motels 0200 - 0520 - 2013 © MARKETLINE THIS PROFILE IS A LICENSED PRODUCT AND IS NOT TO BE PHOTOCOPIED Page | 1 MarketLine Industry Profile Hotels & Motels in Asia-Pacific April 2014 Reference Code: 0200-0520 Publication Date: April 2014 WWW.MARKETLINE.COM MARKETLINE. THIS PROFILE IS A LICENSED PRODUCT AND IS NOT TO BE PHOTOCOPIED
-
Upload
independent -
Category
Documents
-
view
1 -
download
0
Transcript of Asia-Pacific -Hotels & Motels MarketLine Industry Profile Hotels & Motels in Asia-Pacific

Asia-Pacific - Hotels & Motels 0200 - 0520 - 2013
© MARKETLINE THIS PROFILE IS A LICENSED PRODUCT AND IS NOT TO BE PHOTOCOPIED Page | 1
MarketLine Industry Profile
Hotels & Motels in Asia-Pacific April 2014
Reference Code: 0200-0520
Publication Date: April 2014
WWW.MARKETLINE.COM
MARKETLINE. THIS PROFILE IS A LICENSED PRODUCT AND IS NOT TO BE PHOTOCOPIED

Asia-Pacific - Hotels & Motels 0200 - 0520 - 2013
© MARKETLINE THIS PROFILE IS A LICENSED PRODUCT AND IS NOT TO BE PHOTOCOPIED Page | 2
EXECUTIVE SUMMARY
Market value The Asia-Pacific hotels & motels industry grew by 6.4% in 2013 to reach a value of $151.7 billion.
Market value forecast In 2018, the Asia-Pacific hotels & motels industry is forecast to have a value of $232.4 billion, an increase of 53.2% since
2013.
Market volume The Asia-Pacific hotels & motels industry shrank by 1.7% in 2013 to reach a volume of 113.3 units.
Market volume forecast In 2018, the Asia-Pacific hotels & motels industry is forecast to have a volume of 107.3 units, a decrease of 5.3% since
2013.
Category segmentation Leisure is the largest segment of the hotels & motels industry in Asia-Pacific, accounting for 73.1% of the industry's total
value.
Geography segmentation China accounts for 46.2% of the Asia-Pacific hotels & motels industry value.
Market rivalry The hotels and motels industry is dominated by large international players, who compete intensely for a share of the
market amongst themselves and with numerous smaller independent players.

Asia-Pacific - Hotels & Motels 0200 - 0520 - 2013
© MARKETLINE THIS PROFILE IS A LICENSED PRODUCT AND IS NOT TO BE PHOTOCOPIED Page | 3
TABLE OF CONTENTS
Executive Summary ....................................................................................................................................................... 2
Market value ............................................................................................................................................................... 2
Market value forecast ................................................................................................................................................. 2
Market volume ............................................................................................................................................................ 2
Market volume forecast .............................................................................................................................................. 2
Category segmentation .............................................................................................................................................. 2
Geography segmentation ........................................................................................................................................... 2
Market rivalry .............................................................................................................................................................. 2
Market Overview ............................................................................................................................................................ 7
Market definition ......................................................................................................................................................... 7
Market analysis .......................................................................................................................................................... 7
Market Data ................................................................................................................................................................... 8
Market value ............................................................................................................................................................... 8
Market volume ............................................................................................................................................................ 9
Market Segmentation ................................................................................................................................................... 10
Category segmentation ............................................................................................................................................ 10
Geography segmentation ......................................................................................................................................... 11
Market Outlook ............................................................................................................................................................. 12
Market value forecast ............................................................................................................................................... 12
Market volume forecast ............................................................................................................................................ 13
Five Forces Analysis .................................................................................................................................................... 14
Summary .................................................................................................................................................................. 14
Buyer power ............................................................................................................................................................. 15
Supplier power ......................................................................................................................................................... 16
New entrants ............................................................................................................................................................ 17
Threat of substitutes ................................................................................................................................................. 19
Degree of rivalry ....................................................................................................................................................... 20
Leading Companies ..................................................................................................................................................... 21

Asia-Pacific - Hotels & Motels 0200 - 0520 - 2013
© MARKETLINE THIS PROFILE IS A LICENSED PRODUCT AND IS NOT TO BE PHOTOCOPIED Page | 4
Accor SA .................................................................................................................................................................. 21
Starwood Hotels & Resorts Worldwide, Inc. ............................................................................................................. 24
Wyndham Worldwide Corporation ............................................................................................................................ 27
Home Inns & Hotels Management Inc. ..................................................................................................................... 30
Appendix ...................................................................................................................................................................... 33
Methodology ............................................................................................................................................................. 33
Industry associations ................................................................................................................................................ 34
Related MarketLine research ................................................................................................................................... 34

Asia-Pacific - Hotels & Motels 0200 - 0520 - 2013
© MARKETLINE THIS PROFILE IS A LICENSED PRODUCT AND IS NOT TO BE PHOTOCOPIED Page | 5
LIST OF TABLES
Table 1: Asia-Pacific hotels & motels industry value: $ billion, 2009–13 ........................................................................ 8
Table 2: Asia–Pacific hotels & motels industry volume: units, 2009–13 ......................................................................... 9
Table 3: Asia–Pacific hotels & motels industry category segmentation: $ billion, 2013 ................................................ 10
Table 4: Asia–Pacific hotels & motels industry geography segmentation: $ billion, 2013 ............................................ 11
Table 5: Asia-Pacific hotels & motels industry value forecast: $ billion, 2013–18 ........................................................ 12
Table 6: Asia–Pacific hotels & motels industry volume forecast: units, 2013–18 ......................................................... 13
Table 7: Accor SA: key facts ........................................................................................................................................ 21
Table 8: Accor SA: key financials ($) ........................................................................................................................... 21
Table 9: Accor SA: key financials (€) ........................................................................................................................... 22
Table 10: Accor SA: key financial ratios ....................................................................................................................... 22
Table 11: Starwood Hotels & Resorts Worldwide, Inc.: key facts ................................................................................. 24
Table 12: Starwood Hotels & Resorts Worldwide, Inc.: key financials ($) .................................................................... 25
Table 13: Starwood Hotels & Resorts Worldwide, Inc.: key financial ratios ................................................................. 25
Table 14: Wyndham Worldwide Corporation: key facts ................................................................................................ 27
Table 15: Wyndham Worldwide Corporation: key financials ($) ................................................................................... 28
Table 16: Wyndham Worldwide Corporation: key financial ratios ................................................................................ 28
Table 17: Home Inns & Hotels Management Inc.: key facts ......................................................................................... 30
Table 18: Home Inns & Hotels Management Inc.: key financials ($) ............................................................................ 30
Table 19: Home Inns & Hotels Management Inc.: key financials (CNY) ...................................................................... 31
Table 20: Home Inns & Hotels Management Inc.: key financial ratios ......................................................................... 31

Asia-Pacific - Hotels & Motels 0200 - 0520 - 2013
© MARKETLINE THIS PROFILE IS A LICENSED PRODUCT AND IS NOT TO BE PHOTOCOPIED Page | 6
LIST OF FIGURES
Figure 1: Asia-Pacific hotels & motels industry value: $ billion, 2009–13 ....................................................................... 8
Figure 2: Asia–Pacific hotels & motels industry volume: units, 2009–13 ........................................................................ 9
Figure 3: Asia–Pacific hotels & motels industry category segmentation: % share, by value, 2013 .............................. 10
Figure 4: Asia–Pacific hotels & motels industry geography segmentation: % share, by value, 2013 ........................... 11
Figure 5: Asia-Pacific hotels & motels industry value forecast: $ billion, 2013–18 ....................................................... 12
Figure 6: Asia–Pacific hotels & motels industry volume forecast: units, 2013–18 ........................................................ 13
Figure 7: Forces driving competition in the hotels & motels industry in Asia-Pacific, 2013 .......................................... 14
Figure 8: Drivers of buyer power in the hotels & motels industry in Asia-Pacific, 2013 ................................................ 15
Figure 9: Drivers of supplier power in the hotels & motels industry in Asia-Pacific, 2013 ............................................ 16
Figure 10: Factors influencing the likelihood of new entrants in the hotels & motels industry in Asia-Pacific, 2013 ..... 17
Figure 11: Factors influencing the threat of substitutes in the hotels & motels industry in Asia-Pacific, 2013 .............. 19
Figure 12: Drivers of degree of rivalry in the hotels & motels industry in Asia-Pacific, 2013 ........................................ 20
Figure 13: Accor SA: revenues & profitability ............................................................................................................... 22
Figure 14: Accor SA: assets & liabilities ....................................................................................................................... 23
Figure 15: Starwood Hotels & Resorts Worldwide, Inc.: revenues & profitability ......................................................... 25
Figure 16: Starwood Hotels & Resorts Worldwide, Inc.: assets & liabilities ................................................................. 26
Figure 17: Wyndham Worldwide Corporation: revenues & profitability ........................................................................ 28
Figure 18: Wyndham Worldwide Corporation: assets & liabilities ................................................................................ 29
Figure 19: Home Inns & Hotels Management Inc.: revenues & profitability ................................................................. 31
Figure 20: Home Inns & Hotels Management Inc.: assets & liabilities ......................................................................... 32
Asia-Pacific - Hotels & Motels 0200 - 0520 - 2013
© MARKETLINE THIS PROFILE IS A LICENSED PRODUCT AND IS NOT TO BE PHOTOCOPIED Page | 7
MARKET OVERVIEW
Market definition The hotels & motels industry value consists of all revenues generated by hotels, motels and other accommodation
providers, through the provision of accommodation and food service. The value does not include any revenues
generated through other interests, such as casinos, shops and telecommunication services. The industry is segmented
according to the origin of the revenues (leisure consumers and business consumers). Market volumes are classed as the
number of hotels in a country or region.
Any currency conversions included within this report have been calculated using constant 2013 annual average
exchange rates.
For the purposes of this report, Asia-Pacific comprises Australia, China, India, Indonesia, Japan, New Zealand,
Singapore, South Korea, Taiwan, and Thailand.
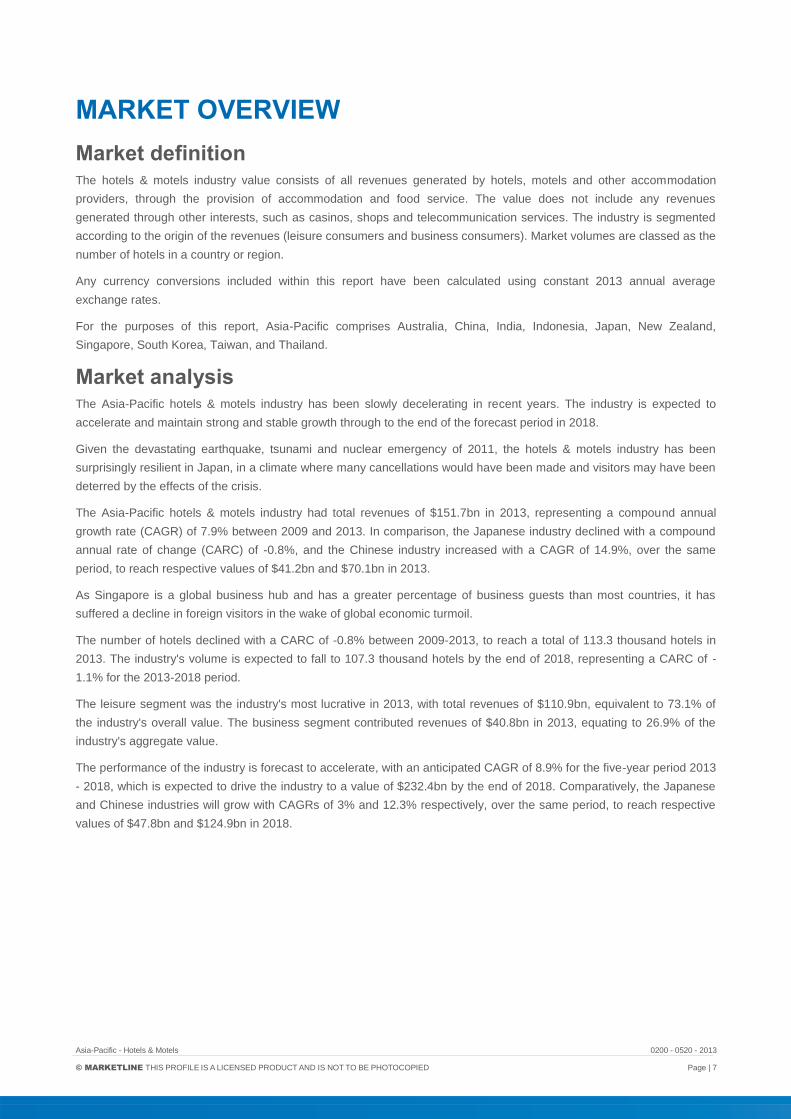
Market analysis The Asia-Pacific hotels & motels industry has been slowly decelerating in recent years. The industry is expected to
accelerate and maintain strong and stable growth through to the end of the forecast period in 2018.
Given the devastating earthquake, tsunami and nuclear emergency of 2011, the hotels & motels industry has been
surprisingly resilient in Japan, in a climate where many cancellations would have been made and visitors may have been
deterred by the effects of the crisis.
The Asia-Pacific hotels & motels industry had total revenues of $151.7bn in 2013, representing a compound annual
growth rate (CAGR) of 7.9% between 2009 and 2013. In comparison, the Japanese industry declined with a compound
annual rate of change (CARC) of -0.8%, and the Chinese industry increased with a CAGR of 14.9%, over the same
period, to reach respective values of $41.2bn and $70.1bn in 2013.
As Singapore is a global business hub and has a greater percentage of business guests than most countries, it has
suffered a decline in foreign visitors in the wake of global economic turmoil.
The number of hotels declined with a CARC of -0.8% between 2009-2013, to reach a total of 113.3 thousand hotels in
2013. The industry's volume is expected to fall to 107.3 thousand hotels by the end of 2018, representing a CARC of -
1.1% for the 2013-2018 period.
The leisure segment was the industry's most lucrative in 2013, with total revenues of $110.9bn, equivalent to 73.1% of
the industry's overall value. The business segment contributed revenues of $40.8bn in 2013, equating to 26.9% of the
industry's aggregate value.
The performance of the industry is forecast to accelerate, with an anticipated CAGR of 8.9% for the five-year period 2013
- 2018, which is expected to drive the industry to a value of $232.4bn by the end of 2018. Comparatively, the Japanese
and Chinese industries will grow with CAGRs of 3% and 12.3% respectively, over the same period, to reach respective
values of $47.8bn and $124.9bn in 2018.
Asia-Pacific - Hotels & Motels 0200 - 0520 - 2013
© MARKETLINE THIS PROFILE IS A LICENSED PRODUCT AND IS NOT TO BE PHOTOCOPIED Page | 8
MARKET DATA
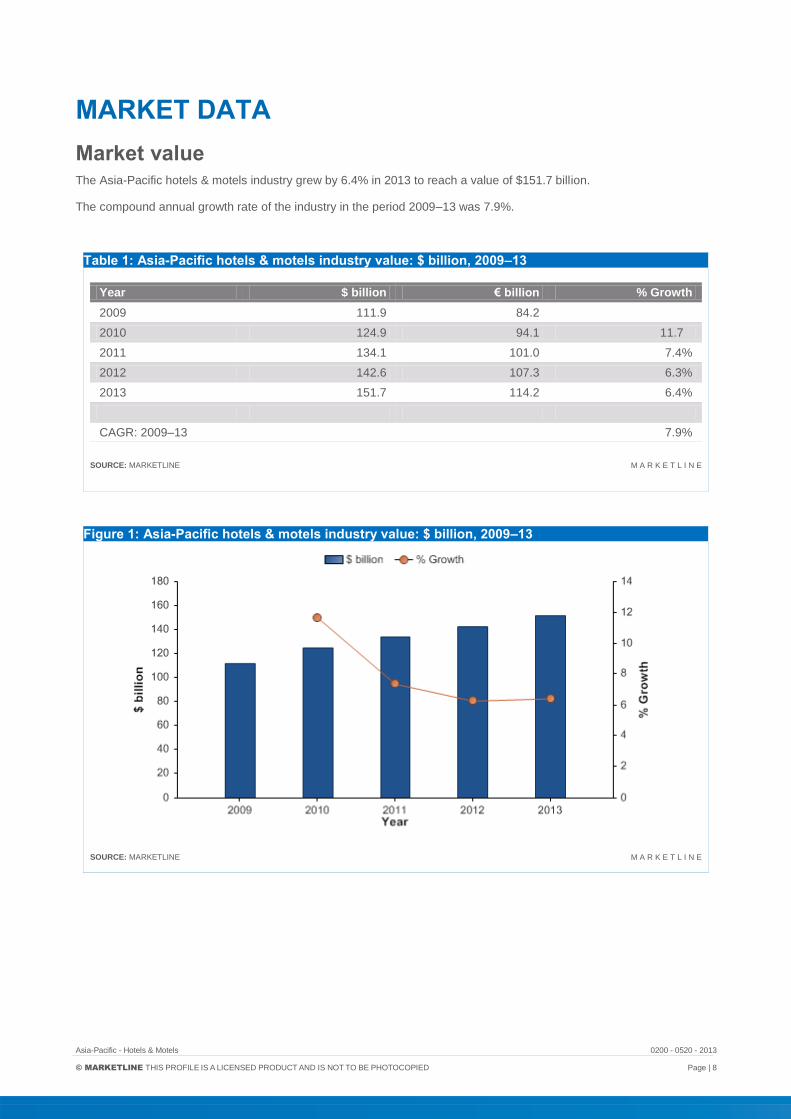
Market value The Asia-Pacific hotels & motels industry grew by 6.4% in 2013 to reach a value of $151.7 billion.
The compound annual growth rate of the industry in the period 2009–13 was 7.9%.
Table 1: Asia-Pacific hotels & motels industry value: $ billion, 2009–13
Year $ billion € billion % Growth
2009 111.9 84.2
2010 124.9 94.1 11.7
2011 134.1 101.0 7.4%
2012 142.6 107.3 6.3%
2013 151.7 114.2 6.4%
CAGR: 2009–13 7.9%
SOURCE: MARKETLINE M A R K E T L I N E
Figure 1: Asia-Pacific hotels & motels industry value: $ billion, 2009–13
SOURCE: MARKETLINE M A R K E T L I N E

Asia-Pacific - Hotels & Motels 0200 - 0520 - 2013
© MARKETLINE THIS PROFILE IS A LICENSED PRODUCT AND IS NOT TO BE PHOTOCOPIED Page | 9
Market volume The Asia-Pacific hotels & motels industry shrank by 1.7% in 2013 to reach a volume of 113.3 units.
The compound annual rate of change of the industry in the period 2009–13 was -0.8%.
Table 2: Asia–Pacific hotels & motels industry volume: units, 2009–13
Year units % Growth
2009 117.0
2010 116.2 (0.7%)
2011 114.5 (1.5%)
2012 115.2 0.6%
2013 113.3 (1.7%)
CAGR: 2009–13 (0.8%)
SOURCE: MARKETLINE M A R K E T L I N E
Figure 2: Asia–Pacific hotels & motels industry volume: units, 2009–13
SOURCE: MARKETLINE M A R K E T L I N E
Asia-Pacific - Hotels & Motels 0200 - 0520 - 2013
© MARKETLINE THIS PROFILE IS A LICENSED PRODUCT AND IS NOT TO BE PHOTOCOPIED Page | 10
MARKET SEGMENTATION
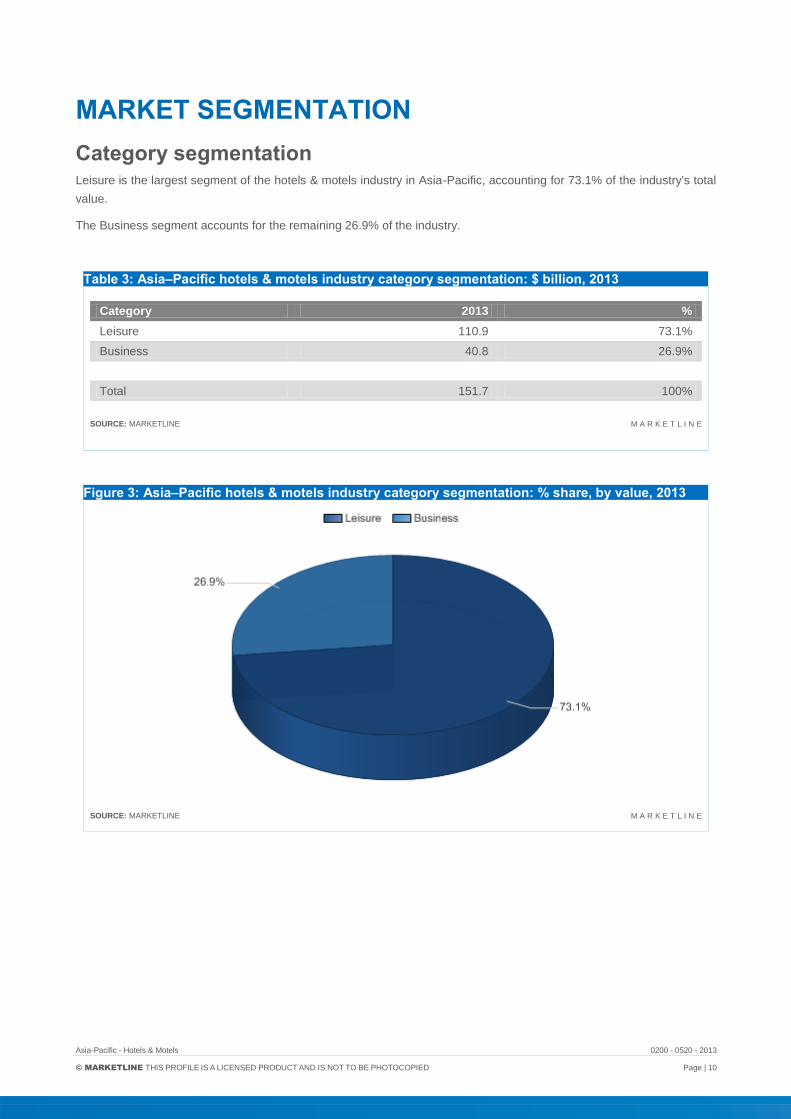
Category segmentation Leisure is the largest segment of the hotels & motels industry in Asia-Pacific, accounting for 73.1% of the industry's total
value.
The Business segment accounts for the remaining 26.9% of the industry.
Table 3: Asia–Pacific hotels & motels industry category segmentation: $ billion, 2013
Category 2013 %
Leisure 110.9 73.1%
Business 40.8 26.9%
Total 151.7 100%
SOURCE: MARKETLINE M A R K E T L I N E
Figure 3: Asia–Pacific hotels & motels industry category segmentation: % share, by value, 2013
SOURCE: MARKETLINE M A R K E T L I N E
Asia-Pacific - Hotels & Motels 0200 - 0520 - 2013
© MARKETLINE THIS PROFILE IS A LICENSED PRODUCT AND IS NOT TO BE PHOTOCOPIED Page | 11
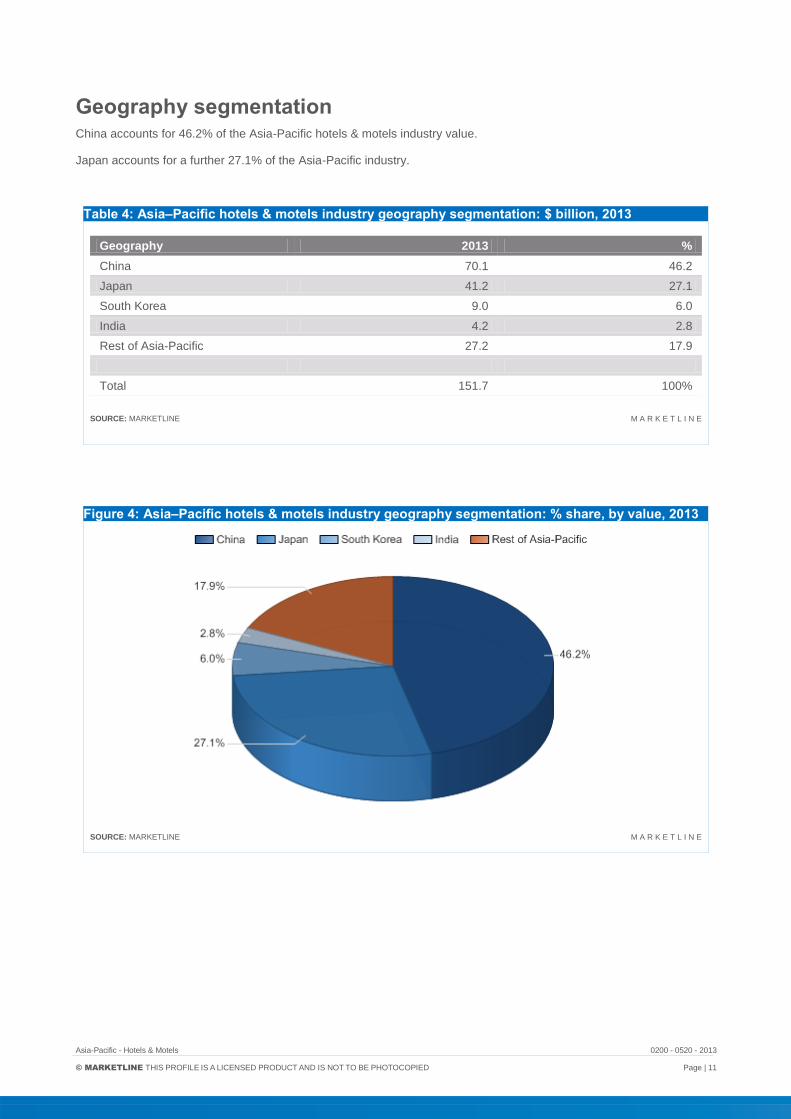
Geography segmentation China accounts for 46.2% of the Asia-Pacific hotels & motels industry value.
Japan accounts for a further 27.1% of the Asia-Pacific industry.
Table 4: Asia–Pacific hotels & motels industry geography segmentation: $ billion, 2013
Geography 2013 %
China 70.1 46.2
Japan 41.2 27.1
South Korea 9.0 6.0
India 4.2 2.8
Rest of Asia-Pacific 27.2 17.9
Total 151.7 100%
SOURCE: MARKETLINE M A R K E T L I N E
Figure 4: Asia–Pacific hotels & motels industry geography segmentation: % share, by value, 2013
SOURCE: MARKETLINE M A R K E T L I N E
Asia-Pacific - Hotels & Motels 0200 - 0520 - 2013
© MARKETLINE THIS PROFILE IS A LICENSED PRODUCT AND IS NOT TO BE PHOTOCOPIED Page | 12
MARKET OUTLOOK
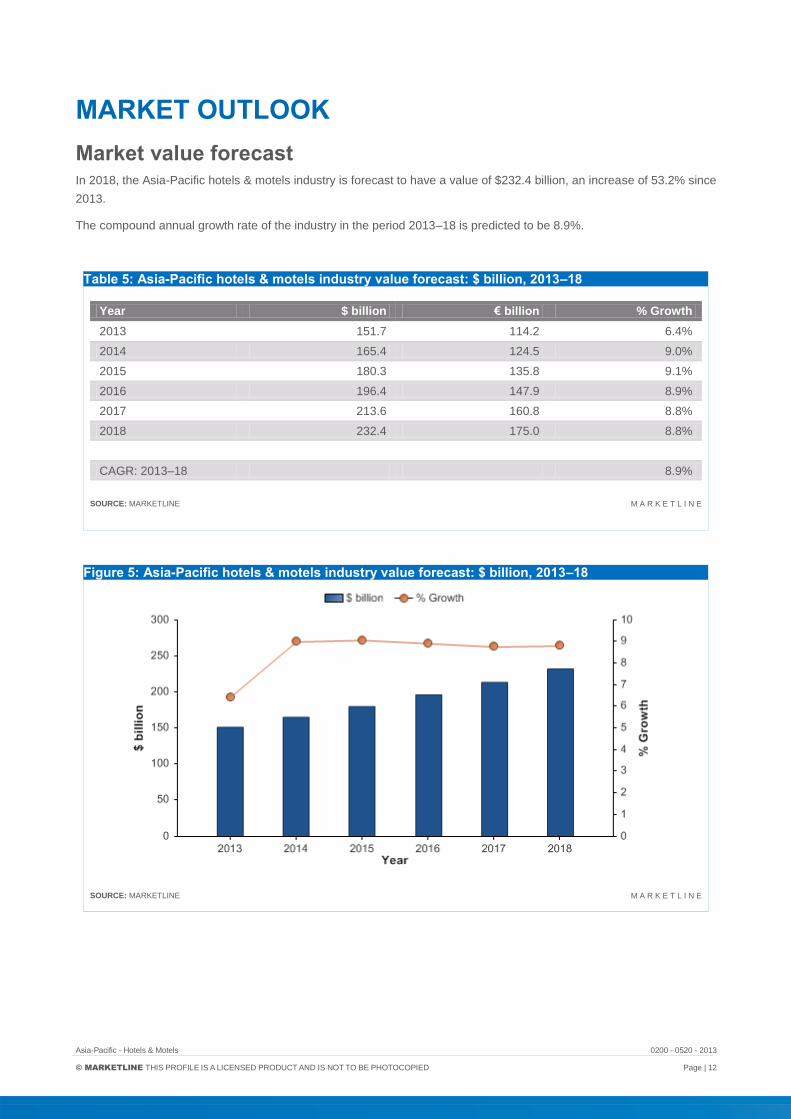
Market value forecast In 2018, the Asia-Pacific hotels & motels industry is forecast to have a value of $232.4 billion, an increase of 53.2% since
2013.
The compound annual growth rate of the industry in the period 2013–18 is predicted to be 8.9%.
Table 5: Asia-Pacific hotels & motels industry value forecast: $ billion, 2013–18
Year $ billion € billion % Growth
2013 151.7 114.2 6.4%
2014 165.4 124.5 9.0%
2015 180.3 135.8 9.1%
2016 196.4 147.9 8.9%
2017 213.6 160.8 8.8%
2018 232.4 175.0 8.8%
CAGR: 2013–18 8.9%
SOURCE: MARKETLINE M A R K E T L I N E
Figure 5: Asia-Pacific hotels & motels industry value forecast: $ billion, 2013–18
SOURCE: MARKETLINE M A R K E T L I N E

Asia-Pacific - Hotels & Motels 0200 - 0520 - 2013
© MARKETLINE THIS PROFILE IS A LICENSED PRODUCT AND IS NOT TO BE PHOTOCOPIED Page | 13
Market volume forecast In 2018, the Asia-Pacific hotels & motels industry is forecast to have a volume of 107.3 units, a decrease of 5.3% since
2013.
The compound annual rate of change of the industry in the period 2013–18 is predicted to be -1.1%.
Table 6: Asia–Pacific hotels & motels industry volume forecast: units, 2013–18
Year units % Growth
2013 113.3 (1.7%)
2014 111.9 (1.2%)
2015 110.5 (1.3%)
2016 109.2 (1.1%)
2017 108.2 (1.0%)
2018 107.3 (0.8%)
CAGR: 2013–18 (1.1%)
SOURCE: MARKETLINE M A R K E T L I N E
Figure 6: Asia–Pacific hotels & motels industry volume forecast: units, 2013–18
SOURCE: MARKETLINE M A R K E T L I N E

Asia-Pacific - Hotels & Motels 0200 - 0520 - 2013
© MARKETLINE THIS PROFILE IS A LICENSED PRODUCT AND IS NOT TO BE PHOTOCOPIED Page | 14
FIVE FORCES ANALYSIS
The hotels & motels market will be analyzed taking hotel and motel operators as players. The key buyers will be taken as
consumers, and property owners, interior designers, and information and computer technology manufacturers as the key
suppliers.
Summary
Figure 7: Forces driving competition in the hotels & motels industry in Asia-Pacific, 2013
SOURCE: MARKETLINE M A R K E T L I N E
The hotels and motels industry is dominated by large international players, who compete intensely for a share of the
market amongst themselves and with numerous smaller independent players.
Within the hotels and motels industry, where switching costs are negligible and competing on price alone is no longer a
key to success, brand recognition and innovation helps to attract first-time customers as well as repeat business. Buyers
include corporate and leisure customers.
Suppliers include providers of various goods and services, as well as a qualified workforce. Due to a high reliance on
sophisticated technology systems and the growing importance of mobile communication channels, some suppliers may
exert strong supplier power.
A new substitute in the form of private rentals, widely available through online services such as Airbnb and FlipKey, is a
potential threat to the industry.
Globalization is an important key driver within the industry, with emerging and developing markets offering significant
opportunities; however, such expansion also involves employing various business strategies to account for cultural and
regulatory differences, resulting in extra costs.
Political disturbances have hit some of these emerging markets, such as Tunisia and Egypt, which had previously
provided strong areas for growth. These events may have upset consumer confidence. How quickly these industries
recover remains to be seen, but the currently volatile nature of the tourism industry as a whole, will directly affect the
hotel and motels industry until confidence in the global economy is restored.

Asia-Pacific - Hotels & Motels 0200 - 0520 - 2013
© MARKETLINE THIS PROFILE IS A LICENSED PRODUCT AND IS NOT TO BE PHOTOCOPIED Page | 15
Buyer power
Figure 8: Drivers of buyer power in the hotels & motels industry in Asia-Pacific, 2013
SOURCE: MARKETLINE M A R K E T L I N E
Within the hotels & motels industry, which is both mature and very competitive, brand recognition is important to attract
consumers. A strong brand image helps to attract first-time customers as well as repeat business, as switching costs are
negligible in this industry. Differentiation between brands becomes important, as one particular brand becomes
synonymous with quality, price or a specific target age group for example. Major players therefore have a wide portfolio
of brands ranging from budget to luxury hotels.
Buyers are generally price sensitive, except in the premium market. Innovation is also vitally important in attracting
customers, as competing on price alone can be difficult, particularly when price is closely linked to a buyer’s perception
of quality. In the premium segment, companies can attract customers with better security and more facilities, such as
spas, gyms and integrating hotels into golf complexes. Larger companies have implemented loyalty schemes, by offering
a points system or air miles to regular customers, which reduces buyer power.
As customers are numerous and mostly small in size, their buyer power is reduced, since the impact of losing one
customer is not a significant threat to business. However, as many of the countries with a heavy reliance on the tourism
industry have discovered, the reduction in the number of holiday makers and overall traveler numbers means that buyer
power has increased, as consumers have more options available, often at a lower price point. Furthermore, the wide
visibility of online reviews and the ability to cancel easily online gives buyers greater power. Corporate buyers are greater
in size and therefore have more power through their financial muscle.
Over two thirds of buyers can be classed as leisure customers. This means that for the majority of buyers, hotels and
motels are a dispensable service that they do not necessarily need, particularly during economic downturns, thereby
increasing buyer power.
As buyers are the final consumers, forwards integration of players is not an issue. The backwards integration of buyers
however, is a potential factor given the increasing popularity of online services such as Airbnb and FlipKey, which allow
the general public to rent their own homes or spare rooms.
Overall, buyer power is moderate.

Asia-Pacific - Hotels & Motels 0200 - 0520 - 2013
© MARKETLINE THIS PROFILE IS A LICENSED PRODUCT AND IS NOT TO BE PHOTOCOPIED Page | 16
Supplier power
Figure 9: Drivers of supplier power in the hotels & motels industry in Asia-Pacific, 2013
SOURCE: MARKETLINE M A R K E T L I N E
Suppliers in this industry are defined as property owners, developers and real estate companies, interior design and
furnishing companies, architects, management and training service providers, marketing companies, industry
consultants, and information and computer technology (ICT) manufacturers.
Real estate companies are often much smaller companies than hotel and motel operators and rather than being
globalized, they are usually local to the property they develop, which reduces their financial muscle and ability to
negotiate favorable contracts. Hotels can also integrate backwards and operate their own real estate business.
Nevertheless, switching properties is costly and suppliers can differentiate themselves in terms of construction quality.
The quality and availability of supplier services and equipment is essential to the hotel and motel industry. Hotel
operators are reliant upon sophisticated technology and systems, including technology utilized for property management,
procurement and reservation systems. Applications, databases and networks must integrate easily with each other and
third-party systems to facilitate collaborations with partners. The growing importance of the mobile channel is clear. The
technology platforms used by hospitality companies must support and enable all user interactions to integrate in the
future, from phones to fax machines to personal computers to mobiles. This strengthens supplier power. Additionally,
those supplying technology are not wholly reliant on the hotel industry due to the wide applicability of technology
systems.
The industry is also labor intensive. Staff costs are significant as success in the hotel industry is strongly influenced by
the quality of the service provided, which strengthens supplier power. However, advances in check-in and booking
technologies have resulted in the requirement for fewer staff overall.
Suppliers are not likely to forwards integrate on a large scale due to the lack of synergies between their core businesses
and the hotel & motel industry.
Supplier power is assessed as moderate overall.

Asia-Pacific - Hotels & Motels 0200 - 0520 - 2013
© MARKETLINE THIS PROFILE IS A LICENSED PRODUCT AND IS NOT TO BE PHOTOCOPIED Page | 17
New entrants
Figure 10: Factors influencing the likelihood of new entrants in the hotels & motels industry in Asia-Pacific, 2013
SOURCE: MARKETLINE M A R K E T L I N E
The hotels & motels industry is strongly influenced by travel and tourism trends. The situation within the industry has
changed significantly in recent years. The business used to be strong and the biggest challenge was finding space to
book. In recent times, many hotel and motel operators are faced with the challenge of finding customers. The recent
global economic downturn had an adverse effect on the industry’s performance and most hoteliers are searching for
demand generators and are relying on direct sales to impact revenues and fill the significant void left by the ailing
economy. This may act as a deterrent for newcomers; however, the growth forecast is positive, which may boost the risk
of new entrants.
It is possible to enter the industry in a relatively low-key way by opening a small, independent hotel or motel as a sole
proprietor, with suppliers being easily accessible. However, the industry is capital intensive, and for a large-scale
entrance, upfront investment in buildings, décor and furnishings, ICT infrastructure and staff is expensive. In a highly
competitive business, conducting operations using all the latest technology, as well as constantly developing the tools
and skills required, is essential (e.g. allowing travelers to check in to hotel rooms remotely). More demanding customers
also want to engage with a hotel across all touch points (i.e. text, email, and social media) where appropriate. Intellectual
property around technology is therefore becoming more important in the industry. Furthermore, major players are able to
exploit the power of their brands in order to create alliances with airlines and travel agents. The franchise model of many
large chains also restricts the number of independent competitors and gives franchisees a fixed cost advantage.
As tourism is not a vital consumer good, it will tend to be cyclical and travelers are increasingly expecting bargain rates
while refusing to tolerate lapses in quality and service. To sustain revenue growth in the premium market, operating a
chain of hotels is often an important strategy as it reduces dependence on tourism in any particular location. However, in
order to open an international chain of hotels, regulations in terms of real estate and buying abroad need to be taken into
consideration and can therefore be restrictive in some countries. The purchase, leasing, and management of property
may involve legal and financial complexities, necessitating spending on professional services.

Asia-Pacific - Hotels & Motels 0200 - 0520 - 2013
© MARKETLINE THIS PROFILE IS A LICENSED PRODUCT AND IS NOT TO BE PHOTOCOPIED Page | 18
Globalization is an important key driver within the industry, with emerging markets, i.e. Russia, India and China, offering
significant opportunities, but it also involves employing various business strategies and extra costs. For example,
customers from China will search for, plan and book a hotel in a different way to customers from Russia. The notion of
brand integrity is crucial: hotels will need to supply consistent service in a global environment, while adapting to support
customers with new cultural backgrounds and sensitivities in local markets. Some companies have been able to develop
a certain business model to avoid many of these extra costs; however, a completely new entrant might not have
sufficient scale economies to attempt this. Some companies, such as Marriott, have developed business models
involving third parties dealing with its property, which has allowed it to bring costs down.
Difficulties in obtaining ISO accreditation and complying with national regulations in areas such as food safety and
information security can also be barriers for new entrants.
Overall, the likelihood of new entrants is moderate.

Asia-Pacific - Hotels & Motels 0200 - 0520 - 2013
© MARKETLINE THIS PROFILE IS A LICENSED PRODUCT AND IS NOT TO BE PHOTOCOPIED Page | 19
Threat of substitutes
Figure 11: Factors influencing the threat of substitutes in the hotels & motels industry in Asia-Pacific, 2013
SOURCE: MARKETLINE M A R K E T L I N E
Substitutes to hotels and motels include alternative forms of leisure accommodation, such as camping facilities or
recreational vehicles, or informal accommodation with friends and family. Switching costs range from negligible to high
(e.g. the purchase price of a recreational vehicle).
While all these substitutes offer the same basic function of a place to stay, up-market hotels and motels often provide
added benefits, such as spas and restaurants. Additionally, whilst some of these substitutes offer reduced costs to hotels
and can undercut the hotels and motels industry, this switch is often out of necessity rather than choice, so when
consumers are in a more generally affluent position, the threat from substitutes is likely to decline.
A more recent substitute that is becoming increasingly threatening is the ability to stay with local people in their own
homes or apartments, either by renting a room or the entire property for privacy. Online services in this area include
Airbnb, FlipKey and the more informal Couchsurfing. The International Hotel & Restaurant Association describes these
services as partially ‘unfair’ competition and a hot topic to be monitored.
The threat of substitutes is assessed as moderate.

Asia-Pacific - Hotels & Motels 0200 - 0520 - 2013
© MARKETLINE THIS PROFILE IS A LICENSED PRODUCT AND IS NOT TO BE PHOTOCOPIED Page | 20
Degree of rivalry
Figure 12: Drivers of degree of rivalry in the hotels & motels industry in Asia-Pacific, 2013
SOURCE: MARKETLINE M A R K E T L I N E
The industry includes several large hotel operators, such as Accor and Wyndham Worldwide, with most of the leading
players are operating several different branded chains. However, there are also a large number of independent players
present in the industry. Larger number of players means increased competition.
Many larger operators have diversified to some extent and own additional businesses, such as casinos, restaurants and
shops. To attract and sustain more business, operators try to offer more complex packages and value-added services,
such as free breakfast and parking or a free third night. Recently, a rising popularity of lifestyle hotels amongst major
chains has been observed. Such hotels cater to the conscientious traveler's demands for eco-friendly practices, social
responsibility, and affordable style.
The largest hotel and motel operators are fairly well insulated from unpredictable market conditions by geographical
diversification. However, others are based largely or exclusively in one country.
Exit barriers in the industry are fairly high because most of the major tangible assets are highly specific to their industry,
and thus harder to divest. This is a likely motivator for many of the global leaders to pursue expansion through
franchising and hotel management services, as well as through the acquisition of properties. Many big chains have
adopted an asset-light business model in order to fuel expansion; selling off assets has allowed large competitors to
raise capital and invest in expanded operations, which again intensifies the competitive nature of the industry.
Overall, rivalry in the industry is moderate.

Asia-Pacific - Hotels & Motels 0200 - 0520 - 2013
© MARKETLINE THIS PROFILE IS A LICENSED PRODUCT AND IS NOT TO BE PHOTOCOPIED Page | 21
LEADING COMPANIES
Accor SA
Table 7: Accor SA: key facts
Head office: Immeuble Odyssey, 110, avenue de France, Paris 75210, FRA
Telephone: 33 1 45 38 86 00
Website: www.accor.com
Financial year-end: December
Ticker: AC
Stock exchange: Paris
SOURCE: COMPANY WEBSITE M A R K E T L I N E
Accor SA (Accor) is a major global hotel operator. The group operates in 92 countries across the globe with Europe
being the largest center for its operations, with nearly 3,576 hotels, and 461,719 rooms as of December 2013. In 2013,
Accor operated 282,255 rooms in Europe; 109,169 rooms in the Asia-Pacific; 38,143 rooms in Latin America and the
Caribbean; and 27,436 rooms in the Middle East & Africa.
Accor operates through two segments: hotels and other businesses.
The hotels segment is further divided in to the luxury, upscale, mid-scale, and economy sub-segments.
The luxury hotels sub-segment comprises the Sofitel range; upscale includes Pullman, Sebel, Grand Mercure, and
MGallery brands; midscale is comprised of Novotel, Mercure and Adagio hotels, while the economy hotels sub-segment
consists of the Formule 1, HotelF1, ibis budget, Adagio access, ibis and ibis Styles brands.
The group's other businesses segment consists of the corporate departments and casinos business.
Key Metrics
The company recorded revenues of $7,349m in the fiscal year ending December 2013, a decrease of 2.0% compared to
fiscal 2012. Its net income was $167m in fiscal 2013, compared to a net loss of $795m in the preceding year.
Table 8: Accor SA: key financials ($)
$ million 2009 2010 2011 2012 2013
Revenues 7,287.7 7,895.7 8,097.5 7,498.8 7,348.8
Net income (loss) (374.3) 4,778.8 35.8 (795.1) 167.3
Total assets 15,592.3 11,519.7 10,619.7 10,035.6 9,371.8
Total liabilities 11,272.8 6,277.5 5,617.8 6,020.0 5,713.4
SOURCE: COMPANY FILINGS M A R K E T L I N E

Asia-Pacific - Hotels & Motels 0200 - 0520 - 2013
© MARKETLINE THIS PROFILE IS A LICENSED PRODUCT AND IS NOT TO BE PHOTOCOPIED Page | 22
Table 9: Accor SA: key financials (€)
€ million 2009 2010 2011 2012 2013
Revenues 5,490.0 5,948.0 6,100.0 5,649.0 5,536.0
Net income (loss) (282.0) 3,600.0 27.0 (599.0) 126.0
Total assets 11,746.0 8,678.0 8,000.0 7,560.0 7,060.0
Total liabilities 8,492.0 4, 29.0 4,232.0 4,535.0 4,304.0
SOURCE: COMPANY FILINGS M A R K E T L I N E
Table 10: Accor SA: key financial ratios
Ratio 2009 2010 2011 2012 2013
Profit margin (5.1%) 60.5% 0.4% (10.6%) 2.3%
Revenue growth (28.9%) 8.3% 2.6% (7.4%) (2.0%)
Asset growth 2.9% (26.1%) (7.8%) (5.5%) (6.6%)
Liabilities growth 8.0% (44.3%) (10.5%) 7.2% (5.1%)
Debt/asset ratio 72.3% 54.5% 52.9% 60.0% 61.0%
Return on assets (2.4%) 35.3% 0.3% (7.7%) 1.7%
SOURCE: COMPANY FILINGS M A R K E T L I N E
Figure 13: Accor SA: revenues & profitability
SOURCE: COMPANY FILINGS M A R K E T L I N E

Asia-Pacific - Hotels & Motels 0200 - 0520 - 2013
© MARKETLINE THIS PROFILE IS A LICENSED PRODUCT AND IS NOT TO BE PHOTOCOPIED Page | 23
Figure 14: Accor SA: assets & liabilities
SOURCE: COMPANY FILINGS M A R K E T L I N E
Asia-Pacific - Hotels & Motels 0200 - 0520 - 2013
© MARKETLINE THIS PROFILE IS A LICENSED PRODUCT AND IS NOT TO BE PHOTOCOPIED Page | 24
Starwood Hotels & Resorts Worldwide, Inc.
Table 11: Starwood Hotels & Resorts Worldwide, Inc.: key facts
Head office: One StarPoint, Stamford, Connecticut 06902, USA
Telephone: 1 203 964 6000
Website: www.starwood.com
Financial year-end: December
Ticker: HOT
Stock exchange: New York
SOURCE: COMPANY WEBSITE M A R K E T L I N E
Starwood Hotels & Resorts Worldwide (Starwood) is a global operator of hotels and resorts primarily in the luxury and
upscale segment of the lodging industry. The company conducts its hotel and leisure business both directly and through
subsidiaries. The company operates in the Americas, Europe and Asia.
Previously, the company operated through two segments: hotels; and vacation ownership and residential. Upon the
completion of an internal management reorganization related to the hotel segment in July 2012, Starwood segregated its
hotel segment into three separate segments: Americas, EAME, and Asia Pacific.
The company's hotel business segment operates primarily in the luxury and upscale market segment representing a
worldwide network of owned, leased and consolidated joint venture hotels and resorts, which are operated under the
company's proprietary brand names. As of December 31, 2013, the company's network of hotels and resorts consisted
of approximately 1,175 hotels with approximately 346,800 rooms, of which 47 hotels are owned or leased or in which the
company has a majority equity interest, 563 hotels are managed by the company on behalf of third-party owners and 551
hotels are franchised.
Starwood's key hotel brands include St. Regis, The Luxury Collection, W Hotels, Westin, Le Meridien, Sheraton, Four
Points, Aloft and Element.
The vacation ownership and residential segment is engaged in the development, ownership and operation of vacation
ownership resorts, marketing and selling of vacation ownership interests, purchase financing, licensing fees from
branded condominiums and residences, and sale of residential units. As of December 31, 2012, the company owned 14
vacation ownership resorts and residential properties in the US, Mexico and the Bahamas.
In addition, Starwood had one wholly-owned residential development in Bal Harbour, Florida.
Key Metrics
The company recorded revenues of $6,115m in the fiscal year ending December 2013, a decrease of 3.3% compared to
fiscal 2012. Its net income was $635m in fiscal 2013, compared to a net income of $562m in the preceding year.
Asia-Pacific - Hotels & Motels 0200 - 0520 - 2013
© MARKETLINE THIS PROFILE IS A LICENSED PRODUCT AND IS NOT TO BE PHOTOCOPIED Page | 25
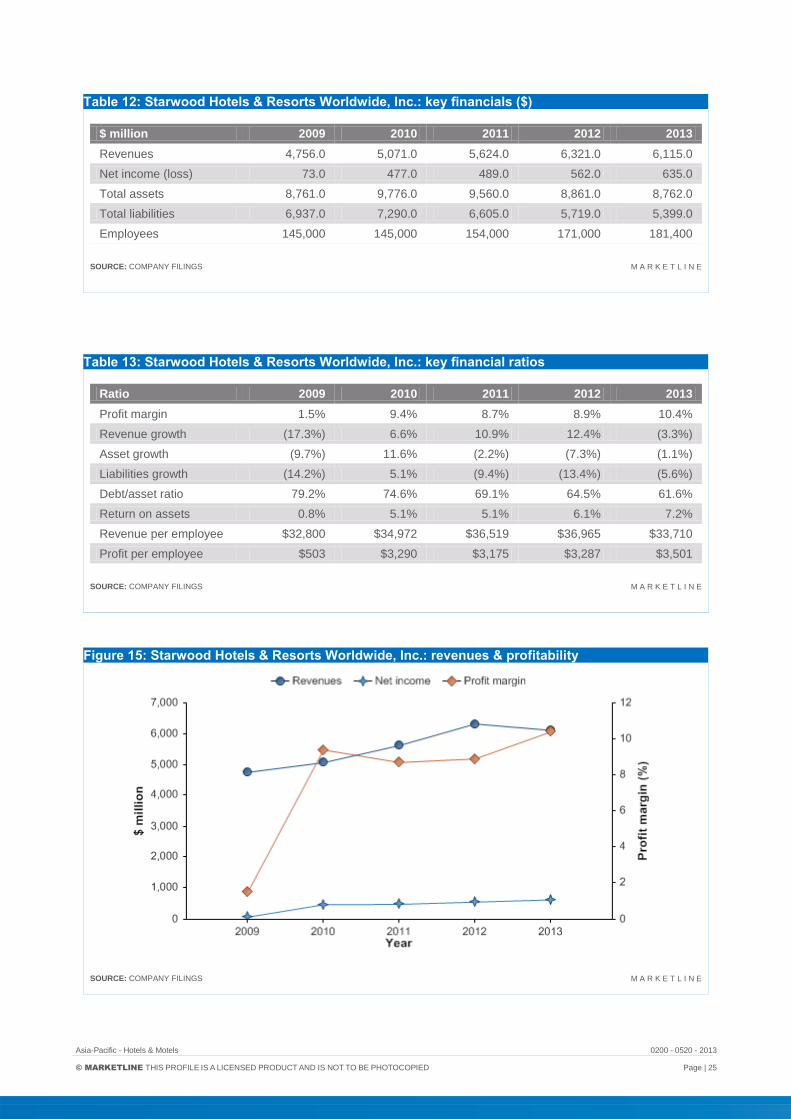
Table 12: Starwood Hotels & Resorts Worldwide, Inc.: key financials ($)
$ million 2009 2010 2011 2012 2013
Revenues 4,756.0 5,071.0 5,624.0 6,321.0 6,115.0
Net income (loss) 73.0 477.0 489.0 562.0 635.0
Total assets 8,761.0 9,776.0 9,560.0 8,861.0 8,762.0
Total liabilities 6,937.0 7,290.0 6,605.0 5,719.0 5,399.0
Employees 145,000 145,000 154,000 171,000 181,400
SOURCE: COMPANY FILINGS M A R K E T L I N E
Table 13: Starwood Hotels & Resorts Worldwide, Inc.: key financial ratios
Ratio 2009 2010 2011 2012 2013
Profit margin 1.5% 9.4% 8.7% 8.9% 10.4%
Revenue growth (17.3%) 6.6% 10.9% 12.4% (3.3%)
Asset growth (9.7%) 11.6% (2.2%) (7.3%) (1.1%)
Liabilities growth (14.2%) 5.1% (9.4%) (13.4%) (5.6%)
Debt/asset ratio 79.2% 74.6% 69.1% 64.5% 61.6%
Return on assets 0.8% 5.1% 5.1% 6.1% 7.2%
Revenue per employee $32,800 $34,972 $36,519 $36,965 $33,710
Profit per employee $503 $3,290 $3,175 $3,287 $3,501
SOURCE: COMPANY FILINGS M A R K E T L I N E
Figure 15: Starwood Hotels & Resorts Worldwide, Inc.: revenues & profitability
SOURCE: COMPANY FILINGS M A R K E T L I N E

Asia-Pacific - Hotels & Motels 0200 - 0520 - 2013
© MARKETLINE THIS PROFILE IS A LICENSED PRODUCT AND IS NOT TO BE PHOTOCOPIED Page | 26
Figure 16: Starwood Hotels & Resorts Worldwide, Inc.: assets & liabilities
SOURCE: COMPANY FILINGS M A R K E T L I N E
Asia-Pacific - Hotels & Motels 0200 - 0520 - 2013
© MARKETLINE THIS PROFILE IS A LICENSED PRODUCT AND IS NOT TO BE PHOTOCOPIED Page | 27
Wyndham Worldwide Corporation
Table 14: Wyndham Worldwide Corporation: key facts
Head office: 22 Sylvan Way, Parsippany, New Jersey 07054, USA
Telephone: 1 973 753 6000
Website: www.wyndhamworldwide.com
Financial year-end: December
Ticker: WYN
Stock exchange: New York
SOURCE: COMPANY WEBSITE M A R K E T L I N E
Wyndham Worldwide Corporation (Wyndham Worldwide) is a global provider of hospitality products and services. The
company offers customers a choice of hospitality products and services across various price ranges through its portfolio
of 30 brands. It primarily operates in the Americas, Europe and Asia.
The company operates through three business segments: vacation ownership, vacation exchange and rentals, and
lodging.
The vacation ownership segment markets and sells vacation ownership interests to individual consumers, provides
consumer financing in connection with the sale of vacation ownership interests and offers management services at
resorts. The company has developed approximately 190 vacation ownership resorts in the US, Canada, Mexico, the
Caribbean and the South Pacific that represent more than 23,500 individual vacation ownership units and over 915,000
owners of vacation ownership interests.
The vacation exchange and rentals segment provides vacation exchange products and services to holiday-makers; it
also provides access to distribution networks to resort developers, and owners of vacation properties. The company
offers vacation exchange services to approximately 3.7 million members through its 4,000 vacation ownership resorts
and has access to over 55,000 vacation properties.
The lodging segment franchises hotels in the upscale, midscale and economy segments of the industry and provides
hotel management services to owners of luxury, upscale and midscale hotels. The segment operates through 15 brands,
with approximately 7,490 hotels representing over 645,400 rooms in six continents. The lodging business franchise
operates under two models. In North America, the company employs a direct franchise model whereby it contracts with
and provides services and assistance directly to independent owner-operators of hotels. In other parts of the world, the
company employs either a direct franchise model or a master franchise model whereby it contracts with a third party to
build a franchise enterprise in the third party's country or region. The company's franchised hotels operate under lodging
brands including Wyndham Hotels and Resorts, Wingate by Wyndham, Hawthorn, Ramada, Baymont, Days Inn, Super
8, Microtel, Howard Johnson, TRYP by Wyndham, Dream Hotels, Night Hotels, Planet Hollywood, Travelodge and
Knights Inn.
Key Metrics
The company recorded revenues of $4,733m in the fiscal year ending December 2013, an increase of 9.3% compared to
fiscal 2012. Its net income was $432m in fiscal 2013, compared to a net income of $400m in the preceding year.
Asia-Pacific - Hotels & Motels 0200 - 0520 - 2013
© MARKETLINE THIS PROFILE IS A LICENSED PRODUCT AND IS NOT TO BE PHOTOCOPIED Page | 28
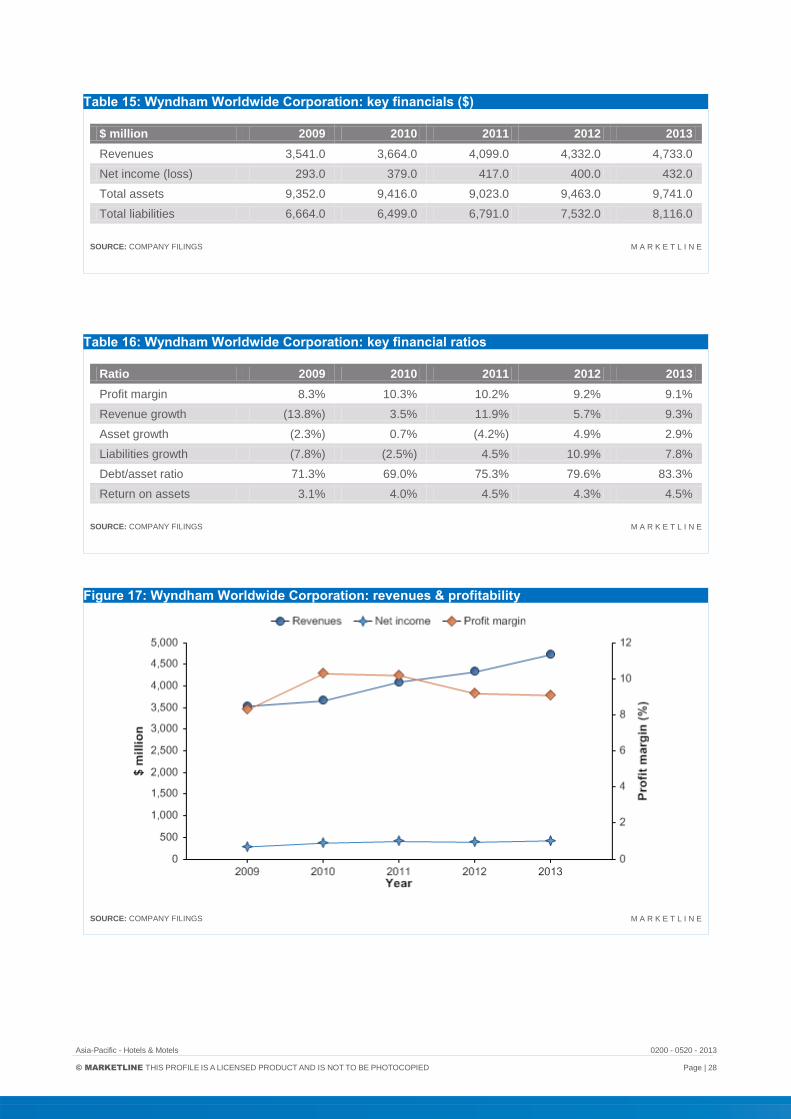
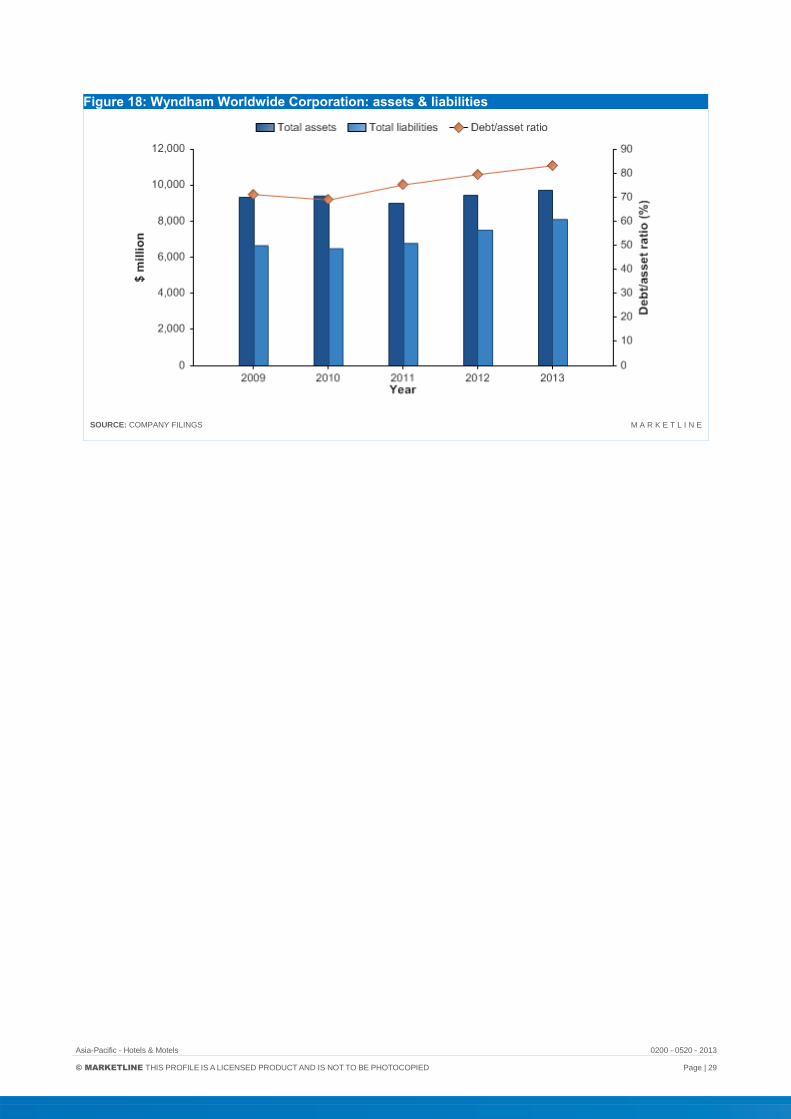
Table 15: Wyndham Worldwide Corporation: key financials ($)
$ million 2009 2010 2011 2012 2013
Revenues 3,541.0 3,664.0 4,099.0 4,332.0 4,733.0
Net income (loss) 293.0 379.0 417.0 400.0 432.0
Total assets 9,352.0 9,416.0 9,023.0 9,463.0 9,741.0
Total liabilities 6,664.0 6,499.0 6,791.0 7,532.0 8,116.0
SOURCE: COMPANY FILINGS M A R K E T L I N E
Table 16: Wyndham Worldwide Corporation: key financial ratios
Ratio 2009 2010 2011 2012 2013
Profit margin 8.3% 10.3% 10.2% 9.2% 9.1%
Revenue growth (13.8%) 3.5% 11.9% 5.7% 9.3%
Asset growth (2.3%) 0.7% (4.2%) 4.9% 2.9%
Liabilities growth (7.8%) (2.5%) 4.5% 10.9% 7.8%
Debt/asset ratio 71.3% 69.0% 75.3% 79.6% 83.3%
Return on assets 3.1% 4.0% 4.5% 4.3% 4.5%
SOURCE: COMPANY FILINGS M A R K E T L I N E
Figure 17: Wyndham Worldwide Corporation: revenues & profitability
SOURCE: COMPANY FILINGS M A R K E T L I N E
Asia-Pacific - Hotels & Motels 0200 - 0520 - 2013
© MARKETLINE THIS PROFILE IS A LICENSED PRODUCT AND IS NOT TO BE PHOTOCOPIED Page | 29
Figure 18: Wyndham Worldwide Corporation: assets & liabilities
SOURCE: COMPANY FILINGS M A R K E T L I N E
Asia-Pacific - Hotels & Motels 0200 - 0520 - 2013
© MARKETLINE THIS PROFILE IS A LICENSED PRODUCT AND IS NOT TO BE PHOTOCOPIED Page | 30
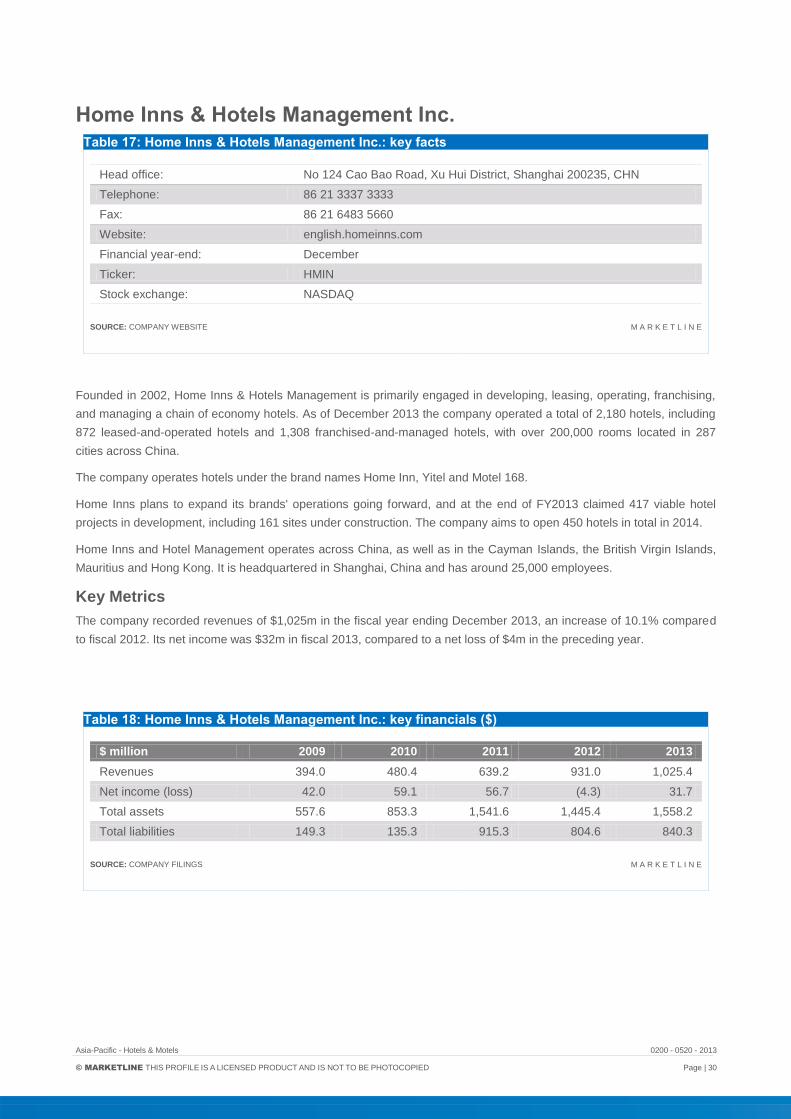
Home Inns & Hotels Management Inc.
Table 17: Home Inns & Hotels Management Inc.: key facts
Head office: No 124 Cao Bao Road, Xu Hui District, Shanghai 200235, CHN
Telephone: 86 21 3337 3333
Fax: 86 21 6483 5660
Website: english.homeinns.com
Financial year-end: December
Ticker: HMIN
Stock exchange: NASDAQ
SOURCE: COMPANY WEBSITE M A R K E T L I N E
Founded in 2002, Home Inns & Hotels Management is primarily engaged in developing, leasing, operating, franchising,
and managing a chain of economy hotels. As of December 2013 the company operated a total of 2,180 hotels, including
872 leased-and-operated hotels and 1,308 franchised-and-managed hotels, with over 200,000 rooms located in 287
cities across China.
The company operates hotels under the brand names Home Inn, Yitel and Motel 168.
Home Inns plans to expand its brands' operations going forward, and at the end of FY2013 claimed 417 viable hotel
projects in development, including 161 sites under construction. The company aims to open 450 hotels in total in 2014.
Home Inns and Hotel Management operates across China, as well as in the Cayman Islands, the British Virgin Islands,
Mauritius and Hong Kong. It is headquartered in Shanghai, China and has around 25,000 employees.
Key Metrics
The company recorded revenues of $1,025m in the fiscal year ending December 2013, an increase of 10.1% compared
to fiscal 2012. Its net income was $32m in fiscal 2013, compared to a net loss of $4m in the preceding year.
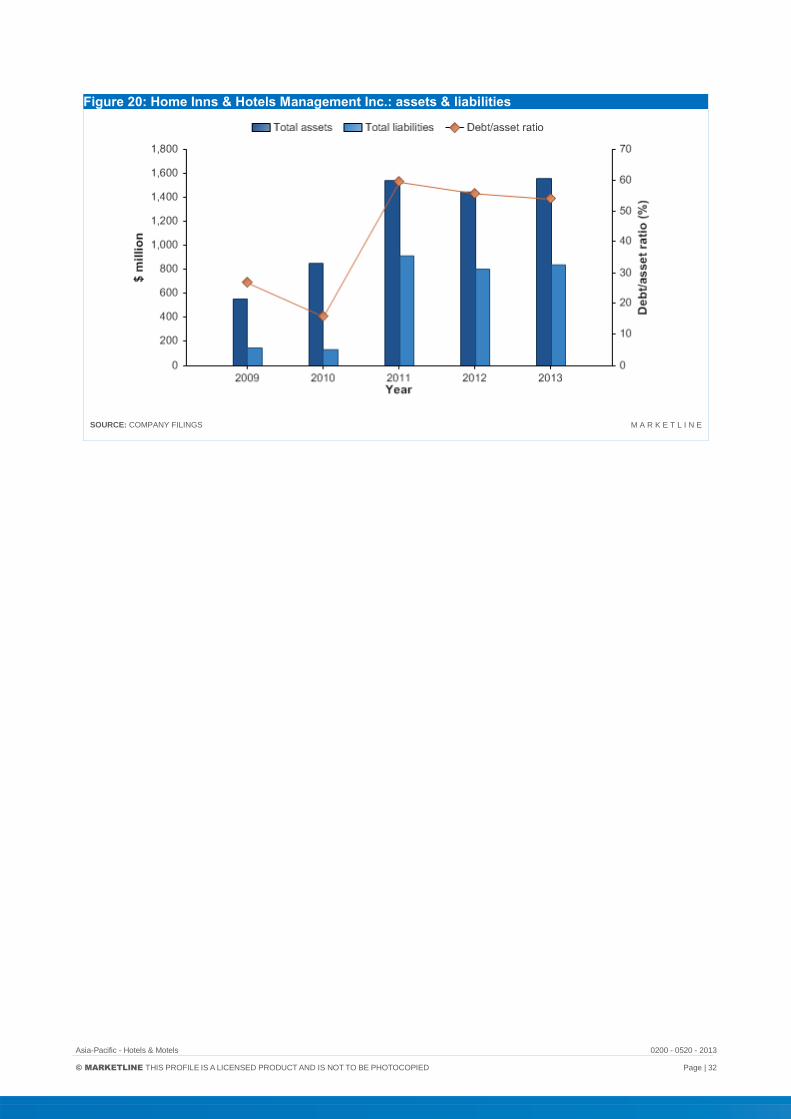
Table 18: Home Inns & Hotels Management Inc.: key financials ($)
$ million 2009 2010 2011 2012 2013
Revenues 394.0 480.4 639.2 931.0 1,025.4
Net income (loss) 42.0 59.1 56.7 (4.3) 31.7
Total assets 557.6 853.3 1,541.6 1,445.4 1,558.2
Total liabilities 149.3 135.3 915.3 804.6 840.3
SOURCE: COMPANY FILINGS M A R K E T L I N E

Asia-Pacific - Hotels & Motels 0200 - 0520 - 2013
© MARKETLINE THIS PROFILE IS A LICENSED PRODUCT AND IS NOT TO BE PHOTOCOPIED Page | 31
Table 19: Home Inns & Hotels Management Inc.: key financials (CNY)
CNY million 2009 2010 2011 2012 2013
Revenues 2,441.0 2,976.0 3,959.7 5,767.4 6,352.2
Net income (loss) 260.0 366.0 351.5 (26.8) 196.2
Total assets 3,454.0 5,286.0 9,549.8 8,954.0 9,652.7
Total liabilities 925.0 838.0 5,669.9 4,984.4 5,205.2
SOURCE: COMPANY FILINGS M A R K E T L I N E
Table 20: Home Inns & Hotels Management Inc.: key financial ratios
Ratio 2009 2010 2011 2012 2013
Profit margin 10.7% 12.3% 8.9% (0.5%) 3.1%
Revenue growth 38.7% 21.9% 33.1% 45.7% 10.1%
Asset growth 2.7% 53.0% 80.7% (6.2%) 7.8%
Liabilities growth (47.3%) (9.4%) 576.6% (12.1%) 4.4%
Debt/asset ratio 26.8% 15.9% 59.4% 55.7% 53.9%
Return on assets 7.6% 8.4% 4.7% (0.3%) 2.1%
SOURCE: COMPANY FILINGS M A R K E T L I N E
Figure 19: Home Inns & Hotels Management Inc.: revenues & profitability
SOURCE: COMPANY FILINGS M A R K E T L I N E
Asia-Pacific - Hotels & Motels 0200 - 0520 - 2013
© MARKETLINE THIS PROFILE IS A LICENSED PRODUCT AND IS NOT TO BE PHOTOCOPIED Page | 32
Figure 20: Home Inns & Hotels Management Inc.: assets & liabilities
SOURCE: COMPANY FILINGS M A R K E T L I N E

Asia-Pacific - Hotels & Motels 0200 - 0520 - 2013
© MARKETLINE THIS PROFILE IS A LICENSED PRODUCT AND IS NOT TO BE PHOTOCOPIED Page | 33
APPENDIX
Methodology MarketLine Industry Profiles draw on extensive primary and secondary research, all aggregated, analyzed, cross-
checked and presented in a consistent and accessible style.
Review of in-house databases – Created using 250,000+ industry interviews and consumer surveys and supported by
analysis from industry experts using highly complex modeling & forecasting tools, MarketLine’s in-house databases
provide the foundation for all related industry profiles
Preparatory research – We also maintain extensive in-house databases of news, analyst commentary, company
profiles and macroeconomic & demographic information, which enable our researchers to build an accurate market
overview
Definitions – Market definitions are standardized to allow comparison from country to country. The parameters of each
definition are carefully reviewed at the start of the research process to ensure they match the requirements of both the
market and our clients
Extensive secondary research activities ensure we are always fully up-to-date with the latest industry events and
trends
MarketLine aggregates and analyzes a number of secondary information sources, including:
- National/Governmental statistics
- International data (official international sources)
- National and International trade associations
- Broker and analyst reports
- Company Annual Reports
- Business information libraries and databases
Modeling & forecasting tools – MarketLine has developed powerful tools that allow quantitative and qualitative data to
be combined with related macroeconomic and demographic drivers to create market models and forecasts, which can
then be refined according to specific competitive, regulatory and demand-related factors
Continuous quality control ensures that our processes and profiles remain focused, accurate and up-to-date

Asia-Pacific - Hotels & Motels 0200 - 0520 - 2013
© MARKETLINE THIS PROFILE IS A LICENSED PRODUCT AND IS NOT TO BE PHOTOCOPIED Page | 34
Industry associations
International Hotel and Restaurant Association
87, rue Montbrillant, 1202 Geneva, CHE
Tel.: 44 22 734 80 41
Fax: 44 22 734 80 56
www.ih-ra.com
Related MarketLine research
Industry Profile
Global Hotels & Motels
Hotels & Motels in China
Hotels & Motels in Japan

MARKETLINE | 119 FARRINGDON ROAD | LONDON,
UNITED KINGDOM, EC1R 3DA
T: +44 161 238 4040 | F: +44 870 134 4371
df

Copyright of Hotels & Motels Industry Profile: Asia-Pacific is the property of MarketLine, aDatamonitor business and its content may not be copied or emailed to multiple sites or postedto a listserv without the copyright holder's express written permission. However, users mayprint, download, or email articles for individual use.