Ecology of Wintering Redheads (Aythya Americana) on the ...
155
Louisiana State University Louisiana State University LSU Digital Commons LSU Digital Commons LSU Historical Dissertations and Theses Graduate School 1991 Ecology of Wintering Redheads (Aythya Americana) on the Lower Ecology of Wintering Redheads (Aythya Americana) on the Lower Laguna Madre, Texas. Laguna Madre, Texas. Christine Anne Mitchell Louisiana State University and Agricultural & Mechanical College Follow this and additional works at: https://digitalcommons.lsu.edu/gradschool_disstheses Recommended Citation Recommended Citation Mitchell, Christine Anne, "Ecology of Wintering Redheads (Aythya Americana) on the Lower Laguna Madre, Texas." (1991). LSU Historical Dissertations and Theses. 5134. https://digitalcommons.lsu.edu/gradschool_disstheses/5134 This Dissertation is brought to you for free and open access by the Graduate School at LSU Digital Commons. It has been accepted for inclusion in LSU Historical Dissertations and Theses by an authorized administrator of LSU Digital Commons. For more information, please contact [email protected].
-
Upload
khangminh22 -
Category
Documents
-
view
5 -
download
0
Transcript of Ecology of Wintering Redheads (Aythya Americana) on the ...
Louisiana State University Louisiana State University
LSU Digital Commons LSU Digital Commons
LSU Historical Dissertations and Theses Graduate School
1991
Ecology of Wintering Redheads (Aythya Americana) on the Lower Ecology of Wintering Redheads (Aythya Americana) on the Lower
Laguna Madre, Texas. Laguna Madre, Texas.
Christine Anne Mitchell Louisiana State University and Agricultural & Mechanical College
Follow this and additional works at: https://digitalcommons.lsu.edu/gradschool_disstheses
Recommended Citation Recommended Citation Mitchell, Christine Anne, "Ecology of Wintering Redheads (Aythya Americana) on the Lower Laguna Madre, Texas." (1991). LSU Historical Dissertations and Theses. 5134. https://digitalcommons.lsu.edu/gradschool_disstheses/5134
This Dissertation is brought to you for free and open access by the Graduate School at LSU Digital Commons. It has been accepted for inclusion in LSU Historical Dissertations and Theses by an authorized administrator of LSU Digital Commons. For more information, please contact [email protected].

INFORMATION TO USERS
This manuscript has been reproduced from the microfilm master. UMI films the text directly from the original or copy submitted. Thus, some thesis and dissertation copies are in typewriter face, while others may be from any type of computer printer.
The quality of this reproduction is dependent upon the quality of the copy subm itted. Broken or indistinct print, colored or poor quality illustrations and photographs, print bleedthrough, substandard margins, and improper alignment can adversely affect reproduction.
In the unlikely event that the author did not send UM I a complete manuscript and there are missing pages, these will be noted. Also, if unauthorized copyright material had to be removed, a note will indicate the deletion.
Oversize m aterials (e.g., maps, drawings, charts) are reproduced by sectioning the original, beginning at the upper left-hand corner and continuing from left to right in equal sections with small overlaps. Each original is also photographed in one exposure and is included in reduced form at the back of the book.
Photographs included in the original manuscript have been reproduced xerographically in this copy. Higher quality 6" x 9" black and white photographic prints are available for any photographs or illustrations appearing in this copy for an additional charge. Contact UM I directly to order.
University Microfilms International A Bell & Howell Information C om pany
30 0 North Z e e b Road. Ann Arbor, Ml 4 8 1 0 6 -1 34 6 USA 3 1 3 /7 6 1 -4 7 0 0 8 0 0 /5 2 1 -0 6 0 0


Order Number 9200077
E cology o f w intering redheads (Aythya americana) on the lower Laguna M adre, Texas
Mitchell, Christine Anne, Ph.D.
The Louisiana State University and Agricultural and Mechanical Col., 1991
UMI300 N. Zeeb Rd.Ann Arbor, MI 48106


ECOLOGY OF WINTERING REDHEADS (AYTHYA AMERICANA) ON THE LOWER
LAGUNA MADRE, TEXAS
A Dissertation
Submitted to the Graduate Faculty of the Louisiana State University and
Agricultural and Mechanical College in partial fulfillment of the requirements for the degree of
Doctor of Philosophy
in
The School of Forestry, Wildlife, and Fisheries
byChristine Anne Mitchell
B.A., University of Colorado, Boulder, Colorado 1973
M.S., Corpus Christi State University, Corpus Christi, Texas 1985
May 1991

ACKNOWLEGMENTS
My Ph.D. program and this study on ecology of wintering redheads would not have been possible without the assistance of many individuals. I would like to thank Susan D. Haseltine for making my career development program within the U.S. Fish and Wildlife Service a reality. She instigated and persevered through all the paperwork, justifications, and probably many other obstacles that I know nothing about. I am grateful to James 0. Keith, Donald H. White, and Thomas W. Custer, all of the U.S. Fish and Wildlife Service, who always let me contribute as much as I was able and participate fully on their research projects. This enhanced my capabilities and enjoyment of field work and data analysis. I would like to thank Phillip J. Zwank who let me have all the responsibility for this project, but who was always available to offer assistance when I needed it. I appreciate the help of Robert H. Chabreck, James G. Gosselink, Robert B. Hamilton, and William E. Kelso who served as advisors on my graduate committee. I thank Norwin E. Linnartz who nominated me for an Alumni Federation Fellowship and who always found office space for me. The many people who assisted on the nuts and bolts of field data collections have been recognized by name within specific chapters of this dissertation; I could not have accomplished all my tasks without their

participation. Finally, the love and encouragement from my family, and from Tom Custer, helped me through the hard times and made the good times better.

"Life has always seemed to me like a plant that lives on its rhizome. Its true life is invisible, hidden in the rhizome. The part that appears above ground lasts only a single summer. Then it withers away - an ephemeral apparition. . . . I have never lost a sense of something that lives and endures underneath the eternal flux. What we see is the blossom, which passes. The rhizome remains."1
1 C. G. Jung, Memories. Dreams. Reflections. Aniela Jaffe, ed. (New York: Vintage Books, 1965), p.4.
iv
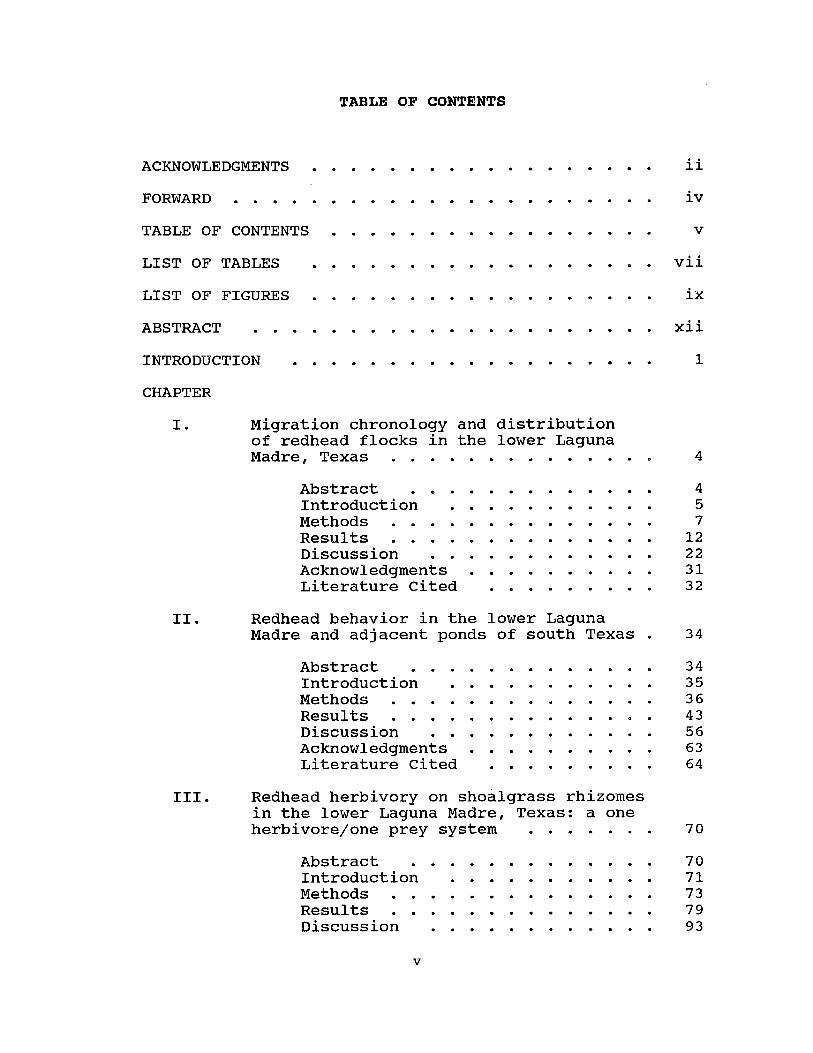
TABLE OF CONTENTS
ACKNOWLEDGMENTS .............................. iiF O R W A R D ........................................... ivTABLE OF C O N T E N T S .................................. VLIST OF TABLES........ ................................ viiLIST OF F I G U R E S ............................ ixABSTRACT .......................................... xiiINTRODUCTION.......... .............................. 1CHAPTER
I. Migration chronology and distribution of redhead flocks in the lower LagunaMadre, Texas ........................... 4
Abstract ......................... 4Introduction ..................... 5Methods ........................... 7R e s u l t s ........................... 12Discussion ..................... 22Acknowledgments .................. 31Literature Cited ................ 32
II. Redhead behavior in the lower LagunaMadre and adjacent ponds of south Texas . 34
Abstract ......................... 34Introduction ..................... 35M e t h o d s ................ 36R e s u l t s ........................... 43Discussion.... ..................... 56Acknowledgments .................. 63Literature Cited ................ 64
III. Redhead herbivory on shoalgrass rhizomesin the lower Laguna Madre, Texas: a one herbivore/one prey system ............. 70
Abstract ......................... 70Introduction ..................... 71M e t h o d s ........................... 73R e s u l t s ........................... 79Discussion.... ..................... 93
v
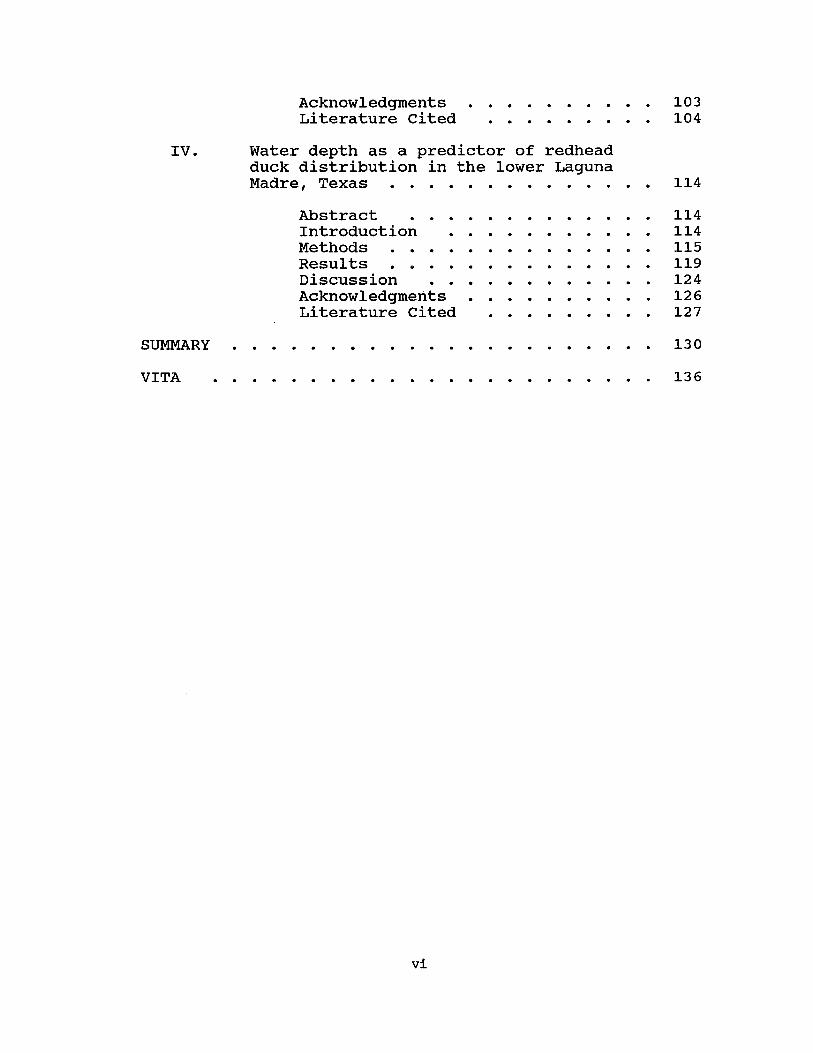
Acknowledgments Literature Cited
103104
IV. Water depth as a predictor of redheadduck distribution in the lower Laguna Madre, Texas ........................... 114
Abstract ........................... 114Introduction .................... 114M e t h o d s ............................. 115R e s u l t s ............................. 119Discussion ......................... 124Acknowledgments .................. 126Literature Cited ................ 127
S U M M A R Y ..............................................130VITA ................................................136
vi

LIST OP TABLESChapter
I.
II.
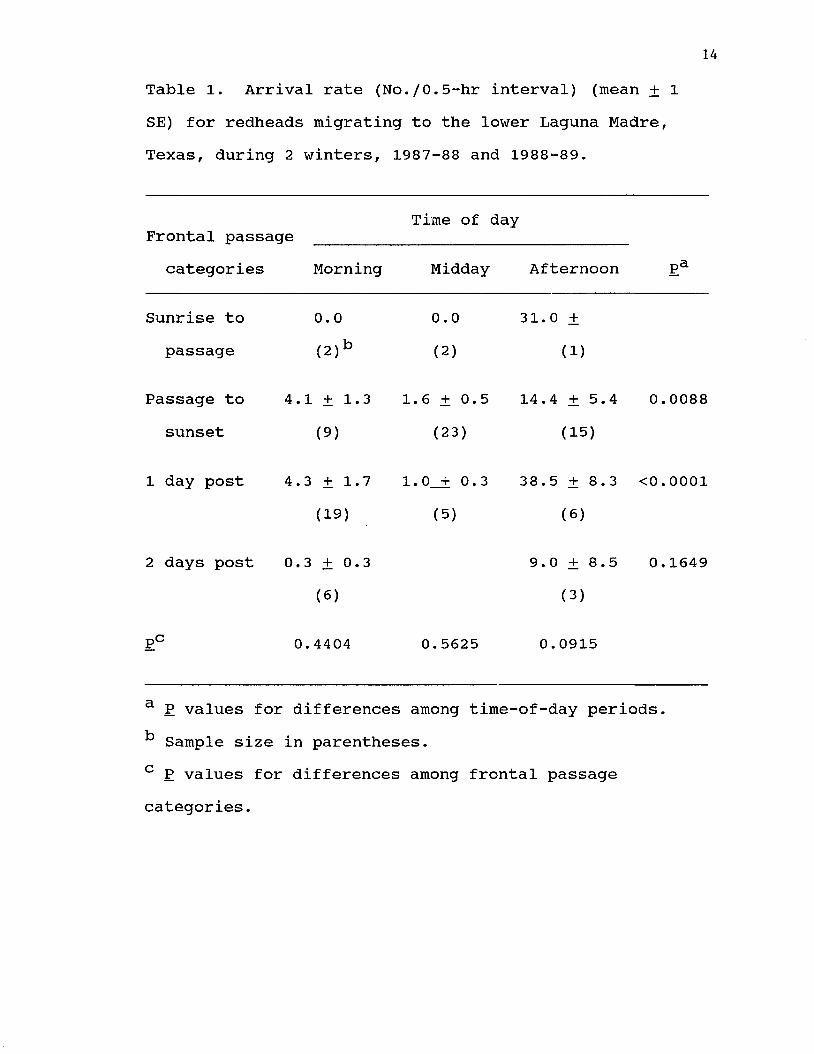
Table1. Arrival rate (No./0.5-hr interval)
(mean + 1 SE) for redheads migrating to the lower Laguna Madre, Texas, during 2 winters, 1987-88 and 1988-1989.................................. 14
2. Table of significant differences among segments for average area covered by redhead flocks per flight on the lower Laguna Madre, Texas.Actual areal values are presentedin Figure 2........................... 16
3. Area (ha) of open water, area of monotypic shoalgrass habitat within open water, and average percent of shoalgrass habitat occupied daily in 5 segments of the lower LagunaMadre, Texas.......................... 20
4. Flights (%) with redheads present in agricultural drains adjacent tothe lower Laguna Madre, Texas,during 2 winters, 1987-88 and1988-89............................... 23
5. Sediment penetration depths in 3 areas of the lower Laguna Madre,Texas................ 24
6. Percent of redhead flock activity (mean + 1 SE) in relation to wind direction in the lower Laguna Madre, Texas, during the winter of1987-88 53
7. Time (sec) (mean + 1 SE) redheads spent feeding during each part of a feeding sequence on the lower Laguna Madre, Texas, during 2winters, 1986-87 and 1987-88......... 55
8. Feeding depths of redheads on the lower Laguna Madre, Texas, during winter, 1988-89...................... 57
v i l

III. 9. Average rate of change of shoalgrass rhizome biomass and root:rhizome ratio for sites that were heavily, lightly, or not grazed by redheads on the lower Laguna Madre, Texas, during winters of 1987-88 and1988-89 80
10. Minimum shoalgrass rhizome biomass at winter's end at sites in the lower Laguna Madre, Texas, that did and did not recover over the following summer from redheadgrazing. ........................... 86
11. Shoalgrass rhizome biomass in October, March, and August for sites with different redhead grazing pressures in thelower Laguna Madre, Texas............ 88
viii

LIST OF FIGURESChapter
I.
II.
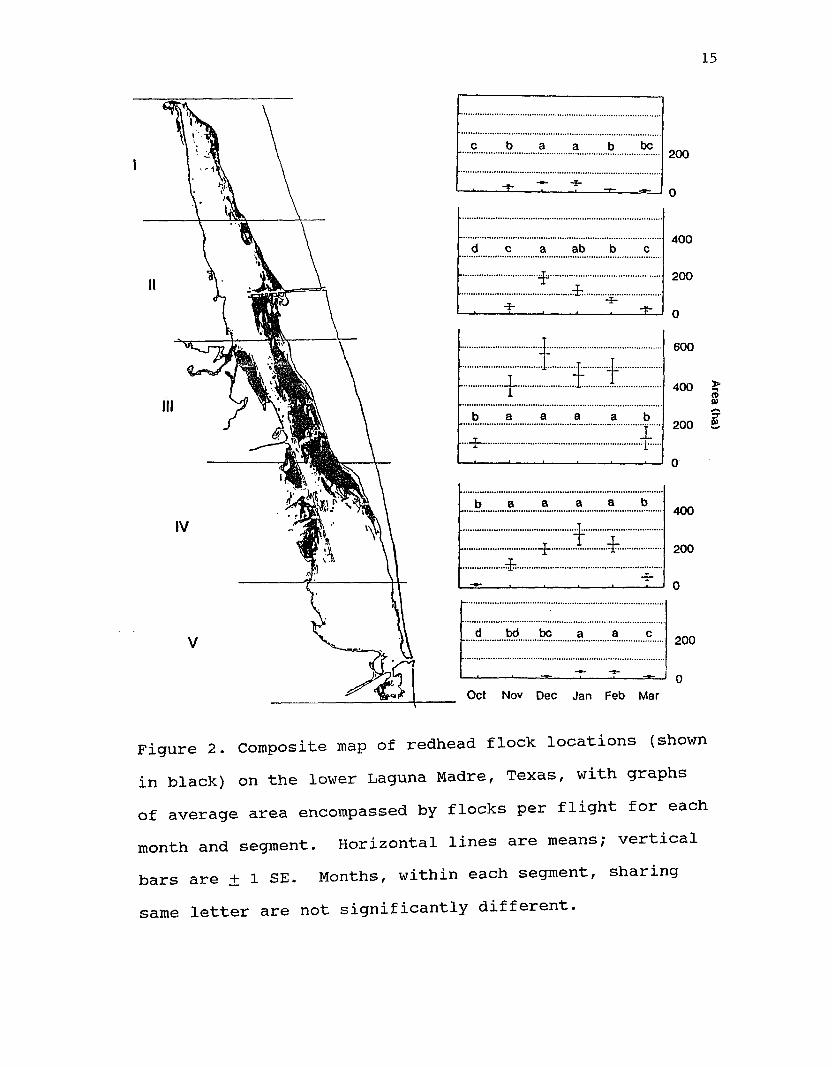
Figure1. Lower Laguna Madre, Texas............ 82. Composite map of redhead flock
locations (shown in black) on the lower Laguna Madre, Texas, with graphs of average area encompassed by flocks per flight for each month and segment. Horizontal lines are means; vertical bars are + 1 SE.Months, within each segment, sharing same letter are notsignificantly different.............. 15
3. Area (ha) occupied per flight by redhead flocks on the lower Laguna Madre, Texas, during 13 aerial surveys in March 1988 and March1989.................................. 18
4. Redhead flock locations (shown in black) on the lower Laguna Madre,Texas, at 1 low (50 - 54 cm) and 1 high (75 - 79 cm) tide, and graphs of percent of flock polygons in segments A - D for all low (45 -54 cm) and high (75 - 84 cm) tides.Horizontal lines are means;vertical bars are + 1 SE. Segments,within tides, sharing same letterare not significantly different. . . . 21
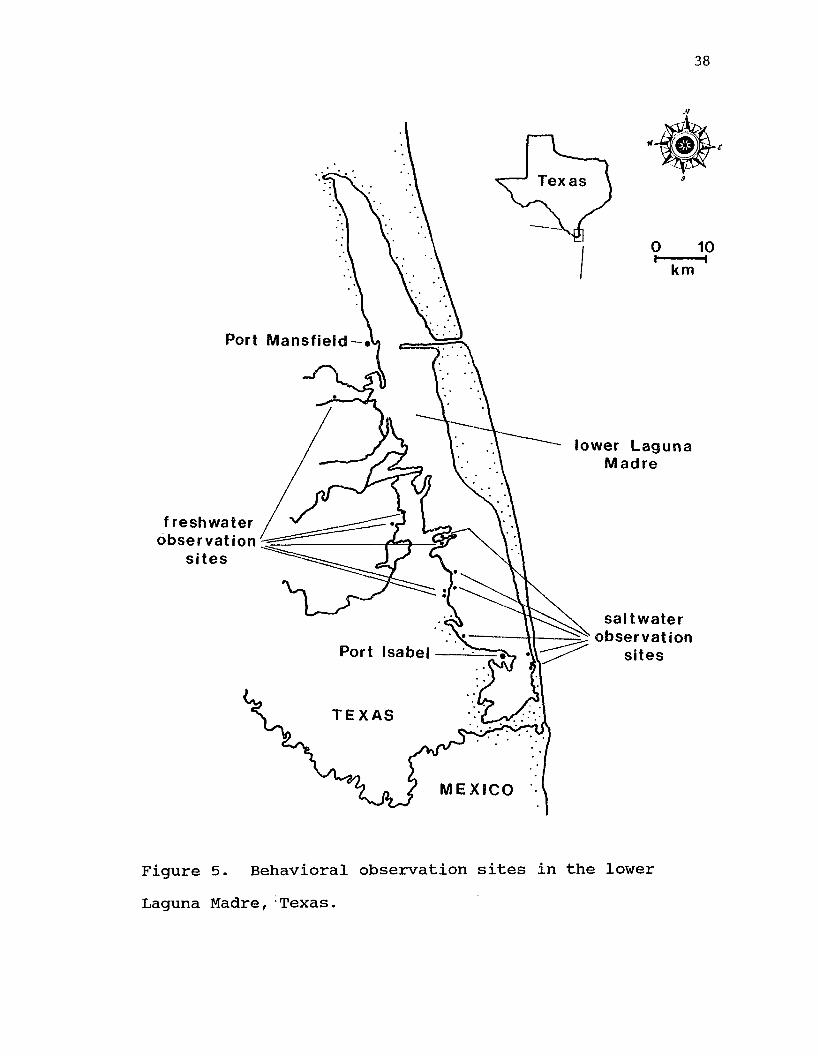
5. Behavioral observation sites in thelower Laguna Madre, Texas............ 38
6. Activities of redheads at saltwater sites on the lower Laguna Madre,Texas, during winters of 1986-87 and1987-88. Vertical bars are + 1 SE.X-axis time-of-day categories are early morning (A), mid-morning (B), midday (C), mid-afternoon (D), and late afternoon (E). Sample size above baseline. Significant P values above each histogram. Bars within month that share same letter or without letters are notsignificantly different.............. 44
ix

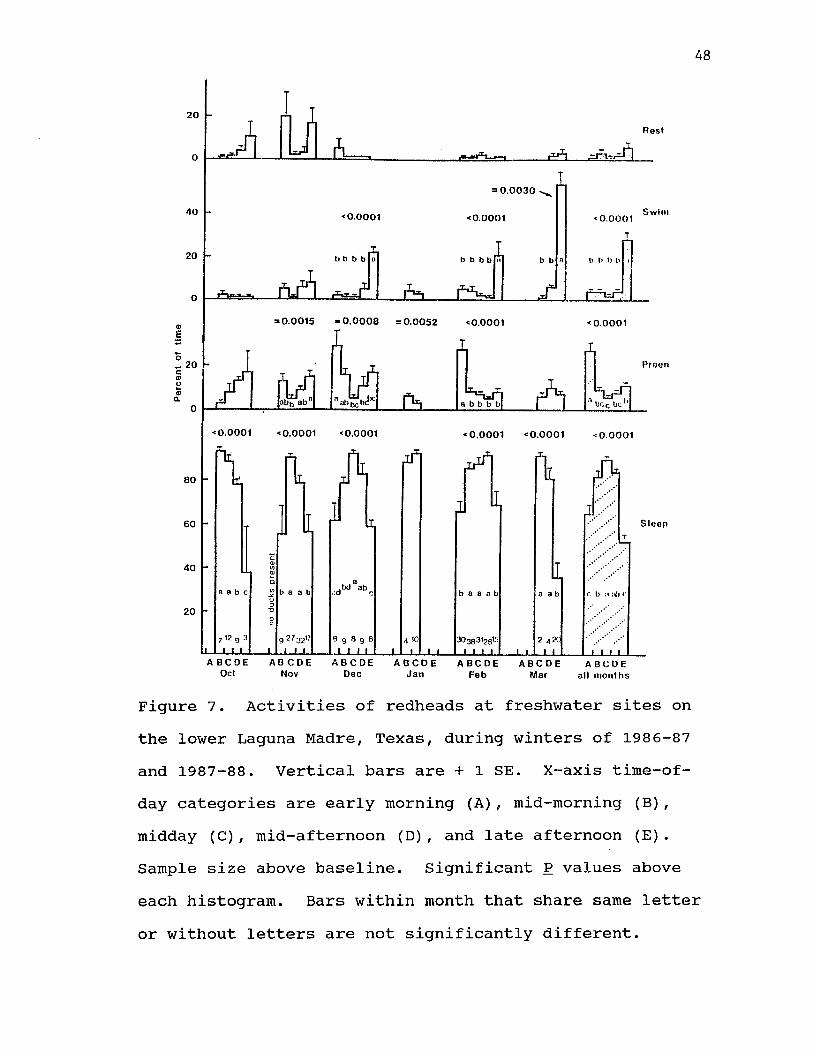
7. Activities of redheads at freshwater sites on the lower Laguna Madre,Texas, during winters of 1986-87 and1987-88. Vertical bars are + 1 SE.X-axis tixne-of-day categories are early morning (A), mid-morning (B), midday (C), mid-afternoon (D), and late afternoon (E). Sample size above baseline. Significant P values above each histogram. Bars within month that share same letter or without letters are notsignificantly different.............. 48
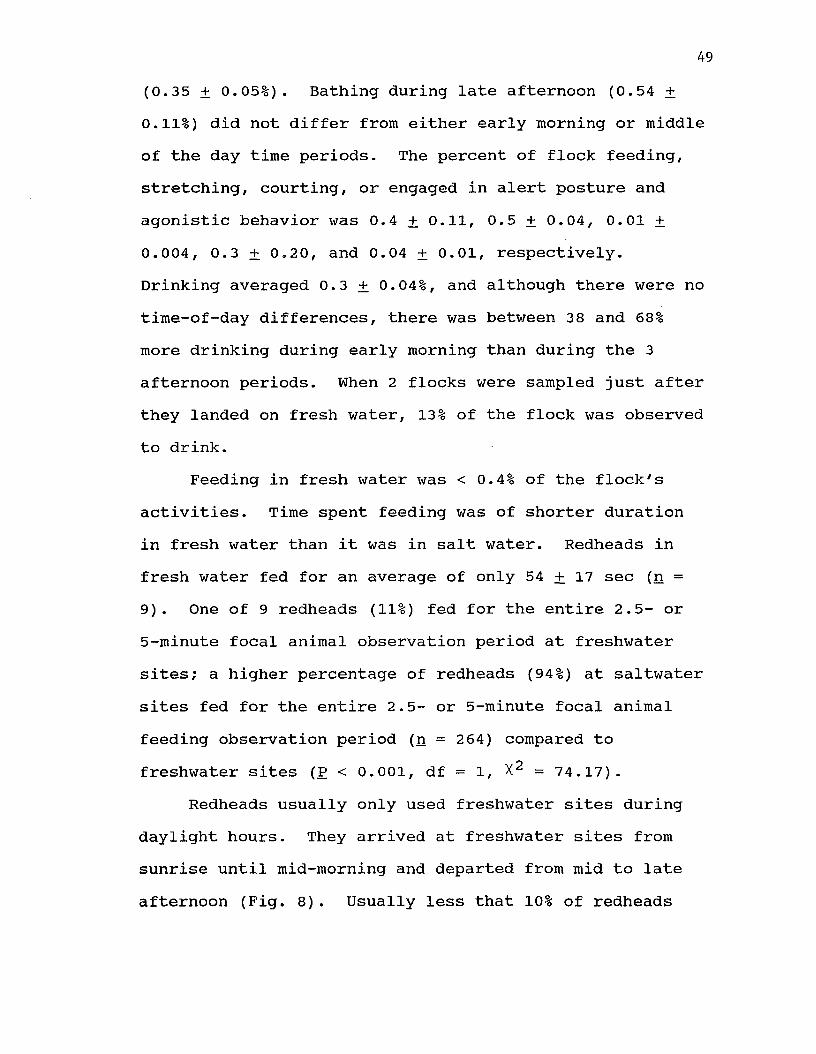
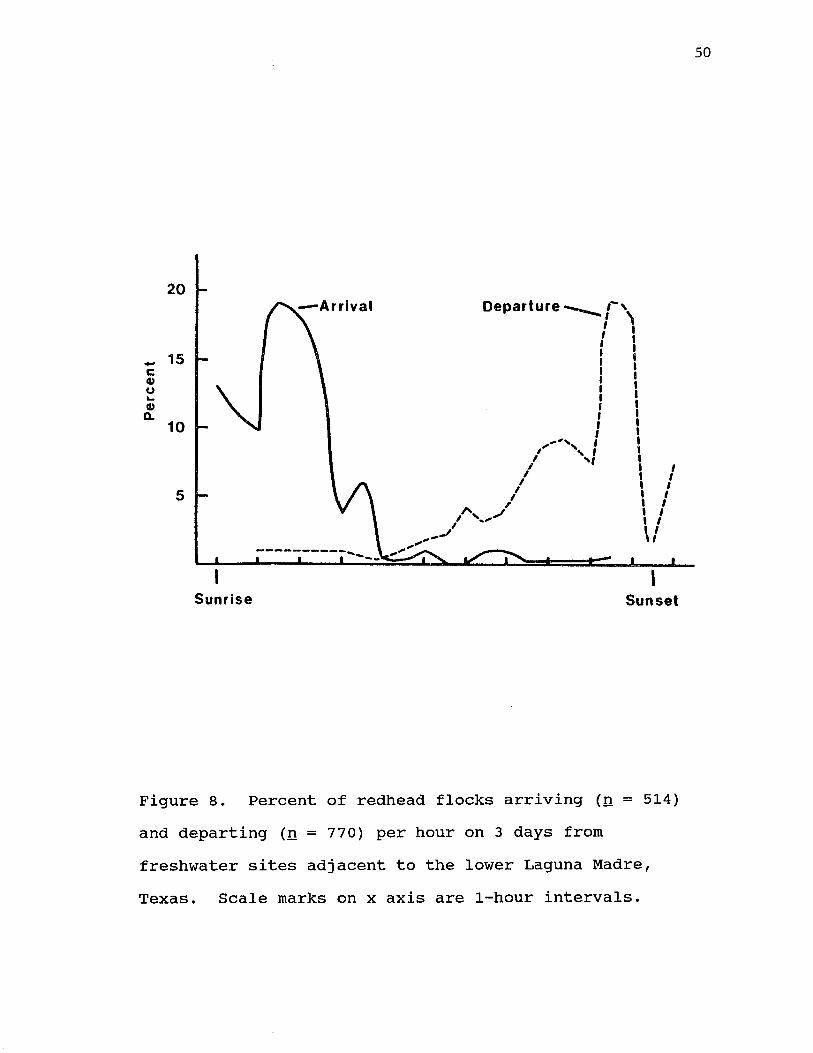
8. Percent of redhead flocks arriving (n = 514) and departing (n = 770) per hour on 3 day from freshwater sites adjacent to the lower Laguna Madre, Texas. Scale marks on x axisare 1-hour intervals................. 50
III. 9. Vegetation plot locations in thelower Laguna Madre, Texas............ 75
10. Percent change, during monthlyintervals, in shoalgrass rhizome biomass at heavily grazed (top)and lightly grazed sites (bottom) from the lower Laguna Madre, Texas. Horizontal lines are means;vertical bars are + 1 SE............. 81
11. Example of shoalgrass rhizomes from the lower Laguna Madre, Texas, that were not grazed (top), partially grazed (center), and heavily grazed (bottom).............................. 82
12. Relationship between shoalgrass rhizome biomass and number of ramets for not, lightly, and heavily grazed sites in the lowerLaguna Madre, Texas................ . 84
13. Shoalgrass rhizome biomass (mean +1 SE) at not grazed sites (exclosures) in the lower Laguna Madre, Texas, with different grazing histories. Open squares are means from sites that were heavily grazed in years prior to exclosure construction, and solid circles are
X
means from sites that were lightly grazed in years prior to exclosure construction...................... 91
IV. 14. Study areas in the lower Laguna Madre, Texas. Filled boxes east of the Intracoastal Waterway show areas where water depth model was developed and tested.................
15. Frequency of water depths, at 1-cm intervals, at 30 study sites in the lower Laguna Madre, Texas, with redheads present (dotted line) and without redheads present (solid line). Top graph is winter, 1987- 88 and bottom graph is winter,1988-89 .
16. Predicted time that 0.25-km2 blocks had water between 12 and 30 cm deep between October 1988 and March 1989 at 2 study areas in the lower Laguna Madre, Texas. Black dots delineate individual study sites. Schematics of bathymetric profiles have different horizontal and vertical scales.......................
17. Location and amount of time redhead flocks were present at 2 study areas on the lower Laguna Madre, Texas, between October 1988 and March 1989. .
116
120
122
123
xi
ABSTRACT
Data on behavior, distribution, and food and habitat requirements of wintering redhead ducks (Avthva americana) were collected during 2.5 winters on the lower Laguna Madre, Texas, between 1987 and 1989. Migrating redheads began arriving on the lower Laguna Madre with frontal passages in early October. They initially congregated in the central portion of the lagoon, and the majority remained there throughout the winter. As winter progressed, flocks dispersed to other parts of the Laguna Madre. Ninety-five percent of redhead flocks were above stands of monotypic shoalgrass (HaJLodule wrightii) vegetation, their primary food source. Redheads fed intermittently throughout the day; most fed by head dipping or tipping up in water between 12 and 3 0 cm deep. Flocks moved east and west across the lagoon as water levels changed, thereby remaining in water between 12 and 3 0 cm deep. Redheads consumed approximately 75% of shoalgrass rhizome biomass each winter. When rhizome biomass was grazed to below 10 g dry mass/m , biomass did not recover to pre-grazing levels the following summer. Thirty-three percent of the sites were grazed to below 10 g dry mass/m2 during both winters of the study; 64% were grazed to below 10 g dry mass/m2 during 1 of 2 years. Rhizome biomass increased inside redhead exclosures, suggesting that redhead grazing may be keeping shoalgrass
x i l

below its maximum biomass. During October and November, redheads were found at freshwater sites adjacent to the lower Laguna Madre. Use of freshwater sites declined through the winter with < 5% of redheads using freshwater sites daily after December. Within the lower Laguna Madre, redheads initially occupied areas with the lowest salinities, and they continued to favor areas with lower salinities throughout the winter. Redheads did not select areas where food was most abundant or had the highest protein content. Redhead habitat selection criteria included: areas with monotypic shoalgrassvegetation, water between 12 and 3 0 cm deep, rhizome biomass > 10 g dry mass/m2, and relatively low salinities. Because of redheads' high reliance on shoalgrass, further loss of this seagrass species from the lower Laguna Madre may adversely affect redheads.
INTRODUCTION
The Laguna Madre of Texas and Mexico is the primary- wintering area for redheads (Avthva americana) (Weller 1964). The Laguna Madre is a seagrass-based ecosystem that has changed greatly over the past 30 years. When the first seagrass survey was conducted in 1960-61, nearly the entire lower Laguna Madre lagoon bottom was covered with monotypic shoalgrass (Halodule wrightii) meadows (Singleton 1964). Distribution of other seagrass species was very limited. By 1974, area covered by monotypic shoalgrass meadows had declined from 47,070 to 29,851 ha (Merkord 1978). Part of this decline was the result of the expansion of manateegrass fSvrinoodium filiforme) into shoalgrass meadows along the Intracoastal Waterway. The rest of the decline was the result of areas that were formerly monotypic shoalgrass meadows becoming de-vegetated entirely. Since 1974, the loss of monotypic shoalgrass meadows has continued, but the rate of loss has decreased (C. Onuf, U.S. Fish and Wildl. Serv., pers. commun.). Biomass of manateegrass has continued to increase in the lower Laguna Madre since 1975, but most of this increase has been in areas that were already classified as mixed-species meadows in 1975. Dredging of the Intracoastal Waterway and associated

2
hydrological changes are thought to be responsible for these vegetation changes (McMahan 1966).
Redheads, while wintering on the Laguna Madre, eat primarily shoalgrass rhizomes (Koenig 1969:39, McMahan 1970). Redheads abandoned other wintering areas, such as the Chesapeake Bay system, when their preferred food disappeared (Stevenson and Confer 1978:109, Perry et al. 1981). The impact of the loss of so much monotypic shoalgrass meadows on wintering redheads is unknown. The objectives of this study were to (1) map distribution of redhead flocks and compare distribution between years, among monthly and time-of-day periods, and among 5 spatial segments; (2) quantify behavior in freshwater and saltwater habitats with emphasis on feeding behavior; (3) determine impacts on and recovery of shoalgrass rhizomes from the effects of redhead grazing; and (4) identify habitat selection factors, such as water depth, salinity, and shoalgrass biomass, and relate these factors to redhead usage patterns. These topics are covered in sequence in the following 4 chapters.
LITERATURE CITED
Koenig, R. L. 1969. A comparison of the winter foodhabits of three species of waterfowl from the upper Laguna Madre of Texas. M.S. Thesis, Texas A & I Univ., Kingsville, 59pp.
3
McMahan, C. A. 1966. Ecology of principal waterfowl foods in lower Laguna Madre. Tex. Parks and Wildl., Job Completion Report, Fed. Aid Proj. W-29-R-19, Job 17. 24pp.
_____ . 1970. Food habits of ducks wintering on LagunaMadre, Texas. J. Wildl. Manage. 34:946-949.
Merkord, G. W. 1978. The distribution and abundance of seagrasses in Laguna Madre of Texas. M.S. Thesis, Texas A & I Univ., Kingsville, 56pp.
Perry, M. C., R. E. Munro, and G. M. Haramis, 1981.Twenty-five year trends in diving duck populations in Chesapeake Bay. Trans. North Am. Wildl. Conf. 46:299-310.
Singleton, J. R. 1964. Ecology of the principal waterfowl food plants of the lower Laguna Madre. Tex. Parks and Wildl., Job Completion Report, Fed. Aid Proj. W-29-R-14, Job 17. 9pp.
Stevenson, J. C., and N. M. Confer, 1978. Summary ofavailable information on Chesapeake Bay submerged vegetation. U.S. Fish and Wildl. Serv. FWS/OBS- 78/66. 335pp.
Weller, M. W. 1964. Distribution and migration of the redhead. J. Wildl. Manage. 28:64-103.
CHAPTER I
MIGRATION CHRONOLOGY AND DISTRIBUTION OF REDHEAD FLOCKS IN THE LOWER LAGUNA MADRE, TEXAS
Abstract: I studied the migration chronology anddistribution of redhead duck (Avthva americana) flocks during 2 winters (1987-88 and 1988-89) in the lower Laguna Madre, Texas. Redheads began arriving during early October in 1987 and 1988, and continued to arrive through November. Redhead migration was closely associated with frontal passages. Redheads arrived on the day of frontal passage and for the following 2 days; no migrants were observed arriving the day before frontal passage. Flock size of arriving redheads was 26.4 + 0.6 birds, and did not differ among the days of frontal and post-frontal passage. Average flock size did not differ among morning, midday, or afternoon periods. Number of flocks arriving per 0.5-hr interval (arrival rate) was higher during afternoon (21.7 + 0.6) than during morning (4.3 ± 1.2) or midday (1.5 ± 0.4) on day of frontal passage and the first day after frontal passage. By 2 days post-frontal passage, arrival rate was 3.2 + 2.9 flocks per 0.5-hr interval and did not differ among the 3 time-of-day periods.
Upon arrival in the lower Laguna Madre, redhead flocks congregated in the central portion. They
continued to use the central portion throughout the winter, but gradually spread to the north and south ends of the lagoon as winter progressed. Ninety-five percent of the area used by flocks was above monotypic shoalgrass (Halodule wrightii) meadows. Redheads occupied between 0.5 and 4.3% of monotypic shoalgrass habitat each day. Flock movement east or west across the lower Laguna Madre seemed to be related to tide level; redheads moved to remain in water between 12 and 30 cm deep. Area occupied by flocks did not differ between years, nor was it a function of wind direction or time of day.Key words; Avthva americana. distribution, habitat selection, lower Laguna Madre, redhead
INTRODUCTIONThe primary wintering area for redhead ducks is the
Laguna Madre of Texas and Mexico (Weller 1964), the only hypersaline lagoon in North America (Gunter 1967) .During winter, redheads feed primarily on rhizomes of shoalgrass, a submerged seagrass species that predominates in the lower Laguna Madre (Keonig 1969:39, McMahan 1970). During the past 30 years, there has been a decrease in area of vegetated lagoon bottom, as well as a decline in area occupied by monotypic shoalgrass meadows (Singleton 1964, Merkord 1978). There were 47,070 ha of monotypic shoalgrass meadows in 1960-61
(Singleton 1964); by 1974, area occupied by monotypic shoalgrass meadows had decline to 29,851 ha (Merkord 1978). Loss of monotypic shoalgrass meadows since .1974 has continued but the rate has slowed (C. Onuf, U.S. Fish and Wildl. Serv. pers. commun.). The impact of these continuing vegetation changes on wintering redheads is unknown.
Distribution of redheads in the lower Laguna Madre was determined in 1956-57 (Kiel 1957), 1960-61 (Clark 1961), and 1974-75 (Cornelius 1977), before and during these habitat changes. During the 1956-57 winter, over half the redheads were present in areas west of the Intracoastal Waterway (ICWW), whereas during the 1960-61 and 1974-75 winters, the majority of redheads were found east of the ICWW. My objectives were to (1) describe the timing and factors affecting redhead arrival on the lower Laguna Madre each fall; (2) map distribution of all redhead flocks and compare distribution patterns between years, and among months, spatial segments, and time-of- day periods; and (3) determine which factors, such as water depth, salinity, and soil compactness, correlate with habitat utilization patterns.
7
METHODSAerial Surveys
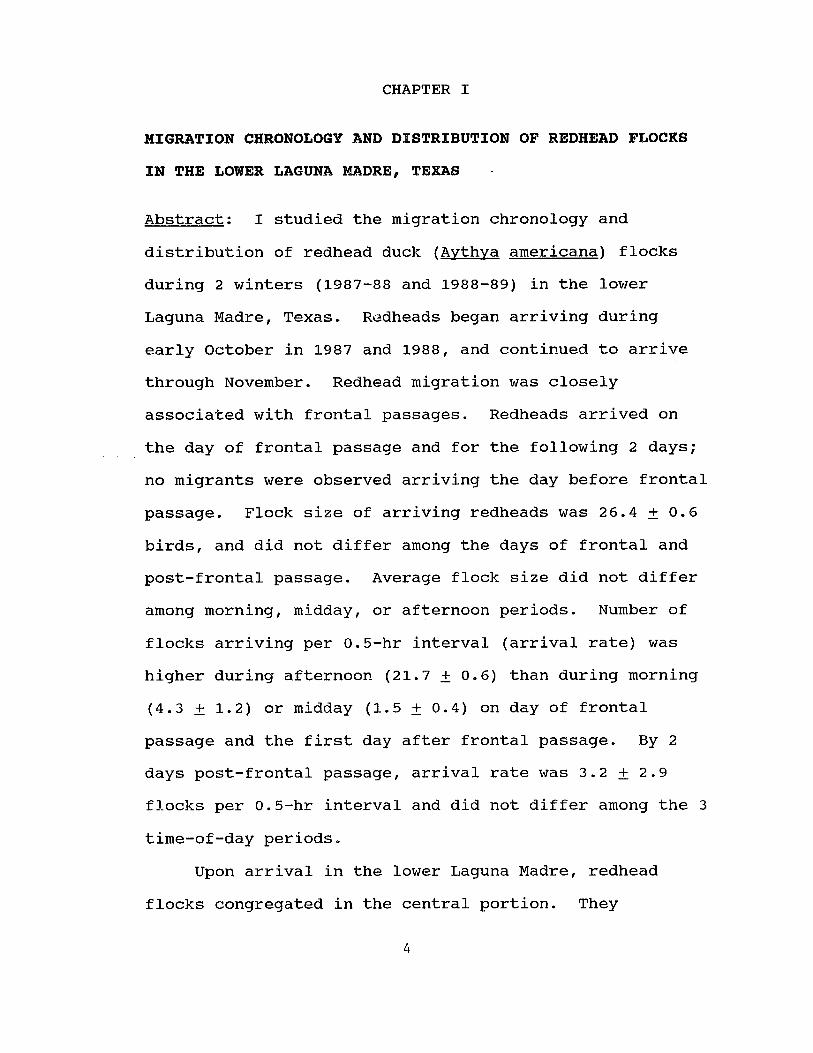
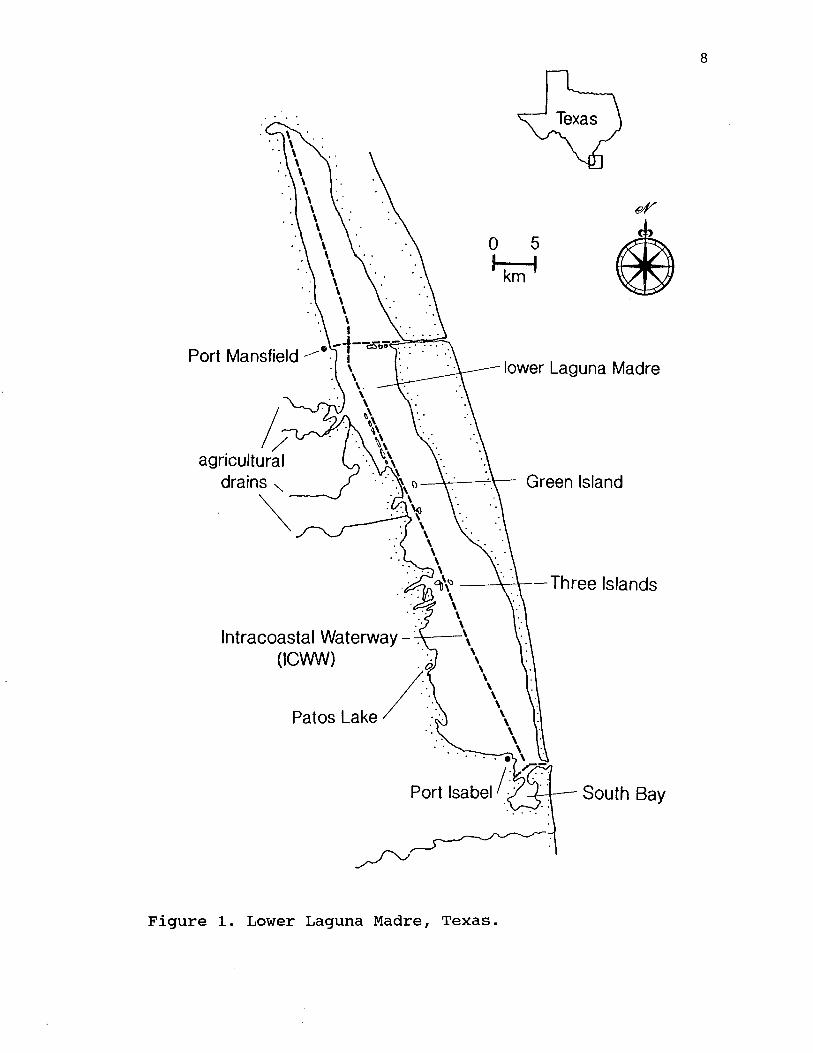
I aerially surveyed 690 km of the lower Laguna Madre (Fig. 1), 3 times/week, weather permitting, between October 1 and March 31 during 2 winters (1987-88 and1988-89), and plotted the location and area encompassed by all redhead flocks on 1:24000 scale National Wetland Inventory (NWI) maps. Each flight was at an altitude of 2 30 m and took approximately 3 hours. Flights were made during 3 time periods: morning, 0800 - 1100; noon, 1100- 1400; and afternoon, 1400 - 1700. I attempted to fly a morning, noon, and afternoon survey each week. Tide level in the lower Laguna Madre during each flight was determined from the National Oceanographic and Atmospheric Administration's tide station 8778490 at Port Mansfield, Texas. Tide levels were divided into 9 5-cm intervals between the tidal extremes of 40 and 85 cm.Wind direction data during each flight were acquired from the National Weather Service's reporting station at Port Mansfield. Wind directions were divided into 8 categories (N, NW, W, etc.).
Two freshwater areas were included in aerial surveys, a system of agricultural drainages emptying into the lower Laguna Madre, and Patos Lake, an 18-ha pond on Laguna Atascosa National Wildlife Refuge (NWR). I used a chi-square contingency table (2 X 6) to test for overall
8
Texas
km
Port Mansfieldlower Laguna Madre
agricultural drains v Green Island
A— Three Islands
Intracoastal W aterw ay - t (ICWW)
Patos Lake
Port Isabel' j South Bay
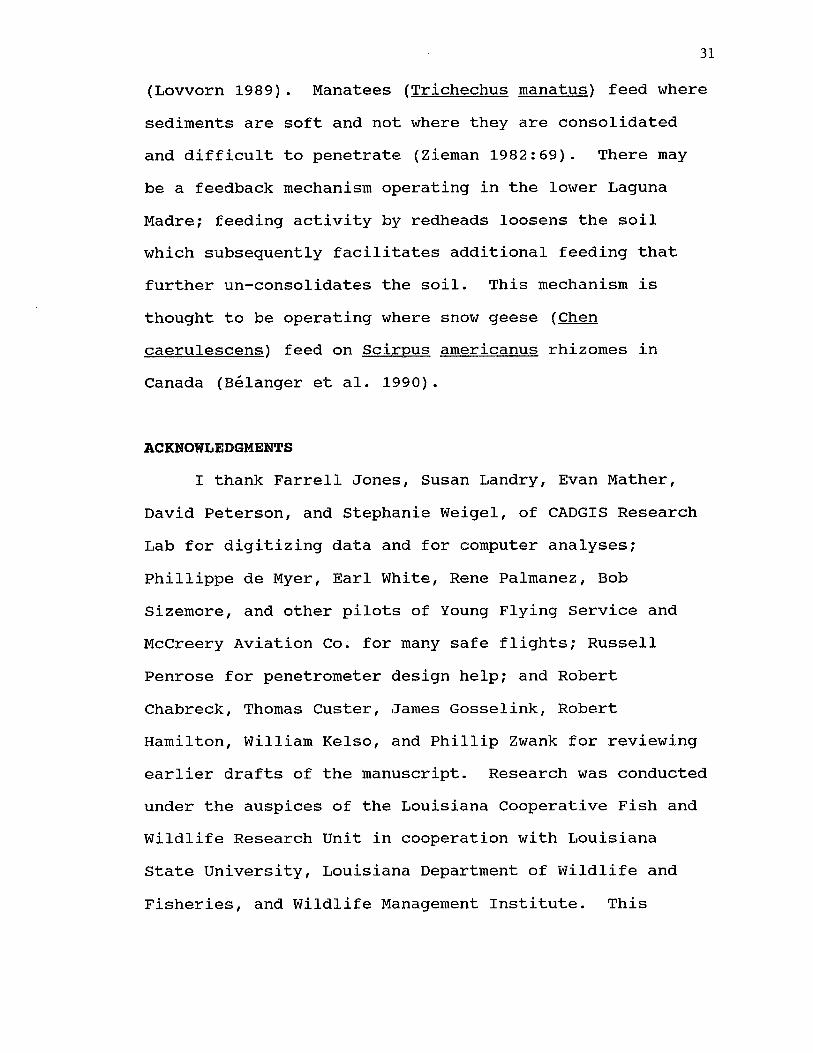
Figure 1. Lower Laguna Madre, Texas.
differences among months between number of flights with and without redheads at freshwater sites, and used pairwise Fisher exact probabilities to determine which months differed from others.Data Reduction and Geographic Information Systems
Polygons, that encompassed flock locations, were digitized from NWI maps for each flight by the CADGIS (Computer Aided Design and Geographic Information Systems) Research Lab, Louisiana State University, Baton Rouge, La. Data were summarized and analyzed with Intergraph software. Six monthly composite maps were constructed by seguentially overlaying maps from appropriate flights and adding to or expanding the outlines of polygons that delineated flock locations. Interior polygon lines were dropped out. Composite maps also were constructed for 3 time-of-day and 9 water level categories. Due to software limitations, composite maps were made for each year separately.
Intergraph software calculated area (ha) of flock polygons on composite maps for month, time-of-day, and tide level categories. Additionally, to test for differences in spatial distribution, I divided the lower Laguna Madre into 5 segments, each 9 min 48 sec of latitude wide (18 km); segments were numbered I to V from north to south. For each individual flight, area
10
encompassed by redhead flocks was calculated for each segment i ;eparato Iy.Data .analysis
I used l-way analysis oi; variance (ANOVA) to compare average area encompar.r.ed by flocks per flight among year, month, and segment factors. Additional ANOVA models wore* used to l et it lor t l.me~of-day and wind direction effects on average' area encompassed by redhead flock:; per I light. I separated moans using Bonferroni multip l e* comparisons when noce,unary. Data were ranked prior to analysis to improve homogeneity of variances.Area mean:; I I are presented in text, tables, and figures;. Alpha level for all tents was P 0.05.
To test for of foots of tide level on flock locations, the southern half ol segment II and all of segment 111 , from the ICWW east, (Pig. a) , were divided into 4 longitudinal segments (A - D), each 1.4 km wide. Area of flock polygons in each segment war. measured with a Numoni.cs Model 1224 digitizer; data lor each segment are expressed at.; percent of total area. I used 1-way ANOVA to compare among the 4 'longitudinal segments the percent, of f locks, in the upper 201 of tide levels (75 - 05 cm) with fix'! lower 201 (45 - 55 cm) of tide levels.
I used the' Numonies digitizer to calculate area of shoal grass habitat in the 5 horizontal segments in the lower haguna Mad.ro from maps, contained in Merkord (1978).
11
1 calculated percent overlap between monthly composite redhead flock locations and monotypic shoalgrass habitat. Migration
On 17 days in October and November, I collected flock size and arrival rate (number of flocks/O.5-hr interval) data from a point 1.2 km south of town for redheads migrating into the Port Mansfield area. Flock size and arrival rate were averaged for 0.5-hr intervals.A group of redheads separated by more than 20 m from other such groups was considered a flock. I partitioned data into 3 time-of-day periods (morning, sunrise to 1000; midday, 1000 - 1400; and afternoon, 1400 - sunset) and 4 time periods relative to frontal passage (sunrise to frontal passage, frontal passage to sunset, and 1 and2 days post-frontal passage). I used 2-way ANOVA to test for time-of-day and time relative to frontal passage effects on flock size and arrival rate.Sediment Compactness
I measured sediment compactness with a sediment penetrometer of my own design at 41 vegetation plots (Chapter III) plus 4 other sites evenly spaced north of Port Mansfield east of the ICWW between the vegetation plot locations and the north end of the lower Laguna Madre. The penetrometer consisted of an 18-mm diameter wooden dowel tapered to a wedge-shape for the last 3 0 mm. Angle of the wedge was 3 0°. The tip of the penetrometer
12
was placed on the sediment surface, and the distance into the sediment that it penetrated under its own weight (529 g) was measured. A 2,725 g weight was added and the amount it farther penetrated was measured. At each site, three penetration measurements were taken and averaged.
RESULTSMigration
Redheads arrived in the Port Mansfield area on frontal passages beginning in early October each year and continued arriving through November. Redhead flocks were first seen arriving on 3 October each winter. No migrating redheads were observed arriving on the day prior to frontal passage.
Average flock size of arriving redheads was 26.4 +0.6 (mean + 1 SE) (n = 690), and did not differ by time of day (P = 0.9048, df = 2,612, F = 0.10) or time relative to frontal passage (P = 0.3428, df = 2,612, F = 0.90). There was no interaction between factors (P = 0.2582, df = 2,612, F = 1.36).
I used separate 1-way ANOVA to test arrival rates for differences among 3 time-of-day periods for 4 time periods relative to frontal passage separately, because the interaction term was significant (P = 0.0022, df = 2,71, F = 6.68) and there were missing cells. Arrival rate was significantly higher during afternoon than
13
during morning or midday for each time period relative to frontal passage individually (Table 1), except for 2 days after frontal passage when arrival rate did not differ by time of day. Two days post-frontal passage arrival rate was 3.2 + 2.9 flocks/0.5-hr. Overall, arrival rate was 20.2 + 4.4 flocks/0.5-hr interval during afternoon, 1.4 + 0.4 flocks/0.5-hr during midday, and 3.4 + 1.2 flocks/0.5-hr during morning.Geographic information
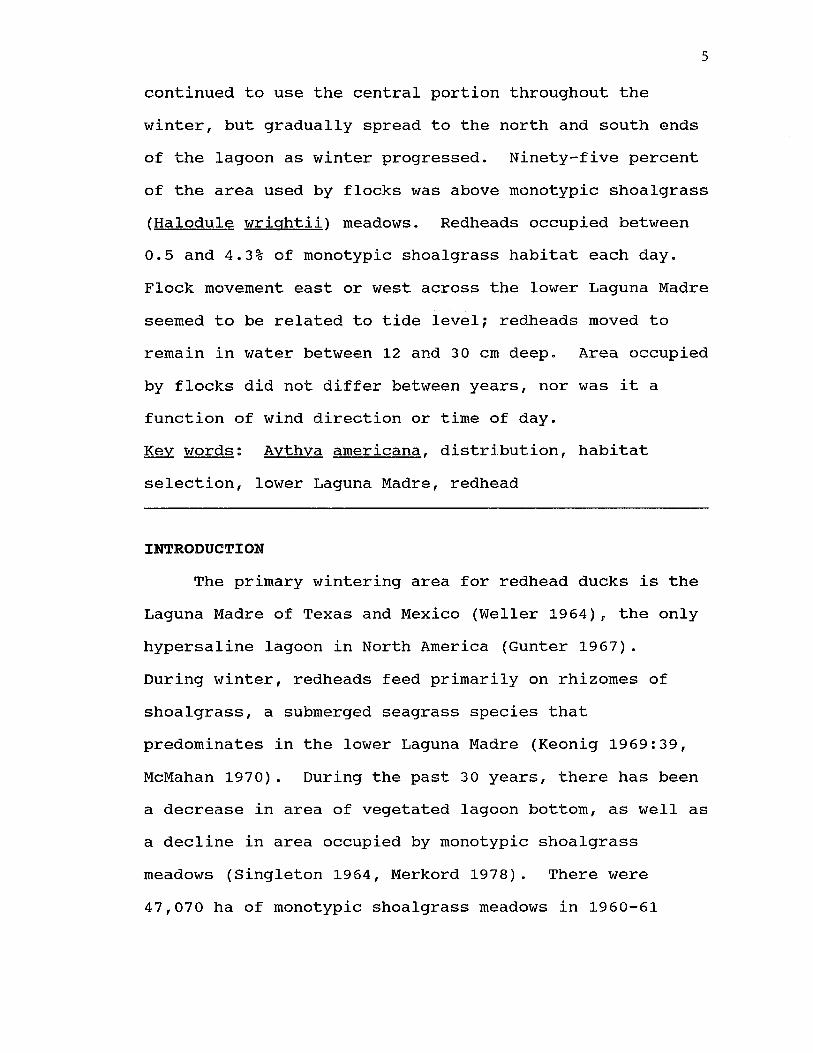
Redhead flocks were not uniformly distributed over the lower Laguna Madre (Fig. 2). Distribution varied by month (P < 0.0001 df = 5,405, F = 20.20) and by segment (P < 0.0001, df = 5,405, F = 61.33) (Table 2). When redheads arrived in October, they covered significantly more area each flight in the central segment (III, Fig.2) than in other segments (Table 2). This was true for the rest of the winter except for January and March when the amount of area covered by redhead flocks was the same in segments IV and III. Flocks occupied the least amount of area per flight in the most northern and southern segments (I and V).
Area occupied by redheads each flight increased in all segments through December. Area occupied continued to build in segment V into January (Fig. 2), concomitant with a nonsignificant reduction in segments II and III.In December, January, and February, significantly more
14
Table 1. Arrival rate (No./0.5-hr interval) (mean + 1 SE) for redheads migrating to the lower Laguna Madre,Texas, during 2 winters, 1987-88 and 1988-89.
Frontal passageTime of day
categories Morning Midday Afternoon Pa
Sunrise to 0.0 0.0 31.0 ±passage (2)b (2) (1)
Passage to 4.1 ± 1.3 1.6 + 0.5 14.4 ± 5.4 0.0088sunset (9) (23) (15)
1 day post 4.3 ± 1.7 (19)
1.0 4- 0.3
(5)
38.5 ± 8.3 (6)
<0.0001
2 days post 0.3 + 0.3 (6)
9.0 ± 8.5 (3)
0.1649
Pc 0.4404 0.5625 0.0915
a P values for differences among time-of-day periods. b Sample size in parentheses.c P values for differences among frontal passage categories.
15
h
c b a a b be
-i--------------- -r-
d c a ab b c
+ :.........
+
200
b a a a a b....................i"T~
400
200
0600
400
200
b a a a a b
T _ 1 .....i ............r.....
-5"i ..j — j—
d bd be a a c
—Oct Nov Dec Jan Feb Mar
400
200
0
200
Figure 2. Composite map of redhead flock locations (shown in black) on the lower Laguna Madre, Texas, with graphs of average area encompassed by flocks per flight for each month and segment. Horizontal lines are means; vertical bars are + 1 SE. Months, within each segment, sharing same letter are not significantly different.
Area (ha)

Table 2. Table of significant differences among segments for average area covered by redhead flocks per flight on the lower Laguna Madre,Texas. Actual areal values are presented in Figure 2.
Segment
Month
Oct. Nov. Dec. Jan. Feb. Mar.
I Ca c C C D CII c c B B C BC
III A A A A A AIV B B B A B ABV C D D C CD C
a Values within each column represented bysame letter are not significantly different. The letter A represents the highest mean area, and the letter D represents the lowest mean area.
17
area was used by flocks than in October and March in all 5 segments. Total area occupied by flocks per flight did not vary between years (P = 0.7776, df = 1,4 05, F =0.08), among 3 time-of-day periods (P = 0.1541, df =2,153, F = 1.89), or by wind direction (P -- 0.2988, df = 3,140, F = 1.24).
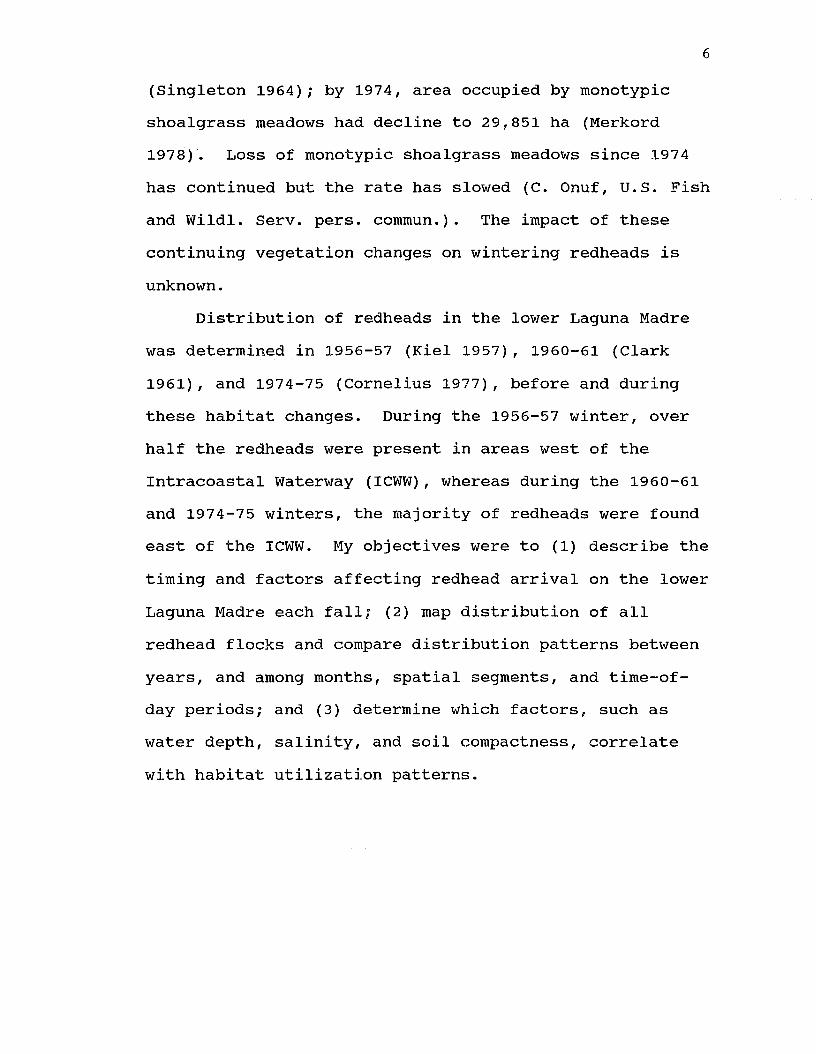
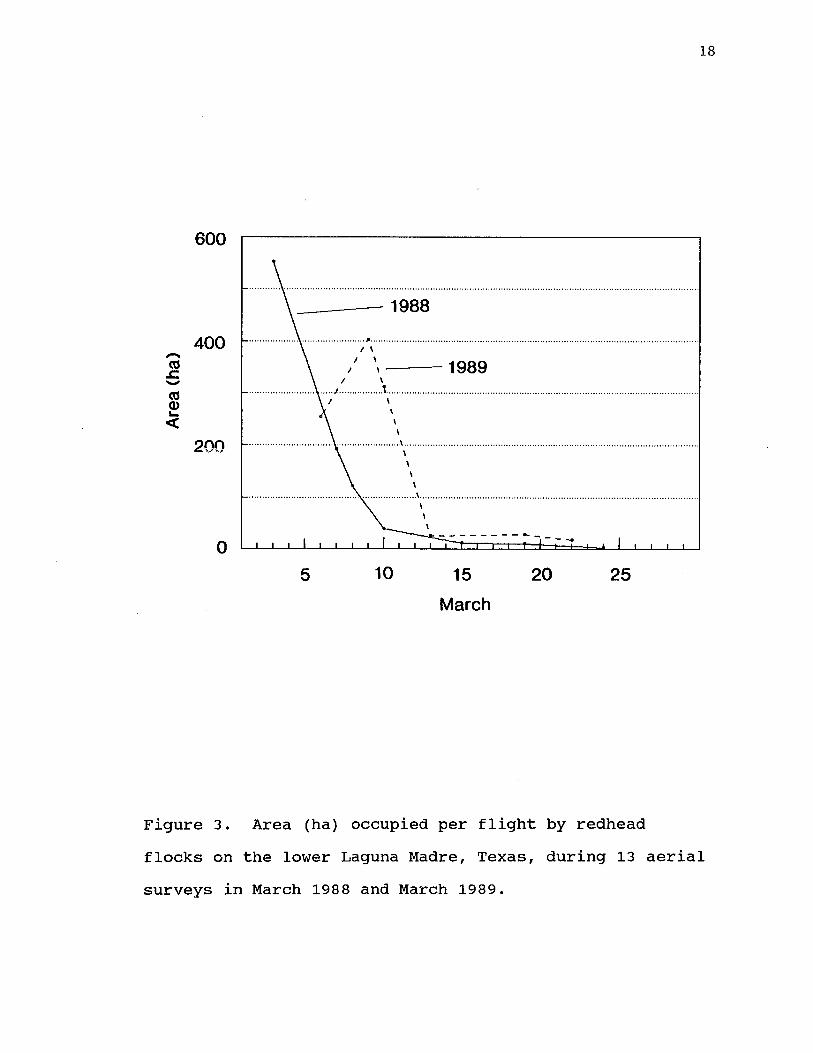
Average area used per flight by redheads in the lower Laguna Madre began to decline by early March (Fig.3). By 10 March, 1988 and 13 March, 1989, < 5% of the average area occupied per day by flocks between November and February was still being occupied by redheads.
Average area covered per flock per day varied by month (P = 0.0388, df = 5,329, F = 3.13) and segment (P < 0.0001, df = 4,329, F = 14.22). Area covered per flock was larger in segments II (4.9+0.61 ha) and III (4.0 + 0.36 ha) than in segments I, IV, and V (1.8 + 0.19, 2.7 + 0.23, 1.4 + 0.2 3 ha); in segment IV, more area was covered per flock than in segment V. Area covered per flock in December (4.2 + 0.54 ha) was larger than area covered per flock in February or March (2.3 + 0.21, 2.3 + 0.38 ha); there were no other differences. Area covered per flock did not vary by wind direction (P = 0.52, df = 3,82, F = 0.76). Area covered per flock was smaller during noon flights (3.0 + 0.47 ha) than during morning (4.2 + 0.36 ha) or afternoon (4.9 + 0.70 ha) flights (P = 0.0501, df = 2,147, F = 3.06).
Area
(h
a)
18
6 0 0
— 1988
4 0 01989
200
010 2015 25
March
Figure 3. Area (ha) occupied per flight by redhead flocks on the lower Laguna Madre, Texas, during 13 aerial surveys in March 1988 and March 1989.

19
More than 95% of the area encompassed by flocks was above monotypic shoalgrass meadows. Flocks that were not located over monotypic shoalgrass meadows were located over areas that were a mixture of shoalgrass and manateegrass (Svringodium filiforme) (2.0%) or over a mixture of turtlegrass (Thalassia testudinum) and manateegrass (2.4%).
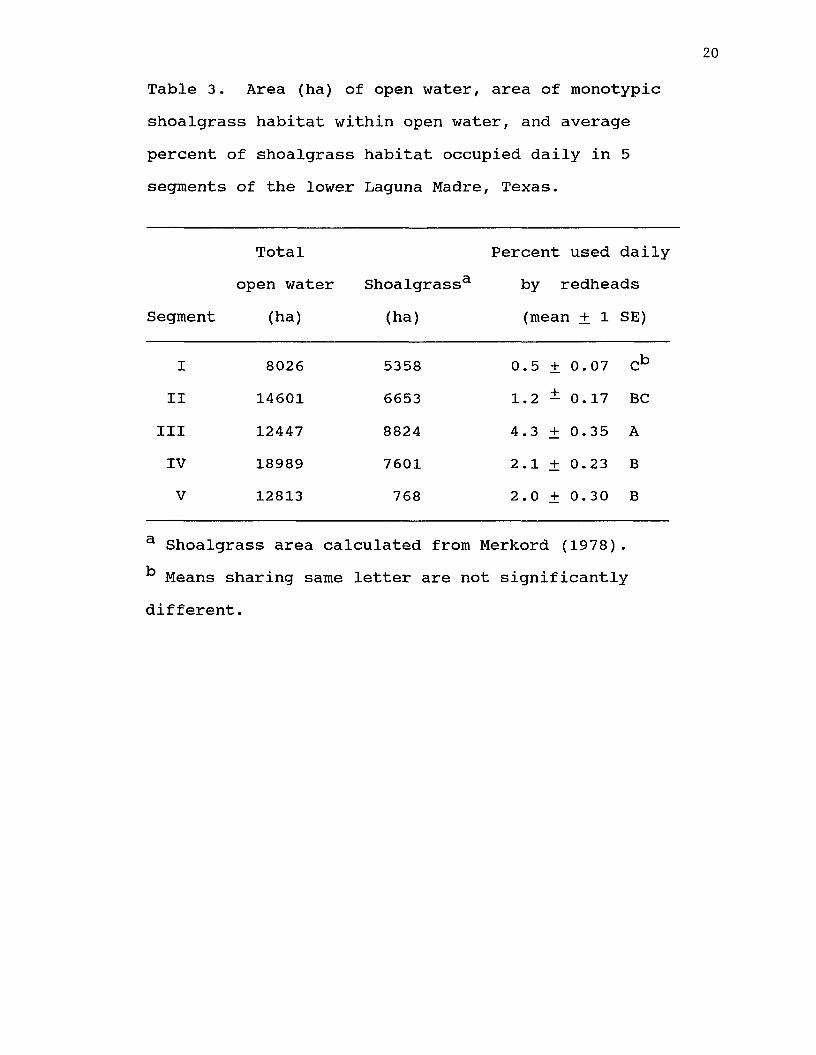
Redhead flocks occupied only 0.5 to 4.3% of shoalgrass habitat each day (Table 3), even though the actual area occupied was as much as 61 times more in 1 segment than another. Segment III had a higher percent of shoalgrass habitat occupied daily than other segments (P < 0.0001, df = 4,460, F = 33.76). It also had the most shoalgrass habitat. Flocks in segment I occupied the smallest percent of shoalgrass habitat daily.
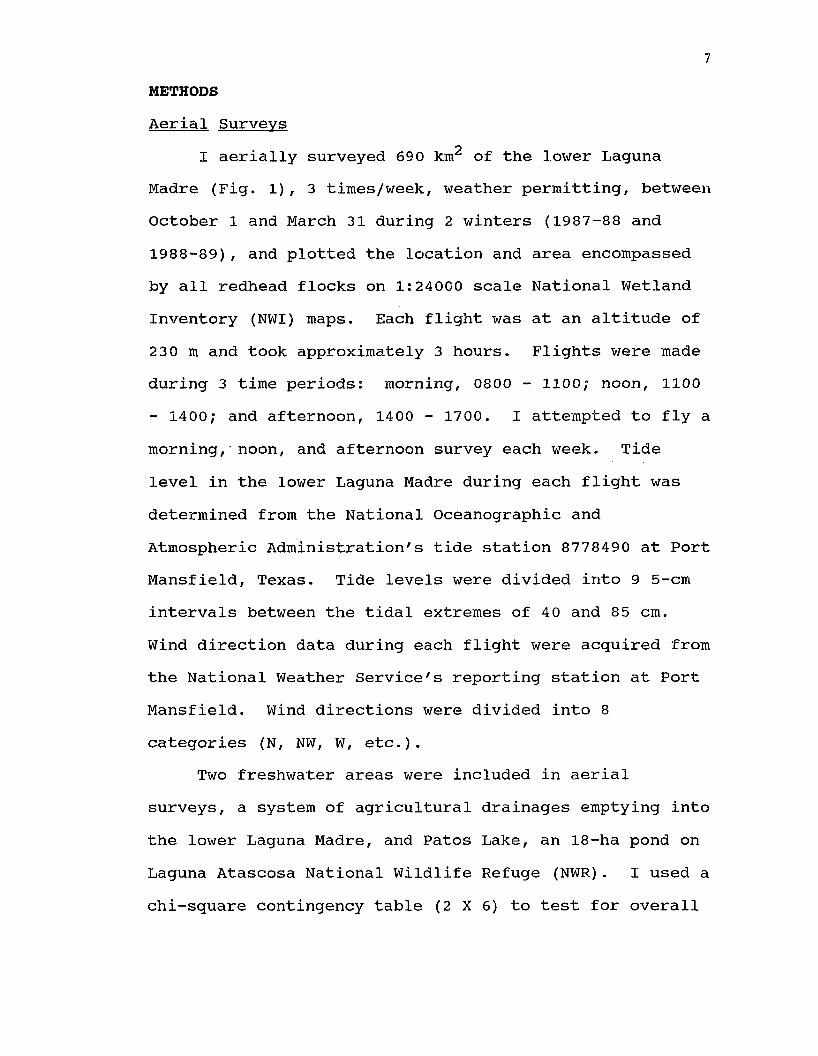
Redhead flocks moved east and west across the lower Laguna Madre as the tide level changed (Fig. 4). When tide levels were high (75 - 85 cm), 90.8% of redhead flocks were present in the 2 segments farthest east (segment C and D). During lowest tides, the majority of flocks (81.9%) was found farther west in the 2 center segments (B and C) (Fig 4.). Segment B had more area covered by flocks at low tides than at high tides, and the converse was true in segment D (P < 0.0001, df =7,20, F = 11.71). Percent of flocks present in segment A or C did not differ between the 2 tide levels.
20
Table 3. Area (ha) of open water, area of monotypic shoalgrass habitat within open water, and average percent of shoalgrass habitat occupied daily in 5segments of the lower Laguna Madre, Texas.
Total Percent used dailyopen water Shoalgrass3 by redheads
Segment (ha) (ha) (mean + 1 SE)
I 8026 5358 0.5 ± 0.07 CbII 14601 6653 1.2 ± 0.17 BC
III 12447 8824 4.3 ± 0.35 AIV 18989 7601 2.1 + 0.23 BV 12813 768 2.0 + 0.30 B
a Shoalgrass area calculated from Merkord (1978).Means sharing same letter are not significantly
different.

21
A B C D
50 - 54 cmXV 1987-88
V \ ** '
A B C D
x x \C3° °oanr' ' ' 1 (O' ' ' IX V \ \
' ' ' \\ \ 7 5 - 7 9 cm1988-89
V V *NX \ \®*\w ' v
ox f ' \x ' 'x̂ V X
\ •"
Figure 4. Redhead flock locations (shown in black) on the lower Laguna Madre, Texas, at 1 low (50 - 54 cm) and 1 high (75 - 79 cm) tide, and graphs of percent of flock polygons in segments A - D for all low (45 - 54 cm) and high (75-84 cm) tides. Horizontal lines are means; vertical bars are + 1 SE. Segments, within tides, sharing same letter are not significantly different.
^ \ V Q>\ U A
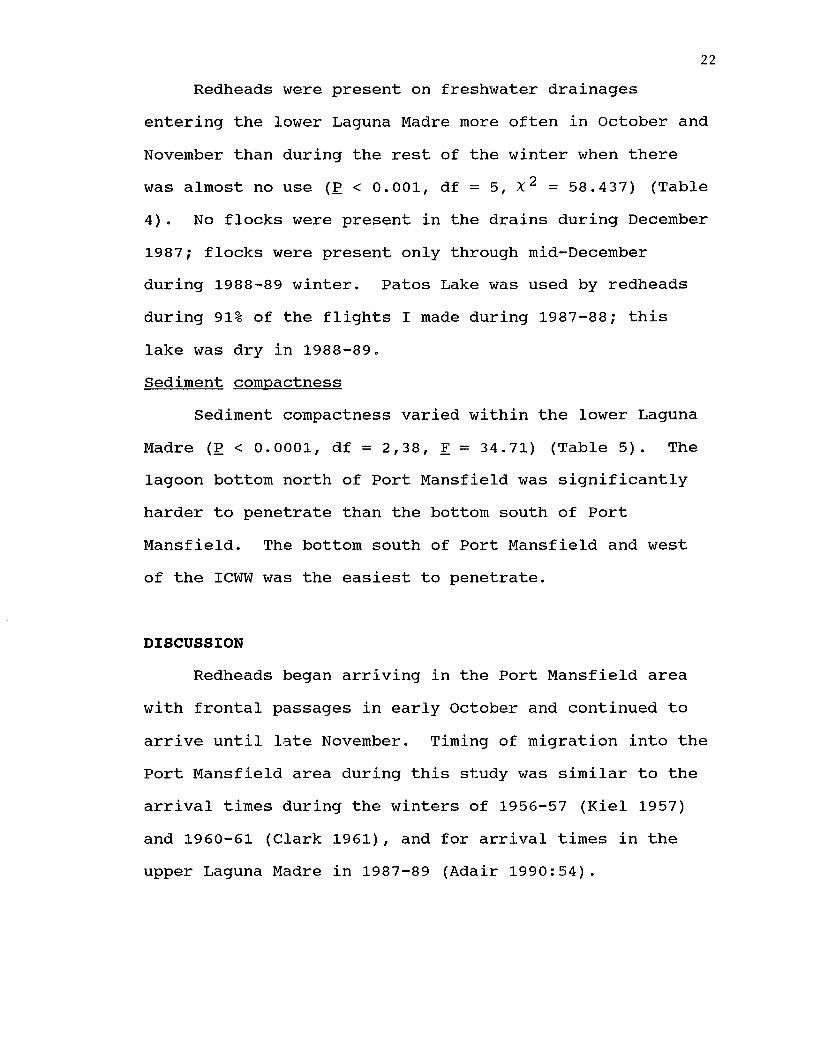
Redheads were present on freshwater drainages entering the lower Laguna Madre more often in October and November than during the rest of the winter when there was almost no use (P < 0.001, df = 5, X 2 = 58.437) (Table4). No flocks were present in the drains during December 1987; flocks were present only through mid-December during 1988-89 winter. Patos Lake was used by redheads during 91% of the flights I made during 1987-88; this lake was dry in 1988-89.Sediment compactness
Sediment compactness varied within the lower Laguna Madre (P < 0.0001, df = 2,38, F = 34.71) (Table 5). The lagoon bottom north of Port Mansfield was significantly harder to penetrate than the bottom south of Port Mansfield. The bottom south of Port Mansfield and west of the ICWW was the easiest to penetrate.
DISCUSSIONRedheads began arriving in the Port Mansfield area
with frontal passages in early October and continued to arrive until late November. Timing of migration into the Port Mansfield area during this study was similar to the arrival times during the winters of 1956-57 (Kiel 1957) and 1960-61 (Clark 1961), and for arrival times in the upper Laguna Madre in 1987-89 (Adair 1990:54).
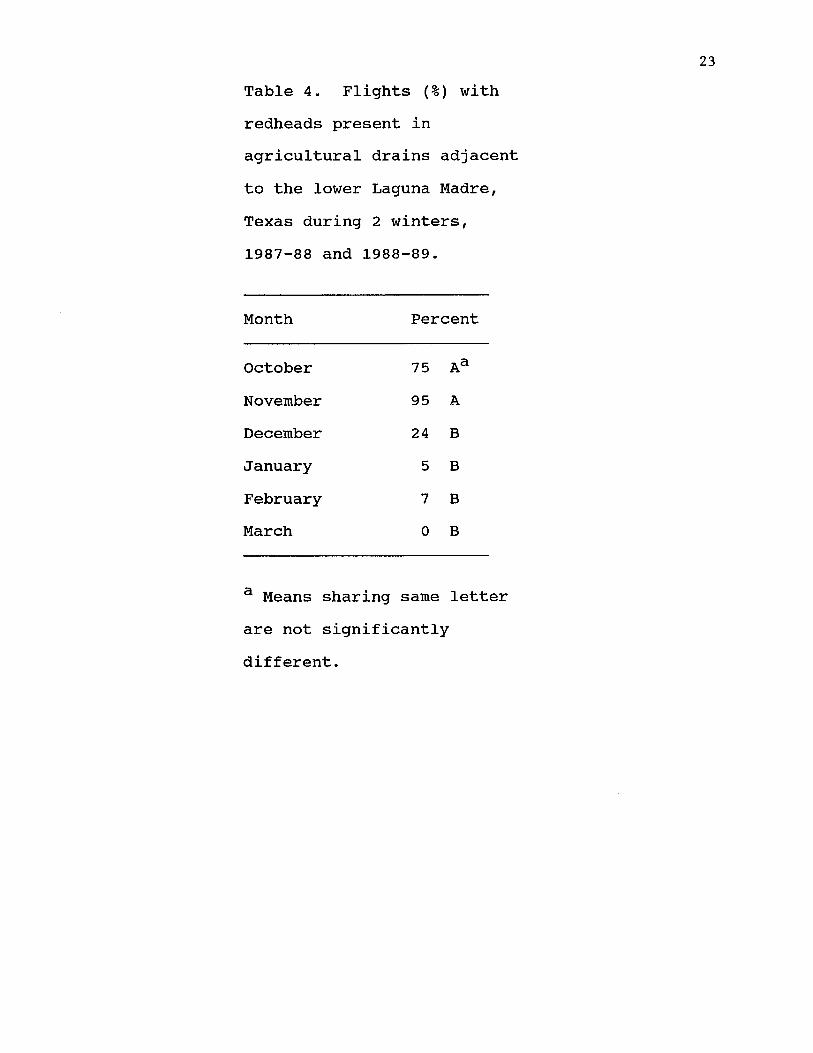
Table 4. Flights (%) with redheads present in agricultural drains adjacentto the lower Laguna MadreTexas during 2 winters,1987-88 and 1988-89.
Month Percent
October 75 AaNovember 95 ADecember 24 BJanuary 5 BFebruary 7 BMarch 0 B
a Means sharing same letter are not significantly different.

24
Table 5. Sediment penetration depths in 3 areas of the lower Laguna Madre, Texas.
Depth penetrated (mm) with
Area n 529 g wgt 2725 g wgtc
North O f Port 9 40.0 ± 1.4 Ab 8 . 4 ± 1 . 0 A bMansfield
South of Port 25 48.2 ± 0.6 B 22.0 + 0.9 BMansfield - east of ICWWSouth of Port 11 54.5 ± 1.3 C 41.3 + 7.5 CMansfield - west of ICWW
a Additional mm penetrated into soil with addition of second weight.b Means within column sharing same letter are not significantly different.

25
Flock size of fall migrants did not vary by time-of- day or by day relative to frontal passage. Arrival rate was higher during afternoon than morning or midday until the second day after frontal passage when arrival rate no longer differed among time-of-day periods. Kiel reported a higher arrival rate (100 redheads/minute) than my rate of 19 redheads/minute (26.4 redheads/flock X 43.4 flocks/hour), however he quantified arrival rate for only a few hours during 1 frontal passage.
Redheads left the lower Laguna Madre over a 2-week period beginning the first of March. By 10 and 13 March each year, average area covered by flocks each flight was < 5% of the average area occupied by flocks per flight during the rest of the winter.
Redheads used the central segment (III) of the lower Laguna Madre earlier than other segments. Flocks covered a larger area in segment III than in any other segment; the average area per flock also was larger in the central portion. The central segment may be more desirable because (1) it contained the most area of monotypic shoalgrass; (2) shoalgrass habitat was spatially clumped not linearly arranged (Merkord 1978); and (3) water was often shallow enough for feeding by tipping up and head dipping (Chapter II). Redheads did not begin using the northern and southern segments until later in the winter, and may have moved into these other areas due to
26
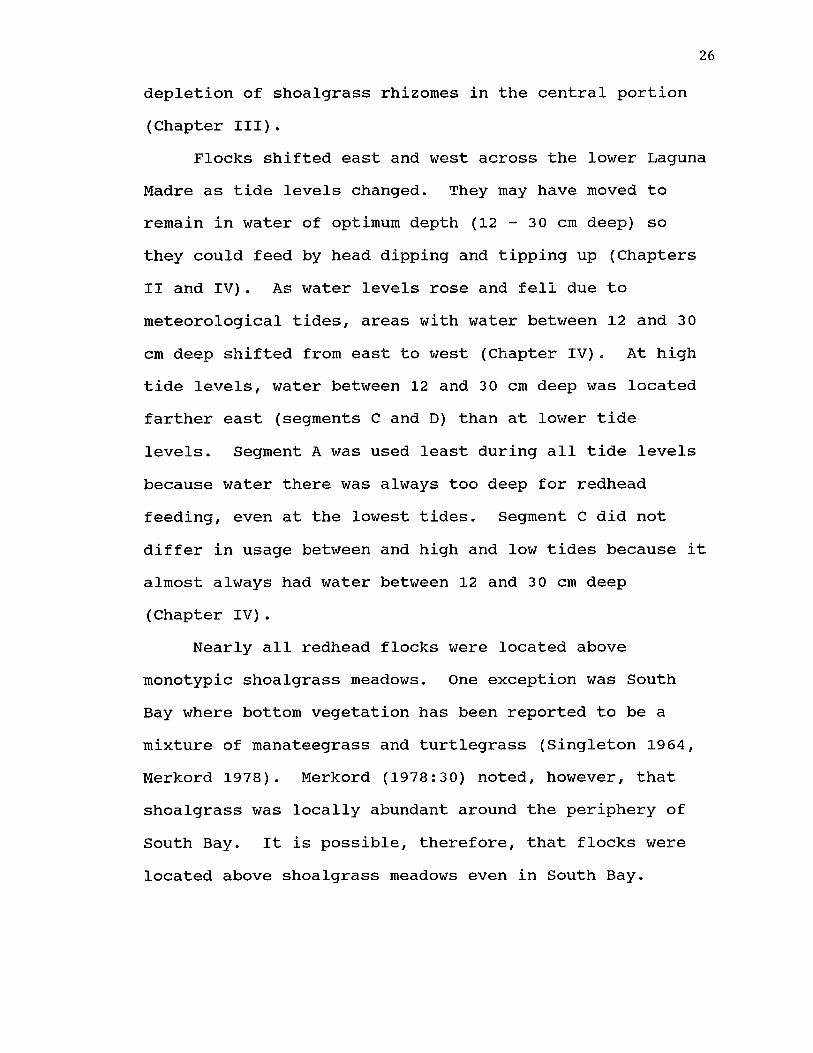
depletion of shoalgrass rhizomes in the central portion (Chapter III).
Flocks shifted east and west across the lower Laguna Madre as tide levels changed. They may have moved to remain in water of optimum depth (12 - 3 0 cm deep) so they could feed by head dipping and tipping up (Chapters II and IV). As water levels rose and fell due to meteorological tides, areas with water between 12 and 3 0 cm deep shifted from east to west (Chapter IV). At high tide levels, water between 12 and 30 cm deep was located farther east (segments C and D) than at lower tide levels. Segment A was used least during all tide levels because water there was always too deep for redhead feeding, even at the lowest tides. Segment C did not differ in usage between and high and low tides because it almost always had water between 12 and 3 0 cm deep (Chapter IV).
Nearly all redhead flocks were located above monotypic shoalgrass meadows. One exception was South Bay where bottom vegetation has been reported to be a mixture of manateegrass and turtlegrass (Singleton 1964, Merkord 1978). Merkord (1978:30) noted, however, that shoalgrass was locally abundant around the periphery of South Bay. It is possible, therefore, that flocks were located above shoalgrass meadows even in South Bay.

27
Between 0.5 and 4.3% of monotypic shoalgrass habitat was covered by redhead flocks daily (0.1 - 3.0% of open water habitat). Because only a small percent of the lower Laguna Madre was covered by redheads flocks during each aerial survey, one might conclude that there was abundant wintering habitat because so little area seemed to be used. However, within shoalgrass habitat, the availability of water between 12 and 30 cm deep may limit the area available each day for redhead feeding (ChapterII), and some areas may have already had the shoalgrass supply depleted (Chapter III). These factors may be partially responsible for the small percent used daily. Presence of greater numbers of wintering redheads might deplete food resources prior to winter's end (ChapterIII) .
Redheads stopped using most freshwater sites near the lower Laguna Madre by mid-December each winter. An exception was Patos Lake that continued to be used by a small proportion of lower Laguna Madre redheads each day. When I used the average correction factor developed by Adair (1990) to correct a single count to reflect total usage of a pond over the course of the entire day, < 15% percent of lower Laguna Madre redheads used fresh water daily after mid-December (average number of redheads in lower Laguna Madre in 1987-88 was 238,000; J. Neaville, unpubl. report). I suggest that redheads used freshwater

areas when they first arrived until they acclimated to the hypersaline conditions in the lower Laguna Madre. Redheads in the Laguna Madre acclimate by hypertrophy of their salt glands (Cornelius 1982); salt glands of redheads in the Laguna Madre weigh 3 times more than salt glands measured at freshwater breeding areas. Size of salt glands is correlated with the salinity of the habitat (Cornelius 1982). Once salt glands become fully functional, redheads may no longer need to drink freshwater daily, and can remain in the lower Laguna Madre without flying to fresh water. Within the lower Laguna Madre, redheads occupied areas with lower salinities than areas not occupied (Chapter III) ; this would further reduce osmotic stress and reduce their need to drink fresh water daily. The proportion of redheads using fresh water daily on the lower Laguna Madre was less than reported for the upper Laguna Madre (Adair 1990). Salinities were approximately 5 - 2 0 ppt less in the lower Laguna Madre and may account for this difference.
Areas used by redhead flocks did not vary by time- of-day or wind direction. Managers scheduling aerial surveys for redheads need not take these 2 variables into consideration.
Previously reported distributional data from the lower Laguna Madre were from surveys done on 1 or 2 days
each month (Kiel 1957, Clark 1961, Cornelius 1977). Numbers of redheads at particular locations may vary widely among survey dates. For example, during 1960-61 the percent of lower Laguna Madre redheads west of the ICWW and south of Three Islands was 7% on 2 3 November,40% on 3 December, and 0.4% on 17 December (Clark 1961). This variation probably does not represent a seasonally shift in flock distribution as Clark suggests, but more likely reflects daily movements.
The proportion of redheads found in different areas of the lower Laguna Madre varied considerably among months in Clark's (1961) monthly surveys, but overall his results were consistent with the distribution pattern I observed. Specific monthly patterns did differ, however. Clark (1961) stated that virtually all redheads shifted their feeding grounds to the west side of the ICWW south of Three Islands by mid-January. His own data do not support this statement as only 6.8% of redheads were in that area in February, which was similar or less than the 1.26 - 42.89% that he counted in that area during 4 surveys prior to mid-January. I found that redheads used the area south of Three Islands west of the ICWW during the entire winter in both years of the study. Redheads increased usage of the area north of Port Mansfield as winter progressed in this study, but not to the extent found during 1960-61 (Clark 1961).
Distribution of redheads in the lower Laguna Madre during winter of 1956-57 (Kiel 1957) differed substantially from what I observed. Kiel (1957) found fewer than 10 percent of lower Laguna Madre redheads east of the ICWW between Port Mansfield and Three Islands during his study; I found the majority of redheads present in that area during both winters of my study.Use of the area north of Port Mansfield remained consistently low during 1956-57 compared to an increase throughout the winter in my study. I know of no reason why redhead distribution during 1956-57 should have been so different from what I found during 1987-88 and 1988- 89.
Redhead distribution during the 1974-75 winter (Cornelius 1977) was similar to what I reported during the 2 winters of my study. Use of the area north of Port Mansfield was substantially more in 1974-75 than in 1987- 88 and 1988-89, however.
Sediment compactness north of Port Mansfield (segment I and II) was greater than elsewhere in the lower Laguna Madre. This attribute may have made these areas less desirable because redheads may have difficulty probing into the relatively hard sediment for rhizomes. Substrate hardness has been previously postulated to affect removal of Vallisneria americana tubers by feeding canvasbacks (Avthya valisineria) in North Carolina
(Lovvorn 1989). Manatees (Trichechus manatus) feed where sediments are soft and not where they are consolidated and difficult to penetrate (Zieman 1982:69). There may be a feedback mechanism operating in the lower Laguna Madre; feeding activity by redheads loosens the soil which subsequently facilitates additional feeding that further un-consolidates the soil. This mechanism is thought to be operating where snow geese (Chen caerulescens) feed on Scirpus americanus rhizomes in Canada (Belanger et al. 1990).
ACKNOWLEDGMENTSI thank Farrell Jones, Susan Landry, Evan Mather,
David Peterson, and Stephanie Weigel, of CADGIS Research Lab for digitizing data and for computer analyses; Phillippe de Myer, Earl White, Rene Palmanez, Bob Sizemore, and other pilots of Young Flying Service and McCreery Aviation Co. for many safe flights; Russell Penrose for penetrometer design help; and Robert Chabreck, Thomas Custer, James Gosselink, Robert Hamilton, William Kelso, and Phillip Zwank for reviewing earlier drafts of the manuscript. Research was conducted under the auspices of the Louisiana Cooperative Fish and Wildlife Research Unit in cooperation with Louisiana State University, Louisiana Department of Wildlife and Fisheries, and Wildlife Management Institute. This
32
manuscript is approved for publication by Director of the Louisiana Agricultural Experiment Station as manuscript **-**-****.
LITERATURE CITEDAdair, S. E. 1990. Factors influencing wintering diving
duck use of coastal ponds in south Texas. M.S.Thesis, Texas A & M Univ., College Station, 201pp.
Belanger, L., J. -F. Giroux, and J. Becard. 1990. Effects of goose grazing on the quality of Scirpus americanus rhizomes. Can. J. Zool. 68:1012-1014.
Clark T. L. R. 1961. Ecology of wintering waterfowl in the lower Laguna Madre. Tex. Parks and Wildl., Job Completion Report, Fed. Aid Proj. W-29-R-14, Job 16.10pp.
Cornelius, S. E. 1977. Food and resource utilization by wintering redheads on lower Laguna Madre. J. Wildl. Manage. 41:374-385.
_____ . 1982. Wetland salinity and salt gland size in theredhead Avthva americana. Auk 99:774-778.
Gunter, G. 1967. Vertebrates in hypersaline waters.Contrib. Mar. Sci. 12:230-241.
Kiel, Jr., W. H. 1957. Ecology of wintering waterfowl in the lower Laguna Madre. Tex. Parks and Wildl., Job Completion Report, Fed. Aid Proj. W-29-R-10, Job 16. 35pp.

Koenig, R. L. 1969. A comparison of the winter foodhabits of three species of waterfowl from the upper Laguna Madre of Texas. M.S. Thesis, Texas A & I Univ., Kingsville, 59pp.
Lovvorn, J. R. 1989. Distributional responses ofcanvasback ducks to weather and habitat changes. J. Applied Ecol. 26:113-130.
McMahan, C. A. 1970. Food habits of ducks wintering on Laguna Madre, Texas. J. Wildl. Manage. 34:946-949.
Merkord, G. W. 1978. The distribution and abundance of seagrasses in Laguna Madre of Texas. M.S. Thesis, Texas A & I Univ., Kingsville, 56pp.
Singleton, J. R. 1964. Ecology of the principal waterfowl food plants of the lower Laguna Madre. Tex. Parks and Wildl., Job Completion Report, Fed. Aid Proj. W- 29-R-14, Job 17. 9pp.
Weller, M. W. 1964. Distribution and migration of the redhead. J. Wildl. Manage. 28:64-103.
Zieman, J. C. 1982. The ecology of the seagrasses ofsouth Florida: a community profile. U.S. Fish and Wildl. Serv. FWS/OBS-82/25. 158pp.
Chapter II
REDHEAD BEHAVIOR IN THE LOWER LAGUNA MADRE AND ADJACENT PONDS OF SOUTH TEXAS
Abstract: Redheads (Aythva americana) winter on thehypersaline Laguna Madre and adjacent fresh to brackish water ponds of south Texas. On the Laguna Madre, feeding (46%) and sleeping (37%) were the most common redhead behaviors; preening (7%), swimming (6%), and resting (4%) were less common. Frequency of most behaviors varied by time of day. A greater percent of the flock fed (64%) during early morning than during the rest of the day (40%). Fewer redheads slept (18%) in early morning than during the rest of the day (42%) . Percent time feeding was negatively correlated with temperature. In contrast to the Laguna Madre, redheads were usually present on fresh to brackish water ponds adjacent to the Laguna Madre only during daylight hours; use of these areas declined as winter progressed. Sleeping (75%) was the most frequently seen behavior at ponds followed by preening (10%), swimming (10%), and feeding (0.4%). Percent sleeping was greatest (90%) during the middle of the day, preening greatest (27%) during early morning, and swimming greatest (27%) during late afternoon. Redheads fed by dipping (58%) more frequently than tipping (25%), diving (16%), or gleaning (0.1%). Water
34
35
depth was least where redheads fed by dipping (16 cm), greatest where they fed by diving (75 cm) and intermediate where they fed by tipping (26 cm). A feeding bout averaged 5.3 sec for dipping, 8.1 sec for tipping, and 19.2 sec for diving.Key words: Avthva americana. behavior, feeding ecology, Laguna Madre, redhead, Texas.
INTRODUCTIONThe primary wintering area for redheads (Avthya
americana) is the Laguna Madre of Texas and Mexico (Weller 1964), the only hypersaline lagoon system in North American (Gunter 1967). There, redheads feed primarily on submerged vegetation, mainly shoalgrass (Halodule wricrhtii) (Koenig 1969:39, McMahan 1970, Cornelius 1977, Merkord 1978, Marsh 1979:23). Singleton (1964) and Merkord (1978) documented a decrease in submerged vegetation and a change in species composition in the lower Laguna Madre between 1960 and 1974; this included a decline in abundance of monotypic shoalgrass meadows from 47,070 to 29,851 ha. The significance of these vegetation losses to redheads is unknown, however a decline in numbers of wintering redheads in the Laguna Madre has been reported (U.S. Fish and Wildlife Service 1983) .

In addition to the Laguna Madre, redheads use adjacent freshwater ponds during their winter residence (Kiel 1957). The extent to which the Laguna Madre and freshwater ponds are used for various activities (e.g. feeding, sleeping, drinking, etc.) has not been documented; only qualitative behavioral data exist for redheads in the Laguna Madre (Koenig 1969:18, Cornelius1977) and only limited data are available for other wintering areas (Alexander 1987). The objective of this study was to use behavioral observations to document and contrast the use by wintering redheads of their 2 primary wintering habitats, the hypersaline Laguna Madre and adjacent freshwater ponds.
METHODSThe Laguna Madre is a shallow (average depth = 1 m),
hypersaline (> 35 ppt) lagoon along the coasts of Texas and Mexico that is separated from the Gulf of Mexico by narrow barrier islands (Rusnak 1960). The U.S. portion is divided into an upper and lower part (Hedgpeth 1947). Adjacent to the Laguna Madre are fresh to brackish water ponds and drainages (hereafter referred to as fresh) that are used by redheads (Kiel 1957). The climate is semi- arid and subtropical with an average minimum and maximum fall and winter temperature (°C) of 13 and 21 (1987-88
37
Port Mansfield reporting station, National Weather Service).
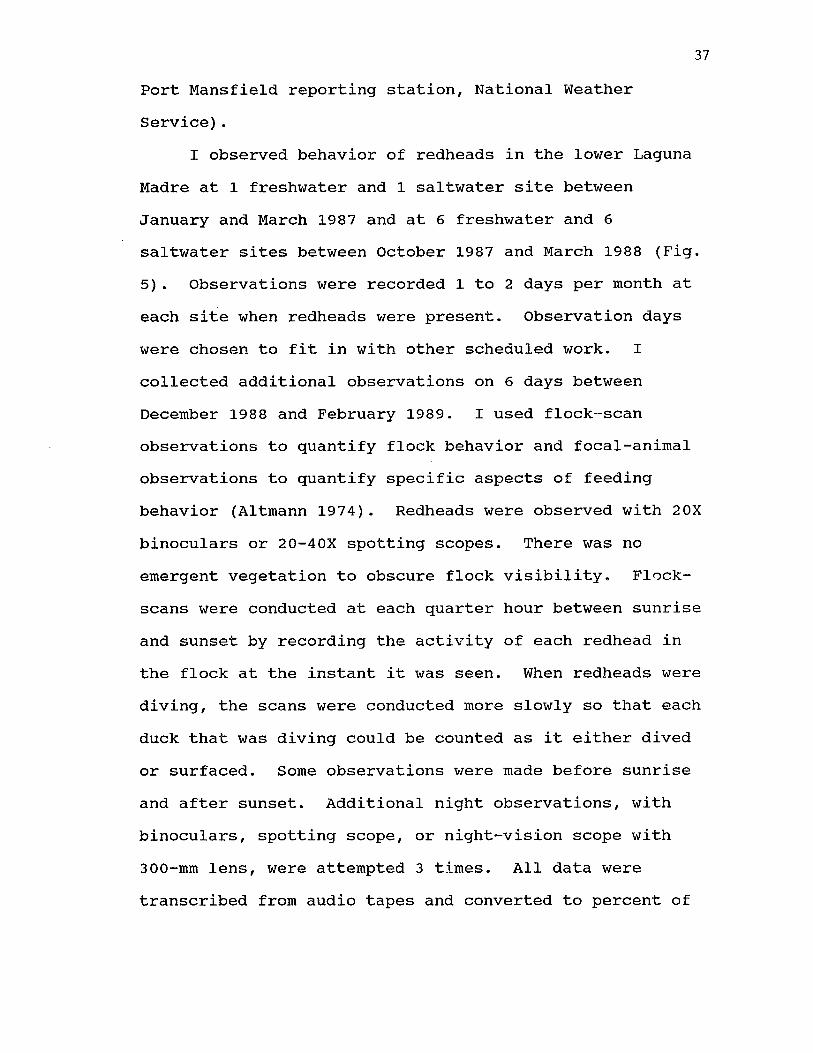
I observed behavior of redheads in the lower Laguna Madre at 1 freshwater and 1 saltwater site between January and March 1987 and at 6 freshwater and 6 saltwater sites between October 1987 and March 1988 (Fig.5). Observations were recorded 1 to 2 days per month at each site when redheads were present. Observation days were chosen to fit in with other scheduled work. I collected additional observations on 6 days between December 1988 and February 1989. I used flock-scan observations to quantify flock behavior and focal-animal observations to quantify specific aspects of feeding behavior (Altmann 1974). Redheads were observed with 20X binoculars or 20-40X spotting scopes. There was no emergent vegetation to obscure flock visibility. Flock- scans were conducted at each quarter hour between sunrise and sunset by recording the activity of each redhead in the flock at the instant it was seen. When redheads were diving, the scans were conducted more slowly so that each duck that was diving could be counted as it either dived or surfaced. Some observations were made before sunrise and after sunset. Additional night observations, with binoculars, spotting scope, or night-vision scope with 300-mm lens, were attempted 3 times. All data were transcribed from audio tapes and converted to percent of
38
Texa s
km
Port M a n s f i e l d -
lower Lagun a Ma dr e
f r e s h w a te ro b se r v a t i o n
s i t e s
s a l t w a t e robse rva t i on
s i t e sPort Isabel
TEXAS
MEXICO
Figure 5. Behavioral observation sites in the lower Laguna Madre, Texas.
39
flock engaged in each activity. Percent of flock is equivalent to percent time (Dunbar 1976, Lehner 1979:112).
Behaviors recorded were (1) agonistic - jabs, chases, or fighting (Alexander 1987); (2) alert - head up, neck usually stretched; (3) bathing - head dipping, wing thrashing, and somersaulting (McKinney 1965); (4) courtship - head-throw (Johnsgard 1965:234); (5) drinking - ingesting water; (6) feeding - partitioned during second field season into (a) dipping - bill, head, or neck only submerged (Poysa 1986a for pictures of this and following feeding postures), (b) diving - duck totally submerged, (c) gleaning - picking or straining from surface, and (d) tipping - up ending with head submerged and tail in air; (7) preening - oiling preening and nibbling preening (McKinney 1965); (8) resting - no other activity, just sitting quietly on water; (9) sleeping - head lying on back with bill tucked into feathers; (10) stretching - includes swimming-shake, wing-flap, and wing-and-leg-stretch (McKinney 1965); and swimming. Behavior of all ducks was recorded for flocks < 250 birds, otherwise, I sampled the flock in strip transects where as many ducks as possible were sampled within a 5- minute period; I ensured that transects covered the entire flock.

40
Between some flock-scans, 5-minute focal-animal feeding observations were made during the first field season; 2.5-minute observations were made during the second field season. I selected a redhead by pointing the scope or binoculars towards the flock and observing the feeding individual nearest the center of the field- of-view. I pointed the scope towards different areas of the flock each time to decrease the probability of observing the same individual more than once. A feeding sequence was divided into 2 parts, time (sec) with head under water and time with head above water. At the moment a redhead raised or lowered its head/body to feed, the event was coded into a computer; a software program (Patuxent Wildl. Res. Ctr., unpubl. program) was used to calculate elapsed time for each part of the feeding sequence. Time spent with head under water and time spent with head above water were averaged for each individual prior to statistical analysis.
For flock-scan data, I divided daylight hours into 5 time periods, each 2 - 2.5 hours long. The 5 time periods are referred to hereafter as early morning (A), mid-morning (B), midday (C), mid-afternoon (D), and late afternoon (E). Daylight hours were divided into only morning and afternoon periods for focal-animal analyses.
At freshwater sites, time-of-day and flock size were recorded for arriving and departing redheads. Data are
41
presented as a percent of the total number of flocks that arrived or departed to standardize for differences in number of flocks arriving and departing on different days. Aggregations of ducks separated in space from other aggregations were considered flocks. Similar diurnal movement patterns were not observed at saltwater sites.
I analyzed flock-scan data with 2-factor factorial analysis of covariance (ANCOVA) (Steel and Torrie 1980), and used an alpha level of 0.05 unless otherwise noted. Factors were month and time-of-day; covariable was daily minimum temperature (°C), as reported by the Port Mansfield recording station of the National Weather Service. Percentages were square root arcsin transformed prior to analysis (Steel and Torrie 1980); average percent + 1 SE are presented in tables, text, and figures. Only behaviors recorded in > 1% of the flock were analyzed in detail. Because the interaction term was significant in all ANCOVAs, means could not be averaged and separated across main factors. Means were separated, therefore, within month categories or time-of- day categories individually. I separated means with 1- way analysis of variance (ANOVA) followed by Bonferroni multiple comparisons (Miller 1981:67-70) within each month individually and within each time-of-day period individually. I analyzed focal-animal data using a 4-

42
factor factorial ANOVA (month, time-of-day, sex, and feeding type) followed by Bonferroni multiple comparisons.
During the second field season data were collected and tested with 1-way ANOVA to determine if differences in flock size, sex, or orientation to the wind affected flock-scan data. When redheads could be censused along the wind gradient the flock was divided into 4 quartiles; the first quartile was upwind and the fourth downwind.
I used paired t-tests to compare pre-disturbance behavior to behavior during the first, second, and third post-disturbance periods to determine the effect of human disturbance on flock behavior. A priori. I considered a flock-scan to be representative pre-disturbance data when no disturbance event had occurred within the previous hour. I used 1-way ANOVA tests to compare disturbance rates between salt- and freshwater habitats.
In 1989, during a rare period of cold temperatures,I collected flock-scan data during afternoon periods on 2 cold days (4 and 7 February, temp, range -1 to 6 °C) and compared these with afternoon observations on a warm day (12 February, temp, range 14 to 21 °C). Temperatures had been warm for 3 days prior to 12 February.
On 3 days between December 1988 and February 1989, I located 2 0 different feeding redhead flocks, recorded their feeding method, and took 6 water depth (cm)
43
measurements where the flock had been feeding. Redheads dipping and tipping in the same area were categorized as "mixed" feeding. Depth measurements at each site were averaged before analysis.
RESULTSFlock-Scan Observations
I observed redheads for a total of 254 hours (995 flock scans) at saltwater and freshwater habitats. I found significant differences, for all ANCOVA tests, for behaviors occurring in > 1% of the flock. Month was a significant factor for all behaviors except preening and feeding. Time-of-day was a significant factor except for swimming in salt water and resting in fresh water. All interaction terms were significant.Saltwater Habitat
The average number of redheads sampled in each flock-scan was 185 + 9 6 (n = 657). Feeding was the dominant activity in saltwater habitats; it averaged 46%+ 1% of the flock's activities (Fig. 6). A greater percent of the flock fed in early morning than during the rest of the day. During the hour before sunrise, 69 ±7.5% (n = 7) of the flock fed. During the hour after sunset 45+14.1% (n = 5) fed. Some feeding occurred at other times of night; these data were not analyzed because sample size was too small.

44
o20
80eZ 60ceu«o.
40
20
60
» 0.0370 * 0.0003 = 0.0012 <0.0001
• bat>*beb bb b«b" b b b»h® bb*>«h*
u5mM l1"^. ^ < ^ \
• 0.0198 * 0 .0397 * 0 .0 0 0 9
• n b b ab*b o b oba b o b ac obb ®bcfJl K-i p-S nA py-i0.0001 «0.0001 * 0.0001 *0.0001
IJ. Ii
L/l
^LL I l \
jb o a a n
V,1Id b a (
< 0.0001
> k
c m b b
S l e e p
< 0.0001 < 0.0001 <0.0001 < 0.0001 < 0.0001
J.
g 0 WMJUUt
L
* b bbc*
m jo16 tn,n JLLU. I I « I
H f i
i a.i. i
A F e e d
A B O D E A B C D E A B C D E A B O D E A B O D E A B O D E Nov De c J e n F o b Ma r al l m o n t h s
Figure 6. Activities of redheads at saltwater sites on the lower Laguna Madre, Texas, during winters of 1986-87 and 1987-88. Vertical bars are + 1 SE. X-axis time-of- day categories are early morning (A), mid-morning (B), midday (C), mid-afternoon (D), and late afternoon (E). Sample size above baseline. Significant P values above each histogram. Bars within month that share same letter or without letters are not significantly different.
45
Sleeping averaged 37 + 1% of the flock's activities (Fig. 6). Percent sleeping was generally greatest during the 3 mid-day periods and declined by late afternoon except during December when percent sleeping was greatest just before sunset.
Preening averaged 7 + 0.3% of the flock's activities (Fig. 6). It did not follow any particular time-of-day pattern. Swimming was observed in 6 + 0.5% of the flock. There were no time-of-day differences. Resting averaged 3.5 + 0.3% of the flock's activities and tended to be highest in late afternoon although this was not consistent.
Only 7 of 25 possible 1-way ANOVAs used to test for month effects within each time period individually were significant. Percent sleeping varied among months for all 5 time-of-day periods, percent swimming varied among months only during mid-afternoon (D), and percent resting varied among month only during late afternoon (E). Generally only 1 month differed from the others and I could not detect any particular pattern. For example, during early morning (A) a higher percent of the flock slept in January than during other months; during midday (C) a higher percent slept in March than during other months.
Because there were no consistent monthly trends for common behaviors, I analyzed activities that occurred in

46
< 1% of the flock only for time-of-day differences. Drinking was the only behavior, which occurred in < 1% of the flock, that varied by time-of-day (P = 0.0013, df = 4,652, F = 4.51). A greater percent of the flock was observed drinking during early morning (0.3 + 0.09%) than during midday or 2 afternoon periods, which averaged 0.08 + 0.01%. Percent drinking during mid-morning was 0.14 + 0.04% and did not differ from the other 4 periods.Percent of flock engaged in the remaining 6 behaviors was 0.3 + 0.03 (stretching), 0.2 + 0.02 (bathing), 0.1 + 0.02 (drinking), 0.1 + 0.04 (alert behavior), 0.08 ± 0.01 (agonistic encounters), and 0.01 + 0.004 (courtship).
Minimum temperature (covariable) affected percent of flock feeding (P < 0.0001, df = 1,632, F = 16.61) and sleeping (P = 0.0467, df = 1,632, F - 3.97) at saltwater sites but did not affect percent swimming, preening, or resting. As temperature decreased feeding increased and sleeping decreased. These same results were found during the extreme cold in February, 1989. A greater percent of redheads fed (60 + 2.3%) during the extreme cold period than during warmer weather (20 + 1.2%) (P < 0.0001, df = 1,52, F = 125.24). There also was less sleeping (33 +2.5% versus 69 + 1.5%) (P < 0.0001, df = 1,52, F =108.67), preening (6 + 0.5% versus 7 + 0.9%) (P = 0.0490, df = 1,52, F = 4.07), and resting (0.6 + 0.2% versus 2 + 0.3%) (P = 0.0023, df = 1,52, F = 10.24).
47
Freshwater HabitatThe average number of redheads sampled in each
flock-scan was 239 ± 8 (n = 338). Sleeping was the dominant activity (75+1%) of redheads at freshwater sites (Fig. 7). Generally fewer redheads slept during early morning and late afternoon than during the middle of the day.
Preening occurred most often during early morning (Fig. 7). Over the entire day, preening averaged 10 +0.5% of the flock's activities. Percent swimming averaged 10 + 1% of flock behavior throughout the day, and was greater in late afternoon compared with the rest of the day in 3 of 5 months and for all months combined (Fig. 7). Resting averaged 3.4 + 0.5% and did not differ by time-of-day.
Month was a significant factor in 7 of 20 possible ANOVAs. Sleeping varied among months during time-of-day period's B, D, and E; swimming varied among months during late afternoon (E); and resting varied among months during time-of-day period's A, B, and E. Like observations in saltwater habitats, usually only 1 month differed from the rest and no trends were apparent.
Bathing was the only behavior occurring in < 1% of the flock that differed by time-of-day (P < 0.0001, df = 4,333, F = 6.71). More bathing was observed during early morning (0.90 + 0.19%) than during the mid-day periods
48
20Rest
= 0.0030
40 Swim< 0.0001 < 0.0001 < 0.0001
20
0.0000 = 0.0052 < 0.0001 < 0.0001
Preen
A
< 0.0001 < 0.0001
,1 bcc be
< 0.0001 < 0.0001 < 0.0001 < 0.0001
80
S le e p60
40
,bd ab
20
A B C D E A B C D E A B C D E A B C D E A B C D E A B C D E ABCDEOct Nov De c J a n F e b Ma r al l m o n t h s
Figure 7. Activities of redheads at freshwater sites on the lower Laguna Madre, Texas, during winters of 1986-87 and 1987-88. Vertical bars are + 1 SE. X-axis time-of- day categories are early morning (A), mid-morning (B), midday (C), mid-afternoon (D), and late afternoon (E). Sample size above baseline. Significant P values above each histogram. Bars within month that share same letter or without letters are not significantly different.
(0.35 + 0.05%). Bathing during late afternoon (0.54 + 0.11%) did not differ from either early morning or middle of the day time periods. The percent of flock feeding, stretching, courting, or engaged in alert posture and agonistic behavior was 0.4+0.11, 0.5+0.04, 0.01+ 0.004, 0.3 + 0.20, and 0.04 + 0.01, respectively.Drinking averaged 0.3 + 0.04%, and although there were no time-of-day differences, there was between 38 and 68% more drinking during early morning than during the 3 afternoon periods. When 2 flocks were sampled just after they landed on fresh water, 13% of the flock was observed to drink.
Feeding in fresh water was < 0.4% of the flock's activities. Time spent feeding was of shorter duration in fresh water than it was in salt water. Redheads in fresh water fed for an average of only 54 + 17 sec (n = 9). One of 9 redheads (11%) fed for the entire 2.5- or 5-minute focal animal observation period at freshwater sites; a higher percentage of redheads (94%) at saltwater sites fed for the entire 2.5- or 5-minute focal animal feeding observation period (n = 264) compared to freshwater sites (P < 0.001, df = 1 , X2 = 74.17).
Redheads usually only used freshwater sites during daylight hours. They arrived at freshwater sites from sunrise until mid-morning and departed from mid to late afternoon (Fig. 8). Usually less that 10% of redheads
50
c4>Ow0)a
20Arrival Departure r \
15
10
5
ISunrise
ISunset
Figure 8. Percent of redhead flocks arriving (n = 514) and departing (n = 770) per hour on 3 days from freshwater sites adjacent to the lower Laguna Madre, Texas. Scale marks on x axis are 1-hour intervals.
51
remained at freshwater sites after sunset, and they were not present there the following morning. Flock size was not significantly different between arriving (39 + 2, n = 486) and departing (41 ± 2, n = 848) flocks.Both Habitats
Agonistic encounters were < 0.1% of the flock's activities. Males initiated more aggressive attacks (21 of 30) than did females (9 of 30) (Binomial test, P = 0.0444). Males and females were attacked equally (Fisher Exact P = 1.00). Ten of 21 attacks by males were directed at other males and 11 were directed at females. Four of 9 attacks by females were directed at males and 5 were directed at females.
While redheads usually formed 1 flock at a location, on 1 occasion 2 flocks of different sizes (n = 273 + 25 and n = 39 + 2 redheads) were maintained for several hours. During this time there was no difference between large and small flocks in percent sleeping (95 + 1.0 versus 89 + 3.4), preening (3 + 0.5 versus 4 + 1.4), swimming (1 + 0.7 versus 3 + 1.3), resting (0.4 + 0.1 versus 3 + 1.4), or drinking (0.2 + 0.1 versus 0.5 +0.3). Stretching, bathing, and agonistic encounters were only observed in the large flock. Alert posture and courtship were not seen in either group.
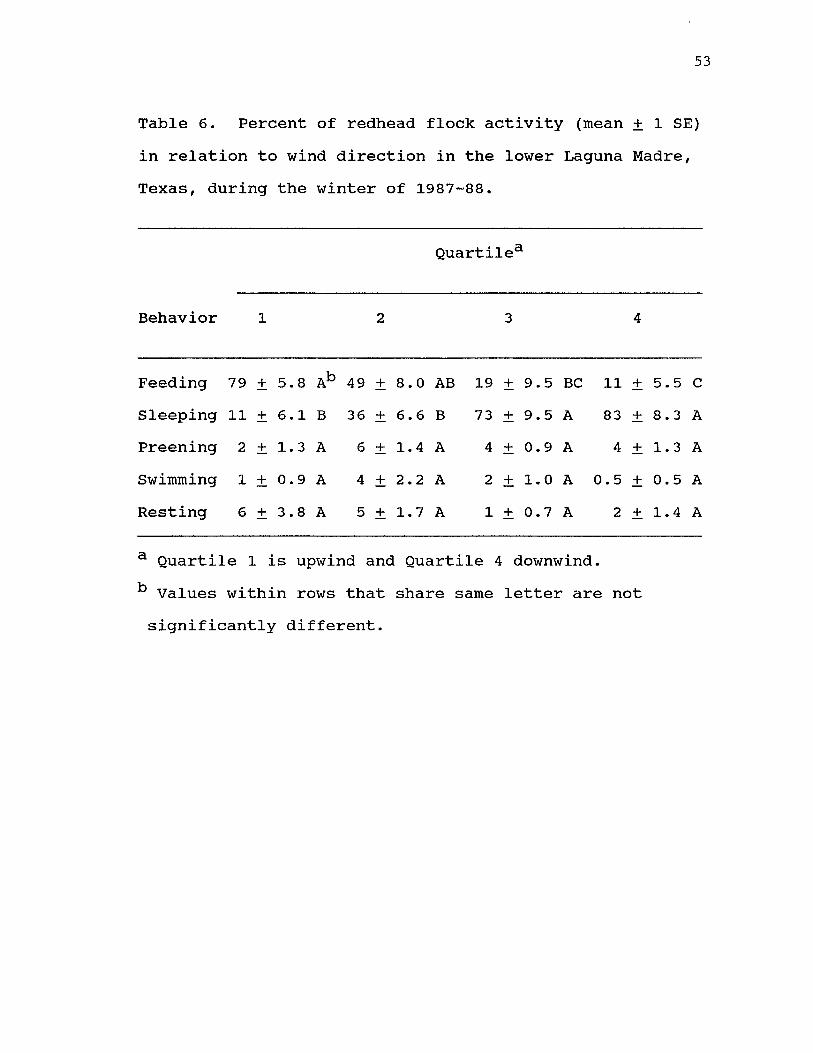
Frequency of behaviors varied by position in the flock relative to wind direction. A flock of 200 + 8

52
redheads was observed relative to wind direction for 3 hours. A greater percent of redheads fed in the upwind part of the flock (Quartile 1) (P < 0.0001, df = 3,24,F = 16.98) than in downwind quartiles (3 and 4) (Table6); a greater percent slept (P < 0.0001, df = 3,24, F = 15.34) in downwind quartiles than in upwind quartiles. Preening, swimming, and resting did not vary relative to wind direction.
On 10 occasions when flocks were close enough to distinguish sex of all individuals, there was no difference between males and females in percent feeding, sleeping, swimming, or preening. Other behaviors were seen too infrequently to test.
Redheads at freshwater sites were disturbed less often (6 of 11 days) than at saltwater sites (14 of 16 days) (Fisher Exact P = 0.084). Disturbances (boats, airplanes, helicopters, and shore activity) occurred more frequently (P = 0.0130, df = 1,18, F = 7.59)) at saltwater (once every 2.3 + 0.7 hours) than at freshwater sites (once every 6.1 + 1.5 hours). During 61 of 93 disturbance events, redheads merely became alert and/or swam away from the source of the disturbance. Thirty-two times redheads flushed from the water; on 17 occasions the flock left the area entirely, 9 times they circled and landed in the immediate vicinity, and 6 times part of the flock left the area while others circled and landed.
53
Table 6. Percent of redhead flock activity (mean + 1 SE) in relation to wind direction in the lower Laguna Madre, Texas, during the winter of 1987-88.
Quartilea
Behavior 1 2 3 4
Feeding 79 + 5.8 Ab 49 + o•00 AB 19 + 9.5 BC 11 + 5.5 C
Sleeping 11 + 6.1 B 36 + 6.6 B 73 + 9.5 A 83 + 8.3 APreening 2 + 1.3 A 6 + 1.4 A 4 + 0.9 A 4 + 1.3 ASwimming 1 + 0.9 A 4 + 2.2 A 2 + 1.0 A in•
o + 0.5 AResting 6 + 3.8 A 5 + 1.7 A 1 + 0.7 A 2 + 1.4 A
a Quartile 1 is upwind and Quartile 4 downwind. b Values within rows that share same letter are not significantly different.

54
When redheads remained in an area after a disturbance and there were adequate pre-disturbance data,I detected a 13% increase in swimming during the first post-disturbance observation period (P = 0.0240) with a concomitant but nonsignificant decrease in feeding (-10%) and sleeping (-5%, n = 20) . By 30 minutes postdisturbance and later, there were no differences between pre- and post-disturbance values for swimming, feeding, sleeping, resting, or preening.Focal-Animal Observations
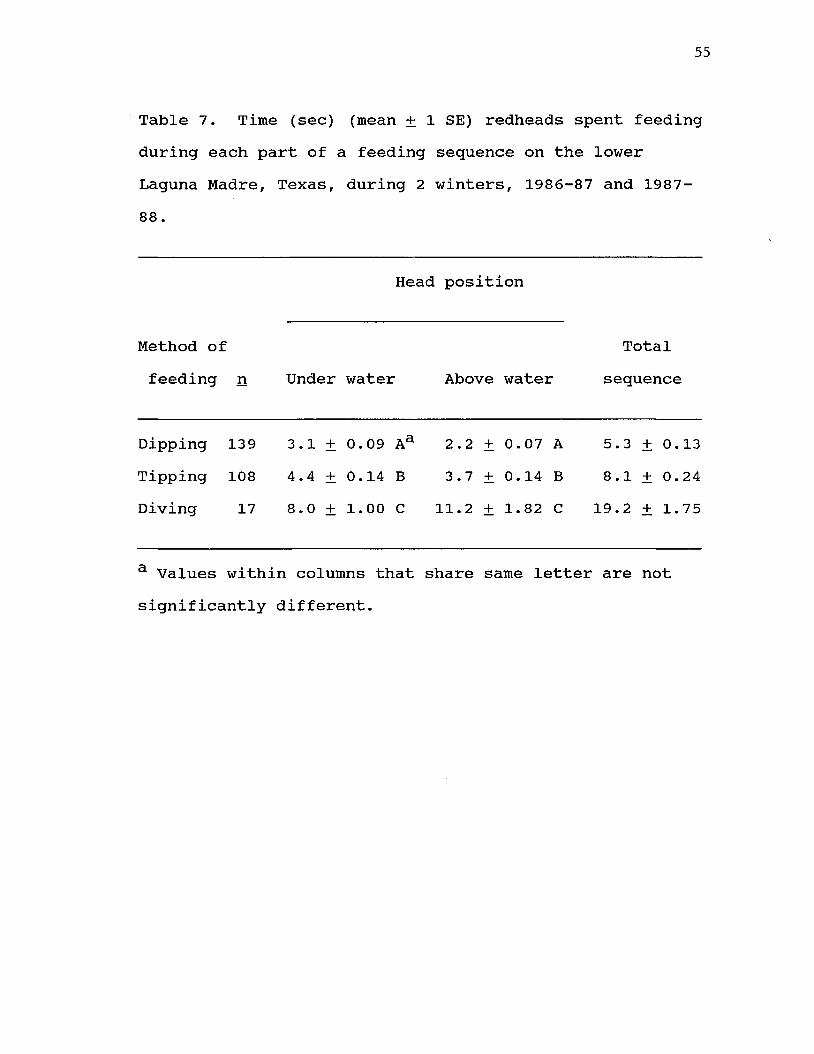
I made focal-animal feeding observations on 147 male and 117 female redheads. Time spent with head above or head below water did not vary with time-of-day, sex, or month. Time spent feeding by the 3 feeding methods differed for both time with head above water (P < 0.0001, df = 1,190, F = 93.78) and time with head below water(P < 0.0001, df = 1,190, F = 69.57) (Table 7). Acomplete feeding sequence averaged 5.3 seconds for dipping, 1.6 times longer when tipping, and 3.7 times longer when diving. Rate of feeding averaged 11, 7, and 3 per minute for dipping, tipping, and diving, respectively.
Redheads fed by dipping (58 + 0.02%) more frequently (P < 0.0001, df = 3,1836, F = 226.49) than by tipping (25+ 1.8%), diving (16 + 1.6%), or gleaning (0.1 + 0.06%).There was no difference between sexes for percent dipping
55
Table 7. Time (sec) (mean + 1 SE) redheads spent feeding during each part of a feeding sequence on the lower Laguna Madre, Texas, during 2 winters, 1986-87 and 1987- 88.
Head position
Method of Totalfeeding n Under water Above water sequence
Dipping 139 3.1 ± 0.09 Aa 2.2 ± 0.07 A 5.3 + 0.13Tipping 108 4.4 ± 0.14 B 3.7 ± 0.14 B 8.1 ± 0.24Diving 17 8.0 ± 1.00 C 11.2 ± 1.82 C 19.2 ± 1.75
a Values within columns that share same letter are not significantly different.
56
(male 48 + 9.3%, female 45 + 10.0%) or tipping (male 14 + 5.1%, female 15 + 3.6%) (n = 10). Dipping was done in more shallow water (P < 0.0001, df = 3,16, F - 159.81) than either "mixed" feeding, tipping, or diving (Table 8). I noticed that redheads dived even in shallow water when the water surface was rough.
DISCUSSIONThe 45% of the time redheads spent feeding
(approximately 5 hours/day), is similar to feeding time of other diving duck species (Nilsson 1970, Pedroli 1982, Hohman 1984, Goudie and Ankney 1986, Thompson et al.1988, Bergan et al. 1989), but more than the 25% reported for redheads in the upper Laguna Madre (Adair 1990:71). More time was spent feeding immediately after sunrise than during the rest of the day. Other diving ducks also spend more time feeding in the morning, but either have a late afternoon feeding peak (Clark 1969, Campbell 1978) or no time-of-day differences (Thompson et al. 1988). Feeding periodicity by diving ducks in coastal habitats is related to tidal cycles (Campbell 1978, Goudie and Ankney 1986); however, tides in the Laguna are small (Rusnak 1960), and do not influence redhead feeding periodicity.
Although a diving duck, redheads fed by diving (16%), less frequently than by dipping (58%) or tipping

57
Table 8. Feeding depths of redheads onthe lower Laguna Madre, Texas, during winter,1988-89.
Method of feeding n
Water depth (cm)
Mean 1 SE Extremes3
Dipping 9 16 Ab 1.0 12 / 22Mixedc 6 22 B 0.6 20 / 24Tipping 4 26 B 1.3 25 / 30Diving 1 75 C 66 / 80
a Maximum and minimum recorded water depths.r_ Values within columns that share same letter are not significantly different. c Mixed feeding was both dipping and tipping.
(25%). Other ducks also have this pattern. Pochards (Aythva ferina) in England dip and tip when water is shallow (Thomas 1976). Eiders (Somataria mollissima) in Scotland tip more frequently than they dive (Campbell1978), and a variety of dabbling ducks dip rather than tip (Tamisier 1976, Poysa 1986b). In contrast, pochards, tufted ducks (Avthva fuliqula), and white-backed ducks (Thalassornis leuconotus) dive even in shallow water (< 30 cm deep) (Clark 1969, Thomas 1976). Redheads, like harlequin ducks (Histrionicus histrionicus) (Bengtson 1966), dived even in shallow water when waves were high because of the difficulty in maintaining position relative to the bottom in rough water. This feeding preference seemed advantageous because dipping (5.3 sec) consumed less time than tipping (8.1 sec) or diving (19.2 sec). Energetic costs also would probably be less when dipping. Because a diving sequence took > 3 times as long as a dipping sequence, redheads would have to spend > 15 hours/day feeding if they were forced to feedexclusively by diving. This calculation does not takeinto account additional energetic costs associated with diving, and assumes that the amount of food taken is the same regardless of feeding type.
Water depth when redheads fed by dipping and tipping was between 12 and 30 cm (inclusive). Maximum waterdepth (30 - 34 cm) for feeding by tipping was similar for
59
wigeon (Anas penelope) and shovelers (Anas clypeata) (Thomas 1976).
Temperature also influenced time spent feeding. As temperatures decreased redheads spent more time feeding as do other diving ducks (Nilsson 1970). Small ducks, with higher surface to mass ratio (e.g. green-winged teal, Anas crecca), decrease feeding time apparently to conserve heat during cold periods (Quinlan and Baldassarre 1984).
Before this study, it was the undocumented consensus that redheads fed in fr-eshwater ponds adjacent to the Laguna Madre. I discovered redheads rarely fed (0.4%) in these ponds. Redheads also rarely fed at freshwater sites in the upper Laguna Madre during winters of 1987-88 and 1988-89 (Adair 1990:72). I suggest that ponds serve as a source of fresh water for redheads acclimating to the hypersaline water of the Laguna Madre. Redheads seemed to become less dependent on dietary fresh water as winter progressed because the number of freshwater areas used decreased beginning in December. Some redheads (approximately 2000 - 3000 per day, unpubl. data), which is < 5% of lower Laguna Madre redheads (total redhead count = 238,000, J. Meaville, U.S. Fish and Wildl. Serv., unpubl. report) continued to use some freshwater sites for the entire winter.

When redheads first arrived at freshwater ponds they immediately drank, preened, and bathed before settling in to sleep for the rest of the day. Percent of flock preening and bathing was greatest during early morning; percent drinking was greatest during early and midmorning, but not significantly so. Prior to departure from the pond, redheads began to swim slowly. Increased swimming during late afternoon corresponded to peak departure time from fresh water. Kiel (1957) also observed early morning arrival and late afternoon departure from freshwater ponds during 1956-57, but Cornelius (1977) did not during the 1974-75 winter. On the upper Laguna Madre during winters of 1987-88 and 1988-89 (Adair 1990:68), most redheads departed from freshwater sites by sunset as I found in the lower Laguna Madre. There was more in and out activity during the day at freshwater ponds adjacent to the upper Laguna Madre (Adair 1990:94), however, than I found at freshwater ponds adjacent to the lower Laguna Madre. This may have been because there was little available surface area at freshwater sites in the upper Laguna Madre; redheads circled ponds until space opened up when other redheads departed (Adair 1990:93). There was always plenty of open water at freshwater sites adjacent to the lower Laguna Madre so redheads did not have to cycle in and
Behavior of redheads did not differ by sex. This agrees with findings for ring-necked ducks (Avthva collaris) in Florida (Hohman 1984) , and for buffleheads (Bucephala albeola) and ruddy ducks (Oxvura iamaicensis) in South Carolina (Bergan et al. 1989). In contrast, female lesser scaup (Avthya affinis) and ring-necked ducks wintering in South Carolina spent more time feeding than males (Bergan et al. 1989). Focal-animal feeding rates also did not vary by sex in this study, nor did they vary by sex for gadwall (Anas strepera), northern pintail (Anas acuta), green-winged teal in North Carolina (Hepp 1985), or for 6 species of diving and ocean ducks in Sweden (Nilsson 1972). Based on my findings, I hypothesize that energetic expenditures are apparently similar for male and female redheads during winter when females do not have increased expenditures associated with reproduction.
Redheads on the lower Laguna Madre were disturbed 2 to 5 times/day; this was greater than disturbance levels in green-winged teal (0.7 times/day) and northern pintail (0.8 times/day) wintering in Louisiana (Tamisier 1976), but about the same as for diving ducks on the upper Mississippi River (Korschgen et al. 1985). Redheads on freshwater sites in this study were disturbed less than those on saltwater sites; freshwater sites were located on national wildlife refuge or private land with limited

62
public access. Excessive disturbance can cause changes in distributional patterns (Tuite et al. 1983, Bell and Austin 1985) and/or increase stress and energy demands (Kendeigh et al. 1977) .
Changes in behavior caused by disturbance on dark- bellied brant (Branta bernicula) rarely lasted more than 20 minutes (Owens 1977). Similarly, for redheads that remained in an area after disturbance, I observed no effect of disturbance 30 minutes after it occurred. Redheads responded to disturbance by swimming more and feeding or sleeping less as Morton et al. (1989) also observed in black ducks (Anas rubripes) in Virginia.
The documented loss of monotypic shoalgrass meadows in the lower Laguna Madre (Singleton 1964, Merkord 1978) is cause for concern; shoalgrass is the main food for wintering redheads and they feed in water < 3 0 cm deep. Redheads are not flexible in adapting to changes in their winter food. When submerged vegetation declined in Chesapeake Bay, winter abundance of redheads declined concurrently (Stevenson and Confer 1978:109, Perry et al. 1981). Redheads did not switch to an alternate food and remain in the Bay as did canvasbacks (Avthva valisineria) (Perry et al. 1981, Perry and Uhler 1988).
Although redheads did not feed at freshwater sites, these areas may be very important. They were a source of fresh water for many redheads when they first arrived in
63
the Laguna Madre, and perhaps helped them acclimate to the hypersaline conditions there. They continued to be used by a smaller number of redheads throughout the winter. Proper management of freshwater and saltwater habitats is necessary to ensure that the lower Laguna Madre remains a viable wintering area for redheads.
ACKNOWLEDGMENTSI thank A. R. Rauch and other staff of Laguna
Atascosa National Wildlife Refuge; L. Powell, Buena Vista Ranch; J. Taylor, El Sauz Ranch; D. Vice, Boardwalk Condominiums; and the U.S. Coast Guard for access to their properties. I also thank C. M. Glenn for data entry; M. G. Holmes for library assistance; G. W.Pendleton for statistical advice; and G. A. Baldassarre,R. H. Chabreck, T. W. Custer, J. G. Gosselink, R. B. Hamilton, D. G. Jorde, W. G. Kelso, G. M. Smith, M. W. Tome, P. J. Zwank, and 3 anonymous reviewers for reviewing the manuscript. Research was conducted under the auspices of the Louisiana Cooperative Fish and Wildlife Research Unit in cooperation with Louisiana State University, Louisiana Department of Wildlife and Fisheries, and Wildlife Management Institute. This manuscript is approved for publication by Director of the Louisiana Agricultural Experiment Station as manuscript 90-22-4079.

LITERATURE CITEDAdair, S. E. 1990. Factors influencing wintering diving
duck use of coastal ponds in south Texas. M.S. Thesis, Texas A & M Univ., College Station. 201pp.
Alexander, W. C. 1987. Aggressive behavior of wintering diving ducks. (Aythyini). Wilson Bull. 99:38-49.
Altmann, J. 1974. Observational study of behavior: sampling methods. Behaviour 49:227-267.
Bell, D. V., and L. W. Austin. 1985. The game-fishing season and its effects on overwintering wildfowl. Biol. Conserv. 33:65-80.
Bengtson, S. 1966. Field studies on the Harlequin Duck in Iceland. Wildfowl Trust Ann. Rep. 17:79-94.
Bergan, J. F., L. M. Smith, and J. J. Mayer. 1989. Time- activity budgets of diving ducks wintering in South Carolina. J. Wildl. Manage. 53:769-776.
Campbell, L. H. 1978. Diurnal and tidal behaviourpatterns of eiders wintering at Leith. Wildfowl 29:147-152.
Clark, A. 1969. The behaviour of the white-backed duck. Wildfowl 20:71-74.
Cornelius, S. E. 1977. Food and resource utilization by wintering redheads on lower Laguna Madre. J. Wildl. Manage. 41:374-385.

Dunbar, R. I. M. 1976. Some aspects of research designand their implications in the observational study of behaviour. Behaviour 58:78-98.
Goudie, R. I. and C. D. Ankney. 1986. Body size, activity budgets, and diets of sea ducks wintering in Newfoundland. Ecology 67:1475-1482.
Gunter, G. 1967. Vertebrates in hypersaline waters.Contrib. Mar. Sci. 12:230-241.
Hedgpeth, J. W. 1947. The Laguna Madre of Texas. Trans.North Am. Wildl. Conf. 12:364-380.
Hepp, G. R. 1985. Effects of environmental parameters on the foraging behavior of three species of wintering dabbling ducks (Anatini). Can. J. Zool. 63:289-294.
Hohman, W. L. 1984. Diurnal time-activity budgets for ring-necked ducks wintering in central Florida.Proc. Southeast. Assoc. Game and Fish Comm. 38:158- 164.
Johnsgard, P. A. 1965. Handbook of waterfowl behavior.Cornell University Press, Ithaca, N.Y. 378pp.
Kendeigh, S. C., V. R. Dol'nik, and V. M. Gavrilov. 1977. Avian energetics. Pages 127-204 in J. Pinowski and S. C. Kendeigh, eds. Granivorous birds in ecosystems. Cambridge Univ. Press, Cambridge.
Kiel, Jr., W. H. 1957. Ecology of wintering waterfowl in the lower Laguna Madre. Tex. Parks and Wildl. Job Completion Report, Fed. Aid Proj. W-29-R-10, Job 16. 35pp.
Koenig, R. L. 1969. A comparison of the winter foodhabits of three species of waterfowl from the upper Laguna Madre of Texas. M.S. Thesis, Texas A & I Univ., Kingsville. 59pp.
Korschgen, C. E., L. S. George, and W. L. Green. 1985. Disturbance of diving ducks by boaters on a migrational staging area. Wildl. Soc. Bull. 13:290- 296.
Lehner, P. N. 1979. Handbook of ethological methods. Garland STPM Press, New York, N.Y. 403pp.
Marsh, S. L. 1979. Factors affecting the distribution,food habits, and lead toxicosis of redhead ducks in the Laguna Madre, TX. M.S. Thesis, Texas A & M Univ., College Station. 47pp.
McKinney, F. 1965. The comfort movements of anatidae. Behaviour 25:120-220.
McMahan, C. A. 1970. Food habits of ducks wintering on Laguna Madre, Texas. J. Wildl. Manage. 34:946-949.
Merkord, G. W. 1978. The distribution and abundance of seagrasses in Laguna Madre of Texas. M.S. Thesis, Texas A & I Univ., Kingsville. 56pp.

Miller, Jr., R. G. 1981. Simultaneous statisticalinference. Second ed. Springer-Verlag, New York,N.Y. 299pp.
Morton, J. M., A. C. Fowler, and R. L. Kirkpatrick. 1989. Time and energy budgets of American black ducks in winter. J. Wildl. Manage. 53:401-410.
Nilsson, L. 1970. Food-seeking activity of south Swedish diving ducks in the non-breeding season. Oikos 21:145-154.
_____ . 1972. Habitat selection, food choice, and feedinghabits of diving ducks in coastal waters of south Sweden during the non-breeding season. Ornis Scand. 3:55-78.
Owens, N. W. 1977. Responses of wintering Brent Geese to human disturbance. Wildfowl 28:5-14.
Pedroli, J. 1982. Activity and time budget of tuftedducks on Swiss lakes during winter. Wildfowl 33:105- 112.
Perry, M. C., R. E. Munro, and G. M. Haramis. 1981.Twenty-five year trends in diving duck populations in Chesapeake Bay. Trans. North Am. Wildl. Conf. 46:299-310.
_____ , and F. M. Uhler. 1988. Food habits anddistribution of wintering canvasbacks, Avthva valisineria. on Chesapeake Bay. Estuaries 11:57-67.

Poysa, H. 1986a. Species composition and size of dabbling duck (Anas spp.) feeding groups: are foraging interactions important determinants? Ornis Fenn.63:33-41.
_____ . 1986b. Foraging niche shifts in multi-speciesdabbling duck (Anas spp.) feeding groups: harmful and beneficial interactions between species. Ornis Scand. 17:333-346
Quinlan, E. E., and G. A. Baldassarre. 1984. Activity budgets on nonbreeding green-winged teal on playa lakes in Texas. J. Wildl. Manage. 48:838-845.
Rusnak, G. A. 1960. Sediments of Laguna Madre, Texas.Pages 153-196 in F. P. Shepard, F. B. Phleger, and T. H. van Andel, eds. Recent sediments, northwest Gulf of Mexico. Am. Assoc. Petroleum Geol., Tulsa, Okla.
Singleton, J.R. 1964. Ecology of the principal waterfowl food plants of the lower Laguna Madre. Tex. Parks and Wildl. Job Completion Report, Fed. Aid Proj. W-29-R-14, Job 17. 9pp.
Steel, R. G. D., and J. H. Torrie. 1980. Principles and procedures of statistics. Second ed. McGraw-Hill Book Co., New York, N.Y. 633pp.
Stevenson, J. C., and N. M. Confer. 1978. Summary ofavailable information on Chesapeake Bay submerged vegetation. U.S. Fish and Wildl. Serv. FWS/OBS- 78/66. 335pp.
Tamisier, A. 1976. Diurnal activities of green-winged teal and pintail wintering in Louisiana. Wildfowl 27:19-32.
Thomas, G. 1976. Habitat usage of wintering ducks at the Ouse Washes, England. Wildfowl 27:148-152.
Thompson, B. C., J. E. Tabor, and C. L. Turner. 1988.Diurnal behavior patterns of waterfowl wintering on the Columbia River, Oregon and Washington. Pages 153-167 in M. W. Weller, ed. Waterfowl in winter. Univ. Minnesota Press, Minneapolis.
Tuite, C. H., M. Owen, and D. Paynter. 1983. Interaction between wildfowl and recreation at Llangorse Lake and Talybont Reservoir, South Wales. Wildfowl 34:48- 63.
U.S. Fish and Wildlife Service. 1983. Statisticalanalysis of selected waterfowl population data compiled from mid-winter waterfowl inventories 1955 - 1983. FWS, Region 2, Albuquerque, N.M. 124pp.
Weller, M. W. 1964. Distribution and migration of the redhead. J. Wildl. Manage. 28:64-103.

CHAPTER III
REDHEAD HERBIVORY ON SHOALGRASS RHIZOMES IN THE LOWER LAGUNA MADRE, TEXAS: A ONE HERBIVORE/ONE PREY SYSTEM
Abstract: Redhead (Aythya americana) herbivory on theirprimary food source, shoalgrass (Halodule wrightii) rhizomes, was studied for 2 winters in the lower Laguna Madre, Texas. Redheads consumed an average of 75% of shoalgrass rhizome biomass in vegetation plots each winter. When rhizome biomass was grazed to 0.17 g dry mass/core (approximately 10 g dry mass/m2) or less, rhizome biomass did not recover to its previous level during the following growing season. Thirty-three percent (10) of the sites were grazed to below this recovery value during both years of the study, and 64% of the sites (19) were grazed to below the recovery value during 1 of 2 years. Rhizome biomass increased inside redhead exclosures, indicating that redhead grazing may be keeping shoalgrass rhizomes below their maximum biomass.
Number of ramets was positively correlated with rhizome biomass; however, this relationship was influenced by grazing intensity. Grazing had no impact on root biomass, rhizome moisture content, rhizome diameter, or soil magnesium, phosphorus, and potassium.
70

71
Presence of redheads was associated with increased soil nitrogen levels.
Areas initially chosen by redheads within the lower Laguna Madre had lower salinities (24 + 5.4 ppt) than areas not selected (35 + 0.8 ppt). Redheads continued to select areas throughout the winter with lower salinities. Crude protein level in shoalgrass rhizomes was not a selection factor.Key words: Avthva americana. Halodule wrightii. herbivory, Laguna Madre, redheads, shoalgrass.
INTRODUCTIONThe Laguna Madre of Texas and Mexico is a seagrass-
based ecosystem with 5 seagrass species present; shoalgrass predominates (Merkord 1978). During the past 30 years there has been a marked decrease in vegetated lagoon bottom, as well as a decrease in area occupied by monotypic shoalgrass meadows from 47,070 to 29,851 ha (Singleton 1964, Merkord 1978). These losses may have resulted from dredging and/or hydrologic changes (McMahan 1968).
Seagrasses have many defenses against herbivores: their tissues are of low nutrient quality; they often occur in large monotypic meadows that reduces an herbivore's ability to obtain essential nutrients from other plant species; their high growth rate outpaces
72
herbivore consumption; their storage and propagation organs are hidden underground; and they grow in rigorous habitats not suitable for many potential herbivores (Lubchenko and Gaines 1981, Duffy and Hay 1990, Lundberg and Astrom 1990). As a result, seagrasses usually constitute only a small proportion of the diet of many vertebrate and invertebrate species that ingest live seagrass tissue (Kikuchi and Peres 1977, Ogden 1976,1980, Zieman 1982, Pollard 1984, Thayer et al. 1984).Even for those species where seagrasses are a dominant component of the diet, [e.g. brant (Branta bernicula), wigeon (Anas uenelope), green sea turtle (Chelonia mydas), parrot and surgeon fish families (Scaridae and Acanthuridae), and sea urchins (Echinoidea)], grazing is limited to aboveground portions, which are readily replaced (Bjorndal 1980, McRoy and Helfferich 1980, Ogden 1980, Zieman 1982, Tubbs and Tubbs 1983, Williams 1988).
Belowground herbivory should be rare because concentrated grazing on rhizomes, the main mode of reproduction in many seagrass species (Smith 1983,Phillips and Menez 1988), could lead to plant extinction unless there is some ungrazable reserve (Noy-Meir 1975, Giroux and Bedard 1987a). As predicted, few species consume belowground biomass of seagrasses. Most of these species, such as manatees (Trichechus spp.) and dugongs (Dugon spp.), are rare and have little impact on seagrass

73
abundance (McRoy and Helfferich 1980, Zieman 1982). In contrast, redheads, a migratory North American duck, whose numbers exceed 0.6 million, feed mainly on shoalgrass during winter and consume only belowground rhizomes (Koenig 1969:39, McMahan 1970, Merkord 1978,Marsh 1979:23). Approximately 80% of the world's redheads winter on the Laguna Madre (Weller 1964).
My objectives were to quantify the impact of redheads on shoalgrass meadows and to determine whether winter habitat may limit redhead numbers. Additionally, this single vertebrate herbivore - single food system offered a unique opportunity to study the effects of a herbivore on its food resource without the confounding variables of prey switching, multiple herbivores, or competition among plant species.
METHODSThe Laguna Madre is a long, narrow, hypersaline
lagoon along the coasts of Texas and Mexico and is one of only a few hypersaline lagoon systems in the world (Gunter 1967). It is shallow with an average depth of 1 m (Rusnak 1960) and is separated from the Gulf of Mexico by narrow barrier islands (Rusnak 1960, Pulich 1980). The U.S. portion is divided into an upper and lower part (Hedgpeth 1947). This study was conducted in the lower portion, which covers an area of 690 km2.

I randomly placed 34 vegetation plots in shallow water (< 80 cm deep) shoalgrass habitat in 3 selected areas of the lower Laguna Madre (Fig. 9). These 3 areas were selected because they were within a 30-minute airboat ride of a public launch ramp and were areas known to be used by redheads. I sampled each site monthly, beginning in mid-October 1987 just before redheads arrived, until mid-March 1988 just after redheads left; I also sampled sites in August during peak biomass (Duarte 1989). I used the same sampling regime during 1988-89 winter, with the addition of 7 redhead exclosures. Exclosures (13 X 13 m) consisted of 4 wooden corner posts with 3 evenly-spaced rows of nylon string strung around the perimeter above water level. Colorful nylon streamers (20 - 30 cm long) were tied to the nylon string at approximately 50-cm intervals, and replaced as needed throughout the winter. Polypropylene rope was attached to the corner posts; it floated at the perimeter of the exclosure. Because all shallow water shoalgrass areas were heavily used by redheads during the first winter, these exclosures were needed to determine seasonal changes in shoalgrass parameters in the absence of redhead grazing. I found redhead feces and feeding holes inside 3 exclosures; the remaining 4 exclosures excluded redheads for the entire winter. I sampled 30 of 34 sites both years; I substituted 4 new, randomly chosen sites in

F i g u r e 9 . V e g e t a t i o n p l o t l o c a t i o n s i n t h e l o w e r L a g u n a M a d r e , T e x a s .

76
1988-89 for 4 sites used in 1987-88 because the 4 sites either contained more than 1 seagrass species or had little shoalgrass present. Sampling at 4 sites in 1987- 88 did not begin until mid-November.
I collected 6, 14.5-cm diameter X 10-cm deep cores, from each site each month to characterize shoalgrass rhizome biomass and other vegetation parameters. Presampling indicated that 6 cores per site per month were sufficient to stabilize the mean and variance. I took the first vegetation core sample 3 m from the center of the vegetation plot and thereafter at 2-m intervals along a straight line in 1 of 8 randomly chosen compass directions (N, NE, E, etc.). A particular direction was only sampled once per season at each site. During the second winter, I took the first core beginning 16 m from the center of the plot and at 2-m intervals thereafter to avoid re-sampling the exact area that I sampled the first winter. Three salinity measurements were taken at each site with a refractometer.
I collected and transported vegetation cores to shore where I counted the number of ramets (individual members of a clone) and separated aboveground shoot, rhizome, and root tissue. I determined moisture content of rhizomes for a sample of 10 vegetation cores each month. Fresh weights were determined soon after rhizome tissue was removed from the soil by spinning off excess
77
moisture in a hand-cranked centrifuge at 330 RPM for 3 0 seconds and then weighing the sample (Duivenvoorden 1987). I measured width of 3 randomly chosen rhizomes per core to the nearest 0.1 mm beginning with November 1988 sampling. Tissues were dried at 60°C to constant weight, cooled in a desiccator, and weighed for biomass determination. Biomass was expressed as g dry mass/core
p(X 60 = g dry mass/m ).In October, November, December, and February, 1988-
89, I collected soil samples at 3 - 5 sites that had redheads present during the week preceding soil collection and at 3 - 5 sites where no redheads had been present during the winter. Soil samples were frozen until analyzed. Total nitrogen (%) in soil was determined using a Perkin-Elmer Model 240 Elemental Analyzer. Magnesium, potassium, and phosphorus levels (mg/kg) were determined by methods outlined in Byrnside and Sturgis (1958) and Thomas (1982). Crude protein level (%) in shoalgrass rhizomes was determined using AOAC techniques in section 2.049 of Horwitz (1975) as modified by Hambleton (1977).
When possible I flew the lower Laguna Madre 3 times/week (58 flights 1987-88, 51 flights 1988-89) and plotted location of all redhead flocks. Each flight took approximately 3 hours. Vegetation plots were categorized for each vegetation sampling interval as not grazed if no
78
redheads were present within 0.5-km radius of the plot; lightly grazed if flocks were present within 0.5-km of the site once or twice during the monthly sampling interval; or heavily grazed if flocks were present 3 or more times during the interval.
During December 1988, I walked a 1-km long by 1-m wide east-west strip transect through an area being actively grazed and counted the number of feeding holes on the lagoon bottom. I measured 103 feeding holes along their longest axis.
For each vegetation parameter, I tested whether any monthly variation existed over the winter in the absence of redhead grazing using exclosure data from the second year. If there was no monthly variation, I disregarded month as a factor in the remaining analyses, and each site each month was put into 1 of 3 categories (not, lightly, or heavily grazed). Additionally, each site was categorized by the number of months that it had been previously grazed. Data were analyzed with linear regression, analysis of variance, and analysis of covariance tests with means separated by contrasts or Bonferroni mean separations with alpha = 0.05. Because there was large variation among sites in initial rhizome biomass per core (0.16 - 2.49 g dry mass/core), data were transformed to percents for some analyses. This procedure reduced among site variability.
79RESULTSRedhead impacts on shoalgrass
Rhizome biomass [0.53 + 0.01 g dry mass/core (mean +1 SE)] did not differ among months (n = 6) between October and March at the 4 sites with no redhead grazing (P = 0.99, df = 5,18, F = 0.08). Rhizomes biomass at sites that were heavily grazed declined by > 20% per month; this loss rate was greater than the loss rate at lightly or not grazed sites (P < 0.0001, df = 10.345, F = 8.08) (Table 9). The rate of change was U-shaped for both heavy and light grazing (quadratic orthogonal contrasts for heavy P < 0.0001 and light P = 0.0319)(Fig. 10) with the rate of change returning to zero after 4 to 5 months of grazing. Average biomass was 0.17 +0.02 g/core (n = 33) when the rate of change returned to zero. For all grazed sites, there was an average loss of 75% of rhizome biomass over the winter (Fig. 11).
Root biomass did not vary monthly in the absence of redhead grazing (P = 0.7415, df = 5,18, F = 0.54); it averaged 2.63 + 0.15 g dry mass/core at non-grazed sites. There was no change in root biomass among not, lightly, or heavily grazed sites or for months previously grazed (P = 0.3875, df = 10,340, F = 1.07). Overall change in root biomass averaged 5.8 + 3.1% (n = 351) per month; this rate did not differ from zero (P = 0.0658, df = 350,
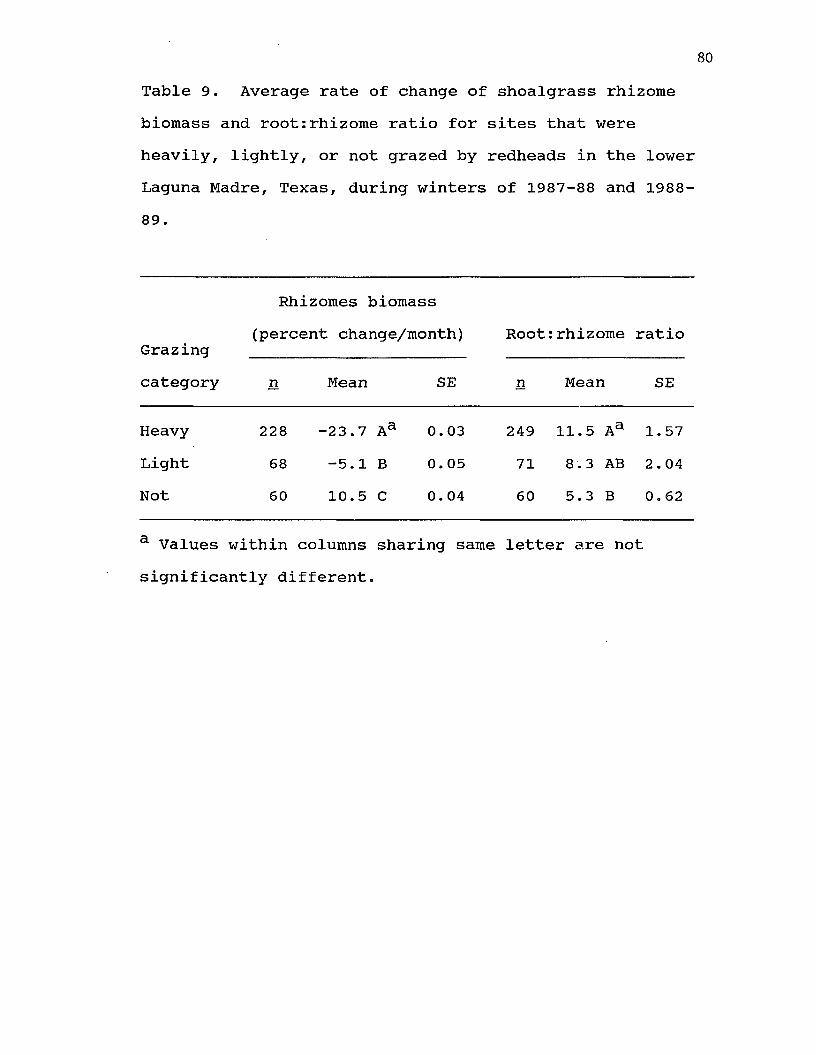
Table 9. Average rate of change of shoalgrass rhizome biomass and root:rhizome ratio for sites that were heavily, lightly, or not grazed by redheads in the lower Laguna Madre, Texas, during winters of 1987-88 and 1988- 89.
Grazingcategory
Rhizomes biomass (percent change/month) Root: rhizome ratio
n Mean SE n Mean SE
Heavy 228 -2 3.7 Aa 0.03 249 11.5 Aa 1.57Light 68 -5.1 B 0. 05 71 8 .3 AB 2.04Not 60 10.5 C 0. 04 60 5.3 B 0. 62
a Values within columns sharing same letter are not significantly different.

81
40
20
0
-20
-40o> o >
I -60oc © o©
20
0
-20
-40
-60
Figure 10. Percent change, during monthly intervals, in shoalgrass rhizome biomass at heavily grazed (top) and lightly grazed sites (bottom) from the lower Laguna Madre, Texas. Horizontal lines are means; vertical bars are + 1 SE.
Heavily grazed
-f +J________________ I________________ I________________ I------------------------- L
Lightly grazed
- r
_____I ............................... 1 , . , 1 1
1 2 3 4 5Number of monthly intervals previously grazed

82
not grazed - 0.99 g dry mass/ core
partially grazed 0.49 g dry mass/ core
m m
heavily grazed - 0.03 g dry mass/
Figure 11. Example of shoalgrass rhizomes from the lower Laguna Madre, Texas, that were not grazed (top), partially grazed (center), and heavily grazed (bottom).
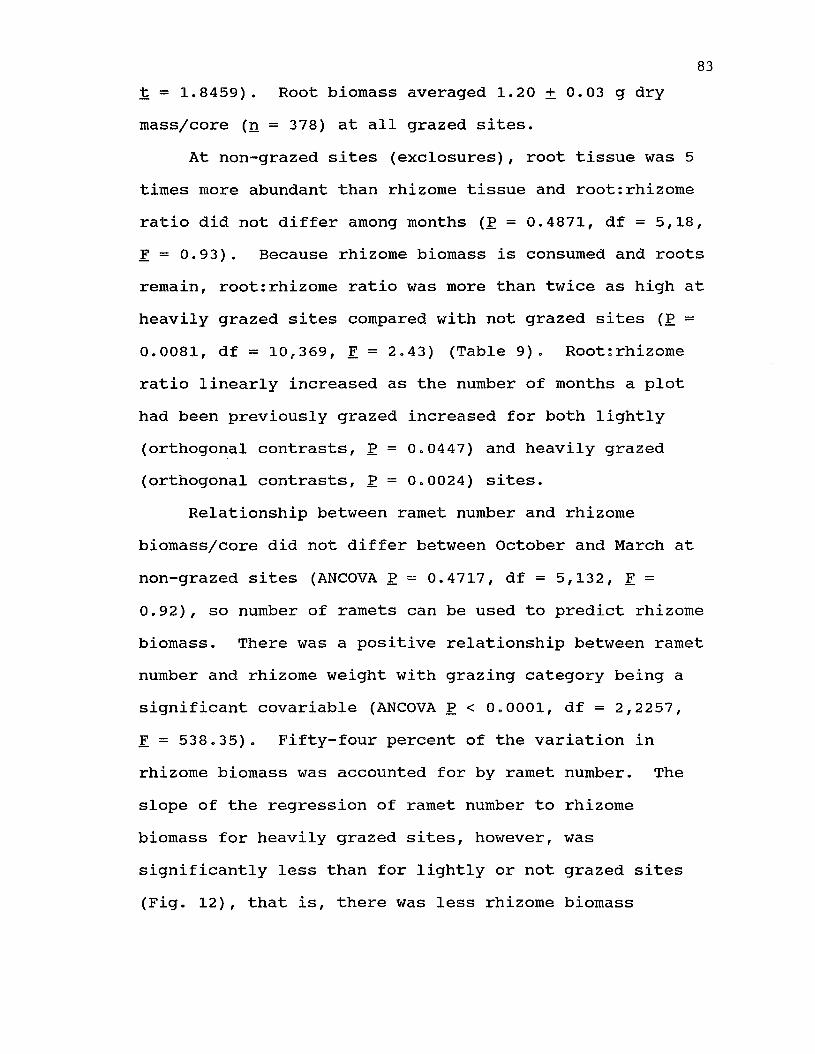
83t = 1.8459). Root biomass averaged 1.20 + 0.03 g dry mass/core (n = 378) at all grazed sites.
At non-grazed sites (exclosures), root tissue was 5 times more abundant than rhizome tissue and root:rhizome ratio did not differ among months (P = 0.4871, df = 5,18,F = 0.93). Because rhizome biomass is consumed and roots remain, root:rhizome ratio was more than twice as high at heavily grazed sites compared with not grazed sites (P = 0.0081, df = 10,369, F = 2.43) (Table 9). Root:rhizome ratio linearly increased as the number of months a plot had been previously grazed increased for both lightly (orthogonal contrasts, P = 0.0447) and heavily grazed (orthogonal contrasts, P = 0.0024) sites.
Relationship between ramet number and rhizome biomass/core did not differ between October and March at non-grazed sites (ANCOVA P - 0.4717, df = 5,132, F =0.92), so number of ramets can be used to predict rhizome biomass. There was a positive relationship between ramet number and rhizome weight with grazing category being a significant covariable (ANCOVA P < 0.0001, df = 2,2257,F = 538.35). Fifty-four percent of the variation in rhizome biomass was accounted for by ramet number. The slope of the regression of ramet number to rhizome biomass for heavily grazed sites, however, was significantly less than for lightly or not grazed sites (Fig. 12), that is, there was less rhizome biomass
84
2.5
2.0
C OC O03E
t 10
0.5
0 4 0 80 120 160Number of ram ets
Figure 12. Relationship between shoalgrass rhizome biomass and number of ramets for not, lightly, and heavily grazed sites in the lower Laguna Madre, Texas.
Lightly grazed Y = -0.078 + 0.016X
Not grazed Y = -0.219 + 0.016X
" Heavily grazed Y = -0.018 + 0.011X
85
associated with each ramet once an area had been heavily grazed.
Rhizome width (0.95 + 0.01mm) did not vary between November and March (P = 0.7546, df = 6,18, F = 0.56) at non-grazed sites. There was no difference in rhizome width for grazing category or months previously grazed (P = 0.2245, df = 10,175, F = 1.32). Rhizome width was not correlated with number of ramets (P = 0.2693, df = 1,103, F = 1.234, r2 = 0.01) or rhizome biomass (P = 0.2888, df = 1,102, F = 1.137, r2 = 0.01).
Moisture content of rhizome tissue averaged 77.7 + 0.56%, (n = 67) and did not differ among months (P = 0.7519, df = 5,26, F = 0.53) or among grazing categories (P = 0.5529, df=6,34, F = 0.83).Shoalarass recovery
Fourteen sites (41%) had as much or more biomass in October 1988 than they had in October 1987. Twenty sites (59%) had less biomass in October 1988 than in October 1987. Sites that had less biomass in October of the second winter compared with October of the first winter had significantly less biomass at winter's end than sites that had as much or more biomass by the beginning of the second winter (P = 0.0030, df = 1,32, F = 5.16) (Table 10); 0.17 + 0.02 g dry mass/core was the average value below which shoalgrass rhizomes did not recover to the previous winter's level.
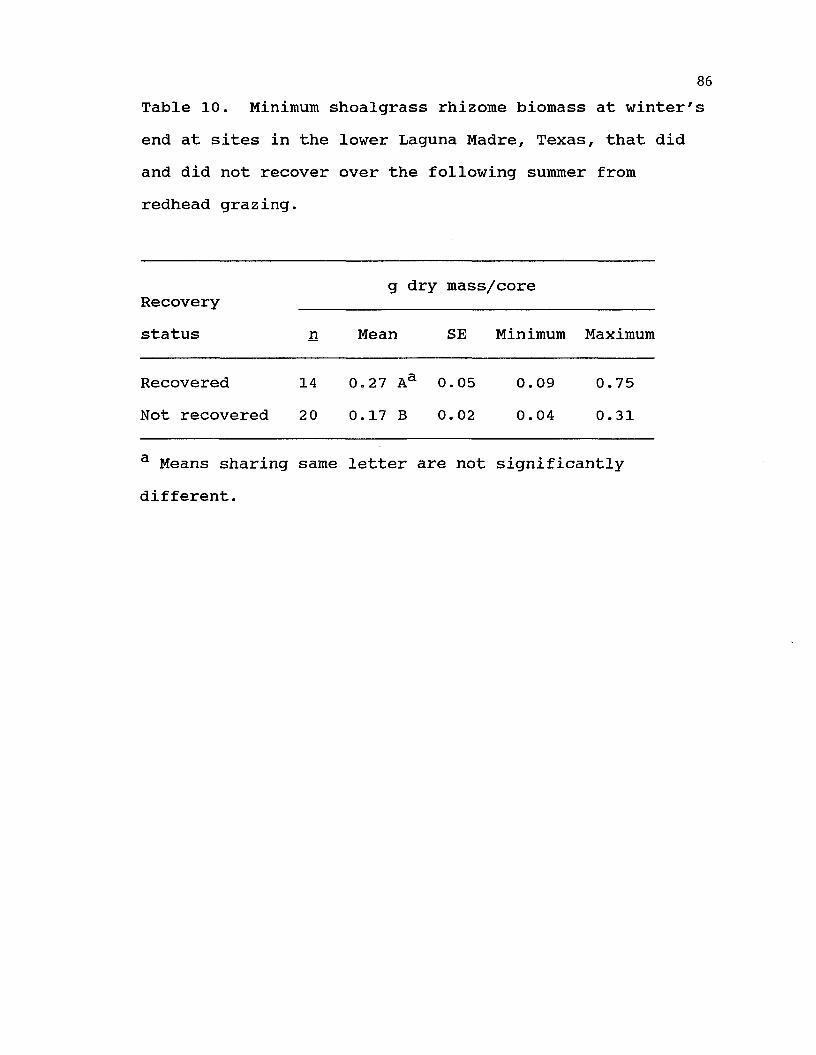
Table 10. Minimum shoalgrass rhizome biomass at winter' end at sites in the lower Laguna Madre, Texas, that did and did not recover over the following summer from redhead grazing.
Recoveryg dry mass/core
status n Mean SE Minimum Maximum
Recovered 14 0.27 Aa 0.05 0.09 0.75Not recovered 20 0.17 B 0.02 0.04 0.31
a Means sharing same letter are not significantly different.
87
Because I did not collect a third year's data, a similar comparison could not be made for the second winter. I used the following August's biomass values, however, as a measure of recovery. At sites that had not been grazed during the second winter, there was no decline in biomass between October and March and a nonsignificant increase through August (Table 11).Biomass at lightly grazed sites declined by 61% but recovered to October levels by August; biomass at heavily grazed sites declined by 81% and did not recover to October levels by August (P < 0.0001, df = 8,114, F =7.17) (Table 11). The second winter's data supported the 0.17 g/core recovery value that I established above.When I used August values as the recovery point for the first winter's data, heavily grazed sites declined by 68% and, on the average, recovered to October levels by August (P < 0.0001, df = 2,89, F = 21.87).
When rhizome biomass was not grazed below the recovery value, shoalgrass rhizomes showed compensatory regrowth, that is, a large percent loss of rhizome biomass over the winter was followed by a large percent recovery of biomass by August (P < 0.0001, df = 69, F = 30.992, r2 = 31.3) and vise versa. The best fitting line was log(Y) = -0.800 + 0.361 x log(X), where Y was the percent loss of rhizome biomass over the winter, and X
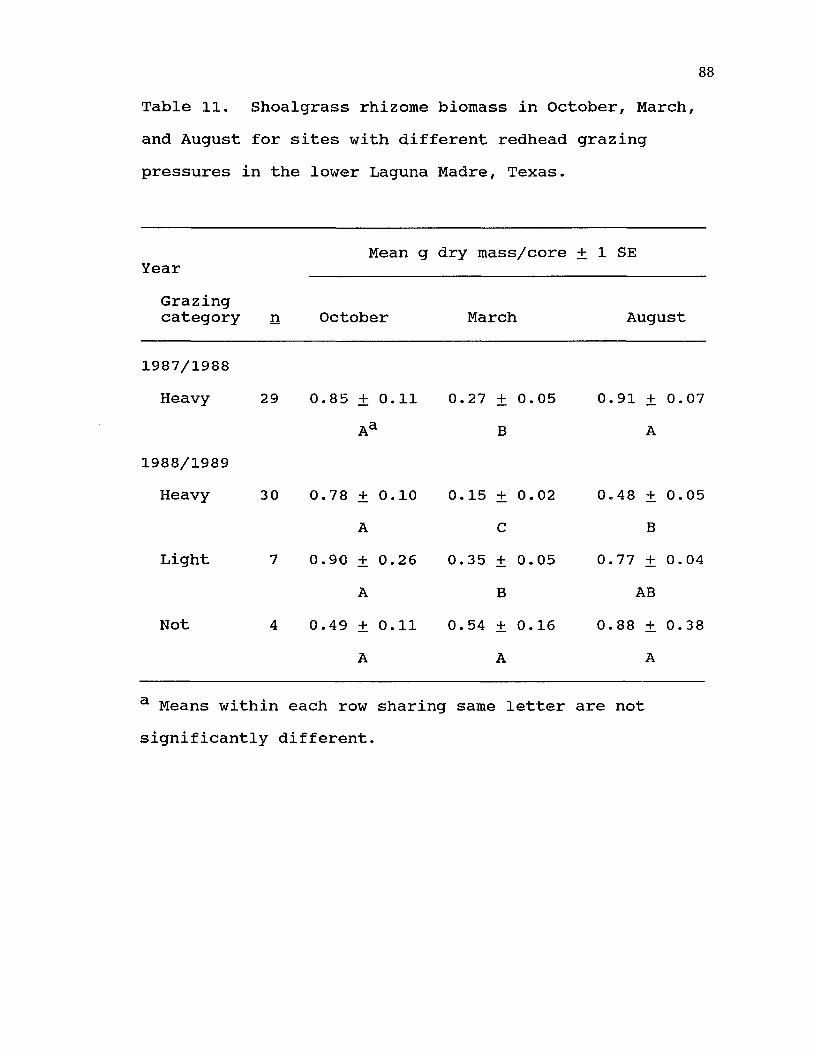
Table 11. Shoalgrass rhizome biomass in October, March, and August for sites with different redhead grazing pressures in the lower Laguna Madre, Texas.
YearMean g dry mass/core ± 1 SE
Grazingcategory n October March August
1987/1988Heavy 29 0.85 ± 0.11 0.27 ± 0.05 0.91 + 0.07
Aa B A1988/1989Heavy 30 0.78 ± 0.10 0.15 ± 0.02 0.48 ± 0.05
A C BLight 7 0.90 ± 0.26 0.35 ± 0.05 0.77 ± 0.04
A B ABNot 4 0.49 ± 0.11 0.54 ± 0.16 0.88 ± 0.38
A A A
a Means within each row sharing same letter are not significantly different.

89
was the percent recovery of rhizome biomass over the spring and summer growing season.
Thirty sites were sampled in both years. Nineteen (64%) were grazed below 0.17 g dry mass/core during 1 of 2 winters during the study, 10 (33%) sites were grazed below 0.17 g dry mass/core during both winters, and only 1 site (3%) was not grazed below this recovery value during both winters.
Rhizome biomass at most sites declined through March when redheads began to depart the lower Laguna Madre. Biomass at 33 sites (13 the first winter and 20 the second winter) stopped declining by February. Rhizome biomass averaged 0.17 + 0.02 g dry mass/core at these sites (extreme values 0.02 - 0.75 g dry mass/core).
When biomass reached 0.17 g dry mass/core at individual sites, redhead use declined thereafter.Redheads were observed on fewer flights (43 + 4.1%) during the month after biomass at sites reached 0.17 g dry mass/core than during the previous month (58 + 3.9%)(P = 0.0098, df = 1,50, F = 7.21).
For sites grazed below the 0.17 g recovery value during the first winter but not grazed below that level the second winter, there was a trend towards less grazing pressure at those sites during the second winter (paired t-test, P = 0.074). During the first winter, I observed ducks within 0.5-km radius of those sites that were
90
ultimately grazed to below 0.17 g dry mass/core on 40 + 1.8% of the flights, whereas during the second winter I observed redhead flocks within 0.5-km radius of those sites on only 29 + 6.5% of the flights.
Biomass at not grazed sites (exclosures) in August was more variable (Bartlette P < 0.001, df = 2, B =16.528) than at heavily or lightly grazed sites. At sites that had a history of heavy grazing prior to exclosure construction, rhizome biomass more than doubled (Fig. 13) once they were released from grazing pressure, whereas sites with little history of grazing prior to exclosure construction had little biomass increase when released from grazing.Physical features and habitat selection
Salinities did not differ among months at not grazedsites (exclosures) (P = 0.1358, df = 5,18, F = 1.95).Sites that were not grazed had higher salinities (38 +0.5 ppt) than sites that were either heavily grazed (32 +0.4 ppt) or lightly grazed (33 + 0.9 ppt) (P < 0.0001,df = 10,367, F = 9.27).
Soil nitrogen levels did not differ among months in the absence of redhead grazing (P = 0.2021, df = 3,25,F = 1.65). Presence of redheads increased soil nitrogen from 0.05 ± 0.012% (n = 12) to 0.11 ± 0.018% (n = 12)(P = 0.0178, df = 1,24, F = 6.47). Nitrogen levels at 8 of 12 sites increased between October (before redheads

91
2 .5
2.0a?UrnO^ 1.5C O(0COE
1.0■oo>
0 .5
Heavily grazed before
Lightly grazed before
- t 3 -
T
-E3-
0October March August
Figure 13. Shoalgrass rhizome biomass (mean + 1 SE) at not grazed sites (exclosures) in the lower Laguna Madre, Texas, with different grazing histories. Open squares are means from sites that were heavily grazed in years prior to exclosure construction, and solid circles are means from sites that were lightly grazed in years prior to exclosure construction.
92
arrived) and the month when samples were collected.There were no differences among months or due to redhead grazing (P = 0.1019, 0.4992, 0.1619, df = 5,21, F = 2.13, 0.90, 1.33) for soil magnesium (555 + 22 mg/kg), phosphorus ( 3 0 + 2 mg/kg), or potassium (249 + 18 mg/kg)(n = 43).
Feeding holes were oblong in shape. The median feeding hole diameter, along the long axis, was 110 mm.I used this to differentiate large and small holes; 110mm was also where a natural break in the distribution of hole diameters occurred. Average diameter for small feeding holes was 61 + 2.4 mm (n = 53); average diameter for large feeding holes was 295 +11.1 (n = 50). There were 2.5 + 0.2 feeding holes per m2, with 1.8 + 0.1 smallholes (maximum 10) and 0.7 + 0.1 large holes (maximum 3)per m2.
Upon arrival in October each year, redheads initially selected sites that had lower salinities (24 + 5.4 ppt) than sites that were not selected (35 + 0.8 ppt); sites that were only lightly used had intermediate salinities (31 + 3.5 ppt) between those heavily used and avoided (P = 0.0257, df = 2,54, F = 3.92). Redheads did not initially choose sites that had rhizomes with higher crude protein levels (P = 0.2141, df = 2,60), F = 1.58) or more rhizome biomass (P = 0.4018, df = 2,60, F = 0.93) than sites not chosen.

93
DISCUSSIONImpacts on and recovery of shoalgrass
Shoalgrass rhizome biomass remained constant over winter in the absence of redhead grazing. Effects of redhead grazing could be delineated without the confounding variable of seasonal variation in biomass. Shoalgrass rhizome biomass in other parts of Texas also does not change over winter (Pulich 1985). Rhizome biomass does not vary over winter for other seagrass species such as Halophila ovalis (Hillman et al. 1989) and Zostera marina (Short 1980, Kirkman et al. 1982).
Cornelius (1977) reported that redheads consumed less than 5% of shoalgrass biomass in the lower Laguna Madre and were having little impact on shoalgrass. I found that redheads significantly reduced shoalgrass rhizome biomass over winter, and some areas did not recover during the following growing season. The reason for this difference may be that Cornelius (1977) measured total biomass rather than rhizome biomass specifically.By doing this, he may have masked changes in rhizome biomass. Because of high root:rhizome ratio and change in this ratio with grazing intensity, studies that measure belowground or total biomass instead of rhizome biomass may reach erroneous conclusions. Reduction in shoalgrass rhizome biomass probably occurred during
94
Cornelius' study (1977), because he showed a significant reduction in shoalgrass between fall and spring in 3 of 6 zones; average reduction in these 3 zones was 24% even though overall in all 6 zones there was no sigmificant change in biomass due to redhead grazing.
Most other waterfowl that graze on seagrasses appear to take much less of available biomass than redheads. Canvasbacks (Avthva valisineria) reduced number of Vallisneria americana tubers by 21 - 41% in North Carolina (Lovvorn 1989) . Coots (Fulica atra) feeding on Ruppia cirrhosa reduced belowground biomass by an estimated 20 - 25% over winter (Verhoeven 1980). Kiprboe (1980) found no difference in belowground biomass for Ruppia cirrhosa and Potamoqeton pectinatus as a result of waterfowl grazing in Denmark. Brant (Branta bernicula) and mute swans (Cvgnus olor) grazing on Zostera marina consumed less than 5% of the standing crop of aboveground vegetation (Nienhuis and van Ierland 1978, Phillips and Menez 1988). Conversely Charman and Macy (1978) reported that brant depleted Zostera beds before switching to emergent species, but no data were presented. Percent cover of Zostera nana and Zostera hornemanniana was reduced by 70% and 100% as a result of brant grazing in the British Isles, but the amount of belowground biomass removed was not reported (Ranwell and Downing 1959).
Although feeding on Scirpus maritimus. an emergent wetland species that produces rhizomes, greylag geese (Anser anser) removed 47% and 81% of rhizome biomass in each of 2 years. The large amount of biomass removed in the second year of the study was considered unusual and resulted from abnormally high concentrations of geese on the study area because of drought conditions elsewhere on the wintering areas (Amat 1986). Snow geese (Chen caerulscens) grazing on rhizomes of emergent vegetation (Scirpus robustus. Scirpus americana. Spartina patens, and Saqittaria platvphvlla) in Louisiana have been reported to de-vegetate entire areas, but no quantitative data were given (McAtee 1910, Mcllhenny 1932, Lynch et al. 1947). Snow geese did not reduce belowground biomass of Scirpus americanus during their 10 - 14 week migratory stopover in Quebec (Giroux and Bedard 1987b).
Recovery of shoalgrass rhizome biomass was hampered by redhead grazing at 33% of the sites in both years and at 64% of the sites in 1 of 2 years. Other work that addressed recovery after grazing found that Zostera nana fully recovered over the summer growing season from a 70% reduction in percent cover by brant, whereas Zostera hornemanniana. that was grazed to 0% cover, recovered to 87% of its previous winter's level (Ranwell and Downing 1959); the amount of belowground biomass removed was unknown. Root/rhizome biomass of Spartina alterniflora.

9663% of which had been removed by wintering snow geese, had not recovered by the following winter at Salt Flat site (Smith and Odum 1981). Continued grazing at this site for an additional 3 years, however, did not lead to further declines in rhizome biomass and suggests that recovery occurred during 3 years of the 4-year study (Smith 1983). Two other sites in that study with similar amounts of biomass removed (50 and 64%) fully recovered by the following winter. Recovery at the latter 2 sites may have been enhanced by a larger number of seed- producing plants, such as Scirpus robustus and Distichlis spicata. This contrasted to the Salt Flat site, that contained mainly Spartina alterniflora. which propagates vegetatively via its rhizomes (Smith and Odum 1981, Smith 1983). Some areas in Louisiana denuded of Scirpus robustus and Spartina americana by wintering snow geese had not recovered 40 years later (Mcllhenny 1932).
Redheads reduced shoalgrass biomass at 63% of the sites to a point where it did not recover completely the following growing season. In the past, before the loss of so much area of monotypic shoalgrass habitat, there was probably enough wintering habitat so that areas grazed to below the 0.17 g dry mass/core recovery value during one winter could be avoided the next, thus allowing them time to recover. This may not be the case today. Areas with heavy grazing pressure in previous
years doubled their biomass after they were released from grazing by exclosures. This suggests that redhead grazing is keeping shoalgrass rhizomes below their maximum biomass based on soil nutrients, light availability, etc. Belanger et al. (1990) felt that staging snow geese in the St. Lawrence estuary kept Scirpus americanus below its optimum level by their grazing.
Rhizome biomass stopped declining at 33 sites by February; biomass stopped declining at all other grazed sites in March when redheads left the lower Laguna Madre. One explanation might be that when rhizome biomass at these 33 sites became so sparse (0.17 g dry mass/core, approximately 10 g/m2), it was not time or cost effective for redheads to find and extract additional rhizomes.Use of sites declined after biomass reached this average. Coots quit feeding on Ruppia cirrhosa when belowground biomass reached 8.8 g/m2 (Verhoeven 1980). This could be considered the inaccessible plant reserve needed to maintain a stable grazing system (Noy-Meir 1975). Additionally, recognizing the amount of plant biomass that must be left to ensure a self-sustaining population should be taken into account when calculating carrying capacity. Often the total amount of biomass present is used and may overestimate carrying capacity, because it does not take into account the amount below which it is
98
not cost effective for herbivores to continue to extract biomass.
Average rhizome biomass below which it was not cost effective for redheads to extract additional biomass (0.17 + 0.02 g dry mass/core) was identical to the 0.17 + 0.02 g dry mass/core recovery value. This may be coincidental or it may reflect intense selective pressure over many years for genotypes that can recover from that average level of grazing pressure.
A number of researchers have predicted belowground biomass from aboveground biomass (Cornelius 1977, Giroux and Bedard 1987b). This may be suitable in certain instances; however, the relationship can change over the winter as a result of grazing. Ramet number was positively correlated with belowground biomass, but the slope was significantly less for heavily grazed sites than for not grazed or lightly grazed sites. Before grazing, each aboveground shoot was connected to the next with a length of rhizome. Feeding redheads ripped rhizomes roughly from the soil and left abovegound shoots attached to only small pieces of rhizome. Several regression equations may be necessary to predict belowground biomass from ramet number or aboveground biomass in the presence of grazing.

99Habitat selection
Upon arrival in October, redheads chose areas within the lower Laguna Madre that had lower salinity levels.This selectivity continued throughout the winter; areas not grazed had higher salinities than sites lightly or heavily grazed. Although salt glands of redheads become hypertrophied in response to hypersaline conditions in the lower Laguna Madre (Cornelius 1982), choosing areas with lower salinities should be less stressful.
Redhead preference for less saline water should not be construed as justification for reducing salinities in the Laguna Madre by construction of passes through barrier islands or by increasing fresh water inflows. Manateegrass (Svrinqodium filiforme) may displace shoalgrass when salinities are moderated (Singleton 1964, McMillan and Moseley 1967, McMahan 1968, Merkord 1978). Because redheads feed almost exclusively on shoalgrass and will not eat manateegrass even when abundant (Stieglitz 1966), replacement of shoalgrass by manateegrass, if salinities are not allowed to fluctuate, will be detrimental to redheads.
Redheads did not select shoalgrass with higher crude protein levels than shoalgrass not selected. This contrasted with white-fronted geese (Anser albifrons) that select plants from fertilized plots that had an average of 12% more nitrogen than plants from
100
unfertilized plots (Owen 1975). Pink-footed geese (Anser brachvrhvnchus1 and barnacle geese (Branta leucopsis) also select food with higher protein levels (Madsen and Mortensen 1987) by selecting among different plant species that differ in protein content. There may not be enough variation in crude protein within shoalgrass to make this a selection factor for redheads. Additionally, shoalgrass rhizomes have low nutrient value compared with other waterfowl foods (Bardwell et al. 1962, Fredrickson and Reid 1988), so selecting areas with more biomass instead of more protein might be more adaptive when feeding on a low nutrient food source. Canada geese (Branta canadensis) adults did not select food higher in nitrogen, but their goslings did (Buchsbaum and Valiela 1987). Goslings may have had a higher protein requirement than adults did at that time of year.Redheads may not have a high protein requirement during winter.
Redheads did not initially select areas with the most rhizome biomass. This is unlike wigeon and brant, which initially selected areas with the most vegetation (Jacobs et al. 1981). Other selective factors, such as salinity, may take precedence over rhizome biomass.Physical features
Increased soil nitrogen from redhead feces could be beneficial to the remaining shoalgrass ramets.
101
Generally, sediments are the principal site of nutrient absorption for most seagrasses (McRoy and McMillan 1977), and nitrogen may be limiting to seagrass species (Patriquin 1972, Short 1983, 1987). In laboratory microcosms, belowground shoalgrass biomass increases with fertilizer additions in the fall but not in the spring (Pulich 1985); this corresponds to the timing of duck fertilization in the lower Laguna Madre. Snow geese feces increased aboveground biomass of Puccinellia phrvqanodes in Manitoba in experimental plots (Bazely and Jefferies 1985). These authors stated that increased nitrogen from goose feces "primed" the sediment and promoted increased growth once geese had left the area; redhead feces might similarly facilitate shoalgrass growth in the lower Laguna Madre. Shanholtzer (1974) noted that fecal material from shorebirds, herons, and ducks could be a locally significant source of nutrient enrichment in salt marshes, but he gave no data. Snow goose grazing in Manitoba indirectly increased soil nitrogen by reducing shading and litter accumulation, which increased nitrogen fixation by cyanobacteria and resulted in higher soil nitrogen levels (Bazely and Jefferies 1989). In contrast, Groot Bruinderink (1989) measured no increase in soil nitrogen as a result of goose (Anser spp.) grazing in the Netherlands.
102
Grazing by redheads created a pock-marked bottom of small (61 + 2.4 mm) and large (295 + 11.1 mm) diameter feeding holes. These holes are similar to feeding holes created by wigeon (Anas penelope), pintail (Anas acuta), and mallards (Anas platvrhvnchos) that feed on Zostera noltii in Holland (Jacobs et al. 1981). In contrast, dugongs (Dugon dugon) and manatees (Trichechus manatus) clear larger patches, 300 X 600 mm, or graze a serpentine trail approximately 26 cm wide by up to 8 m long (McRoy and Helfferich 1980, Zieman 1982). Because wave action quickly refilled shallow feeding holes, redheads have no visual cues to direct them to a specific place or to unused patches. This may serve to distribute feeding holes more randomly so that all rhizomes in an area are not eaten, and some pieces remain to regenerate the following spring and summer. Snow geese can apparently denude an entire area of Scirpus robustus and Scirpus americana roots and rhizomes during the winter in Louisiana by feeding at the edges of feeding areas that they gradually enlarge as they continue to feed around the periphery (McAtee 1910, Mcllhenny 1932).
I found, in contrast to results of previously published studies, that redheads are having a significant impact on shoalgrass rhizome biomass in the lower Laguna Madre. Rhizome biomass is being reduced by an average of 75% over the winter. Grazing impacts were sufficiently

103
severe in certain areas to reduce biomass in subsequent years. This may be critical to redheads because the lower Laguna Madre is their primary wintering area, and they feed almost exclusively on this plant species. My data from exclosures suggested that redheads are keeping shoalgrass rhizomes below their maximum biomass as a result of grazing. Continued loss of monotypic shoalgrass meadows from dredging, hydrologic changes, etc. in the lower Laguna Madre may eventually adversely affect redhead population dynamics.
ACKNOWLEDGMENTSI thank Jim Chambers, Allan Chaney, Brian Chapman,
Norwin Linnartz, Robert Noble, and Michael Stine for use of their equipment; Robert Hulen for assisting in vegetation collection and processing; Susan Cook, Thomas Custer, Ronald Dunn, Steve Hoover, Walter Kittleburger,Leah MacDonald, Donald McWherter, Ronald Miller, Russell Penrose, Sally Preddy, Will Roach, Janice Short, Dennis Tutland, and Mary Ellen and Phillip Zwank for help processing shoalgrass samples; Grey Pendleton and Vernon Wright for statistical advice; and Robert Chabreck,Thomas Custer, James Gosselink, Robert Hamilton, William Kelso, and Phillip Zwank for reviewing the manuscript. Research was conducted under the auspices of the Louisiana Cooperative Fish and Wildlife Research Unit in
cooperation with Louisiana State University, Louisiana Department of Wildlife and Fisheries, and Wildlife Management Institute. This manuscript is approved for publication by Director of the Louisiana Agricultural Experiment Station as manuscript 91-22-5185.
LITERATURE CITEDAmat, J. A. 1986. Some aspects of the foraging ecology of
a wintering greylag goose Anser anser population. Bird Study 33:74-80.
Bardwell, J. L., L. L. Glasgow, and E. A. Epps, Jr. 1962. Nutritional analyses of foods eaten by pintail and teal in south Louisiana. Proc. Southeast. Assoc.Game and Fish Comm. 16:209-217.
Bazely, D. R., and R. L. Jefferies. 1985. Goose faeces: a source of nitrogen for plant growth in a grazed salt marsh. J. Appl. Ecol. 22:693-703.
_____ , and . 1989. Lesser snow geese and thenitrogen economy of a grazed salt marsh. J. Ecol. 77:24-34.
Belanger, L., J. -F. Giroux, and J. Bedard. 1990. Effects of goose grazing on the quality of Scirpus americanus rhizomes. Can. J. Zool. 68:1012-1014.
Bjorndal, K. A. 1980. Nutrition and grazing behavior of the green turtle Chelonia mvdas. Mar. Biol. 56:147-

Buchsbaum, R., and I. Valiela. 1987. Variability in the chemistry of estuarine plants and its effect on feeding by Canada geese. Oecologia 73:146-153.
Byrnside, Jr., D. S., and M. B. Sturgis. 1958. Soilphosphorus and its fractions as related to response of sugar cane to fertilizer phosphorus. La. Agric. Exp. Stn. Bull. 513.
Charman, K., and A. Macey. 1978. The winter grazing of saltmarsh vegetation by dark-bellied brent geese. Wildfowl 29:153-162.
Cornelius, S. E. 1977. Food and resource utilization by wintering redheads on lower Laguna Madre. J. Wildl. Manage. 41:374-385.
_____ . 1982. Wetland salinity and salt gland size in theredhead Avthva americana. Auk 99:774-778.
Duarte, C. M. 1989. Temporal biomass variability and production/biomass relationships of seagrass communities. Mar. Ecol. Prog. Ser. 51:269-276.
Duffy, J. E., and M. E. Hay. 1990. Seaweed adaptations to herbivory. BioScience 40:368-375.
Duivenvoorden, L. J. 1987. A centrifugation method fordetermining the fresh weight of aquatic macrophytes. Aquat. Bot. 29:275-282.
Fredrickson, L. H., and F. A. Reid. 1988. Nutritional values of waterfowl foods. U.S. Fish and Wildl.Serv. Fish and Wildl. Leafl. 13.1.1. 6pp.

Giroux, J. -F., and J. Bedard. 1987a. Effects of simulated feeding by snow geese on Scirpus americanus rhizomes. Oecologia 74:137-143.
_____ , and ______ . 1987b. The effects of grazing bygreater snow geese on the vegetation of tidal marshes in the St Laurence estuary. J. Appl. Ecol. 24:773-788.
Groot Bruinderink, G. W. T. A. 1989. The impact of wild geese visiting improved grasslands in the Netherlands. J. Appl. Ecol. 26:131-146.
Gunter, G. 1967. Vertebrates in hypersaline waters.Contrib. Mar. Sci. 12:230-241.
Hambleton, L. G. 1977. Semiautomated method forsimultaneous determination of phosphorus, calcium, and crude protein in animal feeds. J. Assoc. Off. Anal. Chem. 60:845-852.
Hedgpeth, J. W. 1947. The Laguna Madre of Texas. Trans.North Am. Wildl. Conf. 12:364-380.
Hillman, K., D. I. Walker, A. W. D. Larkum, and A. J. McComb. Pages 635-685 in A. W. D. Larkum, A. J. McComb, and S. A. Shepard, eds. Biology of Seagrasses. Aquat. Plant Stud. 2. Elsevier, New York, N.Y.
Horwitz, W., editor. 1975. Official methods of analysis of the Association of Official Analytical Chemists. Twelfth ed. Assoc. Off. Anal. Chem., Washington, D.C.
Jacobs, R. P. W. M., C. den Hartog, B. F. Braster, and FC. Carriere. 1981. Grazing of the seagrass Zostera noltii by birds at Terschlelling (Dutch Wadden Sea) Aquat. Bot. 10:241-259.
Kikuchi, T., and J. M. Peres. 1977. Consumer ecology of seagrass beds. Pages 147-193 in C. P. McRoy and C. Helfferich, eds. Seagrass ecosystems a scientific perspective. Marcel Dekker, Inc. New York, N.Y.
Ki0rboe, T. 1980. Distribution and production ofsubmerged macrophytes in Tipper Grund (Ringkobing Fjord, Denmark), and the impact of waterfowl grazing. J. Appl. Ecol. 17:675-687.
Kirkman, H., I. H. Cook, and D. D. Reid. 1982. Biomass and growth of Zostera capricorni Aschers. in Port Hacking, N. S. W., Australia. Aquat. Bot. 12:57-67.
Koenig, R. L. 1969. A comparison of the winter foodhabits of three species of waterfowl from the upper Laguna Madre of Texas. M.S. Thesis, Texas A & I Univ., Kingsville. 59pp.
Lovvorn, J. R. 1989. Distributional responses ofcanvasback ducks to weather and habitat change. J. Appl. Ecol. 26:113-130.

Lubchenco, J., and S. D. Gaines. 1981. A unified approach to marine plant-herbivore interactions. I. populations and communities. Ann. Rev. Ecol. Syst. 12:405-437.
Lundberg, P., and M. Astrom. 1990. Low nutritive quality as a defense against optimally foraging herbivores. Am. Nat. 135:547-562.
Lynch J. J., T. O'Neil, and D. W. Lay. 1947. Managementsignificance of damage by geese and muskrats to Gulf coast marshes. J. Wildl. Manage. 11:50-76.
Madsen, J., and C. E. Mortensen. 1987. Habitatexploitation and interspecific competition of moulting geese in east Greenland. Ibis 129:25-44.
Marsh, S. L. 1979. Factors affecting the distribution,food habits, and lead toxicosis of redhead ducks in the Laguna Madre, Texas. M.S. Thesis, Texas A & M Univ., College Station. 47pp.
McAtee, W. L. 1910. Notes on Chen caerulescens, Chenrossi, and other waterfowl in Louisiana. Auk 27:3 37- 339.
Mcllhenny, E. A. 1932. The blue goose in its winter home. Auk 49:279-306.
McMahan, C. A. 1968. Biomass and salinity tolerance of shoalgrass and manateegrass in lower Laguna Madre, Texas. J. Wildl. Manage. 32:501-506.
109
_____ . 1970. Food habits of ducks wintering on LagunaMadre, Texas. J. Wildl. Manage. 34:946-949.
McMillan, C., and F. N. Moseley. 1967. Salinitytolerances of five marine spermatophytes of Redfish Bay, Texas. Ecology 48:503-506.
McRoy, C. P., and C. Helfferich. 1980. Applied aspects of seagrasses. Pages 297-343 in R. C. Phillips and C.P. McRoy, eds. Handbook of seagrass biology: an ecosystem perspective. Garland STPM Press. New York,N. Y.
, and C. McMillan. 1977. Production ecology andphysiology of seagrasses. Pages 53-87 in C. P. McRoy and C. Helfferich, eds. Seagrass ecosystems a scientific perspective. Marcel Dekker, Inc. New York, N.Y.
Merkord, G. W. 1978. The distribution and abundance of seagrasses in Laguna Madre of Texas. M.S. Thesis,Texas A & I Univ., Kingsville. 56pp.
Nienhuis, P. H., and E. T. van Ierland. 1978. Consumption of eelgrass, Zostera marina. by birds and invertebrates during the growing season in Lake Grevelingen (SW Netherlands). Netherl. J. Sea Res.12:180-194.
Noy-Meir, I. 1975. Stability of grazing systems: an application of predator-prey graphs. J. Ecol. 63:459-481.

Ogden, J. C. 1976. Some aspects of herbivore-plantrelationships on Caribbean reefs and seagrass beds. Aquat. Bot. 2:103-116.
_____ . 1980. Faunal relationships in Caribbean seagrassbeds. Pages 173-198 in R. C. Phillips and C. P. McRoy, eds. Handbook of seagrass biology: an ecosystem perspective. Garland STPM Press, New York, N.Y.
Owen, M. 1975. Cutting and fertilizing grassland forwinter goose management. J. Wildl. Manage. 39:163- 167.
Patriguin, D. G. 1972. The origin of nitrogen andphosphorus for growth of the marine angiosperm Thalassia testudinum. Mar. Biol. 15:35-46.
Phillips, R. C., and E. G. Menez. 1988. Seagrasses. Smithsonian Contrib. Mar. Sci. 34:1-104.
Pollard, D. A. 1984. A review of ecological studies onseagrass-fish communities, with particular reference to recent studies in Australia. Aguat. Bot. 18:3-42.
Pulich, Jr., W. 1980. Ecology of a hypersaline lagoon:the Laguna Madre. Pages 103-122 in P. L. Fore and R.D. Peterson, eds. Proc. Gulf of Mexico Coastal Ecosystems Workshop. U.S. Fish and Wildl. Serv. FWS/OBS-80/30. Albuguerque, N.M.

_____ . 1985. Seasonal growth dynamics of Ru p piamaritima L. s.l. and Halodule wriahtii Aschers. in southern Texas and evaluation of sediment fertility status. Aquat. Bot. 23:53-66.
Ranwell, D. S., and B. M. Downing. 1959. Brent goose(Branta bernicla (L.)) winter feeding pattern and Zostera resources at Scolt Head Island, Norfolk. Anim. Behav. 7:42-56.
Rusnak, G. A. 1960. Sediments of Laguna Madre, Texas.Pages 153-196 in F. P. Shepard, F. B. Phleger, and T. H. van Andel eds. Recent sediments, northwest Gulf of Mexico. Am. Assoc. Petroleum Geol., Tulsa, Okla.
Shanholtzer, G. F. 1974. Relationship of vertebrates to salt marsh plants. Pages 463-474 in R. J. Reimold and W. H. Queen, eds. Ecology of halophytes. Academic Press, Inc. New York, N.Y.
Short, F. T. 1980. A simulation model of the seagrassproduction system. Pages 277-295 in R. C. Phillips and C. P. McRoy, eds. Handbook of seagrass biology: an ecosystem perspective. Garland STPM Press, New York, N.Y.
______ . 1983. The response of interstitial ammonium ineelgrass (Zostera marina L.) beds to environmental perturbations. J. Exper. Mar. Biol. Ecol. 68:195-

112
_____ . 1987. Effects of sediment nutrients onseagrasses: literature review and mesocosm experiment. Aquat. Bot.27:41-57.
Singleton, J. R. 1964. Ecology of the principal waterfowl food plants of the lower Laguna Madre. Tex. Parks and Wildl. Job Completion Report, Fed. Aid Proj. W- 29-R-14, Job 17. 9pp.
Smith, III, T. J. 1983. Alteration of salt marsh plant community composition by grazing snow geese.Holarctic Ecol. 6:204-210.
_____ . and W. E. Odum. 1981. The effects of grazing bysnow geese on coastal salt marshes. Ecology 62:98- 106.
Stieglitz, W. O. 1966. Utilization of available foods by diving ducks on Apalachee Bay, Florida. Proc. Southeast. Assoc. Game and Fish Comm. 12:42-50.
Thayer, G. W., K. A. Bjorndal, J. C. Ogden, S. L.Williams, and J. C. Ziemam. 1984. Role of larger herbivores in seagrass communities. Estuaries 7:351- 376.
Thomas, G. W. 1982. Exchangeable cations. Pages 159-165in A. L. Page, ed. Methods of soil analysis, part 2: chemical and microbiological properties. Second ed.ASA Monogr. 9.

Tubbs, C. R., and J. M. Tubbs. 1983. The distribution of Zostera and its exploitation by wildfowl in the Solent, southern England. Aquat. Bot. 15:223-2 39.
Verhoeven, J. T. A. 1980. The ecology of Ruppia-dominated communities in western Europe. III. Aspects of production, consumption and decomposition. Aquat. Bot. 8:209-253.
Weller, M. W. 1964. Distribution and migration of the redhead. J. Wildl. Manage. 28:64-102.
Wiliams, S. L. 1988. Thalassia testudinum productivity and grazing by green turtles in a highly disturbed seagrass bed. Mar. Biol. 98:447-455.
Zieman, J. C. 1982. The ecology of the seagrasses ofsouth Florida: a community profile. U.S. Fish and Wildl. Serv. FWS/OBS-82/25. Washington, D.C.
CHAPTER IV
WATER DEPTH AS A PREDICTOR OF REDHEAD DUCK DISTRIBUTION IN THE LOWER LAGUNA MADRE, TEXAS
Abstract; I used linear regression formulas and National Oceanographic and Atmospheric Administration water level data to predict water depth at 30 sites in the lower Laguna Madre, Texas within 7% of actual water depth.When redhead ducks (Aythva americana) were present at a site, predicted water depth was between 12 and 30 cm deep 90% of the time. Redheads were present in 12- to 30-cm deep water in greater proportion than it was available and were present in water > 30 cm or < 12 cm deep less than expected based on availability. Map showing percent of time, between October 1988 and March 1989, that predicted water depth was between 12 and 30 cm coincided with actual location and degree of usage by redhead flocks.Key words: Avthva americana, habitat selection, LagunaMadre, model, redheads, water depth
INTRODUCTIONWater depth may be an important habitat selection
factor for wintering redhead ducks in Texas (White and James 1978). Redheads wintering on the Laguna Madre feed
114

by head dipping or tipping up in water between 12 and 3 0cm (inclusive) deep. Because redheads feedintermittently through the day, they should remain in water between 12 and 30 cm deep at all times. Waterlevel changes in the lower Laguna Madre aremeteorologically driven (Rusnak 1960), and therefore are not predictable or cyclic. My objectives were to (1) develop and test a predictive water depth model for 30 sites in the lower Laguna Madre; (2) test whether redheads are found in water between 12 and 3 0 cm deep more than would be predicted by availability; and (3) construct a map showing percent of time that water was between 12 and 30 cm deep between October 1988 and March 1989 and compare it with actual time and location of redhead flocks during the same time period.
METHODSWater depth at 30 sites in 2 study areas covering
6,900 ha of the lower Laguna Madre was measured on 10 different days at approximately monthly intervals during 2 winters between January 1988 and March 1989 (Fig. 14). Water level from National Oceanographic and Atmospheric Administration's (NOAA) tide station 8778490 at Port Mansfield, Texas, and wind speed and wind direction data from the Port Mansfield National Weather Service reporting station were 3 independent variables regressed
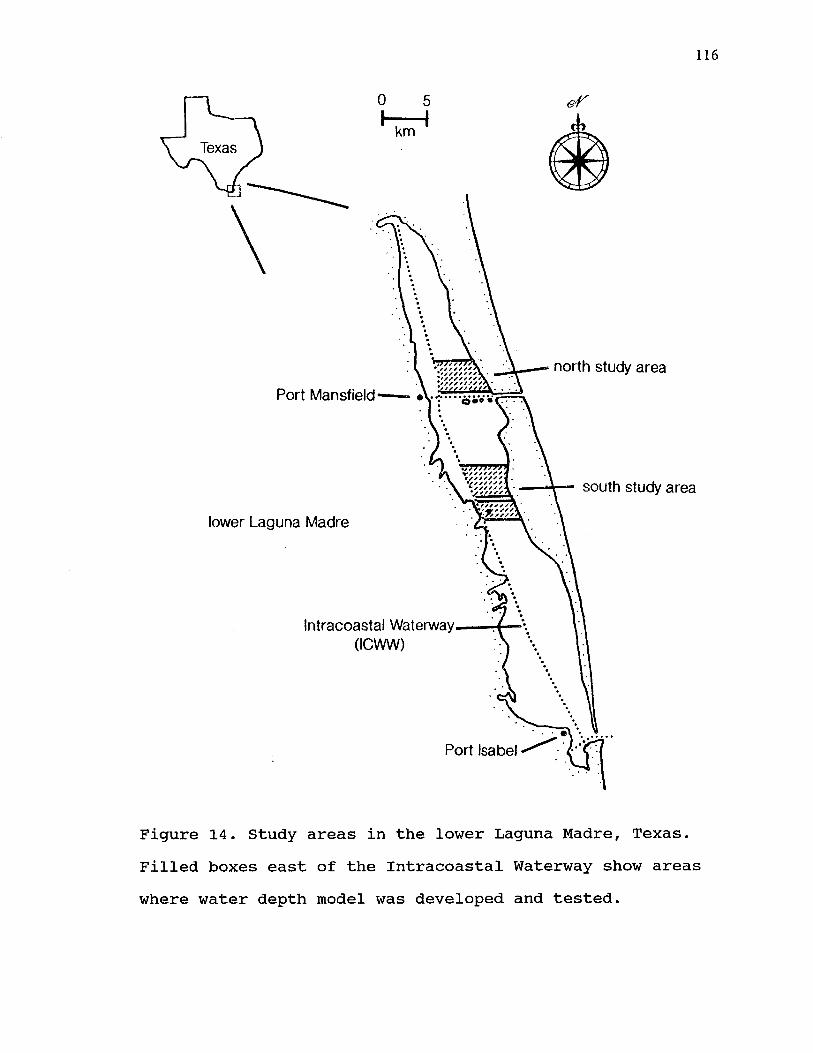
116
&f/r
kmTexas
north study area
Port Mansfield Q o * 9
south study area
lower Laguna Madre
Intracoastal Waterway (ICWW)
Port Isabel
Figure 14. Study areas in the lower Laguna Madre, Texas. Filled boxes east of the Intracoastal Waterway show areas where water depth model was developed and tested.
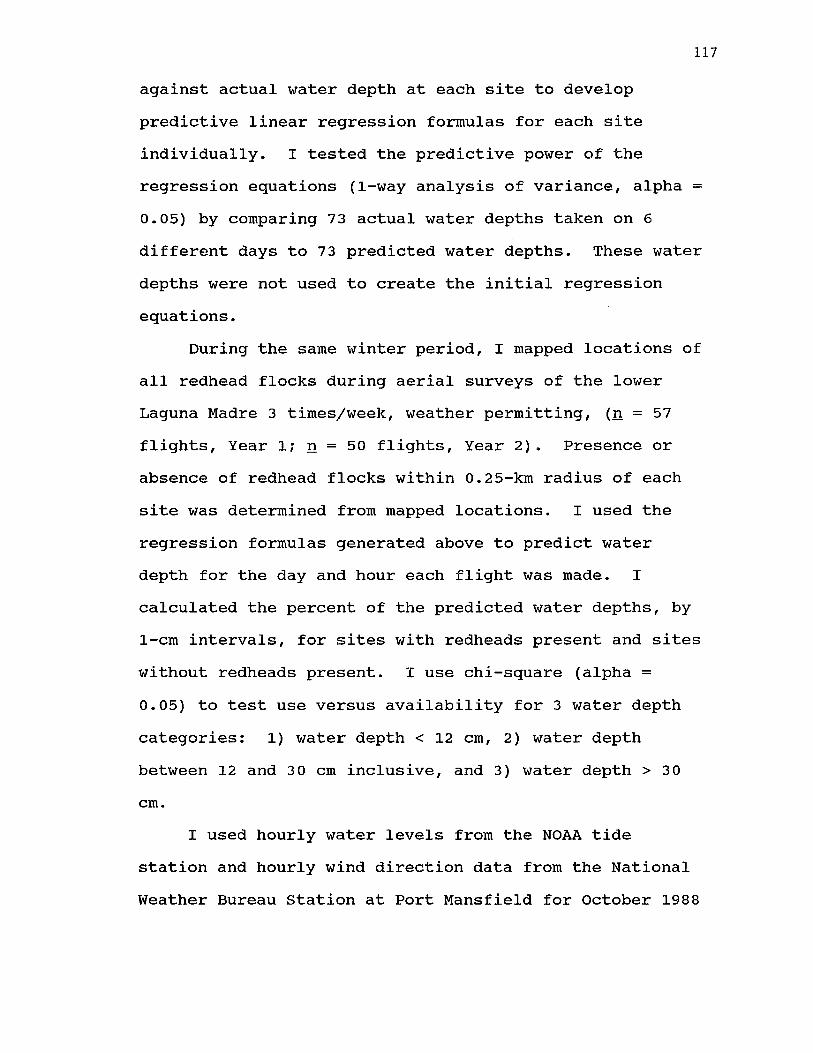
117
against actual water depth at each site to develop predictive linear regression formulas for each site individually. I tested the predictive power of the regression equations (1-way analysis of variance, alpha = 0.05) by comparing 73 actual water depths taken on 6 different days to 73 predicted water depths. These water depths were not used to create the initial regression equations.
During the same winter period, I mapped locations of all redhead flocks during aerial surveys of the lower Laguna Madre 3 times/week, weather permitting, (n = 57 flights, Year 1; n = 50 flights, Year 2). Presence or absence of redhead flocks within 0.25-km radius of each site was determined from mapped locations. I used the regression formulas generated above to predict water depth for the day and hour each flight was made. I calculated the percent of the predicted water depths, by 1-cm intervals, for sites with redheads present and sites without redheads present. I use chi-square (alpha =0.05) to test use versus availability for 3 water depth categories: 1) water depth < 12 cm, 2) water depthbetween 12 and 3 0 cm inclusive, and 3) water depth > 3 0 cm.
I used hourly water levels from the NOAA tide station and hourly wind direction data from the National Weather Bureau Station at Port Mansfield for October 1988

to March 1989 to predict water depth at each site for each hour of the day and night. From these predictions,I calculated percent of time that each site had water depth between 12 and 30 cm (inclusive). I divided the time into 4 categories: water between 12 and 3 0 cm deep > 75% of the winter, water between 12 and 30 cm deep between 50 and 75% of the winter, water between 12 and 3 0 cm deep between 25 and 50% of the winter, and water between 12 and 30 cm deep < 25% of the winter. For presentation, the study areas were gridded into 0.25-km2 blocks; linear interpolations of water depth were made between blocks that contained study sites (e.g. had a predicted value) and those blocks that did not contain study sites. Uniform variation in bathymetry facilitated interpolations. Quarter-km blocks were chosen because water depth change within 0.5 km was assumed to be biologically insignificant to redheads.
A composite map was made of flock locations for each month individually between October 1988 and March 1989.I collated these 6 maps and delineated areas that never had redhead flocks present, had redhead flocks present during 1 month, present during 2 months, etc., up through areas with redhead flocks present for 5 months. No areas had flocks present during all 6 months. Predictions were visually compared against actual use.
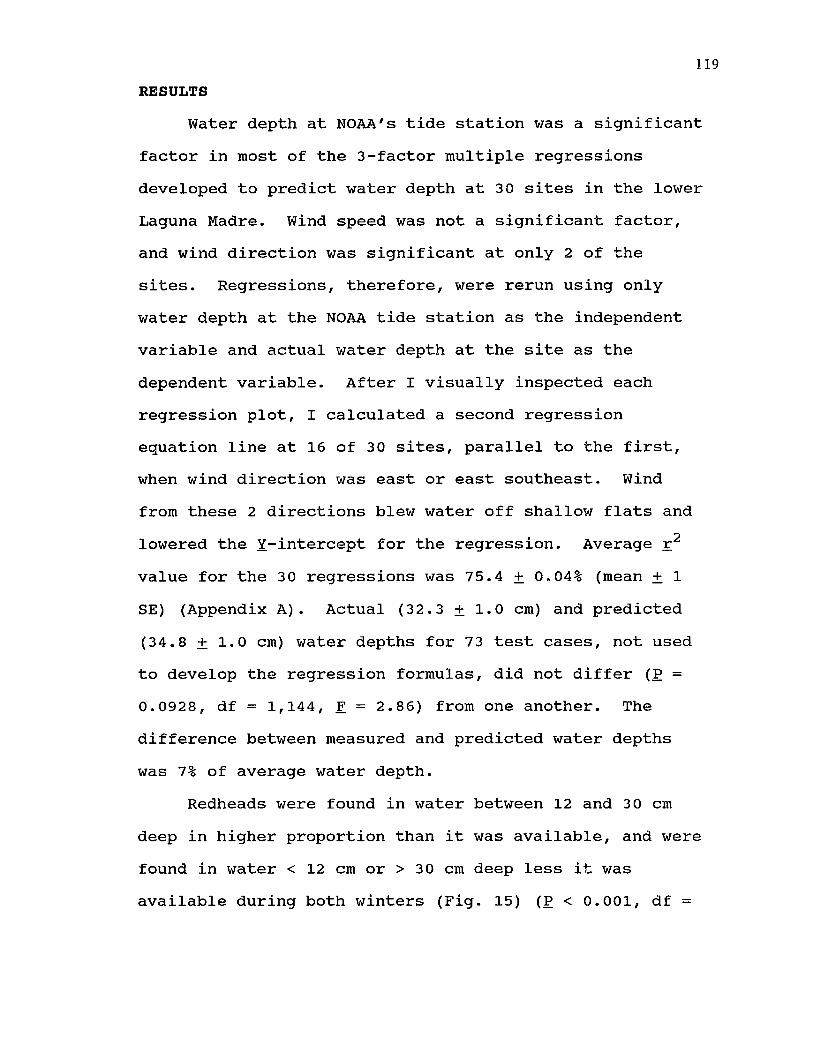
119RESULTS
Water depth at NOAA's tide station was a significant factor in most of the 3-factor multiple regressions developed to predict water depth at 30 sites in the lower Laguna Madre. Wind speed was not a significant factor, and wind direction was significant at only 2 of the sites. Regressions, therefore, were rerun using only water depth at the NOAA tide station as the independent variable and actual water depth at the site as the dependent variable. After I visually inspected each regression plot, I calculated a second regression equation line at 16 of 30 sites, parallel to the first, when wind direction was east or east southeast. Wind from these 2 directions blew water off shallow flats and lowered the Y-intercept for the regression. Average r2 value for the 3 0 regressions was 75.4 + 0.04% (mean + 1 SE) (Appendix A). Actual (32.3 + 1.0 cm) and predicted (34.8 + 1.0 cm) water depths for 73 test cases, not used to develop the regression formulas, did not differ (P = 0.0928, df = 1,144, F = 2.86) from one another. The difference between measured and predicted water depths was 7% of average water depth.
Redheads were found in water between 12 and 3 0 cm deep in higher proportion than it was available, and were found in water < 12 cm or > 30 cm deep less it was available during both winters (Fig. 15) (P < 0.001, df =

101987-88
8
6
4
2 .•
1988-898
with redheads6
4without redheads
2
30 40 5020100W ater depth (cm)
Figure 15. Frequency of water depths, at 1-cm intervals at 3 0 study sites in the lower Laguna Madre, Texas, with redheads present (dotted line) and without redheads present (solid line). Top graph is winter, 1987-88 and bottom graph is winter, 1988-89.

121
2, X2 = 38.5; P < 0.001, df = 2, X2 = 77.0). When redheads were present within 0.25-km radius of a site, water was between 12 and 30 cm deep (inclusive) 88.9%(Year 1) and 91.5% (Year 2) of the time.
Based on the predicted water depths for the entire period between October 1988 and March 1989, only a narrow strip of habitat adjacent to the barrier island in thenorth study area had water between 12 and 30 cm deep, andno part of the north study area was predicted to have water between 12 and 3 0 cm deep more than 75% of the time (Fig. 16). In the south study area, a much broader areaof habitat was predicted to have water between 12 and 30cm deep and approximately 25% of that area was predicted to have water within that depth range more than 75% of the time (Fig. 16).
Areas in the north study area that were actually used by redheads were concentrated along the eastern edge of the lower Laguna Madre. Only 3 small areas were used by flocks during 3 months; the rest of the area was used 2 months or less (Fig. 17). In the south study area,about two-thirds of the area was actually used byredheads; small sections in the eastern third were used by flocks for 4 and 5 months of the winter (Fig. 17).

122
3.7m—
u— fICWW
7 km
5«:
1 0
north study site
ICWW
m
. e « l °5 0• * o o O
iM-mm ®|i|
P e r c e n tm > 75o 5 0 - 7 5[.i 2 5 - 5 0n < 25
south study site
Figure 16. Predicted time that 0.25-km2 blocks had water between 12 and 3 0 cm deep between October 1988 and March 1989 at 2 study areas in the lower Laguna Madre, Texas. Black dots delineate individual study sites. Schematics of bathymetric profiles have different horizontal and vertical scales.

123
north study site
monthsm 5m 4H 3
y> y*? wBpC'ffiy \p z / / z z / l M g a B 2 3 K ^ \
south study site
Figure 17. Location and amount of time redhead flocks were present at 2 study areas in the lower Laguna Madre, Texas, between October 1988 and March 1989.

124
DISCUSSIONWater between 12 and 30 cm deep was a good predictor
of redhead flock locations. When redheads were present at a study site, water was between 12 and 30 cm deep 90% of the time. Prediction of the amount of time that 0.25- km2 blocks in the 2 study areas had water between 12 and 30 cm between October 1988 and March 1989 coincided with the area and time that redheads were actually present.Only a narrow strip along the east side of the lower Laguna Madre north of Port Mansfield had water between 12 and 30 cm deep. Redheads were only found in that narrow strip and the maximum number of months they were present was 3. South of Port Mansfield, approximately two-thirds of the area was estimated to have water between 12 and 30 cm deep more than 25% of the time; approximately 25% of that area had water between 12 and 30 cm deep > 75% of the time. Redheads were found over the broader area as predicted based on water depth. Areas with flocks present for 4 - 5 months were in the areas where water was predicted to be between 12 and 3 0 cm deep > 75% of the time.
This model has less ability to predict flocklocations on a specific day than it does to predict areaswhere redheads will be present over a longer time frame.Not all areas with water between 12 and 30 cm deep hadflocks present each day. Areas not being used may
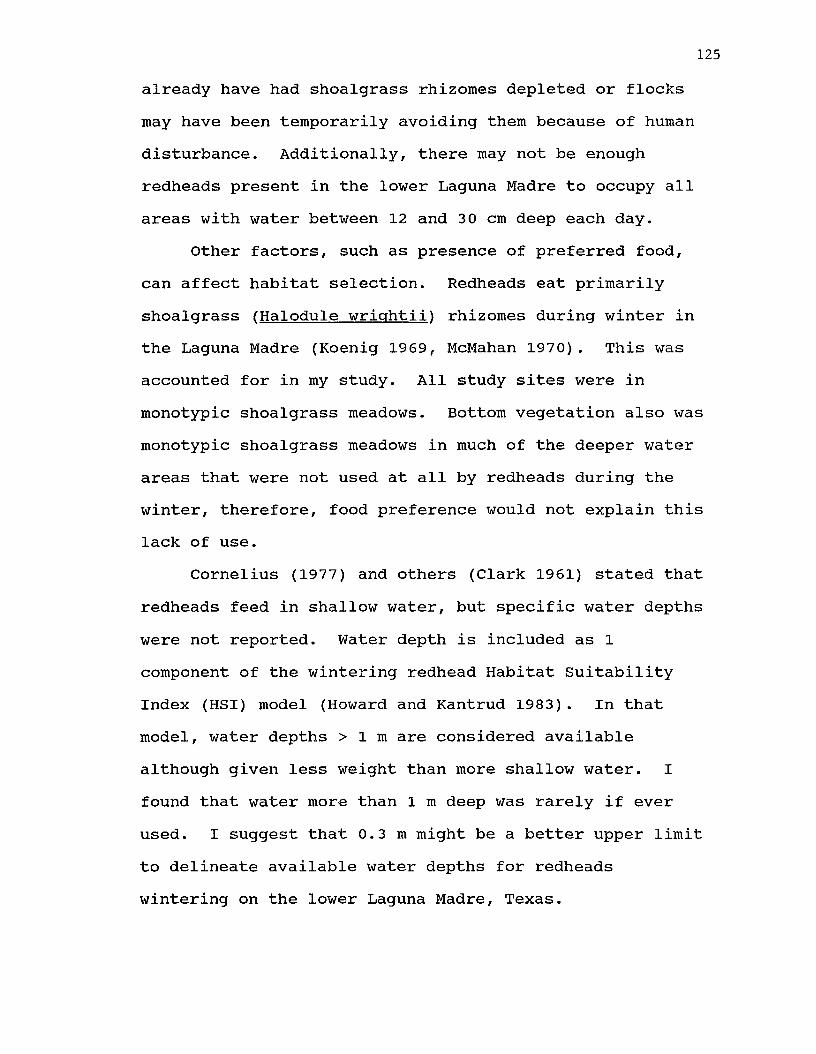
125
already have had shoalgrass rhizomes depleted or flocks may have been temporarily avoiding them because of human disturbance. Additionally, there may not be enough redheads present in the lower Laguna Madre to occupy all areas with water between 12 and 30 cm deep each day.
Other factors, such as presence of preferred food, can affect habitat selection. Redheads eat primarily shoalgrass fHalodule wriohtiil rhizomes during winter in the Laguna Madre (Koenig 1969, McMahan 1970). This was accounted for in my study. All study sites were in monotypic shoalgrass meadows. Bottom vegetation also was monotypic shoalgrass meadows in much of the deeper water areas that were not used at all by redheads during the winter, therefore, food preference would not explain this lack of use.
Cornelius (1977) and others (Clark 1961) stated that redheads feed in shallow water, but specific water depths were not reported. Water depth is included as 1 component of the wintering redhead Habitat Suitability Index (HSI) model (Howard and Kantrud 1983). In that model, water depths > 1 m are considered available although given less weight than more shallow water. I found that water more than 1 m deep was rarely if ever used. I suggest that 0.3 m might be a better upper limit to delineate available water depths for redheads wintering on the lower Laguna Madre, Texas.
126
As recreational and industrial uses of coastal areas increasingly conflict with needs of wildlife, areas .important to wildlife need to be identified so they can be protected. Water depth is one habitat selection factor that can be used to identify important redhead wintering areas in the Laguna Madre.
ACKNOWLEGMENTSI wish to thank Christopher Onuf for providing a
computer file of the hourly tide level and wind speed and direction data; Robert Chabreck, Thomas Custer, James Gosselink, Robert Hamilton, William Kelso, and Phillip Zwank for reviewing the manuscript; and Cadgis Lab personnel for digitizing and summarizing flock location data. Research was conducted under the auspices of the Louisiana Cooperative Fish and Wildlife Research Unit in cooperation with Louisiana State University, Louisiana Department of Wildlife and Fisheries, and Wildlife Management Institute. This manuscript is approved for publication by Director of the Louisiana Agricultural Experiment Station as manuscript **-**-****.

LITERATURE CITEDClark, T. L. 1961. Ecology of wintering waterfowl in the
lower Laguna Madre. Tex. Parks and Wildl., Job Completion Report, Fed. Aid Proj. W-29-R-14, Job 1610pp.
Cornelius, S. E. 1977. Food and resource utilization by wintering redheads on lower Laguna Madre. J. Wildl. Manage. 41:374-385.
Howard, R. J., and H. A. Kantrud. 1983. Habitatsuitability index models: redhead (wintering). U.S. Fish and Wildl. Serv. FWS/OBS-82/10.53 14pp.
Koenig, R. L. 1969. A comparison of the winter foodhabits of three species of waterfowl from the upper Laguna Madre of Texas. M.S. Thesis, Texas A & I Univ., Kingsville. 59pp.
McMahan, C. A. 1970. Food habits of ducks wintering on Laguna Madre, Texas. J. Wildl. Manage. 34:946-949.
Rusnak, G. A. 1960. Sediments of Laguna Madre, Texas.Pages 153-196 in F. P. Shepard, F. B. Phleger, T. H van Andel, eds. Recent sediments, northwest Gulf of Mexico. Am. Assoc. Petroleum Geol., Tulsa, Okla.
White, D. H., and D. James. 1978. Differential use offresh water environments by wintering waterfowl of coastal Texas. Wilson Bull. 90:99-111.

128
Appendix A. Slope, Y-intercept, and r2 values for water depth prediction regression formulasfor 30 sites in the lower Laguna Madre, Texas.
Site Slope
Y-intercept
Wind Other wind E or ESEa directions r2
11 0.705 -27.500 -20.694 0.8812 0.752 -20.000 -21.870 0.9013 0.771 -31.500 -24.868 0.8514 0.758 -32.500 -25.617 0.8914a 0.759 -33.000 -26.533 0.9415 0.712 -29.000 -21.828 0. 9216 0.724 -24.000 -19.511 0.9517 0. 676 -15.500 -12.544 0.8919a 0.270 8.000 14.835 0.4521 0.786 -35.641 0.7922 0.885 -40.285 0.8423 0.827 -36.415 0.7823a 0.745 -30.925 0.7223b 0.716 -30.821 0.7023c 0.843 -39.858 0.8624 0.463 -12.424 0.5125 0.427 -9.102 0.4125a 0.471 -19.000 -10.074 0.51
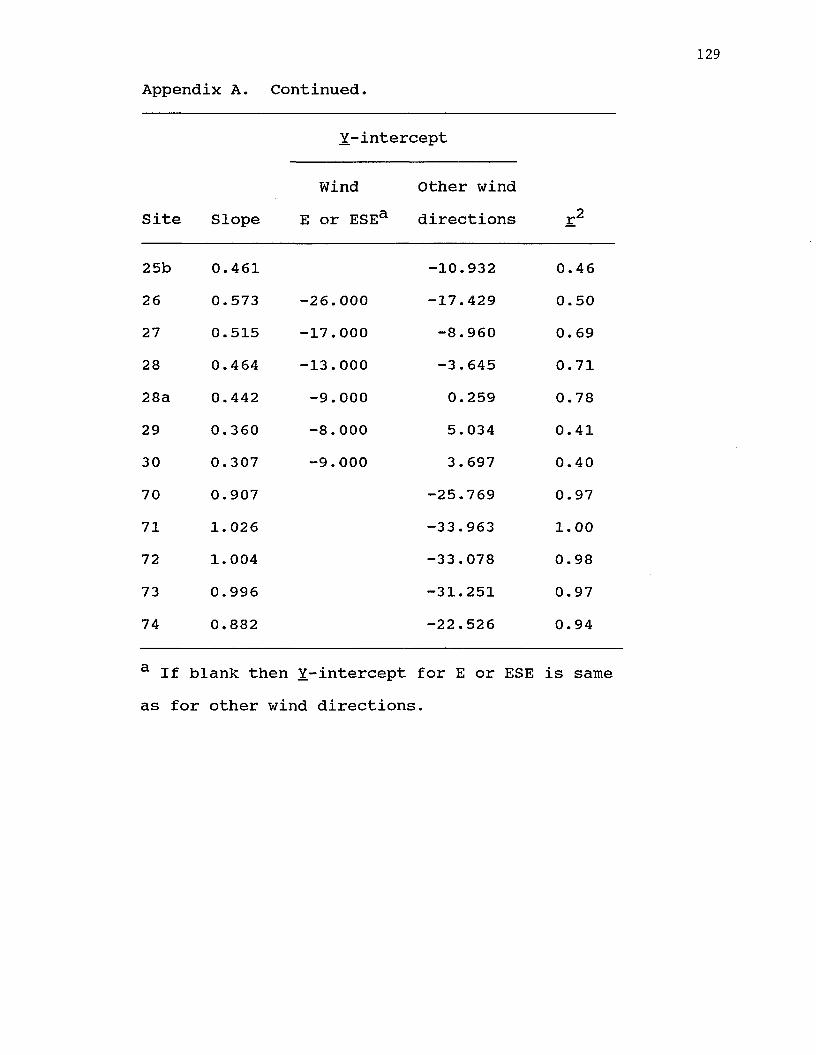
Appendix A. Continued.
Site Slope
Y-intercept
Wind Other wind E or ESEa directions r2
25b 0.461 -10.932 0.4626 0.573 -26.000 -17.429 0.5027 0.515 -17.000 -8.960 0. 6928 0.464 -13.000 -3.645 0.7128a 0.442 -9.000 0.259 0.7829 0.360 -8.000 5.034 0.4130 0.307 -9.000 3.697 0.4070 0.907 -25.769 0.9771 1. 026 -33.963 1.0072 1.004 -33.078 0.9873 0.996 -31.251 0.9774 0.882 -22.526 0.94
a If blank then Y-intercept for E or ESE is sameas for other wind directions
SUMMARY
Each winter redheads begin arriving in the lower Laguna Madre with frontal passages beginning in early October. Flocks did not arrive on the day before frontal passage, but arrived on the day of frontal passage, both before and after actual frontal passage, and for 2 days following frontal passage. Average flock size of migrants was 26.4 ± 0.6 (mean + 1 SE) (n = 690) and did not vary by time of day or the day relative to frontal passage. Arrival rate (number of flocks arriving per 0.5-hr interval) was higher during afternoon (21.7 + 0.6) than during either morning (4.3 + 1.2) or midday (1.5 + 0.4). By day 2 after frontal passage arrival rate was reduced to 3.2 + 2.9 flocks per 0.5-hr interval and did not vary by time-of-day.
Two freshwater areas were sampled during aerial surveys each winter: agricultural drainages and Patos Lake, an 18-ha lake on Laguna Atascosa National Wildlife Refuge. When redheads used freshwater sites, they began arriving there just after sunrise and continue arriving for 2 - 3 hours. They remained on fresh water during the remainder of the day leaving 1 - 2 hours before sunset. After November, redheads quit using fresh water in agricultural drainages, but a few (< 5% of redheads in the lower Laguna Madre) continued to use Patos Lake daily throughout the winter. Redheads which winter on the
130

131
lower Laguna Madre may use freshwater areas extensively upon arrival until they acclimate to the hypersaline conditions of the lower Laguna Madre. Once acclimated, most no longer need fresh water on a daily basis, and remained on the lower Laguna Madre for the rest of the winter.
In October, comparing among saltwater sites within the lower Laguna Madre, redheads selected sites with lower salinities (24 + 5.4 ppt) than sites not selected (35 + 0.8 ppt). Redheads continued throughout the winter to use sites with lower salinities (32 + 0.4 ppt) than sites not used (38 + 0.5 ppt). Both upon initial arrival and for the remainder of the winter, selecting areas of lower salinities would help reduce osmotic stress.
Upon arrival at fresh water, redheads drank, preened, and bathed. Thereafter, sleeping was the dominant activity (75 + 1%). There was almost no feeding at freshwater sites (< 0.4% of flock's activity).Feeding bouts which took place in fresh water were of shorter duration (54 + 17 sec) than those in the lower Laguna Madre. Ninety-four percent of feeding individuals at saltwater sites fed for the entire 2.5- or 5-minute focal animal feeding observation period, compared with 11% at freshwater sites.
On the lower Laguna Madre, feeding was the dominant activity of redheads; it averaged 46 + 1% of the flock's
132
activities. Feeding was intermittent through the day, but a greater percent of the flock fed during early morning than during the rest of the day. Percent of flock feeding was inversely related to temperature; as temperature decreased feeding increased. Frequency of behaviors did not vary by sex or among flocks of different sizes, but behaviors varied according to position within the flock relative to wind direction.More redheads fed in upwind quartiles than in downwind quartiles; the opposite was true for sleeping redheads.
Redheads most frequently fed by dipping or tipping (83% of feeding observations); they rarely dived. A single feeding sequence (time with head underwater plus time with head above water prior to next head under) by dipping took 5 sec, a single tipping sequence took 8 sec, and a single diving sequence took 19 sec. If water is too deep to feed by dipping or diving, redheads would have to dive. I hypothesize that redheads may be choosing shallow water sites to minimize time spent feeding.
Water depth was between 12 and 30 cm deep when redheads fed by dipping and tipping. When redheads were present at locations of known water depth in the lower Laguna Madre, water was between 12 and 30 cm deep 90% of the time. Redheads avoided water > 30 cm and < 12 cm deep. Redheads usually shifted their position in the
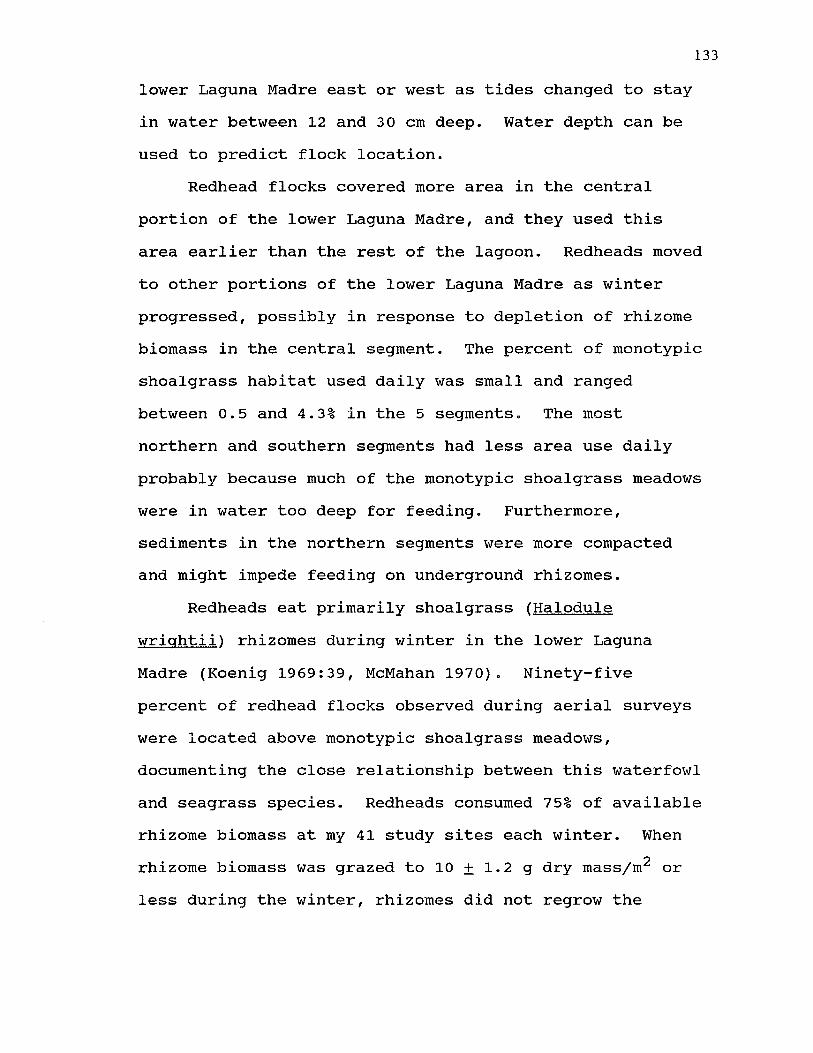
133
lower Laguna Madre east or west as tides changed to stay in water between 12 and 3 0 cm deep. Water depth can be used to predict flock location.
Redhead flocks covered more area in the central portion of the lower Laguna Madre, and they used this area earlier than the rest of the lagoon. Redheads moved to other portions of the lower Laguna Madre as winter progressed, possibly in response to depletion of rhizome biomass in the central segment. The percent of monotypic shoalgrass habitat used daily was small and ranged between 0.5 and 4.3% in the 5 segments. The most northern and southern segments had less area use daily probably because much of the monotypic shoalgrass meadows were in water too deep for feeding. Furthermore, sediments in the northern segments were more compacted and might impede feeding on underground rhizomes.
Redheads eat primarily shoalgrass (Halodule wricfhtii) rhizomes during winter in the lower Laguna Madre (Koenig 1969:39, McMahan 1970). Ninety-five percent of redhead flocks observed during aerial surveys were located above monotypic shoalgrass meadows, documenting the close relationship between this waterfowl and seagrass species. Redheads consumed 75% of available rhizome biomass at my 41 study sites each winter. When rhizome biomass was grazed to 10 + 1.2 g dry mass/m2 or less during the winter, rhizomes did not regrow the

134
following summer to pre-grazing levels. Thirty-three percent of the vegetation plots were grazed to below this recovery value during both years of the study, and 64% were grazed to below this threshold during 1 of 2 years. Rhizome biomass did not decline in redhead exclosures over the winter and biomass increased the following summer. This suggested that redhead grazing may be keeping shoalgrass rhizomes below their maximum biomass. Redhead use of an area declined once rhizome biomass was
O #grazed to 10 g dry mass/m or less. I do not think food is super abundant in the lower Laguna Madre as other's (Cornelius 1977) have reported. Redhead grazing may be limiting shoalgrass biomass.
Habitat selection factors for wintering redheads, in decreasing order of importance are: presence of monotypic shoalgrass meadows, shoalgrass rhizome biomass > 10 g dry mass/m2, water between 12 and 30 cm deep, and relatively low salinities.
Usage of Chesapeake Bay by redheads declined when their preferred food disappeared (Stevenson and Confer 1978:109, Perry and Uhler 1988). Redheads did not switch to an alternate food as did canvasbacks (Avthva valisineria); redheads may be less flexible than other species in adapting to change. Continued loss of monotypic shoalgrass habitat due to dredging and hydrologic changes, as well as reductions due to
continual grazing by redheads, could negatively impactredheads in the future.
LITERATURE CITEDCornelius, S. E. 1977. Food and resource utilization by
wintering redheads on lower Laguna Madre. J. Wildl. Manage. 41:374-385.
Koenig, R. L. 1969. A comparison of the winter foodhabits of three species of waterfowl from the upper Laguna Madre of Texas. M.S. Thesis, Texas A & I Univ., Kingsville, 59pp.
McMahan, C. A. 1970. Food habits of ducks wintering on Laguna Madre, Texas. J. Wildl. Manage. 34:946-949.
Perry, M. C., and F. M. Uhler. 1988. Food habits and distribution of wintering canvasbacks, Avthva valisineria. on Chesapeake Bay. Estuaries 11:57-67.
Stevenson, J. C., and N. M. Confer, 1978. Summary ofavailable information on Chesapeake Bay submerged vegetation. U.S. Fish and Wildl. Serv. FWS/OBS- 78/66. 335pp.
VITAChristine A. Mitchell was born on July 10, 1951 in
Brush, Colorado to Kathryn R. and Donald M. Mitchell.She graduated from Brush High School in 1969. She received a Bachelor of Arts degree in Anthropology from the University of Colorado, Boulder, Colorado in 1973, and a Master of Science degree in Biology from Corpus Christi State University, Corpus Christi, Texas in 1985. She entered graduate school at Louisiana State University in January 1986 and is currently a candidate for the degree of Doctor of Philosophy in Wildlife and Fisheries Science.
136

DOCTORAL EXAM INATION AND DISSERTATION REPORT
Candidate: Christine Anne Mitchell
Major Field: Wildlife and Fisheries Science
Title of Dissertation: Ecology of Wintering Redheads (Ay thy a americana) on theLower Laguna Madre, Texas
Approved:
M ajoft/Professor and Chairman
Dean of the Graduate School
E X A M IN IN G C O M M IT T E E :
C j . —
ft.
—y *y i ■ ■ f ........... ....................
Date of Exam ination:
April 5, 1991