Comparative ecology of over-wintering Calanus finmarchicus in the northern North Atlantic, and...
11
Comparative ecology of over-wintering Calanus finmarchicus in the northern North Atlantic, and implications for life-cycle patterns Michael R. Heath, Peter R. Boyle, Astthor Gislason, William S. C. Gurney, Stephen J. Hay, Erica J. H. Head, Steven Holmes, Anna Ingvarsdo ´ttir, Sigrun H. Jo ´nasdo ´ttir, Pennie Lindeque, Raymond T. Pollard, Jens Rasmussen, Kelvin Richards, Katherine Richardson, Gary Smerdon, and Douglas Speirs Heath, M. R., Boyle, P. R., Gislason, A., Gurney, W. S. C., Hay, S. J., Head, E. J. H., Holmes, S., Ingvarsdo ´ ttir, A., Jo ´nasdo ´ttir, S. H., Lindeque, P., Pollard, R. T., Rasmussen, J., Richards, K., Richardson, K., Smerdon, G., and Speirs, D. 2004. Comparative ecology of over-wintering Calanus finmarchicus in the northern North Atlantic, and implications for life-cycle patterns. ICES Journal of Marine Science, 61: 698e708. Data from plankton net and Optical Plankton Counter sampling during 12 winter cruises between 1994 and 2002 have been used to derive a multi-annual composite 3-D distribution of the abundance of over-wintering Calanus finmarchicus in a swath across the North Atlantic from Labrador to Norway. Dense concentrations occurred in the Labrador Sea, northern Irminger Basin, northern Iceland Basin, eastern Norwegian Sea, FaroeeShetland Channel, and in the Norwegian Trench of the North Sea. A model of buoyancy regulation in C. finmarchicus was used to derive the lipid content implied by the in situ temperature and salinity at over-wintering depths, assuming neutral buoyancy. The FaroeeShetland Channel and eastern Norwegian Sea emerged as having the highest water column-integrated abundances of copepodites, the lowest over-wintering temperature, and the highest implied lipid content. The results are discussed in the context of spatial persistence of populations, seasonal patterns of abundance, and relationships between over-wintering and lipid accumulation in the surface waters. Ó 2004 Published by Elsevier Ltd on behalf of International Council for the Exploration of the Sea. Keywords: Iceland Basin, Irminger Sea, Labrador Sea, lipid, net sampling, Norwegian Sea, Optical Plankton Counter, vertical distribution, zooplankton. M. R. Heath, S. J. Hay, and J. Rasmussen: Marine Laboratory, PO Box 101, Victoria Road, Aberdeen, AB11 9DB, Scotland, UK. P. R. Boyle and A. Ingvarsdo ´ttir: University of Aberdeen, Department of Zoology, Tillydrone Avenue, Aberdeen AB9 2TN, Scotland, UK. A. Gislason: Marine Research Institute, Skulagata 4, PO Box 1390 Reykjavik, Iceland. W. S. C. Gurney, S. Holmes, and D. Speirs: University of Strathclyde, Department of Statis- tics and Modelling Science, Glasgow G1 1XH, Scotland, UK. E. J. H. Head: Department of Fisheries and Oceans, Ocean Science Division, Bedford Institute of Oceanography, PO Box 1006, Dartmouth, Nova Scotia B2Y 4A2, Canada. S. H. Jo ´nasdo ´ttir: Danish Institute for Fisheries Research, Kavalergaarden 6, Charlottenlund, DK-2920 Denmark. G. Smerdon and P. Lindeque: Plymouth Marine Laboratory, Prospect Place, West Hoe, Plymouth PL1 3DH, England, UK. R. T. Pollard: Southampton Oceanography Centre, George Deacon Division, Waterfront Campus, Empress Dock, Southampton SO14 3ZH, England, UK. K. Richards: IPRC/SOEST, University of Hawaii, POST Bldg. 409, 1680 East West Road, Honolulu, HI 96822, USA. K. Richardson: Department of Marine Ecology, University of Aarhus, Finlandsgade 14, DK 8200 Aarhus, Denmark. Correspondence to M. R. Heath: tel: +44 1224 876544; fax: +44 1224 295511; e-mail: [email protected]. Introduction Ocean-basin-scale information on the spatial distribution of Calanus finmarchicus has largely been derived from the Continuous Plankton Recorder (CPR) surveys (Matthews, 1969; Planque et al., 1997). However, these data reflect only the distribution in the surface waters, while the winter distribution, when the copepodites are far below the depth of the CPR, may more effectively delineate the persistent population structures (Bryant et al., 1998). ICES Journal of Marine Science, 61: 698e708 (2004) doi:10.1016/j.icesjms.2004.03.013 1054-3139/$30.00 Ó 2004 Published by Elsevier Ltd on behalf of International Council for the Exploration of the Sea. by guest on February 25, 2016 http://icesjms.oxfordjournals.org/ Downloaded from
-
Upload
borupgaard-gym -
Category
Documents
-
view
4 -
download
0
Transcript of Comparative ecology of over-wintering Calanus finmarchicus in the northern North Atlantic, and...
ICES Journal of Marine Science, 61: 698e708 (2004)doi:10.1016/j.icesjms.2004.03.013
by guest on February 25, 2016http://icesjm
s.oxfordjournals.org/D
ownloaded from
Comparative ecology of over-wintering Calanus finmarchicusin the northern North Atlantic, and implications forlife-cycle patterns
Michael R. Heath, Peter R. Boyle, Astthor Gislason, William S. C. Gurney,Stephen J. Hay, Erica J. H. Head, Steven Holmes, Anna Ingvarsdottir,Sigrun H. Jonasdottir, Pennie Lindeque, Raymond T. Pollard, Jens Rasmussen,Kelvin Richards, Katherine Richardson, Gary Smerdon, and Douglas Speirs
Heath, M. R., Boyle, P. R., Gislason, A., Gurney, W. S. C., Hay, S. J., Head, E. J. H.,Holmes, S., Ingvarsdottir, A., Jonasdottir, S. H., Lindeque, P., Pollard, R. T., Rasmussen, J.,Richards, K., Richardson, K., Smerdon, G., and Speirs, D. 2004. Comparative ecology ofover-wintering Calanus finmarchicus in the northern North Atlantic, and implications forlife-cycle patterns. ICES Journal of Marine Science, 61: 698e708.
Data from plankton net and Optical Plankton Counter sampling during 12 winter cruisesbetween 1994 and 2002 have been used to derive a multi-annual composite 3-D distributionof the abundance of over-wintering Calanus finmarchicus in a swath across the NorthAtlantic from Labrador to Norway. Dense concentrations occurred in the Labrador Sea,northern Irminger Basin, northern Iceland Basin, eastern Norwegian Sea, FaroeeShetlandChannel, and in the Norwegian Trench of the North Sea. A model of buoyancy regulation inC. finmarchicus was used to derive the lipid content implied by the in situ temperature andsalinity at over-wintering depths, assuming neutral buoyancy. The FaroeeShetland Channeland eastern Norwegian Sea emerged as having the highest water column-integratedabundances of copepodites, the lowest over-wintering temperature, and the highest impliedlipid content. The results are discussed in the context of spatial persistence of populations,seasonal patterns of abundance, and relationships between over-wintering and lipidaccumulation in the surface waters.
� 2004 Published by Elsevier Ltd on behalf of International Council for the Exploration of the Sea.
Keywords: Iceland Basin, Irminger Sea, Labrador Sea, lipid, net sampling, Norwegian Sea,Optical Plankton Counter, vertical distribution, zooplankton.
M. R. Heath, S. J. Hay, and J. Rasmussen: Marine Laboratory, PO Box 101, Victoria Road,Aberdeen, AB11 9DB, Scotland, UK. P. R. Boyle and A. Ingvarsdottir: University ofAberdeen, Department of Zoology, Tillydrone Avenue, Aberdeen AB9 2TN, Scotland, UK.A. Gislason: Marine Research Institute, Skulagata 4, PO Box 1390 Reykjavik, Iceland.W. S. C. Gurney, S. Holmes, and D. Speirs: University of Strathclyde, Department of Statis-tics and Modelling Science, Glasgow G1 1XH, Scotland, UK. E. J. H. Head: Department ofFisheries and Oceans, Ocean Science Division, Bedford Institute of Oceanography, PO Box1006, Dartmouth, Nova Scotia B2Y 4A2, Canada. S. H. Jonasdottir: Danish Institute forFisheries Research, Kavalergaarden 6, Charlottenlund, DK-2920 Denmark. G. Smerdonand P. Lindeque: Plymouth Marine Laboratory, Prospect Place, West Hoe, Plymouth PL13DH, England, UK. R. T. Pollard: Southampton Oceanography Centre, George DeaconDivision, Waterfront Campus, Empress Dock, Southampton SO14 3ZH, England, UK.K. Richards: IPRC/SOEST, University of Hawaii, POST Bldg. 409, 1680 East West Road,Honolulu, HI 96822, USA. K. Richardson: Department of Marine Ecology, University ofAarhus, Finlandsgade 14, DK 8200 Aarhus, Denmark. Correspondence to M. R. Heath: tel:+44 1224 876544; fax: +44 1224 295511; e-mail: [email protected].
Introduction
Ocean-basin-scale information on the spatial distribution of
Calanus finmarchicus has largely been derived from the
Continuous Plankton Recorder (CPR) surveys (Matthews,
1054-3139/$30.00 � 2004 Published
1969; Planque et al., 1997). However, these data reflect
only the distribution in the surface waters, while the winter
distribution, when the copepodites are far below the depth
of the CPR, may more effectively delineate the persistent
population structures (Bryant et al., 1998).
by Elsevier Ltd on behalf of International Council for the Exploration of the Sea.
699Comparative ecology of over-wintering C. finmarchicus
by guest on February 25, 2016http://icesjm
s.oxfordjournals.org/D
ownloaded from
The winter dormancy phase of C. finmarchicus, which
may involve a diapause state, has been well documented
(see review by Hirche, 1996). Development is arrested
during copepodite moult stages IV and V in the late
summer and autumn and the animals then descend out of
the surface waters to, it is assumed, some neutral buoyancy
depth that, in the open ocean, is typically between 500 and
1500 m. Arousal from diapause and the moult transition to
copepodite stage VI does not take place until late wintereearly spring of the following year. Stage VI copepodites
migrate to the surface to begin spawning (Heath, 1999;
Gislason and Astthorsson, 2000). Low temperature, avoid-
ance of predators, and limited parasite infection have been
suggested as factors conferring high survival probability on
dormant animals over-wintering at depth (Kaartvedt, 1996).
Less well documented are the ocean-basin-scale patterns
of distribution and properties of over-wintering stages.
Regional studies have identified accumulations in pits and
trenches in continental shelf regions (e.g. Durbin et al.,
1995), in fjords with relatively limited exchange between
the bottom waters and the open sea (e.g. Hirche, 1983), and
at depths of 500e2000 m at various locations in the ocean
(e.g. Hirche, 1996). Heath et al. (2000a) collated data from
depth-resolved plankton samples collected during a number
of regional surveys in the mid to late 1990s to map the
large-scale 3-D distribution of over-wintering C. finmarch-
icus in the shelf and ocean waters of the Northeastern
Atlantic. Here, we extend this synthesis by including
material collected since 1999 from previously unsurveyed
areas to map a swath across the northern North Atlantic,
from Labrador in the southwest to northern Norway in the
northeast. At these scales, the data begin to complement the
CPR in spatial coverage, although they are still a multi-
annual composite. Nevertheless, we can begin to discern
basin-scale structure in the over-wintering population that
may help to account for seasonal and spatial dynamics
elucidated from the surface water CPR data.
Materials and methods
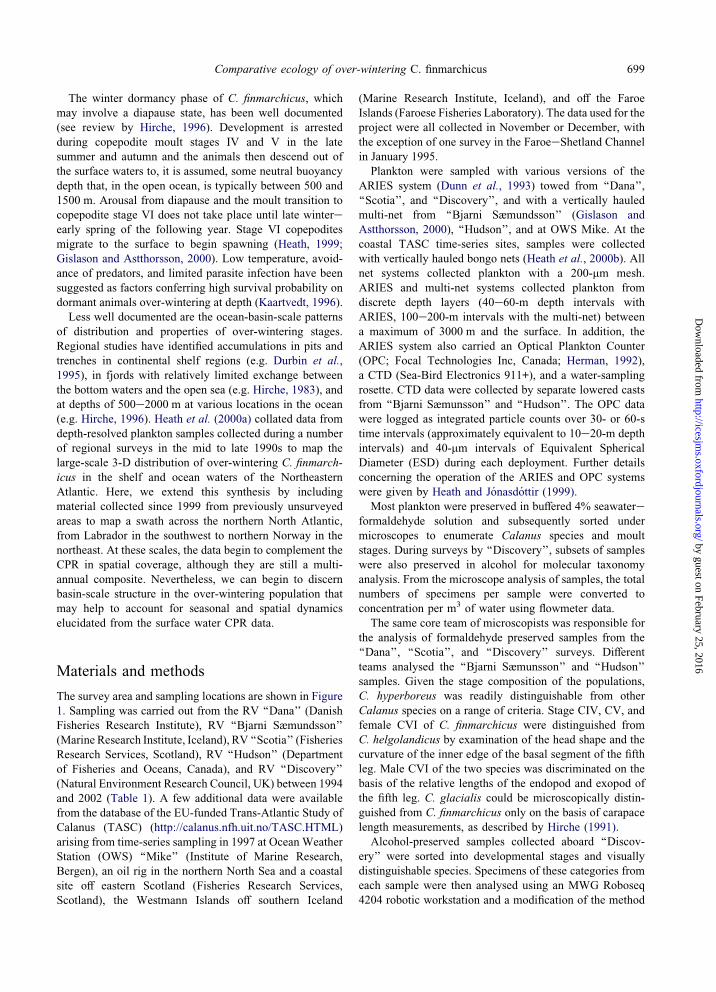
The survey area and sampling locations are shown in Figure
1. Sampling was carried out from the RV ‘‘Dana’’ (Danish
Fisheries Research Institute), RV ‘‘Bjarni Sæmundsson’’
(Marine Research Institute, Iceland), RV ‘‘Scotia’’ (Fisheries
Research Services, Scotland), RV ‘‘Hudson’’ (Department
of Fisheries and Oceans, Canada), and RV ‘‘Discovery’’
(Natural Environment Research Council, UK) between 1994
and 2002 (Table 1). A few additional data were available
from the database of the EU-funded Trans-Atlantic Study of
Calanus (TASC) (http://calanus.nfh.uit.no/TASC.HTML)
arising from time-series sampling in 1997 at Ocean Weather
Station (OWS) ‘‘Mike’’ (Institute of Marine Research,
Bergen), an oil rig in the northern North Sea and a coastal
site off eastern Scotland (Fisheries Research Services,
Scotland), the Westmann Islands off southern Iceland
(Marine Research Institute, Iceland), and off the Faroe
Islands (Faroese Fisheries Laboratory). The data used for the
project were all collected in November or December, with
the exception of one survey in the FaroeeShetland Channel
in January 1995.
Plankton were sampled with various versions of the
ARIES system (Dunn et al., 1993) towed from ‘‘Dana’’,
‘‘Scotia’’, and ‘‘Discovery’’, and with a vertically hauled
multi-net from ‘‘Bjarni Sæmundsson’’ (Gislason and
Astthorsson, 2000), ‘‘Hudson’’, and at OWS Mike. At the
coastal TASC time-series sites, samples were collected
with vertically hauled bongo nets (Heath et al., 2000b). All
net systems collected plankton with a 200-mm mesh.
ARIES and multi-net systems collected plankton from
discrete depth layers (40e60-m depth intervals with
ARIES, 100e200-m intervals with the multi-net) between
a maximum of 3000 m and the surface. In addition, the
ARIES system also carried an Optical Plankton Counter
(OPC; Focal Technologies Inc, Canada; Herman, 1992),
a CTD (Sea-Bird Electronics 911+), and a water-sampling
rosette. CTD data were collected by separate lowered casts
from ‘‘Bjarni Sæmunsson’’ and ‘‘Hudson’’. The OPC data
were logged as integrated particle counts over 30- or 60-s
time intervals (approximately equivalent to 10e20-m depth
intervals) and 40-mm intervals of Equivalent Spherical
Diameter (ESD) during each deployment. Further details
concerning the operation of the ARIES and OPC systems
were given by Heath and Jonasdottir (1999).
Most plankton were preserved in buffered 4% seawatereformaldehyde solution and subsequently sorted under
microscopes to enumerate Calanus species and moult
stages. During surveys by ‘‘Discovery’’, subsets of samples
were also preserved in alcohol for molecular taxonomy
analysis. From the microscope analysis of samples, the total
numbers of specimens per sample were converted to
concentration per m3 of water using flowmeter data.
The same core team of microscopists was responsible for
the analysis of formaldehyde preserved samples from the
‘‘Dana’’, ‘‘Scotia’’, and ‘‘Discovery’’ surveys. Different
teams analysed the ‘‘Bjarni Sæmunsson’’ and ‘‘Hudson’’
samples. Given the stage composition of the populations,
C. hyperboreus was readily distinguishable from other
Calanus species on a range of criteria. Stage CIV, CV, and
female CVI of C. finmarchicus were distinguished from
C. helgolandicus by examination of the head shape and the
curvature of the inner edge of the basal segment of the fifth
leg. Male CVI of the two species was discriminated on the
basis of the relative lengths of the endopod and exopod of
the fifth leg. C. glacialis could be microscopically distin-
guished from C. finmarchicus only on the basis of carapace
length measurements, as described by Hirche (1991).
Alcohol-preserved samples collected aboard ‘‘Discov-
ery’’ were sorted into developmental stages and visually
distinguishable species. Specimens of these categories from
each sample were then analysed using an MWG Roboseq
4204 robotic workstation and a modification of the method
700 M. R. Heath et al.
by guest on February 25, 201http://icesjm
s.oxfordjournals.org/D
ownloaded from
-60 -50 -40 -30 -20 -10 0 10
-60 -50 -40 -30 -20 -10 0 10
50
55
60
65
70
Latit
ude
Latit
ude
Labrador Sea
Irminger Sea Iceland
Basin
Mid
-Atla
ntic
Ridg
e
Rockall Basin
Norwegian Sea
aFr
eoS-
ehlt
nad
C
ahn
enl
NorwegianTrench
North Sea
Longitude
50
55
60
65
70
Figure 1. Chart of the Northern Atlantic showing the principal basins and locations mentioned in the study (upper panel), and the location
of sampling positions (lower panel). Upper panel: grey dashed contour, 250-m isobath; black dashed contour, 3000-m isobath. Upper and
lower panels: light grey shading, 1000e2000-m depth interval; dark grey shading, O2000-m depth. Lower panel: filled circles, sampling
locations with taxonomic data from net samples; open circles, sampling locations with only OPC data available.
6
of Lindeque et al. (1999) to provide a molecular identifi-
cation to species. The system involves amplification of
a region of the 16S rRNA gene using the Polymerase Chain
Reaction (PCR) followed by Restriction Fragment Length
Polymorphism (RFLP) analysis of the amplified product
(Lindeque et al., in press).
To date, not all of the net samples collected on the
cruises included in the study have been analysed (Table 1).
In the cases where no net analyses were available, OPC
data were used to provide estimates of the concentration of
C. finmarchicus. The OPC does not discriminate between
plankton and detrital particles of equivalent size, but Heath
et al. (1999b, 2000a) developed a procedure for calibrating
OPC data to estimate numbers of stage CIVeCVC. finmarchicus. For this project, the calibration coefficients
given by Heath et al. (2000a) were applied to the OPC data:
C: finmarchicus ðm�3Þ ¼ 0:0546!NOPC1:383
where NOPC = the concentration (m�3) of particles in the
900e1700-mm ESD range from the OPC. In total, data from
398 sampling stations, comprising 3218 plankton net sample
analyses from 185 hauls, and a further 16 526 sets of OPC
data from 213 hauls, were available for analysis (Table 1).
Spatial synthesis of stage abundance data
Combined data on C. finmarchicus stage CIV plus CV from
net catches and calibrated OPC data, where appropriate from
all 12 surveys and TASC time-series sites, were averaged
over 200-m depth intervals at each sampling station. The
concentrations (m�3) in each 200-m-thick layer were then
gridded horizontally to 15# longitude! 7.5# latitude
701Comparative ecology of over-wintering C. finmarchicus
by guest on February 25, 2016http://icesjm
s.oxfordjournals.org/D
ownloaded from
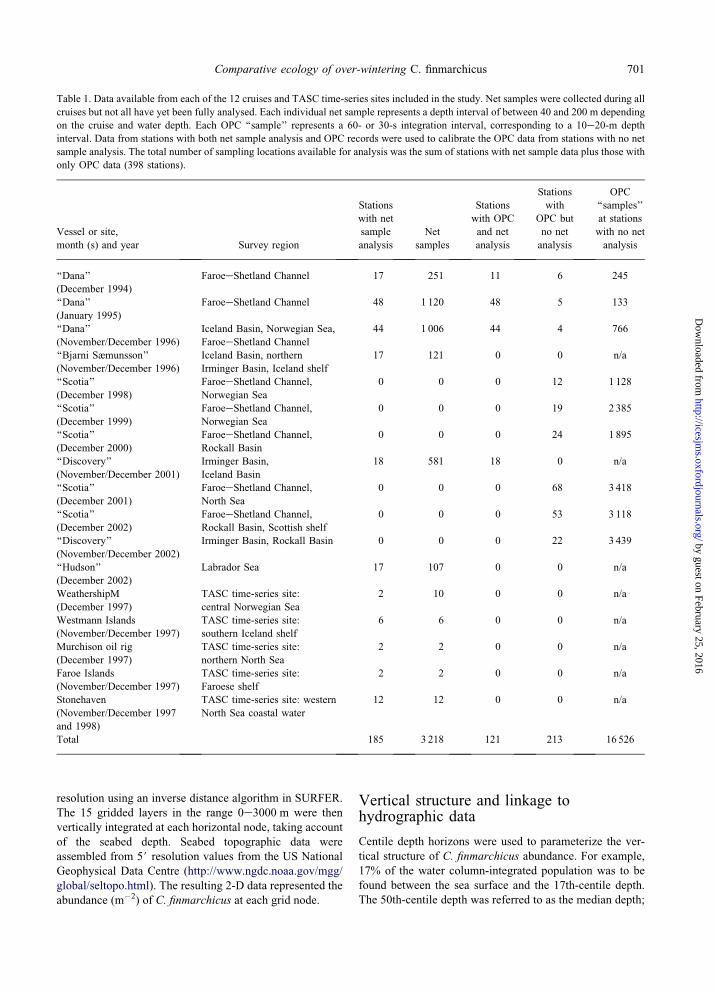
Table 1. Data available from each of the 12 cruises and TASC time-series sites included in the study. Net samples were collected during all
cruises but not all have yet been fully analysed. Each individual net sample represents a depth interval of between 40 and 200 m depending
on the cruise and water depth. Each OPC ‘‘sample’’ represents a 60- or 30-s integration interval, corresponding to a 10e20-m depth
interval. Data from stations with both net sample analysis and OPC records were used to calibrate the OPC data from stations with no net
sample analysis. The total number of sampling locations available for analysis was the sum of stations with net sample data plus those with
only OPC data (398 stations).
Vessel or site,
month (s) and year Survey region
Stations
with net
sample
analysis
Net
samples
Stations
with OPC
and net
analysis
Stations
with
OPC but
no net
analysis
OPC
‘‘samples’’
at stations
with no net
analysis
‘‘Dana’’
(December 1994)
FaroeeShetland Channel 17 251 11 6 245
‘‘Dana’’
(January 1995)
FaroeeShetland Channel 48 1 120 48 5 133
‘‘Dana’’
(November/December 1996)
Iceland Basin, Norwegian Sea,
FaroeeShetland Channel
44 1 006 44 4 766
‘‘Bjarni Sæmunsson’’
(November/December 1996)
Iceland Basin, northern
Irminger Basin, Iceland shelf
17 121 0 0 n/a
‘‘Scotia’’
(December 1998)
FaroeeShetland Channel,
Norwegian Sea
0 0 0 12 1 128
‘‘Scotia’’
(December 1999)
FaroeeShetland Channel,
Norwegian Sea
0 0 0 19 2 385
‘‘Scotia’’
(December 2000)
FaroeeShetland Channel,
Rockall Basin
0 0 0 24 1 895
‘‘Discovery’’
(November/December 2001)
Irminger Basin,
Iceland Basin
18 581 18 0 n/a
‘‘Scotia’’
(December 2001)
FaroeeShetland Channel,
North Sea
0 0 0 68 3 418
‘‘Scotia’’
(December 2002)
FaroeeShetland Channel,
Rockall Basin, Scottish shelf
0 0 0 53 3 118
‘‘Discovery’’
(November/December 2002)
Irminger Basin, Rockall Basin 0 0 0 22 3 439
‘‘Hudson’’
(December 2002)
Labrador Sea 17 107 0 0 n/a
WeathershipM
(December 1997)
TASC time-series site:
central Norwegian Sea
2 10 0 0 n/a
Westmann Islands
(November/December 1997)
TASC time-series site:
southern Iceland shelf
6 6 0 0 n/a
Murchison oil rig
(December 1997)
TASC time-series site:
northern North Sea
2 2 0 0 n/a
Faroe Islands
(November/December 1997)
TASC time-series site:
Faroese shelf
2 2 0 0 n/a
Stonehaven
(November/December 1997
and 1998)
TASC time-series site: western
North Sea coastal water
12 12 0 0 n/a
Total 185 3 218 121 213 16 526
resolution using an inverse distance algorithm in SURFER.
The 15 gridded layers in the range 0e3000 m were then
vertically integrated at each horizontal node, taking account
of the seabed depth. Seabed topographic data were
assembled from 5# resolution values from the US National
Geophysical Data Centre (http://www.ngdc.noaa.gov/mgg/
global/seltopo.html). The resulting 2-D data represented the
abundance (m�2) of C. finmarchicus at each grid node.
Vertical structure and linkage tohydrographic data
Centile depth horizons were used to parameterize the ver-
tical structure of C. finmarchicus abundance. For example,
17% of the water column-integrated population was to be
found between the sea surface and the 17th-centile depth.
The 50th-centile depth was referred to as the median depth;
702 M. R. Heath et al.
by guest on February 25, 2016http://icesjm
s.oxfordjournals.org/D
ownloaded from
66% of the population were to be found between the 17th
and 83rd centile depths.
Centile depths were derived for each developmental
stage in each individual profile of C. finmarchicus con-
centration obtained with ARIES, multi-net, or OPC sys-
tems. This was performed by digitizing the stage profiles to
2-m-depth resolution, assuming that concentrations were
uniformly distributed over the depth integration interval of
each net or OPC sample. Given centile depths were then
estimated by integration from the sea surface. For plankton
profiles with associated CTD data (which was almost all
profiles), the in situ pressures, temperatures, and salinities
at centile depths were estimated by averaging the CTD data
over G2 m of each centile.
Estimating the lipid content implied by thehydrographic conditions at centile depths
The very low levels of swimming activity observed in
freshly sampled diapause specimens of C. finmarchicus
(Hirche, 1983; Ingvarsdottir, 1998) suggest that these
stages have little active control over their vertical location,
and their vertical distribution is a product of their buoyancy
and rates of vertical mixing. Visser and Jonasdottir (1999)
presented a model of buoyancy control in diapausing
copepods, which depended on the fact that the thermal
expansivity and compressibility of wax ester, which con-
stitutes most of the storage lipid in C. finmarchicus, is
higher than that of seawater. As a result, copepodites that
are positively buoyant in warm shallow water can become
neutrally buoyant in cold deep water, but have to actively
swim down to their neutral buoyancy depth rather than sink
passively. Visser and Jonasdottir used the model to derive
neutral buoyancy depths and spring ascent rates of cope-
pods given temperature and salinity profiles and lipid
contents. Here, we use the model inversely to estimate the
lipid content of copepods implied by given pressure,
temperature, and salinity, assuming neutral buoyancy.
Visser and Jonasdottir assumed that the copepod body is
composed of lipid of density rL, water of density rW, andother material of density rO. The density of water within
the copepod rW is assumed to be the same as that outside
and, hence, a function of ambient pressure, temperature, and
salinity, while rL is a function of ambient temperature and
pressure only (equation 2 in Visser and Jonasdottir, 1999).
The mass ratio of lipid to lipid-free dry weight is then:
g#¼� rL
rO
rO � rW
rL � rW
� �
and the implied ratio of lipid to total dry weight by
g¼ g#
1þ g#
Evaluating the density of lipid-free dry matter rO is
problematic. Some of this material will be protein which
has a relatively high density, such that small variations in
protein content can significantly affect the lipid-free dry
density. Visser and Jonasdottir (1999) estimated rO to be
1080 kg m�3 from settling experiments on previously
frozen specimens, but assumed a value of 1240 kg m�3 to
be representative of deep over-wintering animals based on
a typical protein content of 45% of dry weight. However,
Ingvarsdottir (1998) found that for C. finmarchicus in the
FaroeeShetland Channel the seasonal minimum of protein
content (20% of dry weight) occurred in winter diapause
stages, and that values of O35% were restricted to the
summer period. Hence, an appropriate value of rO for
winter copepodites is probably towards the lower end of the
range offered by Visser and Jonasdottir (1999).
Direct measurements of lipid contentand body weight
Jonasdottir (1999) described the procedures for measuring
lipid composition and content and dry mass of C.
finmarchicus specimens collected during ‘‘Dana’’ surveys
in December 1994 and January 1995. Equivalent measure-
ments were performed on material collected during the
survey in November and December 1996. Very briefly, as
soon as possible after recovery of the sampling nets, groups
of up to 10 stage CV specimens were sorted from the catch
in depth layers selected on the basis of the OPC data, and
preserved in liquid nitrogen. Later, lipids were extracted in
chloroform/methanol, and analysed by Thin layer Chroma-
tography/Flame Ionization detection using an Iatroscan
MK-5. Lipid composition was estimated chromatographi-
cally to distinguish in particular wax ester (WE) and
tracylglycerol (TAG). Carapace length was measured on
specimens from each sample and subsequently transformed
to an estimate of total dry mass using calibration relation-
ships established for each survey by freeze drying and
weighing batches of 3e10 measured specimens.
Results
Species identification
The molecular analysis of samples from the ‘‘Discovery’’
survey in 2001 showed that the microscopists’ identifica-
tion of C. finmarchicus was 100% correct, except at two
stations on the East Greenland slope. In this area, 4.5% of
specimens identified by microscopists as C. finmarchicus
were in fact C. glacialis. The molecular methodology did
not reveal any misidentification of C. helgolandicus,
although the areas covered by ‘‘Discovery’’ were not those
where we would have expected this species to form a
significant component of the community.
Composite distribution of C. finmarchicus
The population of C. finmarchicus was aggregated into five
main centres each with depth-integrated abundance
703Comparative ecology of over-wintering C. finmarchicus
bhttp://icesjm
s.oxfordjournals.org/D
ownloaded from
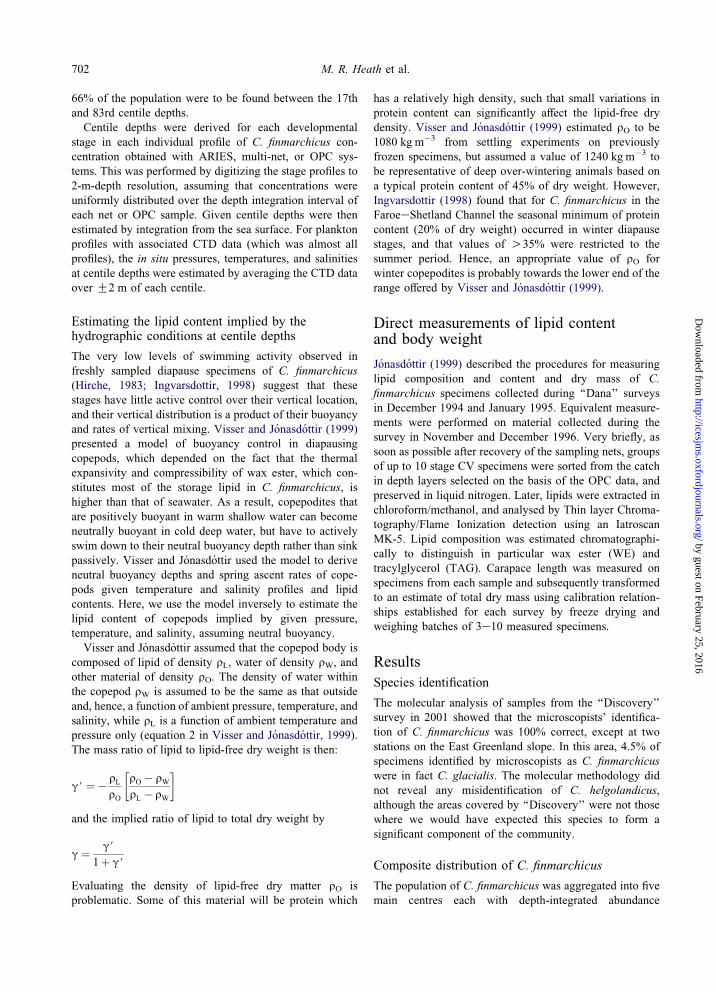
O15 000 m�2. These were located in the Labrador Sea,
northern Irminger Basin, northern Iceland Basin, FaroeeShetland Channel/eastern Norwegian Sea, and a small patch
in the Norwegian Trench of the eastern North Sea. The
highest abundances (>40 000 m�2) were located in the
FaroeeShetland Channel and Norwegian Sea (Figure 2).
The Rockall Basin contained very low abundances. A plume
of locally high abundance was present to the southwest of the
Faroe Islands, coinciding with the area where deep overflow
water from the FaroeeShetland Channel enters the Atlantic
through the Faroe Bank Channel and flows westwards along
the southern face of the IcelandeScotland Ridge (Hansen,
1985; Heath and Jonasdottir, 1999).
The stage composition of the depth-integrated popula-
tions in the different basins was investigated by aggregating
data from deployments falling within a set of nine rectan-
gular compartments located in the major basins and/or
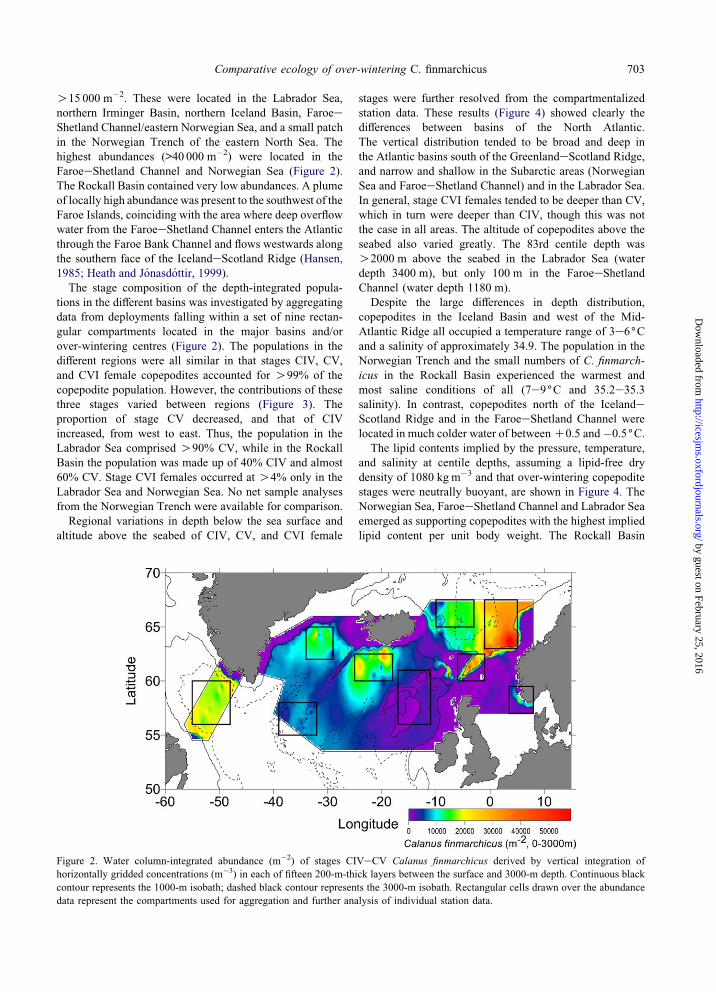
over-wintering centres (Figure 2). The populations in the
different regions were all similar in that stages CIV, CV,
and CVI female copepodites accounted for O99% of the
copepodite population. However, the contributions of these
three stages varied between regions (Figure 3). The
proportion of stage CV decreased, and that of CIV
increased, from west to east. Thus, the population in the
Labrador Sea comprised O90% CV, while in the Rockall
Basin the population was made up of 40% CIV and almost
60% CV. Stage CVI females occurred at O4% only in the
Labrador Sea and Norwegian Sea. No net sample analyses
from the Norwegian Trench were available for comparison.
Regional variations in depth below the sea surface and
altitude above the seabed of CIV, CV, and CVI female
y
stages were further resolved from the compartmentalized
station data. These results (Figure 4) showed clearly the
differences between basins of the North Atlantic.
The vertical distribution tended to be broad and deep in
the Atlantic basins south of the GreenlandeScotland Ridge,
and narrow and shallow in the Subarctic areas (Norwegian
Sea and FaroeeShetland Channel) and in the Labrador Sea.
In general, stage CVI females tended to be deeper than CV,
which in turn were deeper than CIV, though this was not
the case in all areas. The altitude of copepodites above the
seabed also varied greatly. The 83rd centile depth was
O2000 m above the seabed in the Labrador Sea (water
depth 3400 m), but only 100 m in the FaroeeShetlandChannel (water depth 1180 m).
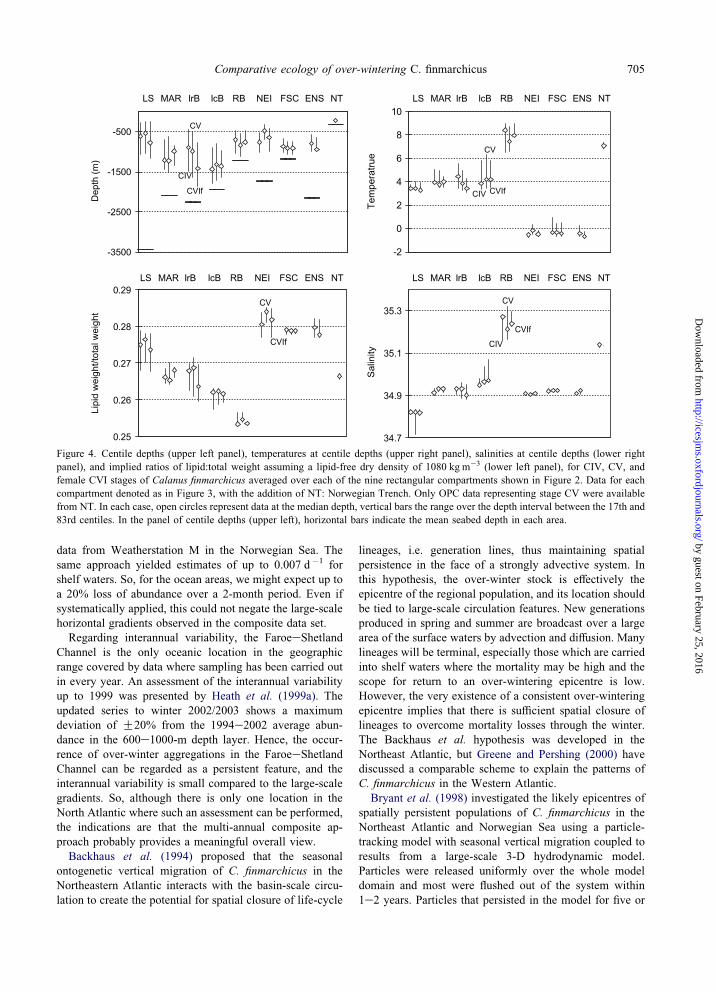
Despite the large differences in depth distribution,
copepodites in the Iceland Basin and west of the Mid-
Atlantic Ridge all occupied a temperature range of 3e6(Cand a salinity of approximately 34.9. The population in the
Norwegian Trench and the small numbers of C. finmarch-
icus in the Rockall Basin experienced the warmest and
most saline conditions of all (7e9(C and 35.2e35.3
salinity). In contrast, copepodites north of the IcelandeScotland Ridge and in the FaroeeShetland Channel were
located in much colder water of betweenC0.5 and�0.5(C.The lipid contents implied by the pressure, temperature,
and salinity at centile depths, assuming a lipid-free dry
density of 1080 kg m�3 and that over-wintering copepodite
stages were neutrally buoyant, are shown in Figure 4. The
Norwegian Sea, FaroeeShetland Channel and Labrador Sea
emerged as supporting copepodites with the highest implied
lipid content per unit body weight. The Rockall Basin
guest on February 25, 2016
Figure 2. Water column-integrated abundance (m�2) of stages CIVeCV Calanus finmarchicus derived by vertical integration of
horizontally gridded concentrations (m�3) in each of fifteen 200-m-thick layers between the surface and 3000-m depth. Continuous black
contour represents the 1000-m isobath; dashed black contour represents the 3000-m isobath. Rectangular cells drawn over the abundance
data represent the compartments used for aggregation and further analysis of individual station data.
704 M. R. Heath et al.
Dow
nload
SL AM R
IrB
0
0.2
0.40.6
0.8
1
CIV CV CVIf
Pro
po
rtio
n o
f C
1-C
6
0
0.2
0.4
0.6
0.8
1
CIV CV CVIf
Pro
po
rtio
n o
f C
1-C
6
0
0.2
0.4
0.6
0.8
1
CIV CV CVIf
Pro
po
rtio
n o
f C
1-C
6
0
0.2
0.4
0.6
0.8
1
CIV CV CVIf
Pro
po
rtio
n o
f C
1-C
6
0
0.2
0.4
0.6
0.8
1
CIV CV CVIf
Pro
po
rtio
n o
f C
1-C
6
0
0.2
0.4
0.6
0.8
1
CIV CV CVIf
Pro
po
rtio
n o
f C
1-C
6
0
0.2
0.4
0.6
0.8
1
CIV CV CVIf
Pro
po
rtio
n o
f C
1-C
6
0
0.2
0.4
0.6
0.8
1
CIV CV CVIf
Pro
po
rtio
n o
f C
1-C
6
IcB
BR
EN I
SF C
NE S
Figure 3. Percentage contributions of CIV, CV, and female CVI stages to the water column-integrated population averaged over each of
the rectangular compartments shown in Figure 2. LS: Labrador Sea; IrB: Irminger Basin; MAR: Mid-Atlantic Ridge; IcB: Iceland Basin;
RB: Rockall Basin; NEI: Northeast Iceland; ENS: Eastern Norwegian Sea; FSC: FaroeeShetland Channel. In each area, only data from
stations deeper than 800 m were accepted for inclusion in the average.
by guest on February 25, 2016http://icesjm
s.oxfordjournals.org/ed from
contained copepodites with smallest implied reserves of
lipid. Absolute values of the implied lipid content were
dependent on the assumed value of lipid-free dry density,
but the relative distribution in space was largely unaffected.
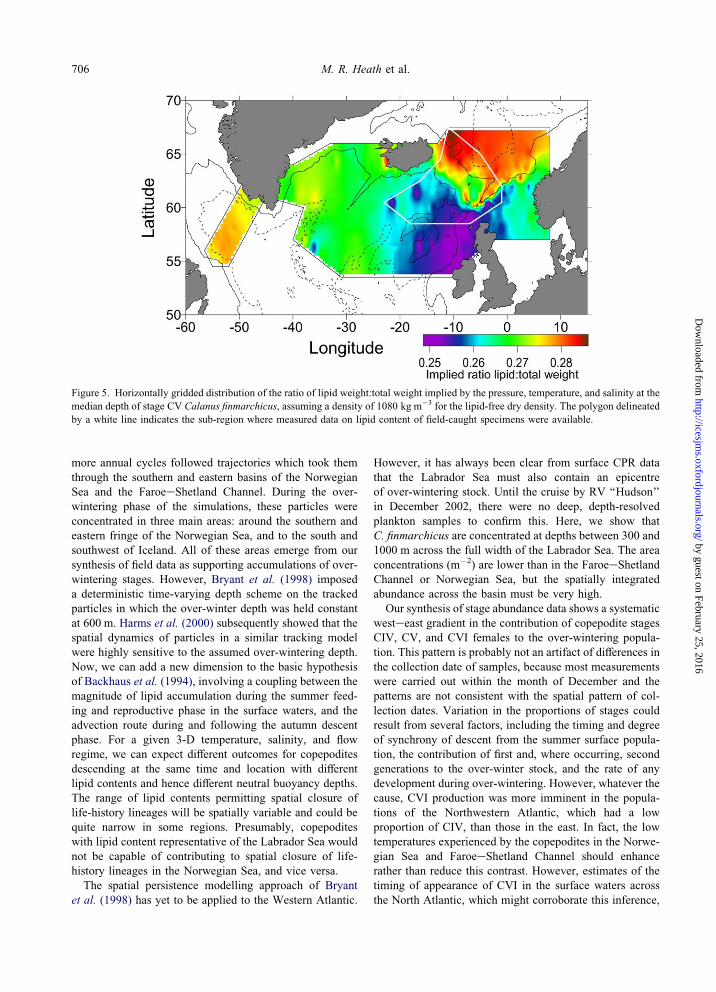
Taking the data from all of the sampling locations into
account rather than just those within the nine compartments
showed the extent of the lipid-rich region in the Norwegian
Sea and FaroeeShetland Channel (Figure 5). Copepodites
in the slope and shelf waters of the Eastern Atlantic were
implied to have the lowest lipid content.
Measurements of WE, TAG content, and body mass for
stage CV C. finmarchicus collected from a range of depths
at 109 sampling locations during three cruises in the
Northeastern Atlantic (‘‘Dana’’ December 1994, January
1995, November/December 1996) were available for com-
parison with the implied lipid content. Samples from depths
falling between the 17th and 83rd centiles of the vertical
distribution of the CV population at each sampling site
were selected from the data set. Of these, samples in which
the TAG content as a proportion of WE + TAG exceeded
1% were rejected on the grounds that these could represent
specimens in which gonad development and emergence
from diapause had commenced and, hence, the neutral
buoyancy assumption might not be applicable. Most of the
samples rejected on the basis of TAG content came from
late in the January 1995 survey. The remaining data com-
prised specimens from 46 sampling depths at 34 stations in
an area centred on the IcelandeScotland Ridge and
including the maximum contrast in the implied lipid
content (Figure 5). The means and ranges of measured
WE/total weight were then related to the implied lipid/total
weights at the median depths and the ranges over the 17th
to 83rd centiles (Figure 6). There was a significant relation-
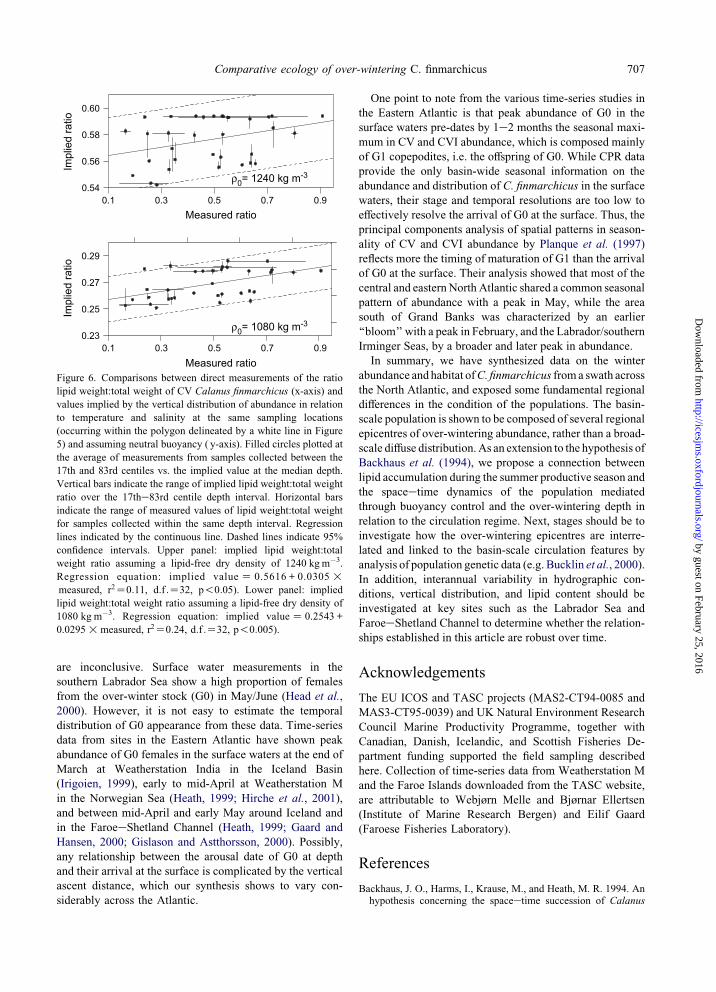
ship between measured and implied lipid content (r2 ¼0:24, p!0:005) when assuming a low value for the lipid-
free dry density (rO ¼ 1080 kgm�3), although the values
conformed to 1:1 proportionality only at low levels of
measured lipid content. If a higher value of lipid-free dry
density was assumed (rO ¼ 1240 kgm�3), then the re-
lationship was weaker (r2 ¼ 0:11, p!0:05) and the values
conformed to 1:1 proportionality only at higher levels of
measured lipid content. The implication is that while lipid
content explains a significant part of the variation in
observed depth distributions, variations in the lipid-free dry
density, most likely related to protein content, may also be
involved. The expectation would be that lipid and protein
contents should be directly related.
Discussion
In this study, we have assembled data collected mainly
between mid-November and late December, but from eight
different years, and generally different regions in each year,
in order to produce a composite interpretation of the large-
scale distribution and properties of over-wintering
C. finmarchicus. The high costs and technical difficulties
associated with sampling in the North Atlantic at this time
of year are such that piecing together data in this way is
currently the only means of interpreting basin-scale patterns
of abundance. The CPR surveys, which have provided so
much large-scale information for the spring and summer
months, are unable to address the issue in winter. However,
this composite use of data is potentially problematic if there
is significant within-year and interannual variability in the
distribution and abundance.
Considering first the potential for bias due to within-year
variation, the major concerns are the effects of mortality on
the perception of spatial distribution from data collected
over a period of 6e8 weeks, and the effects of lipid
utilization on the perceived patterns of vertical distribution.
Regarding mortality, there are no direct estimates of morta-
lity rates for diapause stages at ocean depths, but Heath et al.
(2000b) estimated a value of 0.003 d�1 by model fitting to
705Comparative ecology of over-wintering C. finmarchicus
http://icesjms.oxfordjournals.or
Dow
nloaded from
-3500
-2500
-1500
-500
Dep
th (m
)
CV
CVIf
LS MAR IrB IcB RB NEI FSC ENS NT
CIV
-2
0
2
4
6
8
10
Tem
pera
true CV
CVIfCIV
34.7
34.9
35.1
35.3
Sal
inity
CV
CVIf
CIV
0.25
0.26
0.27
0.28
0.29
Lipi
d w
eigh
t/tot
al w
eigh
t
CV
CVIf
LS MAR IrB IcB RB NEI FSC ENS NT
LS MAR IrB IcB RB NEI FSC ENS NT LS MAR IrB IcB RB NEI FSC ENS NT
Figure 4. Centile depths (upper left panel), temperatures at centile depths (upper right panel), salinities at centile depths (lower right
panel), and implied ratios of lipid:total weight assuming a lipid-free dry density of 1080 kg m�3 (lower left panel), for CIV, CV, and
female CVI stages of Calanus finmarchicus averaged over each of the nine rectangular compartments shown in Figure 2. Data for each
compartment denoted as in Figure 3, with the addition of NT: Norwegian Trench. Only OPC data representing stage CV were available
from NT. In each case, open circles represent data at the median depth, vertical bars the range over the depth interval between the 17th and
83rd centiles. In the panel of centile depths (upper left), horizontal bars indicate the mean seabed depth in each area.
by guest on February 25, 2016g/
data from Weatherstation M in the Norwegian Sea. The
same approach yielded estimates of up to 0.007 d�1 for
shelf waters. So, for the ocean areas, we might expect up to
a 20% loss of abundance over a 2-month period. Even if
systematically applied, this could not negate the large-scale
horizontal gradients observed in the composite data set.
Regarding interannual variability, the FaroeeShetland
Channel is the only oceanic location in the geographic
range covered by data where sampling has been carried out
in every year. An assessment of the interannual variability
up to 1999 was presented by Heath et al. (1999a). The
updated series to winter 2002/2003 shows a maximum
deviation of G20% from the 1994e2002 average abun-
dance in the 600e1000-m depth layer. Hence, the occur-
rence of over-winter aggregations in the FaroeeShetland
Channel can be regarded as a persistent feature, and the
interannual variability is small compared to the large-scale
gradients. So, although there is only one location in the
North Atlantic where such an assessment can be performed,
the indications are that the multi-annual composite ap-
proach probably provides a meaningful overall view.
Backhaus et al. (1994) proposed that the seasonal
ontogenetic vertical migration of C. finmarchicus in the
Northeastern Atlantic interacts with the basin-scale circu-
lation to create the potential for spatial closure of life-cycle
lineages, i.e. generation lines, thus maintaining spatial
persistence in the face of a strongly advective system. In
this hypothesis, the over-winter stock is effectively the
epicentre of the regional population, and its location should
be tied to large-scale circulation features. New generations
produced in spring and summer are broadcast over a large
area of the surface waters by advection and diffusion. Many
lineages will be terminal, especially those which are carried
into shelf waters where the mortality may be high and the
scope for return to an over-wintering epicentre is low.
However, the very existence of a consistent over-wintering
epicentre implies that there is sufficient spatial closure of
lineages to overcome mortality losses through the winter.
The Backhaus et al. hypothesis was developed in the
Northeast Atlantic, but Greene and Pershing (2000) have
discussed a comparable scheme to explain the patterns of
C. finmarchicus in the Western Atlantic.
Bryant et al. (1998) investigated the likely epicentres of
spatially persistent populations of C. finmarchicus in the
Northeast Atlantic and Norwegian Sea using a particle-
tracking model with seasonal vertical migration coupled to
results from a large-scale 3-D hydrodynamic model.
Particles were released uniformly over the whole model
domain and most were flushed out of the system within
1e2 years. Particles that persisted in the model for five or
706 M. R. Heath et al.
http://iceD
ownloaded from
Figure 5. Horizontally gridded distribution of the ratio of lipid weight:total weight implied by the pressure, temperature, and salinity at themedian depth of stage CV Calanus finmarchicus, assuming a density of 1080 kg m�3 for the lipid-free dry density. The polygon delineated
by a white line indicates the sub-region where measured data on lipid content of field-caught specimens were available.
by guest on February 25, 2016sjm
s.oxfordjournals.org/
more annual cycles followed trajectories which took them
through the southern and eastern basins of the Norwegian
Sea and the FaroeeShetland Channel. During the over-
wintering phase of the simulations, these particles were
concentrated in three main areas: around the southern and
eastern fringe of the Norwegian Sea, and to the south and
southwest of Iceland. All of these areas emerge from our
synthesis of field data as supporting accumulations of over-
wintering stages. However, Bryant et al. (1998) imposed
a deterministic time-varying depth scheme on the tracked
particles in which the over-winter depth was held constant
at 600 m. Harms et al. (2000) subsequently showed that the
spatial dynamics of particles in a similar tracking model
were highly sensitive to the assumed over-wintering depth.
Now, we can add a new dimension to the basic hypothesis
of Backhaus et al. (1994), involving a coupling between the
magnitude of lipid accumulation during the summer feed-
ing and reproductive phase in the surface waters, and the
advection route during and following the autumn descent
phase. For a given 3-D temperature, salinity, and flow
regime, we can expect different outcomes for copepodites
descending at the same time and location with different
lipid contents and hence different neutral buoyancy depths.
The range of lipid contents permitting spatial closure of
life-history lineages will be spatially variable and could be
quite narrow in some regions. Presumably, copepodites
with lipid content representative of the Labrador Sea would
not be capable of contributing to spatial closure of life-
history lineages in the Norwegian Sea, and vice versa.
The spatial persistence modelling approach of Bryant
et al. (1998) has yet to be applied to the Western Atlantic.
However, it has always been clear from surface CPR data
that the Labrador Sea must also contain an epicentre
of over-wintering stock. Until the cruise by RV ‘‘Hudson’’
in December 2002, there were no deep, depth-resolved
plankton samples to confirm this. Here, we show that
C. finmarchicus are concentrated at depths between 300 and
1000 m across the full width of the Labrador Sea. The area
concentrations (m�2) are lower than in the FaroeeShetland
Channel or Norwegian Sea, but the spatially integrated
abundance across the basin must be very high.
Our synthesis of stage abundance data shows a systematic
westeeast gradient in the contribution of copepodite stages
CIV, CV, and CVI females to the over-wintering popula-
tion. This pattern is probably not an artifact of differences in
the collection date of samples, because most measurements
were carried out within the month of December and the
patterns are not consistent with the spatial pattern of col-
lection dates. Variation in the proportions of stages could
result from several factors, including the timing and degree
of synchrony of descent from the summer surface popula-
tion, the contribution of first and, where occurring, second
generations to the over-winter stock, and the rate of any
development during over-wintering. However, whatever the
cause, CVI production was more imminent in the popula-
tions of the Northwestern Atlantic, which had a low
proportion of CIV, than those in the east. In fact, the low
temperatures experienced by the copepodites in the Norwe-
gian Sea and FaroeeShetland Channel should enhance
rather than reduce this contrast. However, estimates of the
timing of appearance of CVI in the surface waters across
the North Atlantic, which might corroborate this inference,
707Comparative ecology of over-wintering C. finmarchicus
by guest on February 25, 2016http://icesjm
s.oxfordjournals.org/D
ownloaded from
are inconclusive. Surface water measurements in the
southern Labrador Sea show a high proportion of females
from the over-winter stock (G0) in May/June (Head et al.,
2000). However, it is not easy to estimate the temporal
distribution of G0 appearance from these data. Time-series
data from sites in the Eastern Atlantic have shown peak
abundance of G0 females in the surface waters at the end of
March at Weatherstation India in the Iceland Basin
(Irigoien, 1999), early to mid-April at Weatherstation M
in the Norwegian Sea (Heath, 1999; Hirche et al., 2001),
and between mid-April and early May around Iceland and
in the FaroeeShetland Channel (Heath, 1999; Gaard and
Hansen, 2000; Gislason and Astthorsson, 2000). Possibly,
any relationship between the arousal date of G0 at depth
and their arrival at the surface is complicated by the vertical
ascent distance, which our synthesis shows to vary con-
siderably across the Atlantic.
0.1 0.3 0.5 0.7 0.9
0.1 0.3 0.5 0.7 0.9
Measured ratio
Measured ratio
0.54
0.56
0.58
0.60
Impl
ied
ratio
Impl
ied
ratio
0.23
0.25
0.27
0.29
ρ0= 1240 kg m-3
ρ0= 1080 kg m-3
Figure 6. Comparisons between direct measurements of the ratio
lipid weight:total weight of CV Calanus finmarchicus (x-axis) and
values implied by the vertical distribution of abundance in relation
to temperature and salinity at the same sampling locations
(occurring within the polygon delineated by a white line in Figure
5) and assuming neutral buoyancy ( y-axis). Filled circles plotted at
the average of measurements from samples collected between the
17th and 83rd centiles vs. the implied value at the median depth.
Vertical bars indicate the range of implied lipid weight:total weight
ratio over the 17the83rd centile depth interval. Horizontal bars
indicate the range of measured values of lipid weight:total weight
for samples collected within the same depth interval. Regression
lines indicated by the continuous line. Dashed lines indicate 95%
confidence intervals. Upper panel: implied lipid weight:total
weight ratio assuming a lipid-free dry density of 1240 kg m�3.
Regression equation: implied valueZ 0.5616 + 0.0305!
measured, r2Z0:11, d:f :Z32, p!0:05). Lower panel: implied
lipid weight:total weight ratio assuming a lipid-free dry density of
1080 kg m�3. Regression equation: implied valueZ 0.2543 +
0.0295!measured, r2Z0:24, d:f :Z32, p!0:005).
One point to note from the various time-series studies in
the Eastern Atlantic is that peak abundance of G0 in the
surface waters pre-dates by 1e2 months the seasonal maxi-
mum in CV and CVI abundance, which is composed mainly
of G1 copepodites, i.e. the offspring of G0. While CPR data
provide the only basin-wide seasonal information on the
abundance and distribution of C. finmarchicus in the surface
waters, their stage and temporal resolutions are too low to
effectively resolve the arrival of G0 at the surface. Thus, the
principal components analysis of spatial patterns in season-
ality of CV and CVI abundance by Planque et al. (1997)
reflects more the timing of maturation of G1 than the arrival
of G0 at the surface. Their analysis showed that most of the
central and eastern North Atlantic shared a common seasonal
pattern of abundance with a peak in May, while the area
south of Grand Banks was characterized by an earlier
‘‘bloom’’ with a peak in February, and the Labrador/southern
Irminger Seas, by a broader and later peak in abundance.
In summary, we have synthesized data on the winter
abundance and habitat ofC. finmarchicus froma swath across
the North Atlantic, and exposed some fundamental regional
differences in the condition of the populations. The basin-
scale population is shown to be composed of several regional
epicentres of over-wintering abundance, rather than a broad-
scale diffuse distribution.As an extension to the hypothesis of
Backhaus et al. (1994), we propose a connection between
lipid accumulation during the summer productive season and
the spaceetime dynamics of the population mediated
through buoyancy control and the over-wintering depth in
relation to the circulation regime. Next, stages should be to
investigate how the over-wintering epicentres are interre-
lated and linked to the basin-scale circulation features by
analysis of population genetic data (e.g. Bucklin et al., 2000).
In addition, interannual variability in hydrographic con-
ditions, vertical distribution, and lipid content should be
investigated at key sites such as the Labrador Sea and
FaroeeShetland Channel to determine whether the relation-
ships established in this article are robust over time.
Acknowledgements
The EU ICOS and TASC projects (MAS2-CT94-0085 and
MAS3-CT95-0039) and UK Natural Environment Research
Council Marine Productivity Programme, together with
Canadian, Danish, Icelandic, and Scottish Fisheries De-
partment funding supported the field sampling described
here. Collection of time-series data from Weatherstation M
and the Faroe Islands downloaded from the TASC website,
are attributable to Webjørn Melle and Bjørnar Ellertsen
(Institute of Marine Research Bergen) and Eilif Gaard
(Faroese Fisheries Laboratory).
References
Backhaus, J. O., Harms, I., Krause, M., and Heath, M. R. 1994. Anhypothesis concerning the spaceetime succession of Calanus
708 M. R. Heath et al.
by guest on February 25, 2016http://icesjm
s.oxfordjournals.org/D
ownloaded from
finmarchicus in the northern North Sea. ICES Journal of MarineScience, 51: 169e180.
Bryant, A. D., Hainbucher, D., and Heath, M. R. 1998. Basin-scaleadvection and population persistence of Calanus finmarchicus.Fisheries Oceanography, 7: 235e244.
Bucklin, A., Astthorsson, O. S., Gislason, A., Allen, L. D.,Smolenack, S. B., and Wiebe, P. H. 2000. Population geneticvariation of Calanus finmarchicus in Icelandic waters: pre-liminary evidence of genetic differences between Atlantic andArctic populations. ICES Journal of Marine Science, 57:1592e1604.
Dunn, J., Hall, C. D., Heath, M. R., Mitchell, R. B., and Ritchie,B. J. 1993. ARIES: a system for concurrent physical, biologicaland chemical sampling at sea. Deep-Sea Research, 40: 867e878.
Durbin, E. G., Gilman, S. L., Campbell, R. G., and Durbin, A. G.1995. Abundance, biomass, vertical migration and estimateddevelopment rate of the copepod Calanus finmarchicus in thesouthern Gulf of Maine during late spring. Continental ShelfResearch, 15: 571e591.
Gaard, E., and Hansen, B. 2000. Variations in the advection ofCalanus finmarchicus onto the Faroe Shelf. ICES Journal ofMarine Science, 57: 1612e1618.
Gislason, A., and Astthorsson, O. S. 2000. Winter distribution,ontogenetic migration, and rates of egg production of Calanusfinmarchicus southwest of Iceland. ICES Journal of MarineScience, 57: 1727e1739.
Greene, C. H., and Pershing, A. J. 2000. The response of Calanusfinmarchicus populations to climate variability in the NorthwestAtlantic: basin-scale forcing associated with the North AtlanticOscillation. ICES Journal of Marine Science, 57: 1536e1544.
Hansen, B. 1985. The circulation of the northern part of theNortheast Atlantic. Rit Fiskideildar, 9: 110e126.
Harms, I. H., Heath, M. R., Bryant, A. D., Backhaus, J. O., andHainbucher, D. 2000. Modelling the Northeast Atlantic circula-tion: implications for the spring invasion of shelf regions byCalanus finmarchicus. ICES Journal of Marine Science, 57:1694e1707.
Head, E. J. H., Harris, L. R., and Campbell, R. W. 2000.Investigations on the ecology of Calanus spp. in the LabradorSea. I. Relationship between the phytoplankton bloom andreproduction and development of Calanus finmarchicus inspring. Marine Ecology Progress Series, 193: 53e73.
Heath, M. R. 1999. The ascent migration of the copepod Calanusfinmarchicus from overwintering depths in the FaroeeShetlandChannel. Fisheries Oceanography, 8(Suppl 1): 84e99.
Heath, M. R., Astthorsson, O. S., Dunn, J., Ellertsen, B., Gislason,A., Gaard, E., Gurney, W. S. C., Hind, A. T., Irigoien, X., Melle,W., Niehoff, B., Olsen, K., Skreslet, S., and Tande, K. S. 2000b.Comparative analysis of Calanus finmarchicus demography atlocations around the Northeast Atlantic. ICES Journal of MarineScience, 57: 1562e1580.
Heath, M. R., Beare, D. J., Dunn, J., Fraser, J. G., Hay, S. J., andTurrell, W. R. 1999a. Monitoring the effects of climate change:overwintering abundance of Calanus finmarchicus in theFaroeeShetland Channel. Fisheries Research Services Report14/99. 24 pp. (http://www.frs-scotland.gov.uk/FRS.Web/Uploads/Documents/frsr1499.pdf).
Heath, M. R., Dunn, J., Fraser, J. G., Hay, S. J., and Madden, H.1999b. Field calibration of the Optical Plankton Counter withrespect to Calanus finmarchicus. Fisheries Oceanography,8(Suppl 1): 13e24.
Heath, M. R., Fraser, J. G., Gislason, A., Hay, S. J., Jonasdottir,S. H., and Richardson, K. 2000a. Winter distribution of Calanusfinmarchicus in the Northeast Atlantic. ICES Journal of MarineScience, 57: 1628e1635.
Heath, M. R., and Jonasdottir, S. H. 1999. Distribution andabundance of overwintering Calanus finmarchicus in theFaroeeShetland Channel. Fisheries Oceanography, 8(Suppl 1):40e60.
Herman, A. W. 1992. Design and calibration of a new OpticalPlankton Counter capable of sizing small zooplankton. Deep-SeaResearch, 39: 395e415.
Hirche, H.-J. 1983. Overwintering of Calanus finmarchicus andCalanus helgolandicus. Marine Ecology Progress Series, 11:281e292.
Hirche, H.-J. 1991. Distribution of dominant calanoid copepodspecies in the Greenland Sea during late fall. Polar Biology, 11:351e362.
Hirche, H.-J. 1996. Diapause in the marine copepod, Calanusfinmarchicus: a review. Ophelia, 44: 129e143.
Hirche, H.-J., Brey, T., and Niehoff, B. 2001. A high-frequencytime series at Ocean Weather Ship Station M (Norwegian Sea):population dynamics of Calanus finmarchicus. Marine EcologyProgress Series, 219: 205e219.
Ingvarsdottir, A. 1998. Seasonal changes in physiology andchemical composition of Calanus finmarchicus copepoditestages. PhD thesis, University of Aberdeen. 152 pp.
Irigoien, X. 1999. Vertical distribution and population dynamics ofCalanus finmarchicus at station India (59(N, 19(W) during thepassage of the great salinity anomaly, 1971e1975. Deep-SeaResearch I, 47: 1e26.
Jonasdottir, S. H. 1999. Lipid content of Calanus finmarchicusduring overwintering in the FaroeeShetland Channel. FisheriesOceanography, 8(Suppl 1): 61e72.
Kaartvedt, S. 1996. Habitat preference during overwintering andtiming of seasonal vertical migration of Calanus finmarchicus.Ophelia, 44: 145e156.
Lindeque, P., Harris, R., Jones, M., and Smerdon, G. 1999.Calanus: a simple molecular method to distinguish the speciesidentity of any developmental stage. Marine Biology, 133:91e96.
Lindeque, P. K., Harris, R. P., Jones, M., and Smerdon, G. R.Distribution of Calanus spp. as determined using a geneticidentification system. Scientia Marina (in press).
Matthews, J. B. L. 1969. Continuous plankton records: thegeographical and seasonal distribution of Calanus finmarchicusL. in the North Atlantic. Bulletin of Marine Ecology, 6:251e273.
Planque, B., Hays, G. C., Ibanez, F., and Gamble, J. C. 1997.Large-scale spatial variations in the seasonal abundance ofCalanus finmarchicus. Deep-Sea Research, 44: 315e326.
Visser, A. W., Jonasdottir, S. H. 1999. Lipids, buoyancy and theseasonal vertical migration of Calanus finmarchicus. FisheriesOceanography, 8(Suppl 1): 100e106.


![Survival of Black-headed Gulls Larus ridibundus wintering in urban areas in The Netherlands [in Dutch, with English summary] (Overleving van overwinterende Kokmeeuwen in Nederlandse](https://static.fdokumen.com/doc/165x107/6316f36bd16b3722ff0d2193/survival-of-black-headed-gulls-larus-ridibundus-wintering-in-urban-areas-in-the.jpg)