Climate fluctuations and the spring invasion of the North Sea by Calanus finmarchicus
Upload
independentCategory
view
0download
0
PLEASE SCROLL DOWN FOR ARTICLE
This article was downloaded by: [Giraldo, Alan]On: 13 May 2009Access details: Access Details: [subscription number 911047780]Publisher Taylor & FrancisInforma Ltd Registered in England and Wales Registered Number: 1072954 Registered office: Mortimer House,37-41 Mortimer Street, London W1T 3JH, UK
Marine Biology ResearchPublication details, including instructions for authors and subscription information:http://www.informaworld.com/smpp/title~content=t713735885
Coastal upwelling circulation and its influence on the population dynamics ofCalanus chilensis (Brodski, 1959) off northern Chile (23°S)Alan Giraldo a; Ruben Escribano b; Victor Marín c; Pamela Hidalgo b
a Grupo de Investigación en Ecología Animal, Departamento de Biología, Universidad del Valle, Cali,Colombia b Center for Oceanographic Research in the South-Eastern Pacific (COPAS), Departamento deOceanografía, Universidad de Concepción, Chile c Departamento de Ciencias Ecológicas, Facultad deCiencias, Universidad de Chile, Santiago, Chile
Online Publication Date: 01 May 2009
To cite this Article Giraldo, Alan, Escribano, Ruben, Marín, Victor and Hidalgo, Pamela(2009)'Coastal upwelling circulation and itsinfluence on the population dynamics of Calanus chilensis (Brodski, 1959) off northern Chile (23°S)',Marine Biology Research,5:3,244— 256
To link to this Article: DOI: 10.1080/17451000802425635
URL: http://dx.doi.org/10.1080/17451000802425635
Full terms and conditions of use: http://www.informaworld.com/terms-and-conditions-of-access.pdf
This article may be used for research, teaching and private study purposes. Any substantial orsystematic reproduction, re-distribution, re-selling, loan or sub-licensing, systematic supply ordistribution in any form to anyone is expressly forbidden.
The publisher does not give any warranty express or implied or make any representation that the contentswill be complete or accurate or up to date. The accuracy of any instructions, formulae and drug dosesshould be independently verified with primary sources. The publisher shall not be liable for any loss,actions, claims, proceedings, demand or costs or damages whatsoever or howsoever caused arising directlyor indirectly in connection with or arising out of the use of this material.
ORIGINAL ARTICLE
Coastal upwelling circulation and its influence on the populationdynamics of Calanus chilensis (Brodski, 1959) off northernChile (238S)
ALAN GIRALDO*1, RUBEN ESCRIBANO2, VICTOR MARIN3 & PAMELA HIDALGO2
1Grupo de Investigacion en Ecologıa Animal, Departamento de Biologıa, Universidad del Valle, Cali, Colombia; 2Center
for Oceanographic Research in the South-Eastern Pacific (COPAS), Departamento de Oceanografıa, Universidad de
Concepcion, Chile; 3Departamento de Ciencias Ecologicas, Facultad de Ciencias, Universidad de Chile, Santiago, Chile
AbstractMarine pelagic copepods must cope with a highly heterogeneous environment in coastal upwelling systems. In addition tospatial and temporal heterogeneity in temperature and food supply, advective forces may strongly influence theirpopulations. Off northern Chile, the population of Calanus chilensis, a dominant copepod associated with upwelling centres,is subjected to large interannual variations in abundance, not explained by changing temperature regimes occurring uponcold and warm phases of the ENSO (El Nino Southern Oscillation) cycle. During two spring and two summer periods(1998�2000), we studied the abundance, distribution and growth of the copepodids of C. chilensis. The instantaneous meanweight-specific growth rate was estimated as 0.29 day�1 and was not significantly different among cruises. Weights of latestages did not differ either. However, the numerical abundance and biomass substantially differed among cruises, such thatdaily production of copepodids increased with greater biomasses. Chlorophyll-a was significantly greater in spring 1999 andsummer 2000, as compared to spring 1998 and summer 1999, coinciding with greater abundances of copepodids andstronger upwelling. The current field in the upper 200 m indicated that strong upwelling favoured nearshore waterretention, whereas weak or moderate upwelling caused more offshore advection. This finding is opposite to the usual viewthat strong upwelling favours offshore advection. We further concluded that neither food or temperature had muchinfluence on growth, abundance and production of C. chilensis, but instead seasonal and interannual variation in upwellingcaused by changes in local winds may be the primary cause for the observed fluctuations in population abundance.
Key words: Calanus, coastal upwelling, copepodid growth, Humboldt current, Chile, Antofagasta, 238 00?S, 708 30?W
Introduction
Advection is one of the environment factors
that exert important effects on the success of
zooplanktonic cohorts (Peterson 1998). For exam-
ple, if water circulation generates the conditions for
intense expatriation (e.g. high offshore advection)
from a retention area (e.g. near the upwelling focus),
then it can indeed play a major role in population
dynamics. Advective patterns depend upon the
interaction between local (e.g. winds) and remote
(e.g. coastally trapped waves) forcing, bottom topo-
graphy, coastline geometry and the physical struc-
ture (density) of the water column. Off northern
Chile, Shaffer et al. (1997) have concluded that
currents in the upper 300 m strongly depend upon
local wind forcing. Marın et al. (1993) and Marın
and Olivares (1999), studying Mejillones Bay (238S), have pointed out that local wind events explain
much of the biological variability both at daily and
seasonal scales. Marın et al. (2001) have also
suggested that currents in the upper 200 m in the
coastal zone can be explained as an Ekman dynamics
occurring on top of a poleward flow.
At the upwelling site off Mejillones Peninsula, the
calanoid copepod Calanus chilensis Brodsky, 1959 is a
key herbivore species. It is highly abundant and well
aggregated in the coastal upwelling zone (Escribano
1998). Spatial heterogeneity of temperature during
*Correspondence: Alan Giraldo, Grupo de Investigacion en Ecologıa Animal, Departamento de Biologıa, Universidad del Valle. A.A.
25360, Cali � Colombia. Email: [email protected]
Published in collaboration with the University of Bergen and the Institute of Marine Research, Norway, and the Marine Biological Laboratory,
University of Copenhagen, Denmark
Marine Biology Research, 2009; 5: 244�256
(Accepted 24 June 2008; Printed 19 May 2009)
ISSN 1745-1000 print/ISSN 1745-1019 online # 2009 Taylor & Francis
DOI: 10.1080/17451000802425635
Downloaded By: [Giraldo, Alan] At: 17:38 13 May 2009
active upwelling can have important influences in its
physiological responses, mainly on the development
rate, giving rise to variability in growth and reproduc-
tion success (Giraldo et al. 2002). Spatial hetero-
geneity during upwelling is also reflected in the
distribution of food resources for this species, at least
in terms of chlorophyll-a (Escribano 1998), although
Escribano and McLaren (1999) and Giraldo et al.
(2002) have pointed out that food is not a limiting
factor for population growth of this copepod, and that
individuals may grow at temperature-dependent
rates.
The northern area of Chile may also be subjected
to strong interannual variability, mostly derived from
the alternate phases of the ENSO (El Nino Southern
Oscillation) cycle. During the cold phase of ENSO
coastal upwelling seems more intense and primary
production might be higher, whereas under the
warm phase of ENSO upwelling appears as depleted
and productivity reduced (see Arntz & Fahrbach
1996 for a review). In other words, there seem to be
years with high productivity and others with low
productivity. It is not known if such year-to-year
variation in productivity affects the population
growth of copepods, like Calanus chilensis. In fact,
Escribano & Hidalgo (2000) found a high and
unexplained interannual variability in Calanus abun-
dances in the area from 1991 to 1999. These authors
suggested that interannual changes in mortality rates
may have produced such variation, because neither
temperature nor food showed any association with
copepod abundance.
Variability in mortality may be caused by
increased predation, but as stated by Peterson
(1998) advection might be the key factor regulating
mortality of pelagic copepods in coastal upwelling
systems. The current view states that upon strong
upwelling, offshore advection may increase losses of
copepodids remaining in the upper Ekman layer
(Peterson 1998). Off the Mejillones Peninsula,
however, increased upwelling may give rise to the
existence of retention zones near the coast, which
might prevent offshore advection of copepodids
(Giraldo et al. 2002) and fish larvae (Rojas et al.
2002). These retention areas will allow copepods
cohorts to fully develop, aggregated in the rich
upwellling centres. Conversely, if upwelling is
weak, the cohorts become dispersed, along with
their food, which is then more diluted. Under this
condition, individuals may be more exposed to be
advected away from the nearshore zone. Therefore
variation in upwelling intensity modifying the ad-
vective environment may strongly influence copepod
populations, such as that of C. chilensis. To examine
this hypothesis, in this work we used information
from four cruises performed during the spring/
summer period in 1998, 1999 and 2000. We aimed
at evaluating the effects of changing upwelling
intensity on population abundance, growth and
production of Calanus chilensis, over a seasonal and
interannual scale.
Methods and materials
Sampling methods
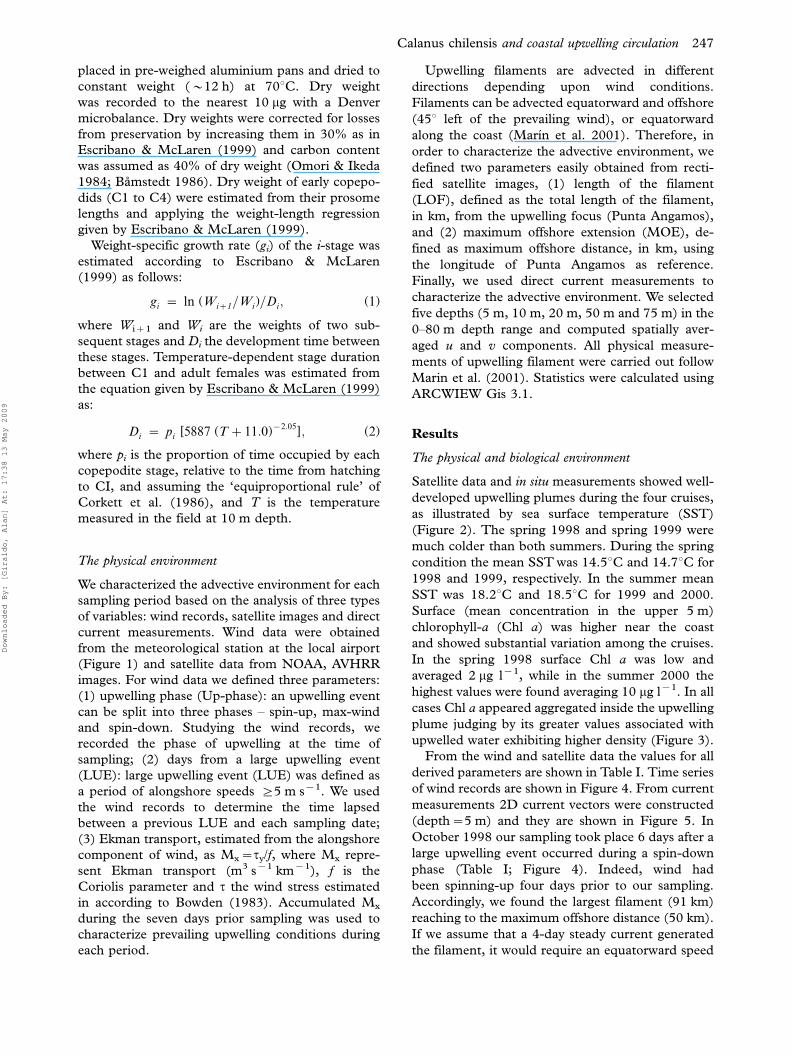
Four cruises were carried out: spring 1998 (October
1998), summer 1999 (January 1999), spring 1999
(November 1999) and summer 2000 (January 2000)
in the northern area off Mejillones Peninsula
(238 01’ 40.45’ S�708 30’ 45.32’ W), where a nearly
permanent upwelling plume can be observed.
Because this plume may change in position and
extension, a different oceanographic grid was sur-
veyed at each cruise (Figure 1), in order to adjust it
to the position of the upwelling plume, such that a
nearly equal number of sampling stations were inside
and outside of the cold upwelled waters. At
each station, direct current profiling in the upper
200 m was carried out using an Acoustic Doppler
current meter, Aanderaa RCM-9. Conductivity�temperature�depth�oxygen, and fluorescence pro-
files were also obtained with a SeaBird-SBE-19
CTD, and Wetstar fluorometer. Fluorescence units
were later converted to Chlorophyll-a concentration
(mg m�3) through an in situ calibration described in
Escribano & McLaren (1999). The sampling grid
was completed in about 30 h on each occasion to
obtain a synoptic description of the physical envir-
onment during upwelling. Further details on meth-
ods for oceanographic and current profiling were
provided in Marın et al. (2001).
A day after the oceanographic grid was finished,
zooplankton samples were obtained from four sta-
tions (Figure 1) in three depth strata: 0�20 m, 20�80 m and 80�200 m, using a Hensen type net with
0.5 m opening, 200 mm mesh, equipped with a
double opening�closing system and a calibrated
General Oceanic flowmeter. The stations were
chosen such that two were inside and two outside
of the cold upwelling plume, although sufficiently
close to each other so that they could be all sampled
during a single daytime or nighttime period to avoid
any diel change in vertical distribution of copepods.
Sampling was replicated during two consecutive
days at both daytime and nighttime periods, to yield
a total number of 48 samples per cruise. This design
was applied in October 1998, January 1999, and
November 1999. In the last cruise, during January
2000, we sampled the whole oceanographic grid
through integrated (0�80 m) net tows to better
examine the spatial distribution of copepods. On
Calanus chilensis and coastal upwelling circulation 245
Downloaded By: [Giraldo, Alan] At: 17:38 13 May 2009
this occasion, 27 stations were thus sampled,
coinciding with the oceanographic grid (Figure 1).
Zooplankton analysis
Individual Calanus chilensis were sorted from the
samples after one week of preservation. All copepo-
did stages were identified and counted. Nauplii were
not analysed presuming that the 200 mm net could
not properly sample them. Depending on abun-
dance, about 10 individual copepodite stages C5,
and 10 adult females were chosen from all the
samples of the upper 20 m layer and from integrated
samples of the January 2000 cruise. The prosome
lengths of all individuals were measured. These
individuals were quickly rinsed in distilled water,
NorthernChile
EasternSouthPacific
23.5S
23.3S
23.1S
22.9S
22.7S
Antofagasta
Mejillones
Meteorologicalstation
Lat
tiud
e
Oceanographic grids
PuntaAngamos
Oct 1998Jan 1999Nov 1999Jan 2000
71.0W 70.8W 70.6W 70.4W 70.2WLongitude
23.5S
23.3S
23.1S
22.9S
22.7S
Oct 1998, Jan 1999, Nov 1999Jan 2000
Zooplankton Stations
Antofagasta
Mejillones
PuntaAngamos
November
Figure 1. The Mejillones Peninsula upwelling site at northern Chile in the Eastern South Pacific, illustrating the sampling grids for the four
oceanographic cruises and the zooplankton stations.
246 A. Giraldo et al.
Downloaded By: [Giraldo, Alan] At: 17:38 13 May 2009
placed in pre-weighed aluminium pans and dried to
constant weight (�12 h) at 708C. Dry weight
was recorded to the nearest 10 mg with a Denver
microbalance. Dry weights were corrected for losses
from preservation by increasing them in 30% as in
Escribano & McLaren (1999) and carbon content
was assumed as 40% of dry weight (Omori & Ikeda
1984; Bamstedt 1986). Dry weight of early copepo-
dids (C1 to C4) were estimated from their prosome
lengths and applying the weight-length regression
given by Escribano & McLaren (1999).
Weight-specific growth rate (gi) of the i-stage was
estimated according to Escribano & McLaren
(1999) as follows:
gi � ln (Wi�1=Wi)=Di; (1)
where Wi�1 and Wi are the weights of two sub-
sequent stages and Di the development time between
these stages. Temperature-dependent stage duration
between C1 and adult females was estimated from
the equation given by Escribano & McLaren (1999)
as:
Di � pi [5887 (T�11:0)�2:05]; (2)
where pi is the proportion of time occupied by each
copepodite stage, relative to the time from hatching
to CI, and assuming the ‘equiproportional rule’ of
Corkett et al. (1986), and T is the temperature
measured in the field at 10 m depth.
The physical environment
We characterized the advective environment for each
sampling period based on the analysis of three types
of variables: wind records, satellite images and direct
current measurements. Wind data were obtained
from the meteorological station at the local airport
(Figure 1) and satellite data from NOAA, AVHRR
images. For wind data we defined three parameters:
(1) upwelling phase (Up-phase): an upwelling event
can be split into three phases � spin-up, max-wind
and spin-down. Studying the wind records, we
recorded the phase of upwelling at the time of
sampling; (2) days from a large upwelling event
(LUE): large upwelling event (LUE) was defined as
a period of alongshore speeds ]5 m s�1. We used
the wind records to determine the time lapsed
between a previous LUE and each sampling date;
(3) Ekman transport, estimated from the alongshore
component of wind, as Mx�ty/f, where Mx repre-
sent Ekman transport (m3 s�1 km�1), f is the
Coriolis parameter and t the wind stress estimated
in according to Bowden (1983). Accumulated Mx
during the seven days prior sampling was used to
characterize prevailing upwelling conditions during
each period.
Upwelling filaments are advected in different
directions depending upon wind conditions.
Filaments can be advected equatorward and offshore
(458 left of the prevailing wind), or equatorward
along the coast (Marın et al. 2001). Therefore, in
order to characterize the advective environment, we
defined two parameters easily obtained from recti-
fied satellite images, (1) length of the filament
(LOF), defined as the total length of the filament,
in km, from the upwelling focus (Punta Angamos),
and (2) maximum offshore extension (MOE), de-
fined as maximum offshore distance, in km, using
the longitude of Punta Angamos as reference.
Finally, we used direct current measurements to
characterize the advective environment. We selected
five depths (5 m, 10 m, 20 m, 50 m and 75 m) in the
0�80 m depth range and computed spatially aver-
aged u and v components. All physical measure-
ments of upwelling filament were carried out follow
Marin et al. (2001). Statistics were calculated using
ARCWIEW Gis 3.1.
Results
The physical and biological environment
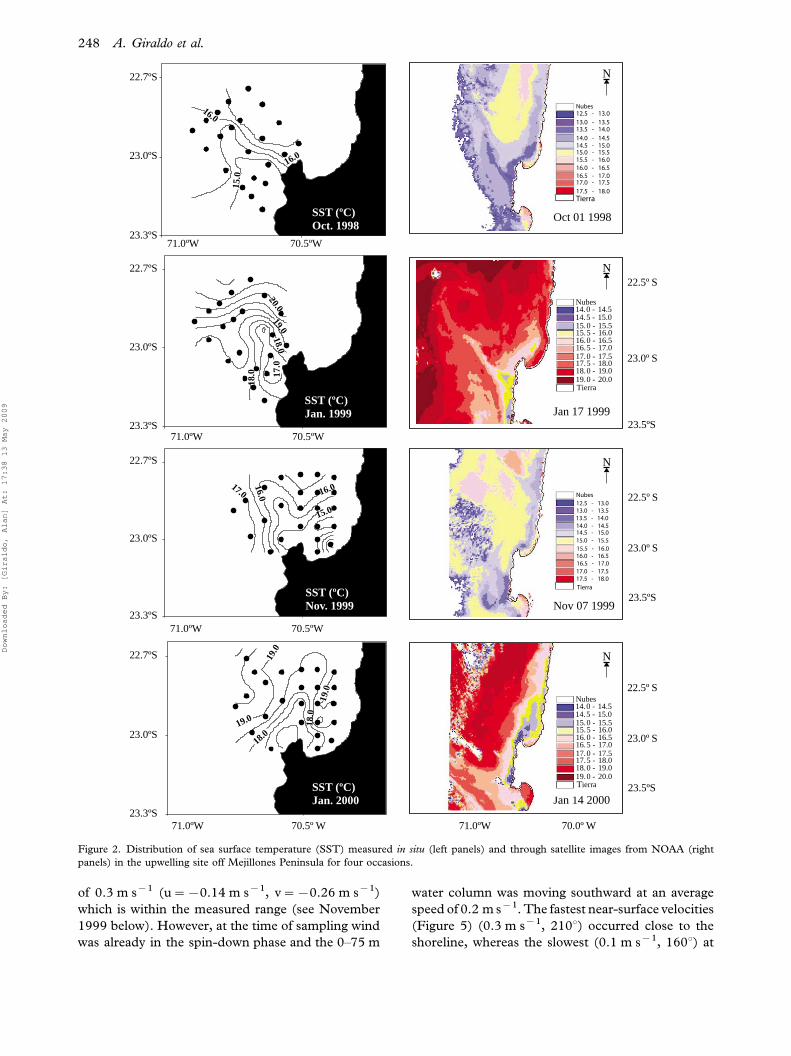
Satellite data and in situ measurements showed well-
developed upwelling plumes during the four cruises,
as illustrated by sea surface temperature (SST)
(Figure 2). The spring 1998 and spring 1999 were
much colder than both summers. During the spring
condition the mean SST was 14.58C and 14.78C for
1998 and 1999, respectively. In the summer mean
SST was 18.28C and 18.58C for 1999 and 2000.
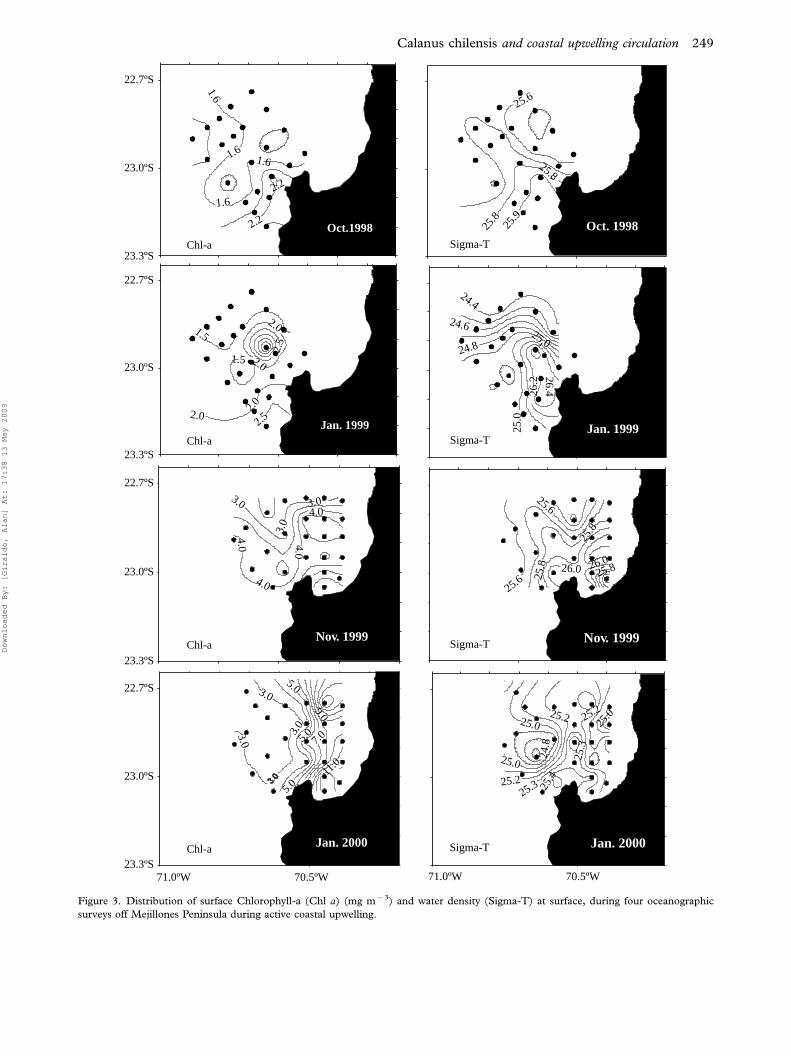
Surface (mean concentration in the upper 5 m)
chlorophyll-a (Chl a) was higher near the coast
and showed substantial variation among the cruises.
In the spring 1998 surface Chl a was low and
averaged 2 mg l�1, while in the summer 2000 the
highest values were found averaging 10 mg l�1. In all
cases Chl a appeared aggregated inside the upwelling
plume judging by its greater values associated with
upwelled water exhibiting higher density (Figure 3).
From the wind and satellite data the values for all
derived parameters are shown in Table I. Time series
of wind records are shown in Figure 4. From current
measurements 2D current vectors were constructed
(depth�5 m) and they are shown in Figure 5. In
October 1998 our sampling took place 6 days after a
large upwelling event occurred during a spin-down
phase (Table I; Figure 4). Indeed, wind had
been spinning-up four days prior to our sampling.
Accordingly, we found the largest filament (91 km)
reaching to the maximum offshore distance (50 km).
If we assume that a 4-day steady current generated
the filament, it would require an equatorward speed
Calanus chilensis and coastal upwelling circulation 247
Downloaded By: [Giraldo, Alan] At: 17:38 13 May 2009
of 0.3 m s�1 (u��0.14 m s�1, v��0.26 m s�1)
which is within the measured range (see November
1999 below). However, at the time of sampling wind
was already in the spin-down phase and the 0�75 m
water column was moving southward at an average
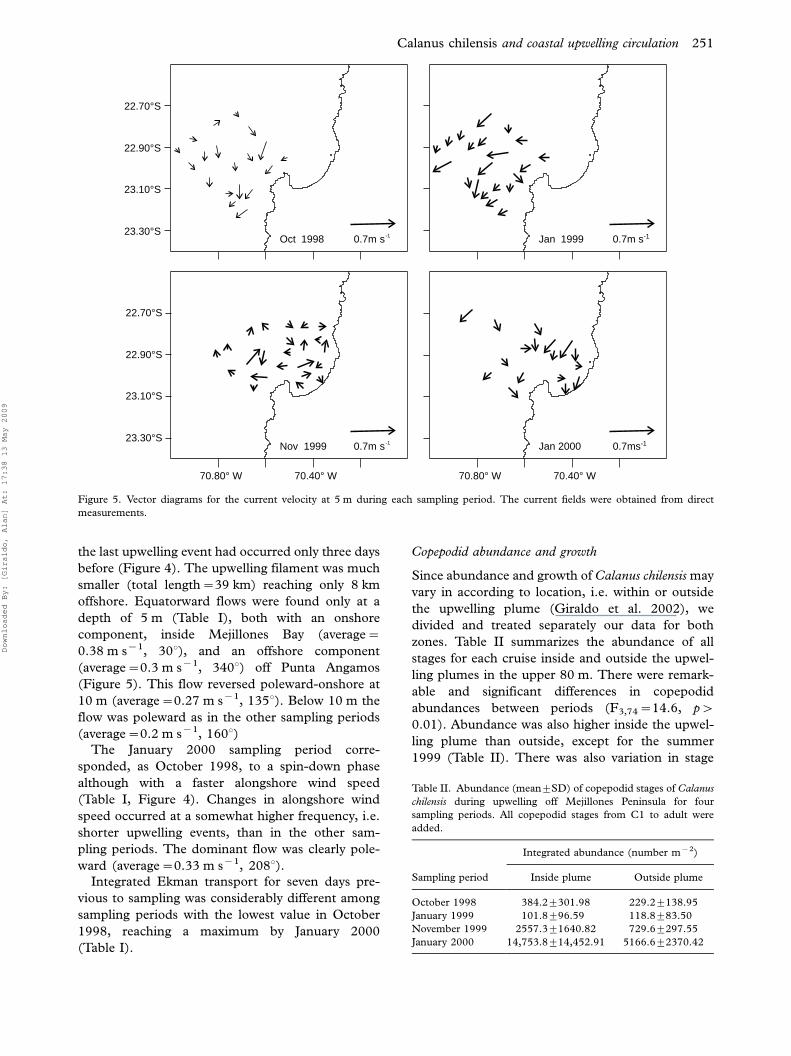
speed of 0.2 m s�1. The fastest near-surface velocities
(Figure 5) (0.3 m s�1, 2108) occurred close to the
shoreline, whereas the slowest (0.1 m s�1, 1608) at
71.0ºW 70.5º W23.3ºS
23.0ºS
22.7ºS
SST (ºC)Jan. 2000
19.0
19.0
18.0
19.0
18.0
71.0ºW 70.0º W
23.5ºS
22.5º S
23.0º S
Jan 14 2000
N
Nubes14.0 - 14.514.5 - 15.015.0 - 15.515.5 - 16.016.0 - 16.516.5 - 17.017.0 - 17.517.5 - 18.0
Tierra
18.0 - 19.019.0 - 20.0
23.0º S
22.5º S
23.5ºS
N
Nubes14.0 - 14.514.5 - 15.015.0 - 15.515.5 - 16.016.0 - 16.516.5 - 17.017.0 - 17.517.5 - 18.0
Tierra
18.0 - 19.019.0 - 20.0
Jan 17 1999
23.5ºS
22.5º S
23.0º S
Nov 07 1999
N
Oct 01 1998
N
71.0ºW 70.5ºW23.3ºS
23.0ºS
22.7ºS
SST (ºC)Nov. 1999
17.0 16.016.0
15.0
71.0ºW 70.5ºW23.3ºS
23.0ºS
22.7ºS
SST (ºC)Jan. 1999
18.0 17
.0
18.019.0
20.0
71.0ºW 70.5ºW23.3ºS
23.0ºS
22.7ºS
SST (ºC)Oct. 1998
15.0
16.0
16.0
Figure 2. Distribution of sea surface temperature (SST) measured in situ (left panels) and through satellite images from NOAA (right
panels) in the upwelling site off Mejillones Peninsula for four occasions.
248 A. Giraldo et al.
Downloaded By: [Giraldo, Alan] At: 17:38 13 May 2009
23.3ºS
23.0ºS
22.7ºS
23.3ºS
23.0ºS
22.7ºS
23.3ºS
23.0ºS
22.7ºS
23.3ºS
23.0ºS
22.7ºS
Jan. 2000
Nov. 1999
Jan. 1999
Oct.1998
71.0ºW 70.5ºW
Nov. 1999
Jan. 1999
Oct. 1998
Jan. 2000
Chl-a Sigma-T
1.6
1.6
1.61.6
2.2
2.2
25.6
25.8
25.8
25.9
24.4
24.6
24.825.0
25.0
26.2
26.4
1.5
2.0
2.0
1.5
2.5
2.02.02.5
Chl-a Sigma-T
3.0 25.6
Chl-a Sigma-T
Chl-a Sigma-T
4.0
3.04.0
4.0
3.0
4.0
25.8
25.626.0
25.8
26.025.8
25.025.2 25.2
25.0
25.3
25.0
24.8
25.225.3 25
.4
3.05.0
9.0
3.0
3.0 5.0 7.0
11.0
5.0
71.0ºW 70.5ºW
Figure 3. Distribution of surface Chlorophyll-a (Chl a) (mg m�3) and water density (Sigma-T) at surface, during four oceanographic
surveys off Mejillones Peninsula during active coastal upwelling.
Calanus chilensis and coastal upwelling circulation 249
Downloaded By: [Giraldo, Alan] At: 17:38 13 May 2009
locations where satellite images showed the presence
of cold temperature filaments.
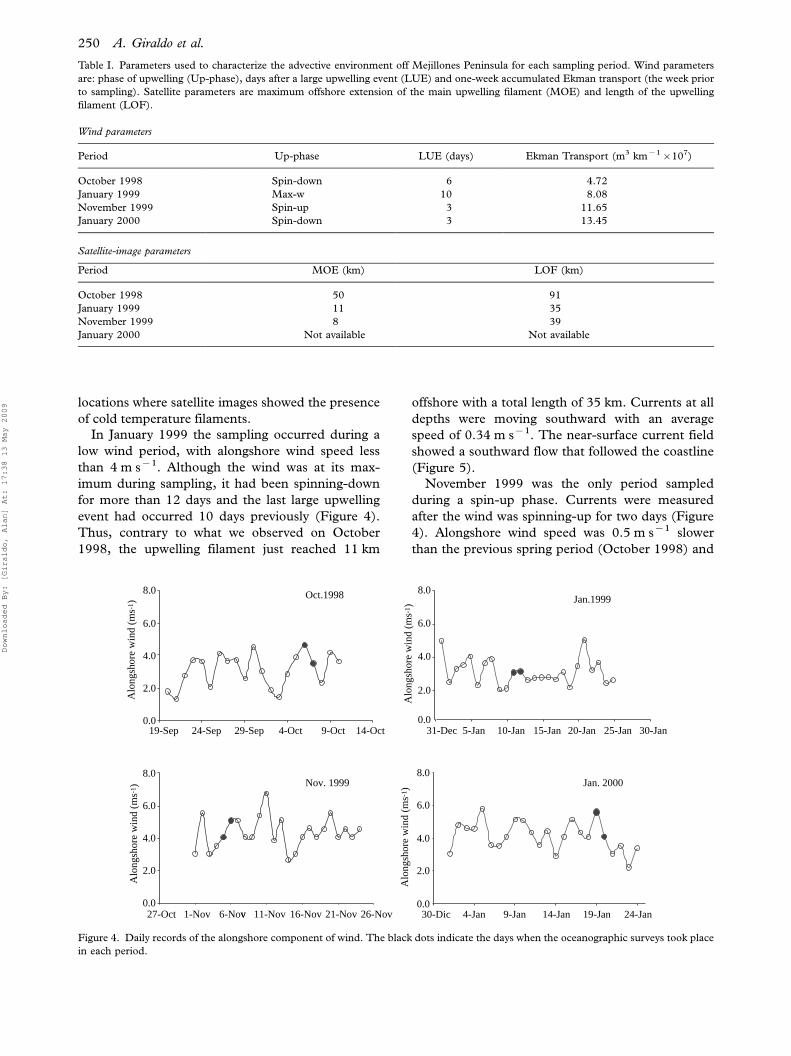
In January 1999 the sampling occurred during a
low wind period, with alongshore wind speed less
than 4 m s�1. Although the wind was at its max-
imum during sampling, it had been spinning-down
for more than 12 days and the last large upwelling
event had occurred 10 days previously (Figure 4).
Thus, contrary to what we observed on October
1998, the upwelling filament just reached 11 km
offshore with a total length of 35 km. Currents at all
depths were moving southward with an average
speed of 0.34 m s�1. The near-surface current field
showed a southward flow that followed the coastline
(Figure 5).
November 1999 was the only period sampled
during a spin-up phase. Currents were measured
after the wind was spinning-up for two days (Figure
4). Alongshore wind speed was 0.5 m s�1 slower
than the previous spring period (October 1998) and
Table I. Parameters used to characterize the advective environment off Mejillones Peninsula for each sampling period. Wind parameters
are: phase of upwelling (Up-phase), days after a large upwelling event (LUE) and one-week accumulated Ekman transport (the week prior
to sampling). Satellite parameters are maximum offshore extension of the main upwelling filament (MOE) and length of the upwelling
filament (LOF).
Wind parameters
Period Up-phase LUE (days) Ekman Transport (m3 km�1�107)
October 1998 Spin-down 6 4.72
January 1999 Max-w 10 8.08
November 1999 Spin-up 3 11.65
January 2000 Spin-down 3 13.45
Satellite-image parameters
Period MOE (km) LOF (km)
October 1998 50 91
January 1999 11 35
November 1999 8 39
January 2000 Not available Not available
0.0
2.0
4.0
6.0
8.0
0.0
2.0
4.0
6.0
8.0
0.0
2.0
4.0
6.0
8.0
0.0
2.0
4.0
6.0
8.0
19-Sep 24-Sep 29-Sep 4-Oct 9-Oct 14-Oct 31-Dec 5-Jan 10-Jan 15-Jan 20-Jan 25-Jan 30-Jan
27-Oct 1-Nov v6-Nov 11-Nov 16-Nov 21-Nov 26-Nov 30-Dic 4-Jan 9-Jan 14-Jan 19-Jan 24-Jan
Oct.1998
Nov. 1999
Jan.1999
0002.naJ
Alo
ngsh
ore
win
d (m
s-1 )
Alo
ngsh
ore
win
d (m
s-1 )
Alo
ngsh
ore
win
d (m
s-1 )
Alo
ngsh
ore
win
d (m
s-1 )
Figure 4. Daily records of the alongshore component of wind. The black dots indicate the days when the oceanographic surveys took place
in each period.
250 A. Giraldo et al.
Downloaded By: [Giraldo, Alan] At: 17:38 13 May 2009
the last upwelling event had occurred only three days
before (Figure 4). The upwelling filament was much
smaller (total length�39 km) reaching only 8 km
offshore. Equatorward flows were found only at a
depth of 5 m (Table I), both with an onshore
component, inside Mejillones Bay (average�0.38 m s�1, 308), and an offshore component
(average�0.3 m s�1, 3408) off Punta Angamos
(Figure 5). This flow reversed poleward-onshore at
10 m (average�0.27 m s�1, 1358). Below 10 m the
flow was poleward as in the other sampling periods
(average�0.2 m s�1, 1608)The January 2000 sampling period corre-
sponded, as October 1998, to a spin-down phase
although with a faster alongshore wind speed
(Table I, Figure 4). Changes in alongshore wind
speed occurred at a somewhat higher frequency, i.e.
shorter upwelling events, than in the other sam-
pling periods. The dominant flow was clearly pole-
ward (average�0.33 m s�1, 2088).Integrated Ekman transport for seven days pre-
vious to sampling was considerably different among
sampling periods with the lowest value in October
1998, reaching a maximum by January 2000
(Table I).
Copepodid abundance and growth
Since abundance and growth of Calanus chilensis may
vary in according to location, i.e. within or outside
the upwelling plume (Giraldo et al. 2002), we
divided and treated separately our data for both
zones. Table II summarizes the abundance of all
stages for each cruise inside and outside the upwel-
ling plumes in the upper 80 m. There were remark-
able and significant differences in copepodid
abundances between periods (F3,74�14.6, p�
0.01). Abundance was also higher inside the upwel-
ling plume than outside, except for the summer
1999 (Table II). There was also variation in stage
23.30°S
23.10°S
22.90°S
22.70°S
Oct 1998 0.7m s-1 Jan 1999 0.7m s-1
Jan 2000 0.7ms-1Nov 1999 0.7m s-1
70.80° W 70.40° W 70.80° W 70.40° W
23.30°S
23.10°S
22.90°S
22.70°S
Figure 5. Vector diagrams for the current velocity at 5 m during each sampling period. The current fields were obtained from direct
measurements.
Table II. Abundance (mean9SD) of copepodid stages of Calanus
chilensis during upwelling off Mejillones Peninsula for four
sampling periods. All copepodid stages from C1 to adult were
added.
Integrated abundance (number m�2)
Sampling period Inside plume Outside plume
October 1998 384.29301.98 229.29138.95
January 1999 101.8996.59 118.8983.50
November 1999 2557.391640.82 729.69297.55
January 2000 14,753.8914,452.91 5166.692370.42
Calanus chilensis and coastal upwelling circulation 251
Downloaded By: [Giraldo, Alan] At: 17:38 13 May 2009
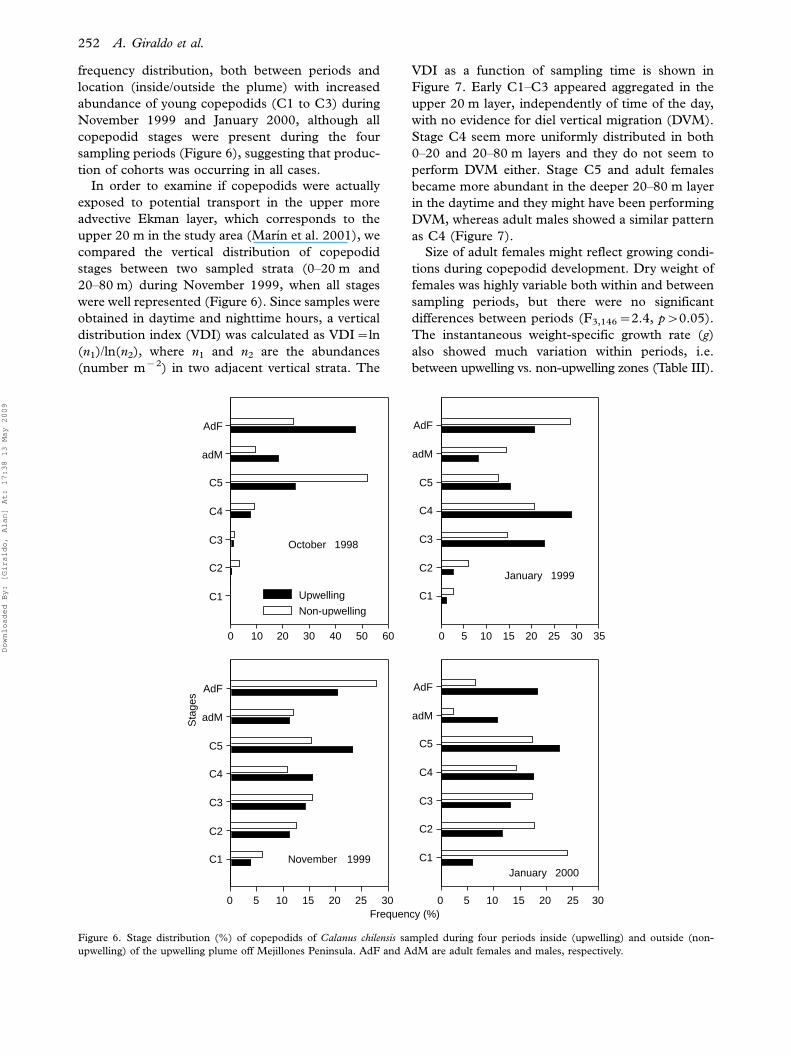
frequency distribution, both between periods and
location (inside/outside the plume) with increased
abundance of young copepodids (C1 to C3) during
November 1999 and January 2000, although all
copepodid stages were present during the four
sampling periods (Figure 6), suggesting that produc-
tion of cohorts was occurring in all cases.
In order to examine if copepodids were actually
exposed to potential transport in the upper more
advective Ekman layer, which corresponds to the
upper 20 m in the study area (Marın et al. 2001), we
compared the vertical distribution of copepodid
stages between two sampled strata (0�20 m and
20�80 m) during November 1999, when all stages
were well represented (Figure 6). Since samples were
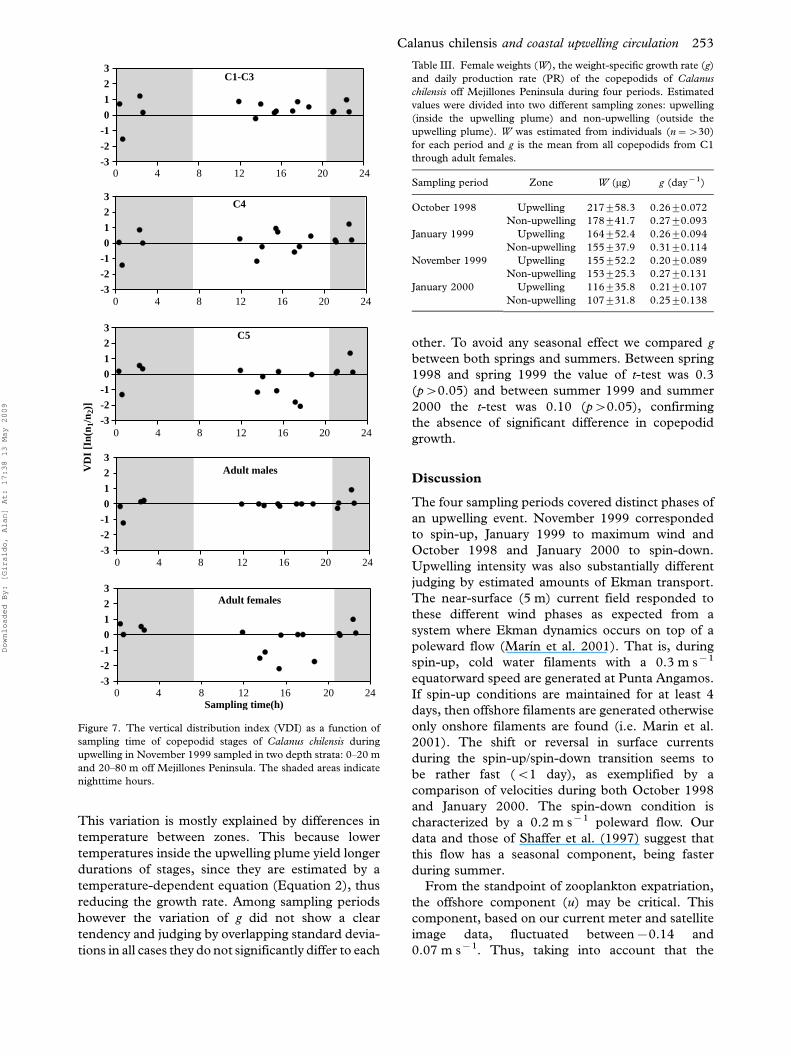
obtained in daytime and nighttime hours, a vertical
distribution index (VDI) was calculated as VDI�ln
(n1)/ln(n2), where n1 and n2 are the abundances
(number m�2) in two adjacent vertical strata. The
VDI as a function of sampling time is shown in
Figure 7. Early C1�C3 appeared aggregated in the
upper 20 m layer, independently of time of the day,
with no evidence for diel vertical migration (DVM).
Stage C4 seem more uniformly distributed in both
0�20 and 20�80 m layers and they do not seem to
perform DVM either. Stage C5 and adult females
became more abundant in the deeper 20�80 m layer
in the daytime and they might have been performing
DVM, whereas adult males showed a similar pattern
as C4 (Figure 7).
Size of adult females might reflect growing condi-
tions during copepodid development. Dry weight of
females was highly variable both within and between
sampling periods, but there were no significant
differences between periods (F3,146�2.4, p�0.05).
The instantaneous weight-specific growth rate (g)
also showed much variation within periods, i.e.
between upwelling vs. non-upwelling zones (Table III).
0 10 20 30 40 50 60
Sta
ges
C1
C2
C3
C4
C5
adM
AdF
Upwelling
Non-upwelling
0 5 10 15 20 25 30 35
C1
C2
C3
C4
C5
adM
AdF
0 5 10 15 20 25 30
C1
C2
C3
C4
C5
adM
AdF
Frequency (%)0 5 10 15 20 25 30
C1
C2
C3
C4
C5
adM
AdF
October 1998
January 1999
November 1999January 2000
Figure 6. Stage distribution (%) of copepodids of Calanus chilensis sampled during four periods inside (upwelling) and outside (non-
upwelling) of the upwelling plume off Mejillones Peninsula. AdF and AdM are adult females and males, respectively.
252 A. Giraldo et al.
Downloaded By: [Giraldo, Alan] At: 17:38 13 May 2009
This variation is mostly explained by differences in
temperature between zones. This because lower
temperatures inside the upwelling plume yield longer
durations of stages, since they are estimated by a
temperature-dependent equation (Equation 2), thus
reducing the growth rate. Among sampling periods
however the variation of g did not show a clear
tendency and judging by overlapping standard devia-
tions in all cases they do not significantly differ to each
other. To avoid any seasonal effect we compared g
between both springs and summers. Between spring
1998 and spring 1999 the value of t-test was 0.3
(p�0.05) and between summer 1999 and summer
2000 the t-test was 0.10 (p�0.05), confirming
the absence of significant difference in copepodid
growth.
Discussion
The four sampling periods covered distinct phases of
an upwelling event. November 1999 corresponded
to spin-up, January 1999 to maximum wind and
October 1998 and January 2000 to spin-down.
Upwelling intensity was also substantially different
judging by estimated amounts of Ekman transport.
The near-surface (5 m) current field responded to
these different wind phases as expected from a
system where Ekman dynamics occurs on top of a
poleward flow (Marın et al. 2001). That is, during
spin-up, cold water filaments with a 0.3 m s�1
equatorward speed are generated at Punta Angamos.
If spin-up conditions are maintained for at least 4
days, then offshore filaments are generated otherwise
only onshore filaments are found (i.e. Marin et al.
2001). The shift or reversal in surface currents
during the spin-up/spin-down transition seems to
be rather fast (B1 day), as exemplified by a
comparison of velocities during both October 1998
and January 2000. The spin-down condition is
characterized by a 0.2 m s�1 poleward flow. Our
data and those of Shaffer et al. (1997) suggest that
this flow has a seasonal component, being faster
during summer.
From the standpoint of zooplankton expatriation,
the offshore component (u) may be critical. This
component, based on our current meter and satellite
image data, fluctuated between�0.14 and
0.07 m s�1. Thus, taking into account that the
VD
I [I
n(n 1
/n2)
]
-3
-2
-1
0
1
2
3
0 4 8 12 16 20 24
0 4 8 12 16 20 24
-3
-2
-1
0
1
2
3
C1-C3
C4
Sampling time(h)
-3
-2
-1
0
1
2
3C5
-3
-2
-1
0
1
2
3
-3
-2
-1
0
1
2
3Adult females
Adult males
0 4 8 12 16 20 24
0 4 8 12 16 20 24
0 4 8 12 16 20 24
Figure 7. The vertical distribution index (VDI) as a function of
sampling time of copepodid stages of Calanus chilensis during
upwelling in November 1999 sampled in two depth strata: 0�20 m
and 20�80 m off Mejillones Peninsula. The shaded areas indicate
nighttime hours.
Table III. Female weights (W), the weight-specific growth rate (g)
and daily production rate (PR) of the copepodids of Calanus
chilensis off Mejillones Peninsula during four periods. Estimated
values were divided into two different sampling zones: upwelling
(inside the upwelling plume) and non-upwelling (outside the
upwelling plume). W was estimated from individuals (n��30)
for each period and g is the mean from all copepodids from C1
through adult females.
Sampling period Zone W (mg) g (day�1)
October 1998 Upwelling 217958.3 0.2690.072
Non-upwelling 178941.7 0.2790.093
January 1999 Upwelling 164952.4 0.2690.094
Non-upwelling 155937.9 0.3190.114
November 1999 Upwelling 155952.2 0.2090.089
Non-upwelling 153925.3 0.2790.131
January 2000 Upwelling 116935.8 0.2190.107
Non-upwelling 107931.8 0.2590.138
Calanus chilensis and coastal upwelling circulation 253
Downloaded By: [Giraldo, Alan] At: 17:38 13 May 2009
spin-up phase may last 4 days, organisms may be
advected up to 50 km offshore, a condition that
could have occurred during October 1998 and
January 1999. If we considered the average value
for u (Bu���0.06 m s�1), then a 4-day spin-up
phase would transport organisms only 20 km off-
shore. This last condition would apply to the flows
during November 1999 and January 2000.
Considering the data presented in this paper, the
data from Shaffer et al. (1997) and Marın et al.
(2001), the coastal ocean in the northern Humboldt
Current System (up to at least 50 km offshore) is
dominated by a poleward flow covering the upper
300 m of the water column. Upwelling events,
generated by increases in the always-dominant south
winds, may reverse the surface (B10 m) currents.
These equatorward flows influenced by the coastal
geometry and bottom topography generate cold water
filaments that may advect organisms as far as 50 km
offshore. However, the most ‘typical’ condition seems
to be that offshore advection will only reach 10 km
offshore.
Calanus chilensis belongs to the C. helgolandicus
species group (Bradford 1988). One of the charac-
teristics of the species in this group is that copepodite
stage C5 overwinter in deep water, a strategy
associated to the advantage of ‘return flows’ which
would mantain species in ‘optimum environments’
(Bradford 1988). Calanus chilensis is then an ‘unu-
sual’ species given its absence of deep water over-
wintering (Gonzalez & Marın 1998) and lack, or
limited, DVM as shown in Figure 7 and as previously
reported by Escribano (1998). Vertical distribution
limited to the upper layer might a consequence of the
shallow oxygen minimum layer in the coastal zone off
northern Chile (Morales et al. 1999), which may
impose constraints for vertical migration of zoo-
plankton (Ulloa et al. 2001; Rojas et al. 2002).
Variability in copepodid abundance between sam-
pling periods may result from the influence of
changing environmental conditions. Increased pri-
mary production and hence better food conditions
may have resulted in greater population growth in
the last two cruises, when Chla was higher and
upwelling more intense. However all cruises were
carried out during spring�summer conditions, i.e.
during the reproductive period for the species
(Escribano & Rodriguez 1994) and even although
Chla was greater in November 1999 and January
2000, adult sizes and growth rates were not sig-
nificantly greater. This species seems to continu-
ously reproduce in the area throughout the year
(Escribano & McLaren 1999) and the possibility of
food-limitation for its population growth seems
unlikely, especially in the spring/summer period.
Moreover, Chla may be considered only as an index
Weak/moderate upwelling Strong upwelling
High advection
High retention
Poleward current Poleward current
Calanus lowabundance
Calanus highabundance
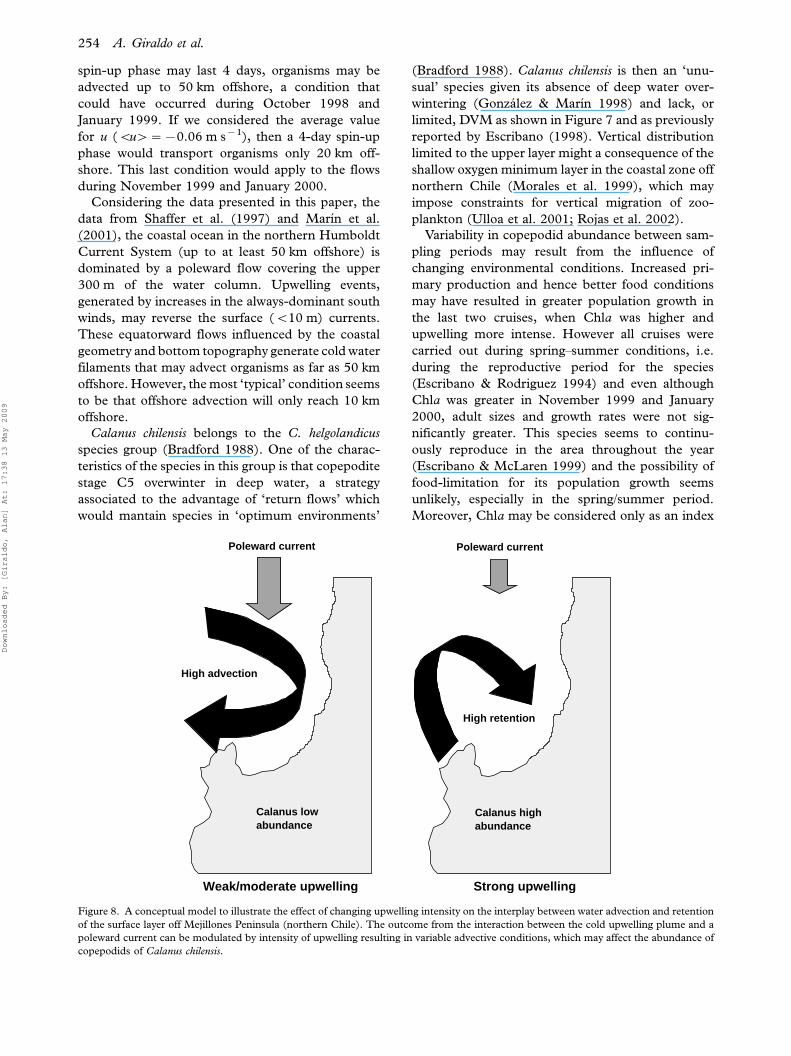
Figure 8. A conceptual model to illustrate the effect of changing upwelling intensity on the interplay between water advection and retention
of the surface layer off Mejillones Peninsula (northern Chile). The outcome from the interaction between the cold upwelling plume and a
poleward current can be modulated by intensity of upwelling resulting in variable advective conditions, which may affect the abundance of
copepodids of Calanus chilensis.
254 A. Giraldo et al.
Downloaded By: [Giraldo, Alan] At: 17:38 13 May 2009
of food availability, because other food sources, such
as components of the microzooplancton are very
abundant in this upwellling area (Gonzalez et al.
2000), and may serve as alternate food resources for
C. chilensis, as reported for other Calanus species
(Ohman & Runge 1994).
Temperature is another factor affecting individual
growth in copepods (Huntley & Lopez 1992) and
thus potentially influencing population abundance.
Indeed, we should recall that our estimates of growth
come from a temperature-dependent model, i.e.
increased temperatures should yield greater growth
rates. However, under increased temperature during
the summer 2000, growth was not incremented;
suggesting that temperature effect on the growth rate
may not suffice to explain differences in biomass and
population abundance. In fact, Escribano & Hidalgo
(2000) found no correlation between temperature
and C. chilensis abundance after 7 years of data from
1991 to 1998. Therefore, variation in copepodid
abundances among cruises in the present study
cannot be explained by our temperature-dependent
growth rates. Losses from the population might be
another line of explanation for variability in popula-
tion size.
Our data showed that upon changing upwelling
intensity the advective environment may shift from a
situation where either retention or offshore advec-
tion can dominate the upper layer (Figure 5).
During October 1998 and January 1999, individuals
were more exposed to offshore transport, coinciding
with low copepodid abundance, as compared to
conditions in November 1999 and January 2000,
when upwelling was more intense, but retention
nearshore was more likely because onshore flows
prevailed (Figure 5). Therefore, offshore advection
may deserve special attention in Mejillones upwel-
ling systems in order to explicate the dynamics of
C. chilensis population size.
The presence of a permanent poleward current
(Shaffer et al. 1997; Marın et al. 2001) in the area,
interacting with the upwelling plume, results in
increased water retention in the nearshore under
conditions of strong upwelling. We have illustrated
the interplay between upwelling intensity and ad-
vective conditions as shown in Figure 8. In this
conceptual model we suggest that weak/moderate
upwelling gives rise to a poleward dominant flow and
the cold plume is advected southwest (see Figure 5).
By contrast, upon strong upwelling the poleward
flow is weakened and a northward and onshore flow
prevails. The later condition will favour Calanus
retention in the upwelling zone, increasing their
abundance and giving rise to higher production
rates, because of greater copepodid biomass.
Further studies should examine the role of chan-
ging predation pressure on the Calanus population.
The possibility that egg production may change
upon varying food availability should also be con-
sidered. Both density-dependent mortality and egg
production rate may strongly influence variability in
population size. In coastal upwelling systems, how-
ever, varying advective conditions appear as a key
role regulating population size and production of
epipelagic copepods.
Acknowledgements
The field study was supported by FONDECYT-
Chile, Grant 198-0366. Data analysis and manu-
script preparation was supported by the Center for
Oceanographic Research in the South-Eastern
Pacific (COPAS) funded by FONDAP-CONICYT
Program of Chile.
References
Arntz WE, Fahrbach, E. 1996. El Nino-Experimento Climatico
de la Naturaleza. Fondo de Cultura Economica, Mexico, DF.
264 p.
Bamsted TU. 1986. Chemical composition and energy content.
In: Corner EDS, O’Hara SCM, editors. The Biological
Chemistry of Marine Copepods. Oxford: Clarendon Press,
p. 1�58.
Bowden KF. 1983. Physical Oceanography of Coastal Waters.
Ellis Horwood Series on Marine Science. New York: John
Wiley and Sons. 302 p.
Bradford JM. 1988. Review of the taxonomy of the Calanidae
(Copepoda) and the limits to the genus Calanus. Hydrobiologia
167/168:73�81.
Corkett CJ, McLaren IA, Sevigni JM. 1986. The rearing of the
marine calanoid copepods Calanus finmarchicus (Gunnerus),
C. glacialis Jashnov and C. hyperboreus Kroyer with comment
on the equiproportional rule. Syllogeus (Natural Museum of
Canada) 58:539�46.
Escribano R. 1998. Population dynamics of Calanus chilensis from
northern Chile. Fisheries Oceanography 7:245�51.
Escribanao R, Hidalgo P. 2000. Influence of El Nino and La Nina
on the population dynamics of Calanus chilensis in northern
Chile. ICES Journal of Marine Sciences 57:1867�74.
Escribano R, McLaren IA. 1999. Production of Calanus chilensis
from the upwelling area of Antofagasta, northern Chile. Marine
Ecology Progress Series 177:147�56.
Escribano R, Rodrıguez L. 1994. The life cycle of Calanus chilensis
Brodsky in Bay of San Jorge, Antofagasta, Chile. Hydrobiologia
292/293:289�394.
Giraldo R, Escribano R, Marın VH. 2002. Spatial distribution of
Calanus chilensis off Mejillones Peninsula (northern Chile):
Ecological consequences upon coastal upwelling. Marine
Ecology Progress Series 230:225�34.
Gonzalez A, Marın VH. 1998. Distribution and life cycle of
Calanus chilensis and Centropages brachiatus (Copepoda) in
Chilean coastal waters: A GIS approach. Marine Ecology
Progress Series 165:109�17.
Gonzalez HE, Ortiz VC, Sobarzo M. 2000. The role of faecal
material in the particulate organic carbon flux in the northern
Humboldt Current, Chile (238S), before and during the
1997�1998 El Nino. Journal of Plankton Research 22:499�529.
Calanus chilensis and coastal upwelling circulation 255
Downloaded By: [Giraldo, Alan] At: 17:38 13 May 2009
Huntley ME, Lopez MDG. 1992. Temperature-dependent pro-
duction of marine copepods: A global synthesis. American
Naturalist 140:201�42.
Marın VH, Escribano R, Delgado LE, Olivares G, Hidalgo P.
2001. Nearshore circulation in a coastal upwelling site off the
northern Humboldt Current System. Continental Shelf
Research 21:1317�29.
Marın VH, Olivares G. 1999. Estacionalidad de la productividad
primaria en bahıa mejillones del sur: Una aproximacion
proceso-funcional. Revista Chilena de Historia Natural
72:629�41.
Marın VH, Rodrıguez L, Vallejo L., Fuenteseca J, Oyarce E.
1993. Efecto de la surgencia costera sobre la productividad
primaria primaveral de bahıa Mejillones del Sur (Antofagasta,
Chile). Revista Chilena de Historia Natural 66:479�91.
Morales CE, Hormazabal SE, Blanco JL. 1999. Interannual
variability in the mesoescale distribution of the depth of the
upper boundary of the oxygen minimum layer off northern
Chile (18�24S): Implications for the pelagic system and
biogeochemical cycling. Journal of Marine Research 57:
909�32.
Ohman MD, Runge JF. 1994. Sustained fecundity when phyto-
plankton resources are in short supply: Omnivory by Calanus
finmarchicus in the Gulf of St. Lawrence. Limnology and
Oceanography 39:21�36.
Omori M, Ikeda T. 1984. Methods in Marine Zooplankton
Ecology. New York: John Wiley and Sons.
Peterson W. 1998. Life cycle strategies of copepods in coastal
upwelling zones. Journal of Marine Systems 15:313�26.
Rojas P, Escribano R, Marın VH. 2002. The influence of coastal
upwelling on fish larvae distribution off Mejillones Peninsula,
northern Chile. Fisheries Oceanography 11:233�44.
Shaffer G, Pizarro O, Djurfeldt L, Salinas S, Ruttlant J. 1997.
Circulation and low-frequency variability near the Chilean
coast: Remotely forced fluctuations during the 1991�92 El
Nino. Journal of Physical Oceanography 27:217�35.
Ulloa O, Escribano R, Hormazabal S, Quinones R, Ramos M,
Gonzalez H. 2001. Evolution and biological effects of the
1997�98 El Nino in northern Chile. Geophysical Research
Letters 28:1591�4.
Editorial responsibility: Torkel G. Nielsen
256 A. Giraldo et al.
Downloaded By: [Giraldo, Alan] At: 17:38 13 May 2009
Copyright © 2022 FDOKUMEN