Ecology and DNA fingerprinting of Cryptocoryne pallidinervia Engler (Araceae) accessions using...
11
Malays. Appl. Biol. (2007) 36(2): 21–31 * To whom correspondence should be addressed. ECOLOGY AND DNA FINGERPRINTING OF CRYPTOCORYNE PALLIDINERVIA ENGLER (ARACEAE) ACCESSIONS USING POLYMERASE CHAIN REACTION M13 UNIVERSAL PRIMER I.B. IPOR 1 , W.S. HO, C.S. TAWAN, M.S. SALMIZANA and M. NORYATIMAH Faculty of Resource Science & Technology University Malaysia Sarawak 94300 Kota Samarahan, Sarawak Malaysia 1 E-mail: [email protected] ABSTRACT The ecological study of Cryptocoryne pallidinervia Engler was conducted at three different locations vis. Sungai Keranji (Lundu), Sungai Batu (Triso, Sri Aman) and Lingga Peat Swamp Forest Reserve (Lingga, Sri Aman).The study comprised of morphological characteristics, growth pattern and biomass allocation of C. pallidinervia, forest structure and edaphic conditions of the location of C. pallidinervia were carried out. The total dry weight (g/m 2 ), plant density, total leaves per m 2 , total leaf area (cm 2 /m 2 ), leaf area ratio (cm 2 /g), specific leaf area (cm 2 /g), leaf weight ratio (g/g), petiole weight ratio (g/g) and root weight ratio (g/g) varied between localities. Genomic DNA of 18 accessions was amplified with the M13 universal primer (5’- TTATGAAACGACGGCCAGT-3’). A total of 18 distinctive PCR patterns were obtained which composed of 3 to 20 bands with the size ranging from 500bp to 3kb. The PCR profile was further analyzed to establish genetic diversity between through the construction of dendrogram. Cluster analysis of genetic relatedness had divided the C. pallidinervia accessions into four different major clusters. All big leaf accessions were grouped together whereas the small leaf accessions can be found in all clusters. Besides that, Bintulu accessions were highly differentiated among the others since they grouped together in different clusters. This indicates that the PCR method with M13 universal primer is a rapid and reliable method to study genetic relatedness of C. pallidinervia accessions from different locations. Key words: Araceae, morphological characters, DNA fingerprinting INTRODUCTION Cryptocoryne (Araceae) has for many years been given attention because of their value as aquarium plants (Rataj and Horeman, 1977). They are common fresh water aquatic plant. According to Mansor (1991), Bastmeijer (2005) and de Wit (1990), most of the species of Cryptocoryne are exploited for the aquarium industry in the international aquarium market. Fourteen species of Cryptocoryne have been recognized from Borneo and one of them being Cryptocoryne pallidinervia Engler. It is a plant of lowland forests where it grows in slow running rivers and streams and seasonally inundated forest pools under extremely acid conditions with around pH4 or so. This species is endemic to Borneo that is in the peat swamp forests of Sarawak and West Kalimantan. To date, in Sarawak, it can be found in Kampung Keranji in Lundu, Lingga Peat Swamp Forest Reserve and Sungai Batu, Kampung Teriso in Sri Aman, Sungai Ayang, Dalat in Mukah, and near Kemena Waterfall in Bintulu (Figure 1). C. pallidinervia is characterized by the cordate, more or less bullate leaves as illustrated in Figure 2. The spathe has a long tube and the limb is red with protuberances. Its collar zone is yellowish with small red spots that become smaller towards the throat. The spadix has the male and female flowers with very short naked part of spadix, situated adjacent to each other. The kettle is black purple inside. The present study is to determine the ecology and genetic relatedness among accessions of C. palidinervia from five different locations in Sarawak.
Transcript of Ecology and DNA fingerprinting of Cryptocoryne pallidinervia Engler (Araceae) accessions using...

ECOLOGY AND DNA FINGERPRINTING OF CRYPTOCORYNE PALLIDINERVIA ENGLER 21Malays. Appl. Biol. (2007) 36(2): 21–31
* To whom correspondence should be addressed.
ECOLOGY AND DNA FINGERPRINTING OF CRYPTOCORYNEPALLIDINERVIA ENGLER (ARACEAE) ACCESSIONS USING
POLYMERASE CHAIN REACTION M13 UNIVERSAL PRIMER
I.B. IPOR1, W.S. HO, C.S. TAWAN, M.S. SALMIZANA and M. NORYATIMAH
Faculty of Resource Science & TechnologyUniversity Malaysia Sarawak
94300 Kota Samarahan, SarawakMalaysia
1E-mail: [email protected]
ABSTRACT
The ecological study of Cryptocoryne pallidinervia Engler was conducted at three different locations vis. Sungai Keranji(Lundu), Sungai Batu (Triso, Sri Aman) and Lingga Peat Swamp Forest Reserve (Lingga, Sri Aman).The studycomprised of morphological characteristics, growth pattern and biomass allocation of C. pallidinervia, forest structureand edaphic conditions of the location of C. pallidinervia were carried out. The total dry weight (g/m2), plant density,total leaves per m2, total leaf area (cm2/m2), leaf area ratio (cm2/g), specific leaf area (cm2/g), leaf weight ratio (g/g),petiole weight ratio (g/g) and root weight ratio (g/g) varied between localities. Genomic DNA of 18 accessions wasamplified with the M13 universal primer (5’- TTATGAAACGACGGCCAGT-3’). A total of 18 distinctive PCRpatterns were obtained which composed of 3 to 20 bands with the size ranging from 500bp to 3kb. The PCR profilewas further analyzed to establish genetic diversity between through the construction of dendrogram. Cluster analysisof genetic relatedness had divided the C. pallidinervia accessions into four different major clusters. All big leafaccessions were grouped together whereas the small leaf accessions can be found in all clusters. Besides that, Bintuluaccessions were highly differentiated among the others since they grouped together in different clusters. This indicatesthat the PCR method with M13 universal primer is a rapid and reliable method to study genetic relatedness of C.pallidinervia accessions from different locations.
Key words: Araceae, morphological characters, DNA fingerprinting
INTRODUCTION
Cryptocoryne (Araceae) has for many years beengiven attention because of their value as aquariumplants (Rataj and Horeman, 1977). They arecommon fresh water aquatic plant. According toMansor (1991), Bastmeijer (2005) and de Wit(1990), most of the species of Cryptocoryne areexploited for the aquarium industry in theinternational aquarium market. Fourteen speciesof Cryptocoryne have been recognized fromBorneo and one of them being Cryptocorynepallidinervia Engler. It is a plant of lowlandforests where it grows in slow running rivers andstreams and seasonally inundated forest poolsunder extremely acid conditions with around pH4or so. This species is endemic to Borneo that isin the peat swamp forests of Sarawak and West
Kalimantan. To date, in Sarawak, it can be foundin Kampung Keranji in Lundu, Lingga PeatSwamp Forest Reserve and Sungai Batu,Kampung Teriso in Sri Aman, Sungai Ayang,Dalat in Mukah, and near Kemena Waterfall inBintulu (Figure 1). C. pallidinervia is characterizedby the cordate, more or less bullate leaves asillustrated in Figure 2. The spathe has a long tubeand the limb is red with protuberances. Its collarzone is yellowish with small red spots that becomesmaller towards the throat. The spadix has themale and female flowers with very short nakedpart of spadix, situated adjacent to each other.The kettle is black purple inside. The presentstudy is to determine the ecology and geneticrelatedness among accessions of C. palidinerviafrom five different locations in Sarawak.
21 - 31 I B Ipor.pmd 3/27/2008, 3:38 PM21

22 ECOLOGY AND DNA FINGERPRINTING OF CRYPTOCORYNE PALLIDINERVIA ENGLER
Fig. 1. Five areas of C. pallidinervia natural habitat in Sarawak.
Fig. 2. Morphological characteristics of spathe, leaves and habitats of C. Pallidinervia collected in thestudy area. (a) Kampung Keranji, Lundu; (b) Lingga, Sri Aman; (c) Kampung Teriso, Sri Aman; (d)Sungai Ayang, Dalat, Mukah.
(a)
(b)
(c)
(d)
21 - 31 I B Ipor.pmd 3/27/2008, 3:38 PM22
ECOLOGY AND DNA FINGERPRINTING OF CRYPTOCORYNE PALLIDINERVIA ENGLER 23
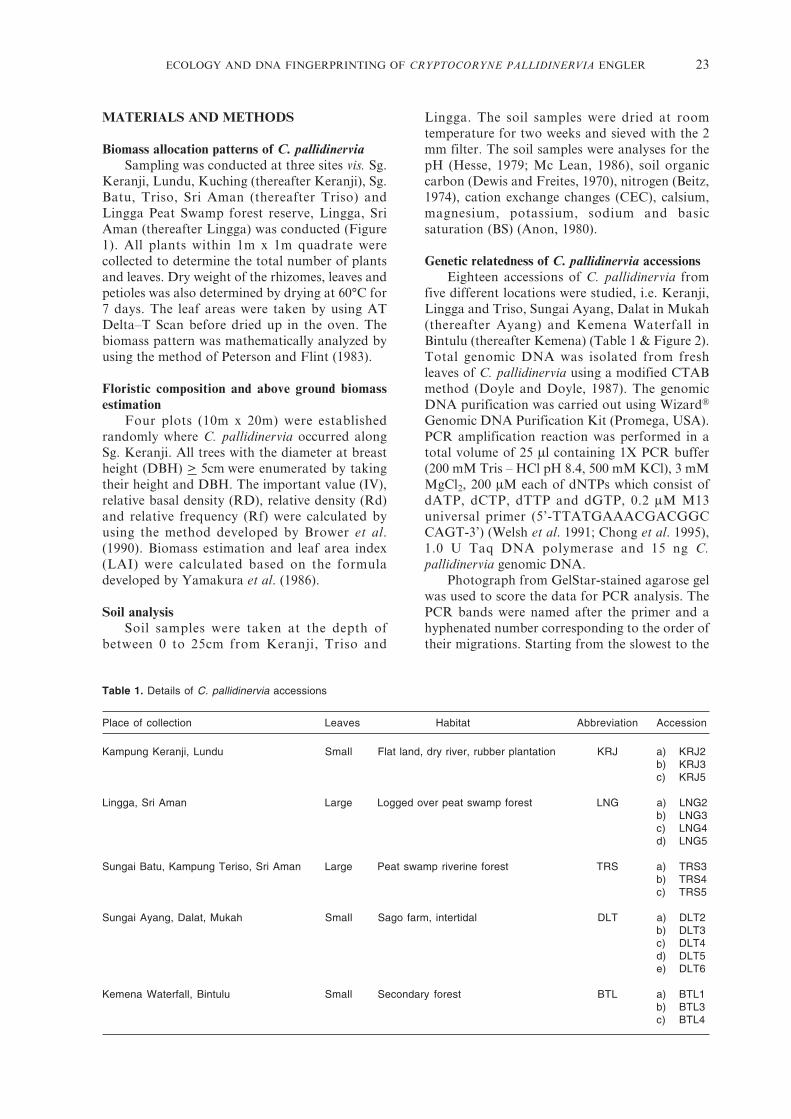
MATERIALS AND METHODS
Biomass allocation patterns of C. pallidinerviaSampling was conducted at three sites vis. Sg.
Keranji, Lundu, Kuching (thereafter Keranji), Sg.Batu, Triso, Sri Aman (thereafter Triso) andLingga Peat Swamp forest reserve, Lingga, SriAman (thereafter Lingga) was conducted (Figure1). All plants within 1m x 1m quadrate werecollected to determine the total number of plantsand leaves. Dry weight of the rhizomes, leaves andpetioles was also determined by drying at 60°C for7 days. The leaf areas were taken by using ATDelta–T Scan before dried up in the oven. Thebiomass pattern was mathematically analyzed byusing the method of Peterson and Flint (1983).
Floristic composition and above ground biomassestimation
Four plots (10m x 20m) were establishedrandomly where C. pallidinervia occurred alongSg. Keranji. All trees with the diameter at breastheight (DBH) > 5cm were enumerated by takingtheir height and DBH. The important value (IV),relative basal density (RD), relative density (Rd)and relative frequency (Rf) were calculated byusing the method developed by Brower et al.(1990). Biomass estimation and leaf area index(LAI) were calculated based on the formuladeveloped by Yamakura et al. (1986).
Soil analysisSoil samples were taken at the depth of
between 0 to 25cm from Keranji, Triso and
Lingga. The soil samples were dried at roomtemperature for two weeks and sieved with the 2mm filter. The soil samples were analyses for thepH (Hesse, 1979; Mc Lean, 1986), soil organiccarbon (Dewis and Freites, 1970), nitrogen (Beitz,1974), cation exchange changes (CEC), calsium,magnesium, potassium, sodium and basicsaturation (BS) (Anon, 1980).
Genetic relatedness of C. pallidinervia accessionsEighteen accessions of C. pallidinervia from
five different locations were studied, i.e. Keranji,Lingga and Triso, Sungai Ayang, Dalat in Mukah(thereafter Ayang) and Kemena Waterfall inBintulu (thereafter Kemena) (Table 1 & Figure 2).Total genomic DNA was isolated from freshleaves of C. pallidinervia using a modified CTABmethod (Doyle and Doyle, 1987). The genomicDNA purification was carried out using Wizard®
Genomic DNA Purification Kit (Promega, USA).PCR amplification reaction was performed in atotal volume of 25 μl containing 1X PCR buffer(200 mM Tris – HCl pH 8.4, 500 mM KCl), 3 mMMgCl2, 200 μM each of dNTPs which consist ofdATP, dCTP, dTTP and dGTP, 0.2 μM M13universal primer (5’-TTATGAAACGACGGCCAGT-3’) (Welsh et al. 1991; Chong et al. 1995),1.0 U Taq DNA polymerase and 15 ng C.pallidinervia genomic DNA.
Photograph from GelStar-stained agarose gelwas used to score the data for PCR analysis. ThePCR bands were named after the primer and ahyphenated number corresponding to the order oftheir migrations. Starting from the slowest to the
Table 1. Details of C. pallidinervia accessions
Place of collection Leaves Habitat Abbreviation Accession
Kampung Keranji, Lundu Small Flat land, dry river, rubber plantation KRJ a) KRJ2b) KRJ3c) KRJ5
Lingga, Sri Aman Large Logged over peat swamp forest LNG a) LNG2b) LNG3c) LNG4d) LNG5
Sungai Batu, Kampung Teriso, Sri Aman Large Peat swamp riverine forest TRS a) TRS3b) TRS4c) TRS5
Sungai Ayang, Dalat, Mukah Small Sago farm, intertidal DLT a) DLT2b) DLT3c) DLT4d) DLT5e) DLT6
Kemena Waterfall, Bintulu Small Secondary forest BTL a) BTL1b) BTL3c) BTL4
21 - 31 I B Ipor.pmd 3/27/2008, 3:38 PM23

24 ECOLOGY AND DNA FINGERPRINTING OF CRYPTOCORYNE PALLIDINERVIA ENGLER
fastest migrating fragment, the PCR amplifiedbands were designated as M13-01, M13-02, M13-03 and so on. The presence of a band was scoredas 1 and absence was scored as 0, based on theseveral criteria which are each locus was assumedas independent or non–allelic, there is no bias inscoring monomorphic fragments versus poly-morphic fragments and only fragments in therange of 500bp to 3kb are considered in order toincrease the data reliability. The data wasanalyzed using the NTSYpc (Version 2.2)software (Rohif, 1998). The data was quantifiedby the similarity index, Jij = Cij / (ni + nj – Cij)(Jaccard, 1908), where Jij is the number of bandscommon to individuals i and j, ni is the numberof bands in individual i and nj is the number ofbands in individual j. A dendrogram wasgenerated using the Unweighted Pair–GroupMethod with Arithmetical Averaging (UPGMA)as described by Sneath and Sokal (1973).
RESULTS AND DISCUSSION
Biomass allocation of C. pallidinerviaTotal dry weight of C. pallidinervia in 1m x
1m quadrate at Keranji was 69.9g while 60.0g forTriso and Lingga with 88.26 g (Figure 3a). Theselocations had 260 plants, 150 plants and 343plants respectively (Figure 3b). Lingga peatswamp forest reserve is presently utilized ascatchment area for water intake to supply treatedwater to the major part of Lingga. The establishedlogged over forest has no significant ecologicaldisturbance with regards to the pristine condition.The luxuriant growth of C. pallidinervia isprobably influenced by the sufficient penetrationof available light through wide openings of forestgaps. The total number of leaves was the highestat Triso (734 total leaf/m2), followed by Lingga(521 total leaf/m2) and Keranji (379 total leaf/m2)(Figure 3c). The plants at Triso were generallycomprised of smaller leaves probably as a resultof regular exposure of plants to direct sunlightthat mainly caused by severe deforestation of thestudy site. Total leaf area of C. pallidinervia in 1mx 1m quadrate at Keranji was 38502cm2 (leaf areaindex of 3.85 cm2/cm2) while at Triso was 9954cm2
(leaf area index of 0.99 cm2/cm2) and at Linggawas 10707cm2 (leaf area index of 1.07 cm2/cm2)(Figure 3d). The plants at Triso had smaller leavesand the plants were more condensed due to theiroccurrence was within freshwater intertidal zone.The habitat in Triso is considerably disturbed dueto illegal logging activities and indiscriminateclearing of riverine forest. The immediate openingof the canopy and strong water currentparticularly during high tide and raining season
probably influenced the growth performance of C.pallidinervia. The leaves of C. pallidinervia werelonger in deep water. The same trend wasobserved by Ipor et al. (2005) for C. striolata inSungai Stuum, Lundu. This phenomenon may bedue to the direct interaction to availability ofsunlight. The leaf dry weight was 20.15g, 17.3gand 22.6g at Keranji, Triso and Linggarespectively. The weight of leaf petioles at Keranjiwas 11.94g while at Sg.Triso was 11.77g andLingga with 19.91g.The dry weight of roots andrhizomes at Keranji was 37.84g, 30.98g at Trisoand 45.75g at Lingga (Figure 3e). The resultrevealed that the highest dry weight of leaves,leaves petioles and root and rhizomes was atLingga.
The leaf area ratio (LAR) of C. pallidinerviafor Sg.Keranji was significantly higher than thosein Triso and Lingga. There was no significantdifference of the leaf area ratio for Triso andLingga (Figure 4a). It was obvious that theoccurrence of C. pallidinervia was at the deeperlevel from the surface water. The water flow atTriso was swifted and the water level will risewhen it is rain. According to Tootil (1984), a lotof aquatic and semi aquatic plant had heterophiliccharacteristic whereby, they have more than onetype of morphological and functions. Leaves indeeper water adapted to current resistance whilethose on water surface have broad lamina as tomaintain it floating. The specific leaf area (SLA)was highest at Keranji with 1910 followed byTriso with 575 and Lingga with 474. The specificleaf area for Keranji was significantly higher thanthose in Triso and Lingga. Hence there was nosignificant difference of specific leaf area in Trisoand Lingga (Figure 4b). The leaf weight ratio(LWR) between Keranji, Triso and Lingga wassignificantly differed (Figure 4c). The leaf weightratio at Keranji was 0.35, Triso 0.41 and Lingga0.07 (Figure 4c).
The petiole weight ratio (PWR) was highestat Lingga with 0.25 followed by Triso and Keranji(Figure 4d). The petiole weight ratio between theselocations had no significant difference. Hence,there are no differences among all of the locations.The root/rhizome weight ratio (RWR) was highestat Keranji (0.45) followed by Lingga (0.40) andTriso with 0.39 (Figure 4c). The root/rhizomeweight ratio in these locations had no significantdifference.
Floristic composition of secondary forest at Kg.Keranji, Lundu
The surrounding structure of Keranji was asecondary forest after the shifting cultivationactivities that had been carried out by thevillagers. The forest was mainly comprised of
21 - 31 I B Ipor.pmd 3/27/2008, 3:38 PM24

ECOLOGY AND DNA FINGERPRINTING OF CRYPTOCORYNE PALLIDINERVIA ENGLER 25
Fig. 3. Comparison of vegetative parts of C. pallidinervia from: Keranji = Keranji, Lundu, Triso = Triso, Sri Amanand Lingga = Lingga, Sri Aman (3a=Total dry weight (g/m2); 3b= Total plants/m2; 3c= Total leaves/m2; 3d= Totalleaf area cm2/m2; 2e= Dry weight (g/m2). Figure 3a, 3b, 3c, 3d and 3e (within cluster), values sharing the same letterhave no significant difference at the 5% level.
rubber farm intercropped with local fruit trees andnuts such as Durio zibethinus (durian) and Shoreamacrophylla (engkabang). According to Mansor(1994) rivers that are situated along or in rubberplantations can be the best medium forCryptocoryne growing when we are dealing withcultivated areas. Hence, the environment in thisarea can support the growth of C. pallidinerviavery well. The canopy from the surroundings trees
also gives a great protection for the growth of C.pallidinervia. Jacobsen (1985) reported thatCryptocoryne could grow well under a thickcanopy.
A total of 101 individuals comprising of 23tree species were recorded at Keranji in 4 plots of10 m x 20 m in size. Five dominant species in thisforest were Hevea brasiliensis, Shorea macrophylla,Sandoricum borneense, Kibessia gracilis and
21 - 31 I B Ipor.pmd 3/27/2008, 3:38 PM25

26 ECOLOGY AND DNA FINGERPRINTING OF CRYPTOCORYNE PALLIDINERVIA ENGLER
Fig. 4. Comparison of biomass allocations of C. pallidinervia from: Keranji = Sg Keranji (Lundu), Triso = Triso(Sri Aman) and Lingga = Lingga (Sri Aman), (4a= Leaf area ratio (cm2/g); 4b= Specific leaf area (cm2); 4c= Leafweight ratio (g/g); 4d= Petiole weight ratio (g/g); 3e=Root/rhizome weight ratio (g/g). Vertical bars are values ofstandard error.
Shorea myrionerva. H. brasiliensis contributed tothe highest value of important value (IV= 75.45)(Table 2). It was followed by S. macrophylla (IV=63.81), S. borneense (IV=18.42), K. gracilis(IV=17.72) and S. myrionerva (IV= 15.50) (Table2). The relative density (Rd= 24.75), relativefrequency (Rf= 8.89) and relative dominance(RD= 41.81) of H. brasiliensis also contributed tothe highest important value (IV). The occurrenceof rubber farm hardly influenced the existence of
the aquatic plant as it provides thick shadecondition. The least dominant species wereBaccaurea bracteata with the important value,IV= 3.23, Timonius havescens (IV= 3.23) andElaocarpus griffithii (IV= 3.22). The relativedensity (Rd) of B. bracteate, T. havescens and E.griffithii was 0.99 each. The relative frequency(Rf) of each of them was also the same or 2.2.
The total above ground biomass (TAGB)from 4 plots of 20 m x 10 m was 5129.68 kg or
21 - 31 I B Ipor.pmd 3/27/2008, 3:39 PM26

ECOLOGY AND DNA FINGERPRINTING OF CRYPTOCORYNE PALLIDINERVIA ENGLER 27
64.12 ton/ha (Table 2). S. myrionerva (1129.54kg)contributed to the highest above ground biomassin the location. It was followed by S. macrophyllawith 672.20kg and Eugenia palembanica with650.94 kg. E. griffithii with 10.63 kg contributedthe least above ground biomass.
Soil characteristicsThe soil test revealed that Keranji had a pH
of 4.4 with 0.33% of nitrogen (N) content (Table3). The total organic carbon was 6.63% while theexchange of calcium (Ca), magnesium (Mg),potassium (K) and sodium (Na) was 1.04 +cmol/
kg, 0.31 +cmol/kg, 0.12 +cmol/kg and 0.11 +cmol/kg respectively. The cation exchange capacity(CEC) in the study site was 7.88 +cmol/kg whilethe percentage of clay was 4.03% with 5.20% ofsilt. The finest soil was 53.63% whilst the coarsecomponent was 36.58%. Base saturation (BS)value was 20.05.
The pH of soil at Triso was 3.3 with anitrogen (N) content of 1.63% (Table 3). The totalorganic carbon was 45.06% and the highest in thisstudy. The content of Ca, Mg, K, and Na was1.83 +cmol/kg, 5.42 +cmol/kg, 0.62 +cmol/kg and0.80 +cmol/kg respectively. The cation exchange
Table 2. Relative density (Rd), relative frequency (Rf), relative dominance (RD), important value (IV) and estimated totalabove ground biomass (TAGB) of trees with DBH > 5cm from the secondary forest at Keranji
SPECIES Rd Rf RD IV TAGB (kg)
Hevea brasiliensis (Willd. ex A. Juss.) Muell. Arg. 24.75 8.89 41.81 75.45 164.11
Shorea macrophylla (de Vr.) Ashton 13.86 8.89 41.06 63.81 672.20
Sandoricum borneense Miq. 6.93 8.89 2.60 18.42 120.61
Kibessia gracilis Cogn. 6.93 8.89 1.91 17.72 81.80
Shorea myrionerva Symington ex P.S. Ashton 3.96 6.67 4.88 15.50 1129.54
Callophyllum soulattri Burm. 5.94 4.44 1.49 11.87 101.34
Macaranga triloba (Bl.) M. A. 2.97 6.67 0.62 10.25 158.29
Eugenia arcuatinerva Merr. 3.96 4.44 1.53 9.93 256.06
Eugenia subsessilifolia Merr. 3.96 4.44 0.34 8.74 25.81
Baccaurea macrocarpa (Miq.) Mull. Arg. 4.95 2.22 0.47 7.64 20.49
Melastoma imbricatum Wall. Ex C. B. Clarke 2.97 4.44 0.14 7.56 22.86
Artocarpus rigidus Blume 2.97 2.22 1.79 6.98 629.37
Artocarpus integer (Thunb.) Merr. 1.98 4.44 0.53 6.95 316.98
Durio zibethinus Murray 3.96 2.22 0.32 6.50 32.31
Vitex pubescen Vahl 1.98 4.44 0.08 6.50 137.90
Eugenia palembanica (Miq.) Merr. 0.99 2.22 0.18 3.39 650.94
Dillenia eximia Miq. 0.99 2.22 0.08 3.30 324.47
Blumeodendron tokbraii (Bl.) J. J. Smith 0.99 2.22 0.07 3.28 142.72
Artocarpus anisophyllus Miq. 0.99 2.22 0.05 3.26 53.82
Mangifera maingayi Hk. f. 0.99 2.22 0.03 3.24 34.75
Baccaurea bracteata M. A. 0.99 2.22 0.02 3.23 21.34
Timonius flavescens (Jack) Baker 0.99 2.22 0.02 3.23 21.34
Elaeocarpus griffithii (Wight) A. Gray 0.99 2.22 0.01 3.22 10.63
5129.68 or64.12 ton/ha
Table 3. The soil characteristics from the study site of Keranji, Triso and Lingga
Exchange Mechanical analysisTotal (+cmol/kg)
CEC hyrometer (%)
BS
Location pH N (%) organiccarbon Ca Mg K Na Clay Silt Fine Coarse
Keranji 4.4 0.33 06.63 1.04 0.31 0.12 0.11 07.88 04.03 05.76 53.63 36.58 20.05
Batu Triso 3.3 1.63 45.06 1.83 5.42 0.62 0.80 22.83 10.73 03.15 77.29 08.83 37.98
Lingga 4.1 0.28 04.58 2.08 5.36 0.28 0.51 13.33 36.80 50.45 08.25 04.51 61.74
N = Nitrogen, CEC = Cation exchange capacity, BS = Base saturation.
21 - 31 I B Ipor.pmd 3/27/2008, 3:39 PM27

28 ECOLOGY AND DNA FINGERPRINTING OF CRYPTOCORYNE PALLIDINERVIA ENGLER
capacity (CEC) in the location was 22.83 +cmol/kg. The percentage of clay was 10.73% with 3.15%of silt. The finest soil was 77.29% and the coursesoil was 8.83% with base saturation (BS) of 37.98.Lingga soil had pH of 4.1 with nitrogen contentof 0.28%. The percentage of the total organiccarbon was 4.58%, Ca, Mg, K and Na were 2.08+cmol/kg, 5.36 +cmol/kg, 1.28 +cmol/kg, and 0.51+cmol/kg respectively (Table 3). The cationexchange capacity (CEC) was 13.33 +cmol/kg asthere was 36.80% of clay, 50.45 % of silt, 8.25%of finest soil and 4.51% coarse soil in the studysite. The base saturation value was 61.74.
Genetic relatedness of C. pallidinervia accessionsTotal genomic DNA of C. pallidinervia
accessions collected from five different locationsin Sarawak, namely Keranji, Lingga, Teriso,Ayang and Kemena was extracted using themodified CTAB miniprep DNA extractionmethod (Doyle and Doyle, 1987) together with
Wizard® Genomic DNA Purification Kit method.Ahigh degree of polymorphism was detectedamong the was used to extract the genomic DNAof 18 C. pallidinervia accessions collected from fivedifferent locations in Sarawak namely Keranji,Lingga, Teriso, Ayang and Kemena. The resultshowed that a high degree of polymorphismamong the C. pallidinervia using the M13universal primer. A total of 18 distinctive PCRprofiles were observed in this study whichcomposed of molecular weight ranging from500bp to 3kb. Although most of the C.pallidinervia accessions showed a high degree ofpolymorphisms, but two accessions, DLT4 andDLT6 produced identical banding profiles.
There were several accessions with one ormore unique band(s) and these bands were usefulin differentiating the C. pallidinervia accessions inthe present study (Figure 5). For example, locusM13–07 was specific to accession TRS4, locusM13–14 was specific to accession TRS5, locus
Fig. 5. DNA profiles of 18 C. pallidinervia accessions collected from 5 different locations in Sarawak, namely Keranji(KRJ), Lingga (LNG), Teriso (TRS), Ayang (DLT) and Kemena (BTL) generated by using M13 universal primer.
21 - 31 I B Ipor.pmd 3/27/2008, 3:39 PM28

ECOLOGY AND DNA FINGERPRINTING OF CRYPTOCORYNE PALLIDINERVIA ENGLER 29
M13-21 was specific to accession LNG4, locusM13–24 was specific to accession DLT3, andlocus M13–27 was specific to accession BTL4(Figure 5). Three bands (locus M13–25, locusM13–29 and locus M13–30) were found in allaccessions except accession BTL1. besides that,different presence and absence behaviors of theremaingin bands were also useful in differentiatingthe samples within accessions (Chong et al. 1995).For example, accessions KRJ2 and KRJ5 couldbe discriminated from the other accessions at
locus M13–33 as well as accessions TRS4 andDLT2, which differed at locus M13–06.
The constructed dendogram based on Jaccardsimilarity matrix had grouped C. pallidinerviaaccessions into 4 major clusters (Figure 6). Cluster1 contained three accessions from Keranji andLingga with average value of J = 0.82. Thegreatest value was observed between accessionKRJ5 and LNG2 with J = 0.70. The smallestvalue of J = 0.52 within this cluster was observedbetween accessions KRJ2 and LNG2. The genetic
Fig. 6. Dendrogram representing the genetic relatedness among the C. pallidinerviaAccessions. KRJ = Keranji, LNG = Lingga, TRS = Teriso, DLT = Dalat, BLT = Bintulu.
21 - 31 I B Ipor.pmd 3/27/2008, 3:39 PM29
30 ECOLOGY AND DNA FINGERPRINTING OF CRYPTOCORYNE PALLIDINERVIA ENGLER
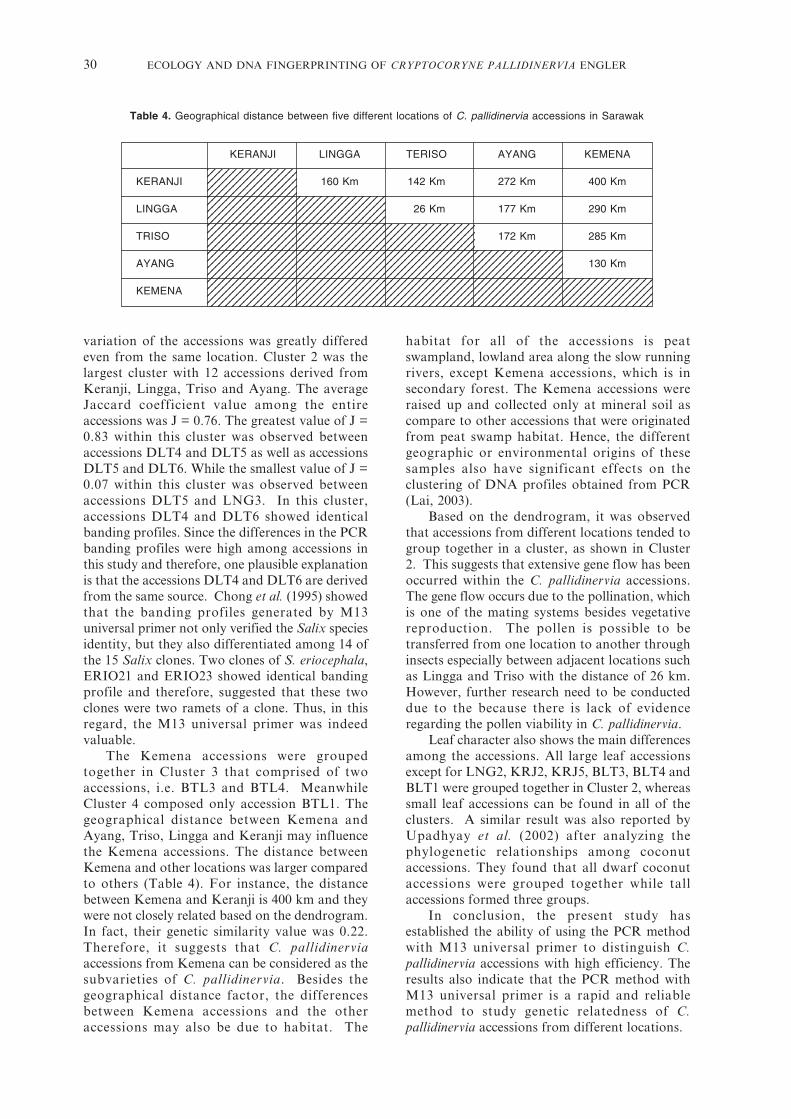
variation of the accessions was greatly differedeven from the same location. Cluster 2 was thelargest cluster with 12 accessions derived fromKeranji, Lingga, Triso and Ayang. The averageJaccard coefficient value among the entireaccessions was J = 0.76. The greatest value of J =0.83 within this cluster was observed betweenaccessions DLT4 and DLT5 as well as accessionsDLT5 and DLT6. While the smallest value of J =0.07 within this cluster was observed betweenaccessions DLT5 and LNG3. In this cluster,accessions DLT4 and DLT6 showed identicalbanding profiles. Since the differences in the PCRbanding profiles were high among accessions inthis study and therefore, one plausible explanationis that the accessions DLT4 and DLT6 are derivedfrom the same source. Chong et al. (1995) showedthat the banding profiles generated by M13universal primer not only verified the Salix speciesidentity, but they also differentiated among 14 ofthe 15 Salix clones. Two clones of S. eriocephala,ERIO21 and ERIO23 showed identical bandingprofile and therefore, suggested that these twoclones were two ramets of a clone. Thus, in thisregard, the M13 universal primer was indeedvaluable.
The Kemena accessions were groupedtogether in Cluster 3 that comprised of twoaccessions, i.e. BTL3 and BTL4. MeanwhileCluster 4 composed only accession BTL1. Thegeographical distance between Kemena andAyang, Triso, Lingga and Keranji may influencethe Kemena accessions. The distance betweenKemena and other locations was larger comparedto others (Table 4). For instance, the distancebetween Kemena and Keranji is 400 km and theywere not closely related based on the dendrogram.In fact, their genetic similarity value was 0.22.Therefore, it suggests that C. pallidinerviaaccessions from Kemena can be considered as thesubvarieties of C. pallidinervia. Besides thegeographical distance factor, the differencesbetween Kemena accessions and the otheraccessions may also be due to habitat. The
habitat for all of the accessions is peatswampland, lowland area along the slow runningrivers, except Kemena accessions, which is insecondary forest. The Kemena accessions wereraised up and collected only at mineral soil ascompare to other accessions that were originatedfrom peat swamp habitat. Hence, the differentgeographic or environmental origins of thesesamples also have significant effects on theclustering of DNA profiles obtained from PCR(Lai, 2003).
Based on the dendrogram, it was observedthat accessions from different locations tended togroup together in a cluster, as shown in Cluster2. This suggests that extensive gene flow has beenoccurred within the C. pallidinervia accessions.The gene flow occurs due to the pollination, whichis one of the mating systems besides vegetativereproduction. The pollen is possible to betransferred from one location to another throughinsects especially between adjacent locations suchas Lingga and Triso with the distance of 26 km.However, further research need to be conducteddue to the because there is lack of evidenceregarding the pollen viability in C. pallidinervia.
Leaf character also shows the main differencesamong the accessions. All large leaf accessionsexcept for LNG2, KRJ2, KRJ5, BLT3, BLT4 andBLT1 were grouped together in Cluster 2, whereassmall leaf accessions can be found in all of theclusters. A similar result was also reported byUpadhyay et al. (2002) after analyzing thephylogenetic relationships among coconutaccessions. They found that all dwarf coconutaccessions were grouped together while tallaccessions formed three groups.
In conclusion, the present study hasestablished the ability of using the PCR methodwith M13 universal primer to distinguish C.pallidinervia accessions with high efficiency. Theresults also indicate that the PCR method withM13 universal primer is a rapid and reliablemethod to study genetic relatedness of C.pallidinervia accessions from different locations.
123456789012341234567890123412345678901234123456789012341234567890123412345678901234123456789012341234567890123412345678901234123456789012341234567890123412345678901234123456789012341234567890123412345678901234123456789012341234567890123412345678901234123456789012341234567890123412345678901234
1234567890123412345678901234123456789012341234567890123412345678901234123456789012341234567890123412345678901234123456789012341234567890123412345678901234123456789012341234567890123412345678901234123456789012341234567890123412345678901234
1234567890123123456789012312345678901231234567890123123456789012312345678901231234567890123123456789012312345678901231234567890123123456789012312345678901231234567890123
123456789012341234567890123412345678901234123456789012341234567890123412345678901234123456789012341234567890123412345678901234
1234567890123412345678901234123456789012341234567890123412345678901234
Table 4. Geographical distance between five different locations of C. pallidinervia accessions in Sarawak
KERANJI LINGGA TERISO AYANG KEMENA
KERANJI 160 Km 142 Km 272 Km 400 Km
LINGGA 026 Km 177 Km 290 Km
TRISO 172 Km 285 Km
AYANG 130 Km
KEMENA
21 - 31 I B Ipor.pmd 3/27/2008, 3:39 PM30

ECOLOGY AND DNA FINGERPRINTING OF CRYPTOCORYNE PALLIDINERVIA ENGLER 31
REFERENCES
Anon. 1980. Malaysian Standard MS 678 Part. Ito V. Recommended Methods for SoilChemical Analysis.
Bastmeijer, J.D. 2005. The Crypts pages. http://132. 229. 93. 11/Cryptocoryne/index. Html.
Beitz, J.A. 1974. Micro-kjedahl digestion by animproved automated ammonia determinationfollowing manual digestion. AnalyticalChemistry, 46: 1617-1618.
Brower, J.E., Zar, H.H. & Ende, C.N. 1990. Fieldand laboratory methods for general ecology.3rd ed. Brown Publisher, USA, pp. 237.
Chong, D.K.X., Yeh, F.C., Aravanopoulos, F.A.& Zsuffa, L. 1995. DNA fingerprintingWillows (Salix L.) using polymerase chainreaction with the M13 universal primer.Scandinavian Journal of Forest Research, 10:27-31.
Dewis, J. & Freites. 1970. Physical and chemicalmethods of soil and water analysis. SoilBulletin No. 10, Food and AgricultureOrganization of the United Nations, Rome.73-77 pp.
Doyle, J.J. & Doyle, J.L. 1987. A rapid DNAisolation procedure for small quantities offresh leaf tissue. Phytochem. Bull., 19: 11–15.
Hense, P.R. 1979. A Textbook of Soil ChemicalAnalysis. Murray. 204-252 pp.
Ipor, I.B., Tawan, C.S. & Jacobsens, N. 2005. Anew species of Cryptocoryne (Araceae) fromSarawak Garden Bulletin Singapore, 57: 1 - 6.
Jacobsen, N. 1985. The Cryptocoryne (Araceae) ofBorneo. Nordic Journal of Botany, 5: 31-50.
Jaccard, P. 1908. Nouvelles rescherches sur ladistribution florale. Bull. Soc. Vaud. Sci. Nat.,44: 223-270.
Lai, L.S. 2003. The use of random amplifiedpolymorphic DNA (RAPD) to studyEschericia coli isolated from beef. BSc thesis,Faculty Resource Science & Technology.Universiti Malaysia Sarawak.
Mansor, M. 1991. Culture and reproduction offreshwater aquarium plants in Malaysia. InDawes, J.A. (Ed). Aquarama ProceedingVol.1. Academic Association Pte Ltd,Malaysia. pp 89-96.
Mansor, M. 1994. Kemandirian beberapa spesiesCryptocoryne yang endemik dari sungai-sungai Malaysia. Dalam Rohani A; AminahA; Mohd K.A; dan S. Fatimah Al Junied(Ed.) Kumpulan Kertas Kerja 27 UKMKesatuan Dalam Kepelbagaian PenyelidikanBiologi. UKM Bangi. pp. 412 - 417.
McLean, E.O. 1986. Soil pH and LimeRequirement In Page, A.L. et al. (Eds.)Method of soil analysis, Part 2. 2nd Ed. Am.Soc. of Agronomy, Madison. pp. 199-208.
Peterson, D.T. & Flint, E.P. 1983. Comparativewater relation, photosynthesis and growth ofsoybean (Glycine max) and seven associatedweed. Weed Sci., 31: 318-322.
Rataj, K.J. & Horeman, T.J. 1977. AquariumPlants. T.F.H. Publications, Inc., NeptuneCity, NJ, 448 pp.
Sneath, P.H.A. & Sokal, R.R. 1973. NumericalTaxonomy. San Francisco : W.H. Freeman &Co. 573 pp.
Tootil, E. 1984. The Panguin Dictionary ofBotany, Panguin Group, England, 390 pp.
Upadhyay, A., Jose, J., Manimekalai, R. &Parthasarathy, V.A. 2002. Molecular analysisof phylogenetic relationships among coconutaccessions. In Engels, J.M.M., RamanathaRao, V., Brown, A.H.D & Jackson, M.T.(Eds). Managing Plant Genetic DiversityIPGRI: CABI. pp 61-66.
Welsh, J., Honeycutt, R.J., McClelland, M. &Sobral, B.W.S. 1991. Parentage determinationin maize hybrids using arbitrary primedpolymerase chain reaction (AP–PCR). Theor.Appl. Genet., 82: 473–476.
de Wit, H.C.D. 1990. Aquariempflanren. 2 ed.Ulmer Verlag, Stuggart.
Yamakura, T, Hagihara, A., Sukardjo, S. &Ogawa, H. 1986. Aboveground biomass oftropical rain forest stands in IndonesianBorneo. Vegitatio, 68: 71-82.
21 - 31 I B Ipor.pmd 3/27/2008, 3:39 PM31