Ecological niche modelling as an exploratory tool for identifying species limits: an example based...
12
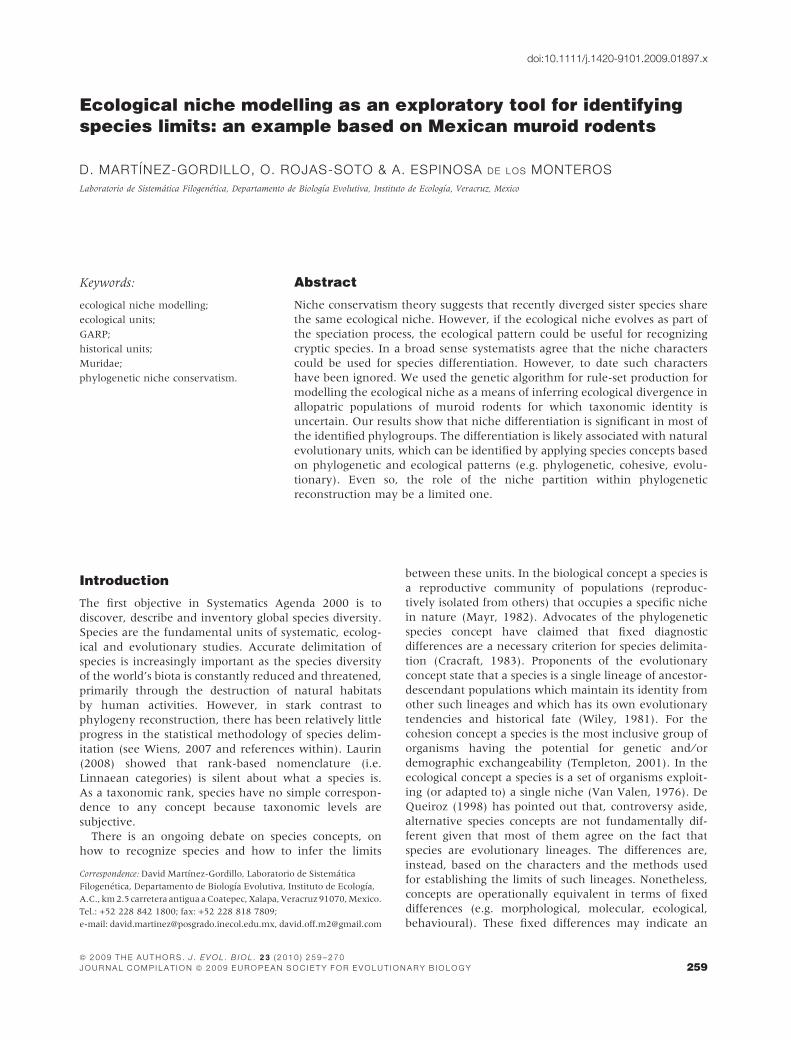
Ecological niche modelling as an exploratory tool for identifying species limits: an example based on Mexican muroid rodents D. MARTI ´ NEZ-GORDILLO, O. ROJAS-SOTO & A. ESPINOSA DE LOS MONTEROS Laboratorio de Sistema ´tica Filogene ´tica, Departamento de Biologı´a Evolutiva, Instituto de Ecologı´a, Veracruz, Mexico Introduction The first objective in Systematics Agenda 2000 is to discover, describe and inventory global species diversity. Species are the fundamental units of systematic, ecolog- ical and evolutionary studies. Accurate delimitation of species is increasingly important as the species diversity of the world’s biota is constantly reduced and threatened, primarily through the destruction of natural habitats by human activities. However, in stark contrast to phylogeny reconstruction, there has been relatively little progress in the statistical methodology of species delim- itation (see Wiens, 2007 and references within). Laurin (2008) showed that rank-based nomenclature (i.e. Linnaean categories) is silent about what a species is. As a taxonomic rank, species have no simple correspon- dence to any concept because taxonomic levels are subjective. There is an ongoing debate on species concepts, on how to recognize species and how to infer the limits between these units. In the biological concept a species is a reproductive community of populations (reproduc- tively isolated from others) that occupies a specific niche in nature (Mayr, 1982). Advocates of the phylogenetic species concept have claimed that fixed diagnostic differences are a necessary criterion for species delimita- tion (Cracraft, 1983). Proponents of the evolutionary concept state that a species is a single lineage of ancestor- descendant populations which maintain its identity from other such lineages and which has its own evolutionary tendencies and historical fate (Wiley, 1981). For the cohesion concept a species is the most inclusive group of organisms having the potential for genetic and ⁄ or demographic exchangeability (Templeton, 2001). In the ecological concept a species is a set of organisms exploit- ing (or adapted to) a single niche (Van Valen, 1976). De Queiroz (1998) has pointed out that, controversy aside, alternative species concepts are not fundamentally dif- ferent given that most of them agree on the fact that species are evolutionary lineages. The differences are, instead, based on the characters and the methods used for establishing the limits of such lineages. Nonetheless, concepts are operationally equivalent in terms of fixed differences (e.g. morphological, molecular, ecological, behavioural). These fixed differences may indicate an Correspondence: David Martı´nez-Gordillo, Laboratorio de Sistema ´ tica Filogene ´tica, Departamento de Biologı´a Evolutiva, Instituto de Ecologı´a, A.C., km 2.5 carretera antigua a Coatepec, Xalapa, Veracruz 91070, Mexico. Tel.: +52 228 842 1800; fax: +52 228 818 7809; e-mail: [email protected], [email protected] ª 2009 THE AUTHORS. J. EVOL. BIOL. 23 (2010) 259–270 JOURNAL COMPILATION ª 2009 EUROPEAN SOCIETY FOR EVOLUTIONARY BIOLOGY 259 Keywords: ecological niche modelling; ecological units; GARP; historical units; Muridae; phylogenetic niche conservatism. Abstract Niche conservatism theory suggests that recently diverged sister species share the same ecological niche. However, if the ecological niche evolves as part of the speciation process, the ecological pattern could be useful for recognizing cryptic species. In a broad sense systematists agree that the niche characters could be used for species differentiation. However, to date such characters have been ignored. We used the genetic algorithm for rule-set production for modelling the ecological niche as a means of inferring ecological divergence in allopatric populations of muroid rodents for which taxonomic identity is uncertain. Our results show that niche differentiation is significant in most of the identified phylogroups. The differentiation is likely associated with natural evolutionary units, which can be identified by applying species concepts based on phylogenetic and ecological patterns (e.g. phylogenetic, cohesive, evolu- tionary). Even so, the role of the niche partition within phylogenetic reconstruction may be a limited one. doi:10.1111/j.1420-9101.2009.01897.x
-
Upload
independent -
Category
Documents
-
view
0 -
download
0
Transcript of Ecological niche modelling as an exploratory tool for identifying species limits: an example based...
Ecological niche modelling as an exploratory tool for identifyingspecies limits: an example based on Mexican muroid rodents
D. MARTINEZ-GORDILLO, O. ROJAS-SOTO & A. ESPINOSA DE LOS MONTEROS
Laboratorio de Sistematica Filogenetica, Departamento de Biologıa Evolutiva, Instituto de Ecologıa, Veracruz, Mexico
Introduction
The first objective in Systematics Agenda 2000 is to
discover, describe and inventory global species diversity.
Species are the fundamental units of systematic, ecolog-
ical and evolutionary studies. Accurate delimitation of
species is increasingly important as the species diversity
of the world’s biota is constantly reduced and threatened,
primarily through the destruction of natural habitats
by human activities. However, in stark contrast to
phylogeny reconstruction, there has been relatively little
progress in the statistical methodology of species delim-
itation (see Wiens, 2007 and references within). Laurin
(2008) showed that rank-based nomenclature (i.e.
Linnaean categories) is silent about what a species is.
As a taxonomic rank, species have no simple correspon-
dence to any concept because taxonomic levels are
subjective.
There is an ongoing debate on species concepts, on
how to recognize species and how to infer the limits
between these units. In the biological concept a species is
a reproductive community of populations (reproduc-
tively isolated from others) that occupies a specific niche
in nature (Mayr, 1982). Advocates of the phylogenetic
species concept have claimed that fixed diagnostic
differences are a necessary criterion for species delimita-
tion (Cracraft, 1983). Proponents of the evolutionary
concept state that a species is a single lineage of ancestor-
descendant populations which maintain its identity from
other such lineages and which has its own evolutionary
tendencies and historical fate (Wiley, 1981). For the
cohesion concept a species is the most inclusive group of
organisms having the potential for genetic and ⁄ or
demographic exchangeability (Templeton, 2001). In the
ecological concept a species is a set of organisms exploit-
ing (or adapted to) a single niche (Van Valen, 1976). De
Queiroz (1998) has pointed out that, controversy aside,
alternative species concepts are not fundamentally dif-
ferent given that most of them agree on the fact that
species are evolutionary lineages. The differences are,
instead, based on the characters and the methods used
for establishing the limits of such lineages. Nonetheless,
concepts are operationally equivalent in terms of fixed
differences (e.g. morphological, molecular, ecological,
behavioural). These fixed differences may indicate an
Correspondence: David Martınez-Gordillo, Laboratorio de Sistematica
Filogenetica, Departamento de Biologıa Evolutiva, Instituto de Ecologıa,
A.C., km 2.5 carretera antigua a Coatepec, Xalapa, Veracruz 91070, Mexico.
Tel.: +52 228 842 1800; fax: +52 228 818 7809;
e-mail: [email protected], [email protected]
ª 2 0 0 9 T H E A U T H O R S . J . E V O L . B I O L . 2 3 ( 2 0 1 0 ) 2 5 9 – 2 7 0
J O U R N A L C O M P I L A T I O N ª 2 0 0 9 E U R O P E A N S O C I E T Y F O R E V O L U T I O N A R Y B I O L O G Y 259
Keywords:
ecological niche modelling;
ecological units;
GARP;
historical units;
Muridae;
phylogenetic niche conservatism.
Abstract
Niche conservatism theory suggests that recently diverged sister species share
the same ecological niche. However, if the ecological niche evolves as part of
the speciation process, the ecological pattern could be useful for recognizing
cryptic species. In a broad sense systematists agree that the niche characters
could be used for species differentiation. However, to date such characters
have been ignored. We used the genetic algorithm for rule-set production for
modelling the ecological niche as a means of inferring ecological divergence in
allopatric populations of muroid rodents for which taxonomic identity is
uncertain. Our results show that niche differentiation is significant in most of
the identified phylogroups. The differentiation is likely associated with natural
evolutionary units, which can be identified by applying species concepts based
on phylogenetic and ecological patterns (e.g. phylogenetic, cohesive, evolu-
tionary). Even so, the role of the niche partition within phylogenetic
reconstruction may be a limited one.
doi:10.1111/j.1420-9101.2009.01897.x
absence of gene flow between putative taxa and the
presence of two or more distinct species (Wiens, 2007). It
appears that the challenge is obtaining enough evidence
to establish a clear demarcation in species’ limits.
One approach that has received attention is the use of
ecological niche modelling as a tool for species delimita-
tion (e.g. Graham et al., 2004b; Guisan & Thuiller, 2005;
Stockman & Bond, 2007). Niche is a term describing the
role of a species or population in its ecosystem. The
abiotic or physical environment is part of the ecological
niche because it influences how populations affect, and
are affected by, resources and other organisms. The
different dimensions of the niche include descriptions of
the organism’s life history and habitat. According to the
competitive exclusion principle, two species cannot
occupy the same ecological niche in the same environ-
ment for a long time. There are several definitions of
niche. For data analyses and discussion we followed
Grinnell’s niche concept (i.e. a niche is the set of
environmental conditions within which each species
can survive and maintain its populations without migra-
tion; Grinnell, 1917).
One evolutionary outcome of niche differentiation
among populations could be a shift in ecological charac-
ters to alternative states. Therefore, identifying consistent
differentiation patterns in characters related to the
ecological niche might provide alternative means of
recognizing putatively independent lineages. This way,
historical units could be recognized simultaneously by
differentiation patterns (Cracraft, 1983) and by ecological
processes (Templeton, 2001).
Recently, several studies have used a maximum
entropy algorithm for modelling the ecological niche,
and for making biodiversity decisions (Raxworthy et al.,
2003, 2007; Rissler & Apodaca, 2007; Stockman &
Bond, 2007; Swenson, 2008; Luxbacher & Knouft,
2009). There are currently more than 10 algorithms
for niche delimitation available [e.g. BioClim, genetic
algorithm for rule-set production (GARP), GLM,
MaxEnt, MARS; see Wisz et al., 2008]. From them,
the GARP and the maximum entropy with threshold
features (MaxEnt) are the only ones that have been
extensively used and tested. MaxEnt fits a probability
distribution for occurrence of a species to the set of
pixels across the study region. This probability is
inferred based on the values of those pixels at which
the species has been detected (Phillips et al., 2006).
GARP builds ecological niche models (ENM) based on
nonrandom associations between known occurrence
points for species and sets of digital layers representing
the ecological landscape. The occurrence points are used
for rule generation and model testing. The genetic
algorithm consists of specially defined operators (e.g.
crossover, mutation) that modify the initial rules. After
each modification, the quality of the rule is tested (to
maximize both significance and predictive accuracy),
until a limited set of best rules is retained. The final
result is a set of rules that can be projected onto a map
to produce a potential geographical distribution for the
species under investigation (Peterson et al., 2007). The
quantitative descriptors of model quality have showed
no significant differences between GARP and MaxEnt.
Nonetheless, MaxEnt is very sensitive to data bias (poor
vs. over collected points), whereas GARP does not
produce significant differences even when a minimum
number of occurrence points are used. Additionally,
MaxEnt shows a relative inability to predict into broad
unsampled regions, a condition under which GARP
performs better (Peterson et al., 2007).
Baker & Bradley (2006) concluded that over 2000
new mammal species could be recognized if all the well-
supported phylogroups were acknowledged and given
this taxonomic status. Biodiversity inventories, how-
ever, are limited by the lack of trained systematists,
economic resources and simple accurate methods.
Therefore, the evaluation of alternative methods that
allow fast, efficient approaches for assessing diversity
has become a priority. This is particularly important for
areas with a high number of endemic species. Geo-
graphical isolation, along with restricted gene flow, has
severe effects on niche changes (Graham et al., 2004b;
Wiens & Graham, 2005). This would be expected in
organisms with limited dispersal abilities, and geograph-
ical restriction that have been affected by recent climatic
fluctuations. This is the case for the mountainous
muroid rodents of Mexico (Leon-Paniagua et al.,
2007). Climate cycles during the Pleistocene may have
produced shifts in the ecological niche of their popula-
tions, thus promoting lineage differentiation (Wiens &
Graham, 2005).
The ecological niches of muroid rodents have several
traits that make these rodents suitable for the analysis of
speciation. First, they display rapid differentiation under
genetic drift or selection due to their biological traits (e.g.
high reproductive rate, short generation time, phylopa-
try, low migration rate, low tolerance to environmental
changes; Pagel et al., 1991). Second, muroid rodents have
differentiated lineages within currently recognized spe-
cies that are geographically restricted, due to low gene
flow (i.e. type I phylogenetic pattern; Avise, 2000). Third,
some of the highest speciation rates among vertebrates
have been reported for these rodents (Triant & DeWoody,
2006).
Our main objective was to assess the capacity of ENM
to identify potential independent lineages that may be
considered as different species. This was achieved by
selecting well-supported phylogroups as null hypotheses.
We then compared the congruence between the phylo-
genetic structure of these lineages, with their degree of
niche differentiation. Using ecological niche analysis
together with other data sources (molecular, cytological,
morphological, geographical, etc.) constitutes one of the
first steps towards establishing an integrative taxonomy
(Dayrat, 2005).
260 D. MART INEZ-GORDILLO ET AL.
ª 2 0 0 9 T H E A U T H O R S . J . E V O L . B I O L . 2 3 ( 2 0 1 0 ) 2 5 9 – 2 7 0
J O U R N A L C O M P I L A T I O N ª 2 0 0 9 E U R O P E A N S O C I E T Y F O R E V O L U T I O N A R Y B I O L O G Y

Methods
Taxon selection
We selected five currently recognized species of rodents
from the Muridae Family that encompass evolutionarily
distinct lineages [i.e. Baiomys musculus (Merriam, 1892),
B. taylori (Thomas, 1887), Peromyscus furvus Allen &
Chapman, 1897, P. aztecus (Saussure, 1860) and Reith-
rodontomys sumichrasti (Saussure, 1861)]. We selected
these five species based on two criteria. First, the
traditional taxonomy of these species has been
re-evaluated yielding well-supported phylogenies, which
suggest that these lineages may include subunits eligible
for species status (Fig. 1). Details on the phylogeograph-
ical analyses for these species have been published
elsewhere (Harris et al., 2000; Sullivan et al., 2000;
Amman & Bradley, 2004). Second, the distribution of
these species is one of the best known for Mexican
mammals. Locality records for the Northern pygmy
mouse (B. taylori) were obtained from Stickel & Stickel
(1949), Hart (1972), Hunsaker et al. (1959), Packard &
Judd (1968), Hall (1981), Gust & Schmidly (1986),
Killion et al. (1995) and Abuzeineh (2006). The distribu-
tion data for the other species were obtained from
Ceballos & Oliva (2005). Distribution data have been
collected since the early 1900s to the present. Collecting
points represent more than 700 reliable localities.
Voucher specimens are deposited at zoological museums
in Mexico (3) and USA (18).
The Southern pygmy mouse (B. musculus) is consid-
ered to be a species with six subspecies. Five of them
are endemic to Mexico (Hall, 1981). Amman & Bradley
(2004) recovered the phylogeographical pattern of
B. musculus and B. taylori (Fig. 1a). They concluded that
the first species is formed by two well-supported
phylogroups, one distributed along the Trans-Mexican
Volcanic Belt (phylogroup C) and the other endemic to
the south-eastern mountains of Mexico (phylogroup
D). The evidence presented by Amman & Bradley
(2004) suggests that these two phylogroups may be
different species.
With the exception of populations from the mountains
of Tamaulipas and Nuevo Leon in Mexico (referred
hereafter as TN populations), the phylogeography of
B. taylori was analysed by Amman & Bradley (2004). The
genealogy recovered two monophyletic phylogroups.
One is found in Texas (phylogroup A), whereas the
other occurs in the Sierra Madre Occidental (SMO;
phylogroup B). The TN populations are geographically
isolated from the other populations of this species. It is
possible, therefore, that these populations represent an
independent ecological unit from phylogroups A and B.
Hall (1981) considered the Blackish deer mouse (Pero-
myscus furvus) to represent a single species. This species is
endemic to the SMO in Mexico, and its populations
exhibit a discontinuous distribution. Harris et al. (2000),
however, concluded that this species encompasses three
well-supported phylogroups (Fig. 1b).
Carleton (1989) recognized the Aztec mouse (Peromys-
cus aztecus) as a single species with five subspecies.
Sullivan et al. (1997), however, concluded that this was
a species complex with at least two species (P. aztecus and
P. hylocetes). More recently, based on cytochrome-b gene
sequences Sullivan et al. (2000) identified six well-
supported phylogroups within the Aztec mouse complex
(Fig. 1c).
Sumichrast’s harvest mouse (Reithrodontomys sumichr-
asti) has been traditionally considered a single species
(Hall, 1981), but Sullivan et al. (2000) recovered six well-
supported phylogroups, which could represent indepen-
dent historical units (Fig 1d).
R. s. sumichrasti OH
R. s. luteolus E
R. s. nerterus
R. s. luteolus W
R. s. sumichrasti SMO
R. s. dorsalis
B. taylori (phylogroup A)
B. taylori (phylogroup B)
B. musculus (phylogroup C)
B. musculus (phylogroup D)
P. furvus North
P. furvus Center
P. furvus South
P. a. oaxacensis OH
P. a. evides E
P. a. evides W
P. a. aztecus SMO
P. a. hylocetes
P. a. oaxacensis
(c) (d)
(a)(b)100
100
100
100
95
98
98
64
5999
93
6697
99
100
100
100
93
9789
100
89
100
100
100
61
100
92
95
100
91
82
92
Fig. 1 Interrelationship hypotheses for the
species complexes of muroid rodents distrib-
uted in Mexico. (a) Baiomys spp. (Amman &
Bradley, 2004); (b) Peromyscus furvus (Harris
et al., 2000); (c) Peromyscus aztecus (Sullivan
et al., 2000); (d) Reithrodontomys sumichrasti
(Sullivan et al., 2000). Numbers above
branches are bootstrap values as reported
in the original publications.
Niche divergence in Mexican muroid rodents 261
ª 2 0 0 9 T H E A U T H O R S . J . E V O L . B I O L . 2 3 ( 2 0 1 0 ) 2 5 9 – 2 7 0
J O U R N A L C O M P I L A T I O N ª 2 0 0 9 E U R O P E A N S O C I E T Y F O R E V O L U T I O N A R Y B I O L O G Y
Ecological niche modelling
In this study, niche modelling was carried out with
GARP. This is a software application that includes
inferential tools in an iterative, artificial intelligence-
based approach (Stockwell & Noble, 1992). Occurrence
points are divided evenly into training and test data sets.
GARP works in an iterative process of rule selection,
evaluation, testing and incorporation or rejection. First,
an inferential tool is chosen from a set of possibilities (e.g.
logistic regression, bioclimatic rules), and then is applied
to the training data and a rule developed; a rule is an
IF…THEN statement that describes the conditions under
which a species may be present (or absent). Predictive
accuracy is evaluated based on the test data and an
equivalent number of points sampled randomly from the
study region as a whole. The change in predictive
accuracy from one iteration to the next is used to
evaluate whether a particular rule should be incorpo-
rated into the model. The final model is projected onto
geographical space to produce a digital map of areas with
environmental characteristics suitable for the species
(Hirzel et al., 2002). Detailed assumptions and discussions
on this algorithm have been published elsewhere
(Peterson & Cohoon, 1999; Stockwell & Peters, 1999;
Anderson et al., 2002; Peterson et al., 2007). GARP is
available at http://www.nhm.ku.edu/desktopgarp.
To characterize environments, we used geological
variables from the Hydro-1K dataset (USGS, 2001), and
interpolated climate data set variables from the
WorldClim project (Hijmans et al., 2005). Both data
sets are based on a grid size resolution of 3000 (�1 km2
cell size). Model reconstruction was inferred from 14
ecological (Table 1) and three geological variables (i.e.
Slope, Digital Elevation Model and Compound Topo-
graphic Index). Different results between replicate
modelling runs result from the stochastic nature of
this algorithm. A consensus map, therefore, was
inferred by running 100 replicates (each replicate
consisted of 1000 iterations or until convergence).
Following Anderson (2003), the resulting models were
ranked based on their errors of omission (i.e. sites
where the species is present, but not predicted by the
model) and commission (i.e. sites where the species is
not present, but is predicted by the model), prioritizing
omissions over commissions. Finally, the 10 best
models were stored in ASCII raster format and
imported to the ArcView Ver. 3.2 Geographic Informa-
tion System (GIS; ESRI, 1999) to produce a strict
consensus map (Chefaoui et al., 2005). To corroborate
the predicted distribution, the consensus map was
compared with the geographical limits of the mamma-
lian ecological regions proposed by CONABIO
(Ramırez-Pulido & Castro-Campillo, 1990). This criterion
was used because ecological regions tend to indicate
the distribution limits of the species (Rojas-Soto et al.,
2003). Therefore, only the predicted areas that were
part of ecological regions in which there was at least
one record of the phylogroup (or the most closely
related phylogroup) were accepted.
We used three approaches to evaluate differentiation
in the geographical and ecological space of each species.
First, we estimated an overlap index (OI) between niche
models. The OI is the ratio of the overlap area between
two phylogroups divided by total area occupied by both
phylogroups. In other words, this index is the fraction of
the niche model of one phylogroup predicted by other
phylogroups within the same species. The OI is a measure
Table 1 Structure coefficients for canonical discriminant functions derived from the 14 ecological layers used to generate the ENM.
Variable set
Baiomys
musculus
CF1
Baiomys taylori Peromyscus furvus
Peromyscus
aztecus
Reithrodontomys
sumichrasti
CF1 CF2 CF1 CF2 CF1 CF2 CF1 CF2
Annual Mean Temperature )0.268 0.009 0.363 )0.527 )0.230 0.337 )0.139 0.666 0.182
Mean Diurnal Range )0.338 0.132 )0.117 )0.047 0.037 )0.611 0.463 )0.098 )0.539
Isothermality )0.218 0.364 )0.072 0.497 )0.483 )0.106 0.599 0.485 0.340
Max Temperature Warmest Month )0.408 )0.103 0.251 )0.586 )0.144 0.154 )0.115 0.549 )0.065
Mean Temperature Wettest Quarter )0.226 )0.028 0.436 )0.584 )0.097 0.361 )0.211 0.551 0.141
Mean Temperature Driest Quarter )0.301 0.170 0.173 )0.361 )0.508 0.273 )0.217 0.737 0.138
Mean Temperature Warmest Quarter )0.261 )0.142 0.324 )0.575 )0.124 0.334 0.202 0.573 0.118
Mean Temperature Coldest Quarter )0.286 0.130 0.275 )0.392 )0.416 0.307 )0.050 0.777 0.237
Annual Precipitation 0.380 )0.013 )0.208 )0.282 )0.367 0.344 )0.137 0.282 0.610
Precipitation Wettest Month 0.189 0.105 )0.107 )0.310 )0.385 0.311 )0.242 0.371 0.437
Precipitation Seasonality )0.866 0.558 )0.006 0.285 )0.597 )0.332 )0.264 0.603 )0.660
Precipitation Driest Quarter 0.647 )0.313 )0.268 )0.410 0.033 0.448 )0.086 )0.293 0.683
Precipitation Warmest Quarter 0.136 0.099 )0.150 )0.638 )0.152 0.299 )0.319 0.168 0.359
Precipitation Coldest Quarter 0.584 )0.151 )0.271 )0.190 )0.254 0.438 )0.206 )0.219 0.617
Explained Variance (%) 100.000 99.900 0.100 76.400 23.600 52.700 22.600 51.900 28.600
Bold indicates the highest absolute size of correlation within function.
262 D. MART INEZ-GORDILLO ET AL.
ª 2 0 0 9 T H E A U T H O R S . J . E V O L . B I O L . 2 3 ( 2 0 1 0 ) 2 5 9 – 2 7 0
J O U R N A L C O M P I L A T I O N ª 2 0 0 9 E U R O P E A N S O C I E T Y F O R E V O L U T I O N A R Y B I O L O G Y

of the geographical space potentially shared by the two
phylogroups. Second, geographical space differentiation
was also explored by computing the number of records
that each ENM predicted for its own phylogroup and
for the other phylogroups within the same species
(i.e. inter-predictability). Third, to determine whether
phylogroups can be distinguished on the basis of ecolog-
ical space as well as to identify the combination of
ecological characters most important to group member-
ship we performed a discriminant functions analysis.
(a) (b)
(c) (d)
(e)
Phylogroup CPhylogroup D Phylogroup A
Phylogroup BTN population
NorthCenter South
OaxacensisHylocetesAztecus SMOAztecus OHEvides WestEvides East
DorsalisNerterusSumichrasti SMOSumichrasti OHLuteolus WestLuteolus East
Pacific Ocean
Gulf ofMexico
Fig. 2 Summary of Ecological Niche Model predictions for five species complexes based on occurrence data and information for 14 climate
and three geological variables. Black area indicates where niches overlap. (a) Baiomys musculus; (b) B. taylori; (c) Peromyscus furvus;
(d) P. aztecus; (e) Reithrodontomys sumichrasti.
Niche divergence in Mexican muroid rodents 263
ª 2 0 0 9 T H E A U T H O R S . J . E V O L . B I O L . 2 3 ( 2 0 1 0 ) 2 5 9 – 2 7 0
J O U R N A L C O M P I L A T I O N ª 2 0 0 9 E U R O P E A N S O C I E T Y F O R E V O L U T I O N A R Y B I O L O G Y
Canonical discriminant functions (CF) were computed by
extracting the values for the ecological variables at each
pixel predicted by the individual ENMs. For these
analyses the phylogroups were designated as the separa-
tion group. All geographical analyses and value extrac-
tions were performed with the GIS ArcView ver. 3.2
computer package. The statistical analyses were per-
formed using SPSS ver. 17 for Mac (SPSS, 2009).
Results
We obtained a total of 20 models that predict the
potential distribution of each phylogroup based on the
environmental variables that set the ecological niche
boundaries. The summary of predictions for these
models for each species is presented in Fig. 2. A
predictability test performed by GARP showed that
the ENM of each phylogroup departed from random
models (P < 0.00001). A linear regression among the
number of locality records per phylogroup vs. the
number of recovered pixels by the ENM was not
significant (r2 = 0.18, P = 0.0649). This indicates there
was no model bias due to insufficient input data.
Finally, the segregation of the potential areas as
inferred by the ENMs fits the proposed hypotheses of
historical independence for each phylogroup (i.e. Harris
et al., 2000; Sullivan et al., 2000; Amman & Bradley,
2004).
Table 2 Approaches used to evaluate
differentiation in the geographical and
ecological space of each species.
PhylogroupOverlap
index (%)
Inter-
predictability
(%) Accuracy (%)*
A B A&B B&A A B
B. musculus C B. musculus D 26.0 24.3 95.7 58.4 75.8
B. taylori A B. taylori B 0.0 0.0 0.0 95.8 99.0
B. taylori A B. taylori TN 1.0 0.0 0.0 95.8 100.0
B. taylori B B. taylori TN 2.0 28.9 0.1 99.0 100.0
P. furvus Center P. furvus North 0.0 0.0 0.0 66.9 95.5
P. furvus Center P. furvus South 16.0 50.0 45.6 66.9 71.8
P. furvus North P. furvus South 0.0 0.0 28.5 95.5 71.8
P. a. aztecus OH P. a. aztecus SMO 7.0 12.5 33.3 58.8 75.5
P. a. aztecus OH P. aztecus evides E 0.0 7.4 33.3 58.8 51.6
P. a. aztecus OH P. aztecus evides W 0.0 0.0 0.0 58.8 68.4
P. a. aztecus OH P. aztecus oaxacensis 1.0 0.0 83.3 58.8 41.8
P. a. aztecus OH P. aztecus hylocetes 0.0 0.0 0.0 58.8 50.4
P. a. aztecus SMO P. aztecus evides E 2.0 0.0 4.1 75.5 51.6
P. a. aztecus SMO P. aztecus evides W 0.0 0.0 0.0 75.5 68.4
P. a. aztecus SMO P. aztecus oaxacensis 5.0 0.0 20.8 75.5 41.8
P. a. aztecus SMO P. aztecus hylocetes 0.0 0.0 0.0 75.5 50.4
P. aztecus evides E P. aztecus evides W 21.0 30.4 18.5 51.6 68.4
P. aztecus evides E P. aztecus oaxacensis 15.0 53.8 40.7 51.6 41.8
P. aztecus evides E P. aztecus hylocetes 7.0 6.7 0.0 51.6 50.4
P. aztecus evides W P. aztecus oaxacensis 16.0 38.4 95.6 68.4 41.8
P. aztecus evides W P. aztecus hylocetes 10.0 8.1 0.0 68.4 50.4
P. aztecus oaxacensis P. aztecus hylocetes 5.0 6.7 0.0 41.8 50.4
R. sumichrasti dorsalis R. sumichrasti luteolus E 15.0 15.1 3.5 42.9 49.4
R. sumichrasti dorsalis R. sumichrasti luteolus W 8.0 0.0 3.5 42.9 52.7
R. sumichrasti dorsalis R. sumichrasti nerterus 3.0 0.0 0.0 42.9 70.5
R. sumichrasti dorsalis R. s. sumichrasti OH 14.0 50.0 3.5 42.9 31.4
R. sumichrasti dorsalis R. s. sumichrasti SMO 5.0 64.7 0.0 42.9 62.4
R. sumichrasti luteolus E R. sumichrasti luteolus W 52.0 53.8 42.4 49.4 52.7
R. sumichrasti luteolus E R. sumichrasti nerterus 5.0 0.0 9.0 49.4 70.5
R. sumichrasti luteolus E R. s. sumichrasti OH 8.0 0.0 9.0 49.4 31.4
R. sumichrasti luteolus E R. s. sumichrasti SMO 1.0 0.0 0.0 49.4 62.4
R. sumichrasti luteolus W R. sumichrasti nerterus 10.0 14.2 0.0 52.7 70.5
R. sumichrasti luteolus W R. s. sumichrasti OH 2.0 0.0 0.0 52.7 31.4
R. sumichrasti luteolus W R. s. sumichrasti SMO 0.0 0.0 0.0 52.7 62.4
R. sumichrasti nerterus R. s. sumichrasti OH 6.0 0.0 10.7 70.5 31.4
R. sumichrasti nerterus R. s. sumichrasti SMO 5.0 0.0 14.2 70.5 62.4
R. s. sumichrasti OH R. s. sumichrasti SMO 15.0 47.0 16.6 31.4 62.4
*Proportion of pixels predicted by the ENMs correctly classified.
264 D. MART INEZ-GORDILLO ET AL.
ª 2 0 0 9 T H E A U T H O R S . J . E V O L . B I O L . 2 3 ( 2 0 1 0 ) 2 5 9 – 2 7 0
J O U R N A L C O M P I L A T I O N ª 2 0 0 9 E U R O P E A N S O C I E T Y F O R E V O L U T I O N A R Y B I O L O G Y
On average, OI between the recovered models was
7.6%, though the values for this index vary considerably.
For instance, the average OI estimated for the contrasts
between the phylogroup of R. sumichrasti were lower
than 10%. The highest OI, however, occurred between
the geographical neighbours R. s. luteolus West and
R. s. luteolus East, whose ENM overlap by 52% (Table 2).
Similarly, the niches modelled for each phylogroup had a
low recovery rate for the collecting points of alternative
phylogroups within their lineages (i.e. inter-predictabil-
ity). As for the OI, the inter-predictability between
models was highly variable. The inferred model for
P. a. oaxacensis recovered 29% of its sister group records.
This value was followed by that of P. a. evides West that
recovered 15% of the collection localities of the taxa
encompassed by its sister group. All other contrasts
recovered inter-predictability values below 3%. It is
important to point out that this parameter can be
unbalanced. For example, for M. musculus, phylogroup
C recovered 95% of the known localities for phylogroup
D, whereas the latter only recovered 24% of collecting
points of the former.
The results from the discriminant analysis indicate that
overall phylogroups differed significantly between their
ENMs. For the five species complexes the Wilks’ lambda
(k) scored probability values smaller than 0.001. In most
cases these overall differences are due to radical shifts in
the ecological parameters in the ENMs of the phylo-
groups. For instance, phylogroups C and D of B. musculus
occupy different temperature and precipitation ranges.
Phylogroup C lives in warmer environments than
phylogroup D. The annual mean temperature recorded
in the potential distribution of phylogroup C is 23 �C,
whereas the same factor is 21 �C for the potential
distribution of phylogroup D. In contrast, phylogroup D
inhabits more humid habitats than phylogroup C. The
raw data show that the annual precipitation in the forest
occupied by phylogroup D is 1223 mm, whereas the
precipitation is 1070 mm in the area predicted for
phylogroup C.
The total variation explained by the first two CF ranged
from 75% to 100% (Table 1). The CF for B. taylori and
P. furvus were associated mainly with temperature vari-
ables (i.e. annual mean, isothermality, maximum of the
warmest month, mean of the wettest quarter, mean of
the driest quarter and mean of the warmest quarter).
These variables, however, were positive for B. taylori, and
negative for P. furvus. On the one hand, the differences in
the ENM of R. sumichrasti that were explained by CF1
were associated with three temperature variables (i.e.
annual mean, mean of the driest quarter and mean of the
coldest quarter), whereas the second CF explained 28.6%
and it was associated with a decrease in four precipitation
variables (i.e. annual, precipitation seasonality, precipi-
tation in the driest quarter and precipitation in the
coldest quarter). Finally, the CF for B. musculus and
P. aztecus were associated mainly with two precipitation
components (i.e. annual precipitation, precipitation wet-
test month, precipitation in the coldest quarter and
precipitation in the driest quarter).
Visual inspection of the first and second CF plots shows
a separation between the phylogroups encompassed in
B. taylori (Fig. 3a). The separation along CF 1 between
phylogroups A and B can be explained mainly by
precipitation seasonality. The classification matrix
showed that on average, pixels were assigned to the
0
2.5
–2.5
Canonical function 10 2.5 5–2.5
Can
onic
al fu
nctio
n 2
Pah
PaeE
PaeW
Pao
OHSMO
Canonical function 1
Can
onic
al fu
nctio
n 2
BtABtB
BtTN
0 5–5–10
0
5
(a) (b)
(c) (d)
–5
Canonical function 1
Can
onic
al fu
nctio
n 2
0 2.5–5
0
5
–5
–2.5
PfC
PfN
PfS
Canonical function 1
Can
onic
al fu
nctio
n 2
0 2.5 5–2.5–5
0
2.5
–2.5
Rsd
RslE
RslW
Rsn
RssOH
RssSMO
Fig. 3 Plots of canonical discriminant
functions 1 and 2 describing ecological
variation. Big circles represent group
centroids. (a) Baiomys taylori: phylogroup A
(BtA), phylogroup B (BtB), TN populations
(BtTN); (b) Peromyscus furvus: Center (PfC),
North (PfN), South (PfS); (c) P. aztecus: aztecus
OH (OH), aztecus SMO (SMO), evides E
(PaeE), evides W (PaeW), oaxacensis (Pao),
hylocetes (Pah); (d) Reithrodontomys
sumichrasti: dorsalis (Rsd), luteolus E (RslE),
luteolus W (RslW), nerterus (Rsn), sumichrasti
OH (RssOH), sumichrasti SMO (RssSMO).
Niche divergence in Mexican muroid rodents 265
ª 2 0 0 9 T H E A U T H O R S . J . E V O L . B I O L . 2 3 ( 2 0 1 0 ) 2 5 9 – 2 7 0
J O U R N A L C O M P I L A T I O N ª 2 0 0 9 E U R O P E A N S O C I E T Y F O R E V O L U T I O N A R Y B I O L O G Y
correct group in 98% of the cases. A similar separation
trend was observed in R. fuscus (Fig. 3b). For this species,
however, precipitation in the warmest quarter explained
the separation along CF 1 between the phylogroup North
and South. Precipitation seasonality, on the other hand,
explained the separation along CF 2 between phylo-
groups Central and South. The classification accuracy
ranged between 95% for phylogroup North and 67% for
phylogroup Central (Table 2). On average, 23% of the
pixels were ambiguously assigned between phylogroups
Central and South; nonetheless, the phylogeny (Fig. 1b)
did not recover these phylogroups as sister taxa. The
amount of data generated for P. aztecus and R. sumichrasti
produced a complex overlap pattern among the disper-
sion clouds of the different phylogroups. In P. aztecus,
however, a separation along CF 1 can be observed for
some of the phylogroups. For instance, P. a. hylocetes does
not overlap with the phylogroup OH, and overlaps
slightly with SMO. The classification matrix shows low
assignation values (< 70%) for most of the data, with
the highest being 76% for the pixels of the phylogroup
OH. The smallest degree of separation is observed in
R. sumichrasti (Fig. 3d). For this species the values
obtained in the classification matrix raged from 71%
for R. s. nerterus to 31% for R. s. sumichrasti OH.
Discussion
In the recent literature, a debate has emerged as to
whether niches are conserved (Wiens & Graham, 2005).
Some authors (Holt & Gaines, 1992; Peterson et al., 1999;
Prinzing et al., 2001; Kozak & Wiens, 2006) have
concluded that the ecological niche evolves at a slower
rate than that at which the speciation process occurs (i.e.
phylogenetic niche conservatism). Closely related spe-
cies, therefore, must share the same ecological parame-
ters. Alternatively, based on complementary evidence
(e.g. morphometric data, colour change regulated by
point mutation and changes in life history traits) other
authors have reached the conclusion that the niche
evolves faster than previously estimated (Losos et al.,
1997; Reznick et al., 1997; Hoekstra et al., 2006; Hendry
et al., 2007). The incompatibility of these two conclusions
may result from comparisons of species exhibiting oppo-
site life strategies (e.g. low vs. high vagility).
The available evidence, however, is not sufficient to
clearly indicate whether this is a common process during
the evolution of lineages. Analyses of potential distribu-
tion patterns might provide further evidence. It is
possible that phylogenetic niche conservatism character-
izes recently diverged sister species. However, niche
differentiation might occur in phylogeographically struc-
tured species with allopatric populations and restricted
gene flow that have been subjected to different ecological
conditions for sufficient periods of time (Avise, 2000).
Apparently, the muroid species used here fit such a
description. Groups with allopatric distribution (i.e.
P. furvus and B. taylori) had a higher degree of ecological
niche differentiation than those with parapatric distribu-
tion (i.e. P. aztecus and R. sumichrasti).
Ecological niche models will help to draw conclusions
about niche conservatism. They may be important in
understanding allopatric speciation, historical biogeogra-
phy, patterns of species richness and community struc-
ture. It is imperative, nonetheless, to have at least an
approximation of the phylogenetic interrelationships for
the species. Conclusions based on non-natural units
would be meaningless. The results presented in this study
corroborate a process of ecological niche differentiation,
one that is correlated with the historical structure of the
phylogroups.
Implications for recognizing species’ limits: themuroid example
The process for the acceptance of new species can be
divided into three phases. First, evolutionary units must
be recognized as putative new species. Second, a formal
description highlighting the characters that differentiate
these units must be provided. Third, a formal name is
erected following the norms and regulations contained in
the codes of nomenclature. The use of ENM deals
exclusively with the first phase (recognition of potential
evolutionary units). One of the problems for species
recognition is that in spite of all the available species
concepts this rank is as subjective as any other taxonomic
rank, and that Linnaean categories are not assigned using
objective criteria (Ereshefsky, 2002; Laurin, 2005). An
empirical way to corroborate the individuality of a
lineage is to evaluate the congruence of data from
independent sources. The ENM can generate comple-
mentary data for inferring patterns of ecological diver-
gence. Therefore, contrasting the information recovered
from ENM and phylogenetic reconstruction is a strategy
of reciprocal illumination for identifying natural units
and perhaps for establishing species’ limits. For instance,
lets us consider the ENM of one species with allopatric
distribution. If the model results in a discontinuous
niche, then each of the areas that encompass collecting
records must be modelled independently. Depending on
the overlap and inter-predictability index, a series of
specimens from those distinctive ecological units would
be used in a phylogenetic analysis to infer if they also
constitute historical lineages. It is after this point that a
taxonomic decision based on phylogenetic criteria (e.g.
diagnosably distinct clades, reciprocal monophyly, line-
age independence) could be made. Our results concur
with the conclusions derived from studies that highlight
the advantages of such an approach (Raxworthy et al.,
2007; Rissler & Apodaca, 2007; Stockman & Bond, 2007;
Swenson, 2008). If two sister lineages can be identified
by their differentiated niche, then that fraction of the
niche is expected to be regulated by autapomorphic
characters and therefore niche differentiation could
266 D. MART INEZ-GORDILLO ET AL.
ª 2 0 0 9 T H E A U T H O R S . J . E V O L . B I O L . 2 3 ( 2 0 1 0 ) 2 5 9 – 2 7 0
J O U R N A L C O M P I L A T I O N ª 2 0 0 9 E U R O P E A N S O C I E T Y F O R E V O L U T I O N A R Y B I O L O G Y
constitute taxonomic evidence (sensu Cracraft, 1983). On
the other hand, if the ecological niche has not changed,
symplesiomorphic characters are expected to regulate it.
The GARP was able to identify discrete ecological units
that correspond to phylogroups recognized by indepen-
dent systematics studies as separate historical units (e.g.
Harris et al., 2000; Sullivan et al., 2000; Amman &
Bradley, 2004). The OI between the niches of the
phylogroups encompassed in P. furvus was very small,
and none of the locality records for the North phylogroup
was recovered by the other ENM. These data support the
conclusion that the North phylogroup is no longer an
ecological counterpart to the remaining units. Likewise,
the southernmost populations also showed a significant
ecological differentiation. Templeton (2001) suggests that
a lack of demographic interchangeability due to ecolog-
ical constraints is evidence that those units belong to
different species (i.e. Cohesive Species Concept). Fur-
thermore, the diagnostic molecular characters of the
North phylogroup also provide evidence that this is an
independent species (sensu Phylogenetic Species Concept;
Cracraft, 1983). Based on molecular data, Harris et al.
(2000) concluded that the North phylogroup was defi-
nitely an evolutionarily stable unit, and suggested that
other phylogroups potentially represent alternative spe-
cies. The available data imply that for the northern
populations divergence takes place in an ecological
dimension, whereas for the south populations the diver-
gence is both ecological and geographical.
Sullivan et al. (1997) recommended that the subspecies
P. a. hylocetes should be raised to the species level. Later,
Sullivan et al. (2000) presented a genealogy in which
P. hylocetes was nested within P. aztecus (Fig. 1c). Thus,
the other phylogroups should be raised to the species
level as well. Not only do the phylogroups have fixed
molecular characters, the ENMs also support that these
groups have diverged ecologically.
The ENMs of R. sumichrasti showed ecological separa-
tion among the different phylogroups (Fig. 2e). The lack
of overlap between ENMs suggests that these phylo-
groups have achieved significant niche divergence. Only
the ENMs for R. s. luteolus East and West overlapped
considerably. There is compelling evidence, however,
that these two phylogroups are not sister lineages
(Sullivan et al., 2000). Therefore, such niche overlap
probably represents a symplesiomorphy that has con-
strained the dispersion of these lineages (i.e. phylogenetic
niche conservatism). Sullivan et al. (2000) have sug-
gested that the Isthmus of Tehuantepec could be an
effective barrier for this species, and that the populations
on each side of this barrier might be different species.
The ENMs for B. taylori support the ecological inde-
pendence of phylogroups A and B (Fig. 2b). Amman &
Bradley (2004) reported genetic variability in the cyto-
chrome-b gene of 0.41% for the Texas population
(phylogroup A), which is four times more variable than
phylogroup B. The same authors concluded that the Rio
Grande could be a geographical barrier that has promoted
the isolation and differentiation between the Mexican
and the U.S. populations. The molecular and ecological
evidence support this conclusion.
ENM as an exploratory tool
We are aware that in some cases the ecological niche
seems to make more geographical than phylogenetic
sense. On the one hand, geographically close phylo-
groups exhibited significant ecological divergence reflect-
ing their phylogenetic position. On the other hand, clinal
variation can be discarded because significant ecological
divergence was not restricted to phylogroups placed at
the extremes of the distribution. Rice et al. (2003) found
similar results for niche differentiation and geography.
They analysed the ecological niche of Aphelocoma jays,
and concluded that geographical proximity better
explained niche divergence than did the phylogenetic
interrelationships. Apparently, some plastic characters
that can be easily altered by evolutionary processes
regulate aspects of the ecological niche. Furthermore,
ecological factors are not necessarily intrinsic to the
species. This idea implies that the ecological niche can
play an important role in species differentiation, but that
it is inadequate for phylogenetic reconstruction. At least
some of the characters that form the ecological niche
must change very fast, thus leading to homoplasy
between closely related lineages (Rice et al., 2003).
The genealogical structure and interrelationships for
the TN populations have not been established. Our
results, nonetheless, suggest that they represent an
independent ecological unit (1% OI and 0.1% inter-
predictability). The question of whether the TN popula-
tions represent an independent historical unit requires
corroboration via complete systematic analyses based on
morphological or molecular characters. The ENM sug-
gests that these populations are worthy of such an effort.
Empirical studies (e.g. Graham et al., 2004a; Raxwor-
thy et al., 2007; Rissler & Apodaca, 2007; Stockman &
Bond, 2007) have shown that the use of potential
distribution models is an effective tool to identify differ-
ences in ecological niches. Such analyses are effective for
inferring lineage divergence and segregation. In general,
species are delimited based on one or more qualitative or
quantitative morphological characters that show no
overlap with closely related species. If two species are
consistently distinguished by one or more diagnostic
morphological differences, then presumably there is no
gene flow between them. Wiens & Servedio (2000)
examined the sample sizes needed to have statistical
confidence that a given diagnostic character is truly fixed
(100% frequency) within a species. However, even
allowing for some level of polymorphism in a diagnostic
character (e.g. frequency of 95% rather than 100%),
hundreds or thousands of individuals may still be
required to be reasonably certain that the trait is
Niche divergence in Mexican muroid rodents 267
ª 2 0 0 9 T H E A U T H O R S . J . E V O L . B I O L . 2 3 ( 2 0 1 0 ) 2 5 9 – 2 7 0
J O U R N A L C O M P I L A T I O N ª 2 0 0 9 E U R O P E A N S O C I E T Y F O R E V O L U T I O N A R Y B I O L O G Y
diagnostic at the desired level. For exploratory analyses,
therefore, it is more productive to gather a large database
of locality records, than museum specimens for morpho-
logical studies, or samples for DNA sequencing.
The drawbacks
The use of ENM as an exploratory tool for delineating
species among divergent lineages is not without issues
and certain limitations, and consequently, it requires
critical examination. Using mtDNA-based phylogenies as
null hypotheses may be inadequate (e.g. gene-tree ⁄species-tree incongruence, introgression, intracellular
symbionts, matrilineal history and selection). Despite
these criticisms, insights gained through mtDNA markers
over the past 25 years have been immense and recent
comparative phylogeographical studies show obvious
and compelling consistencies between mitochondrial
and nuclear DNA genealogies among disparate taxa
(Zink & Barrowclough, 2008). Nuclear mutation rates
are generally lower than mitochondrial ones (10 : 1
ratio). Therefore, there will be less variation per sequence
for nuclear than for mitochondrial sequences. This results
in nuclear genealogies with low resolution that usually
show no conflict with the mitochondrial trees. One might
have to sequence two to three times as many nuclear
bases as mitochondrial to uncover equivalent numbers of
variable sites and, hence, to produce a tree with equiv-
alent resolution. Furthermore, producing this nuclear
gene tree requires that there be no recombination and
that one can sort the specific sequence that occurs in
each allele (Zink & Barrowclough, 2008 and references
within).
It is possible that some of the differentiation observed
between the niches of two groups is due to phenotypic
plasticity. This is a mechanism that allows organism to
deal with environmental heterogeneity. The role of
phenotypic plasticity on population fitness has been
revised in recent years (Caruso et al., 2006). However, its
impact on adaptive evolution remains controversial.
Adaptive phenotypic plasticity is increasingly demon-
strated for many species (Terblanche & Kleynhans,
2009). Phenotypic plasticity can enhance survival under
adverse conditions, therefore, could be a driver of novel
traits, and potentially of speciation. Nonetheless, addi-
tional research is necessary to test for adaptive pheno-
typic plasticity using a strong inference approach while
controlling for the types of plasticity (e.g. developmental
vs. adult), considering the relevance of the ecological
conditions in the habitat.
The evaluation of ecological interchangeability using
niche-based distribution modelling requires close scru-
tiny. For most algorithms, niche-based distribution
models are viewed as a prediction of the organism’s
realized niche because occurrence localities are drawn
exclusively from the source habitat. Soberon & Peterson
(2005), however, concluded that niche models inferred
by GARP provide an approximation to the species’
fundamental niche. This is based on the fact that the
GARP modifies the initial rules (i.e. ecological parame-
ters) by specially defined genetic operators. The results
are models that have ‘evolved’ and are capable of
predicting distribution zones that do not encompass the
ecological conditions recorder at the input points.
Although overlapping predicted distributions might
support the null hypothesis of ecological inter-
changeability, they do not necessarily rule out noninter-
changeability. An over prediction by the model indicates
that a species’ environmental tolerances are more
extensive than observed and that other factors (e.g.
biotic interactions) may be limiting geographical
range. The ideal of reciprocal transplant and common
environment experimentation is without question
unfeasible for many groups. Moreover, reciprocal trans-
plant experiments are potentially irresponsible and
environmentally unethical under many circumstances.
Thus, further work is needed to design tests of ecological
interchangeability that can be more easily implemented
and are feasible for the rapid biodiversity assessments
required in some conservation situations (Bond &
Stockman, 2008).
The ENMs of B. musculus reciprocally recovered most
of the locality records of the alternative phylogroup.
Peterson et al. (2006) reported similar patterns for nested
ENMs between sister taxa in rodents and other
vertebrates. An explanation for this kind of result is that
the niche of one of the lineages is constrained by
geographical or ecological factors, whereas the niche
of the other species has expanded. Harrison (1998)
concluded that niche differentiation was a secondary
consequence of the process of population divergence.
Consequently, the phylogroups segregated by ENM have
been isolated for a sufficient number of generations to
reach ecological specialization. Consequently, explora-
tory approaches like ENM will produce false negatives for
independent historical units where the sister taxa have
occupied the same niche over time.
The central argument in ‘Ecological’ Species Concepts
(e.g. Van Valen, 1976; Templeton, 2001) is the differen-
tiation of the ecological niche. Even so, there are studies
that demonstrate speciation without ecological diver-
gence (e.g. Peterson et al., 1999; Kozak & Wiens, 2006).
Our proposal differs from those concepts because niche
differentiation between sister taxa is not essential for
speciation. We suggest that niche differentiation is
merely an indication that some lineages might have
followed alternative evolutionary pathways. Analyses
like those presented here can be used to identify
previously undetected ecological variation. As such,
hidden biodiversity within currently recognized species
could be revealed by ENM analysis. Further research into
species with alternative biological traits will allow us to
understand the potential and limitations of ENM for
systematic studies.
268 D. MART INEZ-GORDILLO ET AL.
ª 2 0 0 9 T H E A U T H O R S . J . E V O L . B I O L . 2 3 ( 2 0 1 0 ) 2 5 9 – 2 7 0
J O U R N A L C O M P I L A T I O N ª 2 0 0 9 E U R O P E A N S O C I E T Y F O R E V O L U T I O N A R Y B I O L O G Y
Acknowledgments
We thank S. Blanco, G. Ceballos-Gonzalez and G. Oliva
for the collection database. F. Ornelas provide statistical
advice. E. Arellano, A. Guillen, R. Landgrave and M.
Laurin provided comments and suggestions that greatly
improved this manuscript. Special thanks to E. Martınez-
Meyer, C. Munoz and T. Peterson for their advice and
patient assistance with theoretical and methodological
concepts. DMG was supported by a scholarship from the
Mexican government (CONACyT no. 179252).
References
Abuzeineh, A.A. 2006. Landmark morphometric assessment of
the genus Baiomys (Mammalia: Rodentia): geographic varia-
tion, secondary sexual dimorphism, and character displace-
ment in sister species. MSc Thesis, Texas Tech University,
Lubbock, TX.
Amman, B.R. & Bradley, R.D. 2004. Molecular evolution in
Baiomys (Rodentia: Sigmodontinae): evidence for a genetic
subdivision in B. musculus. J. Mammal. 85: 162–166.
Anderson, R.P. 2003. Real vs artefactual absences in species
distribution: test of Oryzomys albigularis (Rodentia: Muridae) in
Venezuela. J. Biogeogr. 30: 591–605.
Anderson, R.P., Gomez-Laverde, M. & Peterson, A.T. 2002.
Geographical distributions of spiny pocket mice in South
America: Insights from predictive models. Global Ecol. Biogeogr.
11: 131–141.
Avise, J.C. 2000. Phylogeography: The History and Formation of
Species. Harvard University Press, Cambridge.
Baker, R.J. & Bradley, R.D. 2006. Speciation in mammals and
the genetic species concept. J. Mammal. 87: 643–662.
Bond, J.E. & Stockman, A.K. 2008. An integrative method for
delimiting cohesion species: finding the population-species
interface in a group of Californian trapdoor spiders with
extreme genetic divergence and geographic structuring. Syst.
Biol. 57: 628–646.
Carleton, M.D. 1989. Systematics and evolution. In: Advances in
the Study of Peromyscus (Rodentia) (G.L. Kirkland Jr & J.N.
Layne, eds), pp. 7–141. Texas Tech University Press, Lubbock.
Caruso, C.M., Maherall, H. & Sherpard, M. 2006. Plasticity of
physiology in Lobelia: testing for adaptation and constraint.
Evolution 60: 980–990.
Ceballos, G. & Oliva, G. 2005. Los mamıferos de Mexico. CONA-
BIO-UNAM, Mexico.
Chefaoui, R.M., Hortal, J. & Lobo, J.M. 2005. Potential distri-
bution modeling, niche characterization and conservation
status assessment using GIS tools: a case study of Iberian Copris
species. Biol. Conserv. 122: 327–338.
Cracraft, J. 1983. Species concept and speciation analysis. Curr.
Ornithol. 1: 159–187.
Dayrat, B. 2005. Towards integrative taxonomy. Biol. J. Linn.
Soc. B 85: 407–415.
De Queiroz, K. 1998. The general lineage concept of species,
species criteria, and the process of speciation: a conceptual
unification and terminological recommendations. In: Endless
Forms: Species and Speciation (D.J. Howard & S.H. Berlocher,
eds), pp. 57–75. Oxford University Press, New York.
Ereshefsky, M. 2002. Linnaean ranks: vestiges of a bygone era.
Phil. Sci. 69: S305–S315.
ESRI (Environmental Systems Research Institute). 1999. ArcView
GIS, V. 3.2. ESRI Inc., Redlands, CA.
Graham, C.H., Ferrer, S., Huettman, F., Moritz, C. & Peterson,
A.T. 2004a. New developments in museum-based informatics
and application in biodiversity analysis. Trends Ecol. Evol. 19:
497–503.
Graham, C.H., Ron, S.R., Santos, J.C., Schneider, C.J. & Moritz,
C. 2004b. Integrating phylogenetics and environmental niche
models to explore speciation mechanisms in dendrobatid
frogs. Evolution 58: 1781–1793.
Grinnell, J. 1917. Field tests of theories concerning distributional
control. Am. Nat. 51: 115–128.
Guisan, A. & Thuiller, W. 2005. Predicting species distribution:
Offering more than simple habitat models. Ecol. Lett. 8: 993–
1009.
Gust, D.H. & Schmidly, D.J. 1986. Small mammal populations
on reclaimed strip-mined areas in Freestone County, Texas.
J. Mammal. 67: 214–217.
Hall, E.R. 1981. The Mammals of North America, Vol. 2. John
Wiley & Sons, New York.
Harris, D., Rogers, D.S. & Sullivan, J. 2000. Phylogeography of
Peromyscus furvus (Rodentia; Muridae) based on cytochrome-b
sequence data. Mol. Ecol. 9: 2129–2135.
Harrison, R.G. 1998. Linking evolutionary pattern and process:
the relevance of species concepts for the study of speciation.
In: Endless Forms: Species and Speciation (D.J. Howard & S.H.
Berlocher, eds), pp. 19–31. Oxford University Press, New York.
Hart, B.J. 1972. Distribution of the pygmy mouse, Baiomys
taylori, in North-Central Texas. Southwest. Nat. 17: 213–214.
Hendry, A.P., Nosil, P. & Rieseberg, L.H. 2007. The speed of
ecological speciation. Funct. Ecol. 21: 455–464.
Hijmans, R.J., Cameron, S.E., Parra, J.L., Jones, P.G. & Jarvis, A.
2005. Very high resolution interpolated climate surfaces for
global land areas. Int. J. Climatol. 25: 1965–1978.
Hirzel, A.H., Hausser, J., Chessel, D. & Perrin, N. 2002.
Ecological-niche factor analysis: how to compute habitat-
suitability maps without absence data? Ecology 83: 2027–2036.
Hoekstra, H.E., Hirschmann, R.J., Bundey, R.A., Insel, P.A. &
Crossland, J.P. 2006. A single amino acid mutation contributes
to adaptive beach mouse color pattern. Science 313: 101–104.
Holt, R.D. & Gaines, M.S. 1992. Analysis of adaptation in
heterogeneous landscapes: implications for the evolution of
fundamental niches. Evol. Ecol. 6: 433–447.
Hunsaker, D., Raun, G.G. & Swindells, J.E. 1959. Range
expansion of Baiomys taylori in Texas. J. Mammal. 40: 447–448.
Killion, J.M., Grant, W.E. & Vinson, S.B. 1995. Response of
Baiomys taylori to changes in density of imported fire ants.
J. Mammal. 76: 141–147.
Kozak, K.H. & Wiens, J.J. 2006. Does niche conservatism
promote speciation? A case study in North American sala-
manders. Evolution 60: 2604–2621.
Laurin, M. 2005. The advantages of phylogenetic nomenclature
over Linnean nomenclature. In: Animal Names, Vol. 1
(A. Minelli, G. Ortalli & G. Sanga, eds), pp. 67–97. Instituto
Veneto di Scienze, Lettere ed Arti, Venice.
Laurin, M. 2008. The splendid isolation of biological nomencla-
ture. Zool. Scr. 37: 223–233.
Leon-Paniagua, L., Navarro-Siguenza, A.G., Hernandez-Banos,
B.E. & Morales, J.C. 2007. Diversification of the arboreal mice
of the genus Habromys (Rodentia: Cricetidae: Neotominae) in
the Mesoamerican highlands. Mol. Phylogenet. Evol. 42: 653–
664.
Niche divergence in Mexican muroid rodents 269
ª 2 0 0 9 T H E A U T H O R S . J . E V O L . B I O L . 2 3 ( 2 0 1 0 ) 2 5 9 – 2 7 0
J O U R N A L C O M P I L A T I O N ª 2 0 0 9 E U R O P E A N S O C I E T Y F O R E V O L U T I O N A R Y B I O L O G Y
Losos, J.B., Warhelt, K.I. & Schoener, T.W. 1997. Adaptive
differentiation following experimental island colonization in
Anolis lizards. Nature 387: 70–73.
Luxbacher, A.M. & Knouft, J.H. 2009. Assessing concurrent
patterns of environmental niche and morphological evolution
among species of horned lizards (Phrynosoma). J. Evol. Biol.
22: 1669–1678.
Mayr, E. 1982. The Growth of Biological Thought. Harvard
University Press, Cambridge.
Packard, R.L. & Judd, F.W. 1968. Comments on some mammals
from western Texas. J. Mammal. 49: 535–538.
Pagel, M.D., May, R.M. & Colline, A.R. 1991. Ecological aspects
of the geographical distribution and diversity of mammalian
species. Am. Nat. 137: 791–815.
Peterson, A.T. & Cohoon, K.C. 1999. Sensitivity of distributional
prediction algorithms to geographic data completeness. Ecol.
Model. 117: 159–164.
Peterson, A.T., Soberon, J. & Sanchez-Cordero, V. 1999. Con-
servatism of ecological niches in evolutionary time. Science
285: 1265–1267.
Peterson, A.T., Papes, M., Reynolds, M.G., Perry, N.D., Hanson,
B., Regnery, R.L., Hutson, C.L., Muizniek, B., Damon, I.K. &
Carroll, D.S. 2006. Native-range ecology and invasive poten-
tial of Cricetomys in North America. J. Mammal. 87: 427–432.
Peterson, A.T., Papes, M. & Eaton, M. 2007. Transferability and
model evaluation in ecological niche modeling: a comparison
of GARP and Maxent. Ecography 30: 550–560.
Phillips, S.J., Anderson, R.P. & Schapire, R.E. 2006. Maximum
entropy modeling of species geographic distributions. Ecol.
Modell. 190: 231–259.
Prinzing, A., Durka, W., Klotz, S. & Brandl, R. 2001. The niche of
higher plants: evidence for phylogenetic conservatism. Philos.
T. Roy. Soc. B 268: 2383–2389.
Ramırez-Pulido, J. & Castro-Campillo, A. 1990. Regiones y
provincias mastogeograficas. In: Atlas Nacional de Mexico, Vol. 2
(Instituto de Gerogafıa, eds), Map IV. 8.8. Instituto de Geografıa,
Universidad Nacional Autonoma de Mexico, Mexico.
Raxworthy, J.C., Martinez-Meyer, E., Horning, N., Nussbaum,
R.A., Schneider, G.E., Ortega-Huerta, M.A. & Peterson, A.T.
2003. Predicting distributions of known and unknown reptile
species in Madagascar. Nature 426: 837–841.
Raxworthy, C.J., Ingram, C.M., Rabibisoa, N. & Pearson, R.G.
2007. Applications of ecological niche modeling for species
delimitation: a review and empirical evaluation using day
geckos (Phelsuma) from Madagascar. Syst. Biol. 56: 907–923.
Reznick, D.N., Shaw, F.H., Rodd, F.H. & Shaw, R.G. 1997.
Evaluation of the rate of evolution in natural populations of
guppies (Poecilia reticulata). Science 275: 1934–1937.
Rice, N.H., Martınez-Meyer, E. & Peterson, A.T. 2003. Ecological
niche differentiation in the Aphelocoma jays: a phylogenetic
perspective. Biol. J. Linn. Soc. 80: 369–383.
Rissler, L.J. & Apodaca, J.J. 2007. Adding more ecology into
species delimitation: ecological niche models and phylogeog-
raphy help define cryptic species in the black salamander
(Aneides flavipunctatus). Syst. Biol. 56: 924–942.
Rojas-Soto, O.R., Alcantara-Ayala, O. & Navarro-Siguenza, A.G.
2003. Regionalization of the avifauna of the Baja California
Peninsula, Mexico: a parsimony analysis of endemicity and
distributional modeling approach. J. Biogeogr. 30: 449–461.
Soberon, J. & Peterson, A.T. 2005. Interpretation of models of
fundamental ecological niches and species distributional areas.
Biodivers. Inform. 2: 1–10.
SPSS. 2009. SPSS Base 17.0 for Mac User’s Guide. SPSS, Inc.,
Chicago, IL.
Stickel, L.F. & Stickel, H.S. 1949. A Sigmodon and Baiomys
population in ungrazed and unburned Texas prairie.
J. Mammal. 30: 141–150.
Stockman, A.K. & Bond, J.E. 2007. Delimiting cohesion species:
extreme population structuring and the role of ecological
interchangeability. Mol. Ecol. 16: 3374–3392.
Stockwell, D.R.B. & Noble, I.R. 1992. Induction of sets of rules
from animal distribution data: a robust and informative
method of data analysis. Math. Comput. Simul. 33: 385–390.
Stockwell, D.R.B. & Peters, D.P. 1999. The GARP modelling
system: problems and solutions to automated spatial predic-
tion. Int. J. Geogr. Inf. Sci. 13: 143–158.
Sullivan, J., Markert, J.A. & Kilpatrick, C.W. 1997. Biogeogra-
phy and molecular systematics of the Peromyscus aztecus group.
Syst. Biol. 46: 426–440.
Sullivan, J., Arellano, E. & Rogers, D. 2000. Comparative
phylogeography of Mesoamerican highland rodents: con-
certed versus independent response to past climatic fluctua-
tions. Am. Nat. 155: 755–768.
Swenson, N.G. 2008. The past and future influence of
geographic information systems on hybrid zone, phylo-
geographic and speciation research. J. Evol. Biol. 21: 421–
434.
Templeton, A.R. 2001. Using phylogeographic analyses of gene
trees to test species status and boundaries. Mol. Ecol. 10: 779–
791.
Terblanche, J.S. & Kleynhans, E. 2009. Phenotypic plasticity of
desiccation resistance in Glossina puparia: are there ecotype
constraints on acclimation responses? J. Evol. Biol. 22: 1636–
1648.
Triant, D.A. & DeWoody, J.A. 2006. Accelerated molecular
evolution in Microtus (Rodentia) as assessed via complete
mitochondrial genome sequences. Genetica 128: 95–108.
USGS (United States Geological Survey). 2001. HYDRO 1K:
Elevation Derivative Database. http://edc.usgs.gov/products/
elevation/gtopo30/hydro/namerica.html.
Van Valen, L. 1976. Ecological species, multispecies, and oaks.
Taxon 25: 233–239.
Wiens, J.J. 2007. Species delimitation: new approaches for
discovering diversity. Syst. Biol. 56: 875–878.
Wiens, J.J. & Graham, C.H. 2005. Niche conservatism: integrat-
ing evolution, ecology, and conservation biology. Annu. Rev.
Ecol. Evol. Syst. 36: 519–539.
Wiens, J.J. & Servedio, M.R. 2000. Species delimitation in
systematics: inferring diagnostic differences between species.
P. R. Soc. Lond. B Biol. Sci. 267: 631–636.
Wiley, R.H. 1981. Social structure and individual ontogenies:
problems of description, mechanism, and evolution. In:
Perspectives in Ethology, Vol. 4 (P.P.G. Bateson & P.H. Klopfer,
eds), pp. 105–133. Plenum Press, New York.
Wisz, M.S., Hijmans, R.J., Li, J., Peterson, A.T., Graham, C.H.
& Guisan, A. 2008. Effects of sample size on the perfor-
mance of species distribution models. Divers. Distrib. 14: 763–
773.
Zink, R.M. & Barrowclough, G.F. 2008. Mitochondrial DNA
under siege in avian phylogeography. Mol. Ecol. 17: 2107–
2121.
Received 29 April 2008; revised 15 October 2009; accepted 19 October
2009
270 D. MART INEZ-GORDILLO ET AL.
ª 2 0 0 9 T H E A U T H O R S . J . E V O L . B I O L . 2 3 ( 2 0 1 0 ) 2 5 9 – 2 7 0
J O U R N A L C O M P I L A T I O N ª 2 0 0 9 E U R O P E A N S O C I E T Y F O R E V O L U T I O N A R Y B I O L O G Y