Ecological Aspects of ntcA Gene Expression and Its Use as an Indicator of the Nitrogen Status of...
10
APPLIED AND ENVIRONMENTAL MICROBIOLOGY, 0099-2240/01/$04.0010 DOI: 10.1128/AEM.67.8.3340–3349.2001 Aug. 2001, p. 3340–3349 Vol. 67, No. 8 Copyright © 2001, American Society for Microbiology. All Rights Reserved. Ecological Aspects of ntcA Gene Expression and Its Use as an Indicator of the Nitrogen Status of Marine Synechococcus spp. DEBBIE LINDELL² AND ANTON F. POST* H. Steinitz Marine Biology Laboratory, Interuniversity Institute for Marine Sciences, Eilat 88103, and Department of Microbial and Molecular Ecology, Hebrew University of Jerusalem, Jerusalem, Israel Received 22 March 2001/Accepted 18 May 2001 Nitrogen nutrition in cyanobacteria is regulated by NtcA, a transcriptional activator that is subject to nega- tive control by ammonium. Using Synechococcus sp. strain WH7803 as a model organism, we show that ntcA expres- sion was induced when cells were exposed to nitrogen stress but not when they were subjected to phosphorus or iron deprivation. Transcript levels accumulated in cells grown on a variety of inorganic and organic nitrogen sources, with the sole exception of ammonium. ntcA transcription was induced when ammonium levels dropped below 1 mM and reached maximal levels within 2 h. Furthermore, the addition of more than 1 mM ammonium led to a rapid decline in ntcA mRNA. The negative effect of ammonium was prevented by the addition of L- methionine-D,L-sulfoximine (MSX) and azaserine, inhibitors of ammonium assimilation. Thus, basal ntcA tran- script levels are indicative of ammonium utilization. Conversely, the highest ntcA transcript levels were found in cells lacking a nitrogen source capable of supporting growth. Therefore, maximal ntcA expression would indicate nitrogen deprivation. This state of nitrogen deprivation was induced by a 1-h incubation with MSX. The rapid response of ntcA gene expression to the addition of ammonium and MSX was used to design a pro- tocol for assessing relative ntcA transcript levels in field populations of cyanobacteria, from which their ni- trogen status can be inferred. ntcA was basally expressed in Synechococcus at a nutrient-enriched site at the northern tip of the Gulf of Aqaba, Red Sea. Therefore, these cyanobacteria were not nitrogen stressed, and their nitrogen requirements were met by regenerated nitrogen in the form of ammonium. Phytoplankton biomass is thought to be limited by nitrogen availability in many oligotrophic bodies of water (10, 54). Yet the growth of all phytoplankton taxa in such waters is not nec- essarily rate limited. A significant proportion of phytoplankton biomass and production in oligotrophic seas is contributed by unicellular cyanobacteria of the genera Synechococcus and Pro- chlorococcus (3, 5, 43). These picophytoplankton taxa grow rapidly despite low ambient nitrogen concentrations in oligo- trophic waters (for a review, see reference 15). It has been hypothesized that they acquire the nitrogen they require for growth from nitrogen sources that are rapidly recycled in the photic layer (24, 45). However, no unequivocal evidence for the exclusive utilization of regenerated nitrogen sources (e.g., NH 4 1 and organic N) by these picophytoplanktonic taxa exists (6, 9, 53). Nor is it apparent whether the use of such nitrogen sources enables these taxa to avoid nitrogen stress. This is mainly because standard oceanographic methods are not con- ducive to assessing nitrogen deprivation of and nitrogen source utilization by (defined here collectively as the nitrogen status) a certain phytoplankton taxon among the myriad of organisms found in the sea. Therefore, it is necessary to develop tech- niques capable of assessing the nitrogen status of phytoplank- ton along taxonomic lines. Ammonium is the preferred source of inorganic nitrogen in cyanobacteria (13, 18, 34, 35). It may be obtained from the environment by either passive diffusion or active uptake and is assimilated into organic matter via the activities of glutamine synthetase (GS) and glutamate synthase (GOGAT) (13). In the absence of sufficient ammonium, the cyanobacterial cell undergoes a series of adaptive processes in order to obtain the nitrogen required for growth and survival. The initial responses to ammonium deficiency include the induction of higher-affin- ity ammonium uptake systems and the synthesis of proteins required for the utilization of other nitrogenous compounds such as nitrate, nitrite, urea, and amino acids (13). The utili- zation of alternative nitrogen sources is energetically more expensive than that of ammonium as, in most cases, it requires both active transport over the cell membrane and conversion to ammonium before assimilation into organic compounds (13, 23). It should be noted that ammonium prevents the utilization of alternative nitrogen sources such as nitrate and nitrite by inhibiting their transport and repressing synthesis of the pro- teins required for their assimilation at the level of gene tran- scription (13, 23, 37, 52). Once all external nitrogen sources suitable for growth have been exploited, the cell enters a stage of nitrogen deprivation. During the adaptation of the cell to nitrogen stress, growth may continue transiently as many phys- iological changes take place, including the specific degradation of phycobiliproteins, which results in chlorosis (22, 56). This process would allow reuse of the nitrogen for the synthesis of proteins required for survival under conditions of nitrogen deprivation (21, 22). Growth is halted once both external and internal nitrogen supplies have been exhausted. Synthesis of the nitrogen regulatory protein, NtcA, is an essential step in cyanobacterial adaptation to conditions of ammonium depletion. ntcA mutants are incapable of growth on nitrate and nitrite (55; A. Moyal, D. Lindell, and A. F. Post, * Corresponding author. Mailing address: H. Steinitz Marine Biol- ogy Laboratory, Interuniversity Institute for Marine Sciences, P.O. Box 469, Eilat 88103, Israel. Phone: 972-76-360-122. Fax: 972-76-374-329. E-mail: [email protected]. ² Present address: Massachusetts Institute of Technology, 48-336, 77 Massachusetts Ave., Cambridge, MA 02139. 3340 on May 15, 2016 by guest http://aem.asm.org/ Downloaded from
Transcript of Ecological Aspects of ntcA Gene Expression and Its Use as an Indicator of the Nitrogen Status of...
APPLIED AND ENVIRONMENTAL MICROBIOLOGY,0099-2240/01/$04.0010 DOI: 10.1128/AEM.67.8.3340–3349.2001
Aug. 2001, p. 3340–3349 Vol. 67, No. 8
Copyright © 2001, American Society for Microbiology. All Rights Reserved.
Ecological Aspects of ntcA Gene Expression and Its Use as an Indicatorof the Nitrogen Status of Marine Synechococcus spp.
DEBBIE LINDELL† AND ANTON F. POST*
H. Steinitz Marine Biology Laboratory, Interuniversity Institute for Marine Sciences, Eilat 88103, and Department ofMicrobial and Molecular Ecology, Hebrew University of Jerusalem, Jerusalem, Israel
Received 22 March 2001/Accepted 18 May 2001
Nitrogen nutrition in cyanobacteria is regulated by NtcA, a transcriptional activator that is subject to nega-tive control by ammonium. Using Synechococcus sp. strain WH7803 as a model organism, we show that ntcA expres-sion was induced when cells were exposed to nitrogen stress but not when they were subjected to phosphorusor iron deprivation. Transcript levels accumulated in cells grown on a variety of inorganic and organic nitrogensources, with the sole exception of ammonium. ntcA transcription was induced when ammonium levels droppedbelow 1 mM and reached maximal levels within 2 h. Furthermore, the addition of more than 1 mM ammoniumled to a rapid decline in ntcA mRNA. The negative effect of ammonium was prevented by the addition of L-methionine-D,L-sulfoximine (MSX) and azaserine, inhibitors of ammonium assimilation. Thus, basal ntcA tran-script levels are indicative of ammonium utilization. Conversely, the highest ntcA transcript levels were foundin cells lacking a nitrogen source capable of supporting growth. Therefore, maximal ntcA expression wouldindicate nitrogen deprivation. This state of nitrogen deprivation was induced by a 1-h incubation with MSX.The rapid response of ntcA gene expression to the addition of ammonium and MSX was used to design a pro-tocol for assessing relative ntcA transcript levels in field populations of cyanobacteria, from which their ni-trogen status can be inferred. ntcA was basally expressed in Synechococcus at a nutrient-enriched site at thenorthern tip of the Gulf of Aqaba, Red Sea. Therefore, these cyanobacteria were not nitrogen stressed, and theirnitrogen requirements were met by regenerated nitrogen in the form of ammonium.
Phytoplankton biomass is thought to be limited by nitrogenavailability in many oligotrophic bodies of water (10, 54). Yetthe growth of all phytoplankton taxa in such waters is not nec-essarily rate limited. A significant proportion of phytoplanktonbiomass and production in oligotrophic seas is contributed byunicellular cyanobacteria of the genera Synechococcus and Pro-chlorococcus (3, 5, 43). These picophytoplankton taxa growrapidly despite low ambient nitrogen concentrations in oligo-trophic waters (for a review, see reference 15). It has beenhypothesized that they acquire the nitrogen they require forgrowth from nitrogen sources that are rapidly recycled in thephotic layer (24, 45). However, no unequivocal evidence forthe exclusive utilization of regenerated nitrogen sources (e.g.,NH4
1 and organic N) by these picophytoplanktonic taxa exists(6, 9, 53). Nor is it apparent whether the use of such nitrogensources enables these taxa to avoid nitrogen stress. This ismainly because standard oceanographic methods are not con-ducive to assessing nitrogen deprivation of and nitrogen sourceutilization by (defined here collectively as the nitrogen status)a certain phytoplankton taxon among the myriad of organismsfound in the sea. Therefore, it is necessary to develop tech-niques capable of assessing the nitrogen status of phytoplank-ton along taxonomic lines.
Ammonium is the preferred source of inorganic nitrogen incyanobacteria (13, 18, 34, 35). It may be obtained from the
environment by either passive diffusion or active uptake and isassimilated into organic matter via the activities of glutaminesynthetase (GS) and glutamate synthase (GOGAT) (13). Inthe absence of sufficient ammonium, the cyanobacterial cellundergoes a series of adaptive processes in order to obtain thenitrogen required for growth and survival. The initial responsesto ammonium deficiency include the induction of higher-affin-ity ammonium uptake systems and the synthesis of proteinsrequired for the utilization of other nitrogenous compoundssuch as nitrate, nitrite, urea, and amino acids (13). The utili-zation of alternative nitrogen sources is energetically moreexpensive than that of ammonium as, in most cases, it requiresboth active transport over the cell membrane and conversionto ammonium before assimilation into organic compounds (13,23). It should be noted that ammonium prevents the utilizationof alternative nitrogen sources such as nitrate and nitrite byinhibiting their transport and repressing synthesis of the pro-teins required for their assimilation at the level of gene tran-scription (13, 23, 37, 52). Once all external nitrogen sourcessuitable for growth have been exploited, the cell enters a stageof nitrogen deprivation. During the adaptation of the cell tonitrogen stress, growth may continue transiently as many phys-iological changes take place, including the specific degradationof phycobiliproteins, which results in chlorosis (22, 56). Thisprocess would allow reuse of the nitrogen for the synthesis ofproteins required for survival under conditions of nitrogendeprivation (21, 22). Growth is halted once both external andinternal nitrogen supplies have been exhausted.
Synthesis of the nitrogen regulatory protein, NtcA, is anessential step in cyanobacterial adaptation to conditions ofammonium depletion. ntcA mutants are incapable of growthon nitrate and nitrite (55; A. Moyal, D. Lindell, and A. F. Post,
* Corresponding author. Mailing address: H. Steinitz Marine Biol-ogy Laboratory, Interuniversity Institute for Marine Sciences, P.O. Box469, Eilat 88103, Israel. Phone: 972-76-360-122. Fax: 972-76-374-329.E-mail: [email protected].
† Present address: Massachusetts Institute of Technology, 48-336, 77Massachusetts Ave., Cambridge, MA 02139.
3340
on May 15, 2016 by guest
http://aem.asm
.org/D
ownloaded from
submitted for publication), and they do not degrade phycobil-iproteins in a timely manner under conditions of nitrogendepletion (47; Moyal et al., submitted). This transcriptionalactivator is subject to negative control by ammonium at thelevel of gene expression (34, 37). ntcA expression is down-regulated to basal levels in the presence of ammonium. In theabsence of ammonium, NtcA enhances the expression of itsown gene as well as of those required for the uptake andassimilation of nitrogen sources like nitrate and nitrite (37;Moyal et al., submitted). However, ntcA expression levels ap-pear to be higher under conditions of nitrogen deprivationthan in nitrate-grown cells (34). NtcA may also be involved inthe expression of genes required for urea utilization (7). Themode of action of NtcA in the process of chlorosis underconditions of nitrogen depletion has yet to be elucidated.
The responsiveness of ntcA to nitrogen availability and thepivotal role it plays in the adaptation of cells to conditions ofammonium and nitrogen depletion suggests that basal andmaximal ntcA expression may be useful indicators of ammo-nium sufficiency and nitrogen deprivation, respectively, in fieldpopulations of cyanobacteria. As pointed out by others (31, 41,50), before a gene or protein can be used in field studies, itspattern of expression must be rigorously studied in relation toappropriate environmental factors under controlled laboratoryconditions. In this study we focus on the response of ntcA geneexpression to ecologically relevant nitrogen conditions, and wedevelop a protocol for the investigation of the nitrogen statusof cyanobacterial field populations using ntcA gene expression.Our model organism for this study is Synechococcus sp. strainWH7803, a strain type with representatives found in variousseas including the Red Sea (4, 36, 44).
MATERIALS AND METHODS
Culture conditions. Marine Synechococcus sp. strain WH7803 was grown inbatch cultures on ASW (56), a defined artificial seawater medium buffered to pH8, modified as previously described to remove inorganic nitrogen from the tracemetal mix (34). The medium was further modified by replacing Tris with HEPES.ASWNO3
and ASWNH4contained 9 mM NO3
2 and 2 mM NH41 as sole nitrogen
sources, respectively, whereas ASW0 was devoid of a combined nitrogen source.Organic N sources used in this study were filter sterilized before addition toASW0 medium. The compositions of organic nitrogen mixes were as follows: forpurines, 100 mM (each) adenine, xanthine, guanine, and hypoxanthine; for pyri-midines, 100 mM (each) cytosine, thymine, and uracil; for amides, 100 mM (each)formamide and acetamide; for basal medium Eagle (BME) amino acids, between50 to 100 mM L isomers of arginine, cysteine, histidine, isoleucine, leucine, lysine,methionine, phenylalanine, threonine, tryptophan, tyrosine, and valine with theaddition of glutamine. The organic N sources used in this study were obtainedfrom Sigma Chemicals except for the BME amino acid mix which was suppliedby Biological Industries (Beit HaEmek, Israel) and were of tissue culture grade.NH4
1 concentrations were determined during growth experiments on organicsources using a sodium sulfite-adjusted orthophthaldialdehyde method (29) toensure that ammonium did not accumulate due to spontaneous release from theorganic sources.
Cultures were grown at 25°C under continuous white light (provided by coolfluorescent lamps) at an intensity of 40 to 50 mmol of photons z m22 z s21 withconstant agitation on an orbital shaker at 125 rpm. Growth of cultures wasmonitored by optical density at 750 nm. Doubling times were in the range of 13to 16 h. Cells were maintained for a minimum of 5 generations in exponentialgrowth prior to experimentation.
For nitrogen source and nutrient deprivation experiments, cells were collectedby centrifugation at 25°C for 10 min at 10,000 3 g, washed twice, and thenresuspended in the new growth medium. Samples for RNA analysis were takenfrom cultures in early- to mid-log phase except during nutrient deprivationexperiments. Each experiment was repeated independently at least twice.
RNA extraction and analyses from Synechococcus cultures. Cells were har-vested by filtration onto 0.45-mm-pore-size polycarbonate membrane filters(Poretics). RNA was extracted with the Ultraspec RNA reagent (Biotecx) or byusing a hot phenol method (48) modified as set out by Lindell et al. (34) andfollowed by DNase treatment. Total RNA was quantified spectrophotometricallyand from ethidium bromide-stained RNA run on nondenaturing agarose gels.
RNase protection assays (RPAs) were carried out on equal amounts of totalRNA with a probe internal to the ntcA gene (designated the internal probe). Inone experiment a probe that is partially upstream of the ntcA gene (referred tobelow as the upstream probe) was also used. RPA analysis with the internalprobe produces a single protected fragment of 450 bp, whereas the upstreamprobe produces two protected fragments: a 400- and a 165-bp fragment corre-sponding to the constitutively expressed and ammonium-regulated ntcA tran-scripts, respectively (34). Antisense biotinylated RNA probes were transcribedusing the Ambion BrightStar BiotinScript kit as previously described (34). TheAmbion RPAII kit was used for RPAs as follows. After coprecipitation, theprobe and RNA were hybridized for approximately 16 h at 43.5°C in 20 ml ofhybridization solution. The denatured RNA and probe were electrotransferred(NovaBlot; Pharmacia) for 30 min at 4 mA z cm22 to a positively charged nylonmembrane (BrightStar Plus membrane; Ambion). Nonisotopic detection wascarried out using Ambion’s BrightStar BiotinDetect kit followed by exposure onX-ray film. ntcA transcript levels were quantified using a model SL-TRFF scan-ning densitometer (Biomed Instruments Inc., Falkerton, Calif.).
It should be noted that the experiments presented in Fig. 1, 2, and 6 werecarried out using RNA extracted using the Biotecx reagent. RNA extracted inthis way produced a low signal-to-noise ratio during the RPA procedure. Thus,banding in these three experiments appears somewhat fainter than in experi-ments in which the RNA was extracted with hot phenol.
NH41 uptake assays in Synechococcus cultures. Cells were grown on ASWNH4
,washed twice, and resuspended in filter-sterilized ASW0 plus 6 mM NH4Cl fromwhich HEPES was omitted. The pH remained at 8 to 8.2 throughout the uptakeexperiments. The concentration of NH4
1 remaining in the medium was deter-mined with time using the Spectroquant kit for ammonium determination(Merck), which is based on the indophenol blue reaction. Absorbance wasmeasured at 690 nm using a 5-cm cell. The limit of detection was 100 nM with aprecision of 650 nM. ASW0 medium for standard curves was prepared byadjusting the pH to 13 and bubbling with helium to remove traces of ammonium.This medium was then spiked with different ammonium concentrations andassayed.
Field sampling. Twelve liters of seawater was collected with Niskin bottlesfrom a depth of 5 m at a nutrient-enriched site (the Ardag offshore floatingcommercial fish farm) at the northern tip of the Gulf of Aqaba (Red Sea) on 11April 2000 at 8:45 am and again at 9:15 am and transported to the laboratory.This site has nutrient concentrations higher than those in the surrounding oli-gotrophic waters, but they are similar to those found in many coastal regions (seeResults). Subsamples were taken for the determination of Synechococcus cellabundance enumerated by epifluorescence microscopy as outlined by Lindell andPost (33), nitrate and nitrite concentrations were determined according to thework of Parsons et al. (42) with a Quick Chem 8000 autosampler (LACHATInstruments), and the ammonium concentration was estimated using the or-thophthaldialdehyde method (29). The remaining water was split into 3 equalvolumes of 3.4 liters and kept at 25°C for 60 min, illuminated with 200 mmol ofphotons z m22 z s21 with the following additions: 100 mM NH4Cl was added toone aliquot, 100 mM L-methionine-D,L-sulfoximine (MSX) was added to a secondaliquot, and the third aliquot remained untreated. Each subsample was thenfiltered onto a 47-mm-diameter, 0.45-mm-pore-size Supor-450 filter (GelmanSciences) under a vacuum of 25 in of Hg while illuminated. The filter wasimmersed in storage buffer (20 mM EDTA, 400 mM NaCl, 0.75 M sucrose, 50mM Tris [pH 9]) according to the method of Gordon and Giovannoni (20),frozen immediately in liquid nitrogen, and stored at 270°C until nucleic acidextraction.
RNA extraction from field samples. Samples were thawed on ice and incu-bated with lysozyme (1 mg z ml21) at 37°C for 15 min. The pH of the sample wasbrought down to 7.5 with HCl. Sodium dodecyl sulfate (SDS) was added to a finalconcentration of 1%, and the sample was heated in a microwave to near-boiling.An equal volume of phenol (pH 7.8) preheated to 65°C was added, and thesample was mixed vigorously and incubated at 65°C for 5 min. An equal volumeof chloroform-isoamyl alcohol (24:1) was added and mixed vigorously beforecentrifugation at 1,700 3 g for 5 min. The sample was extracted again with anequal volume of phenol-chloroform-isoamyl alcohol (25:24:1), followed by ex-traction with an equal volume of chloroform-isoamyl alcohol (24:1). Nucleicacids were precipitated with 0.4 volume of 7.5 M ammonium acetate and 1volume of isopropanol at 220°C for 1 h and centrifuged at 14,000 3 g for 30 min
VOL. 67, 2001 ntcA RESPONSE TO NUTRIENTS 3341
on May 15, 2016 by guest
http://aem.asm
.org/D
ownloaded from
at 4°C. Nucleic acids were resuspended in TE2 (10 mM Tris–0.1 mM EDTA [pH8]) prior to the removal of DNA using Ambion’s DNA-free. The absence of DNAwas verified by nested PCR for the maximal number of cycles as described below.
Reverse transcription. Reverse transcription was carried out with 500 ng oftotal RNA denatured for 10 min at 70°C in 20-ml reaction mixtures containing 50mM Tris-HCl (pH 8.3), 75 mM KCl, 3 mM MgCl2, 0.5 mM deoxynucleosidetriphosphates (dNTPs), 10 mM dithiothreitol (DTT), 40 U of RNasin (Promega),and 2 pmol of primer 4AR [59 AT GGC (C/T)TC GGC (G/T)AT GGC (C/T)TG(A/G)T 39] at 42°C with 65 U of SuperScript II (Gibco-BRL) reverse transcrip-tase. The reverse primer 4AR is located at bp positions 551 to 530 relative to thefirst nucleotide of the ntcA initiation codon found in Synechococcus sp. strainWH7803.
Nested PCR. Two microliters of the reverse transcription reaction product wasused in the first 20-ml PCR (PCR1) with primers 1AF [59 AT(A/T/C) TT(C/T)TT(C/T) CC(G/T/C) GGG GA(C/T) CC(G/A/T) GC 39], which anneals to bppositions 103 to 125 relative to the first nucleotide of the initiation codon, and4AR. These primers amplify a 449-bp ntcA fragment from all marine Synecho-coccus and Prochlorococcus strains tested (data not shown). PCR1 mixturescontained 10 mM Tris-HCl (pH 9), 50 mM KCl, 0.1% Triton X-100, 2 mMMgCl2, 200 mM dNTPs, 2.4 mM 1AF, 0.8 mM 4AR, and 1 U of Taq polymerase(Promega). PCRs were run on an MJ Research thermocycler for 30 cycles ofdenaturation for 1 min at 94°C, annealing for 1 min at 55°C, and elongation for2 min at 68°C following an initial 4-min denaturation step at 94°C. Amplificationwas still in the exponential phase after 30 cycles of PCR1. One microliter of thePCR1 product was used as a template for each of the six or seven second PCRs(PCR2) with primer set G15–16F [a 1:1.3 ratio of primers G15F, 59 GA(A/G)TC(A/C/G/T) GG(G/T/C) GAA GAG ATC AC(C/T) GT 39, and G16F, 59GA(A/G) TC(A/T) GG(A/T) GAA GA(A/G) AT(A/T) AC(A/T) GT 39] andprimer S50R [59 G CAG (A/G)TC (A/G)AT (G/C)GT GAT (G/C)CC (G/C)(A/T/C)G 39]. PCR2 mixtures were 20 ml in volume and contained 10 mM Tris-HCl(pH 9), 50 mM KCl, 0.1% Triton X-100, 1.5 mM MgCl2, 200 mM dNTPs, 0.8 mMG15–16F, 0.8 mM S50R, and 1 U of Taq polymerase (Promega). PCR2 cyclingconditions were identical to those for PCR1 except that reaction tubes wereremoved manually at 2-cycle intervals between 11 and 25 cycles. G15–16F andS50R are located, respectively, at bp positions 178 to 200 and 521 to 500 relativeto the first nucleotide of the ntcA initiation codon and produce a fragment of 344bp. While primer set G15–16F anneals to the ntcA gene from all marine Syn-echococcus and Prochlorococcus strains tested, primer S50R anneals specificallyto Synechococcus strains (data not shown) such that amplification with thisprimer pair yields an ntcA fragment specifically from marine Synechococcus.Reaction mixtures were overlaid with 2 drops of mineral oil (Sigma). PCRproducts were quantified densitometrically using one-dimensional (1D) imageanalysis software (Kodak Digital Science).
RESULTS
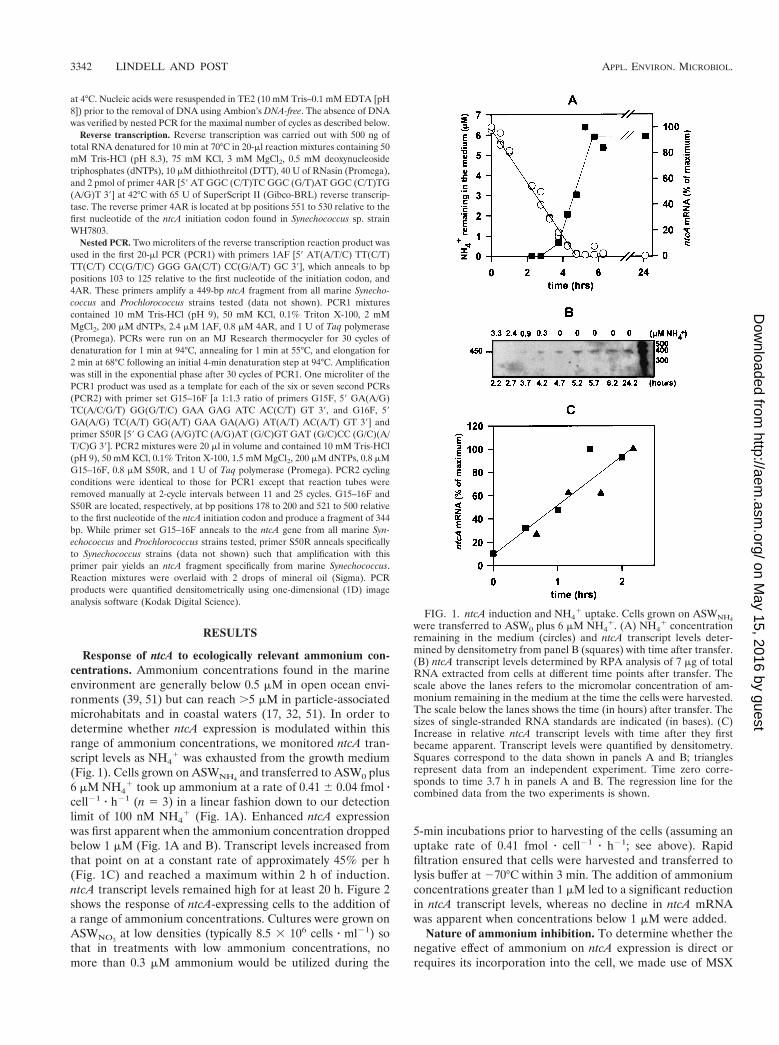
Response of ntcA to ecologically relevant ammonium con-centrations. Ammonium concentrations found in the marineenvironment are generally below 0.5 mM in open ocean envi-ronments (39, 51) but can reach .5 mM in particle-associatedmicrohabitats and in coastal waters (17, 32, 51). In order todetermine whether ntcA expression is modulated within thisrange of ammonium concentrations, we monitored ntcA tran-script levels as NH4
1 was exhausted from the growth medium(Fig. 1). Cells grown on ASWNH4
and transferred to ASW0 plus6 mM NH4
1 took up ammonium at a rate of 0.41 6 0.04 fmol zcell21 z h21 (n 5 3) in a linear fashion down to our detectionlimit of 100 nM NH4
1 (Fig. 1A). Enhanced ntcA expressionwas first apparent when the ammonium concentration droppedbelow 1 mM (Fig. 1A and B). Transcript levels increased fromthat point on at a constant rate of approximately 45% per h(Fig. 1C) and reached a maximum within 2 h of induction.ntcA transcript levels remained high for at least 20 h. Figure 2shows the response of ntcA-expressing cells to the addition ofa range of ammonium concentrations. Cultures were grown onASWNO3
at low densities (typically 8.5 3 106 cells z ml21) sothat in treatments with low ammonium concentrations, nomore than 0.3 mM ammonium would be utilized during the
5-min incubations prior to harvesting of the cells (assuming anuptake rate of 0.41 fmol z cell21 z h21; see above). Rapidfiltration ensured that cells were harvested and transferred tolysis buffer at 270°C within 3 min. The addition of ammoniumconcentrations greater than 1 mM led to a significant reductionin ntcA transcript levels, whereas no decline in ntcA mRNAwas apparent when concentrations below 1 mM were added.
Nature of ammonium inhibition. To determine whether thenegative effect of ammonium on ntcA expression is direct orrequires its incorporation into the cell, we made use of MSX
FIG. 1. ntcA induction and NH41 uptake. Cells grown on ASWNH4
were transferred to ASW0 plus 6 mM NH41. (A) NH4
1 concentrationremaining in the medium (circles) and ntcA transcript levels deter-mined by densitometry from panel B (squares) with time after transfer.(B) ntcA transcript levels determined by RPA analysis of 7 mg of totalRNA extracted from cells at different time points after transfer. Thescale above the lanes refers to the micromolar concentration of am-monium remaining in the medium at the time the cells were harvested.The scale below the lanes shows the time (in hours) after transfer. Thesizes of single-stranded RNA standards are indicated (in bases). (C)Increase in relative ntcA transcript levels with time after they firstbecame apparent. Transcript levels were quantified by densitometry.Squares correspond to the data shown in panels A and B; trianglesrepresent data from an independent experiment. Time zero corre-sponds to time 3.7 h in panels A and B. The regression line for thecombined data from the two experiments is shown.
3342 LINDELL AND POST APPL. ENVIRON. MICROBIOL.
on May 15, 2016 by guest
http://aem.asm
.org/D
ownloaded from

and azaserine, inhibitors of GS and GOGAT, respectively. Theaddition of 100 mM NH4
1 to ASWNO3-grown cells led to a
drastic decline in ntcA transcript levels after 5 min, as expected(Fig. 3A). However, incubation of cells for 1 h with 100 mMMSX prevented the ammonium-mediated decline in ntcAmRNA. The same results were obtained when the cells wereincubated with azaserine (data not shown). These data indicatethat ammonium must be incorporated into cell material via theactivities of GS and GOGAT for its negative effect on ntcAtranscription to occur.
The addition of MSX to both ammonium- and nitrate-growncells led to enhanced ntcA expression within 60 min (Fig. 3B).This suggests that the prevention of ammonium assimilationvia GS served to induce a nitrogen starvation response inSynechococcus sp. strain WH7803. Furthermore, it confirmsthat ntcA expression in nitrate-grown cells is less than maximal(see also Fig. 5C).
An important aspect of the applicability of a molecularprobe is the capability to monitor processes as they occur.Figure 4 shows the time course response of ntcA transcriptionto NH4
1 addition. The addition of 100 mM NH41 to ASWNO3
-grown cells led to an immediate decline in ntcA transcriptlevels (Fig. 4A). Cells that had been starved of a nitrogensource for 20 h responded to NH4
1 addition. However, incontrast to ASWNO3
-grown cells, there was a 15-min delay inresponse (Fig. 4B and C). After this short lag period, ntcAmRNA dropped rapidly to basal levels at a similar rate toASWNO3
-grown cells, with a half-life of approximately 6 minunder the growth conditions used here (Fig. 4C).
Response of ntcA to nitrogen sources. Studies so far havetested the expression of ntcA in the presence of ammonium, inthe presence of nitrate, and in the absence of a combinednitrogen source. In order to determine the response of ntcA to
FIG. 2. Effect of the addition of a range of NH41 concentrations on
ntcA expression. Cells were grown on ASWNO3and exposed for 5 min
to the micromolar concentrations of ammonium indicated above thelanes. ntcA transcript levels were determined by RPA analysis of 13 mgof total cellular RNA. The sizes of single-stranded RNA standards areindicated (in bases).
FIG. 3. (A) Effect of MSX on NH41-promoted decline in ntcA
expression. ntcA transcript levels were determined by RPA analysis of7 mg of total RNA extracted from cells grown on ASWNO3
, either withno addition, incubated for 5 min with 100 mM NH4
1, incubated withthe GS inhibitor MSX (100 mM) for 60 min, or incubated for 60 minwith MSX prior to a 5-min incubation with 100 mM NH4
1. (B) Timeseries of ntcA transcript levels, determined by RPA on 5 mg of RNA,after the addition of 100 mM MSX to cells grown on ASWNO3
(lanesleft of the marker) or ASWNH4
(lanes right of the marker). Time afterMSX addition is given above the lanes. The sizes of single-strandedRNA standards are indicated (in bases).
FIG. 4. Decline of ntcA transcript levels upon the addition of NH41
to cells grown on ASWNO3(A) or deprived of a nitrogen source for
20 h (B). Five micrograms of total RNA, extracted from cells at theindicated times after NH4
1 addition, was subjected to RPA analysis.Times (in minutes) after the addition of NH4
1 (100 mM) are shownabove the lanes. The sizes of single-stranded RNA standards are in-dicated (in bases). (C) Relative ntcA mRNA levels determined bydensitometry and plotted on a semilogarithmic graph. Cells weregrown on ASWNO3
(open symbols) or deprived of a nitrogen source for20 h (solid symbols). Circles correspond to the experiments presentedin panels A and B. Squares are from an independent experiment.Regression lines for the linear portion of each treatment are shown.
VOL. 67, 2001 ntcA RESPONSE TO NUTRIENTS 3343
on May 15, 2016 by guest
http://aem.asm
.org/D
ownloaded from
other potential nitrogen sources found in the sea (e.g., nitriteand a variety of organic nitrogen compounds [1, 51]), we trans-ferred ASWNO3
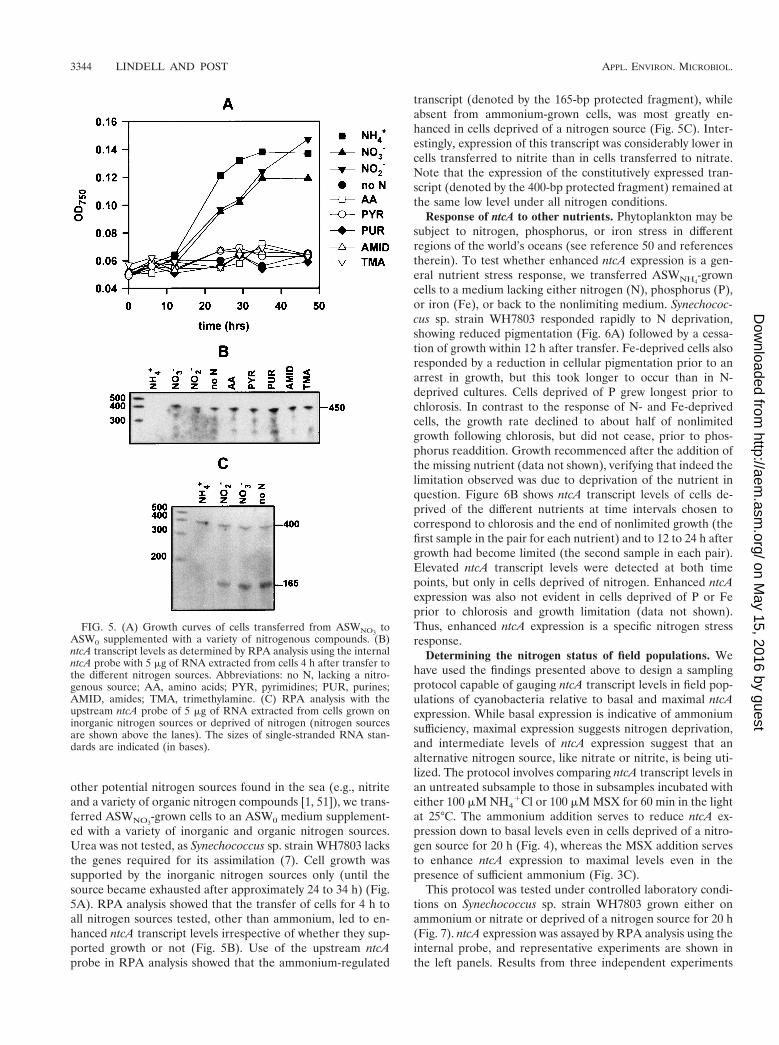
-grown cells to an ASW0 medium supplement-ed with a variety of inorganic and organic nitrogen sources.Urea was not tested, as Synechococcus sp. strain WH7803 lacksthe genes required for its assimilation (7). Cell growth wassupported by the inorganic nitrogen sources only (until thesource became exhausted after approximately 24 to 34 h) (Fig.5A). RPA analysis showed that the transfer of cells for 4 h toall nitrogen sources tested, other than ammonium, led to en-hanced ntcA transcript levels irrespective of whether they sup-ported growth or not (Fig. 5B). Use of the upstream ntcAprobe in RPA analysis showed that the ammonium-regulated
transcript (denoted by the 165-bp protected fragment), whileabsent from ammonium-grown cells, was most greatly en-hanced in cells deprived of a nitrogen source (Fig. 5C). Inter-estingly, expression of this transcript was considerably lower incells transferred to nitrite than in cells transferred to nitrate.Note that the expression of the constitutively expressed tran-script (denoted by the 400-bp protected fragment) remained atthe same low level under all nitrogen conditions.
Response of ntcA to other nutrients. Phytoplankton may besubject to nitrogen, phosphorus, or iron stress in differentregions of the world’s oceans (see reference 50 and referencestherein). To test whether enhanced ntcA expression is a gen-eral nutrient stress response, we transferred ASWNH4
-growncells to a medium lacking either nitrogen (N), phosphorus (P),or iron (Fe), or back to the nonlimiting medium. Synechococ-cus sp. strain WH7803 responded rapidly to N deprivation,showing reduced pigmentation (Fig. 6A) followed by a cessa-tion of growth within 12 h after transfer. Fe-deprived cells alsoresponded by a reduction in cellular pigmentation prior to anarrest in growth, but this took longer to occur than in N-deprived cultures. Cells deprived of P grew longest prior tochlorosis. In contrast to the response of N- and Fe-deprivedcells, the growth rate declined to about half of nonlimitedgrowth following chlorosis, but did not cease, prior to phos-phorus readdition. Growth recommenced after the addition ofthe missing nutrient (data not shown), verifying that indeed thelimitation observed was due to deprivation of the nutrient inquestion. Figure 6B shows ntcA transcript levels of cells de-prived of the different nutrients at time intervals chosen tocorrespond to chlorosis and the end of nonlimited growth (thefirst sample in the pair for each nutrient) and to 12 to 24 h aftergrowth had become limited (the second sample in each pair).Elevated ntcA transcript levels were detected at both timepoints, but only in cells deprived of nitrogen. Enhanced ntcAexpression was also not evident in cells deprived of P or Feprior to chlorosis and growth limitation (data not shown).Thus, enhanced ntcA expression is a specific nitrogen stressresponse.
Determining the nitrogen status of field populations. Wehave used the findings presented above to design a samplingprotocol capable of gauging ntcA transcript levels in field pop-ulations of cyanobacteria relative to basal and maximal ntcAexpression. While basal expression is indicative of ammoniumsufficiency, maximal expression suggests nitrogen deprivation,and intermediate levels of ntcA expression suggest that analternative nitrogen source, like nitrate or nitrite, is being uti-lized. The protocol involves comparing ntcA transcript levels inan untreated subsample to those in subsamples incubated witheither 100 mM NH4
1Cl or 100 mM MSX for 60 min in the lightat 25°C. The ammonium addition serves to reduce ntcA ex-pression down to basal levels even in cells deprived of a nitro-gen source for 20 h (Fig. 4), whereas the MSX addition servesto enhance ntcA expression to maximal levels even in thepresence of sufficient ammonium (Fig. 3C).
This protocol was tested under controlled laboratory condi-tions on Synechococcus sp. strain WH7803 grown either onammonium or nitrate or deprived of a nitrogen source for 20 h(Fig. 7). ntcA expression was assayed by RPA analysis using theinternal probe, and representative experiments are shown inthe left panels. Results from three independent experiments
FIG. 5. (A) Growth curves of cells transferred from ASWNO3to
ASW0 supplemented with a variety of nitrogenous compounds. (B)ntcA transcript levels as determined by RPA analysis using the internalntcA probe with 5 mg of RNA extracted from cells 4 h after transfer tothe different nitrogen sources. Abbreviations: no N, lacking a nitro-genous source; AA, amino acids; PYR, pyrimidines; PUR, purines;AMID, amides; TMA, trimethylamine. (C) RPA analysis with theupstream ntcA probe of 5 mg of RNA extracted from cells grown oninorganic nitrogen sources or deprived of nitrogen (nitrogen sourcesare shown above the lanes). The sizes of single-stranded RNA stan-dards are indicated (in bases).
3344 LINDELL AND POST APPL. ENVIRON. MICROBIOL.
on May 15, 2016 by guest
http://aem.asm
.org/D
ownloaded from

were quantified by densitometry and are presented graphicallyin the right panels. Transcript levels from the “1NH4
1” andthe “1MSX” treatments are presented relative to the “no add”treatment, which was normalized to the value of 1 in all ex-periments regardless of growth conditions. ntcA transcript lev-els in ammonium-grown cells were significantly enhanced (fiveto sevenfold) by the addition of MSX (Fig. 7A), whereas theyremained low upon further addition of ammonium. In contrast,ntcA expression declined fivefold upon addition of ammoniumto nitrogen-deprived cells but did not change upon addition ofMSX (Fig. 7B). However, ntcA expression levels in nitrate-grown cells (Fig. 7C) were both enhanced by the addition ofMSX (two to fourfold) and reduced upon ammonium addition
(declined approximately fivefold). These results conformedwith those expected and suggested that the nitrogen status offield populations of marine Synechococcus can be determinedusing this protocol.
The ntcA expression method was then used to determine thenitrogen status of field populations of Synechococcus (54,000cells z ml2) found at the nutrient-enriched site in the Gulf ofAqaba during the spring bloom of the year 2000. Nitrogenconcentrations in these waters were 0.22 mM nitrite, 0.63 mMnitrate, and approximately 0.6 mM ammonium. A maximalerror of 60.2 mM ammonium resulted from an unexpectedmatrix effect probably caused by residual fish feed. RelativentcA transcript levels for the three subsamples (untreated, am-monium addition, and MSX addition) were determined usingreverse transcription followed by nested PCR (nested RT-PCR). Figure 8A shows the amounts of amplified Synechococ-
FIG. 6. The response of Synechococcus sp. strain WH7803 to nu-trient deprivation. (A) Growth curves of cultures transferred fromASWNH4
to medium lacking in nitrogen (squares), phosphorus (trian-gles), or iron (inverted triangles) or to full growth medium (circles).Zero hours indicates the time of transfer from nutrient-replete tonutrient-depleted medium. Growth prior to 0 h is that of the motherculture used for transfers. Arrows indicate the onset of chlorosis andlimited growth for each nutrient-deprived culture. (B) ntcA transcriptlevels of the cells in panel A, as determined by RPA analysis of 7 mgof total RNA extracted from cells subjected to no (control), N, P, or Fedeprivation. Times after transfer to nutrient-deprived medium areindicated above the lanes. The first sample in each pair coincided withthe onset of limited growth and chlorosis, as marked by the arrows inpanel A, and the second sample in each pair was taken 12 to 24 h aftergrowth limitation set in. The sizes of single-stranded RNA standardsare indicated, in bases.
FIG. 7. Testing of protocol on cultures of Synechococcus sp. strainWH7803. Cells grown on ASWNH4
(A), deprived of a nitrogen sourcefor 20 h (B), or grown on ASWNO3
(C) were subjected to the protocoldescribed in the text. One-third of each culture was incubated for 90min either untreated (no add), with 100 mM NH4Cl (1NH4
1), or with100 mM MSX (1MSX). ntcA transcript levels were analyzed usingRPAs with the internal ntcA probe on 7 mg of total RNA. The leftpanels show the autoradiograms of representative experiments. ntcAtranscript levels were determined densitometrically from three inde-pendent experiments under each growth condition and are showngraphically in the right panels. Transcript levels from the “1NH4
1”and the “1MSX” treatments are presented relative to the “no add”treatment, which was normalized to the value of 1 in all experiments(and thus has no error bars) regardless of growth conditions. Errorbars, standard errors. The sizes of single-stranded-RNA standards areindicated (in bases).
VOL. 67, 2001 ntcA RESPONSE TO NUTRIENTS 3345
on May 15, 2016 by guest
http://aem.asm
.org/D
ownloaded from
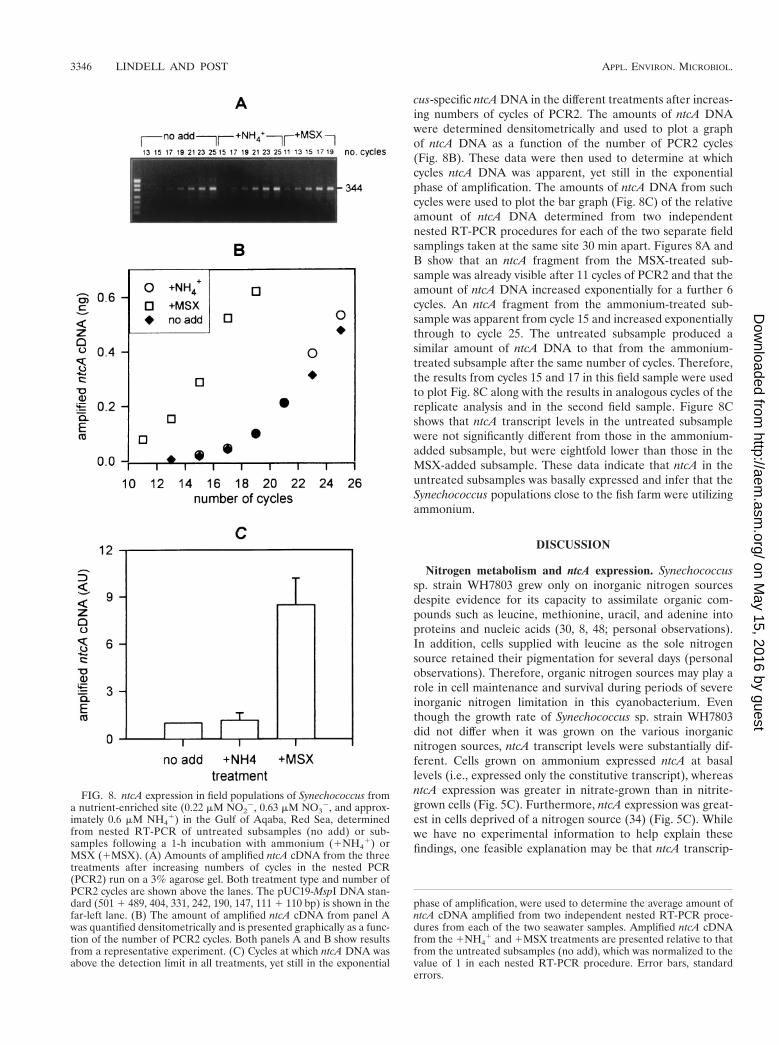
cus-specific ntcA DNA in the different treatments after increas-ing numbers of cycles of PCR2. The amounts of ntcA DNAwere determined densitometrically and used to plot a graphof ntcA DNA as a function of the number of PCR2 cycles(Fig. 8B). These data were then used to determine at whichcycles ntcA DNA was apparent, yet still in the exponentialphase of amplification. The amounts of ntcA DNA from suchcycles were used to plot the bar graph (Fig. 8C) of the relativeamount of ntcA DNA determined from two independentnested RT-PCR procedures for each of the two separate fieldsamplings taken at the same site 30 min apart. Figures 8A andB show that an ntcA fragment from the MSX-treated sub-sample was already visible after 11 cycles of PCR2 and that theamount of ntcA DNA increased exponentially for a further 6cycles. An ntcA fragment from the ammonium-treated sub-sample was apparent from cycle 15 and increased exponentiallythrough to cycle 25. The untreated subsample produced asimilar amount of ntcA DNA to that from the ammonium-treated subsample after the same number of cycles. Therefore,the results from cycles 15 and 17 in this field sample were usedto plot Fig. 8C along with the results in analogous cycles of thereplicate analysis and in the second field sample. Figure 8Cshows that ntcA transcript levels in the untreated subsamplewere not significantly different from those in the ammonium-added subsample, but were eightfold lower than those in theMSX-added subsample. These data indicate that ntcA in theuntreated subsamples was basally expressed and infer that theSynechococcus populations close to the fish farm were utilizingammonium.
DISCUSSION
Nitrogen metabolism and ntcA expression. Synechococcussp. strain WH7803 grew only on inorganic nitrogen sourcesdespite evidence for its capacity to assimilate organic com-pounds such as leucine, methionine, uracil, and adenine intoproteins and nucleic acids (30, 8, 48; personal observations).In addition, cells supplied with leucine as the sole nitrogensource retained their pigmentation for several days (personalobservations). Therefore, organic nitrogen sources may play arole in cell maintenance and survival during periods of severeinorganic nitrogen limitation in this cyanobacterium. Eventhough the growth rate of Synechococcus sp. strain WH7803did not differ when it was grown on the various inorganicnitrogen sources, ntcA transcript levels were substantially dif-ferent. Cells grown on ammonium expressed ntcA at basallevels (i.e., expressed only the constitutive transcript), whereasntcA expression was greater in nitrate-grown than in nitrite-grown cells (Fig. 5C). Furthermore, ntcA expression was great-est in cells deprived of a nitrogen source (34) (Fig. 5C). Whilewe have no experimental information to help explain thesefindings, one feasible explanation may be that ntcA transcrip-
FIG. 8. ntcA expression in field populations of Synechococcus froma nutrient-enriched site (0.22 mM NO2
2, 0.63 mM NO32, and approx-
imately 0.6 mM NH41) in the Gulf of Aqaba, Red Sea, determined
from nested RT-PCR of untreated subsamples (no add) or sub-samples following a 1-h incubation with ammonium (1NH4
1) orMSX (1MSX). (A) Amounts of amplified ntcA cDNA from the threetreatments after increasing numbers of cycles in the nested PCR(PCR2) run on a 3% agarose gel. Both treatment type and number ofPCR2 cycles are shown above the lanes. The pUC19-MspI DNA stan-dard (501 1 489, 404, 331, 242, 190, 147, 111 1 110 bp) is shown in thefar-left lane. (B) The amount of amplified ntcA cDNA from panel Awas quantified densitometrically and is presented graphically as a func-tion of the number of PCR2 cycles. Both panels A and B show resultsfrom a representative experiment. (C) Cycles at which ntcA DNA wasabove the detection limit in all treatments, yet still in the exponential
phase of amplification, were used to determine the average amount ofntcA cDNA amplified from two independent nested RT-PCR proce-dures from each of the two seawater samples. Amplified ntcA cDNAfrom the 1NH4
1 and 1MSX treatments are presented relative to thatfrom the untreated subsamples (no add), which was normalized to thevalue of 1 in each nested RT-PCR procedure. Error bars, standarderrors.
3346 LINDELL AND POST APPL. ENVIRON. MICROBIOL.
on May 15, 2016 by guest
http://aem.asm
.org/D
ownloaded from

tion is controlled by feedback inhibition that depends on therate of supply of nitrogen, if nitrogen derived from nitrite isincorporated more rapidly than that derived from nitrate. Ni-trite assimilation may occur faster than nitrate assimilation be-cause only one reduction step is required and there may bemore than one nitrite transport system (13). Furthermore, ni-trite assimilation is energetically cheaper than nitrate assimi-lation (23).
The ammonium-promoted repression of nitrate and nitriteuptake as well as nirA transcription requires the assimilation ofammonium into carbon skeletons via the GS/GOGAT pathway(13, 52). Our findings show that the negative effect of ammo-nium on ntcA expression also requires its prior assimilation viathe activities of GS and GOGAT (Fig. 3). The direct effectormolecule acting downstream of ammonium assimilation hasremained elusive. It is feasible that the ammonium-promoteddown-regulation of transcription acts separately on ntcA andthe nirA operon. Alternatively, the effector molecule may di-rectly affect ntcA transcription, whereas the effect on ntcA-regulated genes like nirA may be due to the absence of NtcA.
The prerequisite of ammonium assimilation for the declinein ntcA transcript levels could explain the observed delay in theresponse of nitrogen-deprived cells following ammonium ad-dition. Ammonium uptake or assimilation may take time tocommence following nitrogen deprivation. It is also possiblethat internal ammonium supplies or the direct effector mole-cule leading to ammonium-promoted down-regulation takestime to accumulate subsequent to starvation.
The inhibition of GS activity by the addition of MSX led toenhanced ntcA expression (Fig. 3B). This mimics the responsefor nitrogen deprivation despite the presence of suitable nitro-gen sources, as shown by halted growth after the addition ofMSX (36). This suggests that the major, if not the sole, path-way for the assimilation of ammonium is via the activity ofGS in Synechococcus sp. strain WH7803. The addition ofMSX to Anacystis nidulans growing on nitrate or ammoniumalso invokes a nitrogen starvation response. In these cells MSXserved to stimulate nitrate and nitrite uptake and reductionrates (11, 12, 27, 28). Furthermore the addition of MSX toSynechococcus sp. strain PCC 7942 led to enhanced expressionof the nirA operon (52).
The induction of ntcA gene expression in Synechococcus sp.strain WH7803 occurred when NH4
1 dropped below ca. 1 mM.In the same organism Scanlan et al. (49) found that the ex-pression of a phosphate-binding protein (PstS) was inducedwhen PO4
2 dropped below ca. 50 nM. The 20-fold-higherconcentration required for induction of expression of ntcArelative to pstS is interesting when one considers that the cel-lular requirement of nitrogen and phosphorus for unlimitedgrowth is generally considered to be at a ratio of 16:1 (46). Ittherefore appears that the adaptive responses to low concen-trations of nitrogen and phosphorus are induced at a similarlevel relative to the biochemical requirements of the cells.However, it should be noted that Cuhel and Waterbury (8)reported much higher cellular phosphorus levels for this or-ganism than expected from the Redfield ratio.
ntcA expression as an indicator of the nitrogen status ofSynechococcus spp. For ntcA expression to be a suitable indi-cator of the nitrogen status of field populations of unicellularcyanobacteria, a number of requirements must be met. Previ-
ous reports have shown that the ntcA gene is present in a singlecopy in a wide range of cyanobacteria (14, 34). In a separatestudy we have shown that in the absence of ammonium, ntcAexpression was enhanced over a range of photon fluxes as wellas over the entire diel cycle, but that maximal differencesbetween the constitutive and regulated ntcA transcripts oc-curred in the morning hours (D. Lindell and A. Post, unpub-lished data). Therefore, for highest resolution, field samplingshould be carried out in the morning. In addition, ntcA expres-sion was similarly enhanced in cells grown at 18 and 25°C(Lindell and Post, unpublished), which is within the range oftemperatures usually found in tropical and subtropical waters.Here we have shown that ntcA expression responded specifi-cally to nitrogen availability and that ntcA gene expressionresponded rapidly to ammonium addition and nitrogen depri-vation.
In the discussion below, we assume that ntcA expression andNtcA-regulated nitrogen acquisition in field populations ofmarine Synechococcus are similar to those for the model or-ganism Synechococcus sp. strain WH7803. This is a fair as-sumption considering that these functions are very similar inthe evolutionarily more distant marine and freshwater modelSynechococcus strains, WH7803 and PCC 7942 (compare ref-erences 37 and 55 to reference 34 and Moyal et al., submitted).Moreover, the nucleotide sequences of the ntcA gene are moresimilar among marine Synechococcus strains than between Syn-echococcus sp. strains WH7803 and PCC 7942 (36). We furtherassume that urea utilization is indeed regulated by NtcA (7).
The rapid response of ntcA expression to both ammoniumand MSX enables us to compare actual ntcA transcript levels tobasal and maximal levels. Basal levels of ntcA expression canbe used to infer ammonium sufficiency. The use of inhibitors ofthe assimilation of ammonium showed that ntcA transcriptlevels declined only after ammonium was incorporated intocellular organic matter. Thus, basal ntcA expression is indica-tive not only of the presence of ammonium but of its utiliza-tion by the cell. Furthermore, when Synechococcus sp. strainWH7803 displays basal ntcA expression, it is incapable of uti-lizing nitrate or nitrite (34, 35; Moyal et al., submitted). There-fore, basal ntcA expression is indicative of exclusive ammo-nium utilization. In contrast to basal expression, maximal ntcAexpression is indicative of the absence of a nitrogen sourcecapable of supporting growth. Intermediate transcript levelswill demonstrate that while ammonium supplies are inade-quate to prevent enhanced ntcA expression, a nitrogen sourceis being obtained. However, the identity of these nitrogensources cannot be unequivocally ascertained using the presentprotocol. The discovery of genes or proteins that are specifi-cally induced when alternative nitrogen sources are available(e.g., urea, nitrate, or nitrite) would enable their use in con-juction with ntcA expression analysis to further determine ni-trogen source utilization by Synechococcus.
We have exploited the fact that maximal ntcA expression canbe chemically induced by the addition of MSX and that ex-pression is reduced to basal levels after the addition of ammo-nium to develop a protocol capable of differentiating betweenbasal, maximal, and intermediate levels of ntcA expression. Itshould be noted that this assay relies on the ability of cyanobac-teria to transport MSX into the cell, and it will not be infor-mative for those cells incapable of such transport. The coupling
VOL. 67, 2001 ntcA RESPONSE TO NUTRIENTS 3347
on May 15, 2016 by guest
http://aem.asm
.org/D
ownloaded from
of this protocol to nested RT-PCR expression analysis hasenabled us to determine the nitrogen status of Synechococcusfield populations. RT-PCR rather than RPAs was used fordetermining ntcA expression levels in field populations for twomajor reasons. First, the low abundance of Synechococcus inthe sea (relative to yields achieved in laboratory cultures) re-quires the more-sensitive RT-PCR method for the detection ofntcA mRNA. Second, the use of ntcA primers with differingtaxonomic specificity in RT-PCR enables the assessment of thenitrogen status of cyanobacteria at various taxonomic levels.Such flexibility can not be afforded by RPAs, which are sensi-tive to even minor mismatches between probe and templatesequences. Furthermore, this RT-PCR assay could easily beadapted for use in a quantitative PCR machine.
At the northern tip of the Gulf of Aqaba, at a site withmeasurable levels of nitrate, nitrite, and ammonium (yet below1 mM in all cases), Synechococcus populations were expressingntcA basally (Fig. 8). Therefore these Synechococcus popula-tions were not nitrogen deprived. Moreover, from these resultswe can infer that they were exclusively utilizing regeneratednitrogen in the form of ammonium despite relatively highconcentrations of both nitrate and nitrite. The nitrogen con-centrations at this site are similar to those found in coastal andestuarine waters (32, 51) as well as in association with micro-and macroaggregates and Trichodesmium blooms in oligotro-phic seas (17, 19). It is therefore likely that ntcA would bebasally expressed by Synechococcus populations inhabitingsuch environments. Thus ammonium would be the major, ifnot the sole, nitrogen source utilized by Synechococcus undersuch conditions. Inherent to this situation is the fact that theaction of the transcriptional activator, NtcA, would not berequired for the cell’s nitrogen demands to be met in thesewaters.
At this stage we do not know whether ntcA expression isinduced, and the action of NtcA required, for nitrogen acqui-sition by Synechococcus spp. in the vast regions of the openocean where ammonium is found at nanomolar concentra-tions. Reports of nitrogen preference in the field have shownthat at ambient ammonium concentrations of 1 mM or higher,planktonic assemblages preferentially utilized ammonium irre-spective of the concentrations of other nitrogen sources,whereas at ammonium concentrations below 0.5 to 1 mM,nitrogen sources were used according to availability (16, 38).Other reports, however, show a clear preference for ammo-nium even in oligotrophic waters, where ammonium concen-trations are well below 1 mM (26, 40). In these waters, ammo-nium is rapidly regenerated by bacteria and zooplankton suchthat ammonium utilization is often balanced by its regenera-tion (2, 17, 25). Therefore, the flux of ammonium rather thanambient concentrations is likely to be a better indication ofammonium availability. Whether ntcA gene expression re-sponds to ambient ammonium concentrations or to the flux ofammonium is unclear at this stage. Regardless of this currentuncertainty, by allowing Synechococcus to report on its ownnitrogen status through ntcA expression levels, we will be ableto assess whether field populations of marine Synechococcus inwaters with differing nitrogen regimes are deprived of nitro-gen, are utilizing a suitable nitrogen source, or are thrivingsolely on ammonium.
ACKNOWLEDGMENTS
This work was supported by grants from the European Union MastIII program PROMOLEC (MAS3-CT97-0128), the Ecological Foun-dation of the Keren Kayemet Le’Israel (190/1/702/6), and the MosheShilo Center for Marine Biogeochemistry, Minerva Stiftung-Gesell-schaft fuer die Forschung, Munich, Germany.
We thank Nick Fuller and Efrat David for the OPA ammoniummeasurements during organic N experiments and field sampling re-spectively, Aliza Moyal for help with ammonium uptake experiments,and Tanya Korpal and Boaz Lazar for the nitrate and nitrite fieldmeasurements. We thank the Ardag fish farm for permission to samplefrom their farm and Dror Angel and Noa Eden for logistic help withthe field sampling. We also thank Gitai Yahel, Nir Peleg, and twoanonymous reviewers for constructive comments on an earlier versionof the manuscript.
REFERENCES
1. Antia, N. J., P. J. Harrison, and L. Oliveira. 1991. The role of dissolvedorganic nitrogen in phytoplankton nutrition, cell biology and ecology. Phy-cologia 30:1–89.
2. Bronk, D. A., and B. B. Ward. 1999. Gross and net nitrogen uptake and DONrelease in the euphotic zone of Monterey Bay, California. Limnol. Oceanogr.44:573–585.
3. Burkhill, P. H., R. J. G. Leakey, N. J. P. Owens, and R. F. C. Mantoura. 1993.Synechococcus and its importance to the microbial food web of the north-western Indian Ocean. Deep-Sea Res. 40:773–782.
4. Campbell, L., and E. J. Carpenter. 1987. Characterization of phycoerythrin-containing Synechococcus spp. by immunofluorescence. J. Plank. Res. 9:1167–1181.
5. Campbell, L., H. Liu, H. A. Nolla, and D. Vaulot. 1997. Annual variability ofphytoplankton and bacteria in the subtropical North Pacific ocean at stationALOHA during the 1991–1994 ENSO event. Deep-Sea Res. 44:167–192.
6. Chisholm, S. W. 1992. Phytoplankton size, p. 213–237. In P. G. Falkowskiand A. D. Woodhead (ed.), Primary productivity and biogeochemical cyclesin the sea. Plenum Press, New York, N.Y.
7. Collier, J. C., B. Brahamsha, and B. Palenik. 1999. The marine cyanobac-terium Synechococcus sp. WH7805 requires urease (urea amidohydrolase,EC 3.5.1.5) to utilize urea as a nitrogen source: molecular-genetic andbiochemical analysis of the enzyme. Microbiology 145:447–459.
8. Cuhel, R. L., and J. B. Waterbury. 1984. Biochemical composition andshort-term nutrient incorporation patterns in a unicellular marine cyanobac-terium, Synechococcus sp. Limnol. Oceanogr. 29:370–374.
9. Dauchez, S., L. Legendre, L. Fortier, and M. Levasseur. 1996. Nitrate uptakeby size-fractionated phytoplankton on the Scotian Shelf (Northwest Atlan-tic): spatial and temporal variability. J. Plank. Res. 18:577–595.
10. Fanning, K. A. 1992. Nutrient provinces in the sea: concentration ratios,reaction rate ratios, and ideal covariation. J. Geophys. Res. 97:5693–5712.
11. Flores, E., M. G. Guerrero, and M. Losada. 1980. Short-term ammoniuminhibition of nitrate utilization by Anacystis nidulans and other cyanobacte-ria. Arch. Microbiol. 128:137–144.
12. Flores, E., A. Herrero, and M. G. Guerrero. 1987. Nitrite uptake and itsregulation in the cyanobacterium Anacystis nidulans. Biochim. Biophys. Acta896:103–108.
13. Flores, E., and A. Herrero. 1994. Assimilatory nitrogen metabolism and itsregulation, p. 487–517. In D. A. Bryant (ed.), The molecular biology ofcyanobacteria. Kluwer Academic Publishers, Dordrecht, The Netherlands.
14. Frias, J. E., A. Merida, A. Herrero, J. Martin-Nieto, and E. Flores. 1993.General distribution of the nitrogen control gene ntcA in cyanobacteria.J. Bacteriol. 175:5710–5713.
15. Furnas, M., and N. D. Crosbie. 1999. In situ growth dynamics of the pho-tosynthetic prokaryotic picoplankters Synechococcus and Prochlorococcus.Bull. Inst. Oceanogr. 19:387–417.
16. Glibert, P. M., D. C. Biggs, and J. J. McCarthy. 1982. Utilization of ammo-nium and nitrate during austral summer in the Scotia Sea. Deep-Sea Res. 29:837–850.
17. Glibert, P. M., M. R. Dennett, and D. A. Caron. 1988. Nitrogen uptake andNH4
1 regeneration by pelagic microplankton and marine snow from theNorth Atlantic. J. Mar. Res. 46:837–852.
18. Glibert, P. M., and R. T. Ray. 1990. Different patterns of growth and nitogenuptake in two clones of marine Synechococcus spp. Mar. Biol. (Berlin) 107:273–280.
19. Glibert, P. M., and J. M. O’Neil. 1999. Dissolved organic nitrogen releaseand amino acid oxidase activity by Trichodesmium spp. Bull. Inst. Oceanogr.19:265–272.
20. Gordon, D. A., and S. J. Giovannoni. 1996. Detection of stratified microbialpopulations related to Chlorobium and Fibrobacter species in the Atlanticand Pacific Oceans. Appl. Environ. Microbiol. 62:1171–1177.
21. Gorl, M., J. Sauer, T. Baier, and K. Forchhammer. 1998. Nitrogen-starva-tion-induced chlorosis in Synechococcus PCC 7942: adaptation to long-term
3348 LINDELL AND POST APPL. ENVIRON. MICROBIOL.
on May 15, 2016 by guest
http://aem.asm
.org/D
ownloaded from
survival. Microbiology 144:2449–2458.22. Grossman, A. R., M. R. Schaefer, G. G. Chiang, and J. L. Collier. 1994. The
responses of cyanobacteria to environmental conditions: light and nutrients,p. 641–675. In D. A. Bryant (ed.), The molecular biology of cyanobacteria.Kluwer Academic Publishers, Dordrecht, The Netherlands.
23. Guerrero, M. G., and C. Lara. 1987. Assimilation of inorganic nitrogen, p.163–186. In P. Fay and C. Van Baalen (ed.), The cyanobacteria. ElsevierScience Publishers B. V., Amsterdam, The Netherlands.
24. Harrison, W. G., and L. J. E. Wood. 1988. Inorganic nitrogen uptake bymarine picoplankton—evidence for size partitioning. Limnol. Oceanogr. 33:468–475.
25. Harrison, W. G. 1992. Regeneration of nutrients, p. 385–407. In P. G.Falkowski and A. D. Woodhead (ed.), Primary productivity and biogeo-chemical cycles in the sea. Plenum Press, New York, N.Y.
26. Harrison, W. G., L. R. Harris, and B. D. Irwin. 1996. The kinetics of nitrogenutilization in the oceanic mixed layer: nitrate and ammonium interactions atnanomolar concentrations. Limnol. Oceanogr. 41:16–32.
27. Herrero, A., E. Flores, and M. G. Guerrero. 1981. Regulation of nitratereductase levels in the cyanobacteria Anacystis nidulans, Anabaena sp. strain7119, and Nostoc sp. strain 6719. J. Bacteriol. 145:175–180.
28. Herrero, A., and M. G. Guerrero. 1986. Regulation of nitrite reductase in thecyanobacterium Anacystis nidulans. J. Gen. Microbiol. 132:2463–2468.
29. Holmes, R. M., A. Aminot, R. Kerouel, B. A. Hooker, and B. J. Peterson.1999. A simple and precise method for measuring ammonium in marine andfreshwater ecosystems. Can. J. Fish. Aquat. Sci. 56:1801–1808.
30. Kramer, J. G. 1990. The effect of irradiance and specific inhibitors on proteinand nucleic acid synthesis in the marine cyanobacterium Synechococcus sp.WH 7803. Arch Microbiol. 154:280–285.
31. LaRoche, J., R. M. L. McKay, and P. Boyd. 1999. Immunological and mo-lecular probes to detect phytoplankton responses to environmental stress innature. Hydrobiologia 401:177–198.
32. L’Helguen, S., C. Madec, and P. Le Corre. 1996. Nitrogen uptake in perma-nently well-mixed temperate coastal waters. Est. Coast. Shelf Sci. 42:803–818.
33. Lindell, D., and A. F. Post. 1995. Ultraphytoplankton succession is triggeredby deep winter mixing in the Gulf of Aqaba (Eilat), Red Sea. Limnol.Oceanogr. 40:1130–1141.
34. Lindell, D., E. Padan, and A. F. Post. 1998. Regulation of ntcA expressionand nitrite uptake in the marine Synechococcus sp. strain WH 7803. J. Bac-teriol. 180:1878–1886.
35. Lindell, D., E. Padan, and A. F. Post. 1999. Effect of ammonium on nitrate/nitrite uptake and ntcA expression in Synechococcus sp. strain WH 7803.Bull. Inst. Oceanogr. 19:273–278.
36. Lindell, D. 2000. Assessing the nitrogen status of marine prokaryotic phy-toplankton using molecular methods. Ph.D. thesis. Hebrew University ofJerusalem, Jerusalem, Israel.
37. Luque, I., E. Flores, and A. Herrero. 1994. Molecular mechanism for theoperation of nitrogen control in cyanobacteria. EMBO J. 13:2862–2869.
38. McCarthy, J. J., W. R. Taylor, and J. L. Taft. 1977. Nitrogenous nutrition ofthe plankton in the Chesapeake Bay. 1. Nutrient availability and phytoplank-ton preference. Limnol. Oceanogr. 22:996–1011.
39. McCarthy, J. J., C. Garside, and J. L. Nevins. 1999. Nitrogen dynamicsduring the Arabian Sea northeast monsoon. Deep-Sea Res. II 46:1623–1664.
40. Metzler, P. M., P. M. Glibert, S. A. Gaeta, and J. M. Ludlam. 1997. New and
regenerated production in the South Atlantic off Brazil. Deep-Sea Res. 44:363–384.
41. Palenik, B., and A. M. Wood. 1997. Molecular markers of phytoplanktonphysiological status and their application at the level of individual cells, p.187–205. In K. E. Cooksey (ed.), Molecular approaches to the study of theocean. Chapman and Hall, London, United Kingdom.
42. Parsons, T. R., Y. Maita, and C. M. Lalli. 1984. A manual of chemical andbiological methods for seawater analysis. Pergamon Press, Oxford, UnitedKingdom.
43. Partensky, F., W. R. Hess, and D. Vaulot. 1999. Prochlorococcus, a marinephotosynthetic prokaryote of global significance. Microbiol. Mol. Biol. Rev.63:106–127.
44. Pomar, M. L. C. A., G. Caruso, T. L. Maugeri, R. Scarfo, and R. Zaccone.1998. Distribution of Synechococcus spp. determined by immunofluorescentassay. J. Appl. Microbiol. 84:493–500.
45. Probyn, T. A., H. N. Waldron, and A. G. James. 1990. Size-fractionatedmeasurements of nitrogen uptake in aged upwelled waters—implications forpelagic food webs. Limnol. Oceanogr. 35:202–210.
46. Redfield, A. C. 1958. The biological control of chemical factors in the envi-ronment. Am. Sci. 46:205–222.
47. Sauer, J., G. Margit, and K. Forchhammer. 1999. Nitrogen starvation inSynechococcus PCC 7942: involvement of glutamine synthetase and NtcA inphycobiliprotein degradation and survival. Arch. Microbiol. 172:247–255.
48. Scanlan, D. J., N. H. Mann, and N. G. Carr. 1993. The response of thepicoplanktonic marine cyanobacterium Synechococcus species WH7803 tophosphate starvation involves a protein homologous to the periplasmic phos-phate-binding protein of Escherichia coli. Mol. Microbiol. 101:181–191.
49. Scanlan, D. J., N. J. Silman, K. M. Donald, W. H. Wilson, N. G. Carr, I.Joint, and N. H. Mann. 1997. An immunological approach to detect phos-phate stress in populations and single cells of photosynthetic picoplankton.Appl. Environ. Microbiol. 63:2411–2420.
50. Scanlan, D. J., and W. H. Wilson. 1999. Application of molecular techniquesto addressing the role of P as a key effector in marine ecosystems. Hydro-biologia 401:149–175.
51. Sharp, J. H. 1983. The distribution of inorganic nitrogen and dissolved andparticulate organic nitrogen in the sea, p. 1–35. In E. J. Carpenter and D. G.Capone (ed.), Nitrogen in the marine environment. Academic Press, NewYork, N.Y.
52. Suzuki, I., T. Sugiyama, and T. Omata. 1993. Primary structure and tran-scriptional regulation of the gene for nitrite reductase from the cyanobac-terium Synechococcus PCC 7942. Plant Cell Physiol. 34:1311–1320.
53. Tremblay, J. E., L. Legendre, B. Klein, and J. C. Therriault. 2000. Size-differential uptake of nitrogen and carbon in a marginal sea (Gulf of Law-rence, Canada): significance of diel periodicity and urea uptake. Deep-SeaRes. II 47:489–518.
54. Tyrrell, T., and C. S. Law. 1997. Low nitrate:phosphate ratios in the globalocean. Nature 387793–796.
55. Vega-Palas, M. A., F. Madueno, A. Herrero, and E. Flores. 1990. Identifica-tion and cloning of a regulatory gene for nitrogen assimilation in the cya-nobacterium Synechococcus sp. strain PCC 7942. J. Bacteriol. 172:643–647.
56. Wyman, M., R. P. F. Gregory, and N. G. Carr. 1985. Novel role for phyco-erythrin in a marine cyanobacterium, Synechococcus strain DC2. Science230:818–820.
VOL. 67, 2001 ntcA RESPONSE TO NUTRIENTS 3349
on May 15, 2016 by guest
http://aem.asm
.org/D
ownloaded from