
Henvey Inlet Wind Appendix C3. - Transmission Line - Pattern ...
Upload
independentCategory
view
0download
0
Conference Paper NREL/CP-550-46505 September 2009
Eastern Wind Integration and Transmission Study – Preliminary Findings Preprint D. Corbus, M. Milligan, and E. Ela National Renewable Energy Laboratory
M. Schuerger Energy Systems Consulting Services
B. Zavadil EnerNex Corp.
To be presented at the 8th International Workshop on Large Scale Integration of Wind Power and on Transmission Networks for Offshore Wind Farms Bremen, Germany October 14–15, 2009

NOTICE
The submitted manuscript has been offered by an employee of the Alliance for Sustainable Energy, LLC (ASE), a contractor of the US Government under Contract No. DE-AC36-08-GO28308. Accordingly, the US Government and ASE retain a nonexclusive royalty-free license to publish or reproduce the published form of this contribution, or allow others to do so, for US Government purposes.
This report was prepared as an account of work sponsored by an agency of the United States government. Neither the United States government nor any agency thereof, nor any of their employees, makes any warranty, express or implied, or assumes any legal liability or responsibility for the accuracy, completeness, or usefulness of any information, apparatus, product, or process disclosed, or represents that its use would not infringe privately owned rights. Reference herein to any specific commercial product, process, or service by trade name, trademark, manufacturer, or otherwise does not necessarily constitute or imply its endorsement, recommendation, or favoring by the United States government or any agency thereof. The views and opinions of authors expressed herein do not necessarily state or reflect those of the United States government or any agency thereof.
Available electronically at http://www.osti.gov/bridge
Available for a processing fee to U.S. Department of Energy and its contractors, in paper, from:
U.S. Department of Energy Office of Scientific and Technical Information P.O. Box 62 Oak Ridge, TN 37831-0062 phone: 865.576.8401 fax: 865.576.5728 email: mailto:[email protected]
Available for sale to the public, in paper, from: U.S. Department of Commerce National Technical Information Service 5285 Port Royal Road Springfield, VA 22161 phone: 800.553.6847 fax: 703.605.6900 email: [email protected] online ordering: http://www.ntis.gov/ordering.htm
Printed on paper containing at least 50% wastepaper, including 20% postconsumer waste
Abstract — The Eastern Wind Integration and Transmission Study is one of the largest regional wind integration studies to date, examining the operational impact of 20% and 30% wind energy in the Eastern Interconnect and the transmission expansion needed to achieve those wind energy penetrations. This paper reviews the scope of the study, the development of wind datasets, the transmission expansion analysis, and the results to date of the wind integration analysis for the four scenarios.
Index Terms — grid integration, wind power, transmission,
power system operation, reserve requirements.
I. Introduction The Eastern Wind Integration and Transmission Study
(EWITS) is one of the largest regional wind integration studies to date [1]. It was initiated in 2008 to examine the operational impact of up to 20-30% energy penetration of wind on the power system in the Eastern Interconnect of the United States. This study was set up to answer questions that utilities, regional transmission operators, and planning organizations had about wind energy and transmission development in the east.
Previous studies have laid the groundwork for wind integration studies (e.g., New York, 2005, and Minnesota, 2006) [2, 3], and these focused on specific states or utilities. The EWITS regional study approach allows additional questions to be answered including:
• How do local wind resources compare with higher capacity-factor wind power that requires more transmission?
• How does geographic diversity of wind reduce wind integration costs (i.e., spreading the wind power over a larger region and thereby “smoothing” out some of the variability)?
• How does offshore wind power compare with onshore wind power?
• What transmission is needed to facilitate higher penetrations of wind power?
• What is the role and value of wind forecasting? • How are wind integration costs spread over large
market footprints and regions? • What additional operating reserves are needed for large
wind power deployments?
The EWITS is sponsored by the U.S. Department of Energy (DOE) with project coordination by the National Renewable Energy Laboratory (NREL). The wind integration and transmission analysis is being lead by Enernex, with support from Ventyx and the Midwest Independent System Operator (MISO). In addition, Risoe National Laboratory, Denmark, and Institut für Energiewirtschaft und Rationelle (IER), Germany, are working on a sensitivity analysis for EWITS using the WILMAR stochastic planning model. Wind inputs for EWITS were developed by AWS Truewind. This study and
its partner study, the Western Wind and Solar Integration Study, are conducting an operating impact analysis to see if 20-30% wind energy is feasible from an operational level.
II. Major Tasks In this paper, we focus on the three important parts of
EWITS: 1) wind data development, 2) transmission analysis, and 3) wind integration analysis. As with any analysis, the results are only as good as the analysis inputs. Careful development and validation of wind data inputs for EWITS is essential to yielding meaningful results. New transmission will be required for much of the future wind development in the eastern interconnect; hence, it is imperative to plan for this transmission because it takes longer to build new transmission than it does to build new wind plants. The transmission analysis for EWITS includes an expansion plan that is used in the wind integration analysis. Scenario modeling investigates the operational impacts of wind variability and uncertainty. For the EWITS analysis, we used a deterministic production cost model, but also include stochastic modeling as a sensitivity tool to look at different unit commitment strategies. Sensitivity analyses are also conducted using the deterministic model to analyze unit commitment and operating reserve considerations, different market scenarios, and carbon pricing.
A. Wind Data Development
It is important in wind integration studies to use
concurrent load and wind data to capture the correlations between load and wind (i.e., weather). The use of numerical weather prediction models is an accepted method to produce a time-series of wind plant output data. Essentially, physics-based, numerical simulations on supercomputers, integrated with observational datasets, recreate the weather of historical years and generate a four-dimensional gridded wind-speed dataset. A wind speed time-series dataset can be extracted and converted to wind power output. This approach produces a temporally, spatially, and physically consistent wind dataset.
Wind forecasting is an increasingly common tool for utilities and independent system operators (ISOs) in scheduling generation units. Wind integration studies typically include the impact of wind forecast errors on integration costs. Wind forecast data must also be modeled, and it is important that there be no systematic biases in the wind forecast data (e.g., using the same model to generate wind plant ‘actuals’ and ‘forecasts’ can result in forecasts that are too accurate).
For EWITS, AWS Truewind used the Mesoscale Atmospheric Simulation System [4] to generate wind resource and power output at potential onshore and offshore wind plant sites in the eastern United States.
Eastern Wind Integration and Transmission Study – Preliminary Findings
Authors Dave Corbus1), Michael Milligan1), Erik Ela1), Matt Schuerger2), Bob Zavadil3), ) National Renewable Energy Laboratory, Golden, CO, USA. +1 303 384 6966, e-mail [email protected], 2) Energy Systems Consulting
Services, St. Paul, MN, 3) EnerNex Corp. Knoxville, TN.
1

MASS was initialized using the National Centers for Environmental Prediction/ National Center for Atmospheric Research Global Reanalysis (NNGR) data). The NNGR data provide a snapshot of atmospheric conditions around the world every six hours at 19 levels in the troposphere and lower stratosphere on a 210-km grid. Weather observations were assimilated every 12 hours, introducing a discontinuity in the data, which was then smoothed out.
The MASS simulations for EWITS cover a three-year period from 1 January 2004 through 31 December 2006. For each month during the three-year period, MASS was initialized from the NNGR data on the first and fifteenth or sixteenth day of the month followed by a 15- or 16-day sequence of 12-hour simulations. Rawinsonde and surface observations of temperature, dew point temperature, wind velocity, and pressure were assimilated every 12 hours on the 30-km and 8-km grids using an objective analysis procedure. Except for the initial run, all subsequent simulations used the previous MASS fields as the starting point (“first guess”) for the objective analysis. The NNGR provided lateral boundary conditions for the 30-km grid throughout all of simulations, but the inner grids always derived boundary conditions from the outer MASS grids.
Once the MASS simulations were completed, data were extracted at ten-minute intervals for all 2-km grid cells associated with the more than 13,000 project sites. The meteorological data generated by MASS were scaled to long-term wind speeds, bias corrected to match diurnal patterns from tall tower observations, adjusted for wake and other losses, time-filtered to account for observed variability, and converted to plant output with density-adjusted generic composite power curves for each IEC class. The resulting plant output files contain simulated speeds at 80- and 100-m hub heights along with the power output for all IEC classes every ten minutes for the three-year simulation period.
Fig. 1. 579 GWs of onshore wind sites for EWITS. There were 589 GWs of wind sites available for the
onshore sites and over 100 GWs for the offshore sites. Modeling scenarios were developed, as discussed below, using this “superset” of wind data sites (less than half of the wind data was needed for any one scenario). Fig. 1 shows the locations of the 579 GWs of onshore sites.
B. Scenario Analysis EWITS evaluates the operational impact of large
amounts of wind power on the eastern interconnect and coincides with transmission analysis being conducted by several regional grid operators including the Pennsylvania New Jersey Maryland Interconnection (PJM), Midwest Independent System Operator (MISO), Southwest Power Pool (SPP), Tennessee Valley Authority (TVA), New York Independent System Operator (NYISO), and other related entities. In this study, we modeled the year 2024 three times, with the historical load and weather patterns from 2004, 2005, and 2006, allowing for some analysis of inter annual variability, which was not insignificant.
EWITS has four different scenarios of future wind penetrations (three 20% wind energy scenarios and one 30% wind scenario) ranging from utilization of higher capacity-factor wind power in the Midwest with more transmission build-out to more emphasis on “local wind.” The high capacity-factor wind power scenario requires a significant build-out of high-voltage direct current (HVDC) transmission with high-voltage AC “collector” systems to deliver the wind power from the Midwest to the load centers on the east coast. The "local wind" scenario shows that offshore wind is needed for a 20% wind penetration and reveals what future onshore transmission might look like for the east coast. Scenario four, with 30% wind power, requires the large transmission build-out, use of lower capacity-factor “local” wind power, and significant offshore wind power. Table 1 shows a summary of the EWITS scenarios.
TABLE I. EWITS SCENARIOS 1-4. C. Transmission Modeling
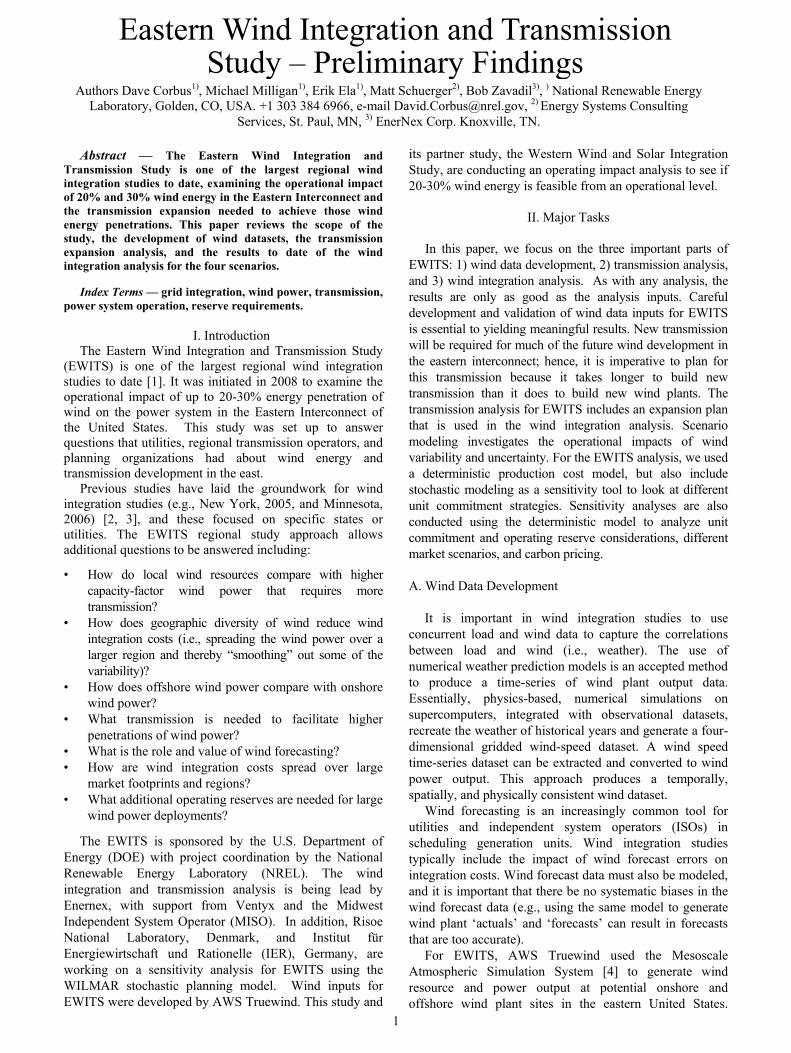
Transmission flows between regions in EWITS are determined in part by the difference between PROMOD® model transmission simulations using a “copper sheet” (i.e., no transmission constraints, no congestion) versus the existing transmission system. Transmission capacity is designed to deliver 80% of the desired energy flow. Figs. 2 and 3 show the transmission overlays for scenarios 1 and 3 respectively. Fig. 2 shows the scenario 1 overlay with the high-voltage AC collector systems that are used to feed the HVDC transmission that carry the high capacity factor wind energy west to east. Fig. 3 shows the overlay for Scenario 3 with high offshore wind and the AC collector systems for offshore wind feeding HVDC systems going
2
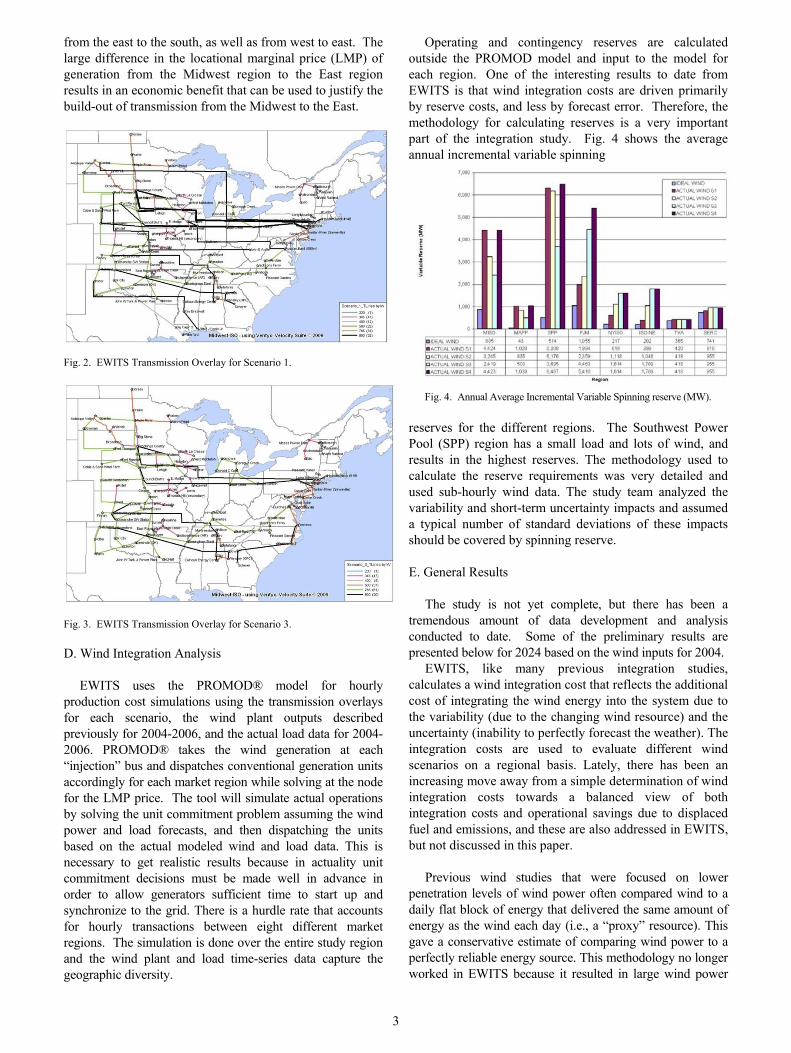
from the east to the south, as well as from west to east. The large difference in the locational marginal price (LMP) of generation from the Midwest region to the East region results in an economic benefit that can be used to justify the build-out of transmission from the Midwest to the East.
Fig. 2. EWITS Transmission Overlay for Scenario 1.
Fig. 3. EWITS Transmission Overlay for Scenario 3. D. Wind Integration Analysis
EWITS uses the PROMOD® model for hourly
production cost simulations using the transmission overlays for each scenario, the wind plant outputs described previously for 2004-2006, and the actual load data for 2004-2006. PROMOD® takes the wind generation at each “injection” bus and dispatches conventional generation units accordingly for each market region while solving at the node for the LMP price. The tool will simulate actual operations by solving the unit commitment problem assuming the wind power and load forecasts, and then dispatching the units based on the actual modeled wind and load data. This is necessary to get realistic results because in actuality unit commitment decisions must be made well in advance in order to allow generators sufficient time to start up and synchronize to the grid. There is a hurdle rate that accounts for hourly transactions between eight different market regions. The simulation is done over the entire study region and the wind plant and load time-series data capture the geographic diversity.
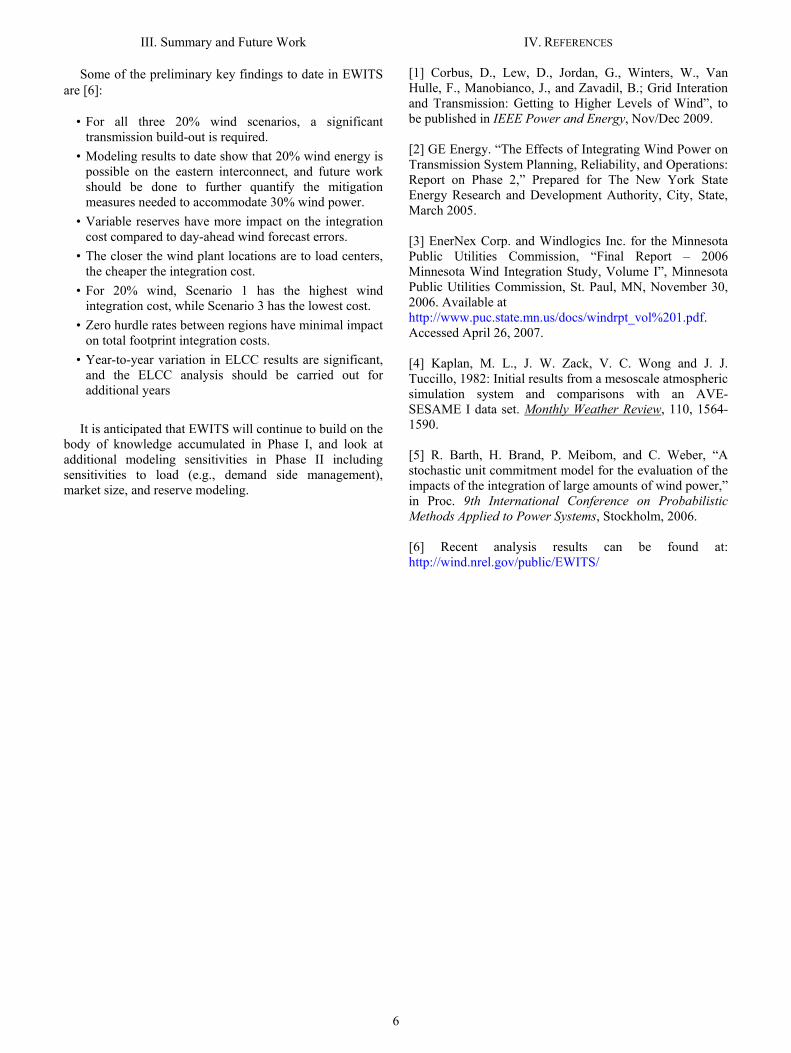
Operating and contingency reserves are calculated outside the PROMOD model and input to the model for each region. One of the interesting results to date from EWITS is that wind integration costs are driven primarily by reserve costs, and less by forecast error. Therefore, the methodology for calculating reserves is a very important part of the integration study. Fig. 4 shows the average annual incremental variable spinning
Fig. 4. Annual Average Incremental Variable Spinning reserve (MW).
reserves for the different regions. The Southwest Power Pool (SPP) region has a small load and lots of wind, and results in the highest reserves. The methodology used to calculate the reserve requirements was very detailed and used sub-hourly wind data. The study team analyzed the variability and short-term uncertainty impacts and assumed a typical number of standard deviations of these impacts should be covered by spinning reserve.
E. General Results
The study is not yet complete, but there has been a tremendous amount of data development and analysis conducted to date. Some of the preliminary results are presented below for 2024 based on the wind inputs for 2004.
EWITS, like many previous integration studies, calculates a wind integration cost that reflects the additional cost of integrating the wind energy into the system due to the variability (due to the changing wind resource) and the uncertainty (inability to perfectly forecast the weather). The integration costs are used to evaluate different wind scenarios on a regional basis. Lately, there has been an increasing move away from a simple determination of wind integration costs towards a balanced view of both integration costs and operational savings due to displaced fuel and emissions, and these are also addressed in EWITS, but not discussed in this paper.
Previous wind studies that were focused on lower penetration levels of wind power often compared wind to a daily flat block of energy that delivered the same amount of energy as the wind each day (i.e., a “proxy” resource). This gave a conservative estimate of comparing wind power to a perfectly reliable energy source. This methodology no longer worked in EWITS because it resulted in large wind power
3

deviations from one day to the next. EWITS addresses this issue by using an hourly flat block comparison instead, using the wind power as it is actually delivered, based on the wind data inputs. Although there are still shortcomings with the hourly flat block proxy, they are beyond the scope of this paper to discuss and it should be noted that this area is an on-going research and discussion.
Wind integration costs and adjusted production costs from the PROMOD® modeling are shown in Table II for the different EWITS scenarios for the 2004 wind data. These integration costs are driven primarily by the need for additional reserves but also include the costs for uncertainty (i.e., not being able to accurately predict the wind). Scenario 3, with more local wind (i.e., wind sited closer to the load) results in slightly lower integration costs than the other two 20% scenarios, and Scenario 4 with 30% wind results in significantly higher wind integration costs. Note that the integration costs do not reflect the higher capital costs (typically in the range of 50%) for the offshore wind in Scenarios 3 and 4.
TABLE II. Wind Integration Costs
Operational analysis of specific EWITS regions based on the PROMOD® production cost simulations for high wind power and low load periods reveals interesting results and lend insight into understanding operation of the system over the entire region. Fig. 5 shows the MISO load and net load, generation, and wind curtailment during a high wind week in spring for Scenario 1.
Fig. 5. MISO Generation for High Wind Week.
Wind curtailment is one way of evaluating how much
wind the system can accommodate. Scenarios that result in high wind curtailments will negatively impact the value of the wind. Mitigation measures for reducing these curtailments (e.g., short-term storage) would come at a cost. Fig. 6 shows the wind curtailment summary for the EWITS scenarios.
Fig. 6. Wind Curtailment for EWITS Scenarios.
Wind curtailment for the 20% wind scenarios is highest in the SPP region for Scenarios 1 and 2, and is high in the New York Independent System Operator (NY-ISO) and Independent System Operator- New England (ISO-NE) regions for Scenario 3. Both Southeast Reliability Council (SERC) and Tennessee Valley Authority (TVA) have very little wind generation, so the megawatt quantities of wind curtailments are not that high. The wind curtailments include both transmission constraints and minimum generation events, but are predominantly due to transmission constraints. This was concluded by doing additional PROMOD runs for Scenario 2, isolating the effects of transmission constraints and minimum generation events and comparing the curtailments between the two runs.
Capturing the geographical diversity of wind power for the large study region is an important part of the modeling. Fig. 7 shows a plot of the normalized standard deviation measured at varying production levels for 5 different size regions, from an 85-GW full market (e.g., MISO) down to a single 500-MW plant. Each smaller group is a subset of the larger one. The plot shows how the variability of the wind reduces significantly with expanding wind capacity. Another interesting aspect of the plot is that the peak of the variability corresponds to a production output of about 50%.
Fig. 7. Comparison of 10-minute variability as diversity increases – 10-minute changes as a function of production.
0.00%
2.00%
4.00%
6.00%
8.00%
10.00%
12.00%
14.00%
Region
Win
d C
urta
ilmen
t (%
)
Scenario 1Scenario 2Scenario 3Scenario 4
Scenario 1 4.05% 10.52% 2.56% 0.03% 4.22% 0.04% 6.89% 6.38%
Scenario 2 2.32% 11.49% 1.43% 0.59% 11.00% 7.92% 3.75% 6.25%
Scenario 3 2.26% 2.58% 1.38% 7.76% 9.72% 0.53% 0.52% 3.26%
Scenario 4 7.81% 11.28% 6.70% 10.57% 9.36% 8.03% 10.71% 8.72%
MISO/MAPP SPP PJM ISONE NYISO SERCNI TVASUB Total Footprint
4

F. Reliability Analysis
Each different scenario studied results in a different effective load carrying capability (ELCC) of wind, based on that scenario’s unique characteristics and where the wind is located. The loss of load expectation (LOLE) analysis is based upon a sequential Monte Carlo simulation using GE’s Multi-Area Reliability Simulation (GE-MARS) tool. The analysis is benchmarked to a reliability of one day in ten years. The wind generation is incorporated through the three year (2004, 2005, and 2006) 8760 hourly profiles (wind generation is effectively a load modifier). Each of the three years of LOLE analysis is run 6,000 times to achieve accurate convergence (non-wind generation is probabilistic based on forced outage ratings; the load model is not probabilistic). Each zone (market footprint) is modeled without internal constraints. Sharing of generation between zones is limited to excess generation only (up to the tie limits). The interface limits between zones are developed from a series of PROMOD® simulations.
The different transmission sensitivities studied are: Stand-Alone (Isolated) Zone
• No zone to zone interfaces modeled • Provides a base point for calculating ELCC
before introducing Interfaces to the LOLE modeling
Without Transmission Overlay • Constrained case • Includes only existing transmission and
interface limits With Conceptual Transmission Overlay
• Increased zone to zone interface limits • Increased ability to move wind energy across
the system Infinite Tie Limits (Copper-Sheet)
• The highest level of transfer capability
Fig. 8 shows the ELCC for the pre- and post overlay (i.e., the transmission system with and without the overlays shown in Figs. 2 and 3). The shaded area shows the increased ELCC of the transmission overlay.
Fig. 8. ELCC for Pre- and Post Overlay.
G. Sensitivity Analysis
EWITS includes two sensitivity analyses for Scenario 2: a carbon sensitivity case using PROMOD® to model carbon emissions at a price that causes a shift to gas generation from coal generation, and a modeling sensitivity case using the WILMAR model from Europe to look at “rolling” unit commitment (e.g., generator dispatch at 3-hour intervals) and stochastic unit commitment.
Some of the key assumptions for the carbon sensitivity case are: natural gas at a nominal $8, 15% capacity credit for wind, nuclear capital costs are $6000/kW, no cycling/ramping of the nuclear, and no increases in demand response or efficiency. The Electric Generation Expansion Analysis System (EGEAS) model was used to identify the carbon price required to drive a change from new coal in the expansion model. Wind was not a variable in the expansion, but was forced into the mixed at 20% penetration. The result was that a significant change from coal to gas did not occur until a carbon price of nearly $100/ton CO2. It should be noted that a change from coal to nuclear occurred at a much lower price. The next step in this analysis is to run a full year of PROMOD® simulations for Scenario 2.
Because of the uncertainty of wind power prediction, much work has been performed in evaluating different ways of solving the unit commitment problem. In EWITS, a sensitivity study was performed using the WILMAR model [5] to evaluate the different impacts that would occur by performing a stochastic unit commitment problem and with performing a continuous rolling unit commitment update. The stochastic unit commitment solves a number of different wind power and load scenarios and minimized the expected cost. Fig. 9, for example, shows multiple scenarios of residual load (load minus wind) in the PJM area. The stochastic unit commitment solves to ensure all scenarios can be met in a least cost manner so that the system is robust and ensures reliable and cost effective solutions despite many uncertain outcomes. Rolling unit commitments are performed to support the theory that forecasts become better as the time horizon becomes closer and so the unit commitment decisions should be updated continuously.
Fig. 9. Multiple residual load scenarios for PJM.
5
III. Summary and Future Work
Some of the preliminary key findings to date in EWITS are [6]:
• For all three 20% wind scenarios, a significant
transmission build-out is required. • Modeling results to date show that 20% wind energy is
possible on the eastern interconnect, and future work should be done to further quantify the mitigation measures needed to accommodate 30% wind power.
• Variable reserves have more impact on the integration cost compared to day-ahead wind forecast errors.
• The closer the wind plant locations are to load centers, the cheaper the integration cost.
• For 20% wind, Scenario 1 has the highest wind integration cost, while Scenario 3 has the lowest cost.
• Zero hurdle rates between regions have minimal impact on total footprint integration costs.
• Year-to-year variation in ELCC results are significant, and the ELCC analysis should be carried out for additional years
It is anticipated that EWITS will continue to build on the body of knowledge accumulated in Phase I, and look at additional modeling sensitivities in Phase II including sensitivities to load (e.g., demand side management), market size, and reserve modeling.
IV. REFERENCES [1] Corbus, D., Lew, D., Jordan, G., Winters, W., Van Hulle, F., Manobianco, J., and Zavadil, B.; Grid Interation and Transmission: Getting to Higher Levels of Wind”, to be published in IEEE Power and Energy, Nov/Dec 2009. [2] GE Energy. “The Effects of Integrating Wind Power on Transmission System Planning, Reliability, and Operations: Report on Phase 2,” Prepared for The New York State Energy Research and Development Authority, City, State, March 2005. [3] EnerNex Corp. and Windlogics Inc. for the Minnesota Public Utilities Commission, “Final Report – 2006 Minnesota Wind Integration Study, Volume I”, Minnesota Public Utilities Commission, St. Paul, MN, November 30, 2006. Available at http://www.puc.state.mn.us/docs/windrpt_vol%201.pdf. Accessed April 26, 2007. [4] Kaplan, M. L., J. W. Zack, V. C. Wong and J. J. Tuccillo, 1982: Initial results from a mesoscale atmospheric simulation system and comparisons with an AVE-SESAME I data set. Monthly Weather Review
, 110, 1564-1590.
[5] R. Barth, H. Brand, P. Meibom, and C. Weber, “A stochastic unit commitment model for the evaluation of the impacts of the integration of large amounts of wind power,” in Proc. 9th International Conference on Probabilistic Methods Applied to Power Systems, Stockholm, 2006. [6] Recent analysis results can be found at: http://wind.nrel.gov/public/EWITS/
6

F1147-E(10/2008)
REPORT DOCUMENTATION PAGE Form Approved OMB No. 0704-0188
The public reporting burden for this collection of information is estimated to average 1 hour per response, including the time for reviewing instructions, searching existing data sources, gathering and maintaining the data needed, and completing and reviewing the collection of information. Send comments regarding this burden estimate or any other aspect of this collection of information, including suggestions for reducing the burden, to Department of Defense, Executive Services and Communications Directorate (0704-0188). Respondents should be aware that notwithstanding any other provision of law, no person shall be subject to any penalty for failing to comply with a collection of information if it does not display a currently valid OMB control number. PLEASE DO NOT RETURN YOUR FORM TO THE ABOVE ORGANIZATION. 1. REPORT DATE (DD-MM-YYYY)
September 2009 2. REPORT TYPE
Conference Paper 3. DATES COVERED (From - To)
4. TITLE AND SUBTITLE
Eastern Wind Integration and Transmission Study – Preliminary Findings: Preprint
5a. CONTRACT NUMBER DE-AC36-08-GO28308
5b. GRANT NUMBER
5c. PROGRAM ELEMENT NUMBER
6. AUTHOR(S) D. Corbus, M. Milligan, E. Ela, M. Schuerger, and B. Zavadil
5d. PROJECT NUMBER NREL/CP-550-46505
5e. TASK NUMBER WER9.6010
5f. WORK UNIT NUMBER
7. PERFORMING ORGANIZATION NAME(S) AND ADDRESS(ES) National Renewable Energy Laboratory 1617 Cole Blvd. Golden, CO 80401-3393
8. PERFORMING ORGANIZATION REPORT NUMBER NREL/CP-550-46505
9. SPONSORING/MONITORING AGENCY NAME(S) AND ADDRESS(ES)
10. SPONSOR/MONITOR'S ACRONYM(S) NREL
11. SPONSORING/MONITORING AGENCY REPORT NUMBER
12. DISTRIBUTION AVAILABILITY STATEMENT National Technical Information Service U.S. Department of Commerce 5285 Port Royal Road Springfield, VA 22161
13. SUPPLEMENTARY NOTES
14. ABSTRACT (Maximum 200 Words) This paper reviews the scope of the Eastern Wind Integration and Transmission Study (EWITS), the development of wind datasets, the transmission expansion analysis, and the results to date of the wind integration analysis for the four scenarios.
15. SUBJECT TERMS Wind; solar; resource data; integration; grid studies; WWSIS; EWITS; transmission; power system operation; reserve requirements.
16. SECURITY CLASSIFICATION OF: 17. LIMITATION OF ABSTRACT
UL
18. NUMBER OF PAGES
19a. NAME OF RESPONSIBLE PERSON a. REPORT
Unclassified b. ABSTRACT Unclassified
c. THIS PAGE Unclassified 19b. TELEPHONE NUMBER (Include area code)
Standard Form 298 (Rev. 8/98) Prescribed by ANSI Std. Z39.18
Copyright © 2022 FDOKUMEN