Earnings Manipulation among the Main Industrial Sectors. Evidence from Italy
11
Earnings Manipulation among the Main Industrial Sectors. Evidence from Italy. Francesco Paolone, Cosimo Magazzino Pavia, Febbraio 2015 N. 4/2014
Transcript of Earnings Manipulation among the Main Industrial Sectors. Evidence from Italy
Earnings Manipulat ion among the Main Industr ial Sectors. Evidence from Italy.
F r an ce s co Pao l one , Co s imo Magaz z i no
Pavia, Febbraio 2015 N. 4/2014

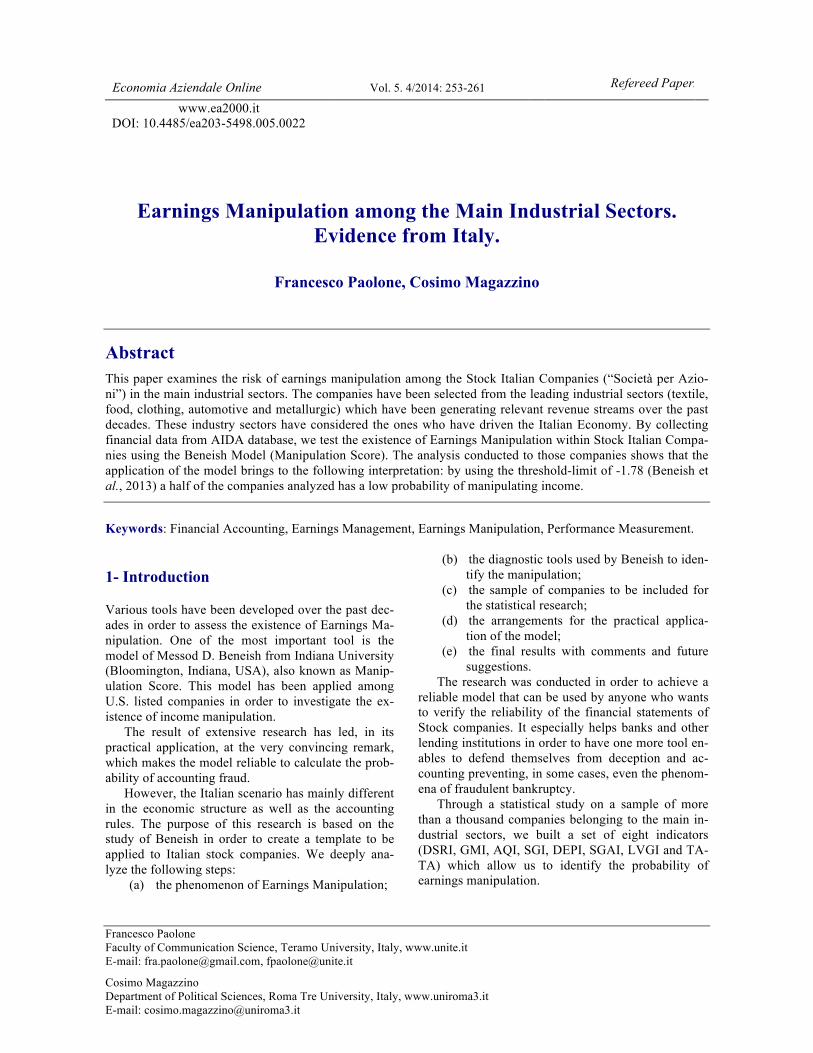
Economia Aziendale Online Vol. 5. 4/2014: 253-261 Refereed Papers www.ea2000.it
DOI: 10.4485/ea203-5498.005.0022
Francesco Paolone Faculty of Communication Science, Teramo University, Italy, www.unite.it E-mail: [email protected], [email protected]
Cosimo Magazzino Department of Political Sciences, Roma Tre University, Italy, www.uniroma3.it E-mail: [email protected]
Earnings Manipulation among the Main Industrial Sectors. Evidence from Italy.
Francesco Paolone, Cosimo Magazzino
Abstract This paper examines the risk of earnings manipulation among the Stock Italian Companies (“Società per Azio-ni”) in the main industrial sectors. The companies have been selected from the leading industrial sectors (textile, food, clothing, automotive and metallurgic) which have been generating relevant revenue streams over the past decades. These industry sectors have considered the ones who have driven the Italian Economy. By collecting financial data from AIDA database, we test the existence of Earnings Manipulation within Stock Italian Compa-nies using the Beneish Model (Manipulation Score). The analysis conducted to those companies shows that the application of the model brings to the following interpretation: by using the threshold-limit of -1.78 (Beneish et al., 2013) a half of the companies analyzed has a low probability of manipulating income.
Keywords: Financial Accounting, Earnings Management, Earnings Manipulation, Performance Measurement.
1- Introduction
Various tools have been developed over the past dec-ades in order to assess the existence of Earnings Ma-nipulation. One of the most important tool is the model of Messod D. Beneish from Indiana University (Bloomington, Indiana, USA), also known as Manip-ulation Score. This model has been applied among U.S. listed companies in order to investigate the ex-istence of income manipulation.
The result of extensive research has led, in its practical application, at the very convincing remark, which makes the model reliable to calculate the prob-ability of accounting fraud.
However, the Italian scenario has mainly different in the economic structure as well as the accounting rules. The purpose of this research is based on the study of Beneish in order to create a template to be applied to Italian stock companies. We deeply ana-lyze the following steps:
(a) the phenomenon of Earnings Manipulation;
(b) the diagnostic tools used by Beneish to iden-tify the manipulation;
(c) the sample of companies to be included for the statistical research;
(d) the arrangements for the practical applica-tion of the model;
(e) the final results with comments and future suggestions.
The research was conducted in order to achieve a reliable model that can be used by anyone who wants to verify the reliability of the financial statements of Stock companies. It especially helps banks and other lending institutions in order to have one more tool en-ables to defend themselves from deception and ac-counting preventing, in some cases, even the phenom-ena of fraudulent bankruptcy.
Through a statistical study on a sample of more than a thousand companies belonging to the main in-dustrial sectors, we built a set of eight indicators (DSRI, GMI, AQI, SGI, DEPI, SGAI, LVGI and TA-TA) which allow us to identify the probability of earnings manipulation.
Paolone F., Magazzino C. / Economia Aziendale Online Vol. 5, 4(2014): 253-261 254
These indicators were entered into a regression model in order to assess the Manipulation Score for each industry sectors.
2 –Literature Review
The field of “Accounting Manipulation” is widely debated in the world of business as well as in interna-tional literature; it consists in the process of altering data of Income Statement and Balance Sheet, which deeply modify the company’s situation from the reali-ty.
According to Stolowy and Breton (2003), Ac-counting Manipulation is defined as the management discretionary decisions in order to make accounting choices that may affect the transfer of wealth between companies, between the company and capital provid-ers, and, finally, between the company and managers.
The development of these illegal practices derived from the “Theory of Inefficient Markets” (Sharpe, 1964, Macey and Miller, 1990, Aboody et al., 2002). An efficient market means that all the information can circulate quickly, correctly and without biases among all the operators in the market. In this condi-tion, managers have no incentive to implement and manipulate accounting practices but, in condition of inefficiency characterized by asymmetry information, the information does not circulate quickly and may be distorted by the operators. The main reason that push managers to adopt manipulating accounting practices is the fear of reaching a result that does not meet the stakeholders’ expectations. The general field of Ac-counting Manipulation can be distinguished into sep-arate groups: 1. The Creative Accounting which means keeping
the accounting practices into the limits of legali-ty (Earnings Management);
2. The Accounting Fraud which means violating the accounting rules and principles (Earnings Manipulation).
The two fields of research (Earnings Management & Earnings Manipulation) belong to the same litera-ture since many scholars have found methods and models that are useful in both cases. Earnings Manip-ulation can be considered as a branch of the general field of Earnings Management (EM).
The last decades have seen significant growth in academic research on the topic of Earnings Manipula-tion. The first Schipper’s contribution (1989) defined EM as a purposeful intervention in the external financial reporting process, with the intent of obtain-ing some private gain. Many scholars highlighted the role of EM in financial reporting and in structuring transactions to alter financial reports to either mislead some stakeholders about the economic performance of the company (Healy and Wahlen, 1999). In this sense EM appears an active manipulation of earnings
towards a predetermined target (Mulford and Comis-key, 2002).
According to Bartov (1993), Earnings Manage-ment can be obtained by using accounting methods and estimates (i.e., an accrual-based manipulation) or by undertaking transactions that make reported in-come closer to some target number than it would oth-erwise be, rather than maximize the firm’s discounted expected cash flows (i.e., a real manipulation) (Roy-chowdhury, 2006). Earnings reporting choices are reflected in different measures of earnings (Walker, 2013). The Accruals are the accounting adjustments that explain the difference between free cash flows and operating income:
Accruals = Operating Income – Free Cash Flows
Walker (2013) defines “Free Cash Flows” as Cash Flows from Operations minus Net Cash Investment in operations. The relation between Earnings Manage-ment and Accruals Estimates has been widely exam-ined in accounting literature. Healy (1985) and De Angelo (1986) used applying accrual methodology and their research findings demonstrated the evidence of income manipulation in a different setting, adopt-ing non-discretionary accruals.
There has seen a significant growth in academic research on relationship between Earnings Manage-ment (EM) and Accruals Estimates driven by the ad-vent of readily calculable EM metrics (Jones, 1991; Dechow et al., 1995) and policy concerns raised by influential accounting standard setters. Jones (1991) used a linear regression approach and controlled for non-discretionary accrual factors including sales rev-enue and property, plant and equipment. Dechow et al. (1995) introduced the Modified Jones Model, which has become one of the most widely used mod-els in earnings management research. The Modified Jones Model includes an adjustment to sales based on the change in the amount of receivables. Peek et al. (2013) have recently provided a contribution by com-paring abnormal accruals across different countries. By using the two accruals estimation models, the Modified Jones and the model of Dechow and Dichev (2002), they found that accruals model exhibit consid-erable cross-country variation in predictive accuracy and power to detect earnings management.
Other studies have explored real earnings manipu-lation in the context of early debt retirements (Hand, 1989). Many scholars (Ronen and Sadan, 1981, Dye, 1988; Trueman and Titman, 1988) suggested that managers are more likely to manipulate earnings through asset sales for several reasons: (1) accounting income from asset sales affects income from continu-ing operations, whereas income from early debt re-tirements is reported as an extraordinary item; (2) in-vestors employ income from continuing operations, rather than net income, in their decision making and
Paolone F., Magazzino C. / Economia Aziendale Online Vol. 5, 4(2014): 253-261
255
(3) managers manipulate earnings to affect investors’ perceptions.
Before Beneish´s contribution, there was a need of a more accurate analysis to find out in which way earnings can be manipulated through performance indicators. Beneish’s study extends this literature by focusing on a model built on performance ratios, and demonstrating its ability to identify and predict fraud cases. He built up a model for identifying cases of Earnings Manipulation.
3 –The Beneish Model
In 1999, Beneish analyzed U.S. firms that manipulate earnings and developed a statistical model to discrim-inate manipulators from non-manipulators. This M-Score (Manipulation Score) model relies exclusively on Key Performance Indicators based on financial statement data and it is useful in monitoring fraud po-tential among firms.
According to Beneish et al. (2013), the model has been discussed in financial statement analysis text-books (e.g Fridson, 2002, Stickney et al. 2003), in ar-ticles directed at auditors, certified fraud examiners, and investment professionals (e.g. Cieselski, 1998, Merrill Lynch, 2000, Wells, 2001, Harrington, 2005).
The model includes eight performance indicators which defining the profile of a “typical earnings ma-nipulator”. The indicators capture financial state-ments distortions that result from earnings manipula-tion (DSR, AQI, DEPI and TATA) as well as indicate a predisposition to engage earnings manipulation due to certain economic conditions (GMI, SGI, SGAI and LEVI). As defined by Beneish (1997), a firm manipu-lator is the one that:
(1) Growing extremely rapidly. Sales Growth in-
dex (SGI) shows the past growth trend. An increasing means a reasonable predisposition to engage in ma-nipulative behavior.
(2) Experiencing deteriorating fundamentals.
Manipulators are hypothesized to have deteriorating gross margin (GMI) and increasing SG&A expenses (SGAI). Furthermore, their debt-to-asset ratio is in-creasing as well as the greater proportion of their total assets reflect non-current and non-PPE investments (AQI).
(3) Adopting aggressive accounting practices. An
increasing Days in Sales Receivables (DSRI) shows an unusual build-up in receivables despite the rapidly increasing sales. Depreciation index DEPI shows that manipulators tend to slow down their depreciation percentage. Finally, the Accruals (TATA) indicates that reported accounting profits of manipulators are less supported by cash profits that those of non-manipulators.
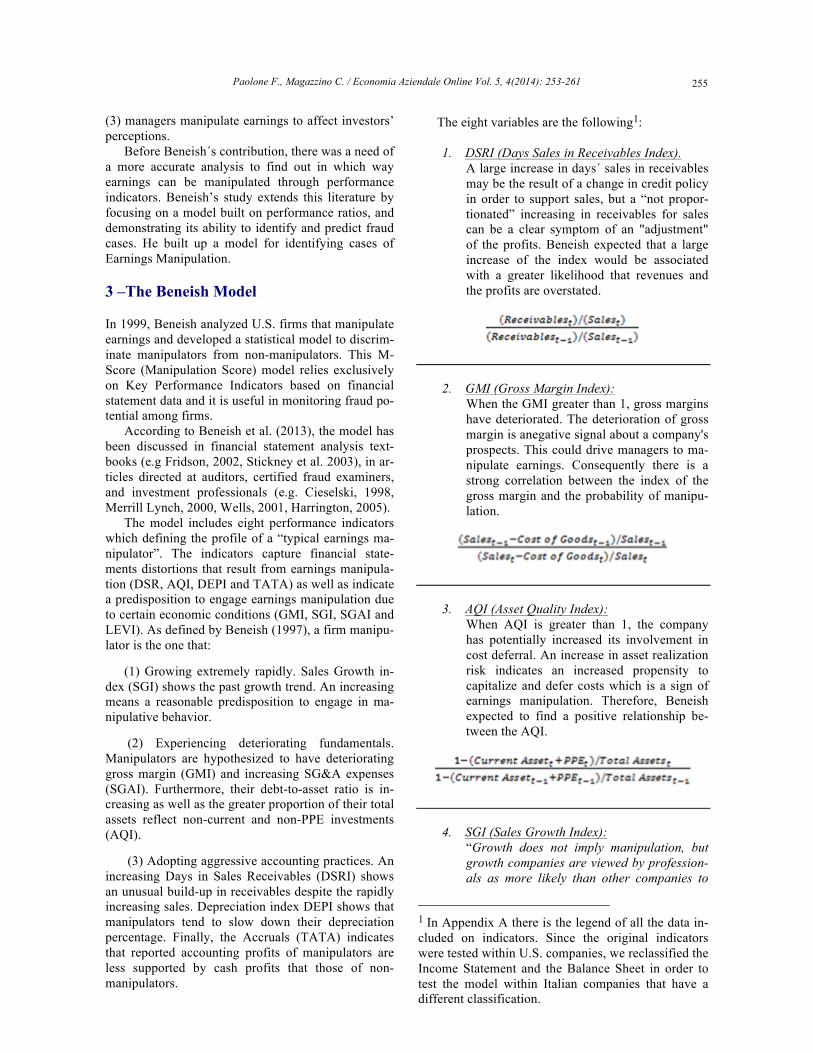
The eight variables are the following1:
1. DSRI (Days Sales in Receivables Index). A large increase in days´ sales in receivables may be the result of a change in credit policy in order to support sales, but a “not propor-tionated” increasing in receivables for sales can be a clear symptom of an "adjustment" of the profits. Beneish expected that a large increase of the index would be associated with a greater likelihood that revenues and the profits are overstated.
2. GMI (Gross Margin Index):
When the GMI greater than 1, gross margins have deteriorated. The deterioration of gross margin is anegative signal about a company's prospects. This could drive managers to ma-nipulate earnings. Consequently there is a strong correlation between the index of the gross margin and the probability of manipu-lation.
3. AQI (Asset Quality Index):
When AQI is greater than 1, the company has potentially increased its involvement in cost deferral. An increase in asset realization risk indicates an increased propensity to capitalize and defer costs which is a sign of earnings manipulation. Therefore, Beneish expected to find a positive relationship be-tween the AQI.
4. SGI (Sales Growth Index):
“Growth does not imply manipulation, but growth companies are viewed by profession-als as more likely than other companies to
1 In Appendix A there is the legend of all the data in-cluded on indicators. Since the original indicators were tested within U.S. companies, we reclassified the Income Statement and the Balance Sheet in order to test the model within Italian companies that have a different classification.

Paolone F., Magazzino C. / Economia Aziendale Online Vol. 5, 4(2014): 253-261 256
commit financial statement fraud, because their financial positions and capital needs put pressure on managers to achieve earn-ings targets” (Beneish,1999). An SGI great-er than 1 indicates that sales are growing over the previous year. If growth companies face large stock price losses at the first in-dication of a slowdown, they may have greater incentives thannon-growth compa-nies to manipulate earnings. Beneish ex-pected a positive correlation between the SGI and the probability of earnings manipu-lation.
5. DEPI (Depreciation Index): “A DEPI greater than 1 indicates that the rate at which tangible assets are being de-preciated has slowed-raising the possibility that the company has revised upward the es-timates of assets' useful lives or adopted a new method that is income increasing” (Be-neish, 1999). Beneish hypothesized a posi-tive correlation between DEPI and the likeli-hood of earnings management.
6. SGAI (Sales, General and Administrative Expenses Index) A GAI greater than 1 means that the cost of selling, general and administrative expenses increased proportionally more than sales. According to Lev and Thiagarajan (1993), analysts interpret a non-proportionate in-crease in sales as a negative signal about a company´s prospects. Beneish expected to find a positive relationship between the SGAI and the probability of manipulation.
7. LVGI (Leverage Index)
A LVGI greater than 1 is equivalent to an increase in financial leverage (leverage). This index is useful to capture the incentives in debt covenants that can lead to manipulate earnings. Once the debt is at risk of violation is easier than managers artificially increase
profits to avoid the effects of a breach, an in-crease in the portion of debt.
8. TATA (Total Accruals to Total Assets)
Total Accruals was used in prior researches to assess the extent to which managers make discretionary accounting choices to alter earnings (Healy, 1985).The value of the TA-TA is used to proxy for the extent to which cash underlay reported earnings may be neg-ative, when the operating cash flow greatly exceeds the net profits and, therefore, there are negative accruals, or reach unity, which means that all assets are made up of accruals. Beneish expected a strong positive associa-tion between accruals (less cash) and the higher likelihood of earnings manipulation.
Not all variables are individually important, but they collectively create a “composite sketch” of a po-tential earnings manipulator. The Earnings Management literature provides two alternatives of the Beneish model to identify the propensity of a company to manipulate earnings. The first one (the full model – the 8M Score) that involves all the eight variable2. On the other hand, the second alternative (the simple model – the 5M Score) picks only five variables up, omitting those are less relevant and meaningful.
4 –Data Collecting, Sampling and Model Testing
In this paper, we investigate the risk of manipulating earnings among the Stock Italian companies (“Società Per Azioni”) in the main traditional industry sectors. According to the analysis, we have selected the lead-ing industrial sectors in Italy which they have been characterized from huge revenue streams as well as they have always driven the Italian economy over the past decades. The relevant industry sectors are the fol-lowing:
2 Table E shows the coefficients and the formulas of each ratio, according to Beneish (1999) & Beneish et al. (2013). This model has been used in this research.
Paolone F., Magazzino C. / Economia Aziendale Online Vol. 5, 4(2014): 253-261
257
- “Textile Industry” - “Food Industry” - “Clothing Industry” - “Automotive Industry” - “Metallurgic Industry”
The sample of Companies (“Società per Azioni”) has been selected from the database of financial in-formation for Italian companies (AIDA Bureau Van Dijk) and it covers the time period from 2005 to 2012, included. Since several financial data were not available on the database, we achieved the percentage coverage for each industry sectors, by calculating the companies with data available divided by all data re-quired (Table A).
As we have already mentioned, there are many differences between U.S. and Italian Accounting principles so that we propose a reclassified model in order to identify the Earnings Manipulation within Italian Stock Companies. The original model has been adapted to the Italian scenario with a reclassifi-cation of the Income Statement and the Statement of Financial Position.
According to the Italian Accounting principles, the “Selling, General and Administrative expenses” data are not present on financial statements, since this item would result from a classification of expenses by function (provided by US GAAP), while Italian fi-nancial statements, which follow the Civil Code, clas-sify expenses and revenues for nature. When financial data are not available, Beneish assumes that all indi-ces remain constant over the years, except for TATA index. In this analysis, we use the neutral value equal to 1 for SGAI index.
In this paper, we use the “full version” of the Be-neish Model (8M-Score) in order to test whether each industry has affected by earnings manipulation. The eight indicators were entered into a regression model in order to achieve the Manipulation Score. By apply-ing the model, we are able to categorize the compa-nies in two different groups: the one with a low prob-ability of Earnings Manipulation and the other with high probability of manipulation. The Final Manipu-lation Score for each company is obtained from the formula (Table B) and it is computed by the average scores of the past years (2005 to 2012). The compa-nies with available financial data are considered the ones with no more than two missing values within the time-period 2005-2012. After computing the value for each company and for each year, we have calculated the final value by doing the average of all the values among the period 2005-2012.
5 –Findings
The research aims to identify whether Stock Ital-ian Companies have manipulated earnings over the
past decade. In this field, the Model of Beneish was used in discriminating companies, which have a risk in manipulating earnings and companies do not. The overall result seems to identify that the half of Stock Italian Companies have a high probability of manipulating risk (by using the threshold of 1-78).
According to the AIDA Bureau Van Dijk data-base, the Italian Stock Companies belonging to the main industrial sectors (Textile, Food, Clothing, Au-tomotive and Metallurgy) are 2755 of which 157 are in liquidation sale and, thus, out of the sample. The remaining 2598 Companies have been covered with a percentage of 70% since the companies with data available are 1809.
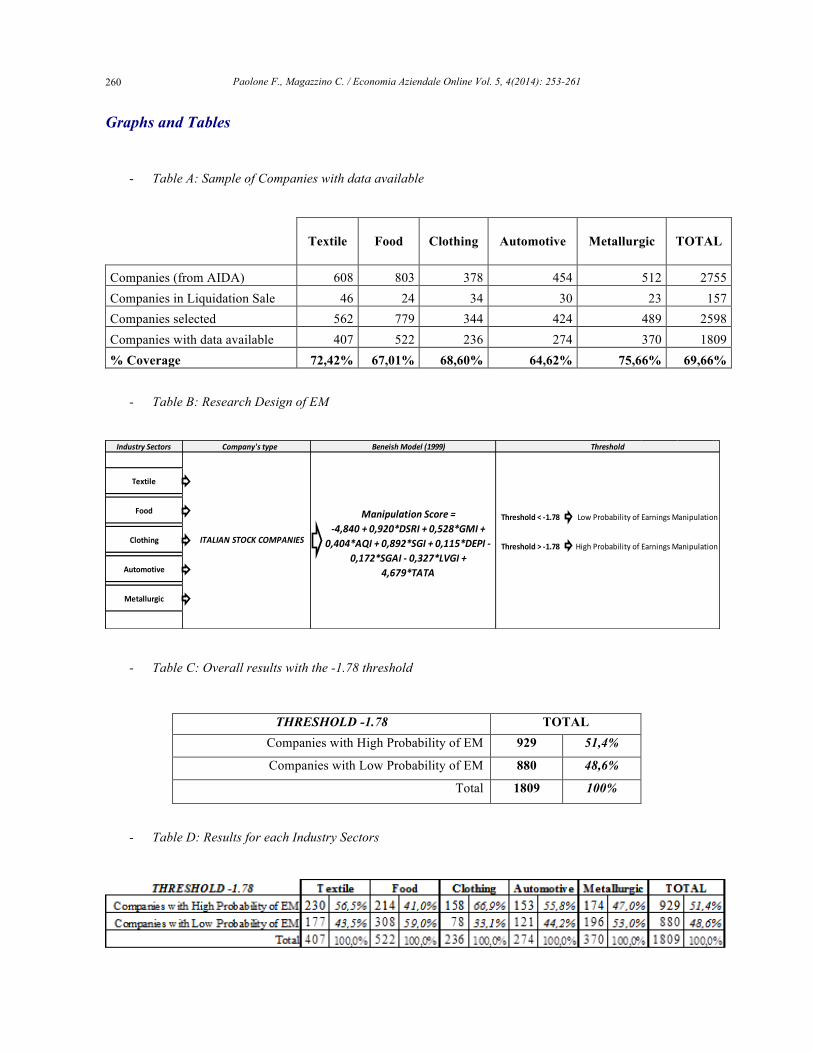
The findings show that, using a threshold of -1.78, the 51.4% of companies have a high probability of manipulating earnings while the 48.6% not. By go-ing in the details of industrial sectors, the results are the following (Table C):
- Textile Industry
The Textile Stock Companies are 608 of which 46 are in liquidation sale and, thus, out of the sample. The remaining 562 have been covered with a percentage of 72% since the companies with data available are 370. The results show that the 56.51% have a high probability and 43.49% not.
-
- Food Industry The Food Stock Companies are 803 of which 24 are in liquidation sale and, thus, out of the sam-ple. The remaining 779 have been covered with a percentage of 67% since the companies with data available are 522. The findings show that the 41.00% have a high probability and 59% not. This means that two different threshold bring to two different results.
-
- Clothing Industry The Italian Stock Companies belonging to the Clothing Sector are 378 of which 34 are in liqui-dation sale and, thus, out of the sample. The re-maining 344 have been covered with a percent-age of 69% (236 have been the companies with data available). The results show that the 66.95% have a high probability and 33.05% not.
-
- Automotive Industry The Automotive Stock Companies are 454 of which 30 are in liquidation sale and, thus, out of the sample. The remaining 424 have been cov-ered with a percentage of 65% since the compa-nies with data available are 274. The results show that the 55.84% have a high probability and 44.16% not.
-
- Metallurgic Industry The Italian Stock Companies belonging to the Metallurgic sector within Automotive Sector are
Paolone F., Magazzino C. / Economia Aziendale Online Vol. 5, 4(2014): 253-261 258
512 of which 23 are in liquidation sale and, thus, out of the sample. The remaining 489 Compa-nies have been covered with a percentage of 76% since the companies with data available are 370. The findings show that the 47.03% have a high probability and 52.97% not.
From the results obtained for each industrial sec-tor, this what emerged: the “Food Industry” is the one with a higher percentage of “low probability of ma-nipulation” (59%) versus 41%, followed by the “Met-allurgic Industry” where the analysis leads to a result of low probability of manipulation, amounting to 52.7%, compared to a high of 47.03%.
In the “Automotive Industry”, on the other hand, the percentages are reversed in favor of the “high probability of manipulation” (55.84%) against a low of 44.16%. In the “Textile Industry”, there has been a result of “low probability” of 43.49%, compared to a high of 56.51%. Finally, the “Clothing Industry” is the one with the higher percentage of “high probabil-ity”, 66.95%, compared with a low of 33.05%. The overall result shows a substantial equality of the companies analyzed between the low and the high probability of manipulating earnings.
6 –Suggestions for future contributions
The suggestions for future contributions are based on expanding the data in terms of further indus-try sectors. It would be useful considering EU-nations as well as no EU countries in order to make a cross-country analysis and compare the results. Furthermore, in relation with the -1.78 threshold (Be-neish et al., 2013), however, the “professional prac-tice” sets a different threshold, equal to -2.22. It would be appropriate to carry out a comparative anal-ysis between the two thresholds. Finally, it would be even useful analyzing the findings related to the vari-ance between the two results.
References
Aboody D., Hughes J., Liu J. (2002). Measuring value rele-vance in a (possibly) inefficient market. Journal of Ac-counting Research, Vol. 40, No. 4. Bartov E. (1993). The Timing of Asset Sales and Earnings Manipulation. The Accounting Review, Vol. 68, No. 4. Beneish, M.D. (1997). Detecting Gaap Violation: Implica-tions For Assessing Earnings Management Among Firm With Extreme Financial Performance. Journal Of Account-ing And Public Policy, Vol. 16, [271-309]. Beneish, M.D. (1999). The Detection Of Earnings Manipu-lation. Financial Analysts Journal, Vol. 55, [24-36]. Beneish, M. D., Lee M.C. and Nichols D.C. (2013). Earn-ing Manipulation and Expected Returns. Financial Analysts Journal, April, [57-82].
Ciesielski, J. (1998). What’s Happening to the “Quality of Assets”?. The Analyst’s Accounting Observer, Vol. 7, No. 3, February, 19. De Angelo L. (1986). Accounting numbers as market evalu-ation substitutes: a study of management buyouts of public stockholders. The Accounting Review, Vol.61, [400-420]. Dechow, P.M., Dichev I.D. (2002). The quality of accruals and earnings: the role of accrual estimation errors, The Ac-counting Review, Vol. 77, No. 1. Dechow, P.M., Sloan, R.G. and Sweeney, A.P. (1995). De-tecting Earnings Management, The Accounting Review, Vol. 70, [193-225]. Dye, R.A. (1988). Earnings management in an overlapping generations model. Journal of Accounting Research, Vol. 26, [195-235]. Fridson, M.S. (2002). Financial Statement Analysis: A Practitioner’s Guide. New York: John Wiley & Sons. Hand, J. R. (1989). Did firms undertake debt-equity swaps for an accounting paper profit or true financial gain?. The Accounting Review, Vol. 64, [587-623]. Harrington, C. (2005). Formulas For Detection: Analysis ratios for detecting financial statement fraud, Fraud Maga-zine, http://www.cfenet.com/resources/articles/ViewArticle.asp?ArticleID=416 [April 7th, 2006]. Healy, P.M. (1985). Evidence On The Effect Of Bonus Schemes On Accounting Procedure And Accrual Decisions, Journal Of Accounting And Economics, Vol. 7, [85-107]. Healy, P.M. and Wahlen, J.M., (1999). Commentary: a re-view of the earnings management literature and its implica-tions for standard setting. Accounting Horizons, Vol. 13, No. 4, [365-383]. Jones, J. (1991). Earnings management during import Vol 29, No. 2, [193-228]. Lev, B., Thiagarajan, S.R. (1993). Fundamental Information analysis. Journal of Accounting Research, Vol.31, [190-215]. Macey J.R., Miller J.P. (1990). Good Finance, Bad Eco-nomics: An Analysis of the Fraud-on-the-Market Theory. Stanford Law Review, Vol. 42, No. 4. Merrill Lynch (2000). Financial Reporting Shocks. March 31, New York. Mulford, C.W. and Comiskey, E.E., (2002). The Financial Numbers Game: Detecting Creative Accounting Practices. New York: John Wiley & Sons. Peek, E., Meuwissen, R., Moers, F. and Vanstraelen, A. (2013). Comparing Abnormal Accruals Estimates across Samples: An International Test. The European Accounting Review, Vol. 22, No. 3, [533-572]. Ronen, J., and Sadan S. (1981). Smoothing Income Num-bers: Objectives, Means, and Implications. Reading, MA: Addison-Wesley. Roychowdhury S. (2006). Earnings Management through real activities manipulation. Journal of Accounting and Economics, Vol. 42, No. 3. Schipper, K., (1989). Commentary: earnings management. Accounting Horizons, Vol. 3, No. 4, [91-102]. Sharpe W.F. (1964). Capital asset prices: A theory of mar-ket equilibrium under conditions of risk. The Journal of Fi-nance, Vol. 19, No. 3. Stickney C., Brown P., and Wahlen J.. (2003). Financial Reporting, Financial Statement Analysis and Valuation, Thomson-Southwestern.
Paolone F., Magazzino C. / Economia Aziendale Online Vol. 5, 4(2014): 253-261
259
Stolowy H., Breton G. (2004). Accounts Manipulation: a literature review and proposed conceptual framework, Re-view of Accounting and Finance, Vol. 3, No. 1. Trueman, B., and Titman S. (1988). An explanation for ac-counting income smoothing, Journal of Accounting Re-search, Vol. 26, [127-139]. Walker M. (2013). How far can we trust earnings numbers? What research tells us about earnings management, Ac-counting and Business Research, Vol. 43, No. 4, [445-481]. Wells, J.T. (2001). Irrational ratios. Journal of Accountan-cy. New York.
Web Sites
Université de Lille (2004) ‘Modèle de Beneish’, http://esa.univlille2.fr/AFI/20042005/groupe06/interieur/03etatsfinanciers/modelebeneish.htm [March 22nd, 2006] www.borsaitaliana.it https://aida.bvdinfo.com/version-201457/home.serv?product=AidaNeo http://www.oldschoolvalue.com/blog/investment-tools/beneish-earnings-manipulation-m-score/ http://www.ft.com/intl/cms/s/0/8588d422-b6ca-11e1-8c96-00144feabdc0.html#axzz34u7jvbYj
Appendix A
Receivables consist of a series of short and long-term accounting transactions dealing with the billing of a customer for goods and services they have ordered. In AIDA they named as “Crediti vs Clienti entro 12 me-si ed oltre 12 mesi”.
Sales are the act of selling a product or service in re-turn for money or other compensation. In AIDA they named as “Ricavi di Vendite e Prestazioni”.
Cost of Goods Sold is computed as “cost of begin-ning inventory + cost of goods purchased (net of any returns or allowances) – cost of ending inventory”. In AIDA they named as “Costo del Venduto = Rima-nenze Iniziali + Costo delle materie prime – Rima-nenze Finali”
Current Assets consists of any asset reasonably ex-pected to be sold, consumed, or exhausted through the normal operations of a business within the cur-rent fiscal year or operating cycle. In AIDA, they named as “Attivo Circolante”.
PPE (Property, Plant and Equipment) consists of “Tangible Assets” that are included in Fixed Assets. In AIDA they named as “Immobilizzazioni Materi-ali”.
Total Assets is computed as the sum of Current As-sets and Fixed Assets. In AIDA, they named as “To-tale Attivo”.
Depreciation is the decrease in value of Tangible As-sets (Property, plant and equipment) while “Amortiza-tion” is the decrease of Intangible Assets. In AIDA, they named as “Ammortamento dei beni materiali”.
SGA expenses (Selling, General and Administrative expenses) is the sum of all direct and indirect selling expenses and all general and administrative expenses of a company. AIDA doesn´t show this cost category. We assume the value of 1
LTD (Long Term Debts) is the sum of all long term borrowings of a company. AIDA doesn´t show this cost category. In AIDA, the named as “Totale Debiti oltre l´esercizio”.
Current Liabilities consists of all debts or obliga-tions that are due within one year. In AIDA, they named as “Passivo Corrente”.
Cash consists of Legal tender or coins that can be used in exchange goods, debt, or services. In AIDA, they named as “Totale Disponibilitá Liquide”.
Current Maturity of LTD consists of the amount of LTD that expired within one year. This item is includ-ed in the general area of “Passivo Corrente”. So that, “Passivo Corrente = Current Liabilities + Current Ma-turity of LTD”.
Income Tax Payable comprised of taxes that must be paid to the government within one year. In AIDA, this is computed as “Imposte Correnti + Imposte Differite – Imposte Anticipate”.
Depr.&Amort. are decrease in value of both Tangi-ble and Intangible Assets. From AIDA, this is compu-ted as “Ammortamento beni materiali + Ammorta-menti beni immateriali”.
Paolone F., Magazzino C. / Economia Aziendale Online Vol. 5, 4(2014): 253-261 260
Graphs and Tables
- Table A: Sample of Companies with data available
Textile Food Clothing Automotive Metallurgic TOTAL
Companies (from AIDA) 608 803 378 454 512 2755 Companies in Liquidation Sale 46 24 34 30 23 157 Companies selected 562 779 344 424 489 2598 Companies with data available 407 522 236 274 370 1809 % Coverage 72,42% 67,01% 68,60% 64,62% 75,66% 69,66%
- Table B: Research Design of EM
Industry)Sectors Company's)type Beneish)Model)(1999)
Textile
FoodThreshold-<-/1.78--- !!!Low!Probability!of!Earnings!Manipulation
ClothingThreshold->-/1.78 !!High!Probability!of!Earnings!Manipulation
Automotive
Metallurgic
Threshold
Manipulation)Score)=))))))))))))))))))))))))))))))))))))))))))))))))))>4,840)+)0,920*DSRI)+)0,528*GMI)+)
0,404*AQI)+)0,892*SGI)+)0,115*DEPI)>)0,172*SGAI)>)0,327*LVGI)+)
4,679*TATA
))ITALIAN)STOCK)COMPANIES
- Table C: Overall results with the -1.78 threshold
THRESHOLD -1.78 TOTAL Companies with High Probability of EM 929 51,4%
Companies with Low Probability of EM 880 48,6%
Total 1809 100%
- Table D: Results for each Industry Sectors
Paolone F., Magazzino C. / Economia Aziendale Online Vol. 5, 4(2014): 253-261
261
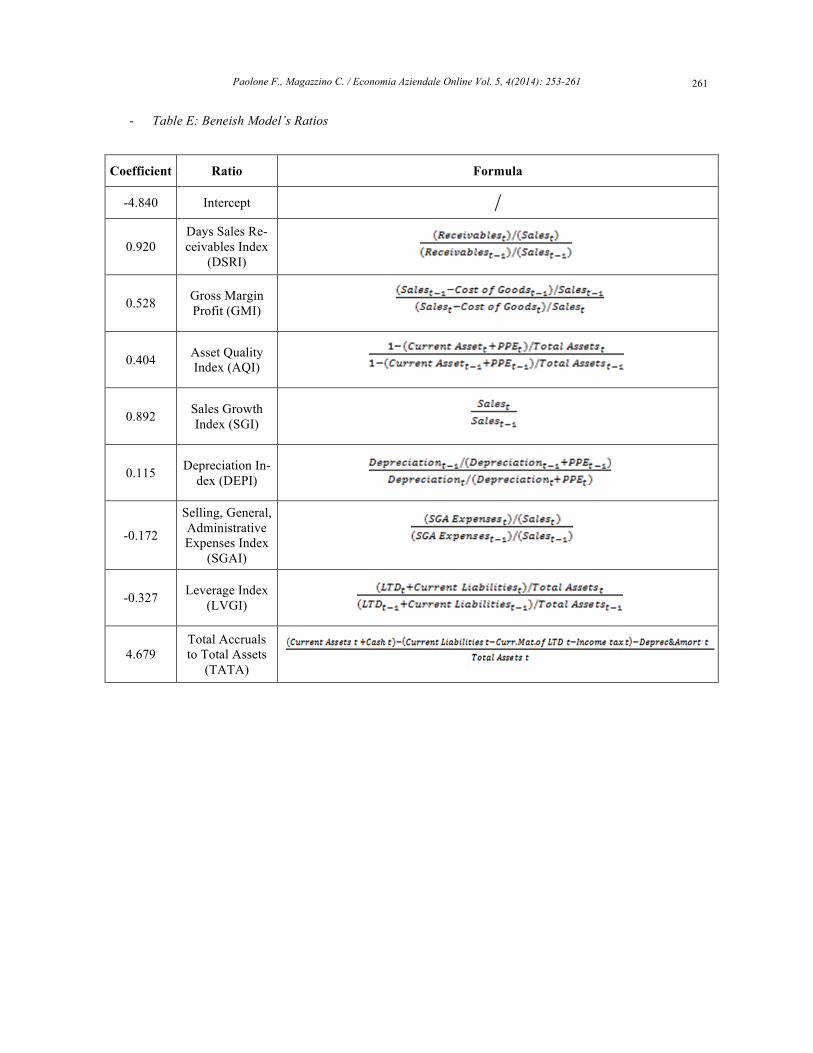
- Table E: Beneish Model’s Ratios
Coefficient Ratio Formula
-4.840 Intercept /
0.920 Days Sales Re-ceivables Index
(DSRI)
0.528 Gross Margin Profit (GMI)
0.404 Asset Quality Index (AQI)
0.892 Sales Growth Index (SGI)
0.115 Depreciation In-dex (DEPI)
-0.172
Selling, General, Administrative Expenses Index
(SGAI)
-0.327 Leverage Index (LVGI)
4.679 Total Accruals to Total Assets
(TATA)