e-Proceedings_ICCC-X.pdf - free statistics
312
-
Upload
khangminh22 -
Category
Documents
-
view
0 -
download
0
Transcript of e-Proceedings_ICCC-X.pdf - free statistics


Proceedings of the International Conference onComputational Creativity
edited byDan Ventura, Alison Pease, Rafael Perez y Perez,
Graeme Ritchie and Tony Veale
Lisbon, PortugalJanuary 2010
Department of Informatics EngineeringUniversity of Coimbra

Departament of Informatics EngineeringUniversity of CoimbraPlo II, Pinhal de Marrocos3030-290 Coimbra, Portugal
www.dei.uc.pt
First published 2010
TITLE: PROCEEDINGS OF THE INTERNATIONAL CONFERENCE ONCOMPUTATIONAL CREATIVITY
EDITORS: DAN VENTURA, ALISON PEASE, RAFAEL PEREZ Y PEREZ,GRAEME RITCHIE, TONY VEALE
ISBN: 978-989-96001-2-6

Preface
This first international conference celebrates the 10th anniversary of a seriesof events on computational creativity which began in 1999. During this period,the symposia and workshops have acted as a focus for an active research com-munity, and have included:
– IJWCC 2008, Madrid, Spain– AAAI 2008 Symposium on Creative Intelligent Systems, Stanford, CA, USA– IJWCC 2007, London, UK (first autonomous workshop)– IJWCC 2006, Riva del Garda, Italy, ECAI’2006– IJWCC 2005, Edinburgh, UK, IJCAI’2005– IJWCC 2004, Madrid, Spain, ECCBR’2004
The IJWCC series resulted from two previous streams of symposia and work-shops associated with AISB 99, AISB 00, ICCBR 01, AISB 01, ECAI 02, AISB02, IJCAI 03, AISB 03 and LREC 04.
As the field has continued to grow, the time has come for the creation of amore formal, even archival, forum for work in computational creativity and thisyear we took the leap. We are gratified to note that we received 53 paper submis-sions as well as 12 show and tell submissions. Each of the paper submissions wasreviewed by at least three programme committee members and additionally byat least one member of the senior programme committee. Each of the show andtell submissions were vetted by the senior programme committee. We are gratefulfor the thoughtful and thorough reviews provided by the programme committee(without whose hard work, this conference would not have been possible), and,based on these, we accepted 33 papers and 11 show and tell presentations.
The conference has been developed as a truly international affair, with mem-bers of the programme committee hailing from Italy, Spain, Mexico, Australia,Indonesia, Ireland, Portugal, the United Kingdom and the United States. Wereceived submissions from authors in 16 different countries, with the number ofsubmissions nearly double that of previous meetings. As the field continues toprogress, we look forward to being the venue at which its work is showcased.
This year, we look forward to stimulating discussion, interesting presentationsand the genesis of important collaborations. As in years past, we are unlikely toresolve (or to even address) the question of defining creativity. However, we willtake a few more steps towards the development of systems that must eventuallybe acknowledged as creative themselves, and, in the process, we will, perhaps,ask additional interesting questions about ourselves.
Dan, Alison, Rafael, Graeme, and TonyDecember 2009 Provo, Edinburgh, Mexico City, Aberdeen, Dublin
iii

Conference Organization
Chairs
Geraint A. Wiggins (Goldsmiths, University of London, UK) – GeneralDan Ventura (Brigham Young University, USA) – ProgramAmılcar Cardoso (University of Coimbra, Portugal) – LocalSimon Colton (Imperial College London, UK) – Publicity
Senior Programme Committee
Alison Pease (University of Edinburgh, UK)Rafael Perez y Perez (UAM Cuajimalpa, Mexico)Graeme Ritchie (University of Aberdeen, UK)Tony Veale (University College Dublin, Ireland)
Local Organization
Paulo Urbano (University of Lisbon, Portugal)Luıs Macedo (University of Coimbra, Portugal) - FinancePaulo Pires (University of Coimbra, Portugal) - SponsoringJorge Avila (University of Coimbra, Portugal) - SecretariateAndre Jeronimo, Lıgia Costa
and Pedro Cruz (University of Coimbra, Portugal) - Graphic Design
Steering Committee
Amılcar Cardoso (University of Coimbra, Portugal)Simon Colton (Imperial College London, UK)Pablo Gervas (Universidad Complutense de Madrid, Spain)Alison Pease (University of Edinburgh, UK)Rafael Perez y Perez (UAM Cuajimalpa, Mexico)Graeme Ritchie (University of Aberdeen, UK)Rob Saunders (University of Sydney, Australia)Tony Veale (University College Dublin, Ireland)Dan Ventura (Brigham Young University, USA)Geraint A. Wiggins (Goldsmiths, University of London, UK)

Programme Committee
John Barnden (University of Birmingham, UK)Ana Boa-Ventura (University of Texas, Austin, USA)David Brown (Worcester Polytechnic Institute, USA)Paul Brown (University of Sussex, UK)Win Burleson (Arizona State University, USA)John Collomosse (University of Bath, UK)Anna Feldman (Montclair State University, USA)John Gero (George Mason University, USA)Pablo Gervas (Universidad Complutense de Madrid, Spain)Ashok Goel (Georgia Institute of Technology, USA)Paulo Gomes (University of Coimbra, Portugal)Kaz Grace (University of Sydney, Australia)Fox Harrell (Georgia Institute of Technology, USA)Kyle Jennings (University of California, Berkeley, USA)Robert Keller (Harvey Mudd College, USA)Penousal Machado (University of Coimbra, Portugal)Brian Magerko (Georgia Institute of Technology, USA)Lorenzo Magnani (University of Pavia, Italy)Mary Lou Maher (National Science Foundation, USA)Ramon Lopez de Mantaras (IIIA-CSIC, Spain)Ruli Manurung (University of Indonesia, Indonesia)Jon McCormack (Monash University - Clayton, Australia)David C. Moffat (Glasgow Caledonian University, UK)Nick Montfort (Massachusetts Institute of Technology, USA)Diarmuid O’Donoghue (National University of Ireland, Ireland)Francisco Camara Pereira (University of Coimbra, Portugal)Luis Pineda (Universidad Nacional Autnoma de Mxico, Mexico)Sarah Rauchas (Goldsmiths, University of London, UK)Joaquim Reis (ISCTE, Lisbon University Institute, Portugal)Mark Riedl (Georgia Institute of Technology, USA)Judy Robertson (Heriot-Watt University, UK)Juan Romero (Universidade da Corua, Spain)Rob Saunders (University of Sydney, Australia)Ricardo Sosa (Tecnologico de Monterrey, Mexico)Oliviero Stock (Istituto per la Ricerca Scientifica e Tecnologica, Italy)Carlo Strapparava (Istituto per la Ricerca Scientifica e Tecnologica, Italy)Ron Sun (Rensselaer Polytechnic Institute, USA)Chris Thornton (University of Sussex, UK)

Sponsors and Support
Sponsored by the European Coordinating Committee for Artificial Intelligence incooperation with the Association for the Advancement of Artificial Intelligence.
We gratefully acknowledge the support of the Portuguese Association for Artifi-cial Intelligence, Ferrand, Bicker & Associados, the Centre for Informatics andSystems of the University of Coimbra, the University of Coimbra, the Universityof Lisbon, Luso-American Development Foundation, Fundacao para a Ciencia ea Tecnologia, and Comissao Portuguesa para o Ano Europeu da Criatividade eInovacao 2009.
Agradecemos penhoradamente a Comissao Parlamentar de Educacao e Cienciada Assembleia da Republica pelo apoio prestado, que sublinha a enfase e oempenho que a Democracia Portuguesa coloca nas questoes da ciencia e da tec-nologia.
We warmly thank the Committee on Education and Science of the PortugueseParliament for their support, which emphasizes the commitment that the Por-tuguese Democracy devotes to issues of science and technology.

Table of Contents
Music: Patterns and Harmony
Using Discovered, Polyphonic Patterns to Filter Computer-generatedMusic . . . . . . . . . . . . . . . . . . . . . . . . . . . . . . . . . . . . . . . . . . . . . . . . . . . . . . . . . . . 1
Tom Collins, Robin Laney, Alistair Willis, Paul Garthwaite
Development of Techniques for the Computational Modelling of Harmony 11Raymond Whorley, Geraint Wiggins, Christophe Rhodes, Marcus Pearce
Realtime Generation of Harmonic Progressions Using ConstrainedMarkov Selection . . . . . . . . . . . . . . . . . . . . . . . . . . . . . . . . . . . . . . . . . . . . . . . . . 16
Arne Eigenfeldt, Philippe Pasquier
Visual Art
Establishing Appreciation in a Creative System . . . . . . . . . . . . . . . . . . . . . . . 26David Norton, Derrall Heath, Dan Ventura
Automated Collage Generation - With Intent . . . . . . . . . . . . . . . . . . . . . . . . . 36Anna Krzeczkowska, Jad El-Hage, Simon Colton, Stephen Clark
A Step Towards the Evolution of Visual Languages . . . . . . . . . . . . . . . . . . . . 41Penousal Machado, Henrique Nunes
Analogy and Metaphor
On the Role of Metaphor in Creative Cognition . . . . . . . . . . . . . . . . . . . . . . . 51Bipin Indurkhya
Some Aspects of Analogical Reasoning in Mathematical Creativity . . . . . . 60Alison Pease, Markus Guhe, Alan Smaill
A Fractal Approach Towards Visual Analogy . . . . . . . . . . . . . . . . . . . . . . . . . 65Keith McGreggor, Maithilee Kunda, Ashok Goel
Stories
Towards Analogy-Based Story Generation . . . . . . . . . . . . . . . . . . . . . . . . . . . . 75Jichen Zhu, Santiago Ontanon
Story Generation Driven by System-Modified Evaluation Validated byHuman Judges . . . . . . . . . . . . . . . . . . . . . . . . . . . . . . . . . . . . . . . . . . . . . . . . . . . . 85
Pablo Gervas, Carlos Leon

MEXICA-Impro: A Computational Model for Narrative Improvisation . . . 90Rafael Perez y Perez, Santiago Negrete, Eduardo Penalosa, Rafael Avila,Vicente Castellanos, Christian Lemaitre
Social Aspects
Curious Whispers: An Embodied Artificial Creative System . . . . . . . . . . . . 100Rob Saunders, Petra Gemeinboeck, Adrian Lombard, Dan Bourke, BakiKocaballi
Elementary Social Interactions and Their Effects on Creativity: AComputational Simulation . . . . . . . . . . . . . . . . . . . . . . . . . . . . . . . . . . . . . . . . . 110
Andres Gomez de Silva Garza, John Gero
Foundations
Constructing Conceptual Spaces for Novel Associations . . . . . . . . . . . . . . . . 120Kazjon Grace, Rob Saunders, John Gero
Search Strategies and the Creative Process . . . . . . . . . . . . . . . . . . . . . . . . . . . 130Kyle E. Jennings
Music: Creation/Generation
Automatic Generation of Music for Inducing Emotive Response . . . . . . . . . 140Kristine Monteith, Tony Martinez, Dan Ventura
Real-Time Emotion-Driven Music Engine . . . . . . . . . . . . . . . . . . . . . . . . . . . . 150Alex Rodrıguez Lopez, Antonio Pedro Oliveira, Amılcar Cardoso
Tabla Gyan: An Artificial Tabla Improviser . . . . . . . . . . . . . . . . . . . . . . . . . . 155Parag Chordia, Alex Rae
Creativity Support: Tools
On the Impact of Chat Communication on Computer-Supported IdeaGeneration Processes . . . . . . . . . . . . . . . . . . . . . . . . . . . . . . . . . . . . . . . . . . . . . . 165
Florian Forster, Marc Rene Frieß, Michele Brocco, Georg Groh
Live Coding Towards Computational Creativity . . . . . . . . . . . . . . . . . . . . . . . 175Alex McLean, Geraint Wiggins
On Two Desiderata for Creativity Support Tools . . . . . . . . . . . . . . . . . . . . . . 180Wai Yeap, Tommi Opas, Narges Mahyar

Creativity Support: Applications
Bisociative Knowledge Discovery for Microarray Data Analysis . . . . . . . . . 190Igor Mozetic, Nada Lavrac, Vid Podpecan, Petra Kralj Novak, He-lena Motaln, Marko Petek, Kristina Gruden, Hannu Toivonen, KimmoKulovesi
Domain Bridging Associations Support Creativity . . . . . . . . . . . . . . . . . . . . . 200Tobias Kotter, Kilian Thiel, Michael R. Berthold
Measuring Creativity in Software Development . . . . . . . . . . . . . . . . . . . . . . . 205Courtney Nelson, Bradley Brummel, Frank Grove, Noah Jorgenson,Sandip Sen, Rose Gamble
Music: Improvisation and Interaction
Clap-along: A Negotiation Strategy for Creative Musical Interactionwith Computational Systems . . . . . . . . . . . . . . . . . . . . . . . . . . . . . . . . . . . . . . . 215
Michael Young, Oliver Bown
A Fitness Function for Creativity in Jazz Improvisation and Beyond . . . . . 223Anna Jordanous
Learning to Create Jazz Melodies Using Deep Belief Nets . . . . . . . . . . . . . . 228Greg Bickerman, Sam Bosley, Peter Swire, Robert M. Keller
Evolution and Design
Experiments in Objet Trouve Browsing . . . . . . . . . . . . . . . . . . . . . . . . . . . . . . 238Simon Colton, Jeremy Gow, Pedro Torres, Paul Cairns
Evolving Expression of Emotions Through Color in Virtual HumansUsing Genetic Algorithms . . . . . . . . . . . . . . . . . . . . . . . . . . . . . . . . . . . . . . . . . . 248
Celso M. de Melo, Jonathan Gratch
The Evolution of Fun: Automatic Level Design Through ChallengeModeling . . . . . . . . . . . . . . . . . . . . . . . . . . . . . . . . . . . . . . . . . . . . . . . . . . . . . . . . 258
Nathan Sorenson, Philippe Pasquier
Linguistics
Quantifying Humorous Lexical Incongruity . . . . . . . . . . . . . . . . . . . . . . . . . . . 268Chris Venour, Graeme Ritchie, Chris Mellish
Defining Creativity: Finding Keywords for Creativity Using CorpusLinguistics Techniques . . . . . . . . . . . . . . . . . . . . . . . . . . . . . . . . . . . . . . . . . . . . . 278
Anna Jordanous
ix

Show and Tell Session
Automated Jazz Improvisation . . . . . . . . . . . . . . . . . . . . . . . . . . . . . . . . . . . . . 288Robert M. Keller
The Painting Fool Teaching Interface . . . . . . . . . . . . . . . . . . . . . . . . . . . . . . . . 289Simon Colton
Generative Music Systems for Live Performance . . . . . . . . . . . . . . . . . . . . . . 290Andrew R. Brown, Toby Gifford, Rene Wooller
Realtime Generation of Harmonic Progressions in Kinetic Engine . . . . . . . 291Arne Eigenfeldt, Philippe Pasquier
The Continuator Strikes Back: a Controllable Bebop ImprovisationGenerator . . . . . . . . . . . . . . . . . . . . . . . . . . . . . . . . . . . . . . . . . . . . . . . . . . . . . . . . 292
Francois Pachet
Software Engineering Rewards for Brainstorming Online (SEREBRO) . . . 293Frank Grove, Noah Jorgenson, Sandip Sen, Rose Gamble
Piano prosthesis . . . . . . . . . . . . . . . . . . . . . . . . . . . . . . . . . . . . . . . . . . . . . . . . . 294Michael Young
A Visual Language for Darwin . . . . . . . . . . . . . . . . . . . . . . . . . . . . . . . . . . . . . . 295Penousal Machado, Henrique Nunes
Using Computational Models to Harmonise Melodies . . . . . . . . . . . . . . . . . . 296Raymond Whorley, Geraint Wiggins, Christophe Rhodes, Marcus Pearce
User-Controlling Expressed Emotions in Music with EDME . . . . . . . . . . . . 297Alex Rodrıguez Lopez, Antonio Pedro Oliveira, Amılcar Cardoso
Swarm Painting Atelier . . . . . . . . . . . . . . . . . . . . . . . . . . . . . . . . . . . . . . . . . . . . 298Paulo Urbano
Author Index . . . . . . . . . . . . . . . . . . . . . . . . . . . . . . . . . . . . . . . . . . . . . . . 299

Using Discovered, Polyphonic Patternsto Filter Computer-generated Music
Tom Collins, Robin Laney, Alistair Willis, and Paul Garthwaite
The Open University, Walton Hall, Milton Keynes, MK7 6AA, [email protected]
Abstract. A metric for evaluating the creativity of a music-generatingsystem is presented, the objective being to generate mazurka-style musicthat inherits salient patterns from an original excerpt by Frederic Chopin.The metric acts as a filter within our overall system, causing rejection ofgenerated passages that do not inherit salient patterns, until a generatedpassage survives. Over fifty iterations, the mean number of generationsrequired until survival was 12.7, with standard deviation 13.2. In theinterests of clarity and replicability, the system is described with ref-erence to specific excerpts of music. Four concepts—Markov modellingfor generation, pattern discovery, pattern quantification, and statisticaltesting—are presented quite distinctly, so that the reader might adopt(or ignore) each concept as they wish.
1 Aim and Motivation
A stylistic composition (or pastiche) is a work similar in style to that of an-other composer or period. Examples exist in ‘classical’ music (Sergey Prokofiev’sSymphony No. 1 is in the style of Joseph Haydn) as well as in music for filmand television, and in educational establishments, where stylistic composition istaught ‘as a means of furthering students’ historical and analytical understand-ing’ (Cochrane 2009). If a computational system produces successful stylisticcompositions (‘successful’ in the sense of the ‘indistinguishability test’ of Pearceand Wiggins (2001) for instance), then it is capable of a task that, in the humansphere, is labelled creative. The creativity metric presented below is intended aspreliminary to (not a replacement of) an ‘indistinguishability test’.
This paper relates ongoing research on a computational system with the aimof modelling a musical style.1 The motivation for the system is as follows. Cope(2005, pp. 87-95) describes a data-driven model that can be used to generatepassages of music in the style of Johann Sebastian Bach’s chorale harmonisations.His model can be cast as a first-order Markov chain and we have replicated thisaspect of his model, with some modifications (see Sect. 2 for details). Our methodis applied to a database consisting of Frederic Chopin’s mazurkas. This choice
1 See Pearce et al. (2002) on how computational modelling of musical styles constitutesone motivation for automating the compositional process.
1

of database is refreshing (Bach chorales have become the standard choice) andexplores the range of music in which Markov chain models can be applied.
A passage generated by a first-order Markov model ‘often wanders with un-characteristic phrase lengths and with no real musical logic existing beyond thebeat-to-beat syntax’ (Cope 2005, p. 91) and Cope discusses strategies for ad-dressing this problem. One such strategy—of incorporating musical ‘allusions’into generated passages—has been criticised for having an implementation thatdoes not use robust, efficient algorithms from the literature (Wiggins 2008,p. 112-113).
Our system is motivated by a desire to investigate the above ‘allusion’ strat-egy, armed with more robust algorithms (or their underlying concepts), and isillustrated in Fig. 1. Subsequent sections describe various parts of this schematic,as indicated by the dotted boxes, but an overview here may be helpful. By an‘allusion’ we mean that an excerpt is chosen from one of 49 Chopin mazurkas(bottom left of Fig. 1), with the objective of generating mazurka-style music thatinherits salient patterns from the chosen excerpt.2 To this end salient patternsare handpicked from the chosen excerpt, using the concept of maximal trans-latable pattern (Meredith et al. 2002). This is the meaning of the box labelled‘pattern discovery’ in Fig. 1. The discovered patterns are then stored as a ‘tem-plate’. Meanwhile the dotted box for Sect. 2 in Fig. 1 indicates that a passage(of approximately the same length as the chosen excerpt) can be generated ondemand. Illustrated by the diamond box in Fig. 1, the same type of patternsthat were discovered and stored as a template are now sought algorithmically inthe computer-generated passage. For a computer-generated passage to survivethe filtering process, we ask that it exhibits the same type of patterns as werediscovered in the chosen excerpt, occurring the same number of times and insimilar locations relative to the duration of the passage as a whole. In Sect. 4the concept of ontime percentage and the Wilcoxon two-sample test are em-ployed to quantify and compare instances of the same type of pattern occurringin different passages of music.
!"#"$"%&'()*#"+*+*,'
-.)/+*0%'1"2345"%'
6&(#7'8'
9)41":)*');'
<"45)='1)>&?'
@"%%",&');'13%+('
,&*&4"#&>'$A'1)>&?'
BC(&4/#'(.)%&*';4)1'
"'-.)/+*'1"2345"'
6&(#7'D'
@"E&4*'
>+%()=&4A'
@"E&4*%'+*'&C(&4/#'
%#)4&>'"%'#&1/?"#&'
6&(#7'F'
G&*&4"#&>'
/"%%",&'
%34=+=&%'
H?#&4+*,'
!)&%7'
,&*&4"#&>'
/"%%",&'H#'
#&1/?"#&I'
J)'
K&%'
Fig. 1. A schematic of the system to be described.
2 We would like to thank Craig Stuart Sapp for creating these kern scores and MIDIfiles, hosted at http://kern.humdrum.net. The database used in this paper consistsof opuses 6, 7, 17, 24, 30, 33, 41, 50, 56, 59, 63, 67, and 68.
2

2 Generation of Computer Music Using a Markov Model
Since initial attempts to marry music theory and Markov chains (Hiller andIsaacson 1959), their application to music analysis and composition has receivedconsiderable attention (see Loy 2005 for an accessible introduction and Norris1997 for the supporting mathematics). The generation of a so-called ‘Markoviancomposition’ is outlined now. Suppose that we join the Markovian compositionpartway through, and that the chord D4-C6 indicated by an arrow in bar 2of Fig. 2 has just been composed, but nothing further (‘middle C’ is takento be C4, and look out for clef changes). The 49 mazurkas by Chopin havingbeen analysed, it is known, say, that in this corpus Chopin uses the D4-C6chord (or any of its transpositions) on 24 occasions. The computer generatesa random number uniformly between 1 and 24, say 17. The 17th instance ofthis chord (actually one of its transpositions, A2-G4) occurs in bar 38 of theMazurka in B Major, op. 41/3. The chord that follows in this mazurka, A2-D]4, is transposed appropriately (to D4-G]5) and becomes the next chord ofthe Markovian composition. To continue composing, one can repeat the last fewsentences with D4-G]5 as the current chord. The passages shown in Figs. 2–3were generated in this way.
!1
67/3,0
" !56/1,119
56/1,116
67/4,18
" ! " !7/5,5
"# " ! !"63/3,18
63/3,26
63/3,58
" ! " ! 41/3,38
41/4,60" ! "$ !
63/1,77
67/1,49
" ! ""$ !! " ! ""$ !! ""$ !! "" !! "" !! ""$ !! ""$$ !! "" !!% &! '
""" !!! ! """( !!! " ! """$ !!! " ! "" !! "" !! "" !! "" !!
Fig. 2. A passage from the computer-music generator that does not survive filtering(contrast with Fig. 3). The italicised numbers refer to opus and bar numbers of par-ticular fragments. For instance ‘67/3, 0’ means opus 67, number 3, bar 0 (anacrusis).The durations in this system are dotted to improve the legibility of the first bar.
The above explanation is simplified slightly, for what happens if one or morealready-articulated notes are held while others begin? This is discussed withreference to the chord C3-F]4-D5 indicated by an arrow in bar 6 of Fig. 3. Inthis chord, the bottom C3 is held over to the next chord, C3-E]4-C]5. We observethat a note in a given chord can be held in one of four ways:
1. Not held beyond the given chord2. Held over to the next chord3. Held from the previous chord4. Held both from the previous chord and to the next chord
Thus in our model, the chord C3-F]4-D5 indicated by an arrow in Fig. 3 wouldbe represented by the pair of vectors (18, 8), (2, 1, 1). The first vector is the chord
3

!"!"
#1
67/4,0
$% !33/3,17
56/1,108
$&
63/1,33
24/3,19
$ $' $ ! $ $ $59/1,91
$ $67/3,23-28
$ $ $ $ ( $
) * $ * (($ ! $ $ $$$$ $$$
22$$$27
31
*( ! %% $$33
$$
#5 $$ !! $$%%
+ $$' $$ $$'% $$%% $$' $$ $$' !! $$%'+ $$ $$
67/1,32
$$' $$% $$ $$,24/3,26
56/1,18
$$$,,' $$$
) ( !*38
$$ $$ *( ! $$$%61
$$$ ( !* $$$$', $$$$$ $$ $$% $ $'
Fig. 3. A passage from the computer-music generator that does survive filtering. Thedarker noteheads in the left hand are referred to as pattern P ∗, and indexed (in orderof increasing ontime and pitch height) to help with understanding Table 1 (p. 8).
spacing (18 semitones from C3 to F]4, and 8 from F]4 to D5) and the secondvector encodes how each of the three notes are held (or not), according to the listjust given. How is an actual chord of certain duration produced in our model,if it only uses chord spacing and holding information? Above, an example wasgiven in which the 17th instance of a chord spacing was chosen from 24 options.By retaining the bar and opus numbers of the original mazurka to which thischoice corresponds, we are able to utilise any contextual information (that is notalready implied by the chord spacing and holding information) to produce anactual chord of certain duration. This Markov model alone is no match for thecomplex human compositional process, but it is capable of generating a largeamount of material that can be analysed for the presence of certain patterns.
3 Discovering Patterns in Polyphonic Music
Meredith et al. (2002) give an elegant method for intra-opus analysis of poly-phonic music. In ‘intra-opus analysis’ (Conklin and Bergeron 2008, p. 67), asingle piece of music or excerpt thereof is analysed with the aim of discoveringinstances of self-reference. The human music analyst performs this task almostas a prerequisite, for it is arguable that music ‘becomes intelligible to a greatextent through self-reference’ (Cambouropoulos 2006, p. 249). Listening to thepassage in Fig. 4, for instance, the human music analyst would notice:
1. The repetition of bars 11-12 at bars 13-142. The repetition of the rhythms in bar 12 at bar 14 (implied by the above
remark), at bar 15, and again at bar 16 (here except the offbeat minim B4)
4

No doubt there are other matters of musical interest (the tonicization of thedominant at bar 16, the crossing of hands in bars 17-18), as well as ‘lesser’instances of self-reference, but here attention is restricted to remarks 1 and 2.It should be emphasised that these remarks are ‘human discoveries’; not froman algorithm. However, the key concepts of Meredith et al. (2002) can be usedto automate the discovery of these types of pattern, so that they can be soughtalgorithmically in a computer-generated passage.3
!"
!"
[Vivace h. = 60]
# $$$$11
[ f ]
%7 8
% % %15
23%%&$' %% %%( %%
31
%% ) %% **+ %% % % %%&$' %% %%( %% %% ) %% **+3 3
, $$$$1
%%%%-
9
%%%%-
17
%%%%-
25
%%%%-
33
%%%%-
39
%%%%- %%%%
-52 %%%
-% 60 %%%-% %%%%
- %%%%- %%%%
-
# $$$$15 %% ) %% **+ *+%% ) % *+
) ,
p
%- %- %- %- % % *+ !, $$$$ %
90
$%%%95
%%%%
104%% %+%107 %% %% %%+ %% %% %%+
Fig. 4. Bars 11-18 of the Mazurka in E Major, op. 6/3 by Frederic Chopin. As in Fig. 3,some noteheads are darker and indexed to help with understanding Table 1 (p. 8).
The formal representation of music as points in multidimensional space canbe traced back at least as far as Lewin (1987). Each note in Fig. 4 can berepresented as a point in multidimensional space, a ‘datapoint’ d = (x, y, z),consisting of an ontime x, a MIDI note number y and a duration z (a crotchet isset equal to 1). The set of all datapoints for the passage in Fig. 4 is denoted D,for ‘dataset’. For any given vector v, the maximal translatable pattern (MTP)of the vector v in a dataset D is defined by Meredith et al. (2002) as the set ofall datapoints in the dataset that, when translated by v, arrive at a coordinatecorresponding to another datapoint in D.
MTP (v, D) = {d ∈ D | d + v ∈ D}. (1)
For instance,P = MTP (w, D), where w = (6, 0, 0), (2)
is indicated by the darker noteheads in Fig. 4. The vector w = (6, 0, 0) iden-tifies notes that recur after 6 crotchet beats, transposed 0 semitones and with3 Further automation of this part of the system is a future aim.
5

unaltered durations (due to the final 0 in w). This is closely related to remark1 (on p. 4), which observes the repetition of bars 11-12 at 13-14, that is after13− 11 = 2 bars (or 6 crotchet beats). It can be seen from Fig. 4, however, thatP contains two notes each in bars 13, 15 and 16, which are repeated in bars15, 17, 18 respectively. This is less closely related to remark 1, showing that thehuman and computational analytic results do not align exactly. One highlightsan idiosyncrasy—perhaps even a shortcoming—of the other, depending on yourpoint of view.
As well as the definition of a maximal translatable pattern, the other keyconcept in Meredith et al. (2002) is the translational equivalence class (TEC).Musically, the translational equivalence class of a pattern consists of the patternitself and all other instances of the pattern occurring in the passage. Mathemat-ically, the translational equivalence class of a pattern P in a dataset D is
TEC(P,D) = {Q ⊆ D | P ≡τ Q}, (3)
where P ≡τ Q means that P and Q contain the same number of datapoints andthere exists one vector u that translates each point in P to a point in Q. Wereturn to the specific example of the dataset D containing the datapoints for thepassage in Fig. 4, and suppose P is defined by (2). It can be verified that thetranslational equivalence class of P in D is
TEC(P,D) = {P, τ(P,w)}, (4)
where τ(P,w) denotes the set of all vectors p + w, and p is a datapoint in P .Equation (2) helps to identify notes whose durations and MIDI note numbersrecur after 6 crotchet beats. The set in (4) contains the pattern P and τ(P,w),the only other instance of the pattern in the excerpt. Together, the equationssuggest how to automate discovery of the type of pattern described in remark 1.
What of remark 2, the repetition of the rhythms in bar 12 at bar 14 (after 6beats), bar 15 (after 9 beats) and bar 16 (after 12 beats)? As this is a rhythmicpattern, it is useful to work with a ‘rhythmic projection’ D′ of the dataset D.If d = (x, y, z) is a member of D then d′ = (x, z), consisting of an ontime andduration, is a member of the projected dataset D′. It should be noted that twodistinct datapoints d, e ∈ D can have a conicident projection, that is d′ = e′, justas two objects placed side by side might cast coincident shadows. The repetitionobserved in remark 2 occurs at 6 and 9 and 12 beats after the original, so let
S = MTP (u′, D′) ∩MTP (v′, D′) ∩MTP (w′, D′), (5)
where u′ = (6, 0), v′ = (9, 0), and w′ = (12, 0). The set MTP (u′, D′) in (5)corresponds to notes whose durations recur after 6 crotchet beats. The secondset MTP (v′, D′) corresponds to notes whose durations recur after 9 beats, andthe third set MTP (w′, D′) to notes whose durations recur after 12 beats. Takingtheir intersection enables the identification of notes whose durations recur after6, 9 and 12 beats, which is closely related to remark 2. It can be verified that
TEC(S,D′) = {S, τ(S,u′), τ(S,v′), τ(S,w′)}. (6)
6

As with pattern P , the human and computational analytic results for patternS do not align exactly. All of the notes in bar 12 of Fig. 4 are identified asbelonging to pattern S, but so are a considerable number of left-hand notes fromsurrounding bars. While it is not the purpose of this paper to give a fully-fledgedcritique of Meredith et al. (2002), Sect. 3 indicates the current state of progresstoward a satisfactory pattern discovery algorithm for intra-opus analysis.
4 Filtering Process
4.1 Quantifying an Instance of a Musical Pattern
When an instance of an arbitrary pattern P has been discovered within somedataset D, as in the previous section, how can the position of the pattern bequantified, relative to the duration of the excerpt as a whole? Here the straight-forward concept of ontime percentage is used. For a note having ontime t, appear-ing in an excerpt with total duration T , the note has ontime percentage 100t/T .For instance, the excerpt in Fig. 4 has total duration 24 (= 8 bars × 3 beats).Therefore, taking the F] at the top of the first chord in bar 13, with ontime 6,this note has ontime percentage 100t/T = 100 · 6/24 ≈ 33%.
When calculating the ontime percentage of each datapoint p in a pattern P ,a decision must be made whether to include repeated values in the output. Forinstance, the six notes in the first chord in bar 13 will have the same ontimepercentage, so repeated ontime percentages indicate a thicker texture. The in-clusion of repeated values does not affect the appropriateness of the statisticaltest described in Sect. 4.2, but it may affect the result: two otherwise similarlists of ontime percentages might be distinguishable statistically due to a highproportion of repeated values in one collection but not the other. Here the deci-sion is taken not to include repeated values. Two lists of ontime percentages areshown in columns 2 and 5 of Table 1 (overleaf). The bottom half of column 5 isderived from the darker notes in Fig. 3, referred to as pattern P ∗. Column 2 andthe top half of column 5 are derived from the darker notes in Fig. 4, pattern P .
4.2 Applying Wilcoxon’s Two-sample Test in Musical Scenarios
Let us suppose we have two random samples, one consisting of m observationsx1, x2, . . . , xm, and the other consisting of n observations y1, y2, . . . , yn. Columns2 and 5 of Table 1 serve as an example, with m = 17 and n = 6. It shouldbe pointed out that the random-sample supposition almost never applies inmusical scenarios. Increasingly however, the assumption is being made in orderto utilise definitions such as the likelihood of seeing a pattern (Conklin andBergeron 2008). Wilcoxon’s two-sample test helps to determine whether two setsof observations have the same underlying distribution. The calculation of the teststatistic will be demonstrated, with the theoretical details available elsewhere(Neave and Worthington 1988). The test statistic W is calculated by assigningranks R1, R2, . . . , Rn to the set of observations, y1, y2, . . . , yn, as though they
7

Table 1. The note indices, ontime percentages and combined sample ranks of twopatterns are shown, P indicated by the darker noteheads in Fig. 4, and P ∗ from Fig. 3.
Pattern P Pattern P continued
Note Ontime Note Ontimeindex % Rank index % Rank
1 0.0 1 90 54.2 197 1.4 2 95 58.3 208 2.8 3 104 66.7 219 4.2 4 107 70.8 2315 6.3 517 8.3 6 Pattern P ∗
23 10.4 7 22 28.0 1225 12.5 8 27 32.0 1431 15.6 9 31 36.0 1633 16.7 10 33 40.0 1739 20.8 11 38 48.0 1852 29.2 13 61 68.0 2260 33.3 15 P ∗ rank total: 99
appear in a combined sample with the other set. This has been done in column6 of Table 1 (see also column 3). Then W =
∑ni=1Ri is a random variable, and
from Table 1, a value of w = 99 has been observed. Either the exact distributionof W or, for large sample sizes, a normal approximation can be used to calculateIP(W ≤ w). Using a significance threshold of α = 0.05 and with m = 17, n = 6, avalue of W outside of the interval [43, 101] needs to be observed in order to rejecta null hypothesis that the two sets of observations have the same underlyingdistribution. As we have observed w = 99, the null hypothesis cannot be rejected.
What does the above result mean in the context of musical patterns? Wehave taken P and P ∗, two instances of the same type of pattern occurring indifferent passages of music, and compared their ontime percentages. Not beingable to reject the null hypothesis of ‘same underlying distribution’ is taken tomean that a computer-generated passage survives this element of the filteringprocess. We are notionally content that the relative positions of P and P ∗ arenot too dissimilar. There are five further elements to the filtering process here,with the Wilcoxon two-sample test being applied to the ontime percentages of:
1. τ(P,w) and τ(P ∗,w), where w = (6, 0, 0)2. S and S∗, where S is given in (5), and S∗ denotes the corresponding pattern
for the computer-generated passage in Fig. 33. τ(S,u′) and τ(S∗,u′), where u′ = (6, 0)4. τ(S,v′) and τ(S∗,v′), where v′ = (9, 0)5. τ(S,w′) and τ(S∗,w′), where w′ = (12, 0)
At a significance threshold of α = 0.05, the passage in Fig. 3 survives eachelement of the filtering process, whereas the passage in Fig. 2 does not.
8

5 Discussion
This paper has presented a metric for evaluating the creativity of a music-generating system. Until further evaluation has been conducted (by human lis-teners rather than just by the creativity metric), we are cautious about labellingour overall system as creative. The objective in the introduction was to generatemazurka-style music that inherits salient patterns from a chosen excerpt. It isencouraging that Fig. 3—which arguably sounds and looks more like a mazurkathan Fig. 2—survives the filtering process, whereas Fig. 2 does not. In termsof meeting the aim of pattern inheritance, there is considerable room for im-provement: Figs. 3 and 4 do not sound or look much alike, and a human musicanalyst would be hard-pressed to show how the filtered output (Fig. 3) inheritsany salient patterns from the chosen excerpt (Fig. 4). One solution would be toinclude more filters. Another solution would be to raise the significance thresh-old, α. By making the null hypothesis of ‘same underlying distribution’ easierto reject, it becomes harder for a generated passage to survive filtering. Overfifty iterations, the mean number of generations required until survival was 12.7,with standard deviation 13.2. Raising α may increase pattern inheritance, butit may also have a non-linear impact on these statistics.
The verbatim quotation in Fig. 3 (of bars 23-28 from the Mazurka in C Ma-jor, op. 67/3) raises several issues that relate to further work. First, we willconsider including in the system a mechanism for avoidance of verbatim quo-tation. Second, the quotation contains a prominent sequential pattern that isdifferent in nature to the intended inheritance (the two patterns observed in re-marks 1 and 2 on p. 4). Using the concept of morphetic pitch defined in Meredithet al. (2002) it is possible to identify such sequential patterns, so the sequenceitself is not a problem, only that its presence was unintended. Measures existfor the prominence (Cambouropoulos 2006) or interest (Conklin and Bergeron2008) of a pattern relative to others in a passage of music. The adaptation ofthese measures to polyphonic music would constitute a worthwhile addition,both to Meredith et al. (2002) and to the use of discovered, polyphonic patternsin filtering computer-generated music.
We have more general concerns about the extent to which the first-orderMarkov model generalises from Bach chorales to Chopin mazurkas. From a mu-sical point of view the mazurkas may be too rich. The verbatim quotation men-tioned above is indicative of a sparse transition matrix, which might be mademore dense by including more mazurkas or other suitable compositions. Thereare several ways in which the system described could be fine-tuned. First, com-putational time could be saved by filtering incrementally, discarding generatedpassages before they reach the prescribed length if for some reason they are al-ready bound not to survive filtering. Second, both Lewin (1987) and Meredithet al. (2002) propose (differing) methods for ordering notes. These could be usedinstead of or as well as ontime percentages, to investigate the effect on the outputof the system described. Third, if a region of original music is spanned entirelyby a pattern (so that there are no non-pattern notes in this region) and this isalso true of its recurrence(s), then this ought to be stored in the template (see
9

the definition of compactness in Meredith 2006). Again this would save com-putational time that is currently wasted in our system. Finally, sometimes theoccurrence of a certain type of pattern implies the occurrence of another typeof pattern. For example, bars 11-12 of Fig. 4 (approximately pattern P ) recurat bars 13-14, implying that the rhythms of bar 12 (approximately pattern S)will recur in bar 14. This may seem obvious for only two discovered patterns, Pand S, but when more patterns are discovered, the way in which these might bearranged into a hierarchy is worthy of further investigation.
6 Acknowledgements
This paper benefited from a helpful discussion with David Meredith. We wouldalso like to thank the three anonymous reviewers for their comments.
References
Cambouropoulos, E.: Musical parallelism and melodic segmentation: a computationalapproach. Music Perception 23(3), 249-267 (2006)
Cochrane, L.: “pastiche.” A. Latham (ed.). The Oxford Companion to Music. OxfordMusic Online, http://www.oxfordmusiconline.com (accessed 20 September, 2009)
Conklin, D., and Bergeron, M.: Feature set patterns in music. Computer Music Journal32(1), 60-70 (2008)
Cope, D.: Computational models of musical creativity. Cambridge, Massachusetts: MITPress (2005)
Hiller, L., and Isaacson L.: Experimental music. New York: McGraw-Hill (1959)Lewin, D.: Generalized interval systems and transformations. New Haven, Connecticut:
Yale University Press (1987)Loy, G.: Musimathics: the mathematical foundations of music, vol. 1. Cambridge, Mas-
sachusetts: MIT Press (2005)Meredith, D.: Point-set algorithms for pattern discovery and pattern matching in music.
T. Crawford and R.C. Veltkamp (eds.). Proceedings of the Dagstuhl Seminar onContent-Based Retrieval. Dagstuhl, Germany (2006)
Meredith, D., Lemstrom, K., and Wiggins, G.A.: Algorithms for discovering repeatedpatterns in multidimensional representations of polyphonic music. Journal of NewMusic Research 31(4), 321-345 (2002)
Neave, H.R., and Worthington, P.L.: Distribution-free tests. London: Unwin Hyman(1988)
Norris, J.R.: Markov chains. Cambridge: Cambridge University Press (1997)Pearce, M.T, Meredith, D., and Wiggins, G.A.: Motivations and methodologies for
automation of the compositional process. Musicae Scientiae 6(2), 119-147 (2002)Pearce, M.T., and Wiggins, G.A.: Towards a framework for the evaluation of machine
compositions. Proceedings of the AISB Symposium on Artificial Intelligence andCreativity in Arts and Sciences (2001)
Wiggins, G.A.: Computer models of musical creativity: a review of computer modelsof musical creativity by David Cope. Literary and Linguistic Computing 23(1),109-115 (2008)
10

Development of Techniques for the
Computational Modelling of Harmony
Raymond Whorley, Geraint Wiggins, Christophe Rhodes, and Marcus Pearce∗
Centre for Cognition, Computation and CultureGoldsmiths, University of London
New Cross, London SE14 6NW, UK.∗Wellcome Laboratory of Neurobiology
University College LondonLondon WC1E 6BT, UK.
{r.whorley,g.wiggins,c.rhodes}@[email protected]
Abstract. This research is concerned with the development of repre-sentational and modelling techniques employed in the construction ofstatistical models of four-part harmony. Multiple viewpoint systems havebeen chosen to represent both surface and underlying musical structure,and it is this framework, along with Prediction by Partial Match (PPM),which will be developed during this work. Two versions of the frameworkare described, starting with the strictest possible application of multipleviewpoints and PPM, and then extending and generalising a little. Someimplementation details are reported, as are some preliminary results.
1 Introduction
The problem we are attempting to solve by computational means is this: given asoprano part, add alto, tenor and bass such that the whole is pleasing to the ear.This is not as easy as it might initially appear, as there are many rules of harmonyto be followed, which have arisen out of composers’ common practice. Ratherthan providing the computer with rules [1], however, we wish to investigate theprocess of learning such rules. The idea is to write a program which allows thecomputer to learn for itself how to harmonise in a particular style, by creatinga model of harmony from a corpus of existing music in that style. In our view,however, present techniques are not sufficiently well developed for models togenerate stylistically convincing harmonisations (or even consistently competentharmony) from both a subjective and an analytical point of view; although Allanand Williams [2] have demonstrated the potential of this sort of approach.
A means of representing music which, when combined with machine learn-ing and modelling techniques, shows particular promise, is multiple viewpointsystems [3]. This framework allows us to model different aspects of the music,and then combine the individual predictions of these models to give an overallprediction. Our research aims to make a theoretical contribution to the fieldof computational creativity in the domain of music by extending the multipleviewpoint framework in order to cope with the complexities of harmony, such
11

that improved computational models of four-part harmonisation can be created.This is not merely an application to harmony of the framework as it stands. Thispaper is concerned with two versions of the framework, beginning with a verystrict application, and then extending and generalising a little.
2 Brief Description of Multiple Viewpoint Systems
and Their Evaluation
See Table 1 for a list of basic and derived viewpoints (not exhaustive) and theirmeanings. Basic types are the fundamental attributes that are predicted, such ascpitch and dur. Derived types such as cpint and dur-ratio are derived from,and can therefore predict, basic types (in this case cpitch and dur respectively).Threaded types are defined only at certain positions in a sequence, determinedby Boolean test viewpoints such as tactus; for example, (cpitch ⊖ tactus)has a defined cpitch value only on tactus beats (i.e., the main beats in a bar).A linked type, or product type, is the conjunction of two or more viewpoints; forexample, dur-ratio ⊗ cpint is able to predict both dur and cpitch. See also[3] for more details.
Table 1. Basic and derived viewpoint types (not exhaustive).
Viewpoint Meaning Viewpoint Meaning
dur duration of event barlength number of time units in a barcont event continuation, or not phrase event at start or end of phrasecpitch chromatic pitch piece event at start or end of piece
ioi difference in start-time contour descending, level, ascendingposinbar position of event in the bar cpintfref pitch interval from tonicmetre metrical importance of event inscale event in major scale, or notcpint sequential pitch interval dur-ratio sequential duration ratio
fib on first beat of bar, or not liph last event in phrase, or nottactus event on tactus pulse, or not fip first event in piece, or notfiph first event in phrase, or not
N-gram Models are Markov models employing sub-sequences of n symbols.The probability of the n
th symbol, the prediction, depends only upon the previousn − 1 symbols, the context. The number of symbols in the context is the orderof the model. See [5] for more details.
What we call a viewpoint model is a weighted combination of various ordersof n-gram model of a particular viewpoint type. The n-gram models can be com-bined by, for example, Prediction by Partial Match (PPM) [6]. PPM makes useof a sequence of models, which we call a back-off sequence, for context matchingand the construction of complete prediction probability distributions. The back-off sequence begins with the highest order model, proceeds to the second-highestorder, and so on. An escape method determines prediction probabilities at eachstage in the sequence.
12

A multiple viewpoint system comprises more than one viewpoint. The predic-tion probability distributions of the individual viewpoint models are combinedby employing a weighted arithmetic or geometric [10] combination technique.See [7] for more information.
Conklin [7] introduced the idea of using a combination of a long-term model(LTM), which is a general model of a style derived from a corpus, and a short-term model (STM), which is constructed as a piece of music is being predicted orgenerated. The latter aims to capture musical structure particular to that piece.
An information-theoretic measure, cross-entropy, is used to guide the con-struction of models, evaluate them, and compare generated harmonisations. Themodel assigning the lowest cross-entropy to a set of test data is likely to be themost accurate model of the data. See [5] for more details.
3 Development of the Multiple Viewpoint
and PPM Frameworks
Version 1: Strict Application of Multiple Viewpoints and PPM The startingpoint for the definition of the strictest possible application of viewpoints is theformation of vertical viewpoint elements [8]. An example of such an element is{69, 64, 61, 57}, where all of the values are from the domain of the same view-point, and all of the parts (soprano, alto, tenor and bass) are represented. Thismethod reduces the entire set of parallel sequences to a single sequence, thusallowing an unchanged application of the multiple viewpoint framework, includ-ing its use of PPM. Only those elements containing the given soprano note areallowed in the prediction probability distribution, however. This is the base-levelmodel, to be developed with the aim of substantially improving performance.
Version 2: Dividing the Harmonisation Task into Sub-tasks In this version, itis hypothesised that predicting all unknown symbols in a vertical viewpointelement (as in version 1) at the same time is neither necessary nor desirable.It is anticipated that by dividing the overall harmonisation task into a numberof sub-tasks [2] [9], each modelled by its own multiple viewpoint system, anincrease in performance can be achieved. For example, given a soprano line, thefirst sub-task might be to generate the entire bass line. This version allows usto experiment with different arrangements of sub-tasks. For example, havinggenerated the bass line, is it better to generate the alto and tenor lines together,or one before the other? As in version 1, vertical viewpoint elements are restrictedto using the same viewpoint for each part. The difference is that not all of theparts are now necessarily represented in a vertical viewpoint element.
4 Implementation
At present, the corpus comprises fifty major key hymn tunes, and the test datafive, harmonised as in [4].
The Lisp implementation of version 1 is capable of predicting or generatingthe attributes dur (note duration), cont (note continuation, which is the partof an already sounding note which continues to be heard when a new note is
13

sounded) and cpitch (chromatic pitch) for the alto, tenor and bass parts, giventhe soprano. More than forty viewpoints have been implemented, and any linkbetween two viewpoints which is capable of predicting dur, cont or cpitch
is allowed. A modification of the feature selection algorithm described in [10],which involves ten-fold cross-validation of the corpus, is used to optimise multipleviewpoint systems for the long-term model alone, the short-term model alone, orfor both together (in which case the same system is used for both). The maximumorder of the n-gram models can be varied, as can the method of combiningprediction probability distributions, which are initially created using PPM withescape method C. Parameters (biases) affecting the weighting of distributionsduring combination can also be varied.
Version 2 extends version 1, and is implemented as described in Section 3.
5 Preliminary Results
Table 2 shows the lowest cross-entropy version 1 multiple viewpoint systemsfound so far for prediction of dur, cont and cpitch. These are for a combinationof long-term and short-term models (LTM and STM, with a cross-entropy of4.46 bits per event), LTM only (with a cross-entropy of 4.54 bits per event), andSTM only (with a cross-entropy of 6.20 bits per event), using weighted geometriccombination. This confirms the findings of previous research, for example thatof Pearce [10], that using both LTM and STM results in a lower cross-entropythan the use of either of them alone. What is particularly interesting, however,is the fact that the STM system does not share a single viewpoint with theLTM + STM system, and has only one viewpoint in common with the LTMsystem; this is in stark contrast with the substantial overlap between the LTM+ STM system and the LTM system. This prompted us to try using two differentmultiple viewpoint systems together, one optimised for the LTM and the otherseparately optimised for the STM; but with a cross-entropy of 4.51 bits perevent, this turned out to be not as good a model as LS in Table 2.
For prediction of cpitch only, the best version 1 LTM system found so farresults in a cross-entropy of 3.29 bits per event. By comparison, the best version2 LTM system found so far predicts the bass first (1.70 bits per prediction),followed by the alto and tenor together (1.55 bits per prediction), giving a totalcross-entropy of 3.25 bits per event. For prediction of cpitch only, then, version2 appears to be very slightly better than version 1. It is worth noting that thebest version 2 system reflects the usual human approach to harmonisation: bassfirst, followed by alto and tenor together.
6 Conclusions and Future Work
We have described two versions of the multiple viewpoint framework and PPM,motivated by our aim to take account of the complexities of four-part harmony.The preliminary results weakly indicate that version 2 is better than version 1 forthe prediction of cpitch only. They also suggest the perhaps counter-intuitiveconclusion that optimising the LTM and STM together leads to a better modelthan optimising them separately. This latter result opens interesting routes for
14

Table 2. Best version 1 multiple viewpoint systems (predicting dur, cont and cpitch)for LTM + STM (LS), LTM only (L) and STM only (S).
Viewpoint LS L S Viewpoint LS L S
cont ⊗ cpint × × (cpintfref ⊖ fiph) ⊗ piece ×cont ⊗ (cpintfref ⊖ tactus) × × cpitch × ×dur ⊗ (cpintfref ⊖ liph) × × dur-ratio ⊗ (ioi ⊖ fib) ×cont ⊗ metre × × dur-ratio ⊗ phrase ×dur ⊗ posinbar × × dur ⊗ cont ×cpintfref × × cont ⊗ (cpitch ⊖ tactus) ×dur ⊗ liph × × inscale ×(cpintfref ⊖ liph) × × contour ×(cpintfref ⊖ fiph) ⊗ fip × × cpitch ⊗ tactus ×cpint ⊗ cpintfref × cpitch ⊗ (cpintfref ⊖ liph) ×(cpintfref ⊖ fib) × inscale ⊗ barlength ×cont ⊗ (cpintfref ⊖ liph) × cpitch ⊗ (cpintfref ⊖ fiph) ×
further work. Finally, using the LTM alone is less good still; and the STM aloneis, as expected, by far the least good model.
In the immediate future, we intend to implement other versions which pushthe development of the multiple viewpoint/PPM framework further.
References
1. Ebcioglu, K.: An Expert System for Harmonizing Four-Part Chorales. ComputerMusic Journal, 12(3), 43–51 (1988)
2. Allan, M., Williams, C.K.I.: Harmonising Chorales by Probabilistic Inference. In:L.K. Saul, Y. Weiss, L. Bottou, editors, Advances in Neural Information ProcessingSystems, vol. 17. MIT Press (2005)
3. Conklin, D., Witten, I.H.: Multiple Viewpoint Systems for Music Prediction. Journalof New Music Research, 24(1), 51–73 (1995)
4. Vaughan Williams, R., editor. The English Hymnal. Oxford University Press (1933)5. Manning, C.D., Schutze, H.: Foundations of Statistical Natural Language Process-
ing. MIT Press (1999)6. Cleary, J.G., Witten, I.H.: Data Compression Using Adaptive Coding and Partial
String Matching. IEEE Trans Communications, COM-32(4), 396–402 (1984)7. Conklin, D.: Prediction and Entropy of Music. Master’s Thesis, Department of Com-
puter Science, University of Calgary, Canada (1990).8. Conklin, D.: Representation and Discovery of Vertical Patterns in Music. In: C.
Anagnostopoulou, M. Ferrand, A. Smaill, editors, Music and Artificial Intelligence:Proc. ICMAI 2002, LNAI, vol. 2445, pp. 32–42. Springer-Verlag (2002)
9. Hild, H., Feulner, J., Menzel, W.: Harmonet: A Neural Net for Harmonizing Choralesin the Style of J.S. Bach. In: R.P. Lippmann, J.E. Moody, D.S. Touretzky, editors,Advances in Neural Information Processing Systems, vol. 4, pp. 267–274. MorganKaufmann (1992)
10. Pearce, M.T.: The Construction and Evaluation of Statistical Models of MelodicStructure in Music Perception and Composition. Ph.D. Thesis, Department of Com-puting, City University, London (2005)
15

Realtime Generation of Harmonic Progressions Using Constrained Markov Selection
Arne Eigenfeldt1 and Philippe Pasquier2
1School for the Contemporary Arts, 2School of Interactive Arts and Technology,
Simon Fraser University, Canada {eigenfel, pasquier}@sfu.ca
Abstract. We present a method for generating harmonic progressions using case-based analysis of existing material that employs a Markov model. Using a unique method for specifying desired harmonic complexity, tension between chord transitions, and a desired bass-line, the user specifies a 3 dimensional vector, which the realtime generative algorithm attempts to match during chord sequence generation. The proposed system thus offers a balance between user-requested material and coherence within the database.
1 Introduction
Generative systems have had a long history within computer music [1] and interactive realtime performance [2]. One standard model for such systems has been that of improvisation [3, 4], in which the software interacts with either a composer or performer. Such models have tended to restrict harmonic movement, by employing a static, modal harmony [5] or ignoring harmony altogether in favour of a free-jazz approach [6]. These restrictions are necessitated because harmony cannot, by its very nature, be improvised collectively: it requires a clear goal (although this goal can be achieved through a variety of progressions).
Several computer music systems have been developed that do allow the generation of harmony, although few are in use within realtime computer music, with the notable exception of Rowe [7]. Such systems have tended to be stylistically motivated, in that they attempt to reproduce specific progressions from within a defined stylistic period: for example, Baroque chorales [8].
As Pachet and Roy point out [9], harmonic language is style specific; as such, any system that relies upon specific rules will restrict itself stylistically, and thus limit its potential expressiveness. Furthermore, the same authors note that a harmonic language’s rules tend to outline specific combinations and linear progressions that should be avoided, rather than followed.
Markov models offer a straight-forward method of deriving correct harmonic sequences based upon a specific corpus, since they are essentially quoting portions of the corpus itself. Furthermore, since the models are unaware of any rules themselves, they can be quickly adapted to essentially “change styles” by switching source data.
16

However, as Ames points out [10], while simple Markov models can reproduce the surface features of a corpus, they are poor at handling higher-level musical structures.
This research offers a method for the composer to specify high-level control structures, influencing the generative algorithm that chooses from the generated Markov transition tables. Using a unique method of specifying desired harmonic complexity, tension between chord transitions, and a bass line, the user can specify a three dimensional vector which the realtime generation algorithm attempts to match during sequence generation. As such, the proposed system offers a balance between user-requested material and coherence with the database.
2 Related Work
Harmonic analysis is a well-researched field, particularly in relation to recent advances in Music Information Retrieval (MIR). Harmonic generation, specifically realtime generation for compositional and/or improvisational systems, is less researched, or at least less documented. Composers of interactive music have written only marginally about their harmonic generation algorithms; those systems that are well documented [22, 23] tend to be non-creative systems that attempt to apply correct (stylistic) harmonic practices to a given melody. This may be a good exercise for music students or musicologists attempting to formulate stylistic rules, but one less useful for creative composers.
2.1 Harmonic Analysis
Theoretical models of tonality have existed for decades, if not centuries; one of the most influential in recent years being Lerdahl’s Tonal Pitch Space [11]. Anglade and Dixon used Inductive Logic Programming to extract harmonic rules from a large database of existing songs [12]. Ogihara and Li used n-grams of chord sequences to construct profiles of jazz composers [13]. There has been significant research in chord recognition and automatic labeling (for reviews, see [14] and [15]). Similarity of chord sequences has been researched by Liu et. al using string matching [16], while both Pachet [17] and Steedman [18] used rewriting rules. Mauch [19] analysed the frequencies of chord classes within jazz standards. de Haas et. al [20] used a method called Tonal Pitch Step Distance, which is based upon Lerdahl’s Tonal Pitch Space, to measure chord sequence similarities
2.2 Harmonic Generation
Methods of harmony generation have included n-gram statistical learning for learning musical grammars [21], as well as several using genetic algorithms [8, 22]. Chuan and Chew [23] created automatic style-specific accompaniment for given melodies, using musical style as the determining factor in type of harmonization. Whorley et al. [24] used Markov models for the generation of 4-part harmonization of “hidden” melodies.
17

Similarly, Chan and Ventura [25] harmonize a given melody by allowing user input for parameters that governed the overall mood of the composition.
Several systems have used probabilistic models for chord generation, including Paiement et al. [26], whose system was used as an analysis engine for jazz harmony to determine stochastic properties of such harmony. This system is extended in Paiement [27], which uses a machine learning perspective that attempts to predict and generate music within arbitrary contexts given a training corpus, with specific emphasis on long-term dependencies. Allan and Williams [28] used a data set of chorale harmonisations composed by Bach to train a HMM, then used a probabilistic framework to create a harmonization system which learned from examples.
2.3 Differences from Previous Research
Our work differs from previous research in that it is not based in music information retrieval nor cognitive science, but in creative practice. Our particular approach has been informed by a number of heuristic choices stemming from the first author’s expertise in composition.
As it is a creative system, our interest is not in modeling a specific musical style; thus, a rule-based system is not useful. Machine learning strategies offer great potential; however, their usefulness has thus far been limited to rather pedestrian activities of melody harmonization. Furthermore, they do not, at this time, offer the flexibility and speed required by realtime computer music. In fact, the realtime nature of our system is one of its distinguishing qualities, in that it can quickly change direction in performance based upon user control. Lastly, we offer a useful measure for harmonic complexity and voice-leading tension that can be used to define harmonic progressions outside of functional harmony. This research does not attempt to construct correct harmonic sequences within the context of functional harmony; it is a creative system based within the ‘post-tonal’ harmony found in certain 20th century musical styles.
3 Description
This system uses a case-based system [29] to generate Markov conditional probability distributions, using either first, second, or third-order chains. However, rather than allowing the generative algorithm to freely chose from the derived transitions, user specified vectors, suggesting bass-line movement, harmonic complexity, and voice-leading tension, are overlaid in order to stochastically choose from the best matching solutions. The system is written in MaxMSP.
3.1 Source Data
For the purposes of this research, the database consisted of chords derived from jazz standards by Miles Davis (4 tunes), Antonio Carlos Jobim (4 tunes), and Wayne Shorter (6 tunes), all taken from the Real Book [30]. 33 compositions by Pat Metheny
18

taken from the Pat Metheny Songbook [31], equally drawn from the tunes written in the 1970s, 80s, and 90s, were also used. Source data are standard MIDI files, consisting only of harmonic data at chord change locations (see Section 4).
3.2 Representation
The term set and chord is used interchangeably in this research. In strict terms, every chord is a set, but not every set is a chord. Chords usually refer to vertical collections of pitches that contain a root, 3rd, 5th, and possibly further extensions (i.e. sevenths, ninths) and their alterations (i.e. lowered ninths, raised elevenths, etc.); sets are any combination of unique pitch classes that need not contain specific relationships. Similarly, set-types are unique sets, or chords; for example, the set (0 4 7 11) is a major seventh chord.
Chords are represented as pitch classes [32], although not in normal or prime form. In pitch class theory, the minor triad (0 3 7) is the inversion of the major triad (0 4 7), and is thus considered identical in normal form (i.e. Forte 3-11); however, in tonal music, major and minor chords function very differently. For this reason, the decision was made not to use Forte’s set theory representations; instead, the major triad is represented as (0 4 7), whereas the minor triad as (0 3 7).
Extensions beyond the octave are folded within the octave; therefore, the dominant ninth chord is represented as (0 2 4 7 10). Transpositions of chords are not considered unique; instead, bass movement, in pitch classes, between chords is acknowledged. Thus, the chords progression Cmaj7 to Fmaj7 is considered a movement between identical chords, but with a bass movement of +5.
Chords with alternate bass notes (Cm/F) or inversions (Cm/G) are considered unique; thus, Cm/F is represented as (0 2 7 10), and Cm/G is represented as (0 5 8).
Chords are represented within chord vectors as indices into an array of recognized pitch class sets. Currently, this array contains 93 unique chords; for example, the minor seventh chord (0 3 7 10) is the first element in this array and is considered set type 1, while the major seventh (0 4 7 11) is the eleventh element, and is considered set-type 11. When combined with the bass note movement between chords, transitions can be defined as a two-element vector: for example, the pair (2 11) (-2 1) represent a major seventh build on D, followed by a minor seventh chord two semitones lower.
4. Analysis
The database requires an initial analysis, executed prior to performance, to be done on specially prepared MIDI files. These files contain only harmonic data at points of harmonic change, with user-defined markers (controller data) specifying phrase beginning and ending points. Individual files are written for each tune in the database, consisting of the sequential chords (see Section 4.1) and the relative duration of chord types (see Section 4.2). The generation of the Markov transition tables occurs at performance time, as these are dependent upon a user-selected corpus from the larger database (see Section 4.3).
19

4.1 Harmonic Data
Within the MIDI file, chords are written in root position, with a separate staff containing the bass line (see Fig. 1). This is done for human analysis of the original notation file, since the chord analysis algorithm can identify chord other than root position. No analysis is done on voice-leading, since voice-leading is a performance, rather than a compositional, decision within improvised music; as such, a voice-leading algorithm was created for performance, that controls registral spacing and individual pitch transitions.
Figure 1. Example notation for analysis
The four chords found in Fig. 1, are represented in Table 1.
Table 1. Different representations of the four chords from Fig. 1. Only the third column is stored in the individual data files.
Chord name MIDI notes Stored values Set Type AbMaj7 b5 / G 55 56 60 62 67 7 8 12 14 19 31 Gbmaj7#5 / F 53 54 58 62 65 5 6 10 14 17 75
Em9b5 52 54 55 58 62 4 6 7 10 14 76 A7b9 57 58 61 64 67 9 10 13 16 19 25
4.2 Duration Data
A mean duration for each chord is calculated in order to give harmonic duration context for generation. Thus, a separate file is created for each composition in the database that contains the mean harmonic rhythm of the composition, and each individual chord’s relative ratio to this mean. For example, if the harmonic rhythm of the composition consisted entirely of half notes, the average duration would be 2.0, or two beats. Each chord type in the composition would then receive a ratio of 1.0.
The use of ratios to an overall harmonic rhythm is used, instead of discrete timings, since it was felt that a chord’s relative duration within a composition is more important than its duration in comparison to other compositions. For example, chords that function as (dissonant) passing chords tend to have shorter durations than stable chords anchoring a tonality, and will thus produce smaller ratios.
20

4.3 Probability Table Generation
The user can select individual compositions from the database as the specific corpus for chord generation. From this corpus, the initial-chord array is generated – consisting of the first chord of each phrase – and the final-chordpair array: the last two chords in each phrase. First, second, and third-order transition probabilities are then calculated for every chord transition, and compiled separately. The tables store root movement and set type as a pair; thus, using only the four chords from Fig. 1, the first-order table is shown in Table 2.
Table 2. First-order transition table for chords from Fig. 1.
Initial Set Bass Movement + Set Occurrences (0 31) ( -2 75) 1 (0 75) (-1 76) 1 (0 76) (5 25) 1 (0 25) - 1
The third-order transition table for the four chords from Figure 1 contains only one
entry (root movements are relative to the first chord), illustrated in Table 3.
Table 3. Third-order transition table for chords from Fig. 1.
Index Bass Movement + Set Occurrences (0 31) (-2 75) (-3 76) (2 25) 1
After analysing four Miles Davis compositions, the 3 transition tables are
illustrated statistically in Table 4.
Table 4. Transition tables for four Miles Davis compositions.
First-order Second-order Third-order # of chains 14 52 64
# of transitions 170 179 184 # of unique transitions 54 79 89
Since there are only 14 unique set types in these four compositions, there are only
14 first-order chains; however, these chords appear in 64 different 4-chord combinations, thus there are 64 third-order chains. Variety in the generated progressions depends strongly upon the size of the database.
The nature of the user-selected corpus will also influence the generation. Obviously, variety in generation depends on the number of potential transitions. If a corpus is heavily redundant, there will be limited variety in output. On the other hand, selecting a corpus from two composers of very different styles will result in a small intersection of transitions, especially within the higher-order transitions. In such a case, the generated progressions will tend to consist of material from one composer or another, with any transitions between the two occurring only when a chain from the intersection of the databases is stochastically selected.
21

5. Chord Progression Generation
Once the transition tables have been generated for the specific corpus, harmonic progressions can be generated using a mixture of stochastic choice and user request. An initial chord is selected from the initial-chord array; given this initial context, the complete harmonic progression is then generated by selecting from the available continuations.
5.1 User Defined Phrase Vectors
Selections are influenced by user-defined vectors for bass line, complexity, and tension, over a user-provided phrase length (see Fig. 2).
Figure 2. User defined bass line vector.
Given a first chord, the available symbols in the transition table are compared to the user-defined vector. Available symbols are scored based upon the distance between their values and the user-defined vector.
Distance vectors are created for bass-line, complexity and tension (see Section 5.2). The three vectors are each scaled by a user-defined function for each feature (i.e. bass line 0.7, complexity 0.4, tension 0.1): this allows the user to balance the request versus generating coherence with the corpus. The scaled vectors are then summed, and a roulette-wheel selection is made from the highest 5% of these scores. This selection method ensures that, given the same request, a variety of harmonic progressions can result – a desirable attribute in generative systems.
5.2 Harmonic Complexity and Transition Tension
Every set-type has a pre-calculated harmonic complexity, which is a distance function between the pitches of the set and those of a major triad and octave (0 4 7 12). A vector is created of the smallest distance of each note of the set to each note of the triad. Within this vector, each instance of pitchclass 1 (a semitone) is multiplied by 0.3, and each instance of pitchclass 2 (a whole tone) is multiplied by 0.1. Since all possible pitches within the octave are within 2 pitchclasses of one of the notes of the major triad and octave, sets that contain more notes will be considered more dissonant (since they contain more pitchclass differences of 1 and 2 between their pitches and the triad), than smaller sets.
22

These scores are summed to create the set’s harmonic complexity. See Tables 5 and 6 for example ratings of the most consonant and most dissonant set types.
Table 5. Harmonic complexity ratings for the most consonant sets within the database.
Consonant sets Chord name Harmonic Complexity 0 7 no 3 0.0
0 4 7 major triad 0.0 0 7 10 7 no 3 0.1 0 2 7 sus2 0.1
0 4 7 9 add6 0.1
Table 6. Harmonic complexity ratings for the most dissonant sets within the database.
Dissonant Sets Chord name Harmonic Complexity 0 3 5 6 8 9 13b9 / third 1.3 0 1 3 5 8 maj9 / seventh 1.2
0 3 6 8 11 7#9 / third 1.2 0 1 3 5 7 8 maj9#11 / seventh 1.2 0 1 3 6 10 m7 / sixth 1.0
The tension rating, tr, compares the intervals between adjacent sets, dividing c, the
number of common tones between the two sets by l, the length of the second set:
€
tr(s 1,s2) =1−c(s1,s2)
1(s2) .
5.3 Generated Harmonic Progressions
Each phrase has a user-specified suggested length in number of chords. During sequence generation, once the generated length reaches 75% of this value, the algorithm begins testing if the last two chords generated are in the final-chordpair array. If the test returns true, the phrase generation algorithm exits.
The use of user-defined vectors influences the selection from the Markov transition tables, but there is no guarantee that the actual generated progression will match the user vector, due to the available values within the tables and the roulette-wheel selection from those values. For example, Fig. 3 displays a user-defined bass line, and the resulting third-order generated bass line, using a four-song database containing 108 chains and a requested phrase length of five chords. A larger database will result in a closer approximation, due to the potentially greater available choices. Lastly, the request may not, and need not, be in the style of the corpus; the result will be a stochastically chosen correction of the request given the actual corpus.
23

Figure 3. A user defined vector, left, and generated bass line, right, given a 4-song database.
Harmonic rhythm (chord duration) during performance is a ratio to the performance tempo, since every chord in the database acquires a mean ratio to that chord’s duration within each composition in which it appears. Thus, relative duration will be consistent, allowing realtime harmonic rhythm to be adjustable, yet independent of the pulse.
6. Conclusions
We have presented a realtime chord sequence generation system that employs a unique user influence over variable-order Markov transition tables. The algorithm described here can be used as a compositional assistant, or embedded within a realtime generative system [33]. In such cases, a large part of the musical success of the system resides in the voice-leading algorithm, which is not described here. This algorithm finds the closest distance between adjacent chord tones, taking into account different chord sizes and octave displacements.
7. Acknowledgements
This research was funded by a grant from the Canada Council for the Arts and the Natural Sciences and Engineering Research Council of Canada.
8. References
[1] J. Chadabe. Electric Sound: The Past and Promise of Electronic Music. Upper Saddle River, New Jersey: Prentice Hall, 1997.
[2] J. Chadabe. Interactive composing: an overview. Computer Music Journal 8(1), 1984. [3] T. Winkler. Strategies for Interaction: Computer Music, Performance, and Multimedia.
Connecticut College Symposium on Arts and Technology, 1995. [4] G. Garnett. The Aesthetics of Interactive Computer Music. Computer Music Journal 25(1),
2001. [5] J. Chadabe. Solo: A Specific Example of Realtime Performance. Computer Music - Report
on an International Project. Canadian Commission for UNESCO, 1980. [6] G. Lewis. Too Many Notes: Computers, Complexity and Culture in Voyager. Leonardo
Music Journal, 10, 2000. [7] R. Rowe. Machine Musicianship. Cambridge, MIT Press, 2001.
24

[8] R.A. McIntyre. Bach in a Box: The Evolution of Four-Part Baroque Harmony Using the Genetic Algorithm. IEEE Conference on Evolutionary Computation, 1994.
[9] F. Pachet, P. Roy. Musical harmonization with constraints: A Survey. Constraints, 6(1), 2001.
[10] C. Ames. The Markov Process as a Compositional Model: A Survey and Tutorial. Leonardo 22(2), 1989.
[11] F. Lerdahl. Tonal Pitch Space. Oxford University Press, 2001. [12] A. Anglade, S. Dixon. Characterisation of Harmony with Inductive Logic Programming.
International Society of Music Information Retrival (ISMIR), 2008. [13] M. Ogihara, T. Li. N-Gram Chord Profiles for Composer Style Representation. ISMIR,
2008. [14] D. Temperley. The Cognition of Basic Musical Structures. Cambridge, MA, MIT Press,
2001. [15] B. Pardo, W.P. Birmingham. Algorithms for Chordal Analysis. Computer Music Journal,
26(2), 2002. [16] C.C. Liu, J. L. Hsu, and A.L.P. Chen. An Approximate String Matching Algorithm for
Content-Based Music Data Retrieval. International Computer Music Conference, 1999. [17] F. Pachet. Computer Analysis of Jazz Chord Sequences. Is Solar a Blues? Readings in
Music and Artificial Intelligence, 1997. [18] M.J. Steedman. A Generative Grammar for Jazz Chord Sequences. Music Perception,
2(1), 1984. [19] M. Mauch, S. Dixon, C. Harte, M. Casey, and B. Fields. Discovering Chord Idioms
Through Beatles And Real Book Songs. ISMIR, 2007. [20] B. de Haas, R. C. Veltkamp, F. Wiering. Tonal Pitch Step Distance: A Similarity Measure
for Chord Progressions. ISMIR, 2008. [21] D. Ponsford, G. Wiggins, C. Mellish. Statistical learning of harmonic movement. Journal
of New Music Research 28(2), 1998. [22] S. Phon-Amnuaisuk, G. Wiggins. The four-part harmonization problem: A comparison
between genetic algorithms and a rule-based system. Proceedings of Society for the Study of Artificial Intelligence and Simulation of Behaviour Convention, Edinburgh, Scotland, 1999.
[23] C. Chuan, E. Chew. A hybrid system for automatic generation of style-specific accompaniment. International Joint Workshop on Computational Creativity (IJWCC), 2007.
[24] R. Whorley, G. Wiggins, M. Pearce. Systematic Evaluation and Improvement of Statistical Models of Harmony, IJWCC, 2007.
[25] H. Chan, D. Ventura. Automatic Composition of Themed Mood Pieces, IJWCC, 2008 [26] J.Paiement, D. Eck, S. Bengio. A probabilistic model for chord progressions. ISMIR, 2005. [27] J.Paiement. Probabilistic Models for Music, Phd Thesis, Université de Montréal, 2008. [28] M. Allan, C. Williams. Harmonising Chorales by Probabilistic Inference. Advances in
neural information processing systems, 17, 2004. [29] L. Spector, A. Alpern. Criticism, Culture, and the Automatic Generation of Artworks.
National Conference on Artificial Intelligence, 1994. [30] The Real Book volume 1, Berklee College of Music, 1971. [31] P. Metheny, Pat Metheny Songbook, Hal Leonard Corporation, New York, 2000. [32] A. Forte. The Structure of Atonal Music, Yale University Press, New Heaven, 1973. [33] A. Eigenfeldt, P. Pasquier. A Realtime Generative Music System using Autonomous
Melody, Harmony, and Rhythm Agents. 12th Generative Art Conference GA2009, 2009.
25

Establishing Appreciation in a Creative System
David Norton, Derral Heath, Dan Ventura
Computer Science DepartmentBrigham Young University
[email protected], [email protected], [email protected]
Abstract. Colton discusses three conditions for attributing creativity to a system:appreciation, imagination, and skill. We describe an original computer system(called DARCI) that is designed to eventually produce images through creativemeans. We show that DARCI has already started gaining appreciation, and haseven demonstrated imagination, while skill will come later in her development.
1 Introduction
While several theoretical frameworks for creativity have been proposed, actually build-ing a system that applies these frameworks is difficult. We are developing an originalsystem designed to implement and integrate concepts proposed by researchers such asBoden, Wiggens, Ritchie, and Colton. Our system, DARCI (Digital ARtist Communi-cating Intention), will produce images that are not only perceived by humans as creativeproducts, but that are also produced through arguably creative processes. This paperrepresents our work with only the first component of DARCI, that of learning about thedomain of visual art. We will discuss why this is an important step in the creative pro-cess in terms of Colton’s creative tripod concept [3], describe how DARCI is learningabout this domain, and finally demonstrate DARCI’s current level of development.
Colton discusses three attributes that must be perceived in a system to consider itcreative: appreciation, imagination, and skill. In order for DARCI to be appreciative ofart, she needs to first acquire some basic understanding of art [3]. For example, in orderfor DARCI to appreciate an image that is gloomy, she has to first recognize that it isgloomy. To facilitate this, we are teaching DARCI to associate low-level image featureswith artistic descriptions of the image. Currently, DARCI has learned how to associate150 different descriptors to images. Furthermore, she can essentially interpret an imageby selecting a specific combination of these descriptors for the image in question, thusdemonstrating a degree of imagination. This will also facilitate communication withDARCI’s audience, enhancing the perception of appreciation and imagination. DARCIcannot yet produce any images and so does not yet demonstrate skill in the sense thatColton prescribes. However, at the end of this paper we will show how DARCI’s under-standing of the art domain will be instrumental to her production of original images.
2 Image Feature Extraction
Before DARCI can form associations between image features and descriptive words,the appropriate image features for the task must be selected. These need to be low-levelfeatures that characterize the various ways that an image can be appreciated.
26

There has been a large amount of research done in the area of image feature extrac-tion. King and Gevers deal with Content Based Image Retrieval (CBIR) [2][6]. CBIRrelies heavily on extracting image features which can then be compared and used whensearching for images with specific content. CBIR systems look at characteristics such asan image’s color, light, texture, and shape. Datta and Li propose several image featuresthat look at these same characteristics to assess the aesthetic quality of images [4][7].
Wang deals with image retrieval specific to emotional semantics [10][9]. The goalis to search for images that have specific emotional qualities such as happy, gloomy,showy, etc. Zujovic tries to classify a painting into one of six different genres: Ab-stract, Expressionism, Cubism, Impressionism, Pop Art and Realism [11]. All of theseresearchers have proposed image features that focus on color, light, texture, and shape.Of these image features, we have selected 102 of the more common ones to use inDARCI. As with prior research, our set of image features is broken down into charac-teristics relating to color, light, texture and shape.
Color and light play a significant role in the emotion and meaning conveyed inimages. Colors have often been associated directly with emotions. For example, red canmean anger and frustration while blue can mean sad and depressed. Likewise with light,a dark image could mean gloomy or scary while a bright image could denote happinessor enthusiasm. Texture and shape features also play a significant role in the meaning andemotion of an image. For example, a cluttered and busy image could indicate feelingsof anxiety or confusion. An image that is blocky and structured could indicate feelingsof stability and security. We extract eight color features, four light features, 50 texturefeatures and 40 shape features as follows:
Color & Light:1. Average Red, Green, and Blue2. Average Hue, Saturation, and
Intensity3. Unique Hue count (20 buckets)4. Average Hue, Saturation, and
intensity contrast5. Dominate hue6. Percent of image that is the
dominate hueShape:
1. Geometric Moment2. Eccentricity3. Invariant Moment (5x vector)4. Legendre Moment5. Zernike Moment6. Psuedo-Zernike Moment7. Edge Direction Histogram (30 bins)
Texture:1. Co-occurrence Matrix (x4 shifts)
1. Maximum probability2. First order element
difference moment3. First order inverse element
difference moment4. Entropy5. Uniformity
2. Edge Frequency (25x vector)3. Primitive Length
1. Short primitive emphasis2. Long primitive emphasis3. Gray-level uniformity4. Primitive length uniformity5. Primitive percentage
It is not the purpose of this paper to go into detail about the image features weextracted. These features were selected based on the results of the research previouslymentioned.
27

3 Visuo-Linguistic Association
DARCI forms an appreciation of art by making associations between image featuresand descriptions of the images. An image can be described and appreciated in manyways: by the subject of the image, by the aesthetic qualities of the image, by the emo-tions that the image evokes, by associations that can be made with the image, by themeanings found within the image, and possibly others. To teach DARCI how to makeassociations with such descriptors, we present her with images labeled appropriately.Ideally we would like DARCI to understand images from all of these perspectives.However, because the space of all possible images and their possible descriptive labelsis enormous, we have taken measures to reduce the descriptive label space to one thatis tractable. Specifically, we have reduced descriptive labels exclusively to delineatedlists of adjectives.
3.1 WordNet
We use WordNet’s [5] database of adjectives to give us a large, yet finite, set of descrip-tive labels. Even though our potential labels are restricted, the complete set of WordNetadjectives can allow for images to be described by their emotional effects, most of theiraesthetic qualities, many of their possible associations and meanings, and even, to someextent, by their subject.
In WordNet, each word belongs to a synset of one or more words that share the samemeaning. If a word has multiple meanings, then it can be found in multiple synsets.For example, the word “dark” has eleven meanings, or senses, as an adjective. Eachof these senses belongs to a unique synset. The synset for the sense of “dark” thatmeans “stemming from evil characteristics or forces; wicked or dishonorable”, alsocontains senses of the words “black” and “sinister”. Our image classification labelsactually consist of a unique synset identifier, rather than the adjectives themselves.
3.2 Learning Method
In order to make the association between image features and descriptors, we use a seriesof artificial neural networks trained incrementally with backpropagation. A training in-stance is defined as the image features for a particular image paired with a single synsetlabel. We create a distinct neural network, with a single output node, for each synsetthat has a sufficient amount of training data. For the results presented in this paper,that threshold is eight training instances. Enforcing this threshold ensures a minimumamount of training data for each synset. As we incrementally accumulate data, moreand more neural networks are created to accommodate the new synsets that pass thethreshold. This process ensures that neural networks are not created for synsets that areeither too obscure or occur only accidentally. Shen, et al. employ a similar approach forhandling non-mutually exclusive labels to good effect using SVMs instead of ANNs [8].
4 Obtaining Data Instances
To collect training data, we have created a public website for training DARCI [1]. Fromthis website, users are presented with a random image and asked to provide adjectives
28

Fig. 1. Screenshot of the website used to train DARCI. Below the image are adjectivesthat the user has entered as well as a text box for entering new adjectives. To the right ofthe image are seven adjectives that DARCI has attributed to the image. Image courtesyof Mark Russell.
that describe the image (Figure 1). When users input a word with multiple senses, theyare presented with a list of the available senses, along with the WordNet gloss, and askedto select the most appropriate one. We keep track of the results in an SQL database fromwhich we can train the appropriate neural networks. As of this writing, we have obtainedclose to 6000 data points this way. While this is still only a small fraction of the amountof data we will need, it has proven satisfactory for some adjectives as we will show.
While there are 18,156 adjective synsets in WordNet, it is not necessary for DARCIto learn all of them. In the set of roughly 6,000 data instances we have obtained sofar, only 1,176 unique synsets have occurred. Of those unique synsets, almost half haveonly a single example. There will be many synsets that will never meet our threshold ofeight instances, thus making the association task more manageable.
The total number of synsets that have at least eight data points (our threshold forcreating a neural net) is currently 150. This means that DARCI essentially “knows” 150synsets at the writing of this paper. Keep in mind that many of those synsets containseveral senses, so the number of adjectives DARCI effectively “knows” is actually muchhigher. As DARCI is currently nascent, this number will continue to grow.
4.1 Amplifying Data
We have been faced with two fundamental problems with regards to training data. First,all of the training data that we have examined so far is exclusively positive trainingdata (i.e. the training data only indicates what an image is, not what it is not). It isvery difficult to train ANNs without negative examples as well. The second problem
29

is a paucity of training instances. ANNs require a lot of training data to converge andcurrently, of the 150 synsets known to DARCI, there are on average just over twentythree positive data instances per synset.
We have employed two methods for obtaining negative data. The first method uti-lizes the antonym attribute of adjectives in WordNet. Anytime an image is labeled withan adjective, we create a negative data point for all antonyms of that adjective. Second,on DARCI’s website, we allow users to directly create negative examples for adjectivesthat DARCI knows. For each image presented to the user, DARCI lists seven adjectivesthat she associates with the image (Figure 1). The user is then allowed to flag thoselabels that are not accurate. This creates strictly negative examples. This method alsoallows DARCI to demonstrate to the user her current interpretation of an image. Usingthese methods, we have built up more negative data points than positive ones.
In order to help compensate for shortages in training data, for each new data instancethat is presented to DARCI, a variable number of old data instances belonging to thesame synset, are reintroduced to the neural net in question. In addition to reintroducingold material, a variable number of prior data instances that do not belong to the samesynset, but that are statistically correlated, are introduced to the neural net in question.These guessed data instances provide DARCI with more data for each synset than sheis in fact receiving, and allow DARCI to take advantage of correlations in labels thatare lost by using unique neural nets for each synset. We perform these data expansionstrategies to both the positive and negative data instances and do so in a manner thatattempts to balance the amount of negative and positive data that DARCI receives foreach synset.
The combination of adding negative data instances, recycling old data instances,guessing correlations with other synsets, and using these guesses to balance positiveand negative training instances, greatly amplifies the amount of training data presentedto DARCI.
5 Interpreting Images
When presented with an image, DARCI takes the output of each synset’s neural netgiven the image features, and treats that output as a score. But DARCI currently knows150 synsets, so how does she choose which of the synsets to label the image with?The easiest solution would be to either take all synsets with a score above a specificthreshold, or take the top n synsets. However, despite our attempts to amplify the data,some synsets continue to be lacking in training instances. The neural networks for thesesynsets should not be given as much weight in determining the relevance of an adjectivefor a particular image. Thus, we use Equation 1 for modifying each neural network’soutput value to create a new score that takes DARCI’s confidence about a particularsynset into consideration. In this algorithm, confidence is not specifically the statisticalmeaning, rather it is an estimation for how certain DARCI is about a particular synset.
score = o ∗[(p+ n) ∗min
(1,n
p
)]( o−0.5γ )
(1)
30

Here o is the output of a neural network for a particular synset, p is the number ofpositive data instances present in the training database and n the number of negativedata instances, and γ is a constant that indicates how much effect the “confidence”measure should have—we found γ = 5 to be useful. This equation amplifies outputs ofsynsets with greater support (p+ n) and at least as many negative as positive examples(there would be more negative than positive examples in an accurate sample of the realworld). It is immediately clear that synsets having no negative examples will have ascore of zero, thus preventing overly positive data from tainting the labeling process.
DARCI then uses this modified score to make her selection of synset labels withthe added caveat that no two synsets are chosen that belong to the same satellite groupof synsets. Satellite groups are groupings of adjective synsets defined in WordNet toshare similar meanings. It is a grouping that is looser than the synset grouping itself,but still somewhat constrained. For example, all colors belong to the satellite group“chromatic”. This means that DARCI will never label an image with more than onecolor. We do this in order to enforce a varied selection of labels.
6 Results
Because labeling images with adjectives is subjective, it is difficult to evaluate DARCI’sprogress. And since DARCI is not yet producing any artefacts, we can’t directly assesshow the associations she is currently learning will effect those artefacts. Nevertheless,in this section we present the results of a test that we devised to estimate how DARCIis learning select adjectives, with the caveat that the evaluation is still somewhat sub-jective. We also demonstrate DARCI’s labeling capabilities for a handful of images. Fi-nally, we briefly describe DARCI’s ability to select the top images, from our database,that fit a given adjective label.
As of this writing, there were 1284 images in our image database and a total of 5891positive user provided labels. 3465 of those labels belonged to synsets that passed therequirement of eight minimum labels. There were 150 synsets that passed this require-ment, constituting the synsets that we say DARCI knows. Even though the system isdesigned to update incrementally, we re-ran all of the data from scratch using updatedparameters.
6.1 Empirical Results
In order to assess DARCI’s ability to associate words with image features, we observedDARCI’s neural net outputs for ten select synsets across ten images that were not inour image database. We presented these same images and synsets to online users inthe form of a survey. We chose this narrow survey approach for evaluation because thedata available for each image in our labeled dataset was scarce. On the survey, userswere asked to indicate whether or not each word described each image. They were alsogiven the option to indicate unsure. Across the ten images, each synset received 215total votes. For every synset, the positive count for each image was normalized by thetotal number of votes that the image received for the given synset. We then calculatedthe correlation coefficient between DARCI’s neural network output and this normalized
31

Synset Gloss Correlation p-valueCoefficient
Scary provoking fear terror 0.1787 0.6214Dark devoid of or deficient in light or brightness; shadowed or black 0.7749 0.0085Happy enjoying or showing or marked by joy or pleasure 0.0045 0.9900Sad experiencing or showing sorrow or unhappiness 0.3727 0.2888Lonely lacking companions or companionship 0.4013 0.2504Wet covered or soaked with a liquid such as water 0.3649 0.2998Violent characterized by violence or bloodshed 0.2335 0.5162Sketchy giving only major points; lacking completeness 0.4417 0.2013Abstract not representing or imitating external reality or the objects of nature 0.2711 0.4486Peaceful not disturbed by strife or turmoil or war 0.3715 0.2905Table 1. Empirical results over ten synsets across ten images. The gloss is the Word-Net definition. The correlation coefficient is between DARCI’s neural net outputs andnormalized positive votes from humans. The p-value is for the correlation coefficient.
positive count. Table 1 shows the results of this experiment for each synset along withthe accompanying p-value.
A high positive correlation and a statistically significant p-value would indicate thatDARCI agrees with the majority of those surveyed. The p-values we obtained indicate,unfortunately, that for the most part, these results are not statistically significant. How-ever, all of the synsets have a positive correlation, hinting that the system is heading inthe right direction and had we more data, would probably be significant. Of note is thesynset “dark”, which has the highest correlation coefficient and is statistically signifi-cant to p < 0.01. “Happy” is both the least statistically significant and shows essentiallyno correlation between DARCI’s output and the opinions of users. From these results,and acknowledging the small amount of training data we have acquired, we can surmisethat DARCI is capable of learning to apply some synsets quite effectively, while othersynsets may be impossible for DARCI to learn. More data will be necessary to solidifythese conjectures.
It is important to note that humans don’t always interpret images in the same fash-ion themselves. For example, the results regarding the synsets for “sketchy”, “sad”,and “lonely” showed little agreement amongst the human participants. While disagree-ment amongst humans did not necessarily correlate with DARCI’s interpretations, thesubjectivity of the problem somewhat absolves DARCI of the necessity for high corre-lation with common consent among humans. Clearly, other metrics are needed to trulyevaluate DARCI.
6.2 Anecdotal Results
We presented DARCI with several images that were not in her database, and observedher descriptive labels of them. Figure 2 shows some of the images and the seven adjec-tives that DARCI used to describe them. In this figure we see that DARCI did fairly wellin describing these four images. Though subjective, a case can be made for describing
32

(a) beautiful, blueish, awe-inspiring, super-natural, reflective, aerodynamic, majestic
(b) grey, bleached, sketchy, supernatural,plain, simple, penciled
(c) orange, hot, supernatural, painted,blotched, abstract, rough
(d) scary, beautiful, violent, dark, red, fiery,supernatural
Fig. 2. Images that DARCI has interpreted. Words underneath each image are the adjec-tives DARCI associated with each image. (a), (b), and (d) courtesy of Shaytu Schwan-des. (c) courtesy of William Meire.
each image the way DARCI did. One exception would be the adjective “supernatural”which appears in every single image DARCI labels. Until DARCI sees enough negativeexamples of “supernatural”, she will continue learning that all images are “supernatu-ral” because she has mostly seen only positive examples of the word.
DARCI’s vocabulary, as of now, is 150 adjective synsets and she has learned somesynsets better than others based on two things. First, she has seen more examples ofsome synsets than of others. Second, some synsets are simply much more difficult tolearn. For example, for DARCI to determine whether an image is “dark” or not is mucheasier than for her to determine whether or not an image is “awesome”. “awesome” ismuch more subjective and takes more aspects of the image into consideration. DARCIhad never seen the images shown in Figure 2 before and so, to analogize with the humanprocess, she had to describe the images based on her own experience. One could arguethat DARCI was showing imagination because she came up with appropriate adjectives.
33

(a) peaceful (b) lonely
Fig. 3. Representative images that DARCI listed in her top ten images described as (a)peaceful and (b) lonely. These images were not explicitly labeled as such when they firstappeared in these lists. (a) courtesy of Bj. de Castro. (b) courtesy of Ahmad Masood.
We designed DARCI so that she could find and display the top ten images she thinksare described by a particular adjective synset as well as the top ten images she thinksdo not represent that particular synset. This gives us a good idea of how well DARCIhas learned a particular synset. It is interesting to note that images that have not beenexplicitly labeled with a particular synset often show up in DARCI’s lists. In Figure 3we see two examples of this with the adjectives “peaceful” and “lonely”. DARCI dis-played these two images as respectively “peaceful” and “lonely” even though they hadnever been explicitly labeled as such. Many would agree that these two images arein fact describable as DARCI categorized them. Again, one could argue that DARCIwas showing imagination because she displayed these images on her own. To observeDARCI’s image interpreting capabilities go to her website [1].
7 Discussion and Future Work
In this paper we have outlined and demonstrated the first critical component of DARCI.This component is responsible for forming associations between image features anddescriptive words, and represents an aspect of artistic appreciation that is critical forthe next steps in DARCI’s development. The next component will be responsible forrendering images in an original and aesthetically pleasing way that reflects a series ofaccompanying adjectives. For example, we may present DARCI with a photograph of alion and the words: majestic and scary. DARCI would then create an artistic renderingof the lion in a way that conveys majestic and scary. If DARCI is able to learn howto render images according to any combination of descriptive words, then the possi-bility for original and meaningful art becomes apparent. The argument for creativityis strengthened as well. For example, what if one were to commission DARCI to ren-der the photograph of a forest scene in a way that is photographic, abstract, angry, andcalm? Who could say what the final image would look like? The commissioner may be
34

attributed with creativity for coming up with such a contradictory set of words, but thegreater act of creativity would arguably lie in the hands of DARCI.
The rendering component of DARCI will use a genetic algorithm to discover howto render images in a way that reflects accompanying adjectives. The fitness functionfor this algorithm will be largely a measure of how closely the phenotype, a renderedimage, matches the adjective in question. This measure will be the very output of theadjective’s associated neural net described in the body of this paper—it is a measure ofher appreciation for her own work. Since DARCI is persistent, this means that the fitnessfunction will be changing as her associative abilities improve. In fact, we intend tointroduce some of her own images into the database, thus convolving the associative andproductive processes. For this reason, we want DARCI to strengthen her associationswhile she produces and evaluates her own images.
Once the rendering component of DARCI is complete, we will continue to developher ability to be creative. We intend to allow DARCI to select the adjectives that driveimage creation by some process that takes associative knowledge into consideration.We may form associations between adjectives and nouns/verbs. This would provide aframework for DARCI to choose the subjects to render based on image captions. Fi-nally, we hope to eventually allow DARCI to create images from scratch, prior to ren-dering, using a cognitive model that would rely heavily on the associative component.
Acknowledgements
This material is based upon work supported by the National Science Foundation underGrant No. IIS-0856089.
References1. DARCI (Digital ARtist Communicating Intention). http://axon.cs.byu.edu/DARCI/.2. Distributed content-based visual information retrieval system on peer-to-pear(p2p) network.
http://appsrv.cse.cuhk.edu.hk/~miplab/discovir/.3. S. Colton. Creativity versus the perception of creativity in computational systems. Creative
Intelligent Systems: Papers from the AAAI Spring Symposium, pages 14–20, 2008.4. R. Datta, D. Joshi, J. Li, and J. Z. Wang. Studying aesthetics in photographic images using a
computational approach. Lecture Notes in Computer Science, 3953:288–301, 2006.5. C. Fellbaum, editor. WordNet: An Electronic Lexical Database. The MIT Press, 1998.6. T. Gevers and A. Smeulders. Combining color and shape invariant features for image re-
trieval. IEEE Transactions on Image Processing, 9:102–119, 2000.7. C. Li and T. Chen. Aesthetic visual quality assessment of paintings. IEEE Journal of Selected
Topics in Signal Processing, 3:236–252, 2009.8. X. Shen, M. Boutell, J. Luo, and C. Brown. Multi-label machine learning and its application
to semantic scene cassification, 2004.9. W.-N. Wang and Q. He. A survey on emotional semantic image retrieval. Proceedings of the
International Conference on Image Processing, 2008.10. W.-N. Wang, Y.-L. Yu, and S.-M. Jiang. Image retrieval by emotional semantics: A study
of emotional space and feature extraction. IEEE International Conference on Systems, Man,and Cybernetics, 4:3534–3539, 2006.
11. J. Zujovic, L. Gandy, and S. Friedman. Identifying painting genre using neural networks.miscellaneous, 2007.
35

Automated Collage Generation – With Intent
Anna Krzeczkowska,∗ Jad El-Hage,† Simon Colton∗ and Stephen Clark†
∗ Department of Computing, Imperial College, London, UK.† University of Cambridge Computer Laboratory, Cambridge, UK.
1 Introduction
One reason why software undertaking creative tasks might be perceived of asuncreative is its lack of overall purpose or intent. In computational creativityprojects, while some skillful aspects may be undertaken by the computer, thereis usually a person driving the process, by making decisions with regard tothe intent of the artefact being produced. Such human intervention can takedifferent forms, for instance via the supplying of background information inscientific discovery tasks, or making choices during an evolutionary art session.We are interested in whether a notion of purpose could be projected onto ThePainting Fool, an automated painter we hope will one day be taken seriouslyas a creative artist in its own right [3, 5]. Starting with the maxim that goodart makes you think, we have enabled The Painting Fool to produce visual artspecifically to invite the viewer to interpret the pieces in the context of the worldaround them, i.e., to make a point about a current aspect of society. However,we do not prescribe what aspect of modern life it should depict, nor do wedescribe the art materials – in this case digital images – it should use. Hence,we effectively opt out of specifying a purpose for any individual piece of art. Asdescribed in section 2, the software starts with an instruction to access sourcesof news articles at regular intervals. Then, via text manipulation, text analysis,image retrieval, image manipulation, scene construction and non-photorealisticrendering techniques, the system produces a collage which depicts a particularnews story. This is initial work, and more effort is needed to produce collagesof more aesthetic and semantic value. We present some preliminary results insection 3, including some illustrative examples and feedback from viewers of thecollages produced. In section 4, we describe the next stages for this project.
2 Automated Collage Generation
A schematic for the collage generation system is provided in figure 1. At regularintervals, scheduled processes begin a flow of information involving the retrievalof news articles from internet sources (with the news source specified by thescheduled job); the extraction of keywords from the news articles; the retrievalof images using the keywords; and the construction of input files for The PaintingFool. The input files specify which images to annotate and extract colour seg-ments from, how to arrange the segments in an overall collage, and what naturalmedia to simulate when painting the segments to produce the final piece. Weprovide further details of these processes below, with full details of the overallsystem available in [7].
36

Fig. 1. Automated collage generation system overview.
• Text Retrieval and Analysis
We enabled the system to access the Guardian News website and Google Newssearch, via their APIs. For the Guardian, the API provides access to headlines,for which there are a number of associated articles, multimedia files, blogs, fo-rums, etc., and our system extracts the first text-based article from this list.The Google News API produces similar output from multiple news sources,from which we extract text-based news stories from the BBC, The Independentnewspaper and Reuters news service. The system retrieves only English languageheadline articles, and we can specify whether the articles should be about Worldor country-specific issues only. The retrieved articles are cleaned of databaseinformation and HTML appendages to produce plain text.
Following this, we use a text analysis technique to extract a specified numberof keywords from the plain text. The technique is an implementation of the Tex-tRank algorithm [8], which is designed to extract those keywords most indicativeof the content of the document. It is based on PageRank [1], the algorithm usedby Google to determine the importance of a web page based on the hyperlinkstructure of the web. The intuition behind PageRank is that important pageswill be pointed at by other important pages, a recursive notion of importancewhich can be assigned numerical values using a simple iterative algorithm. Theintuition behind TextRank is similar: important words in the document will bepointed at by other important words. In the context of a document, pointed atis defined in [8] as being in the same context. Hence a graph representing thedocument can be created, where an edge exists between two words if those wordsappear in each other’s contexts, where context is just a fixed-size window eitherside of the target word. PageRank uses the graph to assign numerical valuesto each word and extracts the most important ones. For our experiments, onlynouns were extracted, as these were considered likely to be the most informative,and also the most useful keywords to use for image retrieval. Full details of thekeyword extraction implementation are given in [6].
• Image Retrieval and Manipulation
The keywords extracted from the news stories are used to retrieve art ma-terials (i.e., digital images) from the internet and local sources. The systemhas access to the 32,000 images from the Corel library which have been handtagged and can be relied on for images which match the given keywords well.
37

Fig. 2. Example collagesproduced by the system.
We also wanted to include images retrieved from theInternet, as these add a level of surprise,1 and a morecontemporary nature to the retrieved images. We in-terfaced the collage generation system with both theGoogle images and the Flickr APIs. In the former case,the interface is fairly lightweight, given that Googlesupplies a set of URLs for each keyword, which pointto the relevant images. In the latter case, however, aURL must be built from information retrieved froma photo-list, which is a non-trivial process. The threeimage sources (Corel, Google, Flickr) are queried in arandom order, but when either Corel or Flickr returnempty results, Google is queried, as this always sup-plies images. Note that we discuss experiments com-paring Flickr and Google images in section 3.• Scene Construction and Rendering
In the final stage of processing, the retrieved imagesare assembled as a collage in one of a number of grid-based templates. Then the system employs The Paint-ing Fool’s non-photorealistic rendering capabilities [5]to draw/paint the collages with pencils, pastels andpaints. In future, we will use the more sophisticatedscene generation techniques described in [4].
3 Initial Results
The first image in figure 2 portrays a typical collage produced by the system.Here, a scheduled process happened to retrieve a Guardian news story aboutthe war in Afghanistan, with the headline ‘Brown may send more troops toAfghanistan’. From the text, the words afghanistan, brown, forces, troops,nato, british, speech, country, more and afghan were extracted. Imageswere retrieved from Flickr accordingly, including a picture of a fighter plane,a field of graves, a young woman in an ethnic headdress and an explosion. Therendering style for this was simply to segment each image into 1000 regions andpresent the images in an overlapping grid with 10 slots. This example hints at theability of the system to construct a collage which can semantically complementa news story, or even add poignancy. The second collage in figure 2 provides ahint of the possibilities for more interesting and perhaps playful juxtapositions.This was produced in response to a news story on the England versus AustraliaAshes test cricket series, which had the headline: ‘England versus Australia –as it happened!’ The images of the Houses of Parliament and a kangaroo in thecollage are fairly obvious additions. However, the Collage also contains a picture
1 For instance, at the time of writing, querying Flickr for images tagged with the word“Obama” returns an image of a woman body-builder as the first result.
38

of the famous Falling Water building built by Frank Lloyd-Wright. Upon inves-tigation, we found that the name wright was extracted from the news story (asa member of the England cricket team) and the first Google image returned forthat keyword is, of course, the image of Falling Water.
In order to informally assess the power of the collages to represent the textupon which they are based, we showed a collection of the collages to 11 subjects.We asked them to complete a survey where they were shown 12 news storiesand 5 collages per news story, only one of which, called the master collage wasgenerated from the news story (with the others generated from similar stories).To generate the 12 master collages, we varied both the number of keywords tobe extracted (5 and 10) and the image source (Google and Flickr). Subjectswere asked to rank the 5 collages for each news story in terms of relevance,with rank 1 indicating the most relevant and 5 the least relevant. Taking theaverage of the ranks, we found that the master collage was ranked as (a) the mostrelevant in 8 of the 12 tests and (b) the second most relevant in the other 4 tests.The most marked difference we noticed was between the collages produced withGoogle and with Flickr. In particular, the Google collages had an overall rank of1.82, while the Flickr collages had an overall rank of 2.14. This highlights thatimage tagging in Flickr is not particularly reliable, with Google returning morerelevant images. These results are encouraging, as they demonstrate that even viathe abstractions of keyword extraction, image retrieval and non-photorealisticrendering, it is still possible for the collages to have semantic value with respectto the news stories from which they were derived.
4 Discussion and Further Work
The system described above is a prototype, and is presented largely as a proofof principle, rather than a finished system. We have presented an illustrativeexample of how the pipeline of processes can produce a collage with the potentialto make viewers engage their mental faculties – in this case about warfare. Thevalue here is not necessarily in the quality of the final artefacts – which arecurrently a little naıve – but rather in the fact that we had little idea of whatwould be produced. We argue that, as we did not know what the content of thecollages would be, it cannot have been us who provided the intention for them.Given that these collages are based on current events and do have the potentialto engage audiences, we can argue that the software provided the intent in thiscase (perhaps subject to further discussion of intent and purpose in art).
In [3], we argue that the perception of how a computational system producesartefacts is as important as the final product. Hence, the fact that the systemsupplies its own purpose in automated art generation may add extra value tothe artworks produced. Having said that, there are a number of improvementsto the process we intend to make in order to increase the visual and semanticappeal of the collages. In particular, we plan to make better use of The PaintingFool’s scene construction abilities, and to implement scene construction tech-niques which are aware of the context of the news story being portrayed. Forinstance, if the text of the news article has a distinctive plot-line, then a linear
39

collage might best portray the narrative of the story, with images juxtaposed inan appropriate order. However, if the major aspect of an article is the mood ofthe piece, then possibly a more abstract collage might best portray this. We alsoplan to involve text summarisation software to provide titles, wall text and otherwritten materials for the collages. We hope to show that by stepping back fromcertain creative responsibilities (described as “climbing the meta-mountain” in[4]), such as specifying the intent for a piece of art, we make it possible to projectmore creativity onto the collage generation system than if there was a personguiding the process. Our long term goal for The Painting Fool is for it to be ac-cepted as a creative artist in its own right. Being able to operate on a conceptuallevel is essential for the development of The Painting Fool, hence we will pursuefurther interactions with text analysis and generation systems in the future.
We would like to thank the anonymous reviewers for their useful advice. Onereviewer stated that in some scientific theory formation systems, the softwareis not perceived as uncreative because of a lack of intent. As the engineers ofscientific discovery software [2], when running sessions, we always provide intentthrough our choice of background material and our choices for evaluating the the-ory constituents. Hence, a critic could potentially argue that the software is notbeing creative, as it has no purpose of its own. We believe that this is true of mostother scientific discovery systems, especially machine learning based approachessuch as [9], where finding a classifier is the explicit user-supplied intention. Thereviewer also compared the collage generation system with Feigenbaum’s famousEliza program. We find it difficult to see the comparison, given that the collagegeneration system is given no stimulus from a user, whereas Eliza reacts repeat-edly and explicitly to user input. A more accurate analogy in the visual artswould be image filtering, where an altered version of the user’s stimulus is pre-sented back to them for consideration. It is clear that the notion of intent insoftware causes healthy disagreements, and perhaps our main contribution hereis to have started a fruitful discussion on this topic.
References
1. S Brin and L Page. The anatomy of a large-scale hypertextual web search engine.Computer Networks and ISDN Systems, 30:1–7, 1998.
2. S Colton. Automated Theory Formation in Pure Mathematics. Springer, 2001.3. S Colton. Creativity versus the perception of creativity in computational systems.
In Proceedings of the AAAI Spring Symposium on Creative Systems, 2008.4. S Colton. Experiments in constraint-based automated scene generation. In Proceed-
ings of the 5th International Joint Workshop on Computational Creativity, 2008.5. S Colton, M Valstar, and M Pantic. Emotionally aware automated portrait painting.
In Proc. of the 3rd Int. Conf. on Digital Interactive Media in Ent. & Arts, 2008.6. J El-Hage. Linguistic analysis for The Painting Fool. Master’s thesis, The Computer
Laboratory, University of Cambridge, UK, 2009.7. A Krzeczkowska. Automated collage generation from text. Master’s thesis, Depart-
ment of Computing, Imperial College, London, UK, 2009.8. R Mihalcea and P Tarau. TextRank: Bringing order into texts. In Proceedings of
the Conference on Empirical Methods in Natural Language Processing, 2004.9. S Muggleton. Inverse Entailment and Progol. New Generation Computing 13, 2005.
40

A Step Towards the Evolution of VisualLanguages
Penousal Machado and Henrique Nunes
CISUC, Department of Informatics Engineering, University of Coimbra, 3030Coimbra, Portugal [email protected]
Abstract. Traditional Evolutionary Art systems allow the evolution ofindividual artworks. We present a novel Evolutionary Art engine for theevolution of visual languages. In our approach, each individual is a con-text free grammar that specifies an entire family of shapes following thesame production rules. Therefore, search takes place at an higher level ofabstraction (families of shapes) than the one typically explored in Evo-lutionary Art systems (individual shapes). The description of the systemgives particular emphasis to the novel aspects of the approach and to thegenerative potential of the representation.
1 Introduction
Stiny and Gips [1] introduced the concept of Shape Grammars, which: “aresimilar to phrase structure grammars, which were introduced by Chomsky inlinguistics. Where phrase structure grammars are defined over an alphabet ofsymbols and generate one-dimensional strings of symbols, shape grammars aredefined over an alphabet of shapes and generate n-dimensional shapes.”[1]. Stinyand Gips have successfully built shape grammars that capture the “language”of Frank Lloyd Wright’s prairie houses, Mughul Gardens, Palladian Plans, etc.Additionally, they were also able to use these grammars to produce new instancesof the same language, e.g. to create new prairie house designs that obey FrankLloyd Wright’s style to the point of being indistinguishable, even to experts,from his original works [2].
Although these grammars are hand-built, and result from a complex processof analysis and formalization of the hidden rules followed in the originals, theseresults show that: (i) it is possible to capture specific visual languages using a setof production rules; (ii) it is then possible to use this set of rules to automaticallygenerate new objects that belong to the same visual language.
The main motivation for the present work is the development of a system forthe evolution of novel visual languages. For that purpose we created an evolu-tionary engine where each individual is a context free grammar, and developedappropriate genetic operators, including several mutation operators and graph-based crossover.
The use of the Context Free Design Grammar (CFDG) language [3] for rep-resentation allows the specification of complex families of shapes through a com-pact set of rules, and has several potential advantages over typical Evolutionary
41

Art (EA) representations. A brief overview of current evolutionary art systems,focusing on representation issues, is presented in Section 2 to allow a bettercontextualization of the present work, while, in Section 3, we describe the mostrelevant characteristics of CFDG. In the fourth Section we describe our evolu-tionary engine, and, in section 5, we present some of the experimental resultsattained. Finally, in Section 6, we draw some final conclusions and indicate futurework.
2 Related WorkA thorough survey of EA systems beyond the scope of this paper (see, e.g., [4]for a in-depth survey). Here we present a brief overview, focusing on the issuesthat are of most relevance to the present work, namely, representation schemeand generation abilities of the system. The most popular EA approach is in-spired in the seminal work of Karl Sims [5]. It uses Genetic Programming (GP)to evolve populations of images. Each genotype is a tree that encodes a LISP-like symbolic expression. The internal nodes of the tree are functions (typicallyarithmetic, trigonometric and image processing operations) and the leafs are ter-minals (typically x and y variables and random constants). The rendering of theexpression results in a phenotype, e.g. an image. More often than not user-guidedevolution is employed, i.e., the user assigns fitness to the images, thus indirectlydetermining the survival and mating probabilities of the individuals. The fittestindividuals have a higher probability of being selected for the creation of thenext population, which is generated through the recombination and mutation ofthe genetic code of the selected individuals.
The use of Genetic Algorithms (GAs) coupled with a fixed or variable lengthstring representation is also frequent. In these cases the most common approachis parametric evolution [4]. In other words, the genotype encodes a set of param-eters that determine the phenotype. Among other applications, this approachhas been used to evolve cartoon faces, fractal shapes, fonts [4]. The use of ECapproaches to the evolution of line-based drawings, 3D shapes, l-systems, filters,etc., has also been explored. Although the application area and implementa-tion details vary, most systems can be seen as instances of expression-based orparametric evolution.
As Machado and Amılcar [6] point out, most expression-based EA systemsare theoretically able to create any image (see also [7]). Nevertheless, in practice,the image space that is actually explored depends heavily on the particularitiesof the system (primitives, genetic operators, genotype-phenotype mapping, etc.).In other words, and notwithstanding works such as [8] that describes an approachto iterative stylistic change in EA, most systems have an identifiable signaturethat naturally emerges from the interactions between its different components. Inparametric evolution models, system signature is even stronger since: “...creatinga parametric model implicitly creates a set of possible designs or a solutionspace.” [4] Thus, there are strong contraints that limit the search-space anddefine the type of imagery produced by the system.
Finally, to the best of our knowledge, there are two reported examples ofthe use of CFDG in the context of Evolutionary Art. Unfortunately, none of
42

them allows the evolution of visual languages. As the name indicates CFDGMutate [9] only allows the application of mutation operators, which is limiting,and does not handle non-deterministic grammars, which means each individualrepresents a single shape (see Section 3). Saunders and Kazjon [10] present aparametric evolution model that evolves parameters of specific CFDG hand-built grammars. Although this allows some degree of exploration, in essence ithas the same shortcomings as other parametric evolution approaches.
3 Context FreeContext Free [11] is a popular open-source application that renders images spec-ified using a simple language entitled Context Free Design Grammar (CFDG).In essence, and although the notation is different from the one used in formallanguage theory, a CFDG program is a context free grammar, i.e. a 4-tuple:(V,Σ,R, S) where,
1. V is a set of non-terminal symbols2. Σ is a set of terminal symbols3. R is a set of production rules that map from V to (V ∪Σ)4. S is the initial symbol
In Fig. 1 we present a simple grammar and the image generated by it. Programsare interpreted by starting with S (in this case S = TREE, as defined by thestartshape directive) and proceeding the expansion of the production rules inbreath-first fashion. Pre-defined V symbols call drawing primitives (e.g. CIRCLEdraws a circle) while predefined Σ symbols produce semantic operations (e.g.size produces a scale change, y moves forward, etc.). Program interpretation isterminated when one of the two following criteria is met: (i) There are no Vsymbols left to expand; (ii) The further expansion does not change the image(E.g.: although the recursive loop of the grammar presented in Fig. 1 is endless,the set of transformation is contractive [12], after a few iterations we reacha size smaller than pixel size and, therefore, further expansion will not causevisible differences). This second termination criterium has no parallel in formallanguage theory, but is similar to the termination criterium used in IteratedFunction Systems (IFSs) rendering.
The grammar depicted in Fig. 1 is deterministic, there is exactly one rulefor each V symbol, therefore its interpretation will always result in the sameimage. To specify languages of shapes we have to resort to non-determinism. InFig. 2 we present a non-deterministic version of this grammar, with two differentproduction rules for the ’TREE’ symbol. When several production rules may beapplied one of them is selected randomly and the expansion of the grammarproceeds. One can control the relative probability of selection by specifying aweight after the V symbol1 (in this case, 0.8 for the first rule and 0.2 for thesecond).
1 The same effect can be attained by making copies of the production rule we wish touse more frequently. So this does not violate the formal language theory definitionof a context free grammar.
43

startshape TREErule TREE {
CIRCLE {}TREEA {size 0.95 y 1.6}}
rule TREEA {CIRCLE {}TREEB {size 0.95 y 1.6}}
rule TREEB {CIRCLE {}TREEC {size 0.95 y 1.6}}
rule TREEC {CIRCLE {}TREED {size 0.95 y 1.6}}
rule TREED {CIRCLE {}TREE {size 0.95 y 1.6 rotate 45}TREE {size 0.95 y 1.6 rotate -45}}
Fig. 1. A deterministic grammar and the tree-like shape generated by it.
startshape TREE
rule TREE 0.80 {CIRCLE {}TREE {size 0.95 y 1.6}
}
rule TREE 0.20 {CIRCLE {}TREE {size 0.95 y 1.6
rotate 45}TREE {size 0.95 y 1.6
rotate -45}}
Fig. 2. A non-deterministic version of the grammar presented in Fig. 1 and instancesof the family of tree-like shapes generated by it.
4 Evolutionary Context Free Art
In this section we describe our evolutionary engine. For the sake of parsimonywe will avoid mentioning the implementation details and focus on the key com-ponents. An in-depth description is left for a future opportunity.
4.1 Representation
Each genotype is a well-constructed CFDG grammar. Internally the genotypeis represented by a directed graph where each node encapsulates a productionrule. For each node, Ni, outgoing edges are created in the following way:
1. Let Vi be the set of all V symbols that the production generates2. Let Mi be the set of all nodes representing production rules that may be
triggered by Vi symbols3. Establish edges from Ni to all Mi nodes
For instance, the grammar of Fig. 1, results in the following edges: TREE →TREEA, TREEA → TREEB, TREEB → TREEC, TREEC → TREED;
44

Fig. 3. The two leftmost images are the parents, the remaining ones are results of theircrossover
for the grammar of Fig. 2 we would have TREE1 → TREE1, TREE1 →TREE2, TREE2 → TREE1, TREE2 → TREE2, where TREE1 and TREE2
represent the nodes that would be created for the first and second production,respectively.
The phenotype is rendered using Context Free. Infinite non-contractive loopsmay occur. To cope with this problem we specify a maximum amount of timefor rendering. If that limit is reached rendering stops and the current image isconsidered the phenotype.
4.2 Genetic Operators
The design of genetic operators that are well-suited to the adopted represen-tation is vital for the success of any evolutionary algorithm. In our case thebiggest challenge was to design a recombination operator that allows the mean-ingful exchange of genetic material between individuals. Given the nature of therepresentation we developed a graph-based crossover operator based on the onepresented by Pereira et al. [13]. In simple terms, this operator, inspired in thestandard GP swap-tree crossover, allows the exchange of subgraphs between in-dividuals. Our implementation follows the algorithm described in [13] closely,but we have generalized it to allow the exchange of subgraphs of unequal size.In Fig. 3 we present examples attained trough crossover.
We use a total of eight mutation operators: Startshape mutate – randomlyselects a new V starting symbol; Add V – Adds a V symbol to a given produc-tion rule in a valid random position; Remove V – Removes a V symbol froma given production rule and associated parameters (if any exist); Copy rule –Duplicates a production rule; Remove rule – Removes a given production ruleupdating the remaining rules when necessary (if it is the only production ruleassociated with a given V symbol, production rules that generate that symbolmust be updated, which is accomplished by removing the symbol from thoserules); Change, Remove, Add parameter – as the names indicate these operatorsadd, remove or change parameters, i.e. Σ symbols.
All operators preserve the validity of the grammar and update the graphaccordingly.
4.3 System Overview and Generation Abilities
In all the experiments presented in this paper we adopted an user-guided evo-lution approach. Unlike most EA representation schemes, it is feasible to edit
45

CFDG by hand, in fact Context Free users have already created an impres-sive collection of shapes and visual languages. As such, it would be possible forthe user to directly manipulate the genetic code. Although the ability to read,understand and edit the evolved genotypes is an important advantage, in theexperiments presented herein we didn’t take advantage of this possibility.
In standard EA systems the initial population is either random or seededusing examples from previous EA runs. In the present system, and given theavailability of a wide set of hand-coded CFDG grammars, we have the option ofusing top-quality grammars to seed the evolutionary runs.
The remaining aspects of the system follow standard Evolutionary Compu-tation practices. We use a generational approach, elitism and tournament selec-tion. In the experiments presented in this paper, population size=50, the topindividual was preserved, and tournament size=5.
In what concerns the generative potential of the system, it is trivial to showthat it is possible to represente any image. Consider you want to represent aparticular image, for each pixel use a rule that changes the color so that itmatches the pixel’s color, draw one square, move in the direction of the next pixel,call the rule for the next pixel. Obviously this would result in an extremely longand mostly useless grammar, but it can be done. Another way of demonstratingthe generality of CFDG is the following: considering that an IFS can be specified(compactly) using CFDG and that Barnsley [12] demonstrated that IFSs can beused to generate any image, the same applies to CFDG. Although this genericrepresentation abilities are theoretically relevant, in practice the main issue isknowing what types of images can be represented compactly. The wide set ofimagery produced by Context Free users indicates that it is possible to generate alarge amount of complex and beautiful shapes with surprisingly small grammars.
A more interesting question is knowing which languages of shapes can beexpressed using CFDG. Once again theory and practice can be quite different.
From a theoretical standpoint, the set of all images of a given resolution,albeit vast, is finite [7]. As such, considering a fixed resolution, any given shapelanguage is also a finite collection of shapes. Since it is possible to representany image with CFDG and that union is a trivial operation for context freelanguages, it follows that any family of shapes can be represented2.
In practice, defining a language of shapes through enumeration is either un-feasible or uninteresting. Thus, from a practical standpoint we can consider theset of all images and the set of all shape languages infinite. It then follows thatit is not possible to represent any language of shapes, nor even the set of allrecursive languages, since the pumping lemma for context free languages aplies.Like previously, the hand-coded examples of CFDG languages developed by thenumerous users of Context Free indicate that, in spite of this limitations, it ispossible to create interesting and sophisticated shape languages with compactCFDG grammars.
2 Consider that you have two grammars, A and B, with initial symbols SA and SB ,A∪B can be attained by: preserving all the production rules of A and B; creating anew initial symbol, SA∪B ; adding the production rules SA∪B → SA and SA∪B → SB .
46

5 Experimentation
The main goals of the experiments conducted were testing the ability of thesystem to: (i) evolve appealing and complex shapes; (ii) cope with hand-codedCFDGs; (iii) evolve families of shapes.
The analysis of the experimental results attained by evolutionary art systems,specially user driven ones, entails a high degree of subjectivity. In our case, thereis an additional difficulty: each individual encodes a set of images. Consideringthese difficulties, space restrictions, and the visual nature of the results, we choseto focus on a single evolutionary, which can be considered typical.
To address goal (ii) we initiate the run using 6 hand-coded CFDGs down-loaded from the Context Free gallery [11]. Fig. 4 presents examples of imagescreated by these grammars.
In what concerns goals (i) and (iii) we already know it is possible to createstunning imagery and visual languages using CFDG, so the main issue is de-termining if it is possible to guide the EC algorithm to promising areas of thesearch space.
The visual diversity of the populations found throughout the run was alwayshigh (see Fig. 5). Population diversity is generally welcomed and has the ad-ditional benefit of keeping the user engaged; however, we found that the userwas often distracted due to the presence of too many interesting alternatives,and unable to keep steady evaluation criteria. Nevertheless, the user was able toguide the EC algorithm with relative ease and promote convergence whenever itwas found necessary. In Fig. 6 we present some of the favorite images producedby individuals of this run.
The mutation operators proved valid throughout the run producing resultsthat are conceptually similar to the effects of mutation in expression-based EA.That is, the effects of mutation range from minor visual alterations to dramaticchanges in appearance induced by small changes of the genetic code, with thelater being less often [6]. Although it is subjective to say it, in what concernsmutation, the system appears to have an adequate degree of plasticity – allowingchange – and stability – preventing chaotic behaviour.
The effects of the crossover operator appear to depend heavily on the struc-tural similarity of the genotypes and on their size. In general terms, when theparents are unrelated the visual appearance of each descendent tends to bemostly determined by one of the parents (see fig. 3). This effect is particularlyvisible when the genotypes are small and with hand-built grammars (which tendto share little resemblance). Like previously, similar findings have been reportedfor expression-based EA, particularly for non-random initial populations [6].
In Fig. 7 we present instances of the visual languages defined by two of theindividuals evolved during the run. The experimental results show that non-trivial and interesting families of shapes were evolved.
During evolution the user only has access to one instance of the images an in-dividual generates. This means that the quality, diversity and consistency of thelanguage of shapes generated by the individual isn’t directly assessed. Arguably,individuals that fail to reliably generate high quality images will eventually be
47

Fig. 4. Hand-coded grammars used as initial population.
Fig. 5. Images generated by the first 15 individuals of the 10th population of the run.
discarded by evolution, and the user will eventually grow tired of individualsthat systematically generate the same image. Nevertheless, this is not the sameas directly assessing the language of shapes that each individual defines, andinteresting languages may easily be overlooked. This may contribute to a lowerdiversity of shapes within each family. In spite of this, the ability to create fam-ilies of shapes is inherent to the the system and the experiments successfullyevolved interesting visual languages.
6 Conclusions and Future Work
We presented a novel evolutionary engine that allows the evolution of CFDGs, isable to cope with non-deterministic grammars, and allows their recombinationtrough a graph-based crossover operator. Due to these abilities, it successfullyovercomes the limitations of previous EC approaches where CFDGs are used.When compared with typical expression-based and parametric evolution modelsour approach presents several advantages, including the ability: to evolve visual
48

Fig. 6. Images generated by some of the most valued individuals evolved during thecourse of the run.
languages instead of individual images; to use hand-coded grammars; and toallow the user to editing of the genotypes.
Although the interpretation of the results is subjective, they provide evidenceof the adequacy of the genetic operators and of the generative power and poten-tial of the system. They also indicate that further experimentation is required tofully explore the potential of the approach for the creation of visual languages.Nevertheless, we consider this to be an important step in that direction.
In terms of future work, redesigning of the user interface, exploring of auto-matic image fitness assignment schemes, and developing approaches to automat-ically assess a language of shapes in terms of consistency, diversity and aestheticqualities of the generated images are our top priorities.
References
1. Stiny, G., Gips, J.: Shape grammars and the generative specification of paintingsand sculpture. In Freiman, C.V., ed.: Information Processing 71, Amsterdam,North Holland Publishing Co. (1971) 1460–1465
2. Boden, M.A.: The Creative Mind: Myths and Mechanisms. Basic Books, NewYork (1990)
3. Coyne, C.: Context free design grammar. http://www.chriscoyne.com/cfdg/ (lastaccessed in September 2009)
4. Lewis, M.: Evolutionary visual art and design. In Romero, J., Machado, P., eds.:The Art of Artificial Evolution: A Handbook on Evolutionary Art and Music.Springer Berlin Heidelberg (2007) 3–37
49

Fig. 7. Instances of the language of shapes defined by two individuals.
5. Sims, K.: Artificial evolution for computer graphics. ACM Computer Graphics 25(1991) 319–328
6. Machado, P., Cardoso, A.: All the truth about NEvAr. Applied Intelligence,Special Issue on Creative Systems 16(2) (2002) 101–119
7. McCormack, J.: Facing the future: Evolutionary possibilities for human-machinecreativity. In Romero, J., Machado, P., eds.: The Art of Artificial Evolution: AHandbook on Evolutionary Art and Music. Springer Berlin Heidelberg (2007)417–451
8. Machado, P., Romero, J., Manaris, B.: Experiments in computational aesthet-ics: An iterative approach to stylistic change in evolutionary art. In Romero, J.,Machado, P., eds.: The Art of Artificial Evolution: A Handbook on EvolutionaryArt and Music. Springer Berlin Heidelberg (2007) 381–415
9. Borrell, A.: Cfdg mutate. http://www.wickedbean.co.uk/cfdg/index.html (lastaccessed in September 2009)
10. Saunders, R., Grace, K.: Teaching evolutionary design systems by extending ”con-text free”. In: EvoWorkshops ’09: Proceedings of the EvoWorkshops 2009 on Ap-plications of Evolutionary Computing, Berlin, Heidelberg, Springer-Verlag (2009)591–596
11. Horigan, J., Lentczner, M.: Context free. http://www.contextfreeart.org/ (lastaccessed in September 2009)
12. Barnsley, M.F.: Fractals Everywhere. Second edn. Academic Press Professional,Cambridge, MA (1993)
13. Pereira, F.B., Machado, P., Costa, E., Cardoso, A.: Graph based crossover —A case study with the busy beaver problem. In: Proceedings of the Genetic andEvolutionary Computation Conference. Volume 2., Orlando, Florida, USA, MorganKaufmann (13-17 July 1999) 1149–1155
50

On the Role of Metaphor in Creative Cognition
Bipin Indurkhya
Cognitive Science Laboratory International Institute of Information Technology
Hyderabad 500032, India [email protected]
Abstract. We consider some examples of creativity in a number of diverse cognitive domains like art, science, mathematics, product development, legal reasoning, etc. to articulate an operational account of creative cognition. We present a model of cognition that explains how metaphor creates new insights into an object or a situation. The model is based on assuming that cognition invariably leads to a loss of information and that metaphor can recover some of this lost information. In this model we also contrast the role of traditional analogy (mapping based on existing conceptualization) with the role of metaphor (destroying existing conceptualizations in order to create new conceptualizations).
1 Introduction
Though there have been many approaches to characterize creativity [17] [25] [31], we start with a simple approach which sees creativity as a process of generating a new perspective on a problem or a situation. We are limiting ourselves to individual creativity here, so the information resulting from this process need only be novel to the cognitive agent, and we do not yet concern ourselves with creativity in a society. Secondly, we do not consider usefulness of the generated information: it is sufficient for us here that the information be novel to the agent. In fact, if the model presented here is correct, it implies that there cannot be some domain-independent principle or heuristic that would generate only (or largely) useful perspectives.
With these assumptions in place, the task we are undertaking is to propose a model that articulates the role of metaphor in the creative process and also explains why metaphor is so effective in generating new perspectives. In this model, we will also compare the role of analogy with the role of metaphor, and argue that the two play complementary roles in creative cognition.
The paper is organized as follows. In the next section we will present a few examples to illustrate how creative insights are obtained in a few diverse domains. Following this, in Section 3, we will present an account in which cognition is seen to necessarily involve loss of some information, and in which metaphor becomes one of the tools that makes it possible to recover some of this lost information. At the end of this section we will also compare the role of analogy with the role of metaphor. Finally, in Section 4, we will summarize the main points of this paper, and mention future research directions.
51

2 Creativity in Cognition: Some Examples
We start by considering some concrete instances where a new insight or a new perspective was generated. The examples are taken from a number of diverse domains including art, legal interpretation, mathematics, and product development. At the end of this section we will present a brief overview of the cognitive mechanisms underlying creativity that have been proposed in the past research.
2.1 Creativity in Art
In a recent study, Okada et al [20] consider the evolution of artistic style and creativity in the works of a Japanese artist Shinji Ogawa over several years. One interesting point in this study is how the artist hit upon an idea that led to a series of work: “[Shinji Ogawa] was a part-time teacher at a vocational-technical school of media art. When he was preparing for a class, he accidentally erased part of a picture on a computer screen by mistakenly pushing a keyboard button. At that moment, he came up with the idea that if something very important and valuable suddenly disappears, a new value may be generated and a new world could be created. With this idea, he tried to create a new movie poster for Roman Holiday by erasing the main actress, Audrey Hepburn, from the original poster. This was the beginning of the artwork series, ‘Without You’.” [p. 194].
Though the authors chose to interpret this example in terms of analogical modification, it resonates strongly with Piaget’s account of how new schemas emerge through sensorimotor interactions with the environment. The example presented above bears a strong resemblance to Piaget’s account of how a child brings a toy to her mouth in order to suck, accidentally notices the bright color of the toy and starts bringing toys near her face to look at them, eventually generalizing into a schema of ‘bringing objects to the face in order to look at them’ [21][22]. In Mr. Ogawa’s case, he accidentally discovered the operation of ‘delete figure from a picture’, realized artistic potential of it, and a new style of artwork was born. That the discovery was made accidentally is not so relevant for our argument here, but what we would like to emphasize is that the discovery resulted from the application of a familiar operation (‘delete’) to a familiar object but in a novel way.
Interestingly, similar episodes occurred later as well in Mr. Ogawa’s career. Okada et al note: “Mr. Ogawa happened to pick up a postcard at hand with old Western scenery and drew a duplicate building next to an original one. Then he mailed it, as a postcard, to a gallery owner. When he heard from the gallery owner telling him that staff members of the gallery talked highly about his postcard, Mr. Ogawa decided to start a new artwork series, ‘Perfect World’, in which he duplicates a person or a thing in postcards or photographs of scenery.” [p. 195]
The operations of ‘delete’ and ‘duplicate’ are quite similar. In the framework of Hofstadter [7], one could say that one operation slipped into a neighboring operation to lead to another creative insight. Or one could see it in terms of a Piagetian schema of related operations that are applied to a different class of objects. It is important to underscore the ‘different’ part here. When handling photographs of famous landmarks, people, etc., we could change the contrast, brightness level, perhaps apply red-eye reduction tool, but we do not normally delete or duplicate objects, and much less so if the object is the main theme of the photograph. In other words, we could say that the creative insights resulted from applying a set of familiar operations to a set of [also familiar] objects that are not usually associated with the operations. This is the key point that makes metaphor an invaluable tool for generating creative insights, something that we will keep reiterating in the rest of the paper.
52

2.2 Creativity in Legal Interpretation
Even though law is a domain that is normally not associated with creativity — for one expects a straightforward application of legal principles and many judicial scholars frown on any deviation from the literal interpretation of the legal text — in our previous research [8] [10] we have found a number of situations where a new perspective or insight was a key factor in a legal discourse. We briefly present two such examples here.
The first example is taken from [8]. In Australia and England, when a married couple divorces, the division of property was determined in large part by the old case law of ‘Husband and Wife’ and by various Acts. These generally provided for division according to economic value added into the marital assets. This was plainly unjust where the husband had worked, while the wife cared for children and maintained the household. In such situations, the standard decision was, until recently, that the husband would get the lion’s share of the property. However in an example of productive thinking, in Baumgartner v Baumgartner [(1987) 164 CLR 137] the High Court of Australia introduced a principle from a completely different area of law and held that the wife’s work placed into the house meant she had an equitable interest in it. The husband, though legally the owner of the house, actually held part of it in a ‘constructive trust’ for his wife. This decision was soon followed by a number of other similar decisions by other courts, and is now the standard approach.
This illustrates a novel application of the legal concept of constructive trusts to a set of situations for which it was not originally intended, which resulted in a new way of rendering judgment on them. Similarly, the decision of Lord Denning in the High Trees case [Central London Property Trust Ltd v High Trees House Ltd [1947] KB 130], which modified contract law by introducing another equitable principle, ‘promissory estoppel’, is another example where a legal concept from a different area was applied to deal with a problem in a domain for which it was not originally intended. (See also [27].)
The second example [10] concerns the case of a hot-dog stand operator, who claimed tax-deduction for the kitchen at home where hot-dogs were prepared [Baie, 74 T.C. 105 (1980)]. One argument made by B. was that her kitchen was a manufacturing facility of the business. The judges remarked: “We find this argument ingenious and appealing, but, unfortunately, insufficient to overcome the unambiguous mandate of the statute.” [74 T.C. 110 (1980)]. The point to emphasize here is that the category ‘manufacturing facility’, which is not normally associated with this situation, is applied to the kitchen where hot dogs are prepared resulting in a novel perspective.
To summarize, we see that the application of a legal concept to a domain or a situation for which it was not originally intended, can sometimes result in a new way of looking at the situation thereby leading to a novel judgment.
2.3 Creativity in Mathematical Reasoning
Consider George Cantor’s theory of transfinite numbers, in particular, his arguments concerning the levels of infinity [1]. Two of his key proofs, namely that 1) rational numbers have the same cardinality as natural numbers, and that 2) real numbers are more numerous than natural numbers, can now be understood by a high-school student. However, when originally proposed, they were considered very radical. Many leading mathematicians at that time refused to accept his formalization of set theory and its implications for infinite sets. Yet, Cantor’s insights were derived from applying the operation of making one-to-one correspondence, which was already well known for finite sets for hundreds of years, to infinite sets. In addition, he used a
53

particular way of arranging infinite numbers in an array and counting them in such a way that two (or more) infinite dimensions can be mapped onto a single dimension of infinity. A somewhat different operation applied to a similarly arranged two-dimensional layout of numbers led to his famous diagonal argument, where he showed that certain sets cannot be put in a one-to-one correspondence with natural numbers.
To emphasize, we see again that the application of familiar operations to a different sets of objects resulted in a novel perspective. For indeed, the theorems and proofs discovered by Cantor revealed a whole new aspect of numbers and opened a fresh chapter in mathematical research.
2.4 Creativity in Product Development
Consider a case study described in Schön [24] where a product development team was faced with the problem of figuring out why synthetic-fiber paintbrushes were not performing as well as natural-fiber paintbrushes, and to improve their performance. The members of the team tried many ideas — for instance, they noticed that the natural fibers had frayed ends, and they tried to have synthetic fibers with frayed ends too — but without success. The breakthrough came when one member of the team suggested that the paintbrush might work as a pump. This idea was initially considered quite shocking, for a paintbrush and a pump were thought to be very dissimilar. Yet, in trying to make sense of the analogy, a new ontology and structure for the paintbrush was created. In this new representation, the paint was sucked in the space between the fibers through capillary action, and when the fibers were pressed against the surface to be painted, the curvature of the fibers caused a difference in pressure that pumped out the paint from the space between the fibers onto the surface to be painted. From this new ontology, when the synthetic-fiber and natural-fiber paintbrushes were compared, it was found that the synthetic fibers bent at a sharp angle against the surface, whereas the natural fibers formed a gradual curve. Thus, juxtaposition with pumping caused a new perspective to be created on the process of painting and paintbrush.
There are many other such examples [Gordon 1961] where seeing one familiar object as another familiar object, but one that is not normally associated with the first object, led to a new perspective and eventually to solving a difficult problem.
2.5 Cognitive Mechanisms of Creativity
So far we have seen a number of examples where a set of operations or concepts are applied to an object or a situation with which they are not normally associated, resulting in a novel perspective. Perhaps not surprisingly, such mechanisms have been noted and studied in the past by various researchers, and they have been known under different labels. Here we summarize a few major veins of this research. Making the Familiar Strange: Gordon and his colleagues [6] studied creative problem solving in real-life situations for many years, and found that one way to get a new perspective on the target problem is to look at in a strange way. The mechanism is they proposed is to juxtapose the target problem or object with a completely unrelated object or situation. Displacement of Concepts: Schön [24] emphasized that in order to get a new insight about a concept, it needs to be displaced, that is, put in the context of other unrelated concepts. He emphasized that the most important step in problem solving is problem
54

setting, that is how the problem is stated and viewed, and metaphors play a key role in this step. Bisociation: Koestler [18] coined this term to emphasize that the pattern underlying a creative act is the perception of a situation or an idea in two self-consistent but habitually incompatible frames of reference. Lateral Thinking: Edward de Bono [4] contrasted vertical thinking with lateral thinking. In the former, one starts with some assumptions and explores their implications deeper and deeper. But in lateral thinking, the goal is to look at the problem in different ways so that the familiar assumptions one makes about it can be questioned and perhaps a new set of assumptions can be brought in. Estrangement. Rodari [23] focused on creativity in inventing stories, and proposed many practical methods that stimulate imagination and creativity in children (and in adults). Many of his methods rely on random juxtaposition of concepts. One mechanism he emphasizes as the first step in creating riddles is estrangement, where you are asked to see the object as if for the first time. In other words, instead of seeing the object in terms of the familiar categories it naturally evokes, you are asked to consciously block this evocation and try to view the object as if it is a strange object you are seeing for the first time. Conceptual Blending. Fauconnier and Turner [5] analyzed how people combine perceptual, experiential and conceptual aspects of different concepts subconsciously to generate new insights. Though each of these approaches has its own peculiarities, they all emphasize that in order to get a new insight about an object or situation, we need to get away from, or break, its existing conceptualization. In this task, viewing the object in terms of (or juxtaposing it with) another unrelated object can be a key step.
3 An Account of Creativity in Cognition
We saw numerous examples in the last section that show that to get a new perspective on an object or a situation, an approach that often works is to apply operations that are not normally associated with that object, or to see that object as another unrelated object. Here we will propose a model to explain why this process works as it does.
3.1 Cognition and Loss of Information
Here we argue that every act of conceptualization (or cognition) invariably involves some loss of information. When we choose to label an object as a ‘chair’ numerous specific details of the object, like its color, the material it is made of, shape, etc. are all lost. Of course, we could make our conceptualization of the object more specific — it is a red chair, made of teak, with a high back, and so on — but no matter how detailed the conceptual representation is made, there is always some aspects of the object that are excluded, and it is these excluded aspects that constitute the information lost in the conceptualization. (This precisely is the theme of a short story Del Rigor en la Ciencia (On Exactitude in Science), by Jorge Luis Borges and Adolfo Casares.)
55

Whenever this lost information becomes crucial to solving the problem, then the existing representation becomes hopelessly inadequate. In the paintbrush example presented above, the information about the spaces between the brush fibers etc. was discarded in the then existing model of painting, so no matter how much and how hard the product development team tried, the problem could not be solved. It was necessary to change the representation or the conceptualization of the object.
3.2 Interaction with the Environment Through Actions and Gestalt Projection
If the hypothesis presented above is correct, namely that some information is invariably lost in conceptualization, the next question is how can we recover, at least partially, this information. Here we assume that we do not have the God’s eye view of the world, meaning that we do not have another way to access the object except through the cognitive agent. This may seem a technicality, but it is a very crucial point, so let us elaborate a bit. In a computer simulation or a model, one can posit a very rich and detailed representation of the object, and then show how a conceptualization picks out some aspects of this rich representation, while ignoring others. For example, the rich representation of a chair may include its material, shape, color, weight, and so on, but the conceptualization can only include legs, seat and back. However, for us here, the rich representation is not available, for if it were, it would be just another conceptualization, and there will still be some lost information. In other words, that our conceptual representation of an object does not include all the information about the object is like an existence proof: we can argue about its existence but we cannot say what it is. So the key question is how can we become aware of this lost information, and how can we recover at least some of it.
Piaget’s action-oriented approach provides a possible way to addressing this question. Piaget argued that an object is relevant or meaningful to a cognitive agent in only as far as how the agent may act on it. Thus, a ball is something that a baby might roll, kick, squeeze, and so on. In this approach, novel aspects of an object may be revealed when the agent carries out new actions on it. Moreover, the actions can be internalized actions, which are called operations in Piaget’s framework. In our earlier work [13], we have used the term gestalt projection to emphasize that it is not just individual operations, but a network of operations, namely a schema or a gestalt, that are projected onto the internalized object or situation. In other words, a cognitive agent can get more information about an object or a situation by projecting a different gestalt, or a different set of operations onto it.
3.3 Metaphor: A Tool for Generating New Information about the Environment
So far we have argued that all conceptualization involves some loss of information, and that some of this lost information may be recovered by projecting a different gestalt or a different set of operations onto it. But this is essentially what a metaphor does! By inviting us to see one object as another, we are forced to project the conceptual organization of the second object (usually referred to as the source) onto the experiences, images etc. of the first object (usually referred to as the target). Thus, metaphor can be a useful and powerful tool to get new information about the environment.
This is essentially the crux of the arguments made by Turbayne [28]. He argued that though we can understand the world only through some metaphor or other, we enrich our understanding by viewing the world through two different metaphors. What a metaphor does is essentially give us an alternate conceptualization of the target. While this alternative conceptualization also loses some information (as all
56

conceptualizations do), the point is that this loses a different kind of information than what was lost in the original conceptualization, and taking them together we recover some of the lost information. (See also [14] and [24].) In this way, metaphor becomes a potent cognitive tool for generating creative insights.
An interesting consequence of this view is that there cannot be any a priori criterion for determining which metaphors will be useful for a particular problem or to achieve a particular goal. If it is the missing information that is the key to solving the problem, then the existing conceptualization is hopelessly inadequate in pointing the way to recovering this information. The metaphor approach presented here is essentially a trial-and-error method that makes no promise to deliver even in a probabilistic sense. We elaborate on this further below.
3.4 To Analogize or Not To Analogize
If we follow the arguments presented above, analogies, in their traditional sense at least, turn out to be an anathema to creativity. The reason is that analogies are based on mapping the structure or attributes of the source, to the structure and attributes of the target. So an analogy, which is based on the existing conceptualization of the source, will retrieve sources that are similar to the structure, thereby further strengthening the existing conceptualization of the target. But if the problem could not be solved because of the missing information, then an analogy-based approach will not be very useful.
Yet, analogy has also been recognized as a key mechanism of creativity [2] [6] [7] [18] [19] [20]. One must distinguish between two modes of analogy here though. On one hand, analogy refers to “seeing one thing as another”, which is essentially the same as how we have characterized metaphor above. The other use of the term analogy refers to the process whereby the structure and the attributes of the source are mapped to the target. It is this latter mechanism that seems contrary to creativity according to the view presented here, and so it needs some further elaboration.
The cognitive structures (categories and conceptualizations) that naturally evolve through a cognitive agent’s interaction with the environment reflect the priorities of the agent. The information that is retained in the conventional conceptualization is the one that has been useful to the agent (or to its ancestors) in the past, and the lost information may not be very relevant. So as long as one stays in the familiar domain (in which the conventional conceptualizations are very useful), and the problem does not require the lost information, reasoning from conventional operations and conceptualizations may be very efficient. Indeed, many of the case studies that show effectiveness of analogy in creative problem solving either stay within the same domain, or they use a source that is already similar to the target in a way that leads to a successful solution to the problem. However, as soon as the problem becomes different requiring new information, analogy becomes a hindrance, and the metaphor approach is called for. (See also [6] and [9].)
To put this in another way, metaphor in the making-the-familiar-strange mode is a cognitively expensive operation, with no a priori guarantee if it will succeed, or when it will succeed. Therefore, this is used sparingly, and only when other avenues (like reasoning from analogy) have been tried out and were not successful.
3.5 Implications for Computational Modeling
The account of creativity and cognition articulated here has a number of implications for computational modeling, and we will briefly highlight a few major ones. First of all, traditional approaches based on mapping existing symbolic representations clearly
57

have limitations [3] as far as creativity is concerned. They do capture a certain aspect of creativity in noticing new connections between existing knowledge, and in importing novel hypotheses from the source to the target, but they do not produce a paradigm shift of Kuhnian kind. In this regard, models based on corpus-based analyses and distributed representations seem more promising [26] [29] [30], but so far they are limited to linguistic metaphors.
Another approach is to model the representation building process itself so that new representations can emerge through an interaction of concept networks and low-level object details that are available through sensory system or through imagination [7] [13]. This comes closest in spirit to the cognitive mechanisms underlying metaphor that we mentioned above in Sec. 2.5, for the creative insights emerge from applying a concept to an object (or a low-level representation of it) that is not habitually associated with it. In our earlier work, we have formalized this process [9] [12], and have applied it to model creativity in legal reasoning [10], but clearly much more work remains to be done. Moreover, in real-life, a number of different cognitive processes may act in consort to generate a creative insight, modeling of which may require hybrid architectures [19].
4 Conclusions and Future Research
We have articulated an account of cognition here in which cognition necessarily involves loss of some information. Creativity essentially lies in recovering some of this lost information, and metaphor play a fundamental role in this process. This, however, is a cognitively expensive operation. In many situations, such a novel perspective is not needed, so other problem-solving methods, including analogy, may be more efficient.
Following the ideas outlined in our earlier research [11], it is possible to build a number of computer-based creativity-support systems to reduce the cognitive load on the agent in generating novel ideas and perspectives, or to stimulate their imagination in coming up with more creative ideas. We have demonstrated this point in a story-telling system that was designed and implemented earlier [16]. Currently we are working on designing and implementing another system to retrieve and display pairs of pictures that are based on perceptual similarities but are conceptually very different, in order to stimulate the user’s creativity [15].
References
1. Bell, E.T.: Men of Mathematics. Simon & Schuster, New York (1937). 2. Bonnardel, N.: Towards Understanding and Supporting Creativity in Design: Analogies in a
Constrained Cognitive Environment. Knowledge-Based Systems 13, 505–513, (2000). 3. Chalmers, D.J., French, R.M., Hofstadter, D.R.: High-Level Perception, Representation, and
Analogy:A Critique of Artificial Intelligence Methodology. Journal of Experimental and Theoretical Artificial Intelligence 4 (3), 185–211, (1992).
4. de Bono, E.: New Think: The Use of Lateral Thinking in the Generation of New Ideas. Basic Books, New York (1975).
5. Fauconnier, G., Turner, M.: The Way We Think: Conceptual Blending and the Mind’s Hidden Complexities. Basic Books, New York (2002).
6. Gordon, W.J.J.: Synectics: The Development of Creative Capacity. Harper & Row, New York (1961).
7. Hofstadter, D., The Fluid Analogies Research Group: Fluid Concepts and Creative Analogies. Basic Books, New York (1995).
58

8. Hunter, D., Indurkhya, B.: ‘Don’t Think, but Look’: A Gestalt Interactionist Approach to Legal Thinking. Proceedings of the Workshop on Advances in Analogy Research, pp. 345–353. Sofia, Bulgaria (1998).
9. Indurkhya, B.: Metaphor and Cognition. Kluwer Academic Publishers, Dordrecht, The Netherlands (1992).
10. Indurkhya, B.: On Modeling Creativity in Legal Reasoning. In Proceedings of the Sixth International Conference on AI and Law, pp. 180-189. Melbourne, Australia (1997).
11. Indurkhya, B. Computers and Creativity. Expanded version of the keynote speech ‘On Modeling Mechanisms of Creativity’ delivered at Mind II: Computational Models of Creative Cognition, Dublin, Ireland (1997): http://www.iiit.ac.in/~bipin/
12. Indurkhya, B.: An Algebraic Approach to Modeling Creativity in Metaphor. In C.L. Nehaniv (ed.) Computation for Metaphors, Analogy and Agents. LNAI, Vol. 1562, pp. 292–306. Springer-Verlag, Berlin (1999).
13. Indurkhya, B.: Emergent representations, interaction theory, and the cognitive force of metaphor. New Ideas in Psychology 24(2), 133–162 (2006).
14. Indurkhya, B.: Rationality and reasoning with metaphors. New Ideas in Psychology 25(1), 16–36 (2007).
15. Indurkhya, B., Kattalay, K., Ojha, A., Tandon, P.: Experiments with a Creativity-Support System based on Perceptual Similarity. In H. Fujita and I. Zualkernan (eds.) New Trends in Software Methodologies, Tools and Techniques, pp. 316–327. IOS Press: Amsterdam (2008).
16. Ishii, Y., Indurkhya, B., Inui, N., Nose, T., Kotani, Y., Nishimura, H.: A System Based on Rodari’s ‘Estrangement’ Principle to Promote Creative Writing in Children. Proceedings of Ed-Media & Ed-Telecom 98, pp. 1685–1686, Freiburg, Germany (1998).
17. Kaufman, J.C., Beghetto, R.A.: Beyond Big and Little: The Four C Model of Creativity. Review of General Psychology 13(1), 1–12 (2009).
18. Koestler, A.: The Act of Creation. Hutchinsons, London (1964). 19. Nersessian, N.J., Chandrasekharan, S.: Hybrid Analogies in Conceptual Innovation in
Science. Cognitive Systems Research 10 (3), 178–188, (2009). 20. Okada, T., Yokochi, S., Ishibashi, K., Ueda, K.: Analogical Modification in the Creation of
Contemporary Art. Cognitive Systems Research 10 (3), 189–203, (2009). 21. Piaget, J.: The Origins of Intelligence in the Child (M. Cook, Trans.) Penguine, New York
(1977). (Original work published 1936). 22. Piaget, J.: Play, Dreams and Imitation in Childhood (C. Gattegno & F.M. Hodgson, Trans.)
W.W. Norton, New York (1962). (Original work published 1945). 23. Rodari, G.: The Grammar of Fantasy (J. Zipes, Trans.) Teachers & Writers Collaborative,
New York (1996). 24. Schön, D.A.: Displacement of Concepts. Humanities Press, New York (1963). 25. Sternberg, R.J.: Creating a Vision of Creativity: The First 25 Years, Psychology of
Aesthetics, Creativity, and the Arts, Vol. S (1), 2–12 (2006). 26. Sun, R.: A microfeature based approach towards metaphor interpretation. Proceedings of the
14th IJCAI, pp. 424–429. Morgan Kaufman, San Francisco (1995). 27. Teeven, K.M.: Origins of Promissory Estoppel: Justifiable Reliance and Commercial
Uncertainty Before Williston's Restatement. University of Memphis Law Review, Spring 2004.
28. Turbayne, C. M.: The Myth of Metaphor. University of South Carolina Press, Columbia (SC) (1970).
29. Veale, T.: Re-Representation and Creative Analogy: A Lexico-Semantic Perspective. New Generation Computing, 24 (3), 223-240 (2006).
30. Veale, T., Hao, Y.: A Fluid Knowledge Representation for� Understanding and Generating Creative Metaphors. Proceedings of COLING 2008, pp. 1–5. Manchester (2008).
31. Ward, T.B.: Creative Cognition as a Window on Creativity. Methods 42, 28–37 (2007).
59

Some Aspects of Analogical Reasoning in
Mathematical Creativity
Alison Pease, Markus Guhe, Alan Smaill
School of Informatics, University of Edinburgh,Informatics Forum, 10 Crichton Street, Edinburgh, EH8 9AB, UK
{A.Pease,M.Guhe,A.Smaill}@ed.ac.uk
http://homepages.inf.ed.ac.uk/apease/research/index.html
Abstract. Analogical reasoning can shed light on both of the two keyprocesses of creativity – generation and evaluation. Hence, it is a powerfultool for creativity. We illustrate this with three historical case studies ofcreative mathematical conjectures which were either found or evaluatedvia analogies. We conclude by describing our ongoing efforts to buildcomputational realisations of these ideas.
1 Introduction
Analogical reasoning is an essential aspect of creativity [2] and computationalrealisations such as [15; 20] have placed it firmly in the computational creativityarena. However, investigation into analogical reasoning has been largely carriedout in the context of problem solving in scientific or everyday domains. In par-ticular, very few historical case studies of analogy (excepting [16; 18]) and nocomputational representations that we know of are in the mathematics domain.There may be features that distinguish mathematics from other domains, suchas having a large number of objects as compared to relations, as opposed to do-mains typically studied by analogy researchers [18], and recent work in analogy[14] has suggested that current theories of analogical reasoning such as the struc-ture mapping theory may require some modification if they are to generalise tomathematics. This largely theoretical paper explores roles that analogical rea-soning has played in historical episodes of creativity in mathematics. Towardsthe end we also describe some computational aspects of our work.
2 A marriage of dimensions
Analogies between different geometrical dimensions, especially between two andthree dimensions, date back to Babylonian times and have been particularlyproductive [16, p. 26]. The discovery of the Descartes–Euler conjecture, thatfor any polyhedron, the number of vertices (V ) minus the number of edges
⋆ We are grateful to Alan Bundy for discussion on the continuity example in section4. This work was supported by EPSRC grant EP/F035594/1.
60

(E) plus the number of faces (F ) is equal to two is one such example: there arediffering accounts of its discovery, but both involve analogy at some level. Euler’sown account of his discovery suggests that analogy to two dimensional polygonshelped to guide his search for a problem: in a letter to Christian Goldbach, Nov1750 he wrote ... “there is no doubt that general theorems can be found forthem [solids], just as for plane rectilinear figures . . . ” (our italics). The simplerelationship that V = E for two dimensional shapes prompted a search for ananalogous relationship between edges, faces and vertices in three dimensionalsolids.
In Polya’s reconstruction of this discovery [16, pp. 35-41] he suggested thatthe analogy was introduced to evaluate, as opposed to generate the conjecture.He developed a technique for using analogies to evaluate a conjecture: given ana-logical mappings and conjectures, Polya suggested that we adjust the representa-tion in order to bring the relations closer [16, pp. 42-43]. In the Descartes–Eulerexample, the re-representation works by noting that vertices are 0D, edges 1D,faces 2D and polyhedron 3D, and then rewriting both conjectures in order of theincreasing dimensions. In the polygonal case, V = E then becomes V −E+1 = 1,and the polyhedral case V − E + F = 2 becomes V − E + F − 1 = 1. Thesetwo equations now look much more similar: in both of them the number of di-mensions starts at zero on the left hand side of the equation, increases by oneand has alternating signs. The right hand side is the same in both cases. Polyathen suggests that since the two relations are very close and the first relation,for polygons, is true, then we have reason to think that the second relation maybe true, and is therefore worthy of a serious proof effort.
3 An extremely daring conjecture
The Basel problem is the problem of finding the sum of the reciprocals of thesquares of the natural numbers, i.e. finding the exact value of the infinite series1 + 1
4+ 1
9+ 1
16+ 1
25+ 1
36+ . . .. In Euler’s time this was a well known and
difficult problem, thus in this example the initial problem already exists. Euler
used analogical reasoning to find his conjectured solution π2
6. To find this he
rearranged known facts about finite series and polynomials in order to drawan analogy between finite and infinite series, and then applied a rule aboutfinite series to infinite series, thus discovering what is referred to by Polya asan “extremely daring conjecture” [16, p. 18]. Euler then spent years evaluatingboth this conjecture and his analogous rule.
4 A split in the real continuum
Cauchy’s conjecture and proof that “the limit of any convergent series of con-tinuous functions is itself continuous” [3, p. 131] is another example in which arule for one area is analogously assumed to hold for another area. In this casethe source domain is series and the target limits, and the rule assumed to hold
61

is that “what is true up to the limit is true at the limit”. Lakatos [9, p. 128]states that throughout the eighteenth century this rule was assumed to hold andtherefore any proof deemed unnecessary. However, this example is complicated:Cauchy’s claim is generally regarded as obviously false, and the clarification ofwhat was wrong is usually taken to be part of the more rigorous formalisationof the calculus developed by Weierstrass, involving the invention of the conceptof uniform convergence.
This episode was treated by Lakatos in two different ways. Cauchy claimedthat the function defined by pointwise limits of continuous functions must becontinuous [3]. In fact, what we take to be counter-examples were already knownwhen Cauchy made his claim, as Lakatos points out in his earlier analysis ofthe evolution of ideas involved [9, Appendix 1]. After discussion with AbrahamRobinson, Lakatos then saw that there was an alternative analysis. Robinsonwas the founder of non-standard analysis, which found a way to rehabilitate talkof infinitesimals (for example, positive numbers greater than zero, but less thanany “standard” real number (see [17], first edition 1966). Lakatos’s alternativereading, presented in [10], is that Cauchy’s proof was correct, but that his notionof (real) number was different from that adopted by mainstream analysis to thisday. In analogy terminology, people who had different conceptions of the sourcedomain were critiquing the target domain which Cauchy developed.
5 Computational considerations
We are exploring these ideas computationally in two ways. Firstly, we are usingLakoff and Nunez’s notion of mathematical metaphor [11]. Lakoff and Nunezconsider that the different notions of “continuum” outlined in §4 correspond toa discretised Number-Line blend (in the case of the Dedekind-Weierstrass reals);a discretised line as the result of “Spaces are Sets of Points” metaphor, whereall the points on the line are represented (in the case where infinitesimals arepresent); or by a naturally continuous (physical) line [11, p. 288]. This approachprovides promising avenues for the understanding of the relationships betweenthe written representation of the mathematical theories, in this case mostly innatural language, the mathematical structures under consideration, and the ge-ometrical or physical notions that informed the mathematical development. Weare using the framework of Information Flow [1] to be more precise about whatconstitutes metaphors (and blends), by looking at the possible metaphorical re-lationships in terms of infomorphisms between domains. In [7; 8] we show howInformation Flow theory [1] can be used to formalise the basic metaphors forarithmetic that ground the notions in embodied human experience (groundingmetaphors). This gives us a form of implementation of aspects of the theoryevolution involved here. We are extending this to Fauconnier and Turner’s con-ceptual blending [4] and Goguen’s Unified Concept theory [6].
Secondly, Schwering et al. have developed a mathematically sound frame-work for analogy making and a symbolic analogy model; heuristic-driven theoryprojection (HDTP) [19]. Analogies are established via a generalisation of source
62

and target domain. Anti-unification is used to compare formulae of source andtarget for structural commonalities, then terms with a common generalisationare associated in the analogical mapping. HDTP matches functions and pred-icates with same and different labels as well matching formulae with differentstructure. In particular, one of its features is a mechanism for re-representing adomain in order to build an analogy. We are using this system to generate thedomain of basic arithmetic from Lakoff and Nunez’s four grounding metaphors.
6 Conclusions
Analogy was used in the first example to find, or generate a problem, for whichvalues could subsequently be conjectured. Also, importantly, it was used to aidevaluation (thus forming an essential tool in McGraw’s “central loop of creativ-ity” [13]). This is particularly interesting given that humans are not very goodat making judgements, particularly in historically creative domains, and is nota generally noted use of analogy. The importance of re-representation in orderto make a more convincing analogy, making sure that any preconditions for there-representation are satisfied is also clear in all of these examples. In our secondcase study the original problem, to find an exact value for the sum of the recipro-cals of the squares, was invented independently of the analogy which was used tosolve it. Euler then tested his application of the rule he used, and this rule itself,rather than the solution to the Basel problem, became the major contributionof Euler’s work in this area. The freedom with which one can apply a rule fromone domain to another depends on the extent to which the second domain hasalready been developed. In Euler’s time, while the modern mathematical con-cept of infinity was not developed, infinite series were an established concept,and thus Euler’s work with infinite series had to fit with the structure alreadydeveloped. In other examples, the target domain is much less developed and theanalogiser may be able to define the domain such that a desired rule holds. Ex-amples include the operations of addition/subtraction on the reals as analogousto multiplication/division: both are commutative and associative, both have anidentity (though a different one) and both admit an inverse operation. Alterna-tively, it may not be possible to define a target domain such that a particularrule from a source domain holds: in Hamilton’s development of quaternions hewanted to develop a new type of number which was analogous to complex num-bers but consisted of triples. He was unable to define multiplication on triples,but did discover a way of defining it for quadruples as i
2 = j2 = k
2 = ijk = −1.However, his multiplication was non-commutative, although it was still associa-tive and distributive. Another possibility is that an analogiser may actively wish
to create a target domain in which a rule from a source domain is broken. Oneexample is the development by Martınez [12] of a system in which the tradi-tional rule that (−1)(−1) = +1 is changed to (−1)(−1) = −1, resulting in a newmathematical system.
Focusing on analogy as a way of developing new mathematical ideas raisesquestions about how novel these ideas can be. By definition, an analogy-generated
63

idea must share some sort of similarity with another domain, familiar to the cre-ator. Thus the criterion of novelty, accepted as necessary for creative outputseems to be under threat. In this paper we leave aside such considerations: sincewe consider the examples we give to be both unambiguously creative and un-ambiguously based on analogy, it seems that any definition of novelty must notexclude analogy. We intend to address this question in a future paper.
Bibliography
[1] J. Barwise and J. Seligman. Information Flow: The logic of distributed systems.CUP, 1997.
[2] M. Boden. Computer models of creativity. AI Mag., 30(3):23–34, Fall Issue, 2009.[3] A. L. Cauchy. Cours d’Analyse de l’Ecole Polyechnique. de Bure, Paris, 1821.[4] Gilles Fauconnier and Mark Turner. The Way We Think: Conceptual blending
and the mind’s hidden complexities. Basic Books, New York, 2002.[5] D. Gentner. Structure-mapping: a theoretical framework for analogy. Cognitive
Science, (7):155–170, 1983.[6] Joseph Goguen. What is a concept? In F. Dau et al., editors, Conceptual Struc-
tures: Common Semantics for Sharing Knowledge, Vol. 3596, LNAI. Springer,2005.
[7] M. Guhe, A. Smaill, and A. Pease. A formal cognitive model of mathematicalmetaphors. In KI 2009: Advances in AI. 32nd Ann. German Conf. on AI, Ger-many, Sept., 2009, pages 323–330. LNAI 5803, Berlin, 2009. Springer.
[8] M. Guhe, A. Smaill, and A. Pease. Using information flow for modelling mathe-matical metaphors. In Proc. of the 9th Int. Conf. on Cognitive Modeling, 2009.
[9] I. Lakatos. Proofs and Refutations. Cambridge University Press, UK, 1976.[10] I. Lakatos. Cauchy and the continuum: the significance of non-standard analysis
for the history and philosophy of mathematics. In J. Worral and C. Currie, editors,Mathematics, science and epistemology, chapter 3, pages 43–60. CUP, UK, 1978.
[11] George Lakoff and Rafael Nunez. Where Mathematics Comes From: How theEmbodied Mind Brings Mathematics into Being. Basic Books, New York, 2000.
[12] A. A. Martınez. Negative Math: How Mathematical Rules Can Be Positively Bent.Princeton University Press, 2005.
[13] G. McGraw and D. Hofstadter. Perception and creation of diverse alphabeticstyles. AISBQ, (85):42–49, 1993.
[14] A. Pease, M. Guhe, and A. Smaill. Analogy formulation and modification ingeometry. In Proc. of the 2nd Int. Conf. on Analogy, pages 358–364, 2009.
[15] F. C. Pereira. Creativity and AI: A Conceptual Blending Approach. Applicationsof Cognitive Linguistics (ACL). Mouton de Gruyter, Berlin, December 2007.
[16] G. Polya. Mathematics and plausible reasoning (Vol. 1): Induction and analogy inmathematics. Princeton University Press, Princeton, USA, 1954.
[17] A. Robinson. Non-standard Analysis. Princeton University Press, Princeton, NewJersey, 1996. Revised Edition.
[18] D. Schlimm. Bridging theories with axioms: Boole, Stone, and Tarski. Perspectiveson Mathematical Practices, II, July, 2008.
[19] A. Schwering et al. Syntactic principles of heuristic-driven theory projection.Special Issue on Analogies - Integrating Cognitive Abilities in Journal of CognitiveSystems Research, 10(3):251–269, 2009.
[20] T. Veale. Re-representation and creative analogy: A lexico-semantic perspective.New Generation Computing, 24(3):pp. 223–240, 2006.
64

A Fractal Approach Towards Visual Analogy
Keith McGreggor, Maithilee Kunda & Ashok Goel
Design & Intelligence Laboratory, School of Interactive Computing,
Georgia Institute of Technology, Atlanta, GA 30332, USA
{keith.mcgreggor, mkunda}@gatech.edu, [email protected]
Abstract. We present a preliminary computational model of visual analogy that
uses fractal image representations that rely only on the grayscale pixel values of
input images, and are mathematical abstractions quite rigorously grounded in
the theory of fractal image compression. We have applied this model of visual
analogy to problems from the Raven’s Progressive Matrices intelligence test,
and we describe in detail the fractal solution strategy as well as some
preliminary results. Finally, we discuss the implications of using these fractal representations for memory recall and analogical reasoning.
1 Cognition, Computation, and Creativity
We may study creative behavior at many levels of aggregation and abstraction
ranging from environmental and genetic to neural and cognitive to social and cultural.
Our work on computational creativity focuses on the cognitive level. Although at
present there is little agreement in the cognitive sciences about the proper
characterization of creativity, nevertheless there is broad and deep consensus that
analogy is a core cognitive process of creative behavior, e.g. [1]–[8]. Indeed, some
cognitive scientists have argued that analogy is a core process not only of creativity,
but all cognition, including perception [6][9]. Thus, understanding the computational
processes of analogy seems critical to understanding and developing computational
models of creativity.
We may classify computational theories of analogy into two broad categories. In
one category are theories that propose general-purpose mechanisms for mapping and
transfer of relations from one problem to another, e.g. production systems [10],
structure mapping [11][12], schema induction [13], and constraint satisfaction [14].
These mechanism theories typically make few commitments about the contents of
knowledge; indeed, their mechanisms are general-purpose because they are agnostic
towards knowledge contents. In the other category are computational theories that
describe contents of knowledge that drive analogies in creative tasks such as story
understanding [15], diagram understanding [16][17], scientific problem solving
[18][19], innovative design [20][21][22], and calligraphy [23]. These content theories
of analogy, too, describe computational processes, but their processes are driven by
the contents of knowledge (and corresponding vocabularies for capturing the
knowledge contents). The extant content and mechanism computational theories of
analogy nevertheless are united in their use of propositional representations: From
65

the perspective of the content theories of analogy, the mechanism theories offer
potential substrates for computational implementation.
We present a preliminary computational theory of visual analogy that is
fundamentally different from both content and mechanism theories because it uses
fractal representations instead of propositional ones. Visual analogy is a topic of
longstanding interest in computational creativity because of its central role in many
creative tasks such as intelligence tests [24]. In particular, in this paper, we focus on
geometric analogy problems that are a type of visual analogy problems: geometric
analogy problems focus solely on shapes, sizes and locations of the shapes, and
spatial relations among the shapes. Fractal image representations rely only on the
grayscale pixel values of input images, and are mathematical abstractions quite
rigorously grounded in the theory of fractal image compression [25].
Below, first we describe how fractal representations can be used for computing
features and similarity among distinct images, and how these operations can be
combined to form a technique for creating visual analogies using purely pictorial
inputs. Second, we present initial experimental results from using this method on
geometric analogy problems that occur on the standardized intelligence test called the
Raven’s Progressive Matrices test [26]. Third, we discuss how this fractal model of
visual analogy may be considered to be a mechanism for creativity.
2 Fractal Image Representation
Consider the general form of an analogy problem as:
A : B :: C : ?
In the case of a visual analogy, we can present each of these analogy elements to be a
single image. Some unknown transformation T can be said to transform image A into
image B, and likewise, some unknown transformation T' transforms image C into the
unknown answer image.
The central analogy in the problem may then be imagined as requiring that T is
analogous to T'. In other words, the answer will be whichever image D yields the
most analogous transformation. Using fractal representations, we shall define the
most analogous transform T' as that which shares the largest number of fractal
features with the original transform T.
2.1 Mathematical Basis
The mathematical derivation of fractal image representation expressly depends upon
the notion of real world images, i.e. images that are two dimensional and continuous
[25]. A key observation is that all naturally occurring images we perceive appear to
have similar, repeating patterns. Another observation is that no matter how closely
you examine the real world, you find instances of similar structures and repeating
patterns. These observations suggest that it is possible to describe the real world in
66

terms other than those of shapes or traditional graphical elements—in particular,
terms which capture the observed similarity and repetition alone.
Computationally, to determine the fractal representation of an image requires the
use of the fractal encoding algorithm. The collage theorem [25] at the heart of the
fractal encoding algorithm can be stated concisely:
For any particular real world image D, there exists a finite set of affine
transformations T which, if applied repeatedly and indefinitely to any other real
world image S, will result in the convergence of S into D.
We now shall present the fractal encoding algorithm in detail.
2.2 The Fractal Encoding Algorithm
Given an image D, the fractal encoding algorithm seeks to discover the set of
transformations T. The algorithm is considered “fractal” for two reasons: first, the
affine transformations chosen are generally contractive, which leads to convergence,
and second, the convergence of S into D can be shown to be the mathematical
equivalent of considering D to be an attractor [25].
Here are the general steps for encoding an image D in terms of another image S:
1) Decompose D into a set of N smaller images {d1, d2, d3, ..., dn}. These individual
images are sets of points.
2) For each image di:
a) Examine the entire source image S for an equivalent image si such that an
affine transformation of si will result in di. This affine transformation will be
a 3x3 matrix, as the points within si and di under consideration can be
represented as the 3-D vector <x, y, c> where c is the (grayscale) color of
the 2-D point <x,y>. Collect all such transforms into a set of candidates C.
b) Select from the set of candidates that transform which most minimally
achieves its work, according to some predetermined and consistent metric.
c) Let Ti be the representation of the chosen affine transformation of si into di.
3) The set T = {T1, T2, T3, ..., Tn} is the fractal encoding of the image D.
The decomposition of D into smaller images can be achieved through a variety of
methods. In our present implementation, we merely choose to subdivide D in a
regular, gridded fashion, typically choosing a grid size of either 8x8 or 32x32 pixels.
Alternate decompositions could include irregular subdivisions, partitioning according
to some inherent colorimetric basis, or levels of detail.
2.3 Searching and Encoding
The search of the source image S for a matching fragment is exhaustive, in that each
possible correspondence si is considered regardless of its prior use in other discovered
transforms. Also, for each potential correspondence, each transformation under a
67

restricted set of affine, similitude transformations is considered. Our implementation
presently examines each potential under identity (I), horizontal (HF) and vertical (VF)
reflections, and 90° (R90), 180° (R180), and 270° (R270) rotational transformations.
The metric we employ to evaluate candidate transformations prefers those
transformations which induce the least translation, rotation or reflection, and color
manipulation. We use this to ensure that areas which are aligned in a Cartesian sense
are chosen. We shall revisit this important metric in a later section.
Once a transformation has been chosen, we construct a compact representation of
it, called a fractal code. A fractal code Ti is a 3-tuple, < <sx, sy>, <dx, dy>, k, c >,
where <sx, sy> is the location of the leftmost and topmost pixel in si; <dx, dy> is the
location of the leftmost and topmost pixel in di; k ∈ { I, HF, VF, R90, R180, R270 }
indicates which affine transformation is to be used; and c ∈ [ -255, 255 ] indicates the
overall color shift to be added uniformly to all elements in the block.
Note that the choice of source image S is arbitrary. Indeed, the image D can be
fractally encoded in terms of itself, by substituting D for S in the algorithm. Although
one might expect that this substitution would result in a trivial encoding (wherein all
of the chosen fractal codes correspond to an identity transform), in practice this is not
the case, for we want a fractal encoding of D to converge upon D regardless of chosen
initial image. For this reason, the size of source fragments considered is taken to be
twice the dimensional size of the destination fragment, resulting in a contractive
affine transform. Similarly, color shifts are made to contract.
The fractal encoding algorithm, while computationally expensive in its exhaustive
search, transforms a real world image into a much smaller set of fractal codes, which
form, in essence, an instruction set for reconstituting the image. This resulting fractal
representation of an image D vis-à-vis another given image forms the basis of our
investigation into solutions for visual analogy problems.
2.4 Determining Fractal Features
As we have shown, the fractal representation of an image is a set of specific affine,
similitude transformations, a set of fractal codes, which compactly describe the
geometric alteration and colorization of fragments of the source image that will
collage to form the destination image. While it is tempting to treat contiguous subsets
of these fractal codes as features, we note that their derivation does not follow strictly
Cartesian notions (e.g. adjacent material in the destination might arise from strongly
non-adjacent source material). Accordingly, we consider each of these fractal codes
independently, and construct candidate fractal features from individual codes.
In our present implementation, each fractal code < <sx, sy>, <dx, dy>, k, c > yields
a small set of features, generally formed by constructing subsets of the tuple:
< <sx, sy>, <dx, dy>, k, c >: a specific feature;
< < dx - sx, dy - sy >, k, c >: a position agnostic feature;
< <sx, sy>, <dx, dy>, c >: an affine transform agnostic feature;
< <sx, sy>, <dx, dy>, k >: a color agnostic feature;
< k, c >: an affine specific feature;
< c >: a color shift specific feature.
68

As shown, the features derived may be categorized into either specific or agnostic
aspects. Our implementation of the fractal encoding algorithm employs a metric
which minimizes the transformative work (either geometrically or colorimetrically)
expressly due to our desire to exploit specific feature matches.
With this basis of fractal representation and feature discovery, we now may address
the problem of visual analogy.
2.5 A Fractal Process of Visual Analogy
To find analogous transforms, our algorithm first visits memory to retrieve a set of
candidate solution images D to form candidate solution pairs in the form <C, D>.
For each candidate pair of images, we generate the fractal encoding of the candidate
image D in terms of the former image C. As we illustrated earlier, from this encoding
we are able to generate a large number of fractal features per transform. We store
each transform into a memory system, indexed by and recallable via each associated
fractal feature.
To determine which of the candidate images has resulted in the most analogous
transform to the original problem transform T, we first fractally encode that
relationship between the two images A and B. Next, using each fractal feature
associated with that encoding, we retrieve from the memory system those transforms
previously stored as correlates of that feature (if any). Considering the frequency of
the transforms recalled, for all correlated features in the target transform, we then
calculate a measure of similarity.
This metric reflects similarity as a comparison of the number of fractal features
shared between candidate pairs taken in contrast to the joint number of fractal features
found in each pair member [27]. In our present implementation, the measure of
similarity S between the candidate transform T' and the target transform T is
calculated using the following formula, also known as the ratio model:
S(T, T') = f(T ∩ T') / [ f(T ∩ T') + α f(T - T') + β f(T' - T) ]
where f(X) is the number of features in the set X. For our initial work, we have
chosen values of α = β = 1.0, which, according to [27], results in this simplification:
S(T, T') = f(T ∩ T') / f(T ∪ T')
The final solution is taken as the candidate image from memory that results in the
highest measured similarity according to this measure.
3 The Raven’s Progressive Matrices Test
In this section, we describe the Raven’s Progressive Matrices test and present some
preliminary results for a solution algorithm that uses the fractal algorithm for visual
analogy described in the previous section.
69

The Raven’s Progressive Matrices (RPM) test is a standardized intelligence test
that consists of visually presented, geometric-analogy-like problems in which a
matrix of geometric figures is presented with one entry missing, and the correct
missing entry must be selected from a set of answer choices. Figure 1 shows an
example of a problem that is similar to one of the problems in the Standard
Progressive Matrices (SPM).
Fig. 1. Example problem similar to one in the Standard Progressive Matrices (SPM) test.
Although the test is supposed to measure only eductive ability, or the ability to
extract and understand information from a complex situation [26], the RPM’s high
level of correlation with other multi-domain intelligence tests have given it a position
of centrality in the space of psychometric measures [28], and it is therefore often used
as a test of general intelligence.
Despite its widespread use, neither the computational nor the cognitive
characteristics of the process of solving the RPM are well understood. Hunt gives a
theoretical account of the information processing demands of certain problems from
the Advanced Progressive Matrices (APM), in which he proposes two qualitatively
different solution algorithms—“Gestalt,” which uses visual representations and
perceptually based operations, and “Analytic,” which uses feature-based
representations and logical operations [29].
Existing AI systems for problem solving on the RPM, in contrast to Hunt’s early
work, use propositional representations [30][31]. Carpenter, Just, and Shell describe
a computational model that simulates solving RPM problems using propositional
representations [30]. Their model is based on the traditional production system
architecture, with a long-term memory containing a set of productions and a working
memory containing the current state of problem solving (e.g. current goals).
Productions are based on the relations among the entities in a RPM problem, for
example, the location of the dark component in a row, which might be the top half in
the top row of a problem, bottom-half in the bottom row, and so on. Lovett, Forbus,
and Usher describe a model that extracts qualitative spatial representations from
70

visually segmented representations of RPM problem inputs and then uses the
technique of structure mapping to find solutions [31]. While, as we mentioned
earlier, production systems and structure mapping offer alternative mechanisms for
implementing content theories of analogies, from the perspective of our work on
fractal representations, the two are similar in that both use propositional
representations.
3.1 Preliminary Results from the Fractal Method of Visual Analogy
A RPM problem can be viewed as a sequence of images (ordered in rows and
columns), where some unknown transformation T can be said to transform one image
into a corresponding adjacent image. In a typical 2x2 RPM problem, there are four
such transformations, as shown in Figure 2. (RPM problems can also have three-by-
three matrices, which we do not address in this paper.)
Fig. 2. Illustration of four image transformations implicit in a 2x2 RPM problem matrix.
RPM problems are formulated to suggest that these transformations are pairwise
analogous (i.e. the two row transformations are analogous to one another). A 2x2
RPM problem generally has six candidate solutions presented. Following the
algorithm for visual analogy described above, we seek to solve an RPM problem by
determining which of the candidate solutions yields the most analogous
transformations. In particular, we perform the recall and similarity calculation
described in Section 2.3 independently over all row and column relationships present
in the RPM problem. The final solution is taken as the candidate that results in the
highest measured similarity for any such relationships.
As an example, we shall use the “arrow” problem shown in Figure 3. Also, while
the complete fractal method examines each of the problem’s analogies, we shall
restrict this detailed discussion to just one of these transformations (T1, as labeled in
Figure 2).
The initial transformation T1 is the fractal encoding of the transformation from the
upper left arrow into the upper right arrow. When encoded using a block size of 32 x
32 pixels, this encoding generates 39 distinct fractal features.
Each candidate answer is encoded likewise, from the upper left arrow into the
candidate, each resulting in between 27 and 45 distinct features. For the arrow
problem, using a 32 x 32 block size, the similarity measures for each answer Ci are:
71

S(T,C1) = 21 / (21+18+24) ≅ 0.333333
S(T,C2) = 15 / (15+24+30) ≅ 0.217391
S(T,C3) = 16 / (16+23+11) ≅ 0.32
S(T,C4) = 14 / (14+25+29) ≅ 0.205882
The answer with the highest calculated similarity is deemed correct. Therefore, the
fractal method chooses as its answer #1.
Fig. 3. The “arrow” problem, in the format of a 2x2 problem matrix with four answer choices.
4 Implications of Fractal Representations for Analogical
Reasoning and Memory Recall
Benoit Mandelbrot coined the term “fractal” from the Latin adjective fractus and its
corresponding verb (frangere, which means “to break” into irregular fragments), in
response to his observation that shapes previously referred to as “grainy, hydralike, in
between, pimply, pocky, ramified, seaweedy, strange, tangled, tortuous, wiggly,
wispy, wrinkled, and the like” could be described by a set of compact, rigorous rules
for their production [32]. The approach we outline in this paper seeks to define a
class of visual representations in a similar, fractal manner, where images are taken as
encountered and transformed into a fractal representation either with regard to other
images or to themselves.
The very nature of this fractal representation places an immediate emphasis on
similarity discovery. These discoveries are used to advantage in solving problems
that place equivalent emphasis on visual analogy, such as the Raven’s Progressive
Matrices test. While the use of fractal representation is important, the emphasis upon
visual recall in our solution afforded by features derived from those representations
bears further discussion.
The importance of individual discovered features presents itself strongly in our
calculation of the similarity metric from [27]. The weights α and β may be skewed
toward or away from equality in order to favor feature inclusion or exclusion. We
note that while a 2x2 RPM problem offers little opportunity for determining feature
72

importance, the class of RPM problems which are 3x3 in nature require it, for the
additional row and column provide an in-domain manner in which to report visual
evidence for the kinds of features to expect within the eventual successful candidate.
Using this additional evidence would allow for the weights of feature inclusion (α)
and exclusion (β) to become covariant with features. We are actively exploring this
as we prosecute solutions for 3x3 RPM problems.
We take the position that placing candidate transformations into memory, indexed
via those discovered fractal features, affords a new method of discovering image
similarity. Indeed, this method of solving the RPM, by being reminded of similar
transformations, bears close kinship to various methods and theories of case-based
reasoning [33], although we exploit recalled transformations toward a significantly
different end. That images, encoded either in terms of themselves or other images,
may be indexed and retrieved without regard to shape, geometry, or symbol, suggests
that the fractal representation bears further exploration not only as regards solutions to
problems akin to the RPM, but also to those of general visual recall and analogy
based creativity.
Acknowledgments. This research has been supported by an NSF grant (IIS Award
#0534266) entitled “Multimodal Case-Based Reasoning in Modeling and Design,” by
ONR through an NDSEG fellowship, and by the NSF GRFP fellowship program.
References
1. Christensen, B. T., & Schunn, C. D. The relationship of analogical distance to analogical function and pre-inventive structure: The case of engineering design. Memory &
Cognition, 35(1), 29-38. (2007)
2. Clement, J. Creative Model Construction in Scientists and Students: The Role of Imagery, Analogy, and Mental Simulation. Dordrecht: Springer. (2008)
3. Darden, L. (ed). Reasoning in Biological Discoveries. Cambridge University Press. (2006)
4. Dunbar, K. The Analogical Paradox. In Gentner, D., Holyoak, K.J., & Kokinov, B.N. (Eds.) The Analogical Mind: Perspectives from Cognitive Science, MIT Press. (2001)
5. Goel, A. K. Design, Analogy, and Creativity. IEEE Expert 12(3): 62-70. (1997) 6. Hofstadter, D. Godel, Escher, Bach: An Eternal Golden Braid. NY: Basic Books. (1979)
7. Holyoak, K., & Thagard, P. Mental Leaps: Analogy in Creative Thought. Cambridge, MA: MIT Press. (1995)
8. Nersessian, N.J. Creating Scientific Concepts. Cambridge, MA: MIT Press. (2008) 9. Hofstadter, D. (editor). Fluid Concepts and Creative Analogies: Computer Models of the
Fundamental Mechanisms of Thought. NY: Basic Books. (1995)
10. Anderson, J.R., & Thompson, R. Use of Analogy in a Production System Architecture. In Vosniadou, S. & Ortony, A. (Eds.), Similarity and analogical reasoning, pp. 267-297,
London: Cambridge University Press. (1989)
11. Gentner, D. Structure Mapping. Cognitive Science, 7: 155-170. (1983) 12. Falkenhainer, B., Forbus, K., and Gentner, D. The Structure-Mapping Engine: Algorithms
and Examples. Artificial Intelligence, 41-1:63. (1989)
13. Gick, M., & Holyoak, K.J. Schema Induction and Analogical Transfer. Cognitive Psychology, 15(1):1-38. (1983)
73

14. Holyoak, K., & Thagard, P. Analogical Mapping by Constraint Satisfaction. Cognitive Science, 13: 295-355. (1989)
15. Winston, P. Learning & Reasoning by Analogy. CACM, 23(12): 689-703. (1979) 16. Gross, M., & Do, E. Drawing on the Back of an Envelope. Computer Graphics and
Applications. (2000)
17. Yaner, P., & Goel, A.K. Understanding Drawings by Compositional Analogy. In Proc. International Joint Conference on Artificial Intelligence (IJCAI-2007), Hyderabad, India.
January 2007, pp. 1131-1137. (2007)
18. Davies, J., Nersessian, N., & Goel, A.K. Visual Models in Analogical Problem Solving. Foundations of Science, 10(1):133-152, 2005. (2005)
19. Griffith, T., Nersessian, N.. & Goel, A.K. Function-follows-Form: Generative Modeling in Scientific Reasoning. In Proc. 22nd Cognitive Science Conference. (2000)
20. Casakin, H., & Goldschmidt, G. Expertise and the Use of Visual Analogy: Implications for Design Education. Design Studies, 20(2): 153-179, 1999.
21. Goel, A. K., & Bhatta, S. Use of Design Patterns in Analogy-Based Design. Advanced Engineering Informatics, 18(2):85-94. (2004)
22. Davies, J., Goel, A.K. & Nersessian, N. A Computational Model of Visual Analogies in Design. Cognitive Systems Research, 10:205-215. (2009)
23. Hofstadter, D., & MacGraw, G. LetterSpirit. In Fluid Concepts and Creative Analogies, Hofstadter (editor), NY: Basic Books. (1995)
24. Evans, T. G. A program for the solution of a class of geometric-analogy intelligence-test questions. Semantic Information Processing, pp. 271–353, MIT Press. (1968)
25. Barnsley, M. F., & Hurd, L. P. Fractal Image Compression. Boston: A. K. Peters. (1992) 26. Raven, J., Raven, J.C., & Court, J. H. Manual for Raven's Progressive Matrices and
Vocabulary Scales, General Overview. San Antonio, TX: Harcourt Assessment. (1998)
27. Tversky, A. Features of similarity. Psychological Review 84 (4): 327-352. (1977)
28. Snow, R., Kyllonen, P., & Marshalek, B. The topography of ability and learning correlations. In Sternberg, R. ed. Advances in the Psychology of Human Intelligence 2: 47-103. Hillsdale, NJ: Erlbaum. (1984)
29. Hunt, E. Quote the raven? Nevermore! In Gregg, L. W. ed. Knowledge and cognition, 129–158. Hillsdale, NJ: Erlbaum. (1974)
30. Carpenter, P. A., Just, M. A., & Shell, P. What one intelligence test measures: A theoretical account of the processing in the Raven Progressive Matrices Test.
Psychological Review 97 (3): 404-431. (1990)
31. Lovett, A., Forbus, K., & Usher, J. Analogy with qualitative spatial representations can simulate solving Raven’s Progressive Matrices. In Proc. 29th Annual Conference of the
Cognitive Science Society, 449-454. (2007)
32. Mandelbrot, B. The Fractal Geometry of Nature. San Francisco: W.H. Freeman. (1982) 33. Kolodner, J.L. Case-Based Reasoning. CA: Morgan Kaufmann Publishers. (1993)
74

Towards Analogy-Based Story Generation
Jichen Zhu1 and Santiago Ontanon2
1 Department of Digital Media, University of Central Florida12461 Research Parkway Suite 500
Orlando, FL, USA [email protected]
2 IIIA, Artificial Intelligence Research InstituteCSIC, Spanish Council for Scientific Research
Campus UAB, 08193 Bellaterra, [email protected]
Abstract. Narrative is one of the oldest creative forms, capable of de-picting a wide spectrum of human conditions. However, many existingstories generated by planning-based computational narrative systems areconfined to the goal-driven, problem-solving aesthetics. This paper fo-cuses on analogy-based story generation. Informed by narratology andcomputational analogy, we present an analytical framework to surveythis area in order to identify trends and areas that have not received suf-ficient attention. Finally, we introduce the new developments of the Riuproject as a case study for possible new narrative aesthetics supportedby analogy.
1 Introduction
Computational narrative explores the age-old creative form of storytelling byalgorithmically analyzing, understanding, and most importantly, generating sto-ries. Despite the progress in the area, current computer-generated stories arestill aesthetically limited compared to traditional narratives. In both plot-centricand character-centric approaches for story generation, the widely used planningparadigm has a strong impact on these stories’ goal-driven, problem-solving aes-thetics.
In order to broaden the range of computer generated narratives, this paperanalyzes the relatively under-explored area of story generation using computa-tional analogy. Recent developments in cognitive science demonstrate the impor-tance of analogy as a powerful cognitive faculty to make sense of the world [5, 10]as well as an effective literary tool to enhance such understandings through nar-ratives [30]. Compared to the large body of planning-based work, significantlyfewer endeavors have been spent on analogy. We argue that analogy is a promis-ing direction towards novel narrative forms and aesthetics that planning-basedapproaches cannot provide. More broadly, our focus on analogy is aligned withGelernter’s account on computational creativity, in which analogy functions asthe crucial link between “high focus” analytical cognitive activities and “lowfocus” ones connected through shared emotions [9].
75

Drawn from narratology and computational analogy, we propose an analyti-cal framework to identify different key aspects of analogy-based story generationand systematically classify existing systems accordingly. We will also discuss theimpact of these aspects (e.g. representation formalism) on the aesthetics of po-tential analogy-generated stories. The purpose of our overview is to recognizeexisting trends and the unexplored areas in this relatively new area of research.In this paper, we adopt a broad definition of analogy to include not only classiccomputational analogy techniques, but also other related areas, such as case-based reasoning (CBR) [1], conceptual blending theory [5, 6], and metaphortheory [18]. Finally, we will introduce the primary results of our Riu project asa case study for analogy-based computational narrative systems.
In the remainder of this paper, Section 2 describes our motivation from thevantage point of aesthetics and narratology. Section 3 presents a brief intro-duction of computational analogy. Based on Chatman’s narratology, Section 4presents our framework of three dimensions of analgy-based story generationand classifies existing systems. Section 5 illustrates our approach through a casestudy of the new developments of the Riu project. Finally, Section 6 summarizesthe paper and future research directions.
2 Aesthetics and Computer-Generated Narrative
Interactive narratives carry the prospect of a fully fledged medium with similarlevels of breath and depth as traditional media of storytelling [24, 27]. However,the current state of computer-generated stories, a crucial component of inter-active narrative, is still far from this goal. In spite of the accomplishments ofplanning-based approaches, the stories they generate often fall into a very smallrange of narrative aesthetics. We are not simply referring to how polished thefinal writing style is. Instead, our primary concern is the built-in narrative affor-dances and constraints of specific architectures in relation to the type of storiesthey generate.
On the one hand, planning’s ability to specify the desired final state givesauthors tremendous amount of control over the story. On the other hand, itsintrinsic goal-driven, problem-solving operations place an unmistakable stampon the generated stories. One of the most salient examples of such planning-based aesthetics is Meehan’s 1976 system Tale-Spin, whose style is still influentialamong many recent systems. Below is an excerpt of a story generated by Tale-Spin:
Joe Bear was hungry. He asked Irving Bird where some honey was. Irvingrefused to tell him, so Joe offered to bring him a worm if he’d tell himwhere some honey was. Irving agreed. But Joe didn’t know where anyworms were, so he asked Irving, who refused to say. So Joe offered tobring him a worm if he’d tell him where a worm was...[22, p.129]
Certainly, the stories generated by modern planning-based systems have be-come much more complex and other non-planning approaches have been devel-
76

oped, some of which will be discussed in Section 4.2. For example, the Visual-Daydreamer system explores very different non-verbal narrative aesthetics usinganimated abstract visual symbols whose actions are emotionally connected [25].However, our intention here is to systematically survey this relatively unexploredarea of computer analogy-based story generation and identify promising new di-rections that may broaden the aesthetic range of computational narratives. Asone of such directions, our Riu system explores sequencing narrative elementsby their associations with similar events, a literary technique famously experi-mented in stream of consciousness literature to depict human subjectivity [17].
3 Computational Analogy
Computational models of analogy operate by identifying similarities and trans-ferring knowledge between a source domain S and a target domain T. Thisprocess is divided by Hall [12] into four stages: 1) recognition of a candidateanalogous source, S, 2) elaboration of an analogical mapping between source do-main S and target domain T, 3) evaluation of the mapping and inferences, and4) consolidation of the outcome of the analogy for other contexts (i.e. learning).The intuitive assumption behind analogy is that if two domains are similar incertain key aspects, they are likely to be similar in other aspects.
Existing analogy systems can be classified into three classes based on theirunderlying architecture [8]. Symbolic models (e.g., ANALOGY [3] and the Struc-ture Mapping Engine [4]), heavily rely on the concepts of symbols, logics, plan-ning, search, means-ends analysis, etc. from the “symbolic AI paradigm.” Con-nectionist models (e.g., ACME [15], LISA [16], and CAB [19]), on the otherhand, adopt the connectionist framework of nodes, weights, spreading activa-tions, etc. Finally, the hybrid models (e.g., COPYCAT [23], TABLETOP [7]and LETTER-SPIRIT [21]) blend elements from the previous two classes.
4 Analogy in Story Generation
Although several analogy-based systems have been developed to generate stories,there has not been any serious attempt to thoroughly and systematically iden-tify different possibilities of analogy-based story generation. In order to betterunderstand the area, this section presents a new analytical framework to classifydifferent systems with the goal of presenting a clear picture of the current stateand identify the areas that have not received sufficient attention.
4.1 Analytical Framework
In this section, we propose three dimensions to classify the landscape of analogy-based story generation: 1) the scope of analogy, 2) the specific technique ofcomputational analogy, and 3) the story representation formalism.
The first dimension uses narratology theory to identify the scope of analogy— the level at which analogy is used in a narrative. In the widely accepted
77

Narrative
Story
Discourse
Events
Existents
Actions
Happenings
Characters
Setting
Fig. 1. Chatman’s Taxonomy of Narrative Components [2, p.19].
theory of Chatman [2] (Figure 1), a narrative can be divided into two parts: thestory and the discourse3. A story is composed of events and existents, each ofwhich can be further divided into actions and happenings, and characters andsettings respectively. Finally, discourse is the ways in which a story is narrated4.As the narrative progresses, these different elements may affect one another. Forinstance, events can affect existents.
Based on Chatman’s taxonomy, we are able to locate the level at whichanalogy is performed, i.e. its scope. Our description below is organized from thelocal to the global scale:
Events: analogy can be used to map individual events (including characteractions and happenings) from S to T. Analogy at this level focuses on trans-ferring only events and/or the structure of multiple events, without takingexistents into account.
Existents: existents can be fairly complicated structures. For instance, a char-acter may have background, personality, and relations. If we partially specifya character in T, the rest of the character traits may be automatically de-fined by drawing analogy from another character in S, given that a stronganalogical mapping can be found between them.
Story: analogy at the story level takes both events and existents into consider-ation as a whole. For instance, analogy at this level can map one completescene (including existents and sequences of events) in S to another in T.
Discourse: analogy at the discourse level focuses on mapping discursive strate-gies, regardless of the story content.
Narrative: analogy at the complete narrative level considers story and dis-course as a whole. Analogy at this global level is useful to identify globalstructural similarities, such as “explaining past experiences using flash-backs,”which can only be captured when considering story and discourse together.
It is worthwhile to stress that certain analogies at a more global narrativelevel cannot be achieved by performing analogy at its child levels separately. For
3 Some authors also use the terms of fable and sjuzet to represent a similar division.4 In Chatman’s terminology, what we conventionally call story generation is actually
narrative generation as it includes both story and dicourse.
78

System Scope Technique Representation
Riedl & Leon’s [26] story CAB - generation planning-based
PRINCE [14] existents analogy - identification WordNet
GRIOT [13] / MRM [35] existents Conceptual Blending logical clauses
Minstrel [31] story CBR Rhapsody
ProtoPropp [11] story CBR OWL
Virtual Storyteller [28] story CBR planning-based
MEXICA [33] existents engagement/reflection relationship graphsTable 1. Classification of Existing Analogy-Based Story Generation Systems.
instance, analogies at the entire story level may not be found at either the eventsor existents levels alone.
The second dimension is the computational analogy method used by a sys-tem. As mentioned before, we also include related areas such as CBR, con-ceptual blending and metaphor theory in our definition of analogy. We furtherdifferentiate the purpose of analogy as identification from generation. Identifica-tion involves only generating an analogical mapping for identifying similaritiesamong two domains. Such similarities can be exploited later for story generationby other techniques, as shown in Section 4.2. By contrast, generation involvestransferring inferences (knowledge) from S to T after completing the analogicalmapping, i.e. analogy itself is used for story generation. From our survey of ex-isting systems, most CBR-based systems only create mappings between S and Tto assess similarity, and use other techniques for story generation. Hence, theyfall into the identification category. This is because traditionally CBR techniquesseparate case retrieval (where similarity is used) from case reuse (where solutionsare generated).
The third dimension is the system’s story representation formalism. Differentstory representation formalisms afford analogical transfers at different levels, andhence allow different computational analogy methods to be applied. Magerko [20]distinguishes three types of approaches to represent stories: planning languages(which emphasize causality and structure), modular languages (which emphasizethe content of the story without focusing on the temporal relations among theelements), and finally hybrid languages. If someone is interested in analogy-basedgeneration at the story level, then modular languages (such as plot points, beats)will not be adequate, since those languages do not specify a story structure. Onthe contrary, such languages represent the useful information to work at theindividual events and the existents level.
4.2 Classification of Existing Systems
The above framework can help us to classify existing analogy-based story gen-eration systems, and more importantly, identify trends and unexplored areas.Table 1 shows the analysis of various systems using the above three dimensions.The first column is the name of the system, if any; the second column shows
79

the level at which analogy is made (notice that this might be different from thelevel at which the system generates narrative components); next is the partic-ular analogy technique used; finally, the last column shows the particular storyrepresentation formalism used for analogy.
Among the systems that adopt classic computational analogy, Riedl andLeon’s system [26] combines analogy and planning. It uses analogy as the maingenerative method and uses planning to fill in the gaps in the analogy-generatedcontent. The system performs analogy at the story level using the CAB algorithm[19] and uses a representation consisting of planning operators. The PRINCEsystem [14] uses analogy to generate metaphors and enrich the story by explain-ing a story existent in the domain T using its equivalent in S. In this case,analogy is used for identification, and a secondary method for generating localmetaphors for the overall narration.
GRIOT [13] and the Memory, Reverie Machine (MRM) system [35], the latteris built on GRIOT, use the ALLOY conceptual blending algorithm to generateaffective blends in the generated output, poetry in the case of GRIOT and nar-rative text in the case of MRM.
Several systems use a case-based reasoning (CBR) approach, including Min-strel [31], ProtoPropp [11] and the Virtual Storyteller [28]. All of these threesystems perform mappings at the story level for story generation. These CBRsystems possess a case base of previously authored stories. When a system needsto generate a story satisfying certain constraints, one of the stories in the casebase satisfying the maximum number of such constraints is retrieved, and lateradapted if necessary through some adaptation mechanism. Reminiscent of CBR,MEXICA [33] performs mapping at the existents level in order to generate sto-ries using an engagement/reflection cycle (also used in the Visual Daydreamer[25]). In particular, MEXICA represents the current state of the story as a graph,where each node is a character and each link represents their relation (e.g., “love”and “hate”). MEXICA maps the current state to the states in the pre-authoredmemories and retrieves the most similar one for the next action.
Based on Table 1, we can see that despite of their uses of different analogymethods and story representations, all systems perform analogy at the storyor existents level. No attempts to date have been spent on performing anal-ogy solely at the events level, solely at the discourse level, or at the completenarrative level. These are some promising lines of future research, even thoughanalogy at the narrative level may require considerably large structures to rep-resent it. Moreover, the systems discussed in this section extend the range ofaesthetic possibilities by generating stories beyond what is achievable by plan-ning approaches.
5 A Case Study: Riu
Riu is a text-based interactive system that explores the same story-world asMemory, Reverie Machine (MRM) [34, 35]. Compared to MRM which was de-veloped on the framework of Harrell’s conceptual-blending-based GRIOT system
80
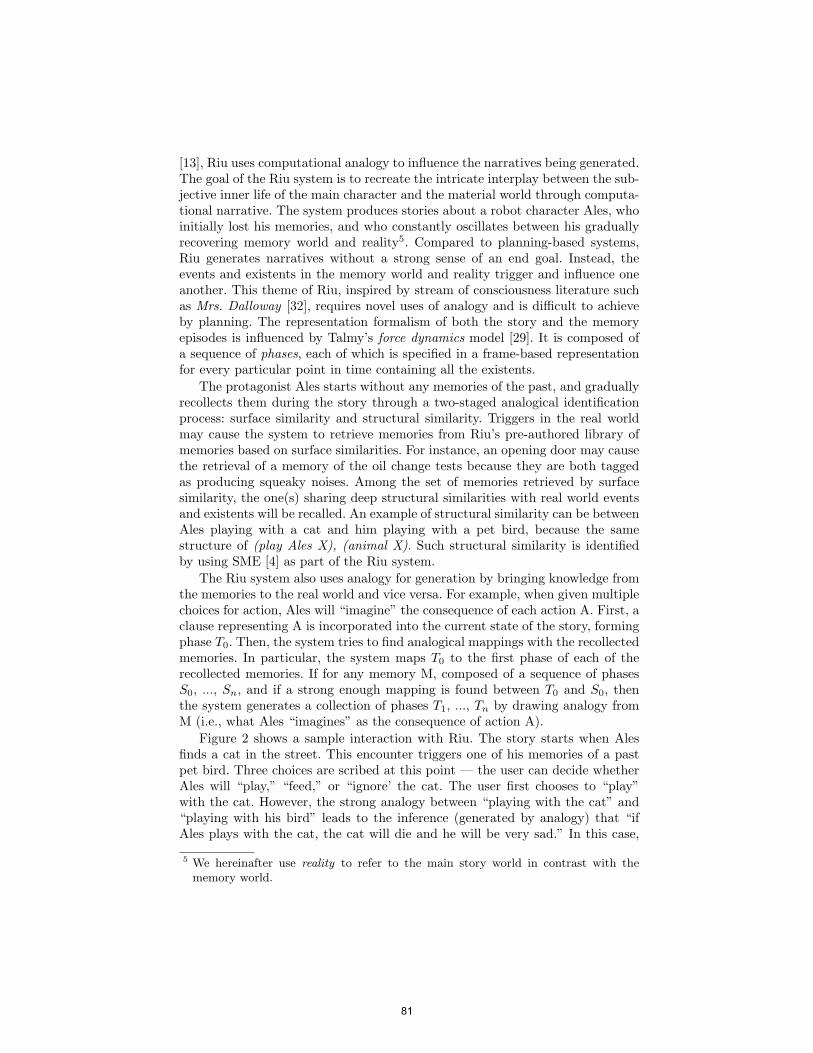
[13], Riu uses computational analogy to influence the narratives being generated.The goal of the Riu system is to recreate the intricate interplay between the sub-jective inner life of the main character and the material world through computa-tional narrative. The system produces stories about a robot character Ales, whoinitially lost his memories, and who constantly oscillates between his graduallyrecovering memory world and reality5. Compared to planning-based systems,Riu generates narratives without a strong sense of an end goal. Instead, theevents and existents in the memory world and reality trigger and influence oneanother. This theme of Riu, inspired by stream of consciousness literature suchas Mrs. Dalloway [32], requires novel uses of analogy and is difficult to achieveby planning. The representation formalism of both the story and the memoryepisodes is influenced by Talmy’s force dynamics model [29]. It is composed ofa sequence of phases, each of which is specified in a frame-based representationfor every particular point in time containing all the existents.
The protagonist Ales starts without any memories of the past, and graduallyrecollects them during the story through a two-staged analogical identificationprocess: surface similarity and structural similarity. Triggers in the real worldmay cause the system to retrieve memories from Riu’s pre-authored library ofmemories based on surface similarities. For instance, an opening door may causethe retrieval of a memory of the oil change tests because they are both taggedas producing squeaky noises. Among the set of memories retrieved by surfacesimilarity, the one(s) sharing deep structural similarities with real world eventsand existents will be recalled. An example of structural similarity can be betweenAles playing with a cat and him playing with a pet bird, because the samestructure of (play Ales X), (animal X). Such structural similarity is identifiedby using SME [4] as part of the Riu system.
The Riu system also uses analogy for generation by bringing knowledge fromthe memories to the real world and vice versa. For example, when given multiplechoices for action, Ales will “imagine” the consequence of each action A. First, aclause representing A is incorporated into the current state of the story, formingphase T0. Then, the system tries to find analogical mappings with the recollectedmemories. In particular, the system maps T0 to the first phase of each of therecollected memories. If for any memory M, composed of a sequence of phasesS0, ..., Sn, and if a strong enough mapping is found between T0 and S0, thenthe system generates a collection of phases T1, ..., Tn by drawing analogy fromM (i.e., what Ales “imagines” as the consequence of action A).
Figure 2 shows a sample interaction with Riu. The story starts when Alesfinds a cat in the street. This encounter triggers one of his memories of a pastpet bird. Three choices are scribed at this point — the user can decide whetherAles will “play,” “feed,” or “ignore’ the cat. The user first chooses to “play”with the cat. However, the strong analogy between “playing with the cat” and“playing with his bird” leads to the inference (generated by analogy) that “ifAles plays with the cat, the cat will die and he will be very sad.” In this case,
5 We hereinafter use reality to refer to the main story world in contrast with thememory world.
81

Ales was walking on the street.
when he saw a cat in front of him.
When he was young, Ales used to have a bird.
Ales was so fond of it that he played with it day after day.
One day the bird died, leaving ALES very sad.
Ales hesitated for what to do with the cat.
(FEED IGNORE PLAY)
> play
No, I do not want the cat to die..., Ales thought.
(FEED IGNORE)
> feed
Ales took some food from his bag and gave it to the cat.
Fig. 2. An excerpt of User Interaction with Riu.
the “cat” in T0 is mapped to “bird” in S0, and all appearances of “bird” aresubstituted by “cat” in the generation of T1 from S1. Such mappings are appliednot only to individual existents such as “cat,” but also to relations and actions.In the resulting T1, the cat is dead and ales is sad, and hence Ales refuses toplay with the cat. The story then continues after the user selects “feed” for thesecond time. This simplistic imagination of Ales would be hard to generate usinga rational planning approach.
6 Conclusions and Future Directions
In this paper, we have systematically explored the idea of generating storiesusing computational analogy. Although planning-based techniques have beenproven fruitful, analogy offers new narrative possibilities as a complement to theaesthetically goal-driven stories generated by planning.
Drawing from narratology and computational analogy, we have presented ananalytical framework consisting of three dimensions — narrative scope, analogytechnique, and story representation — and used it to classify existing systems ofanalogy-based story generation. As a result, we have identified the trends of exist-ing work and, importantly, areas requiring more attention. For instance, analogyat the level of solely discourse, solely events, and the complete narrative levelhave not been explored. We have also seen that although the story representa-tion formalism used plays a key role on enabling certain types of analogies, littleeffort is put into theorizing their effects on different story generation systems.Additionally, we have presented a case study of the Riu system. The project notonly explores new techniques of integrating analogy, but also demonstrates thepotential of a new kind of narrative aesthetics.
Based on our analysis, we propose several interesting future lines of research.First, most work on analogy has focused on the story and existents level. Webelieve that the reason is that these two narrative elements are relatively easyto represent using planning-based or frame-based representations. In addition,
82

analogy may be applied to the unexplored scopes. Some potential theoreticalproblems is how to represent discourse in ways which are amenable to analogy.
Second, the impact of story representation formalisms (e.g., plot-point based,beat based, and planning-based) on analogy and essentially story aestheticsneeds to be further studied. Different representations afford different uses ofanalogy, and imbue certain narrative aesthetics.
Third, analogy has been used for both generation purposes and identificationpurposes. Using analogy for identification purposes is interesting since it enablesthe development of hybrid story generation systems, which can combine analogywith planning or with other generative techniques. An exploration of the possi-bilities to create such hybrids and how such hybridizations affect the generativepossibilities and the resulting aesthetics is also a promising future research line.
Finally, the goal-driven aesthetics of planning-generated stories is well known.Similarly, what is the complete range of aesthetic affordances of analogy? Webelieve the exploration of such questions may help us identify new generativetechniques beyond planning and analogy.
References
[1] Agnar Aamodt and Enric Plaza. Case-based reasoning: Foundational issues,methodological variations, and system approaches. Artificial Intelligence Com-munications, 7(1):39–59, 1994.
[2] Seymour Chatman. Story and Discourse: Narrative Structure in Fiction and Film.Cornell University Press, June 1978.
[3] Thomas G. Evans. A program for the solution of a class of geometric-analogyintelligence-test questions. In Semantic Information Processing. MIT Press, Cam-bridge, MA, 1968.
[4] Brian Falkenhainer, Kenneth D. Forbus, and Dedre Gentner. The structure-mapping engine: Algorithm and examples. Artificial Intelligence, 41:1–63, 1989.
[5] Gilles Fauconnier. Conceptual blending and analogy. In Dedre Gentner, Keith J.Holyoak, and Boicho N. Kokino, editors, The Analogical Mind: Perspectives fromCognitive Science. MIT Press, Cambridge, MA, 2001.
[6] Gilles Fauconnier and Mark Turner. The Way We Think: Conceptual Blendingand the Mind’s Hidden Complexities. Basic Books, New York, NY, 2002.
[7] Robert M. French. The subtlety of sameness: a theory and computer model ofanalogy-making. MIT Press, Cambridge, 1995.
[8] Robert M. French. The computational modeling of analogy-making. Trends inCognitive Sciences, 6(5):200–205, 2002.
[9] David Gelernter. The Muse in the Machine. Free Press, New York, 1994.[10] Dedre Gentner, Keith J. Holyoak, and Boicho N. Kokinov. The Analogical Mind:
Perspectives from Cognitive Science. MIT Press, Cambridge, 2001.[11] Pablo Gervas, Belen Dıaz-Agudo, Federico Peinado, and Raquel Hervas. Story
plot generation based on cbr. Journal of Knowledge-Based Systems, 18(4-5):235–242, 2005.
[12] Rogers P. Hall. Computational approaches to analogical reasoning: a comparativeanalysis. Artif. Intell., 39(1):39–120, 1989.
[13] D. Fox Harrell. Theory and Technology for Computational Narrative: An Approachto Generative and Interactive Narrative with Bases in Algebraic Semiotics andCognitive Linguistics. Dissertation, University of California, San Diego, 2007.
83
[14] Raquel Hervas, Rui P. Costa, Hugo Costa, Pablo Gervas, and Francisco C. Pereira.Enrichment of automatically generated texts using metaphor. In MICAI, pages944–954, 2007.
[15] Keith J. Holyoak and Paul Thagard. Analogical mapping by constraint satisfac-tion. Cognitive Science, 13:295–355, 1989.
[16] John E. Hummel and Keith J. Holyoak. Distributed representations of structure:A theory of analogical access and mapping. Psychological Review, 104:427–466,1997.
[17] Robert Humphrey. Stream of Consciousness in the Modern Novel. Perspectivesin Criticism. University of California Press, Berkeley and os Angeles, 1954.
[18] George Lakoff and Mark Johnson. Metaphors We Live By. University of ChicagoPress, Chicago, 1980.
[19] Levi B. Larkey and Bradley C. Love. Cab: Connectionist analogy builder. Cog-nitive Science, 27(5):781–794, 2003.
[20] Brian Magerko. A comparative analysis of story representations for interactivenarrative systems. In Jonathan Schaeffer and Michael Mateas, editors, AIIDE,pages 91–94. The AAAI Press, 2007.
[21] Gary E. McGraw, Jr. Letter spirit (part one): emergent high-level perception ofletters using fluid concepts. PhD thesis, Indiana University, 1995.
[22] James Meehan. The Metanovel: Writing Stories by Computer. Ph.d., Yale Uni-versity, 1976.
[23] Melanie Mitchell. COPYCAT: A Computer Model of High-level Perception andConceptual Slippage in Analogy-making. PhD thesis, University of Michigan, 1990.
[24] Janet H. Murray. Hamlet on the Holodeck: The Future of Narrative in Cyberspace.The MIT Press, Cambridge, 1998.
[25] Rafael Perez y Perez, Ricardo Sosa, and Christian Lemaitre. A computer modelfor visual-daydreaming. In AAAI Fall Symposium on Intelligent Narrative Tech-nologies, Washington D.C., 2007. AAAI Press.
[26] Mark Riedl and Carlos Leon. Generating story analogues. In AIIDE 2009. TheAAAI Press, 2009.
[27] Marie-Laure Ryan. Narrative as Virtual Reality: Immersion and Interactivityin Literature and Electronic Media. Johns Hopkins University Press, Baltimore,2003.
[28] I.M.T. Swartjes, J.A.F. Vromen, and N.E. Bloom. Narrative inspiration: Usingcase based problem solving for emergent story generation. In A. Cardoso andG.A. Wiggins, editors, Proceedings of the Fourth International Joint Workshopon Computational Creativity, pages 21–28, London, June 2007. Goldsmiths, Uni-versity of London.
[29] Leonard Talmy. Force dynamics in language und cognition. Cognitive Science,12(1):49–100, 1988.
[30] Mark Turner. The Literary Mind: The Origins of Thought and Language. OxfordUP, New York; Oxford, 1996.
[31] Scott R. Turner. Minstrel: a computer model of creativity and storytelling. PhDthesis, University of California at Los Angeles, Los Angeles, CA, USA, 1993.
[32] Virginia Woolf. Mrs. Dalloway. Harcourt, 2002 (1925).[33] Rafael Perez y Perez and Mike Sharples. Mexica: A computer model of a cognitive
account of creative writing. J. Exp. Theor. Artif. Intell., 13(2):119–139, 2001.[34] Jichen Zhu. Intentional Systems and the Artificial Intelligence (AI) Hermeneutic
Network: Agency and Intentionality in Expressive Computational Systems. PhDthesis, Georgia Institute of Technology, 2009.
[35] Jichen Zhu and D. Fox Harrell. Daydreaming with intention: Scalable blending-based imagining and agency in generative interactive narrative. In AAAI 2008Spring Symposium on Creative Intelligent Systems, pages 156–162, Stanford, CA,2008. AAAI Press.
84

Story Generation Driven by System-ModifiedEvaluation Validated by Human Judges?
Pablo Gervás1 and Carlos León2
1 Instituto de Tecnología del [email protected]
2 Departamento de Ingeniería del Software e Inteligencia [email protected]
Abstract. Building systems which can transform their own generationprocesses can lead to the creation of novel high quality artefacts. Inthis paper a solution based on evaluation is proposed. The generationprocess is driven by evaluation rules which can be modified by the system.A panel of human evaluators provides feedback on the quality of theartifacts resulting after each modification. The system keeps track ofwhich rules have been applied in the selection of each artifact, and learnsindirectly from the human judges which modifications to retain based onthe relative ratings of the artifacts. Relevant details and difficulties ofthis approach are discussed.
1 Introduction
Societies of human creators are driven by two basic activities: creation of newartifacts (as performed by artists) and evaluation of newly created artifacts (asperformed by artists and/or critics). Most of the efforts at modelling humancreativity in computational terms in the past have focused on the task of cre-ating artifacts. There are two strong arguments in favour of shifting the focustowards evaluation. First, developing models or algorithms for producing ar-tifacts of a given kind tends to produce good/recognisable/typical artifacts ofthat type, rather than creative new ones. Innovation requires both departurefrom established procedures and the means for identifying when new results aregood. Second, generate and test approaches constitute a simple computationalway of rephrasing the task of creating artifacts in terms of the task of evaluatingthem. Very simple enumerative procedures for traversing a search space mayyield surprisingly good results if driven by an appropriate evaluation function.
If such a shift is taken to an extreme, the enumeration of the valid alter-natives would not need to be altered in search for new artifacts, it would beenough to modify the evaluation function to obtain new candidate elements.Under this approach, the task of modifying creative procedures to obtain newartifacts would take the form of modifying the evaluation function.? Research funded by the MICINN (GALANTE: TIN2006-14433-C02-01), UCM, Co-munidad de Madrid (IVERNAO: CCG08-UCM/TIC-4300) and by BSCH-UCM.
85

In societies of human creators the development of an evaluation function(usually understood as artistic sensibility or equivalent abilities) is recognisedas a fundamental requirement in the learning process of creative individuals.This learning process almost always takes the form of having instances of goodartifacts pointed out.
This paper describes a system that outputs new artifacts obtained by ex-ploring a restricted conceptual space under the guidance of a set of evaluationrules. The conceptual space to explore is that of sequences of events that maybe understood as stories. The exploration procedure is exhaustive enumerationof the search space. The system starts off from an initial set of evaluation rulesfor selecting new artifacts as the conceptual space is explored. A method foractively modifying the set of evaluation rules is provided. Modifications of theevaluation rules lead to new artifacts. The system learns which of the modifiedrules to retain from the responses of a panel of human evaluators that act asaudience for its production of new artifacts.
2 Previous Work
Boden [1,2] divides creativity into exploratory creativity (exploring the com-mon possibilities for creating artefacts) and transformational creativity (chang-ing these common rules to find really new and valid objects).
Jennings [3] hypothesizes that societies create the evaluation criteria of cre-ativity in the individual’s mind, thus leveraging the concept of creativity to aplace beyond pure inner processes. As such, creativity is learned and taught be-tween individuals, and their relationships and the opinions that each one hasabout another have a strong influence on the ideas about the quality or noveltyof artifacts. Autonomous creativity is the ability to change one’s own standardswithout explicit direction from the outside. According to Jennings, autonomouscreativity in humans is achieved through social interaction
Ritchie [4] identifies the role of humans in Computational Creativity to bestill very necessary, given the current state of the art. In his model, it is stated therole of humans must be clearly established before putting them in the generationloop. It is also hypothesized that human actions in the system should never bedirectly related to the generative objective of the system.
Wiggins [5,6] defines a formalization of Computational Creativity processesin terms of their relation with classic Artificial Intelligence and the characteristicsthat separate pure exploration processes from those typically and only presentin Computational Creativity. In his formalization, several sets are identified: U ,the universe of concepts, containing the whole set of artefacts; the conceptualspaces C0 · · ·Cn, which are strict subsets of U , among others. Three functionsare also important to mention: R, which establishes the constraints that definethe conceptual space of valid results, T , which is the function that transversesthis conceptual space and sets an order on the identification of artefacts in theCi set constrained by R, and E , the function for evaluating artifacts.
86

3 Story Generation Based on Evaluation
The domain of story generation has been chosen to illustrate the ideas in thispaper because it deals with artifacts that are easy to represent symbolically, arelinear in nature, and, at a certain level of abstraction, their complete conceptualspace may be specified by definition in terms of combinations of their constituentelements. Some of these points are sketched briefly below.
In terms of Wiggins’ model, the simplest approach for a generation systemthat explicitly performs evaluation on the stories it generates could be the defi-nition of the E function (Eg at this level) and a basic generative strategy whichwould generate all possible stories in the conceptual space. The generative strat-egy, corresponding to Wiggins T function (Tg at this level), could be carried outby a simple backtracking generation in which each step adds a new event to thestory (which therefore, after several steps in that branch, creates a whole story)and then backtracks to test another generative branch. Given a certain set ofterminals like verbs, character names, places and valid time values, for instance,events in the form subject–verb–arguments can be easily generated. The sto-ries can be considered to be sequences of events in the form {e1, e2, · · · , en}(where events would be conceptual statements corresponding to sentences like“Robert went to the park”).
The evaluation function (Eg) would output a real value in the interval [−1, 1],−1 being a “very bad” story and 1 being a wonderful one. A value of 0 wouldrepresent a plain, normal story, acceptable but not “good”. Thus we could obtaina total order for stories in which any threshold in the [−1, 1] range could be usedto differentiate interesting stories (those falling above the threshold) from non-interesting ones. The Eg function could be composed of rules whose structurecould be formed by a set of preconditions (π) considering the current partialevaluation and the current state of the story and a set of effects (ε) that theapplication of those rules have on the final evaluation. Then, a very simpleevaluator would process the story events iteratively, checking the preconditionsand applying the postconditions , in such a way that the state of the evaluator(the partial set of variables that form the evaluation) is progressively updatedfor each processed event.
3.1 Evaluation-Driven Story Generation
The original definition of the T function given by Wiggins modelled the oper-ation of identifying the next element in the conceptual space to be considered.Under a certain interpretation, this could be understood to refer to the actualconstruction process followed by the creative system to obtain its next result. Inthis case, the range of the T function defines system output. However, under adifferent interpretation, the T function would be the procedure for constructingthe next element to be considered by the evaluation function E . As some ofthe candidates proposed by the T function will be rejected by the evaluationfunction E , system output in this case is defined by the interaction between the
87

T and the E functions. In this paper we consider this second interpretation.Modifications of the E function will therefore control system output.
For the purposes of this paper, plain random modification of the rules canbe considered. More refined solutions may be considered. However, the systemshould not rely on the quality of any particular method of transformation. Atthis new level, we will also shift the responsibility for obtaining acceptable resultsto the evaluation process, in this case, the evaluation of effects of the modifiedrules. For this higher level evaluation we resort to a panel of judges.
3.2 Social Interaction Between Humans and Computers forControlling Transformation
The human judges that evaluate stories are asked to produce plain values whichare decided when reading stories. For every generated story, a single numericvalue in the range [−1, 1] could be received from humans reading a story, aslong as the variable to be obtained is clearly defined and it is just dependent onhuman criteria regarding stories.
The proposed method for evaluating stories involves checking the available setof evaluation rules against each story. Only some of these rules will have theirpreconditions met, and therefore be applied to contribute to the final ratingthat the system assigns to the story. For every story S that is finally selected assystem output, a record is kept of which evaluation rules contributed to establishits internal rating: the particular subset of the evaluation rules (the FS set) thatcontributed to its being selected as output.
By combining this record with the evaluations obtained from the humanjudges, each rule in this subset FS could be assigned the rating that humansassigned to the story S. In this way, rules would receive several ratings comingfrom humans indirectly. This could be used, for instance, to keep the rules thatproduce good stories and discard rules creating bad stories according to humanevaluation.
4 Discussion and Further Development
It is important to consider to what extent the autonomy of such a system wouldbe compromised by the role played by the human judges. Ritchie points out[7] the need to keep humans isolated from the final objective of the system.In the present case, this corresponds to ensuring that the human participantsplay no direct role in the actual generation of the stories. At a more specificlevel, since the system is transforming evaluation rules, the human judges mustnot directly add knowledge concerning transformation of rules. In the describedset up, human judges do not at any stage come into contact with the set ofevaluation rules or the method used for transforming them. This constitutes acertain safeguard of system autonomy.
Another aspect to take into account is whether the role played by the humanjudges in the proposed system could be seen to be modelling real phenomena
88

that occur in human creativity. We believe that it emulates closely the roleplayed by critics and teachers in the formation of the creative capabilities ofhuman creators. Along these lines, improvements to the present proposal couldbe contemplated. According to Jennings [3], the influence that external individ-uals have on generators depends on the relation between the generators and theevaluators. Issues like past agreement or mutual admiration may play a signifi-cant role in tempering actual feedback. For instance, it might be interesting toconsider whether the learning process of the system might be refined by givingpriority to the opinions of judges that have awarded good ratings in the past.
The proposed solution would be inefficient. Although the system might ex-plore candidate artifacts at a fast rate, and transform evaluation rules at speed,it relies on a stage of feedback from human judges that would take time (for anumber of stories to be read and evaluated by the judges). The system wouldhave to undergo a learning process equivalent to that of human storywritersreceiving feedback from knowledgeable mentors.
The current proposal restricts system output to a very specific conceptualspace, and all system operations, whatever transformations are applied to theevaluation rules and whatever feedback is received from the judges, cannot leadto outputs beyond that conceptual space. In that sense, it could only aspireto be considered creative in an exploratory manner. Nonetheless, the system isexplicitly transforming its own procedures in a search for better valued arti-facts. This aspect of creative professions, the continuous search for improvementthrough modification of the procedures, has yet to be addressed in the computa-tional creativity literature. The present proposal constitutes a first step in thisdirection.
References
1. Boden, M.: Creative Mind: Myths and Mechanisms. Routledge, New York, NY,10001 (2003)
2. Boden, M.: Computational models of creativity. Handbook of Creativity (1999)351–373
3. Jennings, K.: Developing creativity. Artificial Barriers in Artificial Intelligence. In:Proceedings of International Joint Workshop on Computational Creativity. (2008)
4. Ritchie, G.: Some Empirical Criteria for Attributing Creativity to a ComputerProgram. Minds & Machines 17 (2007) 67–99
5. Wiggins, G.: Searching for Computational Creativity. New Generation Computing,Computational Paradigms and Computational Intelligence. Special Issue: Compu-tational Creativity 24(3) (2006) 209–222
6. Wiggins, G.: A preliminary framework for description, analysis and comparison ofcreative systems. Knowledge-Based Systems 19(7) (2006)
7. Ritchie, G.: Uninformed Resource Creation for Humour Simluation. In: Proceed-ings of the 5th International Joint Workshop on Computational Creativity, Madrid(2008) 147–151
89

MEXICA-Impro: a Computational Model for Narrative Improvisation
Rafael Pérez y Pérez, Santiago Negrete, Eduardo Peñalosa, Rafael Ávila, Vicente Castellanos, Christian Lemaitre
División de Ciencias de la Comunicación y Diseño Universidad Autónoma Metropolitana - Unidad Cuajimalpa
México { rperez, snegrete, eduardop, ravila, vcastellanos,
clemaitre}@correo.cua.uam.mx
Abstract. This paper describes a system that dynamically generate narratives through improvisation. MEXICA-impro is based on a cognitive account of the creative process called engagement-reflection. Its architecture defines a framework where two agents participate in a simulated improvisation session to generate the plot of a story in which each one draws knowledge from two different databases representing cultural backgrounds. A worked example is explained in detail to show how this approach produces novel stories that could not be generated before.
1 Introduction
Storytelling has a relatively long history in computational creativity research. Some well known models of storytelling include: TALESPIN (Meehan 1981), MINSTREL (Turner 1994), FABULIST (Riedl 2004). Improvisation is a means by which creativity can be exercised in storytelling. Two or more participants (agents) intervene in a session where each contributes pieces of stories that are combined with those of the others as time passes, until a whole story is constructed. The intervention of each individual agent in the process, with a certain degree of unexpectedness and a personal point of view, makes the whole process interesting and different from a creative process where only one agent participates.
Once several agents participate in a process where their beliefs (rules) are tested by exposure to those of other agents, we enter the realm of social interaction. Here, the notion of creativity acquires a new meaning, namely the creative process is seen as a social process where a cultural clash might result in something new for both originators. The interaction among computational agents represents a metaphor of the processes of communication in a socio-cultural context, given that, when under controlled observation and with clear parameters, we can shed light on the understanding that characterizes the starting up of human systems of meaning.
90

Social cognition processes have an especially important role in a model such as MEXICA-Impro. We identify some important components of this kind influencing the collaborative improvisation of narratives. We consider three important elements of social cognition in our model: 1) communication resources, including the understanding of symbolic systems such as languages and key meanings facilitating mutual comprehension (Clark & Brennan, 1991); 2) availability of pieces of knowledge shared by agents, such as concepts, principles, procedures or strategies, conforming a convergent (shared) knowledge base in the agents’ minds (Jeong & Chi, 2007), and 3) multiple perspectives, including an amount of divergent knowledge pieces (not shared by agents), leading to flexible ways of analyzing the same phenomena.
In a creative collaborative goal such as constructing narratives, the agents: first, interact and generate a common ground, or mutual understanding space, while directing their efforts to achieve a common goal; second, in order to construct new stories, they rely on their common knowledge base, which should contain the minimal knowledge schemas or mental models to allow discussing the topics under analysis; and finally, according to cognitive flexibility theory (Scott, 1962), they make associations from multiple representations of the same information, such as their own representations compared to other agent’s ideas of the same phenomenon, a process allowing the mental scaffolding necessary to consider novel applications of knowledge, or the emergence of new ideas.
There needs to be a balance between what both agents know (common knowledge) and what they know individually (unique knowledge) to construct creative stories: when both agents’ knowledge bases share an important amount of knowledge pieces, the plots generated by both agents are very similar; otherwise, when agents have an important amount of divergent pieces of knowledge, plots generated by both agents would be completely different (Jeong & Chi, 2007).
2 MEXICA-impro: a computer model of narrative improvisation
Mexica (Pérez y Pérez & Sharples 2001, 2004) is a computational model of plot generation on top of which our system is built. It was inspired by the engagement-reflection (E-R) cognitive account of writing as creative design (Sharples 1999). So, MEXICA-impro is a computer model of narrative improvisation. It is formed by two mexica agents working together to develop as a team a story plot. Agent 1 is also called the leader, and agent 2 is also called the follower. The leader starts the improvisation and decides when it finishes (although in future versions both should be able to decide when to finish). The leader generates material through one complete E-R cycle and then cues the follower to continue the narrative. Then the follower takes the material generated so far and progress the story through one complete E-R cycle and then cues the leader to continue the narrative, and so on.
Each agent in MEXICA-impro is formed by two main modules: the construction of knowledge structures (the K-S module) and the generation of plots through engagement-reflection cycles (the E-R module). The K-S module takes as input two text files defined by the user: a dictionary of valid story-actions and a set of
91

stories known as Previous Stories. The dictionary of story-actions includes the names of all actions that can be performed by a character within a narrative along with a list of preconditions and post conditions for each. The Previous Stories are sequences of story actions that represent well-formed narratives. With this information the system builds its knowledge base with structures known as atoms. Atoms represent (in terms of emotional links and tensions between characters) potential situations that can happen in the story-world and have associated a set of possible actions to be performed when that situation occurs. For example, an atom might represent the situation where a knight is in love with the princess, and it might have associated the action “the knight buys flowers to the princess” as a possible action to be performed by the lover. In MEXICA-impro each agent has different story-actions and/or different set of previous stories. Thus, the same situation might lead each agent to perform different actions.
The E-R module takes two main inputs: the knowledge-base and an initial story-action provided by the user of the system (e. g., the princess heals jaguar knight) that sets in motion the E-R cycle. During engagement, an agent generates sequences of actions guided by rhetorical and content constraints; during reflection, the agent breaks impasses, evaluates, and, if necessary, modifies the material generated so far. It works as follows: the system starts in engagement; the post conditions of the initial action are triggered, generating a story-world context; the story-world context is employed as cue to probe memory and match an atom; then, the system retrieves the actions associated to the atom, selects one at random and updates the story-world context; After that, the engagement cycle starts again; the system attempts to match an atom that is equal to the current story-world context; if it fails the agent looks for an atom that is similar to the current story-world context; after generating three actions (this number can be modified by the user), the system switches to reflection. During reflection the system verifies that all actions’ preconditions are satisfied; if it is necessary, the agent inserts actions to satisfy them; then, it evaluates the material generated so far. At this point, a E-R cycle ends.
3 Generating narratives via improvisation
The MEXICA-impro project has an important goal: the stories generated by the collaborative agents cannot be developed by any one of them alone. If, furthermore, the story produced by the collaborative agents cannot be found within their knowledge bases, we refer to it as a collectively-creative story. Collectively-creative narratives are produced by providing each of our agents with different computational representations of culture, experience (knowledge-base) and personality. Let us elaborate this idea. For example, when one talks about knowledge bases in the context of the MEXICA-impro project, it is possible to describe at least three possible situations. The first one has to do with providing both agents with the same knowledge base. In this case the stories generated by them cannot be classified as collectively-creative because each agent can develop the same story alone. The second one consists of providing both agents with completely different knowledge bases. In this case we might be able to produce collectively-creative stories; however,
92

there is a high risk that our agents cannot progress the story as a team due to the lack of shared experiences. The third possibility involves providing both agents with partially different knowledge bases. In this case, we expect to produce collectively-creative stories through a fluid collaboration between agents. This is the case we are interested in. In this paper we report some tests that we have performed employing partially different knowledge-bases. There are several issues related to dissimilar knowledge bases that should be discussed: how the dissimilarity between two knowledge bases can be measured? What is the best ratio similarity/dissimilarity between two knowledge bases to generate the best collectively-creative stories? And so on. However, due to space limitations, in this document we focus exclusively on explaining the core characteristics of our examples.
As explained earlier, the knowledge base is built from the dictionary of story-actions and the set of previous stories. For this example, both agents employ the same actions; only the previous stories are different. From now onwards, the file of previous stories of agent 1 will be referred to as PH1 and the file of previous stories of agent 2 will be referred to as PH2. PH1 includes seven previous stories; PH2 includes six previous stories. Each story in PH1 shares a similar plot with at least one story in PH2. Sometimes they are very similar and sometimes they only share few elements.
Tensions between characters
0 1 2 3 4 5 6 7 8
0 1-0
1 1-1-(2) 1-0 1-0-(1)
2 2-2-(1) 1-2 1-1 1-0 1-1
3 1-2-(1) 3-1 2-1 0-1 0-1 1-0 1-0
4 1-0 2-2 3-4 2-0 0-1 1-1 0-1 0-1 0-1
5 0-1 0-2(1) 0-2 2-3 1-0 1-0 0-1
6 0-1 0-3 1-0 0-1-(1) 1-2
7 1-1 1-0 1-0 0-1 0-1 0-1
8 1-0 0-1 (1) (1) 1-0 1-0 1-0
Em
otio
nal L
inks
Figure 1. Partial map of atoms. The first digit in each cell indicates the numbers of atoms in the knowledge base of agent 1; the second digit indicates the numbers of atoms in the knowledge base of agent 2; numbers in parentheses indicate the shared atoms.
For example, story four in PH1 and story three in PH2 only differ in their first action; the rest of the actions and the characters participating in the story are alike. However, story one in PH1 only shares few actions with story 1 in PH2. The knowledge bases built from PH1 and PH2 are partially represented in figure 1(for reasons of space we only show half of the map). This map allows comparing each
93

agent’s atoms in terms of the number of components it has. All atoms are comprised by emotional links and tensions between characters (see Pérez y Pérez 2007 for details on how atoms are built). The horizontal axis indicates the number of tensions and the vertical axis indicates the number of emotional links that each atom contains. Each entrance in the map has figures that indicate the number of atoms in that position. The first digit in each cell indicates the number of atoms that belong to the knowledge base of agent 1; the second digit in each cell indicates the number of atoms that belongs to the knowledge base of agent 2; numbers in parentheses indicate those atoms that are equal in both knowledge bases. For example, the position (0 tensions, 2 emotions) shows that both agents share one identical atom, and that each agent has 2 unique atoms. As the reader can observe, agent 1 and agent 2 only share nine identical atoms. Those atoms located in the same position or located close to each other in the map share some characteristics; therefore, they are similar but no identical. Finally, we have few atoms that are very different to the rest. In this way, we are able to have two knowledge bases that are similar but not identical.
4 A story generated by MEXICA-impro
MEXICA-impro is set to produce three actions during engagement and then switch to reflection. From now on agent 1 is referred to as the leader and agent 2 is referred to as the follower. The user provides the following first action:
(0) princess cured jaguar knight
The number on the left indicates that this action was produced at Time = 0. The leader starts an E-R cycle; during engagement the following actions are retrieved from memory:
(0) princess cured jaguar knight (1) enemy kidnapped princess (2) enemy attacked princess (3) jaguar knight looked for and found enemy
At time = 1 the enemy kidnaps the princes, at time = 2 the enemy attacks her and at time = 3 the knight decides to look for the enemy. Now, the leader switches to reflection.
(4) jaguar knight is introduced in the story (5) princess is introduced in the story (7) hunter is introduced in the story (9) hunter tried to hug and kiss jaguar knight (8) jaguar knight decided to exile hunter (10) hunter went back to Texcoco Lake (6) hunter wounded jaguar knight (0) princess cured jaguar knight (1) enemy kidnapped princess (11) enemy got intensely jealous of princess
94

(2) enemy attacked princess (3) jaguar knight looked for and found enemy
The system introduces the princess and the jaguar knight into the story. Then, the system requires to justify why the princess healed the knight and inserts the action where the hunter injured the knight at time = 6. Since there is a new actor, the system introduces the hunter into the story (time = 7). The leader now requires to justify why the hunter wounded the knight; so, it inserts the action where the knight exiled the hunter (time = 8). Why did the knight do that? Because the hunter attempted an excessive demonstration of love on the knight (time = 9). However, because the hunter was exiled, it changed his position inside the story-world. Therefore, in order to wound the knight, first it had to move back to the lake (where the knight is located). The system detects this situation and moves back the hunter to the Texcoco Lake (Time = 10). Finally, MEXICA-impro requires justifying why the enemy decided to attack the princess. So, it inserts action at time = 11. At this point, all preconditions are satisfied and the leader ends its first E-R cycle and cues the follower to continue the story.
The follower starts its E-R cycle and during engagement generates two actions:
(12) jaguar knight had an accident (13) enemy decided to sacrifice jaguar knight
So, after the knight finds the enemy the follower continues the story inserting an action where the knight suffered an accident (time = 12) and the enemy decides to kill him (time = 13). The follower cannot match an atom in memory to continue the story and an impasse is declared. Thus, the system switches o reflection.
Jaguar knight is introduced in the story princess is introduced in the story hunter is introduced in the story hunter tried to hug and kiss jaguar knight jaguar knight decided to exile hunter hunter went back to Texcoco Lake hunter wounded jaguar knight princess cured jaguar knight enemy kidnapped princess enemy got intensely jealous of princess enemy attacked princess jaguar knight looked for and found enemy (12) jaguar knight had an accident (13) enemy decided to sacrifice jaguar knight (14) hunter found by accident jaguar knight (breaking impasse)
All preconditions are satisfied, so the system inserts at the end of the story in progress the action where the hunter found accidentally the knight (time = 14) to try to break the impasse. The E-R cycle ends and the follower cues the leader to continue the story.
95

The leader attempts to match an atom in memory; however, it fails and an impasse is declared. This is not surprising because none of the leader’s previous histories includes a scene where a hero goes to rescue a victim and instead suffers an accident. Now the leader switches to reflection. All preconditions are fulfilled and the system inserts the action where the hunter killed the knight to try to break the impasse.
(15) hunter killed jaguar knight (breaking impasse)
This produces an interesting situation. One would expect that the enemy killed the knight; however, the hunter, who hated the knight, is reintroduced in the story and performs the murder. There is not a similar precedent in the previous stories of both agents. The leader cues the follower to continue the story.
The follower tries to match an atom but again an impasse is declared during engagement; the system switches to reflection to try to break the impasse and inserts the action where the hunter killed himself.
(16) hunter committed suicide (breaking impasse)
The follower evaluates the story in progress and decides that the story is completed. So, the follower cues the leader to continue the story and informs the leader about its decision of finishing the story. The leader receives the information and nevertheless tries to advance the story. During engagement it cannot match an atom in memory and an impasse is declared. During reflection it cannot break the impasse. So, the leader decides to finish the story. This is the plot that both agents built together:
*** Final Story (4) jaguar knight is introduced in the story (l) (5) princess is introduced in the story (l) (7) hunter is introduced in the story (l) (9) hunter tried to hug and kiss jaguar knight (l) (8) jaguar knight decided to exile hunter (l) (10) hunter went back to Texcoco Lake (l) (6) hunter wounded jaguar knight (l) (0) princess cured jaguar knight (1) enemy kidnapped princess (l) (11) enemy got intensely jealous of princess (l) (2) enemy attacked princess (l) (3) jaguar knight looked for and found enemy (l) (12) jaguar knight had an accident (f) (13) enemy decided to sacrifice jaguar knight (f) (14) hunter found by accident jaguar knight (f) (15) hunter killed jaguar knight (l) (16) hunter committed suicide (f)
What makes this story original is its conclusion: a hero goes to rescue a victim but instead suffers an accident that leads to his murder, not by the enemy, but by an old
96

resented rival that suddenly is reintroduced in the plot. There is no similar story in either PH1 or PH2.
The letter on the right side indicates if the action was generated by the leader (l) or by the follower (f). Actions in italics were generated during reflection. In this example the leader performed three E-R cycles while the follower performed two. The leader contributed with 12 actions while the follower contributed with 4. This difference arouse because the initial action provided by the user required that the leader inserted several actions during reflection to satisfy preconditions. During its first E-R cycle the leader produced 11 actions; so, almost its whole contribution to the narrative was generated during its first participation (i.e. during its first E-R cycle). During its second participation the leader inserted one action to try to break an impasse and during its final participation the leader was not able to contribute to the story. The follower contributed with three actions during its first participation and with one during its final participation. Both agents were able to generate more actions during its first E-R cycle because as the narrative unravelled the story-context became more complex and novel and it was more difficult to match an atom. The sequence of actions generated by the leader during its first participation (actions time = 1 to 11) produced a context that was novel to both the leader and the follower. That is, neither the leader’s knowledge-base nor the follower’s knowledge-base contained an atom that was equal to the current story-world context. This novelty arouse as a result of the heuristics employed to satisfy preconditions. The production of novel contexts is a normal and necessary situation when MEXICA generates stories: novel contexts arise and MEXICA looks for atoms similar to the current story-world context and then retrieves its associated actions to unravel the narrative in progress. In this way MEXICA is able to create novel narratives. However, in MEXICA-impro the follower receives unknown material (in this case produced by the leader) that must be progressed coherently: the actions chosen to continue the story must connect with the previous ones, the relation between characters must be kept, and so on. This is a difficult task. The E-R model provides the necessary elements to achieve this goal.
We hypothesized that if the knowledge bases of the two agents were similar enough, the agents would interact without problems. However, in this case, the sequence of actions generated at times 1 to 11 produces a novel context for both agents. This characteristic is positive because the system is generating original situations to push the story forward instead of just copying the content of its knowledge base. However, if the context is “too novel”, the system is not capable of matching an atom in memory and an impasse is declared. In this case, the follower was able to retrieve an action during engagement to continue the narrative. Due to lack of space, it is not possible to explain the details of how the follower matched the atom and retrieved the action at time 12. But it is important to mention that the atom matched only satisfied the minimum requirements to be considered similar to the current story context. That is, because the context was pretty novel the follower was close to declaring an impasse. Nevertheless, agent 2 was able to continue the story. Would the leader be able to match an atom employing the same story-context? This question leads to a more important question: would the leader be able to generate the same story alone? In order to answer these questions we ran a second test. We forced agent 1 to generate exactly the same initial first 11 actions and see if it could continue
97

the story alone. The result was that, after generating again the first eleven actions, agent 1 was not capable of matching any atom in memory. Thus, an impasse was declared and the system switched to reflection to try to break the impasse. Employing the heuristics designed for this purpose, the system inserted an action where Jaguar Knight made the enemy a prisoner. Then, the system considered that the story was completed and decided to finish it. In this way, the story generated alone by agent 1 is shorter and its conclusion is not as original as the conclusion in the story generated by both agents (one could easily expect that the knight would make the enemy a prisoner). Because its knowledge base does not include the necessary knowledge, the leader could never produce alone the same tale produced by MEXICA-impro.
Would agent 2 be capable of generating alone the first same 11 actions and then continue the story? To answer this question we attempted to forced agent 2 to produce the same initial sequence of actions. However, the content of its knowledge base made it impossible. Agent 2 could not come out with the proposal that, after the princess cured the knight, something logical to happen was that the enemy kidnapped her. Thus, this agent could not generate the desired sequence of actions.
As mentioned earlier, collectively-creative narratives are produced by providing each of our agents with different computational representations of culture, experience and personality. In our current version of MEXICA-impro, these characteristics are represented in the system’s knowledge base. This way, because the story produced by MEXICA-impro is novel and could not be produced by any of the agents alone, we consider it as a collectively-creative narrative. This is a nice example of how the cooperation between both agents allowed producing a novel story.
5 Conclusions
MEXICA and other systems have explored in the past how narratives can be created automatically according to different cognitive models and ideas. MEXICA has been successful in representing in computer terms the engagement-reflection account of the human creative process, especially through its capability to ‘reflect’ about partial stories and adjust generation cycles thereafter. One of the main characteristics of creativity, however, one accounted for by many authors (e.g. Boden, 1990), is that products of the process need to be novel to a community, either in a particular group, or in society at large. This particular constraint for some product to be deemed ‘creative’, takes the problem of building models and systems of creative processes into the realm of the social: not only the outcomes need to be sound and interesting but also new to the community. Creative agents then, need to take into account the community’s knowledge when trying to come up with something new.
Our project explores an approach to creativity, namely the use of improvisation in story generation as a metaphor of social reproduction. We believe that creativity is achieved by confronting established local (or global) lore with new, different knowledge and practice. Improvisation is a well known creative experimental medium where two or more different worlds collide in an organised environment to establish the ground for innovative, amusing and relevant knowledge, art work or otherwise. MEXICA-impro has provided a good starting point for our endeavour since it allows
98

us to redefine the creative process as a dialog between two improvising agents that draw their information from different databases considered as cultural contexts for different cultures. From the methodological point of view, our project establishes right from the onset a multidisciplinary approach to a multidisciplinary subject. What creativity is and how it can be modelled and studied can only be investigated by involving all the relevant disciplines. Our system possesses an architecture that provides all members of the group with a clear knowledge of all the relevant mechanisms and parameters at stake, in such a way that everyone can participate almost right from the start in discussions about future design and experiments.
MEXICA-impro simulates the interaction between two agents with separate cultural backgrounds. The resulting system has become an experimental zone at the crossroad of several disciplines. The members of the group developing it come from backgrounds as diverse as A.I., Film Studies, Sociology and Psychology. We believe that we, ourselves, have set out in an engagement-reflection journey to explore in a multidisciplinary way the possibilities of creativity.
6 References
Boden, Margaret. The Creative Mind. Abacus. London, U.K. 1990, p32. Clark, H. H., & Brennan, S. A. (1991). Grounding in communication. In: Resnick, L.B., J.M.
Levine, and S.D. Teasley (Eds.). Perspectives on socially shared cognition. Washington: APA Books.
Jeong, H., & Chi, M. T. H. (2007). Knowledge convergence and collaborative learning. Instructional Science, 35, 287-315.
Meehan, J. (1981). Tale-spin. In R. C. Shank & C. K. Riesbeck (Eds.), Inside computer understanding: Five programs plus miniatures. Hillsdale, NJ: Erlbaum Press
Pérez y Pérez, R. (2007). Employing Emotions to Drive Plot Generation in a Computer-Based Storyteller. Cognitive Systems Research. Vol. 8, number 2, pp. 89-109. DOI information: 10.1016/j.cogsys.2006.10.001
Pérez y Pérez, R. & Sharples, M. (2004) Three Computer-Based Models of Storytelling: BRUTUS, MINSTREL and MEXICA. Knowledge Based Systems Journal. Vol. 17, number 1, pp. 15-29.
Pérez y Pérez, R. & Sharples, M. (2001) MEXICA: a computer model of a cognitive account of creative writing. Journal of Experimental and Theoretical Artificial Intelligence. Volume 13, number 2, pp. 119-139.
Riedl, M. (2004). Narrative planning: balancing plot and character. Ph.D. dissertation, Department of Computer Science, North Carolina State University, Raleigh, NC
Scott, W. (1962). Cognitive Complexity and Cognitive Flexibility. Sociometry, 25 (4), 405-414 Sharples, M. (1999). How we write? Writing as creative design. London: Routledge. Turner, S. R. (1994). The creative process: A computer model of storytelling. Hillsdale, NJ:
Lawrence Erlbaum Associates.
99

Curious Whispers: An Embodied ArtificialCreative System
Rob Saunders1, Petra Gemeinboeck2, Adrian Lombard1, Dan Bourke1, andBaki Kocabali1
1 Faculty of Architecture, Design and Planning, University of Sydney, Australia2 College of Fine Arts, University of New South Wales, Australia
Abstract. Creativity, whether or not it is computational, doesn’t occurin a vacuum, it is a situated, embodied activity that is connected withcultural, social, personal and physical contexts. Artificial creative sys-tems are computational models that attempt to capture personal, socialand cultural aspects of human creativity. The physical embodiment ofartificial creative systems presents significant challenges and opportuni-ties. This paper introduces the “Curious Whispers” project, an attemptto embody an artificial creative system as a collection of autonomous mo-bile robots that communicate through simple “songs”. The challenges ofdeveloping an autonomous robotic platform suitable for constructing ar-tificial creative systems are discussed. We conclude by examining some ofthe opportunities of this embodied approach to computational creativity.
1 Introduction
Human creativity is situated within cultural, social and personal contexts. Froma computational perspective this suggests that the processes involved in creativ-ity should be open to the environment, other creative agents, and a history ofcreative works. Physical embodiment is an important aspect of human creativ-ity that presents significant challenges and opportunities for the development ofcomputational creativity. Katherine Hayles argues that embodiment is alwayscontextual, enmeshed within the specifics of place, time, physiology and culture,which together compose enactment [1]. Following Pickering [2], creativity can-not be properly understood, or modelled, without an account of how it emergesfrom the encounter between the world and intrinsically active, exploratory andproductively playful agents. The world offers opportunities, as well as presentingconstraints: human creativity has evolved to exploit the former and overcomethe latter, and in doing both, the structure of creative processes emerge.
Why is embodiment important for computational creativity? The enactmentdescribed by Hayles, emphasises creativity as a situated act, e.g., in personalhistories, social relations and cultural identity. The computational study of situ-ated cognition as proposed by Clancey [3] does not require physical embodiment,but many of the more successful examples of situated computational systems arerobotic in nature. Perhaps this is because, despite every effort that a developermight make to maintain a separation, there is always the sense that agent and
100

environment are of the same ‘type’ within the simulation and consequently thatthe agent is not truly situated within the environment.
Physical embodiment requires that agents deal with the material nature ofthe creative activity that they engage in—the importance of working with an ex-ternal material in creative activity was highlighted by the work of Schon studyingdesigners and the process he termed as reflection-in-action [4]. Schon’s reflection-in-action illustrates the utility of ideas from distributed cognition [5] in under-standing the creative acts of designers, providing insights into the situated na-ture of creative cognitive process. Distributed cognition and reflection-in-actionprovide useful frameworks for designing artificial creative systems because theyemphasise the relationship between the agent and its environment.
The implementation of autonomous robots imposes constraints upon thehardware and software that can be incorporated. These constraints focus thedevelopment process on the most important aspects of the computational model.At the same time, embodiment provides opportunities for agents to experiencethe emergence of effects beyond the computational limits that they must workwithin. Taking advantage of properties of the physical environment that wouldbe difficult or impossible to simulate computationally, expands the behaviouralrange of the agents [6].
Finally, embodiment allows computational agents to be creative in environ-ments that humans can intuitively understand. As Penny [7] describes, embodiedcultural agents, whose function is self reflexive, engage the public in a consider-ation of the nature of agency itself. In the context of the study of computationalcreativity, this provides an opportunity for engaging a broad audience in thequestions raised by models of artificial creative systems.
Curious Whispers is a project to investigate the nature of embodiment inan artificial creative system and explore the potential of placing this artificialsociety within a human physical and social environment.
2 Background
In 1738, Jacques de Vaucanson exhibited his Flute Player automaton. In 1769,Baron Wolfgang von Kempelen presented to the public his chess playing Me-chanical Turk ; it was not until 1834, that an article appeared in Le MagazinPittoresque revealing its inner workings and the man hidden within [8]. In de-veloping these machines, both Vaucanson and von Kempelen engaged the publicin philosophical questions about the nature of creativity and the possibilitiesof automation [9]. Our apparent fascination with the prospect of building ma-chines that can exhibit creative behaviour continues today with the developmentof embodied agents as robots. Following Vaucanson, many of these robotic ex-periments are within the domain of music.
Ja’maa is a percussion ensemble for human and robotic players, includingHaile a robotic drummer that listens to the drumming of human players andresponds with its own improvisations [10]. Eigenfeldt has developed software-
101

based multiagent systems to emulate improvised percussion ensembles of [11]and has embodied these agents within a robotic performer, MahaDeviBot [12].
DrawBots [13] and Mbots [14] are two examples of recent attempts to de-velop robots capable of exhibiting creative behaviour in the production of ab-stract drawings. Portraitist robots have been implemented [15, 16] but, whilethese projects have overcome significant technical challenges, they have mostlyneglected to examine issues associated with embodied creativity. Cagli et al. [17]proposes the study the behaviour of realistic drawing to focus on the physicalaspects of the creative process. In particular, they focus on visuomotor coordi-nation and present a control architecture based on computational models of eyemovements, and the eye-hand coordination of expert draughtsmen.
For the development of computational models of creativity one of the keyadvantages of embodiment with a physical and social environment may be theaccess it brings to a cultural context beyond the confines of the computationalelements. As Penny [7] observes in relation to his embodied cultural agents “view-ers (necessarily) interpret the behavior of the robot in terms of their own lifeexperience. [...] The machine is ascribed complexities which it does not possess.This observation emphasises the culturally situated nature of the interaction.The vast amount of what is construed to be the ‘knowledge of the robot’ isin fact located in the cultural environment, is projected upon the robot by theviewer and is in no way contained in the robot.” In Penny’s works, the robots areviewed within the context of their cultural environment but this has no impactupon intrinsic behaviour of the robots, having no access to the situation thatthe audience brings.
2.1 Curious Agents
Martindale [18] proposes that the search for novelty is a key motivation for indi-viduals within creative societies. Curious agents embody a computational modelof curiosity based on studies of humans and other animals, where curiosity istriggered by a perceived lack of knowledge about a situation and motivates be-haviour to reduce uncertainty through exploration [19]. Unlike earlier models ofcreative processes that try to maximise some utility function, curious agents aremotivated to discover something ‘interesting’ based on their previous experiencesusing an hedonic function, the Wundt curve (see Figure 1).
Curious agents provide a useful foundation for developing embodied agentsto engage in an artificial creative system because they have been shown to beuseful in modelling autonomous creative behaviour and have been used to robotsto promote life-long learning in novel environments. Schmidhuber [20] presentsa model interest and curiosity, based on the compressibility of information, andintroduced a distributed model of curiosity based on a pair of agents competingto surprise each other [21]. Saunders focused on the role of curiosity in creativityto develop computational models of creativity to search for novelty and interestin design [22]. In these models, the computation of interest and boredom arebased on novelty detection, a technology that was originally developed to detectpotential faults in processes where it is critical to stay within “normal” operating
102

Fig. 1. The Wundt Curve: an example hedonic function for curious agents and robots.
limits. Unlike in monitoring applications, novelty is considered a desirable qualitywhen modelling curiosity, and detected novelty is used as the basis for positivereinforcement of behaviour.
Research developing embodied curious agents has focussed on the utility ofmodelling curiosity as a motivation for learning about physical environments andsocial relations. Marsland et al. [23] introduced the idea of “neotaxis”, movementbased on perceived novelty, as a useful behaviour for autonomous robots to mapphysical spaces. Peters [24] presented the WRAITH algorithm as a layered ar-chitecture for building curious robots suitable for modelling creativity. Oudeyerand Kaplan [25] presents the use of curiosity to support the discovery of com-munication in social robots. Merrick [26] presents an architecture for curious,reconfigurable robots for creative play that can learn new behaviour in responseto changes in their structure.
When computational models of curiosity are used as the model of motiva-tion in intelligent environments a new kind of space emerges: a curious place[27]. Curious places are intelligent environments using curious agents to adaptto changing user behaviour and anticipate user demands. Curious places of-fer new opportunities for supporting and embodying creativity in the physicalenvironment. In addition to supporting human activities, curious places workproactively to anticipate, identify and enact creative behaviour.
2.2 Artificial Creative Systems
The Domain Individual Field Interaction (DIFI) framework is a unified approachto studying human creativity that provides an integrated view of individual cre-ativity within a social and cultural context [28]. According to this framework, acreative system has three interactive subsystems: domain, individual and field.A domain is an organised body of knowledge, including specialised languages,
103

rules, and technologies. An individual is the generator of new works in a creativesystem, based on their knowledge of the domain. A field contains all individualswho can affect the content of a domain, e.g., creators, audiences, critics, and ed-ucators. The interactions between individuals, fields and domains form the basisof the creative process in the DIFI framework: individuals acquire knowledgefrom domains and propose new knowledge evaluated by the field; if the fieldaccepts a proposed addition, it becomes part of the domain and available for useby other individuals.
Inspired by the DIFI model of creativity, Saunders and Gero used curiousagents to develop artificial creative systems, composed of curious design agentscapable of independently generating, evaluating, communicating and recordingworks [29]. Other distributed approaches to computationally modelling creativityinclude McCormack’s “ecosystemic” approach, which recognises the importanceof the environment and the agent’s relationship with the environment as primaryconcerns for modelling creative activity [30].
3 Implementation
Building on the previous work of Saunders [22], we are currently developing theCurious Whispers project in an attempt to develop an artificial creative systemsusing embodied curious agents, i.e., curious robots. Inspired by the thought ex-periments of Braitenburg [31] we have implemented the robots as simple vehicleswith the addition of a loudspeaker, a pair of microphones and sufficient process-ing units to determine their ‘interest’ in the sonic environment. The robot archi-tecture has been developed as a set of function-specific modules: audio captureand processing, song categorisation and analysis, interest and boredom calcula-tions, sound generation and output, and servo and motor control.
The Curious Whispers robots have been built on top of the Ardubot barebones mobile robot platform developed by Sparkfun Electronics3. The Ardubotplatform was designed as a minimal, low-cost platform for developing mobilerobots using the Arduino4 interface boards. The Ardubot platform is based aroundan oversized expansion board for the Arduino integrating a DC motor driverintegrated-circuit (IC) and a pair of mounts for motors. Arduino and Atmel AT-mega168 microcontrollers are used for this application due to their relativelyfast operation speed (20 MIPS), ample memory (16kb flash, 1kb SRAM), flexi-bility, compatibility and affordability. The Arduino acts as the primary interfacebetween the ATmega168 microcontroller and other components attached to therobot, e.g., the DC motor driver, sound generation chips, etc. This provides sim-ple access for programming the ATmega168 and offers expandability through theuse of “shields” that can be stacked on top of the Arduino to provide additionalfunctionality.
A custom shield has been developed for the Arduino to provide the sound gen-eration and sound capture and processing functions to the Arduino. To produce3 http://www.sparkfun.com/4 http://www.arduino.cc/
104

the audio signal to drive the loudspeakers each robot is equipped with an FMsynthesis subsystem based around a Soundgin5 audio processor. The Soundginprocessor has two independent sound engines, each with three oscillators and amixer, providing a large variety of possible sounds.
To allow the robots to move about their environment without damagingthemselves, each robot has a pair of front-facing “whiskers” attached to a touchsensor, allowing the robot to stop and back away from obstacles encountered.
3.1 Audio Capture and Processing
Two audio signals are captured by small microphones mounted on lightweightmovable arms. The ATmega168 microcontroller performs a 64-point, fixed-pointFast Fourier Transform (FFT) operation on each of the audio signals. Using this64-point FFT, a sampling rate of 16kHz and a frequency resolution of 250Hz,we are able to achieve a Nyquist frequency of 8KHz, i.e., we have 32 frequencybands at 0Hz, 250Hz, 500Hz, 750Hz, 1kHz,...8kHz. This is a sufficient frequencyrange for our application, since we do not generate sounds above 8kHz. Theonboard 16kb of memory can hold enough samples to perform two 64 point FFTcalculations. Therefore the robots can monitor a stereo pair of signals enablingleft-right interest differencing, suitable for driving neotaxis. The result of theFFT calculation is passed to the Arduino board for analysis and processing.
The Arduino board monitors a stream of serial data from the FFT calculationon the left and right audio channels. Each sample is represented as an integervalue between 0 and 63 representing the most active frequency detected by theFFT calculation: values close to 0 represent bass sounds. When the dominantfrequency detected by the FFT changes, in either the left or right audio channel,the values for both channels are appended to short-term memory. The values inthe short-term memory represent the “song” the robot is hearing.
3.2 Novelty, Interest and Boredom
When short-term memory contains a total of eight frequencies, the values arepackaged as a vector and presented to a small Self Organising Map (SOM) thatserves as the robot’s long-term memory [32]. Due to the limitations of the hard-ware platform, the SOM contains just 16 neurons, but this has proved sufficientfor the task of categorising the eight-note songs that the robots are capable ofproducing. In contrast with typical applications of categorisation systems, therobots do not attempt to maintain a complete map of the space of all possiblesongs, rather each robot constructs a local map of recently experienced songs.
The novelty of a song is calculated as the shortest Euclidean distance betweenthe vector representation of the song and all of the prototypes held in the SOM.To calculate the interest that the robot has in the current song a non-linearfunction, which approximates the Wundt curve as the sum of two sigmoids, isused to transform the novelty value. Consequently, a song stored in short-term5 http://oopic.com/soundgin/
105

memory that exactly matches an existing song in the SOM is not particularlyinteresting, and a song that is radically different to anything which the robot haspreviously experienced is also not very interesting. The most interesting songsfor these robots will be songs which are similar but different to the songs recentlyexperienced by the robot and held in the SOM.
Interest values calculated for the audio signals received from the left andright microphones are translated into movement such that interest value for theleft channel will be converted into a speed for the right wheel, and vice versa.Figure 2 illustrates a scenario for neotaxis as implemented in our robots, whereone of the robots, having analysed the songs of two other robots (A and B),moves in the direction of the robot that has produced the more interesting song.
NVD
NVDLTM
FFT
FFT
STM
STM
GENERATE
MICROPHON
E
MICROPHON
E SPEAKER
A
B
Fig. 2. The robots in the Curious Whispers project implement neotaxis, driving inthe direction of the most interesting novelty. The architecture includes: audio analy-sis (FFT); short-term memory (STM); long-term memory (LTM); novelty detection(NVD); and, song generation (GEN).
In the absence of interesting songs a robot will become ‘bored’. Boredom iscomputationally modelled as a threshold on the long-term level of interest thatthe robot has had in recent songs. If the robot becomes bored, it changes froma listening mode to a generating mode.
106

3.3 Song Generation
Generative systems are often computationally expensive, both in terms of theprocess of generation and analysis. The limited computational resources availablein the autonomous robots has required that generation of new works be handleddifferently from previous artificial creative systems. Firstly, a simple generativesystem has been implemented, which takes advantage of the long-term memoryof stored patterns to generate similar-but-different songs. To generate a newsong the agent either mutates a pattern randomly chosen from the prototypesstored in the SOM, or chooses two prototypes and combines them using anoperation similar to crossover used in genetic algorithms. Secondly, the analysisof generated songs takes advantage of the embodied nature of the robots to reusethe analysis systems already present. In the generative mode the robot changesits physical configuration by moving its left and right microphones closer to itsspeaker and reduces the volume of the speaker. This reconfiguration allows therobot to listen exclusively to its own songs.
To bootstrap the system, all robots begin in this generative mode. Using therandom vectors assigned to the prototypes held in the robot’s long-term memory,each robot generates songs until it discovers one that is interesting enough tocommunicate to others.
4 Planned Experiments
Three robots are in the final stages of construction and a series of experiments areplanned to evaluate the utility of our approach. In particular, the experimentswill examine:
1. whether embodiment has significant benefits over simulation for the studyof artificial creative systems; and,
2. how humans interacting with an artificial creative system construe the agencyof the robots.
Comparing the behaviour of artificial creative systems is a difficult task. Thebehaviour of the system cannot be validated using the principles that underliethe approach, yet these principles are important indicators of creative behaviour.Behavioural diversity is a key factor in attaining creative behaviour, and one ap-proach to evaluating creative behaviour is to quantify behavioural diversity. Wewill quantify the behavioural diversity of our embodied agents and of the artifi-cial creative system as a whole, and compare these to our simulations of the sameagents to gain insights into the effects of embodiment on the creative processes.The simulation of the artificial creative system uses as much of the code runningon the robots as possible, interacting within a simulated environment.
Human audiences will encounter the artificial society and its evolving tuneswithin a the context of a gallery environment. This will allow them to share thesame space with robots and to engage with their activities and relations fromwithin. To study how embodiment affects the way humans construe the agency
107

of the robots, visitors will have the opportunity to interact with the roboticsystem using an FM synthesiser, similar to the ones used by the robots. Thegoal is to encourage visitors to engage with the social creative process at workin the community of robots by playing simple tunes, allowing visitors to injectelements from their human cultural context into the artificial creative system.
5 Conclusion
This paper has described the design of Curious Whispers, a proof-of-concept im-plementation for an embodied artificial creative system. Unlike typical human-robot interactions, this project does not place the human in a privileged position,able to dictate what the robots should play. Instead the human enters the ar-tificial creative system as an equal to the robots, who is required to producesongs of interest to the robots for them to be picked up and reworked within thesystem. Curious Whispers is a system open to human engagement, potentiallyallowing the agents to take advantage of the social and cultural contexts thatvisitors bring.
References
1. Hayles, N.K.: How we became posthuman: virtual bodies in cybernetics, literature,and informatics. University of Chicago Press, Chicago, Illinois (1999)
2. Pickering, J.: Embodiment, constraint and the creative use of technology. In:Freedom and Constraint in the Creative Process in Digital Fine Art: An AHRBInvited Workshop in Association with the 5th Conference on Creativity and Cog-nition, Goldsmiths College, London, United Kingdom (April 12–15 2005)
3. Clancey, W.J.: Situated Cognition: On Human Knowledge and Computer Repre-sentations. Cambridge University Press, Cambridge, England (1997)
4. Schon, D.A.: The reflective practitioner : how professionals think in action. BasicBooks, New York, NY, USA (1983)
5. Hutchins, E.: Cognition in the Wild. MIT Press, Cambridge, MA (1995)6. Brooks, R.: Elephants don’t play chess. Robotics and Autonomous Systems 6
(1990) 3–157. Penny, S.: Embodied cultural agents: At the intersection of art, robotics, and
cognitive science. In: Socially Intelligent Agents: Papers from the AAAI Fall Sym-posium, AAAI Press (1997) 103–105
8. Reichle, I.: Art in the Age of Technoscience: Genetic Engineering, Robotics, andArtificial Life in Contemporary Art. Springer Verlag (2008)
9. Wood, G.: Living Dolls: A Magical History of the Quest for Mechanical Life. Faberand Faber (2003)
10. Weinberg, G., Driscoll, S., Thatcher, T.: Ja’maa – a middle eastern percussionensemble for human and robotic players. In: International Computer Music Con-ference, New Orleans (2006) 464–467
11. Eigenfeldt, A.: Drum circle: Intelligent agents in max/msp. In: Proceedings of theInternational Computer Music Conference, Copenhagen (2007)
12. Eigenfeldt, A., Kapur, A.: An agent-based system for robotic musical performance.In: Proceedings of New Interfaces for Musical Expression (NIME’08), Genova, Italy(2008)
108

13. Boden, M.A., Brown, P., Husbands, P., Gere, C.: Computational in-telligence, creativity and cognition: a multidisciplinary investigation.http://www.informatics.sussex.ac.uk/research/groups/ccnr/research/creativity.html,accessed 2009 (2005)
14. Moura, L., Pereira, H.G.: Symbiotic art. IAC, Villeurbanne (2004)15. Calinon, S., Epiney, J., Billard, A.: A humanoid robot drawing human portraits.
In: Proceedings of 2005 5th IEEE-RAS International Conference on HumanoidRobots. (2005)
16. Robotlab: autoportrait. http://www.robotlab.de/auto/portrait engl.htm, accessed2009 (2002)
17. Cagli, R.C., Coraggio, P., Napoletano, P.: Drawbot: a bio-inspired robotic por-traitist. Digital Creativity 18(1) (2007) 24–33
18. Martindale, C.: The Clockwork Muse. Basic Books, New York, NY. (1990)19. Berlyne, D.: Aesthetics and Psychobiology. Appleton-Century-Crofts, New York,
NY (1971)20. Schmidhuber, J.: A possibility for implementing curiosity and boredom in model-
building neural controllers. In Meyer, J.A., Wilson, S.W., eds.: Proceedings of theInternational Conference on Simulation of Adaptive Behaviour: From Animals toAnimats, Cambridge, MA, MIT Press (1991) 222–227
21. Schmidhuber, J.: Adaptive confidence and adaptive curiosity. Technical ReportFKI-14991, Technische Universitat Munchen, Munchen, Germany (1991)
22. Saunders, R.: Curious Design Agents and Artificial Creativity. PhD thesis, Uni-versity of Sydney, Sydney (2002)
23. Marsland, S., Nehmzow, U., Shapiro, J.: Novelty detection for robot neotaxis. In:International Symposium On Neural Computation (NC’2000). (2000) 554—559
24. Peters, M.W.: Towards artificial forms of intelligence, creativity and surprise. In:Proceedings of the Twentieth Annual Conference of the Cognitive Science Society,Erlbaum (1998) 836–841
25. Oudeyer, P.Y., Kaplan, F.: Discovering communication. Connection Science 18(2)(2006) 189–206
26. Merrick, K.: Designing toys that come alive: Curious robots for creative play. In:The Seventh International Conference on Entertainment Computing (ICEC 2008),Carnegie Mellon University, Springer (September 25-27 2008) 149–154
27. Maher, M.L., Merrick, K., Macindoe, O.: Intrinsically motivated intelligent sensedenvironments. In: The Thirteenth International Workshop of the European Groupfor Intelligent Computing in Engineering, Ascona, Switzerland (2006) 455–475
28. Feldman, D.H., Csikszentmihalyi, M., Gardner, H.: Changing the World: A Frame-work for the Study of Creativity. Praeger Publishers, Westport, CT (1994)
29. Saunders, R., Gero, J.S.: How to study artificial creativity. In: Proceedings ofCreativity and Cognition 4. (2002)
30. McCormack, J.: Artificial ecosystems for creative discovery. In et. al., T.D., ed.:Genetic and Evolutionary Computation Conference (GECCO 2007). Volume 1.,London, ACM, New York (7-11 July 2007 2007) 301–307
31. Braitenberg, V.: Vehicles: Experiments in synthetic psychology. MIT Press, Cam-bridge, MA (1984)
32. Kohonen, T.: Self-Organizing Maps. Springer–Verlag, Berlin (1995)
109

Elementary Social Interactions and Their Effects on
Creativity: A Computational Simulation
Andrés Gómez de Silva Garza1,1 and John Gero2
1 Instituto Tecnológico Autónomo de México (ITAM), Río Hondo #1, Colonia Progreso Tizapán, 01080—México, D.F., México, [email protected]
2 Krasnow Institute for Advanced Study, 4400 University Drive, Mail Stop 2A1, George
Mason University, Fairfax, VA 22030, U.S.A., [email protected]
Abstract. This paper presents a multi-agent computational simulation of the
effects on creativity of designers' simple social interactions with both other
designers and consumers. This model is based on ideas from situated cognition
and uses indirect observation to produce potential changes to the knowledge
that each designer and consumer uses to perform their activities. These changes
result in global, social behaviors emerging from the indirect interaction of the
players with relatively simple individual behaviors. The paper provides results
to illustrate these emergent behaviors and how the social interactions affect
creativity.
1 Introduction
Computational models of creativity typically simulate the reasoning process of one
creative agent that produces designs (whether they are of residences [1], stories [2],
software [3], artwork [4], or other artifacts, whether abstract or physically realizable).
In this view, the simulation ends as soon as the design of the artifact is generated by
the simulated designer, and this design generation concludes when the simulated
design process converges to an acceptable solution. The simulated designer is
programmed with a particular body of knowledge, which may or may not change over
time, that embodies its expertise and that includes evaluation knowledge that allows
the agent to determine the acceptability of the designs it proposes and therefore halt
the simulated design process.
This simulated design process might have some parameters that can be adjusted,
but usually employs the same overall method in order to generate designs (whether it
be evolutionary algorithms [5], analogy [6], constraint satisfaction [7], shape
grammars [8], or other computational strategies for creating designs). If the design
process is run again on the same problem, then the same solution, or at least the same
type of solution, will be obtained as output. This is the "design as search or
optimization" view, and does not account for the fact that most designers are able to
continue producing creative output throughout their lives. Designers do not just
produce one design and stop, and the designs that they have produced in the past
1 Contact author.
110

influence the ones they produce in the future, instead of each episode of producing a
design being done in complete isolation from all other episodes.
As Boden has pointed out, creative products must be both novel and
useful/valuable [9]. In order for a designer's output to be considered creative it must
be sufficiently distinct from the designer's previous body of work, and in order for
this to occur in a computational model, the simulated designer must be dynamic: at
minimum, some aspect of the way it analyzes and/or produces designs must change
over time. In addition, in order for a designer's output to be considered creative it
must be valued by others, and in order to be successful in this a designer must be
aware (as much as possible) of what others look for or value. It thus appears that
traditional computational models of design are limited in their veridicality because
they do not take into account a designer's social context in modeling design activity
and the factors that drive it.
This paper describes a computational model that embodies a broader view of
design than single designer simulations. In this view the design decisions that a
designer makes (i.e., the evaluation criteria on which those decisions are based) are
influenced by multiple factors, some of which are external to the agent. In particular,
the knowledge that a designer uses both to produce and evaluate designs changes over
time as a result of the interactions of the designer with other members of the world
around it. The other members that can influence a designer's design decisions can be
classified into those that are competitors (other designers in the same industry or
domain, producing the same kinds of designs) and those that are consumers (of the
type of artifact produced by the designer). The influence is not a result of direct
communication between them, but rather results from each member being able to
analyze the behaviors of the others around it, in particular their responses to the
different designs being produced, and adjusting its own knowledge over time as a
result. In broad terms, we can consider the computational model simulates that
consumers' purchasing behavior in the world is independent of, but indirectly affects,
the evaluation criteria used in producing new products.
This view of designing as including a social phenomenon is influenced by research
in the branch of cognitive science known as situated cognition [10, 11]. One of the
observations of situated cognition is that reasoning occurs within a world and is
influenced by a designer’s current worldview, called a “situation” [12]. The same
designer confronted by the same requirements at a different time, or different
designers confronted by the same requirements at the same time, might make different
decisions while reasoning and therefore come up with different solutions to the
requirements. Basing this computational simulation on ideas from situated cognition
allows for the explanation of, and experimentation with, many of the phenomena
involving social influences that are related to design activity.
The remainder of the paper is organized as follows. Section 2 briefly presents the
mechanics of the computational simulation of a social environment in which creative
agents are present, using ideas from multi-agent systems [13]. Section 3 presents
some details about the makeup of the agents used in this simulation. Section 4
describes and presents the results of some experiments performed with this
simulation. The paper concludes by discussing, in Section 5, some of the important
outcomes of this research.
111

2 Multi-agent Simulation
This simulation was implemented in MASON (Multi-Agent Simulation Of
Networks), a multi-agent simulation platform, developed at George Mason University
[14]. In this simulated world there are 1,000 agents, of which 2.5% are designers
(which are also called producers) and 97.5% are observers or consumers (which are
also called receivers) of the designs produced by the designers. These proportions are
based on statistics gathered by the U.S. Census Bureau [15] that show that
approximately 2.5% of the U.S. population is involved in some sort of creative
activity or industry.
Each designer and consumer is modeled as a single agent in MASON resulting in
25 designers agents and 975 consumer agents. Each of these agents has its own value
system, modeling its situation at any time: a set of interests and preferences, or biases,
that are used to evaluate designs. In addition, each of the designer agents has its own
set of skills: generative knowledge that it uses to produce new designs. The sets of
preferences and skills are different in each agent.
The "lives" of the agents are divided into time-steps, and a simulation is run for
each agent for 1,000 time-steps. Within each time-step each designer agent produces a
new design based on its set of generative skills and its evaluation criteria for deciding
what makes a good design. The consumers then observe the produced designs and use
their own evaluation criteria to assign a value to the quality of the designs.
Once all the consumers have had a chance to evaluate the designs produced by all
the designers the results are gathered together to obtain mean values of the population
of designs produced in that time-step. The mean values are used to rank the designs
and the designers according to their success (the relative quality of the designs they
produced, as judged by the consumers) and the consumers according to their
enthusiasm (for the overall set of designs produced by the designers). The results of
this procedure are used by the agents as a catalyst for potentially making adjustments
to the knowledge that they use in their activities in the next time-step (evaluating
designs and, in the case of designers, also producing designs).
In order to simulate the adoption of technologies and methods that have been used
by others and have been proven to be successful, in a previous time-step, the least
successful designers change their situation by adopting some of the knowledge (both
generative and evaluative) that the most successful designer used in the time-step that
has just ended (and thus try to improve their own success in the future). In the real
world this adopted knowledge could have been obtained through licensing, patents,
reverse engineering, industrial espionage, or other means. In order to simulate the
membership behavior of consumers, where consumers are influenced to adopt
products based on which products have been adopted by large groups, the least
enthusiastic consumers adopt some of the evaluative knowledge that the most
enthusiastic consumer used in the time-step that has just terminated in order to try to
improve their enthusiasm for the overall set of designs in existence.
The above procedure is then repeated for each subsequent time-step in the
simulation. Fig. 1 schematically shows the simulation framework just described. The
agents in the simulation undergo gradual changes in their way of viewing the world
around them (and of producing designs, in the case of the designer agents) as the
simulation proceeds. These gradual changes occur as a result of each agent observing
112

the behavior (skills, evaluation criteria, and opinions) of others, rather than as a result
of direct communication between the agents. As a result of these gradual changes, our
hypothesis is that interesting global (social) behaviors that were not programmed
directly into the simulation emerge on the basis of the elementary social individual
agent behaviors.
Fig. 1. Framework for the simulation of a society of producer and receiver agents.
3 Individual Agent Models
In this simulation the designer agents produce simple shapes consisting of sets of
colored unit squares through an evolutionary algorithm. Any generative approach can
be substituted for the evolutionary algorithm. Each agent uses several criteria in
parallel to evaluate designs. In the case of the designer agents, these criteria are used
to evaluate the designs that they themselves generate, and guide their generation
towards convergence in each time-step. In the case of the consumer agents, the
criteria are used to evaluate the designs that the designer agents produced during that
time-step.
The sets of evaluation criteria, which are used to model the notion of “situation,”
available to designer and consumer agents overlap but are distinct. The initial state of
the agents is randomly set (choosing for each agent a fixed number of criteria from
the set of possible criteria that corresponds to it) before commencing the simulation.
In this example the evaluation criteria relate to geometric properties of the designed
shapes (such as their tallness, flatness, area-to-perimeter ratio, bumpiness, degree of
convexity, and symmetry) as well as criteria that relate to color properties of the
shapes (such as degree of color saturation, contiguousness of the colors, and the
existence of different color patterns within the unit squares that make up the shapes).
Each of the designer agents uses a set of genes in order to create genotypes that
describe moves that can be made to describe a shape (design). The set of genes that
each designer agent uses is initialized at random at the beginning of the simulation,
and is chosen from a set of 32 possible genes.
Each gene represents making a unit move from a given start position in one of
eight possible directions (during the creation of a shape) and placing a unit square (of
a particular color) in the position resulting from that move. A genotype is a sequence
of such moves and placements of colored unit squares, read from left to right, that
together creates an entire shape. The start position for each gene in the sequence
(genotype) is the end position for the previous gene. Fig. 2 shows a subset of the set
of genes available to designers (the subset shows the eight possible genes that can
exist for a given color of unit square).
113

1:
2:
3:
4:
Gene:
7:
6:
5:
8:
Gene:
Key to interpreting moves:
= start
= end
Fig. 2. Subset (for a given color) of the genes available to designer agents.
4 Experimental Results
Fig. 3 shows snapshots of the state of the simulated world after each of the first four
time-steps in a typical simulation. In the snapshots, designers are shown as hollow
squares distributed in five rows of five columns each, and consumers are shown as
small circles that are rendered in the vicinity of the designer whose design they liked
the most upon terminating the corresponding time-step of the simulation. From one
time-step to the next the designers remain immobile, but the consumers travel within
the window from their location in the previous time-step to the vicinity of the
designer whose designs they evaluated most highly in the current time-step. The
density of the cloud of consumers depicted in the vicinity of each designer is a
measure of how popular/successful that designer's design was in the current time-step.
A wide range of responses can be observed in the sequence of snapshots shown in
Fig. 3. If the designers are numbered from left to right and from top to bottom,
Designer 8 (second row, third column) maintains an above-average level of popularity
throughout the four time-steps. Designer 25 (last row, last column) has an above-
average number of "followers" only in the third of the four time-steps shown in the
sequence of snapshots. Designer 5 (first row, last column) is not successful at all at
the beginning of the simulation, then has an average number of followers during the
next two time-steps, and then has very few by the fourth time-step. Designer 21 (fifth
row, first column) oscillates between being relatively unpopular and being relatively
popular in each of the four time-steps.
114

1. 2.
3. 4.
Fig. 3. Snapshots of the first four time-steps in a typical simulation. Designers are shown as
hollow squares distributed in five rows of five columns each, and consumers are shown as
small circles that are rendered in the vicinity of the designer whose design they liked.
This first experiment shows that many different types of social responses to
creative agents can emerge in this computational simulation. This is despite the
simplicity and indirectness of the knowledge transfer mechanism employed by the
individual agents in each time-step in the simulation (which is what originates this
range of behaviors) and despite the fact that only four time-steps were observed in
detail in order to analyze the agents' individual behaviors.
115

The second set of experiments is designed to determine global emergent trends
based on these simplified concepts of situated cognition. A Monte Carlo simulation
[16] (with 1,000 time-steps, 20 runs) was run. The mean and standard deviation of the
distributions of the evaluation knowledge used by the sets of agents and the genes
used by the designer agents at each time-step in each run were measured. The
distributions of knowledge allow us to observe whether some evaluation criteria in
both types of agent and some production knowledge in the designers tend to dominate
in time (their initial distribution is set at random, and is therefore statistically
uniform). The standard deviation of these distributions was used as a measure of the
variability within the population of agents. The mean and the standard deviation of
these standard deviations were measured to obtain a global measure of the variability
within the population across all runs (i.e., the variability of the variabilities).
Without the concepts of situated cognition, the simulation should tend over time to
produce agents that will use the same knowledge that only a few of them used at the
beginning of the simulation (the ones initially that turned out to be the most
successful or enthusiastic). Situated cognition encompasses changes in the worldview
of the participants. In the design world we are simulating this could be brought about
when new knowledge (methods, technologies, ideas, etc.) appears. This new
knowledge may augment or supplant some of the knowledge that was being used
earlier. To account for this change in worldviews new values are introduced in an
“onionskin” model of an open world.
In the onionskin model the open world is modeled as a sequence of closed worlds,
one embedded in the other. Each “skin” completely envelopes the previous world,
thus the previous world becomes an open world embedded within the next world as
the constants that define that world are turned into variables by the next closed world.
In this work we treat both the criteria and the generation knowledge as fixed in each
time-step. This makes each time-step operate within a closed world defined by those
criteria and the generation knowledge. In the next skin the criteria that were
previously fixed become part of a larger set as does the generation knowledge. In this
way the current time-step becomes an open world for the previous time-step. Here a
set of new values is regularly introduced to account for changes that emerge from the
current state of the world. These new values are added to or substituted for existing
values. This is repeated at regular intervals. At every 200 time-steps new evaluation
criteria are introduced for both designers and consumers and new genes are added to
the pool from which designs are produced by designers. Fig. 4 shows the graph of the
resulting variability (for the distribution of both designer and consumer evaluation
criteria). The eleven values shown in the horizontal (time) axis of Fig. 4 and Fig. 5
correspond to eleven key time-steps in the simulation: the initial (time-step 0) and
final (time-step 1,000) state of the simulation, and just before and just after the
introduction of new knowledge in time-steps 199, 200, 399, 400, ....
The effect of this introduction of new knowledge can be seen in Fig. 4, which
shows that the variability of the evaluation knowledge is maintained and does not
converge. Having the agents react to these changes in the world by altering the way
they do things crudely models the way they construct situations (interpretations of the
world around them) for themselves, and thus change, as they interact with other
agents in that world in the course of performing their activities [10, 11].
116

Fig. 4. Graph of the variability in terms of the standard deviations of the standard deviations of
the evaluation knowledge, expressed as criteria, used by the designers and consumers.
Fig. 5. Graph of the variability in terms of the means of the standard deviations of the designer and consumer criteria. The means of the designer criteria have been multiplied by 10 to make
them viewable at the same scale as the consumer criteria.
Another measure of the variability is the means of the standard deviations. If these
drop that is an indication of a drop in variability. If, however, they stay high then
variability is sustained. Fig. 5 shows the means of the standard deviation values of the
designer and consumer criteria.
Both graphs show that the variability is maintained throughout the entire process.
117

5 Discussion
In this paper we have presented a computational simulation that uses ideas from
situated cognition to model some of the social aspects of creative activity. In our
simulation, creativity does not stop as soon as an agent finishes producing some
design for a particular set of requirements, as in many traditional computational
models. Instead, we view creativity as an ongoing process that is influenced by factors
that are external to creative agents. Our model fits well within, and contributes a
computational implementation of, the DIFI (Domain-Individual-Field-Interaction)
framework proposed in [17], which views creativity as a property of the interaction
between individuals in a society (field) that belong to a given culture (domain).
Another model that is conceptually similar to the one we present here is described
in [18]. The model in [18] uses a direct interaction between the agents, unlike the one
we describe in this paper, but shares our interest in observing the emergence of
complex social behavior from the elementary interactions of individual behaviors. It
does so by having agents' knowledge not be static, and their "lives" not end as soon as
they produce satisfactory designs, but rather modify agents' knowledge based on their
changing situation as they proceed with their activities and interact with other agents,
and keep agents active throughout many problem-solving episodes. A preliminary
version of the model described in this paper appeared in [19].
There are no causal models of the relationship between consumer preferences and
the designers of the consumed designs. However, computational simulations like this
permit the testing of hypotheses and the observation of the resulting systemic
behaviors. The focus of this paper has been on the hypothesis that peer pressure and
market pressure are drivers of change in the way designers design creatively, and that
this occurs through the indirect observations that designers make of the opinions that
consumers and other designers have on their previous designs, rather than direct
communication between them. The paper described and showed the results of
experiments in which social behaviors emerged from this kind of indirect interaction.
Computational social science, from which this work is derived, provides the
techniques to experiment with behavior in silico, behavior that is too difficult to
experiment with in vivo. Complex social behavior can result from simple individual
behaviors. The results produced here demonstrate that the hypothesis that creativity is
both an individual and social phenomenon can be tested. The results indicate that
social interactions play a role in designers being continuously creative and that the
concepts of situated cognition play a role in our understanding of creativity.
Further experiments will be carried out where different ideas about how designs
and design criteria substitute for existing ones in order to model Schumpeter’s [20]
foundational concept of “creative destruction” will be tested.
Acknowledgements
This research supported by grants form the US National Science Foundation, grant
numbers CNS- 0745390 and SBE-0915482.
118

References
1. Jupp, J., Gero, J.S.: Towards a Computational Analysis of Style in Architectural Design.
Journal of the American Society for Information Science 57:11, 1537-1550 (2006)
2. Pérez y Pérez, R., Sharples, M.: MEXICA: A Computer Model of a Cognitive Account of
Creative Writing. Experimental and Theoretical Artificial Intelligence 13:2, 119-139
(2001) 3. Zitzler, E., Teich, J., Bhattacharyya, S.S.: Evolutionary Algorithms for the Synthesis of
Embedded Software. IEEE Transactions on Very Large Scale Integration (VLSI)
Systems: 8:4, 452-456 (2000)
4. Gómez de Silva Garza, A., Zamora Lores, A.: An Evolutionary Process Model for Design
Style Imitation. In: Gero, J.S., Goel, A.K. (eds.) Design Computing and Cognition '08.
Springer, Heidelberg, Germany (2008)
5. Mitchell, M.: An Introduction to Genetic Algorithms. MIT Press, Cambridge, MA, USA
(1998)
6. Leake, D.V.: Case-Based Reasoning: Experiences, Lessons, & Future Directions. AAAI
Press, Cambridge, MA, USA (1996)
7. Dechter, R.: Constraint Processing. Morgan Kaufmann, San Francisco, CA, USA (2003)
8. Stiny, G.: Introduction to Shape and Shape Grammars. Environment and Planning B: 7:3, 343-351 (1980)
9. Boden, M.A.: Dimensions of Creativity. MIT Press, Cambridge, MA, USA (1996)
10. Clancey, W.J.: Situated Cognition: on Human Knowledge and Computer
Representations. Cambridge University Press, Cambridge, UK (1997)
11. Schön, D.: The Reflective Practitioner: How Professionals Think in Action. Basic Books,
New York, NY, USA (1983)
12. Gero, J.S.: Situated design computing: Principles, in BHV Topping, (ed), Civil
Engineering Computations: Tools and Techniques, Saxe-Coburg Publications,
Stirlingshire, UK, pp. 25-35. (2007)
13. Epstein, J.M.: Generative Social Science: Studies in Agent-Based Computational
Modeling. Princeton University Press, Princeton, NJ, USA (2007) 14. Luke, S., Cioffi-Revilla, C., Panait, L., Sullivan, K., Balan, G.: MASON: A Multi-agent
Simulation Environment. Simulation 81:7, 517-527 (2005)
15. United States Census Bureau: Census 2000 Indexes of Industry and Occupation. United
States Census Bureau, Washington, DC, USA (2000)
16. Kalos, M.H., Whitlock, P.A.: Monte Carlo Methods. Wiley-VCH, Hoboken, NJ, USA
(2008) 17. Feldman, D.H., Csikszentmihalyi, M., Gardner, H.: Changing the World: A Framework
for the Study of Creativity. Praeger, Westport, CT, USA (1994)
18. Sosa, R., Gero, J.S.: Social Structures that Promote Change in a Complex World. Futures
40:6, 577-585 (2008)
19. Gómez de Silva Garza, A., Gero, J.S.: Exploring Knowledge Transfer in a Society of
Designers. In: 17th International Conference on Engineering Design (ICED), Vol. 8, pp.
99-110. Design Society (2009)
20. Schumpeter, J.A.: Capitalism, Socialism and Democracy. Harper, New York, NY, USA
(1942)
119

Constructing Conceptual Spaces for NovelAssociations
Kazjon Grace1, Rob Saunders1, and John Gero2
1 University of Sydney, New South Wales, Australia.2 Krasnow Institute for Advanced Study, Virginia, USA.
Abstract. This paper reports on a system for computational analogy-making based on conceptual spaces. The system constructs conceptualspaces that express the relationships between concepts and uses them tobuild new associations. A case for this conceptual-space driven model ofassociation making is made, and its advantages and disadvantages arediscussed. A prototype space-construction system is detailed and onemethod by which such a system could be used to make associations isproposed. The system forms concepts that are useful to describe a setof objects, then learns how those concepts relate to each other. Theserelationships can then be used to construct analogies.
1 Introduction
The generally accepted frameworks [1, 2] for computational analogy-making fo-cus on three processes: representation, mapping and transfer. Representationsof a source and target object are constructed, mappings are built between themand then knowledge is transferred from the source to the target. Existing mod-els of the representation process [3, 4] build representations out of a set of pro-vided components. Mappings produced by these systems must be constructed(by processes such as conceptual slippage or spreading activation) from relation-ships existing between those components. While the scope of representations inthe system can be broad, all possible kinds of relationship between representa-tions must be provided with the representational components. Representation inanalogy-making systems with a fixed set of representational components is re-duced to “choosing” between which of the pre-encoded relationships will underliethe mapping.
This research investigates an approach to computational association that ad-dresses this restriction: a system that constructs the conceptual space in whichit performs representation. If a system builds the relationships between its con-cepts through use, then potential avenues for mapping between those conceptsneed not be pre-encoded. We detail a system that learns concepts to describeits world, learns how those concepts relate, constructs a space using those rela-tionships, and then can find mappings through the reinterpretation of objectsin that space. In other words, a system in which the associations made are notjust expressed in the representations constructed but are situated in the system’s
120

experientially-derived conceptual space. Our hypothesis is that this increased au-tonomy in representation and mapping will aid in producing potentially creativeanalogies.
2 Association
This research defines association as the process of constructing a new mappingbetween two objects. The process involves identifying a match and buildinga mapping between the two objects that reflects that match. This process isfundamental to analogy-making, metaphor and other related tasks. We assumethat pattern recognition makes recognising mappings in existing representationsvirtually automatic. From this assumption we derive that associating two objectsis fundamentally a process of re-representing the objects to express a connectionbetween them. This is our notion of interpretation-driven association.
2.1 Interpretation-driven association
Modelling association as an interpretation-driven search has several benefits foran analogy-making system. Multiple associations between the same objects arepossible through the development of multiple interpretations of those objects.Each association is situated within the interpretation used to construct it, andany knowledge learnt or transferred through that mapping is also specific to thatinterpretation. Each association embodies a “new” match, in that the associationprocess produces a mapping between representations that was not previouslyknown to the system: it is s-creative [5].
The interpretation process involves concurrent re-representation of the ob-jects via a search of the system’s experiences with them until a viable represen-tation can be found. In a system governed by this idea of association it must bepossible to produce many different representations of one object. We model thisby allowing the concepts used to represent objects to have mutable meaningsthrough a process analogous to “conceptual slippage” in the Copycat system[3]. In appropriate circumstances, the meanings of two concepts can “slip” to-gether, allowing previously disparate objects to be matched. In Copycat, theseslippages can only happen along predefined paths and under predefined circum-stances. Our association system is freed from this constraint as it autonomouslydevelops the relations that cue the “slippage” process between concepts.
Our goal is to produce an analogy-making system that builds representationsout of concepts that it has learnt, but also to learn relationships between thoseconcepts. This would allow the system to “slip” the meanings of concepts withoutpredefined paths along which to do so. To do this requires the solution of twoproblems: we need to learn relationships between the concepts produced by thesystem, and we need to use those relationships to produce new interpretationsand thus associations.
121

2.2 Conceptual spaces as a model of experience
In this research we use the notion of conceptual spaces to describe how conceptsrelate to each other and how those relationships can be used in association. Aconceptual space is an abstract construct in which all the concepts of a systemare located. A conceptual space contains knowledge about how concept meaningsrelate to each other and about how concepts have been used in conjunction witheach other. The conceptual space is an abstraction of a system’s experiencesover the course of its operation and it can be used to put the act of perceivingan object in the context of a system’s past. Our system re-interprets objectsby drawing on this knowledge of related past experiences to find another set ofconcepts that can be used to describe the object.
Conceptual spaces for analogy-making must contain rich and interrelateddescriptions of the features that comprise objects. It is not sufficient to producea conceptual space in which each object is represented by a single point as thespace must express relationships between the concepts used to describe objects,not between the objects themselves. Gardenfors’ “theory of conceptual spaces”[6] states that conceptual spaces are defined by quality dimensions, or “aspectsor qualities of the external world that we can perceive or think about”. If therelationships in a space can be expressed in terms of a few quality dimensionsthen any mapping produced within the space will be derived from those fewqualities. Our definition of conceptual spaces does not imply that the spacescontain any globally coherent organisation.
The mechanism governing the location of concepts in space varies by im-plementation, but at minimum our definition states that proximal concepts arein some way similar. In our system the spaces are defined by undirected multi-graphs, with each node being a concept and each edge being a relationship. Someidea of the similarity between concepts can be gained through the edge distancebetween any two concepts, but as each edge can represent different kinds ofrelationships there is no notion of moving in a defined “direction” in the space.
Concept-to-concept relationships can be learnt through how the system ac-quires and uses concepts. Relationships in conceptual space in our prototype taketwo forms; similarity between the meanings of concepts and similarity betweenthe usage of concepts. We can use these relationships to reinterpret objects.
2.3 Matching in conceptual spaces
Each object can be represented within the conceptual space as a set of nodes,one for each of the concepts that describe it. These concepts form a region inconceptual space that describes the object. Finding a way to reinterpret theconcepts used in this representation involves finding another region of conceptsthat can be mapped onto this one. When two regions in conceptual space aremapped onto one another, one describing a source object and one describing atarget object, it can be said that the concepts within those representations havehad their meanings “slipped” together. This results in representations of the twoobjects that reflect an association between them.
122

If a structural similarity exists between the conceptual regions associatedwith two objects, then the ways the system models those two objects can be seenas alike. Once a mapping between the concepts in two regions is found, we canproduce an interpretation of one object using the concepts associated with theother. The structural similarity between two conceptual regions is indicative ofhow the system’s experiences with those two objects have had similar structure.We can say that there are concepts in both regions playing similar roles withinthat group of concepts, and with similar patterns of relationships with theirneighbours. This approach is syntactic in that it matches on the structure ofconceptual space rather than its content, but that structure is learnt through thesystem’s interactions with its world. Therefore what is being mapped is semanticinformation at the object level expressed as structural information within theconceptual space.
This research is concerned with developing a system that can both learnits own concepts and learn how those concepts relate to each other. The moreremoved the experimenter-provided data is from the analogies being made bythe system, the more defensible is the claim that the system has autonomouslyconstructed a new association. A system based on these principles would a) learna set of concepts to describe the objects in its world, b) learn how those conceptsrelate to each other in both definition and usage, c) construct a conceptual spaceembodying the relationships between concepts, d) find a match between thestructure of the regions in conceptual space that reflect the target object and asource and e) interpret the target and source objects to reflect the mapping thathas been constructed between the concepts used to describe them.
We have developed a prototype of our approach to association constructionthat implements concept formation, conceptual interrelation, conceptual spaceconstruction and a limited form of matching. While this prototype does not yetproduce compelling or interesting analogies, it serves as a proof of concept forour framework and its behaviours offer some insight into our theories.
3 A System for Constructing Spaces
We have developed a system capable of constructing conceptual spaces for analogy-making. An overview of the system can be seen in Figure 1. The system takesa set of objects, learns concepts to describe them, learns relationships betweenthose concepts, constructs a graph of those relationships and then searches forpossible mappings within that graph.
The system operates in a very simple shape perception domain from whichit receives symbolic perceptual input about objects. A future development goalis for the system to take lower level sensory input and learn its own perceptualrepresentations of objects, but symbolic input is sufficient for the purpose oftesting the construction of spaces. The system then learns a set of conceptsthat can uniquely describe each of the objects, using a method based on thediscrimination agent architecture developed by Steels [7]. Discrimination-based
123

Discriminate between objects by learning patterns of percepts.
Percepts (sparse vector of active percepts)
Construct a space of concepts organised by their literal similarity.
Construct a space of concepts organised by how they have been used together.
All concepts (concept definitions as percept sets)
Active concepts
Construct a graph of the relationships between concepts.
Space of concepts(by experience)
Space of concepts (by similarity)
Find regions of the source and target object graphs that share structure.
Concept relationships graph
Fig. 1. A diagram of our system, showing the process from perceptual input on theleft to the generation of possible matches on the right.
learning was chosen for its simplicity and prevalence as a reinforcement strategyin concept formation.
Similarity relationships between concepts are then calculated based on sharedpercepts, while the experiential relationships between concepts are calculatedbased on which concepts co-occur with each other. These relationships are ex-tracted from the set of concepts using the singular value decomposition processdescribed in Sarkar et al. [8]. This method extracts an underlying set of struc-turally important vectors from the concept usage and definition data and thendescribes individual concepts in terms of those vectors. Concepts with similarcomposition in this “singular value” representation are similar in ways that aresignificant in the dataset. Concepts that are sufficiently similar by either theliteral or co-occurence metrics are judged to be related and an edge connectingthem is added to the conceptual space graph. This graph can then be searchedfor matching sub-regions.
3.1 Example domain
The Line Grid domain used in this research is designed to be a simple visual wayto investigate concept formation and space construction. The emphasis is not onthe potential for interesting associations, but on the utility for testing conceptualspace construction. A line grid of size n is an n-by-n grid of points that can eachbe connected to any other point orthogonally or diagonally adjacent to them.Figure 2 shows four objects in the size three line grid. Sufficient versatility existsin this domain to describe polygonal shapes, isometric depictions of 3D objects,line patterns and a simple but complete typeface of capital letters. A line gridshape is described by a binary string indicating which of the possible edges existin that shape. Our system has been tested for size three and four line grids,which have twenty and forty-two possible edges respectively.
Concepts in this domain are patterns of edge presence and absence thatexist in multiple shapes. Relationships between these concepts show how thoseconcepts are similar (identifying similar patterns of edges), or how those conceptsare used (identifying that they form discriminating sets together).
124

Fig. 2. A set of example objects in a 3x3 version of our line grid shape domain.
For example, in the set of 26 objects representing the capital alphabet, theserelationships include things such as “objects containing an enclosed space in thetop half of the letter” being used together with “objects containing a strokedown the left side”, as in the letters P, B and R. These relationships would thenbe compiled into a conceptual space expressing the patterns of relationshipsbetween the concepts learnt by the system to describe the capital alphabet inthe Line Grid domain. The system would then look for matches in the structureof regions of the conceptual space; areas in which other concepts play the same“role” in their groups of related concepts as the source object’s concepts do inits conceptual region. If a group of concepts can be found that shares structurewith the group that describes the target, then another object that is describedby that group may be a potential source.
An example of a proportional analogy that could be made in the Line Griddomain by a complete analogy-making system is seen in Figure 3. Given lettersin a consistent typeface, the system would find that similar structures existedbetween pairs of letters. In this case, the difference between the letters ‘I’ and‘T’ could be considered analogous to the difference between the letters ‘F’ and‘E’.
Fig. 3. Two examples of matches between pairs of objects in the domain that could befound by a complete analogy-making system and expressed as a proportional analogyof the form “I is to T as F is to E”.
3.2 Concept formation
Our prototype concept formation system is designed to produce sets of conceptsthat are suitable for association in conceptual space. It is desirable that each
125

object is described by many concepts in order for conceptual spaces to be moreinteresting and for potential matches to be more varied. An Accuracy-BasedClassifier System [9] modified to reinforce based on discriminative success waschosen as the concept learning algorithm. This algorithm was chosen due to itsability to extract patterns from representations and thus produce many conceptsper object. Concepts produced by the system represent patterns of perceptsthat are useful for telling objects apart from their peers. Concepts use a similarrepresentation to objects but are defined as trinary strings as each concept mayrequire, forbid or not care about each edge in the grid.
The concepts are evolved to be able to discriminate an object from all othersin the given set. Learning about a set of objects via attempting to tell themapart is a common approach to concept formation and is described in Steels[7], where the discrimination occurs for the purpose of a set of agents tryingto co-operatively learn language. The principle has been applied to an analogy-making system based on the idea that it must first be possible to tell objectsapart before any interesting ways can be found to put them together. Conceptscan be combined together to discriminate a chosen object from its context, witheach concept discriminating that object from one or more other objects. This set-based reinforcement method means that each individual concept will be rewardedif it is a part of any discriminating set. As the goal is to produce a rich set ofgeneral concepts, there are no limits on the size of each set or the number ofdiscriminating sets that can be found: this promotes the development of multipledivergent approaches to discriminative success.
The classifier system was able to find a stable and compact set of generalconcepts to describe up to 100 objects in the 4x4 line grid domain. A plot of thesystem’s performance over 10,000 generations on a twenty object problem in the4x4 domain can be seen in Figure 4. The system reached 100% discriminatorysuccess after 1,300 steps with approximately 600 concepts, but the populationcontinued growing to 3,950 concepts after 6,000 steps. The system then reacheda saturation point where enough diversity existed in the population to subsumemost new classifiers into existing more general ones and the population rapidlydeclined. After approximately 8,000 steps the system had found 125 generalconcepts and maintained 100% discrimination rates. The generalisation can beseen in the second data series, with the average number of objects matched perconcept rising to 2.5 with the generalisation process.
3.3 Inter-conceptual relationships
The construction of conceptual spaces is dependent on the system’s ability toform relationships between the concepts that it has learnt. In our system wehave identified two kinds of conceptual relationship to model: experiential co-occurence, or when two concepts are used together in discrimination tasks, andliteral similarity, or when two concepts describe similar properties of objects.Experiential co-occurence relationships are designed to allow the associationsystem to match between concepts that are “used” the same way: concepts thatplay a role in their group of concepts that is analogically equivalent to the role
126

Fig. 4. The results of a run over 10,000 generations with a 4x4 grid and 20 randomobjects. The population of concepts is shown at the left, while the average number ofobjects that each concept can be used to describe is shown on the right.
played by the source concept in its group. Similarity relationships are designed toallow the system to match between the pattern of differences that exist betweenthe meanings of concepts in the two conceptual groups.
A conceptual space graph is formed where each relationship is described aseither literal or experiential and is labelled by the difference between the conceptsit connects. The structure of a region in conceptual space would then be describedby the structure of differences between its concepts. Similarly structured regionscan then be found that contain potential mappings between pairs of conceptsthat play the same “role” in their local area of conceptual space.
We employ Singular Value Decomposition (SVD), a linear algebra methodwith uses in statistical natural language processing, data mining and signalsprocessing. In our work SVD calculates connections between the meanings andusages of concepts the system has learnt. The experiential co-occurence is cal-culated by running the SVD algorithm on a co-occurence matrix of conceptsin discrimination sets. The literal similarity is calculated by running the SVDalgorithm on a matrix of concept definitions in terms of which grid line edgesthey match and which they forbid. The advantage of the SVD approach in cal-culating literal similarity is that the algorithm is able to extract which grid linesrepresent important differences between concepts and reflect that accordingly,which the use of a literal distance measure would not do.
3.4 Constructing spaces
The space construction process takes the relationships identified by the SVDengine and compiles them into a coherent graph representation that can thenbe searched for matches. In the current prototype conceptual graph edges arelabelled only as “similarity” or “co-occurence”. Future versions of this systemwill label edges by how the concepts differ. The current system is able to seepatterns and structures in the body of concepts learnt by the system, but not
127

the specifics of how those patterns relate to each other beyond the kind andnumber of relationships involving each concept.
The correlations between concepts using the two metrics produced by theSVD algorithm are compared to a threshold and sufficiently similar concepts areassigned an edge of the appropriate type. An example of part of a simple graphproduced by the system can be seen in Figure 5. This graph shows some of theconcepts learnt discriminating a small set of objects. There are two broad groupsof literally related concepts connected by solid lines and between those groupsare concepts connected with dashed lines indicating co-occurence.
Fig. 5. Part of a graph describing relationships between concepts. Solid edges indicateconcepts that are literally similar, while the dotted edges indicate co-occuring concepts.
4 Discussion
Conceptual relations and conceptual spaces can be constructed in the courseof learning to describe a set of objects. We have performed simple matchingbetween groups of concepts in constructed spaces, but producing more inter-esting associations in these spaces will require a richer description of conceptrelationships. The current system can only match between relations labelled as“similarity” or as “co-occurence”. Much richer information about the natureof the relationships between concepts exists in the singular values produced bythe SVD system. A detailed set of relations extracted from the singular valueswill permit a more complete labelling of edges in conceptual graphs. Edges be-tween related concepts can be labelled by what differs between them, allowingfor matches to other concept groups with a similar pattern of differences.
Incorporation of a confidence attribute for relationships (the data for whichexists in the SVD output) would allow the system to preferentially match be-tween strongly related concepts but to search weaker links if no strong mappingswere found. Association in the resulting conceptual space would then involvesubgraph isomorphism between the labelled graphs; mapping between groups of
128

concepts with similar patterns of relationships between them, with each rela-tionship defined by its type, strength and the specifics of the difference betweenits concepts.
Like many concept formation systems, learning of concepts in our prototypesystem is grounded in the ability to discriminate between objects. Our systemproduces a set of general concepts to identify each of a set of objects by how it isdifferent from its peers. As a result the graphs produced by our system representthe ‘similarity between differences’ and the ‘co-occurrence of similar differences’.What is necessary for analogy-making is to extract common sub-componentsthat when combined describe the objects themselves rather than describe thedifferences between objects. Therefore discrimination-based concept formationmay not be suitable for analogy-making systems.
We have described the benefits of an analogy-making system that constructsits own conceptual spaces. In order to operate as a complete analogy-makingsystem the prototype described here requires additional features, most notablythe ability to evaluate potential mappings both in terms of analogical quality andhow they relate to previous analogies made by the system. With more detailedconceptual space construction and a revised concept formation process such asystem could produce interesting and potentially creative analogies.
References
1. French, R.: The computational modelling of analogy-making, Trends in ComputerScience, 6: 200–205, (2002).
2. Kokinov, B.: Analogy is like cognition: dynamic, emergent and context sensitive,Advances in Analogy Research NBU Press, Sofia, (1998).
3. Hofstadter, D. and Mitchell, M.: The copycat project: a model of mental fluidity andanalogy-making, in Holyoak, K. and Barnden, J. (eds), Advances in Connectionistand Neural Computation Theory, 2: 31–112, (1994).
4. Kokinov, B.: A hybrid model of reasoning by analogy, in K Holyoak and J Barnden(eds), Analogical Connections, Advances in Connectionist and Neural ComputationTheory, 2: 247–318, (1994).
5. Suwa, M., Gero J. S. and Purcell, T.: Unexpected discoveries and s-inventions ofdesign requirements: A key to creative designs, In: J. S. Gero and M. L. Maher (eds)Computational Models of Creative Design IV, University of Sydney, Australia, pp297–320, (1999).
6. Gardenfors, P.: Conceptual Spaces: The geometry of thought, MIT Press, (2000).7. Steels, L.: Perceptually grounded meaning creation, in Proceedings of the Second
International Conference on Mullti-agent Systems (ICMAS096) Los Alamitos, CA,pp 338–344, (1996).
8. Sarkar, S., Dong, A. and Gero, J. S.: Design optimization problem (re)formulationusing singular value decomposition, Journal of Mechanical Design 131(8) (to ap-pear), (2009).
9. Wilson, S.W.: Classier Fitness Based on Accuracy. Evolutionary Computation, 3(2):149–175, (1995).
129

Search Strategies and the Creative Process
Kyle E. Jennings
Institute of Personality and Social ResearchUniversity of California, Berkeley
Abstract. The human creative process can be likened to searching forsolutions to a problem. This work introduces a computerized aestheticcomposition task that is inspired by the “creativity as search” metaphor.Data from this technique can illuminate how personality and situationalinfluences affect the creative process, rather than merely noting that theyaffect the outcome. Beyond this, the technique can be used to highlightunderlying similarities between human creativity and optimization, aswell as the important differences. Early results with N = 34 participantssuggest that people’s search strategies do differ, and show connectionsbetween personality, evaluation criteria, and search strategy. Suggestionsfor future research are given.
1 Introduction
The creative process can be thought of as the search for an ideal solution to aproblem. One way to understand creativity is to understand this search process.This paper presents early results from a new behavioral research technique thatis based on the “creativity as search” metaphor. In the short term, this techniquewill allow researchers to understand how individual differences and situationalinfluences affect the creative process, instead of merely noting that they affectthe outcome. In the medium term, the technique will be used to understandsimilarities and differences between human creative search and optimization. Inthe long term, the hope is that this and related work will enable better com-munication among creativity researchers in the behavioral and computationaltraditions, eventually leading to a more integrative understanding of what cre-ativity is and how it occurs.
The paper begins with a discussion of creativity and search. Then, the aimsand design rationale for the new technique are presented, followed by illustrativeresults from an early application of the technique. Finally, future directions arediscussed.
1.1 Creativity as Search
Search can either be seen as finding a path from a starting state to a specificend state, or as finding the best solution from among many other solutions.The former case is relevant when the desired outcome is known but the means
130

for achieving it are not (for example, proving a mathematical theorem). Thelatter case is relevant when the desired outcome is unclear, such as during the“problem finding” stages of the creative process. At least in the arts, creativepeople seem to be distinguished by the problems they choose to solve, not by howthey solve them [1]. Accordingly, this research focuses on how people choose thebest solution from among competing alternatives, and not on how that solutionis realized.
In open-ended domains like the arts, choosing what solution to pursue isseldom a simple matter of deciding among a few known choices. Instead, thespace of possibilities is usually too vast to be considered simultaneously, meaningthat the search must proceed by iteratively considering subsets of the space. Howpeople control this iterative process can be called a search strategy, and includesthings like how people move from one subset to another, and how people evaluateeach solution. Though search strategies might be an important determinant ofhow creative the search outcome is, they are not directly observable. However, ifthe options under consideration at each stage can be at least partially observed,it becomes possible to trace how people move through the space of possibilitiesover time. This path is called a search trajectory, and offers clues as to whatkind of search strategy people are using.
This research examines search trajectories, and characterizes them by howcomplex they appear to be, which is tantamount to how straight of a path peo-ple take from their starting solution to the solution they eventually settle upon.At first blush simple trajectories might seem to reflect positive things like deci-siveness and expertise. However, they may also reflect unsophisticated strategiesthat are not well-matched to the nature of the problem. This is particularly likelywhen the aspects of a solution that can be manipulated (the control dimensions)have complex relationships to the criteria that the solution is evaluated on (theevaluation dimensions). In these cases, simple strategies like repeatedly mak-ing incremental improvements until nothing can be improved upon can backfire,since they might miss a drastically different solution that is far superior (see [2,3]).
1.2 Instrument Design
As the foregoing suggests, a research instrument is needed that can track peo-ple’s search trajectories. Because psychological studies involving personality andsituational influences often require large samples, this technique should be as eco-nomical to apply as possible, and should be simple to apply consistently acrossstudies. Also, while high-resolution data are needed, they must be tractableenough to gain insights about as the technique is developed. All of this must beachieved without unduly straining the connection to creativity.
Existing creativity research techniques are not well-suited to these require-ments. Table 1 characterizes insight tasks (e.g., [4, 5]), holistic assessment of endproducts (e.g., [6]), divergent thinking tests (e.g., [7]), and protocol analysis (e.g.,[8]) according to whether they provide trajectory data, are economical to apply,
131

Instrument Trajectory Economical Consistent Tractable Face Valid
Insight tasks no yes yes yes mid1
Holistic assessment no mid mid2 yes yes3
Divergent thinking possibly4 no mid5 mid4 mid1
Protocol analysis possibly6 no possibly6 no yes3
Exploration task yes yes yes yes mid1 — only represents one part of the creative process; 2 — while findings can be replicated acrossdifferent tasks and raters, ratings can’t be compared across samples; 3 — provided the task is a
face valid creative task; 4 — with techniques under development (see [9]); 5 — norms available, butoften not used; 6 — depending on how applied
Table 1. Comparison of creativity measurement techniques.
can be applied consistently, yield tractable data, and are face valid operational-izations of creativity. None of the techniques provides detailed trajectory datain an economical manner.
The technique developed here is a computerized aesthetic composition task.Participants have a fixed amount of time to explore a three-dimensional sceneon the computer, with the goal of finding the image that most captures theirinterest.1 Participants can manipulate two things: the camera position, and theposition of a light source. However, because of the reflection, refraction, andshadows caused by the interplay of the materials and the light, the task is bothless straightforward and more amenable to creative outcomes. (See Figs. 1, 3.)
The exploration task results in a moment-to-moment map of the search tra-jectory. Since there are only two control dimensions (camera and light angle),the search trajectory can be visualized to develop intuitions about the data. Thetask itself can be economically and consistently applied within typical psycholog-ical experimental conditions. Various metrics have been defined for analyzing thesearch trajectory (discussed later), with more sophisticated ones to be developedover time.
Perhaps the least satisfying aspect of the task is its relation to real-worldcreativity. However, nothing short of in vivo studies of working creators will givea perfect match. Laboratory tasks sacrifice this external validity in order to gaincontrol. The exploration task encompasses more of the creative process thaninsight or divergent thinking tasks. While more constrained than typical tasksused with holistic assessments, the technique yields essential trajectory data.
Despite how constrained the task is, it is sufficiently complex to require morethan ordinary problem solving. First, there is no single best solution. Instead,people will prefer different configurations based on the criteria they use, andwould likely find that many configurations satisfied their criteria. Second, pro-vided that people attend to the interplay among the materials in the scene, thereis no simple relationship between the two control dimensions and the many eval-
1 “Interest” incorporates aesthetic concerns [10] but admits more solutions than “aes-thetically pleasing” without attracting merely odd solutions as “creative” might.
132

uation dimensions. If data visualization is not a major concern, more controldimensions can be added to increase the complexity.
2 Early Results
2.1 Methods
A preliminary experiment was run with N = 34 people, who participated inexchange for course credit. Though it is possible that the experiment description(“perform an aesthetic composition task”) attracted more aesthetically-orientedindividuals, none of the participants majored in the arts.
After signing consent forms, participants were seated at a computer and in-structed to begin the experiment, which proceeded automatically. To becomefamiliar with the user interface, participants has up to two minutes to completethe exploration task using a simple scene consisting of a non-reflective, monochro-matic arch on a checkered surface with a monochromatic sky. Next, they had upto five minutes to complete the exploration task using the more complex sceneshown in Fig. 1, with the goal of finding the image that most captured theirinterest. In both scenes, the camera and light were a constant distance fromthe center, with the angles adjustable in four degree increments. Participantscould explore the 3D scenes by manipulating the camera and light angles usingeither a knob that could be rotated to any angle, or buttons that moved one stepclockwise or counterclockwise. A timer showed the elapsed and remaining time,as well a button to press when finished. Participants could choose to continuebefore the time limit expired.
After the exploration task, participants rated their liking of a subset of im-ages from the scene. Due to problems with this measurement, these data arenot analyzed here. Participants then wrote a few sentences describing how theyapproached finding the image that most captured their interest. Finally, theycompleted four questionnaires in a random order (item order was also random).Overall personality was assessed using the Big Five Inventory (BFI) [11]. Cron-bach’s α for the Extraversion, Agreeableness, Conscientiousness, Neuroticism,and Openness dimensions were .82, .79, .79, .91, and .84, respectively. Threeadditional scales were included, but since no relationships were found with thesescales, they are not discussed. Participants were debriefed upon completion.
2.2 Results
Metrics The following metrics are used to characterize the search trajectory.Where applicable, care was taken to ensure that these metrics properly reflectthe circularity of the coordinates.
Time Time elapsed between the first movement and the last movement. Themedian time was 1:10 (minutes : seconds), and the lower and upper quartileswere 0:51 and 1:43, respectively. The maximum time was 2:55, indicatingthat the five minute time limit was more than sufficient.
133

Fig. 1. Exploration interface, showing the experimental scene.
Coverage Percentage of the search space encountered, M = 1.84% and SD =0.70%. Unsurprisingly, each person explored only a small part of the space.
Fixations Number of points where the person lingered, determined by doing aGaussian kernel density estimate over the time spent per coordinate (σ11 =σ22 = 8 degrees), and then counting the local maxima,M = 15.8, SD = 5.75.
Fixation Diversity The mean inter-fixation point distance was calculated forthe upper 50% of each trajectory’s fixation durations (which tended to be lesssimilar to each other in duration than the lower 50%), M = 117, SD = 16.6.
Dimension Changes Times that the search switched control dimensions. Fol-lows a Poisson distribution with λ = 2.26. The modal value was one, indi-cating that most people searched one dimension, and then the other.
Rate The average number of new views per second, M = 3.09 and SD = 1.12.Reversals Time that a trajectory switches direction along a single dimension,
M = 10.56 and SD = 6.92.
Additionally, the outcome of the search can be characterized by how unusual thefinal point is, which will be called unusualness. The calculation is based on theaverage distance between the current search’s final point and every other search’sfinal point. To make unusualness more interpretable, the average distance is di-vided by the mean of the average distances, and the log (base 2) taken. The meanis approximately zero, though in principle it needn’t be. The intercorrelationsbetween the metrics are shown as part of Table 2.
Criteria and Complexity The key question is how complex people’s searches are,and what determines their complexity. One source of complexity is the nature
134

2 3 4 5 6 7 8 9 10 11 12 13Metrics1. Total Time .59∗∗∗ .27 .08 .15 .37∗ -.35∗ -.11 -.02 .36∗ .10 .20 .15
2. Coverage — .84∗∗∗ .24 .59∗∗∗ .51∗∗ .30+ .22 .09 .46∗∗ .27 .28+ -.05
3. Fixations — .32+ .67∗∗∗ .47∗∗ .37∗ .33+ .22 .36∗ .31+ .26 -.044. Fix. Diversity — .21 .21 .04 -.25 .23 -.04 .39∗ .18 .07
5. Dim. Changes — .28+ -.00 .16 .31+ .10 .38∗ .12 .02
6. Reversals — .32+ .42∗ .03 .38∗ .08 .38∗ .167. Rate — .46∗∗ -.05 .34∗ -.04 .05 -.068. Unusualness — -.05 .34∗ .04 -.04 -.13Big Five
9. Extraversion — .31+ .41∗ -.06 -.1210. Agreeableness — .24 -.08 -.0511. Conscientiousness — -.28 -.43∗
12. Neuroticism — .1813. Openness —
+p < .1, *p < .05, **p < .01, ***p < .001
Table 2. Intercorrelations between metrics and personality.
of the problem itself. The intent in designing these scenes was to introduceproblem complexity via the interplay between materials. However, people werefree to choose what criteria they used, and if they did not notice or care aboutthis interplay, their criteria may have been simpler.
For illustration, two sample trajectories are shown in Fig. 2. Each trajectorystarts at the cross and ends at the ‘X’, with color indicating the passage oftime (light blue to black). The size of the circle at each point is proportionalto how long the person spent looking at that image. The participant on the leftdid not mention material properties when describing his/her criteria, while theparticipant on the right did.
To test whether criteria involving the interplay between materials was as-sociated with more complex search trajectories, participants’ open-ended de-scriptions of their search process were coded for whether they mentioned ma-terial properties (e.g., reflection, refraction, transparency, and color). Compar-isons were made between people who mentioned material properties (N = 14)and those who did not (N = 20). Statistically controlling for time, people whomentioned material properties made more dimension changes (M = 1.77 vs.M = 2.96, adjusted). No other effects were significant.
Individual Differences There were some interesting individual differences insearch strategies. Most notably, the time spent searching was significantly andpositively related to the trait “agreeableness” (a tendency to be compassion-ate and cooperative), basically suggesting that nice people took the experimentseriously. People who are more conscientious (self-disciplined, duty-bound, andachievement oriented) trended toward exploring more of the space, explored morediverse regions in the space, and made more dimension changes. Finally, peoplewho are more neurotic (prone to stress and anxiety) showed more reversals intheir search.
135

Tim
eC
over
age
Fix
ati
ons
Fix
.D
iv.
Dim
.C
hgs.
Rate
Rev
s.U
nusu
al
1:4
51.6
7%
11
131
22.0
38
-.19
1:5
23.7
4%
32
127
93.3
719
.13
Fig.2.
Tw
osa
mple
searc
htr
aje
ctori
es.
136

A
B
C
D
0 90 180 270 360
090
180
270
360
Camera Angle
Ligh
t Ang
leA
B
C
D
Fig. 3. Final points, with four examples.
Overall, these results show that search strategy is largely dependent upon howthoroughly the participant approached the task, which appeared to be higher forpeople who either nicer (agreeable) or careful and duty-bound (conscientious).Conscientious people in particular appeared to “leave no stone unturned”, asevidenced by more dimension changes. Beyond this, more anxiety-prone (neu-rotic) people reversed their search direction more. All of these effects appear tobe independent of the effect of criteria complexity, which was itself unrelated topersonality.
Final Points Fig. 3 shows the final points for all 34 participants. As images B,C, and D illustrate, there was a strong preference for images where the threeobjects were composed evenly. (The apparent diagonal line does not correspondto any regular pattern when examined further.)
As shown in Table 2, the unusualness of the final point appears to be pos-itively related to the rate of the search and the number of reversals, and toagreeableness. After controlling for rate or reversals, the effect for agreeablenessis insignificant, suggesting that there may be a mediating effect. If replicable,this would suggest a mechanism by which agreeable people might reach moreunusual points. The ability to detect mediating relationships between externalvariables (like personality or situational influences) and outcomes (like unusu-alness or creativity) via search trajectory characteristics is a strength of thisapproach.
Taken together, these early results show areas of promise and room for improve-ment. First, while some people did appear to notice the material properties,and while this did appear to have some influence on search strategies, the ef-fect was not very large. In future experiments, the scene should be designed tomake the material interplay more apparent. Second, while there were interest-ing relationships between search strategies and personality, the strong effect ofagreeableness says more about the experimental setting than about the nature
137

of the task itself. Future experiments should find ways to encourage people totake the task more seriously without inducing undue demand characteristics.Third, while the metrics themselves have intuitive meanings, more work needsto be done to find and understand the most relevant metrics for characterizingdifferences between trajectories. Despite these problems, the initial experimentwas able to find meaningful relationships among variables and sufficient inter-individual variability to suggest there is more to be found in future studies.
3 Discussion
This paper describes a new research technique for making detailed observationsof the human creative process. While not as face valid as protocol analysis orholistic assessment, the technique is more economical and offers more detailedinformation, making it well-suited for the aims of investigating how personalityand situational influences affect the creative process, and for exploring connec-tions between creativity and optimization. Preliminary results using the tech-nique show that there are many differences in how people approach the searchtask, some of which stem from personality variables, and some of which stemfrom what sorts of images people prefer.
Future Directions The next step in this research is to better understand the ex-perimental task itself, which includes honing the user interface and experimentalsetting, refining and better understanding the search trajectory metrics, and ex-perimenting with scenes of varying complexity. From here, specific questions canbe explored that will add detail to current psychological knowledge about howvarious personality and situational influences affect creativity.
Beyond the exploration user interface, three additional user interfaces havebeen constructed. One interface selects representative points from the searchtrajectory, and asks participants to rate their interest in each image. Anotherinterface plays the entire search trajectory back at low speed, allowing partici-pants to provide a continuous rating of what they’re seeing. The final interfaceasks participants to rate the similarity of pairs of images from the space, whichcan be analyzed with multidimensional scaling. These tools are designed to re-construct participants’ overall evaluations of representative points in the space,and to determine what evaluation dimensions participants use.
With these additional interfaces, the goal is to demonstrate that the scene be-ing explored has two features: interdependencies, and local maxima. Interdepen-dencies are desirable properties that conflict with each other (such as brightnessdiminishing reflections), in turn making the search less straightforward. Localmaxima are points in the space that are better than similar points, but worsethan very different points.
As stated at the outset, finding the best overall point is more difficult forproblems that have interdependencies and local maxima. Metaheuristics are aclass of non-deterministic algorithms for optimizing in such cases, and work bycarefully tilting the balance from diversification (exploring many possibilities)
138

toward intensification (pursuing a single local maximum) [2]. The explorationtask should yield data suitable for detecting similar tendencies in human cre-ators. By showing links between the nature of creativity and optimization aswell as between how humans and computers approach each, this research willhelp expand the “creativity as search” metaphor.
While the aim of this technique is to be comprehensive yet economical, thereis nothing preventing more complex applications. One such avenue would be tohave participants think aloud as they search, which could then be analyzed andcorrelated with their search behavior. While time-consuming, this work couldhelp determine things like whether and when people’s criteria change mid-search,and how aware people are of their exploration strategies. This kind of work will beparticularly useful for determining where creative search and optimization differ,and could even suggest new insights for authors of optimization algorithms,creative artificial intelligence, or creativity simulations.
References
1. Getzels, J.W., Csikszentmihalyi, M.: The Creative Vision: A Longitudinal Studyof Problem Finding in Art. John Wiley & Sons, New York (1976)
2. Blum, C., Roli, A.: Metaheuristics in combinatorial optimization: Overview andconceptual comparison. ACM Computing Surveys 35(3) (2003) 268–308
3. Jennings, K.E.: Adjusting the novelty thermostat: Courting creative successthrough judicious randomness. In: Proceedings of the AAAI Spring Symposiumon Creative Intelligent Systems, Stanford, CA, AAAI Press (March 2008)
4. Duncker, K.: On problem-solving (L. S. Lees, trans.). Psychological Monographs58(5) (1945) Whole No. 270
5. Mednick, S.A.: The associative basis of the creative process. Psychological Review69(3) (1962) 220–232
6. Amabile, T.: Social psychology of creativity: A consensual assessment technique.Journal of Personality and Social Psychology 43(5) (1982) 997–1013
7. Guilford, J.P.: The Nature of Human Intelligence. McGraw-Hill, New York (1967)8. Ericsson, K.A., Simon, H.A.: Protocol Analysis: Verbal Reports as Data. MIT
Press, Cambridge, MA (1984)9. Jennings, K.E.: Early results with faceted classification of “alternate uses” test
responses. In: C&C ’09: Proceeding of the seventh ACM conference on Creativityand Cognition, New York, NY, USA, ACM (2009) 383–384
10. Silvia, P.J.: Exploring the Psychology of Interest. Oxford University Press, Oxford,England (2006)
11. John, O.P., Srivastava, S.: The big-five trait taxonomy: History, measurement, andtheoretical perspectives. In Pervin, L.A., John, O.P., eds.: Handbook of personality:Theory and research. 2 edn. Guilford Press, New York (1999) 102–139
139

Automatic Generation of Musicfor Inducing Emotive Response
Kristine Monteith, Tony Martinez, and Dan Ventura
Computer Science DepartmentBrigham Young University
[email protected], [email protected],[email protected]
Abstract. We present a system that generates original music designedto match a target emotion. It creates n-gram models, Hidden MarkovModels, and other statistical distributions based on musical selectionsfrom a corpus representing a given emotion and uses these models toprobabilistically generate new musical selections with similar emotionalcontent. This system produces unique and often remarkably musical se-lections that tend to match a target emotion, performing this task at alevel that approaches human competency for the same task.
1 Introduction
Music is a significant creative achievement. Every culture in history has incorpo-rated music into life in some manner. As Wiggins explains, “musical behavior isa uniquely human trait...further, it is also ubiquitously human: there is no knownhuman society which does not exhibit musical behaviour in some form” [1]. Per-haps one of the reasons musical behavior is tied so closely to humanity is itsability to profoundly affect human physiology and emotion. One study foundthat, when subjects were asked to select music that they found to be partic-ularly pleasurable, listening to this type of music activated the same areas ofthe brain activated by other euphoric stimuli such as food, sex, or illegal drugs.The authors highlight the significance of the fact that music has an effect on thebrain similar to that of “biologically relevant, survival-related stimuli” [2].
Computing that possesses some emotional component, termed affective com-puting, has received increased attention in recent years. Picard emphasizes thefact that “emotions play a necessary role not only in human creativity and in-telligence, but also in rational human thinking and decision-making. Computersthat will interact naturally and intelligently with humans need the ability to atleast recognize and express affect” [3]. From a theoretical standpoint, it seemsreasonable to incorporate emotional awareness into systems designed to mimic(or produce) human-like creativity and intelligence, since emotions are such a ba-sic part of being human. On a more practical level, affective displays on the partof a computerized agent can improve function and usability. Research has shownthat incorporating emotional expression into the design of interactive agents canimprove user engagement, satisfaction, and task performance [4][5]. Users may
140

also regard an agent more positively [6] and consider it to be more believable [7]when it demonstrates appropriate emotional awareness.
Given music’s ability to alter or heighten emotional states and affect physio-logical responses, the ability to create music specifically targeted to a particularemotion could have considerable benefits. Calming music can aid individuals indealing with anxiety disorders or high-anxiety situations. Joyful and energizingmusic can be a strong motivating force for activities such as exercise and physi-cal therapy. Music therapists use music with varied emotional content in a widearray of musical interventions. The ability to create emotionally-targeted musiccould also be valuable in creating soundtracks for stories and films.
This paper presents a system that takes emotions into account when creatingmusical compositions. It produces original music with a desired emotional con-tent using statistical models created from a corpus of songs that evoke the targetemotion. Corpora of musical data representing a variety of emotions are collectedfor use by the system. Melodies are then constructed using n-gram models rep-resenting pitch intervals commonly found in the training corpus for a desiredemotion. Hidden Markov Models are used to produce harmonies similar to thosefound in the appropriate corpus. The system also selects the accompanimentpattern and instrumentation for the generated piece based on the likelihood ofvarious accompaniments and instruments appearing in the target corpus. Sinceit relies entirely on statistics gathered from these training corpora, in one sensethe system is learning to imitate emotional musical behavior of other composerswhen producing its creative works. Survey data indicates that the system com-poses selections that are as novel and almost as musical as human-composedsongs. Without creating any rules for emotional music production, it managesto compose songs that convey a target emotion with surprising accuracy relativeto human performance of the same task.
Multiple research agendas bear some relation to our approach. Conklin sum-marizes a number of statistical models which can be used for music genera-tion, including random walk, Hidden Markov Models, stochastic sampling, andpattern-based sampling [8]. These approaches can be seen in a number of differ-ent studies. For example, Hidden Markov Models have been used to harmonizemelodies, considering melodic notes as observed events and a chord progressionas a series of hidden states [9]. Similarly, Markov chains have been used to har-monize given melody lines, focusing on harmonization in a given style in additionto finding highly probable chords [10].
Genetic algorithms have also been used in music composition tasks. De laPuente and associates use genetic algorithms to learn melodies, employing a fit-ness function that considers differences in pitch and duration in consecutive notes[11]. Horner and Goldberg attempt to create more cohesive musical selectionsusing a fitness function that evaluates generated phrases according agreementwith a thematic phrase [12]. Tokui and Iba focus their attention on using ge-netic algorithms to learn polyphonic rhythmic patterns, evaluating patterns witha neural network that learns to predict which patterns the user would most likelyrate highly [13].
141

Musical selections can also be generated through a series of musical grammarrules. These rules can either be specified by an expert or determined by statis-tical models. For example, Ponsford, Wiggins, and Mellish use n-gram statisti-cal methods for learning musical grammars [14]. Phon-Amnuaisuk and Wigginscompare genetic algorithms to a rule-based approach for the task of four-partharmonization [15].
Delgado, Fajardo, and Molina-Solana use a rule-based system to generatecompositions according to a specified mood [16]. Rutherford and Wiggins analyzethe features that contribute to the emotion of fear in a musical selection andpresent a system that allows for an input parameter that determines the levelof “scariness” in the piece [17]. Oliveira and Cardoso describe a wide array offeatures that contribute to emotional content in music and present a system thatuses this information to select and transform chunks of music in accordance witha target emotion [18].
Like these previously mentioned systems, our system is concerned with pro-ducing music with a desired emotional content. It employs a number of statisticalmethods discussed in the previously mentioned papers. Rather than developingrule sets for different emotions, it composes original music based on statisticalinformation in training corpora.
2 Methodology
In order to produce selections with specific emotional content, a separate setof musical selections is compiled for each desired emotion. Initial experimentsfocus on the six basic emotions outlined by Parrot [19]—love, joy, surprise, anger,sadness, and fear—creating a data set representative of each. Selections for thetraining corpora are taken from movie soundtracks due to the wide emotionalrange present in this genre of music. MIDIs used in the experiments can be foundat the Free MIDI File Database.1 These MIDIs were rated by a group of researchsubjects. Each selection was rated by at least six subjects, and selections ratedby over 80% of subjects as representative of a given emotion were then selectedfor use in the training corpora.
Next, the system analyzes the selections to create statistical models of thedata in the six corpora. Selections are first transposed into the same key. Melodiesare then analyzed and n-gram models are generated representing what notesare most likely to follow a given series of notes in a given corpus. Statisticsdescribing the probability of a melody note given a chord, and the probabilityof a chord given the previous chord, are collected for each of the six corpora.Information is also gathered about the rhythms, the accompaniment patterns,and the instrumentation present in the songs.
Since not every melody produced is likely to be particularly remarkable, thesystem also makes use of multilayer perceptrons with a single hidden layer toevaluate the generated selections. Inputs to these neural networks are the de-
1 http://themes.mididb.com/movies/
142

fault features extracted by the “Phrase Analysis” component of the freely avail-able jMusic software.2 This component returns a vector of twenty-one statis-tics describing a given melody, including factors such as number of consecutiveidentical pitches, number of distinct rhythmic values, tonal deviation, and key-centeredness.
A separate set of two networks is developed to evaluate both generatedrhythms and generated pitches. The first network in each set is trained using an-alyzed selections in the target corpus as positive training instances and analyzedselections from the other corpora as negative instances. This is intended to helpthe system distinguish selections containing the desired emotion. The secondnetwork in each set is trained with melodies from all corpora versus melodiespreviously generated by the algorithm. In this way, the system learns to emulatemelodies which have already been accepted by human audiences.
Once the training corpora are set and analyzed, the system employs fourdifferent components: a Rhythm Generator, a Pitch Generator, a Chord Gen-erator, and an Accompaniment and Instrumentation Planner. The functions ofthese components are explained in more detail in the following sections.
2.1 Rhythm Generator
The rhythm for the selection with a desired emotional content is generated byselecting a phrase from a randomly chosen selection in the corresponding dataset. The rhythmic phrase is then altered by selecting and modifying a randomnumber of measures. The musical forms of all the selections in the corpus areanalyzed, and a form for the new selection is drawn from a distribution repre-senting these forms. For example, a very simple AAAA form, where each of foursuccessive phrases contains notes with the same rhythm values, tends to be verycommon. Each new rhythmic phrase is analyzed by jMusic and then providedas input to the neural network rhythm evaluators. Generated phrases are onlyaccepted if they are classified positively by both neural networks.
2.2 Pitch Generator
Once the rhythm is determined, pitches are selected for the melodic line. Thesepitches are drawn according to the n-gram model constructed from the melodylines of the corpus with the desired emotion. A melody is initialized with aseries of random notes, selected from a distribution that model which notes aremost likely to begin musical selections in the given corpus. Additional notes inthe melodic sequence are randomly selected based on a probability distributionof what note is most likely to follow the given series of n notes. The systemgenerates several hundred possible series of pitches for each rhythmic phrase. Aswith the rhythmic component, features are then extracted from these melodiesusing jMusic and provided as inputs to the neural network pitch evaluators.Generated melodies are only selected if they are classified positively by bothneural networks.2 http://jmusic.ci.qut.edu.au/
143

2.3 Chord Generator
The underlying harmony is determined using a Hidden Markov Model, withpitches considered as observed events and the chord progression as the underlyingstate sequence. The Hidden Markov Model requires two conditional probabilitydistributions: the probability of a melody note given a chord and the probabilityof a chord given the previous chord. The statistics for these probability distri-butions are gathered from the corpus of music representing the desired emotion.The system then calculates which set of chords is most likely given the melodynotes and the two conditional probability distributions. Since many of the songsin the training corpora had only one chord present per measure, initial attemptsat harmonization also make this assumption, considering only downbeats as ob-served events in the model.
2.4 Accompaniment and Instrumentation Planner
The accompaniment patterns for each of the selections in the various corpora arecategorized, and the accompaniment pattern for a generated selection is prob-abilistically selected from the patterns of the target corpus. Common accom-paniment patterns included arpeggios, chords sounding on repeated rhythmicpatterns, and a low base note followed by chords on non-downbeats. (A few ofthe accompaniment patterns such as “Star Wars: Duel of the Fates” and “Ad-dams Family” had to be rejected or simplified; they were so characteristic of thetraining selections that they were too recognizable in the generated song.) In-struments for the melody and harmonic accompaniment are also probabilisticallyselected based on the frequency of various melody and harmony instruments inthe corpus.
3 Results
Colton [20] suggests that, for a computational system to be considered creative, itmust be perceived as possessing skill, appreciation, and imagination. The systemcould be considered “skillful” if it demonstrates knowledge of traditional musicbehavior. This is accomplished by taking advantage of statistical knowledge totrain the system to behave according to traditional musical conventions. Thesystem may be considered “appreciative” if it can produce something of valueand adjust its work according the preferences of itself or others. This is addressedthrough the neural networks evaluators. The “imaginative” criterion can be metif the system can create new material independent of both its creators and othercomposers. Since all of the generated songs can be distinguished from the songsin the training corpora, this criterion is met at least on a basic level. However,to further evaluate all of these aspects, the generated songs were subjected tohuman evaluation. Twelve selections were generated for testing purposes.3 Eachselection was then played for thirteen individuals, who were asked to answer thefollowing questions:3 These selections are available at http://axon.cs.byu.edu/emotiveMusicGeneration
144

1. What emotions are present in this selection (circle all that apply)?2. On a scale of one to ten, how much does this sound like real music?3. On a scale of one to ten, how unique does this selection sound?
The first two questions target the aspects of skill and appreciation, ascertain-ing whether the system is skillful enough to produce something both musical andrepresentative of a given emotion. The third question evaluates the imaginationof the system, determining whether or not the generated music is perceived asnovel by human audiences.
To provide a baseline, two members of the campus songwriting club wereasked to perform the same task as the computer: compose a musical selectionrepresentative of one of six given emotions. Each composer provided three songs.These selections were also played and subjects were asked to evaluate themaccording to the same three questions. Song order was randomized, and whilesubjects were told that some selections were written by a computer and someby a human, they were not told which selections belonged to which categories.
Table 1 reports on how survey participants responded to the first question. Itgives the percentage of respondents who identified a given emotion in computer-generated selections in each of the six categories. Table 2 provides a baseline forcomparison by reporting the same data for the human-generated pieces. Tables3 and 4 address the second two survey questions. They provide the average scorefor musicality and novelty (on a scale from one to ten) received by the variousselections.
In all cases, the target emotion ranked highest or second highest in termsof the percentage of survey respondents identifying that emotion as present inthe computer-generated songs. In four cases, it was ranked highest. Respondentstended to think that the love songs sounded a little more like joy than love,and that the songs portraying fear sounded a little sadder than fearful. Butsurprisingly, the computer-generated songs appear to be slightly better at com-municating an intended emotion than the human-generated songs. Averagingover all categories, 54% of respondents correctly identified the target emotionin computer-generated songs, while only 43% of respondents did so for human-generated songs.
Human-generated selections did tend to sound more musical, averaging a7.81 score for musicality on a scale of one to ten as opposed to the 6.73 scoredby computer-generated songs. However, the fact that a number of the computer-generated songs were rated as more musical than the human-produced songsis somewhat impressive. Computer-generated songs were also rated on roughlythe same novelty level as the human-generated songs, receiving a 4.86 scoreas opposed to the human score of 4.67. As an additional consideration, thecomputer-generated songs were produced in a more efficient and timely mannerthan the human-generated ones. Only one piece in each category was submittedfor survey purposes due to the difficulty of finding human composers with thetime to provide music for this project.
145

Table 1. Emotional Content of Computer-Generated Music. Percentage of survey re-spondents who identified a given emotion for songs generated in each of the six cat-egories. The first column provides the categories of emotions for which songs weregenerated. Column headers describe the emotions identified by survey respondents.
Love Joy Surprise Anger Sadness Fear
Love 0.62 0.92 0.08 0.00 0.00 0.00Joy 0.38 0.69 0.15 0.00 0.08 0.08Surprise 0.08 0.46 0.62 0.00 0.00 0.00Anger 0.00 0.00 0.08 0.46 0.38 0.69Sadness 0.09 0.18 0.27 0.18 0.45 0.36Fear 0.15 0.08 0.00 0.23 0.62 0.23
Table 2. Emotional Content of Human-Generated Music. Percentage of survey respon-dents who identified a given emotion for songs composed in each of the six categories.
Love Joy Surprise Anger Sadness Fear
Love 0.64 0.64 0.00 0.09 0.09 0.00Joy 0.77 0.31 0.15 0.00 0.31 0.00Surprise 0.00 0.27 0.18 0.09 0.45 0.27Anger 0.00 0.09 0.18 0.27 0.73 0.64Sadness 0.38 0.08 0.00 0.00 0.77 0.08Fear 0.09 0.00 0.00 0.27 0.55 0.45
Table 3. Musicality and Novelty of Computer-Generated Music. Average score (on ascale of one to ten) received by selections in the various categories in response to surveyquestions about musicality and novelty.
Musicality Novelty
Love 8.35 4.12Joy 6.28 5.86Surprise 6.47 4.78Anger 5.64 4.96Sadness 7.09 4.40Fear 6.53 5.07
Average: 6.73 4.86
Table 4. Musicality and Novelty of Human-Generated Music. Average score (on ascale of one to ten) received by selections in the various categories in response tosurvey questions about musicality and novelty.
Musicality Novelty
Love 7.73 4.45Joy 9.15 4.08Surprise 7.09 5.36Anger 8.18 4.60Sadness 9.23 4.08Fear 5.45 5.45
Average: 7.81 4.67
146

4 Discussion and Future Work
Pearce, Meredith, and Wiggins [21] suggest that music generation systems con-cerned with the computational modeling of music cognition be evaluated both bythe music they produce and by their behavior during the composition process.The system discussed here can be considered creative both in the fact that itcan produce fairly high-quality music, and that it does so in a creative manner.In Creativity: Flow and the Psychology of Discovery and Invention (Chapter2), Csikszentmihalyi includes several quotes by the inventor Rabinow outlin-ing three components necessary for being a creative, original thinker [22]. Thesystem described in this work meets all three criteria for creativity.
As Rabinow explains, “First, you have to have a tremendous amount of infor-mation...If you’re a musician, you should know a lot about music...” Computershave a unique ability to store and process large quantities of data. They have thepotential even to have some advantage over humans in this particular aspect ofthe creative process if the knowledge can be collected, stored, and utilized effec-tively. The system discussed in this paper addresses this aspect of the creativeprocess by gathering statistics from the various corpora of musical selections andusing this information to inform choices about rhythm, pitch, and harmony.
The next step is generation based on the domain information. Rabinow con-tinues: “Then you have to be willing to pull the ideas...come up with somethingstrange and different.” The system described in this work can create a practicallyunlimited number of unique melodies based on random selections from proba-bility distributions. Again, computers have some advantage in this area. Theycan generate original music quickly and tirelessly. Some humans have been ableto produce astonishing numbers of compositions; Bach’s work alone fills sixtyvolumes. But while computers are not yet producing original work of Bach’screativity and caliber, they could easily outdistance him in sheer output.
The final step is evaluation of these generated melodies, Rabinow’s thirdsuggestion: “And then you must have the ability to get rid of the trash which youthink of. You cannot think only of good ideas, or write only beautiful music...”Our system addresses this aspect through the neural network evaluators. It learnsto select pieces with features similar to musical selections that have alreadybeen accepted by human audiences and ones most like selections humans havelabeled as expressing a desired emotion. It even has the potential to improveover time by producing more negative examples and learning to distinguish thesefrom positive ones. But finding good features for use in the evaluating classifiersposes a significant challenge. First attempts at improving the system will involvemodifications in this area.
As previously mentioned, research has been done to isolate specific featuresthat are likely responsible for the emotional content of a song [17, 18]. Incor-porating such features into the neural network evaluators could provide theseevaluators with significantly more power in selecting the melodies most repre-sentative of a desired emotion. Despite the possible improvements, it is quiteencouraging to note that even naıve evaluation functions are able to producefairly musical and emotionally targeted selections.
147

Additional improvements will involve drawing from a larger corpus of datafor song generation. Currently, the base seems to be sufficiently wide to producesongs that were considered to be as original as human-composed songs. However,many of the generated pieces tend to sound somewhat similar to each other. Onthe other hand, sparseness of training data actually provides some advantages.For example, in some cases, the presence of fewer examples in the training corpusresulted in similar musical motifs in the generated songs. Phrases would oftenbegin with the same few notes before diverging, particularly in corpora wheresongs tended to start on the same pitch of the scale. Larger corpora will allow forthe generation of more varied songs, but to maintain musicality, the evaluationmechanism might be extended to encourage the development of melodic motifsamong the various phrases.
The type and magnitude of emotions can often be indicated by concurrentphysiological responses. The format of these experiments lends itself to the addi-tional goal of generating music targeted to elicit a desired physiological response.Future work will involve measuring responses such as heart rate, muscle tension,and skin conductance and how these are affected by different musical selections.This information could then be used to create training corpora of songs likely toproduce desired physiological responses. These could then be used to generatesongs with similar properties. The format also allows for the generation of songsthat can switch emotions at a desired point in time simply by switching to usingstatistical data from a different corpus.
The system described here is arguably creative by reasonable standards. Itfollows a creative process as suggested by Rabinow and others, producing andevaluating reasonably skillful, novel, and emotionally targeted compositions.However, our system will really only be useful to society if it produces musicthat not only affects emotions, but that people will listen to long enough forthat effect to take place. This is difficult to demonstrate in a short-term evalu-ation study, but we do appear to be on the right track. A few of the generatedpieces received musicality ratings similar to those of the human-produced pieces.Many of those surveyed were surprised that the selections were written by a com-puter. Another survey respondent announced that the program had “succeeded”because one of the computer-generated melodies had gotten stuck in his head.These results show promise for the possibility of producing a system that is trulycreative.
Acknowledgments
This work is supported by the National Science Foundation under Grant No.IIS-0856089. Special thanks to Heather Hogue and Paul McFate for providingthe human-generated music.
References
1. Wiggins, G.: A preliminary framework for description, analysis and comparison ofcreative systems. Journal of Knowledge Based Systems 19(7) (2006) 449–458
148

2. Blood, A.J., Zatorre, R.J.: Intensely pleasurable responses to music correlate withactivity in brain regions implicated in reward and emotion. Proceedings of theNational Academy of Sciences 98(20) (2001) 11818–11823
3. Picard, R.W.: Affective computing. MIT Technical Report No. 321 (1995)4. Partala, T., Surakka, V.: The effects of affective interventions in human-computer
interaction. Proceedings of the Conference on Human Factors in Computing Sys-tems 16 (2004) 295–309
5. Klein, J., Moon, Y., Picard, R.: This computer responds to user frustration: The-ory, design, results, and implications. Interacting with Computers 14 (2002) 119–140
6. Ochs, M., Catherine, P., Sadek, D.: An empathic virtual dialog agent to improvehuman-machine interaction. Autonomous Agent and Multi-Agent Systems (2008)89–96
7. Bates, J.: The role of emotion in believable agents. Communications of the ACM37(7) (1994) 122–125
8. Conklin, D.: Music generation from statistical models. Proceedings AISB Sym-posium on Artificial Intelligence and Creativity in the Arts and Sciences (2003)30–35
9. Allan, M., Williams, C.K.I.: Harmonising chorales by probabilistic inference. Ad-vances in Neural Information Processing Systems 17 (2005) 25–32
10. Chuan, C., E.Chew: A hybrid system for automatic generation of style-specific ac-companiment. Proceedings International Joint Workshop on Computational Cre-ativity (2007) 57–64
11. de la Puente, A.O., Alfonso, R.S., Moreno, M.A.: Automatic composition of musicby means of grammatical evolution. Proceedings of the 2002 conference on APL(2002)
12. Horner, A., Goldberg, D.: Genetic algorithms and computer-assisted music compo-sition. Proceedings of the International Conference on Genetic Algorithms (1991)
13. Tokui, N., Iba, H.: Music composition with interactive evolutionary computation.Proceedings of the Third International Conference on Generative Art (2000)
14. Ponsford, D., Wiggins, G., Mellish, C.: Statistical learning of harmonic movement.Journal of New Music Research 28(2) (1998) 150–177
15. Phon-Amnuaisuk, S., Wiggins, G.: The four-part harmonization problem: A com-parison between genetic algorithms and a rule-based system. Proceedings of theAISB’99 Symposium on Musical Creativity (1998)
16. Delgado, M., Fajardo, W., Molina-Solana, M.: Inmamusys: Intelligent multi-agentmusic system. Expert Systems with Applications 36(3-1) (2009) 4574–4580
17. Rutherford, J., Wiggins, G.: An experiment in the automatic creation of musicwhich has specific emotional content. Proceedings of MOSART, Workshop oncurrent research directions in Computer Music (2003) 35–40
18. Oliveira, A., Cardoso, A.: Towards affective-psychophysiological foundations formusic production. Affective Computing and Intelligent Interaction (2007) 511522
19. Parrott, W.G.: Emotions in Social Psychology. Psychology Press, Philadelphia(2001)
20. Colton, S.: Creativity versus the perception of creativity in computational systems.Creative Intelligent Systems: Papers from the AAAI Spring Symposium (2008) 14–20
21. Pearce, M.T., Meredith, D., Wiggins, G.A.: Motivations and methodologies forautomation of the compositional process. Musicae Scientiae 6(2) (2002)
22. Csikszentmihalyi, M.: Creativity: Flow and the Psychology of Discovery and In-vention. Harper Perennial, New York (1996)
149

Real-Time Emotion-Driven Music Engine
Alex Rodrıguez Lopez, Antonio Pedro Oliveira, and Amılcar Cardoso
Centre for Informatics and Systems, University of Coimbra, [email protected], [email protected], [email protected]
Abstract. Emotion-Driven Music Engine (EDME) is a computer sys-tem that intends to produce music expressing a desired emotion. Thispaper presents a real-time version of EDME, which turns it into a stand-alone application. A real-time music production engine, governed by amulti-agent system, responds to changes of emotions and selects the moresuitable pieces from an existing music base to form song-like structures,through transformations and sequencing of music fragments. The musicbase is composed by fragments classified in two emotional dimensions:valence and arousal. The system has a graphic interface that provides afront-end that makes it usable in experimental contexts of different sci-entific disciplines. Alternatively, it can be used as an autonomous sourceof music for emotion-aware systems.
1 Introduction
Adequate expression of emotions is a key factor in the efficacy of creative activi-ties [16]. A system capable of producing music expressing a desired emotion canbe used to influence the emotional experience of the target audience. Emotion-Driven Music Engine (EDME) was developed with the objective of having sucha capability. The high modularity and parameterization of EDME allows it tobe customized for different scenarios and integrated into other systems.
EDME can be controlled by the user or used in an autonomous way, depend-ing on the origin of the input source (an emotional description). A musiciancan use our system as a tool to assist the process of composition. Automaticsoundtracks can be generated for other systems capable of making an emotionalevaluation of the current context (i.e., computer-games and interactive media,where the music needs to change quickly to adapt to an ever-changing context).The input can be fed from ambient intelligence systems. Sensing the environmentallows the use in installations where music reacts to the public. In a healthcarecontext, self-report measures or physiological sensors can be used to generatemusic that reacts to the state of the patient.
The next section makes a review of related work. Section 3 presents ourcomputer system. Section 4 draws some conclusions and highlights directionsfor further work.
150

2 Related Work
The developed system is grounded on research made in the areas of computerscience and music psychology.
Systems that control the emotional impact of musical features usually workthrough the segmentation, selection, transformation and sequencing of musicalpieces. These systems modify emotionally-relevant structural and performativeaspects of music [4, 11, 22], by using pre-composed musical scores [11] or bymaking musical compositions [3, 10, 21].
Most of these systems are grounded on empirical data obtained from works ofpsychology [8, 19]. Scherer and Zentner [18] established parameters of influencefor the experienced emotion. Meyer [13] analyzed structural characteristics ofmusic and its relation with emotional meaning in music. Some works have triedto measure emotions expressed by music and to identify the effect of musicalfeatures on emotions [8, 19]. From these, relations can be established betweenemotions and musical features [11].
3 System
EDME works by combining short MIDI segments into a seamless music streamthat expresses the emotion given as input. When the input changes, the systemreacts and smoothly fades to music expressing the new emotion.
There are two stages (Fig. 1). At the off-line stage, pre-composed music issegmented and classified to build a music base (Section 3.1); this makes sys-tem ready for the real-time stage, which deals with selection, transformation,sequencing and synthesis (Section 3.2). The user interface lets the user selectin different ways the emotion to be expressed by music. Integration with othersystems is possible by using different sources as the input (Section 3.3).
3.1 Off-line stage
Pre-composed MIDI music (composed on purpose, or compiled as needed) isinput to a segmentation module. An adaptation of LBDM [2] is used to at-tribute weights according to the importance and degree of proximity and changeof five features: pitch, rhythm, silence, loudness and instrumentation. Segmen-tation consists in a process of discovery of fragments, by looking to each noteonset with the higher weights. Fragments that result are input to a feature ex-traction module. These musical features are used by a classification module thatgrades the fragments in two emotional dimensions: valence and arousal (plea-sure and activation). Classification is done with the help of a knowledge baseimplemented as two regression models that consist of weighted relations betweeneach emotional dimension and music features [14]. Regression models are used tocalculate the values of each emotional dimension through a weighted sum of thefeatures obtained by the module of features extraction. MIDI music emotionallyclassified is then stored in a music base.
151

Real-Time Stage
Off-line Stage
Desired Emotion
Music Selection
Music Transformation
Music Sequencing
Music Synthesis
Music BaseMusic
Features Extraction
Music Segmentation
Pre-composed Music
Knowledge Base Pattern Base
Listener
Music Classification
Fig. 1. The system works in two stages.
3.2 Real-Time Stage
Real-time operation is handled by a multi-agent system, where agents with dif-ferent responsabilities cooperate in simultaneous tasks to achieve the goal ofgenerating music expressing desired emotions. Three agents are used: an inputagent, which handles commands between other agents and user interface; a se-quencer agent, that selects and packs fragments to form songs; and a synthesizeragent, which deals with the selection of sounds to convert the MIDI output fromthe sequencer agent into audio.
In this stage, the sequencer agent has important responsabilities. This agentselects music fragments with the emotional content closer to the desired emotion.It uses a pattern-based approach to construct songs with the selected fragments.Each pattern defines a song structure and the harmonic relations between theparts of this structure (i.e., popular song patterns like AABA). Selected frag-ments are arranged to match the tempo and pitch of a selected musical pattern,through transformations and sequencing. The fragments are scheduled in orderto make their perception as one continuous song during each complete pattern.This agent also crossfades between patterns and when there is a change in theemotional input, in order to allow a smooth listening experience.
3.3 Emotional Input
The system can be used under user control with an interface or act autonomouslywith other input. The input specifies values of valence and arousal.
User Interface. The user interface serves the purpose of letting the user choosein different ways the desired emotion for the generated music. It is possible forthe user to directly type the values of valence and arousal the music should have.
152

Other way is through a list of discrete emotion the user can choose from. Itis possible to load several lists of words denoting emotions to fit different usesof the system. For example, Ekman [6] has a list of generally accepted basicemotions. Russell [17] and Mehrabian [12] both have lists which map specificemotions to dimensional values (using 2 or 3 dimensions). Juslin and Laukka [9]propose a specific list for emotions expressed by music.
Another way to choose the affective state of the music is through a graphicalrepresentation of the valence-arousal affective space, based on FeelTrace [5]: acircular space with valence dimension is in the horizontal axis and the arousaldimension in the vertical axis. The coloring follows that of Plutchik’s circumplexmodel [15].
Other Input. EDME can stand as an autonomous source of music for othersystems by taking their output as emotional input
With the growing concern on computational models of emotions and affectivesystems, and a demand for interfaces and systems that behave in an affectiveway, it is becoming frequent to adapt systems to show or perceive emotions.EmoTag [7] is an approach to automatically mark up affective information intexts, marking sentences with emotional values. Our system can serve the musicalneeds of such systems by taking their emotional output as the input for real-timesoundtrack generation.
Sensors can serve as input too. Francisco et al. [20] presents an installationthat allows people to experience and influence the emotional behavior of theirsystem. EDME is used in this interactive installation to provide music accordingto values of valence and arousal.
4 Conclusion
Real-time EDME is a tool that produces music expressing desired emotions thathas application in theatre, films, video-games and healthcare contexts. Currently,we have applied our system in an affective installation [20]. The real-time usageof the system by professionals of music therapy and the integration of EDMEwith EmoTag [7] for emotional soundtrack generation are also being analysed.The extension of EDME to an agent-based system increased its scability, whichmakes easier its expansion and integration with external systems. Listening testsare needed to assess the fluentness of obtained songs.
References
1. Bresin, R., Friberg, A.: Emotional Coloring of Computer Controlled Music Perfor-mance. Computer Music Journal, 24(4), pp. 44–62 (2000)
2. Cambouropoulos, E.: The Local Boundary Detection Model (LBDM) and its Appli-cation in the Study of Expressive Timing. International Computer Music Conference(2001)
153

3. Casella, P., Paiva, A.: Magenta: An Architecture for Real Time Automatic Compo-sition of Background Music. International Workshop on Intelligent Virtual Agents,pp. 224–232. Springer (2001)
4. Chung, J., Vercoe, G.: The Affective Remixer: Personalized Music Arranging. Con-ference on Human Factors in Computing Systems, pp. 393–398. ACM Press NewYork (2006)
5. Cowie, R.: Feeltrace: An Instrument for Recording Perceived Emotion in Real Time.SpeechEmotion, pp. 19–24 (2000)
6. Ekman, P.: Basic Emotions. In: Dalgleish, T., Power, M. (eds.) Handbook of Cog-nition and Emotion. Wiley, New York (1999)
7. Francisco, V., Hervas, R.: EmoTag: Automated Mark Up of Affective Informationin Texts. EUROLAN 2007 Summer School Doctoral Consortium, pp. 5–12 (2007)
8. Gabrielsson, A., Lindstrom, E.: The Influence of Musical Structure on EmotionalExpression. Music and Emotion: Theory and Research, pp. 223–248. Oxford Uni-versity Press (2001)
9. Juslin, P., Laukka, P.: Expression, Perception, and Induction of Musical Emotions:A Review and a Questionnaire Study of Everyday Listening. Journal of New MusicResearch, 33(3), pp. 217–238 (2004)
10. Kim, S., Andre, E.: Composing Affective Music with a Generate and Sense Ap-proach. Flairs - Special Track on AI and Music. AAAI Press (2004)
11. Livingstone, S.R., Muhlberger, R., Brown, A.R., Loch, A.: Controlling MusicalEmotionality: An Affective Computational Architecture for Influencing MusicalEmotions. Digital Creativity, 18. Taylor and Francis (2007)
12. Mehrabian, A.: Basic Dimensions for a General Psychological Theory. Cambridge:OG&H Publishers (1980)
13. Meyer, L.: Emotion and Meaning in Music. University of Chicago Press (1956)14. Oliveira, A., Cardoso, A. Modeling Affective Content of Music: A Knowledge Base
Approach. Sound and Music Computing Conference (2008)15. Plutchik, R. A general psychoevolutionary theory of emotion. Emotion: Theory,
research, and experience: Vol. 1. Theories of emotion, 3-33. New York: Academic(1980)
16. Russ, S. Affect and Creativity: The Role of Affect and Play in the Creative Process.Lawrence Erlbaum Associates Inc, US. (1993)
17. Russell, J.: Measures of Emotion. Emotion: Theory, Research, and Experience, 4,pp. 83–111 (1989)
18. Scherer, K., Zentner, M.: Emotional effects of music: Production rules. Music andemotion: Theory and research, pp. 361392 (2001)
19. Schubert, E.: Measurement and Time Series Analysis of Emotion in Music. PhDthesis. University of New South Wales (1999)
20. Ventura F., Oliveira A., Cardoso, A.: An Emotion-Driven Interactive System. 14thPortuguese Conference on Artificial Intelligence, pp- 167-178 (2009)
21. Wassermann, K., Eng, K., Verschure, P., Manzolli, J.: Live soundscape compositionbased on synthetic emotions. IEEE Multimedia, pp. 82–90 (2003)
22. Winter, R.: Interactive Music: Compositional Techniques for Communicating Dif-ferent Emotional Qualities. Masters Thesis. University of York (2005)
154

Tabla Gyan: An Artificial Tabla Improviser
Parag Chordia and Alex Rae
Georgia Institute of Technology, Atlanta GA, 30332 [email protected], [email protected]
http://paragchordia.com/
Abstract. We describe Tabla Gyan, a system capable of improvisingtabla solo music, a sophisticated percussion tradition from North India.The system is based on a generative model of the qaida, a central formin tabla solo based on thematic variation. The system uses a recombi-native process of variation generation, and filters the results accordingto rhythmic and timbral characteristics of each phrase. The sequencesare used to generate audio in realtime using pre-recorded tabla samples.An evaluation of the system was conducted with seventy users, primar-ily experienced tabla performer and listeners. With respect to qualitiessuch as musicality, novelty, adherence to stylistic norms, and technicalability, the computer-generated performances compared favorably withperformances by a world-class tabla player.
1 Introduction
This work aims to explore computational models of creativity, realizing themin a system designed for realtime generation of improvised music. This is envi-sioned as an attempt to develop musical intelligence in the context of structuredimprovisation, and by doing so to enable and encourage new forms of musicalcontrol and performance. A model of qaida, a traditional north Indian solo tablaform, is presented along with the results of an online survey comparing it toa professional tabla player’s recording on dimensions of musicality, creativity,and novelty. The model is based on generating a bank of variations and filteringaccording to musical qualities.
2 Background
2.1 Theories of Creativity
This work is fundamentally motivated by an interest in exploring computationalmodels of creativity. There have been many attempts to characterize the basicnature of creativity, and here we identify some key insights.
Mihaly Csikszentmihalyi [4] outlined a theory formulating creativity as aconcept arising from the interaction of a domain, such as music or a particularmusical genre, the individual who produces some possibly creative work, andthe field within which the work is judged. One significance of this is that it
155

moves creativity from being a purely individual characteristic to one largely theproduct of external interactions; notably, the final determination of whether theindividual has been creative rests on the judgement of peers.
Many theories are based in the idea of multiple creativities. Geneplore [6], forexample, models creativity as comprised of a generative phase in which a largeset of potential materials is amassed, and an exploratory phase in which this setis explored and interpreted. There is notable similarity between this and elementsof our system described in Sections 4.1 and 4.2. Sternberg presents a theory[13]that represents creativity in terms of three processes for finding insights in largequantities of information: selective encoding, combination, comparison. Insightsfound by filtering information are then combined to generate new insights, whichin turn are compared to previous or distant insights to create yet another in-sight. Gardner [7] also addresses creativity, characterizing it as the productionof novelty within a domain, similarly to Csikszentmihalyi’s approach.
More practical but equally valid definitions have focused on the concept ofnovelty. A common formulation defines creativity as an action or process whichproduces novel output that satisfies the constraints of context [3]. Addressingthe basis for judging whether an artificial system could be considered creative,Pereira [11] identifies the requirements that when given a problem, answers pro-duced by the system should not replicate previous solutions of which it hasknowledge, and should apply acceptably to the problem. These are notably sim-ilar conceptualizations of creativity, and share the idea that the existence ofcreativity can, and should, be evaluated on the basis of the product.
2.2 Machine Musicianship
Many systems have been developed which can claim to involve computationalcreativity. We mention here a few in order to indicate the range of approachesand goals which others have undertaken.
The Continuator [9], developed by Francois Pachet tries to come up with im-provisatory responses to human pianist’s playing, using weighted random drawsfrom a prefix tree built from phrases detected in the audio input. Arne Eigen-feldt’s multi-agent “Kinetic Engine” [5] models the interactions between net-worked improvising agents in terms of both musical features and social dynamics,allowing shared parameters such as tempo and overall contour to be controlledby a “conductor” agent. David Cope’s long-running project Experiments in Mu-sical Intelligence (EMI) focuses on faithful emulations of styles in the Westernclassical canon [1]. His approach focuses on analyzing a large corpus of worksto extract patterns which encode the main elements of the style, recombiningthem to create derivative works [2]. Cope has written and worked extensivelyin this field, and identifies a number of basic elements which he determines tobe central to computational creativity, specifically calling out pattern-matchingand recombinance [3].
156

3 Introduction to Tabla
Tabla is the predominant percussion instrument of North India. Physically, tablais actually a pair of drums, as seen in Figure 1. It is played with the hands andfingers, and each drum is associated with one hand. The right-hand drum, calledthe tabla or dayan, is higher in pitch than the left-hand drum, or bayan. Bothdrums are capable of producing a variety of distinct timbres, ranging from ringingsounds with a clear pitch to short sharp sounds with a high noise content. Thereare specific striking techniques for producing each of the different timbres, knowngenerally as strokes, and each is named. There are three broad classes of strokes:resonant strokes with a clear pitch and ringing tone, shorter non-resonant noisystrokes, and bass strokes produced on the bayan. Individual strokes and commonshort phrases are known as bols, and form the building-blocks of larger phrases.Improvisation in tabla music takes places within a rhythmic cycle which definesa large-scale periodicity, consisting of a set number of beats. The most commoncycle is Teental, consisting of sixteen beats. To make the cycle easier to perceive,bayan strokes on certain beats are damped, and are referred to as “closed”.Strokes in which the bass is allowed to sound are referred to as “open”.
Fig. 1. A tabla. The drum on the left is the bayan; the drum on the right is the dayan.
There is a rich tradition of solo tabla performance. The tabla is then usuallyaccompanied by a melodic instrument that plays a repeated figure known asnagma which occupies the role of a timekeeper. One of the most prominentcompositional forms presented in a solo tabla performance is qaida, a structuredimprovisation consisting of a theme and variations form [14]. The theme uponwhich a given qaida performance is built is composed of a series of subphrases,and is taken as a fixed composition. The macroscopic form of qaida follows afairly simple structure: introduction of the theme, development of variations atan increased tempo, conclusion. Within the main body, variations are presentedin a structured manner: a variation is introduced, the theme is reiterated, thesame variation is repeated with closed bayan, and finally the theme is playedagain with closed bayan, often re-opening it shortly before the end of the cycle.
157

While qaida themes are part of the shared repertoire of solo tabla, variationsare improvised according to some basic principles. The most important guidingprinciple of qaida variation is a restriction: only bols which appear in the qaidatheme may be used in the variations. This is intended to preserved the essentialcharacter of the given qaida. Given this limitation, one common and effectivevariation technique is to rearrange subsections of the theme.
4 Methods
ThemeStochastic
shufflerFeature
extractorPhrasechooser
Featureprofile
AudiofeaturesTheme
bank
Domain knowledge
Fig. 2. Overview of the Qaida variation architecture. The theme bank is greyed-outbecause the choice of theme is made only once, initially. Domain knowledge, specificknowledge about qaida and tabla, is shown being incorporated at specific points in theprocess.
The design of the system centers around complementary processes of vari-ation generation and variation selection. A database of potential variations isbuilt through a stochastic process, and phrases are selected from that set basedon certain criteria. This bears some semblance to the technique known in algo-rithmic composition as “generate-and-test” [12], however in our case the criteriaare treated more probabilistically, as a basis for the system to make a choicewith a some indeterminacy but weighted heavily towards a desired outcome.
Consistent with the fact that qaida themes are not themselves improvised,and rarely even composed by the performer, no attempt was made to generatenew thematic material. Instead, a number of traditional themes were transcribedmanually and annotated with partition bounds. A bank of of these themes isstored in XML format, and one theme is chosen at start-up which remains theonly source material for the duration of the qaida improvisation.
The core of the system was coded in Python, relying on the NumPy andSciPy [8] packages for performance intensive computation. Audio output wasgenerated using Pure Data (Pd) [10]. An overview of this system is shown inFigure 2.
158

4.1 Variation Generation
A bank of phrases is generated from the chosen theme by applying transfor-mations consistent with qaida theory, and then stochastically applying anotherset of operations to bias the population towards more stylistically appropriatecontent. An overview of these operations is shown in Figure 3. The size of thephrase database is set in advance, and is far smaller than the set of all possiblevariations given the transforms. Clearly, a larger database is preferable in thatit will contain a greater diversity of material; however, the feature extractionand phrase selection processes described in Section 4.2 scale with the size of thedatabase, and computational efficiency is critical within a real-time architec-ture. A bank of two thousand phrases was used during much of the developmentprocess, and it was qualitatively found that this size contained sufficient phrasediversity to support varied and novel output. A given variation is constructedby applying the transforms, and accepting or rejecting the result based on theconstraint that the variation have the same metrical duration as the original.This process is repeated until a bank of the specified size has been constructed.
There are two main transforms used: re-ordering of the theme partitions, andrepetition at doubled tempo. The first assembles a variation by sampling withreplacement from the set of partitions. For efficiency, the number of possiblepartitions in the new phrase is limited to the range within which generatedphrases of the required length are possible. The second transform simply selectsa partition at random and repeats it twice at double the speed. A parametercontrols the relative likelihood of applying one or the other of these operations.
Require metrical length
Random shuffling,no style constraint
Preservecadence
Repeatsub-phrases
Introducerests, fills
Domain knowledge
Fig. 3. Detail of the Qaida variation generating architecture. The reordering routineis depicted here, constrained by metrical length and incorporating domain knowledgein the form of added transformations.
An additional set of three transformations may then be applied, each withan independent probability. They function to bias the phrase bank toward morestyle-specific characteristics. They are intended to favor multiple occurrencesof the same partition (non-consecutive repetition), consecutive repetitions of apartition and preservation of the final partition (cadence).
159

Lastly, a final transform that introduces short rests into the phrases may beapplied at any time. This operation is essential to break the homogeneity whichtends to emerge over time, but it can also disturb the coherence of a phrase.For this reason it is reserved for use in the more “complicated” sections of qaidadevelopment, and may be applied to an existing phrase bank.
4.2 Variation Selection
Selection of a phrase from the bank is initiated by a request for a phrase witha desired set of features. In response, phrases in memory are compared againstthe request, a close match is selected, and the system returns a single phrase forplayback.
Immediately after the phrase bank is first built, features are calculated overeach phrase in the set. It was found that a relatively small set of features couldprovide a surprisingly flexible handle into the character of the returned phrases,though a larger set would no doubt improve the range of performance. The cur-rently calculated features are distribution over each stroke type, by frequency ofoccurrence and by time, ratio of open to closed strokes, by frequency of occur-rence and by time, rhythmic density, spectral centroid, and spectral spread.
Note that these are not all of equivalent dimensionality — rhythmic density,open/closed ratios, and spectral centroid are scalar values, while the distribu-tions over stroke types are vectors. For the most part, these are in effect timbralfeatures, due to the correspondence between stroke types and timbre. The spec-tral centroid and spread require more explanation. The features themselves areuncomplicated, but up to this point we have been dealing with symbolic dataonly. However, the sequences are destined for playback on a known set of sounds,so in this step we calculate average values over the same audio database of seg-mented tabla strokes which is used in playback. This gives us a quantitativeestimate of the timbre we expect when a phrase is synthesized.
The feature preferences defined in the request for a variation can describeany subset of the above features, and specify three values for each: the targetvalue, a relative weighting for this feature, and a “flexibility” measure. Thetarget value, expressed in the range 0 to 1, is normalized to the range present inthe current bank of variations. The flexibility parameter functions as a sort ofdistance metric, an alternative to simple linear distance. It defines the width ofa Gaussian centered on the target value, which is then used as a look-up tableto get the unweighted score for that phrase and feature.
A score is calculated for each phrase in the bank of variations. Rather thanalways choose the best match, which would lead to a deterministic output, thechoice is made probabilistically. The two most successful algorithms are to rescalethe scores to emphasize the higher-scoring phrases and choose randomly from thefull bank using scores as probability weightings, or to take the set of top scorersand make a choice among those based on their normalized probabilities. Thisprocedure serves as a way to balance the creativity and novelty of the system’soutput with its responsiveness to the demands of context.
160

4.3 Macroscopic Structure
The macroscopic structure is simpler and largely deterministic, following the ba-sic qaida form outlined above. Playback is implemented in Pd, and is describedfurther in Section 4.4. The patch controls the alternation between theme andvariation, requests variations from the Python generator, controls the periodicopening and closing of the bayan strokes, and generates the audio. An accom-panying nagma marks the cycle. Feature preferences for the variation requestsare specified manually with a set of sliders. Modeling of longer-term structure isminimal; the manual controls provided allow a user to take the place of a fullermodel. It should be noted, however, that the user need not be highly skilled, oreven particularly knowledgeable with respect to tabla or qaida.
4.4 Audio Output
Synthesis of the generated qaida was accomplished using high-quality isolatedsamples of tabla strokes, played by a professional tabla player and recordedspecifically for this project. Several timbrally consistent samples were recordedfor each stroke type, one of which was selected at random at each playbackcommand. Amplitudes were scaled by durations, to mimic the lighter touch thatis generally used when playing fast sequences. The quality and consistency of therecordings was reflected in the audio output; the only significant shortcomingremains a lack of bayan modulation.
5 Evaluation
3.5 4 4.5 5 5.5 6 6.5 7
human 2
human 1
computer 3
computer 2
computer 1
segm
ent
response value
Fig. 4. Plot showing mean values and confidence intervals for responses to Question 1:“To what extent would you say that this recording demonstrates a feeling of musical-ity?”
An online survey was conducted, in which three recordings of generated out-put were presented alongside two recordings by a world-class tabla player, with-
161

out indication of the origin of the recordings; participants were simply askedto make a series of judgements, unaware that the survey involved compari-son of human playing and computer modeling. The survey can be found athttp://paragchordia.com/survey/tablasurvey/, and the audio clips of bothcomputer-generated output and professional tabla performance can be heardseparately at http://www.alexrae.net/thesis/sound/, the first three beingthe qaida model’s output, as in the results presented here. The recordings ofmodel output were “played” via the user interface implemented in Pd, and wererecorded without subsequent editing.
A total of 70 participants responded to the survey. A majority claimed mod-erate to high familiarity with tabla music, and many reported themselves to bepracticing tabla players. The mean age was 35.2, with a standard deviation of12.2. The order of presentation of audio segments was randomized, and partic-ipants were asked to rate the examples along several dimensions. Judgementswere on a scale of 1 to 7, reflecting answers ranging from “very little” to “alot”, except in case of the last two questions, phrased as ranging from “poor”to “excellent”. A higher value corresponded to a more favorable judgment. Re-spondents were invited to supplement their quantitative judgements with furthercomments.
3.5 4 4.5 5 5.5 6 6.5 7
human 2
human 1
computer 3
computer 2
computer 1
segm
ent
response value
Fig. 5. Plot showing mean values and confidence intervals for responses to Question 2:“To what extent would you say that this recording demonstrates musical creativity?”
Participants were asked the following questions:
1. To what extent would you say that this recording demonstrates a feeling ofmusicality?
2. To what extent would you say that this recording demonstrates musicalcreativity?
3. To what extent would you say that this recording adheres to qaida form?4. To what extent would you say that this recording is novel or surprising, given
the qaida theme?5. To what extent would you say that the improvisations in this recording are
appropriate to the style and the theme?
162

6. If told that this recording were of a tabla student, how would you rate his/heroverall TECHNICAL abilities?
7. If told that this recording were of a tabla student, how would you rate his/heroverall MUSICAL abilities?
Figures 4–6 show mean values and confidence intervals of the judgementscores for each audio segment, adjusted for multiple comparisons using the Dunn-Sidak correction (p < 0.05). A trend is visible in the average values of the dataacross the examples, showing the computer generated output to be rated slightlylower than the human generated excerpts. However, the differences do not reachstatistical significance given the sample size, except in the case of the thirdgenerated qaida, which in many cases is rated somewhat lower than the othermodel outputs. Judgements of musical creativity, question 2, are notable, astwo of the qaida model’s outputs were ranked on par with the human performer.The model was rated similarly highly on judgements of novelty. These results areencouraging: the computer-generated qaida performed quite well in comparisonto very high-quality human-played examples.
3.5 4 4.5 5 5.5 6 6.5 7
human 2
human 1
computer 3
computer 2
computer 1
segm
ent
response value
Fig. 6. Plot showing mean values and confidence intervals for responses to Question4: “To what extent would you say that this recording is novel or surprising, given theqaida theme?”
It is also interesting to note from the comments that many respondents re-mained unaware that three of the examples were computer-generated. One, forexample, wrote in response to example 3: “Again this recording demonstratesthat the Tabla player has excellent abilities in playing the right drum with crisptonal quality. Left drum (Baya) needs some improvement as I stated in the firsttwo Qaidas.” Some comments focused more directly on the style or quality, forexample “Good presentation of Purab / Benaras style kayda. Great speed. Niceoverall sound” (excerpt 2), and “Very nicely done” (excerpt 3). Only one re-spondent clearly deduced the origin of the model’s output, writing simply “Thesynthesized nature of this piece limits its ability to be musical.” Criticism was notreserved for the generated recordings. One respondent commented that excerpt 4“sounded too mechanical and devoid of emotion,” and another that “The Tirak-
163

itas at the start [of example 5] sound very odd and clumsy!” Most comments forexamples 4 and 5, however, were clearly positive.
6 Conclusion
The results of our survey suggest that the qaida model has been successful inproducing improvisatory music which is heard as creative. There is, of course,much work to be done, ranging from addressing deficiencies in playback cited bya number of respondents, such as the lack of bayan modulation, to incorporatinga more robust model of sculpting a larger contour. However it is encouragingand quite interesting to see how effective the methods employed in this modelhave been.
References
1. David Cope. Experiments in Musical Intelligence. A-R Editions, Madison, WI,1996.
2. David Cope. Virtual Music: Computer Synthesis of Musical Style. MIT Press,Cambridge MA, 2001.
3. David Cope. Computer Models of Musical Creativity. MIT Press, Cambridge MA,2005.
4. Mihaly Csikszentmihalyi. Creativity: Flow and the Psychology of Discovery andInvention. Harper Collins, New York, 1996.
5. Arne Eigenfeldt. The creation of evolutionary rhythms within a multi-agent net-worked drum ensemble. In Proceedings of the International Computer Music Con-ference, pages 267–270, Copenhagen, Denmark, 2007.
6. Ronald A. Fink, Thomas B. Ward, and Steven M. Smith. Creative Cognition:Theory, Research, and Applications. MIT Press, Cambridge, MA, 1992.
7. Howard Gardner. Intelligence reframed: multiple intelligences for the 21st century.Basic Books, New York, 1999.
8. Eric Jones, Travis Oliphant, Pearu Peterson, et al. SciPy: Open source scientifictools for Python, 2001–present.
9. Francois Pachet. The Continuator: Musical interaction with style. Journal of NewMusic Research, 32(3):333–41, 2003.
10. Pure Data — PD community site. http://puredata.info, (accessed March 2009).11. Francisco Cmara Pereira. Creativity and artificial intelligence: a conceptual blend-
ing approach. Walter de Gruyter, 2007.12. Curtis Roads. The Computer Music Tutorial. MIT Press, Cambridge, MA, 1998.13. Robert J. Sternberg and Janet E. Davidson. The mind of the puzzler. Psychology
Today, 16:37–44, October 1982.14. Gert-Matthias Wegner. Vintage Tabla Repertory. Munshiram Manohalal Publish-
ers Pvt. Ltd., New Delhi, India, 2004.
164

On the Impact of Chat Communication on Computer-Supported Idea Generation Processes
Florian Forster1, Marc René Frieß1, Michele Brocco1 and Georg Groh1,
1 Technische Universität München, Lehrstuhl XI, Boltzmanstr. 3,
85748 Garching, Germany {forster,friess,brocco,grohg}@in.tum.de
Abstract. It has been shown that traditional forms of communication negatively affect idea generation processes. Creativity support systems can help to avoid these impacts and provide alternative means of interaction for which the known negative affects do not apply. In this paper, we investigate the impact of chat communication on computer-supported idea generation processes. The results show that idea quantity, quality and group satisfaction are not affected by the option to use a chat as an additional communication channel. This implies that positive as well as negative influence factors of communication described in previous studies seem to offset each other in computer-supported idea generation processes. We discuss several of these potential positive and negative influence factors. Furthermore, we discuss why a chat feature can help to lower acceptance barriers for creativity support systems.
1 Introduction
In the 1950s, Alex Osborn [1] proposed four central guidelines for groups to follow in idea generation processes: Criticism is ruled out, freewheeling is welcome, quantity is wanted and combinations / improvements are sought. As of today, brainstorming is probably the most popular and most often applied (group) creativity technique for idea generation processes. According to a study of Fernald and Nickolenko [2], 92% of the American companies use the brainstorming technique in meetings.
Studies on the effectiveness of this technique consistently show that brainstorming groups yield better results than groups conducting traditional meetings [3]. This is mainly due to the strict separation between a divergent phase, where ideas are only generated but not yet discussed, and a consecutive convergent phase, where ideas are evaluated.
Taylor et al. [4] made the finding that for brainstorming, nominal groups1
are more effective (in both quantity and quality of ideas) than groups where the participants communicate. Conducting creativity techniques as a real group process seems to imply some negative consequences that outbalance potential benefits. Three factors can explain the decrease of efficiency for interacting groups [3]:
2 In nominal groups, participants work separately from each other and at the end their ideas are merged.
165

1. Group pressure: Fear of judgment by the other group members and power misbalance (e.g. when hierarchies exist) inhibit participation and can lead to unwanted conformity of idea proposals.
2. Social loafing: Social loafing describes the tendency of group members to do less than their potential would allow them to do. It can occur either if a group member feels isolated from the group or if he feels too submerged.
3. Production blocking: Diehl and Stroebe see production blocking as the dominant factor for efficiency losses in group brainstorming processes [5]. Production blocking refers to the fact, that in interacting groups only one member can speak at a time, while the others have to listen; hence all but one member of the group are blocked and cannot work on their own ideas in this time.
Computer support for idea generation can help to mitigate the negative effects of
interacting groups. Carte et al. [6] state that due to the fact that a creativity support system (CSS) is able to anonymize the users and their contributions, the group pressure on the participants is lowered. Shepherd et al. [7] have shown that by improving the participation awareness in the process, social loafing effects can be reduced. Finally, when the team members do not communicate verbally, they can enter ideas parallely using keyboards and doing so are not interrupted by others. That's why the production blocking does not occur in computer-supported idea generation processes. All these factors lead to improved team effectiveness in idea generation sessions [8].
The studies mentioned above clearly indicate that it is preferable to avoid than to allow verbal communication in idea generation processes, which can be well explained with the effect of production blocking. However, this does not imply that other kinds of communication that enable direct communication between the participants must have a negative impact on the team effectiveness. E.g. using communication means that to allow parallel (non-blocking) communication such as a chat could be an improvement, as suggested in recent studies on computer supported group work (see section 2). In this paper, we want to present and discuss an empirical study we conducted on the research question whether a chat is beneficial for computer supported idea generation processes.
2 Communication in idea generation processes
An idea generation process is a series of activities leading to creative ideas. According to Sternberg [9], an idea is creative if it is “both novel (i.e. original, unexpected) and appropriate (i.e. useful, adaptive concerning task constraints)”. Creativity techniques are guidelines that structure idea generation processes, e.g. by defining distinctive phases or by regulating the participants’ behavior. These restrictions often affect the communication between the group members, as is the case for the brainstorming technique, where criticism is forbidden during idea generation. The strong empirical evidence on the effectiveness and result quality of creativity techniques with strong restrictions on communication (such as brainstorming)
166

indicates that direct communication may not be a positive or necessary factor for idea generation processes.
Applegate et al. [10] investigated a group decision support system for idea generation and issue analysis in organization planning. The participants could exchange ideas using the system, but had no means of direct communication via the system. Even though the participants were allowed to communicate verbally, the authors observed that approximately 96,6 % of the participants' time was spent on working on ideas using the system and only 3,4 % was used for non-electronic group interaction and communication. From this non-electronic communication, a large majority (47,54 %) was relatively short and technology-oriented. They also noted that the majority of verbal interaction was directed to the session facilitator (57 %). Given these small percentage values for "true" task-related direct group communication acts, one could assume that the overall role of direct communication in the process is neglectable.
Hilliges et al. [11] investigated the effects of using a tabletop interface in combination with a large wall display for face-to-face group brainstorming. They compared the results of this setting with control groups using the traditional paper-based method. When counting the groups’ ideas for the analysis of the experiment, they differentiated between new independent ideas, ideas that built on their own earlier ideas, ideas that resulted from seeing somebody else write down an idea and ideas that resulted from talking about an idea. 29 % of the ideas of the paper-based groups and 26% of the ideas of the electronically-supported groups ideas emerged as a result of a communication process. This implies that direct communication is the source of a substantial percentage of ideas which (in contrast to the studies and arguments presented above) may advocate the point of view that direct communication is beneficial in creative processes.
Comparing more than 40 studies on teams that interact mainly or exclusively using computer systems, Powell et al. [12] come to the conclusion that communication is the key success factor in virtual team situations. They argue for a high media-richness of the communication channels, which contrasts with the principle of creativity techniques for idea generation processes that have the tendency to limit the communication channels to allow only task-related idea exchanges and to avoid direct communication between the team members.
Summarizing major findings in GSS reserach, Nunamaker et al. [13] point out that support systems increase the number of ideas generated during a divergent (generation) process. The participation tends to be more equally distributed than in traditional meeting scenarios, which is mainly due to anonymity and the possibility to input ideas parallely. While Nunamaker refers only to parallel input of the generated ideas, we want to investigate the impact of a chat as a channel for direct communication between the participants of an idea generation process.
In conclusion, theories and studies of creative processes give ambiguous signals with respect to the question, whether direct communication, as provided by a chat actually supports idea generation processes or not.
167

3 Study
3.1 Setting
In order to find out more about the impact of chat communication on computer-supported idea generation processes, we conducted an experimental lab study. As participants we selected computer science students, mainly pursuing their Bachelor's degree. A total of 60 students, divided into 18 different groups, took part in the experiment.
The groups were composed randomly by picking the students who had signed up for an experiment date and dividing them into groups of four persons each. This was done in advance. Due to the fact that not all people showed up, the final groups split up into twelve groups with three students each and six groups with four students. Each participant had his own PC, and all PCs were set up with the same configuration (Windows XP, Firefox web browser). Any kind of explicit (e.g. verbal, visual) communication outside of the tool was strictly forbidden. A dedicated facilitator monitored the strict adherence to this rule.
3.2 Experiment
The students used a creativity support system named IdeaStream to find ideas for the given problem “For which purpose could the student fees be used?”. IdeaStream allows teams to collaborate on a virtual whiteboard using a broad set of different creativity techniques [14]. The user interface is shown in figure 1.
Fig. 1. Screenshot of the virtual whiteboard and the chat in IdeaStream.
There, people can work collaboratively on their ideas by creating new ones, changing, moving or deleting them. All ideas on the whiteboard are publicly
168

accessible, but without any information on who created or changed them. An idea is represented by a title and a set of components called aspects that represent pieces of information that in turn compose the idea. These pieces of information consist of texts, uploaded images or sketches. The participants used pseudonyms of the form "user x" that were randomly assigned by the system.
In half of the sessions, the groups were able to chat with each other by using the integrated chat-function. This set consisted of a total of 29 students partitioned into seven groups of three students and two of four students. The other half (31 students) had no means of direct communication at all. Those students were divided into five groups of three and four groups of four.
At the beginning of each session, the facilitator explained the user interface and the applied creativity techniques. After that, a 10-minute test case was played through, in order to let the participants get familiar with the user interface and the features of the tool. After this introduction the main part of the experiment took place.
The idea generation process of the experiment consisted of three connected phases, each following a different creativity technique for idea generation (Brainwriting, Unrelated Stimuli and Forced Combination, see [15] for detailed explanations of the techniques). The duration of each phase was 10 minutes, so each group spent 30 minutes for idea generation, which is a typical period for idea generation sessions [18] [19]. During those phases, all participants’ activities were logged. After completion of all phases, the students evaluated their generated ideas with respect to creativity and feasibility by using a score from 0 (worst) to 4 (best).
4 Results
While analyzing the results of the lab study, we were particularly interested in idea quantity, idea quality and participant satisfaction. When describing the results, we refer to the groups having a chat with “chat” and the groups having no chat with “no-chat”.
4.1 Idea quantity
Chat produced a total of 172 ideas, while no-chat generated 215 ideas. In relation to the number of participants, chat averaged 5.9 ideas per group member, being slightly outscored by no-chat with 6.9 ideas per participant.
4.2 Idea quality
The members of chat rated their ideas with respect to creativity with an average of 2.2 of 4 points , with respect to feasibility with an average of 2.6 of 4 points. No-chat evaluated their idea's creativity with an average of 2.0 and their idea's feasibility with an average of 2.3. So for both criteria, chat assessed slightly higher scores than no-chat.
For an external measure, we asked three researchers from our group to rate the ideas as objectively as possible. In this external rating, chat scored 2.1 for both
169

creativity and feasibility, while the ideas of no-chat were rated with an average of 2.2 for creativity and 2.1 for feasibility. So the external rating showed no significant difference in the quality of contributions between the two groups.
4.3 Participant Satisfaction
In a survey that was conducted immediately after the experiment, the participants were able to suggest improvements for the IdeaStream application. In 7 of the 9 groups of no-chat, at least one member requested a chat. However, both groups equally enjoyed working with the IdeaStream tool (4.6 of 6, where 0 means worst and 6 means best). No-chat rated their satisfaction with the group slightly higher than chat (5.0 / 4.8 of 6).
Table 1. Results of experiment comparing groups with chat and without chat during computer- supported creativity techniques for idea generation.
4.4 Summary
Even though there are numerical differences in the means of most of the relevant variables, t-tests showed that they are not statistically significant. Hence, the hypothesis that chat communication affects a collaborative idea generation process is not supported (H0 saying that there is no difference cannot be rejected). This is true for idea quantity, idea quality (internal and external) and group satisfaction.
5 Discussion
The design of the IdeaStream application and its use and configuration in our experiment provide means to counteract the three well-known negative influences that are usually credited for negatively impacting collaborative creative processes. The user awareness functions can help to inhibit social loafing. To prevent negative effects from social pressure, the users had pseudonyms assigned. Hence, the fear of negative judgment from others was lowered. Lastly, production blocking effects were minimized, since the system allows parallel input of ideas (and, for the chat-groups, of chat messages) and oral communication was strictly forbidden. In this way we provided an environment in which the known negative influence factors on group
170

creativity are mostly suppressed. Based on this, we were able to investigate the question if groups in idea generation processes can benefit from a chat as a channel for direct communication besides the means to enter ideas and view the ideas of others.
5.1 Impact on the process
Our experiment shows that neither overall quality nor quantity of the ideas that are generated by groups in computer-supported creativity techniques are influenced by the group having the possibility to chat. So, looking at the overall process results, there is no net impact of this additional direct communication at all. However, this does not imply that the process itself is not influenced by the communication. The theories presented in the previous chapters provide reasonable arguments on these effects and support the assumption that communication does actually affect the creative group process. However, our experiment showed that different process effects implied by communication definitely cancel each other out in creative group processes, since both settings yielded the same results.
To be able to better support the creative process with creativity support systems, it will be necessary to gain an understanding on the factors which influence communication. As a starting point for future research, we summarized potential positive and negative influence factors, which emerge from direct observations in the experiment as well as personal considerations (see figure 2).
Fig. 1. Potential positive and negative influence factors of communication on computer-supported idea generation processes.
Potential positive factors:
1. Information sharing: Letting others participate in your knowledge on a particular subject may enable them to create new or improved ideas. The stimulus through direct communication between the participants may be different from and additional to the stimulus received by seeing other people's ideas. Furthermore, people may have an information need with respect to the given problem that they can express via a channel such as a chat. That may also help in producing good quality ideas for that particular problem. 2. Socio-Emotional effects: It can be assumed that direct communication can improve emotional states of mind in a very general way, not only with respect to the initial
171

acceptance of the tool (see below) but also with respect to e.g. expressing and thus alleviating temporary emotional indispositions. 3. Consensus or commitment building: While in idea generation processes consensus or “general acceptability” with respect to ideas may not be necessary or in most cases even unwanted, direct communication may contribute to a certain consensus or commitment to some ideas that may give participants incentives to improve, structure or reposition the idea in question during the creative process without diluting it or neglecting alternative ideas.
Potential negative factors:
1. Softening and dilution of ideas: An effect that applies to all forms of “free” communication in creative processes and therefore may also affect chat is that communication may contribute to softening and dilution of innovative radical ideas. One possible reason can be the attitude in groups that induces the desire for agreement on proposed solutions. In order to reach this state the described softening on ideas in view of general acceptability often takes place which sometimes leads to a decreased quality or novelty compared to the original ideas. 2. Distraction: While it can be assumed that a chat is a parallel medium and electronically mediated communication requires fewer adherences to social norms that enforce listening to others while they speak, participants still have to take their time to read the chat contributions, which may distract them from their actual task of idea generation. 3. “Unprofessional” use: In the groups that were able to chat we observed tendencies for unfocused behavior such as joking, which may exert a social force on other participants to join this unfocused and thus potentially distracting behavior.
5.2 Impact on acceptance
As our survey shows, the majority of the groups that were not able to communicate with a chat suggested improving the system by adding a chat feature. This is in particular interesting given the fact that, after all, these groups were not less satisfied with the computer support system or the group than the groups that actually had the chat feature, so we must assume that actually providing them a chat would not have positively affected their satisfaction level. Nevertheless, there seems to be an inner need to communicate in group settings in general or the need for a communication assurance in view of the fear of having to use an unknown tool together with the pressure to produce good ideas. As Dennis and Reinicke [17] point out, acceptance of creativity support systems in practice is still weak, despite of the positive research results in the field. Our experiment findings suggest that there is a strong a priori demand for having a chat in a creativity support system, so providing a chat can help lowering acceptance barriers.
172

Conclusion
In this article we presented the results of a study concerning the use of chat for communicating in computer-supported idea generation processes. First we introduced some of the typical communication problems in interacting groups and showed how using creative support systems can decrease the impact of these factors. Then we reviewed what role recent literature assigns to communication in idea generation processes. Related work gave valid arguments supporting both theories that direct communication via a chat during idea generation processes is necessary and beneficial and that direct communication has negative influence and thus has to be avoided respectively. For this reason we conducted an experiment that resulted in approximately equal performance values for teams having chat as a communication tool and teams without chat function. In the discussion we then interpreted our results and addressed possible causes for them.
However, further research is needed, first of all to comprehensively identify possible other effects. Another important question regarding these effects is what influence they have on the idea generation process and its results. This could be accomplished by designing new experiments to isolate each of the effects. In addition there may be hidden context variables that change the weights depending on the situation, which makes the investigations even more difficult. Such context variables for example include time, place, setting, problem statement and/or type, creativity technique used, etc. For example the weight of "unprofessional" use may increase if the team members know each other well or if the computer support system is buggy.
It is also important to consider that experimental settings have restrictions, especially regarding relationships between participants, motivation and other important aspects that can influence the results of experiments significantly. Therefore we want to emphasize the need to conduct field studies as well with whose help new effects and aspects of intra-team communication may be discovered. On the other hand the complexity of field studies is far higher than of experiments. Trying to isolate effects (as described above) may be very hard or sometimes even impossible in some field study so that we believe that additional lab experiments still have to be used (as far as possible) in a complementary way.
References
1. Osborn, A. F., “Applied imagination. Principles and Procedures of Creative Thinking”, Creative Education Foundation, 3rd edition, 1993
2. Fernald, L. W. and P. Nickolenko, “The creative process: Its use and extent of formalization by corporations”, Journal of Creative Behaviour, vol. 27, no. 3, 1993, pp. 214–220
3. Isaksen, S. G., “A Review of Brainstorming Research: Six Critical Issues for Inquiry”, Technical report, Creative Problem Solving Group, Buffalo, New York, 1998
4. Taylor, D., P. Berry, and C. Block, “Does group participation when using brainstorming facilitate or inhibit creative thinking?”, Administrative Science Quarterly, vol. 6, 1958, pp. 22–47
173

5. Diehl, M. and W. Stroebe, “Productivity loss in idea-generating groups: Tracking down the blocking effect”, Journal of Personality and Social Psychology, 1991, vol. 61, pp. 392–403.
6. Carte, T. A., L. Chidambaram, M. J. Garfield, L. Hicks, and C. Cole, “Group Creativity and Collaborative Technologies: Understanding the Role of Visual Anonymity.”, 12th International Workshop on Groupware CRIWG, 2006, pp. 12–21
7. Shepherd, M. M., R. O. Briggs, B. A. Reinig, J. Yen, and J. F. Nunamaker, Jr., “Invoking Social Comparison to Improve Electronic Brainstorming: Beyond Anonymity.”, Journal of Management Information Systems, vol. 12, no. 3, 1995, pp. 155 – 170.
8. Bostrom, R. P. and M. Nagasundaram, “Research in Creativity and GSS”, Proceedings of the 31. Hawaii International Conference on System Sciences, Washington, DC, USA, 1998, pp. 391–405, IEEE Computer Society
9. Sternberg, R. J. and T. I. Lubart, “The Concept of Creativity: Prospects and Paradigms”, Cambridge University Press, Chapt. 1, 1999, pp. 3–14
10. Applegate, L. M., B. R. Konsynski, and J. F. Nunamaker, “A group decision support system for idea generation and issue analysis in organization planning”, CSCW ’86: Proceedings of the 1986 ACM conference on Computer supported cooperative work, ACM Press, New York, NY, USA, 1986, pp. 16–34
11. Hilliges, O., L. Terrenghi, S. Boring, D. Kim, H. Richter, and A. Butz, “Designing for collaborative creative problem solving”, Proceedings of the 6th ACM SIGCHI conference on Creativity and Cognition, ACM Press, 2007, pp. 137–146
12. Powell, A., G. Piccoli, and B. Ives: “Virtual teams: a review of current literature and directions for future research”, SIGMIS Database, vol. 35, no. 1, 2004a , pp. 6–36
13. Nunamaker, J., R. O. Briggs, D. D. Mittleman, D. R. Vogel, and P. A. Balthazard, “Lessons from a Dozen Years of Group Support Systems Research: A Discussion of Lab and Field Findings”, Journal of Management Information Systems, vol. 13, no. 3, 1997, pp. 163–207
14. Forster, F., “Distributed Creative Problem Solving over the Web”, ICIW ’08: Proceedings of the 2008 Third International Conference on Internet and Web Applications and Services, IEEE Computer Society, Washington, DC, USA, 2008, pp. 283–288
15. Vangundy, A. B., “Techniques of Structured Problem-Solving”, Springer Netherland, 1st edition, 1988
16. Reinig, B., R. Briggs, and J. Nunamaker, “On the measurement of Ideation Quality”, Journal of Management Information Systems, vol. 23, no. 4, 2007, pp. 143–161
17. Dennis, A. and B. Reinicke, “Beta vs. VHS and the Acceptance of Electronic Brainstorming Technology”, MIS Quarterly, vol. 28, 2004, pp. 1–20.
18. Helquist, J., Santanen, E., Kruse, J., “Participant-driven GSS: Quality of Brainstorming and Allocation of Participant Resources”, Proceedings of the CSCW 2007, ACM Press, pp. 1530-1605
19. Prante, T., Magerkurth, C., Streitz, N., “Developing CSCW Tools for Idea Finding – Empirical Results and Implications for Design”, Proceedings of the CSCW 2002, Luisiana, USA, ACM Press, pp. 106-115
174

Live Coding Towards Computational Creativity
Alex McLean and Geraint Wiggins
Goldsmiths, University of London, United [email protected],
WWW home page: http://doc.gold.ac.uk/∼ma503am/
Abstract. Live coding is a way of improvising music or video animationthrough live edits of source code, using dynamic language interpreters.It requires artists to represent their work within a formal computer lan-guage, using a higher level of abstraction than is the norm. Althoughthe only creative agents in live coding performance are human, this ab-straction makes the practice of interest to the field of computationalcreativity. In this paper live coders are surveyed for their thoughts onlive coding and creativity, related to the aims of building creative agents.
1 Introduction
Live coding is the writing of rules in a Turing complete language while they arefollowed, in order to improvise time based art such as music, video animationor dance. This is a relatively new approach, receiving a surge of interest since2004, through both practice and research [1–6].
Live coding is most visible in performance, however the ‘live’ in live codingrefers not to a live audience but to live updates of running code. Convention-ally humans write code followed by software, although some experimental danceimprovisations have used both human rule makers and rule followers. Whetherhuman live coders can be replaced by software creative agents is a question forthe field of computational creativity, which we hope to have at least clarified bythe end of this paper.
In contrast to live coding, generative art is output by programs unmodifiedduring execution, which often have no user interface at all. The lack of controlover such programs has led to a great deal of confusion around the question ofauthorship. When watching a piece of software generate art without guidance,onlookers ask “is the software being creative?” There is no such confusion withlive coding, there is a human clearly visible, making all the creative decisionsand using source code as an artistic medium. In fact there is no difference ofauthorship between live coded and generative art. A programmer making gen-erative art goes through creative iterations to, only after each edit they have torestart the process before reflecting on the result. This stuttering of the creativeprocess alone is not enough to alter authorship status.
If the computer’s role in a live coding performance is uncreative, then whatis this paper doing submitted to a computational creativity conference? Well, asa new way of producing art using formal systems, it is hoped that live coding
175

can give a unique clarifying perspective on issues of computational creativity,and perhaps even become a stepping stone towards a creative software agent.
2 Live coders on computational creativity
A survey was carried out with the broad aim of gathering ideas for study ofcomputational creativity. The members of TOPLAP [3], an active live codingcommunity, were asked to fill out an on-line survey, and 32 responded. To avoidprejudice, the word ‘creativity’ was not used in the invitation or survey text, andpertinent questions were mixed with more general questions about live coding.
2.1 Results
The subjects. Users of the six pre-eminent live coding environments were rep-resented, between five and fourteen for each system (many had used more thanone). Background questions indicated a group with a generally rich musical back-ground. There were a diverse range of approaches to the question of how to definelive coding in one sentence, and the reader is referred to the on-line appendixto read the responses (http://doc.gold.ac.uk/∼ma503am/writing/icccx/). Whilethe responses show some diversity of approach, because the subjects had all usedat least one of the main languages it seems safe to assume that they are workingto largely the same technical definition.
Creating language. Computer users often discuss and understand computerprograms as tools, helping them do what they need efficiently. For a programmerit would instead seem that a computer language is an immersive environmentto create work in. It is interesting then to consider to what extent live codersadapt their computer languages, personalising their environments, perhaps to aidcreativity. Over two thirds (69.0%) collected functions into a library or made anextensive suite of libraries. This is analogous to adding words to a language,and shows the extent of language customisation. A smaller proportion (20.7%)had gone further to implement their own language interpreter and fewer still(17.2%) had designed their own language. That these artists are so engagedwith making fundamental changes to the language in which they express theirwork is impressive.
Code and style. From the perspective of computational creativity, it is inter-esting to focus on the code that live coders produce. Their code is not their work,but a high level description of how to make their work. A creative computationalagent would certainly be concerned with this level of abstraction. An attemptat quantifying how live coders feel about their code was made by asking “Whenyou have finished live coding something you particularly like, how do you feeltowards the code you have made (as opposed to the end result)?” Over half(56.7%) indicated that the code resulting from a successful live coding session
176

was a description of some aspect of their style. This suggests that many feel theyare not encoding a particular piece, but how to make pieces in their own partic-ular manner. Around the same number (50.0%) agreed that the code describessomething they would probably do again, which is perhaps a rephrasing of thesame question. A large number, (83%) answered yes to either or both questions.There are many ways in which these questions can be interpreted, but the sug-gestion remains that many subjects feel they have a stylistic approach to livecoding that persists across live coding sessions, and that this style is somehowrepresented in the code they make.
Live coding as a novel approach. The subjects were asked the open question“What is the difference between live coding a piece of music and composing it inthe sequencer (live coding an animation and drawing one)? In other words, howdoes live coding affect the way you produce your work, and how does it affectthe end result?” Some interesting points relevant to computational creativity areselectively quoted for comment here, the reader is again directed to the on-lineappendix to read the full responses.
“I have all but [abandoned] live coding as a regular performance practice,but I use the skills and confidence acquired to modify my software liveif I get a new idea while on stage.”
The admission that getting new ideas on stage is infrequent, makes an im-portant and humble point. In terms of the Creative Systems Framework (CSF)[8, 7] we can say that live coding is useful in performance if you need to trans-form your conceptual space (the kind of work you want to find or make), oryour traversal strategy (the way you try to search for or make it). However, aswith this subject, transformational creativity is not always desirable in front ofa paying risk-averse audience.
“When I work on writing a piece ... I can perfect each sound to beprecisely as I intend it to be, whereas [when] live coding I have to bemore generalised as to my intentions.”
Making the point that live coders work at least one level of abstraction awayfrom enacting individual sounds.
“Perhaps most importantly the higher pace of livecoding leads to moreimpulsive choices which keeps things more interesting to create. Notsure how often that also creates a more interesting end result but atleast sometimes it does.”
Live coding allows a change in code to be heard or seen immediately in theoutput, with no forced break between action and reception. This would be asurprise to those whose experience of software development is slow and arduous.
“Live coding has far less perfection and the product is more immediate. Itallows for improvisation and spontaneity and discourages over-thinking.”
177

This may also come as a surprise; live coding has a reputation for being cere-bral and over technical, but in reality, at least when compared to other softwarebased approaches, the immediacy of results fosters spontaneous thought.
“Live Coding is riskier, and one has to live with [unfit decisions]. Youcan’t just go one step back unless you do it with a nice pirouette. There-fore the end result is not as clean as an ”offline-composition”, but it canlead you to places you [usually] never would have ended.”
This comment is particularly incisive; the peculiar relationship that livecoders have with time does indeed give a certain element of risk. Thinking againwithin the CSF [7], such riskier ways of making music are more likely to pro-duce aberrant output, providing the opportunity to adjust your style throughtransformational creativity.
“... while Live Coding is a performance practice, it also offers the tan-talising prospect of manipulating musical structure at a similar abstractlevel as ’deferred time’ composition. To do this effectively in performanceis I think an entirely different skill to the standard ’one-acoustic-event-per-action’ physical instrumental performance, but also quite differentto compositional methods which typically allow for rework.”
This really gets to the nub of what live coding brings to the improvisingartist – an altered perspective of time, where a single edit can affect all theevents which follow it.
Live coding towards computational creativity. The subjects were given aseries of statements and asked to guess when each would become true. Regret-tably there was a configuration error early on in the surveyed period, requiringthat the answers of two subjects were discarded.
Optimism for the statement “Live coding environments will include featuresdesigned to give artistic inspiration to live coders” was very high, with just overhalf (51.9%) claiming that was already true, and two fifths (40.7%) agreeing itwould become true within five years. This indicates strong support for a weakform of computational creativity as a creative aide for live coders. Somewhatsurprisingly, optimism for the stronger form of creativity in “Live code will beable to modify itself in an artistically valued manner” was also high, with twofifths (40.7%) claiming that was already possible. If that is the case, it wouldbe appreciated if the live code in question could make itself known, although itseems more likely that ambiguity in the question is at fault. A little more pes-simism is seen in response to “A computer agent will be developed that producesa live coding performance indistinguishable from that of a human live coder”,with a third (34.6%) agreeing this will never happen. This question is posed inreference to the imitation game detailed by Alan Turing [9]. However as onesubject commented, “the test indistinguishable from a human is very loose andthere can be some very bad human live coding music.” That would perhaps ex-plain why half (50.0%) thought the statement was either already true or wouldbecome so within five years.
178

3 Conclusion
What if a musicology of live coding were to develop, where researchers decon-struct the code behind live coding improvisations as part of their work? Cor-relations between expressions in formal languages and musical form in soundcould be identified, and the development of new ways of expressing new musicalforms could be tracked. If successful, the result need not be a new kind of music,but could be a music understood in a novel way. It is this new computationalapproach to understanding music that could prove invaluable in the search fora musically creative software agent.
In looking at creativity through the eyes of live coders, we can see somepromise for computational creativity even at this early stage of developmentof both fields. Live coders feel their musical style is encoded in the code theywrite, and that their language interfaces provide them with inspiration. Theyare actively developing computer languages to better express the music theywant to make, creating computer language environments that foster creativity.From here it is easy to imagine that live coding environments could becomemore involved in the creation of higher order conceptual representations of time-based art. Perhaps this will provide the language, environment and applicationin which a computational creative agent will thrive.
References
1. Blackwell, A., Collins, N.: The programming language as a musical instrument. In:Proceedings of PPIG05. University of Sussex (2005)
2. Wang, G., Cook, P.R.: On-the-fly programming: using code as an expressive musicalinstrument. In: NIME ’04: Proceedings of the 2004 conference on New interfaces formusical expression, Singapore, Singapore, National University of Singapore (2004)138–143
3. Ward, A., Rohrhuber, J., Olofsson, F., McLean, A., Griffiths, D., Collins, N., Alexan-der, A.: Live algorithm programming and a temporary organisation for its promo-tion. In Goriunova, O., Shulgin, A., eds.: read me — Software Art and Cultures.(2004)
4. Collins, N.: Live coding practice. In: NIME. (2007)5. Collins, N., McLean, A., Rohrhuber, J., Ward, A.: Live coding in laptop perfor-
mance. Organised Sound 8(03) (2003) 321–3306. Sorensen, A., Brown, A.R.: aa-cell in practice: An approach to musical live coding.
In: Proceedings of the International Computer Music Conference. (2007)7. Wiggins, G.A.: A preliminary framework for description, analysis and comparison
of creative systems. Journal of Knowledge Based Systems (2006)8. Boden, M.: The Creative Mind. Abacus (1990)9. Turing, A.M.: Computing machinery and intelligence. Mind LIX (1950) 433–460
179

On Two Desiderata for Creativity Support Tools
Wai K. Yeap1, Tommi Opas1 and Narges Mahyar2
1Centre for Artificial Intelligence Research, Auckland University of Technology , New Zealand
2Department of Artificial Intelligence, Faculty of Computer Science and Information Technology,
University of Malaya, Malaysia
Abstract. This paper discusses two important desiderata for developing creativity support tools, namely ideation and empowerment. We then use them to guide us in designing a new individual creativity support tool codenamed Creative-Pad. Creative-Pad is designed to assist individual advertising creative to develop creative ideas for advertisements. For ideation, Creative-Pad searches and filters information automatically from the internet to present to the user with related words and exemplar sentences. For empowerment, Creative-Pad is designed in such a way that the user is neither distracted nor burdened to do any other tasks unrelated to conjuring up a creative idea for a new advertisement. Creative-Pad is fully implemented and some preliminary results of its use by advertising creatives are reported.
1 Introduction
Developing a creativity support tool is an exciting and a very challenging problem for HCI researchers. This is because the interaction between the computer and the human in this task is almost magical. That is, despite significant past research into the nature of creativity (for example, see [1, 4, 19, 20]), we do not understand how the mind works in a creative way. Yet, the challenge here is to develop tools to assist the mind in its creative endeavour. Shneiderman [17, p. 116] remarked: “Developing software tools to support creativity is an ambitious, but some would say, vague goal.”.
Developers of such tools thus face some acute problems. For example, when users of such tools fail to develop a creative solution, it is difficult to know where the problem lies. There are many other factors, such as one’s lack of attention, skills, and interests, which could affect the user’s performance. The interplay of these factors occurs in the mind of the user and is therefore difficult to weed out. Without doing so, it would be difficult to develop a set of criteria or a framework for developing and evaluating these tools (although attempts were made, see [16, 18]). Another example is a general lack of distinction between a creativity support tool and a problem-solving tool. For instance, if one were to use a sketch pad to help sketch out various ideas, should that be a creativity support tool or a drawing tool? Distinguishing between them might not be a straightforward task. This is because a creativity support tool is often perceived to be very much a part of a problem-solving tool. Yet, without
180

doing so one could complicate the design of such tools or at worse, be confused with the kind of tool that one is supposed to design.
Attempts to define creativity support tools in the past thus tend to be quite comprehensive. For example, Lubart [10] considered four categories: computer as nanny, pen-pal, coach and colleague, while Johnson and Carruthers [7] considered three classes which range from tools that do not produce creative ideas/artefact to those that could assist in many different ways. Although these classifications provide a good scope for discussing work in this area in general, they lack definitive statements about these tools and in particular those designed to assist individuals to solve a particular problem.
In this paper, we discuss two desiderata for developing creative support tools, namely ideation and empowerment. The former emphasizes on generating new ideas to the user and the latter, empowering the user to be creative. Section 2 discusses these two desiderata in details. We then show how they guide us in our design and implementation of a new creativity support tool, codenamed Creative-Pad. Creative-Pad is designed to assist individual advertising creative. An advertising creative (or, in short, a creative) is a person working for an advertising agency who is responsible for developing creative ideas for a new advertisement. For ideation, we emphasize on developing a process which generates ideas that bear some relations to the problem on hand. For empowerment, we emphasize on providing the user much time to conjure his/her idea for a new advertisement while being hinted with some “seed” ideas. Section 3 discusses the design and implementation of Creative-Pad. Section 4 concludes the paper with a general discussion of future work and the lessons learned from developing Creative-Pad.
2 Desiderata
The first desideratum, ideation, emphasizes a process which has been well observed to be an inherent part of creative thinking, namely the ability to generate/discover new ideas. Much has already been said in the literature regarding the way in which ideas emerge in a creative process, first as a set of divergent ideas and then as a set of convergent ideas. However, we argue that the ideation process implemented for any creativity support tool should focus only on generating a set of divergent ideas. In particular, we consider the convergent part, for now, to be the responsibility of the user. Partly, this is because we lack an understanding of how creative thinking arises and partly this provides a clear goal for designing these tools. If not, the design of these tools would become too intertwined with the two roles and thus becoming unnecessary complicated.
Furthermore, the ideation process should be able to generate a new set of ideas when used repeatedly and the ideas generated must somehow be able to inspire the user to then work towards a creative solution. If not, the tool itself will be limited in its ability to support creative thinking, both in terms of quantity and quality of ideas generated. It is worthwhile distinguishing between creative thinking tools from creativity support tools as defined here. The former incorporates methods (such as Osborn’s [13] brainstorming, de Bono’s [5] lateral thinking, and MacCrimmon and
181

Wagner’s [11] techniques for “making connections”) which encourage users to come up with new ideas themselves whereas the latter automatically generates ideas to inspire/lead the users to develop a more creative solution for the problem on hand.
Developing such an ideation process suggests that its des ign needs to be crafted in a way that combines both the need to have fresh ideas and ideas that are in creative ways linked to the problem on hand. Consequently, attention needs to be paid to the exact nature of the creative aspect of the problem for which the tool is designed and to where the possible source of inspiration lies. Bonnardel [2, p.158], in analysing the use of analogies in creative activities, also emphasized the importance of knowing “the nature of the situations that can be used as sources of inspiration”.
The second desideratum, empowerment, relates to the tool’s usability. Following from the first desideratum, it becomes clear that this should be about empowering the users to develop his/her ideas freely. By “freely”, it is meant as little interruption as possible to the user’s thought process. Again, this is important because we lack an understanding of how creative thinking arises. The user is best left alone to develop a creative solution.
Fig. 1. Two different views of a creativity support tool: (a) Creativity support embedded in a problem-solving environment; (b) Creativity support view as independent moments in a problem-solving process – after each session, the tool could be updated (dotted arrow)
One way to ensure that this desideratum is met is to separate one’s initial thinking
process from one’s later “action” process. The latter is when the user begins to implement his/her initial ideas fully. A creativity support tool when designed to assist only the former activity would require an interface whereby the user literally has to do nothing. In contrast, researchers who focus on developing a suitable environment to support creative thinking (example, [6]) often tend to provide many tools or a tool with many functions. These environments often allow the users to experiment with alternative ideas prior to moving on to developing the final idea. Creativity support in this latter case is very much embedded as part of the problem-solving process (see Fig. 1a) whereas in our approach, creativity support is very much an independent process (see Fig. 1b). It captures the moments when users take time out to think about certain aspects of the problem. There could be more than one such moment and each might require the use of a different creativity support tool.
(a)
Creativity-support
Problem-solving environment
Possibly different creativity-support tools
Problem solving process
(b)
182

3 Creative-Pad: Design and Implementation
The process of creating an advertisement could succinctly be described as having three key elements, namely a message, an idea, and an execution. A creative first draws out a message from the brief describing the product. Then he/she develops an idea which in turn is executed to produce an advertisement. It is evidently clear that much of the process for finding some initial good ideas for developing an advertisement involves words association. It is interesting to note that this method is also one of the simplest and most popular methods used for generating ideas in many of the commercial creative software. For example, IdeaFisher is one such program and it has an idea bank of more than 700,000 words associations to generate ideas for its user. However, creatives working in this area have often noted that if the word associations are generated in a manner unrelated to the problem on hand, there is a danger that the ideas generated may not be of much use [15]. Furthermore, Poltrack [15] noted that for advertising, related ideas should come from “all corners of life” and one need to “stay tune with the world”. These observations suggest the need for a rich source of contemporary ideas .
Without doubt, one rich source of such contemporary ideas is the World-Wide-Web, or in short, the web. It also has the added advantage of being a huge resource which is readily available, constantly updated, and information is literally coming from “all walks of life”. However, using search tools to retrieve information from the web often produce an overwhelming amount of information [9]. Consequently, researchers are constantly designing new ways to help filter the information. Of particular interests here are Otsubo’s Goromi-Web [14] and Koh et al.’s combinformation [8]. The former extracts and displays keywords that frequently appear in the search results and also displays images and blocks of text as floating images on the screen. The latter extracts text and image clippings from the found documents. These clippings are then presented to the user in a composition space as a group of related ideas and with which the user can interact. For instance, he or she could mouse over it to retrieve further information.
However, unlike Goromi-Web and combinformation, an ideation process for Creative-Pad must not detract the users unnecessary. Consequently, we design a process which does not engage the user with its search for ideas. The user simply enters the keywords from the message and the extraction of ideas is then done automatically. Our current ideation algorithm is as follows:
1. User enters keywords from message; 2. Send request to search engine (currently using Altavista.com) for related
information on the web; 3. Extract links from the results returned and download Html files from each link; 4. Extract all sentences from the Html files that contain the keywords; 5. Extract “interesting” words from these sentences; for now, a simple algorithm is
used. We extract all adjectives and verbs found in these sentences.
183

Fig. 2. Creative-Pad Interface Thus, the ideation process produces as ideas, a set of words and sentences. To
provide an environment conducive for the user to develop his/her own creative ideas for an advertisement, we developed an interface whereby the demand on the user is again kept to a minimum. Basically, Creative-Pad projects ideas onto the screen and the user constantly works on his/her ideas with little interruption. Each session using Creative-Pad consists of the following steps:
1. Words, in randomly assigned colour, are beamed to the user one at a time and up
to a maximum of 150 words per screen (see Fig. 2a). While the words are presented, music is being played in the background Note that words are deliberately presented in an overlapping fashion to discourage the user from reading the words.
2. As each word appears, the user could select it if he/she finds it interesting or inspiring. This is done by either typing the word at the box at the bottom of the screen or clicking the save button (see Fig. 2a).
3. When the maximum number of words is displayed, the screen pauses. The user is given time to work on any ideas brewing in his/her mind.
4. If there are still words to be displayed, the user can repeat step (2) or if the user has had enough ideas, he/she could go to the next step.
5. The user-selected words are then re-beamed to the user together with some randomly generated words. The latter is added partly to add some random ideas and partly to increase the number of ideas in case the user has selected insufficient words.
6. When all the words are displayed, they will be rotated for a few seconds and re-displayed in random positions. During this time, the user is supposed to continue developing his/her ideas. He/she might record his/her ideas by typing a succinct sentence at the bottom of the screen.
7. When the user has had sufficient time developing his/her ideas, he/she will press the continue button to move to the next step.
8. Creative-Pad will then display sentences to the user, moving them from the top right corner to the bottom left corner of the screen. These sentences contain the user selected words and each sentence is numbered (see Fig. 2b). The user could
Save button (a) (b)
184

select those sentences of interests by entering their number at the box at the bottom of the screen.
9. Finally, the user views all words and sentences that he/she has selected or created. He/she continues to develop his/her ideas further.
10. When the session concludes, a report will be generated which contains all the words and random words generated during this session and all the words, sentences and idea sentences generated by the user during this session.
Fig. 3 shows our basic model for Creative-Pad. Step 1 is the ideation process which
consists of retrieving information from the web using some keywords from the message and then processing the information for relevant ideas. In Step 2 ideas are presented to the users in four phases. Firstly, the retrieved words, W1…W t, are presented to the user to help evoke possible ideas for advertisement. User at this stage only needs to select the words that are of interests to him/her. Secondly, the selected words, W s1…Wsm, will be re-displayed and if necessary, together with some randomly generated words, R1…Rp. User at this stage will have a chance to refine his/her thoughts further and describe each of them with single sentences. Thirdly, sentences, S1…So, which contain the selected words, Ws1…Wsm, are displayed as exemplar of ideas using those words. User at this stage can select sentences which are of interests to him/her. Finally, both selected words and sentences are displayed and user can continue to refine his/her ideas.
Fig. 3. Basic model of Creative-Pad Several experiments were conducted where creatives were asked to use Creative-
Pad to develop ideas for some imaginary advertisements. Details of these experiments are reported in [12]. One such experiment with two creatives from two different advertising companies is reported here. The experiment was conducted as follows: Duration - 30 minutes; Instruction given - You will need to enter the phrase “car + family + space” into Creative-Pad and during the experiment, develop ideas for an advertisement with the message “a car with more family space”. At the end of the
Step 2:
Message WWW
Step 1:
S1….Sn W1….W t
W1….Wt Ws1….Wsm + R1….Rp
S1….So report S + Ws
185

experiment, use an A4 sized paper and a black marker to draw or write whatever you think you need to describe your concept.
Note that although ideas generated using Creative-Pad is not intended to be used immediately to generate a graphic display, we nonetheless asked the creatives to do so. This might help us to understand better the ideas currently in the mind of the creatives. Ideally though, they should put the ideas in the drawer and re-visit them later to produce the advertisement required. Figs. 4a and 5a show the words and sentences selected, and the ideas generated by the user (arrows indicate a possible connection between the idea generated and the words/sentences selected). Figs. 4b and 5b show the graphic output of a possible ad.
Fig. 4. Result obtained using keywords: car, family, space
(a) (b)
Selected words
User’s ideas Selected Sentences
Buy Interior Buying Camping Rental Comfortable Compact Feel Top Easy Speed Owned Search Appeal Set Cheap National Personal Excellent Ideal automotive
Sleeping in car
Cheap accommodation
Built in stove
Has a shower Sleeps 2 people Double bed Seats fold away Large space Camper car Roof expands
Transforms to a camper car
Electric hybrid
Pros: Great Price, Comfortable Ride, Lots of space, Great family car
You feel very little movement in the car and it wouldn’t be a terrible exaggeration to say that you could easily fall asleep in the backseat.
Who should buy this car
Best car I’ve ever owned
186

Fig. 5. Another result obtained using keywords: car, family, space
For Fig. 4, two themes emerge from the words selected by the elective: room and
them. Interestingly, the word “room” appears in one of the selected sentences. The number of words displayed was: 234 adjectives, 43 verbs, and 30 random words. The creative selected 9 words and 2 sentences, and generated 4 ideas. For Fig. 5, the emerging theme is a camper car. The number of words displayed was: 283 adjectives, 78 verbs, and 20 random words. User selected 22 words and 4 sentences, and generated 2 ideas.
4 Discussion and Conclusion
Given that creative thinking is still very much a mystery process, we argued that the development of creativity support tools should focus on:
1. Ideation – the tool must be able to generate a new set of ideas when used
repeatedly and the ideas generated must somehow be able to inspire the user to then work towards a creative solution. To achieve the latter, we find words which have some relevance to the problem on hand.
2. Empowerment – the tool must be designed to support the user to be creative in deriving a solution to his/her problem. It aids the “thinking” part as opposed to the “action” part in solving a problem and it should afford minimum interference to the user’s thought process.
With the above properties, a creative support tool could generate ideas that are more relevant than one which supports creative thinking in general and yet it supports finding a solution but not solving the problem itself.
The web undoubtedly provides a rich source of information for the ideation process in Creative-Pad. However, unlike many of the earlier approaches which use this resource, we do not involve the user to search and filter the information retrieved. The ideation process automatically extracts what it believes is useful and the user’s role is to focus on developing a creative solution based upon the information presented to
Selected word User’s ideas Selected Sentences More Extra Larger Designed Organize Stowed Uses Ground-breaking full
More room for your precious cargo
Designed with them in mind (family)
It’s all about them
It’s like a spare room
The firm claims it combines the practicality of a larger car with the appeal of a supermini
An extra flex room gives you plenty of creative ways to use this space
(b) (a)
187

him/her. In this implementation, a simple algorithm is used for extracting words from it. Nonetheless, the resource is so rich that our simple mechanism proves to be adequate, in the sense that the creatives found the information useful and interesting. In addition to the words, we also present sentences that contain the words that the creatives have chosen. One surprising finding is that many of them found that the sentences generated interesting. One possible explanation is that these sentences are like tidbits of news or opinions or commentaries related to the product on hand and thus they kept the creatives informed. They enable the creatives to “stay tune with the world” as if he is gathering the information from a stroll down the street. The creatives could develop an advertisement to position the product in light of these tidbits of information.
Our initial experiments with Creative-Pad are not intended to test the effectiveness of Creative-Pad in helping the creatives to generate creative ideas. As noted earlier in the introduction, such a test is ill-defined, at least for the moment. Rather, they are designed to test whether the ideas generated are sufficiently interesting for the creatives. This, we argue, proves to be the case. Creative-Pad could now serve as a platform for developing and testing these algorithms further. However, a closer inspection of the words generated shows many of the words are judged not interesting. Furthermore, if we treat each word generated as an idea for the creatives, Creative-Pad has generated on average 200 words per experiment and the creatives chose, on average, about 10-15 words. Does the ideation process need to be more “thoughtful” in generating ideas? The initial phase of our ideation process closely resembles a brainstorming session; an extremely popular idea in creative thinking and which has influenced our implementation of the ideation process. Is brainstorming, where quantity of ideas is of essence, the only and best way to interact with the creatives? Or, would it be better to present fewer but better developed ideas? Creative-Pad would provide a suitable platform to experiment with these different alternatives in the future.
In our framework, one way to empower the user to think freely is to identify clearly different areas within the problem where creative thinking is needed and then develop separate creativity-support tools for them. In advertising, there are two different sub-problems, namely getting an idea for the advertisement and developing the final advertisement itself. Creative-Pad is successfully developed for the former. In implementing the interface, we provide ample of time for the users to develop his/her ideas. However, this is done in an ad hoc fashion; more study is needed to develop an interface that better suits the way creatives work.
In summary, creative thinking is such a remarkable feat of the human mind that researchers attempting to develop tools to support such an endeavour must develop a multitude of approaches for experimentation. One such approach is being presented in this paper whereby the focus is on developing an ideation process and an interface which requires the user to almost do nothing except to focus on generating creative ideas for the problem on hand. Using this approach, a tool for advertising creatives has been developed and tested successfully. The tool now provides a platform for future experimentation and discovery about creativity support tools in general and creativity support tools for advertising in particular. Much more research needs to be carried out to establish whether these two desiderata are essential for all such tools or whether we need different desiderata for different tools. If the latter, what are these?
188

References
1. Boden, M.A.: The Creative Mind: Myths and Mechanisms. Weidenfeld and Nicolson, London (1997)
2. Bonnardel, N.: Creativity in Design Activities. In: Creativity and Cognition, pp. 158—165. ACM Press (1999)
3. Chen, Z.: Towards a Better Understanding of Idea Processors, Info. and Soft. Techn. 40, 541—553 (1998)
4. Csikszentmihalyi, M.: Creativity – Flow and the Psychology of Discovery and Invention. Harper Collins Publishers, New York, (1996)
5. De Bono, E.: Lateral Thinking. Harper Colophon Books, New York (1973) 6. Fisher, G.: Domain-oriented Design Environments. Automated Soft. Eng. 1, 177--203
(1994) 7. Johnson, H., and Carruthers, L.: Supporting Creative and Reflective Processes. Int. J. of
Human-Computer Studies 64, 998--1030 (2006) 8. Koh, E., Kerne, A., and Hill, R.: Creativity Support: Information Discovery and
Exploratory Search. In: Proc SIGIR 07, pp. 895--896, ACM Press (2007) 9. Kules, B. Supporting Creativity with Search Tools. In: NSF Workshop Report on Creativity
Support Tools, pp. 53--63 (2005) 10. Lubart, T. How Can Computers be Partners in the Creative Process. Int. J. of Human-
Computer Studies, 63, 365--369 (2005) 11. MacCrimmon, K.R. and Wagner, C. Stimulating Ideas Through Creativity Software.
Management Science, 40, 1514--1532 (1994) 12. Opas, T. An Investigation into the Development of a Creativity Support Tool for
Advertising. PhD Thesis, Auckland University of Technology, New Zealand (2008) 13. Osborn, A.F. Applied Imagination: Principles and Procedures of Creative Thinking.
Scribner’s, New York (1953) 14. Otsubo, G. (2007) Goromi-Web: Browsing for Unexpected Information on the Web. In:
Creativity & Cognition 2007, pp. 267—268. ACM Press (2007) 15. Poltrack, T. Stalking the Big Idea: Some Meditations on the Creative Process. Agency
Magazine Spring (1991) 16. Resnick, M., Myers, B., Nakakoji, K., Shneiderman, B., Pausch, R., Selker, T., and
Eisenberg, M. Design Principles for Tools to Support Creative Thinking. In: NSF Workshop Report on Creativity Support Tools, pp. 25--36 (2005)
17. Shneiderman, B. Creativity Support Tools. CACM, 45, 116--120 (2002) 18. Shneiderman, B., Fischer, G., Czerwinski, M., Resnick, M., Myers, B., Candy, L.,
Edmonds, E., Eisenberg, M., Giaccardi, E., Hwett, T., Jennings, P. and Kules, B. Creativity Support Tools: Report From a U.S. National Science Foundation Sponsored Workshop. Int. J. Human-Computer Interaction, 20, 61--77 (2006)
19. Sternberg, R.J. The Nature of Creativity: Contemporary Psychological Perspectives. Cambridge University Press (1988)
20. Wallas, G.: The Art of Thought. New York: Harcourt Brace (1926)
189

Bisociative Knowledge Discovery for
Microarray Data Analysis
Igor Mozetic1, Nada Lavrac1,2, Vid Podpecan1, Petra Kralj Novak1,Helena Motaln3, Marko Petek3, Kristina Gruden3,
Hannu Toivonen4, Kimmo Kulovesi4
1 Jozef Stefan Institute, Jamova 39, Ljubljana, Slovenia{igor.mozetic, nada.lavrac, vid.podpecan, petra.kralj}@ijs.si
2 University of Nova Gorica, Vipavska 13, Nova Gorica, Slovenia3 National Institute of Biology, Vecna pot 111, Ljubljana, Slovenia{helena.motaln, marko.petek, kristina.gruden}@nib.si
4 Department of Computer Science, University of Helsinki, Finland{hannu.toivonen, kimmo.kulovesi}@cs.helsinki.fi
Abstract. The paper presents an approach to computational knowledgediscovery through the mechanism of bisociation. Bisociative reasoningis at the heart of creative, accidental discovery (e.g., serendipity), andis focused on finding unexpected links by crossing contexts. Contextu-alization and linking between highly diverse and distributed data andknowledge sources is therefore crucial for the implementation of bisocia-tive reasoning. In the paper we explore these ideas on the problem ofanalysis of microarray data. We show how enriched gene sets are foundby using ontology information as background knowledge in semantic sub-group discovery. These genes are then contextualized by the computationof probabilistic links to diverse bioinformatics resources. Preliminary ex-periments with microarray data illustrate the approach.
1 Introduction
Systems biology studies and models complex interactions in biological systemswith the goal of understanding the underlying mechanisms. Biologists collectlarge quantities of data from wet lab experiments and high-throughput plat-forms. Public biological databases, like Gene Ontology and Kyoto Encyclopediaof Genes and Genomes, are sources of biological knowledge. Since the growingamounts of available knowledge and data exceed human analytical capabilities,technologies that help analyzing and extracting useful information from suchlarge amounts of data need to be developed and used.
The concept of association is at the heart of many of today’s ICT technolo-gies such as information retrieval and data mining (for example, association rulelearning is an established data mining technology, [1]). However, scientific dis-covery requires creative thinking to connect seemingly unrelated information,for example, by using metaphors or analogies between concepts from differentdomains. These modes of thinking allow the mixing of conceptual categories and
190

contexts, which are normally separated. One of the functional basis for thesemodes is the idea of bisociation, coined by Artur Koestler half a century ago [7]:
“The pattern . . . is the perceiving of a situation or idea, L, in two self-consistent but habitually incompatible frames of reference, M1 and M2.The event L, in which the two intersect, is made to vibrate simultane-ously on two different wavelengths, as it were. While this unusual situa-tion lasts, L is not merely linked to one associative context but bisociated
with two.”
Koestler found bisociation to be the basis for human creativity in seeminglydiverse human endeavors, such as humor, science, and arts. The concept of biso-ciation in science is illustrated in Figure 1.
Fig. 1. Koestler’s schema of bisociative discovery in science ([7], p. 107).
We are interested in creative discoveries in science, and in particular in com-putational support for knowledge discovery from large and diverse sources ofdata and knowledge. To this end, we participate in a European FP7 FET-Openproject BISON5 which investigates possible computational realizations of biso-ciative reasoning. The project is based on the following, somewhat simplified,assumptions:
– A bisociative information network (named BisoNet) can be created fromavailable resources. BisoNet is a large graph, where nodes are concepts andedges are probabilistic relations. Unlike semantic nets or ontologies, thegraph is easy to construct automatically since it carries little semantics.To a large extent it encodes just circumstantial evidence that concepts aresomehow related through edges with some probability.
5 http://www.bisonet.eu/
191

– Different subgraphs can be assigned to different contexts (frames of refer-ence).
– Graph analysis algorithms can be used to compute links between distantnodes and subgraphs in a BisoNet.
– A bisociative link is a link between nodes (or subgraphs) from differentcontexts.
In this paper we thus explore one specific pattern of bisociation: long-range linksbetween nodes (or subgraph) which belong to different contexts. More precisely,we say that two concepts are bisociated if:
– there is no direct, obvious evidence linking them,
– one has to cross contexts to find the link, and
– this new link provides some novel insight into the problem domain.
We have to emphasize that context crossing is subjective, since the user has tomove from his ‘normal’ context (frame of reference) to an habitually incompatible
context to find the bisociative link [2]. In terms of Koestler (Figure 1), a habitualframe of reference (plane M1) corresponds to a BisoNet subgraph as definedby a user or his profile. The rest of the BisoNet represents different, habituallyincompatible contexts (in general, there may be several planes M2). The creativeact here is to find links (m2) which lead ‘out-of-the-plane’ via intermediate,bridging concepts (L). Thus, contextualization and link discovery are two of thefundamental mechanisms in bisociative reasoning as implemented in BISON.
Finding links between seemingly unrelated concepts from texts was alreadyaddressed by Swanson [10]. The Swanson’s approach implements closed discov-
ery, the so-called A-B-C process, where A and C are given and one searchesfor intermediate B concepts. On the other hand, in open discovery [16], only Ais given. One approach to open discovery, RaJoLink [8], is based on the ideato find C via B terms which are rare (and therefore potentially interesting) inconjunction with A. Rarity might therefore be one of the criteria to select linkswhich lead out of the habitual context (around A) to known, but non-obviouslyrelated concepts C via B.
In this paper we present an approach to bisociative discovery and contex-tualization of genes which should help in the analysis of microarray data. Theapproach is based on semantic subgroup discovery (by using ontologies as back-ground knowledge in microarray data analysis), and the linking of various pub-licly available bioinformatics databases. This is an ongoing work, where some el-ements of bisociative reasoning are already implemented: creation of the BisoNetgraph, identification of relevant nodes in a BisoNet, and computation of linksto indirectly related concepts. Currently, we are expanding the BisoNet withtextual resources from PubMed, and implementing open discovery from textsthrough BisoNet graph mining. We envision that the open discovery process willidentify potentially interesting concepts from different contexts which will act asthe target nodes for the link discovery algorithms. Links discovered in this way,crossing contexts, might provide instances of bisociative discoveries.
192

The currently implemented steps of bisociative reasoning are the following.The semantic subgroup discovery step is implemented by the SEGS system [14].SEGS uses as background knowledge data from three publicly available, seman-tically annotated biological data repositories, GO, KEGG and NCBI. Based onthe background knowledge, it automatically formulates biological hypotheses:rules which define groups of differentially expressed genes. Finally, it estimatesthe relevance (or significance) of the automatically formulated hypotheses onexperimental microarray data. The link discovery step is implemented by theBiomine system [9]. Biomine weakly integrates a large number of biomedical re-sources, and computes most probable links between elements of diverse sources.It thus complements the semantic subgroup discovery technology, due to theexplanatory potential of additional link discovery and Biomine graph visual-ization. While this link discovery process is already implemented, our currentwork is devoted to the contextualization of Biomine nodes for bisociative linkdiscovery.
The paper is structured as follows. Section 2 gives an overview of five stepsin exploratory analysis of gene expression data. Section 3 describes an approachto the analysis of microarray data, using semantic subgroup discovery in thecontext of gene set enrichment. A novel approach, a first attempt at bisocia-tive discovery through contextualization, composed of using SEGS and Biomine(SEGS+Biomine, for short) is in Section 4. An ongoing experimental case studyis presented in Section 5. We conclude in Section 6 with plans for future work.
2 Exploratory gene analytics
This section describes the steps which support bisociative discovery, targetedat the analysis of differentially expressed gene sets: gene ranking, the SEGSmethod for enriched gene set construction, linking of the discovered gene set torelated biomedical databases, and finally visualization in Biomine. The schematicoverview is in Figure 2.
The proposed method consists of the following five steps:
1. Ranking of genes. In the first step, class-labeled microarray data is pro-cessed and analyzed, resulting in a list of genes, ranked according to differ-ential expression.
2. Ontology information fusion. A unified database, consisting of GO6 (bio-logical processes, functions and components), KEGG7 (biological pathways)and NCBI8 (gene-gene interactions) terms and relationships is constructedby a set of scripts, enabling easy updating of the integrated database (detailscan be found in [12]).
3. Discovering groups of differentially expressed genes. The ranked listof genes is used as input to the SEGS algorithm [14], an upgrade of the
6 http://www.geneontology.org/7 http://www.genome.jp/kegg/8 ftp://ftp.ncbi.nlm.nih.gov/gene/GeneRIF/interaction sources
193

. . .
gene2: gene2: gene3:
gene1: + +++
geneN: − −
BiomineSEGS
Microarray data Enriched gene sets Contextualized genes.
Fig. 2. Microarray gene analytics proceeds by first finding candidate enriched gene sets,expressed as intersections of GO, KEGG and NCBI gene-gene interaction sets. Selectedenriched genes are then put in the context of different bioinformatic resources, ascomputed by the Biomine link discovery engine. The ’+’ and ’-’ signs under Microarraydata indicate over- and under-expression values of genes, respectively.
RSD relational subgroup discovery algorithm [3, 4, 13], specially adapted tomicroarray data analysis. The result is a list of most relevant gene groups thatsemantically explain differential gene expression in terms of gene functions,components, processes, and pathways as annotated in biological ontologies.
4. Finding links between gene group elements. The elements of the dis-covered gene groups (GO and KEGG terms or individual genes) are used toformulate queries for the Biomine link discovery engine. Biomine then com-putes most probable links between these elements and entities from a numberof public biological databases. These links help the experts to uncover unex-pected relations and biological mechanisms potentially characteristic for theunderlying biological system.
5. Gene group visualization. Finally, in order to help in explaining the dis-covered out-of-the-context links, the discovered gene relations are visualizedusing the Biomine visualization tools.
3 SEGS: Search for Enriched Gene Sets
The goal of the gene set enrichment analysis is to find gene sets which formcoherent groups and are distinguished from the rest of the genes. More pre-cisely, a gene set is enriched if the member genes are statistically significantlydifferentially expressed as compared to the rest of the genes. Two methods fortesting the enrichment of gene sets were developed: Gene Set Enrichment Anal-ysis (GSEA) [11] and Parametric Analysis of Gene Set Enrichment (PAGE) [6].Originally, these methods take individual terms from GO and KEGG (whichannotate gene sets), and test whether the genes that are annotated by a specificterm are statistically significantly differentially expressed in the given microarraydataset.
194

Fisher
GSEA
PAGE
Microarraydata
Generationof gene sets
Enrichedgene sets
GO
KEGG
NCBI
Rankingof genes
Fig. 3. Schematic representation of the SEGS method.
The novelty of the SEGS method, developed by Trajkovski et al. [12,14] andused in this study, is that the method does not only test existing gene sets fordifferential expression but it also generates new gene sets that represent novelbiological hypotheses. In short, in addition to testing the enrichment of individualGO and KEGG terms, this method tests the enrichment of newly defined genesets constructed by the intersection of GO terms, KEGG terms and gene setsdefined by taking into account also the gene-gene interaction data from NCBI.
The SEGS method has four main components:
– the background knowledge (the GO, KEGG and NCBI databases),– the SEGS hypothesis language (the GO, KEGG and interaction terms, and
their conjunctions),– the SEGS hypothesis generation procedure (generated hypotheses in the
SEGS language correspond to gene sets), and– the hypothesis evaluation procedure (the Fisher, GSEA and PAGE tests).
The schematic workflow of the SEGS method is shown in Figure 3.
4 SEGS+Biomine: Contextualization of genes
We made an attempt at exploiting bisociative discoveries within the biomedi-cal domain by explicit contextualization of enriched gene sets. We applied twomethods that use publicly available background knowledge for supporting thework of biologists: the SEGS method for searching for enriched gene sets [14]and the Biomine method for contextualization by finding links between genesand other biomedical databases [9]. We combined the two methods in a novelway: we used SEGS for hypothesis generation in the form of interesting genesets, and then formulated queries for Biomine for out-of-the-context link dis-covery and visualization (see Figure 4). We believe that by forming hypotheseswith SEGS, constructed as intersections of terms from different ontologies (dif-ferent contexts), discovering links between them by Biomine, and visualizing theSEGS hypotheses and the discovered links by the Biomine graph visualizationengine, the interpretation of the biological mechanisms underlying differentialgene expression is easier for biologists.
195

Biominedatabases
Enrichedgene sets
Biomine Biomine graphlink discovery visualization
Fig. 4. SEGS+Biomine workflow.
In the Biomine9 project [9], data from several publicly available databaseswere merged into a large graph, a BisoNet, and a method for link discoverybetween entities in queries was developed. In the Biomine framework nodes cor-respond to entities and concepts (e.g., genes, proteins, GO terms), and edgesrepresent known, probabilistic relationships between nodes. A link (a relationbetween two entities) is manifested as a path or a subgraph connecting the cor-responding nodes.
Vertex Type Source Database Nodes Degree
Article PubMed 330,970 6.92Biological process GO 10,744 6.76Cellular component GO 1,807 16.21Molecular function GO 7,922 7.28Conserved domain ENTREZ Domains 15,727 99.82Structural property ENTREZ Structure 26,425 3.33Gene Entrez Gene 395,611 6.09Gene cluster UniGene 362,155 2.36Homology group HomoloGene 35,478 14.68OMIM entry OMIM 15,253 34.35Protein Entrez Protein 741,856 5.36
Total 1,968,951
Table 1. Databases included in the Biomine snapshot used in the experiments.
The Biomine graph data model consists of various biological entities andannotated relations between them. Large, annotated biological data sets canbe readily acquired from several public databases and imported into the graphmodel in a relatively straightforward manner. Some of the databases used inBiomine are summarized in Table 1. The snapshot of Biomine we use consistsof a total of 1,968,951 nodes and 7,008,607 edges. This particular collection ofdata sets is not meant to be complete, but it certainly is sufficiently large andversatile for real link discovery.
9 http://biomine.cs.helsinki.fi/
196

5 A case study
In the systems biology domain, our goal is to computationally help the expertsto find a creative interpretation of wet lab experiment results. In the particularexperiment, the task was to analyze microarray data in order to distinguishbetween fast and slowly growing cell lines through differential expression of genesets, responsible for cell growth.
Enriched Gene Sets
1. SLOW-vs-FAST ← GO Proc(’DNA metabolic process’) &INTERACT( GO Comp(’cyclin-dep. protein kinase holoenzyme complex’))
2. SLOW-vs-FAST ← GO Proc(’DNA replication’) &GO Comp(’nucleus’) &INTERACT( KEGG Path(’Cell cycle’))
3. SLOW-vs-FAST ← . . .
Table 2. Top SEGS rules found in the cell growth experiment. The second rule statesthat one possible distinction between the slow and fast growing cells is in genes par-ticipating in the process of DNA replication which are located in the cell nucleus andwhich interact with genes that participate in the cell cycle pathway.
Table 2 gives the top rules resulting from the SEGS search for enriched genesets. For each rule, there is a corresponding set of over expressed genes fromthe experimental data. Figure 5 shows a part of the Biomine graph which linksa selected subset of enriched gene set to the rest of the nodes in the Biominegraph.
The wet lab scientists have assessed that SEGS in combination with Biomineprovide additional hints on what to focus on when comparing the expression dataof cells. Additionally, such an in-silico analysis can considerably lower the costsof in-vitro experiments with which the researchers in the wet lab are trying toget a hint of a novel process or phenomena observed. This may be especially truefor situations when just knowing the final outcome one cannot explain the drugeffect, organ function, or disease satisfactorily. Namely, the gross, yet importantcharacteristics of the cells (organ function) are hidden (do not affect visual mor-phology) or could not be recognized soon enough. An initial predisposition forthis approach is wide accessibility and low costs of high throughput microarrayanalysis which generate appropriate data for in-silico analysis.
6 Conclusions
We presented SEGS+Biomine, a bisociation discovery system for exploratorygene analytics. It is based on the non-trivial steps of subgroup discovery (SEGS)and link discovery (Biomine). The goal of SEGS+Biomine is to enhance the
197

Fig. 5. Biomine subgraph related to five genes from the enriched gene set produced bySEGS. Note that the gene and protein names are not explicitly presented, due to thepreliminary nature of these results.
creation of novel biological hypotheses about sets of genes. A prototype versionof the gene analytics software, which enhances SEGS and creates links to Biominequeries and graphs, is available as a web application athttp://zulu.ijs.si/web/segs ga/.
In the future work we plan to enhance the contextualization of genes with con-texts discovered by biomedical literature mining. We will add PubMed articlesdata into the BisoNet graph structure. To this end, we already have a prelimi-nary implementation of software, called Texas [5], which creates a probabilisticnetwork (BisoNet, compatible to Biomine) from textual sources. By focusing ondifferent types of links between terms (e.g., frequent and rare co-ocurances) weexpect to get hints at some unexpected relations between concepts from differentcontexts.
Our long term goal is to help biologists better understand inter-contextuallinks between genes and their role in explaining (at least qualitatively) under-lying mechanisms which regulate gene expressions. The proposed approach isconsidered a first step at computational realization of bisociative reasoning forcreative knowledge discovery in systems biology.
7 Acknowledgements
The work presented in this paper was supported by the European Commis-sion under the 7th Framework Programme FP7-ICT-2007-C FET-Open project
198

BISON-211898, by the Slovenian Research Agency grants Knowledge Technolo-gies and Systems Biology J4-2228, and by the Algorithmic Data Analysis (Algo-dan) Centre of Excellence of the Academy of Finland. We thank Igor Trajkovskifor his previous work on SEGS, and Filip Zelezny and Jakub Tolar for theirearlier contributions leading to SEGS.
References
1. R. Agrawal, R. Srikant. Fast algorithms for mining association rules in largedatabases. Proc. 20th Intl. Conf. on Very Large Data Bases, VLDB, pp. 487–499,Santiago, Chile, September 1994.
2. W. Dubitzky. Personal communication, FP7 BISON project review, Leuven, June2009.
3. D. Gamberger and N. Lavrac. Expert-guided subgroup discovery: Methodologyand application. Journal of Artificial Intelligence Research 17:501–527, 2002.
4. D. Gamberger, N. Lavrac, F. Zelezny, J. Tolar. Induction of comprehensible modelsfor gene expression datasets by the subgroup discovery methodology. Journal ofBiomedical Informatics 37:269–284, 2004.
5. M. Jursic, N. Lavrac, I. Mozetic, V. Podpecan, H. Toivonen. Constructing informa-tion networks from text documents. ECML/PKDD 2009 Workshop ”ExplorativeAnalytics of Information Networks”, Bled, 2009.
6. S.Y. Kim, D.J. Volsky. PAGE: Parametric Analysis of Gene Set Enrichment. BMCBioinformatics 6:144, 2005.
7. A. Koestler. The Act of Creation, The Macmillan Co., New York, 1964.8. I. Petric, T. Urbancicc, B. Cestnik, M. Macedoni-Luksic. Literature mining
method RaJoLink for uncovering relations between biomedical concepts. Journalof Biomedical Informatics, 42(2): 219–227, 2009.
9. P. Sevon, L. Eronen, P. Hintsanen, K. Kulovesi, H. Toivonen. Link discovery ingraphs derived from biological databases. Proc. of 3rd International Workshop onData Integration in the Life Sciences, (DILS’06), July 2006. Springer.
10. D.R. Swanson, N.R. Smalheiser, V.I. Torvik. Ranking indirect connections inliterature-based discovery: The role of Medical Subject Headings (MeSH). JASIST57(11): 1427-1439, 2006.
11. P. Subramanian, P. Tamayo, V.K. Mootha, S. Mukherjee, B.L. Ebert, M.A.Gillette. Gene set enrichment analysis: A knowledge based approach for interpret-ing genome-wide expression profiles. Proc. of the National Academy of Science,USA, 102(43): 15545–15550, 2005.
12. I. Trajkovski. Functional interpretation of gene expression data. Ph.D. Thesis, JozefStefan International Postgraduate School, December 2007.
13. I. Trajkovski, F. Zelezny, N. Lavrac, J. Tolar. Learning relational descriptions ofdifferentially expressed gene groups. IEEE Transactions of Systems, Man and Cy-bernetics C, special issue on Intelligent Computation for Bioinformatics, 38(1):16–25, 2008a.
14. I. Trajkovski, N. Lavrac, J. Tolar. SEGS: Search for enriched gene sets in microar-ray data. Journal of Biomedical Informatics, 41(4): 588–601, 2008b.
15. F. Zelezny, N. Lavrac. Propositionalization-based relational subgroup discoverywith RSD. Machine Learning, 62(1–2): 33–63, 2007.
16. M. Weeber, H. Klein, L.T.W. de Jong-van den Berg, R. Vos. Using concepts inliterature-based discovery: Simulating Swanson’s Raynaud-fish oil and migraine-magnesium discoveries. J. Am. Soc. Inf. Sci. Tech., 52(7): 548–557, 2001.
199

Domain Bridging Associations SupportCreativity
Tobias Kotter, Kilian Thiel, and Michael R. Berthold
Nycomed-Chair for Bioinformatics and Information Mining, University of Konstanz,Box M712, 78484 Konstanz, [email protected]
Abstract. This paper proposes a new approach to support creativitythrough assisting the discovery of unexpected associations across differ-ent domains. This is achieved by integrating information from heteroge-neous domains into a single network, enabling the interactive discoveryof links across the corresponding information resources. We discuss threedifferent pattern of domain crossing associations in this context.
1 Data-driven Creativity Support
The amount of available data scientists have access to (and should considerwhen making decisions) continues to grow at a breath-taking pace. To makethings worse, scientists work increasingly in interdisciplinary teams where infor-mation needs to be considered not only from one research field but from a widevariety of different domains. Finding the relevant piece of information in suchenvironments is difficult since no single person knows all of the necessary details.In addition, individuals do not know exactly where to look or what to look for.Classical information retrieval systems enforce the formulation of questions orqueries which, for unfamiliar domains or domains that are completely unknown,is difficult if not impossible.
Methods that suggest unknown and interesting pieces of information, poten-tially relevant to an already-known domain can help to find a focus or encour-age new ideas and spark new insights. Such methods do not necessarily answergiven queries in the way traditional information retrieval systems do, but insteadsuggest interesting and new information, ultimately supporting creativity andoutside-the-box thinking.
In [1] Weisberg stipulates that a creative process is based on the ripeness ofan idea and the depth of knowledge. According to Weisberg this means that themore one knows, the more likely it is that innovation is produced. According toArthur Koestler [2] a creative act, such as producing innovation, is performedby operating on several planes, or domains of information.
In order to support creativity and help trigger new innovations, we pro-pose the integration of data from various different domains into one single net-work, thus enabling to model the concept of domain-crossing associations. Thesedomain-bridging associations do not generate new hypotheses or ideas automat-ically, but aim to support creative thinking by discovering interesting relations
200

Fig. 1. Association vs. Bisociation
between seemingly unconnected concepts, therefore helping to fuse diverse do-mains.
2 Bisociation and Bisociative Networks
The term bisociation has been introduced by Arthur Koestler in [2]. He intro-duced bisociation as a theory to describe the creative act in humor, science andart. In contrast to an association representing a relation between concepts withinone domain, a bisociation fuses the information in multiple domains by findinga (usually indirect) connection between them (see Fig 1).
Generally a domain can be seen as a set of concepts from the same field orarea of knowledge. A popular example of a Bisociation is the theory of gravityby Isaac Newton, which fuses the previously Aristotelian two-world system ofsub-lunar and super-lunar physics.
Even though not all creative discoveries are based on bisociation, many ofthem have been made by associating semantically distant concepts. Once sucha connection has been found, it is no longer an unexpected connection andfrequently even turns into “common sense”.
A citation of Henri Poincare also describes the combination of semanticallydistant concepts: “Among chosen combinations the most fertile will often bethose formed of elements drawn from domains which are far apart... Most com-binations so formed would be entirely sterile; but certain among them, very rare,are the most fruitful of all.”
In order to find bisociations, data from different domains has to be integrated.Bisociative Networks (BisoNets) [3] aim to address this problem by supportingthe integration of both semantically meaningful information as well as looselycoupled information fragments. They are based on a flexible k-partite graphstructure, which consists of nodes representing units of information or conceptsand edges representing their relations. Each partition of a BisoNet contains acertain type of concepts or relations e.g. terms, documents, genes or experiments.
BisoNets model the main characteristics of the integrated information repos-itories without storing all the more detailed data underneath this piece of infor-mation. By focusing on the concepts and their relations alone, BisoNets thereforeallow huge amounts of data to be integrated.
201

3 Patterns of Bisociation
Once the information in forms of concepts and relations is combined in thenetwork it can be analyzed and mined for new, unexpected, and hopefully in-teresting pieces of information to support creative discoveries. One way of doingthis is by identifying interesting patterns in the BisoNets. One class of patternsis bisociation. A formal definition of a bisociation in the context of BisoNets isthe following1: “A bisociation is a link that connects concepts from two or moredomains, which are unconnected depending on the specific view by which thedomains are defined.” A domain in a BisoNet is a set of concepts. Depending onthe view, a domain can either consist of concepts of one type, or bundle conceptsof many types.
So far, we have considered two different view types, one depending on theuser’s interest and a second depending on the applied graph analysis algorithms.The first view creates the domain according to the user’s specifications. Therebythe subjective view of the data plays an important role; the fields of knowledgevary and hence are differently defined for each user. The second view is definedby the structure of the graph, e.g. the level of detail and is extracted by thea graph summarization or abstraction algorithm, leading to a user-independentview. Different types of such algorithmic views can be defined.
Once the domains have been defined by a given view, the main part of a biso-ciation, the link that connects concepts from different domains, can be identified.A link can be a single concept, a sub graph or any other type of relation.
Fig. 2. Example of a Bisociative Network
Figure 2 depicts an example BisoNet. The view is the surrounding framethat defines the domains. Each domain is depicted in a different shade andcontains concept types represented by dotted lines. The concepts and relationsof the BisoNet are depicted as circles whereas links connect concepts and theirrelations. An example of a bisociation that connects concepts from differentdomains is depicted by the bold path in the network. The different types ofbisociation are described in more detail below.
1 Result from discussions within the EU FP7 Project BISON.
202

Gene Protein
Ice
Fig. 3. Bridging concept example
Gene DiseaseTextGene1
Gene7
......
Term1
Term6
......
Doc1
Doc2
Fig. 4. Bridging graph example
Soldiers
Horse
altersGate
protects
Troy
no entry
passes
Structure
Add on
Blood-brain
barrier
protects
Brain
no entry
passes
alters
Prodrug Trojan Horse
Fig. 5. Example of structural similarity
Bridging Concepts Bridging concepts are mostly ambiguous concepts or meta-phors. In contrast to ambiguous concepts, which can lead to incorrect conclu-sions, metaphors can lead to new discoveries by connecting seemingly unrelatedsubjects. Bridging concepts are often used in humor [2] and riddles [4].
Bridging concepts connect dense sub graphs from different domains. Figure 3depicts the homonym Ice as an example of a bridging concept. Ice is the nameof a gene but also the name of the protein it encodes. Thus the concept belongsto the gene and the protein domain.
Bridging Graphs Bridging graphs are sub-graphs that connect concepts fromdifferent domains. They lead to new insights by connecting domains that at firstglance do not appear to have anything in common. An example of a bridginggraph is the discovery of Archimedes while he was having a bath. As he got intothe tub he noticed that the level of the water rose. By connecting the rise of thewater level with his body as he immersed into the water he realized that thiseffect can be used in general to determine the volume of a body and is todayknown as the Archimedes’ Principle.
A bridging graph could also connect two concepts from the same domain viaa connection running through a previously unknown domain. Figure 4 depicts abridging graph that connects several genes of the same domain via documentsthat all describe the same disease.
Structural similarity Bisociations based on structural similarity are repre-sented by sub graphs of two different domains with a similar structure. This isthe most abstract pattern of bisociation discussed here, which potentially leadsto new discoveries by linking domains that do not have any connection. Figure 5depicts the structural similarity between a prodrug that passes the blood-brain
203

barrier and the soldiers that pass the gate of Troy hidden in a wooden horse. Inboth scenarios the barrier can only be passed by altering the appearance of theintruder.
4 Conclusion and Future work
In this paper we discuss a new approach that aims to support creative thinking,ultimately leading to new insights. Bisociative networks (BisoNets) provide anenvironment that fosters the curiosity to dig deeper into newly discovered in-sights by allowing to discover new connections between concepts and bridgingthe gap between previously unconnected domains.
We have discussed three different notions of bisociation: bridging concepts,bridging graphs and structural similarity. In addition to defining more patternsof bisociation we will evaluate existing graph-mining algorithms to find differenttypes of bisociations such as betweenness centralities [5] to discover bridgingconcepts or minimum spanning trees [6] to identify bridging graphs. Structuralsimilarity might be discovered by using role detection algorithms [7] or graphkernels that take the neighborhood of each node into account.
Acknowledgment
We would like to thank the members of the EU Bison project for many fruitfuldiscussions during the development of BisoNets. The work presented in thispaper was supported by a European Commission grant under the 7th FrameworkProgramme FP7-ICT-2007-C FET-Open, project no. BISON-211898.
References
1. R.W. Weisberg. Creativity and knowledge: A challenge to theories. Handbook ofcreativity, 226:251, 1999.
2. Arthur Koestler. The Act of Creation. Macmillan, 1964.3. Michael R. Berthold, Fabian Dill, Tobias Kotter, and Kilian Thiel. Supporting
creativity: Towards associative discovery of new insights. In Proceedings of PAKDD2008, 2008.
4. John M. Dienhart. A linguistic look at riddles. Journal of Pragmatics, 31(1):95 –125, 1999.
5. Ulrik Brandes. A faster algorithm for betweenness centrality. Journal of Mathemat-ical Sociology, 25:163–177, 2001.
6. Joseph B. Kruskal. On the shortest spanning subtree of a graph and the travelingsalesman problem. Proceedings of the American Mathematical Society, 7, 1956.
7. Stephen P. Borgatti and Martin G. Everett. Two algorithms for computing regularequivalence. Social Networks, 15(4):361–376, December 1993.
204

Measuring Creativity in Software Development
C. Nelson, B. Brummel, D.F. Grove, N. Jorgenson, S. Sen, R. Gamble University of Tulsa
800 S. Tucker Drive, Tulsa OK, USA {courtney-nelson, bradley-brummel, dean-grove,
noah-jorgenson, sandip, [email protected]}
Abstract. Creativity involves choosing to direct resources toward developing novel ideas. Information technology development, including software engineering, requires creative discourse among team members to design and implement a novel, competitive product that meets usability, performance, and functional requirements set by the customer. In this paper, we present results that correlate metrics of creative collaboration with successful software product development in a Senior Software Projects class that is a capstone course in accredited Computer Science programs. An idea management and reward system, called SEREBRO, provides measurement opportunities to develop metrics of fluency, flexibility, originality, elaboration, and overall creativity. These metrics incorporate multiple perspectives and sources of information into the measurement of creativity software design. The idea management portion of SEREBRO is a Web application that allows team members to initiate asynchronous, creative discourse through the use of threads. Participants are rewarded for brainstorming activities that start new threads for creative discourse and spinning new ideas from existing ones.
1 Introduction
Creativity can be understood and measured from a variety of perspectives. Two of the major approaches to measuring creativity are the psychometric approach and the confluence approach [1]. In this paper, we are concerned with creativity as a process not as an individual difference. We follow Sternberg and Lubart’s [2] investment model of creativity that conceptualizes it as a decision that anyone can make, but few people do because of potential costs. We also incorporate Amabile’s [3] componential model of creativity which requires three critical components for creativity: domain-relevant skills, creativity relevant processes, and intrinsic task motivation. We have implemented a software tool called SEREBRO (Software Engineering REwards for BRainstorming Online) to promote creative discourse in a Senior Software Projects class that is a capstone course in the Computer Science Curriculum at the University of Tulsa. SEREBRO organizes students around creativity relevant processes related to software engineering to motivate and assist teams of students with making creative software design and implementation decisions. Our primary interest as presented in this paper is examining whether encouraging the infusion of more creativity in the software development process results in more creative output with respect to the resulting software projects.
205

Essential cognitive elements for divergent thinking in the creative process include fluency, flexibility, originality, and elaboration [4, 5]. Fluency is the frequency of ideas generated. Flexibility involves seeing the problem in new ways or reconceptualizing the problem. Originality is devising novel ideas or synthesis of the problem. Elaboration is extending or fleshing out details. Creativity can be demonstrated in a specific part of a project or evaluated within the full project. Both objective and subjective metrics can be established to measure these elements in the creative process. The overall creativity encompassing the four cognitive elements can also be appraised subjectively. Our project uses both objective and subjective metrics of each element in the creative process to understand and foster creativity in collaborative software engineering projects.
Software engineering is the process of designing and developing a software product. It often involves a team-based approach that is oriented around specific tasks such as communication, planning, modeling, construction, and deployment [6]. The class undergoes training to acquire domain-relevant skills in each task to derive a set of work products, also called artifacts, which include customer requirements, documentation, designs, code, and packaging. Creativity relevant processes manifest themselves in a variety of forms in software development, such as.
• Interface design to achieve the proper functional use and aesthetic appeal • Combining reusable entities in novel ways to meet innovative product
requirements • Implementation of functionality that is new to the developer’s skill set • Novel strategies for code refinement to increase performance, usability, and
security • Inventive ways to describe how to use a product in the final packaging
delivered to the customer
We address the issue of fostering creativity as part of the collaborative software design in the context of a Senior Software Projects course. Since a team of students is involved, discussing what the novelty is and how it is placed in the product is as essential as the tangible design and implementation itself. We are most concerned with the creativity exhibited in the software development process during which a number of intermediate artifacts are produced, as well as the final software project and demonstration provided by the team at the end of the semester.
Fostering creativity in software engineering student deliberations poses unique challenges. First, it is uncommon for seniors in computer science to be forced to think creatively in their area of studies. Though liberal arts and science courses have creative and critical thinking components, in a computing curriculum, there is less attention paid to creativity and “thinking outside the box.” Second, sharing and furthering ideas among team members in a collaborative fashion is very dependent on the openness of the team members, the time available to meet, and the different skill sets of the team members with respect to classifying requirements, analyzing a system design, and coding the various components (interface, processing, databases, etc.) that comprise the software. This problem has also been noted by information technology experts as well, leading to new software development processes such as agile development [7]. Third, creativity is often not directly rewarded. Even if ideas are explored, captured and used in idea management tools [8, 9], only the resulting
206

artifacts are examined by the instructor (i.e. management) and the customer. Therefore, since the creative discourse is not credited to the participants and is not explicit as an artifact itself, there is limited extrinsic motivation to engage in it.
To address these problems and provide a mechanism that supports, recognizes and fosters creativity, student teams use SEREBRO throughout the software development process. SEREBRO combines idea expression and management with a reward system designed to reinforce the usefulness of ideas and their contribution to creative discourse during the software development process [10]. Our objective is to explore the ability of SEREBRO to both capture and enhance creativity. The outcomes of our experiments can in turn be used to improve future information technology development, including introducing appropriate rewards.
2 Team Interaction on SEREBRO
Teams are an essential part of software development. Even when a single member is more creative or has an advanced skill set, the success of the project requires the contribution of all members, especially within a small team. Therefore, our initial experiments focus on evaluating creativity at a team level. While there may be variances in the contributions to the overall project by each member of the team, our analysis ignores that variance in favor of comparing team creativity with overall performance and outcomes.
Team interaction on SEREBRO starts with the designation of a list of topics. These topics are loosely based on the tasks to be performed and the artifacts required for hand-in at each milestone. The software engineering class used for testing SEREBRO had four major milestones over which the artifacts were produced, culminating in a final product presentation and demonstration. Discussions on SEREBRO commence within a specific topic when any team member posts a brainstorm node. Upon reviewing the node, another team member can agree or disagree with the post and then input their own idea (in the case of a disagree node) or an enhancement of the idea (in the case of an agree node). We call the agree/disagree process spinning an idea. Multiple brainstorms can start the discourse within a single topic. Figure 1 shows an idea network with seven brainstorm nodes in blue circles and agree nodes as green triangles. Disagree nodes, though not included in this figure, are upside down orange triangles. The box at the bottom shows the actual post that is seen when a node is ‘moused’ over.
207

Figure 1: SEREBRO Idea Network
Discourse on SEREBRO is exhibited by a thread of postings, much like an online forum. A short thread is shown in Figure 2 from an actual team when discussing a concept for a video game. Students who are the focus of this experiment are highly computer literate and very familiar with this style of forum posting. Asynchronous postings to SEREBRO, along with email alerts when posts are made, give students the freedom to work on the project from anywhere and at anytime. Though face-to-face meetings are encouraged, they are not essential to the progress of the project and mimic distributed teams. Threads can be pruned when they are no longer considered valid. Those threads that embody essential ideas regarding a specific topic, artifact, or direction are finalized. Finalization in SEREBRO involves naming the emerging concept as a new topic, generally for the next milestone, and tagging all of the contributing ideas, including brainstorm, agree, and disagree nodes.
208

Figure 2: A Thread of Postings
To externally motivate creative contributions, SEREBRO implements a multi-agent system of rewards [10]. The reward system provides an egalitarian method of point distribution based on the structure of the idea network generated. Each user within the system is assigned a user-agent that distributes reward points to users based on their creative contribution following a specific protocol (see Section 3.1). In our current implementation, the agents reward according to the node type (brainstorm, agree, disagree, and finalized.) and its position in the network, but not the node content (contextual information) in performing these point allocations. When users post with a certain node type, they effectively classify the node with a positive or negative rating relative to its parent node. Based on these classifications, each user agent propagates reward points through each idea thread to produce cumulative rewards for each user. Idea nodes tagged during the finalization of a concept for the next milestone receive additional rewards. As points are incrementally allocated, the instructor and SEREBRO generate rewards for the top performing students. Since the nodes are classified by the participants depending on the length of the thread, we expect the resulting point allocations to correlate with expressed creativity. We hypothesized that such grounded and prudent external rewards that rely on peer feedback of creative contribution will motivate further creative expression from team members to attain a better team product. To ensure adequate participation within SEREBRO, students are encouraged to attain a certain level of reward points per milestone in the project.
209

The targeted class comprised six teams with a minimum of three and a maximum of four members. Each member had a role on the team, such as lead, analyst, and programmer, which gave him or her specific responsibilities. These roles were negotiated by the team members when the teams were formed in the first semester of the course [11]. Three non-trivial projects were defined and their requirements were passed to the teams by the product customers. Thus, two teams competed to create the best of each product to meet the requirements. The first project was a Chemistry Lab Creator and Submission software that allowed the instructor to create and post a lab assignment and students to complete the assignment and submit it online. The second was an Online Emergency Center that provided information on gas, food, and shelter during a disaster. The third project was a game to be used as part of a recruiting package for computer science students to choose a university. Initial requirements were sparse, forcing the team to work with the customer and delve into the domain of application. In addition to software artifacts produced, each team had to devise a novel product name and logo.
3 Methods of Creativity Measurement
We measure team creativity from multiple perspectives and sources of information about the software project as it is developed. We seek to determine the degree to which the discourse among the team is creative. This approach reveals unique information on the creativity of the overall software design process. We describe each of these sources and perspectives with respect to SEREBRO’s contribution toward measuring creativity, thereby understanding certain differences in how creativity emerges in software design.
3.1 SEREBRO Threads
Team postings to SEREBRO are examined as consolidated threads related to a topic. Each thread stems from a single brainstorm node. A topic can have multiple evaluated threads, depending on the number of brainstorm nodes that start the various conversations within the topic. Therefore, threads form the basis for creativity analysis and are rated by experts at the end of the semester for the type and level of creativity.
Points. SEREBRO assigns reward points to each individual and team for their creative input based on the number and type of node of each thread posting. The nodes types are designed to align with the elements in the creative process. Fluency can be measured by the number of brainstorming nodes, flexibility by the fan-out of the brainstorming nodes, and originality and elaboration by the fan-in to spinning nodes. An in depth examination of the idea management tool can be found in [10]. Points are allocated through the agent based protocol, which has the following four basic rules. When a user replies with an Agree node to another post, the agent allocates k points to the author of the parent node. Similarly, when a user disagrees with its parent node, the parent node's author is charged k points. In order to reward
210

the progenitors of the thread tree, when an agent receives points at a node, it passes (½ * k) points to its parent node. This process effectively propagates the points throughout local areas of the idea network, yet discounts the reward as the distance increases from the node being considered. This rule also applies to the reward distributed at a Finalized node. Finalized nodes represent some accumulation of ideas that have been implemented within the project or identified as creative and useful to the project. Therefore, rewards at Finalized nodes are magnified by a factor m. This variable factor allows the instructor or project lead to adjust the importance of the Finalized node within the reward system. This (k * m) points are also distributed to other nodes that are tagged with the same tag as the Finalized node. Thus, users directly correlate nodes that are related in content but not necessarily by distance in the network.
In combination, these rules distribute points throughout an idea thread, concentrating point totals on nodes that are well received by other users on the team. The user that authors positive nodes that are accepted by the team gains a higher point total than those who do not participate or do not create novel content. We hypothesize that the users with higher reward point totals have contributed more to the creativity of the group. For our experiments, k = 1 and m = 2. In our reported experiment, team point totals ranged from 1520 to 2210 with an average of 1857.
Expert Ratings. Each SEREBRO thread for each team was rated by five subject matter experts (SMEs) on the fluency, flexibility, originality, elaboration, overall creativity, and the relevancy of thread to the development of the project. The subject matter experts were faculty members and graduate students involved with the development of the SEREBRO program. Threads which were indicated as irrelevant by at least one of the raters were removed from further rating. These threads included reposts of the same content and tests of the system.
Though the sample size of the teams was small, there were a significant number of threads generated for rating. Overall, the SMEs showed sufficient levels of agreement across raters with internal consistencies (Cronbach’s Alpha) on all ratings of each area of creativity ranging from 0.83 for Originality to 0.89 for fluency. Consistency ratings (ICC single measure scores) for each thread ranged from 0.49 on flexibility to 0.63 on fluency. This statistic indicates that the proportion of variance on each of the ratings across the five raters can be attributed to the variance on the construct being rated. The scores for each thread were averaged across the teams and the raters to calculate scores assigned to each team.
The second step in the analyses was to examine the correlations among different types of creativity expressed in the threads. The correlations between specific creativity metrics and overall creativity were quite high. These correlations indicated that threads were rarely rated highly on one metric of creativity and not on other levels of creativity. This result was expected and may have been influenced by the prevalence of threads with few entries which were typically rated low on all components of creativity. The highest correlation was between originality and overall creativity (r = 0.95). Essentially, the more original a thread was rated, the higher it was rated on creativity. This value was followed by examining elaboration (r = 0.91). Fluency and flexibility (r = 0.88) had the same correlation with rated creativity, and they predicted creativity to a lesser extent when compared to the other two elements. The lack of differentiation between types of creativity within threads indicated that
211

the raters typically judged threads to be creative or not rather than more fluent than flexible. Due to these results, further analyses relied only on the overall SME ratings of creativity. Team overall creativity ratings ranged from 1.99 to 3.09 on a five point scale from Poor to Excellent.
3.2 Final Projects and Demonstrations
At the final demonstrations of the team projects, each team was asked to evaluate their own team and the other teams on the overall creativity and overall quality of the projects. Additional survey questions addressed the perception of the creative process within each software team. Figure 3 indicates the different evaluations performed.
Team Colleague Ratings. Teams rated both the overall quality and the creativity of their own and other project teams based on their perceptions and understanding of the demonstrations of the final projects. The course instructor also performed the same ratings at the final demonstrations. Creativity ratings ranged from 3.18 to 4.84 and quality ratings ranged from 3.41 to 4.76. In general, teams with higher quality ratings received high creativity ratings as well. The highest rated quality team, however, was second on creativity.
Team grades. The course instructor graded teams at each milestone for a particular set of artifacts to provide feedback and assess progress. Final team grades ranged from 78 to 94 with a mean grade of 89.
Survey questions. Each team’s own experiences were further investigated through a final survey asking about team performance and experiences with the SEREBRO program. This survey included questions about each of the creativity metrics with respect to the team’s final project. The team members evaluated their own team on a 1 to 5 scale with anchors of Poor, Neutral, Good, Very Good, and Excellent. These ratings constitute a reference shift approach to team level variables in which individual scores about the team are combined to represent a team level construct [12].
��������
������
������
��������
� �����
������
�����
�������
���� ��� ���������
����
������
���������������������
���� �
�� ���������
���� ���!���
����������
������
��� �� ��������
�����������������
� �������
�����������������
� �������
����������
������
�����������������
� �������
����������
������
��� �������� ����
���� ����������������
Figure 3: Perspectives and Sources of Information in the Creativity Metrics
212

4 Overall Results and Discussion
Table 1 displays the average scores and standard deviations of the various ratings. Table 2 displays the correlations between the creativity metrics
Table 1: Average Scores and Standard Deviations
Serebro Points
Expert Ratings
Other Team
Creativity
Other Team
Quality
Own Team
Creativity
Own Team Quality
Team Grades
Mean 1857 2.43 3.85 3.08 3.98 4.11 89.10 SD 270 0.48 0.41 1.09 0.60 0.52 5.52
The correlations among the various creativity metrics reveal both substantial
agreement across the metrics and differentiation between project creativity and quality. Because there were only 6 teams involved in this project, none of the correlations at the team level are statistically significant at p < 0.05 level, but they do reflect a general level of agreement on the rank order of team creativity and quality across the various metrics. These correlations are still the best estimate of the relationships between these measures or team creativity and quality. Specifically, SEREBRO point totals were related to all other measures of both team creativity and quality. Expert ratings were able to distinguish between creativity and quality as only the correlations with other measures of creativity (including team grade) were positive and of medium size. Creativity demonstrated by the process metrics of SEREBRO points, Expert Ratings, and Team Creativity was also demonstrated in the final project as indicated by the other team’s ratings of Creativity, as well as the Team Grades as shown in Table 2. Overall these results provide promising directions for using these metrics to continue to develop and measure creativity in computer science courses and software development teams.
Table 2: Correlations among team-level creativity metrics
1. 2. 3. 4. 5. 6. 1. SEREBRO Points 2. Expert Ratings 0.43 3. Presentation Creativity* 0.53 0.47 4. Presentation Quality* 0.60 -0.04 0.81 5. Team Grades 0.60 .043 0.53 0.33 6. Team Creativity 0.74 0.32 -0.02 0.25 0.42 7. Team Quality 0.64 -0.11 -0.03 0.54 0.86 0.62 *Includes results for only 5 teams. One team did not demonstrate their project on
the assigned day.
5 Conclusion and Future Work
Ideas and novel software properties can take many forms in software engineering. Students who are not accustomed to conversing over creative material have difficulty
213

expressing their own ideas in a group setting, such as the one chosen for experimentation. SEREBRO is a software tool that includes both idea management and motivational rewards to foster creativity within a team developing a non-trivial software product. The results discussed in this paper indicate that SEREBRO performed well with respect to providing insight into creativity in a Senior Software Projects class, as well the correlation of product and team criteria with creativity metrics. The positive outcomes of the research are driving the expansion of SEREBRO with additional software process tools. We are examining different reward mechanisms to determine if certain protocols may be more suitable than others with respect to an individual’s role on the team, his or her skill set, team size, and general attitudes about class and exposing their creative ideas. Further research into the creative process and team’s perception of that process is currently taking place within a new set of students in the Software Projects Class setting. In addition, content based assessment of SEREBRO nodes is being undertaken during the software development process.
Acknowledgments. This material is based upon work supported by the National Science Foundation under Grant No. 0757434. Any opinions, findings and conclusions or recommendations expressed in this material are those of the author(s) and do not necessarily reflect the views of the National Science Foundation (NSF).
References
1. Sternberg, R.J., The Nature of Creativity. Creativity Research Journal, 2006. 18(1): p. 87-98.
2. Sternberg, R.J. and T.I. Lubart, Defying the Crowd: Cultivating Creativity in a Culture of Conformity. 1995, New York: Free Press.
3. Amabile, T.M., The Social Psychology of Creativity. 1983, New York: Springer-Verlag.
4. Guilford, J.P., Way beyond IQ: Guide to improving intelligence and creativity. Buffalo, NY: Creative Education Foundation, 1977.
5. Guilford, J.P., Varieties of Divergent Production. Journal of Creative Behavior, 18,1--10, 1977.
6. Pressman, R.S., Software Engineering: A Practitioner's Approach. 7th ed. 2009: McGraw Hill Higher Education.
7. Ambler, S., Agile Modeling: Effective Practices for eXtreme Programming and the Unified Process. 1st ed. 2002: Wiley.
8. Spigit. http://www.spigit.com/index.html, 2009. 9. BrainBank. http://www.brainbankinc.com/Default.aspx, 2009. 10. R. Gamble, S.Sen, et. al., The SEREBRO Project: Fostering Creativity through
Collaboration and Rewards. Presented at EDUMas Workshop, part of 8th Int. Conf. on Autonomous Agents and Multiagent Systems (AAMAS 2009), 2009.
11. R. Gamble, M.Smith, Moving toward "reality" in team selection for software engineering. Frontiers in Education, 2008.
12. Chan, D., Functional relations among constructs in the same content domain at different levels of analysis: A typology of compositional models. Journal of Applied Psychology, 83(2): p. 234-246, 1998
214

Clap-along: A Negotiation Strategy for CreativeMusical Interaction with Computational Systems
Michael Young and Oliver Bown
1 Music Department, Goldsmiths, University of London, New Cross, London SE146NW, UK
[email protected] Centre for Electronic Media Art, Monash University, Clayton 3800, Australia
Abstract. This paper describes Clap-along, an interactive system fortheorising about creativity in improvised musical performance. It ex-plores the potential for negotiation between human and computer par-ticipants in a cyclical rhythmic duet. Negotiation is seen as one of a set ofpotential interactive strategies, but one that ensures the most equitablecorrespondence between human and machine. Through mutual negotia-tion (involving listening/feature extraction and adaptation) the two par-ticipants attempt to satisfy their own and each other’s target outcome,without knowing the other’s goal. Each iteration is evaluated by bothparticipants and compared to their target. In this model of negotiation,we query the notion of ‘flow’ as an objective of creative human-computercollaboration. This investigation suggests the potential for sophisticatedapplications for real-time creative computational systems.
1 Introduction
Music performance is a creative, ‘real-time’ process that often entails collabo-rative activity. Creative potential in a performance – i.e. the opportunity forindividual or collective actions that appear innovative – is contingent on con-text and style, the presence of a priori agreements (whether explicit or tacit),and other cultural and procedural elements [1]. Various aspects of performancepractice constrain or afford opportunities for immediate creative input, such asrecourse to pre-existing materials, the relative emphasis on individual respon-sibility and the means by which information is exchanged while performing. Inhuman-computer performance the capacities of software to exchange informa-tion with other participants and to take responsibility (i.e. act autonomously)are highly significant factors. Any given approach to these factors impacts greatlyon the performance practice as a whole.
Free collective improvisation is an effective testing ground for computer-based creativity. The computer must be able to produce sonic events that appearintrinsically valid, and it must be able to collaborate appropriately (responsivelyand proactively) with one or more human musicians. Both properties satisfy aworking definition of computational creativity, such as the ability to exhibit
215

behaviour “which would be deemed creative if exhibited by humans” [2] as wellas being “skillful, appreciative and imaginative” [3]. These criteria are only trulysatisfied if the system is not directly reliant on a human ‘user’; there must be anequitable correspondence of ideas between collaborators. Such challenges are noteasily met, but at least apply equally well to human-only improvisation, wherethe behaviour of one performer would never be expected to depend entirely onanother’s contribution, or depend on rules agreed in advance. Ideally at least,group improvisation avoids organisational procedures that determine or influencemusical content, structure or the interactions and mutual dependencies betweenperformers. Implicit procedures may develop through a process of negotiationin performance. As in other forms of process-orientated art, this process maynot be directed towards a known outcome. Rather, the process itself forms boththe central problem and focus of interest that both enables and constitutes theperformance.
We investigate negotiation as a musical process in a wider context of interac-tion strategies that can demonstrate performance-based computational creativ-ity. We devise a simple system, Clap-along, defined by a number of constraints,which we believe demonstrates the challenges of performative, computationalcreativity, and offers a promising model for future, more elaborate, computa-tional systems for interactive musical performance.
2 Interaction strategies
We regard negotiation as a specific strategy for human-machine interaction, amember of a larger set that includes the following list. (The terms ‘source’ and‘result’ are used to refer to actions in an asymmetric relationship, and may applyequally to human and machine depending on context):
Shadowing: The source and result move together. There is a clear temporalsimultaneity that produces layering within a coordinated motion. The coordina-tion of motion between a body and its shadow is simultaneous but also distorted,because the shadow is projected into a different ‘geometrical’ space. Various mu-sical strategies for textural organisation (homophony, micro-polyphony) entailshadowing. Real-time digital effects and simple interaction systems commonlyexhibit shadowing methods. Timbral matching techniques can be thought toemploy this strategy, as found in the Cata-RT [4] and Soundspotter systems [5].The system as a whole may be weakly or strongly integrated, but in generalinteractivity is likely to be readily verifiable to participants and listeners.
Mirroring: The source is reflected in the result. Synchronicity is not re-quired. There is a more elaborate re-interpretation of information received fromthe source than in shadowing, and this is more telling in the absence of temporalsynchrony. Innumerable compositional and improvisational approaches are anal-ogous to mirroring, to be found in structural repetition, motivic developmentand call-and-response strategies. Delay effects are elementary mirrors, project-ing back an image of the musical source. Systems that seek to analyse an existingstyle to generate music (e.g. by Markov modelling) are mirroring at a high level
216

of musical organisation, such as in the Continuator system [6], even though themethod may be sub-symbolic. Mirroring can establish a cohesive musical iden-tity between source and result, and may also be readily verifiable to participantsas an interactive process.
Coupling: Two sources are distinct but connected. There is – or appearsto be – mutual influence, but the roles of ‘source’ and ‘result’ may be unstableand unequally balanced. In live performance, coupling can constitute “proce-dural liveness” and/or “aesthetic liveness” [7]. For instance, coupling can betrivial and procedural, when one system controls another and receives appro-priate feedback, as in the laptop-as-instrument paradigm. Or, it can be illusoryand “aesthetic”, as in the (increasingly rare) genre of music for live instrumentwith tape, where binding and apparently causal links between the performerand tape are in reality entirely controlled and pre-determined. More abstractcouplings that use virtual modelling and dynamical systems offer a more open-ended and genuine relationship between sources (agents), potentially integratingthe procedural and the aesthetic. Examples include music systems where sourcesshare a virtual environment, as in the Kinetic Engine [8] and Swarm Granulator[9]. In coupling, equal relationships are possible, but verification of the degree oftrue interaction is problematic.
Negotiating: The roles of ‘source’ and ‘result’ are conflated. Participatingelements have equal status and are engaged in a series of transactions. Negoti-ation treats performer and computational system as equal in status and overallapproach to the interaction. It can be seen as a unified system based on equiv-alence, and this contrasts with the categories above that suggest an unequalarchitecture of source and result, in which the most likely scenario is a musician(source), acting upon a computational system (result).
According to OED definitions3 ‘negotiation’ refers to transactions directedtowards an objective:
1. To communicate or confer (with another or others) for the purpose of ar-ranging some matter by mutual agreement; to discuss a matter with a viewto some compromise or settlement
2. To arrange for, achieve, obtain, or bring about (something) by negotiation3. To find a way through, round, or over (an obstacle, a difficult path, etc.)
To negotiate, participants engage in a series of transactions that are guided bylocal goals directed towards an individual desired outcome (expectation). Thetransactions can be understood to involve two mutually informing strategies,one externalised, the other internal; “action” and “description” [10]. Actions ex-ecuted within a system may instigate further changes of state in the system. Anassessment of these changes (especially in relationship to anticipated or desiredchanges) forms a description of action-outcome in the system. This empiricaldescription may inform the next action. If so, a cyclical process of experientialaccumulation develops, as the total description becomes more detailed and com-plex. In a pre-determined and constrained context, this accumulation might be
3 Accessed online, 18th September 2009
217

understood as a straightforward ‘making sense of it’. But in a more process-orientated context there may be an emergent formulation of knowledge that isnot external to the system (i.e. the system is not pre-determined). Hamman[10] uses Foucoult’s term ‘episteme’ to describe interactive processes that are“immanent in the very particularity of the thoughts, actions, and descriptionsmade with respect to a hypothesised object of interaction” (p. 95). This is anopen-ended process of negotiation, orientated by variable or uncertain expec-tations. Local goals (intentions) might change as a product of the interactivetransactions underway. Desired outcomes (expectations) need not be static ei-ther, so the OED characterisation of a “compromise or settlement” may remaintheoretical and notional.
A reciprocal negotiation entails a degree of equivalence between human andmachine capacities to act and formulate descriptions. Both participants mustform their own descriptions of the system that incorporates the other participant.Both must be able to modify their actions, short-term goals and intentions, givennew information. In other words, they should also be able to formulate an expec-tation about the overall musical output and modify their contribution, given theother’s, in order to best satisfy the expectation. Verification that transactionsare underway is, in itself, a part of this process, but the accuracy or efficacy ofany “description” is not relevant to the fact that negotiation occurs.
We regard “optimal flow” [11] as a directly relevant but problematic concept.Flow is the human enjoyment derived in undertaking a task that becomes au-totelic, achieved when there is an optimal level of difficulty relative to the skillsof the subject. This balance requires the subject to form an internal descrip-tion of the task’s demands and an assessment of his/her skills in meeting them.Flow has been explored in human-computer interaction [12] and in the creativeprocess [13] including group-based creativity [1]. Particularly in the case of cre-ativity, Csikszentmihalyi notes a number of factors contributing to flow, someof which could be modelled (clarity of goals, availability of immediate feedback)and others perhaps not (no worries of failure, no distractions etc.) [13]. Whereasthis might describe a positive and productive psychological state, flow perhapsdoes not take fully into account other facets of creativity, or for that matterthe experience of negotiating; the role of randomness, unpredictability, happen-stance [14], the use of haphazard trial and error, periods of incubation and,subsequently, innovative “behavioural mutations” [15]. More emotively, considerthe pursuit of the impossible, the thin borderline between absorption and obses-sive compulsion [15], and, perhaps resultant periods of boredom or frustration.Flow describes a settled state that may be too effortless in itself to be centralin establishing creativity. So we attempt to avoid an easily achievable sense of‘flow’ in designing the Clap-along system.
3 Implementation of Clap-along
Our aims in Clap-along are to explore process, expectation and verification in anegotiation-based system, and to consider how these elements might ultimately
218

be extended to produce more aesthetically complex and musically valid results.Negotiation occurs both in a feature space and in the foreground surface of actualrhythms.
Clap-along is a duet system for human-computer interaction. Both partic-ipants produce continuous, synchronised 4-bar clapping patterns in 4/4. Themusical context is as minimal as we can conceive: a fixed tempo, a fixed metricalstructure, and single sound events quantised to beats.
In any loop instance n there is a human clapping pattern, Hn, a computerpattern, Cn, and a composite of the two patterns, Rn. A feature set, Fn, isextracted from Rn and compared by the system to a target feature set Tn, andthis comparison is the basis for the next iteration. Rn is the reality of the currentstate, and Tn represents an expectation that is unknown to the human performer.
The computer maintains patterns as a sequence of 0s and 1s, representingeither a rest or a clap on each beat. The initial pattern C0 is generated randomly.Machine claps are generated from a sample bank of human clap recordings thathave some natural variation in sound; this offers some semblance of human clap-ping. The human performer claps into a microphone, allowing the system tobuild a second binary sequence that represents the human’s clapping rhythm,Hn. Human claps are quantised by rounding down to the previous beat, unlesswithin 200ms of the following beat, in which case they are rounded up. Theinitial expectation, T0, is obtained from a randomly created composite rhythmRtarget that is immediately discarded.
At the end of each 4-bar pattern, the system takes the composite of thetwo rhythms, Rn, and calculates a feature set Fn that forms a minimal internalrepresentation of the musical output. The four features used in this version are:
– density: the total number of claps as a fraction of the maximum possiblenumber.
– homophony: the number of coincident claps as a fraction of the maximumpossible value.
– position weighting: the normalised average position in the cycle over all claps.– clumping: the average size of continuous clap streams as a fraction of the
maximum possible value.
In this multi-dimensional feature space, the system calculates the Euclideandistance between Fn and the target feature set Tn. If the distance exceeds apre-defined threshold, this is deemed to indicate a significant musical differencebetween reality and the expectation. We use a threshold (s) of 0.001 for sat-isfaction of expectation, measured in the feature space where each feature wasnormalised to the range [0,1].
To create Cn+1 the system runs a generate-and-test loop, producing 20 vari-ations of Cn. Variations were generated by flipping each bit in the rhythmicrepresentation with a probability of 0.1. Each variation is combined with theprevious human pattern Hn to produce a candidate composite rhythm R′n, withfeatures F ′n. The pattern with the nearest features to the target is chosen asCn+1.
219

The human performer is invited to negotiate with the system in a compara-ble way. As each loop occurs, the performer contributes Hn to the total patternRn and assesses the machine contribution. He/she may introduce a modifica-tion to the next contribution Hn+1. Any modification might be experimentaland pseudo-random. Alternatively, it may constitute an intentional action basedupon his/her internal description of how the two contributions are co-dependent,and so contribute to developing a better understanding of the expectation, thetarget point Tn.
This implementation could in theory allow the performer and machine toquickly settle upon a rhythm that satisfies the target Tn, so any further changeswould need to be entirely elective; this might be likened to a state of ‘optimalflow’. To avoid this settled state, and ensure a continuing creative negotiation,we introduce an additional device that ensures the open-ended nature of thenegotiation. If the distance between Fn and Tn is under the threshold (s) – i.e.if reality is sufficiently close to the expectation – the system introduces randomvariation to its expectation to produce Tn+1, with mutation along each featuredimension drawn from a Gaussian distribution. In other words, as the contribut-ing rhythms approach the target, and as the human performer has developed arelatively accurate set of descriptions about the system (based only on the musi-cal surface), the expectation changes. As the feature description Fn is obtainedfrom the composite of both rhythms, both the machine and human performershave a potential role in initiating this change of expectation, whether deliber-ately or unwittingly, requiring a change of descriptions and resultant actions. Acontinually diverging system is possible, fostering a mutual creative negotiationthat avoids ‘optimal flow’.
4 Evaluation in performance
The system awaits testing with a number of human collaborators, to build uponinformal, proof-of-concept tests undertaken by the designers. It is evident thatwith care, a performer can induce a stable and sustainable behaviour in thecomputer. For the human performer, there are a number of common sense actionsto be attempted. For any rhythmic cycle Rn, possible actions include:
1. varying: an intuitive rhythmic variation of a previous pattern.2. matching: attempting to follow the Cn homo-rhythmically.3. repeating: so Hn+1 = Hn
4. complementing: an attempt to insert events or gaps that mirror the systempattern in Cn or remembered from Cn−1
5. parsing: rhythmic patterns c, where c is a substring of C, that are eithercomplementary or matching parts of Rn−1
For each of these possible actions, outcomes are heard in the next outputtedrhythm. So the performer attempts to form a description of the system based onhow this new pattern deviates from the last. Upsetting the system with a markedvariation of pattern (action 1) can cause unstable changes in the output. In this
220

event the system’s attempt to update its behaviour in any progressive way isfrustrated. Consequently, the performer struggles to verify logical interaction.Clapping the exact same pattern repeatedly (including not clapping at all) andmatching patterns (action 2 or 3) can cause the system to slowly evolve itsoutput towards the expectation, allowing a more accurate description of thesystem to develop, ultimately initiating a change in expectation (feature targetpoint). However, since the features specified are not independent, it cannot beguaranteed that a given expectation can actually be achieved in the musicalforeground. In this case the system is stuck, and, to move on, requires a moreradical intervention from the performer.
These scenarios are thought experiments as much as real tests. We intendto look at how different performers go about negotiating with the kinds of sim-ple ‘black-boxes’ under different scenarios, and how strategies to deal with thecomputer’s behaviour are developed. Further development of the system couldinvolve additional, or more effective, feature extraction, to provide a richer fea-ture space. Use of alternative methods, such as autocorrelation, would allow anopen definition of the length of any given loop, currently defined as 16 units, andthe system could be expanded to involve expressive timing and other more com-plex rhythmic features. Future systems could offer a more sophisticated and richmusical environment that incorporates many other elements of musical organi-sation beyond metrical rhythm. In all cases – however frustrating or rewarding –these procedures manipulate the expectations and actions of human and machineperformers alike. An unresolvable negotiation is fostered. This points to morecomplex, and possibly creatively valid, negotiation processes that could producereal-time, computational performances of manifest interest and integrity.
5 Conclusion
We have outlined a minimal musical context for investigating computationalcreativity in improvised performance. We have offered a framework for inter-action between human and machine that comprises four categories: shadowing,mirroring, coupling and negotiating. We adopt a critical approach to the notionof ‘optimal flow’ in creative interaction. We have developed a test system thatexplores a process of negotiation in practice, which uses an adaptive system withhidden expectations for varying rhythmic cycles. This creates a demanding con-text for interactive negotiation. This simple study suggests that the negotiationparadigm could be used to test the dimensions of musical interaction in greaterdetail (this includes comparing human-human, human-computer and computer-computer interactions using the same paradigm), and could be built up from thisminimal form to a critical level of complexity where meaningful and verifiableinteraction does occur.
221

Acknowledgements
This work was developed at the July 2009 Dagstuhl Seminar, ‘ComputationalCreativity: An Interdisciplinary Approach’. We would like to thank the organis-ers, Margaret Boden, Jon McCormak and Mark d’Inverno, and the other mem-ber of our ‘interactivity’ discussion group: Iris Asaf, Rodney Berry, Daniel Jones,Francois Pachet and Benjamin Porter.
Oliver Bown’s contribution to this research was funded by the AustralianResearch Council under Discovery Project grant DP0877320.
References
1. Sawyer, R.K.: Group creativity: Music, Theater, Collaboration. Lawrence (2003)2. Wiggins, G.A.: Searching for computational creativity. New Generation Computing
24(3) (2006) 209–2223. Colton, S.: Creativity versus the perception of creativity in computational systems.
In: Papers of the AAAI Spring Symposium on Creative Systems. (2008)4. Schwarz, D., Beller, G., Verbrug, B., Britton, S.: Real-time corpus-based concate-
native synthesis with catart. In: Proceedings of 9th International Conference onDigital Audio Effects. (2006)
5. Casey, M.: Soundspotting: A new kind of process? In Dean, R., ed.: The OxfordHandbook of Computer Music. Oxford University Press (2009)
6. Pachet, F.: Beyond the cybernetic jam fantasy: The continuator. IEEE ComputerGraphics and Applications 24(1) (2004) 31–35
7. Croft, J.: Theses on liveness. Organised Sound 12(1) (2007) 59–668. Eigenfeldt, A.: Emergent rhythms through multi-agency in max/msp. In Kronland-
Martinet, R., Ystad, S., Jensen, K., eds.: Proceedings of the 4th InternationalComputer Music Modeling and Retrieval Symposium, CMMR 2007. (2008) 368–379
9. Blackwell, T., Young, M.: Self-organised music. Organised Sound 9(2) (2004)137–150
10. Hamman, M.: From symbol to semiotic: Representation, signification, and thecomposition of music interaction. Journal of New Music Research 28(2) (1999)90–104
11. Csikszentmihalyi, M.: Flow: The Psychology of Optimal Experience. Harper andRow (1990)
12. Ghani, J.A., Deshpande, S.P.: Task characteristics and the experience of optimalflow in human-computer interaction. Journal of Psychology 128(4) (1994) 381–391
13. Csikszentmihalyi, M.: Creativity: Flow and the Psychology of Discovery and In-vention. Harper Collins, New York (1996)
14. Boden, M.: The Creative Mind. George Weidenfeld and Nicholson Ltd (1990)15. Abra, J.: Skinner on creativity: A critical commentary. Leonardo 21(4) (1988)
407–412
222

A Fitness Function for Creativity in JazzImprovisation and Beyond
Anna Jordanous
Creative Systems Lab / Music Informatics Research Centre,School of Informatics, University of Sussex, UK
a.k.jordanous at sussex.ac.uk
Abstract. Can a computer evolve creative entities based on how cre-ative they are? Taking the domain of jazz improvisation, this ongoingwork investigates how creativity can be evolved and evaluated by a com-putational system. The aim is for the system to work with minimal hu-man assistance, as autonomously as possible. The system employs a ge-netic algorithm to evolve musical parameters for algorithmic jazz musicimprovisation. For each set of parameters, several improvisations are gen-erated. The fitness function of the genetic algorithm implements a set ofcriteria for creativity proposed by Graeme Ritchie. The evolution of theimprovisation parameters is directed by the creativity demonstrated inthe generated improvisations. From preliminary findings, whilst Ritchie’scriteria does guide the system towards producing more acceptably pleas-ing and typical jazz music, the criteria (in their current form) rely tooheavily on human intervention to be practically useful for computationalevaluation of creativity. In pursuing more autonomous creativity assess-ment, however, this system is a promising testbed for examining alterna-tive theories about how creativity could be evaluated computationally.
1 Introduction
The motivation for this work is to move towards achieving the goal of au-tonomous evaluation of creativity. It is initially intended as a test scenario inwhich to evaluate the usefulness of existing proposals for creativity assessment[1, 2]. Longer term, it provides a environment in which to implement and assesstheories about how best to evaluate creativity computationally.
The computational system presented in this paper is designed to developincreasingly more creative behaviour over time. This behaviour is in the domainof jazz improvisation: evolving jazz improvisors based on maximising the levelof creativity exhibited by the improvisor.
Ritchie [1, 2] has proposed a set of 18 formal criteria with which to evaluatethe level of creativity exhibited by a creative system, using the artefacts whichthe system produces. Each criterion formally states a condition to be met by theproducts of the creative system, based on ratings of (at least one of) how typicalthe set of products are of the domain which the system operates in and howvaluable those products are considered to be. The criteria have been adopted by
223

a number of researchers for reflective evaluation of the creativity demonstratedby their creative systems [3, 4, 5].
This work explores the theory that Ritchie’s criteria can be adapted andexploited for the purposes of implementing a fitness function for creativity. Thecriteria are applied to a generation of jazz improvisors and used to select whichof these improvisors should be carried forward to the next generation.
There has been some interesting work on using evolutionary techniques suchas genetic algorithms (GAs) to generate music [6, 7, 8, 9, 10]. Ritchie’s criteriarequire that a creative system should be able to generate artefacts in a specifiedstyle or domain. Jazz music improvisation has been chosen for this domain as itencompasses a wide variety of styles of music under the umbrella term of “jazz”;from “trad jazz”, through the “bebop” style exemplified by Charlie Parker tofree improvisation. This lays the foundation for much creative opportunities, tobe exploited by evolutionary tangents taken by the system.
2 Evolving Creative Improvisation: Implementation
This system is written in Java, using the jGap1 package to implement the geneticalgorithm and the jMusic2 package for music generation.
The system evolves a population of “Improvisors” in the form of a set ofvalues for musical parameters. In each generation of the genetic algorithm, theseparameters are used to generate MIDI music. The parameters control the max-imum number of notes can sound at any one time, the total number of notes inthe piece, the key of the music, the range of pitches used, note durations, tempomarkings and proportions of notes to rests, as well as the amount of variabilityallowed in several of these areas. Notes used are restricted to those in the bluesscale3 for that key4. Within the constraints of the musical parameters, randomchoices are used for the generation of musical improvisations.
2.1 Using Ritchie’s criteria as a fitness function
Ritchie’s criteria rely on two ratings of the improvisations produced: how valu-able these are as jazz improvisations and how typical they are of the genre. Theseratings are made using information about the artefacts. Ritchie makes “no firmproposals on what this information should be” (p. 75) and leaves open the ques-tion of how the rating scheme should be implemented. In the present version ofthis improvisation system, these ratings are provided by human assessment, fol-lowing the example set in [3] (although as discussed in Section 4, if these ratingscan be automatically generated, this would speed up the evolution process).
1 http://jgap.sourceforge.net2 http://jmusic.ci.qut.edu.au3 The blues scale is traditionally used for jazz music. In the key of C, the scale consists
of the pitches: C, Eb, F, F#, G, Bb, C4 Future plans for the system are to allow some chromaticism in notes used, or to
allow it to evolve the notes that should be used, as another parameter.
224

For each set of parameters, a number of improvisations are generated (theexact number is determined by one of the parameters). Two improvisations areselected and played to the human evaluator, who rates each improvisation on itstypicality as an example of jazz and on how much they liked it.
Ratings are recorded for the two selected individual improvisations. If thereare further improvisations by that Improvisor, the mean values for the two pairsof ratings are used as ratings for the remaining improvisations that had not beenrated. In this way, the evaluator is presented only with a selection of improvi-sations to rate, making the process more time-efficient [10]. This is analogousto the evaluator being given a “demo” of the Improvisor rather than having tolisten to all their productions.
At this stage, all improvisations have a value rating and typicality rating andthe 18 criteria can be applied to the products of each Improvisor. Each criterionis specified formally in [1] such that a criterion is either true or false for a givenImprovisor, depending on whether scores derived from the typicality and valueratings are greater than some threshold θ, by setting suitable parameters to rep-resent high/low typicality and value ratings (α, β and γ). In [1] Ritchie choosesnot to specify what values the threshold and parameters should take, but doeshighlight discussions on this [3, 5]. For simplicity, in the current implementationθ = α = β = γ = 0.5, but experimentation with these values may be profitable.
The fitness value for an individual Improvisor is a score between 0 (no cre-ativity) and 1 (maximally creative). Again a simple approach5 is taken:
fitness =number of criteria satisfied
total number of criteria(1)
After all Improvisors have been evaluated for fitness, the highest scoringImprovisor parameters are used to generate a new set of Improvisors, to act asthe new generation of this population of Improvisors. The whole process is thenrepeated once per generation, until the user wishes to halt evolution.
3 Preliminary Results
The current implementation of the evolutionary improvisation system was testedinformally, with a jazz musician (the author) providing the ratings required byRitchie’s criteria. Over several runs, it was able to produce jazz improvisationswhich slowly evolved from what was essentially random noise, to become morepleasing and sound more like jazz to the human evaluator’s ears.
The question of whether the system was able to evolve more creative be-haviour is still unresolved and is the main focus of further work on this project.
Some interesting comments can be made on the implementation of Ritchie’scriteria for creativity. Each criteria manipulates one or both of the ratings fortypicality and value of the music produced during run-time. In [1], Ritchie left
5 This approach assumes all 18 criteria contribute equally to the creativity of a system;again though this is open to experimentation
225

unresolved the issue of generating this rating information, (p. 75), concentratingon how the ratings should then be processed once obtained. This work suggeststhough that these ratings are crucial to the success of evaluation; without reli-able, accurate rating schemes, the application of the criteria becomes less useful.
Using a human evaluator as a “rating scheme” is easy for the system imple-mentor but causes problems at run time. Even with restrictions placed on howmany products the human must evaluate, any reliance on human interventionintroduces a fitness bottleneck [6] into the system, such that the progress of evo-lution is significantly slowed down by having to wait for the evaluator to listen toand rate the music samples. Levels of expertise, fatigue during system runtime,individual bias in preferences and varying levels of concentration also affect thereliability of using human interaction in this way. Issues with using a human aspart of a fitness function are discussed in greater depth in [10].
The system generates random improvisations using evolved parameters, with-out making use of any examples to guide the production of improvisations. Aside effect of this is that there is no “inspiring set” of examples: as used by manyof the criteria. Therefore those criteria currently do not add any new informationto the creativity evaluation and do not contribute to the fitness function.6
Although nothing extraordinary has been generated thus far by the sys-tem, the need for human intervention has restricted any longer-term evolutionof parameters from being attempted. It is proposed that at least some of theinformation currently supplied by user interaction can be derived or estimatedautomatically; then the system (and Ritchie’s criteria) can be tested over moregenerations of evolution. This is discussed further in section 4.
4 Plans for Future Work
To attempt to escape the problems caused by the fitness bottleneck, automatedmethods of rating the improvisations for typicality and value are being explored.
– Genre classification methods are being investigated to help judge how typicalan improvisation is of a specified genre.
– In this work, the value of an improvisation is interpreted as how pleasingan improvisation is to listen to. Currently, a value rating function is beingimplemented based on the perceptual principles described in [11].
Once the system has been extended to a degree where evolution can takeplace over a reasonable time frame, it will be tested over several runs. Theresults of evolution will be compared to similar tests carried out with humanparticipants who will be asked to rate creativity of several of the improvisations.This will allow a fairer investigation of the appropriateness and accuracy ofRitchie’s criteria for evaluating creativity.
On a longer term basis, this approach could also be used to test other theoriesof how best to evaluate the creativity of the products of a creative system (by
6 If machine learning methods are used to automate typicality ratings, though, theinspiring set will then consist of the examples used during the learning process.
226

implementing them as a fitness function for creativity, in various domains). Thevarious theories can be compared and contrasted to each other and to humanjudgements. We can also consider the efficacy of evaluating the creativity of asystem based solely on the artefacts it produces, in comparison to evaluativeframeworks that also take into account the creative process, or details about thesystem itself or the environment it operates in (e.g. as discussed briefly in [12]).Hence this proves a useful tool to enable us to move closer towards the goal ofdiscovering how best to replicate human evaluation of creativity.
5 Acknowledgements
This work has benefitted from discussions with Nick Collins and Chris Thornton.Chris Kiefer has provided useful advice during the implementation of this system.
References
[1] Ritchie, G.: Some empirical criteria for attributing creativity to a computer pro-gram. Minds and Machines 17 (2007) 67–99
[2] Ritchie, G.: Assessing creativity. In: Proceedings of AISB Symposium on AI andCreativity in Arts and Science. (2001)
[3] Gervas, P.: Exploring quantitative evaluations of the creativity of automaticpoets. In: Proceedings of the 2nd. Workshop on Creative Systems, Approaches toCreativity in Artificial Intelligence and Cognitive Science (ECAI 2002). (2002)
[4] Haenen, J., Rauchas, S.: Investigating artificial creativity by generating melodies,using connectionist knowledge representation. Proc. of ECAI Workshop on Com-putational Creativity (2006)
[5] Pereira, F., Mendes, M., Gervas, P., Cardoso, A.: Experiments with assessmentof creative systems: an application of Ritchie’s criteria. In: Proceedings of theWorkshop on Computational Creativity (IJCAI 05). (2005)
[6] Biles, J.A.: Genjam: A genetic algorithm for generating jazz solos. In: Proceedingsof the International Computer Music Conference, Denmark (1994)
[7] Burton, A.R., Vladimirova, T.: Generation of musical sequences with genetictechniques. Computer Music Journal 23(4) (1999) 59–73
[8] Dahlstedt, P.: Thoughts on creative evolution: A meta-generative approach tocomposition. Contemporary Music Review 28(1) (2009) 43–55
[9] Gartland-Jones, A., Copley, P.: The suitability of genetic algorithms for musicalcomposition. Contemporary Music Review 22(3) (2003) 43–55
[10] Todd, P.M., Werner, G.M.: Frankensteinian methods for evolutionary music com-position. In: Musical Networks: Parallel Distributed Perception and Performance.MIT Press, Cambridge, MA (1999) 313–340
[11] Huron, D.: Tone and Voice: A Derivation of the Rules of Voice-Leading fromPerceptual Principles. Music Perception 19(1) (2001) 1–64
[12] Jordanous, A.: Defining creativity: Finding keywords for creativity using corpuslinguistics techniques. Proceedings of the ICCCX Concerence (2010)
227

Learning to Create Jazz Melodies Using Deep Belief Nets
Greg Bickerman1, Sam Bosley2, Peter Swire3, Robert M. Keller1
1 Harvey Mudd College, Claremont, CA, USA 2 Stanford University, Stanford, CA, USA
3 Brandeis University, Waltham, MA, USA [email protected], [email protected], [email protected], [email protected]
Abstract. We describe an unsupervised learning technique to facilitate automated creation of jazz melodic improvisation over chord sequences. Specifically we demonstrate training an artificial improvisation algorithm based on unsupervised learning using deep belief nets, a form of probabilistic neural network based on restricted Boltzmann machines. We present a musical encoding scheme and specifics of a learning and creational method. Our approach creates novel jazz licks, albeit not yet in real-time. The present work should be regarded as a feasibility study to determine whether such networks could be used at all. We do not claim superiority of this approach for pragmatically creating jazz.
1 Introduction
Jazz musicians strive for innovation and novelty in creating melodic lines, in the context of chord progressions. Because of the structural characteristics of typical chord progressions, it is plausible that a machine could be taught to emulate human jazz improvisation. To this end, one might explicitly state the rules for jazz improvisation, e.g. in the form of grammars [1]-[2]. But structural rules may risk losing some of the flexibility and fluidity for which jazz is known. Here we try exploring a more organic approach: instead of teaching a machine rules for good jazz, we give the machine examples of the kind of melodies we want to hear stylistically, and let it determine for itself the features underlying those melodies, so that it can create similar ones.
Our current exposition concentrates on a single approach to learning, heretofore not applied to music creation as far as we are aware: deep belief networks (DBNs), a multi-layered composition of restricted Boltzmann machines (RBMs), a specific type of stochastic neural network. We focus on the creation of melodies, and do not attempt to tackle broader issues of real-time collaborative improvisation. In other words, our work tries to explore the application of a specific neural net technology, as opposed to trying solving the general problem of creating an improvising agent by any means necessary. At present, our learning method is necessarily off-line due to a fairly slow training method, but we hope this can be improved in the future.
228

We were attracted DBNs based on recent expositions of Hinton, et al. [3]-[7]. Such machines learn to recognize by attempting to create examples (in the form of bit vectors), comparing those examples to training examples, and adjusting their parameters to produce examples closer to the given examples, a form of unsupervised learning. This seemed to us to be very similar to the way some humans learn to improvise melodies by emulation. Although the stochastic nature of DBNs might be considered a liability in some application fields, we try to leverage that nature to achieve novelty in our generated melodies, a characteristic of the creativity required for jazz improvisation. Thus our objective is different than that of Hinton; we want to create interesting melodies and are less concerned about their recognition.
2 Restricted Boltzmann Machines
A restricted Boltzmann machine (RBM) is a type of neural network introduced by Smolensky [8] and further developed by Hinton, et al. [3]-[7]. It consists of two layers of neurons: a visible layer and a hidden layer. Each visible neuron is connected to each hidden neuron, and vice versa, through a series of symmetric, bi-directional weights.
A single training cycle for the machine takes a binary data vector as input, activating its visible neurons to match the input data. It then alternates activating its hidden nodes based on its visible nodes, and activating its visible nodes based on its hidden nodes. Each node is activated probabilistically based on a weighted sum of all nodes connected to it. Since nodes within a layer are not connected to each other, activation of the hidden nodes depends only on the states of the visible nodes, and vice versa. After the network has stabilized, the new configuration of visible nodes can be viewed as output.
Figure 1: A restricted Boltzmann machine. The first node B of each layer is a fixed bias node.
The objective of an RBM is to learn features in sets of data sequences. Toward
this end, we implemented the contrastive divergence (CD) learning algorithm, as described by Hinton [3]. We modeled our implementation on an excellent tutorial supplied by Radev [9]. The CD algorithm allows for relatively inexpensive training
229

given the large number of nodes and weights in our networks. Once trained, an RBM can take a random data sequence and, through a series of activations, generate a new sequence that emulates features from the training data.
While a single RBM is capable of learning some patterns in the training data, multiple RBMs can be layered together to form a much more powerful machine known as a deep belief network (DBN) [4]. Multiple RBMs are combined by identifying the hidden layer of each RBM with the visible layer of the one below. The second RBM is able to learn features about the features learned by the first RBM, and thus, the entire layered machine should be able to learn far more intricate patterns than a single RBM could. Figure 2 illustrates the structure of a DBN.
Figure 2: An illustration of a 3-layer Deep Belief Network
3 Data Representation
In order to train DBNs on musical data, we first encode the music as bit vectors. We divide each beat into beat subdivisions called slots, with the number of slots dependent on the smallest note duration to be represented. For our experiments, we chose twelve slots per beat, which allows us to represent all duplet or triplet note durations down to a sixteenth note triplet.
Each slot is filled by a block of thirty bits, divided into twelve chord bits and eighteen melody bits. A description of the melody bits follows. Twelve bits are used as a one-hot encoding for the chromatic pitch classes from C to B over one octave, four bits are used as a second one-hot encoding to designate one of four octaves, one bit designates a sustained extension of the previous note, i.e. the note is not attacked anew, and one bit represents a rest. If a note is being attacked at a given slot, its corresponding pitch and octave bits are on and all other bits are off. If a note is being sustained, then the pitch bits are ignored but the sustain bit is on. Representing octaves this way rather than using a single one-hot encoding to represent a four-octave chromatic range, gave us a significant improvement in training time, by reducing the number of pitch nodes in the input layer.
230

The sustained note bit is used to represent the same pitch value as the note previously played. Thus notes of long duration will be seen as chains of sustain bits being on. Figure 3 shows an example of a melody and its corresponding encoding at a coarser resolution of two slots per beat for brevity.
Beat Auxiliary Chromatic Pitch within Octave Octave Sustain Rest C C# D D# E F F# G G# A A# B 1 2 3 4
1 1 1 & 1 2 1 1 & 1 3 1 1 & 1 1 4 1 1 & 1
Figure 3: A short melodic segment with a coarse encoding (only two slots per beat)
To improve readability, 0 values are left blank. Each chord is encoded as twelve bits representing the chromatic pitches from C
to B. If a pitch is present in a chord, its corresponding bit is on. Melody and chord vectors are concatenated to form part of the input to the network corresponding to one slot. Thus the machine ideally learns to associate specific chords with various melodic features. Because the machine will be seeing more than one slot at a time, as we later describe, it can also learn about chord transitions.
4 Training Data
We initially trained on a small set of children’s melodies such as “Twinkle, Twinkle, Little Star” and “Frère Jacques.” These melodies were all in the same key and generally consisted of simple rhythms and notes that were in their respective chords. Once we taught a machine to learn from, and then create, similarly simple melodies, we moved on to teaching larger networks jazz.
Our primary dataset was a large corpus of 4-bar jazz licks (short coherent melodies) cycling over the common ii-V-I-VI7 “turnaround” chord progression in a single key. The ii-V-I is a very common cadence in jazz; the VI7 chord is a connecting chord that leads one lick into the next for the same progression, VI7 being the dominant relative to the ii chord that follows. Most of the licks were either transcribed from notable jazz solos, or hand constructed, some with the help of the grammar-based “lick generator” of the Impro-Visor software tool [10].
231

5 Learning Method
Part of our goal is for the machine to learn how to create melodies that transition between chords in a progression. To add flexibility, rather than training our machine on inputs of all 4 bars of a lick at once, we break our data up into smaller windows of 1 measure each. For each 4 bar lick, we start the “window” at the beginning of the first bar. Then we move the window forward by one beat and look at the next 4 beats starting at beat 2 of the measure for the next window. We move the window forward by a beat at a time, taking measure-long snapshots of the window, until we reach the end of the 4-bar lick. In this way a single 4-bar lick is broken up into 13 overlapping shorter windows that are used sequentially as the inputs to the network. The scenario is analogous to that shown in Figure 4, except there are no question marks during training.
For creating new melodies, we start the machine with a “seed” consisting of specified chord bits defining our desired chord progression, and random melody input bits. The chord bits in the first layer of the machine are clamped so that, during any given creation cycle, they cannot be modified by the stochastic nature of the machine.
In creating a new melody, we use a procedure analogous to windowing during training. We start by generating the first few beats of a new melody and then clamping their corresponding bits. As each successive beat is generated, the whole melody and chord sequence is shifted forward to make room for the next beat. So in general, the machine only generates one beat at a time, but uses clamped chords and clamped beats of the preceding melody to influence the note choices. This process is illustrated in Figure 4.
Figure 4: An illustration of the process of windowed generation. The RBM generates small segments of melody over a fixed chord seed.
A newly generated segment is then fixed and used to generate the next segment of melody.
232

During the machine’s final activation of its visible layer (which constitutes the
newly generated melody), we group certain bits together for special consideration. Rather than letting the machine activate every bit probabilistically, we look at each slot individually and activate only the pitch bit and octave bit with the highest probabilities of activation among their group. Thus the machine is forced to choose whether to sustain, rest, or start a new pitch. We found that this approach allows for good variety of created melodies, while still resonating well with the given chords.
We also want to know if the machine can learn to create licks over a ii-V-I-VI7 chord progression in an arbitrary key. Thus, we included the option to transpose each input into different keys and train on the transpositions simultaneously.
We implemented all of the functionality described thus far as a stand-alone tool we call “RBM-provisor” that we have made publicly available [11]. The tool is written in Java and supports input and output via the leadsheet format [12] used by Impro-Visor, so that the user can work with readable, symbolic encodings, rather than bit-vectors.
6 Results
Our initial experiments used our dataset of short segments of children’s melodies, training on small 2-layer machines for 100 epochs. Results were encouraging, with chosen notes fitting well into the simple chords and flowing together melodically. Figure 5 shows a children’s melody created over a simple chord progression. After achieving the ability to create stylistically similar melodies from a set of simple examples, we moved on to the more complex problem of learning jazz.
Figure 5: An example of a created children’s melody over a specified chord progression.
In attempting to produce a successful jazz creation network, we experimented
with various aspects of networks, including number of layers, number of nodes per layer, number of training epochs, and many others. We ultimately settled on a 3-layer network containing 1441 input nodes (4 beats x 12 slots per beat x 30 bits per slot + 1 bias), with 750, 375 and 200 hidden nodes respectively. A typical training involved 250 epochs on about 100 four-measure licks, which takes about nine hours on an inexpensive desktop computer.
The first stave of Figure 6 shows a sample of training data, with the second stave showing a typical lick created by the network. For comparison, the third stave shows random notes at the same resolution of 12 slots per beat. When analyzing the created music using Impro-Visor [10], we found the vast majority of generated notes were in the chord, with occasional color tones (tones not in the chord, but sonorous with it),
233

which is totally acceptable. Foreign tones were hardly ever present. Created melodies tended to avoid large interval jumps and rarely skipped octaves.
Additionally, we found the training method was able to deal well with transpositions. After training on four copies of each of our inputs, transposed up 0, 1, 2, and 3 semitones from the original, the machine still created chord-compatible music regardless of the set of chords that was provided as a seed. We have yet to test jazz generation on more than four transpositions due to the extensive added training time required for transposing inputs to all twelve keys. Nonetheless, we are optimistic regarding our machine’s ability to handle any number of transpositions, given sufficient nodes and adequate training time.
The reason that ability to transpose is viewed as important is that, in jazz music, the chord progressions often have implied abrupt key changes that are not labeled as such explicitly. Ideally, an improvisational algorithm would be able to respond to chord changes based on the chords in whatever relative transpositions they occur, rather relative to a fixed reference key. For example, in the standard tune “Satin Doll”, one finds an extended cadence Am7 D7 Abm7 Db7 C. The sub-progression Abm7 Db7 is the same as Am7 D7 transposed down a half-step. It would be more economical and modular to train a network on all transpositions of Am7 D7 that it would be to train it on all contexts that might surround that two-chord sequence.
We noticed some differences between input data and generated music. While half-step intervals were common in our inputs, generated licks tended to avoid them – skirting off-chord approach tones and opting instead for more familiar chord tones. The most striking difference between the two sets of music related to rhythms. While our inputs contained notes of duplet and triplet rhythms, our outputs contained almost exclusively duplet rhythms. This issue will be discussed in greater detail in the next section.
Figure 6: The first stave is a sample from our training data licks. The second stave is a lick that was generated by a trained deep belief network.
The third stave shows random notes generated at the resolution of the network. The fourth stave shows incoherence using selection not based on maximum probability.
In all cases, red notes represent discords.
234

Other approaches tried included selecting bits proportional to the neuron probability distribution, rather than always choosing the maximum probability. However, this produced melodies that were more disjointed and less coherent rhythmically, as in the bottom stave of Figure 6. We also experimented with encodings that included beat information, such as which beats were stronger. The results for such encodings were not superior to those for the chosen encoding presented here. At this juncture, using deep belief networks would not be our first choice for a lick generator in a jazz education tool such as Impro-Visor [10]. The quality of licks generated by Impro-Visor’s grammatical approach is sufficiently superior qualitatively to those generated by our DBN that it would be pointless to conduct a third-party blindfold test. The other drawback to DBNs is the large training time. On the other hand, DBN’s may eventually prove to be less algorithmically biased than an unsupervised approach such as that in [2], which relies on clustering and Markov chains, and it is possible that the training time issue can be alleviated.
7 Future Work
The successes of our initial deep-belief improvisor are encouraging, but there is still much potential for improvement. Despite training on inputs containing both triplet and duplet rhythm patterns, our machine created mostly duplet rhythm patterns. We hypothesize that this results from a predominance of duplet rhythms in our training set, overshadowing the examples of triplet rhythms. Ideally, our machine should be able to generate triplet patterns at a lower frequency than duplet patterns, rather than excluding them from generation altogether. It is possible that a different note generation rule might yield more variety, but we have yet to find one that doesn’t also result in less coherence.
Additionally, the music generated by our trained DBN tends to produce disproportionate numbers of repeated pitches, instances in which the same note is played twice in a row, compared with their relatively low frequency of occurrence in the training data. Repeated notes in jazz may tend to sound static and immobile, and we would like to avoid them if possible. One solution we implemented involved post-processing our generated music to merge all repeated notes. Ideally the machine should avoid producing as many of them in the first place. It is possible that a different encoding might resolve some of these issues.
Finally, we believe that our work naturally lends itself to the open problem of chord inference. Currently, we give our machine chords as input, and it creates a suitable melody. If we instead provide a melody as input, a DBN similar to ours might be able to determine one or more chord progressions that fit the melody.
235

8 Related Work
Geoffrey Hinton and his associates are responsible for much previous work related to restricted Boltzmann machines. They used RBMs and DBNs for various purposes, including handwritten digit recognition [3], facial recognition [7], and movie recommendation [6]. These contrast to our use, which is generation. A particularly useful tutorial for implementing an RBM has been written by Rossen Radev [9]. Our RBM implementation was largely influenced by these sources.
Early work on generation of music by neural networks includes Mozer [13], who used back propagation through time. See Todd and Loy [14] for other early examples. Bellgard and Tsang [15] used a different form of extended Boltzmann machine for the harmonization and analysis of chorales. Eck and Lapalme [16] describe an approach using LSTM (Long Short-Term Memory) neural networks. Additionally, Page [17] utilized neural networks for musical sequence recognition. Please see Todd and Werner [18] for a more extensive survey.
Various other approaches have been taken towards artificial composition. Biles [19] used genetic algorithms. Jazz generation using a grammar-based approach was demonstrated by Keller and Morrison [1], and learning by Gillick, Tang and Keller [3]. Please consult these papers for further references on related approaches. Please see Cope [20] for a broad survey of approaches to musical creativity, including neural networks.
9 Summary
The results of our experiments show that a deep belief network is capable of learning certain concepts about a set of jazz licks and in turn creating new melodies. The ability of a single machine to generate licks over a chord progression in several different keys demonstrates the power and flexibility of the approach and suggests that a machine could be taught to generate entire solos over more complex chord progressions given a sufficient dataset. While the licks created by our networks sometimes under-represented features of the training set, their novelty and choice of notes seem adequate to characterize them as jazz. Despite a moderately-successful proof of concept, deep belief networks would not be our first choice for a practical lick-generation tool at this stage of our understanding. Our initial objective of exploring the possibility has been achieved, and further exploration is anticipated. We continue to be attracted to this approach as the basis for an algorithmically unbiased machine learning method. Acknowledgment This research was supported by grant 0753306 from the National Science Foundation. We are grateful to the anonymous referees for several helpful suggestions for revision and future work.
236

References
1. Keller, R. and Morrison, D.: A Grammatical Approach to Automatic Improvisation, In: Proceedings Fourth Sound and Music Computing Conference, Lefkada, Greece, July (2007)
2. Gillick, J., Tang, K., and Keller, R.: Learning Jazz Grammars, In: Proceedings Sixth Sound and Music Computing Conference, Porto, Portugal, pp. 125--130 (2009)
3. Hinton, G.E.: Training Products of Experts by Minimizing Contrastive Divergence Neural Computation, 14, 8, pp. 1771--1800 (2002)
4. Hinton, G. E., Osindero, S. and Teh, Y.: A Fast Learning Algorithm for Deep Belief Nets. Neural Computation, 18. pp. 1527--1554 (2006)
5. Hinton, G. E.: To Recognize Shapes, First Learn to Generate Images. In: Cisek, P., Drew, T. and Kalaska, J. (eds.) Computational Neuroscience: Theoretical Insights into Brain Function. Elsevier (2007)
6. Salakhutdinov, R. R, Mnih, A. and Hinton, G. E.: Restricted Boltzmann Machines for Collaborative Filtering. In: Proceedings International Conference on Machine Learning, Corvallis, Oregon (2007)
7. Susskind, J.M., Hinton, G., Movellan, J.R., and Anderson, A.K.: Generating Facial Expressions with Deep Belief Nets, In: Kordic, V. (ed.) Affective Computing, Emotion Modeling, Synthesis and Recognition, ARS Publishers (2008)
8. Smolensky, P.: Information processing in dynamical systems: Foundations of harmony theory. In: D. E. Rumelhart and J. L. McClelland, (eds.), Parallel Distributed Processing: Explorations in the Microstructure of Cognition. vol 1: Foundations. MIT Press (1986)
9. Radev, R.: Restricted Boltzmann Machine - Short Tutorial. iMonad Software. http://imonad.com/blog/2008/10/restricted-boltzmann-machine/ (2009)
10. Keller, R. et al.: Jazz Improvisation Advisor, http://www.impro-visor.com (2009) 11. RBM-provisor: https://sourceforge.net/projects/rbm-provisor/ (2009) 12. Keller, R.: Leadsheet notation,
http://www.cs.hmc.edu/~keller/jazz/improvisor/LeadsheetNotation.pdf (2005) 13. Mozer, M.: Neural network music composition by prediction: Exploring the benefits
of psychoacoustic constraints and multiscale processing, Connection Science, 6, 2-3, pp. 247-280 (1994).
14. Todd, P. and Loy, D.G (eds.).: Music and Connectionism, MIT Press, Cambridge, MA (1991)
15. Bellgard, M. and Tsang, C.: Harmonizing Music the Boltzmann Way. In: Griffith, N. and Todd, Peter M. (eds.), Musical Networks, MIT Press, Cambridge, MA, pp. 261--277 (1999)
16. Eck, D., and Laplme, J.: Learning Musical Structure Directly from Sequences of Music, Tech. Rept. 1300, Universite de Montreal DIRO (2008)
17. Page, M.: Modeling the Perception of Musical Sequences with Self-organizing Neural Networks. In: Connection Science, 6, pp 223--246 (1994)
18. Todd, P., and Werner, G.: Frankensteinian Methods for Evolutionary Music Composition. In: Griffith, N. and Todd, Peter M. (eds.), Musical Networks, MIT Press, Cambridge, MA, pp. 313--339 (1999)
19. Biles, J.: GenJam: A Genetic Algorithm for Generating Jazz Solos. In: Proceedings of the International Computer Music Association (1994)
20. Cope, M.: Computer Models of Musical Creativity, MIT Press, Cambridge, MA (2005)
237

Experiments in Objet Trouve Browsing
Simon Colton∗, Jeremy Gow∗, Pedro Torres∗, and Paul Cairns†
∗ Department of Computing, Imperial College, London, UK.† Department of Computer Science, University of York, UK.
Abstract. We report on two experiments to study the use of a graphicdesign tool for generating and selecting image filters, in which the aes-thetic preferences that the user expresses whilst browsing filtered imagesdrives the filter generation process. In the first experiment, we found ev-idence for the idea that intelligent employment of the user’s preferenceswhen generating filters can improve the overall quality of the designsproduced, as assessed by the users themselves. The results also suggestsome user behaviours related to the fidelity of the image filters, i.e., howmuch they alter the image they are applied to. A second experimenttested whether evolutionary techniques which manage fidelity would bepreferred by users. Our results did not support this hypothesis, whichopens up interesting questions about how user preferences can be intel-ligently employed in browsing-based design tools.
1 Introduction
The Objet Trouve (Found Object) movement in modern art gained notoriety byincorporating everyday objects – often literally found discarded in the streets –into visual art and sculpture pieces. This is a two stage process, whereby theoriginal object is first found, and then manipulated into a piece of art. Thisprocess is analogous with certain practices in computer-supported graphic de-sign. In particular, both amateur and expert designers will often find themselvesbrowsing through libraries of image filters; or brush shapes; or fonts; or colourpalettes; or design templates; etc. Once they have found some possibilities, theseare pursued further and manipulated into a final form. This analogy with ObjetTrouve methods is most pronounced in the field of evolutionary art, where artis-tic images (or more precisely the image generating processes) are evolved, e.g.,[5]. Here, the software initially leads the user, through its choices of processes toemploy and the way in which it combines and/or mutates those processes as thesession progresses. However, as the user begins to exert their aesthetic prefer-ences through their choices, the software should enable them to quickly turn theirfound processes into a final form. We investigate here the behaviour of “amateurcreators” [2] when using such design software. Our motivation is to ultimatelybuild software which acts as a creative collaborator in design processes.
We present here the results from two experiments where participants wereasked to undertake graphic design tasks using a simple design tool which allowsusers to browse and select image-filtered versions of a source image in an ObjetTrouve fashion. Various techniques may be used to supply new filters on demand.As described in section 2, our tree based image filtering method enables evolu-tionary, database lookup and image retrieval techniques to be used in providing
238

Fig. 1. Filter tree with trans-forms in blue circles: (A)ddcolour, (C)onvolution, (I)nverse,(M)edian and (T)hreshold; andcompositors in red squares:(A)nd, (F)ade, (M)in and (O)r.Image inputs are in green dia-monds. An original image andfiltered version are shown.
a user with new filters. We incorporated six such techniques into a very pared-down user interface which enables the user to undertake simple graphic designtasks. As described in section 3, the first experiment was designed to test thehypothesis that employing the user’s current choices to intelligently determinewhat to show them next is more effective than a random selection method. Thedata revealed that users ascribe on average a higher score to designs producedby the intelligent methods than produced randomly. In addition, by studyinguser preferences towards the six generation methods, we hypothesised certainuser behaviours, largely involving their preferences towards more conservativeimage filters, i.e., ones with high fidelity which don’t radically change the origi-nal image. Studying these behaviours enabled us to design a second experimentinvolving evolutionary techniques where evolved filters are supplemented withother filters. As described in section 4, this experiment tested the hypothesisthat choosing the supplementary filters to manage the overall average fidelity ofthe filters would be more effective than choosing them randomly. The data didnot support this hypothesis, which opens up interesting questions about howto analyse the behaviour of a user to improve the quality of the content theyare shown as their browsing session progresses. In section 5, we suggest moreintelligent methods for future Objet Trouve design approaches.
2 Image Filtering
An image filter such as blurring, sharpening, etc. manipulates the bitmap infor-mation of an original digital image into bitmap information for a filtered versionof the image. We represent image filters as a tree of fundamental (unary) imagetransforms such as inverse, lookup, threshold, colour addition, median, etc., and(binary) image compositors such as add, and, divide, max, min, multiply, or,subtract, xor, etc. In the example tree of figure 1, the overall filter uses 7 trans-form steps and 6 compositor steps, and the original image is input to the tree7 times. Using this representation, image filters can be generated randomly, asdescribed in [3]. We used such random generation to produce a library of 1000hand-chosen filters, compiled into 30 categories according to how the filteredimages look, e.g., there are categories for filters which produce images that areblurred, grainy, monotone, etc. The time taken to apply a filter is roughly pro-portional to the size of the input image multiplied by the size of the tree. Overthe entire library of filters, the average number of nodes in a tree is 13.62, andthe average time – on a Mac OS X machine running at 2.6Ghz – to apply a filterto an image of 256 by 384 pixels is 410 milliseconds.
239

2.1 Filter Generation Methods
As described in the experiments below, we investigate how best to supply a userwith a set of novel filters (N) given a set of filters (C) for which they have alreadyexpressed an interest. We have implemented the following methods.• Database methods. These two methods use the 30 hand-constructed cate-gories from our image filter library. The Random From Category (RFC) methodsupplies filters for N which are chosen randomly from the library. To do this,firstly a category is chosen at random, and then a filter is chosen at random fromthe category. Given that some of the categories have up to 100 filters in them,we found that choosing evenly between the categories gave the user more varietyin the filters shown than simply choosing from the 1000 filters at random (whichtends to bias towards filters in the most popular few categories – which can lookfairly similar). Whenever a filter has been shown to the user, it is removed froma category, so it will not be shown again, and if a category has been exhausted,then a new one is chosen randomly. The More From Categories (MFC) methodtakes each filter in C with an equal probability, finds the library category fromwhich it came and then chooses a filter from this category at random to add toN . As before, filters which have been shown to the user are removed from thecategory. Exhausted categories are re-populated, but when a filter is used fromthe category, the filter is mutated (see below), to avoid repetitions.• Image retrieval methods. An alternative way to retrieve filters from thelibrary is to search for filters which are closest to the user choices in terms ofcolour or texture. We call these the Colour Search (CS) and Texture Search (TS)retrieval methods. We modified standard image retrieval techniques to performthis search, using information derived offline about how the filters alter the colourhistogram and texture of some standard images, as described in further detailin [11]. While the search techniques work with approximate information aboutfilters (to perform efficiently), they are fairly accurate, i.e., in [11], we report a93% probability of retrieving a given filter in a set of 10. Again, a record of thelibrary filters shown to the user is kept to avoid repetitions.• Evolutionary methods. Representing image filters as trees enables both thecrossing over of branches into offspring from each of two parents, and the mu-tation of trees. To perform crossover, we start with two parent trees (called thetop and bottom parent), and we choose a pair of nodes: Nt on the top parentand Nb on the bottom parent. These are chosen randomly so that the size of thetree above and including Nt added to the size of the tree gained from removingthe tree above and including Nb from the bottom parent is between a predefinedminimum and maximum (3 and 15 for the experiments here). After 50 failedattempts to choose such a pair of nodes, the two trees are deemed incompatible,and a new couple is chosen. If they are compatible, however, the tree above andincluding Nt is substituted for the tree above and including Nb to produce theoffspring. An example crossover operation is shown in figure 2a. We have imple-mented various mutation techniques, which alter the filter by different amounts,with details given in [3]. For the experiments here, we employ a mutation methodwhich randomly mutates a single transform/compositor node in the filter tree
240

Fig. 2. a) Example crossover operation. b) Filter Trouve design interface screenshot.
into a different transform/compositor node. This almost guarantees that a visi-ble change will occur, and through experience we have found that it can producea range of changes to the filter, from mild to fairly strong, depending on wherethe mutated node is in the tree. With the Cross-Over (CO) method, we choosepairs of filters randomly from the set of chosen filters C and perform one-pointcrossover to produce new filters for N . With the Mutate (MT) method, filtersfrom C are chosen randomly and mutated as above to produce filters for N .Note that filters generated by the CO or MT methods are checked to determineif they produce single colour images or the same image as another child of thesame parents. If so, the filter is rejected and another one is generated.
2.2 The Filter Trouve User Interface
The user interface employed for the experiments described below is portrayedin figure 2b. In each session, the user works on a single design which involvesfiltering a single image which is incorporated (possibly multiple times) into adesign, such as a magazine cover, etc. The user is shown the expression of 24filters on the image in successive screens. They can click on a filtered image tosee it in the design (in figure 2b, a filtered version of a tree image is shown ina magazine cover design). The user can also click a tick sign on each image toexpress their preference for it. When a user has chosen the images they like froma sheet, they click on the ‘next’ button which supplies them with another sheetof 24 images. At the end of a session, after clicking a ‘finalise’ button, users areshown all the designs that they ticked one by one in a random order. For eachdesign, they are asked to judge it by choosing one of: (1) would definitely notuse it (2) would probably not use it (3) not sure (4) would probably use it, and(5) would definitely use it. These choices essentially provide a score between 1and 5 for each design. When each design has been given a score, the sessionends. There has been considerable interest recently in creativity support toolslike Filter Trouve, which allow users to quickly generate, explore and comparemultiple alternatives [9]. Our design embraces Shneiderman’s principle of “lowthresholds” for novices, but intentionally avoids the “high ceilings and widewalls” of advanced and comprehensive functionality. Filter Trouve is designedfor the amateur creator [2], who is not motivated to gain domain expertise, asopposed to the novice, who intends to become an expert. However, we see noreason why Objet Trouve methods could not support other user groups.
241

3 Experiment 1
To recap, we are interested in comparing methods for presenting users withsuccessive sets of image filters, so that they can drive a browsing session viatheir aesthetic choices. In this experiment, we investigate whether using tech-niques which choose new filters based on the user’s choices perform better thantechniques which choose them randomly. To do this, we compared the RandomFrom Category (RFC) generation technique with a hybrid technique which wecall Taster. This supplies the user with: 4 filters from MFC; 4 from CO; 4 fromMT; 3 from CS; 3 from TS and 6 from RFC. Note that we included filters re-turned by RFC in the Taster method, as we found in initial tests that usersappreciate the variety provided by RFC. Note also that providing only 3 imagesfrom the CS and TS methods was a mistake – while we had intended to provide4 images for each of these methods, the mistake does not affect the conclusionswe draw. The two hypotheses we proposed were:• The Taster method will produce better images than the RFC method, asmeasured by the scores ascribed by participants to their designs.• Taster will be quicker to use than RFC, as measured by the time to completetasks and number of images viewed before deciding they have finished the task.
We asked 29 participants with varying levels of graphic design experience (noprofessionals) to undertake 4 design tasks using the Filter Trouve interface. Thedesign tasks were: a gallery installation, where a filtered image of a cityscapewas included four times with wooden frames; a magazine cover, which involved afiltered image of a woman’s face behind text; a Facebook profile, which involveda filtered version of man’s face; and a book cover, where a filtered version of a(haunted) house appears on the front and back. We instructed participants totick any filters they liked on a sheet and to stop when either around 10 minuteshad passed, or they felt they had enough designs they were pleased with, or theyfelt the search was futile and wanted to stop. We balanced the two experimentalconditions (i.e., the Taster method and the RFC method) in such a way thateach participant had both conditions twice. This meant that there were either 14or 15 participants in each pairing of design task and condition. The measures foreach task were the time taken to complete the task, the number of sheets viewedby the participant, the number of ticks and expansions (viewing the filteredimage in the overall design) a participant makes, and the score for each design.
3.1 Quality and Efficiency Results
Some summary statistics about Taster and RFC are presented in table 1. Thedata were analysed using SPSS v17.0. With all measures, it was noted that therewas substantial positive skew in many of the task conditions. For this reason,non-parametric tests were used to compare the conditions. Additionally, as eachparticipant completes four separate tasks but not in a full-factorial design, themeasures for each task are considered separately as a between-subjects designfor the two conditions. However, to account for possible correlations between theperformance on the different tasks, we make a Bonferroni correction. Thus, for all
242

Condition Mean Score Mean Ticks Mean Expands Mean Time (s) Mean Sheets
RFC 3.23 17.59 43.07 497.21 9.48Taster 3.47 15.97 39.53 463.55 6.97
Table 1. Mean score per chosen design; average number of ticks per design task; meannumber of expansions per design task; mean time per design task; mean number ofsheets of 24 images per design task, for both RFC and Taster conditions.
Design Task RFC Taster
Gallery 536 (251) 504 (123)Magazine 409 (92.0) 473 (242)Facebook 373 (179) 372 (128)BookCover 673 (298) 508 (230)
Design Task RFC Taster
Gallery 6.87 (2.48) 4.71 (2.37)Magazine 7.73 (2.69) 6.07 (2.76)Facebook 12.1 (5.72) 10.5 (6.29)BookCover 11.50 (5.20) 6.33 (2.82)
Table 2. a) mean (standard deviation) of task times in seconds for each task in eachcondition. b) mean (sd) of number of sheets viewed for each task in each condition.
tests, we use the Mann-Whitney test with significance level α = 0.05/4 = 0.0125,and SPSS was used to produce exact p values. The mean and standard deviationsof the task times are given in table 2a. There are modest differences between themeans, but overall there are no significant differences: for the gallery task, U =102, p = 0.914; for the magazine task, U = 95.5, p = 0.691; for the Facebook task,U = 104, p = 0.974; and for the book cover task, U = 57.5, p = 0.038. Note thatthe book cover task is tending towards being completed significantly quicker forthe Taster condition. For the number of filters viewed, in all tasks, participantsviewed fewer sheets in the Taster condition than in the RFC condition. Themeans and standard deviations are shown in table 2b. Significant differences areseen for Gallery (U = 49, p = 0.011) and for BookCover (U = 40, p = 0.003)but not for Magazine (U = 63.5, p = 0.067) or Facebook (U = 86.5, p = 0.429).
Analysing scores is more complicated, as each participant was able to tickand therefore score as many designs as they wished. The number of ticks dependson personal strategies for using the system, hence it would be useful to see ifparticipants differed in the number of ticked designs in one condition over theother. As tasks were fully counterbalanced across the two conditions, for eachparticipant, the number of scores produced was summed across tasks in eachcondition. In the RFC condition, participants ticked a mean of 17.59 designs,whereas in the Taster condition, the mean is lower, at 15.97. A Wilcoxon SignedRanks test indicates that these differences are not significant (Z = −1.14, p =0.261). Taking instead the average (mean) of all scores for each participant overtwo tasks in a single condition, the mean score in the RFC condition is 3.23and in the Taster condition, it is higher, at 3.47. The difference in mean scoresover the two conditions is significant (Wilcoxon Z = −2.649, p = 0.007). It isworth noting though that looking only at the number of score 5s, i.e., the imagespeople would definitely use, a similar analysis showed no significant difference.
In summary, users will on average be more satisfied (in terms of scores) withdesigns produced by Taster. However, they will not necessarily tick more designsnor give more designs the maximum score in a session. While users will notnecessarily finish quicker, they might be presented with fewer images in carryingout a design task with Taster than RFC, but this is task dependent.
243

Fig. 3. a) Mean sheet scores for the RFC and the Non-RFC submethods in the Tastermethod. b) tick and expand probabilities per sheet for RFC and Non-RFC submethods.
3.2 User Behaviour Analysis
As Taster is a combination of six filter selection submethods, we can look at theindividual contribution each submethod makes. Splitting the submethods intothose using the participant’s choices (Non-RFC) and the RFC method, lookingat figure 3a, we see that for Non-RFC methods, the mean score for designs tickedin sheets 1 to 5 is 3.23, whereas in sheets 6 to 10, the mean score is 3.4. Thesame effect is not present in the sheets produced by the RFC method. Thissuggests that users may appreciate the ability to drive the search with their tickchoices. Let us define the probability of ticking, pt(n), for sheet number n as thenumber of images ticked on the n-th sheet across all sessions divided by 24 (thenumber of images shown on any sheet). Plotting this in figure 3b, we see that forboth RFC and Non-RFC methods, pt(n) consistently falls as n increases from1 to 10. Defining the probability of expanding a design similarly as pe(n), wesee that this also decreases over sheets 1 to 10. This suggests that, in general,participants became more discerning about the images they expanded and tickedas they progressed through the first 10 sheets. After sheet 10, the pattern is lessclear, perhaps due to the small number of sessions that lasted that long. Table3 shows that ranking the methods by mean image score is equivalent to rankingthem by pt and (almost) by pe. This suggests a ranking by popularity, i.e., ifparticipants are ticking/expanding more designs during a session, they will givea higher score on average to the designs they choose. We also note that the twoevolutionary techniques (CO and MT) perform the best in terms of the meanscore that users ascribe to the designs they produce.
To further analyse the difference between the submethods, we investigatedthe fidelity of the image filters. For a given filter f , we letD(f) denote the averageEuclidean RGB-distance between pairs of pixels in the original and filtered imageat the same co-ordinate, normalised by division by the maximum RGB-distancepossible. Note that we have experimented with measures based on the HSVcolour model, but we saw little difference in the results. For a given designsession, S, we let D(S) denote the average of D(f) over all the filters f shownto the user in the session. We let T (S) be the average of D(f) over all the filtersticked by the user in session S. We also denote P (S) as the average EuclideanRGB-distance between pairs of filters (f1, f2) in a session S, where f1 is a filter
244

Rank Method Mean Score pt pe Mean D(S) Mean T (S) Mean P (S)
1 CO 3.92 0.20 0.34 0.33 0.25 0.322 MT 3.73 0.17 0.33 0.35 0.27 0.333 CS 3.30 0.09 0.27 0.37 0.30 0.374 RFC 3.13 0.07 0.20 0.47 0.35 0.515 MFC 3.13 0.06 0.16 0.45 0.35 0.56 TS 3.00 0.04 0.19 0.47 0.37 0.51
Table 3. Taster submethods ranked by mean score; probability of being ticked (pt) orexpanded (pe); mean distance from original D(S); mean distance of ticked filters fromoriginal T (S); mean distance from the ticked filters in the previous sheet P (S).
ticked by the user in sheet n and f2 is any of the 24 filters shown to the user insheet n+1. Table 3 shows D(S), T (S) and P (S) for the submethods used in theTaster sessions. We see that the mean score increases as P (S) decreases, henceparticipants seem to appreciate filters more if they are more similar to thoseticked in the previous sheet. Also, the mean score decreases as D(S) increases,which suggests that participants may have preferred more conservative imagefilters, i.e., which change the original image less. This is emphasised by thefact that in all but 3 of the 116 design sessions, T (S) was less than D(S), i.e.,participants ticked more conservative filters on average than those presented tothem in 97% of the design sessions. The extent of this conservative nature differsby design task: Gallery: D(S) = 0.44, T (S) = 0.34; Magazine: D(S) = 0.44,T (S) = 0.28; Facebook: D(S) = 0.46, T (S) = 0.30; BookCover: D(S) = 0.45,T (S) = 0.35. Participants were particularly conservative with the Magazineand Facebook tasks, as these require the filtering of faces, which was generallydisliked (as expressed through some qualitative feedback we recorded).
4 Experiment 2
To explore the observation that scores seem to be correlated with the fidelity ofthe filters, we implemented further retrieval techniques which manage the overallfidelity of filters presented to users. In particular, we implemented another hybridtechnique, Evolution (EVO), which returns 8 filters produced by CO, 8 filtersproduced by MT and 8 filters produced by RFC. This choice was motivatedby the fact that CO and MT were appreciatively the best submethods fromexperiment 1. We produced two variants of EVO to test against it. Firstly, theEVO-S method replaces the 8 filters produced by RFC with filters chosen fromthe library in such a way that the average D(f) value for the filters on eachsheet remains static at 0.25. This choice was motivated by 0.27 and 0.25 beingthe mean of the D(f) values over the ticked filters produced by the CO and MTsubmethods respectively. The EVO-D method is the second variant. In order tosupply filters for sheet number n, this method calculates the average, A, of D(f)over the ticked filters on sheet n − 1. Then, EVO-D chooses 8 filters from thelibrary to replace those produced by the RFC submethod in EVO, in such a waythat they each have a D(f) value as close to A as possible.
The aim of the second experiment was to test the hypothesis that EVO-S,EVO-D or both would be an improvement on the plain EVO method. A similar
245

Method D(f) Score Ticks Exps Time SheetsEVO 0.28 3.45 18.9 30.6 347.1 6.3
EVO-S 0.25 3.32 22.2 32.3 392.0 6.7EVO-D 0.27 3.15 20.1 27.8 362.2 6.4Table 4. Statistics for exp. 2: Mean RGB dis-tance per design (fidelity); Mean score per cho-sen design; mean ticks per design task; meanexpansions per design task; mean time (s) perdesign task; mean sheets viewed per design task.
experimental setup as before wasemployed, involving 24 partici-pants, asked to undertake 6 newdesign tasks, namely: more sta-tionery; another gallery; anothermagazine cover, shown in figure 3;a poster; a calendar; and a menu(note that we used no faces in thedesigns, to avoid any biasing as inthe first experiment). The EVO,EVO-S and EVO-D methods were balanced around the six design tasks evenly,so that each participant was given each method twice. The results are shownin table 4. A statistical analysis revealed that the hypotheses that EVO-S orEVO-D is better (in terms of eciency and mean score) are not supported by thedata. In fact, EVO has a higher mean score and lower mean time than both theother methods. We speculate that EVO-S and EVO-D’s balancing of the averageimage fidelity results in many very high fidelity filters (i.e. very low RGB dis-tance) being introduced to achieve the balance, and that in general these filtersare less satisfying to the user than the random selection used by EVO.
5 Conclusions and Further Work
To the best of our knowledge, there has been little study of user behaviourwith browsing systems for creative tasks such as evolutionary art [7]. A notableexception is [5], where user interaction with the NEvAr evolutionary art toolis described. We introduce the phrase Objet Trouve browsing to acknowledgethe push and pull between software leading the user and the user leading thesoftware in such systems. This raises the question of whether software could learnfrom the user, or more ambitiously: take a creative lead in design projects. Suchbehaviour might be appreciated by novice or amateur designers perhaps lackinginspiration. We are taking deliberately small steps towards such creative systemswith experiments involving amateur designers to understand the nature of boththe different methods and user behaviour with respect to those methods. Inparticular, we started with the straightforward hypothesis that using intelligenttechniques to deliver new image filters based on those chosen by the user wouldbe an improvement over supplying the filters randomly. (The truth of this israther taken for granted in evolutionary art and image retrieval systems).
Working with image filters enables us to compare and contrast methods fromdifferent areas of computing: database, image retrieval and evolutionary methodsin browsing for resources (filters) in design tasks. In experiment 1, we foundthat more intelligent methods will lead to greater satisfaction in the designsproduced and may lead to the completion of the design task with less effort (i.e.,having to consider fewer possibilities). We also observed some user behaviourssuch as becoming more discerning as a session progresses and appreciating theprogression afforded by the intelligent techniques. Furthermore, while there issome correlation between filter fidelity and user satisfaction, we were unable
246

to harness this for improved browsing techniques, as shown in experiment 2.Simply giving users more of what they like, whether statically or dynamically isnot sophisticated enough, raising interesting questions about managing novelty.
We plan to study other browsing systems, e.g., [10], which employs emotionalresponses to web pages, and other evolutionary image filtering systems, e.g., thatof Neufeld, Ross and Ralph (chapter 16 of [7]), which uses a fitness function basedon a Bell curve model of aesthetics. Moreover, to improve our experiments, wewill study areas of computer supported design such as: the influences of reflec-tion and emergence [8]; the use of analogy and mutation [4]; and how serendipitycan be managed [1]. We will test different browsing mechanisms involving dif-ferent image analysis techniques such as edge information and moments, andmeasures based on novelty, such as those prescribed in [6]. Despite the failure ofthe EVO-D method in experiment 2, we believe that software which dynamicallyemploys information about a user’s behaviour to intelligently suggest new arte-facts can improve upon less sophisticated methods. In particular, we intend touse the data from experiments 1 and 2 to see whether various machine learningtechniques can make sensible predictions about user preferences during imagefiltering sessions. Our ultimate goal is to build and investigate software whichacts as a creative collaborator, with its own aesthetic preferences and goals, ableto work in partnership with both amateur and expert designers.
AcknowledgmentsWe would like to thank the anonymous reviewers for their valuable input. Thiswork is supported by EPSRC grants EP/F067127 and TS/G002835.
References
1. M Andre, M Schraefel, J Teevan, and S Dumais. Designing for (un)serendipity. InProceedings of the 7th ACM Creativity and Cognition Conference, 2009.
2. S Boyd Davis and M Moar. The amateur creator. In Proceedings of the 5th ACMConference on Creativity and Cognition., 2005.
3. S Colton and P Torres. Evolving approximate image filters. In Proceedings of theEvolutionary Art and Music Workshop, EvoMUSART, 2009.
4. J Gero and M Maher. Mutation and analogy to support creativity in computer-aideddesign. In Proceedings of CAAD Futures, 1991.
5. P Machado and A Cardoso. NEvAr – The assessment of an evolutionary art tool.In Proc. AISB Symp. on Creative and Cultural Aspects of AI and Cog. Sci., 2000.
6. G Ritchie. Some empirical criteria for attributing creativity to a computer program.Minds and Machines, 17:67–99, 2007.
7. J Romero and P Machado, editors. The Art of Artificial Evolution: A Handbook onEvolutionary Art and Music. Springer, 2007.
8. D Schon and G Wiggins. Kinds of seeing and their functions in designing. DesignStudies, 13(2):135–156, 1992.
9. B Schneiderman. Creativity support tools: Accelerating discovery and innovation.Communications of the ACM, 50(12):20–32, 2007.
10. I Takeshi, O Jun, M Koji, and M Satoshi. Studies on user adaptive browsingsystem on the internet. SIG-KBS, 43:81–86, 1999.
11. P Torres, S Colton, and S Ruger. Experiments in example-based image filterretrieval. In Proceedings of the SAMT Cross-Media Workshop, 2008.
247

Evolving Expression of Emotions through Color in Virtual Humans using Genetic Algorithms
Celso M. de Melo1 and Jonathan Gratch1
1 Institute for Creative Technologies, University of Southern California,
13274 Fiji Way, Marina Del Rey, CA 90292, USA [email protected], [email protected]
Abstract. For centuries artists have been exploring the formal elements of art (lines, space, mass, light, color, sound, etc.) to express emotions. This paper takes this insight to explore new forms of expression for virtual humans which go beyond the usual bodily, facial and vocal expression channels. In particular, the paper focuses on how to use color to influence the perception of emotions in virtual humans. First, a lighting model and filters are used to manipulate color. Next, an evolutionary model, based on genetic algorithms, is developed to learn novel associations between emotions and color. An experiment is then conducted where non-experts evolve mappings for joy and sadness, without being aware that genetic algorithms are used. In a second experiment, the mappings are analyzed with respect to its features and how general they are. Results indicate that the average fitness increases with each new generation, thus suggesting that people are succeeding in creating novel and useful mappings for the emotions. Moreover, the results show consistent differences between the evolved images of joy and the evolved images of sadness.
1 Motivation
Virtual humans are embodied agents which inhabit virtual worlds and act and look like humans [1]. Inspiring on the human face-to-face conversation paradigm, virtual humans are capable of expressing themselves using verbal and non-verbal modalities in an integrated and synchronized fashion. In order to further increase believability, naturalness and efficiency of communication, virtual humans have been endowed with models of emotions. In particular, research on expression of emotions has tended to focus on the modalities people use in daily interaction: gesture, face and voice. In contrast, this work explores a new form of expression which capitalizes on accumulated knowledge from the visual arts and goes beyond the usual bodily, facial and vocal forms of expression.
In fact, artists have been exploring for centuries the idea that it is possible to perceive emotions in line, space, mass, light, color, texture, pattern, sound and motion [2]. In a simpler conception, art is seen as the expression of the artist’s feelings [3, 4]. However, John Hospers [5] refined this view by noting that the work of art need not reflect the emotions of its creator but can be said to possess emotional properties in its own right. Thus, first, the creator manipulates the formal elements of art (line, space, mass, light, color, texture, pattern, sound and motion) to convey felt or imagined
248

emotions. Then, the audience relies on analogies with the internal and external manifestations of emotions they experienced in the past to interpret the work of art. This work takes this insight and explores color to manipulate the perception of emotions in virtual humans.
Color has been widely manipulated by artists in the visual arts to convey emotion [2, 6]. Color is the result of interpretation in the brain of the perception of light in the human eye. Thus, the manipulation of light in the visual arts, called lighting, has always been a natural way of achieving specific effects with color [7, 8]. In this work, color is manipulated using a lighting model. Moreover, color can also be looked at as an abstract property of a scene and manipulated explicitly with no particular concern for the physics of light. This has been explored in abstract painting [2] and, more recently, in the visual media [9]. The work presented in this paper also explores this form of manipulation and uses filters to achieve such color effects. Filters do post-processing of pixels in a rendered image according to user-defined programs [10].
Having defined the expression modality the following question ensues: How to find novel mappings of emotions into color which are useful both for the individual and society (i.e., that generalize beyond the individual)? A first difficulty is that perception of emotion in color is influenced by biological, individual and cultural factors [2, 6]. Secondly, looking at the literature on lighting, it is possible to find general principles on how to convey moods or atmosphere [7, 8, 11, 12] but, these aren’t sufficient to differentiate between emotions and usually do not reflect the character’s mood but the narrative (such as the climax, for instance). The literature on filters is far scarcer and tends to focus on technical aspects or typical uses rather than on its affective properties [8, 9, 13]. Therefore, this work pursues an approach which is not dependent on the existent literature and tries, instead, to learn such mappings directly from people.
Moreover, the interest here is in learning intuitions about expression of emotion through color from non-experts. This is in contrast to previous approaches which attempt to learn the affective properties of lighting from artists [15, 16] or the existent literature [17, 18]. Effectively, being able to learn from non-experts is a necessity when new forms of expression are being explored. As noted above, this is specially the case with respect to finding expertise on the affective properties of filters. Furthermore, this will later facilitate extending the proposed system to other elements of art. Therefore, the system needs to be responsible for generating the alternatives, which a non-expert is unlikely to be proficient in doing, and the user should only be responsible for evaluating them (as to how well they convey the emotion).
An evolutionary approach, which relies on genetic algorithms, is used to learn mappings between emotions and color. The focus is on joy and sadness and whether the approach is applicable to other emotions is a topic of future work. Genetic algorithms [14] are appropriate for several reasons. The clear separation between generation and evaluation of alternatives is convenient. Alternatives can be generated using biologically inspired operators – mutation, crossover, etc. Evaluation, in turn, relies on feedback from people. Finally, the expression space defined by lighting and filters is very large and genetic algorithms deal well with intractable search spaces.
The rest of the paper is organized as follows: Section 2 describes the lighting and filters model used to manipulate color; Section 3 describes the evolutionary model used to learn the mappings of emotions into color; Section 4 describes two
249

experiments which were conducted to define and understand the mappings of joy and sadness; finally, Section 5 discusses the results and draws conclusions.
2 The Expression Model
The lighting model defines local pixel-level illumination of the virtual human. Among the supported parameters, the following are used in this work: (a) type, defines whether the light source is directional, point or spotlight; (b) direction, defines the illumination angle; (c) ambient, diffuse and specular colors, define the light color for each component. Color can be defined in either RGB (red, green, blue) or HSB (hue, saturation, brightness) spaces; ambient, diffuse and specular intensity, define a value which is multiplied with the respective component color. Setting the value to 0 disables the component. Filters are used to post-process the pixels of the illuminated rendered image of the virtual human. Several filters are available in the literature [19] and this work uses the following subset: the color filter, Fig.1-(b) and (c), sets the virtual human’s color to convey a stylized look such as black & white, sepia or inverted colors; the HSB filter, Fig.1-(d) and (e), manipulates the virtual human’s hue, saturation or brightness. Filters can also be concatenated to create compound effects. Further details about the expression model can be found elsewhere [20].
Fig. 1. Filters used to post-process the rendered image of the illuminated virtual human. No filter is applied in (a). The color filter is used to invert the colors in (b) and create the sepia look in (c).The HSB filter is used to reduce saturation in (d) and to increase the saturation and brightness in (e). Both virtual humans used in this work are shown.
3 The Evolutionary Model
Building on the expression model, the evolutionary model uses genetic algorithms to evolve, for a certain emotion, a population of hypotheses, which define specific configurations of lighting and filters parameters. Evolution is guided by feedback from the user as to how well each hypothesis conveys the intended emotion. The fitness function, in this case, is the subjective criteria of the user.
At the core lies a standard implementation of the genetic algorithm [14]. The algorithm is characterized by the following parameters: (a) stopping criteria to end the algorithm, i.e., the maximum number of iterations; (b) the size of the population, p, to
250

be maintained; (c) the selection method, sm, to select probabilistically among the hypotheses in a population when applying the genetic operations. Two methods are supported: roulette wheel, which selects a hypothesis according to the ratio of its fitness to the sum of all hypotheses’ fitness; tournament selection, which selects with probability p’ the most fit among two hypotheses selected using roulette wheel; (d) the crossover rate, r, which defines the percentage of the population subjected to crossover; (e) the mutation rate, m, which defines the percentage of the population subjected to mutation; (f) the elitism rate, e, which defines the percentage of the population which propagates unchanged to the next generation. The rationale behind elitism is to avoid losing the best hypotheses from the previous population in the new population [14].
The algorithm begins by setting up the initial population with random hypotheses. Thereafter, the algorithm enters a loop, evolving populations, until the stopping criterion is met. In each iteration, first, (1-r)p percent of the population is selected for the next generation; second, r*p/2 pairs of hypotheses are selected for crossover and the offspring are added to the next generation; third, m percent of the population is randomly mutated; fourth, e percent of the hypotheses is carried over unchanged to the next generation. Evaluation is based on feedback from the user.
The hypothesis is structured according to the lighting and filter parameters. Lighting uses the common three-point configuration [7, 8] which defines a primary key light and a secondary fill light. The backlight is not used in this work. Both lights are modeled as directional lights and are characterized by the following parameters: (a) direction, corresponds to a bi-dimensional floating-point vector defining angles about the x and y axis with respect to the camera-character direction. The angles are kept in the range [-75.0º, 75.0º] as these correspond to good illumination angles [5]; (b) diffuse color, corresponds to a RGB vector; (c) Kd, defines the diffuse color intensity in the range [0.0, 5.0]; (d) Ks, defines the specular color intensity in the range [0.0, 3.0]. The HSB and color filters are also applied to the virtual human. Thus, four more parameters are defined: (a) HSB.hue, HSB.saturation and HSB.brightness, define the HSB filter’s hue (in the range [0.0, 10.0]), saturation (in the range [0.0, 5.0]) and brightness (in the range [0.5, 3.0]); (b) color.style, which defines whether to apply the black & white, sepia or inverted colors style for the color filter. Both filters can be applied simultaneously. Further details on the evolutionary model can be found in another article [21].
4 Results
4.1 Learning the Mappings
In a first experiment, non-experts evolve mappings for joy and sadness. The experiment is designed so that subjects are unaware that genetic algorithms are being used. They are asked to classify five ‘sets’ (i.e., populations) of ‘alternatives’ (i.e., hypotheses) for the expression of each emotion. Classification of alternatives goes from 0.0 (’the image does not express the emotion at all’ or low fitness) to 1.0 (’the image perfectly expresses the emotion’ or high fitness). The sets are presented in
251

succession, being the first generated randomly and the succeeding ones evolved by the genetic algorithm. The experiment is automated in software. The user can save the session and continue at any time. A random name is given to the session so as to preserve anonymity. The parameters for the genetic algorithm are: p = 30, sm = tournament selection, r = 0.70, m = 0.15 and e = 0.10. Two virtual humans are used: a male and a female. The rationale for using multiple virtual humans is to minimize geometry effects in the analysis of the results (e.g., the illusion of a smile under certain lighting conditions even though no smile is generated). Participants are evenly distributed among virtual humans. The virtual human assumes the anatomical position and Perlin noise and blinking is applied. No gesture, facial or vocal expression is used throughout the whole experiment. Transition between hypotheses is instantaneous. The camera is fixed and frames the upper body of the virtual human.
The study was conducted in person at the University of Southern California campus and related institutions. Thirty subjects were recruited. Average age was 26.7 years, 46.7% were male, mostly having superior education (93.3% college level or above) in diverse fields. All subjects were recruited in the United States, even though having diverse origins (North America: 50.0%; Asia: 20%; Europe: 20%; South America: 6.7%). Average survey time was around 20 minutes.
The evolution of the average population fitness for joy and sadness is shown in Fig.2. Fourteen (out of possible thirty) of the highest fit hypotheses, one per subject, for joy and sadness are shown in Figures 3 and 4, respectively.
Fig. 2. Average fitness per set (with standard deviations) for joy and sadness.
4.2 Understanding the Mappings
The goals of a second experiment are to understand: (a) what features differentiate the mappings evolved in the first experiment; (b) how general the mappings are. Regarding the first goal, features refer to characteristics in the image generated by the respective hypothesis. The idea, then, is to differentiate the best images for joy and sadness using these features. These images are the union of, for each emotion, for each subject in the first study, the one with the highest classification. Thus, in total, 60 images are used: the 30 best for joy, one per subject; the 30 best for sadness, one per subject. Now, if the first experiment already provided a measure of value for the individuals, the second goal seeks to assess how valuable are the mappings beyond the individuals that generated them. The idea is to understand if there are common
252

patterns in the mappings evolved by each individual and how do these mappings relate to the existent literature. The existent literature is used here as a standard which represents knowledge which already has been shown to be of value to the field.
Fig. 3. Fourteen of the highest fit hypotheses for joy. Each hypothesis is from a different subject.
Fig. 4. Fourteen of the highest fit hypotheses for sadness. Each hypothesis is from a different subject.
Three features were chosen from the literature that measure properties of the pixels in the images generated by the hypotheses: brightness, saturation and number of colors. The brightness of an image is defined, in the range [0.0, 1.0], as the average brightness of the pixels. The brightness of a pixel is the subjective perception of luminance in the pixel’s color. The saturation of an image is defined, in the range [0.0, 1.0], as the average saturation of the pixels. Saturation of a pixel refers to the intensity of the pixel’s color. Standard formulas are used to calculate brightness and saturation [22]. Finally, the number of colors of an image is defined to be the number of different colors in the pixels. However, the maximum number of colors was
253

reduced by rounding the RGB components to one decimal place. Intuitively, this means the feature is only interested in relatively large differences in color.
Having calculated the feature values, the dependent t test was used to compare means between joy and sadness hypotheses with respect to each feature. The results are shown in Table 1.
Table 1. Dependent t test statistics (df=29) for difference in means between the joy and sadness images with respect to brightness (BRIG), saturation (SAT) and number of colors (NCOL).
Brightness* Saturation* Number of Colors * Mean Diff. 0.12 0.25 199.23 Std. Deviation 0.15 0.29 326.14 Std. Err. Mean 0.03 0.05 59.55 95% CI Lower 0.06 0.14 77.45 95% CI Upper 0.17 0.35 321.02 t 4.26 4.70 3.35 Sig. (2-tailed) 0.00 0.00 0.00
* Significant difference, p<0.05 The results in Table 1 show that:
• The average brightness in joy images (M=0.36, SE=0.02) is higher than in sadness (M=0.24, SE=0.02, t(29)=0.00, p<0.05, r=0.62);
• The average saturation in joy images (M=0.44, SE=0.04) is higher than in sadness (M=0.19, SE=0.04, t(29)=0.00, p<0.05, r=0.66);
• The average number of colors in joy images (M=302.20, SE=374.46) is higher than in sadness (M=102.97, SE=29.93, t(29)=0.00, p<0.05, r=0.53). Finally, to assess how general the mappings are, supervised learning techniques
were used to learn models that differentiate images of joy and sadness. In particular, decision trees [23] were used to classify the 60 images with respect to the three features. The J48 implementation of decision trees in Weka [24] was used with default parameters and 10-fold cross-validation. The resulting tree correctly classifies 47 (78.3%) of the images and is shown in Fig.5. Further details on this and the previous experiment can be found in another paper [25]. NCOLORS <= 26: sadness (23.0/3.0) NCOL ORS> 26 | BRIGHTNESS<= 0.302 | | SATURATION <= 0.413: sadness (7.0) | | SATURATION > 0.413: joy (10.0/2.0) | BRIGHTNESS > 0.302: joy (20.0/1.0) Fig. 5. Decision tree that distinguishes joy from sadness.
254

5 Discussion
This paper proposes to use accumulated knowledge from the arts to explore new forms of expression of emotions which go beyond the usual bodily, facial and vocal channels in virtual humans. In particular, the work focuses on how to convey emotion through one formal element of art: color. Color is manipulated using a sophisticated lighting model and filters. The paper further proposes an evolutionary approach, based on genetic algorithms, to learn novel and useful mappings of emotion into color. The model starts with a random set of hypotheses - i.e. configurations of lighting and filters - and, then, uses genetic algorithms to evolve new populations of hypotheses according to feedback provided by non-experts.
In a first experiment, subjects are asked to evolve mappings for joy and sadness using the evolutionary model. Subjects successively classify five sets of hypotheses, for each emotion, without being informed that a genetic algorithm is being used to generate the sets. The results show that the average set fitness for both emotions is monotonically increasing with each succeeding set (Fig.2). This suggests that: (a) subjects are succeeding in finding a novel mapping for the expression of emotions through color; (b) the genetic algorithm is succeeding in providing more useful hypotheses with each successive generation. The fact that subjects are unaware that an evolutionary approach is being used allows us to exclude the possibility that they are classifying later hypotheses better just because that is what is expected of them in an evolutionary approach. Nevertheless, the results also show that the average fitness of the fifth and final set is well below the perfect score of 1.0. This might be explained for two reasons: (a) too few sets are being asked to be evolved. This, then, would have been an experimental constraint which existed to limited survey time and not a fundamental limit on the expressiveness of color; (b) no gesture, facial or vocal expression is used. Effectively, these channels have already been shown to play an important role on the expression of emotions in virtual humans [1] and this paper is not arguing otherwise.
A second experiment analyzes which features characterize the mappings for joy and sadness. Three features were drawn from the literature: brightness, saturation, and number of colors. The results show consistency between the mappings evolved by different subjects. In particular, the results show that images of joy tend to be brighter, more saturated and have more colors than images of sadness (Table 1 and Fig.5). This suggests that the mappings also reflect values which are shared among the individuals and, therefore, that the mappings have the potential to generalize beyond the individuals that created them. Moreover, these results are in line with the lighting literature [7, 8, 11, 12]. This provides further support that the mappings reflect values which generalize beyond the individuals. Finally, the fact that it was possible to learn, using 10-fold cross-validation, a decision tree model which explains the data with a relatively high success rate, also suggests that there is the potential for generalizing beyond the particular examples that were used to learn the decision tree. In summary, if the first experiment suggested that the proposed evolutionary approach is capable of producing novel mappings that are useful at least for the individual, the second experiment suggests that those mappings are also useful for society.
Regarding future work, it would be interesting to explore whether the evolutionary approach generalizes to more emotions. From our experience and the feedback from
255

subjects, we believe this might be so for some, but not all, emotions. Finally, color is but one of the many elements that have been widely explored in the arts. Other elements include: line, space, mass, texture, shape, pattern, sound, motion, etc. It should, therefore, be worth exploring whether the proposed approach also generalizes to these other formal elements in the visual arts [2].
Acknowledgments
This work was sponsored by the Fundação para a Ciência e a Tecnologia (FCT) grant #SFRH-BD-39590-2007. This work was also sponsored by the U.S. Army Research, Development, and Engineering Command and the National Science Foundation under grant # HS-0713603. The content does not necessarily reflect the position or the policy of the Government, and no official endorsement should be inferred.
References
1. Gratch, J., Rickel, J., Andre, E., Badler, N., Cassell, J., Petajan, E.: Creating Interactive Virtual Humans: Some Assembly Required. IEEE Intelligent Systems. IEEE Computer Society, 17(4): 54–63 (2002)
2. Sayre, H.: A World of Art, fifth ed. New Jersey, USA: Prentice Hall (2007) 3. Collingwood, R.. The Principles of Art. Oxford, UK: Clarendon Press (1938) 4. Tolstoy, L.: What is Art? Oxford, USA: Oxford University Press (1955) 5. Hospers, J.: Aesthetics, problems of. The Encyclopedia of Philosophy, P. Edwards. New
York, USA: Ed. Macmillan Publishing Co (1967) 6. Fraser, T., Banks, A.: Designer’s Color Manual: The Complete Guide to Color Theory and
Application. San Francisco, USA: Chronicle Books (2004) 7. Millerson, G.: Lighting for Television and film, 3rd ed. Oxford, UK: Focal Press (1999) 8. Birn, J.: [digital] Lighting and Rendering, 2nd ed. California, USA: New Riders (2006) 9. Zettl, H.: Sight, Sound, Motion: Applied Media Aesthetics. Belmont: Thomson/
Wadsworth (2008) 10. Akenine-Moller, T., Haines, E., Hoffman, N.: Real-Time Rendering. Wellesley, USA: AK
Peters Ltd (2009) 11. Brown, B.: Motion Picture and Video Lighting, 2nd ed. Burlington, USA: Elsevier Inc.
(2007) 12. Alton J.: Painting with Light. New York, USA: Macmillan Co. (1949) 13. Gross, L., Ward, L.: Digital Moviemaking, sixth ed. Belmont, USA: Thomson/Wadsworth
(2007) 14. Mitchell, M.: An Introduction to Genetic Algorithms, 3rd ed. Massachusetts, USA: MIT
Press. 1998 15. Patow, G., Pueyo, X.. A survey of inverse rendering problems. Comp. Graphics Forum
22(4):663–687 (2003) 16. Pelaccini, F., Battaglia, F., Morley, R., Finkelstein, A.. Lighting with paint. ACM
Transactions on Graphics 26(2) (2007) 17. El-Nasr, M., Horswill, I.: Automatic lighting design for interactive entertainment. ACM
Computers in Entertainment 2(2) (2004)
256

18. Tomlinson, B., Blumberg, B., Nain, D.: Expressive autonomous cinematography for interactive virtual environments. Proceedings of the Fourth International Conference on Autonomous Agents (2000)
19. St-Laurent, S.: Shaders for Game Programmers and Artists. Massachusetts, USA: Thomson/Course Technology (2004)
20. de Melo, C., Paiva, A.: Expression of Emotions in Virtual Humans using Lights, Shadows, Composition and Filters. Proceedings of Affective Computing Intelligent Interaction (ACII07) (2007)
21. de Melo, C., Paiva, A.: Evolutionary Expression of Emotions in Virtual Humans Using Lights and Pixels. J. tao, T.N. Tan (eds.): Affective Information Processing, pp.313–336, Springer Science+Business Media LLC (2008)
22. Hunt, R.: The Reproduction of Colour, Sixth ed. Hoboken, USA: John Wiley & Sons (2004)
23. Quinlan, J.: Induction on decision trees. Machine Learning, 1(1): 813–106 (1986) 24. Witten, I., Frank, E.: Data Mining: Practical machine learning tools and techniques, 2nd
ed. San Francisco, USA: Morgan Kaufmann (2005) 25. de Melo, C., Gratch, J.: The Effect of Color on Expression of Joy and Sadness in Virtual
Humans. Affective Computing and Intelligent Interaction 2009 Conference (ACII09) (2009)
257

The Evolution of Fun:Automatic Level Design through Challenge Modeling
Nathan Sorenson and Philippe Pasquier
School of Interactive Arts and Technology,Simon Fraser University Surrey, 250 -13450 102 Avenue, Surrey, BC
{nds6, pasquier}@sfu.ca
Abstract. A generative system that creates levels for 2D platformer games ispresented. The creation process is driven by generic models of challenge-basedfun which are derived from existing theories of game design. These models areused as fitness functions in a genetic algorithm to produce new levels that maxi-mize the amount of player fun, and the results are compared with existing levelsfrom the classic video game Super Mario Bros. This technique is novel amongsystems for creating video game content as it does not follow a complex rule-based approach but instead generates output from simple and generic high-leveldescriptions of player enjoyment.
1 Introduction
Existing processes for creating video game levels are time consuming and expensive,and result in environments that are static and cannot be easily adjusted. Clearly, leverag-ing a creative system that automatically designs levels would enable independent gamedevelopers to generate content that would otherwise require the resources of larger com-panies. If effective, this process would also result in environments that are not static butare instead amenable to endless variety and modification, ideally creating more inter-esting and enjoyable experiences for game players. Furthermore, a dynamic and unsu-pervised method of level creation would allow a virtually limitless amount of contentwhich could be produced off-line and distributed to clients as expansions to the basegame, or generated on-the-fly, whereby levels could adapt to individual players as thegame is being played.
Although automated methods for creating content are occasionally seen in exist-ing games [1–3], current approaches follow a bottom-up, rule-based approach. Thismethod requires a designer to embed aesthetic goals into a collection of rules, resultingin systems just as difficult to construct as hand-designed levels [4]. Genetic algorithmsinstead allow developers to specify desirable level properties in a top-down manner,without relying on the specifics of the underlying implementation. However, any effec-tive fitness function for automated level creation must correctly identify the levels thatare “fun.” To this end, a model of what precisely constitutes a fun level must be de-veloped. In this paper, two such models are proposed: one based on Csikszentmihalyi’sconcept of “flow” [5] and the other on the notion of “rhythm groups,” as described bySmith et al. [6]. These two models are evaluated by inspecting the levels they produce
258

when employed as fitness functions in a genetic algorithm. These levels are then com-pared to existing levels that are generally considered to be well-designed. In this case,the automatically generated levels will be compared to four levels selected from the 2Dplatformer game Super Mario Bros.
Generative systems exhibit creativity when they are able to construct solutions thatare not simply parameterized variations of existing solutions. Indeed, as Byrne notes,systems that are designed for a specific domain might overlook “solutions that mightbe applicable to the current problem but are obscured by context- or domain-specificdetails” [7]. With this in mind, the models of fun that we propose are defined in termsof general theories of player enjoyment instead of by specific details of 2D platformerlevel design. Although we choose to evaluate the system in the context of this particulargenre, our intent is to produce a generative technique that will be applicable to a widevariety of games.
2 Previous Work
2.1 Evolutionary Algorithms in Creative Systems
Evolutionary algorithms are a popular choice for many creative systems [8–10]. Theprocess of creating an initial population of potential artefacts and iteratively evaluatingand breeding new populations corresponds closely to the engagement-reflection modelof creativity [11]. Furthermore, many evolutionary approaches, such as co-evolutionand genetic programming, are not restricted to a well-defined search space but ratherre-define the search space as they operate, which is a desirable characteristic for creativesystems to have [12].
2.2 Generative Systems in Video Games
Recent attempts have been made to generate novel games without the aid of a human de-signer. Cameron Browne’s dissertation [13] considers evolving abstract combinatorialgames which are similar to chess and go. His genetic algorithm uses a fitness functionconsisting of a weighted sum of 57 separate design criteria gleaned from a wide array ofsources, including psychology, subjective aesthetics, and personal correspondence withgame designers. As the parsimony of the underlying model was clearly not a priorityof his research, it is unclear to what degree this approach could be generalized to othercontexts.
Togelius and Schmidhuber also use genetic algorithms to generate novel game de-signs [14]. If a neural net is able to learn to play a particular game well, that designis assigned a high fitness value since it is assumed to contain meaningful patterns thathuman players would enjoy mastering. In contrast to Browne’s approach, this techniqueis not necessarily bound to a specific type of game. However, this work is currently at avery preliminary stage, and it remains to be seen whether games conducive to machinelearning indeed correspond to those enjoyable for human players.
Smith et al. generate levels for 2D platformer games based on a notion of “rhythmgroups” [15], which inspires one of the models presented here. Unlike our system,
259

however, they describe a rule-based system that composes level components togetherthrough the use of a generative grammar. This method is crafted specifically for 2Dplatformer games, whereas our approach seeks greater generality.
2.3 Fun in Video Games
The notion of fun is, without a doubt, incredibly broad, and it is debatable whether thesearch for a comprehensive definition could ever prove fruitful. Limiting the discussionto the sort of fun characteristic of video games still leaves room for considerable am-biguity. In fact, Hunicke, LeBlanc, and Zubek [16] argue that the term ‘fun’ in gamedesign must be discarded in favor of more precise terminology. Therefore, they presenteight distinct types of pleasure that can arise from game playing: sensation, fantasy, nar-rative, challenge, fellowship, discovery, expression, and submission. This is not claimedto be a complete categorization, and indeed, many other distinct forms of fun have beenidentified [17–19].
Such taxonomies can provide useful terminology, but the limited structuring of theircategories and the lack of any theoretical underpinning makes it difficult to extractgeneral design principals from them. These categorizations typically identify what typesof fun can be observed, but they generally do not say why such things are fun, andtherefore cannot offer principled advice as to how designs can evoke a particular typeof fun.
2.4 Flow
Many theoretical treatments of fun in games underline the relevance of Csikszentmiha-lyi’s concept of “flow” [5]. Flow refers to a particular state of intense focus, or “optimalexperience,” that can occur when certain factors are present during a task, such as asense of being in control, a loss of awareness of self and time, and a close match be-tween the task’s difficulty and the individual’s skill. This concept has been adapted bySweetser and Wyath into a game design framework called “GameFlow” [20]. By map-ping the factors that encourage the state of flow to the elements of game design, flowcan be used as a model for player enjoyment in video games.
Both Koster [21] and Zimmerman and Salen [22] note the relevance of flow to cer-tain game experiences, but neither goes so far as to define fun as equivalent to the stateof flow. Certain aspects of the concept are, however, regarded as important for facili-tating fun, particularly the requirement that game difficulty should properly correspondto a player’s skill. In A Theory of Fun, Koster states that “fun is the act of mastering aproblem mentally” [21]. It is the process of learning to overcome the challenges inherentin a game that makes the experience enjoyable, whether it be by developing complexstrategies to defeat certain opponents in a strategy game or by acquiring the muscle-memory necessary to execute a series of timed button presses in a fighting game. Thislearning process can be cut short if a game is too easy, as there will be enough problemsto be mastered, or if a game is too difficult, as a player will not be able to overcome theproblems at all. Similarly, Zimmerman and Salen identify challenge and frustration as“essential to game pleasure” [22].
260

3 Contribution
Challenge-based pleasure is, therefore, both a category common to all the consideredtaxonomies and an important aspect of theoretical conceptualizations of video gamepleasure. The models explored in this paper will then focus on this particular notion,and can be considered attempts to make explicit the relationship between challenge andfun.
As a simplifying assumption, the models will be developed and verified only withinthe specific context of the 2D platformer genre, exemplified by Donkey Kong [23] andthe Super Mario Bros. [24] series. As defined by Wolf, these are “games in which theprimary objective requires movement through a series of levels, by way of running,climbing, jumping, and other means of locomotion” [25].
This game genre is convenient for many reasons. First, it can be argued that theessential form of pleasure drawn from such games is from being challenged; the coregame play mechanic of a platformer game is the dexterity-based challenge of navigat-ing safely from platform to platform. Secondly, the challenges presented in such gamesassume a uniquely explicit form. Whereas challenge in many games emerges from thedynamic unfolding of an extensive rule set or from competition with an artificially in-telligent non-player character [16], the challenge in platform games is embodied in thephysical arrangement of the platforms or the positioning of enemies that possess onlythe most rudimentary artificial intelligence. This embodiment allows the nature of thechallenge in the game to be visually inspected, simplifying the analysis. The level de-sign of a platformer game is not merely an environment or container for the game play,but also serves as an essential element of the game play itself. In other words, to under-stand the nature of challenge in a platformer game, one need look no further than thephysical layout of the levels.
3.1 Model Design
Following the hypothesis that challenge is fundamentally related to the pleasure ofvideo games, challenge will therefore serve as the models’ primary input variable. Asis the case with the notion of fun, challenge is complex and multi-faceted. However,due to the straightforward nature of challenge in 2D platformer games, a reasonableformal conception can be offered. Challenge will be determined entirely by the localconfiguration of platforms. The challenge of a jump between platforms encountered attime step t, c(t), is typically considered to be proportional to the number of potentialplayer trajectories that successfully traverse the gap [26]. The actual measure used is arough approximation and is described in (1), where d(p1, p2) is the Manhattan distancebetween the platforms p1 and p2 minus the sum of the two “landing footprints,” fp, ofboth platforms (shown in Figure 1) plus a constant.
c(t) = d(p1, p2)− (fp(p1) + fp(p2)) + 2fpmax (1)
The landing footprint is a measurement of the length of the platform, bounded tothe maximum distance a player can jump, fpmax. This measure is important, as there
261

is a much larger margin of error when jumping to a wide platform than a narrow plat-form, resulting in a less challenging maneuver. The constant 2fpmax is added simplyto ensure that this difficulty measure never produces a negative value.
fp( )} p1 fp( )} p2
d( , )p1 p2
Fig. 1. The landing footprint, fp, is a measure of a jump’s margin of error.
To guide the development of the models, four levels from the original Super MarioBros. [24], shown in Figure 2, are taken to be exemplars of the 2D platformer genre.These levels will provide the concrete, empirical data to which the models must con-form. Essentially, these levels will constitute an implicit operational definition of thetype of fun that is of interest; in an effort to avoid the difficult task of devising an au-thoritative definition and to remain true to the purpose of mathematical modeling, funwill simply be thought of as a variable that is maximized under the particular config-uration of these levels. In other words, any model of challenge-based fun must able toaccount for the specific patterns of challenge evident in the four selected levels. Ulti-mately, it is hoped that this sampling will suffice to indicate the validity of the models.
Fig. 2. The four selected Super Mario Bros. levels.
3.2 Anxiety Curves
The levels are analyzed with the described challenge metric to produce a characteristicanxiety curve. The anxiety curve is the value of the player’s anxiety, represented bythe variable a, over time. These values are attained by integrating the level’s challengevalue over the duration of the level, with a constant decay factor, cdecay applied, asdescribed in (2). The resulting curve will therefore exhibit an increased slope whenthere is a sequence of high-difficulty jumps in a short period of time, but will slowly
262

drop during less challenging segments. The purpose of this function is to highlight therelative dynamics of the challenge over time, as opposed to drawing attention to theactual values of the challenge measurement itself.
da
dt= c(t)− cdecay (2)
The placement of enemies in the Mario levels is certainly important to the chal-lenge dynamics. Though our difficulty metric does not explicitly refer to enemies, weare able to capture this information by internally representing each enemy as a smallgap in the level. Essentially, the enemies are considered to be as difficult as a smalljump between platforms. Since enemies must generally be avoided or defeated throughjumping, this technique serves as a rough approximation for the challenge a player faceswhen encountering an enemy.
Fig. 3. Super Mario Bros. anxiety curves, charting anxiety, a, (vertical axis), over time, t, (hori-zontal axis).
As Figure 3 demonstrates, there are recognizable similarities between the anxietycurves of the four Super Mario Bros. levels. Although a crude challenge measurementis used and the conceptualization of anxiety is primitive, some structure can already bequalitatively identified: each level begins and ends with a phase of decreasing anxietyand has a recognizable period of high anxiety directly preceding the end. Three of thelevels exhibit a lower anxiety slope during the beginning half of the level, followed bya higher slope. Finally, all four levels exhibit a sawtooth pattern.
3.3 Flow-based Model
The first model is a naıve interpretation of Csikszentmihalyi’s often-cited concept offlow, specifically the portion most often applied to game design: the necessary match
263

between game challenge and player skill. Intuitively, then, the amount of fun had bya player must decrease as the mismatch between skill and challenge increases. Thisrelationship is expressed in (3).
df
dt= −(cskill − c(t))2 (3)
Fun is represented by the variable f , and like anxiety, it accumulates over time andis therefore considered differentiable. Skill (cskill) is assumed to remain constant overthe duration of a single level, and can be interpreted as the greatest level of challenge aplayer is able to effectively overcome. It is clear that to maximize the value of f , cskilland c(t) must be kept as close as possible, which is precisely what the state of flowrequires. Therefore, because we are concerned only with maximization of fun, the factthat this model produces negative values is of no consequence.
3.4 Genetic Algorithm
To evaluate this model, a genetic algorithm is used to automatically create a level thatmaximizes the amount of fun (as defined by the model) experienced during play. Eachindividual level is encoded as a genotype consisting of a sequence of x, y coordinates.Each coordinate pair specifies the horizontal and vertical pixel offset of a 64 by 64 pixelplatform relative to the preceding platform. The advantage of relative position encodingis that the range of these offsets can be limited to the maximum distance a game char-acter can jump. As no playable level will consist of a platform that is unreachable fromthe previous platform, all valid levels can be represented in this manner (assuming, ofcourse, that levels are linear with no branching paths). As well, all unplayable levels areeliminated from the evolutionary search space with this encoding, greatly improvingthe performance of the genetic algorithm.
Mutation consists of perturbing a coordinate by a normally-distributed random value,and individuals are combined through variable-point crossover to allow for various sizesof genotypes. Since two levels of the same total length could consist of different num-bers of platforms, therefore requiring different numbers of x, y pairs in the genotype,a variable-length genotype is necessary. The fitness function is a straightforward im-plementation of (3), which aims to maximize the amount of fun accumulated. As well,levels are generated to be a specific total length and are heavily penalized for deviatingfrom this externally imposed length. This restriction is necessary to avoid the evolution-ary search from simply evolving longer and longer levels as a means of accumulatingarbitrarily high amounts of fun. The population consists of 200 individuals that areevolved for 10,000 generations. Although efficiency is not presently a concern, runningtime was on the order of several hours on a mid-range dual-core PC.
A generated level and its corresponding anxiety curve are shown in Figure 4. Thislevel appears to be a chaotic scattering of platforms, and the anxiety curve seems to beof a nearly-constant slope. While it does not correspond to the Super Mario Bros. levels,this shape is to be expected; in accordance with the concept of flow, challenge is kept asclosely as possible to a constant value in levels with an anxiety curve of constant slope.Therefore, in its naıve application, flow likely does not serve as an effective model for
264

t
a
Fig. 4. Level and anxiety curve for flow-based model.
challenge in video games. This result agrees with the findings of those who believe flowis an inappropriate guideline for game design, such as Juul [27] and Falstein [28].
3.5 Periodic Model
Clearly, variation in a level’s challenge is desired. Indeed, this property is inherent in thenotion of “rhythm groups,” as described by Smith et al. [6] in their structural analysisof the architecture of platform games. A rhythm group is considered a fundamentalunit in platform level design, and consists of a moment of high challenge followed bya moment of low challenge. Rhythm groups can explain the oscillatory anxiety curvesseen in the Super Mario Bros. levels introduced in Section 3.1, and in the attempt toencourage such rhythmic variation, a new model is described in (4).
df
dt= m ∗ da
dt(4)
The behavior of this model is determined by the m variable, which can take thevalue +1 or −1. When positive, the player will accumulate fun at the same rate thatthe anxiety increases. This state represents the pleasure gained from being challenged.However, when the anxiety becomes too great, that is, when a > aupper where aupperis some constant threshold, m will become negative. After this point, fun can onlybe accrued as anxiety falls. When the level of anxiety becomes low enough, that is,a < alower, m will again become positive and the player will be ready for new chal-lenges. Whereas cskill represents, in the flow-based model, a particular degree of chal-lenge, aupper and alower here specify levels of anxiety (essentially, challenge integratedover time, as described in (2)). This model is likewise used as a fitness function in anevolutionary run, and Figure 5 depicts the resulting level and its anxiety curve.
Fig. 5. Level and anxiety curve for periodic model.
265

This level qualitatively appears much more desirable than the previous one, withclearly identifiable rhythm groups. The anxiety curve likewise exhibits an oscillatorynature. However, the observed pattern does not possess a unique high-anxiety peaknear the end of the level; rather its cyclical appearance is much more regular than whatis observed in the Super Mario Bros. levels.
4 Discussion and Future Work
The approach taken in the development and evaluation of this system prompts sev-eral observations. First, by employing theoretical accounts of fun in video games, weare able to identify abstract patterns in existing levels: rhythm groups, as described bySmith et al., can be identified in the anxiety curves, and a characteristic dramatic arccan be seen in all the levels. Secondly, we generate levels in a top-down manner byusing high-level models as fitness functions in a genetic algorithm. This technique isa promising alternative to the time-consuming trial-and-error approach associated withthe creation of rule-based systems. Finally, the analyses of existing levels and the cor-responding models were conducted with regard to the dynamics of challenge over time,not in terms of specific details of 2D platformers. This generality allows for the possi-bility of extending this generative technique to other games and other genres.
With these promising initial results, we intend to further explore the utility of thistop-down approach for level design. A clear first step would be to extend the geneticalgorithm to generate enemies and moving platforms. It would then be interesting todevelop challenge metrics for other games and compare the resulting anxiety curves,looking for similarities and differences between game genres. As well, it might proveuseful to augment the genetic algorithm with meta-evolutionary techniques, such asevolving the encoding of the levels or the fitness functions. These techniques couldfurther reduce the influence of the human designer in the construction of the content,relegating even more creative responsibility to the underlying system.
Although this system does not yet create output comparable to the work a profes-sional level designer, it can be considered an exploratory first step toward that goal.Much work still needs to be done regarding the formal analysis of existing games andthe specification of exactly what variables are important when predicting player enjoy-ment. Even if a definitive formalism is unlikely, it is hoped that the very process ofidentifying simple and general models of fun will enable creative systems to enhancethe practice of game design.
References
1. The NetHack DevTeam: Nethack. (2009) http://www.nethack.org/.2. Meier, S.: Civilization. MicroProse (1991)3. Matsuura, M.: Vib-Ribbon. Sony Computer Entertainment (1999)4. Remo, C.: MIGS: Far Cry 2’s Guay on the importance of procedural content.
Gamasutra (2008) http://www.gamasutra.com/php-bin/news index.php?story=21165.
5. Csikszentmihalyi, M.: Flow: The Psychology of Optimal Experience. Harper Perennial(1991)
266

6. Smith, G., Cha, M., Whitehead, J.: A framework for analysis of 2d platformer levels. In:Sandbox ’08: Proceedings of the 2008 ACM SIGGRAPH symposium on Video games, NewYork, NY, USA, ACM (2008) 75–80
7. Byrne, W., Schnier, T., Hendley, R.J.: Computational intelligence and case-based creativityin design. In: Proceedings of the International Joint Workshop on Computational Creativity2008, Madrid, Spain (2008) 31–40
8. Sims, K.: Artificial evolution for computer graphics. In: SIGGRAPH ’91: Proceedings ofthe 18th annual conference on Computer graphics and interactive techniques. Volume 25.,ACM Press (1991) 319–328
9. Dipaola, S., Gabora, L.: Incorporating characteristics of human creativity into an evolution-ary art algorithm. Genetic Programming and Evolvable Machines 10(2) (2009) 97–110
10. Kicinger, R., Arciszewski, T., Jong, K.D.: Evolutionary computation and structural design:A survey of the state-of-the-art. Computers & Structures 83(23-24) (2005) 1943–1978
11. Jorge, P.M., Tavares, J., Cardoso, A., Pereira, F.B., Costa, E.: Evolving creativity. In: Com-putational Creativity Workshop, 7th European Conference in Case Based Reasoning, Berlin,Germany, Springer (2004) 91–102
12. Boden, M.: The Creative Mind; Myths and Mechanisms. Routledge (2003)13. Browne, C.: Automatic generation and evaluation of recombination games. PhD in computer
science, Queensland University of Technology, Brisbane, Australia (2008)14. Togelius, J., Schmidhuber, J.: An experiment in automatic game design. In: IEEE Sympo-
sium on Computational Intelligence and Games. (2008) 111–11815. Smith, G., Treanor, M., Whitehead, J., Mateas, M.: Rhythm-based level generation for 2d
platformers. In: FDG ’09: Proceedings of the 4th International Conference on Foundationsof Digital Games, New York, NY, USA, ACM (2009) 175–182
16. Hunicke, R., LeBlanc, M., Zubek, R.: MDA: A formal approach to game design and game re-search. In: Challenges in Game AI Workshop, Nineteenth National Conference on ArtificialIntelligence. (2004) 1–5
17. Apter, M.J.: A structural-phenomenology of play. In Kerr, J.H., Apter, M.J., eds.: AdultPlay: A Reversal Theory Approach. Swets and Zeitlinger, Amsterdam (1991) 18–20
18. Malone, T.W.: What makes things fun to learn? heuristics for designing instructional com-puter games. In: SIGSMALL ’80: Proceedings of the 3rd ACM SIGSMALL symposiumand the first SIGPC symposium on Small systems, New York, NY, USA, ACM Press (1980)162–169
19. Garneau, P.A.: Fourteen forms of fun. Gamasutra. October 12 (2001)20. Sweetser, P., Wyeth, P.: Gameflow: a model for evaluating player enjoyment in games. Com-
put. Entertain. 3(3) (2005) 321. Koster, R.: Theory of Fun for Game Design. Paraglyph Press (2004)22. Salen, K., Zimmerman, E.: Rules of Play : Game Design Fundamentals. The MIT Press
(2003)23. Miyamoto, S.: Donkey Kong. Nintendo (1981)24. Miyamoto, S., Yamauchi, H., Tezuka, T.: Super Mario Bros. Nintendo (1987)25. Wolf, M.J.P.: The Medium of the Video Game. University of Texas Press (2002)26. Compton, K., Mateas, M.: Procedural level design for platform games. In: 2nd Artificial
Intelligence and Interactive Digital Entertainment Conference. (2006) 109–11127. Juul, J.: Fear of failing? the many meanings of difficulty in video games. In Yao, X., Burke,
E., Lozano, J.A., Smith, J., Merelo-Guervs, J.J., Bullinaria, J.A., Rowe, J., Tino, P., Kabn,A., Schwefel, H.P., eds.: The Video Game Theory Reader 2. Routledge, New York (2009)237–252
28. Falstein, N.: Understanding fun–the theory of natural funativity. In Rabin, S., ed.: Introduc-tion to Game Development. Charles River Media, Boston (2005) 71–98
267

Quantifying Humorous Lexical Incongruity
Chris Venour, Graeme Ritchie, Chris Mellish
University of Aberdeen
Abstract. Traditional discussions of humorous texts often postulate anotion of �incongruity� as being central, but there is no real formalisa-tion of this notion. We are exploring one particular type of incongruity,in which a clash between the style or register of lexical items leads tohumour. This paper describes our construction of a semantic space inwhich the distance between words re�ects a di�erence in their style ortone. The model was constructed by computing pro�les of words in termsof their frequencies within various corpora, using these features as a mul-tidimensional space into which words can be plotted and experimentingwith various distance metrics to see which measure best approximatesdi�erences in tone.
1 Introduction
The study of humour using computational techniques is still at a very earlystage, and has mainly consisted of two kinds of project: the computer gener-ation of very small humorous texts [1,2] and the use of text classi�cation toseparate humorous texts from non-humorous texts [3]. Little of this work has sofar explored what many theories of humour claim is an essential ingredient of hu-mour: incongruity[4,5]1. On the other hand, non-computational humour researchfails to construct clear and formal de�nitions of this concept. Our work seeks tobridge this gap, by creating and implementing a precise model of a simple kindof humorous incongruity.
The particular type of textual humour that we are focusing on, sometimescalled register-based humour [4], is where the broader stylistic properties of words(in terms of style, social connotation, etc.) within a text are in con�ict with eachother. We intend to model this phenomenon by �nding a semantic distancemetric between lexical items, so that the intuition of `words clashing' can bemade precise. The semantic space we envision will provide an objective andquanti�able way of measuring a certain kind of humorous incongruity - a conceptwhich has proven hard to measure or even de�ne. The space we have developedis designed to automatically identify a particular class of jokes, and we plan touse it to generate original jokes of this type.
1 Mihalcea and Strapparava [3] suggest that one of the features used by their classi�er- antonymy - is a form of incongruity.
268

2 Incongruity theory
Incongruity theory is probably �the most widely accepted humour doctrine today(and) was born in the seventeenth century when Blaise Pascal wrote `Nothingproduces laughter more than a surprising disproportion between that which oneexpects and that which one sees� ' [6]. The idea of incongruity has been variouslyde�ned in the literature - so much so that �it is not even obvious that all thewriters on this subject have exactly the same concept in mind� [5] - but fewcommentaries o�er more detail than the vague description left by Pascal.
Although some detailed work has been done describing some of the mech-anisms of humorous incongruity - see the two-stage model [7] and the forcedreinterpretation model described and extended by [5] - models such as these arestill not speci�ed enough to be implemented in a computer program. We hope tomake some progress in this regard by creating a precise model of a certain kindof incongruity and implementing it to recognize a class of humorous text. Thekind of humorous incongruity we formally model and then test in a computerprogram involves creating opposition along the dimensions of words.
3 Dimensions and Lexical Jokes
Near-synonyms, words that are close in meaning but not identical, reveal thekinds of subtle di�erences that can occur between words � nuances of style orsemantics which make even words that share the same literal meaning slightlydi�erent from each other. For example the words `bad' and `wicked' are near-synonyms � both mean `morally objectionable' � but di�er in intensity. Similarlythe words `think' and `cogitate' are almost synonymous but di�er in terms offormality. These distinctions between near-synonyms � the ideas of `intensity'and `formality' in the examples above � are what we call dimensions. We believethat humorous incongruity can be created by forming opposition along these andother dimensions. To illustrate this idea, consider the following humorous text,taken from an episode of `The Simpsons' (Sunday, Cruddy Sunday) in whichWally and Homer have been duped into buying fake Superbowl tickets:
Wally: Oh, how could I fall for fake tickets? Gee, the fellas are gonna becrestfallen.
Instead of saying `disappointed', Wally uses an outdated, highly literary andformal word, `crestfallen'. This choice of word smacks of a kind of e�ete intel-lectualism, especially in the highly macho context of professional sports, andthe result is humorous. In choosing the word `crestfallen', it is suggested thatWally mistakenly anticipates how `the fellas' will react � with sadness ratherthan anger � but he has also chosen a word that is:
� noticeably more formal than the domain made salient by the scene (football)� has an opposite score on some sort of `formality' dimension than many of
the other words in the passage (`gee', `fellas', `gonna')
269

This kind of incongruity, formed by creating opposition along one or more di-mensions, is, we believe, the crux of a subclass of humour we call lexical jokes.Using the idea of dimensions, we aim to automatically distinguish lexical jokesfrom non-humorous text, and also to generate new lexical jokes. We believe thatthere is a signi�cant subset of lexical jokes in which the relevant dimensions ofopposition have something to do with formality, archaism, literariness, etc.; forbrevity, we will allude to this cluster of features as �tone�.
4 Creating a semantic spaceAs we do not know how the relevant dimensions are de�ned, how these dimen-sions are related, and how they combine to create incongruity, it is not feasibleto simply extract ratings for lexical items from existing dictionaries. Instead, wehave used the distribution of words within suitable corpora as a way of de�ningthe tone of a word. For example, in Figure 1 the grey cells represent the frequen-cies of words (rows) in various corpora (columns): the darker the cell, the higherthe frequency. The words `person', `make' and `call' display similar frequencycount patterns and so might be considered similar in tone. Whereas the patternfor `personage' is quite di�erent, indicating that its tone may be di�erent.
More precisely, our proposed model works as follows:� select corpora which we judge to exhibit di�erent styles or registers� compute pro�les of words in terms of their frequencies within the corpora� use the corpora as dimensions, and the frequencies as values, to form a
multidimensional space� plot words from texts into the space� try various outlier detection methods to see which one displays the outlier
and clustering patterns we anticipate.
This model assumes that word choice is a signi�cant determiner of tone.Syntax and metaphor, for example, may also play a very important role, butthese are not considered here.
We looked for corpora which we think display di�ering degrees of formal-ity/archaism/literariness. Besides using our intuition in this regard, we also feltthat the age of a work is a strong determiner of how formal, etc. it soundsto modern ears, so we chose works that were written or translated in varioustime periods. Thus the following corpora were chosen for the �rst set of exper-iments: Virgil's The Aeneid (108,677 words), Jane Austen's novels (745,926),the King James version of the bible (852,313), Shakespeare's plays (996,280),Grimm's fairy tales (281,451), Samuel Taylor Coleridge's poetry (101,034), twonovels by Henry Fielding (148,337), a collection of common sense statements(2,215,652), Reuter's news articles (1,614,077), a year's worth of New Scientistarticles (366,393), a collection of movie reviews (1,298,728) and the written sec-tion of the British National Corpus (BNC World Edition) (80 million)2.2 Frequency counts of a word in the BNC were taken from the CUVPlus dictionary,available at the Oxford Text Archive.
270

Fig. 1. Using frequency count patterns as `tonal �ngerprints'. Cells in the table repre-sent the frequencies of words (rows) in various corpora (columns).
5 Automatically identifying an incongruous word
5.1 The development data
Twenty lexical jokes were used to develop the model. All contained exactly oneword (shown in bold in the examples below) which we judged to be incongruouswith the tone of the other words in the text3.
1. Operator, I would like to make a personage to person call please (TheComplete Cartoons of the New Yorker (CCNY), 1973, p.312).
2. Sticks and stones may break my bones but rhetoric will never hurt me(CCNY 1970, p.624).
3. You cannot expect to wield supreme executive power just because some waterytart threw a sword at you (Monty Python and the Holy Grail).
4. Listen serving the customer is merriment enough for me (The Simpsons,�Twenty-Two Short Films About Spring�eld�).
Most of the jokes (15/20) are captions taken from cartoons appearing in theNew Yorker magazine. Joke #3 however is taken from a scene in Monty Pythonand the Holy Grail and three of the twenty jokes are from di�erent episodes ofThe Simpsons television show. Thus all the texts - except possibly one whoseexact provenance is di�cult to determine - are snippets of dialogue that wereaccompanied by images in their original contexts. Although the visual compo-nents enhance the humour of the texts, we believe the texts are self-containedand remain humorous on their own.3 A more formal test with volunteers other than the authors will be conducted in thefuture.
271

5.2 Computing scoresIn the tests, stopwords were �ltered from a lexical joke, frequencies of wordswere computed in the various corpora (and normalized per million words) andwere treated as features or dimensions of a word. Words were thus regarded asvectors or points in a multi-dimensional space and the distances between themcomputed. We are interested in �nding outliers in the space because if positionin the space is in fact an estimate of tone, the word furthest away from the othersis likely to be the word whose tone is incongruous.
Ranked lists of words based on their mutual distances (using di�erent dis-tance metrics described below), were therefore computed. If the word appearingat the top of a list matched the incongruous word according to the gold stan-dard, a score of 2 was awarded. If the incongruous word appeared second in thelist, a score of 1 was awarded. Any results other than that received a score of 0.
The baseline is the score that results if we were to randomly rank the wordsof a text. If a text has 9 content words, the expected score would be 2 * 1/9 (theprobability of the incongruous word showing up in the �rst position of the list)plus 1 * 1/9 (the probability of it showing up second in the list), yielding a totalexpected score of 0.33 for this text. This computation was performed for eachtext and the sum of expected scores for the set of lexical jokes was computed tobe 9.7 out of a maximum of 40.
5.3 Computing the most distant word in a text using variousdistance metrics
Di�erent methods of computing distances between words were tried to determinewhich one was most successful in identifying the incongruous word in a text. Our�rst set of experiments, performed using the corpora listed above, employed threedi�erent distance metrics:1. Euclidean distance: this distance metric, commonly used in Information Re-
trieval [8], computes the distance D between points P = (p1, p2, . . . pn) andQ = (q1, q2, . . . qn) in the following way:
D =
√√√√n∑
i=i
(pi − qi)2
A word's Euclidean distance from each of the other words in a lexical jokewas calculated and the distances added together. This sum was computedfor each word and in this way the ranked list was produced. The word at thetop of the list had the greatest total distance from the other words and wastherefore considered the one most likely to be incongruous.
2. Mahalanobis distance: This distance metric, considered by [8] as �one of thetwo most commonly used distance measures in IR� (the other one beingEuclidean distance according to these same authors), is de�ned as
D2 =p∑
r=1
p∑s=1
(xr − µr) vrs (xs − µs)
272

where x = (x1, x2, . . . , xp), µ is the population mean vector, V is the popu-lation covariance matrix and vrsis the element in the rth row and sth columnof the inverse of V. For each word in a text, the Mahalanobis distance be-tween it and the other words in the text is computed and the ranked list isproduced.
3. Cosine distance: Another method of estimating the di�erence in tone betweentwo words, regarded as vectors v and w in our vector space, is to computethe cosine of the angle θ between them:
cosine (θ) =v · w
‖v‖ · ‖w‖Cosine distance is commonly used in vector space modelling and informationretrieval [9] and was used here to produce a ranked list of words in the mannerdescribed in 1. above.
5.4 Initial results
Table 1 shows the outcomes of testing on development examples using the setof corpora A (listed in Section 4) and various distance metrics. Predicting theincongruous word in a text using Euclidean distances received a low score of 2 outof a maximum of 40 and proved to be worse than the baseline score. Computingthe most outlying word in a text with the Mahalanobis metric yielded a scoreof 11 which is only slightly better than random, while using cosine distancesyielded the best result with a score of 24.
Table 1. Results from �rst set of testing
Testno.
Pre-processing Distance metric Corpora Score (outof 40)
1 none Euclidean A 22 none Mahalanobis A 113 none cosine A 24
5.5 Experimenting with pre-processing
We experimented with two kinds of pre-processing which are familiar in infor-mation retrieval:
1. tf-idf: In an e�ort to weight words according to their informativeness, tf-idf[10] changes a word's frequency by multiplying it by the log of the followingratio: (the total number of documents)/(how many documents the wordappears in). This transformation gives a higher weight to words that are rarein a collection of documents, and so are probably more representative of the
273

documents to which they belong. Our model computes frequency counts incorpora rather than documents, however, so the ratio we use to weight wordsis a variation of the one normally computed in information retrieval.
2. log entropy: When we compute the frequencies of words in the various cor-pora, the data is stored in a frequency count matrix X where the value ofthe cell in row i and column j is the normalized frequency count of wordi in corpus j. Our second method of pre-processing, which has �been foundto be very helpful in information retrieval� [11], involved computing the logentropy of the columns of matrix X. This amounts to giving more weightto columns (i.e. corpora) that are better at distinguishing rows (i.e. words).Turney [11] describes how to perform this pre-processing.
Tf-idf transformations (Table 2) generated generally worse results. Log entropypre-processing improved all the results however, the best result emerging onceagain from use of the cosine metric: its score improved from 24 to 32.
Table 2. Results from performing pre-processing
Test no. Pre-processing Distance metric Corpora Score (out of 40)1 tf-idf Euclidean A 32 tf-idf Mahalanobis A *4/363 tf-idf cosine A 144 log entropy Euclidean A 135 log entropy Mahalanobis A 236 log entropy cosine A 32
*Octave, the software we are using to compute the Mahalanobis distance, was forreasons unknown, unable to compute 2 of the test cases. Thus the score is out of 36.
5.6 Experimenting with di�erent corporaAfter achieving a good score predicting incongruous words using log entropy pre-processing and the cosine distance metric, we decided to not vary these methodsand to experiment with the set of corpora used to compute frequency counts.
In experiment #1 corpus set B was built simply by adding four more corporato corpus set A: archaic and formal sounding works by the authors Bul�nch,Homer, Keats and Milton. This increased the corpora size by ∼600K words butresulted in the score dropping from 32 to 31 out of a maximum of 40.
In experiment #2 corpus set C was built by adding another four corpora tocorpus B: Sir Walter Scott's �Ivanhoe�, a collection of academic science essayswritten by university students, a corpus of informal blogs, and a corpus of doc-uments about physics. As we see from Table 3, adding this data (∼1.5 millionwords) improved the score from 31 to 35.
In corpus set C, archaic and formal sounding literature seemed to be overrepresented and so in experiment #3 a new corpus set D was created by com-bining Virgil's Aeneid with works by Homer into a single corpus as they are very
274

similar in tone. Shakespeare and Coleridge's work were also merged for the samereason, as were the works by Bul�nch and Scott. In this way, fewer columns ofthe `tonal �ngerprint' consisted of corpora which are similar in tone. Also, worksby Jane Austen and by John Keats were removed because they seemed to berelatively less extreme exemplars of formality than the others. These changes tothe set of corpora resulted in a score of 37 out of a maximum of 40.
Table 3. Results from using di�erent sets of corpora
Corpora set B C DScore 31 35 37
The decisions made in constructing corpora set D, indeed most of the de-cisions about which corpora to use as foils for estimating tone, are admittedlysubjective and intuitive. This seems unavoidable, however, as we are trying toquantify obscure concepts in such an indirect manner. To the degree that our as-sumption that frequency counts in various corpora can be an estimate of a word'stone, the kind of experimentation and guesswork involved in constructing oursemantic space seems valid.
Thus using corpus set D, log entropy pre-processing and cosine distance asour distance metric, produced excellent results: 37 out of a possible 40 on thedevelopment set, according to our scoring, in identifying the incongruous wordin the set of lexical jokes. We found that we were even able to raise that scorefrom 37 to 39/40 (97.5%) by not eliminating stopwords from a lexical joke i.e.by plotting them, along with content words, into the space. Incongruous wordsin lexical jokes tend not to be commonplace and so including more examples ofwords with `ordinary' or indistinct tone renders incongruous words more visibleand probably accounts for the small rise in the score.
6 Automatically distinguishing between lexical jokes andregular text
The next step is to determine whether the space can be used to detect lexicaljokes within a collection of texts. One way of automating this classi�cation wouldbe to �nd the most outlying word and to look at how far away it is from theother words in the text. If the distance were to be above a threshold, the programwould predict that the text is a lexical joke.
This approach was tested on a set of texts consisting of the developmentset of lexical jokes together with a sample of `regular' i.e. non lexical joke texts:newspaper texts randomly4 selected from the June 5 2009 issue of the Globe andMail, a Canadian national newspaper. Complete sentences from the newspaper4 Newspaper sentences containing proper names were rejected in the selection processbecause names appear haphazardly, making estimation of their tone di�cult.
275

were initially much longer than the lexical joke sentences - the average numberof words in the lexical jokes set is 16.1 - so newspaper sentences were truncatedafter the 17th word.
For each text, the most outlying word was determined using the cosinemethod described above (with log entropy pre-processing) and the average co-sine (λ) it forms with the other words in the text was computed. Precision ishighest when the threshold cosine value is arbitrarily set at 0.425 - i.e. when wesay that λ needs to be less than or equal to 0.425 in order for the text to beconsidered a lexical joke. From Table 4 we see that 77.8% precision (in detectingjokes from within the set of all the texts processed) and 70% recall result usingthis threshold. (When pathological cases5 are excluded from the evaluation, theprogram achieves 10/13 (76.9%) precision and 10/16 (62.5%) recall using thisthreshold).
Table 4. precision and recall when computing averages
threshold value precision recall F score<=0.5 19/26 (73.1%) 19/20 (95%) 82.6<=0.425 14/18 (77.8%) 14/20 (70%) 73.7
The semantic space was developed to maximise its score when identifyingthe incongruous word in a lexical joke, but it has limited success in estimatinghow incongruous a word is. We believe that di�erences in tone in lexical jokesare much larger than those in regular text but the semantic space achieves, atbest, only 77.8% precision in re�ecting the size of these discrepancies.
One reason for this might be that the set of corpora is simply not largeenough. When the threshold is set at .425, the three newspaper texts (not con-taining a pathological word) mistakenly classi�ed as lexical jokes are:
� the tide of job losses washing across north america is showing signs ofebbing , feeding hope that...
� yet investors and economists are looking past the grim tallies and focusingon subtle details that suggest...
� both runs were completely sold out and he was so mobbed at the stage doorthat he...
The most outlying words in these texts (shown in bold) appear only rarely in theset of corpora: the word `ebbing' appeared in only three corpora, `tallies' in twoand `mobbed' in only one corpus. None of the other words in the newspaper textsappear in so few corpora and perhaps these words are considered signi�cantlyincongruous, not because they are truly esoteric (and clash with more prosaiccounterparts) but because the corpus data is simply too sparse.5 Pathological texts contain words which do not appear in any of the corpora. Thesewords were `moola', `tuckered', `�ummery', `eutrophication' and `contorts'.
276

The problem may be more deeply rooted however. New sentences which noone has ever seen before are constructed every day because writing is creative:when it is interesting and not clichéd it often brings together disparate conceptsand words which may never have appeared together before. Perhaps the modelis able to identify relatively incongruous words with precision but is less able togauge how incongruous they are because distinguishing between innovative wordchoice and incongruous word choice is currently beyond its reach.
7 Future work
Results look promising but future work will need to determine how the methodperforms on unseen lexical joke data. In early experiments, Principal Compo-nents Analysis (PCA) was performed on the frequency count data in an attemptto reduce the feature space into a space with fewer (and orthogonal) dimensionsbut initial results were disappointing. One reason for this might be that the cor-pora are too sparse to allow for much redundancy in the features, but furtherinvestigations into using PCA and other techniques for reducing the dimension-ality of vector spaces (such as Latent Semantic Analysis) will be performed.Finally, experiments into using the vector space to generate original lexical jokeswill be conducted.
References1. Stock, O., Strapparava, C.: HAHAcronym: Humorous agents for humorous
acronyms. Humor-International Journal of Humor Research 16(3) (2003) 297�3142. Manurung, R., Ritchie, G., Pain, H., Waller, A., O'Mara, D., Black, R.: The
construction of a pun generator for language skills development. Applied Arti�cialIntelligence 22(9) (2008) 841�869
3. Mihalcea, R., Strapparava, C.: Learning to laugh (automatically): Computationalmodels for humor recognition. Computational Intelligence 22(2) (2006) 126�142
4. Attardo, S.: Linguistic theories of humor. Walter de Gruyter, Berlin (1994)5. Ritchie, G.: The linguistic analysis of jokes. Routledge, London/New York (2004)6. Friend, T.: What's so funny? The New Yorker November 11 (2002) 78�937. Suls, J.: A two-stage model for the appreciation of jokes and cartoons: an
information-processing analysis. In: The Psychology of Humor: Theoretical Per-spectives and Empirical Issues (Goldstein and McGhee). Academic Press, NewYork (1972) 81�100
8. Li, X., King, I.: Gaussian mixture distance for information retrieval. In: Proceed-ings of the International Conference on Neural Networks. (1999) 2544�2549
9. Salton, G., McGill, M.: Introduction to modern information retrieval. McGraw-Hill, New York, NY (1986)
10. Salton, G., Buckley, C.: Term-weighting approaches in automatic text retrieval.Information Processing & Management 24(5) (1988) 513�523
11. Turney, P.: Similarity of semantic relations. Computational Linguistics 32(3)(2006) 379�416
277

Defining Creativity: Finding Keywords forCreativity Using Corpus Linguistics Techniques
Anna Jordanous
Creative Systems Lab / Music Informatics Research Centre,School of Informatics, University of Sussex, UK
a.k.jordanous at sussex.ac.uk
Abstract. A computational system that evaluates creativity needs guid-ance on what creativity actually is. It is by no means straightforward toprovide a computer with a formal definition of creativity; no such defini-tion yet exists and viewpoints in creativity literature vary as to what thekey components of creativity are considered to be. This work combinesseveral viewpoints for a more general consensus of how we define creativ-ity, using a corpus linguistics approach. 30 academic papers from variousacademic disciplines were analysed to extract the most frequently usedwords and their frequencies in the papers. This data was statisticallycompared with general word usage in written English. The results forma list of words that are significantly more likely to appear when talk-ing about creativity in academic texts. Such words can be consideredkeywords for creativity, guiding us in uncovering key sub-components ofcreativity which can be used for computational assessment of creativity.
1 Introduction
How can a computational system perform autonomous evaluation of creativity?A seemingly simple way is to give the system a definition of creativity which itcan use to test whether creativity is present, and to what extent [1, 9, 11].
There have been many attempts to capture the nature of creativity in words[Appendix A lists 30 such papers], but there is currently no accepted consensusand many viewpoints exist which may prioritise different aspects of creativity(this is discussed further in Section 2.1).
Identifying what contributes to our intuitive understanding of creativity canguide us towards a more formal definition of the general concept of creativity. Ifa word is used significantly more often than expected to discuss creativity, thenI suggest it is associated with the meaning of creativity. Many such words maybe more tightly defined than creativity itself; we can encode these definitions ina computational test(s) and combine these tests to approximate a measurementof creativity.
The intention of this approach is to make the goal of automated creativityassessment more manageable by reducing creativity to a set of more tractablesub-components, each of which is considered a key contributory factor towardscreativity, recognised across a combination of different viewpoints.
278

2 Finding Keywords For Creativity
The aim of this work is to find words which are significantly more likely to beused in discussions of creativity across several disciplines. These words can betreated as keywords that highlight key components of creativity.
What discussions of creativity should be examined? Written text is simplerto analyse than speech and there are many sources to choose from. The textsshould be of a reasonable length, otherwise they provide only an overview ratherthan investigating more subtle points which may be significant. This study con-centrates on the academic literature discussing creativity, in order to reducevariability in formats, facilitate discovery of key documents for inclusion andallow a measure of the influence of the document (the number of citations).
To find words used specifically in creativity literature, the language used inseveral papers was analysed to extract the frequencies with which individualwords were used. These extracted word frequencies were statistically comparedwith data on how the English language is used in general written form.
2.1 Creativity Corpus: A Selection of Papers on Creativity
The academic literature on the nature of creativity ranges over at least thepast 60 years; arguably starting from Guilford’s seminal 1950 presentation onwhat creativity is and how to detect it. Many repeated themes have emerged inthe literature as important components of creativity. As an example, the wordclouds1 in Figs. 1 and 2 show that the word new is frequently used in definitionsof creativity and also in discussions of what creativity is.
Fig. 1. Most frequent words in 23 creativity definitions (excluding common-use words)
Wide variance can be found, though, in what are considered primary contrib-utory factors of creativity. For example psychometric tests for creativity (suchas [12]) focus on problem solving and divergent thinking, rewarding the ability tomove away from standard solutions to a problem. In contrast, much recent writ-ing in computational creativity (such as [9, 11]) places emphasis on novelty and
1 Generated using software at http://www.wordle.net
279

Fig. 2. Most frequently used words in30 academic papers on creativity (ex-cluding common English words).
Fig. 3. With creativity and creative re-moved (as they dominate the image)
value as key attributes. Whilst there is some crossover, the differing emphasesgive a subtly different interpretation of creativity across academic fields.
This study considers 30 papers on the nature of creativity, written from anumber of different perspectives. This set of papers is referred to in this paperas the creativity corpus2 and is detailed in Appendix A. The 30 papers wereselected using criteria such as the paper’s influence over future work (particularlymeasured by number of citations), the year of publication, academic disciplineand author(s). To match the diversity of opinions in creativity literature asclosely as possible, the set of papers give viewpoints from many different authors,from psychology to computer science backgrounds and across time, from 1950to the current year (2009). Figure 4 shows the distribution of papers by subject,according to journal classification in the academic database Scopus3.
Fig. 4. Distribution of subject area of papers over time
The methodology for this study placed some limitations on what papers couldbe used. Papers had to be written in English4 and had to be available in a formatthat plain text could be extracted from (this excluded books or book chapters).
2 A corpus is the set of all related data being analysed (plural: corpora).3 Scopus classifies some journals under more than one subject area4 All non-British word spellings were amended to British spellings before analysis
280

2.2 Data Preparation
For each paper a plain text file was generated, containing the full text of that pa-per. All journal headers and copyright notices were removed from each paper, aswere the author names and affiliations, list of references and acknowledgements.All files were also checked for any non-ascii characters and anomalies that mayhave arisen during the creation of the text file.
2.3 Extraction of Word Frequencies from Data
R is a statistical programming environment5that is useful for corpus linguisticsanalysis. Using R, a word frequency table was constructed from the 30 text filescontaining the creativity corpus. For each word6 in the text files, the frequencytable listed: how many papers that word is used in and the number of times theword is used in the whole creativity corpus (all papers combined).
2.4 Post Processing of Results
To reduce the size of the frequency table and focus on more important words,all hapaxes were removed (words which only appear once in the whole creativitycorpus). Any strings of numbers returned as words in the frequency table werealso removed. To filter out words that were not used by many authors, any wordswhich appear in less than 5 out of 30 papers were also discarded.
2.5 Analysis of Results
It is not enough to consider purely the word frequencies on their own: a distinc-tion is often made in linguistics [3, 6, 10] between very commonly used words(form or closed class words) and lower frequency words (content or open classwords): when used more often than usual in a text, the open class words usuallyhold the most interesting or specific content [3]. So for this study the most com-mon words overall are not necessarily the most useful; as the results in Table 1show, the most frequent words overall are usually those expected to be prolificin any written texts.
Removing stopwords (very commonly used English words such as “the” or“and”) is not sufficient for the purposes of this work: this study focusses on thosewords which are specifically used more often than expected when discussingcreativity, as opposed to other texts. A method for quantifying this usage isdiscussed in the remainder of this section.
5 http://www.r-project.org/6 A word is defined as a string of letters delimited by spaces or punctuation. A com-
pound term such as “problem-solving” was divided into “problem” and “solving”.
281

Data on General Language Use: British National Corpus (BNC). TheBNC is a collection of texts and transcriptions of speech, from a variety of sourcesof British English usage. The corpus comprises approximately 100 million words,of which around 89 million words are from written sources and the remainderfrom transcriptions of speech. This study only uses data on the written sources,excluding all transcriptions of speech, as the creativity corpus is also solely fromwritten sources. The data used in this study was taken from [7]: relative wordfrequency data from a sample subset of the written part of the BNC. Beforeusing this data, frequencies were extrapolated to estimate absolute values.
Statistical Testing of Word Frequencies. It was expected that there is arelationship between how many times a word is used in the creativity corpus andhow many times it is used in general writing: to use statistical terminology, thatthe two corpora are correlated. As the data in both corpora is ratio-scored (i.e.the data is measured on a quantifiable scale), a Pearson correlation test can beperformed on the word frequency counts for each corpus, to test the hypothesisthat there is significant positive correlation.
If there is significant evidence of correlation, then the words which do notfollow the general trend of correlation are of most interest: specifically the wordsthat are used more frequently in the creativity corpus than would be expectedgiven the frequency with which they appear in the BNC. A common way tomeasure this is to use the log likelihood ratio statistic G2[3, 6, 8, 10]7:
G2 = 2∑
oij(ln oij − ln eij) (1)
oij = actual observed no of occurrences of a word i in corpus j
eij = expected no of occurrences of a word i in corpus j (see Eqn. 2):
eij =(oij + oik) ∗ total(j)(total(j) + total(k))
(2)
total(j) = total number of words in corpus j
The G2 value is a measure of how well data in one corpus fits a modeldistribution based on both corpora. The higher the G2 value, the more thatword usage deviates from what is expected given this model.
G2 measures the extent to which a word deviates from the model but doesnot indicate which corpus it appears more frequently than expected in. There-fore a subset of the results was discarded: only those words which appear morefrequently than expected in the creativity corpus were retained.
7 An alternative to G2 is the chi-squared test (χ2): see [3, 5, 6, 8, 10] for discussion ofwhy G2 is the more appropriate option for very large corpora.
282

3 Results
3.1 Raw Frequency Counts
As can be seen by Table 1 and as discussed in Section 2.5, most words whichappeared very frequently were common English words, not useful for this study.
Table 1. Most frequently used words in the creativity corpus.
Word Count in corpus Word Count in corpus Word Count in corpus
of 8052 is 2412 as 1448and 4988 that 2372 creativity 1433to 4420 creative 1994 are 1294in 3939 for 1716 this 1174a 3647 be 1561 with 1116
Figure 2 shows the results with “common English words” removed (accordingto http://www.wordle.com); however as discussed in section 2.5, this study’sfocus is on how words are used in the creativity corpus compared to normal, soremoving only wordle.com’s stopwords is not sufficient for our purposes.
3.2 Using the BNC data
As expected, the creativity corpus and BNC word frequencies are significantlypositively correlated, at a 99% level of confidence (p<0.01). Pearson correlationtesting returned a value of +0.716.
The results of this study returned 781 words which are significantly morelikely to appear in creativity literature then in general for written English (at a99% level of confidence). Table 2 shows the 100 words with the highest G2 score.
4 Discussion of Findings
This work has generated a list of words which are significantly associated withacademic discussions of what creativity is. The list is ordered by how likely thesewords are to appear in creativity literature, so the higher they are on the list,the more significantly they are associated with such discussions.
While words such as divergent and originality have appeared high on the list,as expected, some interesting results have emerged which are more surprisingat first glance, for example openness is 6th and empirical is 21st. One notableobservation is that process, in 9th position with a G2 value of 1986.72, is a gooddeal higher than product, in 409th place with a G2 value of 75.38. Althoughon closer inspection, the word process has been used in more different contexts
8 Both G2 values are still well above 6.63, the critical value for significance at p<0.01
283

than product, there are still surprisingly many discussions about the processesinvolved in creativity. This result provides intriguing evidence for the productvs. process debate in creativity assessment [1, 9, 11].
Table 2. Top 100 words in creativity corpus, sorted by descending signed G2
Some words appear surprisingly highly in Table 2, due to unexpectedly lowfrequencies being recorded in the BNC data. Two examples are because andfound. This suggests two possibilities: either a slight weakness in the represen-tativeness of the sample BNC data from [7] (perhaps understandable given thesheer quantity of data in the BNC; no sample can be 100% representative of alarger set of data), or alternatively these words may be used more in academicwriting than in everyday speech - see section 4.1 for further discussion of this.
From inspection, such words seem relatively infrequent, however, comparedto the large number of words which are recognisably associated with creativityin at least some academic domains.
4.1 Further Exploration of Keywords
Words in Common Academic Usage. It is possible that some words featurehighly in the results solely because they are common academic words. Thereforethe results list should be compared to common academic words to see if there
284

is evidence of correlation between the two sets of data. If so, this should also betaken into account.
Two lists of common words in academic English were found: the AcademicWord List (AWL) [2] and the University Word List (UWL) [13]. Both containgroups of words, in order of frequency of usage specifically in academic docu-ments (group 1 holds the most frequent words). Unlike the BNC corpus, theAWL and UWL only provides summary information on academic word usagewith no actual frequency data per word; this limits what statistical testing canbe performed. Spearman correlation testing returns a value of -0.236 correlationbetween the creativity corpus and the AWL and -0.210 correlation between thecreativity corpus and the UWL. Neither correlation value is significant at p<0.01(or p<0.05). As this indicates no significant relationship between the creativitycorpus and either academic list, no correction should be made to the keywordresults on account of either set of academic data.
Poor availability of any other data on academic word usage hinders furtherinvestigation of this issue at present.
Context and Semantics. Although the list of keywords hold much of interestin uncovering what is key to creativity, they rely purely on frequency of wordusage. The results are not intended to account for the different contexts in whichwords are used; when analysing large corpora, exploring every word’s semanticcontext would be highly time-consuming. Instead, the frequency results highlightkeywords to focus on in the texts and examine in more detail [6, 10].
Categorising the keywords by semantics is non-trivial and “labour-intensive”[4]. Carrying this out empirically would be a significant step in itself and isa fruitful avenue for further work. From inspection of the contexts in whichkeywords are used, some key categories are suggested in Table 3.
5 Conclusions
For a computational system to be able to perform automated assessment of cre-ativity by a computational system, it needs some point of reference on whatcreativity is. There is no accepted consensus on the exact definition of creativ-ity. This work empirically derives a set of keywords that combine a variety ofviewpoints from different perspectives, for a more universal encapsulation ofcreativity.
Keywords were calculated through corpus analysis of 30 academic papers onthe nature of creativity. The likelihood measure G2 (Eqn. 1) was used to compareword frequencies in the creativity papers against usage of those words in generalwritten English, as represented by the sub-corpus of the BNC containing writtentexts (see Section 2.5). This analysis returned 781 words which were statisticallymore common in the creativity literature sample than expected, given theirgeneral usage in written English. Table 2 displays the top 100 results.
The list of keywords encapsulates words we commonly use to describe andanalyse creativity in academia. Given their strong association with creativity,
285

Table 3. Key categories for creativity, generated through examining the keywords
Category Keywords representing this category
cognitive processes thinking, primary, conceptual, cognition, perceptualoriginality innovation, originality, noveltythe creative individual personality, motivation, traits, individual, intrinsic, selfability solving, intelligence, facilitate, fluency, knowledge, IQinfluences influences, problem, extrinsic, example, interactions, domaindivergence divergent, investigations, fluency, ideas, research, discoveryautonomy unconsciousdiscovery openness, awareness, search, discovery, fluency, researchdimensions dimensions, attributes, factors, criterionassociation associative, correlation, related, combinations, semanticproduct artefacts, artistic, elements, verbalvalue motivation, artistic, solving, positive, validation, retentionstudy of creativity empirical, predictions, tests, hypothesis, validation, researchmeasuress of creativity scores, scales, empirical, ratings, criterion, measures, testsevolution of creativity developmental, primary, evolutionary, primitive, basisreplicating creativity programs, computational, process, heuristics
they point us towards sub-components of creativity that contribute to our intu-itive understanding of what creativity is.
Many of the keywords in the results can be tested for by a computer moreeasily than testing for creativity itself. For example:
– Originality: Comparing products to other examples in that domain or to aprototype, to measure similarity
– Ability: Depending on the domain, there are usually many standardised teststo measure competence in that domain
– Divergence: Measuring variance of products against each other– Autonomy: Quantifiying the assistance needed during the creative process– Value: Again this is domain dependent and there will usually be many tests
for value measurement in a particular domain
The results presented in this paper identify key components of creativitythrough a combination of several viewpoints. These rsesults will be used to guideexperiments implementing a computational system that evaluates creativity bytesting for the key categories that have been identified. The experiments enableus to determine whether this approach to defining creativity gives a good enoughapproximation for creativity evaluation, and if so, which combination of testsmost closely replicates human assessment of creativity.
Acknowledgements
Nick Collins, Sandra Deshors, Clare Jonas and Luisa Natali all made usefulcomments during discussions of this work.
286

References
[1] S. Colton. Creativity versus the perception of creativity in computational systems.In Proc. of AAAI Symposium on Creative Systems, pages 14–20, 2008.
[2] A. Coxhead. A new academic word list. TESOL quarterly, 34(2):213–238, 2000.[3] T. Dunning. Accurate methods for the statistics of surprise and coincidence. Com-
putational Linguistics, 19(1):61–74, 1993.[4] D. Glynn. Polysemy, syntax, and variation. In V. Evans and S. Pourcel, editors,
New Directions in Cognitive Linguistics. John Benjamins, Amsterdam, 2009.[5] S. T. Gries. Null-hypothesis significance testing of word frequencies: a follow-up
on kilgarriff. Corpus Linguistics and Linguistic Theory, 1(2):277–294, 2005.[6] A. Kilgarriff. Comparing corpora. International Journal of Corpus Linguistics,
6(1):97–133, 2001.[7] G. Leech, P. Rayson, and A. Wilson. Word Frequencies in Written and Spoken
English. Longman, London, UK, 2001.[8] M. P. Oakes. Statistics for Corpus Linguistics. Edinburgh University Press, Edin-
burgh, UK, 1998.[9] A. Pease, D. Winterstein, and S. Colton. Evaluating machine creativity. In Proc.
of ICCBR Workshop on Approaches to Creativity, 2001.[10] P. Rayson and R. Garside. Comparing corpora using frequency profiling. Proc. of
ACL Workshop on Comparing Corpora, 2000.[11] G. Ritchie. Some empirical criteria for attributing creativity to a computer pro-
gram. Minds and Machines, 17:67–99, 2007.[12] E. P. Torrance. Torrance tests of creative thinking. Scholastic Testing Service,
Bensenville, IL, 1974.[13] G. Xue and I. S. P. Nation. A university word list. Language Learning and
Communication, 3(2):215–229, 1984.
Appendix A: Papers in the Creativity Corpus
287

Automated Jazz Improvisation
Robert M. Keller1
with contributions by Jon Gillick2, David Morrison3, Kevin Tang4
1 Harvey Mudd College, Claremont, CA, USA
2 Wesleyan University, Middletown, CT, USA 3 University of Illinois, Urbana-Champaign, IL, USA
4 Cornell University, Ithaca, NY, USA [email protected], [email protected],
[email protected], [email protected]
Abstract. I will demonstrate the jazz improvisational capabilities of Impro-Visor, a software tool originally intended to help jazz musicians work out solos prior to improvisation. As the name suggests, this tool provides various forms of advice regarding solo construction over chord changes. However, recent additions enable the tool to improvise entire choruses on its own in real-time. To reduce the overhead of creating grammars, and also to produce solos in specific styles, the tool now has a feature that enables it to learn a grammar for improvisation in a style from transcribed performances of solos by others. Samples may be found in reference [4].
Acknowledgment This research was supported by grant 0753306 from the National Science Foundation and a faculty enhancement grant from the Mellon Foundation.
References
1. Keller, R. and Morrison, D.: A Grammatical Approach to Automatic Improvisation, In: Proceedings Fourth Sound and Music Computing Conference, Lefkada, Greece, July (2007)
2. Gillick, J., Tang, K., and Keller, R.: Learning Jazz Grammars, In: Proceedings Sixth Sound and Music Computing Conference, Porto, Portugal, pp. 125--130 (2009)
3. Keller, R. et al.: Jazz Improvisation Advisor, http://www.impro-visor.com (2009) 4. http://www.cs.hmc.edu/~keller/jazz/improvisor/Solos/index.html
288

The Painting Fool Teaching Interface
Simon Colton
Department of Computing, Imperial College, London, UK
www.thepaintingfool.com
The Painting Fool is software that we hope will be taken seriously as a cre-ative painter in its own right – one day. As we are not trained artists, a validcriticism is that we are not equipped to train the software. For this reason, wehave developed a teaching interface to The Painting Fool, which enables anyone –including artists and designers – to train the software to generate and paint novelscenes, according to a scheme they specify. In order to specify the nature andrendering of the scene, users must give details on some, or all, of seven screens,some of which employ AI techniques to make the specification process simpler.The screens provide the following functionalities: (i) Images: enables the usageof context free design grammars to generate images. (ii) Annotations: enablesthe annotation of digital images, via the labelling of user-defined regions. (iii)Segmentations: enables the user to specify the parameters for image segmenta-tion schemes, whereby images are turned into paint regions. (iv) Items: enablesthe user to hand-draw items for usage in the scenes, and to specify how eachexemplar item can be varied for the generation of alternatives. (v) Collections:enables the user to specify a constraint satisfaction problem (CSP) via the ma-nipulation of rectangles. The CSP is abduced from the rectangle shapes, coloursand placements, and when solved (either by a constraint solver or evolutionaryprocess), generates new scenes of rectangles, satisfying the user constraints. (vi)Scenes: enables the specification of layers of images, items, segmentations andcollections, in addition to substitution schemes. (v) Pictures: enables the spec-ification of rendering schemes for the layers in scenes. In the demonstration, Iwill describe the process of training the software via each of the seven screens.I will use two running example picture schemes, namely the PresidENTS seriesand the Fish Fingers series, exemplars of which are portrayed in figure 1.
Fig. 1. Exemplar pictures from the PresidENTS and the Fish Fingers series of pictures
289

Generative Music Systems for Live Performance
Andrew R. Brown, Toby Gifford, and Rene Wooller
Queensland University of Technology, Brisbane , Australia. {a.brown, t.gifford, r.wooller}@qut.edu.au
Music improvisation continues to be an intriguing area for computational creativity. In this paper we will outline two software systems designed for live music performance, the LEMu (live electronic music) system and the JamBot (improvisatory accompaniment agent). Both systems undertake an analysis of human created music, generate complementary new music, are designed for interactive use in live performance, and have been tested in numerous live settings. These systems have some degree of creative autonomy, however, we are especially interested in the creative potential of the systems interacting with human performers.
The LEMu software generates transitional material between scores provided in MIDI format. The LEMu software uses an evolutionary approach to generated materials that provide an appropriate path between musical targets [1]. This musical morphing process is controlled during performance by an interactive nodal graph that allows the performer to select the morphing source and target as well as transition speed and parameters. Implementations included the MorphTable [2] where users manipulate blocks on a large surface to control musical morphing transitions. This design suits social interaction and is particularly suited to use by inexperienced users.
The JamBot [3] listens to an audio stream and plays along. It consists of rhythmic and harmonic analysis algorithms that build a dynamic model of the music being performed. This model holds multiple probable representations at one time in the Chimera Architecture [4] which can be interpreted in various ways by a generative music algorithm that adds accompaniment in real time.
These systems have been designed using a research method we have come to call Generation in Context, that relies on iterations of aesthetic reflection on the generated outcomes to inform the processes of enquiry [5]. References 1. Brown, A.R., R. Wooller, and E.R. Miranda, Interactive Evolutionary Composition: Musical
morphing as a compositional strategy, in A-Life for Music: Music and Computer Models of Living Systems, E.R. Miranda, Editor. 2010, A-R Editions: Middleton, WI, (in press).
2. Brown, A. R., R. Wooller, and K. Thomas, The Morph Table: A collaborative interface for musical interaction, in Trans: Boundaries/Permeability/Reification. Australasian Computer Music Conference, A. Riddel and A. Thorogood, Editors. 2007, ACMA:Canberra. p. 34–39.
3. Gifford, T., JamBot. 2008: Brisbane. http://www.dr.offig.com/ 4. Gifford, T. and A. R. Brown, Do Androids Dream of Electric Chimera?, in Improvise: The
Australasian Computer Music Conference 2009, A. Sorensen and P. McIlwain, Editors. 2009, ACMA: Brisbane.
5. Brown, A. R., T. Gifford, E. Narmour and R. Davidson, Generation in Context: An Exploratory Method for Musical Enquiry in The Second International Conference on Music Communication Science, C. Stevens, et al., Editors. 2009, HCSNet: Sydney. p. 7-10.
290

Realtime Generation of Harmonic Progressions in Kinetic Engine
Arne Eigenfeldt1 and Philippe Pasquier2
1School for the Contemporary Arts, 2School of Interactive Arts and Technology,
Simon Fraser University, Canada {eigenfel, pasquier}@sfu.ca
Abstract. We present a method for generating harmonic progressions using case-based analysis of existing material that employs a Markov model. Using a unique method for specifying desired harmonic complexity, tension between chord transitions, and a desired bass-line, the user specifies a 3 dimensional vector, which the realtime generative algorithm attempts to match during chord sequence generation. The proposed system thus offers a balance between user-requested material and coherence within the database. The presentation will demonstrate the software running in realtime, allowing users to generate harmonic progressions based upon a database of chord progressions drawn from Pat Metheny, Miles Davis, Wayne Shorter, and Antonio Carlos Jobim. The software is written in MaxMSP, and available at the first author’s website (www.sfu.ca/~eigenfel).
291

The Continuator Strikes Back: a Controllable Bebop Improvisation Generator
François Pachet1
1 Sony CSL-Paris, 6, rue Amyot, 75005, Paris, France
Abstract. The problem of modeling improvisation has received a lot of attention recently, thanks to progresses in machine learning, statistical modeling, and to the increase in computation power of laptops. The Continuator (Pachet, 2003) was the first real time interactive systems to allow users to create musical dialogs using style learning techniques. The Continuator is based on a modeling of musical sequences using Markov chains, a technique that was shown to be well adapted to capture stylistic musical patterns, notably in the pitch domain. The Continuator had great success in free-form improvisational settings, in which the users explore freely musical language created on-the-fly, without additional musical constraints, and was used with Jazz musicians as well as with children (Addessi & Pachet, 2005). However, the Continuator, like most systems using Markovian approaches, is difficult, if not impossible to control. This limitation is intrinsic to the greedy, left-to-right nature of Markovian music generation algorithms. Consequently, it was so far difficult to use these systems in highly constrained musical contexts. We present here a prototype of a fully controllable improvisation generator, based on a new technique that allows the user to control a Markovian generator. We use a combination of combinatorial techniques (constraint satisfaction) with machine-learning techniques (supervised classification as described in Pachet, 2009) in a novel way. We illustrate this new approach with a Bebop improvisation generator. Bebop was chosen as it is a particularly “constrained” style, notably harmonically. Our technique can generate improvisations that satisfy three types of constraints: 1) harmonic constraints derived from the rules of Bebop, 2) “Side-slips” as a way to extend the boundaries of Markovian generation by producing locally dissonant but semantically equivalent musical material that smoothly comes back to the authorized tonalities, and 3) non-Markovian constraints deduced from the user’s gestures.
Keywords: music interaction, virtuosity, doodling.
References
Addessi, A.-R. & Pachet, F. (2005) Experiments with a Musical Machine: Musical Style Replication in 3/5 year old Children. British Journal of Music Education, 22(1):21-46 March
Pachet, F. (2003) The Continuator: Musical Interaction with Style. Journal of New Music Research, 32(3):333-341
Pachet, F. & Roy, P. (2009) Markov Constraints: Steerable Generation of Markovian Sequences, submitted to Constraints, Kluwer
Pachet, F. (2009) Description-Based Design of Melodies. Computer Music Journal, 33(4):56-68
292

Software Engineering Rewards for Brainstorming Online (SEREBRO)
D.F. Grove, N. Jorgenson, S. Sen, R. Gamble University of Tulsa
800 S. Tucker Drive, Tulsa OK, USA {dean-grove, noah-jorgenson, sandip, [email protected]}
Abstract. Our multi-faceted tool called SEREBRO (Software Engineering Rewards for Brainstorming Online) is an embodiment of a novel framework for understanding how creativity in software development can be enhanced through technology and reinforcement. SEREBRO is a creativity support tool, available as a Web application that provides idea management within a social networking environment to capture, connect, and reward user contributions to team-based, software engineering problem solving tasks. To form an idea network, topics are created that typically correspond to artifacts needed to achieve specific milestones in the software development process. Team members then perform the activities of brainstorming (initiating) ideas, spinning ideas from current ones by agreeing or disagreeing, pruning threads that are non-productive, and finalizing emerging concepts for the next milestone. Each idea type is represented by a corresponding icon and color in the idea network: brainstorm nodes are blue circles, agree nodes are upright, green triangles, disagree nodes are upside down, orange triangles, and finalized nodes are yellow pentagons that have tags associated with contributing ideas. SEREBRO can display threads as a series of posts or in a graphical view of the entire tree for easy navigation. Team members also use SEREBRO for scheduling meetings and announcing progress. Special idea nodes can be used to represent meeting minutes. The meeting mode associates a clock with each idea type and allows multiple users to be credited. Rewards are propagated from leaf nodes to parents to correspond to idea support. They are supplemented when a node is tagged by finalization. These rewards are represented as badges. Reputation scores are accumulated by the direct scoring of ideas by team members. A user’s post publicly displays both reward types. The current version, SEREBRO 2.0, is supplemented with software project management components that enhance both the idea network and reward scheme. These include uploading files for sharing, version control for changes to the product implementations, a Wiki to document product artifacts, a calendar tool, and a Gantt chart. The website with a video of SEREBRO 1.0, data collections, and link to SEREBRO 2.0 to view various idea nets, the wiki, uploaded documents, and any resulting prototype development by the teams, as well as publications, including submissions, can be found at http://www.seat.utulsa.edu/serebro.php. Guest access to SEREBRO is available by email request to [email protected].
293

Piano_prosthesis
Michael Young
Music Department, Goldsmiths, University of London
New Cross, London, UK [email protected]
Piano_prosthesis presents a would-be live algorithm, a system able to collaborate creatively with a human partner. In performance, the pianist's improvisation is analysed statistically by continuously measuring the mean and standard deviation of 10 features, including pitch, dynamic, onset separation time and ‘sustain-ness’ within a rolling time period. Whenever these features constitute a 'novel' point in 10-dimensional feature space (by exceeding an arbitrary distance threshold) this point is entered as a marker. This process continues as the improvisation develops, accruing further marker points (usually around 15 are generated in a 10 minute performance). The system expresses its growing knowledge, represented by these multi-dimensional points, in its own musical output. Every new feature point is mapped to an individual input node of a pre-trained neural network, which in turn drives a stochastic synthesizer programmed with a wide repertoire of piano samples and complex musical behaviours. At any given moment in the performance, the current distance from all existing markers is expressed as a commensurate set of outputs from the neural network, generating a merged set of corresponding musical behaviours of appropriate complexity. The identification of new points, and the choice of association between points and network states, is hidden from the performer and can only be ascertained through listening and conjecture (as may well be case in improvising with fellow human player). The system intermittently and covertly devises connections between the human music and its own musical capabilities. As the machine learns and ‘communicates’, the player is invited to reciprocate. Through this quasi-social endeavour a coherent musical structure may emerge as the performance develops in complexity and intimacy. This is a new system that substitutes on-the-fly network training (previously described in detail [1]) with Euclidian distance measurements, offering considerable advantages in efficiency. There are a number of sister projects for other instruments, with corresponding sound libraries (oboe, flute, cello). Further explanation and several audio examples of full performances are available on the author’s website [2].
References
1. Young, M.: NN Music: Improvising with a ‘Living’ Computer. In: Kronland-Martinet, R. et al (eds.) Computer Music Modelling and Retrieval: Sense of Sounds. LNCS, vol. 4969. pp. 337--350. Springer, Heidelberg (2008)
2. http://www.michaelyoung.info
294

A Visual Language for Darwin
Penousal Machado and Henrique Nunes
CISUC, Department of Informatics Engineering, University of Coimbra, 3030Coimbra, Portugal [email protected]
Abstract. The main motivation for the research that allowed the cre-ation of the works presented here was the development of a system for theevolution of visual languages. When applied to artistic domains the prod-ucts of computational creativity systems tend to be individual artworks.In our approach search takes place at a higher level of abstraction, usinga novel evolutionary engine we explore a space of context free grammars.Each point of the search space represents a family of shapes following thesame production rules. In this exhibit we display instances of the vastset of shapes specified by one of the evolved grammars.
295

Using Computational Models
to Harmonise Melodies
Raymond Whorley, Geraint Wiggins, Christophe Rhodes, and Marcus Pearce∗
Centre for Cognition, Computation and CultureGoldsmiths, University of London
New Cross, London SE14 6NW, UK.∗Wellcome Laboratory of Neurobiology
University College LondonLondon WC1E 6BT, UK.
{r.whorley,g.wiggins,c.rhodes}@[email protected]
Abstract. The problem we are attempting to solve by computationalmeans is this: given a soprano part, add alto, tenor and bass such thatthe whole is pleasing to the ear. This is not easy, as there are many rulesof harmony to be followed, which have arisen out of composers’ commonpractice. Rather than providing the computer with rules, however, wewish to investigate the process of learning such rules. The idea is to writea program which allows the computer to learn for itself how to harmonisein a particular style, by creating a model of harmony from a corpus ofexisting music in that style. In our view, however, present techniques arenot sufficiently well developed for models to generate stylistically con-vincing harmonisations (or even consistently competent harmony) fromboth a subjective and an analytical point of view. Bearing this in mind,our research is concerned with the development of representational andmodelling techniques employed in the construction of statistical modelsof four-part harmony. Multiple viewpoint systems have been chosen torepresent both surface and underlying musical structure, and it is thisframework, along with Prediction by Partial Match (PPM), which willbe developed during this work. Two versions of the framework have sofar been implemented in Lisp. The first is the strictest possible appli-cation of multiple viewpoints and PPM, which reduces the four musicalsequences (or parts) to a single sequence comprising compound sym-bols. This means that, given a soprano part, the alto, tenor and bassparts are predicted or generated in a single stage. The second versionallows the lower three parts to be predicted or generated in more thanone stage; for example, the bass can be generated first, followed by thealto and tenor together in a second stage of generation. We shall be de-scribing and demonstrating our software, which uses machine learningtechniques to construct statistical models of four-part harmony from acorpus of fifty hymn-tune harmonisations. In particular, we shall demon-strate how these models can be used to harmonise a given melody; thatis, to generate alto, tenor and bass parts given the soprano part. Out-put files are quickly and easily converted into MIDI files by a programwritten in Java, and some example MIDI files will be played.
296

User-Controlling Expressed Emotions in Musicwith EDME
Alex Rodrıguez Lopez, Antonio Pedro Oliveira, and Amılcar Cardoso
Centre for Informatics and Systems, University of Coimbra, [email protected], [email protected], [email protected]
http://www.cisuc.uc.pt
Abstract. Emotion-Driven Music Engine software (EDME) expressesuser-defined emotions with music and works in two stages. The first stageis done offline and consists in emotionally classifying standard MIDI filesin two dimensions: valence and arousal. The second stage works in real-time and uses classified files to produce musical sequences arranged insong patterns.First stage starts with the segmentation of MIDI files and proceeds tothe extraction of features from the obtained segments. Classifiers for eachemotional dimension use these features to label the segments, which arethen stored in a music base.In the second stage, EDME starts by selecting the segments with emo-tional characteristics closer to the user-defined emotion. The softwarethen uses a pattern-based approach to arrange selected segments intosong-like structures. Segments are adapted, through transformations andsequencing, in order to match the tempo and pitch characteristics ofgiven song patterns. Each pattern defines song structure and harmonicrelations between the parts of each structure.The user interface of the application offers three ways to define emo-tions: selection of discrete emotions from lists of emotions; graphical se-lection in a valence-arousal bi-dimensional space; or direct definition ofvalence-arousal values. While playing, EDME responds to input changesby quickly adapting the music to a new user-defined emotion.The user may also customize the music and pattern base. We intend toexplore this possibility by challenging attendees to bring their own MIDIfiles and experiment the system. With this, we intend to allow a betterunderstanding of the potential of EDME as a composition aid tool andget useful insights about further developments.
References
1. EDME, http://sites.google.com/site/apspoliveira/home
297

Swarm Painting Atelier
Paulo Urbano1,
1 LabMag, Universidade de Lisboa, Lisboa, Portugal
Abstract. The design of coordination mechanisms is considered as a vital component for the successful deployment of multi-agent systems in general. The same happens in artificial collective creativity and in particular in artificial collective paintings where the coordination model has direct effects in agent’s behavior and in the collective pattern formation process. Coordination, that is, the way agents interact with each other and how their interactions can be controlled, plays an important role in the “aesthetic value” of the resulting paintings, in spite of its subjective nature. Direct or indirect communication, centralized or decentralized control, local versus global information are important issues regarding coordination. We have created a swarm painting tool to explore the territory of collective pattern formation, looking for aesthetically valuable behaviors and interactions forms. We adopted the bottom-up methodology for producing collective behavior, as it is more kin to fragmentation, surprise, and non-predictability—as if it was an unconscious collaboration of collective artists—something similar to a swarm "cadavre exquis", but where we have a much more numerous group of participants, which drop paint while they move. They do not know anything about pattern or style, they have just to decide where to move and which color to drop. We are going to show the artistic pieces made by a swarm painting tool made collections of decentralized painting agents using just local information, which are coordinated through the mediation of the environment (stigmergy). We will also describe other types of agent coordination based on imitation where some consensual attributes, like color or orientation, or position, will emerge, creating some order on a potential collective chaos. This consensus can die out, randomly or by interaction factors, and new consensual attributes can win resulting in heterogeneous paintings with interesting patterns, which would be difficult to achieve if made by human hands. We think that our main contribution, besides the creative exploration of new artistic spaces with swarm-art, will be in the sense of showing the possibilities of generating unpredictable and surprising patterns from the interaction of individual behaviors controlled by very simple rules. This interaction between the micro and macro levels in the artistic realm can be the source of new artistic patterns and also can foster imagination and creativity. The Atelier can be reached at: http://www.di.fc.ul.pt/~pub/swarm-atelier.
298

Author Index
Avila, Rafael 90
Berthold, Michael R. 200Bickerman, Greg 228Bosley, Sam 228Bourke, Dan 100Bown, Oliver 215Brocco, Michele 165Brown, Andrew R. 290*Brummel, Bradley 205
Cairns, Paul 238Cardoso, Amılcar 150, 297*Castellanos, Vicente 90Chordia, Parag 155Clark, Stephen 36Collins, Tom 1Colton, Simon 36, 238, 289*
de Melo, Celso M. 248
Eigenfeldt, Arne 16, 291*El-Hage, Jad 36
Forster, Florian 165Frieß, Marc Rene 165
Gamble, Rose 205, 293*Garthwaite, Paul 1Gemeinboeck, Petra 100Gero, John 110, 120Gervas, Pablo 85Gifford, Toby 290*Goel, Ashok 65Gomez de Silva Garza, Andres 110Gow, Jeremy 238Grace, Kazjon 120Gratch, Jonathan 248Groh, Georg 165Grove, Frank 205, 293*? Indicates a Show & Tell abstract.
Gruden, Kristina 190Guhe, Markus 60
Heath, Derrall 26
Indurkhya, Bipin 51
Jennings, Kyle E. 130Jordanous, Anna 223, 278Jorgenson, Noah 205, 293*
Kotter, Tobias 200Keller, Robert M. 228, 288*Kocaballi, Baki 100Krzeczkowska, Anna 36Kulovesi, Kimmo 190Kunda, Maithilee 65
Lopez, Alex Rodrıguez 150, 297*Laney, Robin 1Lavrac, Nada 190Leon, Carlos 85Lemaitre, Christian 90Lombard, Adrian 100
Machado, Penousal 41, 295*Mahyar, Narges 180Martinez, Tony 140McGreggor, Keith 65McLean, Alex 175Mellish, Chris 268Monteith, Kristine 140Motaln, Helena 190Mozetic, Igor 190
Negrete, Santiago 90Nelson, Courtney 205Norton, David 26Novak, Petra Kralj 190Nunes, Henrique 41, 295*

Oliveira, Antonio Pedro 150, 297*Ontanon, Santiago 75Opas, Tommi 180
Perez y Perez, Rafael 90Pachet, Francois 292*Pasquier, Philippe 16, 258, 291*Penalosa, Eduardo 90Pearce, Marcus 11, 296*Pease, Alison 60Petek, Marko 190Podpecan, Vid 190
Rae, Alex 155Rhodes, Christophe 11, 296*Ritchie, Graeme 268
Saunders, Rob 100, 120Sen, Sandip 205, 293*Smaill, Alan 60Sorenson, Nathan 258Swire, Peter 228
Thiel, Kilian 200Toivonen, Hannu 190Torres, Pedro 238
Urbano, Paulo 298*
Venour, Chris 268Ventura, Dan 26, 140
Whorley, Raymond 11, 296*Wiggins, Geraint 11, 175, 296*Willis, Alistair 1Wooller, Rene 290*
Yeap, Wai 180Young, Michael 215, 294*
Zhu, Jichen 75