E C L A C - Repositorio CEPAL
214
UNITED NATIONS E C L A C ECONOMIC COMMISSION for L atin A merica and THE CARIBBEAN JOSE ANTONIO OCAMPO Executive Secretary REYNALDO BAJRAJ Deputy Executive Secretary
-
Upload
khangminh22 -
Category
Documents
-
view
4 -
download
0
Transcript of E C L A C - Repositorio CEPAL

U N I T E D N A T I O N S
E C L A CECONOMIC COMMISSION
f o r La t in A m e r ic a a n d
T HE CARIBBEAN
J O S E A N T O N I O O C A M P OExecutive Secretary
R E Y N A L D O B A J R A JDeputy Executive Secretary

r
C E P R L¡ R e v i e w ,
N U M B E R 6 4
A P R I L 1 9 9 8
S A N T I A G O , C H I L E
O S C A R A L T I M I RDirector o f the Review
E U G E N I O L A H E R ATechnical Secretary
U n it e d n a t io n s

Notes and explanation of symbols The following symbols are used in tables in the Review:
(...) Three dots indicate that data are not available or are not separately reported.
( - ) A dash indicates that the amount is nil or negligible.
A blank space in a table means that the item in question is not applicable.
(-) A minus sign indicates a deficit or decrease, unless otherwise specified.
0 A point is used to indicate decimals.
(/) A slash indicates a crop year or fiscal year, e.g., 1970/1971.
(-) Use of a hyphen between years, e.g., 1971-1973, indicates reference to the complete number ofcalendar years involved, including the beginning and end years.
References to “tons” mean metric tons, and to “dollars”, United States dollars, unless otherwise stated.Unless otherwise stated, references to annual rates of growth or variation signify compound annual rates. Individual Figures and percentages in tables do not necessarily add up to the corresponding totals, because of rounding.
Guidelines for contributors to C E P A L R e v i e w
The editorial board o f the Review are always interested in encouraging the publication o f articles w hich analyse the econom ic and social developm ent o f Latin A m erica and the Caribbean. W ith this in mind, and in order to facilitate the presentation, consideration and publication of papers, they have prepared the following information and suggestions to serve as a guide to future contributors.— The subm ission o f an article assumes an undertaking by the author not to subm it it simultaneously to other periodical publications.— Papers should be subm itted in Spanish, English, French or Portuguese. They w ill be translated into the appropriate language by ECLAC.
— Every article m ust be accom panied by a short summary (of about 300 words) giving a brief description o f its subject m atter and m ain conclusions. This summ ary w ill also be published on the ECLAC H om e Page on the Internet.— Papers should not be longer than 10 000 words, including the summ ary, notes and bibliography, if applicable, but shorter articles will also be considered.— One copy o f the original text should be submitted, accom panied by a copy on diskette (WordPerfect 5.1 format). In the absence of the latter, two printed or typed copies should be provided.— AH contributions should be accom panied by a note clearly indicating the title o f the paper, the nam e of the author, the institution he belongs to, his nationality, and his fax and telephone numbers. — F ootno tes shou ld be k e p t to the m in im um , as should the num ber o f tables and figures, which should not duplicate inform ation given in the text.— Special attention should be paid to the bibliography, which should not be excessively long. All the necessary inform ation m ust be correctly stated in each case (name o f the author or authors, complete title (including any subtitle), publisher, city, month and year o f publication and, in the case of a series, the title and corresponding volum e num ber or part, etc.).— The editorial board o f the Review reserve the right to make any necessary revision or editorial changes in the articles, including their titles.— Authors w ill receive a one-year courtesy subscription to the Review, plus 30 offprints of their article, both in Spanish and in English, at the tim e o f publication in each language.

CEP AL REVI EW 64
C O N T E N T S
Institutions and growth: can human capital be a link?N auro C am pos a n d Jeffrey B. N ugent
7
External capital flows in Latin America and the Caribbeanin the 1990s: experiences and policies 29G unther H e ld an d R aquel Szalachm an
The Central Bank and Chilean macroeconomic policy inthe 1990s 49R oberto Z ahler
Fiscal policy, cycles and growth 75R icardo M ariner
Best practices, policy convergence and the WTOtrade-related investment measures 93F rancisco Sercovich
Possible effects of European Union wideningon Latin America 113P eter N unnenkam p
The North-South dimension of the environmental andcleaner technology Industries 129Jonathan R, B arton
The evolution of the State’s role In the regulation ofland transport 151Ian Thom son
Integrated water management from the perspectiveof the Dublin Principles 165M ig u el Solanes
Recent ECLAC publications 187
A P R I L 1 9 9 8


Nauro Campos Jeffrey B. Nugent
University o f
Southern California.
C E P A L R E V I E W »4
Institutions and growth:can human capital
be a link?
T his paper attem pts to provide a sounder link betw een institu
tions and econom ic grow th. It does so by i) identifying those
institutions w hich m ight m atter the m ost w ith respect to eco
nom ic perform ance, ii) providing a rationale as to w hy they
m ight m atter, and iii) confronting that rationale w ith som e sys
tem atic em pirical evidence. W e postulate that the central and
com m on characteristic o f relevant institutions is that they give
agents a voice, a stake in the system . By doing so, they increase
the appropriability o f benefits or, conversely, reduce the am ount
o f rent-seeking. A com posite index o f the extent to w hich these
institutional characteristics aie attained is constructed for 19
L atin A m erican countries for the years 1960 to 1986. W ithin an
otherw ise standard grow th m odel, ou r institutional developm ent
index is show n to contribute significantly to the explanation of
the variations in grow th rates o f per capita incom e across coun
tries and over tim e. Som e determ inants o f institutional develop
m ent, across countries as well as decades, are a lso identified. In
contrast to existing studies w hich em phasize a nexus betw een
institutional developm ent and per capita incom e grow th operat
ing through physical capital accum ulation, our results suggest
that a sim ilar nexus operating through hum an capital form ation
m ay be stronger.
A P R I L 19 9 6
8 C E P A L R E V I E W « 4 • A P R I L 1 9 * 8
I
Introduction
O n the research agenda o f econom ics, institutions to day occupy a rather sim ilar position to that occupied by technology forty years ago. A lthough A bram ovitz and Solow were clearly not the first econom ists to em phasize their im portance, they were pioneers in at least two fundam ental ways. First, they courageously dism issed the profession’s belief that the topic should be better le ft to others, in this case, to engineers. Second, they understood that w ithout an explicit and cogent attem pt at quantification, there would be neither a m arshalling o f talent to research the topic, nor any substantial progress. They knew the profession needed some m easure o f its ignorance.
A fter three Nobel prizes, it w ould be difficult to find today anyone who believes that institutions should be better left to others, presum ably political scientists. In the case o f institutions, however, nothing is yet to be seen that is anything like the im pressive m arshalling o f talent working on the topic, the profession’s enthusiasm , and the sequence o f m ajor breakthroughs that m arked the study o f technological change in the 1960s. N ot only does the profession still seem to be looking for the size o f the residual or a m easure of its ignorance, but also the links betw een institutions and econom ic growth rem ain very m uch
□ The authors express their appreciation to the Inter-University Consortium for Political and Social Research (1CPSR) for supplying much of the data used in this study and to the following individuals for their many useful comments on earlier versions of the paper: Irma Adelman, Jean-Marie Baland, Kaushik Basu, Hans Brinkman, Hamid Davoodi, Richard A. Easterlin, William Easterly, Joño Carlos Ferraz, Adolfo Figueroa, Giuseppe Iarossi, Steve Knack, Michael Lipton, Norman Loayza, Florencio López de Silanes, Abraham Lowenthal, Paolo Mauro, James McGuire, Hamid Mohtadi, Christian Morrisson, Vai-Lam Mui, Mustapha Nabli, Moisés Naim, Mancur Olson, Manuel Pastor, Jean-Philippe Platteau, George Psacharopoulos, Lant Pritchett, Martin Ravallion, James Robinson, Dani Rodrik, William Savedoff, Christopher Scott, Gerald Scully, Erik Thorbecke, Douglas Walker, Eduardo Wiesner, three anonymous referees, and other participants at the Development Workshops in Namur, Belgium, the United Nations Headquarters, the University of Southern California, and the First Annual Meeting of the Latin American and Caribbean Economic Association (Mexico City). While many of the suggestions have been implemented, some have not. Hence, in no way can these reviewers be held responsible for remaining errors of commission or omission.
underexplored. As a result, w e are left w ith many unansw ered questions, am ong them: W hich institutions m atter m ost for econom ic growth, and why? Can these relevant institutions be measured, and if so, how ? Can their effect on econom ic growth be dem onstrated? W hat are the determ inants o f these institutions? W hat is the link between institutions and econom ic growth? C an this link be hum an capital?
This paper attem pts to contribute at least m odestly to answering these im portant questions, on the basis o f the Latin A m erican experience. It begins, in section II, by surveying the characteristics o f institutions deem ed im portant to econom ic growth. It then describes an essential, central and com mon characteristic o f growth-prom oting institutions: namely, that they give agents a voice, a stake in the system, thereby increasing the appropriability o f benefits or, conversely, reducing the am ount o f rent-seeking. M ore specifically, w e identify the im portance o f an institution for econom ic developm ent with the degree to which it helps to ensure that the tastes, needs and preferences o f the citizenry are reflected in i) the organization o f the State, ii) the functioning o f the government, and iii) the form ulation and im plem entation o f public policies.
Based on this notion, in section III w e construct a com parative index o f institutional developm ent (CUD) for 19 Latin A m erican countries for the period from 1960 to 1986. In section IV w e incorporate our CIID m easure into an otherw ise standard model o f econom ic growth. Since the CIID w ould seem to be potentially endogenous, section V explores its determ inants and re-estim ates the growth model using instrum ents that represent the CUD rather than the index itself. Taken together, our results dem onstrate the significance o f the CIID in explaining economic performance and, m oreover, they point to a strong and potentially im portant nexus betw een institutional developm ent, hum an capital and growth in per capita income. Finally, section VI presents our conclusions.
W hy should the experience o f the 19 Latin A m erican countries used in this paper be o f relevance in this context? There are several im portant reasons behind this choice. First, in no other part o f the w orld
INSTITUTIONS AND GROWTH: CAN HUMAN CAPITAL BE A UNK? • NAURO CAMPOS AND JEFFREY B. NUQENT

C E P A L R E V I E W 6 4 • A P R I L 1 » 9 8 9
have the shifts in developm ent strategy and the attendant structural reforms been as striking. Second, since sustaining these reforms appears to remain a more serious challenge in Latin A m erica, success in extending and sustaining them w ould seem to require an especially delicate balance w ith respect to the role o f the State. W hile in som e respects the State needs to be strengthened to take on new tasks (Edwards, 1995), in other respects its ro le m ay have to be dim inished and changed so as to allow greater play for the m arket (W iesner, 1994; N aim , 1995). Third, am ong the developing regions, the data required for m easuring and endogenizing institutional developm ent are only available for Latin A m erica. G iven our interest in
exam ining hum an capital as a possible link between institutions and econom ic growth, it is relevant to note that it is in Latin A m erica that it has been suggested that institutional developm ent can contribute positively to econom ic developm ent only if it succeeds in realizing m ore fully the reg ion’s hum an capital potential (Londoiio, 1995). L ast but by no means least, it is in Latin A m erica, w ith its relatively high level o f resource endowm ents but its very considerable growth rate differences from one decade to another (with especially disappointing growth rates since the late 1970s), that the case for exam ining the role o f institutions in explaining growth rate differences w ould seem to be of param ount importance.
IIWhich institutions matter for economic growth, and why?
Although very substantial progress has been m ade in explaining both the determ inants and effects o f institutions a t the m icroeconom ic level (Lin and Nugent, 1995) and variations in growth rates across countries (Barro and Sala-i-M artin, 1995), much less progress has been m ade in explaining the relationship between institutions and econom ic grow th.1 Five features o f institutional analysis w ould seem responsible for lim itations in this respect: i) the persistent difficulty o f operationalizing the term “institution” (M énard,1995); ii) as suggested by Bardhan (1996, p. 1), the insufficient attention given to the identification o f “w hich institutions affect the process o f developm ent and how"; iii) the pessim istic tone o f m uch o f the literature, w ith its em phasis on “path dependency” and “institutional im pedim ents” to developm ent; iv) the excessively narrow and often negative role attributed to the State by m any m odem practitioners o f institutional analysis, and v) the general failure to integrate politics and the tradeoffs between efficiency and distribution into policy objectives (Robinson,1996).
1 Porter and Scutly observe that “Like two ships passing in the night, there exist two bodies o f scholarly literature that are largely unaware of each other, but are related to the problem of economic growth: the neoclassical theory of economic growth and the new institutional economics” (Porter and Scully, 1995, P. 17).
Each o f these lim iting features and ways o f overcom ing them will be considered in turn. First, we feel that the m uch-belaboured distinction between institutions and organizations has been over-emplrasized and should be softened.2 A t the sam e tim e, however, w e believe that institutions need to be m ore strongly distinguished from policies and policy strategies. Indeed, it m ay be hypothesized that differences in institutions can explain why the effectiveness o f a com m on policy adopted to overcom e the sam e problems in two different countries may vary consider
2 For example, North (1990, p. 107) defines institutions as society’s rules of the game, that cannot be seen, felt or even measured, and “organizations” as the players, i.e., “groups of individuals bound by a common purpose to achieve objectives” (North, 1995, p. 23). A softening of the distinction would seem desirable because of: i) the fact that the very substantial time devoted to drawing such an inevitably arbitrary distinction could be better spent on empirically investigating relevant hypotheses concerning the effects of either or both, and ii) in the light of the important time delays and rent-seeking behaviour which arise from conflict-prone reforms, the demonstrated ability of certain organizations to reduce these conflicts and thereby contribute to a better match between policies and long-run economic development.
INSTITUTIONS AND GROWTH: CAN HUMAN CAPITAL BE A UNK? • NAURO CAMPOS AND JEFFREY B. NUGENT

10 C E P A L R E V I E W 6 4 • A P R I L 1 9 9 8
ably.3 This leads us to a conclusion sim ilar to that o f Adelman and Morris (1989, p. 1429): “institutions matter greatly because they determine which government policies are likely to be adopted, and which institutions w ill be strengthened, introduced or w eakened.”
W ith respect to w hich institutions matter, even the following brief survey reveals som e very useful suggestions. For exam ple, North asserts that “the inability o f societies to develop effective, low -cost enforcem ent o f contracts is the m ost im portant source o f both historical stagnation and contem porary underdevelopm ent in the Third World” (North, 1990, p. 54). Likewise, Reynolds (1983, p. 976) attests that “the single m ost im portant explanatory variable [in explaining long-run development] is political organization and the adm inistrative com petence o f the governm ent." Olson (1996, p. 6) em phasizes the role o f incentive structures, which depends not only on w hat econom ic policies are preferred in each period, but also on long-term or institutional arrangements: the legal system s that enforce contracts and protect property rights, and the political structures, constitutional provisions and the w eight o f special-interest lobbies and cartels. Similarly, Sachs and W arner (1995, p. 5) argue that countries w ith inefficient institutions, such as those w hich do not have secure property rights, credible trade openness policies, convertible currency, etc., are unlikely to achieve any convergence (towards h igher stable levels o f per capita income), w hatever the underlying production function or initial level o f hum an capital. A ccording to Easterlin (1996, p. 56), the establishm ent of the rule o f law, the fulfillm ent o f contracts, political stability, and the elim ination o f arbitrary appropriation or taxation o f property by despots or others, together with universal education, are am ong the m ost essential institutions for m odern econom ic growth.4 Finally, A bram ovitz and D avid (1996, pp. 50-51) identify
3 The usefulness of this distinction has been widely recognized in drawing lessons for other regions from the East Asian miracle, e.g., in understanding how heavily interventionist policies have been helpful to growth in East Asia but apparently harmful to growth in other countries.4 As already noted, our econometric results solidly confirm this view. While the effect of institutions on economic development seems to be independent of investment in physical capital, the same is not true of investment in human capital. In particular, the effect of the growth of human capital only becomes statistically significant once international development is achieved.
“social capacity” -defined as the attributes, qualities and nature o f the people and o f social organization which originate in social and political institutions and influence reactions to econom ic opportunities- as the factor affecting a country’s capacity to catch up.5
W ith regard to the third lim iting feature - th e pessim istic approach taken to the possibility that institutions m ay be m od ified - the above-m entioned success o f the new institutional economy at the micro level - th a t is to say, in showing how and why the agents can escape the institutional and poverty traps that beset them and the vicious circles o f underdevelo pm en t- m ay suggest that parallel efforts at the macro level to bring about institutional changes favouring growth could be equally effective.
Finally, w ith regard to the third and fourth features -excessively narrow concepts o f the S tate and econom ic ana ly sis- it should be noted that “good” institutions, such as w ell-defined property rights, do not drop dow n like m anna from heaven. In actual fact, as N orth (1995, p. 20) points out, it is the political system w hich defines and enforces property rights. Consequently, it w ould seem reasonable that econom ic policy considerations should play a larger part in explaining the causes and m acroeconom ic effects o f institutions6 (Lin and Nugent, 1995, p. 2325). Doing this w ould not only broaden the scope o f institutional analysis but w ould also build an effective and useful bridge between two approaches which are related but have so far been kept apart: that o f developm ent specialists regarding “governance” , and that
5 “Social capacity” includes the culture of a society; the priority given to economic achievement; the rights, restrictions and obligations connected with property ownership; and all the incentives and inhibitions to which they can give rise with respect to effort, investment, enterprise and innovation. It also affects the form and activities of organizations, including the provision of public services and infrastructure.6 As Bates (1995, p. 44) suggests, ‘Thus, taking political factorsinto account helps to explain the direction and magnitude of the deviations from the status quo permitted by economic institutions and sheds some light on the reasons for their variable behaviour. The new institutionalism has its roots in economics. In order to fill its agenda, however, it must move towards the study of politics too. It must take account of the distribution of power in society and the impact of the political system on the structure and behaviour of the economic institutions”.
INSTITUTIONS AND GROWTH: CAN HUMAN CAPITAL BE A LINK? • NAURO CAMPOS AND JEFFREY B. NUGENT

C E P A L R E V I E W 64 • A P R I L 1 9 9 8 11
of political scientists regarding “dem ocracy” .7 L ikew ise -a n d quite n a tu ra lly - the analysis o f institutions would tend to lead in a m ore norm ative direction: if the institutions that m atter can also be changed, m ore attention should be given to finding the best way o f prom oting the developm ent o f institutions that foster growth.
The -adm itted ly se lective- study m ade here of the institutions considered to be im portant for longterm growth suggests how som e o f the m ain lim itations in the analysis of institutions could be overcome. W ith regard to the last two cases, this is done by incorporating econom ic policy considerations in such analysis. W e thus arrive at the following premise: the quintessential institution for econom ic developm ent is the degree to which the tastes, needs and preferences of citizens are reflected in i) the organization o f the State, ii) the functioning o f the government, and iii) the form ulation and im plem entation of public policies.
U nlike m uch o f the literature on institutions and developm ent, w hich is based alm ost exclusively on the product or results o f institutions - ite m i) o f the previous paragraph- our proposal lays great stress on the inputs o f the institutional developm ent process (items ii) and iii) o f the previous paragraph). Thus, the essence o f a successful institutional developm ent process does not lie only in the degree of State inter-
7 Governance is marked by the formulation of predictable, open and enlightened policies (that is to say, by transparent processes); a civil service imbued with a professional ethos; an Executive which is answerable for its actions, and a vigorous lay society which takes a part in public affairs, all under the rule of law (World Bank, 1994, vii). The concept of democracy held by political scientists comprises three independent elements: i) the existence of institutions and procedures through which citizens can express their effective preferences between elective policies and leaders; ii) the existence of effective restrictions on the Executive’s use of its powers; and iii) guaranteed civil liberties for all citizens. It should be noted that this definition does not speak of “voting” but of the effective transmission of preferences (see Becker, 1983, regarding this important distinction). Other aspects, such as the rule of law, systems of checks and balances and effective responsibility, may be considered as means or manifestations of these general principles. Finally, it is important to acknowledge that these questions, which had not previously been considered part of the traditional purview of economic science, are now increasingly coming within that field, because of the recently expanded coverage of economics. We may recall, for example, the defence of constitutional governments made by Buchanan (1975), the analysis of cycles of participation made by Hirschman, and the recent empirical studies of the relation between democracy and growth made by Helliwell (1994) and Barro (1996).
vention, the efficient provision of public goods, or its ability to credibly precom m it to policy decisions (Rodrik, 1992).8 Rather, it should also depend on the character o f the process in which these institutions and policies are determ ined9 and, in particular, on the “stake” in the system which agents perceive they have.
A lthough certainly not the only way o f identifying institutional developm ent, our approach suggests that institutions that are transparent and give individuals a “voice” (Hirschman, 1970) or stake in the system could significantly improve m acroeconom ic perform ance in the long run .10 If they are given a greater “voice” , all participants in the econom ic system feel that they have a “stake” in the system. W hen this occurs, agents perceive an increase in the appropriability o f the benefits o f their econom ic activities, and this should reduce the extent o f their rent-seeking activities.
Identifying the essential institutions for econom ic growth also raises afresh the identity o f the m ain link between institutions and growth. T he literature on property rights has led us to believe that physical capital formation should be the key link, in that institutional developm ent is often em bodied in the accum ulation o f physical capital (through the developm ent o f capital and financial m arkets). The way in w hich capital and financial m arket institutions em erge can reduce uncertainty and/or affect the ac
8 Similarly, with respect to the supply of public goods, our concept of institutional development gives at least as much weight to choices among the different public goods and the way in which society arrives at those choices as it does to the efficiency of their provision. There is no need, moreover, to assume that efficiency in provision and the way in which the choices are made of goods to be produced are independent of each other,9 For example, with respect to property rights, our definition considers important not only the security of such rights but also the means by which they are distributed (Shleifer, 1994). That the means by which a property right is distributed can significantly affect efficiency and growth can be illustrated by the well-known efficiency comparisons between tariffs and various means of allocating import quotas. If the quota is given away free, it can give rise to substantial rent-seeking in the form of different agents trying to obtain the quota (i.e., the right to import the restricted amount). If the quota is allocated to the domestic producer of the imported good, that agent will have monopoly power and hence further distort resource allocation and lower efficiency. On the other hand, if the quota is competitively auctioned it will be equivalent to a tariff and have no additional welfare or growth-inhibiting effects.10 The relationship between the “representativeness of government” and economic growth has recently been formalized by Boone (1995) and featured in the literature on the politicaleconomy of growth (Alesina and Perotti, 1992).
INSTITUTIONS AND GROWTH: CAN HUMAN CAPITAL BE A LINK? • NAURO CAMPOS AND JEFFREY B. NUGENT

12 C E P A L R E V I E W 84 • A P R I L 1 9 9 8
cessibility o f external finance for d ifferent sizes and types o f firm s.11
Yet, an equally strong case might be m ade for the em bodiment o f institutional development in the form of human capital or at least for viewing institutional development as complementary to human capital.12 O f relevance to such issues are the widely observed and substantial differences in the private and social rates o f return on human capital, usually in favour o f the former. Since the gap between private and social rates tends to be considerably larger in the least developed countries, where institutional development is also low, and educational opportunities are limited primarily to a small elite group, the high private rates o f return may well reflect education-induced opportunities for rent-seeking.
O n the other hand, at higher levels o f institutional developm ent, the link between education and
rent-seeking m ight be less pronounced, reducing the inflated private rate o f return to education while raising its social rate o f return (Murphy, Schleifer and Vishny, 1991).13
Brazil serves as a good exam ple o f the hypothesized relationship between institutional developm ent and die rates o f return to education. Even though the private rates o f return tend to decline w ith the level o f education, according to Psacharopoulos (1973), in 1970 the private rate o f return to university-level education was a whopping 38% but the social rate o f return a m ore modest 14%. As w ill be shown below, our index o f institutional developm ent reveals a relatively low value for Brazil at that tim e but substantially higher values later on. This w ould seem consistent w ith a subsequent rise in the social rate o f return to education relative to the private one,14
IIIThe comparative index of institutional development (ciid)
As w e noted earlier, w e hypothesize that the quintessential institution for econom ic developm ent is the degree to w hich the tastes, needs and preferences of the citizenry are translated into the functioning of governm ent, the organization o f the State, and the form ulation and im plem entation o f public policies. In the follow ing paragraphs w e w ill construct a Comparative Index o f Institutional D evelopm ent (CIID) based on generally observable indicators w hich, w e
11 Haber (1994) provides historical evidence on this issue. See also Roubini and Sala-i-Martin (1992) and De Grigorio and Guidotti (1995) for empirical evidence on the negative contribution of financial development to economic growth in Latin America. For instance, in De Grigorio and Guidotti financial development is proxied by the ratio of bank credit for the private sector to GDP, and the relationship is found to be negative in the region. On the effects of different types of market development on different sizes of firms, see Nugent and Nabili (1992).12 Throughout this paper, we follow the tradition in applied economics of restricting the concept of human capital to the outcomes of the formal educational system. We recognize, however, that there are other dimensions to this concept (e.g., on- the-job training and improvements in health status), and that these could be even more important in the context o f the least developed countries. See Becker (1993) for the many aspects of the concept of human capital, as well as for arguments stressing outcomes of the formal education system.
believe, capture (at least collectively) som e essential differences in growth-related institutional environments across countries and over time.
13 When the aforementioned characteristics of an appropriate institutional environment are satisfied, and educational opportunities are extended broadly, the competitiveness of advancement through the educational system should be increased. Eventually, this would raise the competitiveness of markets and serve to reinforce healthy institutional development. By contrast, if educational opportunities were instead more narrowly distributed, advancement would likely be determined more by family wealth, ethnic origin, etc., and as a result positive feedbacks to institutional development would be much less likely.14 Another way to illustrate this point is to contrast the experiences of South Korea and Venezuela (World Bank, 1993 and1994). While public expenditure on education in 1985 was 4.3% of GNP in Venezuela but only 3% of GNP in South Korea,the share of the education budget allocated to primary educationwas 83.9% (2.5% of GNP) in South Korea but only 31% (1.3% of GNP) in Venezuela. In most of Latin America, the outcome of the educational system is characterized by high levels of illiteracy, educational inefficiencies such as high grade repetition and under-investment in primary education, and the enhancement of existing inequalities (Fajnzylber, 1990) by over-spending on higher education (Morley, 1995; Londofio, 1995). Taken together, these factors greatly increase the likelihood of the lack of healthy links between education and institutional development in the region.
INSTITUTIONS AND GROWTH: CAN HUMAN CAPITAL BE A UNKT • NAURO CAMPOS AND JEFFREY B. NUGENT

C E P A L R E V I E W 64 ■ A P R I L 1 9 9 8 13
To be sure, there are other indexes that capture som e aspects o f institutional developm ent.15 Yet, for the follow ing reasons, w e believe there is a need for a new index. First and forem ost, the alternatives are extrem ely restrictive in term s o f tim e coverage. Since none o f their indicators are available for years prior to 1971,16 none is able to capture the effects o f the substantial differences in either institutional orientation or econom ic growth between the 1960s and 1990s (e.g., the reversal in growth patterns that follow ed the oil shocks and the debt crisis).
Second, the available alternatives are incom plete in that they fail to consider w hat w e have called the “input side” o f the process. For instance, the indicators used by K nack and K eefer focus exclusively on the efficiency o f the provision o f public goods (an outcom e), but exclude im portant factors such as the choice o f the specific public goods to be provided and the way in w hich that choice is made. L ikew ise, the contract-intensive m oney m easure (CIM) of Clague, Keefer, K nack and O lson (1995) is perhaps too closely related to credit flows, financial interm ediation and investm ent to lend conviction to their argum ent that the causality goes from CIM to the rate o f growth.
Third, existing m easures have been subject to an im plicit selection bias in that country coverage has been restricted to countries where foreign investm ent is, o r has been, im portant. Only for such countries has there been sufficient incentive to invest in the developm ent o f the inform ation necessary for constructing such indicators,17
A fourth and final reason is m ethodological. S ince institutional developm ent is m ultidim ensional, any single index requires aggregation, the results of w hich m ay be sensitive to arbitrary choices o f weights. F or exam ple, M auro’s index of institutional
15 Such as those found in Scully (1988), Mauro (1995), Knack and Keefer (1995), Clague, Keefer, Knack and Olson (1995) and Gwartney, Lawson and Block (1996).16 Because they base their index on the widely available data on the components of the money supply, Clague, Keefer, Knack and Olson (1995) constitute a significant exception. In contrast, the Gastil indexes used by Scully start in 1973, and those used by Knack and Keefer (1995) only extend from 1972 on in some cases and from 1980 on in other cases. The indicators Mauro (1995) used, which come from Business International (now incorporated into The Economist Intelligence Unit), are available from 1971 on, and, finally, the indicator constructed by Gwartney, Lawson and Block (1996) is available only from 1975 on.17 For example, the set of indicators Mauro used for Latin America are available for Argentina, Chile and Mexico, but not for Bolivia.
efficiency was obtained by averaging nine indicators, thereby arbitrarily w eighting each o f them equally.18 Although the arbitrariness of weighting the individual com ponents o f the aggregate index can be reduced through the use o f principal components and other m ethods,19 m ost authors (except K nack and Keefer) have chosen not to use them, generally on the m istaken grounds that the underlying variables were highly correlated.
To overcom e the latter shortcom ing, the construction o f our CUD variable is based on the principal com ponents method.20 First, w e selected the eight indicators listed in table 1 (from Gurr, 1990) as the “underlying variables” o f the c i i d ,21 As noted in the table, these include both the com petitiveness and openness o f executive recruitm ent, constraints on chief executives, com petitiveness and regulation of participation, legislative effectiveness and selection, and lim itations on the econom ic scope o f governm ent actions. Each of these eight indicators is scored according to the coding indicated in table 1. Admittedly, for lack o f relevant indicators across countries and over time, this index m ay give short shrift to other com ponents o f w hat Trebilcock (1995) refers to as the “institutional m atrix” , such as the quality of both the bureaucracy and the legal system.
B ecause of the d ifferent scales used in these eight indicators, it is necessary first o f all to standardize their values, nex t to use the covariance m atrix as the starting point, and finally to equate the resulting index (CIID) to the value o f the “dom inant factor”
18 The Economic Freedom Index constructed by Gwartney, Lawson and Block (1996) has 17 components. These authors offer three versions of the index, each based on a different aggregation scheme. One gives equal weight to all 17, while the other two use survey responses of two different types -from “experts on economic freedom" and “experts on particular countries” to rank these 17 components over time.19 Another method used to construct composite indexes is the Borda ranking technique. See Thomas and Wang (1996) for a recent example of indexes of “distortions” and “interventions”, constructed using the Borda technique.20 One use of the principal components method is to identify a small number of “latent variables” in such a way as to retain as much information (variance) as possible from the original or underlying variables. For this purpose, it estimates linear combinations of these original variables, all orthogonal to each other (components), with the property that the components are “uncovered” in decreasing order according to the amount of the total variance in the original variables that they capture (Greene (1990), pp. 271-273).21 An advantage of these data is that they are non-proprietary and available from the Inter-University Consortium for Political and Social Research (ICPSR).
INSTITUTIONS AND GROWTH: CAN HUMAN CAPITAL BE A LINK? * NAURO CAMPOS AND JEFFREY B. NUGENT

1 4 C E P A L R E V I E W 6 4 * A P R I L 1 9 9 8
TABLE 1Variables underlying the CIID (codes)
Competitiveness of manner o f generation of the executive authorities
0 = power transfers not regulated1 = hereditary succession, designation or a combination of both2 = one executive is chosen by hereditary succession and the other by competitive
elections3 = selection is the result of a competitive election between two or more major parties or
candidates
Openness of executive generation 0 = power transfers not regulated1 = hereditary succession (closed)2 = hereditary succession plus executive or court selection of an effective chief minister3 = selection of an effective chief minister through elections4 = open recruitment process
Constraints on Chief Executive 1 = unlimited authority2 = (intermediate category)3 = slight to moderate limits on executive authority4 = (intermediate category)5 = substantial limitations6 = (intermediate category)7 = parity or subordination of the executive
Competitiveness of participation
1 = competition suppressed2 = restricted/transitional participation3 - factional competition4 - transitional competition5 = competitive
Regulation of participation 1 = unregulated participation2 = factional or transitional3 = factional/restricted4 - restricted5 = regulated participation
Legislative effectiveness 0 = no legislature exists1 = ineffective2 = partially ineffective3 = effective and independent of t(ie executive
Legislative selection 0 = no legislature exists1 = non-elective2 = elective
Scope of government actions 1 - totalitarian2 = (intermediate category)3 = segmental plus4 = (intermediate category)5 = segmental6 = (intermediate category)7 = segmental minus8 = (intermediate category)9 = minimal.
Source: Gurr (1990).
(i.e., the first com ponent). This yields a “set o f loadings’* for each individual country, used to generate a tim e series o f values o f Cltt) for the period 1960 to 1986,22 from w hich decade averages are derived.
Since the CUD is also based on subjective indicators constructed by G urr from different, country- specific secondary studies, the values o f the index are
22 On average, the first of the principal components captures70% of the variance.
m ore com parable across tim e than across countries. Not surprisingly, there is substantial variation in the index across countries at any particular tim e period. Yet there is also a surprising am ount o f variation over time: substantial increases between the 1960s and early 1980s in Brazil, Colom bia, Dom inican R epublic and Paraguay, substantial declines in Chile, Costa Rica, Jam aica, M exico, N icaragua and Uruguay, and substantial fluctuations in Bolivia, Ecuador, Guatemala, H onduras, Peru and El Salvador.
INSTITUTIONS AND GROWTH: CAN HUMAN CAPITAL BE A UNK? • NAURO CAMPOS AND JEFFREY B. NUGENT

C E P A L R E V I E W « 4 • A P R I L 1 9 9 8 15
IVThe impact of institutions on economic growth
In order to answer the question “D o institutions m atter?” , in this section w e add our index o f institutional developm ent ( c u d ) to an otherw ise standard Solow grow th m odel, and then use that m odel to explain variations in grow th rates across 19 Latin A m erican countries in the last three decades. The use o f the Solow m odel is m otivated prim arily by the fact that it contains a shift param eter that “reflects not ju st technology, but resource endow m ents, clim ate, institutions and so on” (M ankiw, R om er and W eil, 1992, pp. 410-411, italics added), thereby m aking explicit the link between institutions and econom ic growth. Additional advantages o f the Solow model in this context are: i) the com parisons it affords with the many other studies w hich use this fram ework, ii) its ability to test som e other im portant hypotheses such as (a) that incom e per capita should be positively related to savings and negatively related to population grow th rates, and (b) that countries converge to their steady-state levels o f incom e per capita, and iii) that it w orks especially w ell (with convergence properties fulfilled) in sam ples of relatively hom ogeneous countries like those o f Latin A m erica.23
The central piece in this m odel is, o f course, a production function with positive and diminishing marginal products and constant returns to scale. It relates output (Y) to a pair o f essential inputs, capital and labor (K and L), and to the shift param eter (A) representing either technology or institutions. I f the function is o f Cobb-D ouglas form , output in period t is:
( 1) Y=K?(AlLt),-a 0< a < 1
23 Several authors have found the Solow framework, at least in modified form, to be superior to the endogenous growth models. For example, Cardoso and Fishlow (1992) find an augmented version of the Solow model incorporating the external sector to be superior. Even among those who embrace the endogenous growth framework, there is open recognition that its “silence with respect to the underlying model" is an important shortcoming (De Gregorio, 1992, p. 69). Levine and Renelt (1992) provide evidence that the econometric results from endogenous growth studies tend not to be robust. Finally, it should be noted that we do not know of other studies on the role of institutions and economic growth that attempt to establish this relationship from a standard theoretical framework.
It is assum ed that the technological or institutional progress is labour-augm enting and that the rates o f growth of population (n), technological or institutional progress (g) and depreciation (8) are constant and exogenous for any period.24 I f k is the capital-labour ratio and y is incom e per worker, the assum ptions about the growth of population and technology imply that, in the steady state (i.e., when the various quantities grow at constant rates), kt would converge (for sm all values o f n, g and 8) to a value k* given by:
(2) k* = [n + g + 8
Substituting (2) into the production function and taking logs, the steady-state incom e per worker becomes:(3)
, r t t 1 j aln[~—] = In A0 +gt + -------L, 1 - a
a- ln(s) -----------ln(n -l- g + 8 )
1 - a
This yields the well-know n hypotheses o f the Solow model: the higher the rate o f saving, the richer the country; and the higher the rates o f population growth, labour-augm ented technological change and depreciation, the poorer the country.
The m odel not only predicts that incom e per capita in each different country will converge to its steady-state value, but also yields estim ates o f the speed at w hich this convergence occurs. L et y* be the steady-state level o f incom e per worker from (3), and
be the actual value at tim e t. In the neighbourhood o f the steady state, an approxim ation o f the speed o f convergence p is given by:
(4)
where
d t a ( y , )
d t
ß = - (n+g+S) (1 -a ).
24 See also Dixit (1976), Artus (1993), and Barro and Sala-i- Martin (1995).
INSTITUTIONS AND GROWTH: CAN HUMAN CAPITAL BE A UNK? • NAURO CAMPOS AND JEFFREY B. NUGENT

16 C E P A L R E V I E W 64 • A P R I L 1 B 9 8
I t should be noted that the speed o f convergence depends on the determ inants o f the steady state as well as on the level o f incom e per worker at the beginning o f the period.25
T here are good reasons to expect that this m odel w ould perform better w hen tested for samples that are relatively hom ogeneous (in the steady-state sense). F o r exam ple, M ankiw, R om er and Weil (1992) obtain quite different param eter estim ates for countries o f the O rganization for Econom ic Cooperation and D evelopm ent (OECD) than for non-oil exporting LDCs, They found evidence o f “unconditional convergence” am ong the OECD countries,26 but little or no such evidence for their larger -a n d m uch less hom ogeneous- sam ples. Since our sam ple is lim ited to L atin A m erican countries, this fram ework w ould seem quite appropriate for beginning our investigation o f the im pact o f institutional developm ent.
O ur first step is to assess the specification given in M ankiw , R om er and W eil (1992). They assum e that g and 5 are constant across countries (because the technology frontier is universal and data on country-specific depreciation rates are not available) and take the values 2% and 3%, respectively.27 They also assum e that the effects o f population growth (n) and savings (i) are independent o f country-specific factors (captured by the stochastic term), thereby justify ing ordinary least squares estim ation. The M ankiw, R om er and W eil specification therefore requires that a coefficient for initial incom es [from (4)], a constant, and a stochastic term should all be added to equation (3) above. This specification also assum es that the production function is the sam e across countries and over tim e. Table 2 shows the results for
25 The concept of conditional convergence does not imply any tendency for the dispersion (or variance) of per capita incomes to decrease (the latter is often referred to as o convergence) (Barro and Sala-i-Martin, 1995, pp. 383-387).26 The importance of homogeneous samples can be appreciated from the fact that Barro and Sala-i-Martin (1995) {»resent similar findings (unconditional convergence) for the states of the U.S.A., regions within Europe, and prefectures in Japan.27 This is obviously a very strong assumption, as correctlypointed out by Srinivasan (1994, p. 271). Yet, since this is notdirectly relevant to our present purposes, and for convenience,the same assumption is made here. Helliwell discusses studies that use different values of g, thus giving international transferso f knowledge a key role to play in the convergence process (Srinivasan, 1994, p. 237). See also Goldman, Kato and Mui (1991).
TABLE2
Latin America (19 countries):Tests for conditional convergencea(Dependent variable: log difference o f GDP per working age person, 1960-1985)
Constant 2.409 2.259(2.266) (1.980)
Ln (YGO) -0.455 -0.438(-3.965) (-3.553)
Ln (I/GDP) 0.492 0.5333(3.216) (2.942)
Ln (n+g+5) 0.054 0.051(0.725) (0.667)
Ln (SCHOOL) -0.014(-0.460)
Adjusted R2 0.55 0.53Observations 19 19
Source: Data taken from Mankiw, Romer and Weil, 1992. a r-statistics are in parentheses. YGO is GDP per working-age
person in 1960.Investment (I/GDP) and population growth (n ) are averages for 1960-1985.(g+8) is assumed to be 5%. SCHOOL is the average percentage of the relevant working-age population enrolled in secondary school in 1960-1985.
the specification, obtained w ith the use o f their data for Latin Am erica.28
In general, this specification fits the data quite well. T he adjusted R 2 is only slightly sm aller than the one obtained by M ankiw, R om er and W eil (1992) for their sub-sam ple o f 22 OECD countries (0.65). This seems to support our claim that Latin A m erica may be m ore hom ogeneous (in term s o f determ inants o f the steady state) than the w orld as a w hole or even A sia or A frica alone. In other im portant respects, however, the results are m ixed.29 On the one hand,
28 The sample is the same set of 19 countries referred to in table 2. It should be noted that for none of these Latin American countries was the quality of the data used as low as the “D” rating of the Penn World Tables, Mark 5.6 (which is reserved for data based on extremely scarce primary sources and considered to be of inferior quality).29 The small sample size may also adversely affect these results. Nevertheless, problems are common in growth studies which include human capital, as is well documented by Benhabib and Spiegel (1994) and Pritchett (1996).
INSTITUTIONS AND GROWTH: CAN HUMAN CAPITAL BE A LINK? • NAURO CAMPOS AND JEFFREY B. NUGENT

C E P A L R E V I E W 64 * A P R I L 1 9 9 8 17
the convergence and the investm ent coefficients both have the expected signs and are significant. O n the other, the coefficients for hum an capital and grow th o f population have the “w rong” signs, although neither is significantly different from zero.30
To help overcom e these shortcom ings in the application o f the m odel to Latin A m erica w e have m ade the follow ing m odifications: i) the inclusion of a tim e-dim ension by separating the cross-sections by decades (1960s, 1970s and 1980s); ii) the use of a better proxy for hum an capital,31 and iii) the introduction o f our com parative index o f institutional developm ent ( c i id ) .
A central issue in the use of panel data is how to deal w ith heterogeneity of the data and, consequently, w ith the choice o f estim ation procedure. In our case, heterogeneity is treated in part by the introduction o f decade dum m y variables, im plying the use o f the fixed effects m ethod (Hsiao, 1986). In the present context, use o f this m ethod implies that, although the underly ing production function is the sam e for each country, it m ay differ over tim e.32 As noted above, w e believe the experience o f the countries in the region to be relatively hom ogeneous, although their perform ance during the 1980s (“ the lost decade”) was in stark contrast to that o f previous decades.33 Two other reasons for the choice o f the fixed effects m ethod are that it perm its com parison w ith previous studies and tha t it facilitates the use of a sim ultaneous equations approach.
O ur next step is to assess the way in w hich the M ankiw, R om er and W eil (1992) specification from table 2 w ould behave w ith the above m odifications in
30 These last two results (on human capital and population) are very important because they could constitute a case against the use of the Solow model for this particular region. This would not be so, however, if in fact education has been characterized by over-investment in higher education and/or inefficient allocation of resources. These possibilities suggest the need for better measures of educational investment in the labour force than gross enrollment rates. In addition to the usual shortcomings, gross enrollment data are particularly problematic for Latin America. Morley shows that, between 1986 and 1989, Brazil failed to graduate 78% of those who entered primary school, Guatemala 64%, Honduras 57%, and Bolivia 50% (Morley, 1995, p. 60 et. seq.).31 We chose to use the Barro and Lee (1993) data and to define human capital as the average years of schooling of the population over 25 years of age. The other comparable option would be the Nehru et al. data set, but two of the countries in our sample (Guatemala and Dominican Republic) are not covered by it.
the hum an capital m easure, the inclusion o f dum m y variables for the 1970s and 1980s (to reflect changes in the production function over time), and subsequently the inclusion o f the c i id . The data sources and descriptive statistics are presented in table 3 and the results in table 4.
The specifications in the first three colum ns o f table 4 test for unconditional convergence (column 1), and for conditional convergence in the basic version o f the Solow m odel (colum n 2) and in the hum an capital-augm ented version (colum n 3).
It should be noted that the coefficients for convergence (initial income, In YÔ), the dummy variable for the 1980s in all three colum ns, and the share of investm ent as a proportion o f g d p (In I /g d p ) in columns (2) and (3) are significant and o f the expected sign. These results are quite robust since they obtain regardless o f subsequent changes in specification.
W ith respect to the coefficients on population (In n+ g+ S) and growth o f hum an capital ( h k g r o w t h ) ,
our results only m arginally im prove upon the ones in table 2 (i.e., those obtained with the data and specification of Mankiw, R om er and Weil, 1992). A lthough the coefficients on population and human capital are not significant, at least they have the expected signs (and for human capital this holds irrespective o f the specification).
Beginning with colum n (4), the results reflect the inclusion o f our index o f institutional developm ent (In CUD). Its inclusion raises the value o f the adjusted R 2, and its coefficient is positive and significant. Even when investm ent is excluded from the m odel, as shown in colum n (5), the coefficient o f c i i d rem ains positive and significant. M ore im portantly, it should be noted that in colum n (6), when w e
32 To evaluate this assumption that the production function is the same across countries, but differs over time, we reestimated all the specifications below using a random-effects estimator, the Fuller-Battese error components model. The results (available from the authors on request) are very similar to the ones presented below (using a fixed effects estimator) and, therefore, the assumption seems to be a reasonable one to maintain.33 See Fishlow (1991), Cardoso and Fishtow (1992), and Edwards (1995).
INSTITUTIONS AND GROWTH: CAN HUMAN CAPITAL BE A LINK? • NAURO CAMPOS AND JEFFREY B. NUGENT

18 C E P A L R E V I E W 64 • A P R I L 1 6 9 6
Descriptive statistics and data sourcesTABLE 3
Mean Std Dev Minimum Maximum Source
Growth rate of real per capita G D P 8 1.28 2.34 -3.48 6.85 Summers and Heston, 1994Growth rate of population8 2.42 0.7418 0.3209 3.75 Summers and Heston, 1994Average rate of investment 16.0721 4.8688 7.18 28.47 Summers and Heston, 1994Log of real per capita GDP at start of decade 7.8253 0.5072 6.9412 8.9539 Summers and Heston, 1994Population at start of decade 14,102 23,716 1,145 121,286 Summers and Heston, 1994Comparative index of institutional development 1.6115 0.7347 0.0263 2.8822 Own calculationsGrowth rate of stock of human capital 1.8592 1.2538 0.1152 5.3756 Barro and Lee (1993)Human capital at start of decade Ratio of public expenditure on tertiary
3.5758 1.2806 1.1550 6.6300 Barro and Lee (1993)
education to primary p lus secondary 0.3222 0.2069 0.0303 1.4000 UNESCO, Statistical Yearbook, various issues
Gini coefficient for land holdings 0.8503 0.0603 0.6940 0.9400 Persson and Tabellini (1992) Adelman and Fuwa (1994)
Black market exchange premium 0.3121 0.4965 - 2.9550 Barro and Lee (1993)Civil liberties 3.0818 1.7301 0.5000 6.0000 Barro and Lee (1993)Revolutions 0.2175 0.3191 - 1.3 Barro and Lee (1993)Coups d ’EtatCoefficient of variation of growth of real
0.0713 0.1143 - 0.4000 Barro and Lee (1993)
per capita GDP 1.0881 0.4877 0.3294 2.7063 Summers y Heston, 1994Rate of change of labour force in agriculture -1.545 1.066 -4.700 0.624 FAO, Production Yearbook,
various issues
8 By the ordinary least squares method.
TABLE 4OLS (ordinary least squares) results,a based on Solow and Manklw, Romer and Weil(Dependent variable is OLS growth o f real per capita GDP; number o f observations is 57 = 3 x 19)
(1) (2) (3) (4) (5) (6)
Constant 0.408 b 0.208784 0.181036 0.33565 0.41494 d 0.290241(2.866) (0.966) (0.811) (1.629) (1.904) (1.449)
In (Y0) -0.0497 c -0.0489 c -0.0466 e -0.064 b -0.0621 b -0.0614 b(-2.574) (-2.613) (-2.416) (-3.497) (-3.172) (-3.474)
In (I/GDP) 0.02445 e 0.0237 c 0.0262 c 0.024477(2.101) (2.008) (2.423) (2.343)
In (n+g+8) -0.047432 -0.051800 -0.03696 -0.031783 -0.04685(-0.823) (-0.883) (-0.691) (-0.555) (-0.903)
HKGROWTH 0.001249 0.003686(0.595) (1.836)
In (CIID) 0.0077 e 0.00732 c 0.0099 b(2.564) (2.260) (3.159)
Adjusted R2 0.5152 0.5528 0.5439 0.6174 0.5609 0.6438
a Numbers in parentheses are r-statistics. (YO) is per capita GDP at the beginning of the decade. Population growth (n) is the OLS growth rate, per decade. I/GDP is average investment rate per decade. Following Mankiw, Romer and Weil (1992), (g+S) is assumed to be 5%.HKGROWTH is the rate of change in average years of schooling of the population over 25 years of age (fromBarro and Lee, 1993). CIID is the authors’ index of institutional development, b Significant at the 1% level. c Significant at the 5% level. d Significant at the 10% level.
INSTITUTIONS AND GROWTH: CAN HUMAN CAPITAL BE A UNK? • NAURO CAMPOS AND JEFFREY B. NUGENT

C E P A L R E V I E W 64 • A P R I L 1 9 9 8 19
include our hum an capital variable ( h k g r o w t h ) , the coefficients o f both institutions and human capital are now positive and significant, whereas, before, the effect o f hum an capital alone was not significant.34 One possible explanation lies in the possibility that, if le ft unchecked by appropriate institutions, those w ith m ore hum an capital may be m otivated to take advantage o f rent-seeking opportunities, thus im plying that hum an capital accum ulation m ay be counterproductive to econom ic growth. O n the other hand, w ith appropriate institutions, the incentives for rent- seeking activities m ay be reduced and those for productive activities increased, thereby raising the attainable rate o f econom ic growth (M urphy, Schleifer and Vishny, 1991).35
W e believe this to be our m ost m eaningful finding, nam ely, tha t only after the c u d is included does the effect o f hum an capital becom e positive and significant.36 In contrast w ith existing studies w hich em phasize a nexus between institutional developm ent and per capita incom e growth operating through physical capital accum ulation, these results suggest that a sim ilar nexus operating through hum an capital form ation m ay be stronger.
Given that the CUD is itself a very specific aggregation of the eigh t individual indicators (shown in table 1), a question w hich arises naturally in such a situation is w hether the aggregate CDD perform s better, w orse or the sam e as its individual com ponents.
Notably, however, the aggregate index has a level o f significance exceeding that o f any individual com ponent alone.37
Judging by the values o f the adjusted coefficient o f determ ination and the robustness o f the results, the preferred specification is that in column (6). N ote that the value o f adjusted R2 is 0.61, which is quite com parable to that obtained by Mankiw, R om er and W eil (1992) for their o e c d sam ple (with a reported adjusted R2 o f 0.65) and considerably h igher than the values they obtained for their LDC samples (adjusted R 2 o f 0.46).38
The coefficients o f initial incom e (convergence), investment, and the dum m y variables for the 1980s have the expected signs and rem ain highly significant across the different specifications. Indeed, their significance is raised slightly by the inclusion o f the CUD and the accum ulation of hum an capital. O ur results w ith respect to the CUD strongly suggest that institutional developm ent should be considered am ong the variables w hich have to be controlled in explaining the continent’s postw ar growth experience. Institutions do m atter for econom ic grow th and w hen both the c i i d and human capita] appear in the same equation, the explanatory pow er and significance of each is increased. This suggests the existence o f an im portant and hitherto neglected nexus between institutions and growth as m easured through hum an capital.
34 In order to further explore the relationship between human capital and institutional development, various interaction terms and non-linearities were introduced, taking us farther from the Cobb-Douglas form and closer to the translog form (Lau, 1996). Yet, as discussed in an earlier version of the paper, the introduction of quadratic terms for CIID and HKGROWTH and a CllD- HKGROWTH interaction term failed to increase the explanatory power or to alter the other results significantly. For this reason, such results are not presented here (they are available from the authors on request).35 Another interesting possibility is provided by Azariadis and Drazen (1990) who formalize the Bowman-Anderson-Easterl in argument that there ate threshold externalities associated with the accumulation of human capital: that is to say, that economic growth should be correlated with human investment relative to per capita income, with high rates of growth being associated with the prior attainment of especially high levels of human investment relative to per capita income (Azariadis and Drazen, 1990, p. 519). See Behrman (1993) for the relevance of these considerations in the Latin American context. It should be noted that the recent empirical literature incorporates this possibility, albeit indirectly, by preferring to use secondary education enrollment data as a proxy for human capital.
36 While the accumulation of human capital is also a central concern of some contributors to the endogenous growth literature (Barro and Sala-i-Martin, 1995; IDB, 1993, and Behrman,1995), the reasons and mechanisms they put forward are very different from those given here.37 In a previous version of this paper, we presented results of a comparison between our aggregate index (CIID) and its individual components (listed in table 1). Instead of the CIID, we included all its individual components in the specification in column (6) of table 5. We observed that none of these coefficients was “more significant” than the coefficient of the CIID itself. Also, using the components instead of the CIID generates a lower adjusted R2. These results are available from the authors upon request.
Notice, however, that our results differ from those of Mankiw, Romer and Weil (1992) in that theirs are from a cross- section of countries.
INSTITUTIONS AND GROWTH: CAN HUMAN CAPITAL BE A LINK? • NAURO CAMPOS AND JEFFREY B. NUGENT

What explains institutional development?
H aving established that institutions do indeed m atter (with respect to econom ic growth), it becom es importan t to further exam ine both how this role is p layed and the direction o f causality. These are the objectives o f the present section.
In order to identify the factors that account for differences in institutional developm ent, we face two challenges: the lack o f a rigorous theoretical model, and the corresponding paucity o f relevant em pirical exercises. W hile, as indicated above, there is a substantial literature on the im pact o f institutional variables on econom ic growth,39 there is m uch less on the im pacts o f econom ic growth on institutional developm ent. Three fine exceptions40 to this assertion are a) an article by B ilson (1982) explaining variations in the G astil index o f civil liberties across 55 countries in 1979, b) a paper by Helliwell (1994) evaluating the two-way linkages between democracy and growth for a panel o f 125 countries for the years 1960-1985, and c) a paper by Porter and Scully (1995) explaining two- way feedbacks betw een econom ic growth and constitutional changes.
Although the Bilson study on civil liberties used seven important explanatory variables,41 only two (namely, per capita real income and the ratio of wages and salary payments to GNP), turned out to
39 The best examples arc Scully (1988), Knack and Keefer (1995), and Mauro (1995).40We selectively emphasize the contributions which had the greatest impact in the economics literature. It should be clear, however, that there are a number of political science studies that should also be considered. In this vein, see Burkhart and Lewis- Beck (1994) and the references therein.41 These were (1) the level of real income per capita (expectedto have a positive sign), (2) the size of the country proxied by its population), (3) the ratio of exports to GNP (positive effect), (4) the ratio of central government expenditure to GNP, (5) the ratio of agricultural income to GNP (both (4) and (5) having effects of ambiguous direction), (6) the ratio of wages and salary payments to GNP (expected to have a positive effect because a “high labour/income ratio is typically associated with a skilled and literate work force and with a relatively even distribution of income” (Bilson, 1982, p. 105), and (7) the growth rate of per capita GNP over the period 1970 to 1976 (expected to have a negative effect due to the fact that, according to Olson, “rapid economic growth is a disruptive and destabilizing force that leads to political instability” (quoted in Bilson, 1982, p. 106).
have effects significantly different from zero. Both had the “w rong” signs, however.
Helliwell (1994), on the other hand, com bined G astirs civil liberties and political rights indexes into a m easure o f dem ocracy, and pooled data on 125 countries for the period 1960-1985 to evaluate the two-way linkages betw een dem ocracy and growth. His m ain findings w ere that the level o f incom e per capita and secondary school enrollm ent both have positive and significant effects on the level o f dem ocracy, and that the degree o f dem ocracy is significantly higher in the OECD countries, significantly low er in six oil-dependent countries o f the M iddle- East, slightly low er in Africa and slightly higher in Latin A m erica than in the rem aining countries o f Eastern Europe and A sia (Helliwell, 1994, p. 228). He also finds that the d irect effect o f dem ocracy on growth is negative, but that its indirect effect (through education and investment) is positive and som ew hat stronger.
Porter and Scully (1995) explain how the needs to offset the dim inishing returns to factor accum ulation in the neoclassical growth model give rise to attem pts in the political m arket to change the “rule space” . A lthough these authors stop short o f a full- fledged attem pt to apply such a m odel em pirically, they illustrate its application by the need to m ake national m arkets m ore efficient in the nineteenth- century U nited States. This need was realized through the federalization, and hence harm onization, o f many state and local rules and regulations and was reflected in the acceleration o f new legislation. U nder certain conditions (including the efficiency o f the political allocation o f rights: an idea very close to the spirit o f the CUD in this paper), the allocation of rights and obligations through such rule changes can be o f lower cost than that effected through private contracts and transactions.
In this light, our approach to the identification of the determ inants o f institutional developm ent starts by devising three classes o f variables, namely, initial conditions; structural variables; and the following other direct determ inants o f the c u d : G astirs index of civil liberties (c iv l ib ), the interaction between the
INSTITUTIONS AND GROWTH: CAN HUMAN CAPITAL BE A UNK? • NAURO CAMPOS AND JEFFREY B. NUGENT

C E P A L R E V I E W 64 • A P R I L 1 9 9 8 21
average num ber o f revolutions and coups d ’eta t per decade (REVCOUP) and the b lack m arket exchange rate prem ium (BMP), the latter being a proxy for overall econom ic distortions. O ur expectation is that the effects on the cnD o f the first tw o variables w ould be positive and that o f b m p negative. For initial conditions, w e include the beginning-of-decade levels o f population (POP 0), hum an capital (HK 0) and real per capita GDP (In YO). O ur expectation is that the effects on the CUD o f the first variable w ould be negative and the latter two positive. Finally, as structural variables, w e include the percentage o f the la bour force w orking in agriculture ( p c t c g a g ) , the Gini coefficient for land ownership (GiniLand), the ratio o f public expenditures on tertiary education to public expenditures on prim ary and secondary education ( i n e q t PS),42 and dum m y variables for the 1970s and 1980s (D VM 70 and DUM80, respectively). W e expect the direction o f the effects on the CIID to be negative in the first three cases and am biguous in the latter two. Interaction term s betw een som e o f these structural variables were also introduced.
Although the results presented in table 5 are exploratory and should therefore be interpreted carefully, they are not w ithout interest. Colum n (1) o f table 6 gives our initial results for the CUD, based on the first four variables m entioned above plus the dum m y variables for the 1970s and 1980s, A lthough all coefficients have the expected signs, only one o f them (BMP) turns out to be statistically significant. The level o f overall econom ic distortions seem s to be a pow erful hindrance to the establishm ent o f a sound institutional fram ework.
A s shown in colum n (2), introducing the initial condition variables does not im prove the results. I t is noteworthy that the effect o f b m p is still negative and significant, and that the level o f hum an capital turns out to be positively related to the level o f institutional developm ent. The three rem aining structural variables are introduced in the specification shown in colum n (3). It should be noted that, w hile all have
42 It is quite well documented for Latin America that the distribution of human capital is one of the major causes of the persistently high income inequality (Behrman, 1993; Londoflo, 1995; Morley, 1995; Berry, 1996). Further, data availability across countries and over time was a crucial factor in the choice of using the determinants instead of using the income distribution data directly. For instance, these data are not available for Bolivia for all three decades covered by this study (Deininger and Squire, 1996).
their expected negative signs, none is significant.43 It m ay also be noted that all previous results, including the significantly negative effect o f b m p on institutional developm ent, are essentially unaffected by the introduction of these term s.44
G iven the aforem entioned relevance o f incom e inequality in general and rent-seeking in particular to our c u d m easure, the lack o f significance o f som e o f our inequality-related structural variables (INEQT -p s) is som ew hat disconcerting. Yet, since the effects o f these variables need not be independent o f each other, in the specification given in colum n (4) we include an interaction term between them . N ote that the sign o f the interaction term turns ou t to be positive (suggesting a reinforcing effect), but m ore im portantly, that the introduction o f this term raises the absolute value o f the negative coefficients as well as the significance o f the two separate types o f inequality. Finally, note that the inclusion o f this interaction term also raises the significance levels o f BMP.
T he above results allow us to identify som e factors contributing to the observed intertem poral and intercountry variations in our index o f institutional development. W e see that policy distortions and inequalities are the m ain determ inants o f that index. It is som ew hat surprising to note that the initial conditions play quite an insignificant role. The estim ates shown in colum n (5) are deem ed best and serve as the basis for endogenizing the cnD. Yet, the possibility o f sim ultaneous equation bias (to the extent that the cnD is really endogenous in the growth equation) raises issues concerning the direction o f causality.
Table 6 presents the results o f our efforts to rem ove th is possible source o f bias and to see how m uch difference doing so makes: w e recalculated the production function, using the predicted values o f the CIID given by the previous analysis.
Colum n (1) o f table 6 shows the results for the per capita incom e growth rate obtained by the two- stage least squares method, substituting the predicted value of CIID (from colum n 2) for its actual value in
43 The results are not changed if we include each determinant one at a time or if, instead of the interaction terms, we use revolutions and coups separately.44 W e also experimented with other structural variables, but the results were similarly unsatisfactory. These variables included urbanization, the size of the middle class (third quintile in the income distribution), levels instead of rate of change of the labour force in agriculture, and the ratio of public expenditure on tertiary education to that on primary education (instead of primary and secondary).
INSTITUTIONS AND GROWTH: CAN HUMAN CAPITAL BE A LINK? • NAURO CAMPOS AND JEFFREY B. NUGENT

2 2 C E P A L R E V I E W 64 ■ A P R I L 1 9 9 8
TABLE5
OLS (ordinary least squares) estimation results for the CIID equation8(Dependent variable is log o f CIID; number o f observations is 57 = 3 x 19)
0 ) (2) (3) (4) (5)
Constant 0.508802 -10.997943 -7.130958 0.253676 2.06081(0.943) (-1.520) (-0.992) (0.033) (0.267)
BMP -0.8207 b -0.715945 c -0.767 b -0.80655 b -0.78124(-3.118) (-2.674) (-2.982) (-3.306) (-3.154)
CIVLIB 0.175158 0.038966 0.001829 0.048117 0.124254(1.407) (0.273) (0.013) (0.364) (0.979)
REVCOUP -2.349367 -2.760597 -2.795151 -2.67501(-1.331) (-1.567) (-1.673) (-1.693)
In (YO) 1.362371 1.68551d 1.585619 d 1.399613(1.401) (1.769) (1.758) (1.537)
POP 0 -0.0000038 0.0000079 -0.000011 -0.000016(-1.174) (0.369) (-0.491) (-0.460)
HK 0 0.557943 0.67181 d 0.295608 0.214968(1.414) (1.721) (0.717) (0.527)
INEQT_PS 0.091166 -27.99896 d -29.426 c(0.124) (-2.044) (-2.123)
GiniLand -0.0821 c -0.14271 b -0.147 b(-2.429) (-3.280) (-3.350)
PCTCHGAG -0.896798 -0.63082(-0.696) (-0.515)
INEQT J>S x GiniLand 0.318286d 0.3339 c(2.053) (2.129)
Adjusted R2 0.0638 0.0841 0.1836 0.2704 0.2443
4 Numbers in parentheses are t-statisties. CIID is the authors’ index of institutional development.BMP is the black market exchange rate premium. CIVL1B is Gastil’s index of civil liberties.REVCOUP is the average number o f revolutions times the average number of coups d ’Etat, per decade.(YO) is the real per capita GDP at the beginning of the decade.HK 0 is the average number of years of schooling of the population over 25 years of age, at start of decade. POP 0 is the population at start of decade. GiniLand is the Gini coefficient for land ownership.INEQT_PS is the ratio of public expenditure on tertiary education to public expenditure on primary and secondary education. PCTCHGAG is the rate of change of the percentage of the labour force working in agriculture.
b Significant at the 1 % level. c Significant at the 5% level. d Significant at the 10% level.
the growth equation. I t should be noted that when this is done, all the previous results rem ain valid. In addition, the significance o f both institutional developm ent and the accum ulation o f hum an capital are increased.
Given the possibility that these results obtain because the initial level o f hum an capital is am ong the
first-stage determinants o f the c i id , in colum n (3) o f table 6 w e show the two-stage least squares estimates o f the param eters of the growth equation obtained after excluding the initial conditions variables from the c i i d equation. The results for this stream lined c i id equation are given in colum n (4). As can be seen, this change does not alter the results obtained earlier.
INSTITUTIONS AND GROWTH: CAN HUMAN CAPITAL BE A UNK? * NAURO CAMPOS AND JEFFREY B. NUGENT

C E P A L R E V I E W « 4 * A P R I L 1 9 8 8 23
TABLE 6
2SLS {two-stage least squares) estimation results a(Number o f observations is 57 = 3 x 19)
Per capita GDP growth
(1)
CUD
(2)
Per capita GDP growth
(3)
CUD
(4)
Constant 0.231133 12.954153b 0.305327 2.060810(1.132) (3,564) (1.478) (0.267)
In (YO) -0.055116 b -0.068274 b 1.399613(-3.089) (-3.578) (1.537)
In(I/GDP) 0.020837 c 0.021503 d(1.927) (2.008)
In (n+g+5) -0.054306 -0.062904(-1.016) (-1.183)
HKGROWTH 0.004590 0 0.004536 d(2.026) (2.033)
In (COD) 0.013326 c 0.013377 b(2.738) (2.792)
BMP -0.841141 b -0.781242 b(-3.509) (-3.154)
CIVLIB 0.199194 d 0.124254(1.850) (0.979)
INEQTJ>S -32.253824 c -29.424568 c(-2.714) (-2.123)
GiniLand -0.147159 b -0.147273 b(-3,504) (-3.350)
INEQT„PS x GiniLand 0.364231 c 0.333876 c(2.717) (2.129)
HKO 0.214968(0.527)
FOPO -0.000010488(-0.460)
Adjusted R2 0.6216 0.2519 0.6266 0.2443
a Numbers in parentheses are i-statistics. The CUD equation in column (3) does not contain initial conditions variables (i.e., In YO, HK 0, and POP 0).
b Significant at the 1% level. c Significant at the 5% level. d Significant at the 10% level.
VIConclusions and suggestions for further research
W e believe that we have been able to advance under- tional developm ent the sam e attention as the “outputstanding o f the determ inants o f per capita growth by side” , this turns out to have a robust, positive andbringing institutional developm ent explicitly into an significant effect on the rate o f per capita incom eotherw ise standard growth m odel. In particular, when growth across countries and over time. W e believeinstitutional developm ent is defined (as in our c u d ) that this index is relevant for econom ic growth be-in such a way as to give the “input side” o f institu- cause o f the greater “stake in the system ” that indi-
INSTTTimONS AND GROWTH; CAN HUMAN CAPITAL BE A LINK? • NAURO CAMPOS AND JEFFREY B. NUGENT

24 C E P A L R E V I E W 6 4 • A P R I L 1 9 6 8
viduals w ould be likely to feel in countries and tim e periods characterized bv high levels o f c i id . W ith such high values o f the cnD, the opportunities for rent-seeking w ould seem to be reduced, thereby raising the incentive for the efficiency-enhancing exercise o f “m aking one’s voice heard” and causing greater energies to be devoted to productive econom ic activities.
M oreover, the fact that the cnD index displays considerable variation not only across countries but also over tim e suggests that the relevant institutions for econom ic growth are not as fixed as they are generally perceived to be. This calls attention to the possibility that institutions (as opposed to policies) could deliberately be changed in ways that w ould raise the overall rate o f econom ic growth. M oreover, since an im portant reason for the positive influence o f the c i i d on econom ic growth is due to the reduction in opportunities for rent-seeking caused by the fact that m ore people feel they have a “stake” in the system, the positive influence o f institutional developm ent on growth need not occur at the expense of greater incom e inequality.
A nother and perhaps even m ore im portant finding concerns the identity o f the link between institutional developm ent and econom ic growth. Both the positive effect o f the level o f hum an capital on our institutional developm ent index ( c i id ) and the fact that both the m agnitude and significance o f the effect o f hum an capital growth on per capita incom e growth are raised by the inclusion o f the influence o f the c u d
on growth suggest that hum an capital could constitute an im portant link by w hich institutions affect growth.45 W hile this need not refute the relevance of physical capital form ation as another link between institutions and developm ent, given the virtually exclusive attention that has been given to the physical
45 Since the CIID and rent-seeking should be negatively correlated, the finding of a significant negative effect of human capital growth on CIID appears to support Pritchett’s conjecture that “the institutional environment in many countries has been sufficiently perverse that accumulated human capital has no effect on, or even has lowered, economic growth even though the returns to schooling have been substantial because schooling has facilitated rent-seeking” (Pritchett, 1996, p. 33). See also the important work of Murphy, Schleifer and Vishny (1991), discussed earlier.
capital link in the existing property rights literature, this is an im portant finding. A t a minimum, greater attention should be given in future research to the triadic relationship between institutions, hum an capital and real per capita incom e growth. A t a maxim um , this w ould suggest the genuine im portance of identifying policies which w ould increase both hum an capital and the CIID and thereby raise the attainable rate o f econom ic growth.
Our growth analysis also demonstrates that, when the sam ple is lim ited to countries which are relatively hom ogeneous, considerable support is provided for the findings o f unconditional and conditional convergence and the effect o f the investm ent rate on the rate o f econom ic growth. All o f the relevant m easures for these variables w ere found to have the expected signs and to be statistically significant, especially w hen the sim ultaneous equation bias is elim inated. Hence, in the latter respects the results also confirm the findings o f previous studies, suggesting the relevance of physical capital investm ent and conditional convergence, after controlling for a num ber o f variables that now include institutional developm ent.
O ur analysis o f institutional developm ent dem onstrated that the c i i d responds negatively to the overall level o f distortions in the economy (represented by b m p ), and inequality in educational expenditures or land ownership. These findings seem to support our interpretation o f the COD as a m easure of institutional developm ent that reflects “stake in the econom ic system” and is therefore o f d irect relevance to the rate o f econom ic growth rather than to political dem ocracy as it m ight at first sight seem.
O ur suggestions for future research are the following:
i) Priority should be given in future research to analysis o f the triadic relationship between institutions, human capital and econom ic growth. This may be particularly im portant in the context o f Latin Am erica, because o f s ubstantial evidence that the average level o f education is distorted (tow ard types which yield high private rates o f return, due to opportunities for rent-seeking, but low social rates of return).
ii) G iven the relatively low value o f the adjusted R 2 in the equation for the COD, a second priority for future research should be given to the introduction of additional variables w hich w ould increase the explanatory pow er o f the m odel w ithout increasing its com plexity unnecessarily.
INSTITUTIONS AND GROWTH: CAN HUMAN CAPITAL BE A LINK? • NAURO CAMPOS AND JEFFREY B. NUGENT

C E P A L R E V I E W 6 4 • A P R I L 1 9 9 8 25
iii) I t w ould be valuable to investigate different lag structures in order to provide additional insights into the direction o f causality.
iv) A nother im portant extension o f these models w ould be to improve some o f the measures used as explanatory variables. Candidates for improvement would include the human capital measure (for example, by the inclusion o f health indicators) and the C1ID itself (by including aspects related to the bureaucracy and judiciary).
v) Finally, once the aforem entioned extensions and im provem ents are carried out for Latin America, for which the relevant data for com puting the CUD
and hum an capital are m ore readily available and the hom ogeneity problem s are som ew hat less severe than in other regions, it w ould be highly desirable to extend the analysis to other regions such as Sub-Saharan Africa and Asia.
(Original: English)
Bibliography
Abramovitz, M. and P. David (1996): Convergence and deferred catch-up: Productivity leadership and the waning of American exceptionalism, in R. Landau, T. Taylor and G. Wright (eds.), The Mosaic o f Economic Growth, Palo Alto, CA, Stanford University Press.
Adelman, I. and C. Morris (1989): Nineteenth-century development experience and lessons for today, World Development, vol. 17, No. 9, special issue, Oxford, U. K., Pergamon Press, September.
Adelman, I. and N. Fuwa (1994): Income inequality and development: The 1970s and 1980s compared, Economie Appliquée, vol. 46, No. 1, Paris, Editions Droz, S. A.
Alesina, A. and R. Perotti (1992): The political economy o f growth: A critical survey o f the recent literature and some new results, Discussion Paper No. 626, New York, Columbia University.
Artus, P. (1993): Théorie de la croissance et des fluctuations, Paris, Presses Universitaires de France.
Azariadis, C. and A. Drazen (1990): Threshold externalities in economic development, Quarterly Journal o f Economics, vol. 105, No. 2, Cambridge, MA, MIT Press.
Bardhan, P. (1996): The nature o f institutional impediments to economic development, Berkeley, CA, University of California, February, mimeo.
Barro, R. (1996): Democracy and growth, Journal o f Economic Growth, vol. 1, Norwell, MA, Kluwer Academic Publishers.
Barro, R. and J. Lee (1993): International comparisons of educational attainment, Journal o f Monetary Economics, vol. 32, No. 3, Amsterdam, Netherlands, North-Holland Publishing Company.
Barro, R. and X. Sala-i-Martin (1995); Economic Growth, New York, McGraw-Hill.
Bates, R. (1995): Social dilemmas and rational individuals: An assessment of the new institutionalism, in J. Harris, J. Hunter and C. Lewis (eds.), The New Institutional Economics and Third World Development, London, Routledge.
Becker, G. (1993a): A theory of competition among pressure groups for political influence, Quarterly Journal o f Economics, vol. 98, No. 3, Cambridge, MA, MU Press. (1993b): Human Capital, Chicago, 1L, University of Chicago Press (Third Edition).
Behrman, J. (1993): Investing in Human Resources, in Inter-American Development Bank, Economic and Social Progress in Latin America: 1993 Report, Baltimore, Johns Hopkins University Press.
Benhabib, J. and M. Spiegel (1994): The role of human capital in economic development: Evidence from aggregate cross-country data, Journal o f Monetary Economics, vol. 34, No. 2, Amsterdam, Netherlands, North-Holland Publishing Company.
Berry, A. (1997): The income distribution threat in Latin America, Latin American Research Review, vol. 32, No. 2, Chapel Hill, NC.
Bilson, J. (1982): Civil liberty: An econometric investigation, Kyklos, vol. 35, Salem, MA, Clearence Center, Inc.
Boone, P. (1995); Politics and the Effectiveness o f Foreign Aid, NBER Working Paper No. 5308, Cambridge, MA, National Bureau of Economic Research (NBER).
Buchanan, J. (1975): The Limits o f Liberty: Between Anarchy and Leviathan, Chicago, IL, University of Chicago Press.
Burkhart, R. and M. Lewis-Beck (1994): Comparative democracy: The economic development thesis, The American Political Science Review, vol. 88, No. 4, Washington, D. C., The American Political Science Association.
Cardoso, E. and A. Fishlow (1992): Latin American economic development: 1950-1980, Journal o f Latin American Studies, vol. 24, Quincentenary Supplement, London, U. K,, Cambridge University Press.
Cardoso, E. and A. Helwege (1991): Populism, profligacy and redistribution, in R. Dombusch and S. Edwards (eds.), The Macroeconomics o f Populism in Latin America, Chicago, IL, University of Chicago Press.
INSTITUTIONS AND GROWTH: CAN HUMAN CAPITAL BE A LINK? • NAURO CAMPOS AND JEFFREY B. NUGENT

26 C E P A L R E V I E W « 4 • A P R I L 1 9 9 8
Clague, C., P. Keefer, S. Knack and M. Olson (1995); Contract-Intensive Money: Contract Enforcement, Property Rights, and Economic Performance, IRIS working paper No. 1.51, College Park, University of Maryland, February.
De Gregorio, J. (1992); Economic growth in Latin America, Journal of Development Economics, vol. 39, No. 1, Amsterdam, Netherlands, Elsevier Science Publishers, B.V.
De Gregorio, J. and P. Guidotti (1995): Financial development and economic growth, World Development, vol. 23, No. 3, Amsterdam, Netherlands, Elsevier Science Ltd.
Deininger, K. and L. Squire (1996): Measuring income inequality: A new data-base, Washington, D. C., World Bank, March, mimeo.
Dixit, A.K. (1976): Theory of Equilibrium Growth, New York, Oxford University Press.
Easterlin, R. (1996): Growth Triumphant: The Twenty- first Century in Historical Perspective, Ann Arbor, MI, University of Michigan Press.
Edwards, S. (1995): Crisis and Reform in Latin America: From Despair to Hope, Oxford, U. K., Oxford University Press.
Engerman, S. and K. Sokoloff (1994): Factor endowments, institutions, and differential paths of growth among new world economies, NBER historical paper No. 66, Cambridge, MA, National Bureau of Economic Research (NBER).
Fajnzylber, F. (1990): Unavoidable Industrial Restructuring in Latin America, Durham, NC, Duke University Press.
Fishlow, A. (1991): Some reflections on comparative , Latin American economic performance and policy,
in T. Banuri, (ed.), Economic Liberalization: No Panacea. The Experiences of Latin America and Asia, Oxford, U. K., Clarendon Press.
Goldman, S., T. Kato and V. Mui (1991): Economic growth and generalized depreciation, Journal o f Development Economics, vol. 34, pp. 397-400, Amsterdam, Netherlands, Elsevier Science Publishers, B.V.
Greene, W. (1990): Econometric Analysis, Englewood Cliffs, NJ, Prentice-Hall.
Gurr, T. (1990): Polity 11: Political Structures and Regime Change, 1800-1986, Ann Arbor, Inter-University Consortium for Political and Social Research (ICPSR).
Gwartney, J., R. Lawson and W, Block (1996): Economic Freedom of die World: 1975-1995, Vancouver, The Fraser Institute.
Haber, S. (1994): Capital Markets and Industrial Development: A Comparative Study of Brazil, India, Mexico and the United States, 1840-1930, IRIS w ork
ing paper No. 144, College Park, University of Maryland, November.
Helliwell, J. (1994): Empirical linkages between democracy and economic growth, The British Journal of Political Science, vol. 24, pp. 225-248, New York, Cambridge University Press,
Hirschman, A. (1970): Exit, Voice and Loyalty: Responses to Decline in Firms, Organizations and States, Cambridge, MA, Harvard University Press,
(1982): Shifting Involvements: Private Interest andPublic Action, London, Blackwell.
Hsiao, C. (1986): Analysis of Panel Data, Cambridge, Cambridge University Press.
IDB (Inter-American Development Bank) (1993): Economic and Social Progress in Latin America: 1993 Report. Special topic: investment in human resources, Washington, D.C., October.
Knack, S. and P. Keefer (1995): Institutions and economic performance: Cross-country tests using alternative institutional measures, Economics and Politics, vol. 7, No. 3, Oxford, U. K., Blackwell.
Lau, L. (1996): The sources of long-term economic growth: Observations from the experience of developed and developing countries, in R. Landau, T. Taylor and G. Wright (eds.), The Mosaic of Economic Growth, Palo Alto, CA, Stanford University Press.
Levine, R. and D. Renelt (1992): A sensitivity analysis of cross-country growth regressions, The American Economic Review, vol. 82, No. 4, Nashville, TN, American Economic Association.
Lin, J. and LB. Nugent (1995): Institutions and economic development, in J. Behrman and T. N. Srinivasan (eds.), Handbook of Development Economics, vol. 3A, Amsterdam, Netherlands, North-Holland Publishing Company.
Londoflo, J.L. (1995): Poverty, inequality, social policy, and democracy, paper presented at the Annual Conference on Development in Latin America and the Caribbean, Rio de Janeiro, World Bank.
Mankiw, G., D. Romer and D. Weil (1992): A contribution to the empirics of economic growth, Quarterly Journal of Economics, vol. 107, No. 2, Cambridge, MA, MIT Press
Mauro, P. (1995): Corruption and growth, Quarterly Journal of Economics, vol. 110, No. 3, Cambridge, MA, MIT Press.
Mdnard, C. (1995): Markets as institutions versus organizations as markets? Disentangling some fundamental concepts, Journal of Economic Behaviour and Organization, vol. 28, No. 2, Amsterdam, Netherlands, North-Holland.
Morley, S. (1995): Poverty and Inequality in Latin America, Baltimore, MD, Johns Hopkins University Press.
INSTITUTIONS AND GROWTH: CAN HUMAN CAPITAL BE A UNK? • NAURO CAMPOS AND JEFFREY B. NUGENT

C E P A L R E V I E W 8 4 • A P R I L 1 » » « 27
Murphy, K., A. Schleifer and R. Vishny (1991): The allocation of talent: Implications for growth, Quarterly Journal of Economics, vol. 106, No. 2, Cambridge, MA, MIT Press.
Naim, M. (1995): Latin America’s Journey to the Market: From Macroeconomic Shocks to Institutional Therapy, Occasional Paper No. 62, San Francisco, CA, International Center for Economic Growth (ICEG).
Nehru, V., E. Swanson and A. Dubey (1995): A data base on human capital stocks in developing and industrial countries: Sources, methodology and results, Journal of Development Economics, Amsterdam, Netherlands, North-Holland.
North, D. (1990): Institutions, Institutional Change and Economic Performance, London, Cambridge University Press.
1995): The new institutional economics and ThirdWorld development, in J. Harris, J. Hunter and C Lewis (eds.), The New Institutional Economics and Third World Development, London, Routledge.
Nugent, J. (1991): The demise of economic development in Latin America and its implications for other developing countries, Journal of Economic Development, vol. 16, No. 1, Seoul, Republic of Korea, Chung-Ahn University, Economic Research Institute.
Nugent, J. and M. K. Nabli (1992): Development of financial markets and the size distribution of manufacturing establishments: International comparisons, World Development, vol. 20, No. 10, Amsterdam, Netherlands, Elsevier Science Ltd.
Olson, M. (1996): Big bills left on the sidewalk: Why some nations are rich and others poor, The Journal of Economic Perspectives, vol. 10, No. 2, Nashville, TN, American Economic Association.
Persson, T. and G. Tabellini (1992): Growth, distribution and politics, in A. Cukierman, Z. Hercowitz and L. Leiderman (eds.), Political Economy, Growth and Business Cycles, Cambridge, MA, MIT Press.
Picciotto, R. (1995): Putting institutional economics to work: from participation to governance, World Bank Discussion Papers, No. 304, Washington, D. C., World Bank.
Porter, P. and G. Scully (1995): Institutional technology and economic growth, Public Choice, vol. 82, Norwell, MA, Kluwer Academic Publishers.
Pritchett, L. (1996): Where Has All The Education Gone ?, Working Paper Series, No. 1581, Washington, D. C., World Bank, March.
Psacharopoulos, G. (1973): Returns to Education: an International Comparison, San Francisco, CA, Jossey-Bass Publishers.
Psacharopoulos, G. and Y. Ng (1994): Earnings and education in Latin America, Education Economics, vol. 2, No. 2.
Raczynski, D. (1995): Programs, institutions and resources: Chile, in D. Raczynski (ed.), Strategies to
Combat Poverty in Latin America, Baltimore, MD, Johns Hopkins University Press.
Reynolds, L. (1983): The spread of economic growth to the Third World, Journal of Economic Literature, vol. 21, No. 3, Nashville, TN, American Economic Association,
Robinson, J. (1996): Theories of bad policy, Los Angeles, CA, University of Southern California, mimeo.
Rodrik, D. (1992): Political economy and development policy, European Economic Review, vol. 36, No. 2-3, Amsterdam, Netherlands, Elsevier Science Publishers B. V.
Roubini, N. and X. Sala-i-Martin (1992): Financial repression and economic growth, Journal of Development Economics, vol. 39, No. 1, Amsterdam, Netherlands, Elsevier Science Publishers, B.V.
Sachs, J. and A. Warner (1995): Economic convergence and economic polices, NBER Working Paper No. 5039, Cambridge, MA, National Bureau of Economic Research (NBER), February.
Schleifer, A. (1994): Establishing Property Rights, Proceedings of the 1994 Annual World Bank Conference on Development Economics, Washington, D. C., World Bank.
Scully, G. (1988): The institutional framework and economic development, Journal of Political Economy, vol. 86, No. 3, Chicago, IL, University of Chicago Press.
Srinivasan, T. N. (1994): Long-run growth theories and empirics: Anything new?, Proceedings of the University of Siena Workshop on Endogenous Growth and Development, Siena, Italy, Università degli Studi.
Summers, R. and A. Heston (1994): Penn World Tables, version 5.6 (PWT 5.6). (may be downloaded as pub/pwt56 from www.nber.org., University of Pennsylvania).
Thomas, V. and Y. Wang (1996): Distortions, interventions, and productivity growth: Is East Asia different?, Economic Development and Cultural Change, vol. 44, No. 2, Chicago, IL, University of Chicago Press.
Trebilcock, M. (1995): What makes poor countries poor? The role of institutional capital in economic development, Toronto, Ontario, University of Toronto, November, mimeo.
Wiesner, E. (1994): Fiscal decentralization and social spending in Latin America: the search for efficiency and equity, IDB Working Paper No. 199, Washington, D. C., Inter-American Development Bank (IDB).
World Bank (1993): The East Asian Miracle: Economic Growth and Public Policy, Washington, D. C.
(1994): Governance: The World Bank’s Experience,Washington, D. C.
INSTITUTIONS AND GROWTH: CAN HUMAN CAPITAL BE A UNK? • NAURO CAMPOS AND JEFFREY B. NUGENT


G u n th e r H eld*R a q u e l S zalach m an**
* Coordinator, Financing Unit, International Trade, Transport and Financing Division, ECLAC,** Financing Unit, International Trade, Transport and Financing Division, ECLAC.
C E P A L R E V I E W W 29
External capital flows inLatin America and the
Caribbean in the 1990s:experiences and policies
This article analyses the experiences of a group o f Latin American and Caribbean countries with high inflows of external capital in 1992-1996 and places them within the context of the
capital movements which have taken place in the region since
1977. Over the last two decades, capital flows to the region
have been marked by their great variability: periods of high inflows of capital have alternated with periods of low inflows. In the three-year period 1992-1994, there was a heavy inflow o f
capital which was concentrated in a few countries, was more
volatile because its composition changed in the direction o f portfolio investments, and continued to be high in 1995-1996 in some countries. Analysis of the period from 1992 to 1996
shows the incentives behind the high inflows of financial capital and the response they elicited from national saving, the bal
ance of payments current account deficit and the real exchange
rate and summarizes the macroeconomic and financial effects o f the decline or reversal o f capital flows in certain countries in
1995-1996. The experiences of the countries of the region show
that in order to take advantage of capital inflows and avoid their
macroeconomic and financial risks, external capital attraction
policies should: i) view access to external resources as part of a
broader policy for strengthening national saving and developing
the financial systems of the recipient countries; ii) seek such resources only as a function o f the sustainable balance of pay
ments current account deficit of the country in question, and
iii) envisage m onetary and exchange-rate system s w hich
permit the gradual and regulated opening-up of the balance of
payments capital account and promote changes in the level and
composition of capital inflows towards flows which are stable
in the medium and long term.
A P R I L 1 9 9 8

30 C E P A L R E V I E W 6 4 • A P R I L 1 9 6 8
IIntroduction
External capital flows can make an important contribution to economic and financial development. They mobilize saving from the capital-exporting countries, thus increasing the resources of the recipient countries and improving international resource allocation. In the recipient countries, these flows make it possible to compensate for reductions in foreign exchange availability due to fluctuations in their exports and in the terms of trade and also further diversify the financial assets and liabilities of the countries involved, as well as providing other benefits (ECLAC, 1995).
Inflows of external capital also bring with them risks and costs, however. The abundant loans that the international banking system made in the second half of the 1970s aided the growth of the countries of the region while they remained available, but they also brought with them excessive aggregate spending, high current account deficits and other macroeconomic imbalances, which culminated in the external and domestic debt crisis which spread to most of the countries of the region in the early 1980s.
The present study deals with the experiences and policies regarding the procurement of external capital by the Latin American and Caribbean countries
which had heavy inflows of external capital between 1992 and 1996. The study is divided into five sections, including the present introduction. Section II highlights the variability of capital movements over the last two decades and uses various criteria to identify the countries of the region which had heavy capital inflows in 1992-1996. Section III describes the incentives which led to these heavy inflows of financial capital, together with their consequences for national saving, the current account deficit and the real exchange rate, and studies the macroeconomic and financial effects of the decline or reversal of external capital flows in some countries in 1995-1996.
Section IV deals with policies for the procurement of external capital within the framework of a development policy which strengthens national saving and domestic financial markets, and examines the concept of a sustainable current account deficit. The analysis of external capital procurement policies stresses the importance of monetary and exchange- rate regimes and looks at various instruments that can be used to regulate capital inflows and adjust to them. Finally, section V presents the main conclusions of the study.
Features of capital flows In Latin America and the Caribbean In recent decades
1. T h e v a ria b ility a n d o th e r fe a tu re s of capita l m o v e m e n ts b etw e en 1977 a n d 1996
Table 1 shows the capital account and current account balances of the balance of payments of countries of the region between 1977 and 1996. The capital flows show great variability. In a period of less than two decades it is possible to identify two periods of high capital inflows with averages equivalent to 5.3% and 4.3% of the regional GDP (1977- 1981 and 1992-1994, respectively), a period of low
capital inflows, with an average of 1.3% of gdp in 1983-1989, and two periods of medium-level inflows equivalent to 2.6% of GDP in 1990-1991 and 2.5% in 1995-1996.1
Of the total inflows in 1977-1996, 85% or more went to only six of the 19 countries shown in table 1, largely because of the size of the recipient countries. Thus, for example, Mexico alone received nearly 40% of net capital inflows in 1992-1994, and Argen-
1 Capital flows in 1982 are excluded because this was a very irregular year.
EXTERNAL CAPITAL FLOWS IN LATIN AMERICA AND THE CARIBBEAN IN THE 1990s: EXPERIENCES AND POLICIES • GUNTHER HELDAND RAQUEL SZALACHMAN

C E P A L R E V I E W 6 4 • A P R I L 1 S 9 8 31
Latin Am erican and Caribbean countries: current and capital account balances(As average percentages o f GDP)
C ountry\ 1977-1981 1983-1989 1990-1991 1992-1994 1995-1996 “
\ YearCurrentaccount
Capitalaccount
Currentaccount
Capitalaccount
Currentaccount
Capitalaccount
Currentaccount
Capitalaccount
Currentaccount
Capitalaccount
Argentina -0.2 1.7 -2.2 1.6 1.4 0.5 -3.2 4.3 -1.1 1.4Bolivia -8.4 7.4 -14.1 14.6 -6.5 6.9 -10.0 11.6 -4.3 6.0Brazil -4.1 4.2 -0.6 0.9 -0.6 0.8 0.4 2.0 -2,8 4.3Chile -8.3 11.8 -6.3 6.6 -1.8 7.6 -3.6 8.3 -1.9 4.5Colombia -0.4 3.1 -2.3 2.4 3.4 -0.6 -1.9 2.7 -5.1 6.1Costa Rica -12.2 12.5 -8.3 10.1 -6.3 7.6 -6.6 6.3 -1.4 2.3Ecuador -7.1 7.5 -5.0 4.9 -4.6 7.3 -3.7 5.7 -1.8 -0.2El Salvador -3.3 2.3 -5.4 6.2 -6.5 7.3 -4.1 5.6 -2.3 3.8Guatemala -3.4 2.9 -4.3 4.6 -2.4 5.2 -6.2 6.5 -3.4 3.3Haiti -14.4 13.4 -12.4 12.4 -10.1 10.3 -6.8 4.7 -3.5 6.5Honduras -10.0 9,9 -8.6 8.7 -10.5 12.0 -12.6 11.6 -5.3 7.2Mexico -4.1 4.5 0.6 -0.4 -4.4 6.3 -7.3 6.5 -0.6 -2.0Nicaragua -11.5 9.4 -36.9 38.3 -42.9 44.3 -49.9 49.6 -27.7 -20.5Panama -8.5 8.7 4.6 -5.0 -3.3 8.1 -2.4 3.9 -2.5 3.0Paraguay -5.8 10.4 -7.9 6.4 -5.2 9.7 -10.3 10.5 -5.1 5.2Peru -2.8 4.5 -3.1 3.3 -3.6 5.1 -5.5 8.6 -6.5 6.8Dominican Republic -7.4 7.7 -5.4 5.5 -1.6 3.7 -3.5 2.4 -0.9 1.1Uruguay -4.5 6.4 -1.0 2.0 1.0 0.7 -2.3 3.1 -1.6 2.7Venezuela -1.6 4.5 1.1 -2.9 10.4 -5.2 -0.9 -0.1 8.0 -3.7Latin America and the Caribbean -43 5.3 -13 13 -1.0 2.6 -33 43 -1.9 2.5
Source: Balance of payments figures: International Monetary Fund (IMF). Figures ft»1 GDP in current dollars: BCLAC estimates.6 The figures for 1995-1996 are based on the new definition of “Capital and financial account” established by the International Monetary Fund (IMF).
tina, Brazil and Chile together have accounted for at least 40% of the flows in all the sub-periods except 1990-1991.2
Table 2 shows the standard deviation from the average of the capital account balances of the regional balance of payments, as an indicator of the variability of capital movements in the region in the period 1977-1994,3 Short-term loans display very high variability (almost 12 times their average value); portfolio investment also displays high variability (almost twice its average value); long-term loans display a certain amount of variability (1.5 times the average value), and foreign direct investment is marked by a low level of variability (equivalent to half its average value). This latter component has shown the most uniform behaviour; over the
2 In the case of Nicaragua, the high share registered in 1983- 1989 is accounted for mainly by unrequited official transfers.3 This table was limited to the period 1977-1994 because the IMF made changes in the classification of capital flows as from 1995.
w ho le perio d i t s to o d a t a round 1.0% o f reg ional GDP, a lthough it has d isp lay ed substan tia l variations a t the ind iv idua l coun try level.
Consequently, the variability of capital inflows into the countries of the region has been associated mainly with the variability of short-term loans and portfolio investment. Similar results have been obtained for industrialized countries (Turner, 1995).
Capital inflows from portfolio investments in stocks, other securities and short-term loans are volatile because they can quickly be reversed. From this point of view, the change in composition in the sense of an increase in portfolio investments and a reduction in long-term loans observed in the 1990s indicates an increase in the volatility of external capital compared with previous periods. In 1992-1994, this situation mainly affected Mexico and Argentina, since the increase in portfolio investments accounts for three-quarters of the increase in total capital inflows into those countries compared with 1983-1989, and it also applied to a lesser extent to Brazil in 1995-1996.
EXTERNAL CAPITAL FLOWS IN LATIN AMERICA AND THE CARIBBEAN IN THE 1990«: EXPERIENCES AND POLICIES • GUNTHER HELDAND RAQUEL SZALACHMAN

32 C E P A L R E V I E W $ 4 * A P R I L 1 9 9 6
TABLE 2Latin America and the Caribbean: Average and standard deviation of the main capital account components, 1977-1994a(Millions o f current dollars)
Capital account components Average Standarddeviation
Standard deviation/ average
Direct investment 6 693 3 617 0.54Portfolio investment 8 252 15 414 1.87Short- and long-term loans 8 869 12 574 1.42
Long-term loans 9 466 14 347 1.52Short-term loans -597 6 953 11.64
Capital account balance 24 963 18 462 0.74Unrequited official transfers 1 576 943 0.60
Current account balance -20 961 15 454 0.74Variation in reserves -3 976 11 076 2.78
Source; Balance of payments figures: International Monetary Fund (IMF). GDP figures: ECLAC estimates. a Calculated on the basis of the total for each component for the 19 countries listed in table 1.
2. C o u n tr ie s w ith h e a v y in flo w s of capital in199 2-1 9 96
A high level or proportion of capital inflows is not of itself an adequate criterion for classifying countries according to their capital inflows. A number of countries of the region have registered inflows above the average for the region, even in periods of high inflows, but this situation led to an adjustment through a high current account deficit which already took place in the past Thus, for example, Bolivia had capital inflows equivalent to 7.4% of GDP in 1977- 1981 and 11.6% in 1992-1994 (compared with averages of 5.3% and 4.3% for the region as a whole), but at the same time it registered current account deficits of 8.4% and 10% of GDP in those periods.
The experience of the countries of the region with capital inflows in recent decades suggests that the existence of variations in the capital inflows into a given country which are equivalent to more than two percentage points of GDP in a particular period constitutes an important additional consideration for classifying countries according to their capital inflows. Thus, a country marked by low capital inflows, equivalent to less than two percentage points of GDP, which registers an increase of around two percentage points in those inflows would qualify as a country with medium-level capital inflows. In contrast, a country marked by medium-level capital inflows of two to four percentage points of GDP which also registers an increase of around two percentage points would qualify as a country with high inflows. For example, table 1 shows that Argentina registered
an increase in capital inflows from 1.6% of g d p in 1983-1989 to 4.3% of g d p in 1992-1994, so that according to this logic it would move up from a situation of “low” capital inflows to one of “high” inflows. Likewise, Peru moved up from a situation of “medium-level” capital inflows in 1983-1989 (3.3% of GDP) to one of “high” inflows in 1992-1994 (8.6% of GDP).
Increases in capital inflows which would lead to a country being classified as a “high inflow” country do not necessarily translate into a situation of abundant foreign exchange. These increases may represent financing for a bigger balance of payments current account deficit due to excessive aggregate expenditure (consumption and investment) in relation to national income. Honduras fits into this situation. Its capital inflows amounted to 8.7% and 11.6% of GDP in 1983-1989 and 1992-1994, but its current account deficits stood at 8.6% and 12.6% of g d p in the corresponding periods.
The response of economic policy and macro- economic adjustments to greater availability of foreign exchange is not due solely to increases in capital inflows. It can also be due to a reduction in the current account deficit or an increase in the surplus on that account Thus, for example, Chile’s current account deficit went down from 6.3% of GDP in 1983-1989 to 3.6% in 1992-1994, while its capital inflows increased from 6.6% to 8.3% of GDP between those two periods.
In view of the foregoing, we classified as countries which had high capital inflows in 1992-1994 (a period of high inflows in the region as a whole) those which simultaneously displayed the following conditions:
EXTERNAL CAPITAL FLOWS IN LATIN AMERICA AND THE CARIBBEAN IN THE 1990»: EXPERIENCES AND POLICIES • GUNTHER HELDAND RAOUEL SZALACHMAN
C E P A L R E V I E W 6 4 • A P R I L 1 9 9 » 33
i) cap ita l in flow s over fou r p e rcen tag e po in ts o f GDP (i.e ., h ig h e r than th e average fo r th e reg io n as a w ho le),
ii) increases o f m ore th an tw o percen tag e po in ts o f GDP in th e ir cap ita l in flow s, o r s im ultaneous p o sitive varia tions in the cap ita l an d cu rren t accoun ts o f th e b a lan ce o f paym en ts (increases in th e defic it o r reductions in the surplus) equ ivalen t to such increases.
Table 1 shows that according to the foregoing criteria, the following countries qualify for the group with high capital inflows in 1992-1994: Argentina, Chile, Ecuador, Mexico, Paraguay and Peru.4 Brazil and Colombia qualify as countries with high capital inflows in 1995-1996, while Chile and Peru continued to register high inflows in that two-year period.5,6
I llThe period of high capital inflows Into a group of countries of the region in 1992-1994
The factors determining capital movements between a capital-exporting country and a recipient country may be visualized in terms of the arbitrage conditions between interest rates or the rate of return on investments in those countries:
(1) r - r* + £(dep) + (p - p*) where:r = Domestic interest rate (or rate of
return)r* = External interest rate (or rate
of return)£(dep) = Expectation of depreciation of the
national currency (or exchange risk) (p ~P*) = difference between the country risks
of the respective economies.
This equation shows that a country which has opened up its balance of payments capital account will receive capital inflows as long as its interest rate or rate of return on investment for a given activity is higher than the corresponding rate in the capital- exporting country, with the interest rate adjusted to take account of the exchange risk and the difference in the respective country risks.
1. C o u n try ris k a n d e x c h a n g e ris k of fin a ncia l in v e s tm e n ts
Some major financial reforms and stabilization policies implemented in the late 1980s and early 1990s opened up the way for heavy inflows of capital into Argentina, Ecuador, Mexico, Peru and Paraguay in 1992-1994 and into Colombia as from 1994. The
high capital inflows registered by Chile were favoured by the reforms in the financial system and capital markets made during the 1980s and an economy which was in a marked process of stabilization from the end of that decade onwards, although it was still subject to widespread indexing practices. In the case of Brazil, the hyperinflation from which that country had been suffering was solved with the monetary reform which brought in the “Real” in July 1994, thereby giving rise to favourable conditions for capital inflows.
These reforms and policies reduced the country risk (i.e., there was less likelihood of restrictions or disturbances affecting access to the foreign exchange market in transactions for taking capital out of the country). However, only Chile and Colombia managed to qualify as countries with low international investment risks (“investment grade”), in 1993 and 1994 respectively.
The reduction in the exchange risk did a great deal to help attract high financial flows, which were also encouraged by expectations of revaluation of the national currency in the periods of high capital inflows into the recipient countries.
4 It was decided to exclude Nicaragua because the high capital inflows into that country include a substantial proportion of unrequited transfers.5The high inflow registered by Chile in 1995-1996 took place in spite of the fact that it made advance repayments on its external debt equivalent to nearly 3% of GDP in 1995.6 It was decided to exclude Paraguay from the countries with high capital inflows in 1995-1996 because its inflows fell from 10.5% of GDP in 1992-1994 to 5.2% in that period.
EXTERNAL CAPITAL FLOWS IN LATIN AMERICA AND THE CARIBBEAN IN THE 1990s: EXPERIENCES AND POLICIES • GUNTHER HELDAND RAQUEL SZALACHMAN

34 C E P A L R E V I E W < 4 • A P R I L 1 9 9 8
The Stability Pact adopted in Mexico in 1989 strengthened the stabilizing role of the exchange rate. Hie exchange rate floating range had a fixed nominal floor and a ceiling which moved up in small daily steps announced in advance, thus making it possible to project the variation in the nominal exchange rate. Annual inflation went down from 26.6% in 1990 to 6.9% in 1994. This policy also concealed the exchange risk to some extent, however. While the cumulative inflation between 1990 and 1994 came to 66.3%, the cumulative increase in the nominal exchange rate for the U.S. dollar only amounted to 20% over the same period.
In Argentina, the April 1991 Convertibility Act introduced a monetary and exchange rate regime with a fixed nominal exchange rate anchor, as part of an ambitious stabilization programme. Inflation went down from 172% in 1991 to 4.3% in 1994 (and 0.2% in 1996). The fixed nominal exchange rate policy wiped out the exchange risk, however. While cumulative inflation between 1991 and 1994 amounted to 43.8%, the cumulative increase in the nominal exchange rate for the U.S. dollar only amounted to 4.8% in the same period.
Since 1991, Chilean exchange rate policy has involved an exchange rate fluctuation range within which the market exchange rate is allowed to vary, and a central exchange parity within that range. The central rate of the range is designed to give medium- term signals on the real exchange rate to the export sector. At the same time, the possibility of floating within the range permits the existence of some exchange risk in order to discourage the entry of short-term capital.
This policy has been subjected to some adjustments in die light of the strengthening of the current situation and future prospects of the external sector from the late 1980s onward. Among the most important changes made were the application of a 20% compulsory reserve requirement on external credits in June 1991 (subsequently raised to 30% and also applied to other financial capital inflows, as described in section IV); the widening of the exchange rate range from 5% to 10% in January 1992; the use of a “dirty float” within that range since March 1992; the decision to link the reference exchange rate of the range to a basket of currencies instead of only to the U.S. dollar in July 1992; revaluation of the central parity of the range by 5% in January 1992 and 9.7% in November 1994; and the inclusion of a 2% annual comparative increase in productivity in the rules for
determining the reference exchange rate in December 1995. In October 1996, the maximum proportion of investments that mutual funds could make abroad was raised from 30% to 100%, and such operations and the corresponding remittances in respect of them were exempted from the compulsory reserve obligation. These measures helped to induce the market exchange rate to rise above the floor of the range, but the exchange risk has been depressed by the persistent tendency of the exchange rate to fall back to the floor and the decline in the reference exchange rate. Thus, while cumulative inflation between the end of 1991 and the end of 1996 came to 68.0%, the nominal exchange rate for the U.S. dollar only rose by 18.1% in that period.
During the 1990s, Ecuador, Paraguay and Peru had exchange rate floating systems involving Central Bank intervention in the foreign exchange market, against a background of stabilization policies. The revaluations of the national currencies likewise resulted in a low exchange risk, partly because of the capital inflows themselves. The cumulative variations in the nominal exchange rate for the U.S. dollar and in inflation between 1991 and 1994 came to 110% and 185% in Ecuador and 44.2% and 64.2% in Paraguay, while in Peru the corresponding rates between 1991 and 1996 came to 217% and 295%, respectively.
At the beginning of 1994, Colombia introduced an exchange rate system based on a central parity moving according to fixed rules and an exchange rate fluctuation range of 15%. This system includes compulsory reserve requirements in respect of foreign currency loans, first introduced in 1993 and later modified in 1994 according to the term of such loans (see section IV). Market pressures led to the revaluation of the central parity by 7% in December 1994. Political uncertainty caused the market exchange rate to rise to the top of the range in mid-1995, causing the Banco de la República to step in to defend the national currency. Between the end of 1993 and the end of 1996, however, the cumulative variations in the nominal exchange rate of the U.S. dollar and inflation came to 16.3% and 46.1%, respectively.
The 1994-1995 Mexican crisis led the Central Bank of Brazil to adopt a crawling band, intervening to keep the exchange rate within an increasingly narrow band which has gradually been moved up to bring about small real devaluations (Dias Cameiro, 1997). Nevertheless, however, the variations in the nominal exchange rate and inflation were 57.2% and 119% respectively between 1994 and 1996.
EXTERN! .OWS IN LATIN AMERICA AND THE CARIBBEAN IN THE 1990a: EXPERIENCES AND POLICIES * GUNTHER HELDAND RAQUEL 8ZALACHMAN

C E P A L R E V I E W 6 4 • A P R I L 1 9 9 8 35
2. T h e rate of re tu rn o n Inte rn a tio n a l p ortfo lioin ve s tm e n ts
High (real) interest rates on both loans and deposits were features of the financial liberalization and/or price stabilization policies of the countries with high capital inflows in the 1990s.7 In the same period, the nominal interest rates on loans and deposits in the United States sank below their trend levels in 1992- 1994, going down to 6.5% and 3.8%. This situation was partly reversed in 1995-1996, when these rates rose to 8.6% and 5.7%, respectively.
Rule 144-A of the United States Securities Commission (1990) made it easier to sell securities on that country’s capital markets, through American Depositary Receipts (ADRs) and other means, and the same occurred in other industrialized economies, especially through Eurobonds (Caro, 1994).
In this context, the reduction and/or elimination of exchange risk already referred to lent great significance to the following factors in the countries receiving high capital inflows in 1992-1994 and 1995-1996, according to the respective situations: i) the spread between their interest rates (or rates of return on investment) compared with those of the United States (and other capital-exporting countries), as shown in equation (1), and ii) the undervaluation (in dollar terms) of domestic securities on the emerging stock exchanges of the countries of the region around 1990, because of the expectations of gain generated by the economic reforms and the higher price/profit ratios at which stocks could be sold through a d r s on the capital markets of the United States.
The differences between the nominal dollar equivalent rates on loans in the United States compared with those in Chile, Ecuador, Paraguay and Peru averaged around 4.4%, 10.7%, 9% and 37.7% a year, respectively, in the period 1992-1994, which led domestic financial institutions and agents to seek resources on the international capital markets.8 In
7 This situation is connected with the low credibility of anti-inflation policies, restrictive monetary policies, flaws in regulation and prudential supervision which do not place limits on risky credit requests in deregulated banking systems, high banking transaction costs, insufficient national saving and other factors.8 The equivalent domestic interest rates in dollars (i*) were obtained by applying the following formula: (1 + /*) = (1 + i)!{\ + tc), where i is the domestic interest rate in national currency and tc is the variation in the exchange rate. In the case of Chile and Colombia, the effect of a 30% compulsory reserve requirement was introduced by multiplying i* by where e is the compulsory reserve rate per unit of inflow of financial capital.
1995-1996, these differences came to 20% in Colombia, 7.7% in Chile and 11.3% in Peru (IMF, 1997).
The average spreads between the nominal interest rates on deposits in the United States and those in Argentina, Chile, Ecuador, Mexico and Paraguay, for their part, stood at average levels of 4.2%, 3.4%, 3.7%, 6.9% and 4% per year, respectively, thus encouraging foreign investors to channel resources to those countries in 1992-1994. In 1995-1996, the spreads were 5.1% for Brazil, 13.3% for Colombia, 4.7% for Chile, and 3.5% for Peru (IMF, 1997).
Between 1990-1992 and the end of 1994, the stock exchange price indexes in dollars trebled in Brazil and Colombia and doubled in Argentina, Chile, Mexico and Peru, providing substantial gains for portfolio investors ( e c l a c , 1996a). These increases were associated with big increases in the sales of stocks and bonds on international capital markets. Table 3 shows that the total amount of gross stock issues by countries of the region in those markets increased by a factor of nearly 3 between 1990- 1991 and 1993-1994, while the total amount of gross bond issues increased by a factor of nearly 7 between 1990-1991 and 1995-1996. Argentina and Mexico received about two-thirds of these investments in 1992-1994. Mexico alone obtained over 40% of them in that period, and portfolio investments in that country went up from slightly negative values in 1983-1989 to 1.3% of g d p in 1990-1991 and 5.2% of g d p in 1992-1994, forming by far the largest component of that country’s capital inflows in that three-year period. For its part, Brazil accounted for about a quarter of total gross stock and bond issues in 1995-1996.
3. R e p la ce m e n t of n ation a l s a v in g b y externals a v in g
Table 4 gives a breakdown of the proportions of national saving, external saving and domestic investment (all at current prices) in countries which had high capital inflows in 1992-1994 (Argentina, Ecuador, Mexico and Paraguay), 1992-1996 (Chile and Peru) and 1995-1996 (Brazil and Colombia). The increases in external saving coincided with substantial declines in national saving in all those countries except Chile and Ecuador.
In Mexico, investment (as a proportion of GDP) increased by only two percentage points between 1983-1989 and 1992-1994, compared with an increase in external saving equivalent to over seven
EXTERNAL CAPITAL FLOWS IN LATIN AMERICA AND THE CARIBBEAN IN THE 1990*: EXPERIENCES AND POLICIES • GUNTHER HELDAND RAQUEL SZALACHMAN

36 C E P A L R E V I E W 6 4 • A P R I L 1 9 9 8
TABLE 3Selected Latin American and Caribbean countries: G ross issues of stocks (A ) and bonds (B ) on international markets, 1990-1996a(Millions o f dollars)
^ S . Year 1990 1991 1992 1993 1994 1995 1996
Country A B A B A B A B A B A B A B
Argentina _ 21 360 795 392 1 570 2 655 6 308 735 5 319 . 6 354 217 13 738Brazil - - - 1 837 133 3 655 - 6 465 1 028 3 998 296 7 041 387 11 194Chile 98 - - 200 129 120 288 322 799 155 224 300 297 1 750Colombia - - - - - - 98 567 207 955 71 1 083 - 1 751Mexico - 2 477 3 531 3 782 3 077 6 100 2 913 11 339 1 679 6 949 - 7 646 668 17 823Peru - - - - - - 26 30 133 100 - - 1 052 -
Latin America and the Caribbean b 98 3124 3 891 7 522 3 965 12 577 6 022 28 764 4 704 18 097 962 23 071 3 662 47157
Source: ECLAC, on the basis of data provided by the World Bank, the International Monetary Fund (IMF) and Euromoney. s The amounts shown are gross in the sense that they do not include amortization of bonds and the flowback of stocks sold through the ADR and GDR systems. b Also includes other countries.
TABLE 4
G ross national saving (G N S ), external saving (E X S ) and gross dom estic Investment (G D I) In countries with high capital Inflows(Average percentages o f GDP)
Country/period GNS EXS GDI Country/period GNS EXS GDI
Argentina a 1983-1989 16.3 2.2 18.5
Ecuador1983-1989 13.8 6.0 19.8
1990-1991 15.7 -1.4 14.3 1990-1991 17.5 2.3 19.81992-1994 15.5 2.9 18.4 1992-1994 18.3 2.1 20.41995-1996 16.6 1.2 17.8 1995-1996 16.0 1.8 17.8
Brazil1983-1989 20.9 0.7 21.5
Mexico1983-1989 21.6 -0.9 20.7
1990-1991 19.6 0.6 20.2 1990-1991 19.5 3.7 23.21992-1994 19.6 -0,4 19.3 1992-1994 15.5 6.5 22.01995 16.8 2.5 19.2 1995-1996 21.0 0.5 21.5
Colombia b 1983-1989 19.1 0.6 19.7
Paraguay a 1983-1989 15.6 7.9 23.5
1990-1991 22.0 -4.8 17.2 1990-1991 18.6 5.2 23.81992-1994 19,0 1.5 20.5 1992-1994 10.1 10.3 23.11995-1996 15.6 5.5 21.0 1995-1996 8.2 5.1 23.6
Chile1983-1989 13.6 5.8 19.3
Peru1983-1989 20.2 2.5 22.8
1990-1991 24.2 1.2 25.4 1990-1991 18.3 2.3 20.61992-1994 24.7 2.8 27.4 1992-1994 16.9 5.0 21.91995-1996 25.4 2.1 27.5 1995-1996 18.7 6.0 24.6
Source: Prepared by ECLAC on the basis of the national accounts and balance of payments data of countries of the region.* National saving was calculated as the difference between the domestic investment figures of the national accounts and the balance of payments current account balance. b National saving in 1996 was calculated as in note a above.
EXTERNAL CAPITAL FLOWS IN LATIN AMERICA AND THE CARIBBEAN IN THE 1990«: EXPERIENCES AND POLICIES * GUNTHER HELDAND RAQUEL SZALACHMAN

C E P A L R E V I E W $ 4 • A P R I L 1 9 9 8 37
percentage points of GDP. In Paraguay, an increase in external saving of almost eight percentage points of GDP between 1990-1991 and 1992-1994 was accompanied by a similar fall in national saving, so that domestic investment remained almost unchanged. Likewise, in Brazil an increase of almost three percentage points of GDP in external saving between 1992-1994 and 1995 was not accompanied by any increase in the proportion of domestic saving.
In Chile, declines in external saving coincided with increases in national saving and hence with declines in the proportions of GDP spent on consumption between 1983-1999 and 1992-1994. Gross national saving increased from 13.6% in 1983-1989 to 24.7% in 1992-1994 and 25.4% in 1995-1996. However, replacement of saving took place at the level of individuals. Thus, individuals registered practically zero saving in 1992-1994, although their compulsory Social Security saving amounted to around 3.5% of GDP in that period (Arrau, 1996). Such voluntary dissaving indicates that they were no exception to the wave of consumption which affected all the countries with high capital inflows.
The above facts suggest that there has been a substantial process of replacement of national saving by external saving in the region. Statistical studies taking account of other variables which affect national saving have shown that an increase in external saving by one percentage point of gdp has tended to reduce national saving by about one-half of one percentage point of gdp in the region (eclac, 1995).
The fact that financial liberalization measures coincided with high current account deficits in a number of countries with high capital inflows in the 1990s was a reflection of the “syndrome” observed by Goos in similar cases in the Scandinavian countries and the United Kingdom: falls in saving, a substantial increase in financing of consumption rather than of investment, and deterioration of the balance of payments current account (Goos, 1996).
The main causal factor in these results in these cases was the credit extended by the banking system to the private sector to finance consumption. A similar role has been attributed to bank credit in a number of countries of the region which had high capital inflows in the 1990s (Sachs, Tomell and Velasco, 1996). As a proportion of gdp, bank credit to the private sector doubled between 1990 and 1994 in Ecuador, Mexico, Paraguay and Peru (IMF, 1997).
Other factors also encouraged consumption in the countries with high capital inflows in the 1990s:
the wealth effect connected with the rapid rise in share prices (except in Ecuador, which did not have a domestic capital market capable of incorporating heavy international portfolio investment flows); trade reforms which reduced average import tariffs to between 10% and 15% at the same time that there were sharp falls in the real exchange rate (table 5), and the adjustment in consumption patterns which took place in countries which had gained renewed access to external financing and credit.
4. T h e fall in real e x c h a n g e ra tes
Table 5 shows capital inflows as a proportion of gdp, the proportion of those inflows which was placed in the international reserves, and the behaviour of real exchange rates (effective export exchange rates) for some countries of the region in the 1990s, using the real 1990 exchange rate as a basis. Six of the countries which registered high capital inflows (Argentina, Brazil, Colombia, Ecuador, Mexico and Peru) channeled about one-third or less of those inflows into the accumulation of international reserves, so that two-thirds or more went into the current account. Except in the case of Ecuador, national saving in those countries remained unchanged or even went down (table 4), thus limiting the capacity of their Central Banks. In Argentina, Ecuador, Mexico and Peru real exchange rates fell (i.e., the currency appreciated in value) by around 20% in 1992-1994 compared with 1990. In Brazil and Colombia, real exchange rates fell by around 30% in 1995-1996 compared with 1990 (and in the first-named country the rate fell by 40% compared with 1992-1994).
The Central Bank of Chile mainly used Social Security saving to finance an accumulation of international reserves equivalent to over 50% of the capital inflows in 1992-1996 (and nearly two-thirds of those inflows in 1992-1994). Through the sale of Central Bank securities to pension funds (almost 40% of the total funds) there were current account deficits of 3.6% of GDP in 1992-1994 and 1.9% in 1995-1996, in spite of capital inflows equivalent to 8.3% and 4.5% of GDP in those periods (table 1). This was one of the reasons why the real exchange rate in Chile registered the smallest decline among the countries which had high capital inflows in the 1990s.
This evidence suggests that the high inflows of capital in this period were accompanied by significant drops in the real exchange rate. In a few cases,
EXTERNAL CAPITAL FLOWS IN LATIN AMERICA AND THE CARIBBEAN IN THE 1990s: EXPERIENCES AND POLICIES • GUNTHER HELDAND RAQUEL SZALACHMAN

38 C E P A L R E V I E W 6 4 • A P R I L 1 6 9 8
TABLE 5
Latin American countries with high capital inflows In the 1990s: Capital inflows, variation In reserves and real exchange rates
Country/periodCapital inflows
(% of GDP)
Variation in reserves
(% of capital inflows)
Real exchange rate (1990=100)
Average1992-1994
Average1995-1996
Countries with high inflows in 1992-1994Argentina 4.3 24.5 76.6 88.0Ecuador 5.7 34.4 85.6 79.3Mexico 6.5 -12.6 81.9 115.3
Countries with high inflows in 1992-1996Chile 6.8 52.9 96.1 90.3Peru 7.9 35.4 82.9 84.0
Countries with high inflows in 1995-1996Brazil 4.3 33.3 112.6 67.8Colombia 6.1 17.1 83.9 73.1
Source: IMF, 1997; ECLAC, 1997.
this process was alleviated to some extent by an increase in national saving and its use for a substantial buildup of international reserves. The use of the exchange rate as a stabilization instrument in Argentina (since 1991), Brazil (since 1994) and Mexico (in 1989-1994), together with the marked expansion in domestic expenditure which accompanied the high capital inflows, among other factors, also influenced the declines observed in real exchange rates.
5. M a c ro e c o n o m ic a n d fin a n cia l risk s a s s o c ia te d w ith h ig h capita l in flo w s
In Mexico, increasingly volatile capital inflows were used to finance a current account deficit which amounted to 7% of GDP in 1994, when serious political events took place in that country. That situation, and an exchange rate which had got out of line, revealed the external vulnerability of the Mexican economy and increased the risk of a reversal of capital flows (Goos, 1996).
A 15% increase in the exchange rate flotation band in December 1994 increased the perception of exchange risk, gave rise to capital outflows equivalent to 7.2% of GDP in 1995, and caused the stock exchange to slump by 62% (in dollar terms) between the third quarter of 1994 and the fourth quarter of 1995. The run against the peso led to over-devalu- ation of the national currency, whose parity fell by half in the space of three months. The macroeconomic adjustment led to a fall of 6.6% in gdp in 1995 and affected the solvency of the banking sys
tem. The fact that 20% of loans were in the bad debts category made it necessary to adopt rescue measures which cost the equivalent of 6% of GDP. However, a 41% rise in the real exchange rate (the effective rate for exports) in the two-year period 1995-1996 (table 5) provided a solid base for reactivating exports and activities in the tradeables sector.
The Mexican situation “infected” Argentina by giving rise to a perception of exchange risk among depositors and investors and compromising the credibility of the fixed exchange rate. The withdrawal of some 14% of the deposits in the banking system in the first quarter of 1995 set off a recessionary adjustment process. The GDP went down by 4.4% in 1995 and stock prices (in dollars) fell by 29.5% between the third quarter of 1994 and the fourth quarter of1995.
The economic recession affected the stability of the banking system, causing the proportion of loans in the bad debt portfolio to rise to 28%. The Central Bank of Argentina tackled the financial instability by promoting a private system of guarantees for deposits, encouraging bank mergers and consolidation and keeping up the level of bank credit in spite of the heavy withdrawals of deposits. This significantly limited the automatic adjustment supposed to be characteristic of a fixed nominal exchange rate regime (Eichengreen and Wyplosz, 1996; ECLAC, 1996c). Even so, the real exchange rate (the effective rate for exports) rose by 15% in 1995-1996 compared with the three-year period 1992-1994, thus increasing the profitability of export and tradeable goods activities.
EXTERNAL C> .OWS IN LATIN AMERICA AND THE CARIBBEAN IN THE 1990s: EXPERIENCES AND POLICIES • GUNTHER HELDAND RAQUEL SZALACHMAN

C E P A L R E V I E W 6 4 ■ A P R I L 1 6 9 8 39
The big expansion in credit in Ecuador and Paraguay in 1992-1994 gave rise to cases of bank insolvency for which the rescue operations cost the equivalent of 4.1% of GDP in Paraguay in 1995 and 1.1% of g d p in Ecuador in 1996.9
The slump in the Mexican stock exchange led to a 5.7% fall in the price index (measured in dollars) of the Chilean stock exchange between the third quarter of 1994 and the fourth quarter of 1995. This slump, together with political uncertainty, seems to have been an important factor in the 37% fall in the price index (measured in dollars) of the Colombian stock exchange in that period. These events did not affect the rate of economic activity in Chile in 1995-1996, however.
IVExternal capital
The experience of the Latin American and Caribbean countries which have registered high capital inflows in recent decades shows the importance of the application of the following economic policy criteria with respect to such inflows in the recipient countries:
i) establishing policies to encourage national saving and the development of the domestic financial system and capital markets, in order to provide a solid base for the financing of domestic investment and ensure that capital inflows are in line with a sustainable level of external saving;
ii) ensuring that the level and composition of capital inflows are compatible with a sustainable balance of payments current account deficit;
iii) using policy instruments designed to regulate capital inflows in line with the respective monetary and exchange rate regimes and to bring about a gradual and orderly entry into international capital markets.
Experience also shows that both the capital exporting and recipient countries could well strengthen their prudential regulations guiding international capital flows.
9 The 1994-1995 bank crisis in Brazil was due to political interference in the credit operations of two major State banks and flaws in the prudential regulation and supervision of the banking system.
The above details show that the macroeconomic and financial risks deriving from the high inflows of capital into the region in the 1990s were limited to a few countries, unlike the generalized external debt problems caused by the heavy inflows of external credit in 1977-1981. The situation in the 1990s may be attributed mainly to two factors: i) the concentration of international portfolio investments in a few countries of the region, partly because of the transparency and risk assessment requirements characterizing the issue and sale of securities on the capital markets of the United States and the industrialized countries, and ii) the external capital procurement policies of some of the countries which registered high inflows of capital in that period.
procurement policies
1. P o lic ie s to p ro m o te n atio n a l s a v in g a n dfin a ncia l d e v e lo p m e n t
The proportions of national saving of the countries of the region have remained at around 20% of GDP since the 1970s. The limited degree of financial development in these countries is reflected in the ratio of M2 (money and quasi-money) to GDP. In 1994, this indicator stood at around 20% of GDP in Argentina, Colombia, Ecuador and Peru, and 35% in Chile and Mexico (IMF, 1997).
The insufficient level of national saving and the small size of domestic financial markets limited the economic policy options open in a number of countries with high capital inflows in 1992-1994 and laid them open to macroeconomic and financial risks. Moreover, the financial instability which affected several countries with high capital inflows in that period highlights the lack of institutional consolidation of their systems of prudential regulation and supervision (ECLAC, 1996b).
The foregoing shows how important it is to have policies designed to promote saving and the development of the domestic financial systems, in order to back up domestic investment in countries of the region and at the same time ensure that external saving is compatible with their sustainable current account deficits.
EXTERNAL CAPITAL FLOWS IN LATIN AMERICA AND THE CARIBBEAN IN THE 1990«: EXPERIENCES AND POLICIES • GUNTHER HELDAND RAQUEL SZALACHMAN

40 C E P A L R E V I E W 6 4 * A P R I L 1 9 9 8
2. S u s ta in a b le c u rre n t a c c o u n t d e fic its
The current account deficit that the capital inflows into a country can sustain, and the corresponding medium- and long-term real exchange rate, are the most important items in the region's experience with capital movements over the last two decades. Such a deficit is directly connected with a country’s capacity to attract foreign capital and maintain its creditworthiness over time. The many factors which are involved in determining that deficit and the associated real exchange rate mean that inter-temporal models for estimating these variables are very complex (Soto, 1996).
For economic policy purposes, a deficit of a conservative nature may be determined by using the following indicators which increase or decrease the sustainable deficit depending on their respective signs (Milesi-Ferreti and Razin, 1996):
i) political stability (political instability would have a negative sign),
ii) the external debt (a high proportion of such debt, or an increase in the ratio of the external debt to exports and/or of the external debt to gdp, would have a negative sign),
iii) exports (a high proportion in the total or an increase in the ratio of exports to GDP would have a plus sign),
iv) the real exchange rate (a low exchange rate or a fall in the real exchange rate would have negative signs),
v) the rate of national saving (a high proportion of total Saving or increases in national saving would have a plus sign),
vi) stability of the domestic banking system (a transparent and solvent banking system, subject to firm prudential regulation and supervision rules, would have a plus sign),
vii) the composition of capital inflows (a high proportion or increase of short-term inflows and/or those of a speculative nature would have a negative sign).
The current account balances of the countries of the region between 1977 and 1996 given in table 1 show that only small countries, or those which have received high levels of unrequited transfers, have been able to sustain current account deficits greater than 5% of GDP for considerable lengths of time. The sustainable current account deficit for Chile has been estimated at 3% or 4% of GDP (Le Fort and Budnevich, 1995). This estimate of the deficit con
trasts with the high capital inflows into that country between 1983 and 1996, which were equivalent to over 6.5% of GDP per year.
The sustainable current account deficit for the larger countries of the region, which have lower export/product ratios, may be lower than the percentage estimated for Chile. Mexico’s current account deficit in 1992-1994, which was around 7% of GDP, was not sustainable. Partly because of contagion by the Mexican crisis, Argentina's deficit in that period, which was equivalent to 3.2% of GDP, did not prove to be sustainable in 1995-1996 either.
3. P o lic ie s to re g ula te a n d a d ju s t to capita l in flo w s
The measures that the Central Bank of a country can take to regulate capital flows in periods of high capital inflows or to adjust the exchange rate to deal with permanent improvements in the situation and prospects of the external sector depend on the monetary and exchange rate regime. In principle, the Central Bank would not have such means at its disposal for this purpose in a system of fixed nominal exchange rates, and it would not need them in a system of freely floating exchange rates.
A system of fixed nominal exchange rates eliminates the exchange risk (provided the exchange rate is credible). This system uses complete openness of the capital account to assure the economic agents that they will enjoy full convertibility of their assets and liabilities into foreign currency at all times, and vice versa. For this reason, this type of exchange rate regime is incompatible with restrictions on capital flows.10
In a freely floating exchange rate regime, all foreign exchange transactions (both on the current account and the capital account of the balance of payments) are carried out between those supplying and demanding foreign exchange, without any Central Bank involvement in exchange operations at all. In principle, such a regime does not provide for any restrictions on capital movements, nor is exchange risk a component of exchange rate policy, since it is
10 Monetary policy is completely passive when base money is created or reduced only through foreign exchange operations. To this effect, the Central Bank acts as a currency board and backs the whole of the monetary base with the international reserves.
EXTERNAL CAPITAL FLOWS IN LATIN AMERICA AND THE CARIBBEAN IN THE 1990«: EXPERIENCES AND POLICIES • GUNTHER HELDAND RAQUEL SZALACHMAN

C E P A L R E V I E W 6 4 • A P R I L 1 6 9 8 41
internalized by the participants in the foreign exchange market themselves.11
Because of the effect of country risk, flows of funds from a capital-exporting country to an importing country will take place until the arbitrage condition shown in equation (1) is fulfilled. Consequently, in order to discourage inflows of capital into the latter country, monetary and exchange rate regimes are required which limit the arbitrage and make possible a gap between domestic and international interest rates and/or between domestic and international rates of return on financial investments in stocks (and also possibly the rates on direct investments).
The arguments in favour of this gap are connected with the level of domestic interest rates which secures a domestic equilibrium between aggregate expenditure and national income and hence the corresponding equilibrium level of external saving for the capital-importing country. In economies with insufficient national saving, low capital endowments, imperfect financial markets and stabilization policies which are still under way, the level of such rates may -when there is an open capital account- at the same time attract such large inflows of capital that they compromise those balances unless restrictions are placed on such inflows. At the same time, heavy capital inflows in economies like those in question may also encourage the revaluation of existing assets and create a risk of a financial bubble instead of financing increases in real capital formation (Zahler, 1992).
Monetary and exchange rate regimes which make possible a gap in the arbitrage of capital movements give the Central Bank a chance to manage such movements (and, consequently, some degree of autonomy in monetary policy). Such regimes generally involve a dirty exchange-rate float, or a float with interventions by the Central Bank in the foreign exchange market which are not announced in advance; market exchange rates determined on the basis of a crawling peg, with suitable adjustment rules and an exchange rate band;12 and market exchange rates determined within a crawling band.
11 The Central Bank can carry out an active monetary policy through exchange operations involving domestic credit, but by not participating in exchange operations it leaves the behaviour of the exchange rate exposed to variations in capital movements.12 Such rules take account of the difference between domestic and external inflation and the difference between the variations in domestic and external productivity.
The main tools used by recipient countries under these regimes to deal with high capital inflows are the application of taxes and compulsory reserve requirements, higher exchange risk, the accumulation of international reserves, and exchange rate adjustment.
The application of these tools is entirely compatible with measures for gradually opening up the balance of payments capital account to both inflows and outflows of funds.
a) Compulsory reserve requirements and taxes oncapital inflowsCompulsory reserve requirements and taxes are
the main tools used to discourage capital inflows (Agosin and Ffrench-Davis, 1996). They increase the financial cost that domestic agents have to pay to gain access to sources of external financing and reduce the rate of return that foreign agents can obtain by investing funds in the domestic markets of the capital-importing country.
Reserve requirements may be differentiated according to the term of the capital in question: while long-term capital inflows may be exempt from them, they may be used to check the inflow of short-term and/or speculative capital. The same results can be obtained through taxes differentiated according to the term of the inflows. Unlike reserve requirements, however, the application of the latter usually requires the adoption of an Act of Parliament (Jiménez, 1995).
The application of reserve requirements and/or taxes to financial capital inflows is particularly important in two situations. First, when there is a lag in the downward trend of domestic interest rates in financial liberalization and/or stabilization policies in countries of the region. Second, when there is a combination of domestic and external factors, including some of a transitory nature, which may help to attract massive inflows of financial capital to domestic markets which are still narrow or incipient, as occurred in various countries of the region in 1992-1996.
In Chile and Colombia, compulsory reserve requirements have been seen as an important instrument for limiting the inflow of short-term capital. In both countries, they have been applied side-by-side with measures to open up the balance of payments capital account (expansion of the range of transactions that can be carried out on the formal exchange market, authorization for the sale of securities on international financial markets, deregulation of capital outflows, etc.). In the case of Chile, they have been used for lengthy periods of time, mainly because of
EXTERNAL CAPITAL FLOWS IN LATIN AMERICA AND THE CARIBBEAN IN THE 1990a: EXPERIENCES AND POLICIES • GUNTHER HELDAND RAQUEL SZALACHMAN
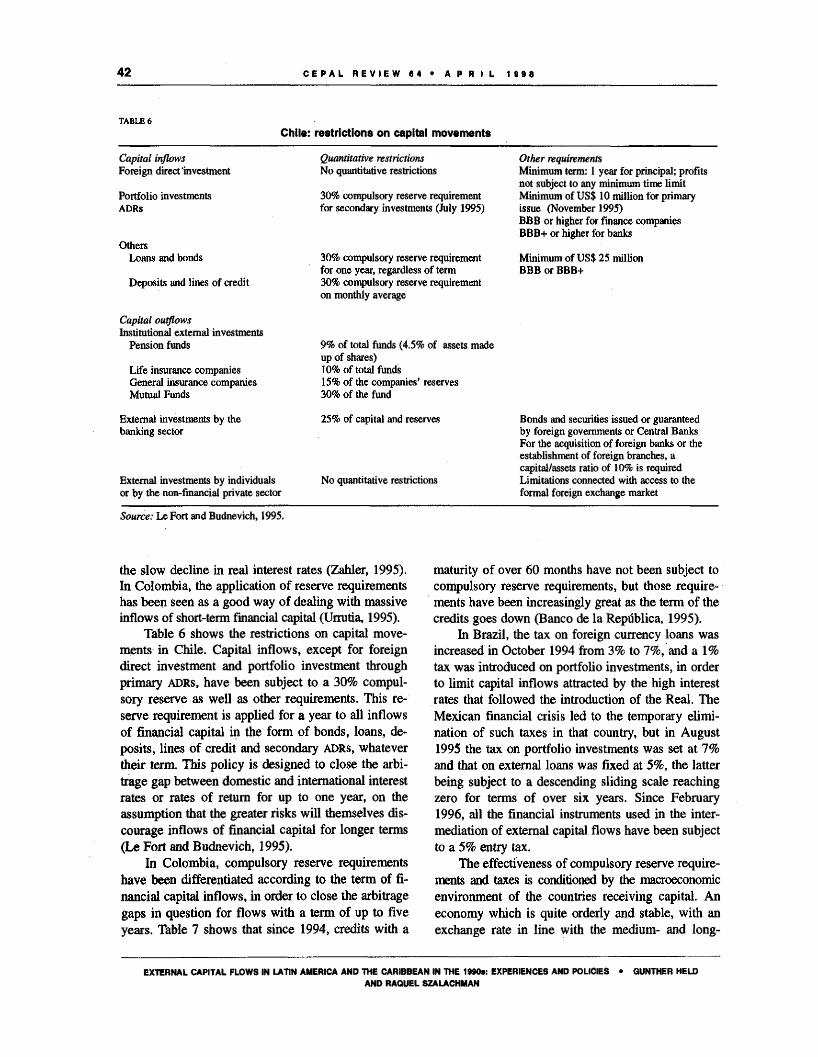
42 C E P A L R E V I E W 6 4 • A P R I L 1 9 6 6
TABLEÓChile: restrictions on capital movements
Capital inflows Foreign direct'investment
Portfolio investments ADRs
Others Loans and bonds
Deposits and lines of credit
Quantitative restrictions No quantitative restrictions
30% compulsory reserve requirement for secondary investments (July 1995)
30% compulsory reserve requirement for one year, regardless of term 30% compulsory reserve requirement on monthly average
Other requirementsMinimum term: 1 year for principal; profits not subject to any minimum time limit Minimum of US$ 10 million for primary issue (November 1995)BBB or higher for finance companies BBB+ or higher for banks
Minimum of US$ 25 million BBB or BBB+
Capital outflowsInstitutional external investments
Pension funds
Life insurance companies General insurance companies Mutual Funds
External investments by the banking sector
External investments by individuals or by the non-financial private sector
9% of total funds (4.5% of assets made up of shares)10% of total funds15% of the companies’ reserves30% of the fund
25% of capital and reserves
No quantitative restrictions
Bonds and securities issued or guaranteed by foreign governments or Central Banks For the acquisition of foreign banks or the establishment of foreign branches, a capital/assets ratio of 10% is required Limitations connected with access to the formal foreign exchange market
Source: Le Fort and Budnevich, 1995.
the slow decline in real interest rates (Zahler, 1995). In Colombia, the application of reserve requirements has been seen as a good way of dealing with massive inflows of short-term financial capital (Urrutia, 1995).
Table 6 shows the restrictions on capital movements in Chile. Capital inflows, except for foreign direct investment and portfolio investment through primary ADRs, have been subject to a 30% compulsory reserve as well as other requirements. This reserve requirement is applied for a year to all inflows of financial capital in the form of bonds, loans, deposits, lines of credit and secondary ADRs, whatever their term. This policy is designed to close the arbitrage gap between domestic and international interest rates or rates of return for up to one year, on the assumption that the greater risks will themselves discourage inflows of financial capital for longer terms (Le Fort and Budnevich, 1995).
In Colombia, compulsory reserve requirements have been differentiated according to the term of financial capital inflows, in order to close the arbitrage gaps in question for flows with a term of up to five years. Table 7 shows that since 1994, credits with a
maturity of over 60 months have not been subject to compulsory reserve requirements, but those requirements have been increasingly great as the term of the credits goes down (Banco de la República, 1995).
In Brazil, the tax on foreign currency loans was increased in October 1994 from 3% to 7%, and a 1% tax was introduced on portfolio investments, in order to limit capital inflows attracted by the high interest rates that followed the introduction of the Real. The Mexican financial crisis led to the temporary elimination of such taxes in that country, but in August 1995 the tax on portfolio investments was set at 7% and that on external loans was fixed at 5%, the latter being subject to a descending sliding scale reaching zero for terms of over six years. Since February 1996, all the financial instruments used in the intermediation of external capital flows have been subject to a 5% entry tax.
The effectiveness of compulsory reserve requirements and taxes is conditioned by the macroeconomic environment of the countries receiving capital. An economy which is quite orderly and stable, with an exchange rate in line with the medium- and long-
EXTERNAL CAPITAL FLOWS IN LATIN AMERICA AND THE CARIBBEAN IN THE 1990»: EXPERIENCES AND POLICIES • GUNTHER HELDAND RAQUEL SZALACHMAN

C E P A L R E V I E W 6 4 • A P R I L 1 9 9 8 43
TABLE 7
Colom bia: Restrictions on capital Inflows
Capital inflows
Income from the sale of foreign currency
“Non-export" income in foreign currency
Foneign-currency income from tourism
Credits
Credits with a term ranging from less than 30 days to 60 months:i) Deposits for 30 days or less
ii) Deposits for 12 months
iii) Deposits for 18 months
iv) Deposits for 24 months
v) Deposits for between 24 and 60 months
vi) Deposits for more than 60 months
Quantitative restrictions
5% commission (April 1991)
3% retention (April 1991) 10% retention (July 1992)
Limit of US$ 25 000
Other restrictions
140% compulsory reserve requirement (August 1994) 93% compulsory reserve requirement (March 1994) 64% compulsory reserve requirement (March 1994) 42.8% compulsory reserve requirement (August 1994) 30% compulsory reserve requirement (August 1994) No compulsory reserve requirement (August 1994)
Banks must maintain net foreign currency assets, which limits the loans they can make in foreign currency
Reserves must be maintained for the entire term of the loan and must be deposited in advance for credits with a term of less than 60 months
The Banco de la República may acquire securities with a term of up to 12 months before they mature, applying a discount of 55%
Advance repayments may only be made not less than 36 months after the procurement of the credit, except with the express authorization of the Banco de la República
Source: Banco de la República, 1995.
term equilibrium rate, may attract excessive inflows of capital, which means that compulsory reserve requirements and taxes are justified in order to forestall adverse macroeconomic effects. In a country with high current account deficits, an overvalued national currency and inflationary pressures, in contrast, restrictions on capital inflows may be redundant because the country risk and exchange risk will represent a barrier to international financial integration (Zahler, 1995).
The application of taxes was considered sufficient to control capital inflows into Brazil in the second half of 1995 and the first half of 1996 (Dias Cameiro, 1997). In the case of Chile, there is still a good deal of discussion as to whether the compulsory reserve requirements have served to reduce the level of financial capital inflows, but it is generally agreed that they have changed the composition of such inflows in the direction of more medium- and longterm capital. In Colombia, there is general agreement that such controls have had favourable effects both in reducing the total amount of external financing and in changing its structure in the direction of long-term capital (Ocampo and Tovar, 1997).
b) Greater exchange riskThe following exchange rate policies enable the
Central Bank to achieve higher levels of exchange risk, mainly for discouraging inflows of short-term capital due to arbitrage:
i) the adoption of an exchange rate regime based on a dirty float, instead of a rule fixing the future evolution of the exchange rate, as for example by the publication of an exchange rate table;
ii) the adoption of an exchange rate rule within a crawling peg system which moves the central value of the exchange rate band as a function of a basket of currencies instead of a single currency, and
iii) broadening the exchange rate band by including a system of a crawling peg subject to an exchange rate band, in order to secure greater exchange rate flexibility.
The effectiveness of these measures depends on whether the reference exchange rate of the respective exchange rate regime coincides with the medium- and long-term equilibrium rate. If a reference exchange rate leads to a market exchange rate which undervalues the national currency, then the expectations of revaluation may cancel out the greater exchange risk.
EXTERNAL CAPITAL FLOWS IN LATIN AMERICA AND THE CARIBBEAN IN THE 1990s: EXPERIENCES AND POLICIES * GUNTHER HELDAND RAQUEL SZALACHMAN
44 C E P A L H E V I E W 6 4 • A P R I L 1 9 9 6
c) Prudential regulation o f financial capital movementsThe portfolio investments made by institutional
investors of industrialized countries in emerging capital markets, unlike the individual transactions of stocks, bonds and other securities by enterprises and institutions of the region on the capital markets of the industrialized countries, are subject to very little prudential regulation. This has led to proposals at three levels for reducing the capital flows attracted by considerations of short-term liquidity or rates of return due to arbitrage (Griffith-Jones, 1996):
i) measures designed to ensure the supply of adequate, timely and reliable information on the exposure of institutional investors in emerging capital markets;
ii) the provision of warning signals about such exposure;
iii) the introduction, by the institutions responsible for regulating and supervising the capital markets of the industrialized countries, of regulations and restrictions on the short-term portfolio investments of institutional investors.
Prudential regulation can also play an important role in the countries receiving capital. The sale of securities to foreign investors by public enterprises and quasi-autonomous institutions, or such sales with the participation of the public sector, may involve an explicit or implicit State guarantee. This guarantee over-incentivates demand, so that there are grounds for establishing strict requirements regarding the issue of these securities and for demanding the express authorization of the economic and/or financial authorities of that sector for their sale.
d) Accumulation o f international reservesThe accumulation of international reserves is not
only justified in countries which have low levels of reserves or are subject to major fluctuations in their external trade or terms of trade. The Central Bank can also accumulate international reserves, by absorbing part of the capital inflows which take place, in order to defend the macroeconomic balances and the real exchange rate. For this purpose, it intervenes in the foreign exchange market through exchange operations and sterilizes the monetary effects of those operations by selling debt paper on the domestic capital markets (thereby giving some degree of autonomy to monetary and exchange rate policy). Substantial sterilization of capital inflows limits the
expansion of aggregate expenditure and thus prevents the replacement of national saving by external saving (Fffench-Davis and Griffith-Jones, eds., 1995).
Sterilization depends on the availability of sufficient national saving, as was the case in Chile in the 1990s, and it also has its costs. It helps to raise domestic interest rates by encouraging short-term financial capital inflows, which tends to undermine the effect of this policy (Steiner and Escobar, 1995), At the same time, it can lead to a deterioration in the net worth of the Central Bank if the interest rates on the latter *s international reserves are lower than those paid by the Bank on the securities which it has issued in national currency,13
e) Exchange rate adjustmentContinual growth of exports and a current ac
count balance which is consistently within the limits of the sustainable deficit, together with high long-term capital inflows which persist in time, justify exchange rate adjustments for macroeconomic reasons. These situations may even make it necessary to reassess the size of the sustainable current account deficit.
Persistent improvements in the current situation and future prospects of the external sector justify the revaluation of the national currency, and vice versa. This translates into changes in the explicit reference value of the exchange rate, as in the case of a crawling peg system, or changes in its implicit reference value, as in the exchange rate that the Central Bank seeks to defend through interventions not announced in advance, in an exchange rate system based on a dirty float.
In such regimes, timely adjustment of the exchange rate is essential in order to avoid the formation of expectations of revaluation or devaluation of the national currency. If expectations of revaluation spread among the economic agents, they will cancel out the exchange risk and encourage capital inflows even if there are compulsory reserve requirements and taxes. In contrast, widespread expectations of devaluation will give rise to heavy capital outflows which will be hard to control even through restrictions.
13 The Central Bank of Chile increased its international reserves by some US$ 10 billion between 1990 and 1995, bringing them to the equivalent of 24% of GDP in the latter year. As the interest rates at which the Bank sells securities on the domestic market are higher than the international interest rates it receives on the international reserves, the corresponding sterilization of capital inflows has caused it to suffer a quasi-fiscal deficit which was estimated at some 0.5% of GDP in 1995.
EXTERNAL CAPITAL FLOWS IN LATIN AMERICA AND THE CARIBBEAN IN THE 1990a: EXPERIENCES AND POLICIES • GUNTHER HELDAND RAQUEL SZALACHMAN

C E P A L R E V I E W 6 4 • A P R I L 1 9 9 8 45
VConclusions
Variability has been the main feature of the movements o f external capital to the countries of the region in recent decades. The high inflows of capital into the region in 1977-1981 (bank loans) and 1992-1994 (portfolio investments) were preceded by periods of low inflows and followed by declines in capital flows in 1983-1989 and 1995-1996. Unlike the widespread reduction in capital inflows to the countries of the region in 1983-1989 (because of the external and domestic debt crisis), however, the reversal in financial capital flows in 1995-1996 was concentrated in just a few countries, especially Mexico and Argentina.
The variability of capital movements is due to external factors connected with the situation of international financial markets, but it also has an important domestic component connected with the external capital procurement policies and structural factors and economic reforms in the recipient countries.
The inadequacy of the policy instruments used to regulate capital flows in periods of abundant supply of external funds has made possible high capital inflows, phases of expansion in aggregate expenditure, and high current account deficits in countries of the region in the 1990s (as in 1977- 1981), which have not proved to be sustainable. These inflows have themselves led to subsequent declines or reversals in capital flows and recessionary macroeconomic adjustments. High capital inflows have also contributed to the expansion of credit to high-risk borrowers which has made it necessary to carry out rescue programmes in a number of the countries which had high capital inflows in the 1990s (as also occurred in the external and domestic debt crisis of the 1980s).
Excessive capital inflows in periods of high supply and shortages of capital inflows in periods of low supply warrant the adoption of external capital procurement policies which graduate the level and composition of such inflows in the light of the volatility characteristic of the different capital flows. Such policies seek to encourage the entry of medium- and long-term capital to finance real investments and to discourage short-term in
flows of a speculative nature, in order to stabilize the flows over time and bring them into line with the sustainable level of current account deficit of the recipient countries.
External capital procurement policies should form part of broader policies to strengthen capital formation in the countries of the region. These policies have the following main components:
i) instruments designed to increase national saving and develop a solvent and efficient domestic financial s ystem, in order to provide competitive national options for the financing of investment, with funds to sterilize excessive inflows of capital, and also to permit orderly outflows of capital;
ii) a monetary and exchange rate regime which will make it possible to manage and regulate capital movements and exchange rate adjustments to cope with lasting changes in the current situation and future prospects of the external sector;
iii) a macroeconomic environment with market exchange rates and interest rates which are in line with medium- and long-term conditions and which avoid expectations of revaluation or devaluation of the national currency, in order to encourage capital inflows based on medium- and long-term considerations and to avoid capital flights.
Increases in national saving, the achievement of stabler and deeper domestic financial systems and capital markets, and credibility with regard to macroeconomic organization and stabilization are structural conditions which directly affect the benefits and risks associated with capital inflows. These conditions can only be achieved in the medium and long term, thus warranting the gradual and regulated opening up-of the balance of payments capital account and progressive entry into international financial markets.
The main instruments for dealing with high capital inflows in the recipient countries are the following:
i) the introduction of compulsory reserve requirements or taxes and of measures to increase the
EXTERNAL CAPITAL FLOWS IN LATIN AMERICA AND THE CARIBBEAN IN THE 1990«: EXPERIENCES AND POLICIES • GUNTHER HELDAND RAQUEL SZALACHMAN

46 C E P A L R E V I E W 0 4 • A P R I L 1 9 9 8
exchange risk for short-term capital inflows motivated by arbitrage and mainly of a speculative nature;
ii) prudential regulation of capital movements in the industrialized countries and the recipient countries, in order to help stabilize such flows and restrict those of a short-term speculative nature;
iii) the accumulation of international reserves by the Central Bank, if the recipient countries have insufficient reserves;
iv) measures to facilitate the outflow of domestic capital, including direct investment and certain forms of financial investment, and
v) the acceptance of gradual falls in the real exchange rate in so far as they represent adjustments to the medium-and long-term equilibrium values.
The application of these instruments depends very much on the availability of national saving, and their effectiveness is conditioned by the macro- economic environment, which should have exchange rates and interest rates in keeping with the medium- and long-term conditions, so as to avoid exchange risk and expectations of revaluation of the national currency.
(Original: Spanish)
Bibliography
Agosin, M. and R. Ffrench-Davis (1995): Managing capital inflows in Latin America, in M. V. Haq, I. Kaul and I. Grunberg (eds.), The Tobin Tax: Coping with Financial Volatility, New York, Oxford University Press.
Arrau, P. (1996): Nota sobre el aumento del ahorro nacional en Chile: 1980-1994, “Financiamiento del Desarrollo” series, No. 39, LC/L.984, Santiago, Chile, Economic Commission for Latin America and the Caribbean (ECLAC).
Banco de la República (1995): Memorando Interno JDS- 401, Santafé de Bogotá, mimeo.
Caro, E. (1994): Acceso a los mercados internacionales de capital y desarrollo de instrumentos financieros: el caso de M éxico , “Financiamiento del Desarrollo” series, No. 18, LC/L.843, Santiago, Chile, ECLAC.
ECLAC (1995): Latin America and the Caribbean: Policies to Improve Linkages with the Global Economy, LC/G.1800/Rev.l-P, Santiago, Chile. United Nations publication, Sales No.E.95.II.G.6.
(1996a): Economic Survey o f Latin America and theCaribbean 1995-1996, LC/G.1929-P, Santiago, Chile. United Nations publication, Sales No. E.96.II.G.2.
(1996b): Quince años de desempeño económico.América Latina y el Caribe, 1980-1995, LC/G.1925/ R ev.l-P , Santiago, Chile. United Nations publication, Sales No. S.96.II.G.3.
(1996c): El régimen de convertibilidad y el sistemabancario en A rgentina , LC/R.1682, Santiago, Chile.
(1997): Preliminary Overview o f the Latin Americanand Caribbean Economy 1997 , LC/G.1984-P, Santiago, Chile. United Nations publication, Sales No. E. 97.II.G.130.
Dias Cameiro, D. (1997): Flujos de capital y desempeño económico del Brasil, in Flujos de capital e inversión
productiva. Lecciones para América Latina, ECLAC/OECD, Santiago, Chile, McGraw-Hill.
Eichengreen, B. and C. Wyplosz (1996): What do currency crises tell us about the future of the international monetary system?, in J. J. Teunissen (ed.), Can Currency Crises be Prevented or Better M anaged?, The Hague, Forum on Debt and Development (FONDAD).
Ffrench-Davis, R. and S. Griffith-Jones (eds.) (1995): Las nuevas corrientes financieras hacia la América Latina: juentes, efectos y políticas, Mexico City, Fondo de Cultura Económica (FCE).
Goos, B. (1996): Floor discussion of the Buira paper, in J. J. Teunissen (ed.), Can Currency Crises be Prevented or Better M anaged?, The Hague, FONDAD.
Griffith-Jones, S. (1996): How can future currency crises be prevented or better managed?, in J. J. Teunissen (ed.), Can Currency Crises be Prevented or Better M anaged?, The Hague, FONDAD.
IMF (International Monetary Fund) (1997): International Financial Statistics Yearbook , W ashington, D. C.
Jiménez, L.F. (1995): Políticas para el control de los movimientos de capitales financieras, Documento de Trabajo No. 35, Santiago, Chile, ECLAC.
Le Fort, G. and C. Budnevich (1995): Capital Account Regulations and Macroeconomic Policy: Two Latin American Experiences, Santiago, Chile, Central Bank of Chile.
Milesi-Ferreti, G. and A. Razin (1996): Current account sustainability, Seminario Regional de Política Fiscal, Santiago, Chile, ECLAC/United Nations Development Programme (UNDP), mimeo.
Ocampo, J.A. and C. Tovar (1997): Flujos de capital, ahorro e inversión en Colombia, 1990-1996, in Flujos de capital e inversión productiva. Lecciones para América Latina, ECLAC/OECD, Santiago, Chile, McGraw-Hill.
EXTERNAL CAPITAL FLOWS IN LATIN AMERICA AND THE CARIBBEAN IN THE IMOs: EXPERIENCES AND POLICIES • GUNTHER HELDAND RAQUEL SZALACHMAN

C E P A L R E V I E W 6 4 * A P R I L 1 9 9 8 47
Sachs, J., A. Tomell and A. Velasco (1996): Financial Crises in Emerging M arkets: The Lessons from 1995, NBER working paper No. 5576, Cambridge, MA, National Bureau of Economic Research, Inc. (NBER).
Soto, R. (1996): El tipo de cambio real de equilibrio: un modelo no lineal de series de tiempo, Análisis empírico del tipo de cambio en Chile, ECLAC/Instituto Latinoamericano de Doctrinas y Estudios Sociales (ILADES), Santiago, Chile.
Steiner, R. and A. Escobar (1995): Acumulación de reservas internacionales: sus causas y efectos en el caso de Colombia, “Financiamiento del Desarrollo” series, No. 30, LC/L.901, Santiago, Chile, ECLAC.
Turner, P. (1995): Capital flows in Latín America: a new phase?, M oney Affairs, vol. VIH, No. 2, M exico City, Centre for Latin American Monetary Studies (CEMLA).
Urrutia, M. (1995): La cuenta de capital durante un proceso d e , liberalización económica, Seminario “Setenta años del Banco Central de Chile” , Santiago, Chile, Central Bank of Chile, mimeo.
Zahler, R. (1992): Monetary policy and an open capital account, CEPAL Review, No. 48, LC/G.1748-P, Santiago, Chile, ECLAC.
(1995): Conferencia inaugural, Seminario “Setentaaños del Banco Central de Chile” , Santiago, Chile, Central Bank of Chile, mimeo .
EXTERNAL CAPITAL FLOWS IN LATIN AMERICA AND THE CARIBBEAN IN THE 1990«: EXPERIENCES AND POLICIES • GUNTHER HELDAND RAOUEL SZALACHMAN


R o b e rto Z a h le r
Former President o f the Central Bank o f Chile.
C E P A L R E V I E W «4 49
The Central Bank andChilean macroeconomic
policy in the 1990s
This article aims to describe and analyze the formulation, im
plementation and results of the macroeconomic policy carried
out by the Central Bank of Chile in the first half of the 1990s.
Section I explains the importance of the macroeconomic bal
ances from the standpoint of the Central Bank of Chile. Section
II describes the Central Bank’s objectives and its interpretation
of the achievement of domestic and external balances. Section
m summarizes the institutional, structural and conjunctural fea
tures which make the Chilean experience a special case. Section
IV sets out the criteria adopted by the Bank in formulating and
implementing its macroeconomic policy. Section V describes
and explains the essential features of the monetary, exchange-
rate, international reserves and capital account openness poli
cies carried out during the period. Finally, section VI describes
the most important results of the above policies and sums up the
main conclusions of this study.
A P R I L 1 9 9 8

50 C E P A L R E V I E W 6 4 • A P R I L 1 9 9 8
IThe basic macroeconomic balances
One of the most important items in the design of economic policy is the role played by the maintenance of the macroeconomic balances in the economic growth process. Fiscal, monetary, exchange-rate, wage and financial policies are of key importance for achieving and maintaining the fundamental macrobalances of the economy, both with regard to employment and stability of prices and of the system of payments (the domestic balance) and with regard to the external sector balance.
In order to achieve and maintain the domestic balance, the level of utilization of the production resources of the country must be such that it does not give rise to inflationary pressures greater than those provided for in the national economic programme. To this end, macroeconomic, and especially monetary and fiscal, policy must be aimed fundamentally at ensuring that aggregate domestic demand is in line with the production potential (the aggregate supply) of the economy.
Although it is true that, as a general trend, global expenditure should not grow more than the potential product1 -a growth rate estimated at approximately 6.5% in real terms per year for the Chilean economy during the first half of the 1990s-,2 it is both possible and desirable to supplement domestic saving appropriately with resources of external origin for financing investment. This makes it desirable that the level of domestic expenditure should only exceed national income by a proportion which depends on the amount, nature and sustainability of the sources of external finance. In the case of the Chilean economy,
□ The author wishes to thank Hector Assael, Gunther Held and Andras Uthoff for their valuable comments,1 Strictly speaking, this assertion is true when the economy is at its production frontier. When it is below this level, it can grow faster (if external constraints permit this). When the economy is overheated, however, it is necessary to adjust levels of activity, so that during this period expenditure must grow more slowly than the potential product.2 See P. Rojas, E. López and S. Jiménez, “Determinantes delcrecimiento del producto potencial de Chile: el rol del comercio", in Análisis empírico del crecimiento en Chile, F, Morandé and R. Vergara (eds.), CEP/ILADES-Georgetown, Santiago, Chile, June 1997.
it w as estim ated tha t m a in ta in ing the ex te rna l balances w as eq u iv a len t to accom m odating a tren d defic it on the balance o f paym en ts cu rren t a cco u n t w ith in the range o f 3% to 4% o f GDP.3
A low rate of inflation is essential when it is sought to achieve ambitious goals in terms of economic growth, investment, employment and reduction of poverty. Since the Central Bank does not have the direct tools for achieving these objectives, it must concentrate its efforts both on reducing the rate of inflation and on progressing towards greater price stability; only in this way can it make an effective contribution to the achievement of such objectives and, hence, the development of the country. It should be noted that price stability is not an easy objective to attain, above all in a country with a history of chronic inflation, like Chile, and with several decades of application of very generalized price indexing mechanisms. Furthermore, in the first half of the 1990s the Chilean economy was operating, for all practical effects, in a situation of full employment and without idle production capacity.
A macroeconomic environment which ensures that inflation is first of all brought under control, then gradually reduced, and finally stabilized at a low rate is an essential prerequisite for achieving high rates of investment and sustained increases in employment and in factor productivity. Experience has shown, however, that bringing inflation down from very high rates to moderately low rates is the easiest part of the stabilization process. The most difficult part is achieving subsequent convergence towards the rates of inflation registered by the industrialized countries. This calls for an unremitting effort to establish conditions favouring a sustained process of slowing down inflation, while at the same time minimizing the presence of distortions which can bring about undesirable fluctuations, if not actual reversal, of that process. The requisites for achieving this result are, among others, the maintenance of strict control over the
3 See N. Eyzaguirre and P. Rojas, “Las políticas monetaria y cambiaria en Chile durante los noventa”, Santiago, Chile, Central Bank of Chile, January 1995.
THE CENTRAL BANK AND CHILEAN MACROECONOMIC POUCY IN THE I t t M * ROBERTO ZAHLER

C E P A L R E V I E W 6 4 • A P R I L 1 9 9 9 51
public finances to avoid expansionary cycles in expenditure; a monetary policy which makes possible real interest rates consistent with the productivity of capital in the long term; a real exchange rate which ensures adequate competitiveness of the tradeables sector while at the same time making possible a level of utilization of external saving in keeping with the viability of the balance of payments in the medium term, and a financial policy which ensures the stability and solvency of the financial system, in order to forestall and prevent repercussions of a macroeconomic nature due to its possible malfunctioning, fragility or even crisis.
It would of course be an exaggeration to pretend that macroeconomic stability is sufficient of itself to achieve high and sustained growth rates. There are other elements of a more structural nature which are also decisive conditions for generating and promoting economic growth and which are connected with the existence of competitive and flexible markets, especially those for the factors of production, and the application of policies to regulate the structure and functioning of some key markets such as the financial market or monopoly markets, as well to foster the processes of saving and investment, human capital formation, and scientific and technological research.
The criteria set forth in the above definition of the macroeconomic environment are not easy to measure. There is therefore usually a good deal of discussion as to whether the levels of interest rates, the exchange rate or the balance of payment current account balance are the right ones for each particular period, and it consequently becomes difficult to judge, when taking a medium-term view, whether or not there are deviations from the macroeconomic equilibrium conditions. The greater the stability of the economy and the more ambitious the anti-inflation objectives pursued, the more complex this problem of diagnosis becomes. Thus, the conditions of macroeconomic instability which give rise to inflation of the order of 30% per year or more are easily identifiable, but those that represent only marginal deviations from an objective of a low rate of inflation, such as that registered in Chile towards the end of the first half of the 1990s, are the subject of considerable discussion and controversy. Prudence, good judgment, careful observation, comparison with the experiences of other countries, and an independent approach in making judgments are very important
assets for making a proper macroeconomic diagnosis in such circumstances.
The difficulty of precisely defining the right environment for the achievement of macroeconomic stability is the reason why, in practice, the rate of inflation is one of the main indicators used for assessing the skill of the economic authorities in controlling that environment.
It is not only the rate of inflation in a given period that is important, however, but also its sustainability in time. Obviously, authorities which repeatedly allow high rates of inflation do not have proper control of the economic situation; the economic agents end up by incorporating a factor of mistrust and uncertainty in their patterns of conduct, which causes them to believe that somehow and some time it will be necessary to make an adjustment in expenditure. There are also situations of low inflation where the policies applied are not sustainable either, however. These cases, which are marked by significant fiscal deficits or balance of payments current account deficits, have usually been followed by the sudden resurgence of latent inflationary problems.4 In these situations, the fiscal and current account deficits are useful indicators for anticipating that in most cases the low rates of inflation observed will not be sustainable in time.
Only those cases where the Central Bank and the government economic authorities have been able to create a sustained environment of low inflation -low in terms of its level or trend- have been successful and have therefore been capable of generating expectations that the current macroeconomic policies will be maintained or, if changes have to be made, that these will be carried out gradually.
In short, the results obtained in terms of inflation and the implementation of policies which are in keeping with the objectives pursued in this respect are of fundamental importance for securing the credibility of economic policy. This credibility encourages the process of saving and stimulates business investment, initiative and innovation, with a corresponding positive impact on the creation of jobs and economic growth.
4 It should be noted that there are some cases where, when there are well-developed capital markets of adequate depth, moderatefiscal deficits are not necessarily a source of inflationary pressures.
THE CENTRAL BANK AND CHILEAN MACROECONOMIC POLICY IN THE 1990a • ROBERTO ZAHLER
Policy objectives
The Charter of the Central Bank of Chile lays down three objectives for that institution: those of ensuring the stability of the currency, the proper functioning of domestic payments, and the proper functioning of external payments. The Charter also states that when adopting agreements the Central Bank must bear in mind the general lines of the government’s economic policy. During the 1990s, the Central Bank of Chile has concentrated its efforts on the gradual, systematic and sustainable reduction of inflation, the definition of a range within which the balance of payments current account deficit must be maintained, and the establishment of suitable conditions for ensuring the stability and soundness of the domestic financial system.5
Consequently, the formulation and execution of the Central Bank’s policies were not directly aimed at the achievement of other government economic policy objectives such as stimulating economic growth, increasing saving and employment, or improving income distribution. There were three reasons for this: first, because the Bank’s objectives are defined by law; second, because the instruments available to the Central Bank are limited, to such a point that some observers claim that the institution does not have the necessary capacity for achieving the three objectives laid down by law, and third, because the achievement of these objectives was approached in such a way as to make it functional to the government’s global development strategy of economic growth with equity.
The objectives laid down by law for the Central Bank of Chile were implemented on the understanding that they would be defined in a long time
5 The present article only analyzes the actions of the Central Bank of Chile with regard to two of these objectives: the control of inflation and the maintenance of the external balance of the Chilean economy. Much of the success achieved in the attainment of these two objectives has been due to the establishment of suitable conditions for the soundness of the domestic financial system and their supervision and follow-up, however. Although it is outside the scope of this article, the “financial development" option (including not only the banking system but also the nonbank financial intermediaries and their proper supervision and regulation, in contrast with the more simplistic policies of “financial liberalization”) has played an important part in the establishment of a macroeconomic and institutional framework favouring coherent economic policies.
horizon, so that their achievement would take place over time, in a sustainable manner. This would also help to give credibility to macroeconomic policy and impart stability and sustainable dynamism to the development process. Another basic feature of the way the Central Bank’s objectives were understood was that they should be achieved within a balanced context, without giving rise to traumas in other key areas of the economy and without it being necessary or even desirable to show spectacular immediate achievements. Instead, priority was given to continuity, a systematic approach, solidity, stability and credibility, together with global macroeconomic balance, with its corresponding positive impact on saving and investment decisions, employment and wages, in a kind of virtuous circle of the economic development process. The alternative would have been to flaunt the apparently rapid and highly successful or even spectacular achievement of a few objectives, but at the cost of giving rise to serious imbalances in other key areas of the economy or society. Experience shows that achievements of this type are marked by their fragility and short duration in time, consequently making it necessary to slow down or even reverse reforms and policy implementation, thereby affecting the confidence of the economic agents and the effectiveness and bases of the macroeconomic programme.
1. T h e a n ti-in flation o b je ctive
Article 3 of the Charter of the Central Bank of Chile lays down that one of the objectives of the institution is to ensure the stability of the value of the national currency. In other words, it lays down the objective of price stability, which was interpreted in the first half of the 1990s as the systematic and sustainable reduction of the rate of inflation to single-digit levels.6
The priority given to the objective of price stability is often questioned on the grounds that the re
6 The Central Bank’s aim was to bring the inflation rate down to the level of the industrial countries, that is to say, between 2% and 3% per year. In accordance with this objective, inflation was to be brought down to single-digit levels by 1995-1996 and then gradually approach the figures in question.
THE CENTRAL BANK AND CHILEAN MACROECONOMIC POLICY IN THE 1990« • ROBERTO ZAHLER

C E P A L R E V I E W 6 4 • A P R I L 1 9 9 8 53
ally important goal is economic development and monetary policy should therefore be subordinated to that objective. This type of criticism is more frequent in periods or situations when the campaign against inflation, reflected in a monetary policy seen as restrictive, leads to a slowdown in the growth rate of the economy.
Empirical studies on the relation between inflation and growth carried out on the basis of data corresponding to developing countries suggest however that, all other things being equal, a higher rate of inflation means a lower rate of growth in the long term. This relation is even more marked in countries with moderate or high inflation. Likewise, the same empirical studies also show that in countries with low and stable inflation rates -around a single digit— variations in those rates tend not to have a serious effect on the economic growth rate.
The objective of price stability, which is shared by almost all the Central Banks in the world -and certainly by all those which are independent, as is the Central Bank of Chile- is not an end in itself. Obviously, the main objective of the economic authorities as a whole is to achieve greater national development and improve the living conditions and quality of life of the population, for which a high economic growth rate is a necessary condition. This does not contradict the achievement of the anti-inflation objective, however. On the contrary, it has been shown both theoretically and empirically that price stability favours economic growth in the medium and long term. The Federal Reserve Board (Central Bank) of the United States, for example, recently published a study in which it shows that lower inflation increases the productivity of the economy. Moreover, inflation is actually a (non-legi slated) regressive tax, since it most heavily affects those with fewer resources, who have less possibility of protecting themselves against it. Consequently, price stability also has a positive effect on income distribution and helps to achieve a society with greater opportunities. Thus, an institution like the Central Bank which seeks to achieve the anti- inflation objective is also collaborating and assisting in the medium and long-term economic development of the country.
During the 1990s, the Central Bank of Chile has taken the view that price stability is a necessary condition for rapid and sustained economic progress and that international experience proves this. From this standpoint, such stability is just one of the measures for the achievement of the more global objective of
good economic performance. An ambitious objective, but one which can reasonably be attained in the case of the Chilean economy, is to arrive at low and stable annual inflation rates like those currently registered in the developed countries. Beyond any doubt, it would be best to be able to live in a world without inflation. The rigidities which have to be faced in real life, however, may make it necessary to permit a slow increase in the price levels of the economy, although at very low rates, in order to facilitate some adjustments in the structure of relative prices. Improvements in the quality of goods and services also involve a tendency toward a statistical rise in price levels. Nevertheless, a stable annual rate of inflation like that registered in the industrial countries could be described, without exaggeration, as thoroughly positive, since the serious problems associated with inflation tend to disappear as the rate of inflation approaches this range.
The aim of achieving a rate of inflation similar to that of the developed countries is also justified because the internalization strategy of the Chilean economy becomes much more efficient in a context of domestic price stability. Likewise, the fact that the consolidated public sector (even after inclusion of the Central Bank accounts) does not show a deficit, together with the increasing soundness of the macroeconomic performance of Chile, indicate that there are no reasons for having inflation rates higher than the international levels. It should, however, be noted that the generalized indexing of the Chilean economy on the basis of past inflation suggests that it would be desirable to progress gradually towards the objective of price stability, for such an approach minimizes the short-term costs in terms of economic activity and employment connected with price stabilization policy, while at the same time the economic authorities steadily gain credibility. This tends to impart growing legitimacy to the anti-inflation policy and makes it possible to further improve monetary policy and make it more efficient, without unnecessarily sacrificing other economic policy objectives.
2, T h e e xte rn a l b a la n c e o b je ctive
Article 3 of the Charter of the Central Bank of Chile also lays down that another of the institution’s objectives is to ensure the normal functioning of external payments. In other words, it lays down the objective of achieving external balance, which has been interpreted as meaning that the balance of payments cur
THE CENTRAL BANK AND CHILEAN MACROECONOMIC POLICY IN THE 1990s • ROBERTO ZAHLER

54 C E P A L R E V I E W 0 4 • A P R I L 1 9 9 8
rent account is an important element and that any deficit on it must be kept within a predetermined range.7
It is often objected that too much importance is attached to the balance of payments current account deficit in the design of macroeconomic policy. It is maintained that the developing countries need external saving to finance investment, and that this deficit is not very important if its financing is covered by net inflows of “private” and “voluntary” capital. It is also argued that the deficit is not a cause for concern when the excess of imports is concentrated in capital goods, especially if the latter are designed to increase the production capacity of the tradeables sector of the economy.
Although the above considerations do make some sense, they are not so important compared with what really matters: the acceptable limits -in terms of both size and duration- of the balance of payments current account deficit The emphasis placed on this deficit, which is fundamentally a reflection of the excess of domestic expenditure over the income of the economy and, more specifically, the emphasis placed on controlling the trend deficit of the balance of payments current account are justified by the decisive influence that external constraints -including the impact of the evolution of the terms of trade and of international interest rates, among other factors connected with Chile’s form of insertion in the international economy- have always had on the vulnerability of the Chilean economy in the past.
Moreover, focusing attention on the evolution of the balance of payments current account deficit is another way of taking care that external saving does not take the place of domestic saving but complements it, so that the latter may finance a high and significant percentage of domestic investment, which is a decisive factor for the stability and sustainability of economic growth.
An item of the greatest importance in the design and execution of Chilean macroeconomic policy in the first half of the 1990s has been the fact that the Central Bank has always resisted the temptation to relax monetary policy ahead of time, in spite of the
7 In the case of Chile, this range was determined, on the one hand, by the fact that it was estimated that the potential product in dollars, at a constant real exchange rate, grows at the rate of about 8% per year. Furthermore, as the external debt in the early 1990s was slightly more than 50% of GDP, a balance of payments current account deficit of (a maximum of) 4% of GDP means that the external debt/GDP ratio would remain constant. The range adopted (between 3% and 4% of GDP) meant that it was not desired to exceed the limit of an external debt equivalent to 50% of GDP; indeed, it was considered prudent to gradually reduce this ratio, which did in fact take place.
easy situation in the external sector due both to the very favourable evolution of exports, whose volume grew at an average annual rate of 10%, and the significant net inflow of external capital, which averaged 6% of GDP. It may be noted that in this period there was heavy pressure for relaxation of the monetary policy (reduction of domestic interest rates) and the modification or even complete elimination of the system of an exchange rate variation band, the international reserves policy, and also the policy designed to deal with short-term inflows of external finance. Yielding to this pressure would have led to greater appreciation of the Chilean peso that that which actually took place during this period, but the distinctive feature of macroeconomic policy in those years was in fact its clear and firm definition and defence of the global strategy, maintaining the monetary policy as long as was necessary to make serious and solid advances in the control of inflation and refusing to allow a larger deficit that that laid down for the balance of payments current account. In this way, the Central Bank helped to consolidate high economic growth for Chile, financed primarily with domestic saving, and in the process it ensured a gradual but credible, sustained and sustainable reduction of inflation, without endangering the medium- and long-term external equilibrium of the Chilean economy.
Consequently, regardless of who was "responsible” for excess domestic expenditure (the public or private sector), the source of its financing (inflows of voluntary external financing or expansion of domestic credit), the composition of imports (consumer or investment goods), or the use made of the latter (expanding the production capacity of the tradeables or non-tradeables sector of the economy), the prime objective of Chilean macroeconomic policy in the first half of the 1990s was to establish conditions which would prevent the generation of a balance of payments current account deficit that might bring into question the sustainability and credibility of the macroeconomic policy.
Although the exact size of the current account deficit that a developing country can reasonably sustain is hard to specify and may vary from one country to another or over time within a given country, the range of 3% to 4% of GDP mentioned above for Chile in the early 1990s was arrived at on the basis of three main guiding criteria.
First, although the trend deficit on the balance of payments current account was substantial, it made it possible to keep steady or slightly improve the usual indicators of external solvency such as, for example,
THE CENTRAL BANK AND CHILEAN MACROECONOMIC POLICY IN THE 1990> • ROBERTO ZAHLER

C E P A L R E V I E W 6 4 • A P R I L 1 9 9 8 55
th e ex ternal d e b t as a p ro p o rtio n o f GDP or o f exports o f goods an d serv ices.
Second, in the light of the level of net international reserves considered desirable, a balance of payments current account deficit of that order of magnitude was in line with the projections of the supply of net medium- and long-term external financing available to Chile.
Lastly, the acceptance of significantly higher levels of current account deficit, even though they
may be considered capable of being financed for a certain length of time, leaves the economy exposed or vulnerable to changes in the liquidity conditions or expectations of international financial markets. These may register sudden big changes due to various types of shocks, ranging from those of a political nature to others such as significant falls in the terms of trade of the economies of the region or rises in interest rates in the industrial countries.
IllInitial conditions
Some structural features of the economy, such as the initial conditions and the institutional context in which macroeconomic policy was carried out in the 1990s, are of great importance because they define and delimit certain special situations which such policy had to deal with in the case of Chile.
a) S truc tu ra l reform sAt the beginning of the 1990s, the Chilean econ
omy had already been operating for some years with a scheme under which various structural reforms had been made, including tariff reduction and simplification, the privatization and radical modification of the Social Security system, liberalization and new legislation for the banking system, fiscal reform, and the privatization of a large number of public enterprises. Many of these reforms suffered serious setbacks over the course of time, but in general the tendency was to reformulate and improve them rather than reverse them.
b ) G row ing openness to the ex te rio rThe Chilean economy is small and quite open to
international trade and finance. During the first half of the 1990s, these features became still more pronounced. Thus, the coefficient of exports of goods and services as a proportion of GDP rose to over 35%, tariffs were lowered from 15% to 11%, the regulations on the foreign exchange earnings of Chilean exporters were steadily eased and finally completely removed, and various bilateral free trade agreements were put into effect.
On the financial level, there was also a process of growing openness to the exterior, with regard to both the inflow and outflow of capital. Foreign investments by Chileans were completely liberalized,
except for those made by banks, pension fund management companies, insurance companies and mutual funds. In the case of these institutions, the liberalization process was more gradual and selective, both through legal restrictions and through those of a prudential nature, mainly promoted by the Central Bank. There was also a growing process of liberalization of capital outflows by non-residents. Thus, for example, the minimum term for the repatriation of foreign investment capital was reduced from three years to one year, the outflow of investments under chapter XIX of the Compendium of International Exchange Regulations was completely liberalized,8 and the advance repayment of foreign debts was liberalized, as was the minimum percentage of external credit that must accompany foreign direct investment.
With regard to the inflow of capital, there was a' significant increase in foreign direct investment, and new mechanisms were authorized and developed such as ADRs (American Depositary Receipts), bonds, and bonds convertible into equity, the conditions of which were also liberalized over time. Because of the negative impact that the excessive inflow of short-term external finance was having on monetary and exchange rate policy, the rate of inflow of such capital was checked and the cost of this type of finance was increased by imposing a requirement for a one-year non- interest-bearing compulsory reserve in respect of most external credits and other sources of foreign- currency financing, which meant an extra charge inversely proportional to the term of such financing.
8 A set of regulations governing the conversion of external debt into investments, introduced during the crisis of the early 1980s.
THE CENTRAL BANK AND CHILEAN MACROECONOMIC POLICY IN THE 1990« * ROBERTO ZAHLER

56 C E P A L R E V I E W 6 4 • A P R I L 1 9 9 8
c) H ig h ra tes o f d o m estic sa v in gAnother significant feature of the Chilean econ
omy in the early 1990s was the high level of domestic saving. Thus, whereas in the first half of the 1980s domestic saving was less than 10% of GDP, in the second half of the decade it exceeded 16% and in 1989 it was a little less than 24% of GDP. Between 1992 and 1996, the level exceeded 25%. It may be noted that the volume of domestic saving depends on the country’s attitude and policies with respect to external saving, since there is abundant empirical evidence of the replacement of domestic saving by external saving, which generally takes place when, in particular circumstances, there is indiscriminate acceptance of “excessive” inflows of external finance, especially of a short-term nature.
d) D eve lo p m en t o f the ca p ita l m arke tThere has been very considerable development
of the capital market in Chile, which has made possible increasing deepening of the financial system. In particular, the demand for Central Bank financial paper, both by banks and by pension fund management companies and insurance companies, has helped not only to create a long-term capital market but also to ensure the smooth execution of open market operations, which have become an effective monetary policy instrument.
e) F isca l su rp lu sIn recent years, the fiscal budget has always
shown a surplus, which made it possible to bring about a relative reduction in both external and domestic debt. The most noteworthy point, however, is that such a surplus was essential if it was desired to offset the substantial quasi-fiscal deficit registered by the Central Bank because, on the one hand, of the sequels of the “rescue” of the private Chilean financial system carried out in the early 1980s and, on the other, the losses suffered by the Central Bank as a result of the significant buildup of international reserves in the first half of the 1990s.
f ) E ffec tive GDP very s im ila r to the p o ten tia l GDPIt may be recalled that in the five-year period
from 1985 through 1989, the main macroeconomic constraint was the shortage of foreign exchange, due mainly to the over-appreciation of the peso in the late 1970s and early 1980s and the consequent balance of payments and external debt crisis and its sequels. Moreover, the high average annual growth rate of GDP in that
period (6.6%) is largely explained by a recovery from the sharp drops suffered in 1982 and 1983 (14.1% and 0.7%, respectively), which meant that in that five- year period the effective evolution of GDP was far below that of the potential product (except in 1989).
In the period from 1992 to 1996, in contrast, there were almost no unused resources in terms of idle production capacity or in the labour market, while the external constraint disappeared as a result of the strong growth in exports and the big inflow of foreign direct investment and international credit during those years. Moreover, because of the overheating of the economy in 1989 and the subsequent evolution of expenditure, GDP growth in the 1990s was close to the limit of the production frontier, or, in other words, the actual level of g d p was very similar to the potential level of the product.
With regard to the economic situation at the end of 1989, this had been preceded by a five-year period in which, as already noted, there had been strong growth of economic activity, led by the increase in gross fixed capital formation and exports. In this context, with GDP growth of 9.9% in 1989, there was obviously excess spending, reflected not only in a level of economic growth which was not sustainable over time, but also in the speeding up of inflation and excessive growth of imports. This situation required an adjustment process in 1990, which was marked by the adoption of an austere fiscal policy and a restrictive monetary policy.
g) G enera lized indexing o f p r icesGeneralized indexing of prices is another feature
of the Chilean economy. As a result of chronic inflation and the size and unexpected fluctuations of price increases, Chilean society had got used to “living with inflation”, protecting itself from some of its harmful effects by the incorporation of price readjustment clauses based on past inflation. In this way, such decisive prices as the exchange rate, interest rates, wages, rents and taxes, among others, have to a large extent incorporated indexing clauses which, while they have relieved some of the problems caused by inflation and have helped to increase financial saving, have also affected the design and execution of fiscal, monetary, exchange rate and wage policies.
h) A lm o s t com p le te absence o f dom estic f is c a l d eb tThere is practically no domestic fiscal debt in
Chile: its place is taken by the domestic debt of the Central Bank. Thus, as a consequence of the rescue
THE CENTRAL BANK AND CHILEAN MACROECONOMIC POLICY IN THE 1990* * ROBERTO ZAHLER

C E P A L R E V I E W 6 4 • A P R I L 1 6 9 8 57
operation for much of the private banking system affected by the financial crisis of the early 1980s, the Central Bank directly and indirectly took responsibility for avoiding the effects of the monetization of that rescue operation by issuing domestic debt paper, mostly in “readjustable” pesos. Likewise, in the 1990s the Central Bank took responsibility for and paid the cost of avoiding the monetary impact of the significant accumulation of international reserves, by issuing its own debt paper, so that in practice it has been responsible not only for monetary policy but also for that of the Treasury, that is to say, for managing the domestic public debt.
i) A u to n o m y o f the C en tra l B ankAnother feature worthy of note is the recently
introduced autonomy and independence of the Cen
tral Bank, which is a decisive factor in the design of macroeconomic policy and in the institution’s will and credibility for combating inflation, with the consequent impact on fiscal policy and the formation of expectations among the various economic agents.
j ) The sh a red o b jec tives o f the governm en t a n d theC entra l B ankFinally, another important point is the fact that
the government and the Central Bank share the same objectives. Thus, beyond any differences of opinion and emphasis which may exist between the two, there has been coordination and collaboration between the fiscal and monetary authorities with regard to the broad lines of macroeconomic policy, and this has undoubtedly contributed to the effectiveness of the design, formulation and results of that policy.
IVCriteria for the formulation and execution of macroeconomic policy
In the light of the initial conditions of a structural, institutional and current nature which marked the Chilean economy at the end of the 1980s, the Central Bank laid down four basic criteria which were to govern its action during the first half of the 1990s.
1. T h e g lo b a l m a c ro e c o n o m ic b a la n ce
A fundamental criterion in the Central Bank’s antiinflation policy was to avoid giving rise to major imbalances in other key areas of the economy. Thus, achievements with regard to inflation must not be secured at the cost of generating a substantial increase in the levels of unemployment and idle capacity, upsets in the financial markets or an unsustainable deterioration in the external accounts. Such internal or external imbalances not only involve high costs in themselves but also undermine the credibility of the stabilization effort, shed doubts on its sustainability, delay its effects, and finally turn out to be counter-productive if that effort finally has to be abandoned halfway.
2. T h e m e d iu m - a n d lo n g -te rm h o rizo n s
A second fundamental criterion for understanding the Chilean Central Bank’s actions in the first half of the 1990s was the time horizon that it took into account in adopting its policies. It always tried to ensure that its decisions gave priority to the stability and solidity of the economy, which meant setting itself a time horizon that took account mainly of medium- and long-term trends; in other words, the Bank's policies must go beyond the short-term, day-to-day situation.
The current or short-term economic situation must of course be observed with close attention, since it affects the future evolution of the various economic variables. Nevertheless, the Central Bank must take its decisions in the light of the medium and long term, because ultimately what it really wants to do is to ensure the stability of the main macroeconomic variables over time, and not give rise to transitory or temporary booms which later have to be reversed, with the consequent negative impact in terms of accentuating the cycles of activity and contraction, as well as the greater uncertainty generated in the taking of decisions by the economic agents.
THE CENTRAL BANK AND CHILEAN MACROECONOMIC POLICY IN THE 1990s • ROBERTO ZAHLER

58 C E P A L R E V I E W $ 4 • A P R I L 1 9 9 8
There are various grounds for the importance of the medium-and long-term horizon in the Central Bank’s decisions. On the one hand, there is an ongoing discussion about the medium- and long-term effects of short-term measures. Thus, in certain circumstances it is possible to stimulate economic growth temporarily by relaxing monetary policy. This would reflect a short-term approach, however, since generally speaking it would adversely affect the long-term growth possibilities of the country. Moreover, it would undoubtedly be necessary sooner rather than later to apply an adjustment policy and hence return to a more restrictive monetary policy. It is because of this conflict between the short and long term that many countries have decided to make their Central Banks autonomous, entrusting them with the basic objective of combating inflation. Monetary policy is thus given a longer time horizon, precisely because of the need to avoid the application of a short-term approach in its execution; when such an approach is taken, it tends to be reflected in the adoption of hasty or even frankly mistaken monetary policy decisions every time that one or another of the economic indicators shows a certain amount of weakness.
Secondly, the Central Bank of Chile has been criticized on a number of occasions, perhaps by persons who were not aware of the medium- and longterm approach taken by it in its actions, for not having achieved major advances in terms of price stability. It was claimed that it would have been possible to make faster progress in this respect, and reference was often made to the experiences of other countries of the region which appeared to be obtaining quicker or more spectacular results than Chile in controlling inflation. In response to this criticism, it should be pointed out that there has in fact been notable progress in controlling and reducing inflation. Thus, after standing at 27.3% in 1990, the growth rate of prices went down steadily to values almost identical with the planned goals in terms of inflation. In 1996, inflation was 6.6%, which was very similar to the goal of 6.5% set for the end of the year. Moreover, although indexing does have some positive aspects, it makes the abrupt reduction of inflation too costly in terms of its effects on the product and employment. For this reason, it has been preferred to deal with inflation through a gradual strategy, on a secure and consistent basis. It should also be noted that Chile has not used the exchange rate for antiinflation purposes. If it had done so, it would have
progressed more rapidly in bringing down inflation, but most likely the short-term benefits of that strategy would have been offset by the costs that would be incurred in the longer term. The painful experience of the early 1980s was something that the Central Bank of Chile was not willing to repeat. As was made clear on that occasion, the use of the exchange rate to achieve better anti-inflation results is a policy which more often than not tends at some point in time to lose its effectiveness and to begin to militate against the possibility of achieving the objective pursued.9
Third, experience has shown that monetary policy takes some time to begin to affect the course of the economy: for a country like Chile, the measures in this field must be taken bearing in mind their effects in the following 6 to 18 months.
Finally, on various occasions the conduct of agents who are using very short-term horizons conflicts with the elements defining the conditions for medium- and long-term equilibrium and development. Thus, for example, financial logic, which is more often than not of a very short-term nature, may give signals and determine prices which cause the tradeables sector of the economy to take mistaken decisions with regard to investment and resource allocation. Likewise, short time horizons like those typical of some information media or specific sectors of activity may affect expectations and investment decisions and even the policy options of the authority, through signals and prices which are not correct from the medium- and long-term development standpoint. Thus, this once again justifies the medium- and long-term approach taken by the Central Bank, which helps to correct or at least limit the distorting effects of an excessively short-term approach on the conduct of the economic agents.
3. P ru d e n c e a n d g ra d u a lity
The Central Bank is an institution which, by the very definition of its objectives -seeking the stability of the currency and the normal functioning of internal and external payments- must be very prudent in its actions. Any decision taken hastily, without prior appraisal of its effects, can and usually does have
9 Sooner or later, the appreciation of the currency becomes unsustainable and costly and complex side effects are generated in other key areas of the economy, such as loss of competitiveness and deterioration of the banking system and/or the need for an eventual devaluation which completely wipes out the progress made against inflation.
THE CENTRAL BANK AND CHILEAN MACROECONOMIC POLICY IN THE 1990« • ROBERTO ZAHLER
C E P A L R E V I E W 6 4 • A P R I L 1 9 0 8 59
extremely harmful consequences for the functioning of the economy.
Moreover, the approach based on the use of medium-term horizons also suggests that a prudent reaction should be taken to the short-term variations displayed by some individual indicators. Monetary and exchange rate policy decisions must be based on the trends of a broad set of indicators, and not on very short-term data covering one or two months. In effect, the policy measures adopted by the Central Bank of Chile were not the result of hasty reactions to indicators for a particular month or period or isolated figures, no matter how spectacular they might be. It should be clearly understood in this respect that the monthly fluctuations shown for example by the Monthly Index of Economic Activity (IMACEC) or the consumer price index itself (CPI) merely represent a couple of items in a considerable group and only assume their true importance when they used, not in an isolated manner, but in terms of their trend values and in conjunction with other complementary indicators such as the evolution of employment, wages, the exchange rate, expenditure, the trade balance and the balance of payments.10
In line with this approach, the Central Bank must proceed on solid bases, although this does not mean reacting in a tardy manner. On the contrary, the really important thing is that the institution should always try to take measures which anticipate inflation rather than waiting for the latter to show itself openly. Thus, as inflation usually reveals itself with some delay, the Central Bank must be on the watch for incipient signs of inflationary pressures and must act firmly to forestall them and neutralize them as soon as possible. It is neither prudent nor efficient to put off certain adjustments until the imbalances are reflected in the inflation rate itself. At that point in time, the inertia introduced through nominal adjustments in wages and prices, together with the loss of credibility in respect of the anti-inflation commitment of the authorities, make necessary stronger adjustments which secure the same results against inflation, but at a considerably higher cost in terms of employment and economic activity.
Consequently, the reactions of the monetary
10 It should also be noted that this approach based on prudence and graduality is not only useful for understanding the monetary and exchange rate policy of the Central Bank of Chile during the 1990s, but also for understanding its strategy with regard to the opening up of the capital account.
authorities must be timely, but never hasty. Sometimes, the institution is criticized for not reacting immediately to particular market signals. The truth is that on most occasions it would have been a mistake for the Central Bank to react to a short-term phenomenon which has a high probability of being reversed in the future. Acting in this manner would only result in the adoption, within a short space of time, of decisions in one direction or another which soon had to be reversed, thus eventually merely adding still more “noise” to the economy and generating adverse effects on the level of activity, investment and employment.
On the contrary, the past experience of Chile, as well as of various other Latin American countries, indicates that very drastic or shock-type measures are justified mainly in the case of critical or veiy special situations, such as very high and uncontrollable inflation or a growing fiscal deficit, or else in order to bring about a significant turnaround in expectations. The impact of the Central Bank’s policies is so great, however, and has so many repercussions on different economic sectors, that as a general rule the Bank must be extremely prudent and proceed in a gradual manner in adopting its decisions. For the same reason, it is necessary to make systematic assessments of the direct and side effects of those decisions. Graduality and prudence are therefore very good guidelines for the taking of decisions, since they make it possible to correct situations in a non-traumatic manner. To put it more bluntly, the Central Bank should not have any interest in seeking to show spectacular results which the slightest unforeseen event could reverse but should prefer forms of progress which are more gradual but have stable and solid bases on which they can be firmly consolidated.
It is important to emphasize the significance of graduality when describing anti-inflation policy, since although more significant and more rapid advances in this respect might seem desirable, they could end up having too high a cost in terms of employment and production, especially in cases like those of Chile, where indexing practices (on the basis of past inflation) are generalized and extend to the most varied kinds of transactions. Thus, as in other matters, in combating inflation the Bank gave priority to a strategy which is gradual but rests on solid and permanent bases. This has enabled the progress made not only to be solidly based but also to be perceived as solid and unlikely to be reversed in the future. Moreover, since the anti-inflation strategy
THE CENTRAL BANK AND CHILEAN MACROECONOMIC POLICY IN THE 1990s • ROBERTO ZAHLER

60 C E P A L R E V I E W 8 4 • A P R I L 1 9 9 8
itself formed part of the approach based on the global macroeconomic balances, the Chilean economy has not shown any major imbalance which could give rise to fears of runaway inflation in the foreseeable future. It should also be noted that an inflation reduction policy which is gradual and sustained means that, as the Central Bank gains increasing credibility, contracts and expectations will incorporate the descending goals in terms of inflation established by the Bank, thus minimizing the risk of giving rise to imbalances in other markets and consolidating the continued existence of the advances achieved in the past.
It is worth noting that, thanks to this gradual approach, it was possible to make a highly significant achievement: to stabilize inflation within a range not seen in Chile for decades past. Thus, on the last two occasions when the country attained a level of inflation similar to, although somewhat higher than, that registered in the mid-1990s, the accumulated imbalances were such that in a few months everything that had been gained was dramatically lost. One of these episodes was in 1981, when, after the fixing of the exchange rate, inflation went down to 9.5%; on that occasion, the external imbalance was so great that the following year it was necessary to devaluate the currency and inflation rose to over 20%. The other, more recent, episode took place at the end of the 1980s, when, after going down to less than 13% in 1988, inflation speeded up again in 1989 because of the big increase in accumulated expenditure in previous years. The important thing, then, is to achieve a permanent, sustained reduction in inflation rather than bringing it down in one or two years only for it to speed up again later. Thus, in the period from 1992 to 1996, an average annual rate of inflation of 9.7% was achieved, which is the lowest rate registered for a five-year period in Chile for over half a century, and it must be emphasized moreover that this antiinflation achievement took place in an environment of strong but sustainable growth of economic activity and solid external accounts.
The gradual approach, together with the use of a medium- and long-term time horizon, is also reflected in the strategy for the opening up of the capital account. As we shall see later in this article, the Central Bank has made significant progress in this field in recent years. Some analysts, however, maintain that the progress should have been even more rapid, even going so far as to suggest total and immediate indiscriminate financial openness. The problem of hasty openness is that it usually gives rise to seri
ous upsets in the economy, including abrupt changes in the real exchange rate or problems in the financial sector. We may recall, for example, the experience of some Latin American countries in the indiscriminate opening up of their capital accounts in the late 1970s, as well as some more recent examples, prior to the Mexican crisis at the end of 1994, which mostly ended up as resounding failures, with a capital account that was more closed in practice than it had been before the attempt was made.
In saying this, we are trying to emphasize that although growing and decided linkages with the international financial markets are desirable, the success of this process depends largely on ensuring that its form, speed and selectivity are such as not to give rise to major upsets in the national economy. Financial openness must therefore be introduced in a prudent, careful and gradual manner.
4. T h e ro le of th e m arket in d e te rm in in g k e yprices
In an economy, there are certain key prices which it is extremely important to determine correctly, that is to say, in such a way that they reflect the true supply and demand conditions, which are those of the most structural nature. The main prices are wages, interest rates, the exchange rate, and the prices of certain assets, especially those on the stock exchange and in the real estate sector. The two key prices where the Central Bank has intervened most directly are the exchange rate and interest rates. If these prices are out of line with their fundamental determinants, this usually causes serious damage to the financial system and adversely affects the basic macroeconomic balances.
There are important precedents, especially in Latin America, of distorted key prices which subsequently led to serious crises. Generally speaking, one of the first sectors to be affected has been the financial sector. Thus, for example, unsuitable legislation, supervision or regulations for the financial system have given rise to problems of what is known as “moral risk”, which tend to foster the existence of abnormally high interest rates. Such interest rates, even though they are market rates, are not equilibrium rates and are not sustainable in time, and they end up by undermining the payment capacity of the financial system’s debtors. What happened in Chile in the second half of the 1970s is a typical example of this. Quite a number of analysts attribute the financial crisis of that period to unusually high real interest
THE CENTRAL BANK AND CHILEAN MACROECONOMIC POLICY IN THE 1990« • ROBERTO ZAHUER

C E P A L R E V I E W 6 4 • A P R I L 1 9 9 8 61
rates which, although they were market rates, could not be home indefinitely by the system. In cases like this, monetary policy becomes very ineffective, while the fragility of the banking system is greatly increased, thus endangering the macroeconomic achievements.
Something similar can occur with the other key price mentioned above: the exchange rate. Fixing an excessively depreciated exchange rate, or carrying out indiscriminate or over-hasty opening up of the capital account, usually results in heavy external indebtedness, generally of a short-term nature, and an over-appreciated domestic currency. When this situation has to be reversed -in order to cope with the servicing of that debt- the effects are usually traumatic: big falls in real wages and employment and/or reductions in the liquidity and solvency of the financial system, all of which jeopardize the macroeconomic balances. Moreover, the effects of an over-appreciated domestic currency on the balance of payments current account make the country very vulnerable to any kind of external shock or to changes in the expectations of international creditors and investors.
In short, distorted key prices can produce serious crises both in the financial system and in the maintenance of the macroeconomic balances.
This does not mean that the authorities should constantly intervene in these markets. Indeed, the
yCentral Bank i
contrary should be the case: that is to say, official intervention should be kept to the minimum, or carried out only when a major short-term imbalance is being produced; instead, mechanisms should be established which make possible suitable regulation and supervision under which the market can operate more freely and efficiently.
In the light of the foregoing, it should be noted that one of the explicit objectives of the Central Bank was to give the market an increasingly large role in the determination of these key macroeconomic prices, because as the Chilean financial and exchange markets develop and become deeper and more sophisticated, there will be fewer and fewer market flaws in the determination of such prices. Examples of this are the broadening of the range of fluctuation of the exchange rate, the application of more flexible rules on the exchange operations that banks can carry out, and the development of private mechanisms for covering exchange risks. In the monetary and financial area, an example is the growing use of the system of auctioning Central Bank promissory notes, so that the Central Bank now concentrates the bulk of its monetary policy on direct management of the one- day interest rate, while the market is an increasingly prominent actor in the determination of interest rates for longer terms.
1. M o n e ta ry p o lic y
The monetary policy of the Central Bank of Chile has been based on the aim of keeping short-term real interest rates at a level in keeping with the targeted inflation.12 The reason for this policy lies in the influence of interest rates on the rate of expansion of aggregate expenditure.
In order to achieve a nominal objective such as price stability, monetary policy must have some nominal “anchor”. Two of the most frequently used anchors are the control of some monetary aggregate and the use of the nominal exchange rate. In the case of Chile, the first of these was discarded because no stable and predictable link was found between the nominal monetary aggregates and nominal expendi-
ture or income, due mainly to the instability of shortterm demand for money. In these circumstances, the establishment of fixed intermediate goals would not
11 The control of aggregate demand, which is the main foundation of macroeconomic stability, calls for coordination between fiscal policy and monetary policy. Moreover, this coordination must go beyond measures to avoid the monetization of public deficits and must also extend to control over the growth of public expenditure in the medium term and the design of an explicitly counter-cyclical fiscal and tax policy. An analysis of aspects of the coordination of these two policy areas and of the fiscal policy of the period in question is outside the scope of the present article, however. The omission of this issue here is in fact an acknowledgement of its importance, which is so great that it would require treatment equivalent to that given to the Central Bank policies themselves.12 Because of the indexing of the Chilean economy, real interestrates have been used: i.e., rates adjusted by the rate of inflation.
THE CENTRAL BANK AND CHILEAN MACROECONOMIC POLICY IN THE 1990« • ROBERTO ZAHLER

62 C E P A L R E V I E W 6 4 • A P R I L 1 9 9 6
be an efficient way of achieving a given objective, and furthermore it would give rise to big fluctuations in interest rates, which would affect investment and economic activity. In various international cases, the use of the nominal exchange rate as a monetary anchor has proved to be a very risky instrument which usually involves high costs in terms of employment and loss of external competitiveness. Generally speaking, the anti-inflation achievements obtained through this instrument are only temporary, as occurred in Chile in the early 1980s, for over-appreciation of the local currency adversely affects the achievement of external balance, giving rise to a devaluation which ends up by wiping out or even reversing the advances made in the reduction of inflation. Moreover, an anchor of this nature leads to excessive rigidity in the design and formulation of general economic policy.
The instability of the relationship between these intermediate objectives and the final objective of controlling inflation caused the Central Bank to centre its action directly on the final objective: the reduction of inflation. Thus, the nominal anchor of monetary policy was the explicit inflation goal, announced each year by the Central Bank in its official report to the Senate. The inflation goal was scheduled to follow a downward path, and its value was fixed by agreement with the Ministry of Finance with a view to progressing towards price stability, but without sacrificing economic activity, employment or other key macroeconomic variables such as saving and investment, the external balance, or the stability and solvency of the financial system.13
The role of the inflation target as the guiding thread of its policies has permitted the Central Bank to take timely preventive action, based on the whole of the information available, directly adjusted in the light of the evolution of the underlying or trend inflation. A tradeoff of the flexibility provided by a strategy based on the final objective of reducing inflation, without intermediate monetary policy objectives, is that it requires great credibility. It should be emphasized that although the Central Bank did not lay down explicit intermediate objectives, it was always on the watch for the first signs of macroeconomic imbalances, especially deviations between the levels
13 This policy obliges the monetary authorities, in the event of an unexpected disturbance or when the effective inflation deviates significantly from the target figure, to make the changes needed to deal with these situations and comply with the inflation goal whenever needed and as vigorously as is necessary.
and grow th ra tes o f do m es tic expend itu re an d the effec tive GDP, on th e o n e hand , and be tw een the e ffective an d th e po ten tia l GDP, on the other.
The gap between the growth of domestic expenditure and the growth of GDP is a signal of the future evolution of the country’s external accounts. If the growth in expenditure is very rapid, this indicates that there will be an accentuation of the balance of payments current account deficit. Depending on the initial starting point, the evolution of the terms of trade, and the external balance objective, such a deterioration may not be a cause for much concern. A significant and lasting discrepancy is more than just a warning sign about the failure to comply with the external equilibrium objective and the need to carry out an adjustment, however.
The gap between the effective and potential GDP, for its part, is a sign that there may be problems in the domestic component of the inflationary trend, although the lag and size of that relation may vary. Naturally, in order to determine this gap it is necessary to have some kind of estimate of the potential GDP.14
Nor is it possible to ignore the importance of certain conditions which ensure the proper functioning of a market economy and have a positive effect on productivity.15
We should not lose sight, however, of the fact that the product gap -that is to say, the difference between the effective and potential GDP- is only one of the factors determining inflation. In any case, it is necessary to make a distinction here between the growth rates and levels of the product. Inflation depends mainly on the levels of the product or, in other words, it is the difference between the effective GDP and the potential GDP which puts pressure on prices. This is an important point, because if at a given moment a country has a level of product which is significantly below the potential level, it may grow faster than the potential product itself, thus reducing
14 For this purpose, a production function is estimated in which the physical stock of capital is undoubtedly an important element which reflects the existence of a close correlation between economic growth and the rate of investment. This does not, however, mean that there is a simple linear relationship between growth and investment, nor does it mean that we can ignore the fact that there are other elements in that function, such as technology, the labour force and its level of skills.15 Thus, it is well known that prices which accurately reflect theconditions of relative scarcity, competition, openness of the economy, etc., among others, are important factors which make it possible to raise the levels of productivity and hence the level -and probably also the growth ra te- of the potential GDP.
THE CENTRAL BANK AND CHILEAN MACROECONOMIC POLICY IN THE 1990« • ROBERTO ZAHLER

C E P A L R E V I E W 6 4 • A P R I L 1 9 9 8 63
the product gap, without this resulting in major inflationary problems.16
With regard to the implementation of monetary policy, the product gap was just one of a number of indicators, although this did not mean that it was any less important. Thus, there are other indicators which also have to be taken into account when taking a decision on monetary policy. In the case of Chile, the indicators used included those on the labour market (nominal and real wage increases, narrowness of the market, etc.); the evolution of the monetary aggregates (growth rates of M l, M2, etc.); credit information (growth rates of consumer loans, mortgage loans, total credit to the private sector, etc.); indicators of aggregate expenditure (industrial sales, imports, private consumption); and the evolution of inflation and of some prices (the exchange rate, prices in the non-tradeables sector, etc.). Thus, for example, if the country was affected by a recession but at the same time wage demands continued to rise, the monetary policy should not be relaxed until those pressures on costs disappeared. The same would apply if other indicators, such as those just mentioned, were not in line with the Central Bank’s objectives with regard to price stability. In short, what we are trying to emphasize is that the product gap is not the only determinant of inflation.
A problem arises with the above approach when there are mixed signals. Theoretically, an increase in the product gap should be accompanied by other elements which also show a fall in inflationary pressures. This is because a low economic growth rate reduces the, growth rate of demand for both money and credit. Likewise, as demand in the labour market goes down, wage pressures should also go down. This is what we ought to be able to expect in theory; to have clear signals for both the short and the long term. In practice, however, monetary policy is a good deal more complex and it is not possible to wait for the long term in order to have signals that are less ambiguous. The fact is that mixed signals are the rule rather than the exception. For example, the recovery of an economy may be just around the comer, but it may be far from being reflected in the product or other measures of economic activity. In this case, if the monetary authorities over-react to the product
16 This is one of the factors which explain what happened in Chile in the second half of the 1980s, when the starting point of the GDP was very low because of the severe recession that took place at the beginning of that decade.
gap they could be giving rise to problems of inflation in the future of making them worse. This means that although the product gap is an important indicator, it should not be given excessive weight and still less should it be considered as the final objective of monetary policy. Once again, what is involved here is the credibility of the Central Bank. In order to maintain this, it is essential that the Bank should show a strong commitment to its main goal: price stability.
At the same time, some comments are called for on the well-known topic of timing in monetary policy. We have already mentioned some of the reasons why giving disproportionate weight to the product gap may be inappropriate in terms of the objective of price stability. Another reason is related with the monetary authorities’ skill in choosing the right moment. The information on the evolution of economic activity suffers from significant lags, and the limitations of the main indicators are well known. There are also lags between the moment when monetary policy measures are applied and the moment when they begin to take effect. Consequently, the monetary authorities are always faced with the risk of overreacting -in a recession, for example- if they do not see signs of a recovery. In these cases, it would be prudent to use other indicators to confirm or deny possible reactivation. Impatience in this respect, reflected in the provision of an extra monetary stimulus by the Central Bank, could finally set off still greater inflationary pressures. The opposite would occur in boom periods: if a slowdown had already begun, then greater monetary restrictions would accentuate it. In short, it is essential that monetary policy should try to be anticipatory and preventive and that the monetary authorities should always be conscious of the existence of lags and the fact that belated action may heighten the economic cycle instead of softening it.
With regard to the execution of monetary policy, in mid-1995 a change was made in the way this had been done for more than a decade. Thus, with a view to using more flexible and efficient instruments, the Central Bank stopped directly fixing the interest rates of 90-day Central Bank paper and concentrated its policy on the one-day interest rate.17 The aim of these
17 As a complement to its interest rate policy, the Central Bank also made an important change in the determination of the liquidity conditions of the economy, allowing the market to play an increasingly large role in determining medium-and long-term interest rates and extending the maturity of the domestic public debt.
THE CENTRAL BANK AND CHILEAN MACROECONOMIC POLICY IN THE 1990s • ROBERTO ZAHLER

64 C E P A L R E V I E W 6 4 • A P R I L 1 6 9 8
measures was, on the one hand, to give the market a greater share in determining the price of all the documents issued by the Central Bank, and not just the interest rate for medium- and long-term documents; and on the other, to regulate liquidity more efficiently and prevent expectations of possible changes in the interest rate of the longer-term documents of the Central Bank from distorting inter-bank market operations. In fact, the use of the one-day interest rate as a main monetary instrument has been shown to be an effective way of minimizing the influence of capital gains or losses and an efficient tool for countries with more developed financial markets. Furthermore, this measure was in keeping with the growing financial integration of the Chilean economy, making possible a more flexible way of implementing monetary policy, for because of the interrelation of domestic and external interest rates it is desirable to eliminate any rigidities which encourage undesirable movements of financial resources and prevent adjustments from being made in a manner more evenly shared between the exchange rate and interest rates, in order to make monetary policy management less complicated and more efficient.
To sum up, the new form of monetary policy is more effective because it gives the Central Bank more initiative and flexibility and permits greater frequency in movements of short-term interest rates, which in turn affect the rest of the rates, themselves increasingly determined by the market. All this makes possible better control of liquidity conditions in order to influence the evolution of aggregate expenditure and inflation. Under these conditions, the impacts and the volatility caused by disturbances affecting the Chilean economy are shared out evenly between movements of the exchange rate, interest rates and the international reserves, and the reconstitution of portfolios.
2. E x c h a n g e rate p o lic y
After the recovery of access to voluntary external financing in the 1990s, the experience of the early years of the previous decade made the economic authorities wary of basing the struggle against inflation on a single instrument such as the exchange rate. Such a practice can lead to serious macroeconomic imbalances and thus to failure. It has also been seen that any attempt to force the value of the real exchange rate up to a high level is also doomed to failure if the exchange rate policy is not accompanied
by extremely austere macroeconomic policies, which may lead to the sacrificing of future growth capacity, because of the adverse impact that this context usually has on investment.18 Consequently, an artificially high real exchange rate does not have any point either, except in critical situations. The exchange rate policy of the first half of the 1990s therefore sought to avoid serious deviations which could divert the market exchange rate from its medium- and longterm equilibrium path.19
In the first half of the 1990s, the Chilean economy was in a phase of development different from that of previous decades. Its structural reinsertion into the international economy was becoming increasingly evident, both in the area of finance and in that of real trade. The export sector was diversifying and considerably expanding its coverage of products and markets. The economy was much more open, and tariffs continued to be reduced. Foreign investment in and by Chile was increasing to very high levels. Moreover, all the indicators of external creditworthiness were markedly improving, while the country risk and external vulnerability were going down significantly, and exchange rate policy also had to adapt itself to this new environment.
Thus, during the first half of the 1990s the main objective in the formulation and execution of exchange rate policy was to complement the fiscal and monetary policies in order to achieve the external balance of the economy in the medium term. To this end, efforts were made to ensure a suitable flow of
18 After the 1982 crisis, Chile faced serious external constraints due mainly to the end of voluntary capital inflows. This made it essential to adopt a real exchange rate which was sufficiently high to generate the necessary foreign exchange by stimulating exports and import substitution activities. The fiscal and monetary policies of this period were aimed fundamentally at achieving a “high” real exchange rate, mainly thanks to the high rate of unemployment, which made possible a drop in real wages. On the other hand, although expenditure was kept at a moderate level in order to avoid the inflationary spiral that could be provoked by the devaluations, it did not prove possible to make any progress against inflation.19 In an economy like that of Chile in the 1990s, it is not reasonable to suggest that the Central Bank should fix the real exchange rate, for the growing process of trade and financial integration, the volatility of the terms of trade, changes in the country risk rating, investment in the tradeable goods sector and the unequal technological development of the tradeable and non- tradeable goods sectors cause the equilibrium real exchange rate to vary. This means that as these structural changes take place, the level of the real exchange rate which gives external balance changes, and the Central Bank must permit the necessary adjustment.
THE CENTRAL BANK AND CHILEAN MACROECONOMIC POLICY IN THE 1990« • ROBERTO ZAHLER

C E P A L R E V I E W S 4 * A P R I L 1 9 9 8 65
external saving to complement domestic sources for financing investment, which meant seeking a balance of payments current account deficit of 3% to 4% of GDP, of a structural or trend nature, as a way of achieving the Central Bank’s legally mandated objective of ensuring the normal functioning of external payments.20 The reason for maintaining this range is that a smaller amount of external saving is not sufficient for a country like Chile, which requires an external contribution in addition to its domestic saving in order to finance a high rate of investment, while on the other hand the existence of balance of payments current account deficits constantly higher than this range could endanger the solvency of the Chilean economy. In short, the aim was to avoid levels of external indebtedness so high that they could increase the vulnerability of the national economy to unexpected shocks.21
A second objective of exchange rate policy was to deal with the temporary short-term fluctuations in the exchange rate in order to partly neutralize the effect of the inflow of speculative capital, which could adversely affect the achievement of both the domestic and the external balance.
At the same time, the policy followed made possible continued gradual progress in the strengthening of the Chilean peso, avoiding traumatic adjustments and giving the business sector time to increase its productivity and adapt to the new situation, in order to maintain the dynamism of the export sector.
20 This range (3% to 4% of GDP) must not of course be taken rigidly, for in some years there may be temporary situations which lead to a level higher or lower than this. In 1992 and 1994, for example, the balance of payments current account deficit was much lower than the range in question, and there was even a small surplus in 1991 and 1995. On the other hand, in 1993 and 1996 the disturbances affecting the prices of the main export products were so great that the current account deficit slightly exceeded the 4% ceiling. The important thing is not the result of a particular year, but the trend observed in this respect. In this context, it may be reiterated that the equilibrium real exchange rate is that which permits the achievement of the objectives laid down for the current account in the medium and long term. This highlights once again the importance of the medium- and long-term criteria so often observed in the Central Bank’s strategy in the first half of the 1990s.21 This vulnerability has been markedly reduced. In 1993, for example, although this was a very negative year in terms of the prices of Chilean exports, the economy nevertheless grew more than 6% without this giving rise to inflationary pressures or pressures for devaluation. It should be noted that in the past the Chilean economy generally suffered severe recessions, accompanied by devaluations and increases in inflation, every time there was an external shock of any magnitude.
Three main elements stand out in the application of the above exchange rate policy: the existence of a broad pre-announced currency floating band; ii) the. transition to a basket of currencies, to the differential incorporation of domestic and international inflation, and subsequently, to the trend-based appreciation of the Chilean peso; and iii) the possibility of Central Bank intervention within the band, through a “dirty float” mechanism.22
Exchange rate policy was implemented through a system of a pre-announced band within which the market exchange rate was located. The width of the band was increased to plus or minus 10% around the central point of the band. This central point, termed the “agreement” (‘acuerdo’) exchange rate, is determined on the basis of a basket of currencies23 whose weightings reflect the relative importance of the U.S. dollar, German mark and Japanese yen areas in Chile’s external trade transactions. This central parity is adjusted daily by the domestic inflation of the previous month, less an estimate of the international inflation affecting Chile.24 At the end of 1995, an additional discount of 2% per year was included, based on the productivity differential between Chile and its main trading partners, which meant a gradual appreciation of the peso in response to stable changes in the Chilean economy’s linkages with the world economy.25
The justification for the system of an exchange rate fluctuation band around a central parity is the
22 The aim of these interventions was to increase or decrease temporary fluctuations in the exchange rate, but not to try to break trends.23 The linking of the peso to a basket of currencies, instead of solely to the U.S. dollar, made it possible on the one hand to make Chilean monetary policy more independent of that of the United States and, on the other, to give rise to greater short-term uncertainty about the peso/dollar exchange rate (unlike the peso/currency basket exchange rate), in order to serve the objective of discouraging interest rate arbitrage.24 Consequently, the central parity of the basket is announced a month in advance, for each day of the following month, whereas the peso/dollar, peso/mark and peso/yen central parities are announced daily, as the parities of the main currencies on international markets become known.25 In effect, between 1990 and 1996 the level of economic activity in Chile expanded at an average annual rate of 6.8%, whereas world production only grew by 3.1%. In the same period, the average productivity of labour in Chile rose at an average annual rate of around 4.7%, while total factor productivity grew by around 2.3% per year. As a result of the higher growth of productivity, international competitiveness increased, which was ultimately reflected in an expansion in exports and strengthening of the Chilean peso. The productivity differential adjustment in the exchange rate rules suggests that this situation will continue in the future.
THE CENTRAL BANK AND CHILEAN MACROECONOMIC POLICY IN THE 1990s • ROBERTO ZAHLER

66 C E P A L R E V I E W 6 4 • A P R I L 1 9 9 8
belief that the long-term equilibrium exchange rate is a dynamic concept which must be given a certain degree of flexibility and that the economic agents do not possess at every moment in time the necessary information and background elements for determining the real equilibrium exchange rate. This view implicitly involves the need for the authorities to provide some guidance about the real exchange rate considered to be in keeping with the external balance of the economy in the medium term: this is precisely the role played by the “agreement” exchange rate in the centre of the exchange rate band, for two main reasons. Firstly, because the market -especially when short-term financial flows are of very considerable magnitude- may tend towards a real exchange rate which is considerably removed from the medium- and long-term equilibrium rate (an “outlier”). Secondly, because it is considered that if the economy departs substantially for long from the real equilibrium exchange rate, this would tend to produce major imbalances, with negative consequences for the functioning and performance of the economy.
It was also considered desirable to give some degree of exchange rate stability to the export sector. The difficulty of precisely predicting the real equilibrium exchange rate, the probability that this rate will get out of line with the basic macroeconomic balances, and the need to give greater autonomy and flexibility to monetary policy, especially in view of the growing linkages of the Chilean economy with international financial markets, all justified the application of a broad exchange rate fluctuation band. Such a band also makes it possible, within certain limits, for the market to play a more important role in determining the observed position of the exchange rate within the band, thus reflecting the criterion of graduality mentioned earlier.
In the five-year period studied, the exchange rate band was changed on two occasions, permitting in effect a drop in the “agreement” exchange rate. This was due to the need to adapt the reference value of the medium- and long-term equilibrium exchange rate to the new structural conditions in which the Chilean economy was operating. The Central Bank, which was faced with a growing inflow of foreign exchange due both to the very favourable evolution of exports and a significant entry of foreign investment and international finance, acted prudently and changed the centre-point and width of the band only when it was sure that the long-term equilibrium exchange rate was not properly reflected in the pre
vailing “agreement” exchange rate. Thus, for example, the observed and foreseeable behaviour of non- traditional exports, the size of the balance of payments current account deficit, the increase in foreign investment in and by Chile, together with the growing unification of exchange rates and liberalization of the outflow of capital, the improvement of the external solvency indicators and the deepening of the Chilean foreign exchange market, were the main elements influencing the decision to allow a gradual appreciation of the Chilean peso.26
It should be noted that the real appreciation registered by the peso during the 1990s, which was around 4,5% per year, was the result of a process of increasing economic balance due to the structural changes undergone by the Chilean economy in recent years rather than any manipulation of the exchange rate with the aim of artificially reducing inflation. On the contrary, a priority objective of the economic policies implemented in that period was precisely to avoid any artificial appreciation of the peso.27
Thus, Chile’s renewed linkages with the international economy, already referred to earlier; the behaviour of the country’s exports and its balance of payments current account; the big increases in changes in productivity, especially in the tradeables sector of the economy, as compared with Chile’s main trading partners; and the over-depreciation of the peso in the second half of the 1980s (to deal with
26 It may be noted, however, that there was a generalized trend in the 1990s towards the appreciation of the currencies of the main Latin American countries, as well as those of a number of Central and Eastern European countries, for reasons of an international nature. Among these, special mention may be made of the relatively low interest rates in the industrialized countries, the lower country risk of the countries which had carried out structural reforms of their economies, and the decisions of important institutional investors in the developed countries to diversify their portfolio by making it more international. This meant a fresh impulse for foreign direct investment in production sectors and in portfolio investments, together with flows of shorter-term external Finance to the countries of the region, all of which contributed to the appreciation of the Latin American currencies (with a relatively short interruption due to the Mexican crisis at the end of 1994).27 International comparisons with regard to the real appreciation of the Chilean currency show that the real exchange rate in Chile has been one of die stablest and least depreciated of the whole of Latin America, even though there were capital inflows into the whole of the region during the first half of the decade before the Mexican crisis. Thus, according to the uniform methodology used by the International Monetary Fund (IMF), whereas the real appreciation of the currency in the period from 1990 through 1994 came to 13% in the case of Chile, in Argentina it was 63%, in Colombia 21%, in Mexico 18%, and in Brazil 17%.
THE CENTRAL BANK AND CHILEAN MACROECONOMIC POLICY IN THE 1990« • ROBERTO ZAHLER

C E P A L R E V I E W 6 4 • A P R I L 1 9 9 6 67
the extremely acute shortage of foreign exchange in that period), were all factors pointing to the need to allow the exchange rate to reflect the greater strength of the peso.
The Central Bank authorities’ view in this respect was that this need for appreciation of the peso was a reflection of the consolidation of various structural changes in the Chilean economy in recent years, which meant that the equilibrium exchange rate was below the current value of the “agreement” exchange- rate. In more general terms, the progress made in Chile’s trade and financial linkages with the international economy warranted a change in the medium- and long-term equilibrium exchange rate. Among the structural changes that the Central Bank mentioned as being of importance in this respect were: the reduction in the levels of relative external indebtedness, from an average of 106% of GDP in the three-year period 1985- 1987 to 35% in 1994-1996; the buildup of international reserves, which in 1994-1996 were double the level of the 1985-1987 period as a percentage of imports of goods and services, representing over 15 months of imports in one of the years in the 1994-1996 period; the steady growth of exports, which achieved an average annual rate of 11,6% in real terms in the latter period, compared with the already high level of 9% registered in 1985-1997; and, lastly, the moderate level of external saving that the Chilean economy has needed (1.7% of GDP in 1994-1996, which was less than the floor level laid down and much less than the 6.3% balance of payments current account deficit registered in 1985-1987).
Finally, it is important to note that the Central Bank resisted the downward pressure on the price of the cutxency in a number of ways, including in particular massive purchases of international reserves, which will be analyzed in the following section.
3. Inte rn a tio na l re s e rv e s p o lic y
The international reserves policy applied by the Central Bank during the first half of the 1990s had two main objectives:28 on the one hand, to make possible Chile’s growing integration into the world economy, without exposing the country to any major risks deriving from changes in the economies of the main industrial countries or the volatility usually marking
28 There was also considerable progress in the management of international assets and liabilities, with the aim of improving the net financial position of the Central Bank.
the behaviour of some international creditors;29 and on the other hand, to partly neutralize the short-term impact of inflows and outflows of capital on the exchange rate, through the purchase or sale of foreign exchange.
The first objective Was achieved mainly thanks to Chile’s abundant international reserves, which were one of the determining factors in the country’s low risk rating for international investors; this rating stimulated foreign direct investment in Chile, while at the same time reducing the cost of the external financing offered to it. Furthermore, the significant accumulation of reserves by the Central Bank in those years30 endowed Chile with great external strength, which was made evident above all early in 1995, when the Chilean economy was affected only minimally,31 and only for a very short time, by the turbulence reigning in international financial markets after the Mexican exchange crisis of late 1994. Finally, the comfortable international reserves position made it possible to use part of those reserves, without compromising the external liquidity and much less the external solvency of the country, to pre-pay the whole of the external debt still outstanding in respect of the refinancing of the crisis of the early 1980s, as well as the balance owed to the IMF.32
29 A high accumulation of international reserves is a necessary condition for enabling a small country to integrate in a sound and effective manner into the international economy, and part of the costs of that accumulation may be interpreted as the premium payable for an “insurance policy” to ensure that that integration is effective and does not give rise to any major upsets.30 Whereas in the late 1980s the international reserves were sufficient for five months of imports, in 1994 they covered 15 months of external purchases. Likewise, while in 1989 the net international reserves amounted to the equivalent of 10.5% of GDP, in 1994 they were a little under 26% of GDP. It is also important to note that, at the aggregate level, neither the public sector nor the non-financial private sector had heavy short-term external liabilities, and the net short-term external liabilities of banking system were only around 4% of GDP, so that the net position of the country with regard to liquid international assets was extremely sound.31 It should be noted that although the Central Bank has made significant efforts to increase the yield on the international reserves, it should not be forgotten that these reserves are not maintained exclusively with the idea of obtaining high yields, but also as a precaution against unexpected external disturbances, in order to have sufficient international liquidity to cope with the latter properly.32 The prepayment of the external debt helped to reduce the deficit associated with the existence of an interest rate differential between the international reserves and the external debt, as well as to further improve the indexes of external creditworthiness of the country, reducing the country risk and improving the Chilean private sector’s conditions of access to international credit.
THE CENTRAL BANK AND CHILEAN MACROECONOMIC POLICY IN THE 1990« * ROBERTO ZAHLER

68 C E P A L R E V I E W « 4 • A P R I L 1 9 9 8
The second objective was achieved through the purchase or sale of foreign exchange by the Central Bank, accompanied by open market operations to neutralize the monetary effects of the exchange operations: a system known as sterilizing interventions in the foreign exchange market. Indeed, in the first half of the 1990s most of the time the exchange rate was quite close to the floor of the band, if not actually on the floor itself. Apart from the purchases of foreign exchange made necessary by the mechanism of the band itself, the Central Bank’s policy was to wait a prudential length of time in order to be able to distinguish whether the inflow of foreign exchange was of a more permanent or a transitory nature. In the latter case, when there was an inflow of short-term capital which could soon be reversed, the Central Bank proceeded to acquire that foreign exchange, accumulating international reserves in order to reduce the volatility of the exchange rate. Something similar was done in the case of transitory outflows of capital. If the inflow or outflow of capital was of a more permanent nature, the Central Bank often intervened in the exchange market, accumulating or reducing its reserves, not in order to go systematically against the market forces, which would be unsustainable in the long run, but in order to make the adjustment of relative prices which would probably be required more gradual in time.
The appreciation of the peso already referred to took place in spite of the significant effort to accumulate international reserves carried out by the Central Bank: between 1990 and 1996 the international reserves increased by US$ 9.45 billion, equivalent to a little less than 4% of GDP per year. This stock of international reserves, which was relatively speaking among the highest in the world, has resulted in heavy costs to the Central Bank’s financial position,33 but it has undoubtedly contributed to the efficient and smooth integration of Chile into the international economy, by easing the rate of appreciation of the
33 The sterilizing interventions of the Central Bank have meant heavy costs for it, because of the higher interest rate that it must pay on the domestic debt issued, compared with the yield of the international assets it acquires. At the same time, the appreciation of the peso in real terms has caused a deterioration in the real value of these assets denominated in foreign currency, including credit to the government, compared with that of the domestic liabilities of the Central Bank. Thus, the effect of this policy has been to generate a bigger quasi-fiscal deficit of the Central Bank, which has been offset by the corresponding fiscal surplus.
Chilean peso and, within the policy of graduality already mentioned, to a non-traumatic adjustment of the price of tradeable goods compared with non- tradeable goods in the Chilean economy.
4. B a la n c e of p a y m e n ts capita l a c c o u n t p o lic y
In a small, open economy like that of Chile, greater financial integration with the exterior brings substantial benefits which must be exploited. Among them are the availability of external saving to finance investment; the absorption of temporary shocks with regard to the terms of trade, and the diversification of risks and sources of national income, all of which makes it possible to smooth the path followed by consumption and derive greater benefit from comparative advantages through a deeper insertion of the country in the international economy.
Greater financial openness also brings with it risks which must be taken into consideration, however. There are permanent costs and transitional costs. The loss of some leeway in monetary policy management and the destabilizing effects that capital movements can cause in a small economy are permanent costs of greater financial openness, while the risks associated with the adjustment from a historically closed capital account to a suddenly open one are transitional costs.34
The conditions of access to external finance, which had been very limited for the region after the debt crisis, changed rapidly and significantly in the 1990s, A better perception of country risk, the low interest rates in the industrialized countries and a generalized expansion in capital flows to the so- called emerging economies significantly increased the supply of external funds. Quite suddenly, countries like Chile found themselves in a situation where the domestic yield on capital was higher than the
34 Historically, capital flows into and out of Chile were very restricted. After the abandonment of the convertibility of the peso, massive controls were established on capital outflows. Although over the course of time these controls were modified, the spirit of the restrictions was maintained, except for intermittent periods of greater freedom. With regard to inflows of capital, the limited conditions of access to external finance formed a natural restriction on them. Indeed, it was only in the 1970s that the developing economies, including Chile, were able to regain the large-scale access to external financing which they had lost after the Great Depression. For Chile, however, this only lasted a short time, since the international debt crisis of the early 1980s, together with the high level of external indebtedness which the country had built up in that brief space of time, led to a renewed suspension of access to international finance.
THE CENTRAL BANK AND CHILEAN MACROECONOMIC POLICY IN THE 1990» • ROBERTO ZAHLER

C E P A L R E V I E W « 4 • A P R I L 1 9 9 8 69
external cost of the funds, adjusted for country risk and for changes in exchange rate expectations.35
In the past, this situation tended to persist in time or changed only gradually, insofar as the perception of country risk and lack of confidence in the local currencies limited the international arbitrage of funds. In the early 1990s, in contrast, a policy of unlimited financial openness would have encouraged the inflow within a short period of time of abundant short-term financial resources, destabilizing expenditure, asset prices and key prices such as the interest rate itself, wages and the real exchange rate.36 The course that the economy follows if this tendency is encouraged is well known. Because of the size of the inflows, the first stage in the transfer process is a boom period in which asset prices and wages rise, consumption and investment increase, there is exchange rate appreciation, and imports become cheaper. This stage is hard to manage in macroeconomic terms, since it is necessary to contain the inflationary pressures generated in the domestic markets and to be on the watch against the generation of financial bubbles which further increase the divergence of prices from their equilibrium levels and encourage the arrival of even greater financial resources. This expansionary phase of the cycle sows the seeds for the subsequent phase of contraction, however, for as the balance of payments current account deficit grows and external liabilities are built up, the perception of country risk begins to increase37, the
35 This differential between yields is due to past circumstances and to the structural reforms which have affected the productivity of the Chilean economy, which have little to do with monetary policy. Thus, if we take into account the relative endowments of capital and human resources in Chile, the limited access to external financing which the Chilean economy enjoyed until quite recently, and the low historical rates of domestic saving and investment, it is only natural that the domestic yield on productive capital, which must be distinguished from the yield on financial capital, tends to be higher than that observed in the industrialized economies.36 Furthermore, with regard to the financial sector institutions, hasty openness (without having first of all made suitable arrangements for the regulation and supervision of the financial intermediaries and of the corresponding authorities) can and usually does give rise to major problems. Chile had previous experience of this, when, in the absence of such regulations, there were perverse incentives in the financial sector which were later transmitted to the rest of the economy, It should be remembered that there are systemic risks involved in this sector, so that it is extremely important to act prudently when taking measures that affect it,37 Historically, this process has taken quite a long time to makeitself felt.
availability of external funds goes down, the volume of external transfers diminishes, and prices and expenditure must therefore begin a downward path.
In an ideal scenario, the inflows are reversed only gradually and the adjustments in key prices are smooth and do not give rise to serious upsets in the performance of the economy. The most probable and realistic scenario, however, is one in which the capital inflows stop and are even reversed abruptly, giving rise to a traumatic adjustment, because the economy is in a highly vulnerable position when it has a high level of external indebtedness and a significant current account deficit, especially if the external financing is of a short-term nature. Increases in international interest rates, falls in the terms of trade, or simply changes in external or domestic expectations may trigger off a sudden crisis of confidence which abruptly terminates the transfer of external resources. The external debt crisis in the region in the 1980s and the upsets in the international financial markets at the end of 1994 and in 1995 illustrate these risks very clearly.
In this latter scenario, the adjustment required involves a perilous combination of high domestic interest rates, a fall in the prices of domestic assets, and heavy depreciation of the real exchange rate, which inevitably brings serious problems in the domestic financial markets and gives rise to additional inflationary pressures; at the same time, and no less importantly, a significant increase in unemployment and a decline in the level of economic activity may be expected as a result of the difficulties produced in the financial and labour markets and the abrupt reduction in the level of expenditure. Chile’s experience in the early 1980s, like that of other countries of the region, has shown that this pessimistic scenario is not only highly probable but also usually involves very significant costs for a long period of time. This is why in the 1990s, in order to maintain and further consolidate macroeconomic discipline and the external balance, it was decided to open up the capital account in a prudent manner, minimizing the risks of an undesirable adjustment that could endanger the progress already made.
From the standpoint of the domestic balance, emphasis must also be placed on the role of interest rates and their links with the form and rate of financial openness to the exterior. Thus, in order to achieve a level and rate of growth of domestic expenditure compatible not only with the prudent use of external saving but also with the production potential
THE CENTRAL BANK AND CHILEAN MACROECONOMIC POLICY IN THE 1990» • ROBERTO ZAHLER

70 C E P A L R E V I E W 6 4 • A P R I L 1 6 6 8
of the Chilean economy, it was necessary that domestic interest rates should be higher than those prevailing in the main industrialized economies during the first half of the 1990s.38
In other words, in view of the low country risk and the total absence of any expectations of devaluation (or, to be more exact, the expectations that there would actually be a revaluation) of the Chilean peso, after adjustment for these two effects the international interest rate was well below the domestic interest rate required for domestic and external macroeconomic balance. The dilemma facing the Central Bank was to find a way to close that gap in order not to give rise to inflationary pressures over and above those already programmed and/or additional pressures on the balance of payments current account. It should be noted that this dilemma had to be faced in a context of positive fiscal saving and public surpluses, a substantial buildup of international reserves (which was giving rise to a significant quasi-fiscal deficit), and a tendency towards strong appreciation of the Chilean peso.
In view of the foregoing considerations, the aim of capital account policy was to complement the fiscal, monetary, exchange rate and international reserve policies in order to prevent an “excessive” inflow of foreign exchange from adversely affecting the domestic and external balances. To put it another way, even if the fiscal, monetary, exchange rate and international reserve policies were well formulated and implemented, the continued entry of short-term financial flows into the country39 would make it essential to check the rate of the net inflow of capital in order to avoid increasing inflation and/or a bigger balance of payments current account deficit. For this reason, it was decided to progress towards greater financial integration with the rest of the world, but in a prudent manner, at a rate, and with a selective approach, which were in keeping with that aim.
38 The interest rates must be more or less in line with the yield of productive capital. In the course of time, high rates of investment like those observed in Chile, accompanied by further increases in domestic saving, will make it possible to reduce the spread between external and domestic interest rates.39 A distinction should be drawn between an inflow of foreign exchange due to very good export results or net inflows of medium- and long-term foreign direct investment, which of themselves lead to balanced appreciation of the peso, and an inflow of external finance, generally very short-term, due basically to the desire to take advantage of the arbitrage of interest rate differentials.
This policy was applied through various means. On the one hand, in the first half of the 1990s the outflow of capital was significantly liberalized.40 Thus, not only were exporters given complete freedom to use the whole of their foreign exchange income as they saw fit, without any obligation to bring it into the country, but liberalization measures were also taken in various other fields.41 For example, the minimum period after which capital brought into the country by non-residents could be repatriated was reduced from three years to one year, and the issue of bonds and shares abroad ( a d r s ) was also permitted, subject to certain requirements which were gradually relaxed over time. At the same time, the repatriation of investments brought in under debt/equity swap arrangements (a system connected with the crisis of the early 1980s) was completely liberalized, as was the advance payment of foreign debts and the rules on the minimum percentage of external credit that must accompany foreign direct investment.
A measure of great significance which was complementary to the foregoing was the complete liberalization of foreign investment by Chilean individuals and firms, thus allowing them to diversify their risks better. Measures were also taken to promote greater international diversification of the asset portfolios of domestic investors, especially institutional investors. The latter were the only exceptions from complete liberalization, but they were nevertheless given increasingly wide options for investment abroad. The openness to the exterior of banks, pension funds, insurance companies and mutual funds was also increased, but less rapidly than for the rest of the economic agents, partly through legal restrictions and, for the first three categories, for prudential reasons connected with systemic risk and contingent fiscal commitments.
The entry of capital was opened up gradually and selectively, with measures to discourage the
40 It should be noted that the growing openness to the outflow of capital is connected with Chile’s strategy of development and insertion in the international economy. It is not designed to increase the value of the national currency, and may even have the opposite effect.41 As well as giving complete freedom in the handling of export proceeds, a number of measures were taken in connection with the balance of payments current account, including a substantial tariff reduction (from 15% to 11%) and various free trade agreements, with the aim of securing growing integration of the so- called formal and informal exchange markets, all of which helped to deepen Chile’s trade and financial integration into the world economy during this period.
THE CENTRAL BANK AND CHILEAN MACROECONOMIC POLICY IN THE I960« • ROBERTO ZAHLER

C E P A L R E V I E W $ 4 * A P R I L 1 9 9 6 71
shortest-term inflows. This gradual policy is justified by the desire not only to avoid major external imbalances, but also to permit a rate of change in relative prices which will allow the different sectors to make less traumatic adjustments over time. The selective openness process calls for the application of certain specific controls when necessary. Although the general trend was to gradually relax the disincentives for capital inflows, this was complemented with measures aimed at securing greater selectivity in capital inflows in order to reduce the country’s exposure to volatile short-term financial flows, give monetary policy greater autonomy, and check the creation of bubbles in the stock market and the longer-term fixed income market. The latter measures were aimed at making inflows of capital (especially shorter-term capital) more expensive, restricting their overall volume, improving their “quality”, and lengthening the term of Chile’s external finance.
On the one hand, the reduction of the restrictions on the repatriation of direct investment capital from three years to one42 discouraged the arrival of big flows on the stock market, helping to forestall a price bubble there.
On the other hand, the rate at which Chilean firms could obtain credit or capital abroad was moderated, since the foreign sale of both bonds and stocks was made subject to certain minimum amounts and the fulfillment of certain requirements, determined by international risk rating firms, concerning the credit worthiness of enterprises or of the instruments that they wished to sell on the international market.43 In this way, the authorities helped to limit the number of firms that could procure financial resources on the international markets, as well as the rate at which they could do so, thus helping to prevent excessive inflows of foreign exchange into the country.44
Thirdly, a one-year non-interest-bearing compulsory reserve requirement was imposed on credit and other sources of external financing, in order to in
42 As already noted, this represented a liberalization measure compared with the situation prevailing in the late 1980s.43 These minimum amounts and requirements were also gradually relaxed, without being completely eliminated.44 Another advantage of this strategy, in view of the fact thatbefore 1990 there were no Chilean firms active on the international stock and bond markets, is that the high creditworthiness and seriousness of the first firms entering the market generated positive externalities for those entering it later. A disadvantage of this measure is that in practice it favours “big” firms more than small firms or individuals.
crease the cost of bringing in short-term capital. In this way, it was sought to give monetary policy more leeway and autonomy so that ideally all the economic agents would face the same interest rate, determined by the Central Bank in order to achieve domestic balance, while at the same time checking the speculation and volatility inherent in very short-term capital and reducing the possibility of interest rate arbitrage.
From a more general standpoint, the set of policies aimed at securing a gradual and selective financial openness process made it possible to change the structure or composition of Chile’s external liabilities, increasing die share of risk capital in total indebtedness and, within the latter, increasing the proportion of long-term capital compared with shortterm funds. This helped to reduce the vulnerability of the Chilean economy to the vicissitudes of the world economy, the pro-cyclical behaviour usually displayed by external debt holders, and changes in the expectations of international economic agents.
Although some other countries of the region carried out policies that were in formal terms more “liberal” or “open” than those of Chile with regard to the balance of payments capital account, domestic interest rates in those countries were higher than in Chile and displayed greater differences with international interest rates. This situation, which ought apparently to be the other way around, is attributable mainly to the greater country risk or risk of devaluation faced by those countries. Consequendy, it is by no means clear that if a country rapidly carries out a total financial openness process it will effectively be able to integrate into the international capital markets in a sound and permanent manner. In short, a country is not “more integrated” into the international economy because it is more or less liberal, but because of the amount, cost, quality and permanence in time of the transfers of capital which are effectively available for it, and all these elements are usually associated with the confidence that the rest of the world has in that economy.45
45 From a macroeconomic perspective, it might seem easier and probably also more necessary to be more “liberal” when there is a high international perception of country risk. In these conditions, the natural interest rate differential with the exterior, adjusted by the country risk and expectations of devaluation, provides sufficient leeway for carrying on an independent monetary policy and avoiding the destabilizing effects described earlier. It would be absurd, however, to conclude that it is desirable that there should be a high perception of country risk, since it is highly beneficial to be trustworthy and credible and thus enjoy an ample supply of external finance at low cost.
THE CENTRAL BANK AND CHILEAN MACROECONOMIC POLICY IN THE 1990s * ROBERTO ZAHLER

72 C E P A L R E V I E W 6 4 ■ A P R I L 1 9 9 8
Finally, there are those who maintain that Chile’s good macroeconomic performance in the early 1990s was due to its high level of domestic saving rather than to the macroeconomic strategy pursued. It should be noted, however, that domestic saving is not a constant which is independent of that strategy. Empirical
studies and experience suggest rather that “ingenuous” policies regarding the entry of foreign finance usually mean that external saving, which is often concentrated in the very short term, is used to finance an excess of domestic consumption expenditure and takes the place of domestic saving.46
VISome conclusions
The main dilemma in macroeconomic policy in the 1990s was that in order to maintain the domestic balance it was necessary that interest rates in Chile should be considerably higher than in the industrial countries, while at the same time the country risk was going down steadily and there were expectations of revaluation of the Chilean peso. In view of the fact that the public sector registered an annual average surplus of 1.8%, that the accumulation of reserves was giving rise to significant quasi-fiscal costs, that the outflow of capital had been very sharply liberalized, and that the peso had appreciated in value at a rate of more than 4% per year in real terms (in spite of the Central Bank’s efforts to discourage that situation), the dilemma facing macroeconomic policy was the following: whether to allow domestic interest rates to equalize rapidly with international rates, or whether to close that gap at least in part. The first of these approaches would have been essentially contradictory to the global strategy and would have led to excessive spending, higher inflation and/or additional appreciation of the peso, and a heavy balance of payments current account deficit, thus increasing the country’s external vulnerability. Consequently, the policy followed was to reduce the interest rate gap by graduating the rate at which companies located in Chile could bring in external financing, while at the same time discouraging the inflow of short-term capital by making it more expensive.
Over the five-year period 1992-1996, the GDP grew at an average annual rate of 7.5% and unemployment stood at 7%. Real wages increased at the same rate as the average productivity of labour: 4.7% per year. Gross fixed capital formation increased by 14,2% per year (twice as fast as GDP), while domestic saving averaged 25.1% of GDP. The fiscal surplus was 1.8% of GDP, while fiscal saving came to 5.1%
of the product. The average real interest rate on bank deposits for between 90 days and one year was 8.9% per year. Domestic public indebtedness (of the Central Bank), as a percentage of GDP, went down compared with previous years, standing at 33.6%, while its average maturity increased year by year, averaging 3.2 years for the five-year period as a whole. Average annual inflation was 9.7%, the lowest rate for a five-year period since over half a century in Chile, because inflation went down from 27.3% in 1990 and 18.7% in 1991 (at a downward rate very similar to the annual inflation targets of the Central Bank) to only 6.6% at the end of 1996. The Chilean peso appreciated in value at an annual rate of 4.3% in real terms, while exports grew by 10.4% per year, likewise in real terms, which was 50% faster than the growth of GDP. The average annual deficit on the balance of payments current account was 2.2% of GDP. Foreign direct investment both in and by Chile reached unprecedented levels. Capital inflows averaged 6% of GDP, and the net international reserves were equivalent to 22.4% of GDP or one year of imports of goods. The external debt represented an average of 38.1% of g d p , or 15.7% after deducting the international reserves.
46 Likewise, it would be a mistake to think that the Chilean economy has come out of the recent round of financial upsets almost unscathed solely because of its measures to discourage capital inflows. Its main strength lies in more structural factors, such as the high level of domestic saving and the coherence in the design and execution of the country’s fiscal, monetary, exchange rate and international reserves policies. The compulsory reserve requirements and restrictions on the inflow of capital which are still in force are important to the extent that they facilitate such coherence. They are just one more element in an internally coherent piece of machinery.
THE CENTRAL BANK AND CHILEAN MACROECONOMIC POLICY IN THE 1990« • ROBERTO ZAHLER

C E P A L R E V I E W 6 4 • A P R I L 1 8 9 8 73
These results show that in the first half of the 1990s Chile was successful in combining economic growth with increases in employment, productivity and wages, as well as saving and investment, while at the same time making significant progress in price stability, not only without endangering the balances in the rest of the economy, but actually making them more solid and secure (particularly in the case of the traditional Achilles’ heel of the Chilean economy: the external sector balance).
It is no coincidence, however, that all these positive results have been obtained within the same period. These achievements are interrelated and strengthen each other, for there is a kind of virtuous circle between macroeconomic stability and sustained growth. Growth brings stability and stability brings growth.
There are many ways in which growth and stability are interrelated. Thus, for example, further consolidation of the process of placing the public finances on a sound basis, prudential regulation and strict supervision of the banking system, together with efficient allocation of financial resources -due in part to the existence of key macroeconomic prices which are not distorted- helped significantly to increase financial saving and direct it towards investment, avoiding the appearance of financial bubbles and furthering the stability and solvency of the country’s banking system. The progress and deepening of the capital market also played an important role in the provision of long-term domestic financing, which is a decisive factor for increasing investment.
The maintenance of a climate of macroeconomic discipline and control of inflation helps to create an environment conducive to long-term planning, which, in turn, also raises the rate of investment and promotes the introduction of new technologies, which ultimately generate more growth. For its part, the maintenance of a situation of sustained growth guarantees the profitability of new investments and facilitates fiscal and monetary discipline. On the government side, the pressures on the budget are reduced when employment, wages and business profits are growing, while the increase in tax revenue makes it possible to satisfy the most urgent public needs without endangering the fiscal balance. On the Central Bank side, the task of keeping inflation under control is also facilitated when the economy is in a situation of sustained growth and low unemployment, since if it is necessary to apply contractionary measures there
will be a greater degree of acceptance which will in turn make possible a rapid and efficient adjustment.
It has been empirically proved that there is a correlation between higher economic growth rates and increases in the rate of national saving, though the reason for this is not so clear. Greater domestic saving, for its part, generates stability, since it reduces the vulnerability of the economy to external disturbances, while keeping the current account deficit down to moderate levels and maintaining favourable indexes of external creditworthiness permits timely access to external financing when this is most necessary, for example, in situations of unfavourable terms of trade. This reduces the risk of having to face an external crisis or to abruptly reduce the economic growth rate. Moreover, a high level of domestic saving cushions the effects produced on the economy by upsets in international financial markets, like those that many countries of the region had to face in 1995 as a result of the Mexican crisis.
There is something almost magical about virtuous circles: the whole is greater than the sum of the parts, because the individual elements mutually strengthen each other. When trends go in the opposite direction, however, virtuous circles may become vicious circles. It is therefore essential to place emphasis on the need to increase saving and investment, to maintain the external balance conditions, and in particular to ensure that all the agents involved persevere with macroeconomic discipline.
Although the Chilean experience of the five-year period dealt with here is of a very specific nature -since there are no such things as “exportable models” in economic policy- it is possible to highlight some elements which have been of fundamental importance for the results achieved.
First, this experience highlights the need for balanced fiscal accounts and proper coordination among fiscal, monetary, exchange-rate and wage policies. The follow-up and control of aggregate demand, in terms of both its level and its rate of change, is a necessary, albeit not of itself sufficient, condition for efficiently achieving the domestic and external balances.
Furthermore, it suggests that inflationary pressures on costs were substantially moderated by the fact that workers and employers gradually incorporated the Central Bank’s projected downward levels of inflation into the criteria used both in labour bargaining and in fixing the prices of goods and
THE CENTRAL BANK AND CHILEAN MACROECONOMIC POLICY IN THE 1990s • ROBERTO ZAHLER

74 C E P A L R E V I E W 6 4 • A P R I L 1 9 9 8
services. The growing credibility of the Central Bank played a crucial role in this respect.
The objective of reducing the magnitude of economic cycles by due anticipation on the part of macroeconomic policy of incipient but not yet evident excess expenditure and the identification of areas of leeway on the supply side also contributed to the results obtained. In this respect, the Chilean experience highlights the desirability of bringing a certain degree of flexibility into the formulation and execution of economic policy, in order to deal in a timely and efficient manner with the effects of domestic or external disturbances. This flexibility was of crucial importance for spreading the positive and negative effects of these disturbances over various markets and thus promoting a more balanced and sustainable adjustment of the economy. This more balanced mechanism for the adaptation of the various markets was also aided by the criterion of not allowing the key macroeconomic prices to diverge for long from their medium- and long-term equilibrium values, which has been a decisive factor in giving stability and sustainability to the Chilean economic growth and development process.
Also in connection with the foregoing, the Chilean experience suggests that the market should be gradually given an increasingly important role in the determination of key prices such as the exchange rate and interest rates, beginning with the long-term segment of the market, in order to gradually incorporate the private sector in the formation of short-term prices, as markets are deepened and become more transparent and competitive.
Concern for the balance of payments current account deficit as a guiding thread in macroeconomic strategy, together with a gradual but sustained downward trend in projected inflation, was the main line
of Chilean macroeconomic policy. Perhaps the biggest challenge that the Central Bank had to face in the first half of the 1990s was to cope with the enormous inflow of foreign exchange which marked that period, taking care to ensure that both the level and the growth rate of absorption (domestic expenditure) were compatible with the significant downward trend in inflation, as well as with the maintenance of the balance of payments current account deficit within very reasonable levels. This latter element was of decisive importance for maintaining the upward trend in domestic saving, so that such saving could finance the major part of investment and the Chilean economy could integrate into the international economy in a sounder and less vulnerable manner, on both the trade and financial level.
In short, the macroeconomic results of the five- year period from 1992 to 1996 were very satisfactory. High growth rates of economic activity and of employment, domestic saving and investment, as well as of real wages and productivity, were achieved in this period. At the same time, inflation was significantly reduced and is well on the way to matching the rates recorded in the industrialized countries. And most important, not only was all this achieved without endangering the external balance of the Chilean economy, but at the same time Chile's linkages with the international economy were further improved, solid external accounts were established, the indicators of the external creditworthiness of the country improved, and its vulnerability was reduced. Equally important was the fact that no imbalances were generated in any other key area of the economy, so that all in all it is possible to take an optimistic view of the possibilities of further increasing and deepening Chile’s economic development.
(Original: Spanish)
THE CENTRAL BANK AND CHILEAN MACROECONOMIC POLICY IN THE 1990s • ROBERTO ZAHLER

R ic a rd o M a rtn e r
Public Sector Planning Division,Latin American and Caribbean Institute for Economic and Social Planning (ILPES).
C E P A L R E V I E W 64 75
Fiscal policy,cycles and growth
In Latin America, macroeconomic fluctuations have been more frequent and more serious in recent decades than in other parts
of the world, and this volatility has adversely affected the devel
opment processes of the countries of the region. This article looks at the desirability of establishing economic policy rules, particularly in the fiscal area, to reduce the frequency and size of these imbalances. The interactions between fiscal policy, the
economic cycle and growth are reviewed, and the difficulty of
establishing a convincing numerical relation between public ex
penditure and long-term growth is demonstrated. The theories
proposing the reduction of public expenditure as a means of improving macroeconomic performance do not have solid empirical bases. “Fine tuning”, which should in principle make
it possible to reduce the effects of disturbances and hence reduce the impact of this negative relation between volatility and growth, require the existence of flexible instruments for explic
itly dealing with the adverse disturbances that frequently arise.
It is therefore necessary to adopt policies that will make it
possible to overcome the dilemma between credibility and
flexibility. The way of tackling this volatility set forth in the
article has to do with the political and institutional factors that
lie at the basis of the expectations of the private agents and
encourage them to save and invest in a long-term economic
horizon, rather than with the imposition of rigid rules that tend
to impede intervention by the authorities in the economic cycle.
In the fiscal area, the article analyses the dilemma between
sustainability and regulatory capacity and posits the need to
make more intensive use of fiscal instruments for stabilization
in order to ensure a better macroeconomic performance.
A P R I L 1 9 9 8

76 C E P A L R E V I E W 6 4 • A P R I L 1 6 9 8
IIntroduction
In the short and medium term, the economic authorities have four simultaneous objectives: i) to reduce unemployment or keep it to a low level, ii) to control inflation, iii) to keep a wary eye on potential imbalances which may arise on the fiscal side, and iv) to keep a similar watch on those that may arise in the external sector. The “art” of economic policy is to reconcile the four comers of this magic square, while the “mission" of policymakers is to minimize the social losses due to fluctuations in the aggregates, anticipating future sources of instability and taking today the measures that are going to be needed to deal with them tomorrow. This means highlighting the importance of the interactions between fiscal policy, the economic cycle and long-term growth: a matter which is dealt with in section II below.
Fiscal policy influences long-term growth in different ways: through its direct participation in capital accumulation, through the crowding-out effect that the financing of public activities can have on private saving and investment, through the negative externalities that improductive public expenditure causes on aggregate productivity, and finally, through what might be called the quality of public policies. The transmission mechanisms are thus highly complex, so that it is impossible to find a simple linear relation between fiscal policy and long-term growth in the empirical literature. The currents of thought that advocate the absence of public intervention and the reduction of public expenditure as mechanisms for improving global macroeconomic performance therefore do not have any sound empirical bases.
In Latin America, the variability of external and domestic conditions has led to recurrent imbalances which have had negative effects on the development processes of our countries. If we take the g d p as a reference point, macroeconomic fluctuations (with a few notable exceptions) seem to be more frequent, bigger and more dramatic than in the industrialized countries. If such cycles are harmful because they affect the average growth rate of the economy through the uncertainty that they generate, then there is ample justification for the adoption of strategies to
reduce their effects. In Latin America, according to the recent economic literature, there is a negative relation between the average GDP growth rate and its standard deviation.
In this article, the analysis is centered on the desirability of establishing economic policy rules in the monetary, fiscal and external sectors, in order to keep the four comers of the magic square under control. The need for “fine tuning” means that flexible instruments should be available for explicitly tackling the negative upsets that often arise. It is therefore necessary to adopt policies based on the idea of “dis- cretionality within the rules” which make it possible to solve the dilemma between credibility and flexibility which has been so marked in the 1990s (credibility means that there should be stable rales for a long period of time, while flexibility means that there should be capacity to respond to changes in the external conditions affecting the system).
If fiscal and monetary policies have an anti- cyclical component relating to the terms of trade and inflow of capital, there is a better chance of addressing the objectives of medium-term stability and, ultimately, bringing the economy as close as possible to its production frontier. This means intervening energetically in the economic cycle, both in respect of the aspects due to domestic fluctuations and those coming from outside.
Since the excessive use of monetary policy as a means of regulating conjunctural situations may lead to cases of macroeconomic inefficiency, greater emphasis needs to be placed on fiscal policy instruments, especially the role of the automatic stabilizers in the cycle and an increase in the degree of discretion (within certain limits) for fixing taxes in the light of stabilization objectives.
In section III, fiscal policy design criteria are examined, the dilemmas between sustainability and regulatory capacity and between discretionality and established rales are analyzed, and it is suggested that greater use should be made of fiscal stabilization instruments in order to ensure a better macro- economic performance.
FISCAL POLICY, CYCLES AND GROWTH • RICARDO MARINER

C E P A L R E V I E W 6 4 • A P R I L 1 9 6 8 77
IIThe interaction between the economic cycle, fiscal policy and long-term growth
In macroeconomics, long-term growth and short-term fluctuations are usually analyzed separately. Thus, it is implicitly suggested that the two are completely independent, so that temporary upsets do not have lasting effects on growth. On the one hand, the debate on the neutral nature of money or the effectiveness of fiscal policy concentrates on describing short-term fluctuations around a given trend and on the desirability of eliminating or alternatively of maintaining such cyclical movements. On the other hand, long-term growth is considered as a phenomenon which is independent of economic fluctuations; the prime objective of researchers is therefore to discover the factors that determine it and the policies that affect it. This reasoning is based on two main assumptions: i) that the cost of fluctuations in terms of well-being is not significant and ii) that macro- economic intervention/stabilization policies do not make much sense in this context.
In this respect, Lucas (1988) has suggested that the value of understanding cycles is only trivial compared with that which could be expected from understanding long-term growth (“the implications that this kind of question holds for human well-being are simply tremendous: once one begins to think about them, it is difficult to think about anything else”). He reaffirms with deep conviction and in dramatic terms the standard dichotomy in macroeconomic studies and asserts the preponderance of economic growth theories over debates on fluctuations. In the words of Sala-i-Martin (1994), “short-term cyclical movements are like tiny and almost irrelevant little variations compared with the immensity and force of the long-term growth rate”.
The empirical literature on the determinants of growth was given a strong impulse with the publication of comparable per capita g d p data for more than 130 countries (Summers and Heston, 1991). Barro (1991) used this set of data to analyze the empirical determinants of growth rates, and since the publication of his article over 50 variables have been found which have a significant correlation with per capita
GDP (Sala-i-Martin, 1994). Within those variables, various fiscal policy indicators undoubtedly have a leading role.
1. Empirical analysis of the impact of fiscalpolicy on growth
Fiscal policy affects long-term growth in four main ways. The first is its direct participation in capital accumulation, especially infrastructure. The second is the crowding-out effect that the financing of public activities can have on private saving and investment. The third is connected with the size of the State and the negative externalities produced by excessive State intervention on aggregate productivity. Finally, the fourth concerns mechanisms which could be grouped together under the title of the quality of public policies.
In regressions like those carried out by Barro, a positive relationship is usually identified between public investment and growth. Thus, for example, on the basis of disaggregated information for a set of developing countries, Easterly and Rebelo (1993) found a solid and significant relationship between public investment and growth, especially in the transport and telecommunications sectors. These authors also report a positive direct influence of public investment on private investment. Devarajan, Swaroop and Zou (1993) identify a non-linear influence of expenditure on infrastructure, consistent with decreasing yields to scale: at low levels of expenditure, its marginal contribution to aggregate productivity is very high, but it rapidly declines and tends to disappear for high values of the ratio between public investment and GDP (inverted U-curve),
Public expenditure in general and the taxes needed to finance it have a negative effect on private investment and growth, however. Mendoza, Milesi and Asea (1995) observed significant effects of the level of taxes on long-term growth, although they were quite small and had coefficients which were fairly weak in relation to other alternative specifica
FISCAL POLICY, CYCLES AND GROWTH » RICARDO MARTNER

78 C E P A L R E V I E W $ 4 • A P R I L 1 9 9 6
tions. De la Fuente (1997), for his part, considers that in the member countries of the Organization for Economic Co-operation and Development (o e c d ) , for every dollar that public investment increases, private investment goes down by 32 cents. The impact is smaller in the case of transfers to households, probably because these represent a redistribution of income among private individuals.
Many studies have also found a partial negative correlation between growth and the size of the public sector, with the latter measured as the ratio of government consumption to GDP (Barro, 1991) or public expenditure as a proportion of g d p . The argument in support of this, which is extremely well known, is that the externalities generated by improductive public expenditure give rise to distortions in the economy which reduce the growth rate of productivity and income. De la Fuente (1997), for example, calculates that a 5 per cent reduction in total public expenditure (keeping investment and transfers constant) would increase the average growth rate of the o e c d economies by two-thirds of a percentage point per year in the medium term. Some authors, however, have highlighted the relatively weak statistical basis of these results, showing that when other relevant variables are added the negative influence of public expenditure disappears (Levine and Renelt, 1992; Easterly and Rebelo, 1993; Andrés, Doménech and Molinas, 1993). There are few empirical proofs, then, of the negative impact of public expenditure on g d p , when an effort is made to measure it systematically.
Finally, some studies try to measure the impact of the quality of public policies on long-term growth. Thus, for example, the report by the World Bank (1997) includes in its multiple regressions a measurement of “good government” in which a public policies variable, defined as a synthetic indicator which includes measurements of the openness of the economy, price distortions (difference between domestic and international prices) and over-valuation of the exchange rate represent a factor for explaining differences of income between developing countries.
The conclusions are not free from the classical problems of multi-collinearity and endogenous elements displayed by this type of regression. In fact, the effects of fiscal policy are not distinguishable from the spurious correlation between fiscal structure and per capita income. Moreover, it is hard to rule out the existence of a spurious correlation among the variables due to the problem of inverse causality. Thus, for example, the interaction between public
expenditure and the growth rate would make it necessary to carry out sensitivity analyses and tests for weak exogenous influences in order to verify the soundness of the results.
Two useful lessons for our purpose may be drawn from this summary examination of the empirical evidence on the impact of fiscal policy: i) it is very difficult to identify a clear causal relationship between government policies and growth, both because of the complexity of the mutual interactions and also because of the difficulty of measuring the multiple actions of the State in the area of the economy, and ii) in line with the foregoing, the international data do not allow a convincing numerical relationship to be established between the size of the State and economic growth, although of course “the measure of our ignorance” should not lead us to underestimate the importance of “good government” in development processes.
2. Volatility, irreversibility and macroeconomicregulation
The sinusoidal image of growth already mentioned earlier, in which the fluctuations twist about a predetermined trend, seems an excessively mechanical view of the process. It is hard to believe that the magnitude or duration of cycles do not have lasting effects on the economic system. The assumption of hysteresis, understood as the irreversibility caused by negative upsets, has important policy implications: one of the requisites for increasing the long-term growth rate of a country is to reduce its real volatility.
In theory, there are linkages of different signs between short-term instability and long-term growth of the product. This relation may be positive in the context of a Schumpeterian process of “creative destruction”. Recessions are a “necessary evil” which makes it possible to eliminate obsolete techniques and activities and increase global productivity. The alternation of phases of recession and reactivation is therefore positive for long-term growth. Models of real cycles highlight the essentially transitory nature of random upsets of technological origin in the economic cycle and consequently ignore the possible adverse effects of fluctuations on the long term.
The negative relation between volatility and growth has two main explanations in the economic literature. Hie first, and undoubtedly the dominant, explanation is connected with the adverse impact that uncertainty has on private investment expenditure. If
FISCAL POLICY, CYCLES AND GROWTH • RICARDO MARTNER

C E P A L R E V I E W 6 4 • A P R I L 1 9 9 6 79
TABLE 1Latin American countries: Growth rates and volatility
Period:
Country
Average (%) Standard deviation
1981-1996 1985-1996 1981-1996 1985-1996
Argentina 1.3 2.0 0.054 0.056Bolivia 1.6 2,8 0.031 0.023Brazil 2.1 2.8 0.039 0.036Chile 4.5 6.3 0.054 0.023Colombia 3.9 4.5 0.016 0.014Costa Rica 2.9 3.8 0.038 0.020Ecuador 2.4 2.7 0.031 0.031Mexico 1.9 1.9 0.038 0.034Paraguay 3.1 3.5 0.029 0.018Peru 1.4 2.1 0.073 0.072Uruguay 1.8 3.6 0.048 0.035Venezuela 1.3 2.5 0.048 0.048
Source: ECLAC data; the volatility of GDP is calculated as its simple standard deviation for both periods.
investment is irreversible, then greater volatility (which gives rise to uncertainty in future demand) may cause the agents to be reluctant to carry out their medium-term projects. The second argument is connected with the process of “learning by doing”, and indicates that part of long-term growth is due to the faculty of learning and the experience accumulated on the job. Consequently, recessions (and the unemployment they cause) represent episodes of dis- accumulation of physical and human capital which strongly affect future growth. The mechanisms of creative destruction, irreversibility and learning by doing may exist side by side in reality, and the predominance of one or another of them is an empirical matter.
It is considered that in general there is a significant negative relation between volatility and growth. Ramey and Ramey (1995) show that a smaller standard deviation of GDP is associated with a higher average growth rate, both for a sample of 92 countries and for the o e c d member countries. These studies take as their starting point the regressions of Barro (1991) and Levine and Renelt (1992), which seek to explain the differences in growth rates between countries by the usual empirical factors: the initial level of per capita g d p (conditional convergence effect), initial human capital (measured by the average number of years of schooling of the population over 25, or the rate of secondary education in the case of the OECD countries), and the average investment rate. When, in addition to these variables, the indicator of volatility (measured as the standard deviation of the annual growth rate) is introduced into the regressions
for the period 1960-1988, the coefficient is negative and significant (as also occurs when the short-term volatility is measured by the standard deviation of the rate of unemployment). According to these calculations, a reduction of one standard deviation of volatility leads to an increase in the growth rate of between 0.3% and 0.6% per year. In terms of magnitude, volatility comes second among the growth factors, after the initial level of GDP and above the investment rate. It should be noted that the estimated impact is independent of the indirect effect of volatility on physical investment, since this latter variable is included in the regressions. All other things being equal, the countries in this sample which have had higher rates of volatility have grown less since 1960.
It seems important, then, to analyze the repercussions of the extraordinary real volatility which has existed in our countries on development. These big fluctuations have led to low average growth rates in most of the Latin American economies. Coder (1997) made estimates for 17 countries of the region for the period 1960-1995 and showed that there is a significant and quite solid negative relationship between the growth rate of GDP and its standard deviation, similar to the correlation observed between investment and an indicator of unexpected volatility. Table 1 shows details of the average growth and standard deviation for 12 countries of the region between 1981 and 1996 and between 1985 and 1996. In many countries, if the transitory external debt upset -i.e., that observed in the first half of the previous decade- is eliminated, the average growth rate increases and the standard deviation decreases. The two problems still remain,
FISCAL POLICY, CYCLES AND GROWTH • RICARDO MARINER

80 C E P A L R E V I E W 6 4 • A P R I L 1 6 6 8
FIGURE 1
Latin America: Volatility and performance of selected countries, 1985*1996
0.08
1 g 0.07
j a 0.06
.§ 0.050.04
■I 0.03
1 0.02 co0.01
0,000.0ft 1.0ft 2.0ft 3.0ft 4.0ft 5.0ft 6.0ft 7.0ft
I Average growth rate
however: generally speaking, the Latin American economies have grown little on average, with many ups and downs,
Without going into a quantitative analysis, the negative relation between growth and economic cycles seems quite clear when we compare the growth rate of GDP with its standard deviation over the period 1985-1996 (figure 1); the countries with the highest average growth (Chile, Colombia, Costa Rica) are also those with the smallest variability. Moguillansky (1996) shows that the factors of variability are important determinants of private investment in the Latin American countries and hence of the potential growth of their economies. Although this is not the only or even perhaps the main explanatory factor, it seems reasonable to identify a positive connection between longterm growth and macroeconomic stability in the Latin American countries.
Thus, the benefits of stabilization may be considerable if declines in the product from its equilibrium level give rise to major costs in terms of well-being. This can happen if the aggregate variability has major effects on decisions affecting production capacity (investment) and, hence, the potential product. If this point of view is correct, countercyclical stabilization policies could mean significant gains in well-being (Romer, 1993). There would thus be a kind of symmetry between the episodes of expansion and contraction of demand. If there is an awareness that major fluctuations in the level of activity have harmful effects, then monetary, exchange- rate and fiscal policies must be very active in order to “insulate” the economy from external upsets and cushion the domestic ones. In this context, it is no longer a question, as Friedman (1968) says, of preventing the policies themselves from being a major source of upsets, but rather of designing policies,
a Perú
□ Argentina
□ Venezuela Brazil
□ M ex ico n ° a U ru g u a yEcuador Chile
Bolivia □ „ n . □□ □ Costa Rica
Paraguay □ Colombia
instruments and institutions which minimize both the causes of the fluctuations and their consequences.
3. T h e m a g ic s q u a re , fine tu n in g a n d v ir tu o u s c irc le s
The imposition of rules and the development of institutions aimed at solving the problem of the inconsistency of growth and preventing pressures in the design of economic policies seem to be quite generalized approaches at the present time. It would therefore be desirable to formulate intermediate objectives -for example, a stable growth rate of the money supply or a ceiling on the fiscal deficit- as a way of imposing restrictions on the discretional powers of the authorities. A system under which governments seek to attain their final objectives (in terms of inflation and unemployment) without laying down rules for the intermediate objectives could be a source of potential errors. Policymakers may genuinely have the aim of maximizing social well-being, yet in spite of this (or perhaps because of it) they commit systematic errors. Thus, for example, the authorities may give too much weight to the short-term costs of higher unemployment as compared with the long-term costs of higher inflation. This can happen if there are strong political pressures or there is not a clear knowledge of the way the economy operates. In this context, the procedure which seems to be a maxim of our times is applied: if we know little, then we had better do little, since taking measures and then having to reverse them may be more costly than not doing anything at all.1 As the effects of decisions are uncertain, it is reasoned that more ac-v tive policies would lead to still greater uncertainty.2
In the same direction, Lucas (1994) holds that, since only surprise measures can have some effect, the most that can be expected from economic policy is that it should be neutral, with two clear rules: i) a balanced fiscal budget (which refrains from using economic policy for regulatory purposes), and ii) a monetary policy which maintains a growth rate of the money supply in keeping with the potential growth of activity (thus preventing the use of monetary policy as an anti-cyclical instrument). It may be noted that this argument is consonant with the assertion that short-term fluctuations are irrelevant.
1 For an interesting analysis of the importance of intervention at the macroeconomic level, see Blanchard (1996).2 The classic article by Brainard (1967) introduces the idea of multiplicative uncertainty.
FISCAL POLICY, CYCLES AND GROWTH • RICARDO MARINER

C E P A L R E V I E W 6 4 • A P R I L 1 « » 6 81
FIGURE 2
The Magic Square
+---------------------------------------GDP Inflation
Emphasis is often placed on the desirability of watching over the macroeconomic balances as a necessary condition for ensuring growth. It is essential to keep inflation and the external and public balances under control in order to create suitable conditions for growth (figure 2). But the problem is that the relations between the four coiners of the magic square are multiple and interdependent There are short-term dilemmas which are by no means insignificant between inflation and growth, between the external balance and GDP, between the public deficit and GDP, and between inflation and the external sector, and the way they are tackled conditions future growth. It is not possible, therefore, to reduce the role of macroeconomic policies simply to “maintaining the balances”, since both what is done and what is not done have significant effects on the evolution of an economy.
Macroeconomic efficiency diminishes volatility and reduces the magnitude of the cycle, bringing the level of activity increasingly close to the production frontier and transforming the magic square into a virtuous circle. Macroeconomic regulation therefore takes on great importance in development processes; the State is responsible for safeguarding the “common good” that stability represents in a market economy. The announcement of explicit medium-term objectives for the four comers of the magic square can help in this respect. But the rules must also be flexible, in order to give the authorities the discre- tionality they need to forestall the generation of harmful fluctuations. Explicit rules form a sound basis for the “structural” credibility of economic policies, but discretionality is also needed in order to ensure the capacity for regulatory intervention.
It is not really necessary to “choose” in the dilemma between credibility and flexibility; it should be possible to achieve institutional arrangements which allow both concepts to be reconciled. The credibility of policies does not depend so much on respect for rigid rules as on the simultaneous fulfillment -within reasonable limits- of the four objectives of the magic square. If fiscal and monetary policies have an anti-cyclical component regarding the terms of trade and inflow of capital, there are greater possibilities of achieving medium-term stability objectives and, ultimately, coming as close as possible to the production frontier. This means intervening energetically in the economic cycle, both in that generated by domestic fluctuations and in that due to external forces. All options are legitimate for this purpose; the best policy for withstanding a negative upset tomorrow is to develop the necessary institutions and introduce today a set of measures which will make it possible to accumulate reserves to cope with the bottom part of the cycle.
The application of rules of this type, understood as the definition of instruments and selection of objectives (Fontaine, 1995), gives credibility to macroeconomic policy and makes it possible to achieve its objectives. If the intervention in the economy by the authorities is in line with more or less well-known rules, this will help to put the expectations of private agents on a steady basis. These rules are not numerical, but rather normative, however. When we speak of well-known rules, for example, we nevertheless mean that there should be some flexibility in the targets regarding the public balance (if the public deficit is greater than expected in an environment which is more recessionary than was anticipated, it is desirable to activate the automatic stabilizers rather than fulfill the goals strictly) or that if there is an excessive increase in aggregate demand there should be a reaction by the Central Bank.3 Flexible rules (exchange rate fluctuation bands, ranges of inflation, and ranges of external and public deficit) provide the degree of discretionality that the economic authorities need in order to avoid the generation of harmful fluctuations. In other words, there must be semi-automatic rules, if
3 In this respect, the agents’ internalization of the Phillips curve and of the reaction of the Central Bank is noteworthy. In the United States, for example, an excessive increase in employment immediately gives rise to expectations of a rise in interest rates. Inflation may be very low, but the agents already know that the Central Bank will react even before a possible outbreak of inflation takes place.
FISCAL POUCY, CYCLES AND GROWTH • RICARDO MARTNER

82 C E P A L R E V I E W « 4 • A P R I L 1 9 9 8
possible anti-cyclical, in order to achieve objectives under normal conditions, but the authorities should reserve full capacity to intervene in possible situations of external or internal disturbances which may distort the growth path and increase real volatility.
Rules cannot be completely mechanical in an increasingly complex world. In this respect, rules laid down by decree or law, or institutions with too much independence, are not only undemocratic but can also accentuate the fluctuations if an attempt is made to achieve a single objective at any price. In reality, there is not much point in establishing excessively precise goals in respect of inflation or the public deficit. The important thing is to achieve a certain degree of relative stability, to smooth down expectations, rather than to precisely fulfill the announced goals. What improves the business climate is not the reduction of the public deficit or of inflation in themselves, but the steadying of expectations that takes place when the macroeconomic policy is seen to be effective in influencing private sector decisions.
There is a much better chance that the goal in terms of inflation will be fulfilled if the combination of exchange-rate, monetary and fiscal policies respects a current account objective and, in addition, can help increase domestic saving. If it were necessary to establish an order of precedence among the four economic policy objectives, then first of all it
would be necessary to set a current account objective, and then objectives in respect of inflation, the level of activity, and finally the public deficit. The current account objective should be in real terms, in order to take account of changes in relative prices with the exterior and introduce a reference situation; it should be sustainable, with an external debt/GDP ratio that will not increase, and it should be of a medium-term nature (it is better to establish ranges of values rather than precise goals).4 This means controlling aggregate demand, through all the relevant policies, as a function of the external results. This way of approaching the problem makes it necessary to establish a certain order of objectives, which can always prove to be dangerous, unorthodox, rather arbitrary and perhaps impossible to achieve. It is also the way in which the authorities have had to act when there is a pressing external constraint. Clearly, under normal conditions, fulfilling the external balance objective (in terms of the current account deficit) will make it possible to obtain results with regard to inflation, growth, unemployment and the public balance. The purpose of fine tuning is to establish suitable conditions for giving rise to virtuous circles within the magic square, with the clear objective of reducing aggregate fluctuations through a wide range of instruments, of which fiscal policy is particularly important.
IllFiscal policy design criteria
Let us assume, in order to simplify the analysis, that fiscal policy has two macroeconomic objectives: i) sustainability of the deficit, defined in technical terms as the public balance that keeps the public debt/GDP ratio stable, and ii) macroeconomic stabilization, defined as the combination of expenditure and income which will ensure a suitable level of aggregate demand. In Latin America, more than in other parts of the world, governments have concentrated their efforts on reducing the deficit and public debt, leaving the regulatory role, if it exists, to monetary policy. In order to achieve these objectives, two ways may be chosen: i) the application of discretional measures, with the authorities using all the instruments available to them as they see fit, or ii) the
establishment of explicit rules, with restrictions being imposed on public intervention in order to make its actions more transparent and credible. In the following sections, the various fiscal policy criteria will be discussed as a function of these four concepts.
1. Sustainability or macroeconomic regulation?
The evolution of the public debt in Latin America and the big changes displayed by it in the 1980s and 1990s raise the question of the sustainability of fiscal
4 Held and Szalachman (1997) make a more detailed analysis of the importance of establishing a conservative sustainable deficit objective and the desirability of basing the definition of this objective on a number of domestic and external indicators.
FISCAL POLICY, CYCLES AND GROWTH • RICARDO MARTNER

C E P A L R E V I E W 6 4 • A P R I L 1 9 6 6 83
policy. Long and irregular episodes of -sometimes explosive- growth of indebtedness were followed by short and very violent adjustments. It has often happened that the fiscal budget has been involved in an unstable pattern of sudden growth (“snowballing”) of indebtedness in which the servicing of that debt absorbs a growing proportion of fiscal revenue. Apart from the fact that there may be excessively expansionary policies, this perverse pattern is generally exogenous to the public sector and those responsible for it. Thus, if the (domestic or external) interest rate increases and growth falls, the sustainability of fiscal policy is immediately brought into question. Even when there are no discretional decisions by the authorities, the persistence of a situation of this type gives rise to an explosive pattern of growth of the debt.
Thus, a restrictive monetary policy increases the public deficit, especially if the exchange rate appreciates and public indebtedness includes a significant external component. It is by no means hard to imagine this kind of situation, in view of the abundant examples observed in the region in recent years. It is worth wondering if, in these conditions, the excessive use of monetary policy is an efficient way of stabilizing the economy. Although managing interest rates may help to correct excessive movements of private expenditure, it can also generate, maintain or aggravate a potentially destabilizing movement on the fiscal side. Although these situations may be only transitory, their effects on the budget may become permanent, giving rise to the persistence of deficits and debts. If there were some automatic stabilization mechanism, these debts and deficits would be absorbed in the economic cycle, if the exogenous variables returned to their medium-term path. In general, however, these self-regulating mechanisms are insufficient, so that the deficits become persistent.
The sustainability of the public deficit, which is no more nor less than the long-term solvency of the government, depends on the observance of its budgetary restrictions over time, which is expressed in the form of two equivalent identities: i) the public debt is equal to the updated value of the anticipated future primary surpluses, and ii) the updated value of the debt for a horizon tending to infinity is zero. Sustainability may be defined as a condition of stability of the public debt in a determinist world, or one of being stationary in a stochastic world (Hamilton and Flavin, 1986). In the latter case, the State is solvent if the public debt/GDP ratio is stationary. What this latter property tries to reflect is that the solvency of the
government is endangered not so much by the existence of deficits as their persistence at an excessively high level.
a) Balanced budget lawsMany authors maintain that public deficits are
the cause of high real interest rates and stagnation of production. Reduction of the public deficit may be painful in the short term, but it has very favourable effects in the future, since it reduces interest rates because of the greater availability of private saving and stimulates investment, consumption and production. This view assumes the adoption of specific rules, according to the particular case, for reducing the deficits to “reasonable” levels or securing completely balanced fiscal accounts. One of the most hotly debated reforms at present is the introduction of constitutional laws demanding a balanced budget, or measures to limit the government’s power to run up deficits. It is argued that, even if it is accepted that this is a second-best policy, a balanced budget law would have the merit of doing away with second-best solutions of political origin which may lead to much greater problems than those arising from the failure to cyclically adjust the budget (Alesina and Perotti, 1995).
The most radical supporters of this view hold that the budget should be balanced at all times. In theory, the benefits of having a numerical target for the balance are clear, both for strengthening fiscal discipline and for stimulating long-term economic growth. A law that makes a balanced budget compulsory would eliminate the sources of imbalance generated by opportunistic politicians and short-sighted views. There are no actual cases where such a rule has legal force, but in some countries the maintenance of a budget which is balanced or even shows a surplus is indeed a prime objective. It seems fair that it should be the beneficiaries of public services who should pay for them and that the costs should not be placed on the shoulders of future generations, but only in the case of current expenditure which does not give rise to future income.
In the literature on this subject, two main arguments are put forward against the use of strict numerical targets. The first is that a rule of this type increases the incentive to use accounting practices which are “creative rather than transparent” (Alesina and Perotti, 1996), since there are innumerable accounting tricks which make it possible to apparently
FISCAL POLICY, CYCLES AND GROWTH • RICARDO MARTNER

84 C E P A L R E V I E W 6 4 • A P R I L 1 9 9 8
respect the objectives but reduce the transparency of the budget; in the medium term, lack of transparency becomes a serious impediment to controlling expenditure and achieving the institutional consolidation of budgetary procedures. The second argument is of an economic nature. Quite apart from the contractionary consequences of an adjustment process of this type, balanced budget rules turn the public sector into an amplifier for economic fluctuations. Their strict application means that exogenous upsets must be instantly absorbed by the public sector, thus leading to the programming of public income and expenditure on a sub-annual basis. Immediate regulation of the deficit represents a radical break with the principle of using fiscal policy for macroeconomic stabilization purposes. It is also at variance with the rules that state that the level of public expenditure should be guided by structural objectives and should be as foreseeable as possible.
Thus, for example, if there is a recession public income goes down more than proportionately to the reduction in GDP (the elasticity of revenue collection is generally greater than unity if there is some degree of progressiveness in the tax system). The balanced budget rule would entail the immediate reduction of expenditure by an amount equal to the loss of revenue, which would certainly aggravate the recession and reduce tax income still further. Procyclical policies can turn the economy into a bottomless pit. On the other hand, a situation of expansion would provide room for reducing taxes, which would mean speeding up the growth of demand, with the consequent risk of increasing inflation. In this respect, a rule demanding a strictly defined balance would be a second-best solution. To sum up, balanced budget laws are probably not a good idea, since they introduce incentives to reduce budget transparency and also lead to excessive fiscal rigidity.
In view of the foregoing, it is extraordinarily difficult, if not impossible, to put forward a practical constitutional amendment in this respect. As Mus- grave (1997) suggests, the establishment of rules governing the procedures to be followed does not require such a constitutional amendment, nor can faith in rules take the place of the implementation of responsible policies. In our classification, this policy would be sustainable and would have a high normative content, but it would leave little or no room for the regulatory role of fiscal policy and would also prevent discretional intervention.
b) The sustainable deficitWhen the real interest rate is lower than the real
growth rate of GDP, a certain amount of deficit can be financed through public indebtedness, without increasing the public debt burden. In this case, it is possible to handle primary deficits on an ongoing basis, while respecting the criterion of debt sustainability (Bohn, 1995). When the interest rate is higher than the growth rate of GDP, however, the persistence of a primary deficit gives rise to explosive growth of the debt and of interest payments, which sooner or later endangers the solvency of the public sector. In order to stabilize the debt, then, it is necessary to achieve a primary surplus which will make it possible to pay that part of the interest commitments which is not absorbed by the growth of the economy. This primary surplus is proportional to the prior total debt and to the difference between the interest rate and the growth rate. In highly dynamic economies marked by a positive differential in this respect, of course, the sustainability of fiscal policy is ensured because the debt is gradually eroded by growth.
If the objective pursued is to stabilize the public debt and there is a lack of monetary financing, a situation of stagnation and high interest rates makes it necessary to generate surpluses proportional to the relative weight of the debt. In view of the extreme sensitivity of the public accounts and the size of the adjustments required in a situation of stagnation of the economy, short-term goals for the deficit are impracticable. This perverse mechanism explains the explosive growth of public indebtedness in most of the countries of the region in the situation of recession and high interest rates which prevailed in what has been called the “lost decade”.
The obligation to respect goals in respect of the public balance in conditions of high real interest rates leads to the short-term adaptation of the level of public expenditure to the level of income, in order to maintain the annual goal. In a policy of this kind, the government must manage public expenditure on almost a monthly basis, in view of the sensitivity of public income to the level of activity. This kind of management of the budget, which entails multiple revisions of public expenditure plans in the course of the year, increases the uncertainty of the environment in which private decisions are taken. In their efforts to anticipate this policy in a rational manner, the agents would tend to act in a procyclical manner, since the reduction of public demand would announce a reduction in private demand, and vice
FISCAL POLICY, CYCLES AND GROWTH • RICARDO MARTNER

C E P A L R E V I E W « 4 • A P R I L 1 9 9 8 85
versa. The question of the sustainability of public indebtedness and of the solvency of the public sector thus becomes a central issue in the formation of the agents’ expectations, but it would appear to be ill-advised to establish rigid rules regarding the sustainable debt or deficit in such changeable conditions of the macroeconomic environment.
When a public balance target fixed a priori -whether it refers to the surplus, balance or the deficit- is maintained regardless of the evolution of the level of activity and the other macroeconomic variables, the role of the public finances as automatic stabilizers disappears. When these rules are explicit, budgetary policy plays a markedly procyclical role. In our classification, as in the previous cases, the sustainable deficit rule reduces the flexibility of fiscal policy and prevents its use as a regulatory instrument.
c) The golden rule for the public financesIn the European countries, the debate can be set
forth in different terms. A fundamental aspect of the Maastricht Treaty is the adoption of explicit restrictions on fiscal policy for the countries which are going to form part of the European Monetary Union. The justification for these limitations is that overindebtedness of a member country could lead to monetary destabilization. The rules adopted are more flexible than in the case of the balanced budget law. Since the historical rate of public investment in Europe has been 3% of GDP, a reference value of 3% of GDP for the deficit is something like a golden rule for the public finances: indebtedness is permissible subject to limitation by capital expenditure (Corsetti and Roubini, 1996).
If public sector investment is profitable, future flows of current income for covering the costs of indebtedness are ensured. The Maastricht criterion may be interpreted, then, as an implicit rule for the current account balance of the public accounts. This golden rule, which is more flexible than those of the balanced budget and sustainable deficit criteria, is based on a macroeconomic logic: the budget must be neutral with respect to private agents’ consumption and saving decisions. In its strictest version, the golden rule would mean, for example, that subsidies to enterprises would not be financed from taxation but from credits and that the income from privatization operations would not be available for financing current expenditure. With regard to short-term stabilization policies, the Maastricht Treaty itself and the recent arrangements in connection with it allow the target balance to be interpreted more flexibly, accept
ing higher (although limited) deficits due to temporary cyclical factors. The idea behind the establishment of these numerical targets would appear to be to ensure a balanced current account budget position in the medium term. Although this rule is more flexible than the foregoing examples, it is still within the area of normative criteria basically aimed at ensuring a sustainable fiscal policy, even to the detriment of the regulatory objective and of flexibility in the authorities’ interventions.
d) Optimum fiscal policyOptimum fiscal policy (Barro, 1979) means that
the budget deficits and surpluses are used in the best possible manner to minimize the distorting effects of taxes for a certain given behaviour of expenditure. Consequently, the public balance is used as a shock absorber; there are deficits when expenditure is momentarily higher, and surpluses when it is low. If public expenditure has to be high today and low tomorrow (if there is a war, for example), a balanced budget policy means that there must be high tax rates today, followed by a reduction of taxes tomorrow. Optimum fiscal policy suggests rather the application of constant tax rates, however, accepting a deficit today; obviously, the surplus tomorrow will have to make up for the present deficit in terms of its present value. This policy is preferable to that of the balanced budget, because in the latter policy the additional tax distortions of today more than outweigh (in terms of utility) the social advantages of the lower tax rates of tomorrow, because of the decreasing marginal profits. Optimum fiscal- policy means not changing tax rates to cope with a momentary deficit situation.
This simple principle has far-reaching consequences for fiscal policy.5 The principle of optimum fiscal policy is very clear: fiscal deficits and surpluses are used in the best possible way in order to minimize the distorting effects of taxation. An important extension of this policy refers to cyclical fluctuations in tax revenue: tax rates should remain approximately constant during the economic cycle, thus accepting deficits during periods of recession, which will be offset by surpluses during periods of expansion. The optimum nature of the policy assumes a balanced budget rule which is adjusted for cycles; deficits should be allowed during wars and recessions if they are offset by equivalent surpluses in periods of peace and expansion.
5 For an analysis of this question, see Alesina and Berotti, 1995.
FISCAL POLICY, CYCLES AND GROWTH * RICARDO MARTNER

86 C E P A L R E V I E W 6 4 • A P R I L 1 9 9 8
Curiously enough, although with different arguments, old Keynesian and new classical economists advocate similar fiscal policy rules, although assuredly with different levels of public expenditure. It should be noted that we are not talking about Keynesian stabilization policies, because we are dealing with a supply-side model. Compared with the previous rules, optimum fiscal policy seeks medium-term sustainability, thus leaving room for the accommodation of the public balance as a function of macroeconomic circumstances. The normative component is more flexible: a constant rate of taxation is preferred to a rule fixing a target balance. There are no reasons for adopting discretional regulatory policies, since the tax rate is fixed once and for all as a function of permanent expenditure,
e) Active regulatory policiesFor traditional Keynesians, fiscal policy should
ensure surpluses in situations of full employment and accept deficits in recessions, giving a zero average balance for the cycle as a whole. If the objective of fiscal policy is to obtain an average balance independently of the cycle, then the annual balance is allowed to vary as a function of domestic conditions, allowing the spontaneous mechanisms of the automatic stabilizers to act Deficits are perfectly legitimate and even necessary in periods of crisis, but the suggestion that there should be surpluses at times of full employment has met with a cooler reception. As Tobin (1993) emphasizes, Keynesian macroeconomic policies apply to both sides of the medal. The fiscal surplus is a fundamental instrument for containing excess expenditure. Macroeconomic stabilization calls for reasonably symmetrical countercyclical regulation of demand.
Efficient macroeconomic management also involves the achievement of increasing degrees of tax consensus among the economic agents, however, especially when there are upsets of various types. The tax consensus means reducing private and public expenditure in situations of excessive demand through taxes on households and enterprises and through the fiscal adjustment itself. A more active fiscal policy can help to improve the effectiveness of short-term regulation. In order to use tax instruments designed to check oscillations in private expenditure, however, the authorities need a certain amount of freedom to fix tax rates, which they do not have at present.
In this respect, there are some interesting proposals for establishing by law certain ranges of tax rates within which taxes can vary according to the prevailing conditions. There is a danger, of course, that the
authorities might be tempted to keep those rates always at the highest levels in order to cover their expenditure more easily. The experience in this respect shows that it has been very difficult to come to an agreement between the Executive and the Legislature for the efficient use of tax rates for stabilization purposes. Although this is the most powerful means of directly managing the evolution of private expenditure, it is very little used in the Latin American countries.
In our classification, active intervention policies are classed as discretional (and therefore run the risk of being somewhat arbitrary) and are concerned basically with the aim of regulation. There may be a bias towards excessive intervention, exaggerated public expenditure or an insufficiently controlled deficit. At some point, the regulation of aggregate demand through fiscal policy comes into conflict with sustainability, giving rise to the well-known consequences in terms of economic-political cycles and/or the accumulation of imbalances. Whether for intellectual reasons or on account of the lessons of experience, many analysts tend to reject the discretional intervention model because of the dangers of arbitrary action, populism and fiscal irresponsibility that it involves. The fixing of external limits or the exertion of control by Congress or other State organs to prevent excesses in the management of public expenditure and tax rates would appear to be advisable in order to avoid potentially destabilizing fiscal cycles.
f) Automatic stabilizers and rules on expenditureIn periods of expansion, public revenue grows
rapidly and the expenditure associated with unemployment benefits tends to go down, thus temporarily easing the management of the public finances. At times of recession, in contrast, the low level of activity seriously affects the budgetary balance. The types of public income and expenditure whose evolution is linked to the economic cycle are called automatic stabilizers.
The “rule” for fiscal policy cannot be the deficit itself, but its discretional component, which is independent of the economic cycle. The programming of income and expenditure as a function of a discretional target in terms of the deficit would allow a medium-term approach to be taken in the management of the public finances, thus avoiding continuous fluctuations in policy formulation and execution. With economies as volatile as those of Latin America, the public sector cannot be allowed to become a sound
FISCAL POLICY, CYCLES AND GROWTH • RICARDO MARINER

C E P A L R E V I E W 6 4 • A P R I L 1 9 9 8 87
ing-board for short-term fluctuations. In the case of recession, for example, the public sector must accept a certain amount of cyclical deficit if it does not want to make the crisis still worse. If fiscal policy wants to avoid becoming an agent for the propagation and amplification of macroeconomic upsets, then medium- term budgetary rules should be adopted with the aim of controlling the discretional or permanent component of the deficit.
It is thus a question of seeking fiscal policy indicators which are independent of the economic cycle. This is the methodology of the OECD (Giomo and Suyker, 1997), in which the deficit is broken down into a cyclical component and a structural component. A variation in public income or expenditure is of a cyclical nature when it is produced by the difference between the observed product and the trend product. The cyclical position of the economy leads to fluctuations which are reflected in the budget, especially in tax revenue and expenditure on unemployment benefits. In contrast, when it is a question of variations which are due to decisions by the public authorities, then these are of a discretional nature.
For the OECD countries as a whole, the cyclical balance has ranged between +0.8 and -0.5 points of GDP between 1985 and 1996, although it has reached peaks of +2.6 points of GDP in the United Kingdom and +1.4 points in Japan and minimum levels of -2 points in Canada and -1.8 points in France (Giomo and Suyker, 1997). As table 2 shows, a breakdown of the global fiscal balance of the Latin American countries reveals a cyclical component of the deficit which has been very significant in the 1990s, fluctuating between -1 point of GDP in Argentina (1996) and Brazil (1992) and +1 point of GDP in Argentina and Uruguay (1994) (Mariner, 1997).
The relative size of the cyclical deficit depends on two factors: the gap between the effective and potential g d p (that is to say, the distance between the effective growth of the economy and its medium- term path) and the weight of taxes (i.e., the revenue directly linked with the level of activity) in total public income. Obviously, the cyclical component has been greatest in the most volatile countries, such as Peru, Argentina, Venezuela, Mexico and Brazil in the 1990s. In the more stable countries, in contrast, the cycle of the level of activity has had less influence on their public accounts (Paraguay, Bolivia, Colombia, Ecuador and Chile in the 1990s). The second determining element -the weight of tax revenue in total
public sector resources- is very significant in some countries (90% on average in Argentina, 80% in Peru, 70% in Chile, 60% in Brazil, Colombia and Mexico, and 50% in Costa Rica, Paraguay and Uruguay), but in others it is not outstandingly important (23% in Venezuela, 29% in Ecuador, 30% in Bolivia).
If we combine these two elements, we see that it is in Argentina, Peru, Brazil, Chile, Colombia, Costa Rica, Mexico and Uruguay that the influence of the economic cycle is of fundamental importance for evaluating the public accounts. In Bolivia, Paraguay and Ecuador, in contrast, the cyclical component is no more than 0.1 points of GDP, In Venezuela, the cyclical component has amounted to only 0.4 points of GDP in the 1990s, in spite of big fluctuations in the level of activity and the public accounts balance. This is because of the decisive influence both of variations in oil prices and rescue programmes for the financial system.
The above breakdown leads in some cases to a radically different interpretation of the results of the public accounts. Generally speaking, the cyclical component is seen to be important in the improvement in the public accounts in the early 1990s. In many countries, the reactivation of the economy at rates higher than the medium-term trend values led to fiscal results which were positive, but which were partly obtained on the basis of transitory resources. In this respect, it is essential to identify a sustainable medium-term path and to formulate fiscal policy as a function of the permanent incomes generated when the economy is located on its trend path. Moreover, the deterioration of the public accounts in some situations may be due to factors of a conjunctural nature rather than to deliberate actions by the authorities. In this case, the position within the cycle conceals a structural effort to improve the public accounts.
The use of indicators of fiscal discretionality is very useful for the analysis, formulation and design of budget policies. By giving a measure of the public deficit independent of the economic cycle, this makes it possible to identify more clearly the decisions of the fiscal authorities and to calculate the size of the deficit which has to be corrected through discretional measures. In this respect, a rule on the discretional deficit would be rather of a passive nature, since it would allow the automatic stabilizers to act. If the effective GDP were below the trend GDP, the cyclical component of the deficit, attributable to higher expenditure on unemployment benefits and smaller tax
FISCAL POLICY, CYCLES AND GROWTH * RICARDO MARINER

88 C E P A L R E V I E W 6 4 • A P R I L 1 9 9 8
TABLE 2
Latin American countries: Fiscal performance
1990 1991 1992 1993 1994 1995 1996
ArgentinaObserved balance -3.8 -1.6 -0.1 1.4 -0.2 -0.6 -1.9Structural balance -3.1 -1.5 -0.7 0.6 -1.5 0.1 -1.1Cyclical balance -0.7 -0.1 0.6 0.8 1.3 -0.7 -0.8BoliviaObserved balance -4.5 -4.3 -4.4 -6.1 -3.0 -2.0 -1.9Structural balance -4.5 -4.4 -4.3 -6.0 -3.0 -2.0 -1.9Cyclical balance - 0.1 -0.1 -0.1 - - -
BrazilObserved balance 1.4 -0.2 -1.8 -0.8 1.1 -4.9 -3.9Structural balance 0.8 -0.3 -1.1 -0.4 1.0 -5.2 -4.2Cyclical balance 0.6 0.1 -0.7 -0.4 0.1 0.3 0.3ChileObserved balance 0.8 1.5 2.2 1.9 1.7 2.5 2.2Structural balance 1.0 1.7 1.8 1.6 2.1 2.6 2.4Cyclical balance -0.2 -0.2 0.4 0.3 -0.4 -0.1 -0.2ColombiaObserved balance -0.5 -0.1 0.3 2.6 -0.5 -1.1Structural balance -0.8 0.2 0.2 0.6 2.5 -0.8 -1.1Cyclical balance 0.3 -0.2 -0.3 -0.3 0.1 0.3 -
Costa RicaObserved balance -2.5 -0.1 0.7 0.6 -6.6 -2.0 -2.7Structural balance -2.4 0.3 0.6 0.2 -7.0 -2.1 -2.1Cyclical balance -0.1 -0.4 0.1 0.4 0.4 0.1 -0,6EcuadorObserved balance 0.1 -1.0 -1.7 -0.4 -0.2 -1.5 -3,1Structural balance 0.2 -1.0 -1.8 -0.4 -0.3 -1.5 -3.0Cyclical balance -0.1 - 0.1 - 0.1 - -0.1MexicoObserved balance -2.8 3.5 4.8 0.8 -0.7 -0.8 -0.5Structural balance -2.5 3.5 4.6 0.6 -1.3 -0.4 -0.4Cyclical balance -0.3 - 0.2 0.2 0.6 -0.4 -0.1ParaguayObserved balance 5.2 2.9 0.1 1.2 2.4Structural balance 5.1 2.9 0,2 1.2 2.4 -0.1 -
Cyclical balance 0.1 - 0.1 - - 0.1 -
PeruObserved balance -2.1 -1.4 -1.5 -2.3 1.8 -1.6 2.2Structural balance -2.4 -1.5 -1.0 -1.7 -1.6 2.1 2.2Cyclical balance 0.3 0.1 -0.5 -0.6 0.2 0.5 -
UruguayObserved balance 0.3 1.3 1.5 -0.8 -2.5 -1.3 -1.2Structural balance 0.5 1.6 1.2 -1.0 -3.3 -0.8 -0.9Cyclical balance -0.2 0.3 0.3 0.2 0.8 -0.5 -0.3VenezuelaObserved balance 0.1 -2.2 -5.9 -1.3 -13.8 -5.9 7.5Structural balance 0.4 -2.3 -6.2 -1.6 -13.7 -5.9 7.9Cyclical balance -0.3 -0.1 0.3 0.3 -0.1 - -0.4
Source: Prepared by the author. See Martner, 1997,
FISCAL POLICY, CYCLES AND GROWTH • RICARDO MARTNER

C E P A L R E V I E W 6 4 * A P R I L 1 9 9 8 89
revenue receipts, would be financed through indebtedness. When the GDP returned to its medium-term trend path, this deficit would be automatically eliminated. The amount of debt contracted during the low part of the cycle would be absorbed in its high part. Both the balance and the total debt would be constant on average during the cycle, provided that the real interest rate was on average either equal to or not very different from the growth rate of the economy. A policy of this type is based on controversial assumptions, however, such as the need for a certain symmetry in the cycle and the absence of lasting effects of the latter. Realism calls for the maintenance of a certain amount of flexibility in economic policy in order to maintain the possibility of intervention in an uncertain environment.
In economies with a high degree of variability like those of Latin America, with periodic financing constraints and difficulties in establishing active fiscal policies, it would seem desirable to have explicit public expenditure rules throughout the cycle to make it possible to keep up growth when the economy is in the low part of the cycle and reduce the public debt when it is in the high part. For normal conditions, a prudent practice would be to allow expenditure to grow at a similar rate to the trend GDP and income to rise like the effective GDP. If the condition of the medium-term convergence of these two values is fulfilled, then obviously the average balance would be zero for the cycle. A programming criterion of this type presupposes strict control over certain types of expenditure (on health, for example), which tend to grow faster than the trend GDP. In our classification, these policies would have a certain normative component, but like all policies aimed at fulfilling the regulatory role of the public sector, they bring with them a tempting bias towards slacker fiscal discipline.
2. Discretionality or rules?
Figure 3 shows the position of the policies analysed above in the classification which we adopted. The position of each of these policies in the different quadrants of the area is relatively unimportant. In the lower left quadrant, the approach which we have called ap ostle o f accoun ting has much to do with the way fiscal policy is currently carried on in our countries. Very often, decisions follow an accounting logic rather than a macroeconomic one, with the discretional adoption of expenditure priorities which
FIGURE 3
Fiscal policy criteria
RULES
PUBUC VICES, PRIVATE VIRTUES
4 BALANCED BUDGET
O SUSTAINABLE DEFICIT
O GOLDEN RULE
SUSTAINABILITYO OPTIMUM FISCAL POLICY
O APOSTLE OF ACCOUNTING
PUBLIC AND PRIVATE VIRTUES
PUBUC AND PRIVATE VICES
o RULES ON EXPENDITURE
o AUTOMATIC STABILIZERS
REGULATION
O ENLIGHTENED DESPOT
PUBLIC VIRTUES, PRIVATE VICES
OISCRETIONAUTY
give preference to the fulfilment of strict targets regarding the balance. This is a perspective based on the idea of p u b lic a n d p r iv a te v ir tu es , in which the authorities trust in the self-regulating mechanisms of the market and the agents believe in the good judgement of public decisions. If, in contrast, the agents do not have confidence in what the public sector is doing, we enter the world of p u b lic v ices a n d p riva te vir tues (upper left quadrant), where priority is given to the establishment of explicit rules to ensure the sustainability of fiscal policy. There, within the combination of sustainability and rules, we have placed balanced budget laws and, below them, the idea of a sustainable deficit (a little less normative) and the golden rule of public finances (in which the objective of sustainability is a little more flexible).
Others, however, may tend to mistrust the market, and may advocate much more active regulation of aggregate demand, with discretional intervention. These active policies, which we have symbolized with the image of the en lig h ten ed despo t, are located in the world of p u b lic v ir tu es a n d p r iva te v ices (lower right quadrant). In this view of the world, the self-regulation mechanisms of the market are either non-existent or perverse, and it is therefore necessary to have flexible intervention mechanisms for controlling excessive (or insufficient) expenditure and insufficient (or excessive) saving in the private sector. It is important to note that here we are contrasting the criteria of regulation and sustainability, because of the potential tensions that may arise between them. If the effective GDP is less than the potential level, the criterion of regulation (which calls for anticyclical fiscal policy intervention) comes into contradiction
FISCAL POLICY, CYCLES AND GROWTH * RICARDO MARTNER

90 C E P A L R E V I E W 6 4 • A P R I L 1 9 * 8
with the criterion of sustainability (which favours a procyclical form of behaviour). Although there are situations where the two objectives are compatible (in the expansionary phase, anticyclical policy means increasing public saving, which obviously improves the financial position), the important thing in this classification is that it highlights the potential dilemmas that exist when establishing policy criteria.
In this respect, the impact of the automatic stabilizers on the level of activity has been the subject of intensive empirical evaluation but, as usually happens, the results have not been very enlightening. Weise (1996), for example, calculates that in the case of the United States, if the anticyclical reaction of the public balance were eliminated, the size of the recessions would increase by between one-third and half a percentage point of GDP. There would thus be a real conflict between the objectives of stabilization and short-term sustainability of fiscal policy. Other studies, however, show that the size of the cycle and the action of the automatic stabilizers are relatively independent of each other. It is estimated that for the OECD countries, the impact of variations in the public balance on the gap between effective and potential GDP is a good deal weaker (H6nin, 1997), thus considerably weakening the significance of the foregoing dilemma in this case. It is important to note that our classification refers basically to the more common definition of sustainability (understood as the annual and even monthly numerical goals for the balance imposed on governments in stabilization programmes). This criterion, if carried through to its ultimate consequences, would have a negative effect on the economic cycle and also, through the transmission mechanisms already referred to, on long-term growth.
Finally, the upper right quadrant shows us the combination of regulation and rules in which the automatic stabilizers and rules on expenditure may be located. In these cases, the normative component is more of an implicit nature and takes the form of a criterion rather than a strict rule. Policies involving automatic stabilizers refer more particularly to income, whereas rules on expenditure also try to limit the growth rate of expenditure, so that their normative and regulatory components are greater. Although these criteria are not of a mandatory nature for the public sector, they do represent clear guidelines for fiscal policy action, imposing maximum and minimum levels on expenditure and income. It may be recalled that we defined the rule on sustainable expenditure as the practice, in normal conditions, of
allowing public expenditure to grow like the trend GDP and income like the effective gdp.
As we already noted, one of the most important questions in fiscal policy matters is the clear separation of the transitory from the permanent components of public finances. Economic trends in the 1990s in our countries have shown once again, however, that fluctuations associated with events which are transitory or not sustainable in the medium term have played a leading role in the evolution of the public accounts. In this respect, indicators of discretionality can help to highlight the medium-term problems of public finances, by promoting an informed discussion and strengthening fiscal discipline in economic boom periods.
Mention may be made here, by way of illustration, of the kind of analysis carried out in the Ministry of Finance of France (referred to in Hénin, 1997), in which the criteria used in the definition of fiscal policy are the following:
i) The sustainability of fiscal policy must be ensured, so that the rules adopted must comply with the requirements that the public sector must meet over time. The biased application of the action of the automatic stabilizers, involving excessive optimism in periods of expansion, may endanger the solvency requirement;
ii) Only if sustainability is assured is it possible to permit the action of the automatic stabilizers, defined in the strict sense, i.e., as a symmetrical mechanism;
iii) Only if the leeway for action is clearly identified can it be advisable to go beyond the automatic stabilizers, especially through expenditure of a transitory nature on public investment, whose effect on demand is both strong and rapid.
Although there is no intention here of trying to establish criteria of universal applicability, this way of formulating fiscal policy rules is obviously more flexible and hence more realistic than a mere requirement for balanced budgets. In a world of constant changes and uncertain situations, economic policies must be very active in their task of reducing excessive fluctuations, and fiscal policy obviously has a major role to play in fulfilling this objective. Leaving aside “good” or “bad” policy prescriptions, the challenge is to progress towards greater fiscal governance by developing instruments to guide the budgetary process towards a scheme in which expenditure is adapted to the ongoing availability of resources, by clearly identifying the transitory factors and ensuring that a medium-term view is taken in fiscal policy decisions.
FISCAL POLICY, CYCLES AND GROWTH • RICARDO MARINER

C E P A L R E V I E W 6 4 • A P R I L 1 9 9 6 91
IVConclusions
In economies like ours, periods o f volatility are multiple, o f great magnitude and frequent. If the authorities aim to reduce this volatility, which can lead to losses o f social well-being, economic policy must be extraordinarily active and vigilant on all fronts. Laissez-faire in these matters has led in all the countries o f the region to extreme situations; the State can hand over many o f its powers to the private sector, but it cannot renounce its duty to watch over common goods like stability in a market economy.
A number o f studies have shown the negative correlation that exists between volatility of the econom ic aggregates and long-term growth. In these conditions, stability would lead to gains o f w ellbeing in the medium term, thus giving grounds for the adoption o f an approach which is more highly committed to the need for macroeconomic regulation. In their deeds, although perhaps not in their words, most o f the industrialized countries currently practice Keynesian-type policies, i.e., policies which are more or less o f an anticyclical nature. Policies designed to reduce the volatility o f the real sector of the economy can have important beneficial effects. Macroeconomic regulation thus assumes great importance in development processes.
If the authorities act in accordance with more or less generally-known rules in their interventions in the economy, this helps to put private agents’ expectations on a steady basis. Such rules, which are normative rather than numerical, must preserve the
degree o f discretionality that the authorities need in order to forestall the generation o f harmful fluctuations, however. Since the excessive use of m onetary policy as a short-term regulation instrument can lead to situations o f macroeconomic inefficiency, it is necessary to give much greater weight to fiscal policy, strengthening in particular the role o f the automatic stabilizers in the cycle and increasing the discretional capacity -within set lim its- to fix tax rates for stabilization purposes.
In the interplay between the private agents and the public sector, a cooperative solution calls for a guarantee of stability, in order to lengthen the time horizon o f decisions. A virtuous cycle is formed when forward-looking economic calculations become feasible, when the perceptions o f future demand are stable, and when the agents do not pursue windfall gains caused by abrupt changes but profitable projects in the real sector o f the economy. What is needed is to create, through active policies within the magic square, suitable conditions for a virtuous circle in which enterprises invest because there is demand and consumers consume and save because there is employment. The well-known maxim o f supply-side theories (“today’s profits are the investments o f tomorrow and the jobs o f the day after tomorrow”) curiously enough converges today with an approach calling for macroeconomic policies which are much more active in regulating aggregate demand.
(Original: Spanish)
Bibliography
Alesina, A. and R. Perotti (1995): The political economy of budget deficits, IMF Staff Papers,, vol. 42, No. 1, Washington, D. C., International Monetary Fund (IMF).
(1996): Fiscal discipline and the budget process, TheAmerican Economic Review. Papers and Proceedings, Menasha, WI, American Economic Association, May.
Andrés, J., R. Doménech and C. Molinas (1993): Growth, convergence and macroeconomic performance in OECD countries: A closer look, working paper, Madrid, Ministerio de Economía y Hacienda, Dirección General de Análisis y Programación Presupuestaria.
Barro, R. J. (1979): On the determination of the public debt, Journal o f Political Economy, vol. 87, Chicago, DL, The University of Chicago Press, October.
(1991): Economic growth in a cross section ofcountries, Quarterly Journal o f Economics, vol. 106, No. 2, Cambridge, MA, The MIT Press.
Blanchard, O. (1996): Macroeconomics, Upper Saddle River, NJ, Prentice Hall.
Bohn, H. (1995): The sustainability of budget deficits in a stochastic economy, Journal o f Money, Credit and
FISCAL POLICY, CYCLES AND GROWTH • RICARDO MARTNER
92 C E P A L R E V I E W 6 4 • A P R I L 1 9 9 8
Banking, vol. 27, No. 1, Ohio, Ohio State University Press.
Brainard, W. (1967): Uncertainty and the effectiveness of policy, The American Economic Review. Papers and Proceedings, vol. 57, No. 2, Menasha, WI, American Economic Association.
Corsetti, G. and N. Roubini (1996): European versus American perspectives on balanced-budget rules, The American Economic Review. Papers and Proceedings, Menasha, WI, American Economic Association, May.
Cotier, P. (1997): Economic growth and macroeconomic fluctuations: The case o f Latin America, Mexico City, Instituto Tecnológico Autónomo de México (ITAM), Department of Economics, June, rmmeo.
De la Fuente, A. (1997): Fiscal policy and growth in the OECD, working paper, Madrid, Ministerio de Economía y Hacienda, Dirección General de Análisis y Programación Presupuestaria, November.
Devarajan, S., V. Swaroop and H. Zou (1993): What do governments buy? The composition o f public spending and economic performance, Policy Research Working Papers, No. 1082, Washington, D. C., World Bank.
Easterly, W. and S. Rebelo (1993): Fiscal policy and economic growth. An empirical investigation, Journal o f Monetary Economics, vol. 32, No. 3, Amsterdam, North Holland Publishing Company.
Fontaine, J. A. (1995): Sobre el significado de Lucas para la política económica, Estudios Públicos, Santiago, Chile, Centre for Public Studies (CEP), Spring.
Friedman, M. (1968): The role of monetary policy, The American Economic Review, vol. 58, No. 1, Menasha, WI, American Economic Association.
Giomo, C. and W. Suyker (1997): Les estimations de l’écart de production de l’OCDE, Economie Internationale, No. 69, Paris, Centre d’Etudes Prospectives et d’information Internationales (CEPII).
Hamilton, J. D. and M. A. Flavin (1986): On the limitations of government borrowing: A framework for empirical testing, The American Economic Review, vol. 76, No. 4, Menasha, WI, American Economic Association.
Held, G. and R. Szalachman (1997): Flujos de capital externo en América Latina y el Caribe. Experiencias y políticas en los noventa, “Financiamiento del Desarrollo” series, No. 40, Santiago, Chile, Economic Commission for Latin America and the Caribbean (ECLAC).
Hénin, P. Y. (1997): Le coût en bien-être des fluctuations économiques et l ’efficacité des politiques conjoncturelles, in P. Artus, A. Cartapanis and D. Laussel, Politique économique. Fondements théoriques, chapter 4, Paris, Editions Económica.
Levine, R. and D. Renelt (1992): A sensitivity analysis of cross-country growth regressions, The American Economic Review, vol. 82, No. 4, Menasha, WI, American Economic Association
Lucas, R. E., Jr. (1988): On the mechanics of development planning, Journal o f Monetary Economics, vol. 22, No. 1, Amsterdam, North-Holland Publishing Company.
(1994): Review of Milton Friedman and Anna J.Swartz’s “A monetary history of the United States”, Journal o f Monetary Economics, vol. 36, No. 1, Amsterdam, North-Holland Publishing Company.
Mariner, R. (1997): Políticas fiscales, estabilizadores automáticos e indicadores de discrecionalidad en América Latina, working paper, LC/IP/R.199, Santiago, Chile, Latín American and Caribbean Institute for Economic and Social Planning (ILPES), Public Sector Planning Division.
Mendoza, E., G. Milesi and P. Asea (1995): Do taxes matter for long run growth? Harberger's supemeu- trality conjecture, IMF Working Papers, No. 79, Washington, D. C., IMF.
Moguillansky, G. (1996): The macroeconomic context and investment: Latin America since 1980, CEPAL Review, No. 58, LC/G.1916-P, Santiago, Chile, ECLAC.
Musgrave, R. A. (1997): Reconsidering the fiscal role of government, The American Economic Review. Papers and Proceedings, Menasha, WI, American Economic Association, May.
Ramey, G. and V. Ramey (1995): Cross-country evidence on the link between volatility and growth, The American Economic Review, Menasha, WI, American Economic Association, December.
Romer, D. (1993): The new Keynesian synthesis, Journal o f Economic Perspectives, vol. 7, No. 1, Menasha, WI, American Economic Association.
Sala-i-Martín, X. (1994): Apuntes de crecimiento económico, Barcelona, Antoni Bosch Editor.
Summers, R. and A. Heston (1991): The Penn World Tables (Mark 5): An extended set of international comparisons, 1950-1988, The Quarterly Journal o f Economics, vol. 106, No. 2, Cambridge, MA, The MIT Press,
Tobin, J. (1993): Price flexibility and output stability: An old Keynesian view, Journal o f Economic Perspectives, vol. 7, No. 1, Menasha, WI, American Economic Association.
Weise, C. L. (1996): Severity of economic fluctuations under a balanced budget amendment, Contemporary Economic Policy, No. 14, Long Beach, CA, April.
World Bank (1997): The State in a changing world, Annual Report, 1997, Washington, D. C.
FISCAL POLICY, CYCLES AND GROWTH • RICARDO MARTNER
Francisco Sercovich
Chief, Industrial Development Policy Studies, United Nations Industrial Development Organization (UNIDO).
C E P A L R E V I E W 64 93
Best practices, policyconvergence and
the WTO trade-relatedinvestment measures
International experience shows that cost-free replication
and adoption of industrial best practices on a universal ba
sis is a misconception. Rather, it is a matter of a progressive
and reciprocal adaptation between external and local prac
tices in which learning costs and times are an essential fac
tor. The potential for convergence of policies, practices and
institutions triggered by globalization appears to be greater
at the macroeconomic than at the microeconomic level.
This article first examines such issues in a general way and
then focuses on the dilemmas facing the countries of the
Association of South East Asian Nations (ASEAN) and
other developing countries of Asia in their efforts to comply
with the World Trade Organization’s Trade-Related Invest
ment Measures (TRIMS) by the year 2000. The experience
of these countries is of special relevance to other develop
ing regions, Latin America and the Caribbean in particular,
in view of the difficulties arising in the race against time to
reconcile those commitments with national development ob
jectives.
A P R I L 1 9 9 8
94 C E P A L R E V I E W « 4 • A P R I L 1 9 9 8
Introduction
Globalization has put the issue o f the international convergence o f production practices, policies and institutions on the world’s economic agenda. The spread o f universal best practices, such as those agreed by a large number o f WTO member countries, appears to have becom e inexorable and, at the same time, to be easing the way towards a level playing field in the international economy. The deadlines involved for the adaptation o f national policies to uniform and universal standards impart an added sense of urgency and priority, underscored by the impact they w ill have on econom ic and social development in the developing countries and the econom ies in transition (the former centrally-planned economies).
The force and speed o f the move towards policy convergence is undeniable. Of the 109 developing countries and econom ies in transition that have launched major market-oriented reform programmes, 75 have done so since 1989. At the same time, 104 o f the 131 member countries o f the WTO are developing countries, while another 28, including China, Russia and Taiwan, are actively negotiating their entry (Sercovich and others, forthcoming, chapter 2).
These figures reflect a general trend towards the withdrawal o f the State as a direct economic agent and an evolution instead towards more open economies and more deregulated and competitive markets. This should not lead us, however, to minimize the importance o f international policy convergence or to jump to hasty conclusions about the loss o f degrees o f freedom at the national level (Sercovich and others, forthcoming; D e María y Campos and Sercovich, forthcoming).
□ A preliminary version of this report was submitted to S E L A ’s
First Regional Ministerial Forum on Industrialization (SELA ,
Caracas, Venezuela, 30 July-1 August 1997). The author wishes to express his gratitude to M. De Marfa y Campos, P. de Motta Veiga, R. Lavagna, S. Teite), an anonymous referee and, in particular, J. Katz for their valuable comments and to K.-Y. Nam for his greatly appreciated assistance. Neither UNIDO nor the above-named colleagues necessarily share the views expressed in this article.
According to the World Trade Organization’s TRIMS agreement,1 by the year 2000 the developing countries (and by 2002, the least developed countries) will have to abolish all restrictions on foreign direct investment that affect imports, exports or foreign exchange balances, including local content rales.
Typically, such regulations are part and parcel o f industrial development programmes with horizons that go far beyond the year 2000 (as notably in the case o f some South East Asian countries). We may consequently wonder what the situation will be like once the brief period o f two years separating us from that date has elapsed.
These circumstances are likely to bring about requests for waivers and exemptions from the enforcement o f TRIMS deadlines by a number o f WTO members and, even more so, by countries which are still negotiating their entry. Such requests were already being prepared before the growth crisis that began in Thailand in mid-1997 and then spread to the whole o f South East Asia and beyond, and will probably be further encouraged by it.2 Both groups of WTO members w ill seek to secure authorization to
1 For the text of this Agreement, see the Final Act of the W TO (Marrakesh, 1994), annex 1A.2 The crisis of the second half of 1997 has unleashed two forces acting in opposite directions. On the one hand, the slowing- down of investment plans due to the accumulation of stocks and excess production capacity will cause delays in attaining the objectives of national development plans and, hence, strong pressures to seek to extend the W TO deadlines, while on the other, the crisis is also helping to lower ambitious modernization and technological development goals. All in all, it is unlikely that the net result will favour the equally ambitious objectives pursued by W TO 2000 in terms of convergence. There is a wide variety of situations in this respect. On the one hand, the East Asian countries will be faced for the first time with the problem of unemployment (in the absence of effective social security arrangements). It is estimated that the dramatic fall in growth rates will lead to two million unemployed in Thailand, 1.5 million in South Korea and 200,000 in Malaysia. The latter country has already begun to reverse its policy of generalized progress towards capital- and technology-intensive manufacturing activities and is now welcoming foreign-owned manufacturing operations that make intensive use of labour, in so far as they are aimed at supplying foreign markets (see the official announcement by Malaysian Prime Minister Dr. Mahathir in The Star, 1997). Although energetic measures are being taken all
BEST PRACTICES, POLICY CONVERGENCE AND THE WTO TRADE-RELATED INVESTMENT MEASURES • FRANCISCO SERCOVICH
C E P A L R E V I E W 6 4 * A P R I L 1 9 9 8 95
comply with the policy changes involved only when the activities they are promoting for their future development become sustainably competitive, and not before. Thus, a resurgence o f debates on the legitimacy o f the forms and periods of application of the infant industry argument can be expected (since the validity o f the argument itself would be beyond question).
If the uneven manner in which policy convergence is taking place becomes still more pronounced, particularly from the interregional and intersectoral perspectives, so that the “particular difficulties” allowed for in the w t o agreement are extensively resorted to, the necessary universality in the application o f the TRIMS, together with the desired levelling of the playing field, may be jeopardized.3
This raises the more general question o f whether universal, peremptory compliance with a uniform set o f rules is the best route to a level playing field. More precisely, it questions the possibility o f defining universal international best practice rules that can be
applied by all countries, regardless of their stage of development and national conditions, in a uniform manner, without net costs and within the space o f a few years. The ultimate question is: can a balance be struck between the rewards for those who comply punctually and meticulously with the agreed rules and the penalties for those who do not?
The following sections do not purport to completely clarify these questions, but merely to deal with som e dimensions o f the problem from an interregional and sectoral perspective, with the aim o f providing some elements for a more exhaustive study.
In the following section, the general question o f convergence is addressed, after which w e review the question o f the “replicability” o f best production practices and policies in the light o f disparities in initial conditions and strategic challenges, finally going on to assess the various uncertainties and disparities raised by the countdown to the year 2000 in the specific field of TRIMS, from an interregional and sectoral perspective.
I IVerification of hypotheses on convergence of levels of productivity and income
The formulation o f hypotheses and predictions on the inter-country convergence o f levels o f productivity and income is based on the theory of economic growth, whose basic conceptual foundations were laid by the classical economists and their direct successors.4 Among these foundations are the role o f decreasing returns in the accumulation of physical and human capital, the relation between per capita
income and population growth, the effects o f technological progress on the specialization o f labour, and the influence o f monopoly power on technological progress.
The neoclassical growth models predict a conditional form o f convergence whereby, the lower the initial level o f the real per capita GDP o f a country compared with its steady-state level, the higher its
over the subregion to impose fiscal austerity and contain aggregate demand, in the case of Malaysia this is being done in preparation for an agreement with the International Monetary Fund (IMF), including the recent submission to the WTO of a programme for the liberalization of the financial sector, Thailand, for its part, is postponing its programme of tariff reductions in the chemical sector, while Indonesia’s latest agreement with the IMF eliminates the tax exemptions for the Timor project. In the Southern Cone of South America, Chile has announced a reduction in the average tariff level from 11% to 8% as from 1998, at the same time that MERCOSUR has decided to raise the group’s common external tariff by 3% for three years, from 12% to 15% . Although The Economist (1 997 , “The Americas” section) has taken an unusually tolerant and understanding attitude to this increase, the European Union has already expressed its
concern in this respect (see the statements by A. M, Cam- pogrande, Principal Foreign Relations Administrator of the European Union, in Estrategia, 5 December 1997),
3 “On request, the Council for Trade in Goods, may extend the transition period for the elimination of the TRIMs ... for a ... Member., .which demonstrates particular difficulties in implementing the provisions of this Agreement. In considering such request, the Council ... shall take into account the individual development, financial and trade needs of the Member in question” (Para. 3, Art. 5 on Notification and Transitional Arrangements of the TRIMs Agreement).
4 These include, in addition to Adam Smith, David Ricardo and Thomas Malthus, economists of the present century such as Frank Knight and Joseph Schumpeter.
BEST PRACTICES, POLICY CONVERGENCE AND THE WTO TRADE-RELATED INVESTMENT MEASURES • FRANCISCO SERCOVICH

96 C E P A L R E V I E W 6 4 • A P R I L 1 9 9 6
growth rate w ill be because o f a higher relative return on investm ent, provided w e leave out o f the reckoning all differences between countries as regards rates o f saving, initial levels o f human capital, population growth, governm ent policies and technological change.
The neoclassical theory o f growth lost its significance as a field o f research as from the early 1970s because it was not empirically relevant. Since then, macroeconomic research has concentrated on shortterm fluctuations. The growth theory was revived towards the m id-1980s, however, when a period of great intellectual activity in this field began.5
What are the conclusions reached by the available empirical studies on the hypothesis o f the convergence o f levels o f productivity and income? Comparison o f the evolution o f real per capita GDP in 129 countries during the period from 1960 to 1990 indicates that the degree o f dispersal has increased: the per capita g d p o f the most advanced country in the sample (the United States) increased from 39 times that o f the most backward country (Ethiopia) in 1960 to 65 times its level in 1990. At the historical growth rate o f Japan between 1890 and 1990
5 The emergence of this new growth theory marks an epoch- making break with the tradition (and irrelevance) of the neoclassical assumptions. Instead of perfect markets it posits that markets are imperfect, the idea of an abundance of public goods takes the place of the possibility of complete private appropriation, increasing returns replace the idea of decreasing returns, and endogenous technological change replaces exogenous technological change. In these conditions, and particularly in the presence of monopolistic appropriation of the fruits of investment in scientific and technological research, the growth rate does not necessarily have to fall in the presence of high levels of capital accumulation per employed person, while the influence of government policies on the growth rate through their impact on the degree of openness of the economy, the rate of saving, the educational level, the spread of technology, etc., does assume importance. Thus, although the new growth theory still fails to provide answers in many cases, it is reconciled with reality and once again feeds empirical research and receives feedback from it. In particular, it makes it possible to reconsider the predictions regarding conditional convergence. In an “agnostic” interpretation of the contribution of the new growth theories, Nelson (1997) notes that much of the formal modelling of these theories is carried out at the expense of their actual pertinence and consists of the belated adoption of existing empirical observations. Thus, for example, it assumes perfect predictability (or a correctly specified distribution of the probability of occurrence of future events), it ignores differences between the models of business management and institutional organization, and it leaves out the question of technological learning. An important methodological reason for this is that the respective models try not to depart too much from the basic ideas of general equilibrium theory.
(2.75%), Ethiopia could com e close to the 1990 level of the United States by 2149, but at the more modest historical growth rate o f the latter country (1.75%) it would only do so by the year 2236 (Barro and Sala-i- Martin, 1995, p. 3).
The average annual real per capita GDP growth rate between 1960 and 1990 for a sample o f 114 countries was 1.8%, with South Korea (6.7%) at one extreme and Iraq (-2.1%) at the other. A further 16 countries in the sample, mostly from Africa south of the Sahara, also registered negative growth rates. In other words, a representative country o f that region would take 30 years to grow by a factor o f 1.3, while South Korea would grow by a factor of 7.4 in the same period (Barro and Sala-i-Martin, 1995, pp. 3-4).
In short, the hypothesis that the more backward the initial position o f a country in terms o f real per capita GDP, the higher w ill be its growth rate, has not been confirmed, except in the conditional sense defined above. Even in such a hypothetical scenario of a world which is totally homogeneous except in levels o f growth, however, the rate o f convergence would be so slow that the elimination o f the gap between the current real per capita GDP and its longterm level would take at least 70 years.
In the particular case o f Latin America, the available estimates indicate that the gap between total factor productivity in that region, on the one hand, and in the advanced recently-industrialized economies of East Asia, on the other, has widened markedly since the end o f the Second World War, especially since the mid-1960s (Ramos, 1997). Nor is there any confirmation of convergence between the levels of labour productivity in the manufacturing sectors of Latin America and the United States over the period from 1970 to 1994, except in the 1973-1982 period (Benavente, Crespi, Katz and Stumpo, 1996).
If we look into the dimensions of such divergence beyond the hypotheses o f growth theory, a distinction may be seen between economic convergence (i.e., convergence o f productivity levels and standards of living) and institutional convergence. The latter refers to the multiple forms o f relations between the market, public policy and public and private associations and organizations, which vary widely in the factor and product markets. In this sense, the convergence would appear to take the form o f a growing affinity of forms o f institutions and responses to political, social and econom ic imbalances o f an external or domestic nature.
BEST PRACTICES, POLICY CONVERGENCE AND THE WTO TRADE-RELATED INVESTMENT MEASURES • FRANCISCO SERCOVICH

C E P A L R E V I E W 6 4 • A P R I L 1 9 9 6 97
The viability o f types o f economic performance which are comparable over the long term may be compatible with very different institutional configurations (see the distinction between macro and micro convergence later in this article), so that the purview o f heterogeneity in institutional matters is considerably broader than it is in the strict sense o f the stylized variables o f growth theory.
If, as w e have seen, the hypothesis o f econom ic convergence is difficult to confirm, then it is much harder to confirm that o f institutional convergence,
which is seriously weakened by the persistence of specific national conditions (Boyer, 1996).
In the final analysis, the debate on convergence boils down to the rivalry between different civilizations and their influence on the configuration o f the world order in terms o f the acceptable degree o f diversity. The relation between universality and specificity has been the subject o f a very long-standing controversy which has now been renewed by the changes that have taken place since the end o f the Cold War (see Huntington, 1997, especially chapter 12).6
I l l“Replicability” of best practices in the light of disparities In initial conditions and strategic challenges
In contrast with the hypothetical convergence towards best international production and policy practices, the developing world has faced a growing differentiation in recent decades. This has had two main effects: on the one hand, a gradation between economic and social winners and losers and, on the other, sharply differing policy dilemmas and challenges that considerably reduce the scope for transferring and reproducing successful experiences. The diversity o f initial conditions displayed by the developing countries and the economies in transition mean that the challenges faced have a high degree o f specificity.
In order to give some idea o f the nature o f the problem, box 1 shows the diversity o f strategic challenges faced by four categories o f countries: i) newly open econom ies (NOEs: i.e., countries which have m oved from inward-looking to substantially open econom ies integrated into the world market); ii) successful industrializing countries (sics: i.e., those of East and South East Asia); iii) economies in transition (which comprise the former centrally planned economies); and iv) least developed countries (LDCs: comprising several dozen o f the world’s poorest econom ies). Apart from sharp intra-group contrasts of a historical, geographical, econom ic, social and institutional nature (for example, the Central European econom ies in transition which are joining the European Union are making faster progress towards
convergence than their Central Asian counterparts), the differences in policy challenges between these four groups o f countries have acquired historical proportions, associated with stages o f development almost as distinct as those that exist between them, on the one hand, and the advanced industrial countries (a ic s ) on the other.7
6 Huntington (1997, pp. 309-311) holds that those who do not acknowledge the fundamental divisions (between civilizations) are doomed to be frustrated by them. He goes on to explain that the diversities of cultures and civilizations challenge the Western -and above all United States- belief in the universal validity of Western culture. At the descriptive level, this belief holds that the peoples of all societies wish to adopt Western values, institutions and practices, while at the normative level it holds that all the peoples of the world wish to embrace Western values, institutions and culture because they enshrine the loftiest, most enlightened, most liberal, rational, modem and civilized thinking of mankind. This belief suffers from three problems, asserts Huntington: it is incorrect, immoral and dangerous, so that the most prudent course for the West is not (like Brutus) to try to freeze power shifts but to learn to swim with the current, combat misery, refrain from adventures, and protect its own culture. The ideas of individual liberties, political democracy, the rule of law, human rights and cultural freedom were bom in the West, and Western civilization is valuable not because it is universal but because it is unique. Lian and Oneal (1997) have not found any systematic association whatever between the different cultures (ethnic, religious or linguistic) and economic performance.7 For more details, see Sercovich and others (forthcoming), chapter 2.
BEST PRACTICES, POLICY CONVERGENCE AND THE WTO TRADE-RELATED INVESTMENT MEASURES • FRANCISCO SERCOVICH
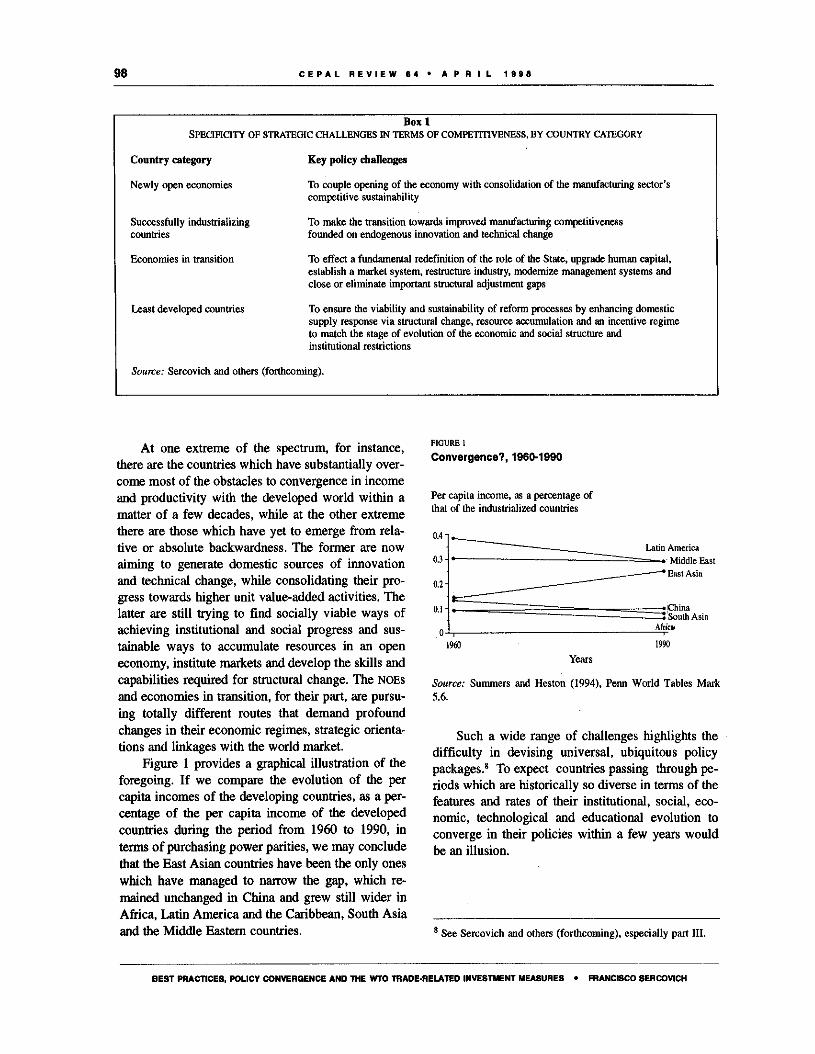
98 C E P A L R E V I E W 6 4 • A P R I L 1 6 9 6
Box 1Sp e c if ic it y o f st r a t eg ic c h a l l e n g e s in t e r m s o f c o m p e t it iv e n e s s , b y c o u n t r y c a teg o r y
Country category Key policy challenges
Newly open economies To couple opening of the economy with consolidation of the manufacturing sector’s competitive sustainability
Successfully industrializing countries
To make die transition towards improved manufacturing competitiveness founded on endogenous innovation and technical change
Economies in transition To effect a fundamental redefinition of the role of the State, upgrade human capital, establish a market system, restructure industry, modernize management systems and close or eliminate important structural adjustment gaps
Least developed countries To ensure the viability and sustainability of reform processes by enhancing domestic supply response via structural change, resource accumulation and an incentive regime to match the stage of evolution of the economic and social structure and institutional restrictions
Source: Sercovich and others (forthcoming).
At one extreme o f the spectrum, for instance, there are the countries which have substantially overcome m ost o f the obstacles to convergence in income and productivity with the developed world within a matter o f a few decades, while at the other extreme there are those which have yet to emerge from relative or absolute backwardness. The former are now aiming to generate domestic sources o f innovation and technical change, while consolidating their progress towards higher unit value-added activities. The latter are still trying to find socially viable ways of achieving institutional and social progress and sustainable ways to accumulate resources in an open economy, institute markets and develop the skills and capabilities required for structural change. The NOEs and econom ies in transition, for their part, are pursuing totally different routes that demand profound changes in their econom ic regimes, strategic orientations and linkages with the world market.
Figure 1 provides a graphical illustration o f the foregoing. If w e compare the evolution o f the per capita incomes o f the developing countries, as a percentage o f the per capita incom e o f the developed countries during the period from 1960 to 1990, in terms o f purchasing power parities, w e may conclude that the East Asian countries have been the only ones which have managed to narrow the gap, which remained unchanged in China and grew still wider in Africa, Latin America and the Caribbean, South Asia and the M iddle Eastern countries.
FIGURE 1Convergence?, 1960-1990
Per capita income, as a percentage of that of the industrialized countries
Years
Source: Summers and Heston (1994), Penn World Tables Mark 5.6.
Such a wide range o f challenges highlights the difficulty in devising universal, ubiquitous policy packages.8 To expect countries passing through periods which are historically so diverse in terms of the features and rates o f their institutional, social, economic, technological and educational evolution to converge in their policies within a few years would be an illusion.
8 See Sercovich and others (forthcoming), especially part III.
BEST PRACTICES, POLICY CONVERGENCE AND THE WTO TRADE-RELATED INVESTMENT MEASURES • FRANCISCO SERCOVICH

C E P A L R E V I E W 6 4 • A P R I L 1 9 9 8 99
Box 2
LE A N PROD U CTIO N, SKILL D EV ELO PM EN T AND CORPORATE GOVERNANCE:
TH E LIM ITS TO CRO SS-BO RD ER REPLICABILITY O F "BEST PRACTICES"
A M O N G M EM BERS O F TH E "CO N V ERG EN CE CLUB”
“Best practice” and country of origin
Key attributes in the country of origin
Restrictions on its replicability
l , Lean production a (Japan)
- Decentralization of responsibility, elimination of “dead time” and induction of constant work effort among the labour force
- Team work, polyvalent skills- Motivation through “stress” and
“reciprocal obligation"
In Germany: Skills are occupational, standardized and portable rather than being general and focussed on firm-specific organizational and labour environments, as they are in Japan. The portability of skills facilitates labour mobility among independent enterprises; non-portability favours labour markets internal to the firm or conglomerate. In Germany, priority is given to workers' commitment to their own performance and labour ethos rather than to their loyalty and devotion to their employer. Performance prevails over seniority and team work rests on individual skills rather than on team capabilities as such
2. Technical training (Germany)
- Efficient mechanisms for collective bargaining between employers and employees; low pressure for unit labour cost increases; aversion of trade unions to inflation and protectionism
- Training is an explicit component of collective bargaining
- Trade unions respond to technical change by demanding upgrading of skills and an increase in the proportion of skilled workers in the labour force
In France: The tradition of employer control and the propensity for conflictive labour relations have blocked the assimilation of the German model of a tripartite govemment/enterprise/trade union dialogue which is vital for reaching consensus on effective and sustainable technical training programmes
3. Corporate governance (United States and Japan)
- Minimization of transaction costs (Japan), versus
- Minimization of agency costs (United States)
In the United States and Japan: Each of these countries has advanced in a particular dimension of the dichotomy between transaction costs and agency costs, so that they have corporate governance systems which are not mutually replicable.Similar contrasts between the United Kingdom and Germany have blocked progress towards common European legislation in this field
Source: Based on Berger and Dore (eds.), 1996. a Applies to manual work in assembly operations.
If the assumption that there can be similar paths, analogous policies and similar strategic guidelines for carrying out such diverse processes o f change is open to doubt, these doubts become still greater when we see that, even among die countries which are members of the “convergence club” (i.e., the most highly developed countries), replication o f best practices is hindered by the substantive disparities that exist among them. Box 2 gives some examples o f this.
It is generally acknowledged that the principles of lean production, which originated in Japan, have produced a quantum leap as compared with traditional Fordism, so that they can be considered as exem plifying an international best practice worth emulating. Indeed, this has been the direction followed by enterprises around the world, particularly in the developed countries, including Germany. As shown in box 2 with respect to the case o f Ger
BEST PRACTICES, POLICY CONVERGENCE AND THE WTO TRADE-RELATED INVESTMENT MEASURES • FRANCISCO SERCOVICH

100 C E P A L R E V I E W 6 4 • A P R I L 1 9 6 8
many, however, different institutions, practices and forms o f social conduct have significantly narrowed the scope for the general application o f the principles o f lean production outside Japan.
France and the United Kingdom are known to have encountered difficulties in trying to emulate the efficient German practices in the field o f training and skill formation. Indeed, France has failed not only in its attempts to replicate German practices in education and training but also in research and developm ent, labour relations and industrial restructuring. Latin America and the Caribbean has also experienced serious problems in trying to follow the exam ple o f the German dual technical training system ow ing, among other things, to poor standards o f basic education. The lack o f a tradition o f public-private cooperation in this field has also been an important factor.
Let us now look at what may be considered best practice among the advanced countries in the field of corporate governance. Management practices based on large industrial conglomerates in countries such as Germany, Italy, Japan, South Korea and Switzerland -typified by the Japanese kereitsu and the South Korean chaebol- are more efficient in terms o f lower transaction costs due to the use o f implicit contracts and permanent, stable and foreseeable relationships among enterprises. On the other hand, the Anglo- American system facilitates lower agency costs associated with the separation between ownership and control. What represents an advantage in one system translates into a disadvantage in the other and vice versa. An analogous contrast exists within the European Union (with Germany and the United Kingdom at the antipodes, and France and Italy somewhere in between), which has led to a paralysis in the timetable for advancing towards a common business legislation. This suggests that there may be not just a single best practice but a multiplicity o f best practices in any given field, associated with country-specific historical, institutional and social organization legacies.
If the workability o f convergence beyond the limits of national autonomy is still in doubt in the monetary and fiscal spheres (as illustrated by the problems o f launching the European common cur
rency), the impact o f globalization on the domestic microeconomic scenarios raises even stronger doubts, in view o f the considerable differences in national institutions, policies and practices.9 Divergences in the microeconomic domain are greater and more resistant than those at the macroeconomic level, since they involve more deeply-rooted national institutions, practices and traditions. This challenges the hypothesis that globalization reduces national states to a condition o f irrelevance, passivity and impotence.
Evidence that m icroeconomic policies and institutions can be successfully replicated across borders is not very convincing; indeed, the number of cases o f failure may well exceed those o f success. Best practices espoused in the management literature mostly refer to issues o f operational efficiency. Yet, the essence o f entrepreneurial strategies and related public policy guidelines concerns choices among alternatives specific to the economic and social milieu. The possibility o f replication o f techniques geared to improve operational efficiency, such as total quality control or “time-based” competition, must pass the acid test of the adaptation o f such techniques to a specific entrepreneurial environment (Porter, 1997).
Technological learning, production o f public goods, the formation o f skills and capabilities and the promotion o f the use of increasing returns to scale are spheres o f national policy that even the governments o f the most advanced countries are reluctant to leave in the hands o f the market, whether visible or invisible.
Rather than universally superior practices, there are usually ranges o f best practices which are normally hybridised during the process o f adoption and adaptation to specific national conditions.
9 Thus, for example, it is still to be shown whether it is possible to link German orthodoxy at the macroeconomic level with Anglo-American laissez-faire at the microeconomic level. With regard to the developing countries and the economies in transition, Rodrik (1996) has noted that the consensus on what constitutes suitable structural reforms is based on theoretical and empirical foundations which are much more fragile than those of the consensus on the need for macroeconomic stability.
BEST PRACTICES, POLICY CONVERGENCE AND THE WTO TRADE-RELATED INVESTMENT MEASURES • FRANCISCO SERCOVICH

C E P A L R E V I E W 6 4 • A P R I L 1 9 9 8 101
IVWTO 2000: a comparative subregional and sectoral perspective
1. T h e c h a lle n g e
The diverse rates and approaches countries are taking in the countdown towards 1 January 2000, when the period o f transition to comply with TRIMS expires, offer insights into disparities in microeconomic policy. There seems to be no consensus as to what the precise meaning o f such a transitional period is, but there appear to be two main approaches.
Some countries are using the transition period as a time o f progressive convergence towards the situation which is scheduled to prevail as from 1 January 2000, in order to arrive at that date with their houses in order. Other countries, however, see it as a race against time: something like a last chance to employ policy instruments and practices which, as o f 2000 (or 2002 for the least developed countries), will be prohibited because they w ill be considered as bad practices and duly punished. What these countries are trying to do is to place themselves in the best possible position in terms o f technological learning and manufacturing competitiveness, while seeking to postpone the deadlines for compliance by resorting to exception mechanisms.10
The recent escalation o f the number o f disputes before the w to appears to be related to some extent with this diversity o f approaches. Between January 1995 and September 1996, 54 disputes concerning 34 regulations were brought before the WTO, compared with 196 disputes during the 47 years o f g a t t ’s existence, This increase is symptomatic o f a high rate of activity connected with accommodation to the new international econom ic order, as well as a heightened awareness o f the need for reciprocal monitoring. Table 1 gives an idea o f the geographical distribution of the cases brought before the w to by developed countries regarding developing countries’ practices during the period in question.
10 This distinction is not so clear when the measures are part ofpolicy packages agreed upon in the context of economic integration treaties.
TABLE 1
Cases brought before the WTO by developed countries between 1 January 1995 and 18 October 1996
Number of cases Percentage
Asian developing countries 11 65Other developing countries 6 35Total 17 100
Source: Asian Development Bank (1997).
According to the Asian Development Bank, o f 25 disputes submitted to the w to dispute settlement machinery involving Asian developing countries (either as plaintiffs or as respondents), six relate to the automobile industry, while the remaining 19 are spread throughout ten other sectors. As one o f the sectors most exposed to such trade disputes, this industry probably best illustrates the diversity o f rates and styles o f accommodation to the new international economic order.
This brief sketch o f the situation cannot leave out China, whose influence permeates the whole o f the Asia-Pacific region and beyond. China is unlikely to agree to comply, except at best partially, with the w to disciplines before 2010 at the earliest, even though it is the world’s fifth largest trading power and the recipient of 35% to 40% of total foreign direct investment flows going to developing countries and economies in transition (the ambiguous position o f Hong Kong, which is a WTO member but is now part o f China, cannot be expected to simplify or shorten these times). This of itself raises vital questions as to how level the playing field w ill be as o f 1 January 2000.
2. A S E A N p o lic ie s fo r th e a u to m o b ile In d u s try
The world automobile industry is expected to reach a capacity to produce more than 210,000 vehicles per day by the year 2000 (compared with 178,000 today), and more than 40% o f world excess capacity will be located in Asia (Deloitte & Touche Consulting Group, 1997).
BEST PRACTICES, POLICY CONVERGENCE AND THE WTO TRADE-RELATED INVESTMENT MEASURES • FRANCISCO SERCOVICH

102 C E P A L R E V I E W 6 4 • A P R I L 1 9 9 B
As may be seen from table 2, within ASEAN Thailand is the main assembler, accounting for some 40% of current supply, followed in descending order by Indonesia, Malaysia, the Philippines and Vietnam.
Thailand is taking advantage o f its privileged position vis-h-vis its ASEAN partners in terms o f its domestic market size, good infrastructure, accumulated experience and development o f the auto parts industry. It plans to become the Detroit o f a s e a n and is therefore pursuing a much more open policy than its subregional partners.11
Almost all o f the large world automobile enterprises (and a good many o f their respective suppliers, particularly those o f Japanese origin) have set up shop in Thailand already or are about to do so. The case o f General Motors (gm) merits special mention, as it has negotiated a US$ 750 million investment in Rayong to produce 100,000 units annually as o f 1999, 70% o f which w ill be destined for export markets starting from the second year o f operation. GM expects that some 30 o f its component suppliers, particularly the European suppliers o f Opel in Germany, w ill follow it to Thailand or other neighbouring countries, since intra-ASEAN trade w ill be almost fully liberalized as o f 2003.12
GM has benefitted from incentives for investment in rural areas, duty-free machinery and equipment imports for two years and tax exemptions on export incom e for eight years, followed by a 50% tax reduction during the following five years. It w ill also enjoy an incom e tax reduction for ten years amounting to as much as 25% of its investments in infrastructure and 200% of its expenses for transportation, electricity and water. Import duties on some raw materials will also be reduced. Furthermore, the Thai Government has agreed to finance a US$ 15 million investment to set up an education and training centre. The most salient and unusual feature o f the deal negotiated between the Thai Government and GM, however, is the cancellation o f the local content rules for autom obiles. Besides having traditionally been more open to foreign direct investment than its neighbours,
11 It is estimated that Thailand has some 600 auto parts firms, 200 of which would be internationally competitive. Many of them are Japanese enterprises which relocated to avoid the high wage costs of Japan and the appreciation of the yen.12 Almost two-thirds of the units produced by Toyota in A SEAN
countries have a local content of at least 40%. This figure will include products to be traded under the common preferential regime (A IC O ) which is to come into force in 2003 (JEI Report, 1997).
TABLE 2
ASEAN: Distribution of automobile supply in 1995 and projection for the year 2000
Country 1995 2000 (projection)
Thailand 571 000 850 000Indonesia 380 000 600 000Malaysia 296 000 320 000Philippines 129 000 275 000Vietnam 15 000 60 000Total 1391000 2 105 000
Source; UNIDO.
starting in 1998 (provided there are no unexpected delays) Thailand w ill be the only ASEAN country preparing to fulfill its TRIMS commitments under WTO 2000 in terms o f both dates and content.13
By contrast, both Indonesia and Malaysia are pursuing their respective national car projects (dubbed ‘Timor” and “Saga”, respectively). These include highly selective promotional regimes that comprise fiscal and tariff exemptions as well as subsidized financing,14 thus keeping prices considerably below those o f the competition. Key features o f these regimes are rules providing for gradually higher local content.
Malaysia, the relatively more advanced o f the two, has been proceeding with an unusual blend of strong State support and entrepreneurial drive, particularly in terms of technology mastery.15 In 1996, Proton acquired an 80% share o f Lotus, U.K., in order to have access to design technology and thus reduce its dependence on Mitsubishi, which has an 8% stake in Proton. Several Lotus engineers are now working for Proton’s R&D division on the development o f an integrated engine and gearbox system. Proton, which is now negotiating the purchase of Royal Begemann, a Belgian gearbox producer, for US$ 126 million, is one o f the key elements in Prime Minister Mahathir’s plan to turn Malaysia into an industrialized country by the year 2020. It exports
13 GM took good advantage of intra-ASEAN rivalry, in this case between Philippines and Thailand, to attract investments. President Ramos had negotiated personally with GM’s head the most enticing incentive package ever offered by the Philippines, including a free site for five years, compensation for investments in infrastructure, a training school worth US$ 20 million and other typical sweeteners. The Philippine offer was useful to GM in its negotiations to induce the Thai Government to lift local content rules 18 months ahead of schedule.14 See footnote 2 above.15 For a detailed analysis of another similar interesting case, seeSercovich, 1980.
BEST PRACTICES, POLICY CONVERGENCE AND THE WTO TRADE-RELATED INVESTMENT MEASURES • FRANCISCO SERCOVICH
C E P A L R E V I E W 8 4 • A P R I L 1 9 9 8 103
18-20% o f its annual production to some 30 countries, including Australia, Chile, England, France, Indonesia and Singapore, with margins close to zero.
M alaysia’s budget for 1997 includes incentives to lim it imports o f intermediate goods, parts and components, through the gradual elimination or reduction o f tariff and sales-tax exemptions. Faced by the forthcoming constraints associated with its WTO commitments, the Malaysian Government is pursuing accelerated measures to deepen the industrial structure and foster greater use o f domestic inputs, particularly intermediate and capital goods, through the development o f industrial clusters, with activities ranging from final products to manufacturing and service support activities, in order to strengthen intrasectoral linkages, increase domestic value-added and reduce dependence on imports. Imports represent some 85% of the value o f manufacturing exports, and capital goods imports still account for nearly half of the value o f investment. A ll capital goods imports must be accompanied by export offset programmes, including the transfer of technology (The Jakarta Post, 1996a ).16
The Indonesian Government has reiterated its strong commitment to the development o f an independent automobile industry, favouring local ownership, development and use o f domestic technology and enforcement o f local content rules. So far only the “Timor” project, carried out by a local enterprise in association with the South Korean firm KIA, has qualified for special treatment. The Timor car is a four-door, 1600cc sedan whose domestic production is scheduled for 1998 after an initial year in which all completely built-up units (cb u ) will be imported tariff-free for local sale. The cars will be exempt from domestic sales and luxury product taxes, so that they can be sold at around half the price of the competi-
16 Government policy was clearly stated by Prime Minister Mahathir at the launching of the Seventh Plan, which runs until 2000: “Some people believe that the way to minimize the balance of payments deficit is to reduce the rate of growth of the economy. The simple answer is that it is necessary to reduce imports and increase exports. The local content of exports is still low and must be raised ... The worst thing to do is to slow down growth by increasing interest rates ... Domestic industry ought to produce everything that goes into the fabrication of the components of the final product. This way, increases in exports will not result in similar increases in imports. There will still be imports, but these will consist of low-value raw materials for the most part ... The Government will actively support R&D to increase the local content and enable domestic enterprises to manufacture goods bearing their own brands”.
tion. The project also enjoys subsidized financing and benefits from government procurement guidelines (Business Times Malaysia, 1996a, p. 2, and 1996b, p. 1).
The European Union, the United States and Japan have accused Indonesia o f violating the nondiscrimination and most-favoured-nation principles, as well as the t r im s agreement, whereby its existing policy in the automobile sector should have been notified in 1995 and no new non-complying regulations should have been introduced since 1 January 1995. Since agreement among the parties was not reached in bilateral negotiations, the WTO has instituted a panel to settle the controversy along the procedural guidelines currently in force.17 It is considered that by the time the panel reaches a decision, Indonesia is likely to be beyond the point o f no return in the execution o f the project (although this has now becom e more doubtful because o f the exchange and financial crisis that broke out in July 1997). A sharp disparity between generic and selective policies is apparent in ASEAN in general and Indonesia in particular. W hile being criticized by the largest trading powers for its policy in the automobile sector, Indonesia is also being commended by the World Bank as South East Asia’s most liberalized economy since the deregulation package adopted in June 1996.18 Yet, this deregulation has not affected such non-tariff barriers as those relating to local content, investment licenses, government procurement and export restrictions on certain products. The current average rate o f effective protection for 269 categories o f manufactured goods is estimated at 52%. This level is due to go down over the next years as a result o f scheduled reductions in nominal tariffs to between 0% and 5% in 1998 for one category o f products and 20% in 2000 for another category (Business Taiwan, 1996).
For comparative purposes, table 3 gives information on local content regulations in the a s e a n countries and some other countries. It also shows the respective rules to be complied with by the enterprises and the effective local content levels achieved or programmed.
17 The stages in the dispute settlement process are: consultations (60 days), establishment of the independent panel, issue of its report and decision (between 6V4 months and one year), approval of the panel's report (60 days), compliance with the decision or lodging of an appeal (three months), and final fulfillment (within a reasonable time agreed between the parties). More details of the complaints entered may be found on the WTO’s page on the Internet (http://www.wto.org).18 Statement by Dennis de Tray, Director of the World Bank’s Jakarta Office, in The Jakarta Post, 1996b.
BEST PRACTICES, POLICY CONVERGENCE AND THE WTO TRADE-RELATED INVESTMENT MEASURES • FRANCISCO SERCOVICH

104 C E P A L R E V I E W S4 • A P R I L 1 9 9 8
TABLE 3ASEAN and other Aslan countries:Local content rules and cases in the automobile Industrya
Country Automobiles Commercial vehicles Per capita MVA in 1993 (US$) b
Indonesia (up to) 65% (up to) 30%c40% (Bakrie pickup in 3 years) 60%
167
Philippines 40% 45% 198
Malaysia (u p to) 60% d46%: Kijang Astra (60% in 1998) 75% (Saga Proton)58% (Honda City)
45%70% (1LOKOM pickups and light trucks in 3 years)17% (Prado Toyota Land Cruiser)51% (Hicom/DRB/Isuzu trucks in 3 years)
724(1991)
Thailand 54% e60% (Honda City)
72%80% (Ford/Mazda pickup)
607
70% (Toyota Soluna) 65% (GM Opel, 1999)
Vietnam 30% in 10 years f 39Taiwan 50% 8 3 202India 80% (Fiat)
70% (Peugeot 309) 90% (Maruti 800)
59
China 80% h90% (Santana LX, 2.7%, 1985) 80% (Santana 2000, 60%, 1995) 90% (Jetta)65% (Audi)85% (Citroën 1988)
190
Russia 65% (KIA in 5 years) 65% (KIA in 5 years) 628Hungary 10% (GM engines) 716Botswana 20% (Hyundai from 1998) 101Argentina The regime has been essentially liberalized 1 1 498Brazil 85% actual average, liberalization continues 596(1991)Mexico 36% (since 1985) 464Turkey 50% (K IA pickup) 630Italy 75% (Mitsubishi Pajero, 1999) 3 503United States 75% (Toyota Camry) 4 298United Kingdom 90% (Nissan Primera) 2 954
S o u r c e : UNIDO.
a In all A SEAN countries except Thailand, a progressive increase in local content is scheduled over the next few years. Thailand has decided to abolish local content rules in 1998.
b M VA = Manufacturing value added.c Depending on installed capacity.d 30% for automobiles of over 2851 cc, 45% for those between 1851 and 2850 cc and 60% for those up to 1850 cc. The government of
Malaysia has warned that it will exclude from the calculation of local content those parts and components with a high content of imported subcomponents.
e In this case the local content is not measured according to the value of the parts but with a weighting system which assigns “points” to each part of the vehicle so that they add up to 100.
f The actual local content is less than 10%.8 To b e eliminated when Taiwan joins the W TO. However, tariffs as well as non-tariff restrictions in the automobile sector will continue for
8 more years (see text). Currently, only automobiles from the USA and Europe can be imported. The tariff is 30% for automobiles and 42% for trucks.
h Since 1995 the automobile companies with installed capacity in China must ensure 40% local content immediately, 60% within the second year and 80% within the third year.
1 The share of domestic value added in the value of industrial production fell from 51% in 1984/1985 to 35% in 1994/1995 (see text).
BEST PRACTICES, POLICY CONVERQENCE AND THE WTO TRADE-RELATED INVESTMENT MEASURES • FRANCISCO SERCOVICH

C E P A L R E V I E W 6 4 • A P R I L 1 9 6 8 105
FIGURE 2
Automobile Industry: Local content (LC) versus manufacturing value added (MVA) per capita In 1993(Percentages and values in US dollars)
100 n
8 0 -
60“
40“
20 -
O Brazil8 China
O IndiabIndonesia Di .^ 0 Russia
• Malaysia1• Thailand® Turkey
^ Philippines• Mexico
1 Vietnam
O Botswana
O .Hungary
1 000
O Italy
O United Kingdom
• Taiwan
Argentina*1
• United States
2 000 3 000 4000 3 000
• ; Government regulation O : Actual LC
Source: UNIDO.
8 1991. b 1990. c 1992
In short, the situation is as follows:i) In all the ASEAN countries, except Thailand,
there are policies aimed at a progressive increase in local content during the coming years (this is also the case in China and India).19
ii) Local content rules have little relation to the levels o f per capita manufacturing value added (m va) (see figure 2). This means that such rules are not a reflection o f existing industrial capabilities - in respect of which they may be unnecessary, as is the case in many industrial countries- but rather of intended ones.20
19 Local content policies in the A SE A N countries are not restricted to the automobile industry. Thus, for example, Samsung has bowed to the Malaysian Government’s directives to raise the local content to 85% in the local production of consumer electronics goods.20 In the advanced industrial countries, local content rules are superfluous, except in the sense of the application of rules of origin in transactions with trading partners.
3. L o c a l c o n te n t ru le s a n d In d u stria l s tra te g yIn A S E A N : C o n tra s ts w ith M E R C O S U R
Local content rules are normally an integral part of broader policies o f “indigenization”, import substitution, export expansion, assimilation and local development o f technology, capability development and industrial deepening.21 Hence, such regulations are usually accompanied by a comprehensive set o f complementary tariff and fiscal incentives, as well as special training, R&D, industrial location and other programmes. They are also used as bargaining points in foreign direct investment and trade negotiations.
Following the path first pursued by Japan and then by South Korea, the ASEAN countries apply policies aimed at promoting activities with increasing
21 The sharp contrast between this type of strategy and the maquila-type strategy is evident, for instance, with regard to the need to give priority, among other things, to the development of a well financed and equipped formal and technical education and training system able to form skilled workers. On the links between domestic learning, technical change and competitiveness, see Sercovich, 1988.
BEST PRACTICES, POLICY CONVERGENCE AND THE WTO TRADE-RELATED INVESTMENT MEASURES • FRANCISCO SERCOVICH

106 C E P A L R E V I E W < 4 • A P R I L 1 9 9 B
technological and skilled-labour content. The aim is to overcome the problem of rising unit labour costs and to attain the status o f industrialized countries within a couple o f decades. In Thailand, for instance, the Development Research Institute has reported that exports o f medium- and high-technology products exceeded those o f labour-intensive products in 1993 for the first time and have continued to grow at a much higher rate than the latter {Business Times, 1995, p. 5). Thailand’s current Industrial Master Plan relies on the cluster approach as a means o f deepening the industrial structure and completing the process o f transition towards becoming an industrialized economy. The absence o f cluster development is perceived as a market failure making necessary policy measures designed to increase local content and induce upstream development, including manufacturing and service support networks.
The ongoing increase in manufacturing value added (MVA) as a proportion of the value o f production in the ASEAN countries is in marked contrast to the prevailing trend in the m e r c o s u r countries, where the dismantling o f measures aimed at increasing local content is well under way. In Argentina, for instance, the share o f local MVA in the value o f industrial production declined from 51% in 1984-1985 to 36% in 1994-1995. A similar trend, albeit more moderate, has begun to be observed in Brazil.22
This contrast is also apparent at the aggregate level when comparing the growth o f imports and exports (figure 3). During the present decade, Argentina and
FIGURE 3
Latin America and South East Asia (selected countries):Growth of exports and imports, 1990-1996(Annual average growth rates in current US$)
Exports 35 “ 1
30 -
25 -
20 -
15 “
10 -
Malaysia
ThailandSingapore •fC4exicohina
• Chile Indonesia'*« South Korea
/ Taiwan , / • Brazil
P h ilip p in e s
Argentina
T "10
T15
I '20
Imports
I25 30
“ 135
Source: UNIDO.
a Exports by Brazil and Chile and imports by Indonesia and Taiwan refer to the period 1990-1995.
22 Argentina and Brazil have undertaken to cancel their respective motor industry regimes at the end of 1999, Brazilian motor industry policy gave rise to friction with the United States, Japan, South Korea and the European Union, however, when the government raised the import tariff on motor cars from 32% to 70% in mid-1995, A little later, this tariff was halved for established firms, provided they exported an equivalent number of units and that local content amounted to 60% (40% for the first three years in the case of new plants). Japan felt that it was discriminated against, because up to then it had stayed mainly in the import business. Subsequently, the Brazilian Government offered an import quota of 40,000 units per year at a tariff of 35% for firms which did not have manufacturing plants in Brazil. Although this still did not satisfy Japan, it was considered discriminatory by the United States, which submitted a complaint to the WTO on 10 January 1997, alleging the provision of discretional benefits for enterprises of Japan, South Korea and the European Union and violation of articles 1:1 and III;4 of the 1994 GATT agreement, article 2 of the TRIMS agreement, and articles 3 and 27.4 of the WTO agreement on subsidies and countervailing measures. It also requested the cancellation of the benefits referred to in article XXIII:l(b) of GATT 1994. The
European Union, for its part, also submitted a complaint on 7 May 1997 regarding Acts Nos. 9440 and 9449 of 14 March 1997 and Decree No. 1987 of 20 August 1996, alleging the same violations referred to in the United States complaint. Japan withdrew an announced complaint when the Brazilian Government established a quota system to make up for the advantages provided by the motor industry regime for firms already established in Brazil, and the latter country avoided the institution of a panel, as occurred in the case of Indonesia, through skillful trade diplomacy. Brazil is currently the tenth largest car manufacturer in the world and could rise to fourth place by the year 2000. Twelve firms are setting up plants or implementing decisions to do so (Renault, Toyota, Honda, Mercedes-Benz, Volvo, Audi, Chrysler, Asia Motors, Kia, Daewoo, Hyundai and Peugeot). MERCOSUR is scheduled to initiate a common motor industry regime by the year 2000. The Motor Manufacturers’ Association of Argentina (A D E FA ) has requested that this regime should be postponed and that the existing rules should continue after 1 January 2000. This request is based on the claim that Brazilian firms are receiving bigger incentives and protection and that the playing field is therefore not level. The states in the north of Brazil exempt the plants established there from taxes until the year 2010, with an import tariff of 35%.
BEST PRACTICES, POLICY CONVERGENCE AND THE WTO TRADE-RELATED INVESTMENT MEASURES • FRANCISCO SERCOVICH
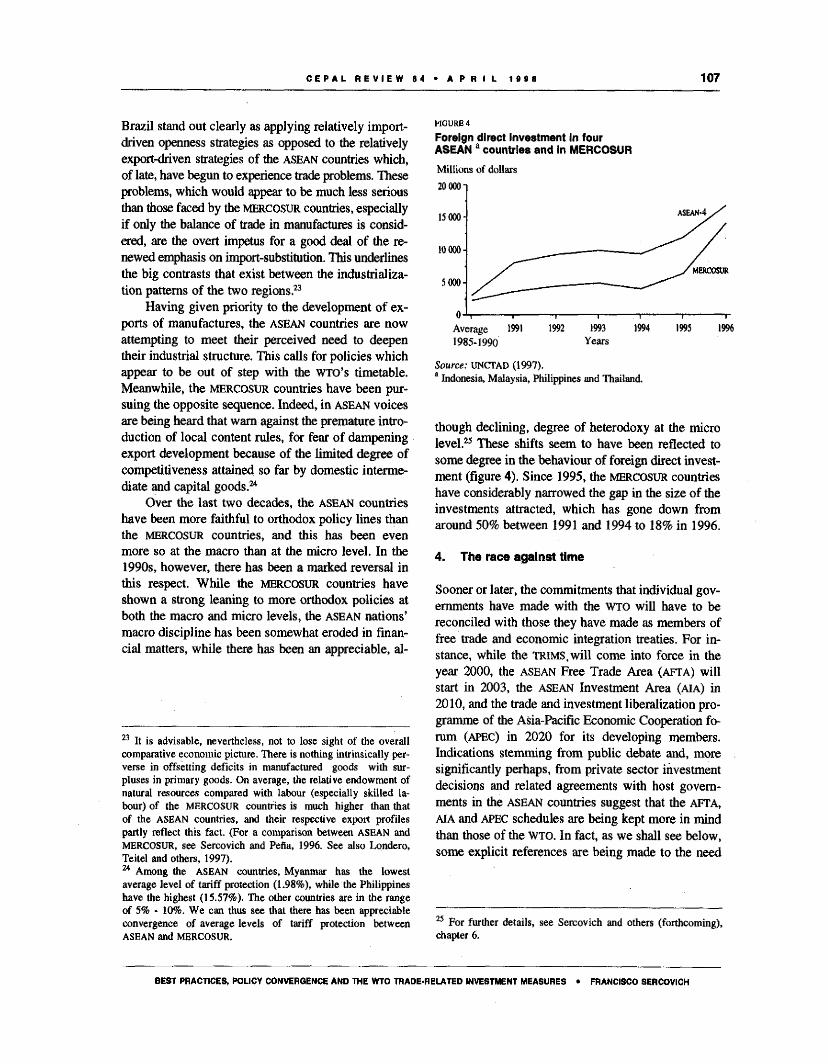
C E P A L R E V I E W 6 4 • A P R I L 1 6 9 8 107
Brazil stand out clearly as applying relatively import- driven openness strategies as opposed to the relatively export-driven strategies o f the ASEAN countries which, of late, have begun to experience trade problems. These problems, which would appear to be much less serious than those faced by the MERCOSUR countries, especially if only the balance o f trade in manufactures is considered, are the overt impetus for a good deal o f the renewed emphasis on import-substitution. This underlines the big contrasts that exist between the industrialization patterns o f the two regions,23
Having given priority to the development o f exports o f manufactures, the ASEAN countries are now attempting to meet their perceived need to deepen their industrial structure. This calls for policies which appear to be out o f step with the WTO’s timetable. Meanwhile, the MERCOSUR countries have been pursuing the opposite sequence. Indeed, in ASEAN voices are being heard that warn against the premature introduction o f local content rules, for fear o f dampening export development because o f the limited degree of competitiveness attained so far by domestic intermediate and capital goods.24
Over the last two decades, the asean countries have been more faithful to orthodox policy lines than the MERCOSUR countries, and this has been even more so at the macro than at the micro level. In the 1990s, however, there has been a marked reversal in this respect. W hile the MERCOSUR countries have shown a strong leaning to more orthodox policies at both the macro and micro levels, the asean nations’ macro discipline has been somewhat eroded in financial matters, while there has been an appreciable, al
23 It is advisable, nevertheless, not to lose sight of the overall comparative economic picture. There is nothing intrinsically perverse in offsetting deficits in manufactured goods with surpluses in primary goods. On average, the relative endowment of natural resources compared with labour (especially skilled labour) of the M ER C O SU R countries is much higher than that of the A SE A N countries, and their respective export profiles partly reflect this fact. (For a comparison between A SEA N and M ER C O SU R , see Sercovich and Pefia, 1996. See also Londero, Teitel and others, 1997).24 Among the A SE A N countries, Myanmar has the lowestaverage level of tariff protection (1.98%), while the Philippines have the highest (15.57%). The other countries are in the rangeof 5% - 10%. We can thus see that there has been appreciable convergence of average levels of tariff protection betweenA SE A N and M ERCO SU R.
FIGURE 4
Foreign direct investment In four ASEAN a countries and In MERCOSURMillions of dollars
1985-1990 Years
Source: UNCTAD (1997). a Indonesia, Malaysia, Philippines and Thailand.
though declining, degree o f heterodoxy at the micro level,25 These shifts seem to have been reflected to some degree in the behaviour o f foreign direct investment (figure 4). Since 1995, the m ercosur countries have considerably narrowed the gap in the size o f the investments attracted, which has gone down from around 50% between 1991 and 1994 to 18% in 1996.
4. The race against time
Sooner or later, the commitments that individual governments have made with the WTO will have to be reconciled with those they have made as members of free trade and econom ic integration treaties. For instance, while the trim s, w ill com e into force in the year 2000, the ASEAN Free Trade Area (AFTA) will start in 2003, the asean Investment Area (aia) in 2010, and the trade and investment liberalization programme of the Asia-Pacific Economic Cooperation forum (APEC) in 2020 for its developing members. Indications stemming from public debate and, more significantly perhaps, from private sector investment decisions and related agreements with host governments in the asean countries suggest that the a f ta , a ia and APEC schedules are being kept more in mind than those of the WTO. In fact, as w e shall see below, some explicit references are being made to the need
25 For further details, see Sercovich and others (forthcoming), chapter 6.
BEST PRACTICES, POLICY CONVERGENCE AND THE WTO TRADE-RELATED INVESTMENT MEASURES • FRANCISCO SERCOVICH

108 C E P A L R E V I E W 6 4 * A P R I L 1 9 9 8
to make these different schedules converge. If this is done, it is unlikely that this w ill lead to earlier compliance with those o f the WTO.
Except in the case o f Thailand, which has decided to abolish local content requirements in 1998, the governments o f the other ASEAN countries are under various pressures to postpone their conformity to the w to rules.26 Firms that are carrying out pluri- annual investment programmes to attain progressively higher percentages o f local content, as mandated by the regulations which will remain in force until the end o f 1999, potentially face considerable losses if their markets are suddenly opened up to more efficient international competitors. Governments would find it hard to ignore the social consequences o f this type o f situation. It may therefore be expected that efforts w ill be made to exploit some grey areas in the TRIMS agreement, such as potential exceptions and differences o f interpretation.27
From the year 2000, very low tariffs will be practically the only substitute for local content rules. Hence, a race against time is on to attain domestic manufacturing capabilities efficient enough to com pete in world markets, with very low margins of effective protection. This challenge has been further complicated by the crisis which broke out in the second half o f 1997.
The Philippine private sector has already requested its government to revise its commitment with w to to liberalize the automobile industry by 2000, on the grounds that auto part firms need more time to adjust to the new situation. The request calls for the retention o f local content rules as well as the foreign exchange trade balance demands applied to domestic car production and assembly o f completely knocked- down units. The private sector is also lobbying for postponement o f the liberalization schedule until 2010 : an idea which is gaining currency in other ASEAN countries (Business World, 1996, p. 12).
Significantly, the Investment Council (IC) o f the Philippine government has endorsed the private sector’s proposal to extend the application o f the local content rules to CKD units beyond the year 2000, as
26 In a sense, this is already the case, since this process of adaptation cannot take place instantaneously on 1 January 2000.27 The main unknown factor, of course, is China, which is negotiating substantial exceptions and grace periods. China had offered to abolish its non-tariff barriers in the automobile sector over 15 years (last March, it eased this stance somewhat, offering to shorten the period to 12 years).
part o f its efforts to help the domestic automobile industry attain international competitiveness. Moreover, the IC supports an increase in mandatory local content from the present level of 40% to 50% in 2000. Despite the fact that such a measure would have to be harmonized with the tariff reform programme underway, the IC regards it as a necessary step to develop the local auto parts industry.28 Finally, the IC is also considering levying a 7% specific tax on CKD units, thus increasing the tariff applied to car parts and components from the current 3% to 10%. These proposals are contained in the document “Philippine Automobile Vision 2020”, which sets out the strategy for the sector (Business Daily, 1997).
In contrast to the sparsity o f clear signals in respect to w to TRIMS deadlines, the Philippine government has declared that it favours liberalization of FDI incentives within South East Asia by 2010, in accordance with the a i a schedule, as a complementary measure to the AFTA, in order to increase intra- regional investments. Under AFTA, tariffs will go down to between 0% and 5% in 2003. In addition, the ASEAN Chamber o f Commerce and Industry (ASEAN-CCI), whose current President is a Philippine businessman, is studying a regional local content rule of 50% for capital goods from outside ASEAN.
Outside ASEAN, an illustrative case is that of Taiwan, which, although ready to abolish local content rules in its bid to enter WTO, is negotiating compensatory measures aimed at lessening the impact of such a measure and stretching it over time.
The Government o f Taiwan contends that if it were to accept the w to disciplines in toto, the output of local automobile firms would fall 60% and their market share would drop to 30% from the current 67%, while auto parts production would fall by half, with only 35% of the domestic auto part producers surviving the abolition o f the local content rules. It estimates that only three or four o f the 11 automobile assembly firms in operation would survive as such in a liberalized market, while the remainder would becom e sellers o f imported vehicles.29 In its negotiations with the WTO, the Taiwan Government is trying
28 T he private sector has also requested an increase in the mandatory foreign exchange offset margins from the current 50% of total sales to 65% in 2000, which would also be inconsistent with the commitments under the WTO.29 Statement by the Bureau of Industrial Development of the Ministry of Economic Affairs, published in The Jakarta Post, 1995, p. 9.
BEST PRACTICES, POLICY CONVERGENCE AND THE WTO TRADE-RELATED INVESTMENT MEASURES * FRANCISCO SERCOVICH

C E P A L R E V I E W 6 4 * A P R I L 1 6 9 8 109
to safeguard the position o f sectors that it considers vital for the domestic economy, such as automobiles and consumer electronics, which would continue to be highly protected. Basically, only those subsectors which have already gained a competitive edge, such as informatics and petrochemicals, would be substantially liberalized. The Taiwan Government has granted trade concessions in the shape o f import quotas for automobiles to those countries which have agreed to support Taiwan’s entry into the w t o under these conditions.
Thus, for instance, Taiwan has agreed a grace period o f eight years after its entry into w to with Japan, which includes the progressive lifting o f the 20-year-long ban on imports o f Japanese automobiles. A tariff-based quota system will be implemented, under which up to 7,700 small cars w ill be imported in 1997; with a 10% annual increase until 1999, when the increase in the quota will stop until Taiwan enters the WTO, Once this happens, the annual quota w ill be immediately raised to 10,000 units, increasing by 20% annually. The automobiles imported within the quota w ill be charged a 29% tariff during the first year after entry into the WTO, after which the tariff w ill gradually go down to 22,5% in the course of the eight-year grace period. Imports in excess o f the quota will pay duty o f 60%. After the grace period, quantitative restrictions will be removed and all imported automobiles will be subject to a uniform 22.5% tariff. The current local content requirement o f 50% for locally assembled automobiles w ill be abolished immediately upon Taiwan’s entry into WTO (Business Taiwan, 1997).
Taiwan is negotiating similar bilateral agreements with a number o f other countries in return for their support o f its entry into the WTO. To counteract the heavy expected impact that removal of local content requirements w ill have on auto parts firms, whose output may fall by 50%, active programmes are underway to encourage gains in efficiency through process automation, improved product quality, better management, updating o f production technology, and strengthening o f marketing networks. This is expected to help local firms to retain around 75% of the domestic market. Finally, it may be noted that, although it was the country o f the region least affected by the 1997 financial and exchange-rate crisis, Taiwan has announced that it will postpone the liberalization o f its capital market until after the year 2000 (International Herald Tribune, 19 January 1998, p. 11).
FIGURE 5
ASEAN and MERCOSUR: Stylized evolution of local content in the automotive industry, 1950-2000
*
Years
Source: UNIDO.
Given their current policy approaches and place in the technological learning curve, the MERCOSUR countries w ill probably face less difficulties that those o f ASEAN in complying with WTO 2000 (figure 5). It is difficult to see how most o f the ASEAN countries, as well as several others in Asia, including China and India, can fully adopt the WTO TRIMS disciplines by 1 January 2000, because of the inertia of their current policies and investment processes and their relatively late entry into such sectors as automobiles and capital goods. This could make it necessary for them to apply for exception mechanisms under the “special difficulties" provision allowed for by w to . An alternative might be to make their local content regulations consistent with those of the WTO through their application at the ASEAN level (a 50% local content rule has been proposed for capital goods, for example). On the other hand, none o f the MERCOSUR countries has embarked on a “national car” policy, as have Indonesia and Malaysia.
The ASEAN countries are faced with a major challenge due to the potential competition o f large countries such as China and India, which are seeking to develop their own automobile industry. Perhaps the best response would be to pursue intra-industry specialization at the regional level, but so far Thailand is the only ASEAN country that has favoured a regional approach in the automobile sector.
The a s e a n Enterprise-to-Enterprise Industrial Cooperation scheme (AICO) could perhaps serve as a regional means o f encouraging an increase in local
BEST PRACTICES, POLICY CONVERGENCE AND THE WTO TRADE-RELATED INVESTMENT MEASURES • FRANCISCO SERCOVICH

110 C E P A L R E V I E W « 4 • A P R I L 1 9 9 8
content at the regional level with very low intra- regional tariffs. Because it w ill com e into effect only in 2003, however, the schem e’s impact is unlikely to be felt fully before 2005 or 2010. One o f the difficul-
yFinal remarks
ties with aico is that each member country applies different exception regimes (for instance, regarding local content), so that harmonization raises considerable problems.30
There seems to be a lack o f consensus in defining precisely the meaning o f best practices, particularly with regard to microeconomic policies, which are largely guided by the institutional and historical heritage o f each country and by the nature o f the policy goals pursued, which, in turn, cannot be divorced from geopolitical considerations.
To varying degrees, for instance, the ASEAN countries are emulating the experiences o f Japan and South Korea, with a view to joining the “convergence club” in a couple o f decades. However, this is not precisely the type o f em ulation that
underlies the WTO disciplines, since it entails giving priority to policies aimed at substantially modifying the initial resource endowment over time, rather than taking it as a given element in terms of shaping the future.
Underlying these differences are two alternative paradigms with respect to the meaning o f convergence and of a “level playing field”. In one, levelling the playing field means policy convergence today. In the other, it means convergence in levels of development tomorrow. So the debate continues.
(Original: English)
Bibliography
ADB (Asian Development Bank) (1997): Asian Development Outlook 1997-1998, Manila.
Barro, R. J. and X. Sala-i-Martin ( 1995): Economic Growth, McGraw-Hill Advanced Series in Economics, New York, McGraw-Hill, Inc.
Benavente, J. M., G. Crespi, J. Katz and G. Stumpo (1996): Changes in the industrial development of Latin America, CEPAL Review, N° 60, LC/G.1943-P, Santiago, Chile, Economic Commission for Latin America and the Caribbean (ECLAC).
Berger, S. and R. Dore (eds.) (1996): National Diversity and Global Capitalism, London, Cornell University Press.
Boyer, R. (1996): The convergence hypothesis revisited: Globalization but still the century of nations?, in S. Berger and R. Dore (eds.), National Diversity and Global Capitalism, London, Cornell University Press.
Business Daily (1997): Bangkok, 5 March.Business Taiwan (1996): Taiwan, 26 December. (1997): Taiwan, 17 February.Business Times (1995): Kuala Lumpur, 6 August.Business Times Malaysia (1996a): Malaysia, 18 October. (1996b): Malaysia, 6 November.Business World (1996): Bombay, 23 December.
De María y Campos, M. and F. Sercovich (forthcoming): Hacia una nueva visión de las políticas de desarrollo industrial y competitividad, Mexico City, Nacional Financiera, S.A. (NAFINSA).
Deloitte & Touche Consulting Group (1997): The Automotive Industry: Strategies and Priorities in a Global Environment, London.
Estrategia (1997): Statement by A. M. Campogrande, Principal Foreign Relations Administrator of the European Union, Santiago, Chile, 5 December.
Huntington, S. P. (1997): Die Clash o f Civilizations and the Remaking o f the World Order, New York, Touchstone Books.
International Herald Tribune (1998): Frankfurt, 11 January 1998, p. 11.
30 AICO is a common preferential regime that will allow eligible enterprises (those which operate in a member country and have at least 30% local shareholding) to enjoy tariffs of 0-5% immediately after it comes into effect in 2003. The enterprises will also be given non-tariff incentives and regional local-content accreditation. A ICO is an accelerated benefit of A FTA and will replace the A SE A N Industrial Joint-Venture (A IJV ) and Brand-to-Brand Complementation (B B C ) schemes.
BEST PRACTICES, POLICY CONVERGENCE AND THE WTO TRADE-RELATED INVESTMENT MEASURES • FRANCISCO SERCOVICH

C E P A L R E V I E W 6 4 • A P R I L 1 9 9 6 111
JEI Report (1997): Tokyo, 7 February.Lian, B. and J. R. Oneal (1997): Cultural diversity and
economic development: A cross-national study of 98 countries, 1960-1985, Economic Development and Cultural Change, Chicago, IL, The University of Chicago Press, October, pp. 61-67.
Londero, E., S. Teitel and others (1997): Resources, Industrialization and Exports in Latin America, London, Macmillan.
Nelson, R. (1997): How new is new growth theory?, Challenge, vol. 40, No. 5, New York, M. E. Sharpe.
Porter, M. (1996): What is strategy?, Harvard Business Review, vol. 74, No. 6, Boston, MA, HBS Publishing Corporation.
Ramos, J. (1997): Industrial Policy and Competitiveness in Open Economies, “Desarrollo productivo” series, No. 34, LC/G.1928, Santiago, Chile, ECLAC.
Rodrik, D. (1996): Understanding economic policy reform, Journal o f Economic Literature, vol. 34, No. 1, Nashville, TN, American Economic Association.
Sercovich, F. (1980): State-Owned Enterprises and Dynamic Comparative Advantages in the World Petrochemical Industry, Cambridge, MA, Harvard University, Harvard Institute for International Development.
(1988): Domestic Learning, International Technology Flows and the World Market, Geneva, International Labour Organisation (ILO).
Sercovich, F. and others (forthcoming): Competition and the World Economy: Comparing Industrial De
velopment Policies in Developing and Transition Economies, London, United Nations Industrial Development Organization (UNIDO) /E. Elgar.
Sercovich, F. and F. Pena (1996): From Open Regionalism to Multilateralism: Forging Partnerships for Global Competitiveness in ASEAN and MERCOSUR, Vienna, UNIDO.
Summers, R. and A. Heston (1994): The Penn World Tables (mark 5.6) (FWT 5.6) (may be downloaded from www.nber.org/pub/pwt56, University of Pennsylvania),
The Economist (1997): London, The Economist Newspaper, 22 November.
The Jakarta Post (1995): Statement by the Minister of Economic Affairs, Industrial Development Office, Jakarta, Indonesia, 7 February.
(1996a): Address by Mr. Anwar Ibrahim, DeputyPrime Minister and Minister of Finance of Malaysia, Jakarta, Indonesia, 21 October.
(1996b): Statement by Dennis de Tray, Director ofthe World Bank Jakarta Office, Jakarta, Indonesia, 1 May.
The Star (1997): Official announcement by the Prime Minister, Datuk Seri Dr. Mahathir Mohamad, Kuala Lumpur, 30 November.
UNCTAD (United Nations Conference on Trade and Development) (1997): World Investment Report 1997: Transnational Corporations, Market Structure and Competition Policy, New York, United Nations publication, Sales No. E.97.II.D.10.
BEST PRACTICES, POLICY CONVERGENCE AND THE WTO TRADE-RELATED INVESTMENT MEASURES • FRANCISCO SERCOVICH


Peter Nunnenkamp
Kiel Institute of World Economics,Kiel, Germany,
C E P A L R E V I E W 64 113
Possible effects ofEuropean Union widening
on Latin America
Pending widening of the European Union to the East has
revived concerns in Latin America that Europe may become
more inward-looking. However, booming trade and foreign di
rect investment relations between current European Union
members and Central and Eastern European countries are un
likely to harm Latin America. Trade patterns suggest that Latin
America’s exports to the European Union are complementary to
the exports of the Central and Eastern European countries.
Moreover, the recent surge in flows of foreign direct investment
to various host countries, including several Latin American
economies, indicates that new investment opportunities in the
Central and Eastern European nations induce additional foreign
direct investment, rather than causing its diversion. This picture
is unlikely to change significantly once some of those nations
become members of the European Union. The paper concludes
that future economic relations between Latin America and the
Union depend primarily on sustained economic policy reforms
in Latin America and the European Union’s role in multilateral
trade negotiations, rather than on the Union’s widening per se.
A P R I L 1 6 9 8
114 C E P A L R E V I E W 6 4 • A P R I L 1 « D 8
IIntroduction
T he w idening o f the E uropean U nion (eu) to include the Central and Eastern European countries (CEECs) m ay involve a dilem m a for Latin Am erica. O n the one hand, Latin A m erica should be interested in the successful integration o f the CEECs into the eu,1 since Latin A m erican exporters m ay find new buoyant m arkets in the ceecs if their econom ic transition and integration into the U nion proceed smoothly. By con- trast, i f the w idening o f the European Union to the E ast were to fail, this w ould m ost likely result in econom ic and political destabilization o f the CEECs, and the adverse repercussions o f such a failure might w ell spread beyond W estern Europe, w ith non-EU m em bers becom ing the victim s o f econom ic and political tension betw een the U nion and the CEECs, because the EU w ould be a less reliable trade and investm ent partner for all non-m em bers, including L atin America.
O n the o ther hand, the pending w idening of th e EU has rev ived concerns th a t Europe m ay becom e m ore inw ard-looking. In m any L atin A m erican countries, the perception o f being d iscrim inated
vis-à-vis intra-EU suppliers and privileged trading p artners o f the U n ion is deep ly roo ted . A dverse effects o f discrim ination are indeed to be expected if the prospective EU m em bers am ong the ceecs are d irect com petitors of Latin A m erica in exporting to the EU and attracting foreign d irect investm ent (fd i) from it.Concem s about trade and EDI diversion resulting from EU w idening to the East are justified in principle. For various reasons, how ever, Latin Am erica is rather unlikely to be affected by significant diversion effects. This proposition w ill be substantiated in the following sections, first by analysing recent trade patterns (section II), and second by discussing the issue o f com petition for the EU’s foreign direct investm ent (section III). The evaluation takes into account the fact that recent trends m ay change once som e CEECs becom e full EU mem bers (section IV). The conclusion is that econom ic relations between Latin A m erica and the EU are m ost likely to prosper if EU integration proceeds smoothly and Larin A m erica susta ins its econom ic po licy reform s.
I IThe pattern of EU imports: why trade preferences are not a sufficient explanation
1. Booming East-West trade: a case of trade diversion?
T he CEECs have benefited from an unprecedented shift in the EU’s trade policy stance. In the socialist era, CEECs w ere seriously restricted in terms o f m ark e t access to the e u . They faced high tariffs, quantitative restrictions and a w ide range o f contingent
1 For a similar Hne of reasoning, see Langhammer and Nunnenkamp (1993).
protection measures. At that time, the CEECs ranked at the bottom o f the pyramid o f trade preferences granted by the e u to various groups of countries (Hiemenz, Gundlach, Langhammer and Nunnenkamp, 1994, pp. 18 et seq.). The liberalization o f East-West trade began in 1988 (when the EU concluded a trade and cooperation agreem ent w ith H ungary), but the really big change cam e in 1991, when the so-called “Europe Agreements” promoted the former Czechoslovakia, Hungary and Poland to the top of the pyramid o f trade preferences.
The shift from discriminatory to preferential treatment has certainly favoured the boom of EU im-
POSSIBLE EFFECTS OF EUROPEAN UNION WIDENING ON LATIN AMERICA • PETER NUNNENKAMP

C E P A L R E V I E W 6 4 • A P R I L 1 9 6 8 115
ports from ceecs. Such imports from a group o f seven ceecs2 increased fivefold between 1986 and 1995 (OECD, Foreign Trade by Commodities. Series C, several issues). Though it is true that they started from a higher level, EU imports from Latin America only doubled during the same period. In 1995, imports from the seven CEECs exceeded imports from all the Latin American economies. It is not unreasonable to assume that the trend o f considerably faster growth o f EU imports from CEECs will continue, considering that some o f them will join the EU soon.
Nevertheless, it is open to question whether booming EU imports from CEECs were (or w ill be) at the expense o f other trading partners in general, and Latin America in particular. Likewise, it is debatable to what extent the boom in these imports was due to preferential access o f the ceecs to eu markets. Historical trade patterns o f the inter-war period, as well as the simulation o f “normal” trade patterns,3 suggest that the ceecs would normally direct the largest share o f their exports to Western Europe in any case. There are two reasons why the exports o f CEECs to the EU fell short o f the “normal” pattern until the early 1990s: apart from the aforementioned trade restrictions imposed by the eu, those countries suffered from a deterioration in their supply capacity under conditions o f central planning. In other words, the economic transformation o f the ceecs would most likely have resulted in rising exports to the EU even if preferential market access had not been granted by the latter.
This implies that the increase in EU imports from ceecs may reflect trade creation, rather than preference-induced trade diversion.4 It is almost impossible to empirically assess the relative importance of trade creation and trade diversion. However, the following evaluation suggests that the e u ’s trade policies towards the ceecs are o f minor importance in explaining Latin America’s competitive position on EU goods markets.
2. CEECs and Latin America: competing suppliers on EU markets?
Trade diversion to the detriment of Latin America would be m ost likely if substitution elasticities between (preferred) CEEC suppliers and (non-preferred) Latin American suppliers in EU markets were high. As substitution elasticities are difficult to measure, trade overlap indices are often used as proxies (Lang- hammer, 1994). Comparing the commodity structure of EU imports from CEECs and Latin America as a whole reveals a surprisingly low degree o f overlapping. M ost strikingly, perhaps, manufactured goods accounted for 70% o f total EU imports from CEECs in 1994, while the share o f manufactures in EU imports from Latin America was only 20% (see table 1).
It might be suspected that the significant increase in the share o f manufactures in eu imports from ceecs since 1989 has hindered Latin America from reducing the strong bias in favour o f non-manufactures (such as food products, crude materials and other commodities) in its exports to the EU. It is indeed striking that, in contrast to eu imports from Latin America, imports by the United States from the latter region shifted considerably towards manufactures in the early 1990s.5 However, several observations conflict with the above suspicion. For Latin America as a whole, the stylised facts are as follows:- The share o f manufactures in Latin America’s
exports was about 50% lower in the e u market than in the United States market even before the ceecs were granted privileged status by the EU (United Nations, 1996).
- At the level o f particular manufacturing industries, there is little evidence that shifts in the structure o f EU imports from the CEECs were related to shifts in the structure o f EU imports from Latin America.6 The shares o f chemicals, machinery and transport equipment, and textiles, clothing and leather in manufactured EU imports
2 Albania, Bulgaria, Czech Republic, Hungary, Poland, Romania and Slovak Republic.3 This was done by using gravity models which consider economic size and distance as major determinants of the direction of trade; see, for example, Piazolo (1997).4 Piazolo (1997) concluded from a comparison of revealed comparative advantage of CEECs vis-à-vis the EU on the one hand,and vis-à-vis all trading partners on the other hand, that regional integration benefitting intra-European trade is unlikely to lead to substantial distortions.
5 The share of manufactures in United States imports from Latin America almost doubled from 31% in 1990 to 60% in 1994 (United Nations, 1996).6 Table 1 includes three prototype manufacturing industries: the chemical industry, which is relatively physical capital intensive; machinery and transport equipment, where production technologies tend to be relatively skill-intensive; and textiles, clothing and leather, the production of which is relatively (unskilled) labour-intensive.
POSSIBLE EFFECTS OF EUROPEAN UNION WIDENING ON LATIN AMERICA • PETER NUNNENKAMP

1 1 6 C E P A L R E V I E W « 4 • A P R I L 1 9 9 8
TABLE 1European Union: Commodity structure of imports from CEECs and Latin America, 1989 and 1994(Percentages)
Manufactured goods a (total
imports = 100)Chemicals b
Selected industries (manufactured imports = 100) Machinery and
transport equipment6
Textiles, clothing and
leather d
CEECs6 1989 49.4 16.4 22.4 30.41994 70.3 9.3 29.7 30.0
Latin America 1989 19.4 17.6 37.5 24.31994 20.4 16.5 34.7 23.3
Argentina 1989 14.7 34.9 13.6 39.61994 14.1 21.4 22.1 39.9
Brazil 1989 29.3 12.9 41.3 24.31994 27.4 12.2 33.0 24.4
Chile 1989 3.5 71.6 4.5 5.01994 7.3 61.6 7.6 7.2
Mexico 1989 28.5 19.3 58.2 10.21994 47.0 16.4 57.4 7.2
Source: OECD, Foreign Trade by Commodities. Series C, several issues. a SITC sections 5-8, minus divisions 67 and 68. b SITC section 5. c SITC section 7.d SITC divisions 61, 65, 84 and 85. e Excluding the Community of Independent States.
from Latin America all declined slightly, irrespective o f the direction o f change in the share o f these items in manufactured EU imports from CEECs (see table 1).
- Finally, for the bulk o f manufactures, access to EU markets is largely unrestricted for Latin American suppliers. To put this a different way, preference margins favouring CEECs play only a marginal role in large areas o f manufacturing. This is also because about 60% of Latin American exports o f processed and semi-processed goods to the EU actually enter EU markets dutyfree or with reduced duties under the Generalized System of Preferences (European Union, EUROSTAT, 1995).Obviously, average figures for Latin America as
a whole disguise significant differences at the country level. Considering four major Latin American econom ies, the share o f manufactures in EU imports in 1994 ranged from 7% for Chile to 47% for Mexico (see table 1). Nevertheless, country-specific evidence tends to support the view that trade diversion played
a minor role. For instance, M exico and, to a lesser extent, Chile succeeded in raising the share o f manufactures in their total exports to the EU, although EU imports from CEECs shifted towards manufactures at , the same time. Moreover, trade diversion cannot reasonably be blamed for the slightly declining share of manufactures in Argentina’s and Brazil’s exports to the EU. Changes in the share of particular industries in manufactured EU imports from Argentina were exactly in line with changes in the share o f these industries in EU imports from CEECs. In the case o f Brazil, the share o f machinery and transport equipment declined considerably. Although EU imports from CEECs shifted towards this industrial sector, Brazil is unlikely to have suffered from trade diversion. Rather, this decline in its share seems to be due to country-specific factors that impaired Brazil’s international competitiveness in this sector. Otherwise, it would be difficult to explain why the share o f the same industrial sector increased in the cases of Argentina and Chile, and remained outstandingly high in M exico.
POSSIBLE EFFECTS OF EUROPEAN UNION WIDENING ON LATIN AMERICA • PETER NUNNENKAMP

C E P A L R E V I E W 6 4 • A P R I L 1 9 9 8 117
A closer look at trade overlaps may be required in so-called sensitive areas. Notably in the cases of steel, textiles and agricultural products, e u imports have traditionally been quota-restricted. It is primarily in these areas that CEECs were granted preferential treatment by the e u , which may have caused trade diversion. However, empirical analyses revealed rather small overlaps in the supply o f CEECs and Latin A m erica in quota-restricted EU markets (Langhammer, 1994).
As regards steel, trade overlaps in the late 1980s and early 1990s were basically due to competition between Brazil and the former USSR in special steel products. However, Brazil’s declining market shares in this period cannot be explained by preference margins, but must be attributed to price underbidding by the successor States o f the USSR. Trade diversion caused in this way has diminished since 1992-1993: the EU enforced “orderly marketing behaviour”, imposed quantitative restrictions on steel imports from the republics o f the Community of Independent States, and subjected steel imports from the Czech and Slovak Republics to tariff quotas (WTO, 1995, p. 59). Both Latin America and the CEECs became subject to a “managed trade” strategy o f the EU, designed to protect domestic steel producers and traditional trading partners against allegedly dumped steel imports. As a matter o f fact, the share o f iron and steel in total exports to the e u declined for both Latin America and the CEECs,7
Likewise, Latin America does not appear to have suffered from considerable trade diversion with respect to textiles and clothing. True, Latin America’s share in EU imports of textiles and clothing (SITC divisions 65 and 84) from all non-OECD sources declined from 2.9% in 1989 to 1.7% in 1994, while the share of the CEECs more than doubled to 16.2% (OECD, Foreign Trade by Commodities. Series C, several issues).8 However, the decline in Latin America’s
7 In 1989, iron and steel accounted for 7% of total EU imports from CEECs and 3,2% of total EU imports from Latin America; the respective shares declined to 5.5% and 1.4% in 1994 (OECD, Foreign Trade by Commodities. Series C, several issues).8 Soaring EU imports of textiles and clothing from CEECs appear to be largely due to outward processing (maquila) activities of EU companies in CEECs (Nunnenkamp, Gundlach and Agarwal, 1994, p . 76), By contrast, outward processing trade does not play a significant role in Latin America's exports to the EU. This implies that trade patterns in textiles and clothing are biased in favour of the CEECs, considering that processed re-exports to the EU are inflated by imports of unprocessed inputs from the Union.
market share was even more pronounced in the 1980s:9 i.e., before the CEECs became the most favoured trading partner o f the EU. Moreover, in 1989- 1994 Latin America experienced a similar decline in its share in EU imports o f all manufactures (from 7.1% to 4.5%; see table 2). Country-specific data presented in table 1 reveal that it was only for M exico that textiles, clothing and leather accounted for a declining share in manufactured exports to the eu . All this implies that preferential treatment o f imports o f textiles and clothing from c e e c s does not provide a sufficient explanation o f Latin America’s poor performance. Moreover, the preferences granted to c e e c s were less significant than might be suggested by the expression “removal o f quantitative restrictions”. As in the case o f steel, preference-induced trade diversion in favour o f imports o f textiles and clothing from c e e c s was contained by persistent trade monitoring by the EU. The remaining preferences w ill be further reduced once international trade in textiles and clothing becom es subject to w to discipline, as agreed in the Uruguay Round.
Arguably, the value o f trade preferences granted to the CEECs was particularly high for products covered by the Common Agricultural Policy (CAP). Nevertheless, the degree o f trade diversion affecting Latin America does not appear to be as substantial as is widely believed (Langhammer, 1994):10 first, CAP products exported by c e e c s in 1992 amounted to less than one-third o f c a p products exported by Latin America;11 second, trade overlaps in food supply on EU markets by the CEECs on the one hand and Latin America on the other hand were even smaller than for steel and textiles, and third, as in the case of textiles, preference margins in favour o f the CEECs
9 In 1980, Latin America accounted for 5.8% of EU im ports of textiles and clothing from all non-OECD sources (OECD, Foreign Trade by Commodities. Series C, several issues).10 Koester (1996) analyses in detail the im pact of the EU’s agricultural policy towards the CEECs on developing countries. He finds that “LDCs will certainly be som ew hat negatively affected by the increase in preferential exports o f the CEECs to the EU ... . Y et this effect is m ost likely to be ... m arginal, as LDCs sell a set o f products which only com pete indirectly through cross-price effects with products supplied from the CEECs” (Koester, 1996, p. 174).11 EU imports of food, beverages and tobacco suggest that Latin America has remained a more important supplier than the CEECs. In 1994, the latter countries (including the former USSR) exported about US$ 3 billion of these items to the EU, compared with Latin American exports of US$ 13.5 billion (United Nations, 1996).
POSSIBLE EFFECTS OF EUROPEAN UNION WIDENING ON LATIN AMERICA • PETER NUNNENKAMP

118 C E P A L R E V I E W 6 4 * A P R I L 1 9 9 S
TABLE 2European Union: Regional structure of imports from non-OECD countries, a 1989 and 1994(Percentages)
Total Manufactured goods b Chemicalsc
Machinery and transport
equipment d
Textiles, clothing and
leather e
Africaf 1989 9.1 3.7 5.3 0.9 2.71994 6.6 2.3 1.4 0.6 2.2
Asia6 1989 30.4 60.6 20.3 68.9 63.11994 38.7 62.0 28.0 72.0 60.2
Central and EasternEurope 1989 6.6 8.0 14.3 6.0 7.4
1994 13.1 16.7 20.9 14.3 16.2
Maghreb and Mashrek1 1989 7.5 4.3 8.0 1.7 8.41994 6.9 4.4 6.4 1.7 10.2
Latin America 1989 14.9 7.1 13.6 9.0 5.31994 12.2 4.5 10.1 4.6 3.4
Argentina 1989 1.52 0.55 2.09 0.25 0.661994 1.57 0.40 1.16 0.26 0.52
Brazil 1989 5.66 4.05 5.70 5.63 3.011994 4.42 2.21 3.60 2.09 1.74
Chile 1989 1.39 0.12 0.92 0.02 0.021994 0.99 0.13 1.08 0.03 0.03
Mexico 1989 1.49 1.04 2.19 2.03 0.321994 1.06 0.91 2.00 1.50 0.21
Source: OECD, Foreign Trade by Commodities. Series C, several issues.a Including Mexico. b SITC sections 5-8, minus divisions 67 and 68. c SITC section 5. d SITC section 7.e SITC divisions 61, 65, 84 and 85. f Excluding Algeria, Egypt, Libya, Morocco, Tunisia and the Republic of South Africa.8 Excluding the Middle East. h Excluding the Community of Independent States.1 Excluding Lebanon.
will be reduced once the Uruguay Round agreements on agriculture are implemented completely.
The experience o f Argentina is particularly revealing for assessing trade diversion in agriculture. About 60% of Argentina’s exports to the EU consist of food items (SITC category 0 ),12 and this share remained virtually constant from 1989 to 1994 (OECD, Foreign Trade by Commodities. Series C, several issues). It might be suspected that, due to its high dependence on food exports, Argentina would be the first to suffer from trade diversion in agriculture. Yet,
among the four Latin American economies under consideration, it performed best on EU markets, for only Argentina reported a (modest) increase in its overall market share in the EU (see table 2). In 1989- 1994, Argentina’s exports to the EU increased by a factor o f 1.4, compared with a factor of 1.1 for Latin America as a whole. Even more strikingly, it was non-manufactured exports which were largely responsible for this favourable performance.13 In 1994, EU imports o f food items from Argentina were 40% higher than in 1989 (OECD, Foreign Trade by Commodities. Series C, several issues).
12 This compares with about 35% for Brazil, 28% for Chile and 6% for Mexico in 1994 (O E C D , Foreign Trade by Commodities. Series C, several issues).
13 It may be noted that Argentina’s share in manufactured EU imports declined between 1989 and 1994 (see table 2).
POSSIBLE EFFECTS OF EUROPEAN UNION WIDENING ON LATIN AMERICA • PETER NUNNENKAMP

C E P A L R E V I E W $ 4 • A P R I L 1 9 9 8 119
FIGURE I
European Union: Regional structure of Imports of manufactured goods from non-OECD countries(Percentages)
1989 1994
Source:See table 2.A F = Africa (excluding Algeria, Egypt, Libya, Morocco, Tunisia and the Republic of South Africa). A S = Asia (excluding the Middle East).CEE = Central and Eastern Europe (excluding the Community of Independent States).LA = Latin America.MM = Maghreb and Mashrek countries (excluding Lebanon).ROW = Rest of non-OECD countries.
3. Latin America’s position on EU markets: who is to blame?
The changes observed in the regional structure of eu imports from all non-OECD countries support the view that Latin America’s relatively poor performance on eu markets cannot be attributed to closer institutional ties with, and trade preferences for CEECs. If discriminatory trade policies by the EU had been the major factor shaping changes in market shares, Asian suppliers should have been the first to suffer from trade diversion, because Asian countries -notably the newly industrializing economies- were a major target of discriminatory trade policy instruments applied by the EU (such as export restraint agreements and anti-dumping measures) (Hiemenz, Gundlach, Langhammer and Nunnenkamp, 1994, pp. 65-67).14
Nonetheless, Asia further strengthened its dominant position among non-OECD suppliers of manufactured goods on EU markets in 1989-1994 (see figure 1; for details, see table 2).13
Asia gained market shares in capital- and skillintensive industries such as chemicals and machinery and transport equipment, while its market share declined somewhat with respect to labour-intensive eu imports o f textiles, clothing and leather.
In sharp contrast to Asia, Latin America’s com petitive position on EU markets deteriorated in 1989- 1994, in terms of both total trade and trade in manufactures. Furthermore, Latin America’s market share declined in various manufacturing industries (see table 2).
EU trade policies in general, and preferential treatment o f CEECs in particular, cannot explain the contrasting performances o f non-favoured trading
14 Recent anti-dumping investigations concerned various Asian -----------------------------------------------------------------------------suppliers, including India, Indonesia, Malaysia and Thailand 15 For a detailed analysis, see Agarwal, Langhammer, Lücke and (WTO, 1995). Nunnenkamp (1995).
POSSIBLE EFFECTS OF EUROPEAN UNION WIDENING ON LATIN AMERICA • PETER NUNNENKAMP

1 2 0 C E P A L R E V I E W 6 4 • A P R I L 1 6 6 6
European Union: Country structure of Imports of manufactured goods from Latin America(Percentages)
1989 1994
.Source; see table 2.
partners in penetrating EU markets. Latin America lost market shares to other trading partners o f the EU, irrespective o f whether those partners had privileged access to EU markets (CEECs) or, on the contrary, were subject to discriminatory treatment by the EU (Asian countries). It therefore follows that the blame for Latin America’s poor performance on EU markets must be placed primarily on domestic supply constraints, especially in manufacturing, which may be the legacy o f prolonged import substitution policies that impaired the international competitiveness of Latin American manufacturers.
The effectiveness o f trade policy reforms in overcoming this problem may have been slow in manifesting itself. Yet, country-specific data indicate that the earliest reformers in Latin America performed relatively favourably on EU markets for manufactured goods. Thus, for example, only Chile avoided a decline in its share o f manufactured EU imports from all non-OECD countries in 1989-1994 (table 2), At the other extreme is Brazil, whose eco
nomic reforms were delayed until recently. Brazil’s share in EU imports o f manufactures from non-OECD countries was cut by half, standing at only 2.2% in 1994. Argentina and M exico rank between these extremes. Industry-specific trends are consistent with the view that the market position o f latecomers in the reform process deteriorated most seriously. For instance, Brazil’s share in EU imports of machinery and transport equipment from non-OECD countries dwindled from 5.6% in 1989 to 2.1% in 1994, whereas the corresponding loss by M exico was quite modest (see table 2). Figure 2 underscores the link between domestic policy reforms and export performance. Brazil accounted for a drastically reduced share of Latin America’s manufactured exports to the EU in 1994. The shift mainly benefitted M exico, but non- traditional exporters o f manufactures such as Chile gained in relative importance as well. The crucial role o f domestic econom ic policy is also evident when it comes to explaining EDI patterns, to which w e turn next.
POSSIBLE EFFECTS OF EUROPEAN UNION WIDENING ON LATIN AMERICA • PETER NUNNENKAMP

C E P A L R E V I E W 6 4 • A P R I L 1 9 9 » 121
I I IOutward FDI by the European Union: why a zero-sum game is unlikely
1. The Central and Eastern European countriesas new competitors for FDI: a threat to LatinAmerica?
Latin America has traditionally been the dominant host region for fdi from the EU in the non-OECD area. About 45% of the H>! stocks of the four main EU investor countries (France, Germany, the Netherlands and the United Kingdom) in all non-OECD countries were located in Latin America in 1985 and 1990 (see figure 3), and about 60% of the FDI flows from six EU countries16 to the non-OECD area were channelled to Latin America in 1985-1987 (OECD, 1996).
The CEECs were practically non-existent as competitors for FDI until the dem ise o f socialism. In 1985-1987, six EU countries invested a meagre annual average o f US$ 20 million in Central and Eastern Europe, compared with US$ 2.5 billion in Latin America (OECD, 1996). Figure 3 shows that European Union fd i stocks in those countries were exceptionally low until recently.
However, the CEECs have experienced a boom of inward FDI since they started to transform themselves into market econom ies. FDI inflows from six EU countries soared thirteenfold to ECU 2.7 billion in 1994 (see figure 4). In contrast, fd i flows from the EU to Latin America remained considerably below the 1990 inflows in the three subsequent years, increasing substantially only in 1994.
The prospective EU members among the CEECs, in particular, may be expected to becom e even more attractive hosts for fd i in the future. M oves towards closer integration into the European Union have boosted FDI in several EU member countries in the past. Spain, for example, emerged as a major host
16 Flow data are also available for Denmark and Spain. OECD data for the remaining EU countries are either incomplete, inconsistent or completely lacking (OECD, 1996).
country o f FDI after it joined the EU in 1986.17 For the EU as a whole, the Internal Market programme provided a major stimulus to intra-regional fd i flows (Agarwal, Hiemenz and Nunnenkamp, 1995).18
All this would apparently suggest that Latin America has much to lose as a host of FDI. As in the case o f trade, however, the region’s attractiveness for fd i has little to do with EU integration and the emergence o f prospective EU members as new competitors for fdi. This assertion is supported by a closer inspection o f recent fd i patterns in the next section. Moreover, the subsequent discussion o f investors’ motivations underlying different types o f FDI reveals that fd i diversion is likely to remain small in the future.19
2. FDI Inflows to Latin America: how can we explain the region’s impaired attractiveness?
Various empirical observations run counter to the idea that Latin America has been affected significantly by FDI diversion resulting from EU integration and closer ties between the EU and CEECs. First, if FDI diversion had been a major factor, all non-OECD hosts should have suffered from the improved attractiveness of the CEECs. In particular, developing Asia' should not have fared better as a host region of FDI than Latin America. Yet, the most dramatic shift in the regional distribution of fd i in all non-OECD countries occurred exactly between these two regions (Gundlach and Nunnenkamp, 1996, figure 1): East Asia’s
17 FDI flows from all sources to Spain soared from ECU 2.6 billion in 1985-1986 to ECU 5.6 billion in 1987-1988 and to ECU 11.8 billion in 1989-1990 (annual averages). The increase was particularly pronounced for FDI flows from other EU members to Spain, which increased more than sixfold to ECU 7.3 billion in1989-1990 (OECD, 1996).18 Die intra-BU share of total FDI outflows of EU countries doubled from 31% in 1985-1987 to 63 % in 1990-1992.19 In contrast to trade diversion, the notion of FDI diversionlacks analytical foundation. We use this term as a catchword covering the possible effects of fiercer competition for FDI on traditional recipients of FDI.
POSSIBLE EFFECTS OF EUROPEAN UNION WIDENING ON LATIN AMERICA • PETER NUNNENKAMP

122 C E P A L R E V I E W 6 4 • A P R I L 1 9 9 0
FIGURES
European Union: Regional distribution of FDI stocks of four EU countries a In non-OECD countries , 1985-1994(Percentages)
1985° 1990 1994 Latin America
1985 c 1990 1994 Africa
Source: OECD (1996).a France, Germany, the Netherlands and the United Kingdom. c1987 for France and the United Kingdom.
1985c 1990 1994 South and East Asia
1 Including Mexico.
1985c 1990 1994 Central and Eastern Europe
FIGURE 4
European Union: FDI flows from six EU countries a to selected regions, 1990-1994
Source: OECD (1996).8 Denmark, France, Germany, the Netherlands, Spain and the United Kingdom. b Excluding the Middle East.c Central and Eastern Europe, including the former USSR,
share o f global fd i flows has nearly quadrupled since 1980, whereas Latin America’s share has declined significantly. This pattern also holds for outward FDI by the EU. Although EU investors have traditionally been under-represented in Asia, the shift from Latin America to Asia is evident from figures 3 and 4.20
20 FDI flows from six EU countries to Asia amounted to less than one-third of the corresponding flows to Latin America in 1990, but this proportion increased to almost 90% when comparing average annual FDI flows in 1993-1994 (see figure 4). For a more detailed analysis, see European Commission/UNCTAD (1996).
Second, Latin America’s loss of attractiveness for FDI occurred mainly in the 1980s: i.e., before FDI diversion in favour o f CEECs could have played any role. The region’s share in global fd i flows collapsed from 12.6% in 1979-1982 to less than 4% in 1990 (IMF, Balance o f Payments Statistics Yearbook, several issues). Even more strikingly, Latin America’s share in global FDI flows recovered precisely when the CEECs entered the scene as new competitors for FDI. Latin America’s share remained persistently lower in 1991-1995 than in 1979-1982, but on average it was double the 1990 level.
Third, the recent increase in overall FDI flows to Latin America is mainly because o f booming fdi from the United States (IDB/IRELA, 1996, table 11). Recently, however, EU investors too have expanded their commitments in the region (see figure 4). The relatively modest increase in FDI flows from Europe21 is unlikely to reflect fd i diversion, unless it is argued that this increase would have been more pronounced if the CEECs had not attracted rising fd i from the EU (which cannot be proven). Rather, United States fd i in Latin America generally appears to be more volatile than EU FDI in this region: the boom of fd i from the United States started from a depressed level in 1985-1989, whereas European FDI flows to Latin
21 According to data provided by ID B /IR EL A (1996, table 11), European FDI flows to Latin America throughout the period 1990-1994 were 65% higher than in the second half of the 1980s. In comparison, FDI from the United States increased sevenfold.
POSSIBLE EFFECTS OF EUROPEAN UNION WIDENING ON LATIN AMERICA • PETER NUNNENKAMP

C E P A L R E V I E W 6 4 • A P R I L 1 9 6 8 123
America were even somewhat higher in 1985-1989 than in 1980-1984.
Finally, the performance o f Latin America in attracting f d i differed remarkably between individual host countries:22- Traditionally by far the most important recipient
o f FDI inflows in the region, Brazil reported a steeply declining share o f f d i flows from all sources to Latin America.
- M exico, and recently also Argentina, surpassed Brazil in terms of total FDI inflows.
- Chile and Argentina proved to be most attractive with respect to average annual f d i inflows per capita in 1991-1995.Brazil continued to be the m ost important re
cipient o f f d i flow s from the European Union (see table 3), but f d i flows from the EU displayed a remarkable shift towards other Latin American host countries. As in the case o f global FDI flows, Argentina and M exico (in the 1990s) and Chile (since the early 1980s) were the main beneficiaries o f higher FDI flows from the EU.23 This shift seems to be closely related to the economic policies pursued by the respective governments (Nunnenkamp, 1997a). As noted before, Chile is the front-runner with respect to econom ic reforms in Latin America, but the link between the timing o f reforms and improved attractiveness for FDI is also evident in the cases of Argentina and Mexico.
It follows that Brazil’s particularly poor performance in attracting f d i is the consequence o f its serious delay in adopting reforms.24
To sum up, FDI diversion resulting from European integration appears to have been only a minor factor in shaping recent FDI patterns. Both global and European FDI has been far from being a zero-sum game. Various Latin American economies recovered their attractiveness for FDI precisely when the CEECs emerged as new competitors for FDI. Countries in both regions benefitted from additional f d i at the same time, after they had implemented stabilization and structural adjustment programmes. Recent shifts
22 For a detailed analysis and data sources, see Nunnenkamp (1997a)23 The increasing share of the remaining part of Latin America suggests that EU investors strengthened their engagement in various smaller economies within the region, too. Examples include Jamaica, Peru and Trinidad and Tobago (ID B /IR EL A , 1996, Statistical Annex, table 23).24 For a detailed analysis of the case of Brazil, see Nunnenkamp(1997b).
TABLE 3Share of four major Latin American economies In European Union FDI Flows to the region, a 1980*1994(Percentages)
1980-1984 1985-1989 1990-1994
Argentina 16.7 14.4 18.2Brazil 50.3 51.1 29.0Chile 5.8 9.2 8.9Mexico 12.1 8.9 14.9Others 15.1 16.4 29.0
Source: IDB/IRELA, 1996, table 23.a Annual average. FDI flows to offshore financial centres excluded.
in the distribution o f f d i across regions and among Latin American econom ies seem to have a close correlation with the timing and consistency o f econom ic reforms.
3. Motivations of European Union investors:biased against Latin America?
The next question is whether closer EU integration in the future is likely to cause FDI diversion to the detriment o f Latin America. An assessment o f FDI in different sectors and the underlying motivations of foreign investors may offer som e valuable insights in this respect,25 since the potential f d i diversion can reasonably be assum ed to d iffer w idely betw een various types o f investment (Agarwal, 1994).
There are three basic underlying motives for FDI: i) to draw on raw materials and natural resources available in the host country, ii) to serve the domestic markets o f host countries or regions, and iii) to use overseas locations as platforms for global sourcing and marketing. The following discussion w ill show that FDI diversion is hardly a relevant issue in the first two areas. It may be a threat in the third area, but whether it will actually occur largely depends on Latin America itself.
As regards resource-based FDI, Latin America is highly unlikely to suffer from such diversion in favour of prospective eu members among the ceecs. With few exceptions, these countries do not offer promising investment opportunities in the mineral sector. Rather, most o f them are heavily dependent
25 For a comprehensive analysis of investors’ motivations and possible FDI diversion effects, see Michalet (1997).
POSSIBLE EFFECTS OF EUROPEAN UNION WIDENING ON LATIN AMERICA • PETER NUNNENKAMP

124 C E P A L R E V I E W 6 4 • A P R I L 1 9 9 8
on imports o f minerals and other raw materials. From an endowment point o f view, the situation is different in agriculture, where investment opportunities may exist. Nevertheless, the available evidence suggests that the primary sector as a whole continued to be a negligible target for FDI in prospective EU member countries in the early 1990s (Agarwal, 1994, table 4), This is unlikely to change unless the restrictive Common Agricultural Policy is reformed fundamentally.
In contrast to prospective EU members among the ceecs, various successor States o f the USSR do offer vast investment opportunities in the primary sector because o f their favourable endowment of natural resources. This may induce a larger degree o f FDI diversion if the EU strengthens its ties with these countries. Even so, Latin America is unlikely to be affected significantly. First, for the time being FDI conditions in the successor States o f the USSR remain clouded by economic and political uncertainty. Second, various Latin American host countries have little to lose. In Brazil and Mexico, for exam ple, the primary sector as a whole accounted for only about 2% o f total FDI stocks in 1994 (idb/irela, 1996, table 8). Third, fd i diversion may be a minor concern even in Latin American countries where the primary sector figures prominently in total fd i stocks,26 because resource-based fd i tends to be highly location-specific. This means that fd i diversion is conceivable only among countries offering the same quality o f a particular commodity.
FDI for serving the domestic markets o f host countries (in UNCTAD’s jargon, market-seeking FDI) seems to account for the bulk o f fd i in Latin America (Nunnenkamp, 1997a). This is a plausible assumption, although the available data do not allow for a clear distinction between market-seeking FDI and fd i undertaken in the context o f global sourcing and marketing (efficiency-seeking fdi):
The services .sector, in which the production of non-tradeables is clearly dominant, accounts for a significant share o f total fd i in major Latin American host countries.27
- Surveys o f enterprises and regression analyses reveal that the size and growth o f host country markets have been major stimuli for FDI in manufacturing. This applies especially to Latin America, where lasting import substitution strategies provided a disincentive to efficiency- seeking FDI in the past. The low share o f manufactured goods in Latin American exports to the EU (see section II.2 above) underscores the fact that European Union FDI in manufacturing has primarily been market-seeking in this region.The sectoral distribution o f fd i in several ceecs
suggests that, as in Latin America, market-seeking FDI was dominant in the early 1990s (Agarwal, 1994, p. 12). This is corroborated by recent survey results (OECD, 1993; Michalet, 1997). Most probably, this similarity between Latin America and the CEECs will greatly reduce the scope for FDI diversion. It is hardly conceivable that EU investors w ill give up important markets in Latin America simply because o f new market opportunities in CEECs. Rather, one can expect additional FDI if different regions all offer favourable market prospects.28 This view is supported by the recent boom of FDI in the services sector o f various countries in Latin America, Central and Eastern Europe and other regions, after these countries had joined the world-wide trend towards privatization and deregulation o f services.
It follows that, as far as market-seeking FDI is concerned, the continuation o f the recent recovery in FDI flows to the region will depend on the economic prospects o f Latin American countries, rather than on the future course o f EU integration. This is not to ignore the fact that the prominence of market-seeking FDI involves certain risks for Latin America. Indi-
26 Examples are: Bolivia (76%), Chile (59%), Colombia (61%) and Ecuador (51%). The degree to which EU investors are engaged in the primary sector of these countries cannot be identified from the available data.
27 The share of the services sector in total FDI stocks in 1994 was around 40% in Argentina, Brazil and Mexico, while it was about 25% in Chile (ID B /IR EL A , 1996, table 8). Moreover, recent FDI flows to various Latin American countries were heavily concentrated in services, largely because of privatization programmes (Nunnenkamp, 1997a).28 Additional FDI may be associated with relatively lower domestic investment in EU countries. In contrast to FDI diversion, this might be called “ FDI creation” (by analogy to trade creation).
POSSIBLE EFFECTS OF EUROPEAN UNION WIDENING ON LATIN AMERICA • PETER NUNNENKAMP

C E P A L R E V I E W 6 4 • A P R I L 1 9 9 S 125
rectiy, it may put Latin American economies at a disadvantage in competing for the third type o f fdi, i.e., efficiency-seeking investments.
In the era o f globalization, efficiency-seeking FDI is considered to be the hallmark o f the response of multinational corporations to the changing international environment (UNCTAD, 1996, p. 97), The size of host country markets, as one o f the most important traditional FDI determinants, is expected to decrease in relative importance. Under such conditions, Latin America may be handicapped vis-à-vis other regions.
Globalization may shift the FDI balance further towards Asia. Various Asian countries are well- known for their world market orientation which puts them in a favourable position to compete for efficiency-seeking fdi. In contrast, Latin American countries may still be suffering from insufficient international competitiveness o f manufacturing industries that were established under conditions o f import substitution. At the same time, the recent move towards trade liberalization in Latin America tends to weaken the incentive for foreign investors to undertake market-seeking FDI in this region in order to jump over protectionist fences.
It may also prove more difficult for Latin America than for CEECs to attract efficiency-seeking FDI. The recent surge o f market-seeking FDI in CEECs occurred when these host countries liberalized their foreign trade regimes substantially. Hence, the existing FDI stock in the CEECs is probably more in line
with these countries’ comparative advantages than in the case o f Latin American countries. This could render it relatively easy for CEECs to switch from market-seeking to efficiency-seeking FDI. CEECs have two additional advantages in attracting efficiency- seeking fdi: their geographical proximity, which helps them in competing for this type o f fd i from eu countries, as distance typically involves higher transaction costs, and their preferential access to EU markets.
It is in the area o f efficiency-seeking fd i that the largest potential for fd i diversion exists. Under conditions o f globalization, overall fd i prospects seem to depend increasingly on the attractiveness o f a given location for efficiency-seeking fdi. If this is so, the Latin American economies have little choice but to prepare themselves for fiercer world-wide competition for this type o f investment. Important steps have already been taken by various Latin American countries to reduce the risk o f FDI diversion. Comprehensive reform programmes with regard to macro- econom ic stabilization and structural adjustment were instrumental in the recent recovery of fd i flows to Latin America (Nunnenkamp, 1997a). The close link between reform-mindedness and FDI inflows supports the view that the future prospects o f Latin America in attracting efficiency-seeking FDI depend primarily on the economic policies followed in this region, rather than on the deepening and widening of EU integration.
IVFuture prospects
1. Towards more significant trade diversion?
Recent trade and FDI patterns suggest that EU widening to the East has only limited effects on Latin America. As regards trade, the CEECs and the Latin American countries have targeted different markets for their exports to the EU. The resulting surprisingly small trade overlaps mean that there is likely to be relatively little trade diversion due to EU integration which negatively affects Latin America. This picture may change somewhat when several CEECs become full members o f the EU. However, the picture should not be dramatically different in the future, consider
ing that possible changes work in opposite directions, so that their effects on trade diversion may cancel each other out:
- On the one hand, the potential for trade diversion will further decrease once the Uruguay Round agreements are fully implemented. Preference margins for CEECs will then be reduced, limiting trade diversion in “sensitive” areas such as textiles and clothing. Furthermore, trade overlaps may become even smaller in the future, if the ceecs succeed in making better use of their relatively favourable endowment o f human capital and skilled labour. With continued investment to replace the obsolete capital stock inherited from
POSSIBLE EFFECTS OF EUROPEAN UNION WIDENING ON LATIN AMERICA • PETER NUNNENKAMP

126 C E P A L R E V I E W 6 4 • A P R I L 1 9 9 8
the socialist past, the comparative advantages o f the CEECs will shift towards skill-intensive lines o f production. Rising wages in the c e e c s during the process o f economic transformation and EU integration will reinforce structural change towards more sophisticated manufacturing industries. The supply by the CEECs on EU markets may then become increasingly complementary to Latin American supply, rather than taking its place.
- On the other hand, full EU membership of some CEECs may induce more trade diversion. Remaining trade barriers between these CEECs and current EU members will be removed, but at the same time the CEECs will be required to reduce their (relatively high) protection against non-EU members to the (relatively low) level of external protection of the current EU. Taken together, the free trade area requirement and the customs union requirement may give rise to considerable structural adjustment needs in the new CEEC members of the European Union. Against this backdrop, these countries will probably appeal to the EU to consider their demands for higher protection when it comes to trade negotiations with nonmembers. An extended EU may thus slow down the process of external trade liberalization, especially during the period of structural adjustment by the CEECs to the import pressures from both current EU members and non-EU countries (Langhammer and Nunnenkamp, 1993).
It is almost impossible to draw up a balance between these opposing influences, let alone assess the net impact on particular external trading partners of the e u such as Latin American economies. Even if trade diversion becomes more likely, new opportunities for trade w ill emerge simultaneously. Latin America may be adversely affected i f the EU becomes more reluctant to liberalize extra-EU trade, but at the same time Latin American suppliers w ill benefit from better access to still highly protected markets of CEECs, once the latter are members o f the customs union, and this may help increase the extremely low share o f Central and Eastern Europe in total Latin American exports (1994: 0.3%, excluding the former USSR (United Nations, 1996)).
2. Towards stronger complementarity betweentrade and FDI?
As in the case o f trade, there are certain risks that Latin America w ill be affected by FDI diversion. For
several reasons, however, such risks should not be overrated. World-wide fd i flows have never been -and are most unlikely to becom e- a zero-sum game. The recent surge o f FDI flows to various host countries and regions, including many Latin American econom ies, indicates that new investment opportunities induce additional fd i, rather than leading to f d i diversion. Fears o f such diversion tend to be exaggerated, failing to take into account the fact that overall FDI is far from being a uniform phenomenon. Different motivations underlie resource-based FDI, market- seeking FDI and efficiency-seeking FDI. The threat o f FDI diversion is essentially restricted to efficiency- seeking FDI, but it may be expected that this type o f investment will become increasingly important in the era o f globalization.
The current trend towards globalized production and marketing may have important implications for the nexus between trade and fd i (see also u n c ta d , 1996, chapter IV), To a certain extent, and under specific conditions, f d i can still be a substitute for trade. For instance, fd i may follow trade once a certain market share has been achieved through exports, or f d i may be used to surmount import barriers. Brazil, for example, appears to have been the largest recipient o f market-seeking FDI among developing countries prior to the foreign debt crisis, mainly because its import substitution policies hindered trade. However, the more traditional sense o f substitutability of FDI for trade is challenged by the trend towards globalization. It would appear that multinational enterprises increasingly view trade and FDI as complementary modalities o f serving markets and organizing production. Geographically dispersed manufacturing and the combination o f markets and resources through FDI and trade are becoming an important part o f the world economy:
By means of FDI, multinational enterprises slice up the value chain and capitalize on international cost differences, locating production processes where the relevant comparative advantages are highest.
- At the same time, multinational enterprises account for about two-thirds o f world exports of goods and non-factor services ( u n c ta d , 1995, p. 193). About half the exports o f multinational enterprises are intra-firm exports. Moreover, the share o f intra-firm trade in the total trade o f multinational enterprises appears to be on the rise. Empirical analyses reveal a positive correlation
between trade flows and FDI flows, which indicates
POSSIBLE EFFECTS OF EUROPEAN UNION WIDENING ON LATIN AMERICA • PETER NUNNENKAMP

C E P A L R E V I E W 6 4 • A P R I L 1 9 9 6 127
that complementarities between trade and FDI have predominated over substitution effects (Nunnenkamp, Gundlach and Agarwal, 1994, pp. 81 et seq.). FDI is positively correlated not only with exports o f the investors’ home countries to host countries, but also with exports o f host countries to the home countries. Hence, rather than replacing trade with developing countries, the recent boom of FDI is likely to be accompanied by intensified trade relations.
3. How can we achieve closer economic relations?
The complementarity between trade and f d i not only helps developing countries in getting access to resources for strengthening their production capabilities, but also in penetrating world markets with products where they enjoy comparative advantages. They must meet various requirements, however, in order to becom e involved in globalized production and thereby improve their prospects o f attracting FDI and penetrating world markets. Cross-country analyses suggest that the following factors should be of priority concern: sustained macroeconomic stability, openness to world markets, and accumulation of physical and human capital (Sachs and Warner, 1995; Gundlach and Nunnenkamp, 1996; Nunnenkamp, 1996).
This means that the question o f whether Latin American countries’ economic relations with the e u will prosper depends primarily on the economic policies pursued by them. Various countries of the region are in the process o f restoring their international competitiveness and attractiveness for FDI, but major challenges remain. W hile the bulk of FDI has tradi
tionally been market-seeking in Latin America, the region can no longer rely on local or regional market size as a sufficient incentive for FDI inflows. In order to benefit from complementarities between trade and fd i, Latin America must improve its attractiveness for efficiency-seeking fd i . A critical question is whether manufacturing industries which foreign investors helped to establish under conditions o f import substitution can become competitive by international standards. Transport equipment and electronics are cases in point, since intra-firm trade plays a particularly prominent role in these industries (UNCTAD, 1995, p. 197). In the short term, Latin America faces a dilemma: trade liberalization may have negative effects on traditional forms o f fd i, as it weakens the incentive to make such investm ents in order to surmount import barriers, but in the longer run, liberalization o f trade and deregulation o f f d i are instrumental to Latin America’s integration into globalized production, as they enhance specialization according to comparative advantages.
Sustained economic policy reforms may be regarded as the contribution that Latin America must make in order to foster better economic relations with the EU. The EU’s most important contribution would be to ensure open markets for non-members, including the Latin American countries, and to play a constructive role in maintaining a liberal multilateral trading system. EU widening to the East does involve some risk for the Union’s external trade liberalization, but the threat of more inward-looking policies of the EU may be still greater if EU integration does not proceed smoothly.
(Original: English)
Bibliography
Agarwal, J. P. (1994): Impact o f "Europe Agreements” on FDI in developing countries, Working Papers, No. 640, Kiel, Germany, Kiel Institute of World Economics.
Agarwal, J. P., U. Hiemenz and P. Nunnenkamp (1995): European integration: A threat to foreign investment in developing countries ?, Discussion Papers, No. 246, Kiel, Germany, Kiel Institute of World Economics.
Agarwal, J. P., R. J. Langhammer, M. Lticke and P. Nunnenkamp (1995): Export expansion and diversification in Central and Eastern Europe: What can be learnt from East and Southeast Asia?, Discussion Papers, No. 261, Kiel, Germany, Kiel Institute of World Economics.
EU (European Union), EUROSTAT (Statistical Office) (1995): External Trade: System o f Generalized Tariff Preferences, Luxembourg.
European Commission/UNCTAD (United Nations Conference on Trade and Development) (1996): Investing in Asia’s dynamism, Luxembourg, European Union Direct Investment in Asia.
Gundlach, E. and P. Nunnenkamp (1996): Some consequences o f globalization for developing countries, Working Papers, No. 753, Kiel, Germany, Kiel Institute of World Economics.
Hiemenz, U., E. Gundlach, R. J. Langhammer and P. Nunnenkamp (1994): Regional integration in Europe and
POSSIBLE EFFECTS OF EUROPEAN UNION WIDENING ON LATIN AMERICA • PETER NUNNENKAMP

128 C E P A L R E V I E W 6 4 * A P R I L 1 0 9 6
its effects on developing countries, Kiel Studies, No. 260, Tübingen, Germany.
IDB (Inter-American Development Bank)/1RELA (Institute for European-Latin American Relations) (1996): Foreign Direct Investment in Latin America in the 1990's, Madrid.
IMF (International Monetary Fund) (several issues): Balance o f Payments Statistics Yearbook, Washington, D. C.
Koester, U. (1996): EU agricultural policy towards CEECs: The impact on LDCs, in A. Kuyvenhoven, O. Me- medovic and N. van der Windt (eds.), Transition in Central and Eastern Europe: Implications for EU-LDC Relations, Dordrecht, Netherlands.
Langhammer, R. J. (1994): Latin America’s competitive position vis-à-vis Central and Eastern Europe. Comment on Andräs Inotai, in B. Fischer, A. von Gleich and W. Grabendorff (eds.), Latin America’s Competitive Position in the Enlarged European Market, Baden-Baden, Germany.
Langhammer, R. J. and P. Nunnenkamp (1993): Implications o f the Europe Agreements for Latin America, Kiel, Germany, Kiel Institute of World Economics, mimeo.
Michalet, C. A. (1997): Investment strategies o f multinational corporations and the attractiveness o f host countries. The impact o f the opening o f Central and Eastern Europe on the location o f foreign direct investment, Washington, D. C., World Bank, Foreign Investment Advisory Service (FIAS), mimeo.
Nunnenkamp, P. (1996): Winners and losers in the global economy: recent trends in the international division o f labour and policy challenges, Discussion Papers, No. 281, Kiel, Germany, Kiel Institute of World Economics.
(1997a): Foreign direct investment in Latin Americain the era of globalized production, Transnational Corporations, vol. 6 , No. 1, New York, United Nations.
(1997b): Herausforderungen der Globalisierung fürBrasilien, Die Weltwirtschaft, N° 1.
Nunnenkamp, P., E. Gundlach and J. P. Agarwal (1994): Globalization o f production and markets, Kiel Studies, No. 262, Tübingen, Germany.
OECD (Organization for Economic Cooperation and Development) (1993): Summary Record o f the Meeting o f the Advisory Group on Investment, Warsaw, 7-8 July, mimeo.
(1996): International Direct Investment StatisticsYearbook, Paris.
(several issues): Foreign Trade by Commodities.Series C, Paris.
Piazolo, D. (1997): Trade integration between Eastern and Western Europe: Policies follow the market, Journal o f Economic Integration, vol. 12, No. 3.
Sachs, J. D. and A. Warner (1995): Economic convergence and economic policies, Working Papers, No. 5039, Cambridge, MA, National Bureau of Economic Research, Inc. (NBER).
UNCTAD (1995): World Investment Report, 1995. Transnational Corporations and Competitiveness, Geneva. United Nations publication, Sales No. E.95.Ü.A.9.
(1996): World Investment Report, 1996. Investment,Trade and International Policy Arrangements, New York. United Nations publication, Sales No. E96.II.A.14.
United Nations (1996): Monthly Bulletin o f Statistics, vol. 50, No. 5, New York, May.
WTO (World Trade Organization) (1995): Trade Policy Review: European Union. Report by the Secretariat, Document WT/TPR/S/3, Geneva.
POSSIBLE EFFECTS OF EUROPEAN UNION WIDENING ON LATIN AMERICA • PETER NUNNENKAMP

Jonathan R. Barton
School o f Development Studies, University o f East Anglia, Norwich, United Kingdom.
C E P A L R E V I E W 64 129
The North-South dimensionof the environmental and
cleaner technologyindustries
The environment industry, which includes a wide range of products and services relating to the monitoring, treatment, control and management of industrial and domestic pollution, has grown rapidly during the 1980s and 1990s as a response to environmental regulations. Due to the relatively early application of these regulations in the United States, Europe and Japan, these areas have become competitive producers and exporters of environmental products and services. As the industrial sector has developed, environmental awareness has been raised and competition and international trade in the environment industry have expanded. There is now a clear North/South dimension in international patterns of development of the industry and its trade. Whilst environment industries were established to deal with waste reduction and disposal strategies, there has also been a drive towards cleaner production. The European environmental and cleaner technology industries are reviewed in order to establish their competitiveness and the shift between the two different approaches to environmental management: amelioration by environmental industries and prevention by cleaner process and production technologies. In this respect, Latin American provides a contrasting example. The nature of the expansion of the industrial environmental management sector in the region is questioned, particularly with regard to the composition of the sector and the way it is interpreted in different countries. The paper suggests that the environment industry and cleaner technologies should be understood as industries rather than as unquestionably “environmentally positive” sets of products and services. Hie extent to which these industries reveal an information and technology gap in environmental management is also analysed. This gap may, on the one hand, assist environmental managers in the South, but on the other it may lead to a condition of environmental management dependence.
A P R I L 1 9 6 6

130 C E P A L R E V I E W « 4 • A P R I L 1 f l 9 8
I
The relationship between the environment and industry
This relationship has been central to many o f the debates on Latin American development since 1972, when the Stockholm Declaration raised consciousness o f the impacts o f environmental contamination. In the twenty-five years since that Declaration, Latin America’s urban environments have provided prominent case studies in such areas as environmental degradation and innovative environmental policies. Environmental stress has been pivotal in debates relating to urban planning, health and econom ic development. For these reasons, the nature o f the changes in the environment/industry linkage are especially deserving o f attention now, in the mid- 1990s, since after twenty years o f relatively unchecked industrial pollution, the last five years have brought considerable developments in the environment/industry relationship. The principal changes relate to the emergence o f “environment industries” and the extent to which these industries can bring about the promotion o f cleaner production in Latin America’s “dirtier” industries.
The emergence o f environment industries, especially those firms engaged in the production of goods and services aimed at the reduction of contamination (principally “end-of-pipeline” technologies), was observed throughout the world during the 1980s as a response to tighter regulatory systems. While the United States, Japan and Germany have been the “first movers” in terms o f environment industry development, the role o f the environment industry in Latin American industrial development in the next century w ill be a significant one, both in terms of the provision o f goods and services and also improvements in Latin American environmental quality.
This paper w ill address the changes that have taken place in the environment/industry relationship over time and stress the important role that environment industries w ill play in the early part o f the next century and the need for Latin American firms and governments to be aware o f these developments and to respond to them. If the environment industries’ goods and services continue to be supplied mainly by
foreign firms, the future costs for Latin American firms w ill have significant impacts on export product prices and w ill threaten the econom ic successes o f the export-led models.
Whilst the debates relating to environmental regulation and its effects on industrial competitiveness continue to divide industrialists and environmentalists, the impacts o f those regulations -a s well as o f failure to regulate- are being experienced on a global basis.1 The links between econom y and environment, as w ell as the social consequences of those links, are fully recognized by multilateral institutions (Munasinghe and Cruz, 1995). A significant outcome of the environmental regulation o f industrial sectors has been the emergence o f a vast sector that has become known as the environment industry. This industry has expanded to accommodate the demands of increasing numbers of industries that must take heed of environmental policy recommendations; the European Union has already issued 160 Directives in this respect, for example (European Commission, 1994a). In order to meet the new regulations, industries have had to invest significantly in pollution abatement and control (see table 1).
In many ways the development o f the environment industry and cleaner technologies, and the debates on them, are an extension o f previous debates relating to industrial relocation to “pollution havens”, and “industrial flight” more generally (see Stafford, 1985; Hesselberg and Knutsen, 1994). These debates were concerned with the movement o f “dirty” industries out of regions with strict environmental regulations to regions with slacker regulations. There was a clear North/South dimension to these debates, and there continues to be a strong similar dimension to the environment industry and the diffusion o f cleaner
1 This paper, forms part of the European Commission’s Fourth Framework Project on Environment and Climate, entitled “Environmental regulations, globalization of production and technological change." The author wishes to express his thanks to Rhys Jenkins for his comments.
THE NORTH-SOUTH DIMENSION OF THE ENVIRONMENTAL AND CLEANER TECHNOLOGY INDUSTRIES • JONATHAN R. BARTON

C E P A L R E V I E W 6 4 • A P R I L 1 9 6 8 131
Pollution abatement and control expenditure(As a percentage o f gross fixed capital formation)
TABLE 1
Public sector Business sector Total % of GDP
1985 1990 1985 1990 1985 1990 1990
United States 1.1 1.4 2.0 2.0 3.1 3.4Japan 2.9 2.6 0.5 0.3 3.4 3.0 -
Germany 1.9 2.1 1.6 1.4 3.5 3.5 1.6France 0.8 0.7 0.4 0,4 1.2 1.1 1.0Italy 1.0 0.9 - - - - 0.8Austria 2.7 - - 1.0 - . -
Denmark 1.0 1.8 - - - . 1.1Netherlands 2.2 1.0 1.0 1.3 3.2 2.3 1.4Portugal 1.0 1.0 0.5 0.7 1.5 1.6 0.8Spain 0.6 0.8 - - - - 0.6Sweden - - 0.8 1.2 - - -
Source: OECD (1993a) and European Commission (1994a).
technologies, even though research has revealed that generally speaking “dirty” firms have not been forced to relocate in response to regulatory pressures (Leonard, 1984 and 1988),
W hilst environmental regulations in North America, Western Europe and Japan sought to reduce contamination and, it was thought, might lead to the expulsion o f “dirty” industries, the environment industry firms which developed to respond to the demands o f the regulated industries became “first movers” and are now well placed to benefit from the globalization o f environment regulation policies. For this reason, the emergence o f strong European environmental industries and cleaner technology initiatives during the 1980s and 1990s has led to potential advantages in terms o f trade in European environmentally-based goods and services. It was in Germany and the Netherlands that the environment industries were promoted most keenly during the 1980s, following the swift adoption o f new standards, a sharp increase in public spending on R&D, and aggressive strategies o f firms in the environment market (European Commission, 1989). These countries continue to be market leaders in environment- related goods and services.
The notion o f “first movers” is seen to be integral to the environment and cleaner technology industries. Much o f the R&D in the sector is based on the realization that good returns on capital investment w ill be forthcoming in the longer term as regulations becom e more widespread and stricter, thus requiring improved technologies and management strategies. To be a “first mover” is to benefit from
competitive advantages in the marketplace and is considered to be a fundamental factor behind the development process. Since the high costs o f R&D have been prohibitive in many areas o f the world where regulatory frameworks remain lax or not intensively implemented, the “first mover” advantages have accrued to firms based in countries which had strict regulations from an early stage, such as the United States, Germany and Japan. These firms, having risked capital in R&D in the stages o f innovation, are now able to profit from growing demand as similar regulations elsewhere in the world have prompted a need for their goods and services. The link between regulatory models and environment industry trade is very strong: thus, for example, the United States regulatory system was adopted in M exico, and United States firms have supplied that market.
With regard to cleaner technologies, the costs o f R&D are often prohibitive since, in many cases, an overhaul o f the entire production system is required in order to assess the areas o f greatest possible benefits. Nevertheless, the advantages o f being a “first mover” remain the same, and it is likely that cleaner systems will be increasingly in demand in the near future as public environmental pressure works through the political apparatus into regulatory policies. There is little likelihood o f continued high demand for “end-of-pipeline” technologies, due to increasing waste disposal costs and the problem of competition from firms that have low waste output; internal factors such as product quality, raw material costs and energy requirements also need to be considered in this respect (Rajagopal, 1992). Investment
THE NORTH-SOUTH DIMENSION OF THE ENVIRONMENTAL AND CLEANER TECHNOLOGY INDUSTRIES • JONATHAN R. BARTON

132 C E P A L R E V I E W 6 4 • A P R I L 1 9 9 8
in the environment industry is a recognition o f the need to keep pace with the rapid changes taking place in environmental regulation and management; in Germany, for example, the environment industry invests an average o f 3.1% of its turnover in R&D, compared with only 1.8% in manufacturing generally (Vickery and Iarrera, 1996). It is likely that Germany will maintain its predominant position in Europe within this sector.
The environment industry is a supplier o f technology and associated services such as consultancy, maintenance and upgrading. The industry is both highly sophisticated yet “low-tech” in terms o f the products supplied in response to the broad range of industrial and environmental requirements: low-tech components such as simple lagging o f existing equipment in order to reduce heat waste or water loss are as important as hi-tech equipment such as flue gas desulphurization plants. “Low” technology is an important theme within the environment industry, especially in the context o f the South. For example, a report by the United States International Trade Commission (1995, pp. 6-22) on the United States municipal and industrial water and wastewater technology industry revealed that United States products were often seen as too sophisticated and expensive, and that less sophisticated approaches might be appropriate in many cases for export to less developed economies.
Cleaner technology is different from the activities o f the environment industries in that it seeks to reorganize the production process in order to reduce waste, in contrast with the environment industries’ focus on dealing with waste that remains from industrial processes. Although many definitions class these two areas o f industrial environmental management together, for the purposes o f this paper they will be dealt with as separate approaches, because o f their fundamentally different positions regarding how waste and contamination should be controlled.
In terms o f growth, the environment industry (in this case including cleaner technologies) is one o f the fastest-growing sectors in the global economy. In 1992, Bill Clinton noted that the environmental goods and services industry was “The only sector of our economy that has shown an unexpected level o f growth in the past five years” (Corriere della Sera, 10 November 1992, quoted by Malaman, 1996). Similar growth rates have also been experienced in Europe and Japan. Clinton followed up this statement in 1993 by directing United States government agen
cies to assess environmental technologies and their competitiveness and to develop trade, financing and technical strategies to increase environment industry exports and jobs (United States Department o f Commerce, 1994a and b). This strong State support for a surging industrial sector reveals the perceived current and future importance o f the environment industry within the global economy.
The environment industry is centered around the production o f pollution control equipment and waste treatment and disposal. These two areas give rise to the nine principal subdivisions of the industry’s activities: waste management; wastewater treatment; air pollution control; energy management; marine pollution control; environmental monitoring and instrumentation; environmental services; noise and vibration control; and contaminated land rehabilitation. Together, the concerns operating in these areas have built up a US$ 200 billion industry (1990) that is expected to grow 50% by the year 2000 (OECD, 1992a). The World Bank’s International Finance Corporation doubles the estimate for the year 2000, thus putting the environmental industry’s annual market higher than that of the chemical industry ( ifc , 1992; Karliner, 1994).
The delineation o f the subsectors o f the environment industry listed above is a thorny problem which has preoccupied those involved in research relating to this sector. The 1992 OECD report on the industry (OECD, 1992a), which was the first to review the industry as a whole, was hampered by the difficulties of how the industrial sector was interpreted and measured by different member States o f the OECD (see box 1). This ongoing problem of definition continues to make data analysis problematical. The Washington Meeting on the environment industry in October 1994 also struggled with these difficulties. Whilst authors are still trying to clarify how they and particular States interpret the terms “environment industry”, “environmental industry”, “eco-business” or “eco-industry”, the difficulties o f comparative analysis w ill remain highly complex (see Noble, 1996; Gaston and Santiago, 1996). For example, the definition put forward by the European Commission (1994) is broad, but so extensive as to be difficult to work with: “Eco-industries ... may be described as including firms producing goods and services capable o f measuring, preventing, limiting or correcting environmental damage such as the pollution o f water, air, soil, as well as waste- and noise-related problems. They include clean technologies where pollution and raw material use is being minimized.”
THE NORTH-SOUTH DIMENSION OF THE ENVIRONMENTAL AND CLEANER TECHNOLOGY INDUSTRIES • JONATHAN R. BARTON

C E P A L R E V I E W 6 4 • A P R I L 1 6 9 8 133
Box 1D EFIN ITIO N S O F TH E EN VIRONM ENT INDUSTRY IN SELECTED COUNTRIES
United States Government - “Environmental Technology”“A technology that advances sustainable development by reducing risk, enhancing cost effectiveness, improving process efficiency, and creating products and processes that are environmentally beneficial or benign. The word “technology” is intended to include hardware, software, systems and services.”
Japan, Ministry of International Trade and Industry -“Eco-business”“Industrial sectors with a potential to help reduce environmental burdens”
Australian Industry Commission - “Environmental waste management equipment, systems and services industry”“A diverse collection of industrial producers and service providers encompassing any entity providing technology or service-related solutions to solid, liquid, or gaseous waste management problems. Thus it embraces parts of product-based industry sectors engaged in engineering, construction, design, scientific instrumentation and consultancy services.”
Netherlands (Association of Suppliers of Environmental Equipment)“Companies producing, supplying and/or installing (parts of) equipment/machines for the abatement of environmental damage (excluding noise hindrance) as well as companies advising on environmental issues”
Source: O ECD (1993a).
The difficulties o f definition become particularly complex when die issue o f clean technologies is considered, since it is difficult to separate these technology improvements from other improvements (OECD, 1995). The o e c d ’s 1992 definition did not include the clean technology dimension, however the division between environment industry and clean technology is not a transparent one. The definition varies widely according to sources, due to the relatively recent association o f environmentally-related products and services with large-scale industry and international trade.
The wide-ranging nature of the products and services involved, from consultancy and monitoring to “end-of-pipeline” technologies and cleaner production technologies, complicates the international trade picture even further. More recently, the OECD (1996a) has delineated the industry into three areas: environmental equipment, environmental services and integrated environmental technologies (cleaner industrial processes and products) (see box 2 and table 2). In this way, the OECD makes the separation o f cleaner technologies explicit. At the national level, the United States, Canada and Japan have broad definitions of the environment industry whilst Italy, Norway and Germany, for example, have chosen narrower ones (see Vickery and Iarrera, 1996); in Japan, the definition is so wide-ranging that all municipal services are included, The reasons for such divergent definitions are connected with the rapid innovations in environment industries and the wide range o f services, equipment and applications that are used by industry. Since the industrial make-up o f national economies varies con-
Box 2BR EA K D O W N OF THE EN V IRON M EN T INDUSTRY
Environmental equipmentWaste-water treatment equipment Waste management and recycling equipment Air pollution control equipment Noise reduction equipment Monitoring instruments and scientific, research and
laboratory equipment Natural resource conservation/protection and urban
amenities
Environmental services Waste-water operations Waste handling facility operations Noise reduction operations Analytical, monitoring and related conservation and
protection services Technical and engineering services Environmental research and development Environmental training and education Accounting and legal services Consulting services Other environmental business services Others: eco-tourism
Cleaner technologies: Integrated environmental technologiesCleaner production equipmentEfficient energy generation and conservation equipment Eco-products
Source: OECD (1996a).
THE NORTH-SOUTH DIMENSION OF THE ENVIRONMENTAL AND CLEANER TECHNOLOGY INDUSTRIES • JONATHAN R. BARTON

134 C S P A L R E V I E W 6 4 • A P R I L 1 9 9 8
Main components of the environment industry, 1990(Percentages)
TABLE 2
Billions of ECU EstimatedN.America Europe Japan Total, OECD -------------------------- growth per
1990 2000 annum (%)
Equipment/related services 74 76 79 76 119 172 5.0Water and effluent treatment 24 34 22 29 47 65 4.0Waste management 25 15 22 21 31 49 6.4Air quality control 12 17 25 15 23 33 4.4Other (land rehabilitation, noise) 13 10 10 11 17 25 5.1General services 26 24 21 24 37 62 7.4Total 100 100 100 100 156 234 5.5
Source: European Commission, 1994a, based on OECD data.
siderably, the range o f goods and services inducted within the definition o f “environment industry” has also been variable.
There is clearly a need for a universal definition that can be applied for comparative purposes, but the difficulty o f classifying what goods and services are explicitly environmentally related, rather than industrial per se, w ill be a considerable problem. There is a great danger that almost all innovations that lead to reductions in waste and contamination w ill be labelled environmental, even when these reductions are incidental rather than o f a priority nature. At the Washington M eeting on the environment industry in 1994, it was acknowledged that consistent data collection had hampered the analysis o f the industry and that one way forward would be the identification of core and non-core groups o f products (Vickery and Iarrera, 1996). The core group would include producers o f “end-of-pipeline” and clean-up equipment and suppliers o f associated environmental services, as well as services with a clear single environmental purpose. The non-core group would include cleaner
products and cleaner technologies, as well as intermediate products (so-called multi-use products).
A working definition used in this paper is that the environment industry is a supplier o f technology and its associated services such as consultancy, maintenance and upgrading. It is at once highly sophisticated and “low-tech” and is one o f the fastest expanding sectors in the global economy. Its raison d ’être is the reduction and disposal o f waste from the final stages o f industrial production. Cleaner technologies are associated with the environment industry but can be differentiated from it in terms o f approach, in that cleaner technologies seek to reduce waste by reviewing and altering the entire industrial process, thus reducing the need for “end-of-pipeline” strategies. The United States provides the largest environment industry market at 39% of the global market, while the European Union accounts for 24% of the global market, with Germany predominating with 36% of the EU share. In terms o f potential growth, Canada in particular has been increasing its environment industry’s share o f international markets (Fouillard, 1992; Higgins, 1996).
IIThe response to pollution regulation
Regulation o f “dirty” industries during the 1970s led to the adoption o f “end-of-pipeline” technologies and treatments for the most part. These technologies sought to reduce the em ission o f contaminants rather than change the production process and reduce the production o f pollutants. The demand for “end-of- pipeline” technologies to curb emissions and respond
to legislative regulations on pollution control resulted in the emergence o f supplier firms. These firms were initially involved in other mechanical and engineering activities but responded to this new demand through diversification, or in many cases through the establishment o f new small firms and consultancy offices. Later, some o f the largest multinational firms
THE NORTH-SOUTH DIMENSION OF THE ENVIRONMENTAL AND CLEANER TECHNOLOGY INDUSTRIES • JONATHAN R. BARTON

C E P A L R E V I E W « 4 • A P R I L 1 9 9 8 135
Global environment market(Billions o f U.S. dollars) a
TABLE 3
OECD ECOTEC ETDC Environment Business International
1990 2000 1990 2000 1990 2000 1990 2000
North AmericaUnited States 78 113 85 125 115 185 134 180Canada 7 12 14 18 7 14 10 17Mexico - - 1 5 3 18 1 2Subtotal 85 125 100 147 125 217 145 199
Latin America . _ 2 5 _ _ 6 10Europe
France 10 15 - - 10 30 - .
Germany 17 23 60b 89b 21 65 94 132United Kingdom 7 11 - - 11 28 - -
Rest of European Union 12 20 - - 15 48 - -
Rest of Western Europe 5 9 - - 6 17 - -
Eastern Europe/NewlyIndependent States 15 21 5 9 15 25 14 27Subtotal 66 99 65 98 78 213 108 159
Asia-PacificJapan 24 39 30 44 24 65 21 31Australia/New Zealand 2 3 - - 2 4 3 5Taiwan - - - 5 30 - -
Hong Kong - - 5° 12e - 3 - -
South Korea - - - 1 8 - .
Rest of Asia-Pacific - - - 14 28 6 13China - - 2 1 5 . - .
India - - 1 2 - . - .
Subtotal 26 42 85 63 46 138 30 49Rest of World 21 34 - - 6 12 6 9Total World 200 300 210 320 255 580 295 426
Source; OECD, 1996aa The categorisation of environment products and services differs between the particular sources, especially in terms of the inclusion, exclusion and definition of “clean” technologies. b All Western Europe. c East and South East Asia.
saw the competitive advantages o f supplying pollution control equipment. Joseph Karliner (1994), for example, points to the Dow Corporation and DuPont as two significant suppliers o f pollution control equipment in the United States. He also mentions the specialist firm o f Waste Management Technologies (WMX), which accounts for approximately 10% o f the U.S. environment industry’s earnings and rivals the aircraft manufacturer Lockheed in size. These large firms have been able to expand into international markets far more easily than the smaller firms, thanks to their existing organizational structures. For example, w m x has rapidly increased its operations in Europe since 1991, especially in the United Kingdom and France. In Europe, the German firm Deutsche Babcock was an early market leader, with a turnover
of e c u 650 million as early as 198S, but when this is compared with w m x’s turnover o f e c u 3 billion, the difference between the United States and European industries becomes more apparent (European Commission, 1989 and 1994a).
In terms o f geography, the “first mover” advantage has led to the emergence of specialized environmental industry firms in those countries with early environmental regulation. Since environmental movements developed most strongly in the United States and Europe, it was there that the early regulation gave rise to environment industry development (see table 3). Japanese firms also emerged at the same time in response to air pollution problems. In Europe, the water and effluent treatment technology market is the best established within the eu environmental in
THE WORTH-SOUTH DIMENSION OF THE ENVIRONMENTAL AND CLEANER TECHNOLOGY INDUSTRIES • JONATHAN R. BARTON

136 C E P A L R E V I E W 6 4 • A P R I L 1 9 9 8
dustry, providing 34% o f its output in value terms (European Commission, 1994a).
The outcome of the growth o f specific core areas and specialization has been that certain countries have strong firms in particular core areas o f the industry. In Japan, Mitsubishi and Hitachi lead in air pollution control equipment, whilst European firms have a “first mover” advantage in waste water treatment (the Dutch in contaminated land rehabilitation), and North American firms in waste treatment. The emergence o f these firms, which now have strong comparative advantages in terms of R&D and production experience within the global marketplace for environmental goods and services, has been a direct response to early environmental regulation in specific countries. Consequently, it may be observed that there are two processes under way within the global environment industry: one is the specialization o f firms based in particular countries in areas of the environment industry; the other is the geographical nature o f the commercial relations that have developed in the trade and transfer o f environmental goods and services. With regard to the first-named process, certain countries have sought to occupy niches in the global marketplace for environment goods and services, often with strong State support. As for the second process, particular countries have sought to dominate the trading relations o f particular regions in the environmental industry. The most obvious exam
ples o f this latter process are the promotion o f United States environment goods and services in Latin America, and the similar prevalence of Japanese products and services in South East Asia (see Ecotec Research and Consulting Ltd., 1994), In the case o f Japan, the government’s environmental strategy entitled the “Environmental Vision o f Industry” focused on improving environmental performance in fifteen targeted industrial sectors. The outcome has been that the expertise developed under this strategy can now be traded abroad.
A s environmental regulations lead to a transition from “end-of-pipeline” technologies to fundamental changes in production processes, the firms in the North (essentially in North America, W estern Europe and Japan) have sought to benefit from the increasing demand for environment goods and services in the South as environmental regulations begin to be enforced in response to (mainly international) environmental pressures. Karliner (1994, p. 60) notes that this is the third stage in a longer process o f exporting toxic industrial developm ent to the South: “firstly, econom ic ‘developm ent’ is exported through free trade policies and financing by multilateral and bilateral agencies; secondly, environmental regulations to control the excesses of this developm ent are introduced; finally, ‘environm ental’ technology and services are exported to service these regulations.”
Competition and trade In the environment industry
The environment industry is not homogeneous and is difficult to compare with many industrial sectors. Unlike the iron and steel industry, where the products are varied but share the same materials, the environment industry is much more difficult to unravel, particularly in the separation o f products and services. For this reason, the development o f the sector has not been uniform and technological, geographical and investment factors have followed different trajectories in the different core areas o f the industry. It is the largest core areas -w aste water treatment, waste management and air pollution control- that have aroused the greatest interest in terms o f technological
change and investment. Other sectors, due to their relative scale and development, have followed other development paths. For instance, environmental consultancy has grown considerably but, due to its human capital basis, does not attract large investment and is not so responsive to technological change as equipment production. Another example is the area of noise and vibration control, which, although prevalent in many contexts, is still in its infancy.
In line with scale o f enterprise, demand and technology, there are clear sectoral divisions within the environment industry which reveal it to be a highly heterogeneous sector in many ways, such as
THE NORTH-SOUTH DIMENSION OF THE ENVIRONMENTAL AND CLEANER TECHNOLOGY INDUSTRIES • JONATHAN R. BARTON

C E P A L R E V I E W 6 4 • A P R I L t 9 9 8 137
capitalization, employment, rates o f change, and human and technological intensity. For these reasons, patterns o f competition and trade have been more difficult to track for the industry as a whole. The rapidity o f growth during the 1980s and 1990s has been remarkable and has been matched by a parallel increase in competition and trade within the sector, in all the core areas. As with all examinations o f the industry, however, it becomes fragmented once the issues o f competition and trade are raised.
Like competition within the domestic (national) context, international competition has been dependent on the nature and longevity o f regulations, as well as the ability o f firms to set up operations and compete on equal terms. The issue o f trade, for its part, raises the questions o f international competition, the globalization o f the environment industry, and the pursuit and development of new markets. It is in the context o f the latter that the environment industry rates as a most important industrial sector, rivalling many other key industrial sectors such as pharmaceuticals and vehicles in terms o f its North/South dimensions. With investment in research and development concentrated within firms based in the North, the trading patterns that have becom e most apparent in the industry, apart from particular horizontal links within and between North America, Europe and Japan, are those linking North and South (see table 4). These North/South links are critical to the development of the industry and have received considerable governmental export promotion support in many cases, most notably from the United States government.
Competition within the industry varies greatly from one country to another. Specific domestic regulations and their time scales of application have given some nations “first mover'’ advantages which have greatly favoured the firms catering for this sector and put them in a good position for expanding into international markets. Within this state o f affairs, some firms have captured considerable shares o f the market for certain products and services and have grown to a sufficient scale to compete internationally. An important issue within the competitiveness debate is the prevalent size o f firms in the environment industry, Until the 1990s, the industry was characterised by small and medium-sized firms, but this has been changing considerably. In the mature environment industries o f the United States and Germany, for instance, these firms are generally larger than the overall national average. In the United States the reason for this is the slowing growth rates of the industry in the 1990s and an
TABLE 4
OECD trade In environment products, 1990
Export share (as a percentage of
production exported)
Trade balance (millions of
ECU)
USA 10 3 120Europe 20 6 240Germany 40 7 800United Kingdom 17 390France 14 390Japan 6 2 340
Source: European Commission, 1994a, based on OECD data.
increase in mergers and acquisitions (Vickery and Iarrera, 1996). In Germany, environment industry firms are larger than the national sectoral average as a result o f the strong performance o f the national environment industry and its high profile as a strategic sector (Walter and Horbach, 1996).
It is difficult to get a clear picture o f competition across the board within the environment industry for two reasons: first, the rapidity o f change within most core areas, and second, the wide range o f sectors and subsectors, their definitions, and the size o f operations, which make comparative analysis problematical. What is clear is that the competitive advantages o f firms operating in one or more o f the delineated fields within the industry depend heavily on R&D. A setback for many firms is their operating size and the financial constraints, such as access to capital, that they face.
In international environment industry trade, Germany is the world’s leading exporting country in terms of the proportion o f its production exported. Thus, Germany exports 40% of its production in value terms, principally water treatment equipment and air pollution abatement technologies. The direction o f German exports is divided between the European countries and more distant destinations such as North America, Eastern Europe, the Middle East and Africa. Within the European Union, the United Kingdom, Netherlands and France are also net exporters in terms o f the environment industry, according to data for 1994 (OECD, 1996a). In the same way that strict national regulations initiated the development o f Germany’s environment industry, new pressures for cleaner technologies and process methods (both aimed at reducing the need for “end-of-pipeline”- style technologies) may well signify “first mover” or “market driver” advantages for that country into the first two decades o f the next century.
THE NORTH-SOUTH DIMENSION OF THE ENVIRONMENTAL AND CLEANER TECHNOLOGY INDUSTRIES • JONATHAN R. BARTON

138 C E P A L R E V I E W 6 4 • A P R I L 1 9 9 8
IVThe European environment Industry
The European environment industry has become an important part o f the national econom ies, particularly in Northern Europe, in terms o f both domestic and international production and supply. It is a large sector in terms o f employment and trade within the European Union, and is likely to continue to register a healthy growth rate for as long as the pressure for reduced environmental contamination continues, especially in view o f its geographical proximity for trading with countries requiring environment products and services in Eastern and Central Europe.
Within Europe, Germany dominates the environment industry in terms o f number and size o f firms, production, employment and expenditure on environment industry products (see tables 6 and 7). As Germany established environmental regulation frameworks earlier than other European Union member States, its firms operating in this sector were able to enjoy “first mover” advantages when other States began establishing their own regulations. The rise and consolidation of the German environment industry and its success in export markets have made it Europe’s leader in this sector, to such an extent that it is often monitored by the United States and Japan on its own rather than as part o f the European Union. Within Europe, it is Germany which is the competitor rather than the Union as a whole.
The OECD (1996a) calculates that the German environment industry market (US$17.5 billion in1992) accounts for 30% of the European total. The reunification process, whereby a country with high environmental standards was merged with a country with low standards in this respect, has established a large domestic market for environmental products and services, although the extent to which the industry is able to take advantage o f the demand on its doorstep w ill depend on the resources available for financing it. Financing the demand for environmental products and services is the greatest barrier to the development o f the global environment industry, whether in Eastern and Central Europe, South and South-East Asia or Latin America. What is clear is that the European environment industry should be able to develop strongly on the basis o f the demand
TABLES
Growth of the Western European environment market, by segments(Billions of US dollars)
1990 1995Annual growth
rate (%)
Waste management 20.9 28.0 4.5Water and waste-water 12.8 21.3 9.1Air pollution control 9.6 12.8 4.3Land rehabilitation 1.0 2.3 16.1Total 443 64.4 8.5
Source: United States Congress, Office of Technology Assessment (OTA), 1994.
TABLE 6
Environmental industry output, by countries, 1990
Billions As aof ECU percentage
Germany 17.0 36.2France 10.0 21.3United Kingdom 7.0 14.9Italy 5.0 10.7Netherlands 2.7 5.8Spain 1.8 3.8Belgium 1.4 3.0Denmark 1.0 2.1Portugal 0.4 0.9Ireland 0.3 0.6Greece 0.3 0.6
Total, EuropeanCommission 46.9 100.0
European Commission 46.9 23.5United States 78.0 39.0Others 75.1 37.6
Total, World 200.0 100.0
Source: European Commission, 1994a, based on OECD data.
THE NORTH-SOUTH DIMENSION OF THE ENVIRONMENTAL AND CLEANER TECHNOLOGY INDUSTRIES * JONATHAN R. BARTON

C E P A L R E V I E W 6 4 • A P R I L 1 9 6 8 139
TABLE 7
Number of firms and employment estimates
Number of firms
Employment(thousands)
Germany 4 000 250France 1 500 90United Kingdom 1 500 75Italy 2 300 40Europe 20 000 600
Source: European Commission,1994a, based on OECD data.
from the Eastern and Central European econom ies currently in transition, which have access to tied financial aid aimed at reducing pollution from dom estic and industrial sources.
The urban waste water directive has been the m ost important single d irective for the d evelopment o f the environment industry in Europe, be
cause o f the demand for services and technologies that it has generated: water and waste-water m anagement absorbs 45% o f Europe’s environment industry output, compared with 20% for waste management, 22% for air pollution control, and 13% for others (including noise control, laboratory equipment, land rehabilitationandresourceconservation).Althoughit is important to recognize Germany’s predominance in w aste water treatment and other areas, other leading member States have also established comparative advantages in particular core areas. Thus, for exam ple, French and United Kingdom firms have also established strong positions in waste water treatment, while the Netherlands has firms with ex pertisein contaminated land rehabilitation. In Southern Europe, the newer entrants into the Union have considerably smaller environment industries, with little specialization (Ecotec Research and Consulting Ltd., 1994).
yThe Latin American environment industry
The environmental debates in Latin America are closely interwoven with those relating to development per se. The traditional insertion o f Latin American economies into the international economy as suppliers o f primary commodities has led to continual pressures on the natural environment (see Sánchez,1993). Until the mid-twentieth century, these pressures were concentrated in rural environments, where the effects o f agricultural production were leading to desertification, soil erosion, reduced soil fertility, compaction and salinization, and also in mining areas and forested environments where extraction left its marks on the locality. For urban environments, environmental pressures already existed during the nineteenth and early twentieth centuries, due to urbanization factors and the need for adequate basic services, but from the mid-twentieth century the deepening o f the industrialization process intensified these pressures.
W hilst the Northern European environment industry has developed rapidly during the 1980s and 1990s, the Latin American econom ies have struggled in the face o f public sector financial obstacles and sluggish progress towards environmental awareness
and legislation and regulation in this field. During the 1990s, national responses to environmental issues, prompted by domestic pressures but above all by international environmental concern and the imposition of trading conditions, have led to a rise in demand for environmental products and services. The bulk of the more sophisticated systems have been supplied from the North, especially from the United States.
Among the Latin American economies, M exico has been the main target o f the US environment industry. With the environmental industry market of Latin America’s six largest econom ies valued at U S$ 2.5 billion in 1992 (40% supplied by imports) and an expected 25% growth rate over the next few years, the promotion o f non-domestic products and services is steadily increasing (Karliner, 1994) (see table 8). The considerable amounts o f capital needed for the adoption o f new technologies and related services com e partly from bilateral and multilateral aid and development programmes. Through these programmes, the countries o f the North are effectively acting as agents for their domestic producers by promoting their technologies and supplying funds to Southern governments for the purchase o f this equip-
THE NORTH-SOUTH DIMENSION OF THE ENVIRONMENTAL AND CLEANER TECHNOLOGY INDUSTRIES * JONATHAN R. BARTON

140 C E P A L R E V I E W » 4 • A P R I L 1 * 9 »
ment. W hile this technology is undoubtedly valuable for reducing contamination, the political and economic foundations o f this process are not based on the sustainability o f Southern environments but on Northern domestic industrial criteria o f competition and sales (Gligo, 1995). It is also argued that technologies that are now less suitable for complying with the current regulatory systems in the North are being exported to the South. This type o f trade has strong similarities with the technology transfers of the 1960s and 1970s to Latin America, when obsolete plant and equipment (often obsolete for reasons of contamination) was transferred or sold to countries in the South to assist in their industrialization programmes. The example o f Cubatâo in Brazil, where a former United States oil refining plant was reconstructed in order to sustain the Brazilian “econom ic miracle”, is a case in point. This refinery, along with numerous other plants involved in the production of chemicals and petrochemicals and in other types of heavy industrial activities, led to a concentration of the highest levels o f environmental contamination in the country. The Ecotec report (Ecotec Research and Consulting, Ltd., 1994, p. 83) prepared for the United Kingdom Government on the environment industry recommends that companies should not “try to sell old technology in developing markets.” This is the contemporary view, calling for the use o f new plant and technology in developing markets where standards have been or are being raised and regulations tightened, but the question o f how this new technology can be financed still remains. Without the “halfway house” of cheaper “second hand” technology, many firms will probably be unable to purchase the required equipment, resulting in long time-lags before the regulatory authorities are able to force firms to invest in the equipment or be penalized for failing to do so.
The transfer o f obsolete equipment and outdated methods of contamination reduction will inevitably lead to a continuation o f the technology gap between the North and the South, but this w ill also be the case if new technologies are imported. It is likely that when “end-of-pipeline” technologies give way to integrated pollution control methods within the production process, Southern firms w ill once again have to import new (or old) production systems developed in the North. For this reason, the environment industry is not a way o f reducing the gap between North and South in terms o f industrial production and economic growth, but is rather a continuation o f a series of
TABLESLatin American environment markets and imports, 1992
Market (millions of US dollars)
Percentageimported
Argentina 168 25Brazil 1 015 19Mexico 614 24Venezuela 44 97Chile 560 89Colombia 45 78
Source: United States Agency for International Development (U S
A ID ), in United States Congress, Office of Technology Assessment (O T A ), 1994.
industrial phases, from consumer and intermediate goods production, to heavy industrial production, and finally to higher technology products, in which the time-lag in their introduction leads to the persistence of a technology gap. Osvaldo Sunkel (1980) already noted the link between development strategies and the environment almost two decades ago, and the environment industry is yet another manifestation of this connection. This in turn exacerbates the terms- of-trade gap. If the national picture o f the relationship between the environment and the economy is taken into consideration, as highlighted by the OECD
(1996c), the role o f technology, the social implications o f the adoption o f technology and environmental impacts (not only from the reduction in industrial emissions but also from those displaced by the new technology) must be considered within an integrated strategy. In their own way, technologies form the critical link between the environment and social systems, and environmental management policies direct this linkage (Tolba, 1980; Bustamente and Torres, 1990).
Although Birdsall and Wheeler (1993) and Wheeler and Martin (1992) rightly claim that Latin American economic openness actually encourages cleaner industry and higher anti-pollution standards, the financial, commercial and competitive implications o f this openness are more complex. This is especially the case when one considers which firms are able to play a part in cleaner production due to their financial position and which are not. There are also marked differences between sectoral branches within the same national economy: for example, the restructuring o f Argentina’s steel industry during the 1990s
THE NORTH-SOUTH DIMENSION OF THE ENVIRONMENTAL AND CLEANER TECHNOLOGY INDUSTRIES • JONATHAN R. BARTON

C E P A L R E V I E W 8 4 * A P R I L 1 9 9 8 141
and 1980s also led to improved environmental technologies compared with Argentina’s petrochemical industry (see López and Chidiak, 1995, and Bisang and Chidiak, 1995), The threat o f a two-tiered system o f environmental standards and compliance is a very real one in the Latin American context. If the outcom e o f environmental regulations and environment industry products and services is the displacement of domestic firms by foreign firms, the econom ic and social implications o f such environmentally-based strategies must be considered in detail (Cramer and Zegveld, 1991). Another point worthy o f consideration is the gap that may exist between legal regulations and their monitoring and enforcement. In Latin America, there are many regulations on the statute books but weak public sector financial circumstances often mean that their monitoring and enforcement are under-resourced. Ramón López (1992) writes that environmental policies can affect pollution intensity but that they depend critically on the implementation and enforcement o f an adequate regulatory framework to internalize the true social costs o f the resources used. This type o f approach would ensure a more locally rooted system of laws, rather than an imported model unsympathetic to local needs and sensibilities. Latin American environmental nongovernmental organizations have persistently argued along these lines (Faure, 1995).
M exico has been highlighted as the most outstanding Latin American market for export promotion because o f its large industrial base, heightened environmental awareness due to the experience of M exico City’s poor air quality, and the 1988 General Law on Ecological Equilibrium and Environmental Protection, which provided the legislative framework for regulation and hence a market for the environment industry. M exico’s principal market has been for waste water treatment, since drinking water supply has been a government social priority, and also for air pollution control in M exico City.
The nature o f M exico’s political development has ensured that there is still a great deal o f State control o f basic services and utilities. For this reason, the public sector has been the principal purchaser of environmental goods and services; indeed, public sector procurement o f environmental products and services is a feature o f the industry all over the world. This demand has led to big market opportunities for
foreign exporters, particularly for United States firms which have been backed very strongly by their government and its trade promotion agencies such as the U.S. Department o f Commerce’s International Trade Administration, the U.S. International Trade Commission, and the Agency for International Development. These agencies’ publications advising firms of market opportunities in M exico have been a vital factor in the development o f a strong United States presence in that market. Another important factor has been the commercial relationship established by the North American Free Trade Agreement (NAFTA) and the geographical proximity o f the two countries, which facilitate the movement o f goods and services between them (ifc, 1992; Nadal, 1995). For M exico, the threat o f a future “dirty industry” tax on exports to the United States by industries which do not meet certain environmental standards has also been a factor taken into consideration (Low, 1992).
Whilst M exico is now well advanced within the global environment industry as an importer, and also as a domestic supplier is certain core areas, in Latin America only Brazil can be compared with M exico in terms o f market size. Other countries such as Argentina, Venezuela and Chile, all with advanced industrial economies, require imported environmental products and services, but the need for these depends on the environmental regulations in force in each country. In the United States strategy for environment industry promotion in Latin America, Chile and Argentina are the main targets for export promotion after M exico (U.S. Department of Commerce, 1994b). Not until their ecological awareness and demands become more clearly focused and the consequent regulations are put into place will other Latin American economies be subject to the same degree of export promotion and environment industry development as that already experienced in the case of Mexico. In these South American economies, a more open marketplace is likely to emerge within which there w ill be competition between United States, European and Japanese firms. In Chile, for example, with its advanced neoliberal economy, its openness to competing firms in this area w ill result in more open competition that goes beyond the geopolitical interests that have been prevalent in the past in such cases as those o f the United States in M exico, and Japan in South East Asia.
THE NORTH-SOUTH DIMENSION OF THE ENVIRONMENTAL AND CLEANER TECHNOLOGY INDUSTRIES • JONATHAN R. BARTON

142 C E P A L R E V I E W 6 4 • A P R I L 1 9 9 6
VIThe future: the drive for cleaner technology
The tendency towards cleaner production processes rather than “end-of-pipeline” equipment in the United States, the European Union and Japan is very clear. The likelihood that this tendency w ill lead to pressures for higher environmental standards for goods imported from elsewhere is also clear, especially in international environmental fora where the displacement o f “dirty” production activities from areas o f higher environmental standards o f production to other areas is seen as counterproductive in terms of global environmental improvement. In view o f this, eco-labelling and the ability o f Latin American firms to conform to trade and regulatory standards in the countries to which their exports are directed w ill becom e a paramount concern. The combination o f trade restrictions with environmental restrictions may also be an important factor in closing Northern hemisphere domestic markets to particular goods.
As with the environment industries, cleaner technologies have also been quick to emerge in Europe (and also the United States and Japan); the first European Round Table on Cleaner Production Programmes was held in October 1994 at Graz, Austria, and focused on comparing and contrasting national and regional programmes, cleaner production demonstration projects, and the ideas o f industrial ecology and sustainable societies (Cleaner Production, 1995), Research and development in the fields o f both environment industries and cleaner technologies is intensive, and this is where the investment goes. It is for these reasons that the two fields have been joined together for purposes o f definition in certain countries, but although they are similar in this respect, they are fundamentally different in essence. The high costs of research and development have been an important factor in restricting innovation to certain countries and certain firms, although the essence of cleaner production is that the firms themselves should becom e more highly involved in this development. Whereas the products o f environment industries -such as flue gas desulphurization equipment or environmental consultancy services- can simply be purchased, cleaner production requires the rethinking of the entire process, of the social context o f that
process and -especially important in terms o f the globalization o f cleaner production strategies- the local resource base (Georg, Jorgensen and Ropke, 1990; Cramer and Zegveld, 1991; Rajagopal, 1992). Only through attention to these issues o f the social context and the local resource base w ill it be possible to find out how to ensure the spread o f cleaner technologies.
An example o f clean technology development in Europe, developed under the BRITE/EURAM programme, has been coordinated by the Italian com pany separem . This company has linked up with project participants in Italy, Germany and France to develop a membrane which reduces the pollution generated by the textile industry. The membrane allows waste water to be purified and enables most chemical agents used in the process to be recovered; it also reduces water consumption by 80% (European Commission, 1994b). It is this ability to recover and recycle raw material inputs while at the same time reducing operating costs through low water consumption that distinguishes cleaner technology projects from end-of-pipeline technologies.
Although it is environmental consciousness and movements to that effect that have brought issues of industrial pollution onto the political and regulatory agenda, there can be no doubt that economic factors will shape the development o f cleaner industries. The implementation o f cleaner technologies and industrial restructuring entail very high costs which exceed the initial costs o f “end-of-pipeline” equipment for example. In cost/benefit terms, it will be the future developments in particular industries and their products that w ill determine investment in what remains of this century. Such implementation has apparently negative short-term consequences, because it is inspired by longer-term objectives such as “first mover” advantages, the gauging o f future consumption patterns based on environmental awareness, and other Porteresque benefits (Porter and Van der Linde,1995). The OECD (1995) identifies three impediments to the wider adoption o f cleaner technologies: structural (e.g., the need to amortize equipment already installed); cyclical (e.g., market trends and the financial situation o f the firm); and commercial (e.g., dif
THE NORTH-SOUTH DIMENSION OF THE ENVIRONMENTAL AND CLEANER TECHNOLOGY INDUSTRIES • JONATHAN R. BARTON

C E P A L R E V I E W 5 4 * A P R I L 1 9 9 8 143
ficulty in marketing new processes or products). Institutional factors such as management inertia and lack o f communication between engineers and executive management are also possible impediments, especially when management sees cleaner technology as an purely environmental cost rather than as a prospective benefit in terms o f competitiveness.
W hilst cleaner technologies w ill determine the shape o f the industry/environment competitiveness relationship in the short run, they must not be seen as solutions in themselves, since the notion o f “zero pollution" is an abstract one. Although research reveals that 70%-90% of current emissions can be reduced through the use o f cleaner technology, such technology w ill have to overcome barriers relating to various factors (Rajagopal, 1992; OECD, 1994a and b): economic (in terms o f investment-retum times); institutional (knowledge, information and R&D capacity); technological (the local context for its application); educational (the human resource base for technology development); regulatory (suitability for complem enting the processes concerned); information (dissemination and transfer, principally in the North/South axis); and government financial support instruments for cleaner technology promotion (as in the European Comm ission’s Financial Instruments for the Environment (LIFE) programme which came into force in July 1992 and directs 40% of its funding to the promotion o f cleaner technologies).
The magnitude o f these future barriers suggests that the adoption of cleaner technologies will be geographically distinctive. For this reason, the further issue o f the trade in cleaner products may well be the conditioning factor, in that the moves towards eco labelling, environmentally friendly goods and a “greener" international consumer base may shape protectionist trade policies regarding product standards. As long ago as 1989, in Germany 2500 products were being sold with labels proclaiming them as “environmentally friendly” (European Commission, 1989), and that country now blocks products that have been manufactured using materials banned in Germany.
Within the regulatory process, there are clearly pressures for cleaner production rather than for processes that merely reduce contamination. In itself this is a major shift in direction, since environmental industries have been developed to service industrial waste and by-products. At this point it would be worth clarifying where a possible division may be made between environmental industries and cleaner
production. This division is by no means clear, and this has contributed to the numerous problems associated with the measurement o f environmental industries: for some countries cleaner production processes are placed together with environmental industries in their working definitions, whereas in others they are separated. For the purposes of this paper, the two are separated, because o f the fundamental difference between what each tries to do.
Environment industries were established to reduce contamination, and they developed so-called “end-of-pipeline" technologies that seek to reduce emissions and the dispersal o f pollutants. These contaminating products are collected and disposed o f by gaseous transfer or by waste disposal in authorized sites. Consequently, these industries and technologies do not seek to transform industry. In contrast, cleaner production and processes are not focused on the wastes generated by production activities and ways of separating the good from the bad. Instead, cleaner production seeks to transform the entire production process so that the inputs, processes and outputs are all considered in terms o f potential contamination. This approach calls for the reconfiguration o f the industrial process in its entirety.
The strategies adopted fall into five areas: process optimization; process and product innovation; recycling and by-product recovery; resource sharing and resource optimization; and a co-productivity approach among firms (Sutter, 1989; Rajagopal, 1992). The degree to which these strategies can be applied depends very much on the maturity o f the environmental market in the economy in question. Ecotec (1992) identifies three phases o f market maturity: Phase I: developing markets with little environmental legislation, predominant use o f end-of-pipeline technologies in environmental management, licensing arrangements or direct market penetration by foreign firms; Phase II: more developed markets with more wide-ranging environmental legislation and a greater emphasis on technological innovation in environmental management; and Phase III: mature markets where an integrated approach is taken to policy development and cleaner technologies are the focus of environmental management. Within Europe, there is a wide range o f different degrees o f market maturity, most clearly in a North/South division, which means that while there is a large potential market within the European Union, the establishment o f Union-wide measures pertaining to environmental management
THE NORTH-SOUTH DIMENSION OF THE ENVIRONMENTAL AND CLEANER TECHNOLOGY INDUSTRIES • JONATHAN R. BARTON

144 C E P A L R E V I E W « 4 • A P R I L 1 9 9 8
presents bigger problems. It is evident that global environmental measures w ill be difficult to establish on an international cooperation basis as long as there are such clear variations, even within the North itself, among the so-called developed economies.
W hile the environment industries were a response to stricter regulations and environmental consciousness during the 1980s, it can be said that cleaner technologies are the response to the same factors in the 1990s. It is obvious that the costs o f waste disposal and the basic principle o f producing waste have been subjected to serious consideration and that
the new focus has been on waste reduction, based on the assumption that a large part o f this waste w ill be potentially contaminating, whether in the form of gases, water'or solid waste. The drive behind this new approach is at one and the same time environmental and economic: as politicians take up the environmental agenda in response to the pressures of interest groups, industrialists are increasingly aware o f the benefits o f reducing waste (as removal costs increase), the advantages o f “first mover” innovation, and the pressing demands for “eco-friendly” products for labelling and marketing purposes.
V IIThe problem of the linear development of the environment/industry relationship
While no-one suggests that there is a steady linear development to the environment/industry relationship -from “dirty” industries to “environmental” industries to “cleaner” industries- it is clear that Latin American industrial development will lag behind in this progression from one to another. As Joseph Karliner (1994) suggests, the importation o f environmental industry products and services reveals yet another stage in industrial development and the intercontinental links o f that development. D ue to the high-technology nature o f environmental industries and cleaner production processes, the opportunities for domestic companies to cater for national industry environmental needs are limited, so that the development o f local capacity and an “endogenous development nucleus” is also restricted (Durán de la Fuente, 1991, p. 133). What is clear is that environmental demands w ill be supplied by foreign firms for the most part. Latin American industries w ill be unable to export products without the use, first o f end-of- pipeline equipment, and later the adoption o f cleaner production processes. The cost o f such improvements will have to be internalized in one way or another. As international pressures for environmental improvement increase, such as those in the Montreal Protocols and Agenda 21, the demands on industries to improve their relationship with the local environment will undoubtedly increase likewise. These pressures may mean both a damaging impact on Latin Ameri
can manufacturing exports and an increase in industrial production costs. The positive outcomes will be improvements in environmental quality in terms of industrial emissions and contamination. The negative outcomes w ill relate to the labour implications o f higher production costs and the long-term costs o f an intensification o f foreign market dominance and technology transfer that will widen the technology gap to a veritable chasm.
Joseph Karliner (1994) points to an important anomaly in the environment industry business. He notes that there are many firms which are in breach o f environmental regulations (and have been subject to judicial action) but which are also suppliers o f environmental goods and services. Clearly this is a serious state o f affairs that must be overcome before the interaction between environmental regulations and the environment industry can lead to improvements in levels o f contamination.
What this situation reveals is that the environment industry, as with any other multi-billion dollar industrial sector, is not altruistically responsive to ecological arguments or environmental quality demands. The industry functions just like any other, responding to market economics, and is likely to follow the same course as others. For this reason, the term “environment industry” must not be used in a misleading manner. As with other industries which have led to the relocation o f activities, changes in the
THE NORTH-SOUTH DIMENSION OF THE ENVIRONMENTAL AND CLEANER TECHNOLOGY INDUSTRIES • JONATHAN R. BARTON

C E P A L R E V I E W « 4 * A P R I L 1 S 9 8 145
international division o f labour (as for example in the case o f the motor industry) and new patterns of trade and investment, especially in the context o f the South, the environment industry should be challenged. The costs and benefits o f the environm ent industry warrant just as much scrutiny as other industries.
Cramer and Zegveld (1991) note that the relationship between technology and environment management is often ambiguous, since there are both positive and negative effects on the environment. They stress that technology also requires changes in socio-organizational structures and consideration of the associated social contexts, as in the case o f clean technologies (Rajagopal, 1992). The OECD (1996d) highlights the need for cleaner technologies to be implemented only with adequate support and changes in production patterns, which include the social component o f production. What is needed is consideration of the wider implications o f environment products and services, their implementation and management. As a technology-based industrial sector, the social impacts o f the adoption o f environment products are immense. It is these social effects that need to be considered in an integrated manner alongside the technological and economic arguments, as in the case of the regulations themselves.
What is clear in the global environment industry is that the “first movers” are located in the North and that the costs o f R&D will be passed on to the South when environmental regulations, suggested and pursued by Northern agencies (environmental groups and supranational organizations), are intensified in those countries. The costs of transition to cleaner technology w ill be felt most by domestic firms which will have to import equipment and services, less so by the multinational firms which w ill transfer technology and knowledge on an intra-firm basis or which w ill already have a division o f their corporate structure devoted to the environment industry. It is likely that the outcome o f more rigorous environmental regulation in the global context, together with the evolution o f the global environment industry, which w ill serve this regulatory boom, w ill lead to a strengthening o f multinational capital in Southern locations relative to domestic firms, and a greater dependence o f these host countries on the trade and investment decisions of executives in the North. This shows that the environment industry in many ways typifies the nature o f the globalization o f economic activities, in that the perceived solutions to contem
porary ills are to be found in still further integration of the global capitalist economy.
It is also quite clear that the transfer o f regulations leads to technology transfer, so that the pursuit o f Northern models o f environmental regulation will lead to the need for imports o f new technologies. This set o f circumstances w ill result in strong exports from the environment industry firms in the North and high costs for “dirty” industries in the South. While the economic argument is that these increased costs should be passed on to the consumer, it is more likely that, in order to remain competitive, domestic firms will be forced to rationalize, evade existing regulations where possible, or surrender to multinational competitor “buy-outs”. A recurrent feature in reports on environment industry exports is that the lack of finance for meeting the demands will continue to be a serious obstacle to the global expansion o f the industry, especially into the South (EPC, 1992; U.S. Congress, Office o f Technology Assessment, 1994; U.S. International Trade Commission, 1995 and 1996). The degree to which development aid and multilateral financial assistance can meet these demands is limited. These demands are themselves dependent on the establishment o f environmental regulations in these areas, which often follow slow trajectories through the legislature. For both these reasons, the impacts o f the environment industry within the South are, and w ill continue to be, significant.
The least likely scenario is that a healthy domestic industrial sector w ill emerge, converting “dirty” industries into “clean”’ industries and leading to wider econom ic benefits within the national economy and society. The most likely scenario is that multinational firms w ill increase their share o f the industrial sector o f Southern economies, particularly the processing o f natural resources such as minerals and forestry products. The outcome of this scenario is the repatriation o f profits, rationalization o f labour, and production for international rather than domestic markets. This scenario is an excellent one for company shareholders, but not so attractive for those who will benefit little from the buoyancy o f the export-led industrial sector.
The environment industry is a rapidly evolving sector (see table 9) and there are likely to be extensive changes in the make-up o f the sector and its geography, in terms o f R&D and trade orientation. A clear example o f these changes is already evident in the field o f trade, where the licensing o f technology
THE NORTH-SOUTH DIMENSION OF THE ENVIRONMENTAL AND CLEANER TECHNOLOGY INDUSTRIES * JONATHAN R. BARTON

1 4 6 C E P A L R E V I E W » 4 • A P R I L 1 9 9 8
TABLE 9Forecasts of environment Industry market trends, by countries(Billions o f ECU)
1990 2000Estimated
annual growth (%)
Germany 17.0 23.0 4.0France 10.0 15.0 5.5United Kingdom 7.0 11.0 6.3Italy 5.0 7.7 6.0Netherlands 2.7 3.7 4.1Spain 1.8 3.0 7.4Belgium 1.4 2.3 6.4Denmark 1.0 1.2 2.2Portugal 0.4 0.7 8.3Ireland 0.3 0.5 6.5Greece 0.3 0.5 7.4Total, EC 46.9 68.6 4.9
United States 78.0 113.0 5.0
Total, World 200.0 300.0 5.5
Source: European Commission, 1994a, based on OECD data.
has gained growing importance compared with trade in technological equipment per se. A further example is the process o f concentration within the sector, with mergers and acquisitions altering the balance of small, medium and large firms. The higher returns of the larger United States environmental firms, together with their increased R&D potential and the desire of public authorities to work with fewer companies, for monitoring and evaluation reasons, all work in favour o f larger organizations.
An important question is to what extent the environment industry can maintain its current structure, incorporating such a wide range o f activities, products and services. There are strong arguments for a more rigid categorization o f the sector, separating various components and considering how far clean technologies can be incorporated or kept separate from the concept o f environment industries. As the industry becomes more established and its current size and range o f activities are more generally recognized outside the industry itself, som e critical reflection on the way in which the sector came into being and how it can be consolidated or compartmentalized in the future may be in order.
The environment industry should be treated in the same way as the chemical industry, which is now subdivided into clearly defined branches. The term “environment industry” really means very little and
requires greater study. The meeting on the environment industry organized by the OECD, the United States Department o f Commerce and the United States Environmental Protection Agency in Washington in 1994 is a step in this direction, following on from the OECD’s 1992 report which revealed the difficulties o f data collection and comparison. The term “environment” has positive overtones within societies which have recognized ecological causes and provides a positive image for all the firms working within its framework, but some useful lessons could be drawn from the analogy o f the drive for industrialization and its positive equation with the promotion o f modernization in the 1950s and 1960s. The environment industry itself is currently addressing the failures of the latter drive. One wonders what w ill occur in the next century in terms o f addressing the weaknesses or failures o f the current environment industry, the fourth stage in Joseph Karliner’s (1994) process of exporting industrial development from the North to the South, along with its accompanying ills.
Only by critical introspection can the industry act as a positive influence, giving rise to reduced contamination and improved ecological conditions and building on the recognized interface between the environment and the economy and the related issues of competitiveness (OECD, 1996c). This will require the industry to have effective regulations and controls in its own right, in order to reduce “leakages” and displacements o f pollution. A lso worthy o f further consideration is the very rationale o f the industry: the promotion o f “end-of-pipeline” technologies instead of cleaner production technologies and life-cycle assessments which seek to reduce pollutants rather than deal with their emission. The future o f the environment industry w ill be determined by its ability to involve itself in cleaner process technologies in order to m ove ahead in what the International Finance Corporation’s Executive Vice-President, Sir W illiam Ryrie, terms the “four Rs” o f waste management: reduction, reuse, recycling and recovery. This contrasts with the current driving chain o f the environment industry’s “end-of-pipeline” orientation: reaction, response, treatment and disposal.
For the European environment industry, there are clearly significant gains to be made in the areas of pollution control demand where finance has been made available. With particular countries developing niche markets, it is likely that the core areas o f European environment industry demand will be met inter
THE NORTH-SOUTH DIMENSION OF THE ENVIRONMENTAL AND CLEANER TECHNOLOGY INDUSTRIES • JONATHAN R. BARTON

C E P A L R E V I E W 6 4 * A P R I L 1 9 9 8 147
nally rather than from outside the Union, but at all events the industry is undergoing a rapid transition. With the drive towards clean technologies rather than the “end-of-pipeline” approach, it is the ability o f firms to diversify their products and remain as leaders within the R&D race which dictates developments within the industry. The European Union can act as a strong influence in this process by laying down environmental targets and encouraging firms, through a variety o f integrated methods o f incentives and directives, to push ahead in industrial process developments such as life cycle assessments. It is these developments which will enable European firms to compete in the global market place when the markets for “end-of-pipeline” technologies have dried up as a result o f the regulatory process that will prevail in the first quarter o f the next century.
Dan Noble (1996, p. 45) summarizes the situation in the United States environment industry, the largest in the world and the trend-setter to a great extent, as one in which constant innovation is essential: “Environmental equipment remains a large market, but now more than ever manufacturers must push the envelope.” For Noble, “pushing the envelope” means the drive towards on-site, source- specific systems for recovery, recycling or treatment: what he terms Process and Prevention Technology (PPT). The idea o f process and prevention is mirrored in the key features o f cleaner production noted by Tim Jackson (1992): prevention (minimizing environmental hazard) and integration (with cleaner production foremost in industrial design, processes and product consumption). This drive represents a m ovement away from “end-of-pipeline” technologies, which are already diminishing as a percentage of total spending on environmental management strategies in the United States.
The nature o f the development o f the cleaner technology sector will depend on various factors, but policy instruments will be decisive in this development process. The central issue is whether cleaner technologies should be promoted from the demand or supply side: in effect, whether R&D should lead policy and trigger market compliance, or whether the market should determine the pace o f technological development. A further issue is the focus o f this cleaner technology: whether it should be on the product (highlighting the life-cycle assessment approach to waste reduction), the production process at industry level, or both (OECD, 1994a and b; Berkhout,
1996), Ecotec (1992) points out that an ongoing problem for the adoption o f cleaner technologies has been that the demand side has lacked the legislative impetus to exert a “pull” on environmental innovations, whilst the supply side has been too fragmented to “push” new technologies into the market place. Clearly the role o f government w ill be critical in overcoming this obstacle (OECD, 1995), since the process o f “corporate greening” has shown itself to be slow and there continues to be little concentration and coherence among environmental firms (Irwin and Hooper, 1992).
Whatever the development path o f the cleaner technology sector in the developed economies, a key factor in achieving lower waste and contamination on the global scale (thus avoiding any displacement outcomes) is that o f intergovernmental support, such as bilateral assistance programmes, together with lifecycle assessment and capacity-building so that firms in the developing economies can link up with the private sector in partnerships that can lead to effective environmental management strategies (Almeida, 1993; Luken and Freij, 1996). Underpinning these possibilities for reducing the cleaner technology gap between North and South is the role that should be played by international organizations such as the World Bank and UNIDO in promoting these investment and partnership opportunities, within industrial sectors and between national environment industries.
As the shift in the environment/industry relationship progresses from one o f an environment industry focusing on “end-of-pipeline” technologies towards the developm ent and application of cleaner technologies, it is already clear that cleaner technologies are not, in them selves, a panacea for industrial contamination. A more fundamental shift is required in terms o f energy use and basic technologies for production, transport and consumption in order to press forward towards the goal o f sustainable developm ent (Kemp, 1994). It is this next phase o f R& D, the “next generation” (OECD, 1995), which is already underway and which w ill undoubtedly dictate environment/industry and industry/trade relations by 2025. For this reason, forecasts on the development o f the environment industry into the next millennium are likely to be misleading. Rather than an environment industry as it currently exists, the likelihood is that profound changes in energy use, production strategies and consumption patterns w ill raise different environmental issues
THE NORTH-SOUTH DIMENSION OF THE ENVIRONMENTAL AND CLEANER TECHNOLOGY INDUSTRIES • JONATHAN R. BARTON

148 C E P A L R E V I E W 6 4 • A P R I L 1 9 9 8
demanding highly distinctive approaches and policies. In order for European industries to be aware of these rapid changes and remain competitive in the global market place, intensive public and private sector investment in R&D will be required. The German example o f growth in public environmental research and development expenditure -from 1% of all R&D
in 1975 (ECU 51.2 billions) to 3. 1% in 1985 ( e c u
309.3 billions): i.e., greater than all the other European countries combined (European Commission, 1989)- is an indication o f the level o f R&D investment that w ill be required to ensure European competitiveness in the environment industry sector.
(Original: English)
Bibliography
Almeida, C. (1993): Development and Transfer o f Environmentally Sound Technologies in Manufacturing: A Survey, Discussion paper, No. 58, Geneva, United Nations Conference on Trade and Development (UNCTAD).
Berkhout, F. (1996): Integrated environmental policy and industrial competitiveness, paper presented at the Workshop on Competitiveness and Environmental Policy, Cambridge, U. K., October.
Birdsall, N. and D. Wheeler (1993): Trade policy and industrial pollution in Latin America: Where are the pollution havens?, Journal o f Environment and Development, vol. 2, No. 1.
Bisang, R. and M. Chidiak (1995): Apertura económica, reestructuración productiva y medio ambiente: la siderurgia argentina en los ’90, Documentos de trabajo, No. 19, Buenos Aires, Research Centre for Industrial Transformation (CENIT).
Bustamante, M. I. and S. Torres (1990): Components of an effective environmental policy, CEPAL Review, No. 41, LC/G.1631-P, Santiago, Chile, Economic Commission for Latin America and the Caribbean (ECLAC).
Cleaner Production (1995): The Newsletter of the UNEP IE Cleaner Production Network, No. 9, Geneva, Spring.
Cramer, J. and W. C. Zegveld (1991): The future role of technology in environmental management, Futures, vol. 23, No. 5, Guildford, U. K., Butterworth Scientific Limited.
Durán de la Fuente, H. (1991): Industrial and urban pollution: Policy options, CEPAL Review, No. 44, LC/G.1667-P, Santiago, Chile, ECLAC.
Ecotec Research and Consulting Ltd. (1992): The development of cleaner technologies: A strategic overview, Business Strategy and the Environment, vol. 1, No. 2, London.
(1994): The U.K. Environmental Industry: Succeeding in the Changing Global Market, London.
European Commission (1989): The emerging industries, Panorama o f EC Industry, 1989, Luxembourg, Office for Official Publications of the European Community.
(1990): The environmental services industry, Panorama o f EC Industry, 1990, Luxembourg, Office for Official Publications of the European Community.
(1994a): Eco-industries in the EC, Panorama o f ECIndustry, 1994, Luxembourg, Office for Official Publications of the European Community.
(1994b): The environment - At the Heart o f EuropeanResearch and Development, Brussels.
Faure, M. G. (1995): Enforcement Issues fo r Environmental Legislation in Developing Countries, Working paper, No. 19, Maastricht, United Nations University, INTECH (Institute for New Technologies).
Fouillard, A. (1992): Emerging Trends and Issues in Canada’s Environmental Industry, Working Paper No. 8, Ontario, Canada, National Round Table on the Environment and the Economy.
Gastón, C. and M. Santiago (1996): Defining and measuring the environmental industry: Concept and approach, OECD (Organization for Economic Cooperation and Development), The Environment Industry: The Washington Meeting, Paris
Georg, S., U. Jorgensen and I. Ropke (1990):Clean technology: Innovation and environmental regulation, paper presented at the Conference on Environmental Cooperation and Policy in the Single European Market, Venice, Italy, April.
Gligo, N. (1995): The present state and future prospects of the environment in Latin America and the Caribbean, CEPAL Review, No. 55, LC/G.1858-P, Santiago, Chile, ECLAC.
Hesselberg, J. and H.M. Knutsen (1994): Location o f Population-Intensive Industry in a North/South Perspective: Review o f Literature F.I.L., Working Paper No. 1, Oslo, University of Oslo.
Higgins, J. (1996): Categorisation of the environmental industry: A Canadian view, OECD, The Environment Industry: The Washington Meeting, Paris.
IFC (International Finance Corporation) (1992): Investing in the Environment: Business Opportunities in Developing Countries. Washington, D. C.
Irwin, A. and P. D. Hooper (1992): Clean technology, successful innovation and the greening of industry:
THE NORTH-SOUTH DIMENSION OF THE ENVIRONMENTAL AND CLEANER TECHNOLOGY INDUSTRIES • JONATHAN R. BARTON

C E P A L R E V I E W 6 4 * A P R I L 1 9 9 8 149
A case-study analysis, Business Strategy and the Environment, vol. 1, No. 2.
Jackson, T. (1992): Towards Clean Production: Concepts and Principles for Guiding Technological Choice Towards Sustainable Development, Working Paper, Stockholm, Stockholm Environment Institute.
Karliner, J. (1994): The environment industry: Profiting from pollution, The Ecologist, vol. 24, No. 2.
Kemp, R. (1994): Technology and the transition to environmental sustainability: The problem oftechnological regime shifts, Futures, vol. 26, No. 10, Guildford, U. K., Butterworth Scientific Limited.
Leonard, H. J. (1984) Are the Environmental Regulations Driving US Industry Overseas?, Washington, D. C,, The Conservation Foundation.
(1988): Pollution and the Struggle for the WorldProduct, New York, Cambridge University Press.
López, R. (1992): The environment as a factor of production: The economic growth and trade policy linkages, in P. Low (ed.), International Trade and the Environment, World Bank Discussion Paper No. 159, Washington, D. C,, World Bank.
López, A. and M. Chidiak (1995): Reestructuración productiva y gestión ambiental en la petroquímica argentina, Documentos de trabajo, No. 18, Buenos Aires, Research Centre for Industrial Transformation (CENIT).
Low, P. (1992): Trade measures and environmental quality: The implications for Mexico’s exports, in P. Low (ed.), International Trade and the Environment, World Bank Discussion Paper No. 159, Washington, D. C., World Bank.
Luken, R. and A. C. Freij (1996): Cleaner industrial production in developing countries: Market opportunities for developed countries and potential cost savings for developing countries, OECD, The Environment Industry: The Washington Meeting, Paris.
Malaman, R. (1996): The Italian environment industry, OECD, The Environment Industry: The Washington Meeting, Paris, pp. 105-139.
Munasinghe, M. and W. Cruz (1995): Economywide Policies and the Environment: Lessons from Experience, World Bank Environment Paper No. 10, Washington, D. C., World Bank.
Nadal, A. (1995); Technology, Trade and NAFTA’s Environmental Regime, Working Paper No. 15, Maastricht, United Nations University, Institute for New Technologies (INTECH).
Noble, D. (1996): Redefining the environmental industry, OECD, The Environment Industry: The Washington Meeting, Paris.
OECD (1990): Pollution Control and Abatement Expenditure in OECD Countries: A Statistical Compendium, Paris.
(1992a): The OECD Environment Industry: Situation,Prospects and Government Policies, Paris.
(1992b): Technology and Environment: Trade Issuesin the Transfer o f C lem Technologies, Paris.
(1992c): Government Policy Options to EncourageCleaner Production and Products in the 1990’s, Paris.
(1993a): Pollution Abatement and Control Expenditure in OECD Countries, Paris.
(1993b): Technologies for Cleaner Production andProducts: Towards Technological Revolution for Sustainable Development. Report on the OECD Programme on Technology and the Environment1990-1993, Paris.
(1994a): Supply Side Policies to Augment Government Support fo r Promoting Cleaner Technologies, Paris.
(1994b): Reducing Environmental Pollution: LookingBack, Thinking Ahead, Paris.
(1995): Technologies fo r Cleaner Production andProducts: Towards Technological Trmsformation fo r Sustainable Development, Paris.
(1996a): The Global Environmental Goods andServices Industry, Paris.
—— (1996b): The Environment Industry: The Washington Meeting, Paris
(1996c): Integrating Environment and Economy:Progress in the 1990’s, Paris.
(1996d): Environmental Performance in OECD Countries: Progress in the 1990 's, Paris.
Porter, M. E. and C. Van der Linde (1995): Toward a new conception of the environment-competitiveness relationship, The Journal o f Economic Perspectives, vol. 9, No. 4, Nashville, TN, American Economic Association.
Rajagopal, R. (1992): Clean technology development-The ultimate solution?, Norwegian Journal o f Geography, No. 46.
Sánchez Albavera, F. (1993): Natural resources: The current debate, CEPAL Review, No. 51, LC/G.1792-P, Santiago, Chile, ECLAC.
Stafford, H. A. (1985): Environmental protection and industrial location, Annals o f the Association o f American Geographers, vol. 75, No. 2, Washington, D. C., Association of American Geographers.
Sunkel, O. (1980): Introducción, in O. Sunkel and N. Gligo (eds.), Estilos de desarrollo y medio ambiente en la América Latina, Mexico City, Fondo de Cultura Económica, pp. 50-64.
Sutter, H.P. (1989): An integrated approach to low waste technology, International Journal o f Clean Technologies, No. 1.
Tolba, M. K. (1980): Present development styles and environmental problems, CEPAL Review, No. 12, United Nations publication, Sales No. E.80.II.G.5, December.
THE NORTH-SOUTH DIMENSION OF THE ENVIRONMENTAL AND CLEANER TECHNOLOGY INDUSTRIES • JONATHAN R. BARTON

150 C E P A L R E V I E W 6 4 • A P R I L 1 6 9 8
UNCED (United Nations Conference on Environment and Development) (1991): Global Climate Change: The Role o f Technology Transfer, London, Touche Ross,
UNCTAD (1993): The Role o f Technology in Environmentally-Motivated Structural Change and the Implications fo r International Trade, Geneva.
(1994): Report o f the Workshop on the Transfer andDevelopment o f Environmentally Sound Technologies (ESTs), Geneva.
United States Congress, Office of Technology Assessment (OTA) (1994): Industry, Technology and the Environment: Competitive Challenges and BusinessOpportunities, Washington, D. C.
United States, Department of Commerce (1994a): Mexico: Environmental Technologies: Export Market Plan (Trade Promotion Coordinating Committee: Environmental Trade Working Group), Washington, D. C.
(1994b): Latin America Environmental Initiative(Trade Promotion Coordinating Committee: Environmental Trade Working Group), Washington, D. C.
United States, International Trade Commission (ITC) (1995): Global Competitiveness o f US Environmental
Technology Industry: Municipal and Industrial Water and Wastewater, Washington, D. C.
(1996): Global Competitiveness o f US EnvironmentalTechnology Industry: Air Pollution Prevention and Control, Washington, D. C.
USAID (United States Agency for International Development) (1995): Mexico's Environmental Markets, Washington, D. C., Office of Energy, Environment and Technology.
Vickery, G. and M. Iarrera (1996): Summary of the Environment Industry Expert Meeting, Washington, 13-14 October 1994, OECD, The Environment Industry: The Washington Meeting, Paris.
Walter, J. and J. Horbach (1996): The German environment industry. Present structure and development, OECD, The Environment Industry: The Washington Meeting, Paris.
Wheeler, D. and P. Martin (1992): Prices, policies and the international diffusion of clean technology: The case of wood pulp production, in P. Low (ed.), International Trade and the Environment, World Bank Discussion Paper No. 159, Washington, D. C., World Bank.
THE NORTH-SOUTH DIMENSION OP THE ENVIRONMENTAL AND CLEANER TECHNOLOGY INDUSTRIES ■ JONATHAN R. BARTON

C E P A L R E V I E W 64 151
The evolution of the State’srole in the regulation
of land transport
For nearly twenty years, the land transport sector of various Latin American countries has been undergoing highly significant institutional changes, both through the participation of the private sector and through the easing of economic regulations, giving rise to new needs for regulation of the market in general and the operating units in particular. The most important changes have taken place in rail and bus transport and in the road transport infrastructure. In the region, these changes took place first of all in Chile and reversed the previous predominance of State intervention associated with a development model which had begun to run out of steam. After a privatization process, the private enterprise which has won the concession for a railway or highway can exert various powers that militate against competition, not only by unjustifiably discriminating between the users of its services but also by discouraging economic production or diverting transport to another medium which has a higher real cost It is therefore desirable that concession contracts should restrict the possibility that the concessionaire can take advantage of these powers for his own benefit against the interests of the community, while at the same time the contracts should maintain the incentives for him to improve his efficiency. The deregulation of a market can lead to a position where a dominant operator or group of operators may use his influence or financial capacity to eliminate the competition, which is something that the anti-monopoly legislation should be able to prevent. Sometimes, however, this legislation needs to be strengthened, for example by giving it the possibility of taking punitive or dissuasive measures against offenders. Furthermore, in the public transport systems of big cities deregulation can lead to unnecessary social costs, such as externalities connected with congestion or air pollution. In this case, awarding the corresponding concessions by public tender could be the best solution. Short-term concessions favour the competitiveness of the market, but longer-term concessions encourage the concessionaires to make investments in the activity. An optimum system of concessions could perhaps involve the concept of leasing the fixed installations and rolling stock or vehicles with a long service life.
Ian Thomson
Transport Unit, International Trade, Transport and Finance Division, ECLAC.
A P R I L 1 9 » S

152 C E P A L R E V I E W 6 4 • A P R I L 1 9 9 8
Land transport in Latin America over the last twenty years
1. The private sector takes the driver's seat inrail transport
A notable change took place between the late 1970s and the late 1990s in the institutional framework o f Latin American land transport, especially as regards the distribution o f operations between the public and private sectors. In the case o f rail transport (table 1), it is likely that by the end o f the century the State sector w ill continue to be responsible for running trains only in countries like Paraguay, Uruguay and V enezuela, where rail transport is o f little importance. In the rest o f the region, the permanent way w ill continue to belong to the State, but the actual railway operations w ill be in the hands of private concessionaires. There are already two countries in the world where all the main line trains are run by private enterprises, and one o f them is in South America (Bolivia).1 Even in countries like Brazil, which have traditionally favoured State intervention in transport operations, the railways have been transferred to concessionaires.
Twenty years ago, it was usual for the Latin American countries to have heavily subsidized State-owned railways w hose business objectives were not usually very clearly specified and were interpreted in such a way as to favour social w elfare at the expense o f business profits, so that som etim es there was not even any intention o f fix ing scales o f charges that cam e anywhere near the cost o f operating the services.
Thus, for example, the freight rates o f the State- owned Ferrocarriles Argentinos were defined as a function o f the “econom ic capacity o f the users” or the “value o f the goods transported” (Argentina, Ministry o f the Economy and Public Works and Services, 1977). In many countries in the world, including a number o f Latin American ones, the use of
1 The other is the United Kingdom.
TABLEt
Latin America (11 countries): Public versus private operation of the national railway systems, 1977 and 1997
Form of operation a
1977 1997
Argentina F P bBolivia F PBrazil F PColombia F MSCChile F MSCEcuador F FMexico F MSCParaguay F FPeru F ¥1 CFUruguay F FVenezuela F F
Source; Prepared by the author on the basis of information taken from various issues of the publications Rieles, Realidad ferroviaria, International Railway Journal, and Jane’s World Railways and interviews with the General Managers of railway companies of the region.a F = operated by the federal or national government.P = operated by private enterprise.MS = mixed private/public system.
b One line still remains to be given in concession. c Privatization announced or already under way.
such criteria in fixing rail freight rates contributed to the financial difficulties and loss o f market share of the railways. To make up for this, Ferrocarriles Argentinos were favoured with a number of privileges such as exemption from import duties and heavy subsidies (amounting to US$210 million in 1977), which gave little incentive for their efficient administration.
2. Nationalizing road transport was never a logical step, and regulating such transport was a very complicated matter
The railways competed with a road transport sector which was effectively deregulated in economic as-
THE EVOLUTION OF THE STATE’S ROLE IN THE REGULATION OF LAND TRANSPORT • IAN THOMSON

C E P A L R E V I E W 64 • A P R I L 1 9 9 8 153
pects,2 but at least in the case of Argentina, this situation was not due to the conviction that it was necessary but rather to the difficulty of putting regulation into practice (Argentina, Ministry of the Economy and Public Works and Services, 1977, pp. 46 and 171), Law No. 12.346 provided for the regulation and control of road cargo transport, but it was not feasible to apply the corresponding articles, while in other countries attempts were made to regulate road transport charges, but this always proved to be impossible.
Cases of the State operation of road transport services in market economies are extremely rare. Mainly for ideological reasons, State trucking firms were set up in the United Kingdom in the late 1940s and in Bolivia in the mid-1980s, but without the slightest economic justification and without any pretence that the existing firms were in danger of bankruptcy and thus warranted a government rescue operation.
Thus, the institutional changes which have taken place in land transport in the last twenty years have had very little effect on the road transport sector, which was already privately operated and largely deregulated, except with regard to international road transport.
3. Private enterprise runs urban transport too
As regards urban bus services in capital cities and other important centres, in the period between 1977 and 1997 only Quito went against the general trend towards the replacement of public services with private ones. In Mexico City, the service was nationalized and then returned to the private sector. Twenty years ago, a large part of the bus services in major cities such as Arequipa, Brasilia, Rio de Janeiro, Sao Paulo, Recife, Lima, Mendoza and Caracas were provided by publicly owned enterprises, usually municipal, but sometimes provincial or national.
2 In this article, “deregulation” is used to refer to the elimination o f all alm ost controls on econom ic matters connected with the supply o f a service (scales o f charges, frequencies, entry into or exit from the area o f activity, etc.). In some cases, the regulation o f a deregulated market appears to be in order, meaning basically the ordering o f the market through the planning o f the services provided, while maintaining elements o f competition among the operators, which would determine the econom ic characteristics o f their services within a regulatory framework laid down by the authorities.
TABLE 2Latin America (selected cities):Private, municipal or federal/national ownership of bus companies, 1977 and 1997 a
City1977 1997
More Less M ore Less
Buenos Aires P « PL a Paz P - PSäo Paulo P M PSantafé de Bogotá P F/M PQuito P - P MM exico City P F/M P F/MbAsunción P - PLim a P F PMontevideo P - PCaracas P M P F
Source: Prepared by the author on the basis o f information co llected from interviews with public authorities and private entrepreneurs and various seminars or meetings organized by ECLAC, the Technical Committee o f the Latin American Public and Urban Transport Congresses and national bodies. a P = private ownership.
M = municipal ownership.F = federal or national ownership. In the cases o f Santafé de Bogotá
and M exico City, the public-sector bus companies belong to the districts in question, which come under the national government. b All the companies were privatized by the end o f the year.
4. The State never played a significant role in inter-urban bus transport
On the other hand, there have been few cases of participation of public enterprises in non-urban bus transport. Only in Cuba has the State played a major role in this type of transport. Although there has not been a change of ownership in inter-urban bus transport, however, there have been fundamental changes in terms of regulation in some countries.
It should be noted that in 1977 governments did participate in inter-urban passenger transport by rail and air. Many of the national airlines, such as Aeroperü, Lan Chile* Lloyd Aéreo Boliviano, VASP,
V IA SA , etc., belonged to national or provincial governments, but now they are all in private hands (leaving aside the case of the airline Iberia, belonging to the Spanish Government, which still has a share in some of them), and the State railways of almost all the countries of the region offered inter-urban passenger services. In 1997, however, except in a very few cases (Southern Chile, Cuzco-Carillanca and the Province of Buenos Aires) these trains no longer operated, or else were of little or no significance. The managements of privatized railways have shown very
THE EVOLUTION OF THE STATE'S ROLE IN THE REGULATION OF LAND TRANSPORT * IAN THOMSON

154 C E P A L R E V I E W 64 • A P R I L 1 9 9 8
little enthusiasm for operating passenger trains, except in the case of the Ferrocarril Oriente in Bolivia.
5. Governments intervened in inter-urban and urban bus transport through regulation
In 1977, private passenger transport companies, both urban and inter-urban, were subject to heavy State regulation; their fares were approved by the corresponding ministries and their carrying capacity and/or journey frequencies were controlled by the authorities. Especially outside urban areas, these companies basically played the part of contractors, i.e., of operators of services which were defined by the authorities, and they had little incentive to improve the quality of the services offered or take initiatives in their marketing. An observer of that time commented that the regulations in force impeded the entry of new entrepreneurs, inhibited competition, generated few incentives to improve the service, and worked against the efficient use of the few resources available in the sector (González Narváez, 1992).
In some countries -Brazil, for example- the regulations are still frozen in the conditions of twenty years ago. As recently as 1990, with reference to inter-urban bus transport in Brazil, EC LA C noted that “at least since 1945, no company had lost its license” to operate a line (ECLA C , 1991). Since 1990, the Brazilian government has made proposals for deregulation, but has always run into the determined resistance of monopolistic enterprises -usually only one for each route- and so far has always had to give way.
6. Traditional regulation and its problems
Generally speaking, State-owned enterprises have regulated themselves in accordance with the provisions regarding safety, technical conditions, scales of charges, etc., laid down in the legislative instruments which set them up. Sometimes, this has placed them at a disadvantage compared with private enterprises operating in the same sector which have not been obliged to comply with the same rules or which failed to comply with them because the controls or checks were not strict enough (Argentina, Ministry of the Economy and Public Works and Services, 1972, p. 176).
Private bus companies were subject to a number of regulations concerning not only technical matters or safety, but also the economic environment. An implicit or explicit concern in those regulations was the
fear that the natural action of the market could leave some market segments without service or with services of unacceptable quality. Especially in the case of passenger transport, in order to try to ensure the continued supply of suitable services governments granted concessions or permits which usually remained in the hands of the same firms almost for ever. Subsequently, in order to protect users from the monopoly powers created in this way, the authorities subjected the operating companies to a variety of rules on scales of charges, frequencies, transfer of vehicles to other services, etc.
In the particular case of inter-urban passenger transport, the application of restrictions on the number of operators and the frequency of journeys on the various routes meant that at times of peak demand the factors of occupation rose to the maximum feasible levels and many potential passengers were simply unable to travel, except perhaps by resorting to the black market ( e c l a c , 1991).
When different levels of government imposed their own rules and regulations, this led to inconsistencies: for example, sometimes there was a difference between the fares charged by services belonging to the national government and similar services run by the regional authorities. Efforts to solve these inconsistencies led to the application of similarly inconsistent measures, such as prohibiting services coming under federal jurisdiction from transporting passengers from one point to another in a province, even though their routes through the province included stops at both the points in question.
It has been noted that there was a tendency to fix fares at relatively low levels, especially in urban transport, in order to reduce the travel costs of the lower-income sectors and/or keep down inflation (E C LA C , 1992). In addition to the legal uncertainty surrounding many operations, this brought with it various unfortunate consequences, such as reluctance to renew bus fleets and overloading of the buses in service (Thomson, 1994). The result was a service with low fares but also of low quality. This situation also fostered a climate of dishonesty between the supervisory authorities and the private enterprises. In one case at least (in Rio de Janeiro), some bus firms submitted false data to the authorities on the volumes of passengers transported, in order to secure permission to charge higher fares.
In some important cases, subsidies were granted not only to public-sector enterprises, thereby encour
THE EVOLUTION OF THE STATE’S ROLE IN THE REGULATION OF LAND TRANSPORT * IAN THOMSON

C E P A L R E V I E W 64 • A P R I L 1 9 « S 155
aging their inefficiency, but also to private firms, which sometimes led to the waste of resources because the firms took advantage of the situation for their own benefit (E C L A C , 1992). A study on the developed countries concluded that out of every dollar or equivalent spent on subsidizing urban collective transport, only 60 cents went to the benefit of users, while some 40 cents of the subsidy was lost through the payment of unjustifiably higher wages, over- staffing, etc. (Bly, Webster and Pounds, 1980). In the mid-1980s, the annual deficit of the public passenger transport companies in Mexico City and Sao Paulo came to over US$ 150 million in each case ( e c l a c ,
1992).
7. A situation crying out for reforms
The institutional situation of land transport had reached a stage where fundamental changes were called for and have in fact already been carried out or begun in such countries as Argentina, Bolivia, Chile,
Mexico and Peru. In other countries the reforms are still to be embarked upon, having been delayed in some cases by the obstacles raised by vested interests favoured by the current regulations, such as bus companies which operate lines where the concessionaires never seem to have to open their activities up to competition. In the developed countries, land transport regulation was not radically different from Latin America, but it worked better because the markets were relatively stable, the bureaucracies were more efficient, and also, as far as passenger transport was concerned, public transport was less important compared with that operated by the private sector.
Reforms have been adopted in different countries, with very little connection between each other. Among the developed countries, special mention may be made of the innovations made in the United States and the United Kingdom. Interesting changes have also been made in New Zealand. In Latin America, Chile occupies a leading position in this respect. A great deal can be learned from alt these experiences.
IIThe rise and fall of State intervention
1. The rise of State intervention
Long before the Second World War, all over the world there was a tendency (in all but a few countries) towards growing State participation in the transport sector, either as an operator or as the regulator of the activities of firms operating in the sector. The State’s participation as an operator was initially motivated, in most cases, by the insolvency of railway, tramway or other enterprises due to such factors as: i) technological changes in motor transport and highways; ii) the rise in income levels (which encouraged the acquisition of private vehicles and reduced the demand for collective transport), and iii) the greater dispersion of land use patterns (which reduced the competitiveness of the traditional means of transport, which were obliged to run on permanent tracks). Moreover, in some countries such as Argentina or the United Kingdom State operation was the result of political ideologies.
Normally, State regulation precedes State operation, beginning, in the case of mechanized land trans
port, with the railways and tramways. In the case of the tramway companies, there was a clear need for regulation in the field of safety, because they share the use of public roads with other vehicles and pedestrians. As far back as the past century, however, some municipal authorities which were concerned about the monopoly status of the transport companies -as in the cases of Bogotá or Buenos Aires, for example- subjected them to controls on their scales of charges or other measures designed to guarantee the quality of the service provided to users (Jaramillo and Parías, 1995; Scobie, 1977). In later years, excessively rigid control over their charges was a very significant factor in giving rise to the nationalization or municipalization of the tramway companies ( e c l a c , 1994),
2. The railways were regulated at an early date
The arrival of the railways significantly improved people’s access to their desired destinations and considerably reduced the cost of transporting goods. Although the railway companies charged monopolistic
THE EVOLUTION OF THE STATE’S ROLE IN THE REGULATION OF LAND TRANSPORT • IAN THOMSON

156 C E P A L R E V I E W 64 • A P R I L 1 9 9 6
rates, the cost of rail transport was still below the levels of the previous means of transport, so that to begin with regulation was not aimed at economic aspects. Later, people began to forget what the world had been like before the arrival of the railway companies and they began to become aware that those companies sometimes acted in a monopolistic or discriminatory manner, which led to the application of economic regulations. This took place at the national level in the United States in 1887, with the establishment of the Interstate Transportation Commission, whose powers were extended in 1935 to the road transport of passengers and goods, partly because of the influence of the railway companies, which exerted pressure to make sure that road transport did not enjoy greater trading freedom than they did. In the United Kingdom, Parliament had begun to take an interest in regulating the railways much earlier, in 1835, and by 1940 the railways were probably the most highly regulated economic activity in that country (Dyos and Aldcroft, 1969).
3. How deregulation took place in the UnitedStates
Only in the last quarter of the twentieth century has a serious effort been made to deregulate the transport sector in the United States, through Acts such as the 1976 Act to revitalize the railways and reform the regulations affecting them, inter alia through the more flexible fixing of freight rates, and the 1978 Act on the deregulation of air transport, which set in motion a programme to liberalize air fares and entry into the industry. Later, in 1980, the well-known Staggers Act gave the railway companies greater freedom of action and the Act to reform the motor transport sector somewhat eased the rules on the fixing of charges and entry into the road freight transport industry. Four years later, the Act reforming the regulations on bus transport did the same for inter-urban bus transport (Transportation Quarterly, 1985).
Button (1990) classifies the United States regulations in three categories: i) economic regulations (on scales of charges, levels of production, number of producers, etc.); ii) social regulations (on safety, consumer protection, etc.), and iii) anti-monopoly regulations. He considers that strictly speaking deregulation has only concerned the first of these categories, although there have also been some re-interpretations in the third category which have resulted in partial
de facto deregulation (it may be noted that Button’s system of classification is rather unusual, and in fact each of the three categories includes matters often considered to belong to the economic sphere).
The arguments put forward by economists, who had worked out the high costs involved in regulation, were an important motive for deregulation. In some cases it was possible to compare a deregulated activity -such as civil aviation in some large states- with the same activity subject to regulation. It was also suggested that regulation tended to benefit established companies or the regulators themselves (Button, 1990). The theory of “contestable markets” held that free access to a market could cause a dominant supplier to act as though he was really facing competition, even though such competition was potential rather than real.3 Another factor that also prompted serious consideration of the possibility of deregulation was the lower dynamism of the economy at the time and the suggestions that growth would be promoted by an economy in which there were greater incentives. The advocates of deregulation were able to point to the fact that previous cases where there had been deregulation (such as that of road transport in Britain and various subsectors in some states of the United States) had generally been successful.
4. Deregulation and privatization in Britain
In the United Kingdom, deregulation of the transport sector took longer than in the United States, although there was a marked increase in the actions taken in this area under the Conservative governments in power between 1980 and 1996. In Great Britain, the process also involved the denationalization of urban and inter- urban bus services and the railway system (as well as the ports and civil aviation). In United States, the railway system was never in State hands (except for a short time during the rescue operation for the Penn Central Railroad) and neither were the inter-urban buses, although the urban bus services continue to belong to the government sector in many cases.
Road freight transport in Britain had already been fairly extensively deregulated in 1968 by a Socialist government, but the first decisive step towards
3 Button mentions that one consequence o f deregulation o f civil aviation was the lowering o f fares on main routes but their increase on lower-volume routes where there was no competition. In other words, in practice the full validity o f the theory o f contestable markets still remains to be seen in some cases.
THE EVOLUTION OF THE STATE’S ROLE IN THE REGULATION OF LAND TRANSPORT • IAN THOMSON

C E P A L R E V I E W 64 * A P R I L 1 9 9 8 157
general deregulation was only taken in 1980, with the adoption of an Act which liberalized non-urban bus transport and promoted the privatization of the public operating companies in that field. In the mid-1980s, comparable measures were taken with respect to urban bus transport outside London. In London, the bus companies were privatized, but rather than liberalizing supply, a regulated scheme was introduced which included the award of bus routes by tender,4 As far as land transport is concerned, the process was completed with the privatization of the railways between 1994 and 1997.
The Labour government which took office in the latter year has not shown any interest in re-nationalizing the railway system, although it does aim to strengthen the regulation of the companies in that field or to use the threat of greater regulation as a means of promoting greater concern with the quality of the services offered to the public or an increase in investments (box 1). Nor does it envisage re- nationalizing the bus sector, although it does aim to regulate the services operated.
4 Initially, it was also intended to deregulate bus transport in London. Subsequently, however, there was an exchange o f views and reports on this matter between the Managing D irector o f the State-owned London Transport company and the ECLA C Transport Unit, which recommended that bus transport in big cities like London should not be deregulated. It is not known up to what point the EC L A C recommendations influenced this change in policy.
5. Not much Is happening in this respect In other developed countries
In other European countries there seems to be a certain lack of interest in the logic behind the British deregulation and privatization processes, although these generally seem to have been successful. On the European continent, greater importance is attached to such matters as the integration of the transport system, and it is considered that the global objectives of the State in the field of transport can be achieved more effectively if it is the State itself which operates the system. With regard to ports, whereas in the United Kingdom the financial results are taken as the framework for analysis, on the other side of the Channel greater attention is given to their contribution to the development of the areas in which they are located. In the Continental European countries, the changes which have taken place are due mainly to decisions taken at a higher level, that is to say, at the level of the European Union rather than that of the governments of each country. There is a great deal of discussion of the British and United States experience, but it has not influenced the policies of other developed countries very much.
A notable exception is New Zealand, where the privatization and deregulation process displays many similarities with Great Britain. Indeed, the same private enterprises have even acquired concessions in both countries in some cases: the United States company Wisconsin Central in rail freight transport, for example, and the British firm Stagecoach in the field of urban bus services.
6. In Latin America, deregulation began in Chile
In the mid-1970s, a thorough-going reform of the economy was carried out in Chile which included quite comprehensive liberalization of economic activities, including transport. Road freight transport was deregulated first, in 1975, through the application of an anti-monopoly law (the previous government had controlled not only entry into this area of activity and the value of freight charges, but even the importation of trucks, granting a virtual monopoly to a Spanish make of truck). Later, between 1977 and 1979, the entry into and exit from inter-urban bus transport was liberalized, together with the fares charged. Subsequently, through a process which was only completed in 1987, the same was done in the case of urban bus transport (E C L A C , 1987).
B o x 1
T H E TH R EA T OF G REA TER REGULATION AS AN IN CEN TIV E FOR M O RE COM PETITIVE
B EH A V IO U R BY EXISTING COMPANIES IN M ONOPOLY M ARKETS
The theory o f contestable markets was developed and applied in the context o f the possible entry of new competitors as an incentive for more com petitive behaviour by existing companies with monopoly powers. The same behaviour can be induced, however, by the threat o f greater regulation. Cases o f the latter type o f reaction include the fares policy o f the North Eastern Railw ay in England last century, the reduction in fares (after an increase which the M inister for the sector considered to be unjustified) decided upon by the association o f urban bus operators in Santiago, C hile, in the early 1990s, and the investment policies o f some o f the recently privatized British railway companies when the Labour government took o ffice in m id-1997.
THE EVOLUTION OF THE STATE’S ROLE IN THE REGULATION OF LAND TRANSPORT • IAN THOMSON

158 C E P A L R E V I E W 64 • A P R I L 1 9 9 6
The promoters of this Chilean deregulation process were not, generally speaking, transport engineers or professionals but general economists of the Chicago school who usually tend to lump together many different sectors of the economy. On one occasion, the Minister of Transport and Telecommunications (a Chilean Air Force General), tried to keep in being some quantitative regulations on the fleet of buses operating in Santiago, but the opposing opinion of the Minister of Finance (an engineer who shared the neo-liberal economic ideas of the Chicago school) prevailed (Thomson, 1992).
It should be noted that, as part of the deregulation process in Chile, serious attempts were made to maximize the efficiency of the market through, for example, various measures designed to give bus users the necessary information for making a rational choice between the different services offered, to defend users’ rights, and to promote responsible conduct by the operating companies (through heavy fines for the loss of baggage on inter-urban buses, consideration of bus tickets as a legal contract between the entrepreneur and the passenger, etc.).
The Chilean experience in deregulating transport was quite heavily criticized in other countries of the region, rightly in some cases and wrongly in others (the fact that the reforms were introduced under a military government doubtless increased the amount of criticism). In freight transport, the Chilean reforms did not result in a set of institutions very different from those in other countries of the region, but in inter-urban passenger transport for a number of years there were no other countries in the region which had policies anything like those adopted by Chile or a comparable situation. Although criticized abroad, especially by entrepreneurs in countries where they were still benefited by the existing regulations, there is little doubt that the new Chilean policy was generally speaking a success, leading to highly competitive and efficient services. The bus companies make a profit and the users can choose between different qualities of service (mostly very good), at fares which also vary but are generally below those charged in other countries analysed by e c l a c in the early years of the present decade ( e c l A C, 1991).
It may also be considered that deregulation has likewise been a success in almost all Chilean cities, although in the biggest urban centres, especially Santiago, it led to a number of problems connected with levels of fares, congestion and air pollution. On the
positive side, the coverage of the services has notably improved. The reasons why deregulation has not been so successful in the larger cities have been analysed by e c l a c elsewhere (see, for example, Thomson, 1993). Although in the 1990s the government introduced regulations in Santiago which are considerably different from those existing fifteen years earlier, it is significant that no major changes have been made in the economic rules governing inter-urban passenger transport or urban transport in other cities.
7. Deregulation has crossed frontiers, but notmany of them
The only other country which has adopted a deregulation scheme as comprehensive as that of Chile is Peru, where in fact the measures were of even greater scope, since authorization was given for the importation of used vehicles, many of which, brought from Asian countries, were acquired by small entrepreneurs and placed in service in Lima or other cities. Moreover, the use for purposes of collective transport of vehicles half way in size between a private car and a small bus, which is prohibited in Chile, is not subject to any such restrictions in Peru, where there has been a proliferation of such vehicles, known as Com- bis (after the passenger van made by Volkswagen).
Legislative Decree No. 640 of 25 June 1991, which eliminated “all administrative and legal obstacles impeding the free access of new concessionaires” was applied to inter-urban transport, but on some routes insufficient checks on the mechanical condition of the vehicles or shortcomings in the safety regulations led in 1997 to the decision to temporarily freeze the number of vehicles. Later in the same year, a draft Supreme Decree included among its preambular paragraphs the statement that “interprovincial bus passenger transport is in a state or emergency” because of the high indices of accidents and other factors (CID ATT, 1997). The new draft proposes the restoration of a system of concessions.
In Lima, the individual municipalities grant concessions for the operation of bus services, but not with any intention of limiting the number of vehicles. In any case, many vehicles operate without the corresponding concession. It is estimated that in mid-1997 some 55,000 collective transport vehicles were operating in Metropolitan Lima. There is already a great deal of interest at both the metropolitan and municipal level in the possibility of reordering and rationalizing the network of collective transport routes.
THE EVOLUTION OF THE STATE'S ROUE IN THE REGULATION OF LAND TRANSPORT • IAN THOMSON

C E P A L R E V I E W 64 • A P R I L 1 9 9 6 159
TABLE 3
Argentina: Some indicators of inter-urban bus transport before and after deregulation of the services, 1990-1995
YearNumber
ofcompanies a
Number o f buses in service
Average age of fleet
Coefficientof
occupation
1990 152 2 597 5.8 n.d.1991 158 2 597 5.6 0 .701992 160 2 844 5.3 0 .621993 164 2 934 5.1 0.541994 165 3 278 4.4 0 .501995 171 3 695 4.2 0.38
Source: Compendio estadístico del transporte en la Argentina. Ministry o f Public Works and Transport, Buenos Aires, 1996. a Only a marginal increase in the number o f companies was possible, because o f the features of the type o f deregulation adopted.
In Argentina, inter-provincial bus transport was deregulated in 1992, with results which were not evaluated in a general manner until late 1997. The operating companies complain of low profits, but users may well be satisfied with the new situation. As often happens when a bus transport service is deregulated, supply has increased more than demand, and coefficients of seat occupation have gone down (table 3). As long as the situation thus created does not lead to severe imbalances, it will doubtless be preferred by users to the previous situation.
This state of affairs can only last if operating costs have gone down since the application of the regulations, thus allowing the companies to obtain adequate profits at lower rates of occupation than before, or if the previous profits had been exces
sively high. In Argentina, there have still not been any important changes in terms of regulation of urban collective transport, regardless of whether it comes under federal, provincial or municipal jurisdiction.
In Bolivia, inter-urban bus transport has been deregulated and there has been a significant easing of the regulations regarding urban transport. In Latin America, as in Europe, however, cases of deregulation are still the exception rather than the rule. Chileans sometimes style themselves “the Englishmen of Latin America”, and in view of the fact that the deregulation of transport in both Chile and Great Britain has aroused relative skepticism in many other Latin American countries and in Continental Europe, respectively, perhaps they are right.
8. Privatization is moving forward faster thanderegulation
The progress made in many Latin American countries in the privatization of transport services has been more notable than in the case of deregulation. At the end of the twentieth century, the only national railway systems in the region which will still be in the hands of the State are likely to be those of countries where this means of transport is of little relative importance, such as Paraguay and Venezuela (leaving aside the special case of Cuba). The only urban or inter-urban buses that will remain in public hands are likely to be those of some Brazilian cities, some trolleybuses in Argentina and Ecuador, the Metrobus system in Caracas, and some municipal buses in Quito (once again leaving aside the special case of Cuba).
THE EVOLUTION OF THE STATE’S ROLE IN THE REGULATION OF LAND TRANSPORT • IAN THOMSON

The economic regulation of transport in the present circumstances
It is increasingly frequent nowadays to meet with two situations in terms of transport: private enterprises resulting from the sale or concession of public enterprises which previously controlled a transport market (case A), and subsectors of the transport area where the regulations previously applied to private operators have been eliminated or are considered to be excessively restrictive and are on the point of being reformed (case B). The problems of regulation are not the same in both these cases,
1. Case A
a ) C o m p a n ie s w ith so m e m o n o p o ly p o w e r s
In case A, the private enterprises thus formed are usually operating in a market where they have some monopoly powers. It is therefore desirable to adopt some specific legal instruments to ensure that they do not exploit those powers for their own benefit against the interests of the community. For example, the manipulation of its own freight rates could enable a railway company to internalize for itself an excessively high proportion of the surpluses of its captive clients. The same could occur in the case of a highway whose management is entrusted under a concession to a private company which is allowed to collect tolls.
Save in exceptional cases, the monopoly power of a transport company is far from being complete, because of the existence of other transport options which may be less attractive for the client (such as trucks, which are an alternative to trains, or alternative routes to a highway which has been granted in concession). Although trucks can also transport bulky products such as minerals, however, they would only do so at a higher cost, while alternative routes are rarely attractive options.
Perhaps the State does not always need to worry too much about the distribution of profits between, say, a railway company and a mining firm.5 High freight charges may adversely affect economic progress, however, and not merely influence the distribution of the fruits of that progress among the companies
involved. Thus, for example, charging freight rates much higher than the marginal costs could discourage investments in new mines which would be made if the freight rates offered were more reasonable.
A monopolistic enterprise (the railway, in our example) might charge lower freight rates to new clients, which would give rise to accusations of discriminatory treatment, as well as discouraging new investments by its traditional client.
The latter company could solve its problem by obtaining the concession to operate the railway from the government in the corresponding tender process or obtaining it subsequently from whoever won the concession. If it did this, it would lower the freight rates it charged itself and raise them for its competitors, with the opposite results to those described in the previous paragraph.
At all events, charging high freight rates to maximize the income of the railway company could divert part of the traffic to the highways, with social costs which might be considerable in terms of i) an increase in traffic accidents, ii) damage to the road surface due to the high axle loads of the trucks, andiii) delays caused to the occupants of light vehicles stuck behind slow-moving trucks on the roads serving mining areas.
b) R e g u la tio n o f c o m p a n ie s e n jo y in g so m e m o n o p o ly p o w e rsIn some cases, it would be desirable for govern
ments to retain some rights to intervene in the freight rates charged, perhaps by ensuring that they maintain a reasonable relationship with the corresponding marginal costs, in'order to ensure non-discriminatory treatment of clients and to keep the profitability of the railway company within reasonable limits.
5 It may be noted that a mining client may depend on a railway company for the transport o f its products, or the opposite may be the case if mineral traffic is o f prime importance for the railway. An interesting example o f this is the CentroM in mining complex in the Central Highlands o f Peru and the Ferrocarril Central, both o f which are State enterprises in the course o f privatization.
THE EVOLUTION OF THE STATE’S ROLE IN THE REGULATION OF LAND TRANSPORT • IAN THOMSON

C E P A L R E V I E W 64 • A P R I L 1 6 9 6 161
In case A, the general, anti-monopoly and other legal regulations are not sufficient, among other reasons because of the confidential nature of commercial contracts (one client cannot know how much another is being charged). In concession contracts it is necessary to ensure that the monopoly enterprise does not take advantage of this status and also has incentives to improve the quality of the services offered and reduce their cost.
In the United States, this problem is solved basically by defining a reasonable rate of profit for the monopoly enterprise. The principle preferred in the United Kingdom is to set the rates that the company is authorized to charge for a period of five years, expressed in the form of a number of percentage points above or below the consumer price index (Powell, 1992). Both systems have their advantages and disadvantages. The United States system makes it possible to ensure interest by investors and to maintain profitability even when there are unexpected fluctuations in the cost of inputs, but if the profitability allowed is set somewhat higher than the market levels, this could encourage the companies to make unnecessary investments simply in order to maximize the yield on their capital. Under the British system, the companies would have more incentive to reduce their costs, but sometimes it is not easy to define the adjustments authorized in their scales of charges.
c) Privatization of rail services in Britain: the role of the leasing companies In the particular case of the British railway sys
tem, the privatization system separates the administration of the permanent way from the operation of the trains. A natural monopoly company, Railtrack, administers the permanent way, while more than 20 other companies operate the trains in different sectors of the system. The authority responsible for regulating the railways (the Rail Regulator) requires Railtrack to reduce its charges by 2% per year in real terms, in view of the possible savings in maintenance costs. Variations in the passenger fares charged by the monopoly operating companies, especially those providing urban or suburban services, are also subject to real maximum values (Glover, 1996).
The British rail privatization system includes various mechanisms for ensuring a suitable level of competition and incentives for the provision of services of satisfactory quality. Thus, for example, the concessions for the passenger services last for be
tween 7 and 15 years, after which they are put up for tender again. Some operating companies are negotiating longer concessions in return for additional investments over and above those provided for in the contracts. A particular feature of the British railway privatization system is that the operating companies are not obliged to acquire their own equipment; initially, the whole of the rolling stock was in the hands of leasing companies (likewise privatized). There is also the option of acquiring new equipment through one of the leasing companies, of which there are three. Some operators prefer to acquire their new equipment from such companies, whereas others purchase it directly, or else through their parent companies.
2. Case B
a) The problems of a deregulated marketIn case B the potential monopoly could also be a
problem. In inter-urban passenger transport, for example, a company which already dominates the market could try to wipe out other competitors with smaller financial capacity by charging very low fares until it forces them to withdraw from the market. Situations of this type have occurred in Chile in the bus transport market and in civil aviation and have been taken to the courts. At the international level, similar actions taken by Pan American and British Airways effectively wiped out the commercial threat presented by the incipient Laker airline.
Big firms could also defend themselves against competition in other ways; for example, by building their own terminal and leaving the terminal used by the other companies, or making their services always leave a few minutes earlier than the others (there have also been occasions when the windshields or tyres of vehicles belonging to new competitors have been mysteriously broken).
In some cases there could be a monopolistic union through agreements between operating companies to control fares or restrict supply. Normally, such agreements do not take the form of written documents and it is hard to prove their existence. It is almost certain, however, that in Santiago, Chile, in the 1980s and in Lima ten years later, the collective transport operators came to agreements for a coordinated rise in fares.
Especially in the case of urban public transport, deregulation could also lead to over supply by encouraging an excessive entry of new operators because they do not need to pay the marginal social
THE EVOLUTION OF THE STATE’S ROLE IN THE REGULATION OF LAND TRANSPORT • IAN THOMSON

162 C E P A L R E V I E W 64 • A P R I L 1 9 9 8
costs that they cause.6 These costs are connected with traffic congestion, air pollution and accidents. Something similar takes place in the case of road transport of goods: the taxes usually charged do not cover the corresponding road maintenance costs in the case of vehicles with high axle loading.
In case B, the market would appear to be potentially open because of the lack of obvious barriers to the entry of new operators. However, a latent barrier -such as the threat of a price war or something like that- could effectively discourage the entry of new companies.
In case A, a transport operator can discriminate between different groups of clients, but this possibility is not usually open to companies in case B.
b) P u tt in g o r d e r in a d e r e g u la te d m a rke t, w ith o u tg o in g b a c k to th e p a s tThere can be little doubt that the regulations ap
plied in the past reduced the commercial motivation of entrepreneurs. The problem that must be faced now in the field of transport is how to regulate activities in such a way as to ensure that the market is competitive and that the social benefits exceed the social costs caused, yet without strangling the greater efficiency that privatization and deregulation are supposed to generate and allowing the private firms to use all their initiative to develop markets and reduce costs.
In deregulated markets, as already noted, a big firm could try to dominate the market, or operators could join together, either formally or informally, for the same purpose. Anti-monopoly laws can limit such tendencies, although sometimes it is difficult to prove the existence of monopolistic actions, especially if there is no written or recorded evidence of the apparent concerted action of the operating firms.7 When a dominant company tries to wipe out smaller companies operating in the same market, the latter may win in court, but only after they have been
6 The word “oversupply” is very freely used but is not very clearly defined. W ith regard to deregulated markets, ECLAC uses it in the sense o f the supply generated when operators do not have to pay the whole o f the marginal social costs corresponding to their actions,7 If the users are few in number and well organized, they could make investigations aimed at proving the existence o f anticompetitive practices which adversely affect their interests. Bus passengers, however, are very numerous and are not usually organized, although in some countries institutions have recently been set up to defend consum ers’ interests.
wiped out commercially (as occurred in the case of Laker Airlines). One way of partly solving problems of this type is to oblige the big company to pay compensation which is higher than the damage suffered by the companies affected by its actions, as is done in the United States.
It often happens that a company temporarily works at a loss in order to wipe out the competition by such actions as reducing fares to levels below cost and making its services leave a few minutes before those of the rival company in order to take passengers away from it, but once the competition has been wiped out its raises the fares again, sometimes to levels considerably higher than its costs. One way of discouraging such practices is to require that any change in fares, routes or frequencies must be announced well in advance. This would at least mean that the company engaging in such practices would have to keep on offering its special low fares for some time after the withdrawal of its competitors. In Great Britain, bus companies are required to inform the authorities of modifications in their services at least 42 days before putting them into effect; the reason for this is to give the authorities time to arrange socially useful services (by granting subsidies) when the market stops providing them and also to produce timetables for the services, but it would also serve to reduce the incidence of anti-competitive practices.
As already noted, in Santiago (Chile) the almost complete economic deregulation of the public transport system came to an end in the early 1990s. The Ministry of Transport and Telecommunications decided to identify the services that should be operated and granted concessions for their operation, by tender, to companies in the private sector, normally made up of die members of bus owners’ associations which had provided the services previously. Generally speaking, the experience in Santiago has been quite successful (Thomson, 1995).
In Santiago, the maximum duration of the concessions is seven years, after which each route is put up for tender again. If the term of the concessions were longer, the companies could construct their own facilities for maintaining their vehicles, but this would weaken the competitiveness of the market and the companies would have fewer incentives to offer good quality services to their clients, although if the companies had their own workshops the buses would probably be better maintained than if they used commercial workshops, especially if each owner indi
THE EVOLUTION OF THE STATE'S ROLE IN THE REGULATION OF LAND TRANSPORT • IAN THOMSON

C E P A L R E V I E W 64 • A P R I L 1 9 9 8 163
vidually arranges the maintenance of his bus or buses with the latter.
One way out of the controversy over the respective virtues of short or long terms for concessions could be the establishment of leasing companies for workshops, which would lease them to the companies holding concessions. As far as is known, this is not done anywhere in the world; the case of the leasing of railway rolling stock in Great Britain is no different in principle, however, except that workshops are immovable pieces of real estate, while rolling stock can be moved from one place to another.
The Santiago system of granting bus route concessions by tender also solves the problem of the probably excessive expansion of the number of vehicles which tends to accompany the deregulation of collective transport. The best solution would be to charge each bus a toll which reflects the social costs of the congestion, pollution and accidents caused by its presence on the streets. Until a system of charges to private vehicles for road use is adopted, however, it would not be appropriate to think of applying it to collective transport.
(Original: Spanish)
B ib l i o g r a p h y
Argentina, Ministry of the Economy and Public Works and Services (1972): E studio pre lim in a r del transporte de la región m etropolitana, B uenos A ires.
(1977): P lan N acional de Transporte. A n tecedentesh istóricos 1965-1977 , vol. 1, B uenos A ires.
A rgentina, M inistry o f Public W orks and T ransport (1996): C om pendio estadístico d e l transporte en la A rg en tin a , B uenos A ires.
B ly, P., F . W ebster and S. Pounds (1980): Subsidisation o f U rban Public Transport, R eport SR .541, C row - thom e, U nited K ingdom , T ransport and Road R esearch Laboratory.
B utton, K. (1990): T ransport regulation in advanced cap italist nations: The case o f USA, D eregula tion an d Transport, London, D avid Fulton Publishers.
CIDATT (A dvisory C entre for L and T ransport Research and D ocum entation) (1997): El serv icio público de transporte interprovincial de pasajeros por carretera en óm nibus, B iblioteca de Transporte, vol. 7, Lima.
D yos, H. and D. A ldcroft (1969): B ritish Transport: A n E conom ic Survey fro m the Seventeenth Century to the Tw entieth, H arm ondsw orth, U nited K ingdom , Penguin Books.
ECLAC (E conom ic C om m ission fo r Latin A m erica and the C aribbean) (1987): Transporte in terurbano de p a sa je ro s en Chile: inform e principa l, L C /R .5 2 0 -R ev .l, Santiago, Chile.
(1991): E l transporte in terurbano p o r bus en A rg en tina, B rasil y Chile: un análisis com parativo, L C /G .1662, Santiago, C hile , June.
(1992): The im pacts o f subsidies, regulation and d iffe r e n t fo rm s o f ow nership on the service quality an d operational efficiency o f urban bus system s in Latin A m erica , L C /L .675, Santiago, Chile.
(1994): The developm ent o f urban p u b lic transportin Latin A m erica an d the w orld, L C /G .1817, Santiago, Chile,
G lover, J. (1996): N ational R ailw ays: A G uide to the P rivatised R ailw ay, Shepperton, U nited K ingdom , Ian A llen Publishing.
G onzález N arváez, C. (1992): L a desregulación del autotransporte federal en M éxico y sus perspectivas, Sem inario sobre au toridad de control en e l sector transporte, B uenos A ires, M inistry o f the E conom y and Public W orks and Services.
In ternational R a ilw ay Journal (several years): Bristol, C onnecticut.
J a n e 's W orld R ailw ays (several years): Surrey, Canada, Jane’s Inform ation G roup Lim ited.
Jaram illo , S. and A. Parías (1995): Vida, pasión y m uerte del tranvía en B ogotá , CEDE docum ent No. 3, San- tafé de B ogotá, U niversity o f the A ndes, C entre for E conom ic D evelopm ent S tudies (CEDE).
Pow ell, T. (1992): Tendencias in ternacionales en la privatización y desregulación del transporte: experiencias de nuevas autoridades de control, Sem inario sobre A uto rid a d de C ontrol en e l Sector Transporte, B uenos A ires, M inistry o f the Econom y and Public W orks and Services/GTZ (G erm any), June.
R ealidad F erroviaria (several years): B uenos A ires, Fundación Instituto A rgentino de Ferrocarriles.
R ieles (several years): B uenos A ires, M agazine Satelital, S.R.L.
Scobie, J. (1977): Buenos A ires: D el centro a los barrios, 1870-1910, B uenos A ires, Solar/H achette.
T hom son, 1. (1992): U rban bus deregulation in C hile, Journal o f Transport Econom ics and P olicy, vol. 26, No. 3, London, London School o f E conom ics and Political Science.
(1993): La desreglamentación del transporte autobuserourbano e interurbano: cóm o funciona y cóm o podría funcionar m ejor, M em oria de l VI C ongreso Latinoam ericano de Transporte Público (CIATP) y del V I
THE EVOLUTION OF THE STATE’S ROLE IN THE REGULATION OF LAND TRANSPORT • IAN THOMSON
164 C E P A L R E V I E W 64 • A P R I L 1 9 9 8
E ncuentro Latinoam ericano de Transporte U rbano (ELATU), San José, C osta R ica, FU N D ESTR A .
-(1994): The transportation system s o f Latin A m erican cities: H ow they m ight better serve the needs o f the poor, E nhancing the M anagem ent o f M etropo litan L iving E nvironm ents in Latin A m erica , U N CRD ,
Research Report Series, No. 1, Nagoya, Japan, United Nations Centre for Regional Developm ent (U N C RD ).
(1995): U na evaluación crítica de algunos aspectosdel desarrollo del sistem a de transporte urbano de Santiago, in F. M artínez C oncha (ed.), A ctas del V il C ongreso Chileno de Ingeniería de Transporte, Santiago, C hile, Sociedad C hilena de Ingeniería de T ransporte (SOCHITRAN
Transportation Q uarterly (1985): Joint C onference, Eno Foundation, B oard o f D irectors and B oard o f C onsultants, W estport, CT, April.
THE EVOLUTION OF THE STATE’S ROLE IN THE REGULATION OF LAND TRANSPORT • IAN THOMSON

Miguel Solanes
Regional Advisor on
Water Law and Public
Services Regulation, ECLAC.
CEPAL REVI EW 64 165
Integrated watermanagement from the
perspective ofthe Dublin Principles
T his article analyses the relationship betw een the D ublin
Principles o f 1992, integrated w ater p lanning and w ater law.
T he Dublin Principles were an attem pt to concisely state
the m ain issues and thrust o f w ater m anagem ent: fresh w ater
is a finite and vulnerable resource, essential to sustain life, de
velopm ent and the environm ent; w ater developm ent and
m anagem ent should be based on a participatory approach,
involving users, planners and policy-m akers at all levels;
wom en play a central part in the provision, m anagem ent and
safeguarding o f water, and w ater has an econom ic value in all
its com peting uses, and should be recognized as an econom ic
good. T his report does not aim to endorse any single given
m odel or solution, but to provide a set o f a lternatives and expe
riences w hich m ay be useful to readers seeking inform ation
about institutional issues affecting w ater m anagem ent. Globally,
w ater law provides exam ples o f system ic approaches to w ater
resources m anagem ent including, w ith varying degrees o f com
pleteness, principles and norm s relevant to integrated w ater
m anagem ent and planning. How ever, m anners o f approach and
degrees o f developm ent differ. A m ong these differences are
those relating to ethics in integrated w ater m anagem ent, the
capabilities o f the responsible agencies, the generally scant
public participation, inform ation, w ater rights and planning,
w ater pricing and the lim its o f planning.
A P R I L 1 9 9 8

166 C E P A L R E V I E W 64 * A P R I L 1 9 9 8
IIntroduction 1
In this paper policies, planning and integrated management are considered as steps within a unitary -albeit not always harmonious- process. The purpose of this article is to identify subjects, topics and elements relevant to planning and to suggest areas where the law may need to be further developed in order to improve decision making. It is assumed that the final objective of a planning process is the best possible consideration and integration of environmental, economic and social elements in sustainable water resources management.
Water is not an ordinary commodity. It is a natural element crucial to environmental processes, social well- being and economic viability and development. It has special economic characteristics which include, inter alia, public good aspects; externalities; imperfect competition; risk, uncertainty, and imperfect information; potential for social and environmental inefficiencies and inequity, and vulnerability to monopolization.2 This is why the American Society of Civil Engineers endorses legislation recognizing that water by its very nature requires integrated management and can benefit from comprehensive planning (Matthews, 1994).
In operational terms, integrated water management can be understood in at least three ways: integration of the different water components; integration of water, land and environmental concerns and resources; and integration of water within social and economic development (Mitchel (ed.), 1989, p. 203.
The concept of planning is bivalent. It can be understood as a set of arrangements, or as a method
1 The Dublin Principles were adopted at the International Conference on Water and the Environment, held in Dublin, Ireland, from 26 to 31 January 1992. They consist of four main statements laid down at the Conference, on which the present article comments in order to relate them to integrated water management and water law. These principles are: i) fresh water is a finite and vulnerable resource, essential to sustain life, development and the environment; ii) water development and management should be based on a participatory approach, involving users, planners and policy-makers at all levels; iii) women play a centra] part in the provision, management and safeguarding of water; and iv) water has an economic value in all its competing uses and should be recognized as an economic good.2 For a general description, see Colby-Saliba and Bush, 1987.
for doing things. While the present article refers to technical concepts and ultimate goals, such as sustainability, efficiency and equity, it also attempts to bring to the discussions some concepts of strategic management borrowed from the private sector. Such transplantation of concepts has been prompted by a perception of the need to avoid the rigidity, determinism and lack of rational assessment of projects observed in some national systems for water management. Additional reasons include the fact that several exercises in water management in developing countries -particularly those related to water as an input or intermediate good- seem to assume that water-related products are isolated from global competition. On the contrary, however, private strategic water management is keenly aware of the dynamics of the markets in all their branches.
In some developing countries water management includes public policies to simultaneously achieve multiple policy goals relating to development, decentralization and environmental protection, without allowing for enough time or resources for collecting data, establishing capabilities and determining imple- mentable strategies. While the substantive aims of these policies are legitimate, their practical implementation would benefit from the experience of the private sector in phasing activities according to substantive priorities and capabilities, within a comprehensive strategy.
Some recent experiences and decisions in Latin America, such as dam construction in Western Argentina, raise the question of ethical considerations in water policy and planning: a subject not always considered in water planning, but one which seems to be standard content in modem private strategic management.
In the context of water resources, ethical notions are closely related to efficiency and equity. Efficiency in the use of scarce water resources is a requirement of sustainability. However, few legal systems have legally binding rules, laying down standards and thresholds, for the economic and social evaluation of projects, and almost none include procedural rules allowing the public to effectively object to programmes on grounds of economic inefficiency or social inequity.
INTEGRATED WATER MANAGEMENT FROM THE PERSPECTIVE OF THE DUBLIN PRINCIPLES • MIGUEL SOLANES

C E P A L R E V I E W 64 • A P R I L 19 S8 167
Equity is in many respects closely related to efficiency, since the impact of inefficient public decisions, usually embodied in subsidies burdening the taxpayer, is bome by the public through higher taxes and diminished funds for public services. Another dimension of equity is the possibility of access to water resources and to water-related products at reasonable prices. Systems that facilitate monopolization do not favour equity. Access and competition are thwarted and prices are higher than they would have been in a competitive system.
In operational legal terms, norms intended to protect environmental values -both substantively and procedurally- appear to be more evolved than those providing substantive and procedural protection against economically inefficient decision-making, despite the fact that economic analysis has well-established methods for the assessment of this aspect.
As a result, relatively better placed special interest groups are sometimes able to obtain specific economic benefits, through subsidies resulting from inadequate economic assessments. In this latter respect there seems to be a parallel between the co-opting by private interests of those responsible for regulating public utilities -a well-known subject- and the co-opting of decisionmakers responsible for water resources management and water development projects
The issue of leadership is also relevant. In some cases, good technicians prepare well-thought-out proposals, only to find later on that they are systematically disregarded by policy levels sensitive to vested interests.
This article, which covers legislation, planning, organization, participation, financing and capabilities, has been organized according to the headings of the Dublin Principles.
IIFresh water is a finite and vulnerable resource, essential to sustain life, development and the environment
1. Policies
An important preliminary task is to identify the overall purposes of water resources management. Howe and Da Cunha state that the guiding principle should be the achievement of equity and efficiency, to which it seems appropriate to add “within a context of sustainable development” (Howe, 1996a, p. 30; Da Cunha, 1989, pp. 57-69, and Howe, 1996b).
Several countries state the purposes and objectives of their water policies in their water legislation. The statement of policies is relevant to the interpretation, application and enforcement of legislation on integrated water management.
The recent Brazilian Law on Water Policies and the National System for Water Management are good examples of this trend: water is a public good which has an economic value, is capable of multiple uses, and should be managed at the river basin level, according to principles of decentralization and participation (Water Law (No. 9433) of 8 January 1997).
The Law pursues multiple objectives: protection of the interests of future generations, integrated and rational utilization, sustainable development, and prevention of, and protection from, natural disasters (art. 2). It lays down legal principles for the implementation of the National Water Policy, namely: a systemic approach, integrating considerations of both water quality and quantity; adjustment of management principles to specific regional situations; integration between water management and environmental objectives; integration of users, regions, states and the National Government into the planning process; integration between water and soil management; and integration of river basins, estuaries and coastal areas.
Several laws include policy principles where the multiple roles of water are recognized.
The Canadian Water Act of 1970 encourages optimum use of water resources for the benefit of all Canadians (art.l). The Environmental Assessment Act of 1992 aims to ensure that environmental effects of projects are carefully considered; to promote sus-
INTEGRATED WATER MANAGEMENT FROM THE PERSPECTIVE OF THE DUBLIN PRINCIPLES • MIGUEL SOLANES

168 C E P A L R E V I E W 64 • A P R I L 1 9 6 8
tainable development for a healthy environment and a healthy economy; to make sure that projects do not cause significant adverse environmental effects, and to assure public participation. The Act applies to projects where the Federal Government has decisionmaking authority.
The aim of the 1988 Water Law of China is to ensure the rational development, utilization and protection of water resources, fully realizing the benefits of water for economic development and the livelihood of the population.
The Water Law of Germany (as amended on 23 September 1986) provides that water (both surface and ground water) must be managed in a manner that serves the common interest, benefitting individual users while preventing avoidable harmful impacts (art. la).
New Zealand’s Resource Management Act of 1991 (which includes water) defines the legal meaning of sustainability (meeting the reasonably foreseeable needs of future generations; safeguarding the life-sup- porting capacity of water, soil, air and ecosystems; avoiding, mitigating and remedying adverse effects on the environment). Criteria and standards for the measurement of sustainability are provided. They are divided into two hierarchical groups: “Matters of National Importance” and “Other Matters”, which must be taken into account in decision-making and which include environmental, social, and economic issues.
The Netherlands’ “Policy Document on Water Management” (1991) establishes a policy of integrated water resources management which includes both quantitative and the qualitative aspects.
Some systems, such as that for the Mississippi in the United States, include details of goals, objectives, means and tools: maximum beneficial use; no waste; maximum economic development compatible with other uses; environmental protection; drainage and flood control; water storage; the issue of permits; water quality preservation and enhancement; water policies; and emergency situations.
The connections between general socio-economic conditions (and plans or programmes) and the use and protection of natural systems have been specifically pointed out in the Brundtland Report. Japan, Poland and Nigeria, as well as France, seek to integrate water management within national economic and social policies and plans (Mitchel (ed.), 1989, pp. 203-204).
The concept of integrated water management is not only a concern of individual countries. In Europe, the Single European Act of 1986 has adopted the
principle of a Community Environmental Policy which makes it possible to consider the implementation of integrated water resources management policies, with special attention to non-structural water management measures (Da Cunha, 1989, pp. 57-69).
2. Integrating environmental elementsinto water law
The environmental dimension of water is a major component of water legislation. Permits, prohibitions and charges are used to curb the deterioration of water and related natural resources and environmental assets.
The Canadian Water Act provides for the designation of water quality management areas and the implementation of water quality management programmes (art. 11). Water quality management agencies must plan, initiate and carry out programmes to restore, preserve and enhance the quality of the waters within the water quality management area (art. 13).
The Water Law of China makes it the duty of the State to protect and improve the environment. Agriculture must be practiced with a view to promoting high but stable agricultural yields (art. 15). Hydropower development must be carried out in accordance with protection of the ecological environment (art. 16). Adverse environmental impacts in the implementation of inter-basin transfers must be prevented (art. 21). Additional rules control waste disposal, mining activities, land reclamation, construction of projects, and creation of management and safeguard zones (arts. 24 to 29).
The German Water Law imposes a general duty to prevent water contamination and detrimental changes in its properties, requiring “economical use of water in the interest of natural water resources” (art. la). Waters can be subject to characterization parameters issued by the Federal Government, (art. 36b). The Law also provides for the maintenance of proper flow conditions, maintenance of navigation, ecological requirements, landscape features, protection of banks, and self-purification (art. 27).
The policies of the Netherlands on the environment and water aim primarily at securing and maintaining a safe and habitable country and developing and maintaining healthy water systems which guarantee their sustained use (Mitchel (ed.), 1989, pp. 203-204). The “screens” or criteria for their implementation include rational or “guided” use of water resources, especially groundwater. There is a
INTEGRATED WATER MANAGEMENT FROM THE PERSPECTIVE OF THE DUBUN PRINCIPLES • MIGUEL SOLANES

C E P A L R E V I E W «4 • A P R I L 1 9 9 8 169
requirement that action plans must be prepared every five years to combat water pollution (Mitchel (ed.), 1989, pp. 8-9).
In some systems environmental concerns are the basis on which existing water rights can be amended, restricted, prorated or cancelled. The French Water Law of 1992 authorizes changes in water rights when public health or safety so require, or when water environments are threatened (art. 10.iv). In the United States, the public trust doctrine has been utilized to limit prior appropriation rights when the full exercise of such rights would result in drying up a lake,3
3. Integrating surface and groundwater and land resources
The protection of water sources through the control of land use and development has been a traditional concern of water law. Increasing demand and externalities have strengthened this concern.
Regulation of land and water use may be traced back to Roman Law. Actio aquae fiuviae arcendae was a judicial means of protecting downstream owners from man-made changes in the drainage of rainwater. Modem land regulation is based on the police power of the State and is intended to protect the public. It includes regulation of urban growth, subdivisions and the use of flood plains and open lands. Regulation of the latter areas is intended on the one hand to prevent harm, and on the other to save surrounding areas from flooding and also protect flora and fauna.
Land regulation has also included restrictions on land fills in order to protect water flows and prevent water pollution, protect wetlands and control coastal areas and dredging. Other controlled land activities include mining, quarrying, use of agricultural lands, forestry, coastlines and beaches, conservancy districts and control of land use to protect water supplies (Wright and others, 1978, pp. 172-175).
The German Water Law provides for the creation of water protection areas within which certain activities cannot be carried on or certain restrictions must be observed (art. 19). New Zealand’s 1991 Resource Management Act, and the 1997 Water Act in Brazil, require joint consideration of water, land, and soil management.
3 Mono Lake. National Audubon Society v. Superior Court of Alpine County, 33 Cal.3d 419,189 Cal. Rptr. 346, 658 P.2d 709 (1983).
In England, the 1989 Water Act and the 1991 Water Resources Act provide for protection from sedimentation, creation of water protection zones, nitrate-sensitive areas, good agricultural practices and business management of land and water. The National Rivers Authority has a general mandate to ensure proper management, which includes conserving, redistributing, augmenting and securing the proper use of the water supplies of England and Wales. Water resources management schemes can be established for this purpose.
It is now a generally accepted fact that groundwater must be controlled and protected. A number of countries have enacted legislation protecting recharge areas, creating special management zones, and fostering conjunctive use of surface and groundwater.4
4. Water planning
Integrated management began as a result of specific concerns relating water to other environmental resources. Early efforts at integration therefore related water management to land degradation and soil erosion, but subsequent evolution led to the consideration of broader objectives such as flood control, hydropower and river basin transportation (Mitchel (ed.), 1989, p. 203).
The government’s legal attributions to plan and regulate the use of water and other resources have seven main sources:i) ownership of the resource, because water is
generally publicly owned;ii) public trust;iii) spending power, when dealing with publicly
funded projects;iv) promotion of well-being, which is an attribution
of government found in some national constitutions;
v) regulation of commerce and navigation;vi) police power resulting from the sovereign condi
tion of States, which entitles them to exercise reasonable regulation of private goods and conduct; and
vii) prevention, mitigation, and reparation of harm. Water rights are privately owned, and as private
property they are subject to regulation. Such regulation resulting from the State’s police power should
4 More detailed information about current practices in groundwater management can be found in Beck and Goplerud (eds.), 1991.
INTEGRATED WATER MANAGEMENT FROM THE PERSPECTIVE OF THE DUB UN PRINCIPLES • MIGUEL SO LANES

170 C E P A L R E V I E W 84 • A P R I L 1 9 9 8
not be arbitrary, capricious, unreasonable, unduly discriminatory, or tantamount to a taking of private property. What is “taking” is a debated legal subject. As long as property yields a reasonable return and a reasonable spectrum of possible uses is left open to the owner, regulation has been found reasonable. Regulation is also accepted when needed to prevent harm.
Countries usually rely on a mix of legislation, political commitment and administrative decisions to foster integrated water management.
The Water Law of China requires that the development and utilization of water and the prevention of disasters must be planned in a comprehensive and systematic manner, with all relevant aspects taken into account, for multi-purpose development and maximum benefits, with full consideration of the multiple functions of water (art. 4). There are comprehensive plans for the basins of major rivers and special plans for sectors. Comprehensive plans -prepared by the Departments of Water Resources of the different levels of government- must be coordinated with the National Land Plan in the light of the demands of the different regions and sectors. Special plans for sectors are prepared by the relevant departments (art. 11). Remedial measures or, alternatively, compensation are required when such plans interfere with existing projects (art. 20).
The French system centers around two basic elements: hydrographic basins (all waters flowing into a common terminus (river, lake or sea) and hydrographic units ( specific rivers or aquifers).
Hydrographic basins or groups of basins are covered by Water Development and Management Master Plans. They determine general objectives of water quality and quantity and the works to be carried out in their pursuance. The Prefects of the corresponding regions initiate the process, which is carried out by River Basin Committees. Water-related interests within the basin participate in the process. The plans, which cover five-year periods, must be approved by the administrative authorities, after which they are made available for examination by the general public.
Individual rivers and systems of aquifers or groups of sub-basins are regulated by Water Resources Devel
opment and Management Plans, which are given coherence by the Master Plans. They define general objectives for the use, development, and qualitative and quantitative protection of surface and groundwater, wetlands and aquatic ecosystems. Management Plans are prepared, reviewed and monitored by
special commissions made up of representatives of local communities, users, owners, riparian dwellers, professional organizations, the central government and its public bodies. Participation is therefore a specific aim of the system. Both before and after they receive administrative approval, management plans are open to the general public for comments and observations. Local Water Communities can be established to own works, facilities and structures developed under such plans.
German Water Law requires the fulfillment of a prior plan approval procedure before approving any substantial modifications of water bodies and their banks (art. 31). River basins and economic regions must be subject to such plans, in order to safeguard the water resources needed for economic improvement and protection of the quality of life. Plans must consider available water resources, flood control, and protection from pollution, integrating water planning with regional planning. Plans are subject to adjustment and updating and are implemented through a variety of means which provide, inter alia, for administrative requirements, revocation of permits and licenses (art. 36b).
When considering the establishment of objectives, policies and rules under Part V of the Resource Management Act of New Zealand, local authorities are obliged to consider the relevance and instrumentality of their decisions in relation to the objectives of the law; alternative means of achieving the objectives pursued by the decision; reasons for and against a decision (including the possibility of taking no action), and assessments of benefits and costs. They must be satisfied that the decision is the most efficient and efficacious means of fulfilling the objectives of the law.
The approach is performance-based and not prescriptive. Accordingly, the use of river and lake beds and water resources, including abstraction or discharge, must be allowed subject to the rules of regional plans or resource use authorizations (Resource Management Act, sections 13 and 14).
Regional plans must cover, among other aspects, conflicts between use and development and conservation and means of mitigating or avoiding such conflicts; needs and demands for special protection; natural or man-made hazards that may be avoided or mitigated; demands on natural resources; native interests; reparation, avoidance and mitigation of harm; uses of land and water with adverse effects on land conservation and air and water quality; and other is
INTEG RATED WATER MANAGEMENT FROM THE PERSPECTIVE OF THE DUBLIN PRINCIPLES * MIGUEL SO LANES

C E P A L R E V I E W 64 * A P R I L 1 9 9 8 171
sues. Plans must be justified, their effects anticipated, and the means of implementation identified. Plans must not be inconsistent with water conservation orders or national policy statements (Natural Resources Management Act, sections 63/67).
In Spain, hydrological plans aim at satisfying water demands, harmonizing regional and sectoral development, increasing resource availability, protecting water quality, and conserving and rationalizing water use in harmony with the environment and other natural resources. The plains are legally binding. The law also contains detailed provisions about the contents of plans. (Spanish Water Law, 29/1985, arts. 35-44).
In the United States, a number of laws include provisions relating to integrated water management. Planning is an important element in water-related interstate litigation, as well as in the acceptability of limitations on interstate water transfers.
Land and water planning are important elements of the Clean Water Act and the Safe Drinking Water Act. The National Environment Policy Act (n e p a ) includes a number of procedural requirements to ensure consideration of environmental issues, and has been applied to water projects. It has been used to bring water-related cases to the courts (dam and reservoir construction, dredging and filling, flood control, dumping at sea, river and harbour projects, and wetlands and water pollution).
Additional planning requirements, imposed in accordance with other Acts, are intended to protect endangered species, fish and wildlife, and historic and archeological values. Cost sharing, recreation, and water resources affected by mining operations are included in other enactments. One important principle is that benefits must at least equal the costs of projects, if projects are to be allowed to go forward (Reclamation Act, 1902, amended 1939).
Although NEPA does not require cost-benefit analysis, this typically forms part of the environmental impact survey because one of the purposes of the Act is to consider environmental amenities and values in line with economic considerations. Courts have requested such surveys to be revised because of unrealistic cost-benefit considerations. Other statutes requiring a cost-benefit equation are the Flood Control Act of 1936 and the Watershed Protection Act of 1954.
More than twenty years ago, the United States National Water Resources Council prepared a set of “Proposed Principles and Standards for Planning Water
and Related Land Resources" which are a good example of multidisciplinary assessment of water plans. The Principles call for the implementation of a system to display the relevant beneficial or adverse effects of water plans. Consequently, water development must be assessed according to the effects that alternative plans would have on objectives of national economic development, environmental quality, regional development and social factors (United States, Water Resources Council, 1971, pp. 24145-24146).
Until they were changed in 1983, regulations required a cost/benefit analysis. They were then changed to non-binding principles and guidelines, which still emphasize economic analysis. The guidelines do not give any procedural or substantive right to any party (Kelley-Pittman, 1991, pp. 299 et seq.). Therefore, the controversial issue of cost/benefit is “almost totally isolated from judicial review”
Writing about Latin America, Axel Dourojeanni notes the dearth of criteria, principles and standards for assessment in the region, which results in the approval of projects on the basis of scant relevant multidimensional analysis (e c l a c , Natural Resources and Energy Division, 1995). It is therefore not unusual to find projects that do not justify, in actual operation or economic performance, the expectations of designers, evaluators and financiers.
Judicial decisions also provide important planning inputs for water law. It has been possible to identify at least one court case where an environmental impact assessment was requested for the granting of irrigation subsidies.5
5. Capabilities of water management agencies
Water and environmental agencies must compete for personnel with the private sector and other better- paid agencies. They are normally understaffed, mostly by engineers concentrating on structural solutions and by lawyers without too much knowledge of water and its dimensions, outside the literal interpretation of the law (Howe, 1996a).
As a result they are prone to inertia, which is a serious problem in a changing world. Social, economic and environmental considerations are sometimes seen as hurdles to be overcome rather than as valuable elements of judgement.
5 Natural Resources Defense Council v. Duvall, United States District Court, E.D. California, (777 F.Supp. 1533 E. D. Cal 1991). See also New York Times, 1991.
INTEGRATED WATER MANAGEMENT FROM THE PERSPECTIVE OF THE DUBLIN PRINCIPLES • MIGUEL SO LANES

172 C E P A L R E V I E W 64 • A P R I L 1 9 9 8
There are some concepts of modem strategic management in the private sector which should be increasingly considered in the water management sector Their inclusion in this article is intended to facilitate initial assessments of capabilities, constraints and opportunities, with a view to implementing sequential, staged processes of improvement of integrated water management.
The private sector pays special attention to three main elements in designing and implementing a business strategy: i) the industry (or activity) concerned;ii) the country; and iii) the available resources, capabilities and strategies affecting the performance of a business unit or corporation.
In order to bring this approach to water management, it would be necessary:
a) That the activity, (in this case integrated water management) and its relative maturity and consolidation in a country should be evaluated with particular care when beginning or improving a process of integrated water management. The objective of this evaluation is not to raise unrealistic expectations at the onset of programmes and projects, but to establish appropriate benchmarks and stages in the development of an integrated management programme.
b) That the country where a process is started or improvement programmes are begun should also be subjected to evaluation. If national capabilities are generally low, it may be over-optimistic to assume that die water sector would be able to perform at a pace different from the rest of the economic and social environment. Once again, it is important to establish realistic objectives and time frameworks and also to identify areas where the implementation of processes requires special support and enhancement.
c) Closely connected with the above consideration is a fact noticed in a number of countries: water resources development programmes started mainly on the basis of the locally available land and water resources, with scant regard for the effective existence and sustainability of demand for the local products and goods for which water is an intermediate good. Thus, costly and rigid structural investments are undertaken, without a clear understanding of the situation with regard to global demand and competition, only to realize later that the investments were not as productive as estimated. Successful private sector strategies are at present particularly concerned with global opportunities and threats. Economically sustainable water development (integration between
water and economics) should incorporate these private sector concerns.
d) The third important element concerns the resources, capabilities and strategies available for the activity. In many developing countries, water institutions are expected to perform adequately with scant funds and poorly defined strategies and without qualified human resources.
Strategies are the. pivotal tool for water management organizations to reach out to the community, obtain political legitimacy and support, and effectively fulfill their roles. Defining an adequate strategy is not an easy task. In addition to the predetermined -although manageable- factors of activity, country, resources and capabilities, the definition of a successful strategy is conditioned by and requires technical knowledge, foresight, political savvy and leadership, and the ethical conviction that efficiency and equity in the use and allocation of water resources are crucial to sustainability. The ethical requirement is not always mentioned in the water management literature, yet it is given special consideration in modem private sector management (Hill and others, 1996, p. 57).
Strategies require the setting of basic long-term goals, the charting of courses of action for their achievement, and the procurement and allocation of resources for the implementation processes. While this is the rational approach to planning, strategies also include spontaneous responses to unexpected situations, to risk and to uncertainty. The interface between predetermined plans and the unexpected is a difficult matter. The ultimate, and unfortunately rather glib, answer to this question would be that planning must preserve flexibility.
Referring specifically to water resources planning, Dourojeanni states that planning should preferably concentrate on what is possible and necessary (e c l a c , Natural Resources and Energy Division, 1995, p. 8). Translated into operational terms, this means that water planning requires measures to preserve sustainability and to satisfy basic human needs. Furthermore, planning needs to be cautious about irreversibly committing resources (financial, natural and human), giving rise to rigid structural investments to meet poorly estimated or volatile demands, and approaching management purely in terms of structural investments, while disregarding non-structural measures such as demand management and the integration of water quality and quantity, surface and groundwater, and land and water resources.
INTEGRATED WATER MANAGEMENT FROM THE PERSPECTIVE OF THE DUBLIN PRINCIPLES • MIGUEL SOLANES

Water development and management should be based on a participatory approach involving users, planners and policy-makers at all levels
1. Assigning responsibility for overall water management
The functional organization for policy-making, water allocation and management, and monitoring of users plays an important role in the implementation of a sustainable water development system. When these functions are vested in institutions with functional responsibilities for specific water uses or for particular economic activities, water planning and management might not be objective. In these cases each concerned party may tend to support water projects or allocation arrangements according to vested functional interests, without regard to the source of supply or the soundness of investments and projects.
Another limiting factor is the separation of planning and allocation responsibilities among different agencies, therefore separating regulation from planning and disengaging permits from plans (Dellap- enna, 1991, p. 413 et seq.).
To avoid such problems, a number of jurisdictions allocate responsibility for policy-making, water allocation and programme and project evaluation to a non-user agency or ministry independent of the traditional sectors. A number of countries seek to improve the quality of decision-making through delegation of such duties to appropriate local levels and through the creation of coordinating arrangements between different levels of government and also with the private sector. In some cases coordination takes place through the creation of river-basin organizations made up of the different stakeholders. However, the most sophisticated systems preserve coherence through a system of approval and consultation for decentralized plans produced by river-basin and regional authorities.
Another means of securing coherence is the retention by the central government of residual author
ity to apply legislation not properly implemented by local, regional or river-basin organizations.
Brazil has set up a national water resources management system to ensure: a) coordination of integrated management; b) administrative arbitration of conflicts; c) implementation of the National Water Policy, and d) promotion of systems of water charges. The management system consists of: a) a national council; b) state councils; c) river-basin committees;d) water-related organizations at all levels of government, and e) water agencies (Water Policy Law, 1997, arts. 32 et seq.). The Secretariat of the National Water Council comes under the Ministry of the Environment and Water Resources (art. 45).
France has set up a Water Directorate within the Ministry of the Environment, which receives guidance from the Interministerial Water Commission and from the National Water Commission, made up of users, river-basin authorities and the government, which expresses its opinion on matters of national water management. Its activities are decentralized and are carried out through National Environmental Directorates. The Ministry oversees the water boards of the river-basin agencies in technical aspects of water management. The boards are also accountable to the Ministry of Finance regarding financial matters. The Coordinating Prefect for a river basin takes the initiative in preparing the basin water plan, and is responsible for the implementation and coordination of State policies on water management and policing. He is assisted by the Environmental Directorate. The Prefects of the Départements are the basic administrative level for State intervention in water management, policing, and the preparation and follow-up of planning documents. They also have emergency powers. At the lowest political level, the communes have a legal monopoly of drinking water supply and sanitation services, are represented on the river-basin
INTEGRATED WATER MANAGEMENT FROM THE PERSPECTIVE OF THE DUBUN PRINCIPLES • MIGUEL SOLANES

174 C E P A L R E V I E W 64 • A P R I L 1 9 9 8
committees and their Boards of Directors, and play an important role in water planning, through the preparation of water management and development plans.
In New Zealand, all levels of government are obliged to consider the effects of proposed actions regarding the environment, with the Minister for the Environment having residual authority to apply every provision of the relevant Act not properly applied by the corresponding local authorities (Furuseth and Cocklin, 1995, pp. 243-272). Regional Councils prepare regional policy statements and plans. In this respect, district and city councils and governments of local territories have lost independence on strategic planning and environmental management issues, and regional planning has been strengthened in relation to city planning (Furuseth and Cocklin, 1995, p. 263). In order to ensure coherency and coordination, regional policy statements and plans must be consulted with the Ministry of the Environment, local and national authorities and Maori organizations (First Schedule, sect. 3). Despite the trend towards devolution to the intermediate level (die regions) the system has built-in precautions to safeguard the national interest. The Ministry of the Environment can set environmental standards, stop controversial developments, approve regional policy statements, and bring decisions before the Planning Tribunal for appeal, while the system as a whole is continuously monitored by the Parliamentary Commissioner for the Environment (Furuseth and Cocklin, 1995, p. 266).
In Spain, the highest authority is the Ministry of Public Works and Urbanism. The National Water Resources Council, consisting of all sectors interested in water, has a consultative role, its main function being to give its views on the National Hydrological Plan and the River-Basin Hydrological Plans, which are approved respectively by the Legislature and the Government.
River basins are managed by hydrographic confederations, regulated and organized under public law, which have a legal standing different from that of the Government. These confederations propose the river-basin plan; administer and control public water resources; design, control and administer public works; grant water rights and concessions; inspect and monitor water resources, uses thereof, and water- related works; gauge water resources; study the situation of water resources; keep records on and provide information about floods; control water quality, and provide technical services (Cubillos, 1994, p. 28).
Despite these signs of greater coherence and independence in water management, in a number of countries or provinces or states within countries water components are fragmented between management agencies dealing with problems of water quality and water quantity, or surface and groundwater (Mitchel (éd.), 1989, p. 203).
2. Stakeholder participation and protection ofpublic interests
A process of democratizing and balancing water decision-making and water-related activities is under way. In water planning, balanced, informed and pluralistic participation is important because it fosters the consideration of wide ranges of issues and in so doing takes into account different dimensions of the resource. This is achieved through public hearings, stakeholder involvement in administrative bodies, organization of users’ associations and -for general environmental concerns- greater flexibility of the rules governing the right to act in either administrative or judicial fora. Thus, stakeholders may participate in policy-making, legislative discussion, general water administration, and field level activities.
New Zealand’s Resource Management Act requires that public hearings must be held to discuss, inter alia, resource management plans and resource authorizations. Such hearings must not be burdened with unnecessary formalities (sect. 39). The right to be heard and submit evidence is based on the broad standing of concerned parties, with the proviso that parties with the same interest may be limited in their participation (sect. 40).
It is worth noting that some countries have made particularly strong commitments to the consideration of the water interests and rights of native communities and customary uses. New Zealand, Canada, the United States and some countries in the South Pacific (Fiji, Papua-New Guinea) offer particularly worthy examples in this respect. In New Zealand, consideration of Maori interests is a main tenet of the planning process.
There are, however, cases where the interests and concerns of local populations have not been a main issue when planning water development. Disregard for traditional rights has been identified as a major factor in the conflicts associated with, and the relative lack of success of, development efforts in some parts of the world. Concerns relating to the
INTEGRATED WATER MANAGEMENT FROM THE PERSPECTIVE OF THE DUBUN PRINCIPLES • MIGUEL SOLANES

C E P A L R E V I E W 64 • A P R I L 1 9 9 8 175
disregard of social values and interests related to water have also been voiced.6
Stakeholders and water users can participate in public hearings or consultations intended to discuss policies, programmes, projects or legislation. While the mechanism is fundamentally designed to open avenues for participation, the mere fact of its creation does not necessarily mean that every stakeholder will participate and thus ensure a balance of interests or more rational decisions. Thus, when the United Kingdom regionalized water management in 1974, certain influential lobbies received more favourable treatment, to the detriment of openness to the general public and -according to some- of economic efficiency (Barraqué, 1992, p. 9). This perception is shared by Mitchel, who points out that “there has been a shift away from involving the public in actual decisions, as regional water authorities have been streamlined to make them more businesslike” (Mitchel (ed.), 1989, p. 215).
Kemper, in her excellent discussion of the Curú Valley, in the state of Ceará, Brazil, notes that privileged user groups have strong standing in the valley, are comparatively well-educated and organized, and would be strong in collective negotiations aimed, for example, at keeping water tariffs low. These groups have more leverage than poorer farmers, including as they do the large agro-industrial complexes and farms. In contrast, poorer users have to live according to the rules of political clientage (Kemper, 1996, pp. 195-200). She also quotes Hearne and Ester, concluding that the legal design of water markets in Chile has resulted in concentration of forfeited land and water rights in the hands of the big fruit-exporting companies, and that although economic efficiency was increased, overall welfare might not have been improved (Kemper, 1996, p. 193 and Hearne and others (undated)).
Examples of similar situations, where the outcome of decision-making processes may have been dictated by construction, land development and farming lobbies, rather than by economic soundness or general economic well-being, are to be found elsewhere in Latin America. Recently, a report found that the economic feasibility of a dam in Western Argen
tina was “extremely compromised” and that in most cases the Government would have “a negative net benefit”; “the project is not economically attractive, neither in terms of global feasibility, nor in terms of the gains resulting from public investment”. Special interests had actively campaigned for the project. The report quoted above has not been disseminated. The implications that non-profitable public investment (and previous public indebtedness) can have in relation to taxes on, and expenditures on behalf of, the general public, are not well understood by the latter. It would appear that the project will nevertheless be built, in line with a recent political decision (Argentina, Ministry of the Economy and Public Works and Services, Energy Department, 1997, p. 5 and cover).
In a presentation made by a senior UNICEF official it was pointed out that “...the danger is that vested interests groups will comer the resource in the name of growth, and inequality will increase further...”.7
There are, however positive cases of participation by stakeholders. In the Yahagi river basin, in Japan, a Water Quality Protection Association has shown how interest groups from the private sector can combine their interests and talents to tackle problems that in many countries are left to the public sector (Mitchel (ed.), 1989, p. 305).
Other examples of positive participation are provided by professional associations. Thus, the American Society of Civil Engineers is actively involved in the proposal of legal principles for the promotion of integrated management and planning. Starting with the premise that water benefits from management and planning, it has sketched a set of basic principles which water law should include in order to promote improved management: a) with some exceptions, all water is public; b) water quality and water quantity cannot be separated; surface, ground and atmospheric waters should be integrated; c) public attributions required for appropriate management include multifaceted evaluations of water allocations and water transfers;d) rights can be forfeited for waste ; e) water rights can be periodically re-evaluated and the function of water can be varied according to technological changes; f) comprehensive planning requires a balancing act between
—--------— ----- —-------- — --------- ————------- —— — 7 Gourisankar Ghosh, Chief, Water Environment and Sanitation6 See, in general terms, Conac (1989) and the statements by Cluster, U N IC E F , New York. Keynote Address at 22nd W E D C
Barraque (1997). Conference, New Delhi, 9-13 September 1996.
INTEGRATED WATER MANAGEMENT FROM THE PERSPECTIVE OF THE DUBLIN PRINCIPLES • MIGUEL SOLANES

176 C E P A L R E V I E W 64 • A P R I L 1 9 9 8
public and private interests; g) safe yields and minimum flows required to maintain water quality and to protect biological diversity must be estimated, after identifying existing uses; h) drought strategies must be developed and special water management areas may be created; i) dispute settlement and arbitration procedures should be established; j) appropriate enforcement and implementation powers should be granted to the relevant water agencies; k) there should be recognition of the need to pursue economic development through the promotion of economic efficiency, by requiring reasonable appropriations and recognizing existing rights; 1) environmental values must be protected by expanding the concept of beneficial use; m) conservation and augmentation of the resource should be fostered by granting permits in respect of conserved waters; and n) the transaction costs of temporary transfers should be reduced (Matthews, 1994).
It is argued that governments can further the empowerment of interested parties by providing access to data, giving them recognized status in meetings and, generally, providing opportunities for interested parties to express opinions and positions (Haddad, 1996, p. 392).
The desirability of active government measures to promote participation seems to be confirmed in practice by a recent experience in South Africa: in a public consultation on forthcoming water legislation, industries submitted comprehensive responses, while a number of organizations and individuals also responded in a positive manner, yet it was noticed that no comments were submitted by community-based organizations, rural communities or village-level water committees. Very few submissions came from NGOs either.
The issue of participation is closely related to the development of laws, their enforcement, and accountability under them. While the government is the traditional body responsible for the creation and application of the law, a major current issue is government inertia in this respect. This inertia may stem from inability to act due to lack of resources, or unwillingness to decide in the face of competing pressures.
A good example of creative legal development is the environmental field, where there has been a broadening of the opportunities for citizens’ suits and a parallel flexibilization of the rules governing the right to take legal action on the part of groups or individuals having interests other than traditional individual economic interests.
However, citizens’ suits are limited when there are no legal frameworks setting the conditions for public action. In turn, the availability of suitable legal frameworks is affected by differences in the opportunities of access to political decision-makers and the lobbying capabilities of interest groups with different interests. While a number of countries have enacted rules on the environment and environmental impacts, binding normative rules on the economic evaluation and conditioning of projects on economic grounds, actionable by the public or by third parties, are scant or nil. Therefore, even the most deficient projects cannot be challenged by members of the public on economic grounds. In this respect, the public in most countries is limited by two factors: the lack of compulsory substantive rules for evaluation of the economic efficiency of public investment and related standards and thresholds, and the existence of rigid rules which grant legal standing only on the basis of traditional individual economic rights.8 A similar situation exists regarding social interests. The case of the dam in Western Argentina cited earlier in this article is a good example of such a state of affairs. A further consideration is that successful lobbying groups are not accountable.
The imbalance in stakeholder participation and access seems to be an international concern. A project in Latin America, executed by Consumers International and financed by the United Kingdom Overseas Development Administration, starts with the premise that: “Consumer interests are not adequately represented in the policy-making processes that regulate water, electricity and telephone utilities in Latin America. This is due to institutional barriers created by governments as well as lack of information and expertise among consumers’ organizations,..”.
3. Information
The need for data and public information is not only a conditioning factor for appropriate decision-making but also an effective means of curbing imbalances.
8 “Standing” is the legal technical term denoting the right to pursue an interest in court. Traditionally, standing was only granted on the basis of individual -i.e., not widely shared- economic interests and excluded other interests such as recreational amenities. While this conception is rapidly changing, in most countries citizens still do not have a right to standing on the grounds o f bad or inadequate economic decision-m aking by governments. This would be a very widespread interest, and therefore not strong enough, in the absence o f specific legislation, to grant a right to act in court.
INTEGRATED WATER MANAGEMENT FROM THE PERSPECTIVE OF THE DUBLIN PRINCIPLES * MIGUEL SOLANES

C E P A L R E V I E W «4 • A P R I L 1 9 9 8 177
To be effective, a system of participatory planning and management of water resources must be able to provide timely information on what kind and quality of water is available, where, and who is using the water and for what purposes. Therefore, effective water management systems require adequate official surveys, inventories and cadasters of water sources and water supplies, as well as up-to-date registers and records of water uses, discharges into waters, water rights, and beneficiaries of such rights, with their respective water allocations. This is the reason why well-developed water management systems usually charge fees for water rights, in order to finance administrative management and information expenses.
The objective of information is to make possible appropriate decisions by policy-makers, administrators, managers, users and the public.
The Brazilian Water Law of 1997 specifically includes information among the instruments for implementing the national water resources policy (art. 5). The system operates on the basis of decentralization, unified coordination and free access to data (art. 26).
The British Water Resources Act of 1991 requires the National Rivers Authority to provide information to policy-makers and entrepreneurs and also to the public (sections 196-197). For its part, the Authority has powers to obtain information about surface and groundwater. The information must be timely and adequate, and there are provisions on the kind of information to be collected and the manner in which it must be organized (sections 197-203). The British system is complemented with norms on confidential and reserved information and penalties for false statements (sections 205-206). Public participation is sought through a system of inquiries (sections 213-215).
Canada’s Water Act provides for the establishment of public information programmes through which the public is informed about water conservation, development and utilization (art. 27). The Act also requires that the Minister responsible for water must report to Parliament each fiscal year on the operations carried out under the Act (art. 36).
The Resource Management Act of New Zealand requires local authorities and public utility networks to supply information to the Minister for the Environment (section 27). Local authorities are required to collect information and keep records on a number of subjects, including, inter alia, plans, resource authorizations and complaints (section 35). National standards on water quality, levels or flows cannot be
submitted for approval without first giving the public an opportunity to comment, including such comments in the submissions, and publishing a report and recommendations (section 44).
Proposed amendments to the 1985 Spanish Water Law include establishment of the public’s right to have access to water-related information (art. 13 bis)
The 1964 Water Resources Research Act in the United States established Water Resources Research Institutes in each state. Their work, according to Beck and Goplerud (eds.) (1991), has significantly contributed to the data base available for federal and state planning.
4. The lowest appropriate administrative level
It is widely acknowledged that the river basin would be the most sensible unit for the implementation of water strategies. However, arbitrary borders are usually drawn around water projects, disregarding outside impacts. Jurisdictional boundaries not corresponding to the river or other natural systems are one of the greatest causes of inefficiency in the design and operation of water systems. Impacts outside the area of jurisdiction are usually ignored (Howe, 1996a, pp. 31-32).
For this reason, Professor Howe states that the subsidiarity concept (the lowest appropriate level for policy implementation and enforcement) may increase the likelihood of significant externalities, the reason being that the lowest appropriate political level does not necessarily coincide with natural limits. The tension between “subsidiarity” and externalities is one of the biggest outstanding problems in policy design (Howe, 1996a, p. 32). Appropriate organization at the river basin level allows transaction costs to be reduced or minimized. A few countries have therefore heightened the political importance of river basins. In New Zealand the basin is not only the unit for water planning and management but also the main focus of the Regional Councils which have the greatest responsibilities for the implementation of sustainable management. The Councils are responsible for water development, water and soil conservation, geothermal resources, pollution control and the mitigation of hazards in the region (Furuseth and Cocklin, 1995, pp. 243-272). More specifically, they control water use, development, damming and discharges in their area (section 30, Resource Management Act).
INTEGRATED WATER MANAGEMENT FROM THE PERSPECTIVE OF THE DUBLIN PRINCIPLES • MIGUEL SO LANES

178 C E P A L R E V I E W 64 • A P R I L 1 9 9 8
The Act has built-in flexibility, since it authorizes the transfer and delegation of functions from local authorities to other authorities. However, such transfers and delegations are subject to approval and must have solid grounds of efficiency, expertise, and representativeness at the community level (sections 33-34).
Along similar lines, according to Barraqué, the Netherlands have turned basin organizations into local authorities (Barraqué, 1992, p. 21).
Nevertheless, the need to ensure that basin organizations realize their full potential in technical terms in reducing transaction costs has not blinded countries to the need for public and stakeholder participation. Therefore the river basin organizations in France, for example, strive to ensure adequate participation of affected and interested parties.
Moreover, by creating the figure of the Coordinating Prefect, recent reforms in French water law seem to be evolving towards closing the gap between administrative authorities and basin organizations. French river basin agencies are based on the geographical scope of the watershed, rather than the political divisions, in an effort to get away from political struggles. The management approach is based on a contract established among the various interest groups, on a decentralized basis. Specific goals include increasing water quality and quantity, and the system integrates water management and private water services. Pollution and sewerage charges are imposed on water users. The Boards of the respective agencies have a system of tripartite representation (the central government, local governments and other users), and the Agencies are (now) fully legitimized in the eyes of public opinion (Barraqué, 1992, p. 21).
On the other hand, the French river basin agencies have drawn some criticisms on the grounds of their excessive reliance on a “give and take” approach and alleged shortcomings in integrated water resources planning and lack of clearly defined police powers (Barraqué, 1992, pp. 13, 20 and 21). Interestingly, this is the same kind of criticism that could be levelled at attempts to introduce river basin institutions in Latin America.
Thie 1991 Agrarian Reform Law of Peru provides for the creation of independent river basin authorities to promote the formulation of master plans and to encourage their implementation within their area of jurisdiction. They have had only a relative degree of success, due to the lack of clearly defined powers, resources and organizational arrangements.
The river basin has also been the focus of a number of national and internationally sponsored activities at the country and inter-country level in Africa, Asia and Latin America. A number of these programmes have faced constraints and attracted criticisms, including inter alia their lack of correspondence with the capabilities of the area of location, extremely broad -and at the same time weak- mandates, inability to deal with traditional political jurisdictions, unawareness of environmental issues, disruption of local patterns of production, insensibility towards social realities and conditions in the place of implementation, lack of resources, and inability to provide for long-term effects.
A fundamental limitation of these projects has been the lack of local ownership, and as a result tenuous political and electoral support, which in fact may be the key issue for the success (or lack of it) of basin organizations.
INTEGRATED WATER MANAGEMENT FROM THE PERSPECTIVE OF THE DUBLIN PRINCIPLES • MIGUEL SOLANES

C E P A L R E V I E W 6 4 • A P R I L . 1 S 9 8 179
IVWater has an economic value in all its competing uses, and should be recognized as an economic good
1. Water rights
Although water has an economic value and water rights should provide security of tenure to water users, there is a general tendency to condition its use. The conditions imposed include formal requirements (the need to obtain a permit) and those of a substantive nature (i.e., no uncompensated harm to third parties, environmental protection, efficiency).
According to the Brazilian Water Law, the system of water rights is one of the instruments for the implementation of the national water resources policy (Brazilian Water Law of 1997, art. 5).
In New Zealand, authorizations for water use are regulated by the Resource Management Act. Authorizations (“resource consents”) cannot infringe the terms of resource management plans. A description of the activity in question and its location are required, as well as assessment of the impacts on the environment (section 88). Consents are issued taking into consideration, inter alia, policies and plans (sect. 104). They may be subject to charges, bonds, covenants, financial contributions, information obligations and liability for environmental damage (even after their expiration), etc. (section 108); Consents are subject to review due to adverse environmental impacts or the establishment of new plans (section 128). In addition, the Planning Tribunal can change or cancel a resource consent by enforcement order (section 133).
It is interesting to compare New Zealand with Chile, where almost all water resources are officially public property, but the system of water rights has resulted in a kind of functional privatization.
In Chile, water allocation is not related to any specific use or price. If water is available, the water law stipulates that the Government cannot reject an application (Pefia, 1996, p. 7). After allocation, the only possible regulation is that exercised by the water market. A recent report states that the results of this
system include: a) a free transfer of public wealth (Peña, 1996, p. 10); b) present applications for water amount to 50,000 m3/s: four times the total exploitable volume available in the country and out of all proportion to reasonable foreseeable national development during the next 50 years (Peña, 1996, p. 10);c) the situation distorts the operation of the water and other markets, since water rights can be used as a deterrent to entry into some industries;9 d) the results can include under-investment and increases in the prices of products such as electricity; e) in addition, the individualistic structure of the water rights system leaves no room for planning for the medium and long term (Peña, 1996, p. 12); f) long-term externalities are difficult if not impossible to control; g) integrated basin management is limited, since rivers are divided, for administrative purposes, into sections that do not represent hydrological units; h) ground and surface water are independently managed; and i) quality and quantity are not integrated, and water development is not planned according to multiple-use objectives, but sectorally (Peña, 1996, p. 15).
The German Water Law, which provides a good example of current trends, attaches a number of conditions to water use, permits and licenses. They include, inter alia, the possibility of imposing new conditions after a permit or license has been granted. These ex-post conditions may refer to environmental or economic requirements of water resources management (art. 5). Use of water by property owners and riparian dwellers must not adversely affect other persons, cause detrimental change to water, adversely alter the water balance, or substantially reduce water flows (art. 24).
9 Three decisions have considered the relationship between water rights and monopolization: 1) Court of Appeals, Puerto Montt, Endesa vs. Dirección General de Aguas, 31 January 1997; 2) Comisión Preventiva Central: Consultation by the President of the National Energy Commission, Res. CPC 992/636/25/11/96; and 3) Comisión Resolutiva, Resolución No. 480, 7 January 1997.
INTEGRATED WATER MANAGEMENT FROM THE PERSPECTIVE OF THE DUBLIN PRINCIPLES * MIGUEL SO LANES

180 C E P A L R E V I E W 64 • A P R I L 1 9 9 8
The Spanish Water Law requires that water rights be granted in accordance with the provisions of hydrological plans (art. 57, Law 29/85). Water rights shall be adjusted and reviewed as required by changes in hydrological plans (art. 63, Law 29/85).
2. Water markets
Increasing attention is being paid to the marketing of water rights as a useful and economically efficient alternative for the improvement of water allocations.
However, countries such as China, while acknowledging the need to develop water markets, emphasize the need for macro-management of water resources, to avoid harmful impacts on the environment and social development.
One result of the complexities of water marketing is that the activity has been subjected to regulations in the interest of third parties and the public in general (Anderson and others, 1991, pp. 234 et seq.).
There are also considerations of public interest which apply to the review of applications to transfer water rights. They concern public value externalities and include: a) the effects of the economic activity resulting from the application; b) effects on fish and game resources and on public recreation; c) effects on public health; d) the opportunity cost of the use;e) possible harm to other persons; f) intention and ability to use; g) effects on access to public and navigable waters; h) water conservation needs; and i) factors of local importance.
Thus, a reallocation would not be allowed if it resulted in the violation of minimum health, environmental or safety standards. However, the public interest element can be accommodated by making an application for reallocation conditional on measures to mitigate public interest concerns.
Although the substantive legitimacy of public interest concerns is fully recognized, questions have been raised about the most appropriate fora and means for their consideration. While there are always administrative and judicial functions to be fulfilled, for some authorities such fora and means should include water planning and public participation.10
Other considerations may include assessment of the impacts that a transfer may have on the environment, the tax base or the local economy of the area of origin of the water allocation to be transferred.
10 See Dumars and Minnis, as quoted by Anderson, 1991, p. 298, and also New Mexico Statutes, Ann.: 72-14-1; 72-14-22.
It has been suggested that the marketing of water resources should be subjected to a programme: i.e. active management, with measurable goals and timed benchmarks and performance incentives (Haddad, 1996, p. 392).
3. Integrated water management, economicincentives, and charges
It is widely accepted that pricing is an appropriate water management instrument.
At least one law (Brazil, 1997) identifies water charges as one of the instruments for the implementation of the national water policy (art. 5). Water charges acknowledge the economic dimension of water resources, signalling to the user the actual value of the resource, promote the rationalization of water use, and secure financial resources to meet the costs of the programmes and projects included in water resources plans (art. 19). Funds collected through water charges are primarily for allocation to the basin where they were generated. They are intended to pay for the costs of implementation of basin plans, and to cover the expenses of the administration system. Such expenses cannot exceed 7.5% of the total funds collected.
In France, Water Agencies (Agences de l’Eau) provide financial incentives for the improvement and preservation of water resources. Users pay a fee based on the volume of water consumed or the volume of pollution caused. Such fees are then reinjected into the water sector to help the public and private sector to pay for water conservation and antipollution facilities, equipment and technologies.
Financial actions are implemented through pluri- annual programmes (generally for five years) presented to the Basin Committees and approved by the Prime Minister on the recommendation of the Interministerial Water Commission. Action programmes are voted by the users who have to pay the fees, who make up the Basin Committees.
Action programmes must fit in with national economic and social policies and general water policy. They comprise three sections: identification and analysis of problems; actions, costs, and estimates of the assistance expected to be provided by the Water Boards; and systems of fees (expected revenues) for ensuring the financial equilibrium of the system.
Fees are charged to all public or private persons abstracting water, polluting it or altering its regime,
INTEGRATED WATER MANAGEMENT FROM THE PERSPECTIVE OF THE DUBLIN PRINCIPLES • MIGUEL SOLANES

C E P A L R E V I E W 84 • A P R I L 1 9 8 8 181
and benefiting from works constructed with the assistance of the Water Boards. Towns, industries, farmers and electricity generation all pay fees.
The New Zealand Resource Management Act requires the corresponding Minister to consider and investigate the use of economic instruments to achieve the purposes of the Act (1991 Act, section 24h). The Minister can also make grants and loans to foster the purposes of the Act (section 27). Local authorities are authorized to fix charges, which can be adjusted according to the actual cost and recovered from the beneficiary of the activity, which the authorities are not obliged to complete until the charge has been paid in full (section 36). The connection between ways and means is clearly expressed in the law, which in section 38 relates the actions of enforcement officers with the payment of salaries and expenses. Further revenue concerns are covered in
section 112, which requires the payment of royalties and rents to regional councils.
Drinking water supply and sanitation utilities in the United Kingdom are required to pay financial charges as a contribution to the costs of the Rivers Authority. The powers of the United States Federal Energy Regulatory Commission include the levying of charges for use of public domain facilities.
The question of charging for water is by no means free from controversy. Proposals to charge for water have been objected by Chilean utilities, on the grounds that the original water rights were granted without charges and any subsequent charges would affect their property rights. In Switzerland, the Water Service of the Industrial Services of Geneva is resisting an attempt by the cantonal government to introduce a water tax to pay for restoration of the canton’s rivers (Financial Times, 1996, pp. 3-4).
VConclusions
1. Ethics in integrated water management
Sustainable integrated water management is contingent upon efficiency and equity, among other factors. Inefficient management and allocation of resources have negative consequences on equity (apart from the need to make allowances for targeted disadvantaged groups), since they limit total benefits and access.
Efficiency and equity in integrated water management are closely related to governance, and ultimately to ethics. The concept of ethics in this context implies at least the following main elements: i) not to fund public projects with a negative rate of return, unless justified by overwhelming social considerations, duly stated and proven; ii) to provide the public with accurate, precise and transparent information;iii) not to undertake public projects without careful assessment of their economic, social and environmental impacts; and iv) not to allow the manipulation and monopolization of the resource by special interests.
2. Capabilities of water management agencies
There are systems where planning is mostly understood as the orderly development of water-related works, but there are also others which include ex
plicit considerations of social well-being, economic efficiency, assessment of alternatives, including non- structural and do-not options, social impacts, and detailed considerations of environmental effects. Although the first approach may ensure order, precision and engineering correctness, it needs to be complemented by the second in order to have a correct understanding of macrosituations and ensure sound decision-making.
While some of the national examples discussed in this article show that the state of the art in integrated water management and planning is relatively well developed, the translation of technical norms into binding legal arrangements is uneven, if considered at the world level.
The extent to which countries lagging behind can improve their resource management is related to national capabilities. Capacity-building programmes may help to remedy particular situations, but their ultimate success depends on national commitment and resource ownership.
In this context, “capacity” includes not only appropriate staff, financial resources and adequate organization, but also “software tools”, for good project evaluation.
INTEGRATED WATER MANAGEMENT FROM THE PERSPECTIVE OF THE DUBUN PRINCIPLES ■ MIGUEL SOLANES

182 C E P A L R E V I E W 64 • A P R I L 1 6 9 8
Some national water management systems include principles for the assessment of projects, programmes, or even legislation and policies. While the state of the art on assessment includes well-developed principles on environmental, economic and social issues, legally binding substantive and procedural rules are comparatively more strict on environmental issues than on economic and social issues. Tlie result is that in some countries there is a relatively higher degree of flexibility and opportunities for action by public and private parties concerning environmental issues than concerning issues related to the economic efficiency, social equity and soundness of public actions related to water.
Most developing countries lack appropriate normative standards for the compulsory evaluation of the economic, social and environmental effects of water projects.
Integrated water management and planning is supported by a wide range of public legal attributions and technical knowledge, but its implementation in developing countries is hindered by limited national capabilities and legal development, scant information and understanding of the dynamics of the resource, and unbalanced access and influence of special interest groups.
An area of concern, regarding the ability to implement integrated water planning, is the separation between planning and regulation. Countries are taking action in this regard, however. Some countries are concentrating planning and regulatory capabilities in non-sectoral institutions, others are at the same time creating new mechanisms for institutional coordination and integration, and there is a group where integration of management at the basin level is taking place, through the devolution of functions to regional or basin authorities. Such devolution is accompanied, however, by processes of scrutiny and consultation of regional and river-basin plans at the national level, as well as by the reservation of residual powers by central government ministries in order to remedy the lax or non-existent application of laws and policies and to ensure consistency.
Mechanisms for conciliating and harmonizing different institutions through national councils are gaining support. However, some experiences indicate that the process may be hindered by political feuds, deficient procedural norms, and the need to gain legitimacy.
There is explicit agreement that the basin is the most suitable unit for integrated water management.
At the same time, there is concern that this notion should be spelled out clearly when applying the principle of the lowest possible level. A further concern relates to the implementation of the basin concept in the face of jurisdictional boundaries. Further research and dissemination may therefore be required in respect of alternatives involving the use of the existing models, legal principles and organizational arrangements to cope with problems of political boundaries (such as equitable utilization or prohibition of significant harm) and of the powers of national governments in federal countries. All in all, the technical relevance of the basin, and the ability of basin organizations to reduce externalities and transaction costs, seem to indicate that their institutional acceptance will increase. However, basin organizations need to be specially aware of the importance of broad and adequate stakeholder participation.
Experiences of basin-level management bodies in developing countries indicate that for these organizations to be successful they should take into consideration national capabilities and circumstances, be granted adequate resources -including autonomous revenue sources- and have clear mandates and sufficient legal powers. Capacity-building processes and understanding of macro-factors (economic, social, environmental, cultural) are important pre-requisites for the establishment and consolidation of basin-level organizations.
3. Scant public participation
Some countries have well-developed rules for stakeholder participation. In a significant number of developing countries, however, the avenues of participation are not well developed, and when they are developed, tend to allow a higher degree of participation on environmental matters than on economic and social issues. Consequently, well-organized special interests have more opportunities of access than others, and there are few counterbalances other than the judgement of the regulator or the public manager, which in turn may be affected by the phenomenon of “regulatory capture” by powerful interests. Two examples from Latin America, discussed in this article, illustrate this situation. The ultimate result is that, by reflecting only a partial segment of interests, water-related decision-making does not take into account all the relevant factors, therefore hindering integrated management and sustainability. Decisions which are not efficient result in
INTEGRATED WATER MANAGEMENT FROM THE PERSPECTIVE OF THE DUBLIN PRINCIPLES * MIGUEL SO LANES

C E P A L R E V I E W 64 • A P R I L 1 « « 6 183
inequity because limited financial and water resources are allocated on the basis of lobbying capabilities rather than the intrinsic value and merits of competing projects.
4. In fo rm a tio n
Information is increasingly being referred to as the basis for sound decision-making and as a means for furthering social control of public water-related processes.
There are some examples of legislation designed to secure integrated land and water management, the integration of surface and groundwater, and control of quality and quantity. However, most cases of integration were to be found in developed and not in developing countries.
5. W a te r r ig h ts a n d w a te r p la n n in g
As water has economic status, water rights and water markets acquire important dimensions. In this regard it has been possible to identify systems covering a wide spectrum of alternatives. Assessment of highly individualistic, unconditioned water rights systems indicates that they do not promote either integrated management, efficiency or equity. At the other end of the spectrum there are systems which subject water rights to planning requirements. Water markets in mature systems take into consideration issues of public interest, which in fact reflect factors relevant to integrated water management. At least two experts endorse the view that planning, programming, benchmarking and participation are important elements in water marketing.
Closely related to the above is the question of what to do when already existing water rights do not fit in with planning decisions. The question is important because if non-conditioned rights are not optimal, legal uncertainty in the face of future conditions may deter investment. Alternative answers to this question could include regulation through police powers and efficiency requirements for water use, or respect for rights effectively and beneficially used, with payment of compensation if they are cancelled.
6. W a te r p ric in g
A number of laws refer to, and accept, financial measures and water charges as key tools for water
management. There is resistance from vested interests in some countries, however, which shows that there is a need for clearer indication of the relevant conditions when issuing water rights.
7. T h e lim its of p la n n in g
While the overall objective of planning is to preserve and make available water of a certain quality at a certain time, for development, sustainability or other purposes, there are some important questions which arise in this connection: a) how much planning is it practical to do, in view of constraints and uncertainties?; and b) to what extent do vested property rights prevent the integration of water resources management, or, at least, how should they be dealt with? (Beck and Goplerud (eds.), 1991, p. 575 et seq.).
In practice, the scope of planning, which was formerly conceived as meaning the orderly and technically correct execution of water-related works, has expanded to include sustainability and social and economic issues.
This is where integrated management must strive to strike a balance between the foresight of planning and the need to keep the strategic ability to adjust to changing conditions, all the more so in a global economy. This is why some experts argue that what should be planned is only what is necessary and what is possible. The relevant question is: what is possible and what is necessary? The answer may be strictly related to local conditions, but overall sustainabilty appears to be a sine qua non, except in very specific circumstances, such as the planned depletion of non- rechargeable aquifers.
Also, if sustainability is interpreted as meaning economic, environmental and social sustainability guided by considerations of equity and efficiency, then planning requires a liberal use of economics, sociology and the environmental sciences. In addition, in a changing and globally integrated world, planning for economic purposes should perhaps borrow some concepts and techniques of strategic management from the private sector.
In this context, integration has geographical, environmental and socio-economic implications. It includes a basin-level approach, joint surface and groundwater management, integration of water quality and quantity, and internalization of externalities through “the polluter must pay” and “the user must pay” principles,
(Original: English)
INTEGRATED WATER MANAGEMENT FROM THE PERSPECTIVE OF THE DUBUN PRINCIPLES • MIGUEL SOLANES

184 C E P A L R E V I E W 64 " A P R I L 1 9 9 6
Bibliography
Anderson, L. O. and others (1991): Reallocation, in R. E. Beck and P. C. Goplerud (eds,), Waters and Water Rights, vol. 2, Charlottesville, VA, The Michie Company.
Argentina, Ministry of the Economy and Public Works and Services, Energy Department (1997): Evaluación económica del Proyecto Potrerillos, Buenos Aires, 27 February.
Barraqué, B. (1992): Water management in Europe: beyond the privatization debate, “Flows and Stocks of Fixed Capital” series, No. 7, Paris, OECD (Organization for Economic Cooperation and Development), March.
(1997): Integrated water resources management inChina: The scope for change, Nanking International Symposium, 22-25 April.
Beck, R. E. and P. C. Goplerud (eds.) (1991): Waters and Water Rights, Charlottesville, VA, The Michie Company.
Colby-Saliba, B. and D. Bush (1987): Water markets in theory and practice: Market transfers, water values and public policy, Studies in Water Policy and Management, No. 12, Boulder, CO, Westview Press.
Coñac, F. (1989): Land and water rights issues in irrigated schemes in sub-Saharan Africa and Madagascar - conflicts that might be avoided, DVWK Bulletin No. 16, Situation-specific Management, International Irrigation Symposium, Berlin, Verlag Paul Parcy.
Cubillos, G. (1994): Bases para la formulación de leyes referidas a los recursos hidricos, LC/R.1387, Santiago, Chile, ECLAC, Natural Resources and Energy Division.
Da Cunha, L. V. (1989): Water resources situation and management in the EEC, Hydrogeology, No. 2.
Dellapenna, J. (1991): Regulated Riparianism, in R. E. Beck and P. C. Goplerud (eds.), Waters and Water Rights, vol. 1, Charlottesville, VA, The Michie Company.
ECLAC (Economic Commission for Latin America and the Caribbean), Natural Resources and Energy Division (1995): Planes y marcos regulatorios para la gestión integrada de cuencas, LC/R.1487, Santiago, Chile.
Financial Times (1996): Water Report, No. 6, London, 4 September.
Furuseth, O. and C. Cocklin (1995): An institutional framework for sustainable resource management: The New Zealand model, Natural Resources Journal, vol. 35, No. 2, University of New Mexico School of Law.
Haddad, B. M. (1996): Evaluating the market niche: Why long-term rural-to-urban inter-regional markets for water have not formed in California, Berkeley, CA, University of California, PhD. thesis.
Heame, R. R. and others (undated): Water allocations and water markets: an analysis o f gains from trade in Chile, Technical Paper No. 315, World Bank, Washington, D. C.
Hill, C. and others (1996): Strategic Management: An Integrated Approach, New York, McGraw-Hill.
Howe, C. (1996a): Water resources planning in a federation of states: Equity vs. efficiency, Natural Resources Journal, vol. 36, University of New Mexico School of Law.
(1996b): Protecting Public Values under TradableWater Permit Systems: Efficiency and Equity Considerations, Boulder, CO, November.
Kelley-Pittman, A. (1991): Planning and authorization of federal water projects, in R. E. Beck and P. C. Goplerud (eds.), Waters and Water Rights, vol. 1, Charlottesville, VA, The Michie Company.
Kemper, K. E. (1996): The cost o f free water: Water resources allocation and use in the Curú Valley, Ceard, Northeast Brazil, Linköping Studies in Arts and Science, No. 137, Linköping, Sweden.
Matthews, O. P. (1994): Changing the appropriation doctrine under the model statute water code, Water Resources Bulletin, vol. 30, No. 2, Bethesda, MD, American Water Resources Association.
Mitchel, B. (ed.) (1989): Integrated water management: International experiences and perspectives, London, Bellhaven Press.
Peña, H. (1996): Modificaciones al código de aguas y su aporte a la gestión del agua, Seminario Internacional: Gestión del Recurso Hídrico, Santiago, Chile, FAO (Food and Agriculture Organization of the United Nations), December.
The New York Times (1991): Federal judge orders review of rules on irrigation water, New York, 1 August, p. A 14.
United States, Water Resources Council (1971): Proposed principles and standards for planning water management and related natural resources, Office of the Federal Register, vol. 36, No. 245, Washington,D. C., 21 December.
Wright, R. and others (1978): Land Use, S t Paul, MN, West Publishing Co.
INTEGRATED WATER MANAGEMENT FROM THE PERSPECTIVE OF THE DUBUN PRINCIPLES • MIGUEL SOLANES

R e v i s t ade la
C E P A LSolicitud de suscripción y/o ejemplares atrasados
□ Suscripción por el año
□ Ejemplares atrasados N2
Nombre:..................................
98 N9
Domicilio:........
Código y ciudad:
País:................ .FAX:.......................................................Te l:.....................
E-Mail:.......................................................Adjunto cheque (*) del Banoo................................................... N ° .................................................
por valor de $ / US$............................... (Para exterior: sobre plaza USA. / No enviar giros postales).
(*) Agradeceremos emitir el cheque a nombre de UN-ECLAC.
□ Favor cargar tarjeta de crédito Q MasterCard Q Visa
Nombre que aparece en la tarjeta:.................................................. Número:...................................
Firma:........................
Fecha de vencimiento:
Los precios de subscripción anual vigentes para 1998 son de US$30. El precio por ejemplar suelto es d e U S $15 más costo de envío.Los precios de subscripción por dos años (1998-1999) es de U S$50.
t * S -
P u b lic a c io n e s d e la C E P A LCOMISIÓN ECONÓMICA PARA AMÉRICA LATINA
Y EL CARIBE Casilla 178-0 - Santiago da Chlla
publIcatlonsOaelac.cl
C E P A L
R e v i e w
Request for subscription and/or back issues
□ Subscription for the year
□ Back issues Nos.............
Name: ..................................
98 No.
Address:...............................................................................................................................
City and postal code: ..........................................................................................................
Country: ................................................... Telephone:...................... F A X :......................
E-Mail:.............................................................I enclose chequeO No................................................. drawn on the following bank:..........................
In the amount of $ / US$....................................................(For requests originating outside Chile, the
cheque must be drawn on a United States bank. / Do not send money orders).
(*) The cheque should be made payable to UN-ECLAC.
□ Please charge my credit Card Q MasterCard Q Visa
Name as appears on card:............................................. Number:.................................................
Signature:.
Expiration:
Annual subscription costs for 1998 are U S$35. The price of single issues is US$15 plus shipping costs.The cost of a tw o-year subscription (1998-1999) Is U S$60.
E C L A C p u b lic a tio n sECONOMIC COMMISSION FOR LATIN AMERICA
AND THE CARIBBEAN C aallla179-D • Santiago, CHILE
publlcatlonaO aclcc.cl


C E P A L R E V I E W 64 187
Recent ECLACpublications
Periodical publications
Prelim inary overview o f the econom y o f L atin A m erica and the C aribbean , 1997 (LC/G.1984-P), United Nations publication, Sales No. E.97.ILG. 13, ECLAC, Santiago, Chile, December 1997, 64 pages.
In spite of the instability that has prevailed in international financial markets in recent months and the consequent disturbances which have affected the economies of the region, the latter registered the best performance for a quarter of a century in 1997, thanks to the combination of an average growth rate of 5.3% (compared with 3.2% in the period 1991-1996) and an average rate of inflation below 11%. Although the current account deficit has considerably increased, from US$ 35 billion in 1996 to US$ 60 billion in 1997 (3% of GDP), this will be amply covered by foreign capital inflows, which have reached the unprecedented level of at least US$ 73 billion, of which almost two-thirds corresponds to direct investment. The employment situation has also improved slightly, although the percentage of the population who are unemployed continues to be very high in some countries. This fact also inhibits the efforts to seek a more rapid reduction in the incidence of poverty, which continues to be a serious challenge within a generally favourable context.
The positive growth rates registered were due to a marked recovery in investment and the continuing expansion of exports, thanks entirely to an increase in volume, since prices remained unchanged on average for the region. Intra-regional trade showed considerable buoyancy, highlighting the economic interdependence of some countries, especially in the Southern Cone. At the same time, however, imports exceeded exports, partly as a reflection of the increase in investments, since there was a marked increase in purchases of capital goods. The restrictive fiscal and monetary policy applied in previous years helped to bring inflation down to its lowest level in 50 years, aided by sometimes overvalued exchange rates which were also afactor in the deterioration of the trade balance. The more favourable macroeconomic environment made it possible to devote more funds to public investment and to apply a more flexible credit policy without affecting domestic stability.
The main query that arose as 1997 drew to its end was whether this relatively satisfactory situation could be maintained in the coming year. The factor causing the greatest uncertainty was the external context; primary commodity prices, interest rates, and above all external capital flows. The Asian financial crisis is expected to have adverse effects on the region both with regard to trade and to capital movements. Short-term capital flows which introduce an element of instability persist in some countries. The financial vulnerability of the region will be mitigated, however, by the fact that, as already noted, the capital entering Latin America has a more stable structure than a few years ago. Moreover, the banking sector has been solving some of its problems.
Taking together the effects of the often contradictory external factors and the macroeconomic policies adopted in order to reduce inflation or current account deficits, the most likely outcome is that in 1998 the region will register somewhat lower growth than in 1997, possibly coming closer to the average rate for the 1990$ as a whole. If so, the employment situation will continue to be a source of concern. At the same time, however, inflation wilt probably continue to go down, and the current account deficit could also be reduced. Likewise, in view of the determination already shown by several governments to take difficult measures at the right moment in order to maintain macroeconomic stability, it is considered unlikely that the Asian financial crisis will have such serious repercussions as to give rise to new exchange crises in the region.
Panoram a de la inserción internacional de América Latina y el Caribe (Overview of the economic linkages of Latin America and the Caribbean) (LC/G.1978) ECLAC, Santiago, Chile, 28 November 1997,225 pages.
This edition of the Overview, corresponding to the year 1997, has the dual aim of informing the governments of the region about trends in the international economy and trade which could affect their economic development strategies, and also furthering the exchange of information on the trade policy instruments used by the Latin American and Caribbean countries in the period between January 1996 and July-August 1997.
The document is divided into four parts. Part I, which is devoted to the international economy, reviews the main current trends and presents some comments on the structural changes under way, as well as analysing the recent evolution of the main economic areas of the region. Part n , on Latin American and Caribbean trade and trade policy between 1996 and 1997, analyses the application of the World Trade Organization’s dispute settlement mechanisms, in so far as they may affect the trade policies of the countries, and the changes which have taken place in those policies in the region, especially in the Central American countries. Part III describes the most outstanding events in the regional integration process in 1996 and 1997 and analyses some aspects of the harmonization process in the fiscal field. Finally, part IV looks at questions relating to access to markets for goods and services in the context of the Uruguay Round agreements.
Economic Survey of Latin America and the Caribbean, 1996- 1997 (LC/G.1968-P), United Nations publication, Sales No.E.97.II.G.2, ECLAC, Santiago, Chile, September 1997, 354 pages (includes diskettes).
This issue of the Survey consists of a regional analysis, plus an examination of the situation in each country of the region. In addition to the regional summary, there are chapters on macroeconomic policy and structural reforms; the level of activity and inflation; investment and saving; employment and wages; and the external sector. It includes two diskettes with a comprehensive Statistical Appendix.
In essence, the Survey notes that the Latin American and Caribbean economies seem to have returned in 1996-1997 to the pattern of moderate growth, based on an abundant inflow of foreign
A P R I L 1 9 9 8

C E P A L R E V I E W 64 • A P R I L 1 9 9 6 1 8 8
capital, which was characteristic o f the years before the outbreak o f the M exican financial crisis.
Som e other tendencies noted differ from those which prevailed in the early 1990s. Among the positive changes is the considerable easing o f inflation, partly due to the improvement in the fiscal situation. In the case o f unemployment, however, which continues to be higher than that registered at the beginning o f the decade, there has been a deterioration compared with that period. The international context within which the above trends have taken place has continued to be relatively favourable. The volume o f imports o f goods by the advanced industrial economies, which are the main recipients o f the export sales o f Latin America and the Caribbean, increased by 5.3% in 1996. The prices o f the region’s exports, however, have not maintained the buoyancy shown in 1994 and 1995.
The main negative sequels o f the 1994-1995 crisis are to be seen in the social area: growing unemployment, deterioration in wages, and contraction o f consumption. These tendencies, as ECLAC has repeatedly emphasized, worsen the already pronounced inequity prevailing in the region and have led to social tensions in some countries. Moreover, the renewed heavy inflow of foreign capital has both favourable and potentially negative effects. On the one hand, it has allowed the countries to cover higher current account deficits and finance slight increases in investment, but on the other hand it is recognized as being volatile, and if it slackens for any reason the region could be driven into a new exchange crisis.
Consequently, in coming years it will be o f crucial importance to strengthen investment in export activities, financing this with the resources obtained through a higher rate o f domestic saving. Only through such changes will it be possible to consolidate the recovery registered in 1996-1997 and achieve higher growth rates.
O th er publications
L a grieta de las drogas. D esintegración social y políticas públicas en A m érica L atina (D rugs: a gaping crack in society . Social disintegration and public policies in Latin America) (LC/G. 1975-P), United Nations publication, Sales No. S ,9 7 .II.G . 12, ECLAC, Santiago, C hile , D ecem ber 1997, 210 pages.
This study consists o f three parts. Part I deals with matters relating to the political economy of drugs, with special emphasis on the cases of Colombia, Peru and Bolivia. It summarizes recent trends in the production, circulation and consumption o f illicit drugs, as a basis for the formulation o f new ideas and conjectures about how the drug question and the problems arising from it should be tackled in Latin America. Part II analyses the factors in the socio-cultural, legal and incriminatory context which accompany (or condemn) the consumption o f illicit drugs and have an incidence on the diversified nature assumed by drug consumption patterns; it also includes articles on the measurement o f illicit drug consumption. Part III makes a com parative analysis o f different assessments o f the policies being applied to deal with the production, trafficking and consumption o f illicit drugs, with reference to national examples which are very different from each other in terms o f the public policies adopted on drugs, such as those o f the United States, the Netherlands, Chile and Colombia.
D inám ica de la población y desarrollo en el C aribe (Population dynamics and development in the Caribbean) (LC/G.1879-P and LC/DEM/G.171), “Cuadernos de la CEPAL” series, No. 76, United Nations publication, Sales No. S.97.II.G . 10, ECLAC, Santiago, Chile, July 1997, 116 pages.
The Caribbean countries were seriously affected by the crisis of the 1980s, so that their economic growth rates went down and poverty indexes rose, especially in the most heavily populated countries o f the region. The crisis had particularly dramatic consequences for vulnerable groups such as woman heads of household, young people and the elderly.
As a result o f a moderate natural population growth rate (1.8% per year) and population loss due to international emigration, the population growth rate o f the region (which is quite heterogeneous) averages 1.3% per year.
Fertility has been going down in recent years, although it is estimated that the rates o f utilization of contraceptive methods in the region continue to be low and may even have stagnated. Adolescent fertility has gone down, although it continues to be high. The region is in the midst o f a transitional period in epidemiological terms, and life expectancy is slightly over 70 years.
The declines in fertility and mortality have been reflected in a reduction in the proportion o f children and young people under 15 and an increase in the proportion o f persons o f working age. The percentage o f elderly persons has also increased, and is now over 10% in a number o f countries o f the region.
In the 1980s, the region registered a net population loss o f over 1.3 million people due to international emigration. In some countries, the net migration rate is as high as the natural population growth rate. Although in recent years there has been a slight diversification o f the countries to which emigrants from the region go, most o f them still go to the United States and Canada. Generally speaking, most of the emigrants are people with higher levels o f education and training, thus representing a loss o f skilled human resources.
Many attempts to integrate demographic factors into development policies are still restricted to the use of population projections at the sectoral level. In order to expand this integration, suitably qualified human resources are needed in this field, and the same time it is necessary to improve access to the available socio-demographic information sources and stimulate their use. Improving the institutional structure responsible for dealing with population problems would considerably aid in the integration o f the fields o f population and development and the formulation and execution o f population policies integrated into development strategies.
Partidos políticos y gestión estratégica (P olitica l parties and strategic management) (LC/G.IP/L. 135), ILPES, Santiago, Chile, 1997, 403 pages.
This book contains a set o f articles on political parties and strategic management written by leading politicians and academics o f various countries. The articles analyse the crisis in politics and reform of the State; social inequality and democratic governance; the links between the public and private fields; political visions and the role o f the State; strategic management, regulation and the market; and reform o f the State and o f the political parties.
RECENT ECLAC PUBLICATIONS

ECLAC publications
ECONOMIC COMMISSION FOR LATIN AMERICA AND THE CARIBBEAN
Casilla 179-D Santiago, Chile
PERIODIC PUBLICATIONS
C E P A L Review
CEPAL Review first appeared in 1976 as part of the Publications Programme of the Economic Commission for Latin America and the Caribbean, its aim being to make a contribution to the study of the economic and social development problems of the region. The views expressed in signed articles, including those by Secretariat staff members, are those of the authors and therefore do not necessarily reflect the point of view of the Organization.
CEPAL Review is published in Spanish and English versions three times a year.
Annual subscription costs for 1998 are US$ 30 for the Spanish version and US$ 35 for the English version. The price of single issues is US$ 15 in both cases.
The cost of a two-year subscription (1998-1999) is US$ 50 for Spanish-language version and US$ 60 for English.
Estudio Económico de Economie Survey ofAmérica Latina y el Latin America andCaribe the Caribbean
1980, 664 pp. 1980, 629 pp.
1981, 863 pp. 1981, 837 pp.
1982, vol. 1 693 pp. 1982, vol.l 658 pp.1982, vol. Il 199 pp. 1982, vol. II 186 pp.1983, vol. I 694 pp. 1983, vol. 1 686 pp.1983, vol. Il 179 pp. 1983, vol. II 166 pp.
1984, voi. 1 702 pp. 1984, vol. 1 685 pp.1984, voi, Il 233 pp. 1984, vol. II 216 pp.1985, 672 pp. 1985, 660 pp.
1986, 734 pp. 1986, 729 pp.1987, 692 pp. 1987, 685 pp.1988, 741 pp. 1988, 637 pp.1989, 821 pp. 1989, 678 pp.1990, vol. 1 260 pp. 1990, vol. 1 248 pp.1990, vol. II 590 pp. 1990, vol. II 472 pp.1991, vol. 1 299 pp. 1991, vol. 1 281 pp.1991, vol. II 602 pp. 1991, vol. It 455 pp.1992, vol. 1 297 pp. 1992, vol.l 286 pp.1992, vol. II 579 pp. 1992, vol. II 467 pp.1993, vol. 1 289 pp. 1993, vol. 1 272 pp.1993, vol. II 532 pp, 1993, vol. II 520 pp.1994-1995, 348 pp, 1994-1995, 332 pp.1995-1996, 349 pp. 1995-1996, 335 pp.1996-1997, 354 pp. 1996-1997, 335 pp.
(issues for previous years also available)
Anuario Estadístico de América Latina y el Caribe I Statistical Yearbook for Latin America and the Caribbean (bilingual)
1980, 617 pp. 1989, 770 pp,1981, 727 pp. 1990, 782 pp.1982/1983, 749 pp. 1991, 856 pp.1984, 761 pp. 1992, 868 pp.1985, 792 pp, 1993, 860 pp.1986, 782 pp. 1994, 863 pp.1987, 714 pp. 1995, 865 pp.1988, 782 pp. 1996, 866 pp.
(Issues for previous years also available)
Libros de la C E P A L
1 Manual de proyectos de desarrollo económico, 1958, 5th.ed. 1980,264 pp,
1 Manual on economic development projects, 1958, 2nd. ed. 1972,242 pp.
2 América Latina en el umbral de los años ochenta, 1979,2nd. ed. 1980,203 pp.
3 Agua, desarrollo y medio ambiente en América Latina, 1980,443 pp.
4 Los bancos fransnac/ona/es y el fínanciamiento extemo de América Latina. La experiencia del Perú,1980,265 pp.
4 Transnational banks and the externai fínance of Latín America: the experience of Perú, 1985, 342 pp.
5 La dimensión ambiental en los estilos de desarrollo de América Latina, Osvaldo Sunkel, 1981, 2nd. ed. 1984,136 pp.
6 La mujer y el desarrollo: guía para la planificación de programas y proyectos, 1984,115 pp.

6 Women and development: gufdelines for programme and project planning, 1982, 3rd, ed. 1984,123 pp.
7 África y América Latina: perspectivas de la cooperación interregional, 1983,286 pp.
8 Sobrevivencia campesina en ecosistemas de altura, vols. t y II, 1983,720 pp.
9 La mujer en el sector popular urbano. América Latina y el Caribe, 1984,349 pp.
10 Avances en la interpretación ambiental del desarrollo agrícola de América Latina, 1985,236 pp.
11 El decenio de la mujer en el escenario latinoamericano, 1986, 216 pp.
11 The decade for women in Latín America and the Caribbean: background and prospecte, 1988, 215 pp.
12 América Latina: sistema monetario internacional y fínanciamiento externo, 1986,416 pp,
12 Latín America: internationat monetary system and external fmancing,1986,405 pp.
13 Raúl Prebisch: Un aporte al estudio de su pensamiento, 1987,146 pp.
14 Cooperativismo latinoamericano: antecedentes y perspectivas, 1989,371 pp.
15 CEPAL, 40 años (1948-1988), 1988,85 pp.15 ECLAC 40 Years (1948-1988), 1989,83 pp.16 América Latina en la economía mundial, 1988,321 pp.17 Gesf/ón para el desarrollo de cuencas de alta montaña
en ia zona andina, 1988,187 pp.18 Políticas macroeconómicas y brecha extema: América
Latina en los años ochenta, 1989,201 pp.19 CEPAL, Bibliografía, 1948-1988,1989,648 pp.20 Desarrollo agrícola y participación campesina, 1989,
404 pp,21 Planificación y gestión del desarrollo en áreas de
expansión de la frontera agropecuaria en América Latina, 1989,113 pp.
22 Transformación ocupacional y crisis social en América Latina, 1989,243 pp.
23 La crisis urbana en América Latina y el Caribe: reflexiones sobre alternativas de solución, 1990, 197 pp.
24 The environmentai dimensión in development planning i, 1991, 302 pp.
25 Transformación productiva con equidad, 1990,3rd. ed. 1991,185 pp.
25 Changing production patterns with social equity,1990, 3rd.ed, 1991,177 pp.
26 América Latina y el Caribe: opciones para reducir el peso de la deuda, 1990,118 pp.
26 Latín America and the Caribbean: options to reduce the debt burden, 1990,110 pp.
27 Los grandes cambios y la crisis. Impacto sobre la mujer en América Latina y el Caribe, 1991, 271 pp.
27 Major changos and crisis. The impact on women in Latín America and the Caribbean, 1992, 279 pp.
28 A collection of documents on economic relations between the United States and Central America, 1906-1956,1991,398 pp.
29 inventarios y cuentas del patrimonio natural en América Latina y el Caribe, 1991,335 pp.
30 Evaluaciones del impacto ambiental en América Latina y el Caribe, 1991,232 pp.
31 El desairollo sustentable: transformación productiva, equidad y medio ambiente, 1991,146 pp.
31 Sustainable development: changing production patterns, social equity and the enwronmenf,1991,146 pp.
32 Equidad y transformación productiva: un enfoque integrado, 1993, 254 pp.
33 Educación y conocimiento: eje de la transformación productiva con equidad, 1992, 269 pp.
33 Education and knowledge: basic pillars of changing production patterns with social equity, 1993, 257 pp.
34 Ensayos sobre coordinación de políticas macroeconómicas, 1992, 249 pp.
35 Población, equidad y transformación productiva,1993, 2nd. ed, 1995,158 pp.
35 Population, social equity and changing production patterns, 1993, 153 pp.
36 Cambios en el perfil de las familias. La experiencia regional, 1993, 434 pp.
37 Familia y futuro: un programa regional en América Latina y el Caribe, 1994, 137 pp.
37 Family and future. A regional programme in Latín America and the Caribbean, 1995,123 pp.
38 Imágenes sociales de la modernización y la transformación tecnológica, 1995, 198 pp,
39 El regionalismo abierto en América Latina y el Caribe,1994, 109 pp.
39 Open regionalism in Latín America and the Caribbean, 1994, 103 pp.
40 Políticas para mejorar la inserción en la economía mundial, 1995, 314 pp.
40 Policies to improve linkages with the global economy, 1995,308 pp.
41 Las relaciones económicas entre América Latina y la Unión Europea: el papel de los servicios exteriores, 1996,300 pp.
42 Forfafecer el desarrollo. Interacciones entre macro y microeconomía, 1996,116 pp.
42 Strengthening development. The interplay of macro- and microeconomics, 1996,116 pp.
43 Quince años de desempeño económico. América Latina y el Caribe, 1980-1995,1996,120 pp.
43 The economic experience of the last fiñeen years. Latin America and the Caribbean, 1980-1995,1996,120 pp.
44 La brecha de la equidad. América Latina, el Caribe y la cumbre social, 1997,218 pp.
44 The equity gap. Latín America, the Caribbean and the social summit, 1997, 219 pp.
45 La grieta de las drogas, 1997, 218 pp.

MONOGRAPH SERIES
Cuadernos de la C E P A L
1 América Latina: el nuevo escenario regional y mundial/Latín America: the new regional and worid setting, (bilingual), 1975,2nd. ed. 1985,103 pp.
2 Las evoluciones regionales de la estrategia internacional del desarrollo, 1975,2nd. ed. 1984,73 pp.
2 Regional appralsals of the International development strategy, 1975, 2nd.ed. 1985,82 pp.
3 Desarrollo humano, cambio social y crecimiento en América Latina, 1975, 2nd. ed. 1984,103 pp.
4 Relaciones comerciales, crisis monetaria e integración económica en América Latina, 1975,85 pp.
5 Síntesis de la segunda evaluación regional déla estrategia internacional del desarrollo, 1975,72 pp.
6 Dinero de valor constante. Concepto, problemas y experiencias, Jorge Rose, 1975,2nd.ed. 1984,43 pp.
7 La coyuntura internacional y el sector extemo, 1975, 2nd. ed. 1983, 106 pp.
8 La industrialización latinoamericana en los años setenta, 1975,2nd. ed. 1984,116 pp.
9 Dos estudios sobre inflación 1972-1974. La inflación en los países centra/es. América Latina y la inflación importada, 1975,2nd. ed, 1984,57 pp.
s/n Cañada and the foreígn firm, D. Pollock, 1976,43 pp.10 Reactivación del mercado común centroamericano,
1976,2nd. ed. 1984,149 pp.11 Integración y cooperación entre países en desarrollo
en el ámbito agrícola, Germánico Salgado, 1976, 2nd. ed. 1985,62 pp.
12 Temas del nuevo orden económico internacional, 1976,2nd. ed. 1984,85 pp.
13 En tomo a las ideas de la CEPAL: desarrollo, industrialización y comercio exterior, 1977, 2nd. ed. 1985,57 pp.
14 En tomo a las ideas de la CEPAL: problemas de la industrialización en América Latina, 1977, 2nd. ed. 1984,46 pp.
15 Los recursos hidráulicos de América Latina. Informe regional, 1977,2nd. éd. 1984,75 pp.
15 The water resources of Latín America. Regional report, 1977,2nd. ed. 1985,79 pp.
16 Desarrollo y cambio social en América Latina, 1977, 2nd. ed. 1984,59 pp.
17 Estrategia internacional de desarrollo y establecimiento de un nuevo orden económico internacional, 1977, 3rd. ed, 1984,61 pp.
17 International development strategy and establishment of a new International economic order, 1977,3rd. ed. 1985,59 pp.
18 Raíces históricas de las estructuras distributivas de América Latina, A. di Filippo, 1977, 2nd. ed. 1983, 64 pp.
19 Dos estudios sobre endeudamiento externo, C. Massad and R. Zahler, 1977, 2nd.ed. 1986,66 pp.
s/n United States - Latín American trade and financial relations: some poiicy recommendations,S. Weintraub, 1977,44 pp.
20 Tendencias y proyecciones a largo plazo del desarrollo económico de América Latina, 1978, 3rd. ed. 1985,134 pp.
21 25 años en la agricultura de América Latina: rasgos principales 1950-1975,1978,2nd. ed. 1983,124 pp.
22 Notas sobre la familia como unidad socioeconómica, Cartos A. Borsotti, 1978,2nd. ed. 1984,60 pp.
23 La organización de la información para la evaluación del desarrollo, Juan Sourrouille, 1978, 2nd. ed. 1984,61 pp.
24 Contabilidad nacional a precios constantes en América Latina, 1978,2nd. ed. 1983,60 pp.
s/n Energy in Latín America: The Historical Record, J. Mullen, 1978,66 pp.
25 Ecuador, desafíos y logros de la política económica en la fase de expansión petrolera, 1979, 2nd, ed. 1984, 153 pp.
26 Las transfomnaciones rurales en América Latina: ¿desarrollo social o marginación?, 1979, 2nd. ed. 1984,160 pp.
27 La dimensión de la pobreza en América Latina, Oscar Altimir, 1979,2nd. ed. 1983,89 pp.
28 Organización institucional para et control y manejo de la deuda externa. El caso chileno, Rodolfo Hoffman, 1979,35 pp.
29 La política monetaria y el ajuste de la balanza de pagos: tres estudios, 1979, 2nd. ed. 1984,61 pp.
29 Monetary poiicy and balance of payments adjustment: three studies, 1979,60 pp.
30 América Latina: las evaluaciones regionales de la estrategia internacional del desarrolio en los años setenta, 1979,2nd. ed. 1982,237 pp.
31 Educación, imágenes y estilos de desarrollo, G. Rama, 1979, 2nd. ed. 1982,72 pp.
32 Movimientos internacionales de capitales, R. H. Arriazu, 1979, 2nd,ed. 1984,90 pp.
33 Informe sobre las inversiones directas extranjeras en América Latina, A. E. Calcagno, 1980, 2nd. ed. 1982, 114 pp.
34 Las fluctuaciones de la industria manufacturera argentina, 1950-1978, D. Heymann, 1980, 2nd. ed. 1984,234 pp.
35 Perspectivas de reajuste industrial: la Comunidad Económica Europea y los países en desarrollo, B. Evers, G. de Groot and W. Wagenmans, 1980, 2nd.ed. 1984,69 pp.
36 Un análisis sobre la posibilidad de evaluar la solvencia crediticia de los países en desarrollo, A. Saieh, 1980,2nd. ed. 1984,82 pp.
37 Hacia los censos latinoamericanos de los años ochenta, 1981,146 pp.

s/n The economic relations of Latín America with Europe, 1980, 2nd. ed. 1983,156 pp.
38 Desarrollo regional argentino: la agricultura, J. Martin, 1981,2nd. ed. 1984,111 pp.
39 Estratificación y movilidad ocupadonal en América Latina, C. Filgueira and C. Geneletti, 1981, 2nd. ed. 1985,162 pp.
40 Programa de acción regional para América Latina en los años ochenta, 1981,2nd.ed. 1984,62 pp.
40 Regional programme ofaction for Latín America in the1980s, 1981, 2nd. ed. 1984, 57 pp.
41 El desarrollo de América Latina y sus repercusiones en la educación. Alfabetismo y escolaridad básica, 1982, 246 pp.
42 América Latina y la economía mundial del café, 1982, 95 pp.
43 El ciclo ganadero y la economía argentina, 1983,160 pp.
44 Las encuestas de hogares en América Latina, 1983,122 pp.
45 Las cuentas nacionales en América Latina y el Caribe, 1983,100 pp.
45 National accounts in Latín America and the Caribbean, 1983,97 pp.
46 Demanda de equipos para generación, transmisión y transformación eléctrica en América Latina, 1983, 193 pp.
47 La economía de América Latina en 1982: evolución general, política cambiaría y renegociación de la deuda extema, 1984,104 pp.
48 Políticas de ajuste y renegociación de la deuda extema en América Latina, 1984,102 pp.
49 La economía de América Latina y el Caribe en 1983: evolución general, crisis y procesos de ajuste, 1985,95 pp.
49 The economy of Latín America and the Caribbean in 1983: maln trends, the impact ofthe crisis and the adjustment processes, 1985,93 pp.
50 La CEPAL, encamación de una esperanza de América Latina, Hernán Santa Cruz, 1985,77 pp.
51 Hacia nuevas modalidades de cooperación económica entre América Latina y el Japón, 1986,233 pp.
51 Towards new forms of economic co-operatíon between Latín America and Japan, 1987,245 pp.
52 Los conceptos básicos del transporte marítimo y la situación de la actividad en América Latina, 1986,112 pp.
52 Basic concepts of maritime transport and its present status in Latín America and trie Caribbean,1987,114 pp.
53 Encuestas efe ingresos y gastos. Conceptos y métodos en la experiencia latinoamericana. 1986,128 pp.
54 Crisis económica y políticas de ajuste, estabilización y crecimiento, 1986,123 pp.
54 The economic crisis: policies for adjustment, stabilization and growth, 1986,125 pp.
55 El desarrollo de América Latina y el Caribe: escollos, requisitos y opciones, 1987,184 pp.
55 Latín American and Caribbean development: obstacles, requirements and options, 1987,184 pp.
56 Los bancos transnacionales y el endeudamiento externo en la Argentina, 1987,112 pp.
57 El proceso de desarrollo de la pequeña y mediana empresa y su papel en el sistema industrial: el caso de Italia, 1988,112 pp.
58 La evolución de la economía de América Latina en1986.1988, 99 pp.
58 The evolution of the Latín American Economy in 1986, 1988,95 pp.
59 Protectionism: regional negotiation and defence strategies, 1988,261 pp.
60 Industrialización en América Latina: de la “caja negra* al “casillero vacio* F. Fajnzylber, 1989, 2nd. ed. 1990,176 pp.
80 Industrialization in Latín America: from the “Black Box" to trie “Empty Box", F. Fajnzylber,1990.172 pp.
61 Hacia un desarrollo sostenido en América Latina y el Caribe: restricciones y requisitos, 1989,94 pp.
61 Towards sustained development in Latin America and the Caribbean: restrictions and requisites,1989,93 pp.
62 La evolución de la economía de América Latina en1987.1989, 87 pp.
52 The evolution o f trie Latin American economy in 1987,1989,84 pp.
63 Elementos para el diseño de politicas industriales y tecnológicas en América Latina, 1990, 2nd. ed.1991.172 pp.
64 La industria de transporte regular internacional y la competitividad del comercio exterior de los países de América Latina y el Caribe, 1989,132 pp.
84 The iníernafionai common-carrier transportation industry and the competitiveness of the foreign trade of the countries of Latin America and the Caribbean, 1989,116 pp.
65 Cambios estructurales en los puertos y la competitividad del comercio exterior de América Latina y el Caribe, 1991, 141 pp,
65 Structural Changes in Ports and the Competitiveness of Latin American and Caribbean Foreign Trade, 1990,126 pp.
66 The Caribbean: one and divisible, 1993, 207 pp.67 La transferencia de recursos externos de América
Latina en la posguerra, 1991, 92 pp.67 Postwar transfer of resources abroad by Latin
America, 1992,90 pp.

68 La reestructuración de empresas públicas: el caso de ios puertos de AméricaLatina ye l Caribe, 1992, 148 pp.
68 The restructuring of public-sector enterprises: the case of Latín American and Carlbbean ports,1992, 129 pp.
69 Las finanzas públicas de América Latina en la década de 1980,1993,100 pp.
69 Public Finances in Latin America in the 1980s,1993, 96 pp,
70 Cana/es, cadenas, corredores y competitividad: un enfogue sistèmico y su aplicación a seis productos latinoamericanos de exportación, 1993, 183 pp.
71 Focalización y pobreza, 1995,249 pp.72 Productividad de los pobres arrales y urbanos, 1995,
318 pp.73 El gasto social en América Latina: un examen
cuantitativo y cualitativo, 1995,167 pp.74 América Latina y el Caribe: dinámica de la población y
desarrollo, 1995, 151 pp.75 Crecimiento de la población y desarrollo, 1995,95 pp.76 Dinàmica de la población y desarrollo económico,
1995, (en prensa).77 La reforma laboral y la participación privada en los
puertos del sector público, 1996, (en prensa).77 Labour reform and prívate particípátion in
public-sector ports, 1996,160 pp.78 Centroamérica y el TLC: efectos inmediatos e impli
caciones futuras, 1996,164 pp.79 Ciudadanía y derechos humanos desde la perspectiva
de las políticas públicas, 1997,124 pp.82 A dinámica do Setor Saúde no Brasil, 1997,220 pp.
Cuadernos Estadísticos de la C E P A L
1 América Latina: relación de precios del intercambio, 1976,2nd. ed. 1984,66 pp,
2 Indicadores del desarrollo económico y social en AméricaLatina, 1976,2nd.ed. 1984,179 pp.
3 Series históricas del crecimiento de América Latina, 1978,2nd.ed. 1984,206 pp.
4 Estadísticas sobre la estructura del gasto de consumo de ios hogares según finalidad del gasto, por grupos de ingreso, 1978,110 pp. (Outofprint; replaced by No. 8 below)
5 El balance de pagos de América Latina, 1950-1977, 1979,2nd.ed. 1984,164 pp.
6 Distribución regional del producto inferno bruto sectorial en los países de América Latina, 1981, 2nd.ed, 1985,68 pp.
7 Tablas de insumo-producto en América Latina, 1983, 383 pp.
8 Estructura del gasto de consumo de los hogares según finalidad del gasto, por grupos de ingreso,1984,146 pp.
9 Origen y destino del comercio exterior de los países de la Asociación Latinoamericana de Integración y del Mercado Común Centroamericano, 1985,546 pp.
10 América Latina: balance de pagos, 1950-1984,1986, 357 pp,
11 El comercio exterior de bienes de capital en América Latina, 1986,288 pp.
12 América Latina: índices del comercio exterior, 1970-1984,1987,355 pp.
13 América Latina: comercio exterior según la clasificación industrial internacional uniforme de todas las actividades económicas, 1987, Vol. I, 675 pp; Vol. II, 675 pp.
14 La distribución del ingreso en Colombia. Antecedentes estadísticos y características socioeconómicas de los receptores, 1988,156 pp.
15 América Latina y el Caribe: series regionales de cuentas nacionales a precios constantes de 1980,1991, 245 pp. ■
16 Origen y destino del comercio exterior de los países de la Asocición Latinoamericana de Integración, 1991, 190 pp.
17 Comercio intrazonal de los países de la Asociación de Integración, según capítulos de la ciasiñcación uniforme para el comercio internacional, revisión 2,1992, 299 pp.
18 Clasificaciones estadísticas internacionales incorporadas en el Banco de Datos del Comercio Exterior de América Latina y el Caribe de la CEPAL, 1993, 313 pp.
19 América Latina: comercio exterior según la clasificación industrial internacional uniforme de todas las actividades económicas (CIIU) - Volumen I -Exportaciones, 1993, 285 pp.
19 América Latina: comercio exterior según la clasificación industrial internacional uniforme de todas tas actividades económicas (CIIU) - Volumen II -Importaciones, 1993, 291 pp.
20 Dirección del comercio exterior de América Latina y el Caribe según principales productos y grupos de productos, 1970-1992,1994,483 pp.
21 Estructura del gasto de consumo de los hogares en AméricaLatina, 1995, 274pp,
22 América Latina y el Caribe: dirección del comercio exterior de los principales productos alimenticios y agrícolas según países de destino y procedencia, 1979-1993, 224 pp.
23 América Latina y el Caribe: series regionales y oficiales de cuentas nacionales, 1950-1994,1996,130 pp.
24 Chile: comercio exterior según grupos de la Clasificación Uniforme para el Comercio Internacional, Rev. 3, y paisas de destino y procedencia, 1990-1995, 1996,480 pp.

1 Nicaragua: el impacto de la mutación política, 1981, 2nd. ed. 1982,126 pp.
2 Perú 1968-1977: la política económica en un proceso de cambio global, 1981, 2nd. ed. 1982,166 pp.
3 La industrialización de América Latina y la cooperación internacional, 1981,170 pp. (Out of print, will not be reprinted.)
4 Estilos de desarrollo, modernización y medio ambiente en la agricultura latinoamericana, 1981,4th. ed. 1984, 130 pp.
5 El desarrollo de América Latina en tos años ochenta, 1981,2nd. ed. 1982,153 pp.
5 Latín American development in the 1980s, 1981, 2nd. ed. 1982,134 pp.
6 Proyecciones del desarrollo latinoamericano en /os años ochenta, 1981,3rd. ed. 1985,96 pp.
6 Latín American development projections for the 1980$, 1982,2nd. ed. 1983,89 pp.
7 Las relaciones económicas extemas de América Latina en los años ochenta, 1981, 2nd. ed. 1982,180 pp,
8 Integración y cooperación regionales en los años ochenta, 1982,2nd. ed. 1982,174 pp,
9 Estrategias de desarrollo sectorial para los años ochenta: industria y agricultura, 1981, 2nd. ed. 1985,100 pp.
10 Dinámica del subempleo en América Latina. PREAL C, 1981,2nd. ed. 1985,101 pp.
11 Estilos de desarrollo de la industria manufacturera y medio ambiente en América Latina, 1982, 2nd. ed. 1984, 178 pp.
12 Relaciones económicas de América Latina con los países miembros del "Consejo de Asistencia Mutua Económica”, 1982,154 pp.
13 Campes/nado y desarrollo agrícola en Bolivia, 1982, 175 pp.
14 El sector externo: /nd/cadores y análisis de sus fluctuaciones. El caso argentino, 1982,2nd. ed. 1985,216 pp.
15 Ingeniería y consultoría en Brasil y el Grupo Andino, 1982,320 pp.
16 Cinco estudios sobre la situación de la mujer en América Latina, 1982,2nd. ed. 1985,178 pp.
16 Five studies on the situation of women in Latín America, 1983,2nd, ed. 1984,188 pp.
17 Cuentas nac/ona/es y producto material en América Latina, 1982,129 pp,
18 El financiamiento de las exportaciones en América Latina, 1983,212 pp.
19 Medición del empleo y de /os ingresos rurales, 1982, 2nd. ed. 1983,173 pp.
19 Measurement o f empioyment and income in rural areas, 1983,184 pp.
Estudios e Informes de la C E P A L 20 Efectos macroeconómicos de cambios en las barreras ai comercio y al movimiento de capitales: un modelo de simulación, 1982,68 pp.
21 La empresa pública en la economía: la experiencia argentina, 1982,2nd. ed. 1985,134 pp.
22 Las empresas transnacionales en la economia de Chile, 1974-1980,1983,178 pp.
23 La gestión y la informática en las empresas ferroviarias de América Latina y España, 1983,195 pp.
24 Establecimiento de empresas de reparación y mantenimiento de contenedores en América Latina y el Caribe, 1983,314 pp.
24 Estabiishing container repair and malntenance enterprises in Latín America and the Caribbean, 1983,236 pp.
25 Agua potable y saneamiento ambiental en América Latina, 1981-1990/Drinking water suppty and sanltatíon in Latín America, 1981-1990 (bilíngual), 1983,140 pp.
26 Los bancos transnacionales, el estado y el endeudamiento externo en Bolivia, 1983,282 pp.
27 Política económica y procesos de desarrollo. La experiencia argentina entre 1976 y 1981, 1983, 157 pp.
28 Estilos de desarrollo, energía y medio ambiente: un estudio de caso exploratorio, 1983,129 pp.
29 Empresas transnacionales en la industria de alimentos. El caso argentino: cereales y carne, 1983, 93 pp.
30 Industrialización en Centroamérica, 1960-1980,1983, 168 pp.
31 Dos estudios sobre empresas transnacionales en Brasil, 1983,141 pp.
32 La crisis económica internacional y su repercusión en América Latina, 1983,81 pp.
33 La agricultura campesina en sus relaciones con la industria, 1984, 120 pp.
34 Cooperación económica entre Brasil y el Grupo Andino: el caso de /os minerales y metales no fañosos, 1983,148 pp.
35 La agricultura campesina y el mercado de alimentos: la dependencia externa y sus efectos en una economía abierta, 1984,201 pp.
36 El capital extranjero en la economia peruana, 1984, 178 pp.
37 Dos estudios sobre política arancelaria, 1984,96 pp.38 Estabilización y liberalización económica en el Cono
Sur, 1984,193 pp.39 La agricultura campesina y el mercado de alimentos: el
caso de Haití y el de la República Dominicana, 1984, 255 pp.
40 La industria siderúrgica latinoamericana: tendencias y potencial, 1984,280 pp.
41 La presencia de las empresas fransnac/ona/es en la economia ecuatoriana, 1984,77 pp.

42 Precios, salarios y empleo en la Argentina: estadísticas económicas de corto plazo, 1984,378 pp.
43 El desarrollo de la seguridad social en América Latina, 1985,348 pp.
44 Market structure, firm size and Brazilian exports,1985, 104 pp.
45 La planificación del transporte en países de América Latina, 1985,247 pp.
46 La crisis en América Latina: su evaluación y perspectivas, 1985,119 pp.
47 La juventud en América Latina y ei Caribe, 1985,181 pp.
48 Desarrollo de los recursos mineros de América Latina, 1985,145 pp.
48 Development of the mining resources o f Latín America, 1989,160 pp.
49 Las relaciones económicas internacionales de América Latina y la cooperación regional, 1985,224 pp.
50 América Latina y la economía mundial del algodón, 1985,122 pp.
51 Comercio y cooperación entre países de América Latina y países miembros del CAME, 1985,90 pp.
52 Trade relations between Brazil and the United States, 1985,148 pp.
53 Los recursos hldricos de América Latina y el Caribe y su aprovechamiento, 1985,138 pp.
53 The water resources of Latín America and the Caribbean and their utilization, 1985,135 pp.
54 La pobreza en América Latina: dimensiones y políticas, 1985,155 pp.
55 Politicas de promoción de exportaciones en algunos países de América Latina, 1985,207 pp.
56 Las empresas transnacionales en la Argentina, 1986,222 pp,
57 El desarrollo frutícola y forestal en Chile y sus derivaciones sociales, 1986,227 pp.
58 El cultivo del algodón y la soya en el Paraguay y sus derivaciones sociales, 1986,141 pp.
59 Expansión del cultivo de la caña de azúcar y de la ganadería en el nordeste del Brasil: un examen del papel de la política pública y de sus derivaciones económicas y sociales, 1986,164 pp.
60 Las empresas transnacionales en ei desarrollo colombiano, 1986,212 pp.
61 Las empresas transnacionales en la economía del Paraguay, 1987,115 pp.
62 Problemas de la industria latinoamericana en la fase crítica, 1986,113 pp.
63 Relaciones económicas internacionales y cooperación regional de América Latina y el Caribe, 1987,272 pp.
63 international economic relations and regional co-operation in Latin America and the Caribbean, 1987,267 pp.
64 Tres ensayos sobre inflación y políticas uo estabilización, 1986,201 pp.
65 La industria farmacéutica y farmoquimica: desarrollo histórico y posibilidades Muras. Argentina, Brasil y México, 1987, 177 pp.
66 Dos estudios sobre América Latina y el Caribe y la economía internacional, 1987,125 pp.
67 Reestructuración de la industria automotriz mundial y perspectivas para América Latina, 1987,232 pp.
68 Cooperación latinoamericana en servidos: antecedentes y perspectivas, 1988,155 pp.
69 Desarrollo y transformación: estrategia para superar la pobreza, 1988,114 pp.
69 Development and change: strategies fot vanqufshfng poverty, 1988,114 pp.
70 La evolución económica deí Japón y su impacto en América Latina, 1988,68 pp.
70 The economic evolutíon of Japan and Hs impact on Latín America, 1990,79 pp.
71 La gestión de los recursos hidricos en América Latina y el Caribe, 1989,256 pp.
72 La evolución del proWema de la deuda extema en América Latina y el Caribe, 1988,77 pp.
72 The evolutíon o f the extemaI debt problem ín Latín America and the Caribbean, 1988,69 pp.
73 Agricultura, comercio exterior y cooperación intemadonal, 1988,83 pp.
73 Agricultura, externa/ trade and International Corporation, 1989,79 pp.
74 Reestructuración industrial y cambio tecnológico: consecuendas para América Latina, 1989,105 pp.
75 El medio ambiente como factor de desarrollo, 1989, 2nd,ed. 1991,123 pp.
76 Ef comportamiento de los bancos transnacionales y la crisis internacional de endeudamiento, 1989, 214 pp.
76 Transnational bank behaviour and the International debt crisis, 1989,198 pp.
77 Los recursos hidricos de América Latina y del Caribe: planificación, desastres naturales y confam/nac/ón,1990,266 pp.
77 The water resources of Latín America and the Caribbean - Planning hazards and pollutíon, 1990, 252 pp.
78 La apertura financiera en Chile y el comportamiento de los bancos transnacionales, 1990,132 pp.
79 La industria de bienes de capital en Amérca Latina y el Caribe: su desarrollo en un marco de cooperación regional, 1991,235 pp.
80 impacto ambiental de la contaminación hídrica producida por la Refinería Estatal Esmeraldas: análisis técnico-económico, 1991,189 pp.

81 Magnitud de la pobreza en América Latina en los años ochenta, 1991,177 pp.
82 América Latina y el Caribe: el manejo de la escasez de agua, 1991, 148 pp,
83 Reestructuración y desarrollo de la industria automotriz mexicana en los años ochenta: evolución y perspectivas, 1992,191' pp.
84 La transformación de la producción en Chile: cuatro ensayos de interpretación, 1993, 372 pp.
85 Inversión extranjera y empresas transnacionales en la economía de Chile (1974-1989). Proyectos de inversión y estrategias de tas empresas transnacionales, 1992, 257 pp.
86 Inversión extranjera y empresas transnacíonalés en la economia de Chile (1974-1989). El papel del capital extranjero y la estrategia nacional de desarrollo, 1992, 163 pp.
87 Análisis de cadenas agroindustriales en Ecuador y Perú, 1993, 294 pp.
88 El comercio de manufacturas de América Latina. Evolución y estructura 1962-1989,1993,150, pp.
89 El impacto económico y social de las migraciones en Centroamérica, 1993,78 pp.
90 El papel de las empresas transnacionales en la reestructuración industrial de Colombia: una síntesis, 1993,131 pp.
91 Las empresas transnacionales de una economia en transición: La experiencia argentina en los años ochenta, 1995,193 pp.
92 Reestructuración y desarrollo productivo: desafío y potencial para los años noventa, 1994, 108 pp.
93 Comercio internacional y medio ambiente. La discusión actual, 1995, 112 pp.
94 Innovación en tecnologías y s/sfemas de gestión ambientales en empresas lideres /af/noamericanas, 1995,206 pp.
95 México: la industria maquiladora, 1996,237 pp.
Serie INFOPLAN: Temas Especiales del Desarrollo
1 Resúmenes de documentos sobre deuda extema, 1986,324 pp.
2 Resúmenes de documentos sobre cooperación entre países en desarrollo, 1986,189 pp.
3 Resúmenes de documentos sobre recursos hidricos, 1987,290 pp.
4 Resúmenes de documentos sobre planificación y medio ambiente, 1987,111 pp.
5 Resúmenes de documentos sobre integración económica en América Latina y el Caribe,,1987, 273 pp.
6 Resúmenes de documentos sobre cooperación entre países en desarrollo, II parte, 1988,146 pp.
7 Documentos sobre privatización con énfasis en América Latina, 1991, 82 pp.
8 Reseñas de documentos sobre 'desarrollo ambientalmente sustentabte, 1992, 217 pp.
9 MERCOSUR: resúmenes de documentos, 1993, 119 pp.
10 Políticas sociales: resúmenes de documentos, 1995, 95 pp.
11 Modernización del Estado: resúmenes de documentos, 1995, 73 pp.
12 Gestión de la información: reseñas de documentos, 1996,152 pp.
13 Políticas sociales: resúmenes de documentos il, 1997,80 pp.

Konrad-Aienauer-
StiftungCIEDLA
C O
f T l
oC J
C Q
c d
r |
Oc j
3/1998
E l DESAFÍO DE
LA GLQBALIZACIÓNTENUSGlobaiización y crisis M artin Krause _____Efectos de la globaiización en el m undo jurídico.l 'n enfoque particular en e l área financiera y de negociosFacundo G óm ez M inujín _______ .La com petencia entre los sistemas y la división internacional del trabajo ante el fenóm eno de la globaiizaciónH ans jü rgen R o sn e r_________________________La crisis asiática y el proceso de globaiización Ramón Frediani _____________________ 'Las em presas m ultinacionales en América Latina. ¿Promotoras del desarrollo o villanos de la globaiización?Klaas S cb a e ffle r_______________________________________Los procesos de globaiización:perspectivas y riesgos para América LatinaRaúl Bem al-M eza _____________________________________
ENSAYOSAlemania y la Unión Europea Ottfried H ennig ____________Desarrollo económ ico, poder judicial y com petitividad en la República Argentina A n a L Piaggi , _ .Mediaciones en la mira: culturas populares, recepción, educación y desarrollo Marcelo G uardia C respo_________________
DOCUMENTOS Y HECHOSLas elecciones nacionales en Paraguay Wolf-Rüdiger L ü e r s __________________Desarrollo y resultados de las elecciones parlam entarias y municipales celebradas en la República DominicanaM anfred H u b e r_______________________________________Elecciones de fin de siglo en el EcuadorM anfred Rabeneick __________________________________Elecciones presidenciales en Colombia Hubert Seegers_____________ __________

CUADERNOS DE ECONOMIA
Año 35 Agosto 1998 N° 105
S U M A R I O
T a s a s d e I n t e r é s N o m in a l d e C o r t o P l a z o en C h il e :
U n a C o m p a r a c ió n E m p ír ic a d e s u s M o d e l o s 161
Franco Parisi
D e s e m p e ñ o E c o n ó m ic o A g r e g a d o y M e r c a d o A c c io n a r io .
U n A n á l i s i s E m p í r ic o p a r a e l C a s o C h i l e n o 183
Jorge Gregoire C.Leonardo Letelier S,
T a m a ñ o d e l o s F o n d o s d e P e n s io n e s e n C h il e y
s u D e s e m p e ñ o F in a n c ie r o 2 0 5
Patricio Arrau Rómulo Chumacero
Un M o d e l o d e D u r a c i ó n E s t r u c t u r a l p a r a e l R e e m p la z o
d e B ie n e s D u r a b l e s 2 3 7
Viviana Fernández M.
TECHNICAL NOTE
T h e G r o w t h o f P u b l ic E x p e n d it u r e in L a t ín A m e r ic a :
A T e s t o f " W a g n e r 's L a w " 255John Thornton
IN STITU TO D E ECO N O M IA P O N T IF IC IA UNIVERSIDAD CA TO LICA DE C H IL E
PRECIO SUBSCRIPCION ANUAL 1998 (CUATRIMESTRAL)Chile S U.000América Latina USS 42 (incluye envío aéreo)Europa y USA USS 52 (incluye envfo aéreo)
NUMEROS SUELTOS O ATRASADOSChile S 4.000Extranjero USS 15 (incluye envío aéreo)
Enviar pedidos de suscripción y cheque o giro (libre de comisiones y gastos bancaríos) a nombre de:Pontificia Universidad Católica de Chile Instituto de Economía Oficina de Publicaciones Teléfonos: 686-4314; 686-4312 Casilla 76, Correo 17, Santiago CHILEFAX 56-2-5521310 echamorr® volcan, facea. puc, el
Cuadernos de Economía Pontificia Universidad Católica de Chile
Derechos reservados Inscripción N* 63.967
(autorizada su reproducción con mención de las fuentes)

Desarrollo EconómicoRevista de Ciencias Sociales
Comité Editorial: Juan Carlos Torra (Director), Luis Beccaria, Roberto Bouzas, Daniel Chudnovsky, José Nun, Edith Obschatko, Juan Carlos Portantiero, Hilda Sabato, Getulio E. Steinbach (Secretario de Redacción)
NOTA EDITORIALLUIZ CARLOS BRESSER PEREIRA; La reforma del Estado de los años
noventa. Lógica y mecanismos de control.TORCUATO S. DI TELIA: De opciones racionales y confabulaciones. Por
una teoría política de la política.VICTOR 6EKER, GUILLERMO ROZENWURCEL, EDGARDO CENZON,
CARLOS GALPERIN Y JAVIER MILEI: La disputabiiidad en la industria telefónica argentina.
GUILLERMO V. ALONSO: Democracia y reformas: Las tensiones entre decretismo y deliberación. Ei caso de la reforma previsional argentina.
ELMAR ALTVATER: La ecología del nuevo orden mundial.
NOTAS Y C O M EN TA R IO S
JOSEPHHODARA: Las confesiones de Don Raúl. El capitalismo periférico.
1N MEMOR1AM
JUAN JOSE LLOVET: Saiud reproductiva y sexualidad: el Estado, la sociedad civil y otros actores sociales.
IN FO R M A C IO N IN STITU C IO N A L
IN FO R M A C IO N DE BIBLIOTECA
DESARROLLO ECONOMICO - Revista de Ciencias Sociales es una publicación trimestral editada por e! Instituto de Desarrollo Económico y Social (IDES). Suscripción anual: R. Argentina. S 60,00; Países limítrofes, U$3 68; Resto de América, U$S 74; Europa, U$S 76; Asia, Africa y Oceanía, USS 80. Ejemplar simple: U$S 15 (recargos según destino y por envíos vía aérea). Más información disponible en I n t e r n e t :
www.clacso.edu.ar/~ides. Pedidos, correspondencia, etcétera, a:
ISSN 0046-001X
Vol. 38 Julio * setiembre 1S98 N 5 1 5 0
Instituto de Desarrollo Económico y SocialAráoZ 2838 4 1425 B uenos Aires 4 Argentina Teléfono: 804-4949 4 Fax: (541) 804-5856
C o rre o e le ctró n ico : id e s @ c ia c s o .e d u .ar

JULIO-AGOSTO 1998
M nueva SOCIEDAD
156 Director Heidulf Schmidt Jete de Redacción: S. Chejfec
I
COYUNTURA:Brasilio Saílum Jr. Brasil. Las dificultades de Cardoso. Jorge Cela. República Dominicana, De las elecciones a la sociedad civil. Rafael Vergara, Colombia. ¿Elecciones hacia el cambio?APORTES: Salvador Martí, La violencia política en Nicaragua. Eiites, bases sandinistas y contras en los 90. David Slater. Los rasgos espaciales de la democratización en tiempos globales. Klaus Bodemer. La glcbalización. Un concepto y sus problemas.TEMA CENTRAL: ESTADO Y EXCLUSIÓN. Soma Fleury, Política social, exclusión y equidad en América Latina en los 90. Plerre Salama, Pobreza, empleo e inflación en América Latina. José Miguel Candia, Exclusión y pobreza. La fo- calización de las políticas sociales. Carlos Sojo, Reforma económica y cambio estatal en Centroamérica. Cristina Bloj, De las necesidades y derechos a las políticas. Investigación antropológica y políticas sociales, Maria das Grabas Rúa. Exclusión social y acción colectiva en el medio rural. El Movimiento de los Sin Tierra de Brasil. Romeo Grompone. Exclusión y control social. Un nuevo mapa peruano. Emilio Pradilla Cobos, Fragmentación y exclusión en la megalópolis mexicana.LIBROS: Lulú Giménez, El fin del siglo xix en eí Caribe insular.
SUSCRIPCIONES ANUAL BIENAL(Incluido flete aéreo) (6núm s.) (12núm s.)América Latina USS 50 USS 85Resto del mundo USS 80 US$ 145
PAGOS: Cheque en dólares a nombre da NUEVA SOCIEDAD. Rogamos no efectuar transferencias bancadas para cancelar suscripciones. Dirección: Apartado 61712- Chacao-Caracas 1060-A. Venezuela. Tetfs.: (58-2) 267.31 .89 /265 .99 ,75/265 .53 .21 /266 .16.48/265.18.49, Fax:267.33.97; @: [email protected]; [email protected]ágina digital; www.nuevasoc.org.ve

(SSN: 1*105* 1079
gestión y política públicavol. VII, núm. 1, México, primer semestre de 1998
Rafael Tamayo
Renzo Daviddi
Ishtiaq Jamil
Ernesto Beltrán y Mariano Rojas
Gustavo Leal
GESTIÓN Y POLÍTICA PÚBLICA
Crecimiento económico regional: una sinopsis de la teoría y su conexión explícita con las políticas públicas
La privatización en la transición a una economía de mercado
GESTIÓN Y ORGANIZACIÓN
La cultura administrativa: una forma de comprender la administración pública en distintas culturas
GESTIÓN REGIONAL Y LOCAL
Discriminación de precios en bienes culturales: la arqueología en México
Voces, salidas, lealtades, oportunidades, "denominación de origen” interés y tempo de una política pública: la reforma mexicana de la salud y la seguridad social
CENTRO DE INVESTIGACIÓN Y DOCENCIA ECONÓMICASm
CIDE

l iÌ . X
/
C "
v \ A
J
f/ \
v iiL
VoL 1. No. 1 July 1997
I N A U G U R A L I S S U E
Union Budget for 1997-98: An EvaluationG Thimmaich, Member Planning Commission, New Delhi
Vision and Strategy for the 21st CenturyM B Athreya. Independent Management Advisor, New Delhi
Technology and ManagementSharat Kumar, Director, IM t Ghaziabad
Reforms and the Corporate WorldKalyan Raipuria, Advisor, Ministry o f Commerce, New Delhi
Globalisation - Restructuring and International Competitiveness S P Gupta, Director, ICRIER, New Delhi
Fiscal Deficit Containment: Not an Excuse for Neglect of PoorK S Ramachandran, Consultant ICRIER, New Delhi
Management: Agenda for 21st Century Uma Shankar, Senior Faculty, MDL Gurgaon
Industry - Dabble in Education But CarefullyN K Uberoi, CE-DLP, IMT, Ghcziabad
Indian Managers for a Global EconomyAtmanand, Associate Prof., IMT, Ghaziabad
Measuring Quality of Work Life and Simple Approach Naval Karrir, Deputy Manager: PCRA, New Delhi
Amulya Khurana, Faculty, IIT, Delhi
IMTThe Journal of Institute of Management Technology
Ghaziabad

R evista M exicana de S o c io l o g íaD irector René Millán Valenzuela Editora: Sara María Lora Flores
Ó rgano oficial dei Instituto de tn vesti zacio n es Sociales d é la Universidad Nacional Autónom a de México, G rtu ito Mario de la Cueva, Zona Cultural, Cd. Universitaria, CP. 04510
NÚM. 2 / ABRIL-JUNIO / 1998PERSPECTIVAS TEÓRICAS
El papel del parlamento duranti la consolidación de la democracia y después J u u á n S a n ta m a r ía
Algunas sugerencias para renovar la función de control parlamentario Angel G arrorena M orales
LOS PARLAMENTOS EN EUROPA: ESPAÑA E ITALIA
Itejjresentaciiín y funciimes del congreso de los diputados español: 1977-1996 Lourdes López N ieto
El parlamento en España, procedimientos de elección y funciones Pablo O ñate y Antonia Martínez
Parlamento y opinión pública en España Ismael C respo M/uwínezyJ ordi C alvet C respo
El parlamento en la reforma constitucional italiana M ó n ic a M ín d e í L a c o
DEMOCRACIA. PRE SID E N O A U SM O Y PARLAMENTARISMO EN AMÉRICA LATINA
Democracia y valores democráticos en la clase politica latinoamericana Manuel Alcántara Sáez
Presidencialismo y parlamentarismo en América Latina: un .debate abierto M ario Serrafero
Uruguay: leu alternativas de un presidencialismo pluralista J orge Lan m ro
R EP R E SE N TA C IO N Y D IM E N SIO N ES PARLAM EN TARIAS EN M E X IC ORepresentación y la construcción de un gobierno representativo
Yolanda M etenoerg
La inccrtidumbre constitucional. Gobierno dividido y aprobación presupuestal en el congreso mexicano, 1997-2000
U lis es C arrillo y Alonso L ujambio
El congreso del estado en Baja California, Del partido hegemónico al partido dominante: 1980-1997
_________ VIctor Alejandro Espinoza Valle____ _____ ______
R E P O R T E S I)E IN V ESTIG A CIO N
Democracia y representación parlamentaria en México L uisa B éjar A.
Algunas observaciones sobre la élite parlamentaria latinoamericana A rachu Mateos D íaz y Cristina Rivas P érez
Inform es y suscripciones: D epartam ento de ventas __________ Telefono: 622 75 64______________

r Library of U.S.Congroaa Card No. 90-640 754*\ ISSN No. 0970-4205 j
JOURNAL OF FINANCIAL MANAGEMENT AND ANALYSIS (JFMA) i n t e r n a t i o n a l r e v i e w o f f i n a n c e
A IM : T h e J F M A - a refereed journal - offers techniques and new concepts backed up by case studies and ne w methodologies and provides a bridge betw een financial m anagem ent theory and practice. Th e Journal is an indispensable decision kit for finance practitioners, policy m akers and scholarly com m unity from developed and developing countries and for those directly con cern ed w ith today’s critical issues in financial m an agem ent, and offers a unique opportunity to contribute your ow n expertise to develop the financial m an agem ent science.
J F M A fo c u s e s on fin a n c ia l m a n a g e m e n t is su e s c o n fro n tin g M N C -c o n t r o lle d and M N C -d e p e n d e n t developed and developing countries, by providing a forum facilitating the deve lopm ent of the science of financial m anagem ent.
* A n a to m y of w idening poverty gap : are selfless service/co-operatives engines of e con om ic grow th?
* Nature of incom e equality among Nigerian peasant farmers* A sta tistica l test for de term ining in a d e q u a cy-cu m -re d u n d a n cy or a d e q u a cy of
a cco u n tin g inform ation in annual financial reports* A c c o u n ta n c y is a means to an end : focus on environmental financial m anagem ent* O ve rn ive stm e n t in fixed assets versus structural adjustm ent program m es leads to
liquidity crisis via structural m a la d ju stm e n t: focus on equipm ent leasingA stud y of put-call parity violations of the Toron to Stock Exchange options
* R ecyclin g of solid w aste : cost-benefit analysis* R ecycled w a te r utilization in Israel *. focus on w aste w ater pricing
A financial analysis of prudent m anagem ent of investm ent cycle and inflationary gap* N ature of distortions caused by inflation* A financial m anagem ent analysis of corporate sickness and recovery - som e advances
in cash m an agem ent techniques* M eaningfulness or otherwise of financial statements under exchange rate fluctuations* Financial m an agem ent and good business ethics : focus on S w a m y C onfide nsive
M o tive and check (cheque) fraud* S y m p to m s of com m ercial banks insolvency/failure (case studies)* Financial m an agem ent implications of rural-urban d ichoto m y for integrated rural
d e ve lopm ent
M A N U S C R IP T S F O R S U B M IS S IO N : Ty p e d articles, in triplicate (including su m m a ry of the paper in 3 0 0 w o rd s ), are invited on any aspect bearing on financial m anagem ent from scholars and practising financial m anagers, planners, analysts, consultants and other professionals for consideration for publication in J F M A , w ith subm ission fee of U . S . 9 15 .
E D IT O R IA L B O A R D C O N S IS T S O F : Em inent financial m anagem ent experts f r o m different countries of the w o rld .
A N N U A L S U B S C R IP T IO N : U .S .$ 85
Subscription and m anuscript m ay be sent to ;M anaging Editor, J F M A
O m Sai Ram Centre for Financial M anagem ent Research 15 Prakash Cooperative H ousing Society, Relief Road
Santacruz (W est), M um bai * 4 0 0 0 5 4 IN D IA

EL TRIMESTRE ECONOMICOCOMITÉ DICTAMINADOR; Alejandro Castañeda, Pablo Cotler, Fausto Hernández Trillo, Raúl Uvas, Rodolfo de la Torre, Alejandro Werner. CONSEJO EDITORIAL: Edmar L Bacha, José Blanco, Gerardo Bueno, Enrique Cárdenas, Arturo Fernández, Ricardo Ffrench*Davis, Enrique Florescano, Roberto Frenkel, Kevin B. Grier, Ricardo Hausmann, Alejandro Hernández, Albert O. Hirschman, Hugo A, Hopenhayn, David Ibarra, Felipe Larrainl Francisco Lopes, Guillermo Maldonado, Rodolfo Manueili, José A. Ocampo, Joseph Ramos, Luis Angel Rojo Duque, Gert Rosenthal, Francisco Sagasti, Jaime José Serra, Jesús Silva Herzog Flores, Osvaldo Sunkel, Carlos Tello, Sweder van Winjberger.
Director: Rodolfo de la Torre, Subdirector: Raúl Uvas Secretario de Redacción: Guillermo Escalante A.
Vol. LXV (3) México, Julio-Septiembre de 1998 Núm. 259
ARTÍCULOS
Augusto Rincón Pledrahita Crecimiento económico en ia América Latina.Estudio basado en el modelo neoclásico
José Miguel Sánchez Callejas, Sebastián Valdés de Ferarl y Bart Ostro
Robin M. Grler y Kevin B. Grler
Aarón Tornell y Gerardo Esquivel
Estimación de los beneficios en salud del Plan de Descontaminación de Santiago
Inflación e Incertídumbre inflacionaria en México, 1960-1997
La economía política del ingreso de México al TLC
DOCUMENTOS: Comunicado oficial del Consejo InterAcción. COMENTARIOS BIBLIOGRÁFICOS: Francisco José Calderón Vázquez: Carmen Arasa Medina y José Miguel Andreu, Economía del Desarrollo
E l Trim estre Económico aparece en los meses de enero, abril, julio y octubre. La suscripción en México cuesta $180.00. Número suelto $60.00, Número suelto atrasado $40.00. Disquetes con el índice general (por autores y temático) de los números 1-244, $26.00 (4.49 dls.)
Precios para 1998 (dólares)
Números sueltos Suscnpc/ones --------------------------------------------------
Del año AtrasadosCentroamérica y el Caribe 70.00 20.00 10.00
Sudamérica y España 90.00 30.00 20.00
Canadá, Estados Unidos y resto del mundo 120.00 33.00 20.00
Fondo de Cultura Económica, carretera Picacho Ajusco 227, Col. Bosques del Pedregal, 14200 México, Distrito Federal. Suscripciones y anuncios: teléfono 227 46 70, señora Irma Barrón.
Correo electrónico (E-mall): [email protected] Página del Fondo de Cultura Económica en Internet: http://www.fce.com.mx

The Developing EconomiesThe Journal of
Institute of Developing Economies Tokyo, Japan
Volume XXXVI Number 2 June 1998
The Performance of the Integrated RuralDevelopment Program in India:An Assessment Satya Paul
Structure of Rural-Based Industrialization:Metal Craft Manufacturing on the Outskirtsof Greater Manila, the Philippines Yujiro Hayami,
Masao Kikuchi, andEster B. Marciano
Effects of Domestic Policies and ExternalFactors on Agricultural Prices: Cassavaand Soybeans in Indonesia Romeo M. Bautista
Agricultural Prices in Bulgaria: Did TransitionCreate Structural Breaks? Pavlos Karadeloglou
Vertical Integration Strategies ofthe National Oil Companies Majed A. Al-Moneef
The Developing Economies is an international and interdisciplinary forum for social science studies of the developing countries. The Developing Economies provides an opportunities for discussion and exchange across the broadest spectrum of scholarly opinion, in order to stimulate theoretical, empirical, and comparative studies of the problems confronted by countries on the road to development.
Scholars, specialists, and research students from all disciplines and nations are invited to submit their articles and reviews. Unpublished manuscripts typed double space, together with a duplicate copy, may be sent to the Secretary, The Developing Economies. Institute of Developing Economies, 42 Ichigaya-Hommura-cho, Shinjuku-ku, Tokyo 162- 8442, Japan. Articles should not exceed 10,000 words. References, footnotes, and all bibliographical information must be provided. Authors of articles accepted will receive a free copy of the journal. Manuscripts will not be returned.
Subscription correspondence should be sent to Maruzen Co., Ltd., P.O. Box 5050, Tokyo International 100-3199, Japan. The Developing Economies is published quarterly (March, June, September, and December). The annual subscription rate for 1998 is US$96.00, postage included. A single copy is US$24.00, postage included.
P R O B L E M A S ®
D F S A R R n I L O
R E V I S T A L A T I N O A M E R I C A N A DE E C O N O M Í A
Publicación trimestral del Instituto de Investigaciones Económicas
U n iv e r s id a d N a c io n a l A u t ó n o m a de M é x ic o
VOL. 29___________________VI3______________________ abril-junio 1998P resen tación
ARTÍCULOSCarlos Eduardo MartitisCapitalismo contemporáneo y crisis del sistema de innovación Claudio KatzOptimismo y pesimismo en la economía de la innovación José R am ón C uzm a nAnálisis de un modelo dinámico intersectorial Jaime OsoríoMercados interno y externo: ¿para quién produce la nueva economía latinoamericana? Los casos de Chile y MéxicoSalvador Padilla Hernández El liberalismo mexicano y el pensamiento del Dr. José María Luis Mora
TESTIMONIOSAlicia Girón GonzálezEl premio en investigación económicaMtro. Jesús Silva Hentog y la misión del nEc.Gérard de BernisSobre el sentido y significado del premio en investigación económica “Maestro Jesús Silva Herzog"Afbríd Cristina RosasLas grandes potencias del siglo XXILuis Arturo Méndez ReyesReflexiones acerca de los premios en investigación científicaLuis Sandoual RamírezLa transición energética contemporánea
LIBROS
Norm as y c rite rio s de publicación
Ventas: en librerías de la u n a m . Suscripciones y Ventas: Oepto. de Ventos del i l f c : Torre I I de Humanidades, 3er, piso, Ciudad Universitaria, México, D.F., 04510 ó al A.P. 20*721,01000, México. D.F. Tel.: 623-00*£>4, Fax: 623 01 24, Correo electrónico: ventiiec@servidor. unam.mx. Colaboraciones: Depto. de la Revista: Torre II de Humanidades. 5o. piso, Cubículo 515, Tel.: 623-01*05, Fax: 623-00-07, con Atención del Director Dr. Salvador Rodríguez y Rodríguez. Correo electrónico: revprodetiiiaervidor. unam.mx

Cambridge Journals
Journal of Latin American StudiesJoum ai o f Latin American Studies now in its 30th
year o f publication presents recent research in thè
field o f Latin American studies in history, economics, geography, politics, international
relations, sociology, social anthropology and
cultural history. Regular features include articles
on contemporary themes, specially commissioned
commentaries and an extensive section o f book
reviews. There is no com m itm ent to any political viewpoint or ideology.
Recent articles include; Process and pattern: A re
examination o f the Ibero-American independence
movements,; 1808-1826; Taxation, coercion, trade
and development in a frontier economy, early and
m id colonial Paraguay '.The revolution o f the ; :
Ganhadores’: Urban labour, ethnicity and the :
African Strike o f 1857 in Bahia, Brazil.
AmericanStudies
Subscriptions'
Volume 3 0 in 1998: February, May and October
£ 80 for institutions; £45 for individuals; £31 for
members o f SIAS, A H ilA and CLAH; £28 for stu-
dents.Prices include delivery by air
ISSN 0 0 2 2 -2 1 6 X
Take a closer look... freePlease send m e a free sam ple copy o f :
Journal of Larôn American Studies
Send qriixifl to:Joianah Marketing, Cambridge University Press, the Edinburgh Building, Cambridge, CB2 2RU, UK
5270S
nam e
address
ro conracf the Journals Marketing Department -in Cambridge: tel +44(0)1223 325806 fax +44(0)1223 315052 email [email protected] inNewYork: tel (9 1 4 )9 3 7 96 0 0 x 1 54 (ax (914)9374712 email journals_marketingiicup.org
¿Ü C a m b r i d g e .T h e l i d in b u r g h B u ild in g . C a m b r id g e , c b ^ i r u , U K
,1J F U N I V E R S I T Y P R E S S 40 W e st z o th S tree t, N ew Y ork, NY 10011- 4111. U S A

Estado v sociedadGOBERNABILIDAD Y GLOBALIZACIONCarlos M. Vilas
AniversariosLA REFORMA DEL '18 Y EL FUTURO DE LA UNIVERSIDADEnrique Otcizn
Revista de economía editada por el INSTITUTO
ARGENTINO PARA EL DESARROLLO ECONOMICO
SUMARIO DEL N° 157 I de julio al 15 de agosto de 1998
Suscripción 8 números /1 año: $ 75.00
4 números / 6 meses: $ 37.50
ReflexionesEDUCACION. TRABAJO, TECNOLOGIAGaudencio Frigotto
Educación ISECTOR INDUSTRIALY EDUCACION TECNICAATRAE
OpinionesMARIATERESA SILVENT MARIA ERNESTINA ALONSO
Educación IIUN PROBLEMA "PERVERSO"Aída Arango
Para ¡a historia del país AUGUSTO REINHOLD Horacio Giberti
DocumentoEL PROBLEMA ENERGETICO EN LA REPUBLICA ARGENTINAFctcra
InterpretacionesLA ACUMULACION EN UN REGIMEN CON RENTA AGRARIAM aría Adela Plascncia
Economía internacional MERCADO DEL AZUCAR: NUEVOS DEBATES Y DESAFIOSKarína Bidascca
Economías regionalesU S POLITICAS NEOLIBERALES Y U CRISIS DE LA PROVINCIA DEL NEUQUENErnesto Bilder, Humberto Zambón, Adriana Giuliani
ParadigmasEL FORDISMO EN U ACEPCION REGUUCIONISTAJosé Eli Da Vciga
realidad económ ica Revista de econom ía editada por el Instituto
Argentino para el Desarrollo Económ ico (IAD E)- Hipólito Yrigoycn 1116- 4 o piso (1086) Buenos A ires
Teléfonos y fax: 381-7380/9337 c-mail: iadc@ rcc.com .ar

—/ Perspectivasen poíftíca, economía y gestión
Volumen 1 - Número 2 -1998
Para suscribirse comuniqúese con Nelly Berenguer Editora Ejecutiva: Fono: (562) 6784067 Fax: (562) 6894987 E*mail: perspectGdii.uchile.cl
o escríba a:República 701, Santiago, Chile

PROTECCIÓN A LOS CONSUMIDORESNueva ley del consumidor: innovaciones y limitaciones
Francisco Fernández
La pirámide financiera MMMDaniel Kaufmann
Protección a ios consumidores en Chile:¿Por qué tan poco y tan tarde?
Eduardo Enget
ARTÍCULOSLa ética del gobierno ¿debe codificarse?
Frededck Schauer
La regulación del mercado laboral en Chile: 1975-1995Alejandra MizaJa
Competencia y regulación en telecomunicaciones: la experiencia chilena
José Ricardo Meto y Patío Serra
PROPUESTAi Cómo reformar el sistema de ISAPRE ?
Ronakí FischerComentarios de Rafael Caviedes, Alejandro Ferrelro y Francisco Quesney Respuesta de Ronakí Fischer

71 Revista de« n a I I C v l M a U C #EconomíaPolítica
Volume 18, n° 3 (71), julho-setembro/1998
Crescimento com restrigoes de divisasOtaviano Canuto
O empresário brasileiroSergio Birchal
Os novos clássicos e HayekJorge Soromenho
Indicadores de desenvolvimento sócio-económicoJuan Hersztajn Moldan
O futuro da PetrobrásFabio Giambiagi e Adriano Rodrigues
R esenhas de L ivros
Bolhas e péndulos Crise, reforma do Estado e governabilidade
A sociedade justa Esiabilizaçâo e crescimento
editoraB34

\
United Nattons publications may be obtained from bookstores and distributors throughout the world. Consult your bookstore or write to: United Nations, Sales Section, New York or Geneva.
C O M M E N T S E P R O C U R E R L E S P U B L IC A T IO N S D E S N A T IO N S U N IE S Les publications des Nations Unies sont en vente dans les librairies et tes agences dépositaires du monde entier. Informez-vous auprès de votre libraire ou adressez -vous
à: Nations Unies, Section des ventes, New York ou Genève.
ICAK flO T ly N 3 A A H IM O r r A N N 3A A M H O B*% CAM H EH tfM X M A U X H
H m m m OprtMMaauN« OO-mammcmmwix momim nynirrat m knmjmkm« m r a -H » r* < n tti4 » *o m *x paAonax mm?*. H*»o«ht« cnpM iw o4 m x m k u a
aaui«M HHHMNOM ««ruNK « «mm nNiUNTi no u p t c y : OpriNtoauN* ot-MAMRMawx HaumA. Comumm no npaaaat« io m n m A, M uo-llop« mmm )K«m n .
C O M O C O N S E G U IR P U B L IC A C IO N E S D E L A S N A C IO N E S U N ID A S Las publicaciones de las Naciones Unidas están a la venta en librerías y casas distribuidoras en todas partes del mundo. Consulte a su librero o diríjase a: Naciones Unidas, Sección de Ventas, Nueva York o Ginebra.
Las publicaciones de la Comisión Económica para América Latina y el Caribe (CEPAL) y las del Instituto Latinoamericano y del Caribe de Planificación Económica y Social (ILPES) se pueden adquirir a los distribuidores locales o directamente a través de:
Publicaciones de las Naciones Unidas Publicaciones de las Naciones UnidasSección de Ventas - DC-2-0853 Sección de Ventas, Fax (22)917-0027Fax (212)963-3489 Palals des NatlonsE-mall: publlcatlons9un.org 1211 Ginebra 10, SuizaNueva York, NY, 10017 Estados Unidos de América
Publications of the Economic Commission for Latin America and the Caribbean (ECLAC) and (hose of the Latin American and the Caribbean Institute for Economic and Social Planning (ILPES) can bo ordered from your local distributor or directly through:
H O W T O O B T A I N U N IT E D N A T IO N S P U B L IC A T IO N S
Unidad de Distribución CEPAL - Casilla 179-D
Fax (562)208-1946 E-mail: publications 0 ec lac .cl
Santiago de Chile
United Nations Publications Sates Sections, DC-2-0853 Fax (212)963-3489
United Nations Publications Sales Sections, Fax (22)917-0027 Palais des Nations 1211 Geneve 10, SwitzerlandE-mail: pub1icationsQun.org
New York. NY, 10017USA
Distribution Unit CEPAL - Casilla 179-D
F ax , (562)208-1946 E-mail: publications 9 ectac .cl
Santiago. Chile