
DYNAMICS OF VERGENCE EYE MOVEMENTS IN PRE ...
82
DYNAMICS OF VERGENCE EYE MOVEMENTS IN PRE-VERGENCE ADAPTATION AND POST-VERGENCE ADAPTATION CONDITIONS DISSERTATION Presented in Partial Fulfillment of the Requirements for the Degree Doctor of Philosophy in the Graduate School of The Ohio State University By PremNandhini Satgunam, B.S (Optom), M.S * * * * * The Ohio State University 2007 Dissertation Committee: Approved By Dr. Nicklaus Fogt, Advisor Dr. Michael Earley Dr. Marjean Taylor Kulp Dr. Thomas Raasch ________________________ Advisor Vision Science Graduate Program
-
Upload
khangminh22 -
Category
Documents
-
view
3 -
download
0
Transcript of DYNAMICS OF VERGENCE EYE MOVEMENTS IN PRE ...

DYNAMICS OF VERGENCE EYE MOVEMENTS IN PRE-VERGENCE
ADAPTATION AND POST-VERGENCE ADAPTATION CONDITIONS
DISSERTATION
Presented in Partial Fulfillment of the Requirements for
the Degree Doctor of Philosophy in the
Graduate School of The Ohio State University
By
PremNandhini Satgunam, B.S (Optom), M.S
* * * * *
The Ohio State University
2007
Dissertation Committee: Approved By Dr. Nicklaus Fogt, Advisor Dr. Michael Earley Dr. Marjean Taylor Kulp Dr. Thomas Raasch ________________________ Advisor Vision Science Graduate Program


ii
ABSTRACT
Objects at different distances are viewed using vergence eye movements. These
eye movements are brought about by a negative feedback vergence controller that
monitors the eye and the target position. The vergence controller contains a fast vergence
component and a slow vergence component. The fast vergence component has an initial
open-loop portion that elicits the vergence movement followed by a closed-loop
component that completes the vergence movement. Sustained vergence posture is
maintained by the slow vergence component, the neural innervation of which is
responsible for vergence adaptation. Control system models predict that for sustained
viewing, the slow vergence controller relieves the fast vergence controller. The fast
vergence controller is then available to respond to novel stimuli. The purpose of the
current dissertation was to experimentally assess interactions between the slow and fast
vergence components. Specifically, vergence parameters including vergence latency,
vergence amplitude and vergence velocity were studied before and after vergence
adaptation.
Twenty subjects were enrolled with informed consent. A haploscopic arrangement
was used to present computer generated vergence targets. Subjects viewed a 12 degree
vergence target initially for 5 seconds (pre-vergence adaptation) and subsequently for 5
minutes (post-vergence adaptation). Subjects made a divergence or convergence
movement of 4 degrees from the 12 degree vergence position for both the viewing
durations (5 seconds and 5 minutes). Phoria measures were made at three different time
intervals in a given trial to monitor vergence adaptation. Twenty trials were measured on
different days (10 trials for convergence and 10 trials for divergence) for each subject.

iii
It was found that the divergence latency increased by 11.5 %, while divergence
velocity and amplitude decreased by 43.8 % and 34 % after vergence adaptation. This
trend was present after sustained vergence regardless of the presence of positive vergence
adaptation. For convergence, the velocity (8.2 %) and amplitude (17.7 %) were found to
be significantly higher after a period of sustained convergence only if vergence
adaptation occurred.
The change in vergence amplitude and velocity brought about by vergence
adaptation followed the main sequence ratio (1:4) established in the literature. This
suggests that the increase in neural innervation from the slow vergence controller
interacted with the disparity detectors. Specifically, these data suggest that there is a
decline in the divergent disparity detectors after sustained vergence. Finally, these data
suggest that slow vergence innervation is gated during a fast vergence movement.

iv
Dedicated to my Mom and people like her, who never had an opportunity for
education, yet struggle to give it to their children

v
ACKNOWLEDGMENTS
I take this opportunity to thank everyone who has been a source of inspiration,
support and of tremendous help in my graduate school years at OSU. First of all, is my
adviser, Dr. Nick Fogt, who believed that I could complete this work in time when I had
my own doubts. Without his deep insightful discussions and patient corrections of my
many ‘unreadable’ drafts this dissertation would have never seen light. He has been
tirelessly helping me for all these five years and constantly thinking in my best interest
for my future career. Dr. Angela Brown has been another well-wisher and I am indebted
to her for her words of wisdom. I thank Dr. Andrew Toole for sharing his expertise in
computer code nuances. This project would have never been completed if my subjects
had not come 20 times to complete the study; I thank them for their perseverance. Dr.
Karla Zadnik, for her timely assistance in clearing the required paper work. Finally, my
committee members Dr. Mike Earley, Dr. Marjean Kulp and Dr. Tom Raasch for their
discussion and comments.
I have the blessing of good friends to talk and listen to me that buffered me well
during the stressful periods in my graduate study. I will not be able to name them all but
in particular, I am grateful to Deepa, Indu, Vidhya, Sowjanya, Priya and Barbara Pyle for
their moral support and prayers and in reminding me that I am neither the only one nor
the first one to go through this. Finally, my parents, Vaidehi akka, brothers and sisters-
in-law for their phone calls, encouragement and prayers.

vi
VITA
May 8, 1977……………………………………………. Date of Birth
1999……………………………………………………. B.S. Optometry, Elite School of Optometry India
1999 – 2002……………………………………………..Faculty-cum-clinical instructor, Elite School of Optometry India
2002 – 2004……………………………………………. M.S. Vision Science, The Ohio State University
PUBLICATIONS
Satgunam, P., Fogt, N. (2005). Saccadic latencies for achromatic and chromatic targets. Vision Research , 45: 3356-3364. Brown, A., Lindsey, D., Satgunam, P., Miracle, J. (2007). Critical immaturities limiting infant binocular stereopsis. Investigative Ophthalmology and Visual Science, 48: 1424-1434.
FIELDS OF STUDY
Major Field: Vision Science
vii
TABLE OF CONTENTS
Abstract ............................................................................................................................... ii
Dedication ........................................................................................................................ ..iv
Acknowledgments............................................................................................................... v
Vita..................................................................................................................................... vi
List of Tables ...................................................................................................................... x
List of Figures .................................................................................................................... xi
Chapters 1. Introduction..................................................................................................................... 1
1.1 Control system models.............................................................................................. 2
1.2 Components of vergence movement......................................................................... 4
1.3 Vergence Adaptation ................................................................................................ 8
1.4 Background............................................................................................................. 11
1.5 Overview of experiments........................................................................................ 13
2. Preliminary Studies....................................................................................................... 15
2.1 Experiment I: Brock string experiment................................................................... 15
2.1.1 Introduction.................................................................................................. 15 2.1.2 Methodology................................................................................................ 16 2.1.3 Data analysis ................................................................................................ 18 2.1.4 Results.......................................................................................................... 19 2.1.5 Conclusion ................................................................................................... 21
2.2 Experiment II - Effect of accommodative vergence on vergence adaptation......... 21
2.2.1 Introduction.................................................................................................. 21

viii
2.2.3 Methods........................................................................................................ 22 2.2.4 Results.......................................................................................................... 24 2.2.5 Conclusions.................................................................................................. 25
2.3 Experiment III: vergence dynamics after vergence adaptation studied in an
anaglyphic setup............................................................................................................ 26
2.3.1 Introduction.................................................................................................. 26 2.3.2 Methods........................................................................................................ 26 2.3.3 Results.......................................................................................................... 29 2.3.4 Conclusion ................................................................................................... 33
3. Introduction - Main Study............................................................................................. 34
4. Methods......................................................................................................................... 36
4.1 Subjects ................................................................................................................... 36
4.2 Baseline measurements........................................................................................... 36
4.3 Experimental set up................................................................................................. 37
4.3.1 Haploscope arrangement.............................................................................. 37 4.3.2 Stimulus target ............................................................................................. 39
4.4 Accommodative measurements .............................................................................. 39
4.5 Eye tracking instrument .......................................................................................... 41
4.6 Test Trial................................................................................................................. 41
5. Results........................................................................................................................... 45
5.1 Data analysis ........................................................................................................... 45
5.2 Accommodation – Baseline measure...................................................................... 45
5.3 Calculation of phoria and vergence adaptation....................................................... 46
5.4 Calculation of vergence dynamics .......................................................................... 48
5.5 Effect of vergence adaptation on vergence dynamics............................................. 51
5.6 Comparison between positive trials and negative trials.......................................... 52
5.9 Vergence anomalous subjects ................................................................................. 54
6. Discussion ..................................................................................................................... 56
6.1 Accommodation...................................................................................................... 56

ix
6.2 Vergence Adaptation .............................................................................................. 56
6.3 Vergence parameters............................................................................................... 57
6.4 Interpretation........................................................................................................... 58
7. Conclusion .................................................................................................................... 63
References......................................................................................................................... 65
x
LIST OF TABLES
Table Page
Table 2.1: Comparison of the vergence parameters in no adaptation and adaptation conditions for both convergence and divergence...................................................... 30
Table 5.1: overall average values of vergence parameters (vergence latency, vergence amplitude and vergence peak velocity) before and after viewing the vergence adaptation target is shown along with the standard deviation for both convergence and divergence eye movements ........................................................... 51
Table 5.2: Comparison of average vergence parameters for negative and positive trials identified for convergence trials ...................................................................... 54
Table 5.3: Comparison of average vergence parameters for negative and positive trials identified for divergence trials ......................................................................... 54

xi
LIST OF FIGURES Figure Page
Figure 1.1: Simplified control system model for vergence eye movements............... 4
Figure 1.2: (A) illustration supporting Schor and Jiang’s model (B) illustration supporting Rosenfield et al.’s model .......................................................................... 6
Figure 1.3 Control system model of Saladin (2005)................................................... 7
Figure 1.4: Modified from the computer simulation model of Schor (1979) showing the decay of FVC (fast vergence controller) with the simultaneous increase in innervation of SVC (slow vergence controller). The net vergence position is the additive sum of FVC and SVC ................................................................................... 8
Figure 2.1: Illustration of the near condition (NC) trials 1 and 2 and far condition (FC) trials 3 and 4 ..................................................................................................... 18
Figure 2.2: Vergence position and velocity trace plotted for a given trial when both convergence and divergence movements were made ............................................... 19
Figure 2.3: Comparison of average velocity of both convergence and divergence eye movements made on all four trials............................................................................ 20
Figure 2.4: Illustration of vergence adaptation shown for both accommodative stimulus and disparity vergence stimulus for all the twenty six subjects ................. 25
Figure 2.5: Illustration of the target presentation in a given experimental trial ....... 28
Figure 2.6: Illustration of average vergence amplitude for the no adaptation (NA) and adaptation (A) trials for both convergence and divergence ............................... 31
Figure 2.7: Illustration of average vergence amplitude for the no adaptation (NA) and adaptation (A) trials for both convergence and divergence ............................... 32
Figure 2.8: Illustration of average vergence velocity for the no adaptation (NA) and adaptation (A) trials for both convergence and divergence ...................................... 32

xii
Figure 4.1: Block diagram showing the experimental set up.................................... 38
Figure 4.2: Illustration of target sequence presented in a given experimental trial .. 44
Figure 5.1: Box plots showing the magnitude of vergence adaptation calculated from the differences in phoria position measured at three instances in time for both convergence and divergence trials ............................................................................ 47
Figure 5.2: Time series plot of vergence position data measured along with the target onset data from the Analog signal from the A/D board for a given trial .................. 49
Figure 5.3: Time series plot showing the Target position, vergence position and vergence velocity. The vergence paramete rs measured (latency, peak velocity and amplitude) are marked .............................................................................................. 50
Figure 5.4: Box plots showing the magnitude of vergence adaptation for all subjects on all the 20 trials...................................................................................................... 53
Figure 5.5: Time series plots showing absence of convergence response to the transient stimulus (a) and presence of convergence response after vergence adaptation (b) for three subjects who showed vergence anomaly ............................ 55
Figure 6.1: Illustration of the four possible (A, B, C, D) interactions among the disparity detectors for vergence disparity and vergence burst neurons .................... 59

1
CHAPTER 1
INTRODUCTION
Objects located at different depths are primarily viewed by moving the eyes in
opposite directions to produce a disjunctive movement called vergence (Howard and
Rogers 2002). When looking from far to near the eyes come together to converge. They
move away from each other or diverge when looking from near to far. These fixational
eye movements permit one to see a ‘single fused’ object by ensuring the fovea in each
eye is used for fixation.
Vergence eye movements are the last to develop in human infants but they are
often the first to fatigue and to become disrupted (Carpenter 1988). In patients reporting
symptoms with visual tasks, vergence eye movements are often shown to be abnormal in
optometric and ophthalmologic eye examinations (Carpenter 1988). Improper functioning
of vergence eye movements leads to eyestrain, headaches and discomfort in performing
prolonged near work. In comparison to other eye movements relatively little is known
about the neurology of vergence eye movements (Gamlin 2002; Büttner-Ennever 2006).
However, eye movement studies and theoretical control system engineering models have
been applied to understand the dynamics of vergence eye movements (Schor and
Ciuffreda 1983; Ciuffreda and Tannen 1995; Hung and Ciuffreda 2002).

2
Objects falling on non-corresponding points on the retina in each eye create
disparity that serves as a stimulus for vergence eye movement (Westheimer and Mitchell
1956). Since it is the retinal disparity that drives the vergence eye movement rather than
diplopia itself, it is preferable to call these eye movements “disparity” vergence
movements rather than the more conventional “fusional” vergence movement (Stark,
Kenyon et al. 1980).
1.1 Control system models
According to all vergence control system models, the output of the vergence
system is continuously monitored so as to compare the eye position with the target
position. Any difference between the eye vergence and target vergence is fed back into
the vergence controller resulting in a negative feedback system. Vergence eye movement
is stopped when the retinal disparity is minimized within Panum’s fusional area.
The first control system analysis of vergence eye movement was produced by
Rashbass and Westheimer (Rashbass and Westheimer 1961). They found that disparity
vergence was continuously sampled, making it a continuous feedback system. Further, it
was found that there were two components to the disparity vergence eye movement; a
transient vergence initiating component and a vergence sustaining component
(Westheimer and Mitchell 1969; Jones and Kerr 1972).
Jones and Kerr (Jones and Kerr 1972) observed the vergence initiating component
to be a coarse system elicited only by retinal disparity and having no preference to the
shape of targets while the more fine tuned sustained component required similar targets
to hold vergence. This was demonstrated by having subjects attempt to make vergence
movements to either similar or dissimilar targets presented transiently for about 200 ms.
A model of the vergence eye movement control system was proposed by Krishnan
and Stark (Krishnan and Stark 1977) that had two components; a fast vergence controller

3
and a slow vergence controller. Computer simulations were used in their model to
demonstrate a fast controller that initiated the vergence movement (derivative controller).
The neural impulse from the fast vergence controller was followed by a slow controller
(integral controller) that reduced the disparity and maintained steady state. Neurological
studies that followed later identified two types of vergence-related neurons in the
midbrain, the burst and tonic neurons, that seemed to correlate with the functions of the
fast and slow vergence controller (Mays, Porter et al. 1986). The firing rate of the burst
neurons correlated well with vergence velocity while the vergence position correlated
with the activity of the tonic cells.
The control system model proposed by Krishnan and Stark (Krishnan and Stark
1977) could not explain the presence of fixation disparity. This is a small vergence error
that is commonly found while fixating on a target. According to Krishnan and Stark’s
model (Krishnan and Stark 1977) the controller would reduce any vergence error such
that fixation disparity would eventually be zero. Schor (Schor 1979 a; Schor 1979(b))
refined Krishnan and Stark’s model by describing the fast controller as a leaky neural
integrator and the slow vergence controller as a system with a longer time constant to
maintain vergence posture. The slow vergence controller described in Schor’s model
explains the phenomenon of vergence adaptation explained in section 1.3 of this
dissertation, and it is different from the slow vergence controller described in Krishnan
and Stark’s model.
Schor (Schor 1979(b)) showed a bi-phasic decay of the vergence posture),
characterized by a rapid decay in about the first 10 seconds when disparity vergence was
prevented by monocular occlusion (open loop). This occurred due to dissipation of
innervation from the fast vergence controller. This was followed by a gradual decay of
the vergence posture contributed by the dissipation of innervation from the slow vergence
controller. Figure 1.1 shows a simplified control system model for vergence eye
movement.

4
Figure 1.1: Simplified control system model for vergence eye movements
Even though disparity vergence is described as a feedback system the initial 200
ms of the vergence movement occurs with no feedback (open-loop condition) (Hung,
Semmlow et al. 1986; Semmlow, Hung et al. 1986; Semmlow, Hung et al. 1993) from the
oculomotor system. Thus, the transient portion of the fast vergence controller is open
loop while the sustained portion of the fast vergence controller gets feedback and is
therefore closed loop.
1.2 Components of vergence movement
Besides the disparity vergence eliciting vergence eye movements, accommodative
vergence and to some extent proximal vergence also contribute to vergence eye
movements (Carpenter 1991). While it is well established that innervation to the slow
vergence controller of the vergence eye movement comes from the fast vergence
controller (Schor 1979(b); Schor and Kotulak 1986), the contribution of accommodative
convergence to slow vergence controller is less clear. Accommodative vergence is
brought about by a change in accommodation through the cross-link gain controller. The
amount of accommodative convergence brought about per diopter of accommodation is
termed the AC/A ratio. Conflicting opinions are presented in the literature about the
Input: Target disparity Slow fusional
vergence
Output: Vergence eye movement
Negative feedback
Fast fusional vergence (transient and sustained)
5
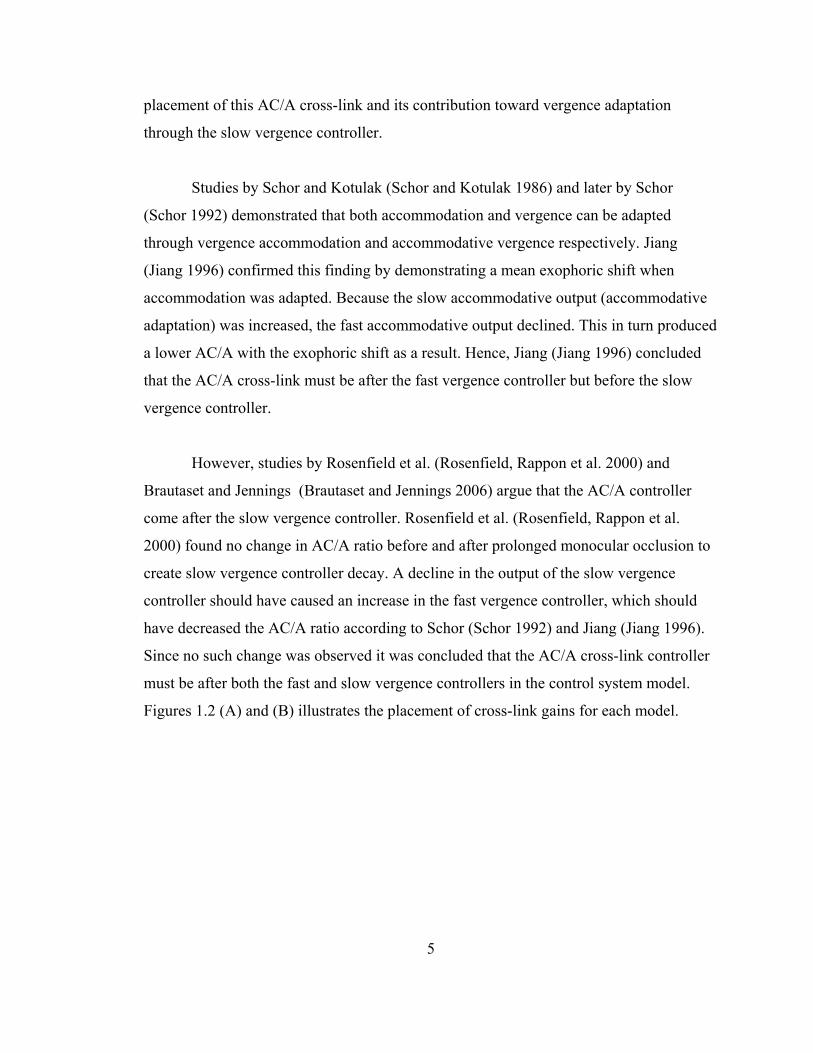
placement of this AC/A cross-link and its contribution toward vergence adaptation
through the slow vergence controller.
Studies by Schor and Kotulak (Schor and Kotulak 1986) and later by Schor
(Schor 1992) demonstrated that both accommodation and vergence can be adapted
through vergence accommodation and accommodative vergence respectively. Jiang
(Jiang 1996) confirmed this finding by demonstrating a mean exophoric shift when
accommodation was adapted. Because the slow accommodative output (accommodative
adaptation) was increased, the fast accommodative output declined. This in turn produced
a lower AC/A with the exophoric shift as a result. Hence, Jiang (Jiang 1996) concluded
that the AC/A cross-link must be after the fast vergence controller but before the slow
vergence controller.
However, studies by Rosenfield et al. (Rosenfield, Rappon et al. 2000) and
Brautaset and Jennings (Brautaset and Jennings 2006) argue that the AC/A controller
come after the slow vergence controller. Rosenfield et al. (Rosenfield, Rappon et al.
2000) found no change in AC/A ratio before and after prolonged monocular occlusion to
create slow vergence controller decay. A decline in the output of the slow vergence
controller should have caused an increase in the fast vergence controller, which should
have decreased the AC/A ratio according to Schor (Schor 1992) and Jiang (Jiang 1996).
Since no such change was observed it was concluded that the AC/A cross-link controller
must be after both the fast and slow vergence controllers in the control system model.
Figures 1.2 (A) and (B) illustrates the placement of cross-link gains for each model.

6
Figure 1.2: (A) illustration supporting Schor and Jiang’s model (B) illustration supporting Rosenfield et al.’s model
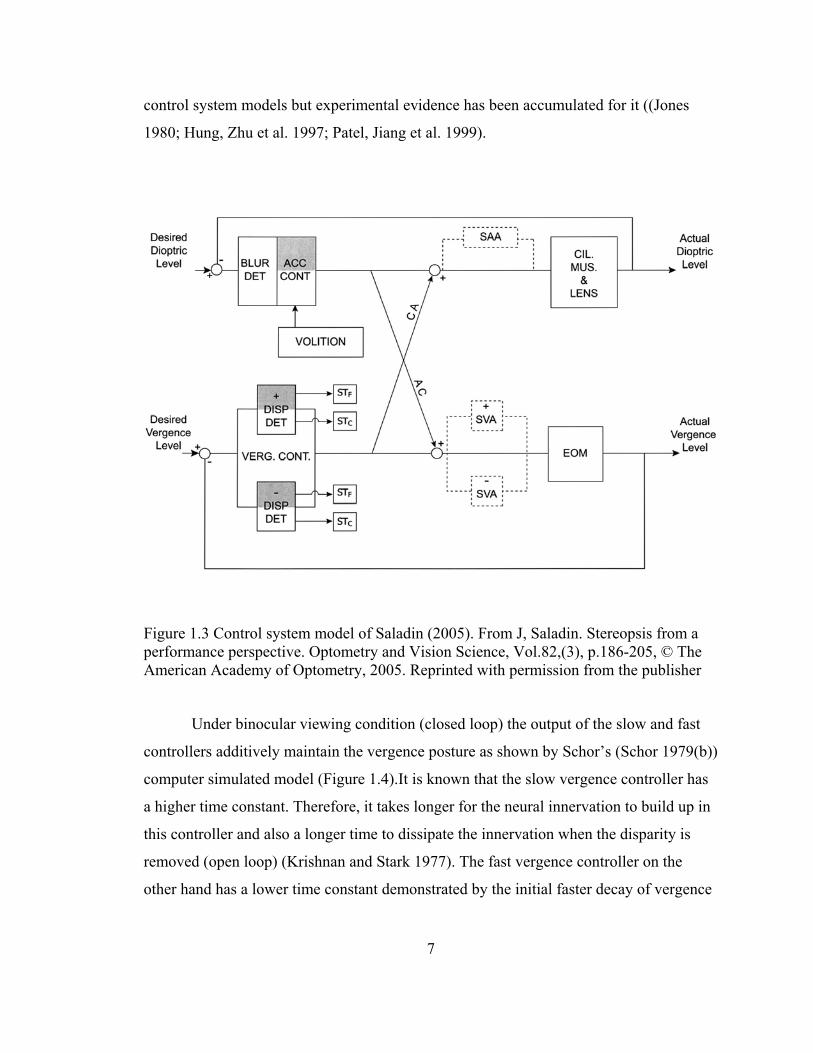
The control system model proposed by Saladin (Saladin 2005) was meant to be
clinician friendly (Figure 1.3), naming anatomical structures involved in the vergence
dynamics. In this model the AC/A cross-link goes before the slow vergence controller
and voluntary or proximal contribution from both accommodation and vergence feeds
into the accommodative controller. Also, his model contains separate pathways for
convergence and divergence. This dichotomy was not included explicitly in the earlier
(A)
(B)
7
control system models but experimental evidence has been accumulated for it ((Jones
1980; Hung, Zhu et al. 1997; Patel, Jiang et al. 1999).
Figure 1.3 Control system model of Saladin (2005). From J, Saladin. Stereopsis from a performance perspective. Optometry and Vision Science, Vol.82,(3), p.186-205, © The American Academy of Optometry, 2005. Reprinted with permission from the publisher
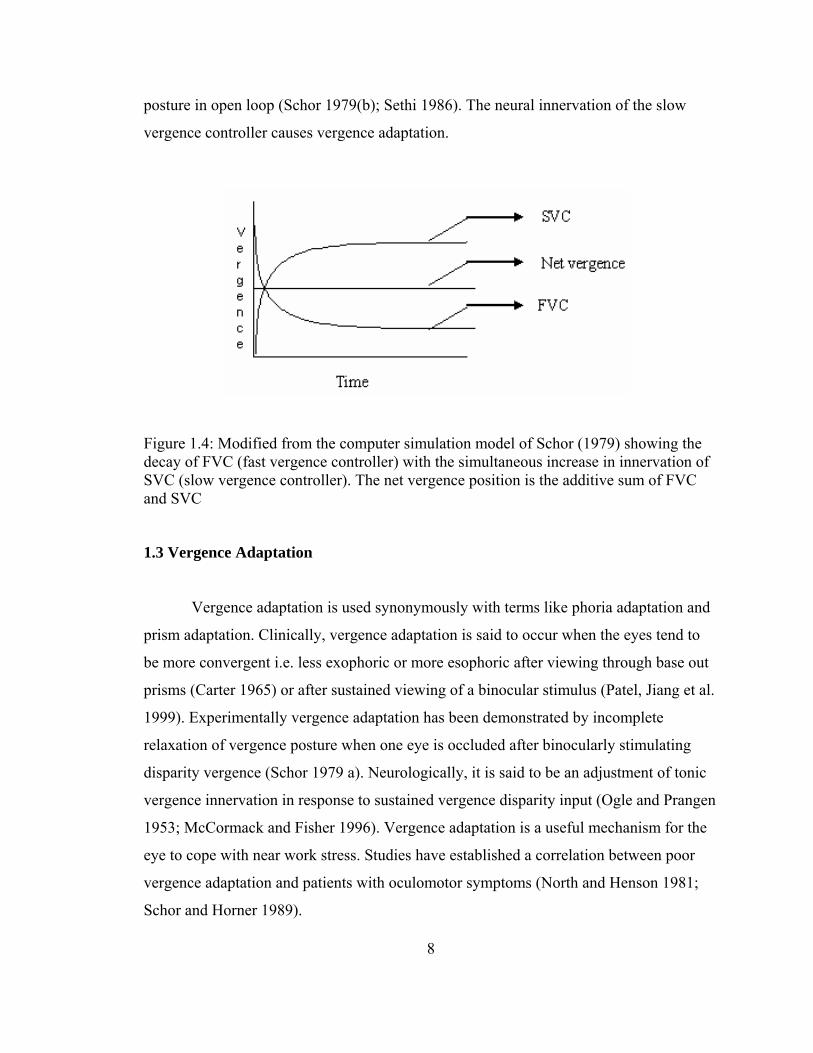
Under binocular viewing condition (closed loop) the output of the slow and fast
controllers additively maintain the vergence posture as shown by Schor’s (Schor 1979(b))
computer simulated model (Figure 1.4).It is known that the slow vergence controller has
a higher time constant. Therefore, it takes longer for the neural innervation to build up in
this controller and also a longer time to dissipate the innervation when the disparity is
removed (open loop) (Krishnan and Stark 1977). The fast vergence controller on the
other hand has a lower time constant demonstrated by the initial faster decay of vergence
8
posture in open loop (Schor 1979(b); Sethi 1986). The neural innervation of the slow
vergence controller causes vergence adaptation.
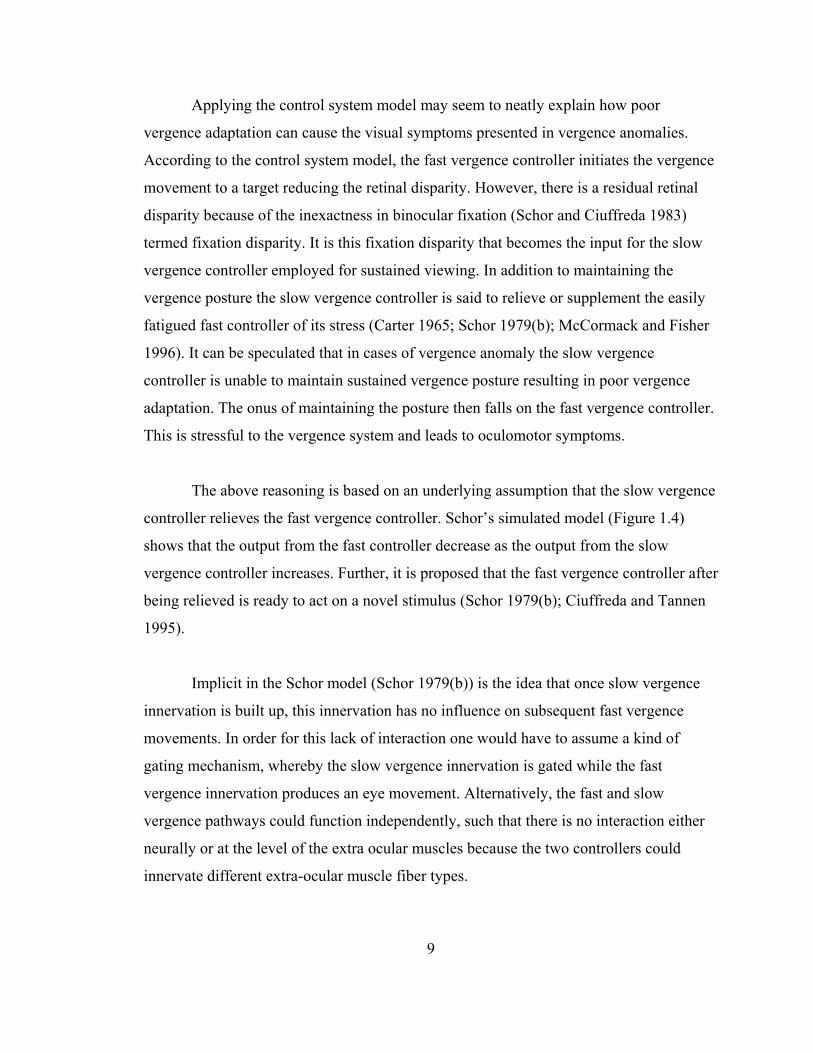
Figure 1.4: Modified from the computer simulation model of Schor (1979) showing the decay of FVC (fast vergence controller) with the simultaneous increase in innervation of SVC (slow vergence controller). The net vergence position is the additive sum of FVC and SVC
1.3 Vergence Adaptation
Vergence adaptation is used synonymously with terms like phoria adaptation and
prism adaptation. Clinically, vergence adaptation is said to occur when the eyes tend to
be more convergent i.e. less exophoric or more esophoric after viewing through base out
prisms (Carter 1965) or after sustained viewing of a binocular stimulus (Patel, Jiang et al.
1999). Experimentally vergence adaptation has been demonstrated by incomplete
relaxation of vergence posture when one eye is occluded after binocularly stimulating
disparity vergence (Schor 1979 a). Neurologically, it is said to be an adjustment of tonic
vergence innervation in response to sustained vergence disparity input (Ogle and Prangen
1953; McCormack and Fisher 1996). Vergence adaptation is a useful mechanism for the
eye to cope with near work stress. Studies have established a correlation between poor
vergence adaptation and patients with oculomotor symptoms (North and Henson 1981;
Schor and Horner 1989).
9
Applying the control system model may seem to neatly explain how poor
vergence adaptation can cause the visual symptoms presented in vergence anomalies.
According to the control system model, the fast vergence controller initiates the vergence
movement to a target reducing the retinal disparity. However, there is a residual retinal
disparity because of the inexactness in binocular fixation (Schor and Ciuffreda 1983)
termed fixation disparity. It is this fixation disparity that becomes the input for the slow
vergence controller employed for sustained viewing. In addition to maintaining the
vergence posture the slow vergence controller is said to relieve or supplement the easily
fatigued fast controller of its stress (Carter 1965; Schor 1979(b); McCormack and Fisher
1996). It can be speculated that in cases of vergence anomaly the slow vergence
controller is unable to maintain sustained vergence posture resulting in poor vergence
adaptation. The onus of maintaining the posture then falls on the fast vergence controller.
This is stressful to the vergence system and leads to oculomotor symptoms.
The above reasoning is based on an underlying assumption that the slow vergence
controller relieves the fast vergence controller. Schor’s simulated model (Figure 1.4)
shows that the output from the fast controller decrease as the output from the slow
vergence controller increases. Further, it is proposed that the fast vergence controller after
being relieved is ready to act on a novel stimulus (Schor 1979(b); Ciuffreda and Tannen
1995).
Implicit in the Schor model (Schor 1979(b)) is the idea that once slow vergence
innervation is built up, this innervation has no influence on subsequent fast vergence
movements. In order for this lack of interaction one would have to assume a kind of
gating mechanism, whereby the slow vergence innervation is gated while the fast
vergence innervation produces an eye movement. Alternatively, the fast and slow
vergence pathways could function independently, such that there is no interaction either
neurally or at the level of the extra ocular muscles because the two controllers could
innervate different extra-ocular muscle fiber types.
10
From a neural point of view, the nature of the interaction between the fast and the
slow vergence controllers is not well understood. The following are some known facts
concerning the neurophysiology of vergence.
In order to produce a vergence movement, the disparity of the target object must
be detected and a sensorimotor transformation must occur to convert the disparity signal
to a vergence motor response. Richards (Richards 1970; Richards 1971) and Jones (Jones
1977) studied the detection of coarse disparities (0.5 to 4.6 degrees) psychophysically by
flashing dichoptic targets. Both investigators reported individuals with stereoanomalies.
That is, some subjects could not detect one class of disparities (convergent or divergent).
Richards termed these individuals stereoanomalous, and argued that there are three pools
of disparity detectors; convergence, divergence and zero disparity. Jones extended
Richards work showing that individuals with stereoanomalies could also show vergence
anomalies.
Later neurophysiological studies (Poggio and Talbot 1981; Poggio 1995) found
neurons sensitive to the plane of fixation (tuned-zero neurons), closer targets (near cells)
and beyond the plane of fixation (far cells), thus confirming Richards previous assertion.
It is still not clear whether these disparity signals are used in generating the vergence eye
movement (Werner and Chalupa 2004).
Once the disparity is detected the vergence signals eventually reach the brainstem
where the vergence burst cells and tonic cells are responsible for the vergence movement.
The burst cells code for vergence velocity while the tonic cells are responsible for
vergence position. Both convergence and divergence cells have been found in an area of
the mesencephalic reticular formation just dorsal and lateral to the oculomotor nucleus
(Mays 1984; Mays, Porter et al. 1986).
The goal of this dissertation is to better understand the interaction between the
slow and fast vergence controller. To do this, we will examine the influence of slow

11
vergence innervation on the dynamics of vergence eye movement after vergence
adaptation. The term dynamics is used to refer to the parameters that are commonly used
to characterize a vergence movement. These include vergence latency, vergence
amplitude and vergence velocity. Latency is the reaction time and it is commonly
measured by finding the difference between the target onset time and the time taken by
the oculomotor system to make the vergence eye movement. The commonly reported
vergence latency values ranges between 160-200 milliseconds (Rashbass and Westheimer
1961; Semmlow and Wetzel 1979; Ciuffreda and Tannen 1995). Latency reflects both the
processing time for sensory information in the brain and the motor time taken to make the
ocular movement. While the latency represents the sensory-motor transformation time,
vergence velocity represents the motor firing action of the burst neurons that respond to
the target disparity. The velocity signal is integrated into a position signal by the neural
integrator. The difference between the initial and final vergence position gives the
amplitude of vergence. Because of the tight relation between the position and vergence
velocity a linear main sequence relation has been shown both in eye movement studies
(Rashbass and Westheimer 1961) and in neurological studies (Mays, Porter et al. 1986).
1.4 Background
So far, only one study has looked at the question of whether sustained vergence
influences the dynamics of vergence eye movements. In a study by Patel et al. (Patel,
Jiang et al. 1999), vergence dynamics were compared between pre- and post- short term
adapting conditions. The study had 6 subjects who were shown a 6-degree convergence
demand for durations of 5, 30, 60 and 90 seconds, after which vergence demand toggled
for three cycles between 4 degree and 6 degree. The target at each vergence demand was
shown for 5 seconds. The study aimed to see if the fast vergence component (called the
transient component in their study) could be adapted. Any change in vergence dynamics
between the pre- and post condition was classified as an adaptation effect. They found
that only the divergence dynamics changed, with the divergence peak velocity being
lower after adaptation.
12
Patel et al.(Patel, Jiang et al. 1999) concluded that the transient or fast vergence
component is adaptable but that the adaptation is direction specific, suggesting separate
pathways for convergence and divergence sensorimotor control. Such a result could mean
two things. First, the adaptation effect in their study must involve a suppression or
reduction in the divergence disparity detectors or the divergence burst cells. Second,
since the convergence velocity did not change, it seems that the change in divergence
related cells was not accompanied by a concomitant change in the convergence cells. If
the convergence velocity had increased, for example, there may have been a
transformation of non-directional burst cells to convergence burst cells. Alternatively or
in addition there might have been an increase in the tonic innervation level of the
convergence burst cells, making it easier for these cells to reach their firing threshold.
A final explanation for the results of Patel et al. (Patel, Jiang et al. 1999) is as
follows. It could be argued that after a period of sustained convergence, tonic innervation
to the extraocular muscles (medial recti) is maintained. Such an increase in tonicity could
alter the vergence dynamics of the vergence movement made to a new target.
Specifically, the increased tonicity of the extraocular muscles could decrease the velocity
(and possibly the amplitude) of convergence and divergence movements. The only way
in which the tonic innervation would not influence a burst-driven vergence movement is
if the tonic innervation were gated during the vergence movement. In Patel et al.’s (Patel,
Jiang et al. 1999) study only the divergence velocity decreased. Therefore, one would
have to hypothesize the presence of a non-linear gating mechanism, such that the tonic
innervation to the extraocular muscles is gated for the convergence movement (so the
burst and tonic innervation to the medial recti do not interact) but is not gated for the
divergence movement.
The relationship between fast and slow vergence could not be fully assessed in
Patel et al.’s (Patel, Jiang et al. 1999) study. This is because the vergence adaptation in
their study was not likely to have been complete. Vergence adaptation begins almost after
about 10 s of viewing the vergence target (Sethi 1986), but the adaptation is not complete

13
for about 4.5 to 5 minutes (Brautaset and Jennings 2005) for at least a 6 prism diopter
target disparity at 40 cm. In Patel et al’s (Patel, Jiang et al. 1999) study the maximum
duration for the convergence demand was 90 sec. Also, the vergence adaptation effect
was not measured in their study and hence it is not clear if complete vergence adaptation
occurred. This is important because it can be seen from Schor’s (Schor 1979(b))
simulated model (Figure 1.4) that the fast vergence output goes down as the slow
vergence output increases. Hence, to study the interaction between the fast and slow
vergence controllers, it must be established that vergence adaptation has taken effect.
As previously discussed, the fast vergence controller has a coarse and a fine
component. The coarse component initiates the vergence movement without any
feedback from the oculomotor system (open loop condition). The initial 200 ms of the
vergence response is known to be contributed by the open loop component (Horng,
Semmlow et al. 1998). In Patel et al’s (Patel, Jiang et al. 1999) study target duration of 5s
included the open loop and the closed loop component of the vergence controller. In such
a case it is possible that there could be an interaction in vergence dynamics between the
open loop and the closed loop component.
For the reasons cited above, we performed the study described here to fully assess
the interaction between slow and fast vergence controller. The specific question asked in
the current study is that, does the innervation for slow vergence interact with the
innervation for fast vergence, or is the slow vergence innervation gated when fast
vergence movement occur.
1.5 Overview of experiments
Three preliminary studies were conducted to refine and shape the methodology
for the main study. These experiments are described in chapter 2. The main study is
described in the later chapters.

14
In the first experiment we studied the vergence dynamics for a real world target.
In the second experiment we looked at the interaction between accommodation and
vergence. The third experiment studied the vergence adaptation effect on vergence
dynamics in an anaglyphic target set up.

15
CHAPTER 2
PRELIMINARY STUDIES
2.1 Experiment I: Brock string experiment
2.1.1 Introduction
As a first step to study vergence dynamics, a real target under natural conditions
was used. Natural conditions here refer to a visually rich environment that contains
objects and visual frames that provide effective cues to relative depth to the observer
(Erkelens, Steinman et al. 1989). The Brock string, a commonly employed therapeutic
device in optometric vision therapy practice was selected for this purpose. The Brock
string consists of a long string usually 6 meters in length with three wooden color beads
(red, yellow and green). In vergence therapy a patient is asked to fixate between the color
beads trying to keep the fixated bead clear and single. The non-fixated beads fall outside
the limits of Panum’s fusional area and are seen double, a phenomenon called
physiological diplopia. This helps the patients to appreciate the difference between
diplopia (double vision) and haplopia (single vision). As the beads in the string can be
easily aligned with the midline it serves as a convenient target to stimulate symmetrical
vergence.
The current experiment was done to study the effect of short term vergence
adaptation on vergence dynamics for a real world target. The study also aimed to ensure
16
that the custom made ISCAN (ISCAN, inc., Woburn, MA) infrared eye tracker goggle
would be adequate to track vergence eye movements.
2.1.2 Methodology
Subjects
Five subjects with no binocular vision anomalies were enrolled. All subjects
signed a consent form approved by the Biomedical Sciences Institutional Review Board
of The Ohio State University prior to participation. The age range was 23-28 years. All
subjects had corrected or uncorrected 20/20 vision for both distance and near. There were
3 emmetropes and 2 myopes with contact lens correction. The near phoria for the subjects
were less than 4 ∆ (exophoria or esophoria) and the vergence facility with 12 ∆ BO/3 ∆
BI was greater than 15 cycles per minute.
Experimental setup
A Brock string was mounted on a black board that was at eye level for the subject.
Two sets of target conditions, a far condition and a near condition were shown. For the
far conditions the Brock string beads were positioned such that the vergence disparity
was 4/8/12 degrees. For the near condition the beads had a disparity of 12/16/20 degrees.
The chosen disparity levels were comparable to an earlier study (Alvarez, Semmlow et al.
2005). For each subject the inter-pupillary distance (IPD) was measured and entered into
an Excel (Microsoft Corporation, Redmond, WA) worksheet program to calculate the
distance at which the beads needed to be positioned to give the above target disparities.
Subjects were seated with a chin rest to minimize head movements. Subjects wore
an ISCAN (ISCAN, Inc., Woburn, MA) infrared eye tracker goggle that monitored the
eye movements. The eye tracker had a temporal resolution of 60Hz. This temporal

17
resolution was adequate to track vergence eye movement (Patel, Jiang et al. 1999). The
spatial resolution of the instrument was 10-15 arc minutes .
A calibration run was recorded before the start of every test trial. In this
calibration run, subjects were asked to look at colored pegs placed 4 degrees to the right
and left of the central bead. After the calibration procedure, the pegs were removed and
subjects were asked to look at the central bead for 40 seconds and were instructed to look
back and forth between the central bead and either the closer or farther bead. Each bead
was fixated for about 1 second while keeping it clear and single. Four trial conditions
were measured in random order. In trial 1, subjects were asked to look between the center
bead and the bead farther away in the near condition. In trial 2, subjects were asked to
look between the center and the closer bead in the near condition. In trial 3, subjects were
asked to look between the center bead and the bead farther away in the far condition and
in trial 4, subjects looked between the center and closer bead in the far condition. Figure
2.1 illustrates the four trial conditions. It must be noted that both convergence and
divergence velocities were obtained in each of these trials as the subjects looked back and
forth between the beads. Two cycles of convergence and divergence eye movements
were measured for each trial.

18
Figure 2.1: Illustration of the near condition (NC) trials 1 and 2 and far condition (FC) trials 3 and 4
2.1.3 Data analysis
A linear regression was plotted between the eye position during the calibration
procedure and the angle of fixation to calculate the gain of the eye-tracker. The calibrated
eye position data for the trial runs was calculated by subtracting the zero position (eye
position while fixating on the center bead) and dividing the gain obtained from the linear
regression equation in the calibration run. A time series of the calibrated eye position was
plotted.
Vergence position was calculated by subtracting the difference in calibrated eye
position between the left and right eye. In order to calculate the vergence velocity the
traces were inspected for blink artifacts and saccades and such trials were discarded. The
vergence position was low pass filtered at 5 Hz using a computer program and vergence
velocity was calculated by differentiating the position data against time. Figure 2.2 shows
both the vergence position and the vergence velocity plot.

19
Figure 2.2: Vergence position and velocity trace plotted for a given trial when both convergence and divergence movements were made
2.1.4 Results
The overall means for the five subjects along with the standard error of means for
both convergence and divergence velocity on all four trials is shown in Figure 2.3
Vergence velocity
Vergence position
20
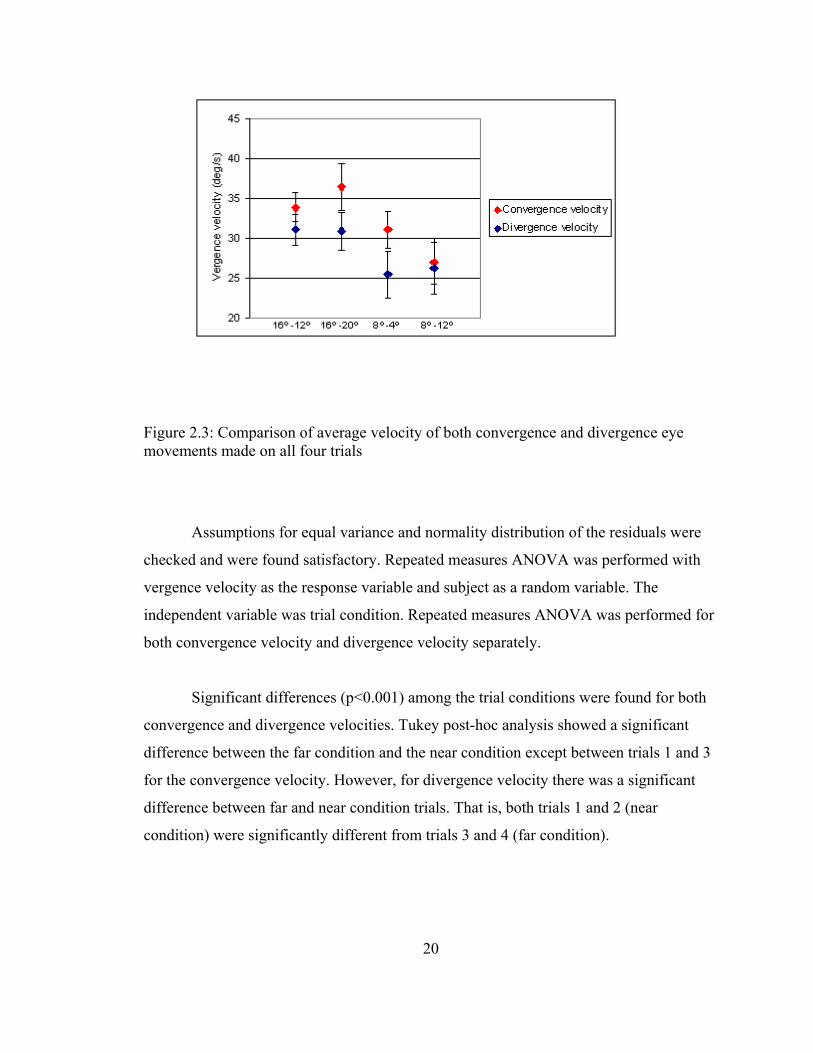
Figure 2.3: Comparison of average velocity of both convergence and divergence eye movements made on all four trials
Assumptions for equal variance and normality distribution of the residuals were
checked and were found satisfactory. Repeated measures ANOVA was performed with
vergence velocity as the response variable and subject as a random variable. The
independent variable was trial condition. Repeated measures ANOVA was performed for
both convergence velocity and divergence velocity separately.
Significant differences (p<0.001) among the trial conditions were found for both
convergence and divergence velocities. Tukey post-hoc analysis showed a significant
difference between the far condition and the near condition except between trials 1 and 3
for the convergence velocity. However, for divergence velocity there was a significant
difference between far and near condition trials. That is, both trials 1 and 2 (near
condition) were significantly different from trials 3 and 4 (far condition).

21
2.1.5 Conclusion
In this experiment velocities for divergence and convergence under a short
adaptation period (40 seconds) for two different initial positions of the target were
compared. There were two different initial positions for the real target used in this study;
they were 8 degrees (trials 3 and 4) and 16 degrees (trials 1 and 2).
The ISCAN (ISCAN, Inc., Woburn, MA) instrument used was adequate in
tracking the vergence eye movements (Figure 2.2). Vergence velocity for both
convergence and divergence varied based on the initial target position after a short
adaptation time. The vergence velocity recorded in this study (convergence =33.85 deg/s;
divergence=31.04 deg/sec) was higher than that reported in a previous study
(convergence=17.53 deg/s; divergence=16.9 deg/s). (Alvarez, Semmlow et al. 2005).
Erkelens et al.(Erkelens, Steinman et al. 1989) have reported higher vergence velocities
under natural conditions. Also, with change in target distances accommodation could
have influenced the vergence eye movement.
2.2 Experiment II - Effect of accommodative vergence on vergence adaptation
2.2.1 Introduction
The aim of this experiment was to study the effect of accommodative vergence on
the slow vergence controller (vergence adaptation). The information from this study helps
in determining whether it was necessary to use targets at a constant accommodative
demand rather than real world targets to exclude accommodative vergence.

22
2.2.3 Methods
Subjects
26 subjects, 21 to 39 yrs of age (mean=26 + 4), were enrolled in the study. All
subjects signed a consent form approved by the Biomedical Sciences Institutional Review
Board of The Ohio State University prior to participation. Subjects had 20/20 vision and
normal binocular vision. 18 were exophoric (0.5 Δ to 10 Δ), 5 were esophoric (0.5 Δ to 5
Δ) and 3 were orthophoric.
Experimental set up
Dissociated phoria was measured using the modified Thorington technique. The
modified Thorington technique uses a Muscle Imbalance Measure (MIM) card (Bernell ®
1980) that was mounted at 40 cm on a white board to cut off peripheral distractions. The
card has a center aperture that was illuminated with a reading lamp. Subjects were made
to wear a trial frame with a red Maddox rod trial lens that was mounted horizontally in
front of the right eye. A vertical streak was seen through the right eye and the center light
was seen through the left eye. The MIM card (Bernell ® 1980) has calibrated vertical and
horizontal circular marks each representing 1 prism diopter at 40cm. Every 2 prism
diopter is numerically marked on the card. Subjects were asked to call out the number
and the position of the red line with respect to the center light. If the line was to the right,
the eye position is esophoric. If the line is to the left the eye position is exophoric, and
orthophoria is the result if the line crosses the center light.
Procedure
The subject’s head was stabilized with a chin rest and their phoria was measured
before (pre-phoria) and after (post-phoria) adapting to either a 6 Δ BO or a negative lens
for 5 minutes, on different days in a random order. Vergence adaptation is found to be
23
maximal around 3 minutes (Henson and North 1980) and in a recent study (Brautaset and
Jennings 2005) it was found that vergence adaptation was complete by 5 minutes to a 6
prism base-out given at 6 m and 40 cm. Hence, 5 minutes was chosen as the adapting
time for this task.
The negative lens power was calculated based on the individual’s stimulus AC/A
ratio in order to equate the amount of convergence to 6 Δ. This was done by asking the
subjects to report the phoria while viewing binocularly through +1.00, + 2.00, plano, -
1.00 and -2.00 diopter lenses after maintaining a clear image of the Thorington (MIM)
numbers. The order of the lenses was randomized to prevent any carry over adaptation
effect. A regression line was plotted between the lens power and the measured phoria
value. The slope of this regression was taken as the stimulus AC/A ratio (Rainey 2000;
Rosenfield, Rappon et al. 2000). The required negative lens power to give the needed 6 Δ
diopter of convergence was calculated based on this AC/A ratio. The average calculated
AC/A ratio was 2.56 Δ/D. This calculated AC/A ratio seems lower than the normal value
reported in the literature of 4 Δ/D. This was because of the asymmetry observed between
negative lens and positive lens used in younger subjects. Hence, for the purpose of
calculating the negative lens power required to bring about 6 Δ of convergence, the AC/A
was calculated only from the plano and negative lens powers for each subject.
Subjects fixated on a 2° word target (“CLEAR”) at 40cm during the adaptation
time. For the disparity vergence condition the subjects remained binocular (closed loop
condition for vergence) and the 6 Δ BO lens was placed in front of the left eye. For the
accommodative condition, the subject’s left eye was patched in order to elicit only
accommodative vergence (open loop condition for vergence) while adapting through the
negative lens mounted in front of the right eye. Thus, any change in phoria position
would have resulted only from the change in accommodation and the resultant
accommodative convergence produced. The prism and the lens in the above conditions
were removed and the Maddox rod was mounted quickly in front of the right eye before

24
measuring the post-phoria. Subjects were asked to close their left eye while the lenses
were changed.
2.2.4 Results
Vergence adaptation was calculated by subtracting the pre-phoria from the post-
phoria measurement. Positive values indicated more esophoria or less exophoria, while
negative values represented the opposite result. Mean adaptation to the 6 Δ BO stimulus
was 2.18 ± 1.27 Δ, and mean adaptation to the negative lens was 1.65 ± 1.6 Δ. Figure 2.4
shows the magnitude of vergence adaptation measured on each of the 26 subjects.
From Figure 2.4 it can be seen that 24 subjects showed vergence adaptation to the
6 Δ BO. Two subjects (subject 4 and 23) showed neither a positive nor a negative
vergence adaptation to the prism. For the accommodation stimulus 22 subjects showed
vergence adaptation in the esophoric direction. One subject (subject 5) showed neither a
positive nor a negative vergence adaptation to the negative lens. Three subjects (subjects
3, 11 and 15) showed an increase in exophoria viewing the accommodative stimulus.

25
Figure 2.4: Illustration of vergence adaptation shown for both accommodative stimulus and disparity vergence stimulus for all the twenty six subjects
A one sample t-test was used for data analysis. Vergence adaptation with prism
and with the lens was significantly different from 0 (p<0.0001). There was no significant
difference in the magnitude of adaptation observed between the prism and negative lens
(p=0.204).
2.2.5 Conclusions
Vergence adaptation was induced with both the vergence disparity target and the
accommodative target. The mean amplitude of vergence adaptation found in this study
was similar in the two conditions. This suggests that the slow vergence controller for
vergence adaptation receives input from both disparity and accommodative vergence.
Hence, this study is in agreement with those of Schor and Kotulak (Schor and Kotulak
1986) and Jiang (Jiang 1996) in that the AC/A cross-link is before the slow vergence
controller in the control system model. Therefore, accommodative convergence can
26
induce vergence adaptation and accommodation must be held constant to study the
interaction between the fast vergence controller and slow vergence controller.
2.3 Experiment III: vergence dynamics after vergence adaptation studied in an
anaglyphic setup
2.3.1 Introduction
The purpose of this study was originally to study the interaction between the slow
vergence controller and the fast vergence controller using anaglyphic targets. Data
collected on five subjects showed higher vergence latency than that reported in the
literature. Such a result could have been due to the lower luminance of the anaglyphic
targets. Also, an order effect for phoria and vergence adaptation was found when more
than one trial was performed on the same day. The methods and results are discussed
below.
2.3.2 Methods
Subjects
5 subjects between the ages of 24 and 34, with no known binocular vision
problems and 20/20 vision were enrolled. All subjects signed a consent form approved by
the Biomedical Sciences Institutional Review Board of The Ohio State University prior to
participation.
Experimental setup
Computer generated anaglyphic targets (blue and red) were displayed at 65 cm on
a black screen. The target at this distance subtended 1.5º of visual angle. The target
luminance of the red and blue targets was measured with a LITEMATE III Photometer
27
(Model 504, Photoresearch, Burbank, CA) and was found to be 1.2 cd/m2. The blue and
red filters used in this study had complete cancellation with the computer generated blue
and red targets. The edges of the computer screen were masked using a black screen and
the entire testing procedure took place in a dark room to avoid fusional artifacts.
Procedure
The subject’s head movements were minimized using a chin and headrest. Eye
movements were recorded using the IOTA Orbit Eyetrace (IOTA AB, ver 1.71, Sweden)
infrared eye tracker goggle. The eye tracker had a sampling rate of 500 Hz. Red and blue
filters were mounted on the trial lens holder of the eye tracker in front of the right and left
eye respectively.
Two conditions, no adaptation (NA) and adaptation (A) were performed on
different days in random order. Ten trials for each of the conditions were recorded. A
calibration run preceded each experimental run. In a calibration run a set of three white
horizontal crosses at eccentricities –5, 0 and +5 degrees were shown. Subjects were asked
to fixate at each of the crosses for about a second. The recorded eye position was linearly
regressed against the target eccentricity angle to calculate the gain of the instrument from
the sum of the least squares linear regression equation. This gain was used to calibrate the
eye data collected in the subsequent experimental run.
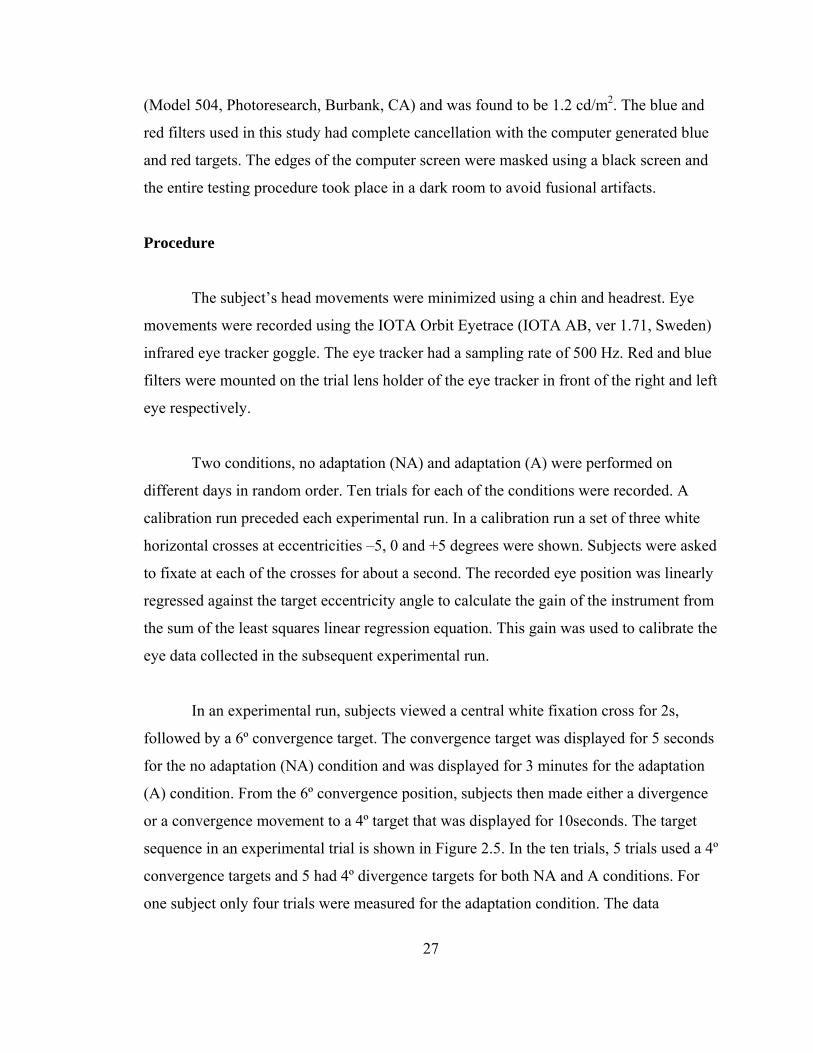
In an experimental run, subjects viewed a central white fixation cross for 2s,
followed by a 6º convergence target. The convergence target was displayed for 5 seconds
for the no adaptation (NA) condition and was displayed for 3 minutes for the adaptation
(A) condition. From the 6º convergence position, subjects then made either a divergence
or a convergence movement to a 4º target that was displayed for 10seconds. The target
sequence in an experimental trial is shown in Figure 2.5. In the ten trials, 5 trials used a 4º
convergence targets and 5 had 4º divergence targets for both NA and A conditions. For
one subject only four trials were measured for the adaptation condition. The data
28
collected from the IOTA Orbit Eyetrace (IOTA AB, ver 1.71, Sweden) software was
analyzed offline. Three trials were measured for the adaptation condition in a given day
and ten trials were measured for the NA condition in one day. A 3-5 minute break was
given between trials. During the break time, the room was dimly illuminated with an
incandescent bulb and subjects were encouraged to look away from the computer screen
and to look elsewhere in the room.
Figure 2.5: Illustration of the target presentation in a given experimental trial
The anaglyphic targets were generated using a Visual Basic 6 program. The
program generated the target disparity based on every subject’s Inter-Pupillary Distance
(IPD). A digital voltage was sent out of a Digital-to-Analog (D/A) channel of an Analog-
to-Digital (A/D) board miniLAB 1008 (Measurement Computing corporation, Norton,
MA) to indicate the onset of a target presentation. The data from this board was sampled
at 500 Hz to match the sampling rate of the eye tracker. The IOTA Orbit Eyetrace (IOTA

29
AB, ver 1.71, Sweden) software does not allow an external synchronization of the
recorded eye position. Hence, a computer mouse was wired to take the voltage signal out
from the mouse’s left click button. This signal was fed into the same A/D board that was
used for the targets. Thus, when the record button of the IOTA Orbit Eyetrace (IOTA
AB, ver 1.71, Sweden) was clicked with the mouse, a voltage signal was sent to the
recording board allowing synchronization of the recorded eye movement trace with the
target onset time. The end of a trial was recorded by clicking the stop button of the IOTA
Orbit Eyetrace (IOTA AB, ver 1.71, Sweden) with the specially wired computer mouse.
2.3.3 Results
Data analysis
The vergence eye movement position data was low pass filtered at 5Hz to
eliminate high frequency noise in the signal. The filtered position was then differentiated
to calculate the vergence velocity. This procedure was comparable to an earlier study on
vergence dynamics (Patel, Jiang et al. 1999). Vergence latency and vergence amplitude
were calculated by visual inspection of the plotted vergence eye trace and by going
through the vergence position data column to note the change in vergence position. All
the vergence dynamics parameters were calculated for both the 4º convergence and
divergence movements made from the 6º convergence target. Data showing blink
artifacts were eliminated. In the vergence adaptation trials the comparison of phoria
values before and after 3 minutes of sustained vergence showed vergence adaptation in
76% of the trials.
Vergence Dynamics
The average values and the standard deviation for the vergence parameters
(vergence latency, vergence amplitude and peak vergence velocity) are shown in Table
2.1. The parameters were compared between the two conditions (NA and A) for both
30
convergence and divergence trials. The comparison of means with standard error of mean
is plotted for latency (Figure 2.6), amplitude (Figure 2.7) and peak velocity (Figure 2.8)
and is shown below.
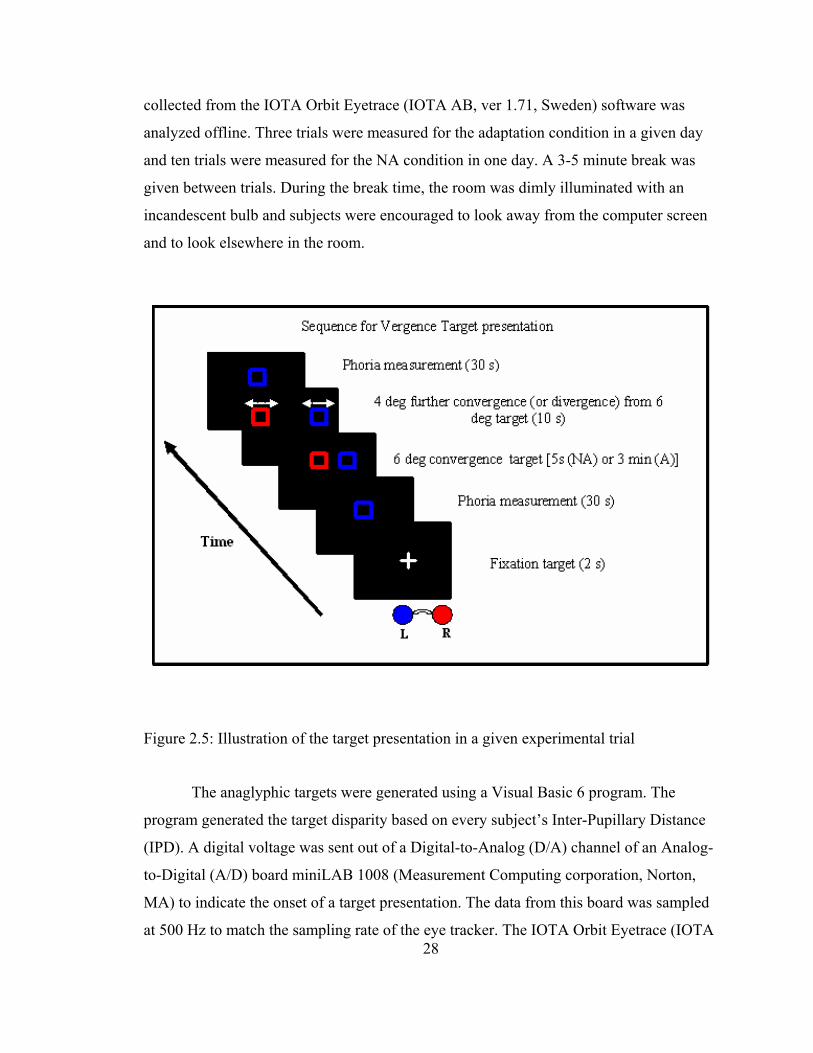
Table 2.1: Comparison of the vergence parameters in no adaptation and adaptation conditions for both convergence and divergence
It can be seen from Table 2.1 that the recorded vergence latency in this
experiment is much higher than that reported in earlier studies (150 -250 ms (Rashbass
and Westheimer 1961; Ciuffreda and Tannen 1995; Alvarez, Semmlow et al. 2005). This
could have resulted for two reasons. The luminance of the targets (1.2 cd/m2) used in this
experiment is lower and this could have increased the latency. It has been shown that a
decrease in luminance increases the latency of disparity vergence (Stephens 1982).
Second, accommodative vergence is known to have a longer latency of about 280-380 ms
(Krishnan, Shirachi et al. 1977; Ciuffreda and Tannen 1995). It is unclear if subjects
employed accommodative vergence in this experiment, although one might not have
expected this since the targets were held at a constant distance.
The measured average differences between the convergence latency, amplitude
and peak velocity for adaptation and no adaptation trials were 126ms, 0.8º and 9.6º/s. For
Convergence Divergence Vergence Parameters No Adaptation Adaptation No Adaptation Adaptation
Latency (ms)
370.2 ± 91.3
496.3 ± 264.6 451.1 ± 119.3 496.8 ± 94.8
Amplitude (degrees)
3.6 ± 1.1 4.4 ± 2.1 5.2 ± 1.3 5.6 ± 0.8
Peak Velocity (degrees/s)
16.4 ± 7.5 26 ± 25.6 22.3 ± 6.6 24.1 ± 8.3

31
divergence the differences were 45.7ms, 0.4º and 2º/s. Non-parametric Wilcoxon rank
sum test was performed on vergence dynamic parameters between the no adaptation and
adaptation trials. No statistically significant (p>0.1) differences were found between the
two trials for any of the parameters.
Figure 2.6: Illustration of average vergence amplitude for the no adaptation (NA) and adaptation (A) trials for both convergence and divergence

32
Figure 2.7: Illustration of average vergence amplitude for the no adaptation (NA) and adaptation (A) trials for both convergence and divergence
Figure 2.8: Illustration of average vergence velocity for the no adaptation (NA) and adaptation (A) trials for both convergence and divergence

33
Phoria measures
In the NA trial, ten runs were made with breaks in between. For the “A”
condition, three trials were made. The order effect was plotted for phoria measures in
these conditions. Interestingly, it was found that the phoria values fluctuated up and down
randomly. The vergence adaptation measured by the difference in pre-phoria and post-
phoria also seem to show some positive correlation with the phoria measure (i.e) when a
greater phoria was measured the magnitude of phoria adapatation was greater and vice-
versa for lower measured values of phoria in a given trial. These data show that even
though the adapting target was shown only for 5 seconds some vergence adaptation effect
was found that could be carried over to the subsequent trial and could influence the
phoria measured in a subsequent trial.
2.3.4 Conclusion
For both convergence and divergence, there were no statistically significant
differences observed in the NA condition and A condition dynamics for any of the
vergence parameters. Greater variability in measured, particularly for convergence
latency and velocity, was observed. Also, the vergence latency found in this study was
longer than that reported in the literature. Decreased target luminance could be the factor
responsible for this observation.
34
CHAPTER 3
INTRODUCTION - MAIN STUDY
Experiments I to III described in the earlier chapter lead to a more refined
experiment to address the primary goal of this dissertation. The primary goal is to
investigate the influence of the slow vergence controller on the fast vergence controller.
In brief, the following were learned from experiments I to III that facilitated the design of
the current experiment:
A. Experiment I (Brock string experiment): Two different target distances were
chosen to elicit different disparity vergence. From the graph plotted in Figure 2.4
it can be seen that trial 1 (12-16 degrees) and trial 4 (8-12 degrees) showed
significant difference for both convergence and divergence velocity. In the current
experiment the magnitude of disparity vergence was chosen to be 8, 12 and 16
degrees based on the result from Experiment I.
B. Experiment II (Effect of accommodative vergence on vergence adaptation): It
is well established that vergence and accommodation act in synergy through the
cross-link gain controllers when looking at near targets. However, it was unclear
if the accommodative gain controller would contribute to the slow vergence
controller. In experiment II we showed that accommodative vergence contributes
to the slow vergence controller, by demonstrating vergence adaptation after
accommodative vergence was elicited under open loop vergence conditions. Thus

35
it is important to maintain a constant target distance to avoid changes in
accommodation demand while the target disparity is being changed. For the
current experiment the target distance was held constant.
C. Experiment III (vergence dynamics in an anaglyphic set up): In this
experiment longer latencies were observed for both convergence and divergence
movements. This could have been either a result of the low target luminance used
in the study or because of accommodative vergence. Also, the phoria measures
and the magnitude of vergence adaptation were observed to vary over the ten
trials measured in the “NA” condition. This shows that vergence adaptation of
one trial interacts with the phoria measure of the subsequent trial, in spite of the
breaks given in between the trials when subjects were asked to fixate elsewhere.
Importantly, this implies that measuring vergence dynamics in more than one trial
at a time would show some interaction on measurements made on the subsequent
trials. Hence, the current study restricted data collection to only one trial in a
given day for each subject. The time between two trial runs was at least 24 hours.
Also, a haploscope arrangement with targets of higher luminance was used for the
current study. The targets in the current study had adequate contours and detail to
hold accommodation and provided for easy blur detection.

36
CHAPTER 4
METHODS
4.1 Subjects
Twenty subjects (8 males and 12 females) with visual acuities of 20/25 or better
and with no known ocular or systemic problems were enrolled, after signing a consent
form approved by the Ohio State University Biomedical Sciences Review Board. The age
of the subjects varied between 21 and 32 years of age (mean = 24.3 ± 2.7).
Subjects were either emmetropic or corrected for their refractive error with
contact lenses. Spectacle wearers were excluded from the study to avoid erroneous noise
that could be produced in the eye tracker from spectacle reflection. 9 emmetropes and 11
myopic subjects (refractive error ranged from -1.25 D to -6.25 D) were enrolled.
4.2 Baseline measurements
On the first study visit, baseline measures of monocular near point of
accommodation (NPA) with a 20/40 near card target and near point of convergence
(NPC) with pencil push up method were measured on all subjects. The average NPA for
the right eye was 8 cm and that for the left eye was 9 cm. The average NPC was found to
37
be 6cm. These measurements were within the accepted normal range (Scheiman, Wick et
al. 2002).
4.3 Experimental set up
4.3.1 Haploscope arrangement
Two front surface mirrors were mounted at right angles to one another and at 45
degrees to the facial plane. The mirrors were placed at a distance of 12 cm from the
subject’s lateral canthus. Targets were presented on two identical CRT monitors (CTX,
VL 501 and CTX, VL 510) that were positioned at 28cm from each of the front surface
mirrors (Figure 4.1). Thus, the total optical distance from the target to the subject was 40
cm. The targets were held at this constant distance thus minimizing the accommodative
and proximal cues associated with target distance (Rosenfield, Chun et al. 1997;
Semmlow, Alvarez et al. 2007). The edges of the two front surface mirrors were obscured
with a rhombus shaped black aperture on one and a rectangular black aperture on the
other. This was done to prevent peripheral fusional cues.
The two monitors were programmed from one computer using Visual Basic6.
VGA and DVI monitor splitter cables were used to split the display so that the left half of
the display was seen on one computer monitor and the right half was seen on the other.
Thus simultaneous display of targets with no or minimal lag time between the monitors
was achieved. The screen resolution of both monitors was 1024 x 768. The monitors were
physically aligned to each other and the center of the target (fixation cross) was aligned
to the center of the mirror using a Visual Basic program that allowed alignment of the
target independently on each monitor. From this centered position target disparity was
presented using computer software that accounted for each subjects’ inter-pupillary
distance. The monitors were closely matched in luminance using a handheld light meter
(LITEMATE, III, Model # 502, Burbank, CA) and by perceptually adjusting the
brightness for a simultaneous luminance match for identical targets presented on each
38
monitor. Both the luminance measurement and the simultaneous luminance match were
made for the target reflected from the front surface mirrors. A white target on a black
background was used for this study and the Michelson luminance contrast [(Lmax-Lmin)
/ (Lmax + Lmin)] measured on the right and left monitors for these targets were 98.1 %
and 98.3%. The average luminance value of the targets measured on the monitors was
about 92 cd/m2. This luminance value was much higher than that used for the anaglyphic
targets (1.2 cd/m2) in experiment III.
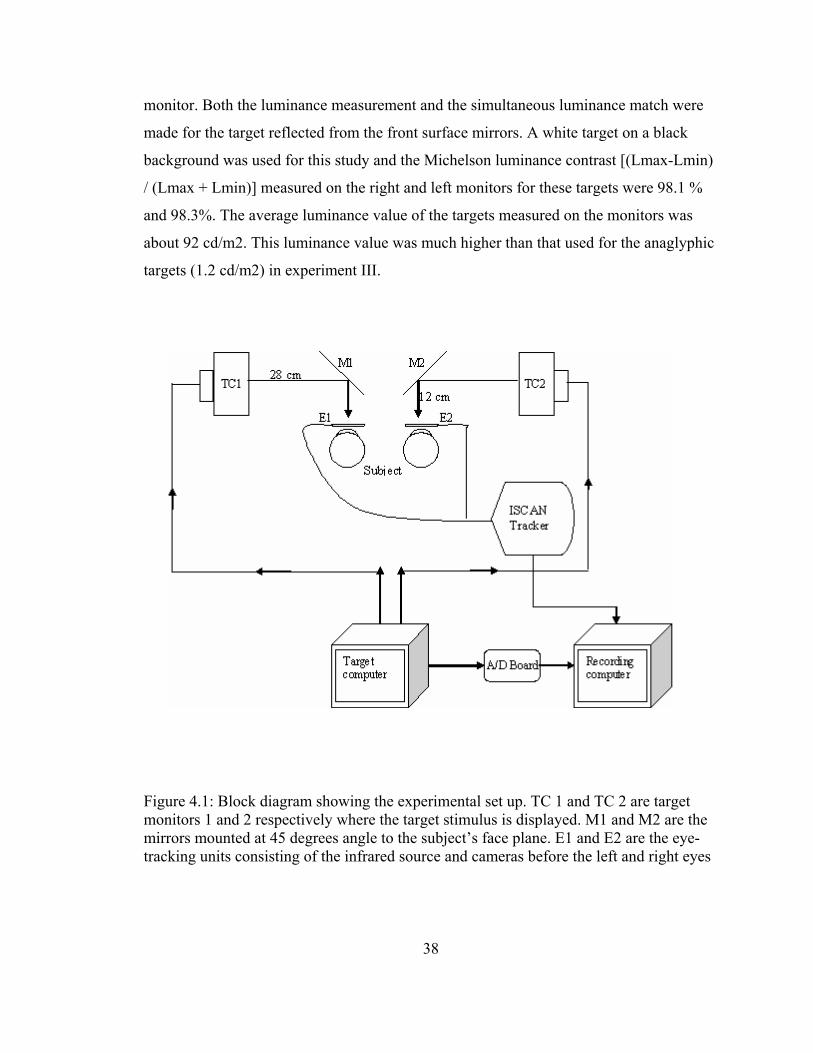
Figure 4.1: Block diagram showing the experimental set up. TC 1 and TC 2 are target monitors 1 and 2 respectively where the target stimulus is displayed. M1 and M2 are the mirrors mounted at 45 degrees angle to the subject’s face plane. E1 and E2 are the eye-tracking units consisting of the infrared source and cameras before the left and right eyes

39
4.3.2 Stimulus target
The target used in this study consisted of two squares (1 deg and 1.6 deg)
concentrically placed with a central fixation cross (0.4 deg). This target was effective in
holding foveal fusion and had sufficient details to hold the accommodative response. This
target was presented binocularly to generate the disparity targets, and monocularly to the
right eye for phoria measurements.
Although the target distance was not changed in this experiment, the
accommodative response could have changed for the different target disparities
presented. The accommodative response could not be estimated simultaneously with eye
position measurements because the infrared source from our autorefractor interacted with
that of the eye tracker producing spurious noise in the eye movement data. Hence the
accommodative response was measured prior to the study. The measurement of
accommodation is discussed below.
4.4 Accommodative measurements
Accommodative measurements were made on the first study visit. The target
stimulus with the same dimensions and closely matched luminance as that used in the
haploscope presentation was presented on a Compaq computer monitor (Michelson
luminance contrast = 98.2%). The edges of the monitor were masked with a black board.
The monitor was placed behind a Grand Seiko binocular autorefractor/keratometer (WR-
5100K) at a distance of 40 cm from the subject’s lateral canthus. Subjects’ heads were
stabilized with the autorefractor’s head and chin rest.
Subjects wore an empty trial frame and were instructed to keep the square target
clear and single. Ten measurements of the refractive status were then made from the right
eye with the Grand Seiko binocular autorefractor/keratometer WR-5100K. Next, subjects
wore an 8 base in prism or an 8 prism base out in front of the left eye or trial lenses of
power +1.25D or –1.25D lenses in front of both eyes. The order of the prisms or lenses
40
was randomized for each subject. Instructions to maintain the square target clear and
single were given in all conditions. Ten measurements were made for each condition
from the right eye. Since the left eye saw through the prism and measurements were
made only in the right eye, off-axis refraction resulting from prism was avoided.
The 8 prism diopter vergence demand closely approximated the change in
vergence demand created in the experimental task (4 degree vergence change). Similarly
the 1.25D of accommodative change is expected had the target been seen in real depth.
The calculations for these values are shown below.
The viewing target distance is at 40 cm or 0.4 m (d)
Convergence demand = PD (cm) / d (m)
For an average PD of 6 cm, the convergence demand at this distance is = 6/0.4 =
15 prism diopters = 8.18 deg (1 prism diopter = 0.5454 deg)
In the main experimental task, a 4 degree change in vergence demand was made
from a 12 degree convergent position. Thus a convergence movement was made to a 16
deg target or a divergence movement was made to an 8 deg target. Thus, the
accommodative response was measured for a 4 degree vergence change by giving an 8
prism BI (divergence demand) and 8 prism BO (convergence demand) in front of one
eye.
For 12 deg or 22 prism diopters of convergence, the corresponding target distance
would be about 27.27 cm. This creates an accommodative demand of 3.6 D. For 16 deg
or 29 prism diopters the target distance would be about 20.68 cm, producing an
accommodative demand of 4.83 D. For 8 deg or 15 prism diopters the viewing distance
would be 40 cm with an accommodative demand of 2.5 D. Thus the change in
accommodative demand along the three vergence postures is about 1.2 D. Hence, a +

41
1.25 D and a -1.25 D lenses were used to measure the accommodative response for the
subjects.
4.5 Eye tracking instrument
The ISCAN (ISCAN, Inc., Woburn, MA) infrared eye tracker goggle was used to
measure the eye movements. This device allows for binocular eye movement
measurement. The instrument has an infrared light source that illuminates the eye after
reflected from a beam-splitter. The reflected eye image from the beam splitter travels
back to an infrared camera that captures the video image of the eye. The dark pupil is
brightly illuminated by the infrared light source and and tracked by the software. The
software allows the user to change the threshold settings. This was adjusted for each
subject such that the pupil was accurately tracked with minimum or no noise. The
temporal sampling rate of the instrument was 60 Hz for 132 trial runs and 120 Hz for 268
trials. Both of these sampling rates were adequate for collecting vergence data (Patel,
Jiang et al. 1999). The spatial resolution of the instrument is 10-15 arc minutes.
Onset of the target was signaled by a change in the digital voltage output signal.
This signal was taken from an Analog-Digital (A/D) miniLAB 1008 (Measurement
Computing corporation, Norton, MA) board and was fed into the Analog-in channel of
the ISCAN (ISCAN, Inc., Woburn, MA) board. Such a set up permitted the
synchronization of target presentation with the eye movement recording.
4.6 Test Trial
The following steps describe the sequence of target presentation for a given test
trial. The sequence is also shown in Figure 4.2:
42
1. Calibration:
A calibration preceded the trial run. The calibration was performed for
each eye separately. A set of horizontal and vertical crosses were shown and
subjects were instructed to look at the center cross, then to look to the cross on the
left and then the cross on the right, fixating at each cross for about a second.
When the crosses were presented on one monitor the other monitor had a black
screen. Only horizontal eye movements were of interest in this study so the
calibration was performed in the horizontal meridian.
2. Fixation:
After the calibration procedure subjects were asked to blink and were then
alerted before starting the trial. The trial began with a fixation cross presented on
both monitors for 2 seconds. The target had a convergence demand of 8 degrees.
The position of the eye while fixating at this cross was taken as the zero position.
3. Phoria measure 1 (pre-phoria):
The fixation cross was extinguished and then the concentric square target
was presented to the right eye for 20 seconds. A black screen (0.3 FL luminance)
was displayed for the left monitor and the left eye in the dark room saw no visible
targets.
4. Fixation:
After the pre-phoria measurement the fixation cross (8 degrees) was again
shown for 2 seconds
5. 12 degree disparity target (non-adapting condition):
The 12 degree vergence disparity target was shown for 5 seconds. This
required a 4 degree convergence movement to be made from the fixation cross.
6. 16 degree or 8 degree disparity target:
Either a 16 degree (convergence trial) or an 8 degree (divergence trial)
vergence disparity target was randomly selected to be displayed for 0.2 seconds
(200 milliseconds). The short duration of the target was to elicit the open-loop or
reflexive fast vergence eye movement.
7. Phoria measure 2 (phoria):
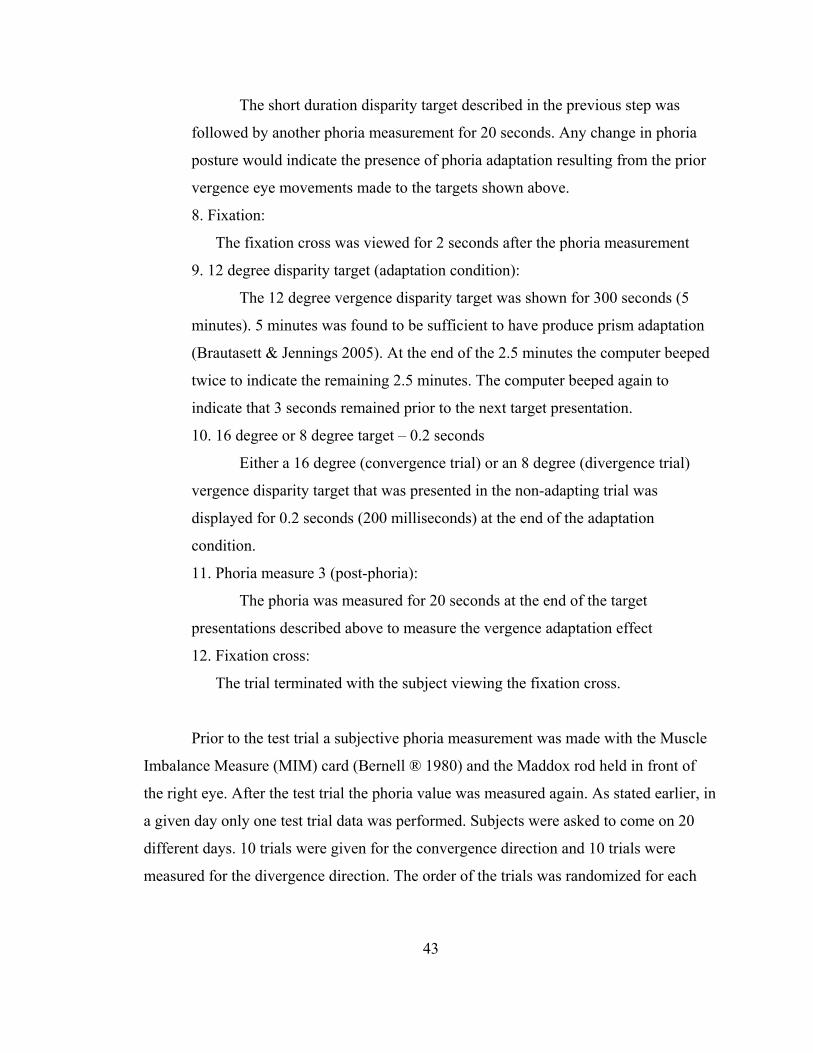
43
The short duration disparity target described in the previous step was
followed by another phoria measurement for 20 seconds. Any change in phoria
posture would indicate the presence of phoria adaptation resulting from the prior
vergence eye movements made to the targets shown above.
8. Fixation:
The fixation cross was viewed for 2 seconds after the phoria measurement
9. 12 degree disparity target (adaptation condition):
The 12 degree vergence disparity target was shown for 300 seconds (5
minutes). 5 minutes was found to be sufficient to have produce prism adaptation
(Brautasett & Jennings 2005). At the end of the 2.5 minutes the computer beeped
twice to indicate the remaining 2.5 minutes. The computer beeped again to
indicate that 3 seconds remained prior to the next target presentation.
10. 16 degree or 8 degree target – 0.2 seconds
Either a 16 degree (convergence trial) or an 8 degree (divergence trial)
vergence disparity target that was presented in the non-adapting trial was
displayed for 0.2 seconds (200 milliseconds) at the end of the adaptation
condition.
11. Phoria measure 3 (post-phoria):
The phoria was measured for 20 seconds at the end of the target
presentations described above to measure the vergence adaptation effect
12. Fixation cross:
The trial terminated with the subject viewing the fixation cross.
Prior to the test trial a subjective phoria measurement was made with the Muscle
Imbalance Measure (MIM) card (Bernell ® 1980) and the Maddox rod held in front of
the right eye. After the test trial the phoria value was measured again. As stated earlier, in
a given day only one test trial data was performed. Subjects were asked to come on 20
different days. 10 trials were given for the convergence direction and 10 trials were
measured for the divergence direction. The order of the trials was randomized for each

44
direction (convergence and divergence). The randomization was done in Microsoft Excel
(Microsoft Corporation, Redmond, WA) for each subject.
Figure 4.2: Illustration of target sequence presented in a given experimental trial

45
CHAPTER 5
RESULTS
5.1 Data analysis
Eye movement and target signal data collected by the ISCAN (ISCAN, Inc.,
Woburn, MA) software were analyzed offline using MATLAB® R2007a (The
MathWorks Inc., Natick, MA) software. Eye movement data were calibrated from the
calibration procedure performed prior to the trial. Vergence eye position was calculated
from the difference between the calibrated right eye and left eye position. Time series
plots of calibrated vergence eye position were made for further analysis.
5.2 Accommodation – Baseline measure
As discussed in the methods, accommodation measures were taken on all subjects
on the first day of the trial while viewing the target stimulus on a computer with and
without lenses (1.25 DS) and prisms (8 prism diopters). Average values were calculated
from the 10 readings taken for each of the viewing condition on every subject. With the 8
BI prism, there was modest relaxation of accommodation of about 0.13 D ± 0.27. With
the 8 BO prism, the average increase in accommodation was about 0.22 D ± 0.22. With

46
+1.25 DS, accommodation relaxed by about 1.00 D ± 0.2 and for the –1.00 DS lens the
eyes accommodated by 1.00 D ± 0.4.
5.3 Calculation of phoria and vergence adaptation
Objective phoria position was measured for 20 seconds. The first 10-15 s of
phoria measure is contributed by the fast vergence component decay (Krishnan and Stark
1977; Schor 1979 a) and the remaining phoria measure indicates the slow vergence
component decay. It is the last 5s that is of interest in this study. Average position for the
last 5s is calculated as the measure of phoria. Three phoria measures were made in a
given trial at three different instances in time as described in the methods. First, it was
measured after the calibration procedure and was called pre-phoria (phoria 1). Next it was
measured before the presentation of the 12 degree convergent vergence adaptation target
and was called phoria (phoria 2) and finally it was measured at the end of the vergence
adaptation period and after the brief presentation of the transient divergent or convergent
stimuli. This latter phoria measure was called the post-phoria (phoria 3). Differences
between the pre-phoria measure, phoria measure and post-phoria measure were
calculated. On average, the differences between the above phoria measures were found to
be significantly different from zero (p <0.05) for both the convergence and divergence
trials (Figure 5.1). The difference between the post-phoria and pre-phoria measure
showed the greatest change (Box plots on the right in Figure 5.1). This shows that the
vergence adaptation target (12 degree convergent target) was often effective in eliciting
vergence adaptation effect.

47
Figure 5.1: Box plots showing the magnitude of vergence adaptation calculated from the differences in phoria position measured at three instances in time for both convergence and divergence trials. Measures shown on the left were made at the beginning of the trial prior to vergence adaptation and that on the right were made at the end of the trial after viewing the vergence adaptation target
A positive value for the differences between each of the phoria measures
demonstrates positive vergence adaptation (positive trials). A negative value or zero
indicates a lack of vergence adaptation (negative trials). It can be seen from Figure 5.1
that there is variability observed in the magnitude of vergence adaptation measured. That
is, both positive trials and negative trials were found in the data. As the primary aim of
this experiment is to study the interaction of vergence adaptation on the fast vergence
controller it becomes important to separate out the positive and negative trials. This is
discussed further in section 5.5
postphoria-prephoriapostphoria-phoriaphoria-prephoriaDivergenceConvergenceDivergenceConvergenceDivergenceConvergence
7.5
5.0
2.5
0.0
-2.5
-5.0
Verg
ence
ada
ptat
ion
(deg
rees
)

48
5.4 Calculation of vergence dynamics
Twenty subjects completed all the 20 trials. Two vergence measurements to a
transient target (either a convergent 16 degrees or a divergent 8 degrees target) were
made in a given trial at different time intervals as described in the methods. The first
measure was made after viewing the 12 degree convergent target for 5 seconds (pre-
adaptation) and the second measure was made after viewing the 12 degree convergent
target for five minutes to induce vergence adaptation (post-adaptation). The analysis for
both these measures and for the convergence and divergence eye movements is identical.
Blink free vergence traces were selected for analysis. Of the total trials collected
for convergence and divergence 153 trials for convergence and 167 trials for divergence
were found to be free of blink artifacts in both pre-adaptation and post-adaptation
condition. Therefore, these data were usable for further pair wise analysis. Figure 5.2
shows a sample vergence trace collected over the entire duration of the test trial with the
components of the trial marked.
Vergence position data was low-pass filtered at a cut-off frequency of 10 Hz. This
cut-off frequency was comparable to earlier studies (Patel, Jiang et al. 1999). A two point
difference method was used to calculate the vergence velocity from the filtered vergence
position. Filtered vergence position, vergence velocity and target analog signals were
then plotted for further calculations (Figure 5.3).

49
Figure 5.2: Time series plot of vergence position data measured along with the target onset data from the Analog signal from the A/D board for a given trial
Peak velocity was calculated as the maximum velocity in a given velocity trace.
Vergence amplitude was calculated as the difference between the start and end of a
vergence movement. The start and end of the movement was identified as average of two
points prior to the start of vergence eye movement. This point was easily located from the
beginning of the velocity plot. The end of the vergence movement was identified as the
vergence posture that corresponded with the deceleration of the vergence velocity to zero.
A similar criterion has been used in earlier studies (Bahill, Clark et al. 1975). Vergence
latency was calculated from the difference between target onset time (noted from the
change in analog signal) and the change in vergence eye position noted by manually
going over the data column. This difference was then divided by the time taken between
each data point (1/120 = 0.008333 for 120 Hz sampling rate or 1/60 = 0.016667 for 60
HZ sampling rate) to give the value in milliseconds.

50
Figure 5.3: Time series plot showing the Target position, vergence position and vergence velocity. The vergence parameters measured (latency, peak velocity and amplitude) are marked
The overall average vergence latency, amplitude and peak velocity before and
after sustained convergence is shown for both convergence and divergence in Table 5.1
below.
0.6 0.7 0.8 0.9 1 1.1 1.2 1.3 1.4 1.5 1.6
-15
-10
-5
0
5
10
15
20
25
Time (seconds)
Pos
ition
(deg
rees
)
Target
Vergence peak velocity
Vergence poisition
Vergence latency
Vergence amplitude
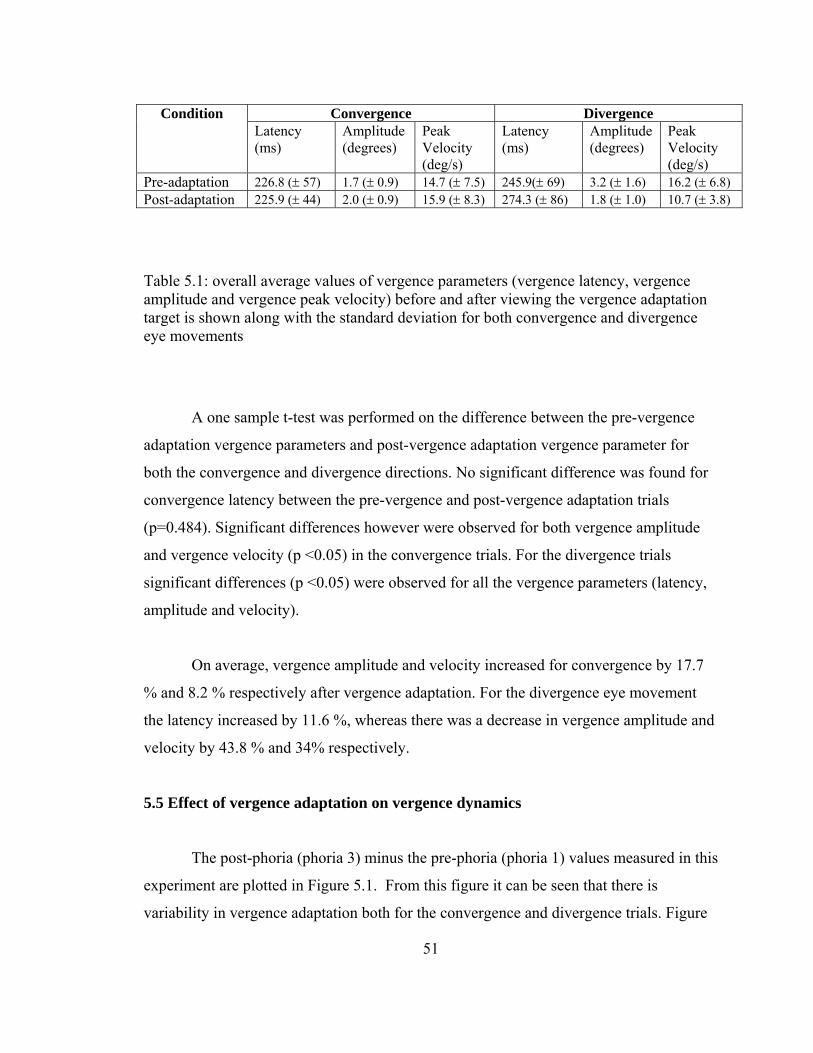
51
Table 5.1: overall average values of vergence parameters (vergence latency, vergence amplitude and vergence peak velocity) before and after viewing the vergence adaptation target is shown along with the standard deviation for both convergence and divergence eye movements
A one sample t-test was performed on the difference between the pre-vergence
adaptation vergence parameters and post-vergence adaptation vergence parameter for
both the convergence and divergence directions. No significant difference was found for
convergence latency between the pre-vergence and post-vergence adaptation trials
(p=0.484). Significant differences however were observed for both vergence amplitude
and vergence velocity (p <0.05) in the convergence trials. For the divergence trials
significant differences (p <0.05) were observed for all the vergence parameters (latency,
amplitude and velocity).
On average, vergence amplitude and velocity increased for convergence by 17.7
% and 8.2 % respectively after vergence adaptation. For the divergence eye movement
the latency increased by 11.6 %, whereas there was a decrease in vergence amplitude and
velocity by 43.8 % and 34% respectively.
5.5 Effect of vergence adaptation on vergence dynamics
The post-phoria (phoria 3) minus the pre-phoria (phoria 1) values measured in this
experiment are plotted in Figure 5.1. From this figure it can be seen that there is
variability in vergence adaptation both for the convergence and divergence trials. Figure
Convergence Divergence Condition Latency (ms)
Amplitude (degrees)
Peak Velocity (deg/s)
Latency (ms)
Amplitude (degrees)
Peak Velocity (deg/s)
Pre-adaptation 226.8 (± 57) 1.7 (± 0.9) 14.7 (± 7.5) 245.9(± 69) 3.2 (± 1.6) 16.2 (± 6.8) Post-adaptation 225.9 (± 44) 2.0 (± 0.9) 15.9 (± 8.3) 274.3 (± 86) 1.8 (± 1.0) 10.7 (± 3.8)

52
5.4 below shows the vergence adaptation variability in individual subjects (20 trials). It
can be seen that though many of the subjects (n=12) showed vergence adaptation on all
trials, some subjects showed no vergence adaptation on some trials. However, no subject
fell under the zero line in Figure 5.4, indicating that all subjects showed vergence
adaptation on at least some trials.
To analyze the influence of vergence adaptation on the fast vergence controller
the trials were divided into positive trials (vergence adaptation occurred) and negative
trials (vergence adaptation did not occur) and were reanalyzed. Positive trials are those
with a decrease in exophoria or increase in esophoria after sustained vergence to the 12
degree convergent target for 5 minutes. Negative trials are those where there was an
increase in exophoria or a decrease in esophoria after sustained vergence to the 12 degree
convergent target. A cut-off value of vergence adaptation greater than 0.8 degrees was
used to identify the positive and negative trials. 0.8 degree was the mean adaptation effect
found after viewing the 12 degree convergence target for 5 seconds and was thus used as
the cut-off value. Values of 0.8 degrees or less were identified as negative trials.
5.6 Comparison between positive trials and negative trials
About 20% of the trials were identified as negative trials for both convergence (30
out of 153 trials) and divergence (34 out of 167) trials. The average vergence parameters
(vergence latency, vergence amplitude and vergence peak velocity) are tabulated below
for the negative and positive trials for both convergence (Table 5.2) and divergence trials
(Table 5.3).

53
Figure 5.4: Box plots showing the magnitude of vergence adaptation for all subjects on all the 20 trials
A one sample t-test was performed under each of these trial conditions. For
convergence, no significant differences were found between pre-adaptation and post-
adaptation trials under negative trials (p>0.4). Under positive trials however, significant
differences were found for vergence amplitude and velocity (p<0.05) but not for latency
(p=0.599)
2019181716151413121110987654321
7.5
5.0
2.5
0.0
-2.5
-5.0
Subjects
Verg
ence
ada
ptat
ion
(deg
rees
)

54
Table 5.2: Comparison of average vergence parameters for negative and positive trials identified for convergence trials
For divergence, significant differences were found for vergence velocity and
amplitude but not for latency (p=0.655) in the negative trials. Significant difference
(p<0.05) was found for all vergence parameters in the positive trials.
Divergence (negative trials) Divergence (positive trials) Condition Latency (ms)
Amplitude (degrees)
Peak Velocity (deg/s)
Latency (ms)
Amplitude (degrees)
Peak Velocity (deg/s)
Pre-adaptation 267.9 (± 75) 2.8 (± 1.2) 13.8 (± 4.4) 240.4 (± 66) 3.3 (± 1.6) 16.8 (± 7.2) Post-adaptation 271.4 (± 93) 1.6 (± 0.9) 9.71 (± 3.4) 275.1 (± 84) 1.9 (± 1.0) 11.0 (± 3.9)
Table 5.3: Comparison of average vergence parameters for negative and positive trials identified for divergence trials
5.9 Vergence anomalous subjects
It was found that on some trials (at least 4 out of 10 convergence trials), three
subjects in this study showed no convergence response to the transient (200 ms) vergence
Convergence (negative trials) Convergence (positive trials) Condition Latency (ms)
Amplitude (degrees)
Peak Velocity (deg/s)
Latency (ms)
Amplitude (degrees)
Peak Velocity (deg/s)
Pre-adaptation 220.6 (± 34) 2.0 (± 0.9) 16.9 (± 7.3) 228.4 (± 62) 1.6 (± 0.9) 14.1 (± 7.5) Post-adaptation 215.4 (± 39) 2.0 (± 0.8) 16.8 (± 6.5) 228.2 (± 44) 2.0 (± 0.9) 15.7 (± 8.7)

55
stimulus. Interestingly, a vergence response was elicited for the same transient target after
vergence adaptation. Figure 5.5 shows a trial run from each of these three subjects.
Figure 5.5: Time series plots showing absence of convergence response to the transient stimulus (a) and presence of convergence response after vergence adaptation (b) for three subjects who showed vergence anomaly
1.5 2 2.5 3 3.5
0
2
4
6
8
10
12
Time (seconds)
verg
ence
pos
ition
(deg
rees
)
2 2.5 3 3.50
2
4
6
8
10
12
Time (seconds)V
erge
nce
posi
tion
(deg
rees
)
1 1.1 1.2 1.3 1.4 1.5 1.6 1.7 1.8 1.9 2
2
3
4
5
6
7
8
9
10
11
Time (seconds)
Pos
ition
(deg
rees
)
0.8 0.9 1 1.1 1.2 1.3 1.4 1.5
2
3
4
5
6
7
8
9
10
11
Time (seconds)
Pos
ition
(deg
rees
)
0.8 0.9 1 1.1 1.2 1.3 1.4
3
4
5
6
7
8
9
10
11
Time (seconds)
Pos
ition
(deg
rees
)
1 1.2 1.4 1.6 1.8 2 2.23
4
5
6
7
8
9
10
11
Time (seconds)
Pos
ition
(deg
rees
)
Subject 1 (a) Subject 1 (b)
Subject 2 (a) Subject 2 (b)
Subject 3 (a) Subject 3 (b)

56
CHAPTER 6
DISCUSSION
6.1 Accommodation
The baseline accommodation measured with the Grand Seiko autorefractor
showed that vergence induced by prism disparity was primarily brought about by
disparity vergence rather than accommodative vergence. There was only a minimal
change in accommodation when the disparity was introduced (0.13D and 0.22D), and this
may have originated from the CA/C cross-link interaction between accommodation and
disparity convergence. Thus, when disparity is introduced and the accommodative
demand is held constant, the primary source of vergence is disparity vergence.
6.2 Vergence Adaptation
The purpose of this experiment was to induce vergence adaptation, such that the
dynamics of vergence eye movement could be measured before and after this adaptation.
Vergence adaptation was brought about by viewing a 12 degree convergence target for
five minutes. The adaptation effect was calculated by a change in phoria position. Hence,
a more convergent posture after viewing the target would indicate positive vergence
adaptation in the expected direction. In the current study, vergence adaptation was found

57
after viewing the target for 5 minutes as well as for 5 seconds (Figure 5.1). The
adaptation effect, as expected, was greater for the 5 minute viewing time (about 2.3 deg
more esophoric) when compared to the 5 seconds viewing time (about 0.8 deg change in
vergence posture).
6.3 Vergence parameters
Comparisons of the vergence parameters (vergence latency, vergence amplitude,
vergence peak velocity) were made before and after sustained convergence for both the
convergence and divergence trials. The analysis was first performed for all trials,
regardless of whether vergence adaptation occurred (Table 5.1). For the convergence
trials, vergence latency did not change significantly before and after vergence adaptation.
However, vergence peak velocity and vergence amplitude increased after adaptation by
8.2% and 17.7% respectively. For the divergence trials, all three parameters showed
significant changes after vergence adaptation. For divergence, vergence latency increased
by 11.5% after adaptation while vergence amplitude and vergence peak velocity
decreased by 43.8% and 34% respectively. Patel et al.(Patel, Jiang et al. 1999), who used
shorter periods of sustained convergence, reported only a decrease in peak divergence
velocity (25%) while the other parameters that were measured in their study (steady state
vergence posture and latency to peak velocity) did not change.
In our experiment the trials were also divided into positive trials that showed
vergence adaptation in the expected direction and negative trials that did not show
vergence adaptation. In the negative trials, for convergence there were no significant
differences in the vergence parameters before and after sustained convergence. However,
in the positive trials, convergence peak velocity and convergence amplitude increased by
11.4 % and 25% respectively. These differences were found to be statistically significant
(p<0.05). The convergence latency however was not found to be statistically significant
(p=0.599).

58
For the divergence trials, vergence amplitude and peak velocity decreased for
both the negative and positive trials. The peak velocity decreased by 34.5% for the
positive trials and by 31.2% for the negative trials. The vergence amplitude decreased by
42.4% for the positive trials and by 42.8% for the negative trials. These decreases were
found to be statistically significant (P <0.05). Divergence latency increased in both the
positive and negative trials but the increase was found to be significant only for the
positive trials (p<0.05).
6.4 Interpretation
In interpreting these results, we will first consider the peak velocity and amplitude
parameters. Regardless of whether vergence adaptation occurred, vergence peak velocity
and vergence amplitude declined for the divergence trials following a period of sustained
convergence. These results can be interpreted to mean that only sustained convergence,
and not vergence adaptation, is required to bring about decreases in divergence amplitude
and divergence velocity. Referring to Figure 6.1 below, what is shown are the pools of
convergent disparity detectors and divergent disparity detectors in the cortex, as well as
the pools of convergent and divergent burst cells in the midbrain. The disparity detectors
drive the vergence burst cells. The fact that sustained convergence results in a decrease in
divergent peak velocity could mean that any of the possibilities (shown in Figure 6.1)
might occur. These possibilities are:
(A) Sustained convergence leads to suppression of divergent disparity detectors
(B) Sustained convergence leads to suppression of divergent burst cells
(C) Sustained convergence leads to conversion of divergent disparity detectors to
convergent disparity detectors
(D) Sustained convergence leads to conversion of divergent burst cells to
convergent burst cells

59
Of these possibilities, the most likely is that the divergent disparity detectors are
suppressed or undergo conversion. These are the most likely possibilities because there
was a concomitant change in vergence amplitude with changes in vergence peak velocity
that matches the main sequence relationship (vergence peak velocity versus amplitude)
previously described in the literature (Rashbass and Westheimer 1961; Hung, Ciuffreda
et al. 1994). It has been reported for vergence that if the amplitude of a vergence
movement changes by 1 deg, then the peak velocity of this vergence movement changes
by 4 deg/s (Hung, Ciuffreda et al. 1994). In our experiment, the reduction in divergent
response amplitude for trials that showed vergence adaptation was 1.4 deg with an
accompanying decrease in peak divergence velocity of 5.8 deg/s. For the trials where
vergence adaptation did not occur, the reduction in divergent response amplitude was 1.2
deg with a reduction in peak divergence velocity of 4.1 deg/s.
Figure 6.1: Illustration of the four possible (A, B, C, D) interactions among the disparity detectors for vergence disparity and vergence burst neurons
CORTEX
Convergent disparity detectors
Divergent disparity detectors A C
MESENCEPHALON
Convergent Burst neurons
Divergent Burst neurons B D
60
If the divergent disparity detectors are suppressed or reduced in number, then the
target disparity may not be assessed accurately. This could lead to a larger undershoot
such as that found after sustained convergence in this study. In addition, suppression or
reduction in the number of divergent disparity detectors would reduce the number of
burst cells driven by the disparity detectors. This in turn could reduce the vergence peak
velocity, just as we found.
On the other hand, if the burst cells were suppressed or declined in number, then
one would expect a drop in velocity, but any change in amplitude may not match the
change expected from the main sequence. The critical test of the disparity detector
hypothesis would be an experiment in which divergent stereoanomalies are tested for
before and after a period of sustained convergence. In that case, our hypothesis would
predict an increased incidence of divergent stereoanomalies following a period of
sustained convergence.
Also, in our study we found three subjects (15% of the study population) who
apparently showed vergence anomalies for the convergence direction on at least 4 out of
the 10 trials. Earlier studies have reported an incidence of 20% for vergence anomaly
with convergence anomaly being more common (Jones 1972; Jones 1977). Both vergence
anomaly and stereoanomaly are said to be due to a lack of disparity detectors (Richards
1970; Richards 1971; Jones 1977). We observed that following the sustained period of
convergence in the current experiment, the three subjects were subsequently able to
respond to the transient convergent target. Such a finding could probably support the
mechanism presented in (C) where greater convergent disparity detectors are recruited
from the divergence disparity detector pool.
The convergence results, on the other hand, show that sustained convergence does
not influence convergence amplitude and convergence peak velocity unless convergent
vergence adaptation occurs. This, combined with the divergence results, implies that a
strong sustained effort capable of driving vergence adaptation can result in one of the
61
following. Sustained convergence might lead to an increase in the number of
convergence (disparity detection or burst) cells available to produce a vergence
movement. Alternatively or in addition, sustained convergence might lead to a rise in the
tonic innervational level of the convergence (disparity detection or burst) cells, making it
easier for them to reach their firing threshold.
The final vergence parameter that was measured in this experiment is the
vergence latency. Vergence latency encompasses the time taken for the sensory signals to
reach the cortex, the processing of the information (disparity detection) necessary for an
appropriate eye movement, and the motor signal (vergence burst neuron activity) to elicit
a vergence response. For the vergence responses recorded before and after vergence
adaptation we can safely assume that the sensory signal reaching the cortex via the optics
of the eye and the visual pathway would essentially remain a constant. Thus, a change in
vergence latency before and after vergence adaptation would reflect the disparity
processing time (sensory processing) and the time taken to generate the vergence
movement (motor output). It was found in this study that the divergence latency increased
significantly after vergence adaptation. This could mean that there was an increase in
sensory processing because of lower availability of divergent disparity detectors (process
(C) in Figure 6.1) or alternately because of the suppressed activity due to sustained
convergence (process (A) in Figure 6.1). It is also possible that the motor output is
causing the delay by taking a longer time to reach the firing threshold due to process (B)
or (D). Convergence latency showed an insignificant decrease in latency after vergence
adaptation.
In addition to the explanations put forth so far, an alternate explanation for the
results would involve the activity at the lower motor level. It is possible that increased
neural innervation could increase the tonicity of the medial recti. Recent
neurophysiological studies (Büttner-Ennever 2006) have identified a unique type of slow
non-twitch, fatigue-resistant muscle fiber called the multiply innervated muscle fibers
(MIFs) that are different and have independent topographic organization from the singly
62
innervated muscle fiber (SIF). The SIFs primarily drive eye movements while the MIFs
participate in determining the tonic muscle activity as in gaze-holding, vergence and eye
alignment (Buttner-Ennever, Horn et al. 2001; Buttner-Ennever, Horn et al. 2002;
Büttner-Ennever 2006). Thus, the SIFs and its inputs may be associated with the transient
response of the fast vergence controller while the MIFs may be associated with the
sustained response of the fast vergence controller. The role of MIFs in vergence
adaptation has not yet been examined.
If the tonicity of the MIFs were to increase as convergence is sustained, then the
SIFs would have to operate against the sustaining forces of the MIFs in order to produce
a vergence movement. This could result in a decline in vergence parameters (velocity and
amplitude) when a vergence eye movement is made in the convergent or divergent
direction. Instead, the results of the current study showed a decline in the vergence
parameters for divergence but an increase in velocity and amplitude for convergence
trials (when vergence adaptation occurred) after sustained convergence.
It is difficult to explain this result by proposing a gating mechanism, in which the
MIFs are inhibited while the SIFs are innervated to produce a vergence movement. In
that case, the MIFs would only be inhibited or gated when a convergence movement is
made, allowing interaction between the MIFs and SIFs when a divergent movement is
made. Further, it is difficult to explain how “peripheral” interactions such as those
described here could account for the increase in convergent velocity and amplitude noted
after sustained convergence or how such interactions could explain why the vergence
main sequence relationships continued to be obeyed after sustained convergence. We
therefore feel that the most parsimonious explanation for the results is a change in the
properties of disparity detectors brought about by sustained convergence.

63
CHAPTER 7
CONCLUSION
In this experiment, we aimed to study the influence of the slow vergence
controller, responsible for vergence adaptation, on the fast vergence controller that
initiates a vergence eye movement in the presence of a target disparity. Specifically, the
study was to examine the interaction of the slow vergence controller with the transient
(open loop) part of the fast vergence controller (Westheimer and Mitchell 1969; Jones
and Kerr 1972; Hung, Semmlow et al. 1986; Semmlow, Hung et al. 1993).
The results show that after a period of sustained convergence, divergence
amplitude and peak velocity decline. The reduction in these parameters occurs regardless
of whether sustained convergence brings about vergence adaptation. The concomitant
change in amplitude and peak velocity seems to fit the main sequence. This suggests that
changes in the divergent disparity detectors might be responsible for the decline in
amplitude and peak velocity. Studies in which stereoanomalies are assessed prior to and
after sustained convergence are necessary to solidify this theory.
On the other hand, after a period of sustained convergence, convergence
amplitudes and peak velocities do not change unless vergence adaptation takes place.
When these parameters change, they increase.

64
Finally, because vergence adaptation is correlated with declines in divergent peak
velocity and amplitude but it is correlated with increases in convergent peak velocity and
amplitude, we conclude that the slow fusional vergence innervation is gated during a
vergence eye movement.
Previous literature suggests that vergence adaptation would release the fast
vergence controller to quickly act on a novel target (Schor 1979(b); Ciuffreda and
Tannen 1995). From our study we can conclude that while this may be true for eye
movements made in the convergent direction, the divergence movements would be
slower and less accurate after sustained convergence.
65
REFERENCES
Alvarez, T. L., J. L. Semmlow, et al. (2005). "Divergence eye movements are dependent on initial stimulus position." Vision Res 45(14): 1847-55.
Bahill, A. T., M. R. Clark, et al. (1975). "The main sequence, a tool for studying human eye movements." Mathematical Biosciences 24: 191-204.
Brautaset, R. L. and A. J. Jennings (2006). "Effects of orthoptic treatment on the CA/C and AC/A ratios in convergence insufficiency." Invest Ophthalmol Vis Sci 47(7): 2876-80.
Brautaset, R. L. and J. A. Jennings (2005). "Increasing the proportion of binocular vision makes horizontal prism adaptation complete." Ophthalmic Physiol Opt 25(2): 168-70.
Büttner-Ennever, J. A. (2006). Neuroanatomy of the oculomotor system. Amsterdam ; Oxford, Elsevier.
Buttner-Ennever, J. A., A. K. Horn, et al. (2002). "Modern concepts of brainstem anatomy: from extraocular motoneurons to proprioceptive pathways." Ann N Y Acad Sci 956: 75-84.
Buttner-Ennever, J. A., A. K. Horn, et al. (2001). "Motoneurons of twitch and nontwitch extraocular muscle fibers in the abducens, trochlear, and oculomotor nuclei of monkeys." J Comp Neurol 438(3): 318-35.
Carpenter, R. H. S. (1988). Movements of the eyes. London, Pion.
Carpenter, R. H. S. (1991). Eye movements. Boca Raton, CRC Press.
Carter, D. B. (1965). "Fixation Disparity and Heterophoria Following Prolonged Wearing of Prisms." Am J Optom Arch Am Acad Optom 42: 141-52.
Ciuffreda, K. J. and B. Tannen (1995). Eye movement basics for the clinician. St. Louis, Mosby.
Erkelens, C. J., R. M. Steinman, et al. (1989). "Ocular vergence under natural conditions. II. Gaze shifts between real targets differing in distance and direction." Proc R Soc Lond B Biol Sci 236(1285): 441-65.
66
Gamlin, P. D. (2002). "Neural mechanisms for the control of vergence eye movements." Ann N Y Acad Sci 956: 264-72.
Henson, D. B. and R. North (1980). "Adaptation to prism-induced heterophoria." Am J Optom Physiol Opt 57(3): 129-37.
Horng, J. L., J. L. Semmlow, et al. (1998). "Initial component control in disparity vergence: a model-based study." IEEE Trans Biomed Eng 45(2): 249-57.
Howard, I. P. and B. J. Rogers (2002). Seeing in depth. Thornhill, Ont., I. Porteous.
Hung, G. K. and K. J. Ciuffreda (2002). Models of the visual system. New York, Kluwer Academic/Plenum Publishers.
Hung, G. K., K. J. Ciuffreda, et al. (1994). "Vergence eye movements under natural viewing conditions." Invest Ophthalmol Vis Sci 35(9): 3486-92.
Hung, G. K., J. L. Semmlow, et al. (1986). "A dual-mode dynamic model of the vergence eye movement system." IEEE Trans Biomed Eng 33(11): 1021-8.
Hung, G. K., H. Zhu, et al. (1997). "Convergence and divergence exhibit different response characteristics to symmetric stimuli." Vision Res 37(9): 1197-205.
Jiang, B. C. (1996). "Accommodative vergence is driven by the phasic component of the accommodative controller." Vision Res 36(1): 97-102.
Jones, R. (1972). "Psychophysical and oculomotor responses of normal and stereoanomalous observers to disparate retinal stimulation (Dissertation)."
Jones, R. (1977). "Anomalies of disparity detection in the human visual system." J Physiol 264(3): 621-40.
Jones, R. (1980). "Fusional vergence: sustained and transient components." Am J Optom Physiol Opt 57(9): 640-4.
Jones, R. and K. E. Kerr (1972). "Vergence eye movements to pairs of disparity stimuli with shape selection cues." Vision Res 12(8): 1425-30.
Krishnan, V. V., D. Shirachi, et al. (1977). "Dynamic measures of vergence accommodation." Am J Optom Physiol Opt 54(7): 470-3.
Krishnan, V. V. and L. Stark (1977). "A heuristic model for the human vergence eye movement system." IEEE Trans Biomed Eng 24(1): 44-9.
Mays, L. E. (1984). "Neural control of vergence eye movements: convergence and divergence neurons in midbrain." J Neurophysiol 51(5): 1091-1108.

67
Mays, L. E., J. D. Porter, et al. (1986). "Neural control of vergence eye movements: neurons encoding vergence velocity." J Neurophysiol 56(4): 1007-21.
McCormack, G. and S. K. Fisher (1996). "The source of disparity vergence innervation determines prism adaptation." Ophthalmic Physiol Opt 16(1): 73-82.
North, R. and D. B. Henson (1981). "Adaptation to prism-induced heterophoria in subjects with abnormal binocular vision or asthenopia." Am J Optom Physiol Opt 58(9): 746-52.
Ogle, K. N. and A. D. Prangen (1953). "Observations on vertical divergences and hyperphorias." AMA Arch Ophthalmol 49(3): 313-34.
Patel, S. S., B. C. Jiang, et al. (1999). "Nonlinear alteration of transient vergence dynamics after sustained convergence." Optom Vis Sci 76(9): 656-63.
Poggio, G. E. (1995). "Mechanisms of stereopsis in monkey visual cortex." Cereb Cortex 5(3): 193-204.
Poggio, G. F. and W. H. Talbot (1981). "Mechanisms of static and dynamic stereopsis in foveal cortex of the rhesus monkey." J Physiol 315: 469-92.
Rainey, B. B. (2000). "The effect of prism adaptation on the response AC/A ratio." Ophthalmic Physiol Opt 20(3): 199-206.
Rashbass, C. and G. Westheimer (1961). "Disjunctive eye movements." J Physiol 159: 339-60.
Richards, W. (1970). "Stereopsis and stereoblindness." Exp Brain Res 10(4): 380-8.
Richards, W. (1971). "Anomalous stereoscopic depth perception." J Opt Soc Am 61(3): 410-4.
Rosenfield, M., T. W. Chun, et al. (1997). "Effect of prolonged dissociation on the subjective measurement of near heterophoria." Ophthalmic Physiol Opt 17(6): 478-82.
Rosenfield, M., J. M. Rappon, et al. (2000). "Vergence adaptation and the clinical AC/A ratio." Ophthalmic Physiol Opt 20(3): 207-11.
Saladin, J. J. (2005). "Stereopsis from a performance perspective." Optom Vis Sci 82(3): 186-205.
Scheiman, M., B. Wick, et al. (2002). Clinical management of binocular vision : heterophoric, accommodative and eye movement disorders. Philadelphia, Lippincott Williams & Wilkins.
68
Schor, C. and D. Horner (1989). "Adaptive disorders of accommodation and vergence in binocular dysfunction." Ophthalmic Physiol Opt 9(3): 264-8.
Schor, C. M. (1979 a). "The influence of rapid prism adaptation upon fixation disparity." Vision Res 19(7): 757-65.
Schor, C. M. (1979(b)). "The relationship between fusional vergence eye movements and fixation disparity." Vision Res 19(12): 1359-67.
Schor, C. M. (1992). "A dynamic model of cross-coupling between accommodation and convergence: simulations of step and frequency responses." Optom Vis Sci 69(4): 258-69.
Schor, C. M. and K. J. Ciuffreda (1983). Vergence eye movements : basic and clinical aspects. Boston, Butterworth.
Schor, C. M. and J. C. Kotulak (1986). "Dynamic interactions between accommodation and convergence are velocity sensitive." Vision Res 26(6): 927-42.
Semmlow, J. and P. Wetzel (1979). "Dynamic contributions of the components of binocular vergence." J Opt Soc Am 69(5): 639-45.
Semmlow, J. L., T. L. Alvarez, et al. (2007). "Dry dissection of disparity divergence eye movements using independent component analysis." Comput Biol Med 37(7): 910-8.
Semmlow, J. L., G. K. Hung, et al. (1986). "Quantitative assessment of disparity vergence components." Invest Ophthalmol Vis Sci 27(4): 558-64.
Semmlow, J. L., G. K. Hung, et al. (1993). "Initial control component in disparity vergence eye movements." Ophthalmic Physiol Opt 13(1): 48-55.
Sethi, B. (1986). "Vergence adaptation: a review." Doc Ophthalmol 63(3): 247-63.
Stark, L., R. V. Kenyon, et al. (1980). "Disparity vergence: a proposed name for a dominant component of binocular vergence eye movements." Am J Optom Physiol Opt 57(9): 606-9.
Stephens, G. L. (1982). An analysis of the effects of target luminance and duration on disparity vergence eye movements: 212 leaves. also on microfiche. 3 sheets.
Werner, J. S. and L. M. Chalupa (2004). The visual neurosciences. Cambridge, Mass., MIT Press.
Westheimer, G. and A. M. Mitchell (1956). "Eye movement responses to convergence stimuli." AMA Arch Ophthalmol 55(6): 848-56.

69
Westheimer, G. and D. E. Mitchell (1969). "The sensory stimulus for disjunctive eye movements." Vision Res 9(7): 749-55.