Due Diligence Investigations of Novel Copper-alloy Mesh ...
37
Environmental aspects of copper alloy mesh 1 Robert Dwyer , (International Copper Association), Patrick Earley, Brandon Swope (US Navy SPAWAR), Juan Carlos Torres (CODELCO), Scott Smith, Holly Gray, (Wilfrid Laurier University), Uwe Hofmann (Wieland Werke) February 2015 Due Diligence Investigations of Novel Copper-alloy Mesh Materials in Aquaculture: - Measured copper release rates - Modeled and measured ambient concentrations - Measured uptake in cultured fish - Predicted bioavailability to other aquatic organisms
-
Upload
khangminh22 -
Category
Documents
-
view
1 -
download
0
Transcript of Due Diligence Investigations of Novel Copper-alloy Mesh ...
Environmental aspects of copper alloy mesh1
Robert Dwyer, (International Copper Association), Patrick Earley, Brandon Swope (US Navy SPAWAR), Juan Carlos Torres (CODELCO), Scott Smith, Holly Gray, (Wilfrid Laurier University), Uwe Hofmann (Wieland Werke)
February 2015
Due Diligence Investigations of Novel Copper-alloy Mesh Materials in Aquaculture: - Measured copper release rates - Modeled and measured ambient concentrations - Measured uptake in cultured fish - Predicted bioavailability to other aquatic organisms

Why copper alloys?
2
• Durable in the offshore environment
• Solid track record in marine engineering
• Low corrosion rates
• Strong and rigid
• Easy to fabricate
• 100 percent recyclable
Environmental aspects of copper alloy mesh
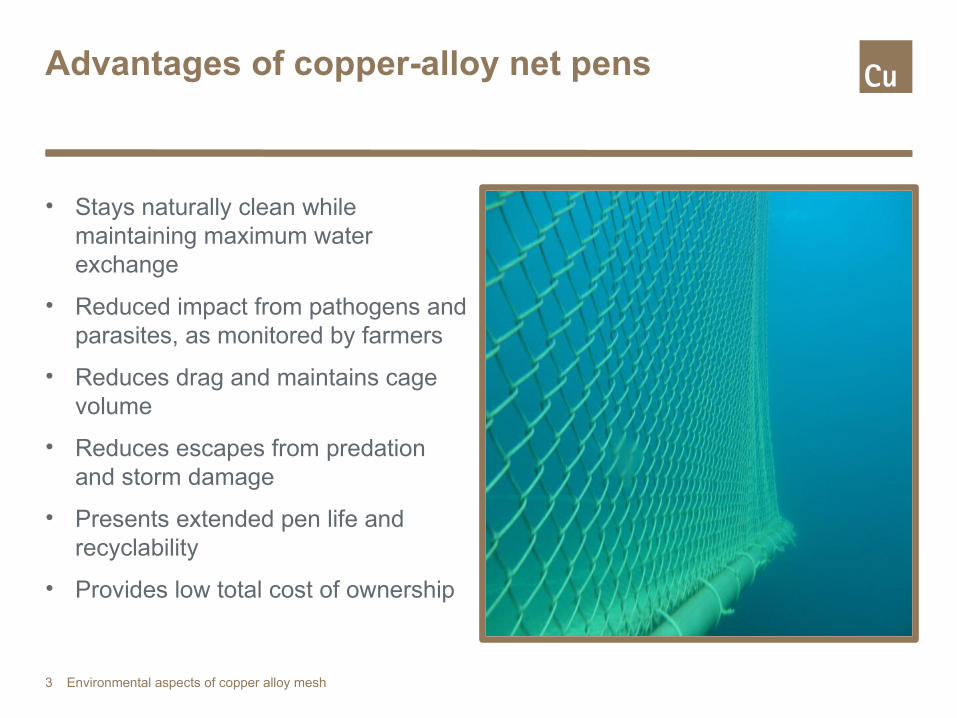
Advantages of copper-alloy net pens
3
• Stays naturally clean while maintaining maximum water exchange
• Reduced impact from pathogens and parasites, as monitored by farmers
• Reduces drag and maintains cage volume
• Reduces escapes from predation and storm damage
• Presents extended pen life and recyclability
• Provides low total cost of ownership
Environmental aspects of copper alloy mesh
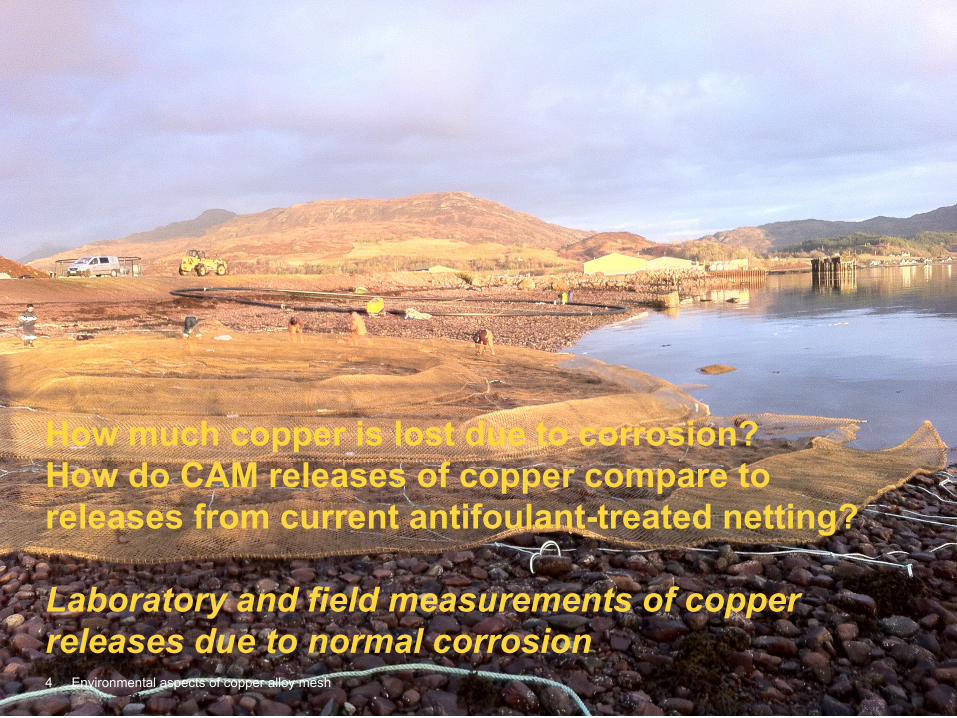
How much copper is lost due to corrosion?How do CAM releases of copper compare to releases from current antifoulant-treated netting?
Laboratory and field measurements of copper releases due to normal corrosion4 Environmental aspects of copper alloy mesh

Major objective of copper-alloy mesh products: Reduce metal loss to extend working life with minimal maintenance
Corrosion sequence for copper alloys in seawater:
• Bare (“bright”) metal initially oxidizes with relatively soluble corrosion products (oxides, hydroxides)
• Over several weeks, relatively soluble corrosion products are replaced by less and less soluble salts: copper chlorides, copper carbonates
• These low-solubility corrosion salts form a protective patina on surfaces to inhibit further corrosion and metal loss
5 Environmental aspects of copper alloy mesh
Copper releases to seawater during this corrosion sequence
• Laboratory experiments: “Jar” tests (Major Testing Lab, Germany)
• Field measurements: “Dome” tests (U.S. Navy, San Diego)
6 Environmental aspects of copper alloy mesh
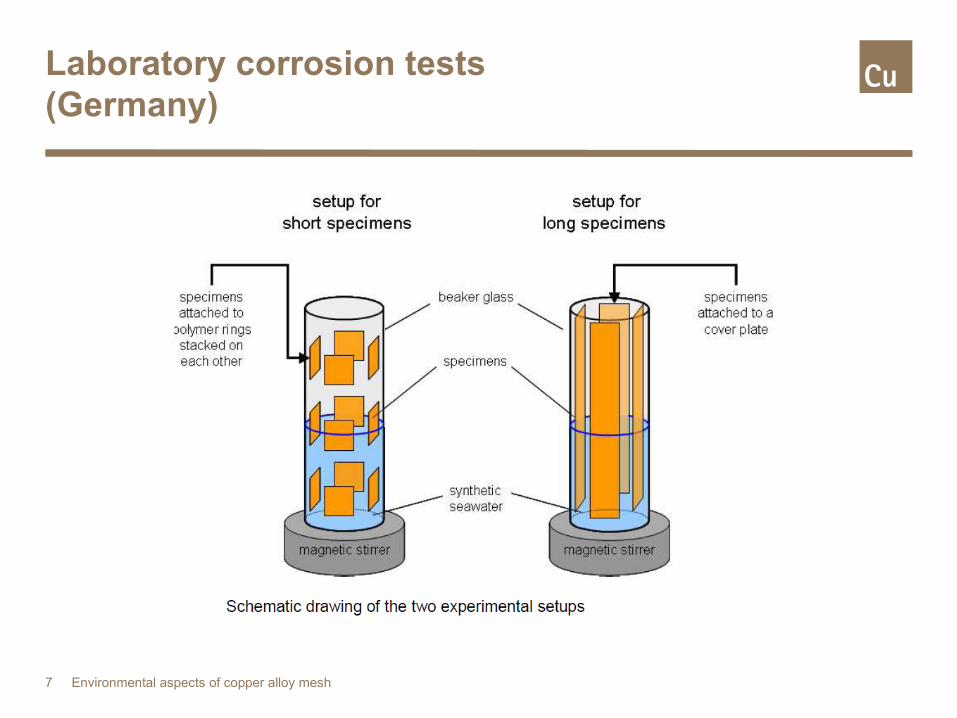
Laboratory corrosion tests (Germany)
7 Environmental aspects of copper alloy mesh
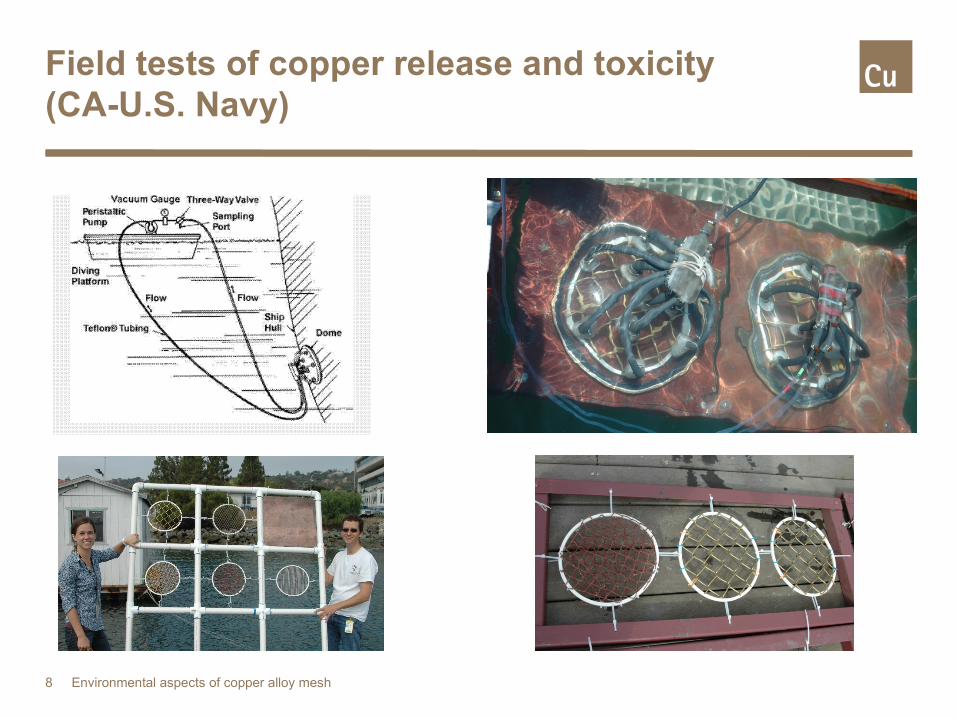
Field tests of copper release and toxicity (CA-U.S. Navy)
8 Environmental aspects of copper alloy mesh

Copper release rates—current practice: Nylon mesh coated with antifoulant
Environmental aspects of copper alloy mesh9
0 50 100 150 200 250 300 350 4000
20
40
60
80
100
120
140
160
180
200
Elapsed time, days
Cop
per
rele
ase,
μg/
cm2-d
ay
Nylon net-FlexGuard)
Source: Brooks, K.M., 2000

0 50 100 150 200 250 300 350 4000
20
40
60
80
100
120
140
160
180
200
Copper release rates—current practice: Nylon mesh coated with antifoulant
10
0 50 100 150 200 250 300 350 4000
20
40
60
80
100
120
140
160
180
200
Elapsed time, days
Cop
per
rele
ase,
μg/
cm2-d
ay
Nylon net-FlexGuard
FlexGuard (extrapolated)
Source: Brooks, K.M., 2000
Environmental aspects of copper alloy mesh
0 50 100 150 200 250 300 350 4000
20
40
60
80
100
120
140
160
180
200
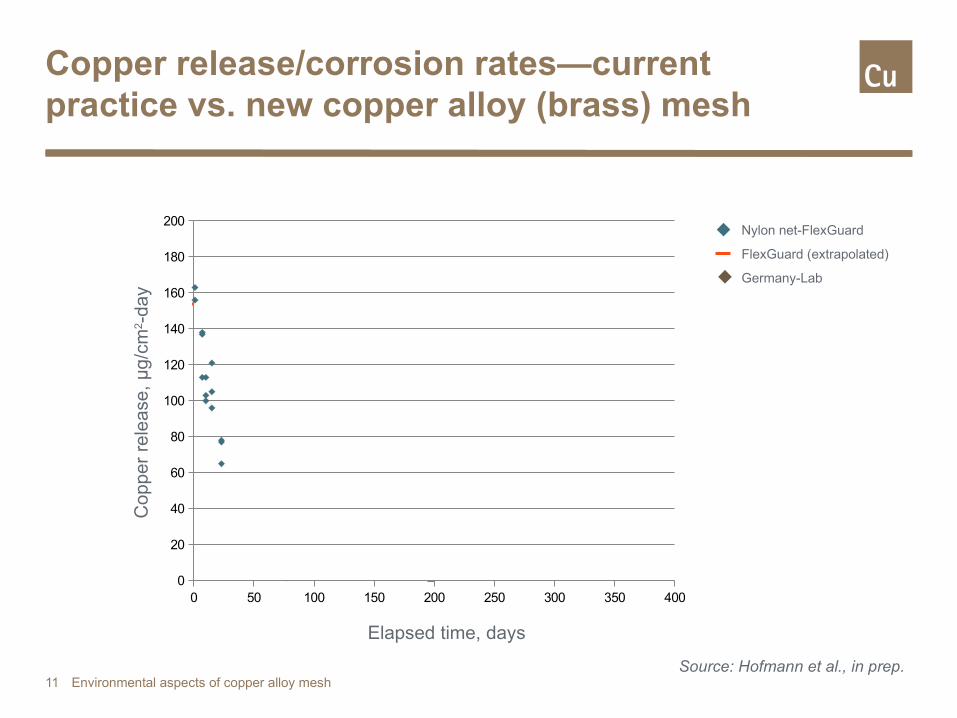
Copper release/corrosion rates—current practice vs. new copper alloy (brass) mesh
11
0 50 100 150 200 250 300 350 4000
20
40
60
80
100
120
140
160
180
200
0 50 100 150 200 250 300 350 4000
20
40
60
80
100
120
140
160
180
200
Elapsed time, days
Cop
per
rele
ase,
μg/
cm2-d
ay
Nylon net-FlexGuard
FlexGuard (extrapolated)
Germany-Lab
Source: Hofmann et al., in prep.Environmental aspects of copper alloy mesh

12
0 50 100 150 200 250 300 350 4000
20
40
60
80
100
120
140
160
180
200
0 50 100 150 200 250 300 350 4000
20
40
60
80
100
120
140
160
180
200
0 50 100 150 200 250 300 350 4000
20
40
60
80
100
120
140
160
180
200
0 50 100 150 200 250 300 350 4000
20
40
60
80
100
120
140
160
180
200
Elapsed time, days
Cop
per
rele
ase,
μg/
cm2-d
ay
Nylon net-FlexGuard
FlexGuard (extrapolated)
Germany-Lab
Navy Dome-Field
Source: Earley et al., in prep.
Copper release/corrosion rates—current practice vs. new copper alloy (brass) mesh
Environmental aspects of copper alloy mesh

Comparative copper release rates from CAM and AF-coated nylon, over a typical grow-out cycle
Environmental aspects of copper alloy mesh13
Elapsed time
Cop
per
rele
ase
Nylon coating replacement cycle
Copper-alloy meshreplacement cycle

Release rate—conclusions
• Copper-alloy mesh release rates decrease rapidly as bright metal forms protective patina
• Total metal loss: < 2 percent over five- to eight-year lifetime in the water (based on initial pilot tests; agrees with extrapolation of these test data)
• CAM release rates over a grow-out cycle: much less than AF-treated nylon (where releases will “spike” every four – eight months when freshly-treated nylon net replaces copper-depleted and fouled net)
14 Environmental aspects of copper alloy mesh
Environmental aspects of copper alloy mesh15
Zinc Releases from CAM Brass
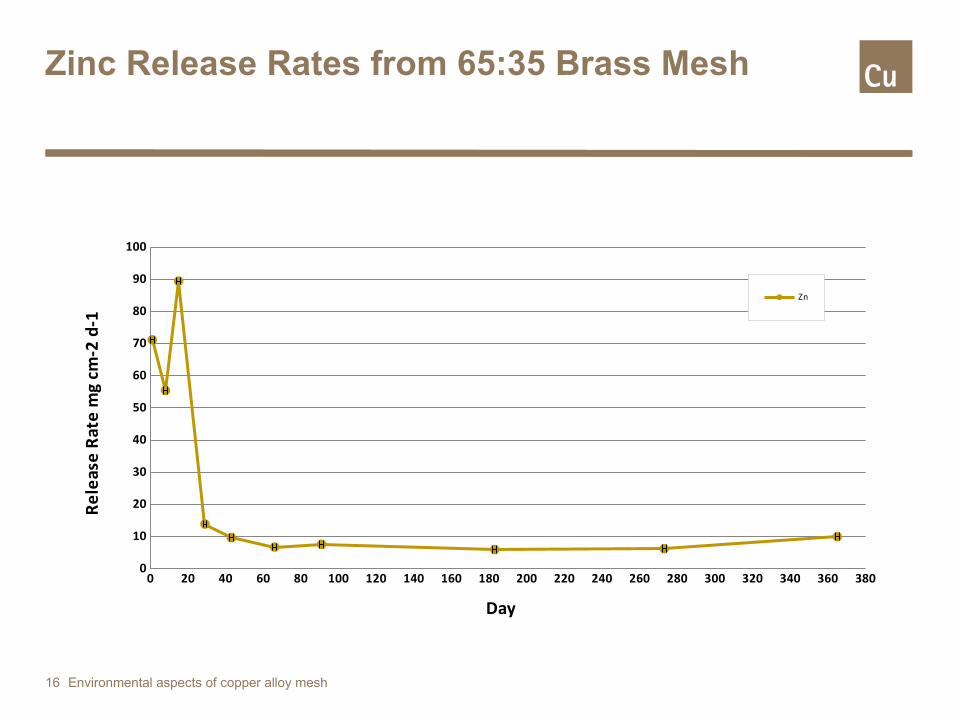
Zinc Release Rates from 65:35 Brass Mesh
Environmental aspects of copper alloy mesh16
0 20 40 60 80 100 120 140 160 180 200 220 240 260 280 300 320 340 360 3800
10
20
30
40
50
60
70
80
90
100
Zn
Day
Rele
ase
Rate
mg
cm-2
d-1

How much do copper concentrations increase in nearby waters?Do copper concentrations near CAM pens comply with water quality standards?
Measured Nearfield Copper Concentrations at a Site in British Columbia, Canada17 Environmental aspects of copper alloy mesh
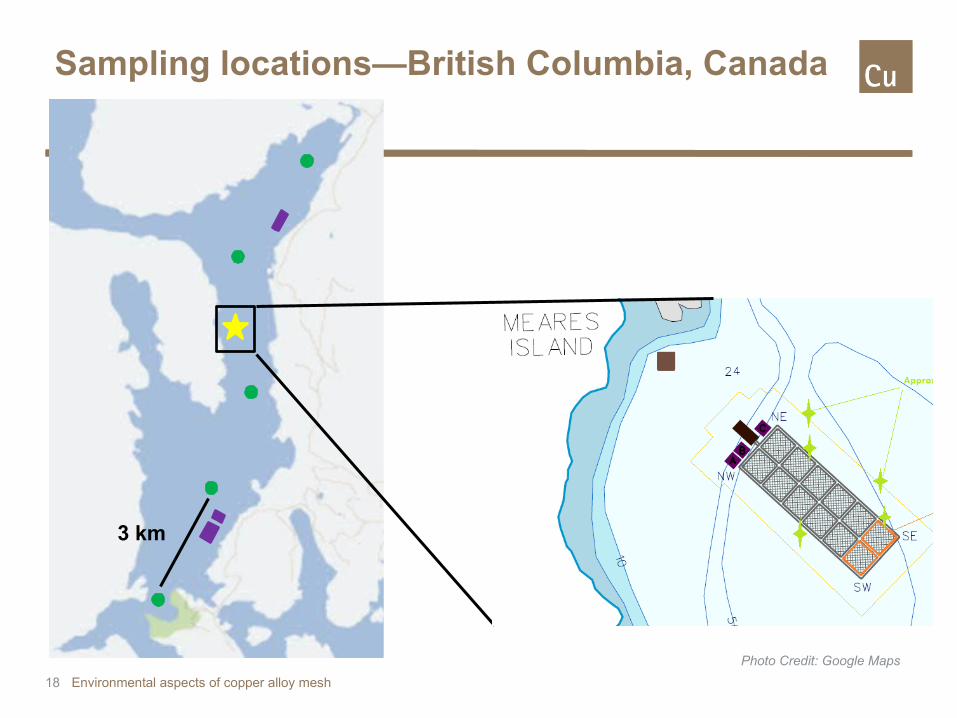
3 km
Sampling locations—British Columbia, Canada
18
Photo Credit: Google Maps
Environmental aspects of copper alloy mesh
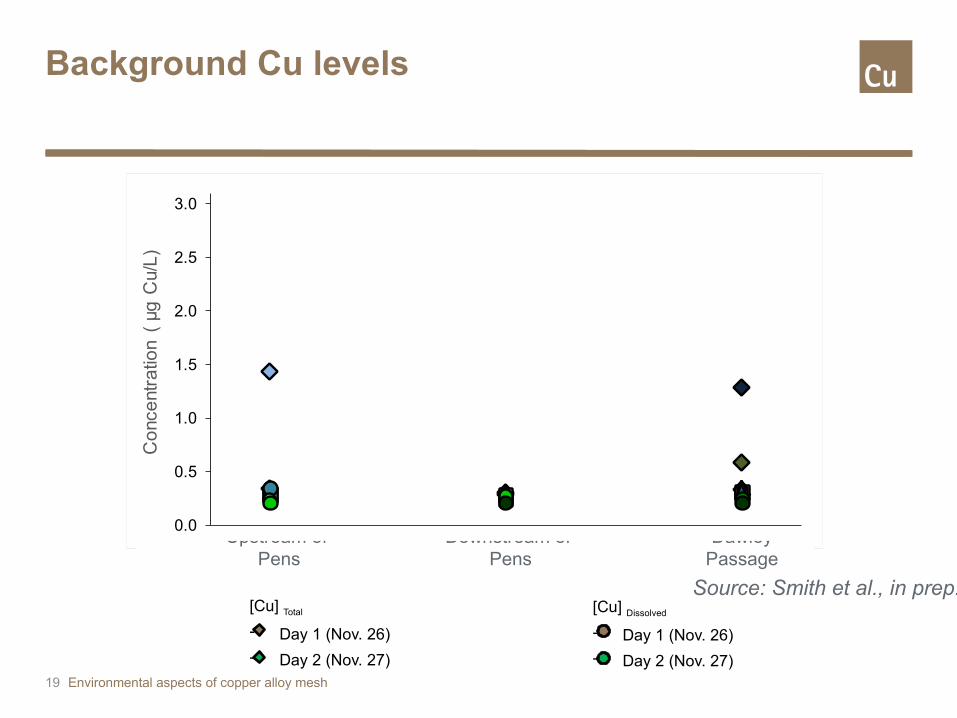
Background Cu levels
Environmental aspects of copper alloy mesh19
Upstream of
PensDownstream of
PensDawley
Passage
[Cu] Total
- Day 1 (Nov. 26)
- Day 2 (Nov. 27)
[Cu] Dissolved
- Day 1 (Nov. 26)
- Day 2 (Nov. 27)
Source: Smith et al., in prep.
0.0
0.5
1.0
1.5
2.0
2.5
3.0
Co
nce
ntra
tion
( µg
Cu/
L)

Downstream samples over time
20
0,0
0,5
1,0
1,5
2,0
2,5
3,0
Co
nce
ntr
atio
n (
µg
Cu
/L)
6 8 9 15 20
Day
Environmental aspects of copper alloy mesh
Source: Smith et al., in prep

Downstream samples over time
21
6 8 9 15 20
Day
0,0
0,5
1,0
1,5
2,0
2,5
3,0
Co
nce
ntr
atio
n (
µg
Cu
/L)
[Cu] Total
[Cu] Dissolved
Environmental aspects of copper alloy mesh Source: Smith et al., in prep
Conclusions
• Measured values are below applicable British Columbia water quality standards for copper.
• No consistent patterns to indicate detectable amounts of copper are being released from the newly-installed cages.
22 Environmental aspects of copper alloy mesh
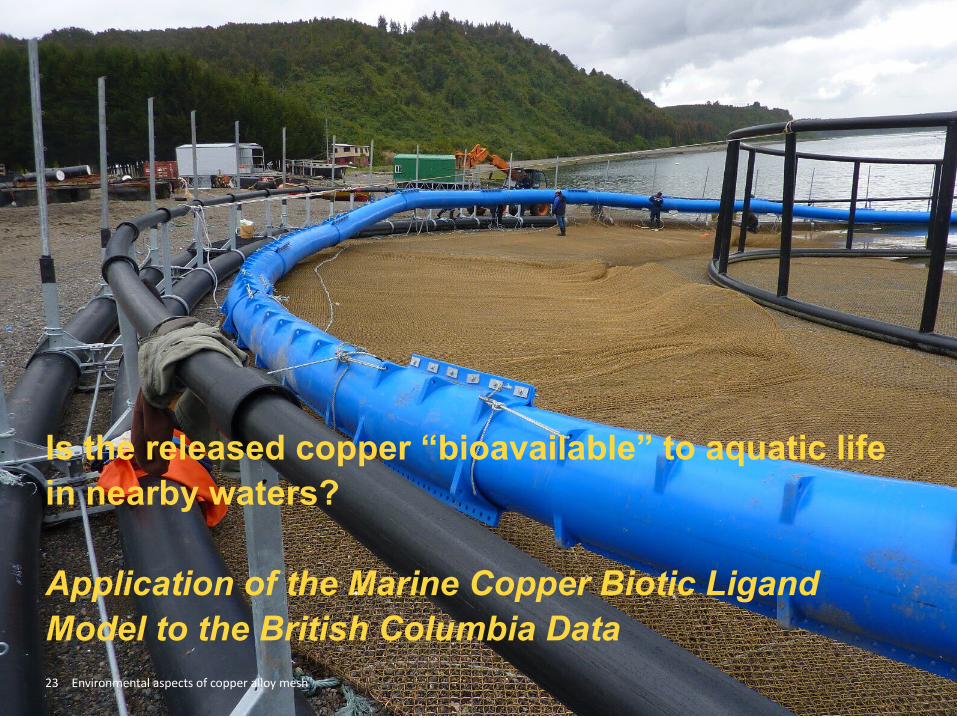
23
Is the released copper “bioavailable” to aquatic life in nearby waters?
Application of the Marine Copper Biotic Ligand Model to the British Columbia Data
Environmental aspects of copper alloy mesh
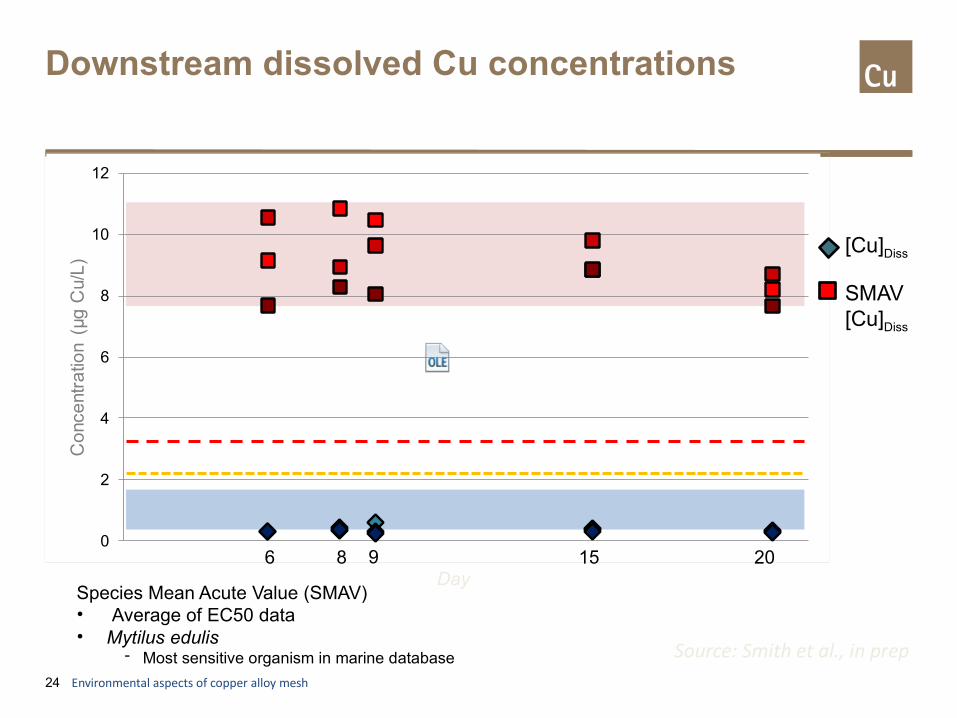
Downstream dissolved Cu concentrations
24
6 8 9 15 20Day
[Cu]Diss
SMAV[Cu]Diss
Species Mean Acute Value (SMAV)• Average of EC50 data• Mytilus edulis
- Most sensitive organism in marine database
Environmental aspects of copper alloy mesh
Source: Smith et al., in prep
0
2
4
6
8
10
12
Co
nce
ntra
tion
(µg
Cu/
L)

How much do copper concentrations increase in nearby sediments?
Planned sediment monitoring, per ASC Salmon Standard
25 Environmental aspects of copper alloy mesh
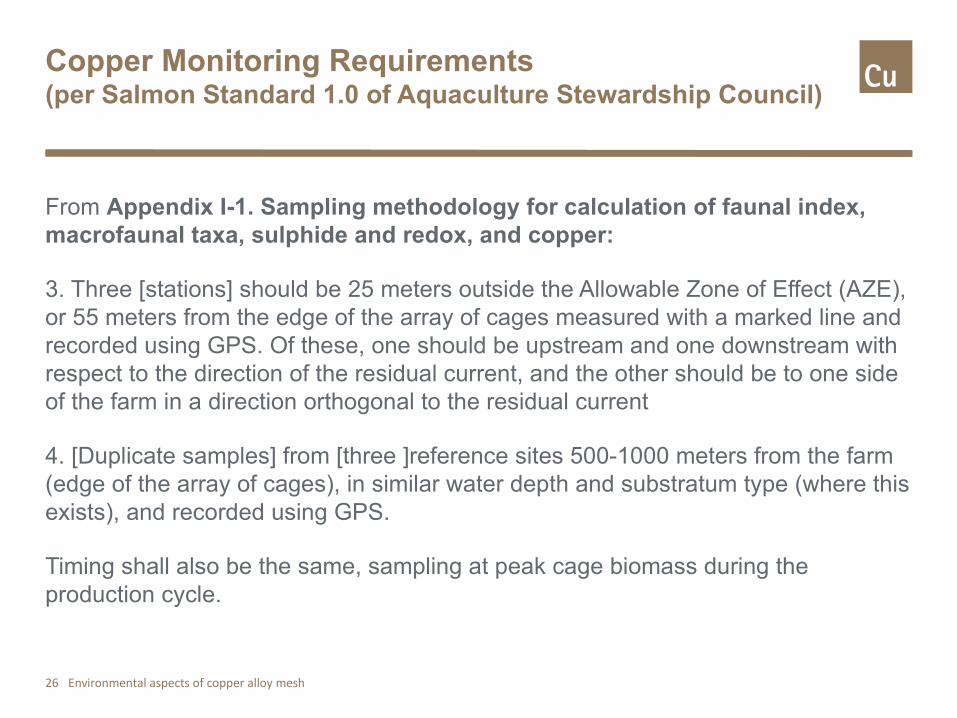
Copper Monitoring Requirements(per Salmon Standard 1.0 of Aquaculture Stewardship Council)
From Appendix I-1. Sampling methodology for calculation of faunal index, macrofaunal taxa, sulphide and redox, and copper:
3. Three [stations] should be 25 meters outside the Allowable Zone of Effect (AZE), or 55 meters from the edge of the array of cages measured with a marked line and recorded using GPS. Of these, one should be upstream and one downstream with respect to the direction of the residual current, and the other should be to one side of the farm in a direction orthogonal to the residual current
4. [Duplicate samples] from [three ]reference sites 500-1000 meters from the farm (edge of the array of cages), in similar water depth and substratum type (where this exists), and recorded using GPS.
Timing shall also be the same, sampling at peak cage biomass during the production cycle.
Environmental aspects of copper alloy mesh26

Sediment Sampling – Current Status
CAM Salmon Pilot Test Sites:
• All salmon sites previously used copper-based antifouling coatings on polymer nets
• These sites have elevated and variable copper background, due to past or current deployment nearby of AF-coated pens
• Thus, these sites unsuitable for identifying discrete accumulation from CAM pens
Sea Bass site in Vietnam:
• No copper antifoulants used in the past
• Full-life cycle 3 m x 3m x 3m pens deployed in April, 2014
• Sediment sampling planned
Environmental aspects of copper alloy mesh27

Additional analyses to determine Bioavailable copper in sediments
Sediments to be analyzed for:
• Total copper
• Simultaneously Extracted Metals (SEM)
• Acid-Volatile Sulfide (AVS)
• Organic Carbon
• Concentrations in <63 um fraction (Simpson, S. et al. CSIRO 2009)
Environmental aspects of copper alloy mesh28

How can you estimate how many CAM pens can safely be installed at a site?
Predicting the “Carrying Capacity” of a Fjord in British Columbia using MAMPEC29 Environmental aspects of copper alloy mesh
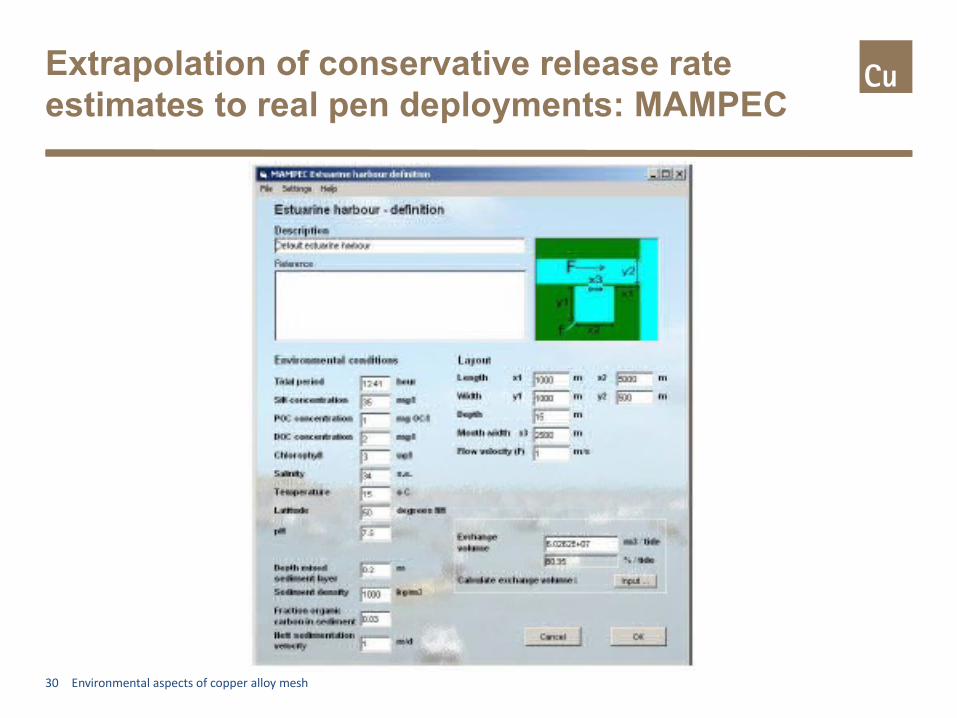
Extrapolation of conservative release rate estimates to real pen deployments: MAMPEC
30 Environmental aspects of copper alloy mesh
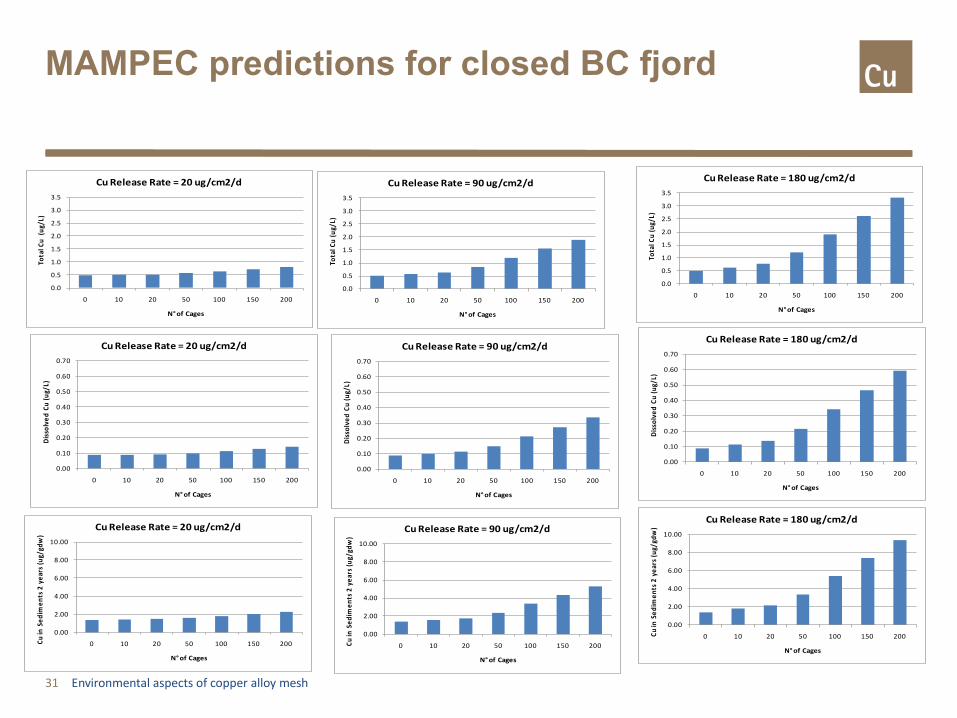
MAMPEC predictions for closed BC fjord
31
0.0
0.5
1.0
1.5
2.0
2.5
3.0
3.5
0 10 20 50 100 150 200
Tota
l Cu
(ug/
L)
N°of Cages
Cu Release Rate = 20 ug/cm2/d
0.0
0.5
1.0
1.5
2.0
2.5
3.0
3.5
0 10 20 50 100 150 200
Tota
l Cu
(ug/
L)
N° of Cages
Cu Release Rate = 90 ug/cm2/d
0.00
0.10
0.20
0.30
0.40
0.50
0.60
0.70
0 10 20 50 100 150 200
Dis
solv
ed C
u (u
g/L)
N° of Cages
Cu Release Rate = 20 ug/cm2/d
0.00
0.10
0.20
0.30
0.40
0.50
0.60
0.70
0 10 20 50 100 150 200
Dis
solv
ed C
u (u
g/L)
N° of Cages
Cu Release Rate = 90 ug/cm2/d
0.00
2.00
4.00
6.00
8.00
10.00
0 10 20 50 100 150 200Cu in
Sed
imen
ts 2
yea
rs (u
g/gd
w)
N° of Cages
Cu Release Rate = 20 ug/cm2/d
0.00
2.00
4.00
6.00
8.00
10.00
0 10 20 50 100 150 200Cu in
Sed
imen
ts 2
yea
rs (u
g/gd
w)
N° of Cages
Cu Release Rate = 90 ug/cm2/d
0.0
0.5
1.0
1.5
2.0
2.5
3.0
3.5
0 10 20 50 100 150 200
Tota
l Cu
(ug/
L)
N°of Cages
Cu Release Rate = 180 ug/cm2/d
0.00
0.10
0.20
0.30
0.40
0.50
0.60
0.70
0 10 20 50 100 150 200
Dis
solv
ed C
u (u
g/L)
N° of Cages
Cu Release Rate = 180 ug/cm2/d
0.00
2.00
4.00
6.00
8.00
10.00
0 10 20 50 100 150 200Cu in
Sed
imen
ts 2
yea
rs (u
g/gd
w)
N° of Cages
Cu Release Rate = 180 ug/cm2/d
Environmental aspects of copper alloy mesh
Conclusion: Releases of copper to the aquatic environment from CAM corrosion
• Even with 200 pens deployed in small bay, predicted increase in total copper likely < 0.5 mg/L.
• Bioavailable fraction (basis for regulatory standards in U.S. and EU) much lower still.
• Therefore, no likelihood of exceedance of marine environmental quality standards for copper.
32Source: Torres et al., in prep.
Environmental aspects of copper alloy mesh

Does the copper accumulate in the tissue of the fillets headed to market?How do copper levels in CAM-farmed fish compare to conventional pen-farmed salmon, or wild-caught salmon?
Tissue measurements in CAM-farmed Salmon
33 Environmental aspects of copper alloy mesh

Copper concentrations in salmon fillets
CAM Atl. Salmon (Chile)Wild BC Salmon
Farmed BC Atl. Salmon
0,00
0,20
0,40
0,60
0,80
1,00
1,20
1,40
1,60
minimum
mean
maximum
Copper Concentration,mg/kg, wet wt.
34
Sources: EcoSea, in prep. (Chilean salmon)Kelly, B.C. et al., 2008 (BC wild and farmed salmon)
Environmental aspects of copper alloy mesh34

Conclusion: No food safety issues
Copper concentrations in fillets of Atlantic Salmon harvested from copper-alloy mesh pens are no different from copper concentrations in :
• Wild-caught Pacific salmon
• Atlantic salmon raised in conventional nylon pens (with copper AntiFouling coatings)
35 Environmental aspects of copper alloy mesh35

Summary
Economics, growth performance and disease
• Lower incidents of disease
• Lower operating costs
• Less environmental impact
Environmental effects and food safety
• Reduced copper releases relevant to current coated nylon technology
• Copper levels in fish tissue—equivalent to wild caught salmon
36 Environmental aspects of copper alloy mesh

Thank You!
Environmental aspects of copper alloy mesh
For more information please contact:
Or visit:
CuAquaculture.org
37