
Dual-Mode Tumor Imaging Using Probes That Are ... - MDPI
87
Citation: Subasinghe, S.A.A.S.; Pautler, R.G.; Samee, M.A.H.; Yustein, J.T.; Allen, M.J. Dual-Mode Tumor Imaging Using Probes That Are Responsive to Hypoxia-Induced Pathological Conditions. Biosensors 2022, 12, 478. https://doi.org/ 10.3390/bios12070478 Received: 19 May 2022 Accepted: 26 June 2022 Published: 30 June 2022 Publisher’s Note: MDPI stays neutral with regard to jurisdictional claims in published maps and institutional affil- iations. Copyright: © 2022 by the authors. Licensee MDPI, Basel, Switzerland. This article is an open access article distributed under the terms and conditions of the Creative Commons Attribution (CC BY) license (https:// creativecommons.org/licenses/by/ 4.0/). biosensors Review Dual-Mode Tumor Imaging Using Probes That Are Responsive to Hypoxia-Induced Pathological Conditions S. A. Amali S. Subasinghe 1 , Robia G. Pautler 2 , Md. Abul Hassan Samee 2 , Jason T. Yustein 3 and Matthew J. Allen 1, * 1 Department of Chemistry, Wayne State University, 5101 Cass Avenue, Detroit, MI 48202, USA; [email protected] 2 Department of Integrative Physiology, Baylor College of Medicine, Houston, TX 77030, USA; [email protected] (R.G.P.); [email protected] (M.A.H.S.) 3 Integrative Molecular and Biomedical Sciences and the Department of Pediatrics in the Texas Children’s Cancer and Hematology Centers and The Faris D. Virani Ewing Sarcoma Center, Baylor College of Medicine, Houston, TX 77030, USA; [email protected] * Correspondence: [email protected] Abstract: Hypoxia in solid tumors is associated with poor prognosis, increased aggressiveness, and strong resistance to therapeutics, making accurate monitoring of hypoxia important. Several imaging modalities have been used to study hypoxia, but each modality has inherent limitations. The use of a second modality can compensate for the limitations and validate the results of any single imaging modality. In this review, we describe dual-mode imaging systems for the detection of hypoxia that have been reported since the start of the 21st century. First, we provide a brief overview of the hallmarks of hypoxia used for imaging and the imaging modalities used to detect hypoxia, including optical imaging, ultrasound imaging, photoacoustic imaging, single-photon emission tomography, X-ray computed tomography, positron emission tomography, Cerenkov radiation energy transfer imaging, magnetic resonance imaging, electron paramagnetic resonance imaging, magnetic particle imaging, and surface-enhanced Raman spectroscopy, and mass spectrometric imaging. These overviews are followed by examples of hypoxia-relevant imaging using a mixture of probes for complementary single-mode imaging techniques. Then, we describe dual-mode molecular switches that are responsive in multiple imaging modalities to at least one hypoxia-induced pathological change. Finally, we offer future perspectives toward dual-mode imaging of hypoxia and hypoxia- induced pathophysiological changes in tumor microenvironments. Keywords: dual-mode imaging; hypoxia; molecular imaging; tumor microenvironment 1. Introduction Hypoxia occurs as a consequence of inadequate delivery of oxygen to living cells [1,2], and it is a prognostic biomarker of several diseases including heart arrhythmia [3], Alzheimer’s disease [4,5], and cancer [6–9]. With cancer, hypoxia plays a critical role in solid tumors that possess rapidly proliferating abnormal cells with fast metabolic rates. Oxidative stress is the imbalance between the production and detoxification of reactive oxygen species that occurs as one of the major consequences of hypoxia [10]. As tumors expand, the distance between cells and blood vessels increases, and when tumors outgrow blood supply, the demand for oxygen is not satisfied by oxygen supply. Cells located roughly 150 μm beyond functioning blood vessels usual become necrotic due to lack of oxygen [11], and three distinct regions are observed in most solid tumors: normoxic (rapidly proliferating viable cells located close to blood vessels, pO 2 > 2%), hypoxic (viable cells that are capable of surviving at a low oxygen concentration, pO 2 ≤ 2%), and anoxic (mostly composed of dead cells without oxygen) [12]. To adapt to a dwindling supply of oxygen and nutrients, hypoxic cells activate a family of transcription factors, called hypoxia-inducible factors Biosensors 2022, 12, 478. https://doi.org/10.3390/bios12070478 https://www.mdpi.com/journal/biosensors
-
Upload
khangminh22 -
Category
Documents
-
view
0 -
download
0
Transcript of Dual-Mode Tumor Imaging Using Probes That Are ... - MDPI

Citation: Subasinghe, S.A.A.S.;
Pautler, R.G.; Samee, M.A.H.; Yustein,
J.T.; Allen, M.J. Dual-Mode Tumor
Imaging Using Probes That Are
Responsive to Hypoxia-Induced
Pathological Conditions. Biosensors
2022, 12, 478. https://doi.org/
10.3390/bios12070478
Received: 19 May 2022
Accepted: 26 June 2022
Published: 30 June 2022
Publisher’s Note: MDPI stays neutral
with regard to jurisdictional claims in
published maps and institutional affil-
iations.
Copyright: © 2022 by the authors.
Licensee MDPI, Basel, Switzerland.
This article is an open access article
distributed under the terms and
conditions of the Creative Commons
Attribution (CC BY) license (https://
creativecommons.org/licenses/by/
4.0/).
biosensors
Review
Dual-Mode Tumor Imaging Using Probes That Are Responsiveto Hypoxia-Induced Pathological ConditionsS. A. Amali S. Subasinghe 1 , Robia G. Pautler 2 , Md. Abul Hassan Samee 2, Jason T. Yustein 3
and Matthew J. Allen 1,*
1 Department of Chemistry, Wayne State University, 5101 Cass Avenue, Detroit, MI 48202, USA;[email protected]
2 Department of Integrative Physiology, Baylor College of Medicine, Houston, TX 77030, USA;[email protected] (R.G.P.); [email protected] (M.A.H.S.)
3 Integrative Molecular and Biomedical Sciences and the Department of Pediatrics in the Texas Children’sCancer and Hematology Centers and The Faris D. Virani Ewing Sarcoma Center, Baylor College of Medicine,Houston, TX 77030, USA; [email protected]
* Correspondence: [email protected]
Abstract: Hypoxia in solid tumors is associated with poor prognosis, increased aggressiveness,and strong resistance to therapeutics, making accurate monitoring of hypoxia important. Severalimaging modalities have been used to study hypoxia, but each modality has inherent limitations.The use of a second modality can compensate for the limitations and validate the results of anysingle imaging modality. In this review, we describe dual-mode imaging systems for the detection ofhypoxia that have been reported since the start of the 21st century. First, we provide a brief overviewof the hallmarks of hypoxia used for imaging and the imaging modalities used to detect hypoxia,including optical imaging, ultrasound imaging, photoacoustic imaging, single-photon emissiontomography, X-ray computed tomography, positron emission tomography, Cerenkov radiation energytransfer imaging, magnetic resonance imaging, electron paramagnetic resonance imaging, magneticparticle imaging, and surface-enhanced Raman spectroscopy, and mass spectrometric imaging. Theseoverviews are followed by examples of hypoxia-relevant imaging using a mixture of probes forcomplementary single-mode imaging techniques. Then, we describe dual-mode molecular switchesthat are responsive in multiple imaging modalities to at least one hypoxia-induced pathologicalchange. Finally, we offer future perspectives toward dual-mode imaging of hypoxia and hypoxia-induced pathophysiological changes in tumor microenvironments.
Keywords: dual-mode imaging; hypoxia; molecular imaging; tumor microenvironment
1. Introduction
Hypoxia occurs as a consequence of inadequate delivery of oxygen to living cells [1,2],and it is a prognostic biomarker of several diseases including heart arrhythmia [3], Alzheimer’sdisease [4,5], and cancer [6–9]. With cancer, hypoxia plays a critical role in solid tumorsthat possess rapidly proliferating abnormal cells with fast metabolic rates. Oxidative stressis the imbalance between the production and detoxification of reactive oxygen species thatoccurs as one of the major consequences of hypoxia [10]. As tumors expand, the distancebetween cells and blood vessels increases, and when tumors outgrow blood supply, thedemand for oxygen is not satisfied by oxygen supply. Cells located roughly 150 µm beyondfunctioning blood vessels usual become necrotic due to lack of oxygen [11], and threedistinct regions are observed in most solid tumors: normoxic (rapidly proliferating viablecells located close to blood vessels, pO2 > 2%), hypoxic (viable cells that are capable ofsurviving at a low oxygen concentration, pO2 ≤ 2%), and anoxic (mostly composed ofdead cells without oxygen) [12]. To adapt to a dwindling supply of oxygen and nutrients,hypoxic cells activate a family of transcription factors, called hypoxia-inducible factors
Biosensors 2022, 12, 478. https://doi.org/10.3390/bios12070478 https://www.mdpi.com/journal/biosensors

Biosensors 2022, 12, 478 2 of 87
(HIFs) [13,14]. These factors, particularly hypoxia-inducible factor-1 (HIF-1), result inunique heterogenous tumor microenvironments compared to non-hypoxic cells as a resultof altering the metabolic activity of hypoxic cells [15]. Tumor microenvironments havecharacteristic pathophysiological parameters, including low extracellular pH (<7.4) [16,17];elevated levels of reactive oxygen [18,19], nitrogen [20,21], and sulfur [22,23] species; redoximbalance [24,25]; and accumulation of some inorganic ions (Figure 1) [26]. Moreover,these changes stabilize HIFs, further promoting tumor growth and eventually increasingresistance to radiotherapy and chemotherapy [27,28]. Therefore, the monitoring of hypoxiaand oxidative stress is a critical endeavor.
Biosensors 2022, 12, x FOR PEER REVIEW 2 of 86
oxygen and nutrients, hypoxic cells activate a family of transcription factors, called hy-poxia-inducible factors (HIFs) [13,14]. These factors, particularly hypoxia-inducible fac-tor-1 (HIF-1), result in unique heterogenous tumor microenvironments compared to non-hypoxic cells as a result of altering the metabolic activity of hypoxic cells [15]. Tumor mi-croenvironments have characteristic pathophysiological parameters, including low extra-cellular pH (<7.4) [16,17]; elevated levels of reactive oxygen [18,19], nitrogen [20,21], and sulfur [22,23] species; redox imbalance [24,25]; and accumulation of some inorganic ions (Figure 1) [26]. Moreover, these changes stabilize HIFs, further promoting tumor growth and eventually increasing resistance to radiotherapy and chemotherapy [27,28]. There-fore, the monitoring of hypoxia and oxidative stress is a critical endeavor.
Figure 1. Schematic representation of regions of a tumor (left) and chemicals that are overproduced in hypoxic regions (right).
Tumor hypoxia can be measured using O2 needle electrodes or imaging methods [29–32]. Needle electrodes are invasive and are limited in accuracy based on their placement in the tumor—they do not give a full tumor profile. Noninvasive detection of hypoxic tumors that are located deep within tissues is possible only with imaging methods, but each imaging method is limited by properties inherent to the method. For example, fluo-rescence imaging is highly sensitive, but due to light absorption and scattering, this mo-dality has limited depth penetration [33].
Individual imaging modalities can be improved with respect to signal enhancement and specificity through the use of probes or contrast agents, and an emerging field of bi-omedicine involves the use of responsive probes and contrast agents with imaging mo-dalities to characterize tumors [34–36]. These exogenous molecules often change their structure and chemical properties in response to hypoxia or hypoxia-induced changes in tumor microenvironments. Responsive imaging probes are studied with imaging modal-ities including positron emission tomography (PET), single-photon emission tomography (SPECT), and X-ray computed tomography (X-ray CT) because these imaging modalities possess nearly unlimited depth penetration [37], despite involving ionizing radiation that could damage cells [38,39]. Responsive contrast agents are also studied with magnetic res-onance imaging (MRI) and ultrasound imaging to characterize hypoxic environments without the use of ionizing radiation. It is important to study each of these modalities because the orthogonal advantages and limitations of the modalities make them useful in different environments, and combinations of imaging modalities with distinct properties can overcome the limitations of any single modality, including the limitation of concen-tration-dependent probe response [40].
Figure 1. Schematic representation of regions of a tumor (left) and chemicals that are overproducedin hypoxic regions (right).
Tumor hypoxia can be measured using O2 needle electrodes or imaging methods [29–32].Needle electrodes are invasive and are limited in accuracy based on their placement in thetumor—they do not give a full tumor profile. Noninvasive detection of hypoxic tumors thatare located deep within tissues is possible only with imaging methods, but each imagingmethod is limited by properties inherent to the method. For example, fluorescence imagingis highly sensitive, but due to light absorption and scattering, this modality has limiteddepth penetration [33].
Individual imaging modalities can be improved with respect to signal enhancementand specificity through the use of probes or contrast agents, and an emerging field ofbiomedicine involves the use of responsive probes and contrast agents with imagingmodalities to characterize tumors [34–36]. These exogenous molecules often change theirstructure and chemical properties in response to hypoxia or hypoxia-induced changes intumor microenvironments. Responsive imaging probes are studied with imaging modali-ties including positron emission tomography (PET), single-photon emission tomography(SPECT), and X-ray computed tomography (X-ray CT) because these imaging modalitiespossess nearly unlimited depth penetration [37], despite involving ionizing radiation thatcould damage cells [38,39]. Responsive contrast agents are also studied with magneticresonance imaging (MRI) and ultrasound imaging to characterize hypoxic environmentswithout the use of ionizing radiation. It is important to study each of these modalitiesbecause the orthogonal advantages and limitations of the modalities make them usefulin different environments, and combinations of imaging modalities with distinct prop-erties can overcome the limitations of any single modality, including the limitation ofconcentration-dependent probe response [40].

Biosensors 2022, 12, 478 3 of 87
In this review, we describe dual-mode imaging methods reported for the ability tocharacterize hypoxia-relevant characteristics reported since the year 2000. For reviews ofsingle-mode detection of hypoxia, readers are referred elsewhere [41–47]. This article isdivided into two introductory sections—characteristics of oxidative stress and hypoxia thatcan be imaged and imaging modalities used to study hypoxia—followed by descriptions ofdual-modality imaging of hypoxia using cocktails of probes in combination with multipleimaging modalities and then dual-modality imaging of hypoxia with multimodal probesfor multiple imaging modalities. Thoughts for the future of the field close the article.
2. Hypoxia-Mediated Pathophysiological Changes in the Tumor Microenvironment
In addition to low oxygen partial pressure (pO2 < 15 mmHg (pO2 ≤ 2%)) [48], thereare several other changes in cellular homeostasis that are associated with hypoxia in tumors(Table 1). This section describes those pathophysiological conditions that are inherentto hypoxic environments that have been used for imaging. In this review, we focus onmultimodal imaging using probes that are responsive to changes in these conditions inaddition to pO2.
Table 1. Summary of hypoxia-mediated pathophysiological changes in tumor microenvironment.
Change Chemicals Involved Causes Consequences
pH Lactic acid, H+, CO2
Partial degradation of glucose,imbalance in ion exchange betweenintra- and extra-cellular environment.
Tumor acidosis.
Reactive species•OH, O2
•−, H2O2, NOX, NO•,ONOO−, H2S Partial cellular respiration. Promote tumor growth.
Redox buffers NADH, Glutathione, NADPH Production of reactive oxygen species. Promote tumor growth.
Inorganic ions Ca2+, PO43−, ATP
Incomplete cellular respiration,production of reactive oxygen species. Help survival of tumor cells.
2.1. Acidic pH (Acidosis)
A key regulator of hypoxia, HIF-1, upregulates the expression of glucose transporters,and as a consequence, the rate of glucose uptake into hypoxic cells is fast relative tothat of nonhypoxic cells [49–51]. HIF-1 also increases the gene expression involved inthe enzymatic breakdown of glucose into pyruvate and the conversion of pyruvate intolactate [52]. Lactic acid is eventually released into the extracellular matrix, resultingin acidosis. There are multiple pathways for intracellular glucose metabolism [53,54];however, in hypoxia, HIF-1 promotes the glycolytic breakdown of glucose. Additionally,HIF-1 indirectly inhibits the enzymatic activity of pyruvate dehydrogenase that is necessaryto convert pyruvate into acetyl-CoA [55,56]. Production of acetyl-CoA from pyruvate isthe first step of the citric acid cycle that occurs in mitochondria. The citric acid cycle isthe main mechanism that provides electrons to the electron transport chain; consequently,mitochondria do not function at their maximum levels under hypoxic conditions. Toreduce the accumulation of pyruvate and nicotinamide adenine dinucleotide (NADH),HIF-1 induces lactate dehydrogenase, an enzyme needed to convert pyruvate into lactatewhile consuming NADH [57,58]. Although the generation of lactate is the main pathway toreducing the pH of the tumor microenvironment, other metabolic reactions also contributeto acidosis [59–69]. Probes that are responsive to pH or the products or intermediatesof the biochemical pathways associated with acidosis are potentially useful in the studyof hypoxia.
2.2. Aberrant Levels of Reactive Chemical Species
Reactive oxygen species are formed as byproducts of aerobic respiration and themajor source of reactive oxygen species in cells is the mitochondria [70–72]. Some reactiveoxygen species are reactive radicals, including the hydroxyl radical (•OH) and superoxide

Biosensors 2022, 12, 478 4 of 87
radical (O2•−), and comparatively less-reactive molecules including hydrogen peroxide
(H2O2) [73]. Reactive oxygen species are cytotoxic and short-lived and, therefore, nearlyinstantaneously converted into less-reactive molecules as they form. In healthy cells, thedecomposition of reactive oxygen species is mediated by antioxidants including glutathioneand N-acetyl cysteine resulting in homeostasis between the generation and decompositionof reactive oxygen species with a slight favoring of antioxidant activity to prevent oxidativedamage to cells [74–76]. However, HIF-1 activates enzymes, including oxidases andhydroxylases, and these enzymes release reactive oxygen species as byproducts [77]. Forexample, HIFs promote the activity of the nicotinamide adenine dinucleotide phosphateoxidase (NOX) enzyme complex that catalyzes the production of superoxide, protons, andNADP+, while consuming oxygen [78].
Abnormal quantities of reactive nitrogen species are also distinct biomarkers of tumormicroenvironments [79,80]. Hypoxia induces the regulation of some isoforms of nitricoxide synthase and the release of nitric oxide radicals (NO•) [81–83]. Excess productionof nitric oxide is detrimental when it reacts with superoxide to form large amounts ofperoxynitrite (ONOO−) [84–86]. In healthy cells, low levels of ONOO− are beneficialand regulate apoptosis. In tumor cells, excessive amounts of ONOO− promote tumorimmunosuppression [87], and consequently, accelerate tumor growth [88]. Therefore,imaging of reactive nitrogen species is a target for detecting and monitoring hypoxictumors.
In addition to reactive oxygen and nitrogen species, oxidative stress also promotesthe synthesis of reactive sulfur species including H2S via non-enzymatic pathways [89,90].H2S serves as an antioxidant to protect hypoxic cells from reactive oxygen and nitrogenspecies [91,92]. Therefore, both reactive species and the chemicals that are responsive toreactive species could be used as markers of hypoxia for imaging probes.
2.3. Elevated Levels of Cellular Redox Buffers
Redox homeostasis is tightly regulated in healthy cells by redox buffers includingglutathione, thioredoxin, and NADPH [93–95]. As a defense against the production ofreactive species in hypoxic cells, HIFs increase the production of antioxidants includingNADPH and glutathione [96]. These antioxidants buffer reactive oxygen and nitrogenspecies resulting in less-reactive molecules and, thus, adaptation to oxidative stress [97,98].Additionally, H2S increases the concentration of glutathione, resulting in the scavenging ofH2O2 and reducing the accumulation of reactive oxygen species [99,100]. Furthermore, oneof the consequences of upregulated glycolysis and NADPH synthesis is the generation oflarge concentrations of glutathione. Therefore, elevated levels of glutathione and NADPHare major biomarkers of hypoxic tumors. The accumulation of reducing molecules, includ-ing NAD+, is a consequence of oxidative stress [101]. Necrotic cells leach these components,making the tumor extracellular matrix more reducing than the intracellular matrix [102,103].Therefore, molecules that respond to redox regulatory molecules are important probes forimaging hypoxia.
2.4. Accumulation of Inorganic Ions
The imbalance between influx and efflux of Ca2+ in cells occurs as a consequence of thegeneration of reactive oxygen species in cells under oxidative stress, and studies have shownthat Ca2+ ions accumulate in hypoxic tissues [104]. Furthermore, upon low oxygen supply,the major energy currency of cells, adenosine triphosphate (ATP), is hydrolyzed to poweroxidative phosphorylation and glycolysis, resulting in an increase in the concentration ofPO4
3− in cells. Consequently, hypoxic cells are usually rich in phosphate compared tohealthy cells [105,106]. Therefore, probes that are responsive to these inorganic ions couldbe used as imaging agents for hypoxia.

Biosensors 2022, 12, 478 5 of 87
3. Types of Imaging Modalities
The hypoxia-induced pathological changes described in the previous section can bedetected using various imaging modalities [107–116]. Although each method has its ownadvantages and limitations with respect to accurate detection of hypoxia, single-modedetection methods have been widely used to provide details about hypoxia-induced patho-physiological changes over the past few decades [117,118]. In this section, we summarizecommon imaging modalities (Table 2) that are currently used to detect and study hypoxiaand cancer.
Table 2. Summary of imaging modalities and their properties frequently used for tumor imaging.
Modality Type of Information SpatialResolution (mm)
PenetrationDepth
Probe/AgentSensitivity References
Optical anatomical or tracer 0.1–10 <1 cm 10−9–10−12 M [119–123]
Ultrasound anatomical or tracer 0.01–0.1 mm to cm 10−12 M [123,124]
SPECT 1 tracer 8–10 (clinical)1–2 (preclinical) unlimited 10−10–10−11 M [123,125]
X-ray CT 2 anatomical or tracer0.5–1 (clinical)
0.05–0.2(preclinical)
unlimited not determined [123,126,127]
PET 3 tracer 5–7 (clinical)1–2 (preclinical) unlimited 10−11–10−12 M [123,125]
MRI 4 anatomical or tracer~1 (clinical)
0.025–0.1(preclinical)
unlimited 10−3–10−5 M [123,128,129]
CRET 5 tracer mm unlimited 10−11–10−12 M [123,125,130]
MPI 6 tracer 1 mm unlimited 10−9 M [131,132]
EPRI 7 tracer µm nm 104 spins per voxel(~100 zmol)
[133]
MSI 8 surface imaging µm mm to µm ppm [134]
SERS 9 surface imaging mm ~5 mm 10−12–10−15 M [123]1 single-photon emission tomography; 2 X-ray computed tomography; 3 positron emission tomography; 4 magneticresonance imaging, 5 Cerenkov radiation energy transfer, 6 magnetic particle imaging, 7 electron paramagnetic res-onance imaging, 8 mass spectrometric imaging, 9 surface-enhanced Raman spectroscopy. (M = molarity; mol/L).
3.1. Optical Imaging
Optical imaging is a powerful tool that can visualize subcellular morphologies basedon the use of molecules that absorb and emit light [135]. Optical imaging probes de-scribed in this review for tumor imaging are fluorescent materials (for example, organicfluorophores and quantum dots) and luminescent probes (for example, lanthanide lu-minophores). With long-lifetime luminophores, the sensitivity of optical imaging can beincreased using time-gated imaging [136,137]. However, scattering and absorbance occurwhen light travels through media; consequently, optical imaging is not an efficient methodto image deep into tissues. In addition to luminescent probes, colorimetric imaging can beused in detecting cellular biomarkers. This modality involves compounds that change colorin response to stimuli and, consequently, are used to generate pictures of the environment.
3.2. Ultrasound Imaging
Ultrasound imaging involves the use of sound waves with frequencies above the upperaudible limit of human hearing (>20,000 Hz) [138]. After sending ultrasound pulses intotissue using a probe, ultrasound echoes that vary with the properties of tissues are turnedinto images. There four different modes of ultrasound are used in current medical imaging.These include A-mode, B-mode, M-mode, and Doppler mode [139]. Examples described

Biosensors 2022, 12, 478 6 of 87
in this manuscript are based on B-mode (a two-dimensional ultrasound image displaycomposed of bright dots representing the ultrasound echoes) [140] and Doppler mode(estimate the blood flow through blood vessels by bouncing high-frequency ultrasoundwaves off circulating red blood cells) [141]. Ultrasound is usually used to image softtissues and organs including muscles, blood vessels, heart, and brain [142–146]. Becauseultrasound uses sound waves, it is generally considered to be a noninvasive methodof imaging. Sometimes gas-filled microspheres (microbubbles) with specific acousticproperties are used to enhance contrast in ultrasound images [147].
3.3. Photoacoustic (Optoacoustic) Imaging
Photoacoustic imaging, also known as multispectral optoacoustic tomography (MSOT),is an emerging technique that uses light and sound waves to generate images. Optical en-ergy (for example, pulsed laser light) is used to excite endogenous (for example, hemoglobinor melanin) or exogenous (for example, MnO2 nanoparticles) chromophores that undergothermoelastic expansion leading to the generation of pressure waves that can be detectedusing ultrasound transducers [148]. Photoacoustic imaging is not a sensitive method com-pared to fluorescence-based methods, but because the scattering of sound waves in tissue isreduced compared to light waves, photoacoustic imaging offers a contrast in tissues thickerthan those that can be imaged using purely optical methods [149]. The oxy-hemo mode isused in photoacoustic imaging to measure oxygenation saturation and hemoglobin levelsin oxygenated and deoxygenated blood in the tissue area or volume [150–153].
3.4. Single-Photon Emission Computed Tomography (SPECT)
SPECT is a medical imaging technique that is based on molecular probes labeled withgamma-emitting radionuclides distributed in tissues and organs. Some of the gammaray-emitting radioactive tracers used in SPECT include iodine-123, technetium-99 m, andfluorine-18 [154,155]. Based on biodistribution properties, radiopharmaceuticals are ac-cumulated in different organs or tissues. After administering SPECT probes, scintillationcamera systems are used to trace the probes via gamma rays that are emitted from decay-ing probes accumulated in hypoxic areas. Although ionizing gamma radiation is used,SPECT is a promising imaging method in terms of high sensitivity and practically lim-itless depth penetration that makes it a vital molecular imaging modality in preclinicaland clinical imaging of not only tumors but also neurodegenerative diseases and cardiacfunction [156–159].
3.5. X-ray Computed Tomography (X-ray CT)
X-ray CT is a noninvasive imaging modality that can be used to obtain detailed three-dimensional anatomical images [160,161]. Narrow beams of X-rays pass through samples,and an unattenuated portion of X-rays is detected using digital detectors located directlyopposite the source. X-ray CT is used to image complex bone fractures; the presence oftumors in the lungs, and the presence of blood clots, hemorrhages, and injuries in thebrain [162–164]. Dense structures can be imaged with X-ray CT, but soft tissues are difficultto observe. Probes with large electron densities that interact with X-rays can be usedto enhance contrast, and these probes often include iodine or heavy metals includinggold [165–167]. The largest limitation of X-ray CT is the ionizing radiation exposureto patients.
3.6. Positron Emission Tomography (PET)
PET is an imaging method based on the detection of distribution of radiopharmaceuti-cals labeled with a positron (β+)-emitting radionuclides, including fluorine-18, copper-64,and gallium-68 [168]. Positrons interact with electrons to annihilate, resulting in twogamma rays emitted at 180◦ from each other that are detected and used to produce im-ages [169]. PET is a sensitive and noninvasive method that offers practically unlimiteddepth penetration. The rate of consumption of glucose (18F-labeled), blood flow, and oxy-

Biosensors 2022, 12, 478 7 of 87
gen consumption are some of the main biomedical applications of PET [170–172]. Therefore,PET is also used to study hypoxic tumors [173–175]. Although picomolar quantities ofradiopharmaceuticals are administered, patient exposure to high-energy gamma radiationis a limitation of this technique. In clinical imaging, the lack of anatomical informationprovided by PET promotes the use of combinations of imaging modalities to provideanatomical information to overlay with PET images.
3.7. Cerenkov Radiation Energy Transfer (CRET) Imaging
Cerenkov radiation is the result of a charged particle passing through a dielectricmedium at a speed greater than the phase velocity of light in that medium [176]. Cerenkovradiation occurs during PET imaging when the velocity of β+ particles exceeds the speedof light in the tissue [177]. Cerenkov radiation is usually readily absorbed by biomoleculesincluding hemoglobin, water, and cytochromes; however, surface-weighted images can beobtained using sensitive charge-coupled devices and optical cameras [178]. Furthermore,Cerenkov energy can be effectively transferred (CRET) to nanomaterials with large Stokesshifts to produce red-shifted photonic emissions. CRET imaging is relatively a new modalitythat has potential use in hypoxia research [179,180].
3.8. Magnetic Resonance Imaging (MRI) Including Chemical Exchange Saturation Transfer(CEST) and Paramagnetic Shift (PARASHIFT) Imaging
MRI is a noninvasive imaging modality that is used to visualize morphological andfunctional anatomy with practically unlimited depth penetration [181]. In MRI, samplesare exposed to a strong external magnetic field, and radiofrequency pulses are appliedto perturb the alignment of nuclear spins within the magnetic field. As spins relax uponceasing of the applied radiofrequency pulse, radiowaves are emitted, and these radiowavesare detected and used to generate three-dimensional images using gradients of the magneticfield [182]. Paramagnetic chemicals (contrast agents) are used to enhance the contrast ofMRI by increasing the relaxation rate of nuclear spins, and the efficiency of contrast agentsas a function of concentration is measured as longitudinal or transverse relaxivity (r1 or r2,respectively). Tissue environment, radiofrequency pulse sequences, and the presence ofcontrast agents all contribute to contrast in MRI. A variety of MRI-active nuclei are usedin biomedical applications [for example, hydrogen-1 (1H-MRI) and fluorine-19 (19F-MRI)]that possess unique advantages and limitations [183–189]. For example, 1H-MRI is moresensitive but possesses a considerable background signal compared to 19F-MRI [190].
CEST imaging is a variation of MRI that involves chemical probes that usually con-tain exchangeable protons, although other exchanging nuclei can be used with non-1H-MRI [191]. The exchanging protons are selectively saturated using radiofrequency pulses,and those saturated protons exchange with bulk water protons to transfer some of thesaturation to water, thus altering the water signal. Some CEST agents are sensitive tobiomarkers including oxygen concentration and pH; therefore, responsive CEST agents canbe used to study tumors [192–196].
PARASHIFT imaging is another variation of MRI that involves the use of metal com-plexes with an anisotropic magnetic susceptibility for direct detection of proton-containingtracer molecules having a negligible background signal in vivo [197]. Because anisotropicmagnetic susceptibilities of some paramagnetic metal ions including Dy3+, Tb3+, Pr3+, Tm3+,Tb3+, Fe2+, and Co2+ can shift the proton NMR signals of chelating ligands beyond thediamagnetic range of endogenous proton (water and fat in biological systems) resonances.PARASHIFT imaging agents can also shift resonances of nuclei other than 1H that includenuclei in chelating ligands. For example, some 19F-PARASHIFT imaging agents have beenused as sensitive probes for detecting overproduced chemicals during hypoxia includinghydrogen peroxide [198].

Biosensors 2022, 12, 478 8 of 87
3.9. Electron Paramagnetic Resonance Imaging (EPRI)
EPRI detects the magnetic resonance transitions between energy states of unpairedelectrons in an applied magnetic field using microwave radiation [199]. EPRI can probespecies with unpaired electrons including radicals and paramagnetic species. Biologicalsystems contain small amounts of paramagnetic species having short lifetimes that areintermediates of biochemical reactions. Therefore, usually, exogeneous spin probes areused to detect paramagnetic species in biological systems. These probes form paramagneticadducts in the presence of the species of interest to enable quantification and localizationof the species. EPRI can also be used to image environmental parameters including par-tial pressure of oxygen, pH, and temperature [200,201]. These physical parameters alterthe resonance frequencies of the exogenous spin probes. Although EPRI is a sensitivemethod because of the specificity of EPRI towards paramagnetic species, instrumental chal-lenges associated with EPRI make the technique less commonly used than other imagingmethods [202].
3.10. Magnetic Particle Imaging (MPI)
MPI is a noninvasive, quantitative, three-dimensional imaging technique that offerslarge signal-to-noise ratios [203,204]. Unlike structural imaging modalities–including 1H-MRI, ultrasound imaging, and X-ray CT–MPI is a tracer imaging technique that directlymeasures the amount of tracer [for example, superparamagnetic iron oxide (SPIO) nanopar-ticles] [205]. MPI uses two magnets pointed at each other to produce a magnetic fieldgradient with a field-free region at the center. The field-free region is rapidly moved acrossa sample to produce an image. Magnetic field gradients used in MPI can saturate themagnetization of SPIO nanoparticles outside the field-free region. The magnetization ofSPIO nanoparticles changes nonlinearly as the field-free region transverses the location ofan SPIO nanoparticle. This time-varying magnetization induces a voltage in the receivercoil that is linearly proportional to the number of nanoparticles and, thereby, enables thequantification of nanoparticles. MPI is a sensitive (detecting nanograms of iron per voxel)imaging modality [204].
3.11. Raman Spectroscopy and Surface-Enhanced Raman Spectroscopy (SERS)
Raman spectroscopy is a noninvasive and label-free optical imaging technique withlarge spatial resolution [206,207]. In biomedical imaging, it is based on the use of laserlight that is inelastically scattered from biological samples. The difference in wavelengthsbetween the incident and scattered photons depends on the molecular bonds present in thesample. Therefore, a detailed biochemical fingerprint of the sample can be obtained, en-abling the identification of molecular differences between each molecule. Major limitationsassociated with Raman spectroscopy are relatively weak signal intensities and possiblethermal damage to samples due to long acquisition times [208,209]. To ameliorate the signalintensity issue, metal nanostructures (for example, gold nanoparticles) are mixed withbiological samples [210]. An enhancement of the Raman signal occurs as a consequenceof the aggregation of metal nanostructures. Enhancement of Raman signal via the use ofmetal nanostructures is known as surface-enhanced Raman spectroscopy (SERS). SERS canenhance the Raman signal up to 1015-fold [211,212]; therefore, SERS can be used to analyzesmall concentrations. Compared to Raman spectroscopy, the shorter acquisition times andlower laser power used in SERS minimize thermal damage to samples [213]. However,SERS suffers from poor reproducibility due to plasmonic hot spots associated with metalnanostructures [214].
3.12. Mass Spectrometric Imaging
Mass spectrometric imaging is a powerful tool that can be used to obtain informa-tion about the spatial distribution of molecules in biological samples [215,216]. Withoutlabeling, mass spectrometric imaging can be used to image the distribution of a varietyof biomolecules including proteins, lipids, and glycans. In a thin section of a biological

Biosensors 2022, 12, 478 9 of 87
specimen, x and y coordinates are defined over the surface of the sample. A mass spectrom-eter is used to ionize molecules on the surface of the thin section, resulting in a collectionof mass spectra mapped to spatial coordinates of the section. After collecting the spectra,computational software is used to determine the intensities of the mass-to-charge ratios,and these intensities are combined to generate heat-map images that display the relativedistribution of specific mass-to-charge ratios over the surface of a sample. Tandem massspectrometry and databases can be used to identify specific mass-to-charge ratios and,therefore, can identify specific biomolecules present in a sample [217,218]. A relatively newmass spectrometric imaging method involves a laser ablation system combined with aninductively coupled plasma mass spectrometer (LA-ICP-MS) to visualize the distributionof elements of interest within solid samples in two or three dimensions [219–221]. Briefly,a laser pulse ablates a sample, and the aerosol of the ablated sample passes through thehigh-energy plasma to atomize and ionize the elements in the aerosol. The resulting ionsare transferred from the plasma to a mass analyzer to measure the intensity of elements ofinterest. These intensities correspond to the abundance of elements in the ablated sample.Although mass spectrometric imaging is promising, it is a destructive technique.
Each single imaging modality possesses inherent advantages and limitations. There-fore, it is desirable to combine multiple imaging modalities that contain complementaryadvantages to study hypoxic tumors while overcoming the limitations of each imagingmode and serving as a conformation for single-mode analyses.
4. Imaging Hypoxia with Multiple Probes and Multiple Modalities
In this section, we describe the use of dual- and multi-modal imaging modalitiesto detect hypoxia and hypoxia-related pathological conditions (Table 3). We describethe use of two imaging modalities followed by the use of three imaging modalities toimage hypoxia-relevant properties. Overall advantages of this method include the ability toobtain information about the tumor microenvironments, overcome limitations of individualmethods, and enhance the accuracy of details obtained from both imaging modalities.
Table 3. Summary of imaging hypoxia with multiple probes and multiple modalities.
Dual- or Multi-Modal Imaging Method Advantages Limitations
MRI and mass spectrometric imaging Surface imaging with high spatial resolution Invasive
Photoacoustic and ultrasound imaging Sensitive soft tissue imaging, good depthpenetration photostability of chromophores
MRI and SPECT imaging Deep tissue imaging, high spatial resolution Exposure to ionizing radiation
MRI and X-ray CT imaging Detailed anatomical imaging with highspatial resolution Exposure to ionizing radiation
MRI and PET imaging Anatomical and tracer imaging with highspatial resolution, deep tissue imaging Exposure to ionizing radiation
PET and X-ray CT imaging Tracer and anatomical imaging,highly sensitive Exposure to ionizing radiation
SERS and photoacoustic imaging Surface imaging, high sensitivity Photostability
MRI, EPRI, and PET imaging Detailed anatomical and tracer imaging Exposure to ionizing radiation
X-ray CT, MRI, and photoacoustic imaging Detailed anatomical and tracerimaging, sensitivity Exposure to ionizing radiation
Fluorescence, photoacoustic imaging,and MRI
Detailed anatomical and tracerimaging, sensitivity photostability of chromophores
4.1. MRI and Mass Spectrometric Imaging
MRI and mass spectrometric imaging are combined to extract the spatial distributionof biomolecules with a high resolution [222,223]. A combination of mass spectrometric

Biosensors 2022, 12, 478 10 of 87
imaging with MRI can potentially bridge the gap between the ex vivo and in vivo imagingtechniques [224]. Therefore, combined MRI and mass spectrometric imaging are powerfultools that can be used to study several diseases including cardiovascular diseases, infections,and cancer [225–231]. Laser ablation inductively coupled plasma mass spectrometry is asensitive method that can be used to determine metals and chemicals in biological environ-ments [232–235]. Therefore, laser ablation inductively coupled plasma mass spectrometry,combined with MRI provides a detailed understanding of the physiological characteristicsof the tumor microenvironment. New and co-workers reported a series of cobalt-containingtris(2-pyridylmethyl)amine pro-drugs with the varying charge for distribution and activityin three-dimensional tumor spheroids using laser ablation inductively coupled plasmamass spectrometry and MRI [236]. Out of all complexes that they studied, complex 1 wasselective for hypoxic regions of cells both in accumulation and activation. This observationwas attributed to the fact that a CoIII-containing complex can reduce to a CoII-containingcomplex and favorably accumulate in reducing acidic environments that are characteristicof hypoxic regions of the tumors. Furthermore, electroneutrality obtained upon protonationof the carboxylic group of 1 in the acidic extracellular region facilitates the accumulation of1 in the inner hypoxic regions (Figure 2) [236]. As supported by MRI studies, 1 showed anincrease in MR signal intensity in the inner regions of hypoxic tumors. This observationcan be attributed to the reduction in diamagnetic CoIII to paramagnetic CoII in reducingenvironments which are known to be prevalent in hypoxic tumors.
Biosensors 2022, 12, x FOR PEER REVIEW 10 of 86
PET and X-ray CT imaging Tracer and anatomical imaging, highly sen-sitive
Exposure to ionizing radiation
SERS and photoacoustic imaging Surface imaging, high sensitivity Photostability MRI, EPRI, and PET imaging Detailed anatomical and tracer imaging Exposure to ionizing radiation
X-ray CT, MRI, and photoacoustic imaging
Detailed anatomical and tracer imaging, sensitivity
Exposure to ionizing radiation
Fluorescence, photoacoustic imag-ing, and MRI
Detailed anatomical and tracer imaging, sensitivity
photostability of chromophores
4.1. MRI and Mass Spectrometric Imaging MRI and mass spectrometric imaging are combined to extract the spatial distribution
of biomolecules with a high resolution [222,223]. A combination of mass spectrometric imaging with MRI can potentially bridge the gap between the ex vivo and in vivo imaging techniques [224]. Therefore, combined MRI and mass spectrometric imaging are powerful tools that can be used to study several diseases including cardiovascular diseases, infec-tions, and cancer [225–231]. Laser ablation inductively coupled plasma mass spectrometry is a sensitive method that can be used to determine metals and chemicals in biological environments [232–235]. Therefore, laser ablation inductively coupled plasma mass spec-trometry, combined with MRI provides a detailed understanding of the physiological characteristics of the tumor microenvironment. New and co-workers reported a series of cobalt-containing tris(2-pyridylmethyl)amine pro-drugs with the varying charge for dis-tribution and activity in three-dimensional tumor spheroids using laser ablation induc-tively coupled plasma mass spectrometry and MRI [236]. Out of all complexes that they studied, complex 1 was selective for hypoxic regions of cells both in accumulation and activation. This observation was attributed to the fact that a CoIII-containing complex can reduce to a CoII-containing complex and favorably accumulate in reducing acidic environ-ments that are characteristic of hypoxic regions of the tumors. Furthermore, electroneu-trality obtained upon protonation of the carboxylic group of 1 in the acidic extracellular region facilitates the accumulation of 1 in the inner hypoxic regions (Figure 2) [236]. As supported by MRI studies, 1 showed an increase in MR signal intensity in the inner re-gions of hypoxic tumors. This observation can be attributed to the reduction in diamag-netic CoIII to paramagnetic CoII in reducing environments which are known to be preva-lent in hypoxic tumors.
Figure 2. (A) Chemical structure of 1 in its CoIII oxidation state. (B) Laser ablation inductively cou-pled plasma mass spectrometric images of the control sample and tumor spheroid incubated with 1. (C) T1-weighted MR images of the control sample and tumor spheroid incubated with 1. Both laser ablation inductively coupled plasma mass spectrometric image and T1-weighted image of the tumor spheroid incubated with 1 showed accumulation of 1 in the inner hypoxic regions which is known to have a reducing and acidic environment. Adapted with permission from O’Neill, E. S.; Kaur, A.; Bishop, D. P.; Shishmarev, D.; Kuchel, P. W.; Grieve, S. M.; Figtree, G. A.; Renfrew, A. K.;
Figure 2. (A) Chemical structure of 1 in its CoIII oxidation state. (B) Laser ablation inductivelycoupled plasma mass spectrometric images of the control sample and tumor spheroid incubated with1. (C) T1-weighted MR images of the control sample and tumor spheroid incubated with 1. Both laserablation inductively coupled plasma mass spectrometric image and T1-weighted image of the tumorspheroid incubated with 1 showed accumulation of 1 in the inner hypoxic regions which is knownto have a reducing and acidic environment. Adapted with permission from O’Neill, E. S.; Kaur, A.;Bishop, D. P.; Shishmarev, D.; Kuchel, P. W.; Grieve, S. M.; Figtree, G. A.; Renfrew, A. K.; Bonnitcha, P.D.; New, E. J. Hypoxia-responsive cobalt complexes in tumor spheroids: laser ablation inductivelycoupled plasma mass spectrometry and magnetic resonance imaging studies. Inorg. Chem., 2017, 56,9860–9868. Copyright 2017 American Chemical Society [236].
4.2. Photoacoustic and Ultrasound Imaging
Current biomedical imaging uses the advantages of photoacoustic imaging withinherently co-registered high-frequency ultrasound imaging that enables accurate map-ping of tumors [237–239]. These advantages include the ability of ultrasound imaging toproduce anatomical data and the ability of photoacoustic imaging to sensitively detect light-absorbing molecules that are present in deep tissues with excellent resolution [240–242].Co-registration of photoacoustic imaging and ultrasound imaging provides optical contrastand high-resolution anatomical data. Because sound waves echo differently from fluid-fillbubbles (in contrast-enhanced ultrasound imaging) and solid masses, ultrasound can beused to distinguish tumors from healthy tissues. A study by Heuchel and co-workers

Biosensors 2022, 12, 478 11 of 87
used high-frequency ultrasound imaging and photoacoustic imaging to assess hypoxiaand tumor blood flow in murine models of intra-abdominal tumors including pancreaticand colon cancer [243]. They also observed a positive correlation of imaging data withimmunohistochemical evidence of hypoxia. The study is based on the measurement oftissue oxygen saturation based on hemoglobin and deoxyhemoglobin. Absorption spectraof hemoglobin differ with oxygenation. Dual-wavelength photoacoustic imaging can beused to separately measure tissue concentration of oxyhemoglobin and deoxyhemoglobinand therefore, can calculate focal tissue oxygen saturation. Thermoelastic waves that resultdue to optical excitation of molecules are detected by ultrasound receivers. Accordingly, hy-poxic, and non-hypoxic regions of subcutaneous pancreatic tumor-bearing murine modelswere imaged using combined photoacoustic and ultrasound imaging (Figure 3) [243].
Biosensors 2022, 12, x FOR PEER REVIEW 11 of 86
Bonnitcha, P. D.; New, E. J. Hypoxia-responsive cobalt complexes in tumor spheroids: laser ablation inductively coupled plasma mass spectrometry and magnetic resonance imaging studies. Inorg. Chem., 2017, 56, 9860–9868. Copyright 2017 American Chemical Society [236].
4.2. Photoacoustic and Ultrasound Imaging Current biomedical imaging uses the advantages of photoacoustic imaging with in-
herently co-registered high-frequency ultrasound imaging that enables accurate mapping of tumors [237–239]. These advantages include the ability of ultrasound imaging to pro-duce anatomical data and the ability of photoacoustic imaging to sensitively detect light-absorbing molecules that are present in deep tissues with excellent resolution [240–242]. Co-registration of photoacoustic imaging and ultrasound imaging provides optical con-trast and high-resolution anatomical data. Because sound waves echo differently from fluid-fill bubbles (in contrast-enhanced ultrasound imaging) and solid masses, ultrasound can be used to distinguish tumors from healthy tissues. A study by Heuchel and co-work-ers used high-frequency ultrasound imaging and photoacoustic imaging to assess hypoxia and tumor blood flow in murine models of intra-abdominal tumors including pancreatic and colon cancer [243]. They also observed a positive correlation of imaging data with immunohistochemical evidence of hypoxia. The study is based on the measurement of tissue oxygen saturation based on hemoglobin and deoxyhemoglobin. Absorption spectra of hemoglobin differ with oxygenation. Dual-wavelength photoacoustic imaging can be used to separately measure tissue concentration of oxyhemoglobin and deoxyhemoglobin and therefore, can calculate focal tissue oxygen saturation. Thermoelastic waves that re-sult due to optical excitation of molecules are detected by ultrasound receivers. Accord-ingly, hypoxic, and non-hypoxic regions of subcutaneous pancreatic tumor-bearing mu-rine models were imaged using combined photoacoustic and ultrasound imaging (Figure 3) [243].
Figure 3. Imaging of tumor hypoxia in subcutaneous pancreatic xenografts. (A) Representative oxy-hemo photoacoustic image of a hypoxic tumor. B-mode image (left panel) and oxygen saturation Figure 3. Imaging of tumor hypoxia in subcutaneous pancreatic xenografts. (A) Representativeoxy-hemo photoacoustic image of a hypoxic tumor. B-mode image (left panel) and oxygen saturationmap (oxy-hemo photoacoustic imaging, right panel). The heat map represents oxygen saturationlevel, ranging from 100% (red) to 0% (dark blue). The yellow dashed line defines the tumor region.(B) Representative hypoxia staining (brown color) of the same tumor. The black dashed line definesthe tumor region. (C) Representative hematoxylin and eosin staining of the same hypoxic tumor.(D) Representative oxy-hemo photoacoustic image of a non-hypoxic tumor. B-mode image (left panel)and oxygen saturation map oxy-hemo photoacoustic image (right panel). The heat map representsoxygen saturation level, ranging from 100% (red) to 0% (dark blue). The yellow dashed line definesthe tumor region. (E) Representative pimonidazole staining of the non-hypoxic tumor, which lacksbrown staining. The black line represents the tumor region. (F) Representative hematoxylin and eosinstaining of the non-hypoxic tumor. Adapted with permission from Gerling, M.; Zhao, Y.; Nania, S.;Norberg, K. J.; Verbeke, C. S.; Englert, B.; Kuiper, R. V.; Bergström, A.; Hassan, M.; Neesse, A.; Löhr, J.M.; Heuchel, R. L. Real-time assessment of tissue hypoxia in vivo with combined photoacoustics andhigh-frequency ultrasound. Theranostics, 2014, 4, 604 [243].

Biosensors 2022, 12, 478 12 of 87
High-frequency color Doppler imaging enables the visualization of blood flow withhigh resolution. Studies revealed that doppler ultrasound imaging can visualize blood flowwith high-resolution [244–247]. Keša and co-workers combined these properties of twoimaging modalities to study tumor oxygenation and vascularization in vivo during thegrowth of subcutaneously implanted patient-derived xenograft lymphomas (Figure 4) [248].They reported that this multi-modal ultrasound-photoacoustic imaging method offers anew approach for rapid and direct assessment of oxygen saturation of patient-derivedxenograft lymphomas without the use of exogenous contrast agents. Its high-resolutionnature provides details as fine as 50 µm, as demonstrated by the detection of blood flow.
Biosensors 2022, 12, x FOR PEER REVIEW 12 of 86
map (oxy-hemo photoacoustic imaging, right panel). The heat map represents oxygen saturation level, ranging from 100% (red) to 0% (dark blue). The yellow dashed line defines the tumor region. (B) Representative hypoxia staining (brown color) of the same tumor. The black dashed line defines the tumor region. (C) Representative hematoxylin and eosin staining of the same hypoxic tumor. (D) Representative oxy-hemo photoacoustic image of a non-hypoxic tumor. B-mode image (left panel) and oxygen saturation map oxy-hemo photoacoustic image (right panel). The heat map rep-resents oxygen saturation level, ranging from 100% (red) to 0% (dark blue). The yellow dashed line defines the tumor region. (E) Representative pimonidazole staining of the non-hypoxic tumor, which lacks brown staining. The black line represents the tumor region. (F) Representative hema-toxylin and eosin staining of the non-hypoxic tumor. Adapted with permission from Gerling, M.; Zhao, Y.; Nania, S.; Norberg, K. J.; Verbeke, C. S.; Englert, B.; Kuiper, R. V.; Bergström, A.; Hassan, M.; Neesse, A.; Löhr, J. M.; Heuchel, R. L. Real-time assessment of tissue hypoxia in vivo with com-bined photoacoustics and high-frequency ultrasound. Theranostics, 2014, 4, 604 [243].
High-frequency color Doppler imaging enables the visualization of blood flow with high resolution. Studies revealed that doppler ultrasound imaging can visualize blood flow with high-resolution [244–247]. Keša and co-workers combined these properties of two imaging modalities to study tumor oxygenation and vascularization in vivo during the growth of subcutaneously implanted patient-derived xenograft lymphomas (Figure 4) [248]. They reported that this multi-modal ultrasound-photoacoustic imaging method of-fers a new approach for rapid and direct assessment of oxygen saturation of patient-de-rived xenograft lymphomas without the use of exogenous contrast agents. Its high-reso-lution nature provides details as fine as 50 μm, as demonstrated by the detection of blood flow.
Figure 4. Representative set of anatomic images of a tumor recorded in B-mode and oxy-hemo mode (A,C,E). Different tissues (brighter shade and darker areas) correspond to photoacoustic panels (B,D,F) of small, medium, and large tumors and depict vital areas (brighter pixels in a B-mode and oxygenated areas in photoacoustic oxy-hemo mode are blue and red, respectively) and less oxygen-ated and necrotic areas inside tumors. Scale bar represents 1 mm. Adapted from Ultrasound in Med-icine and Biology, 47, Keša, P.; Pokorná, E.; Grajciarová, M.; Tonar, Z.; Vočková, P.; Trochet, P.; Ko-peček, M.; Jakša, R.; Šefc, L.; Klener, P. Quantitative in vivo monitoring of hypoxia and vasculariza-tion of patient-derived murine xenografts of mantle cell lymphoma using photoacoustic and ultra-sound imaging, 1099–1107, Copyright 2021, with permission from Elsevier [248].
Shah and co-workers reported a method to assist the co-registration of optoacoustic images with dynamic contrast-enhanced ultrasound images to study pre-clinical tumor
Figure 4. Representative set of anatomic images of a tumor recorded in B-mode and oxy-hemomode (A,C,E). Different tissues (brighter shade and darker areas) correspond to photoacousticpanels (B,D,F) of small, medium, and large tumors and depict vital areas (brighter pixels in aB-mode and oxygenated areas in photoacoustic oxy-hemo mode are blue and red, respectively)and less oxygenated and necrotic areas inside tumors. Scale bar represents 1 mm. Adapted fromUltrasound in Medicine and Biology, 47, Keša, P.; Pokorná, E.; Grajciarová, M.; Tonar, Z.; Vocková, P.;Trochet, P.; Kopecek, M.; Jakša, R.; Šefc, L.; Klener, P. Quantitative in vivo monitoring of hypoxia andvascularization of patient-derived murine xenografts of mantle cell lymphoma using photoacousticand ultrasound imaging, 1099–1107, Copyright 2021, with permission from Elsevier [248].
Shah and co-workers reported a method to assist the co-registration of optoacousticimages with dynamic contrast-enhanced ultrasound images to study pre-clinical tumormodels [249]. A spatial correlation was observed between the dynamic contrast-enhancedultrasound imaging properties and tumor blood oxygen saturation and hemoglobin asestimated using photoacoustic imaging. Photoacoustic imaging can detect hemoglobin andassess oxygenation. Total hemoglobin and blood oxygen saturation are important methodsto infer hypoxia and its spatial and temporal variation. Combined imaging performedusing a tumor modal showed that ultrasound image of the tumor hypoxic region is spatiallycorrelated with the optoacoustic imaging, which was used to determine blood-oxygensaturation and hemoglobin (Figure 5) [249].

Biosensors 2022, 12, 478 13 of 87
Biosensors 2022, 12, x FOR PEER REVIEW 13 of 86
models [249]. A spatial correlation was observed between the dynamic contrast-enhanced ultrasound imaging properties and tumor blood oxygen saturation and hemoglobin as estimated using photoacoustic imaging. Photoacoustic imaging can detect hemoglobin and assess oxygenation. Total hemoglobin and blood oxygen saturation are important methods to infer hypoxia and its spatial and temporal variation. Combined imaging per-formed using a tumor modal showed that ultrasound image of the tumor hypoxic region is spatially correlated with the optoacoustic imaging, which was used to determine blood-oxygen saturation and hemoglobin (Figure 5) [249].
Figure 5. (A) A reconstructed single wavelength multispectral optoacoustic tomography image of tumor-bearing mouse at 800 nm. The yellow dashed line indicates the tumor region. (B) The corre-sponding deconvoluted image, showing the distribution of hemoglobin and oxyhemoglobin com-ponents in blue and red, respectively. (C) An ultrasound image of the tumor-bearing mouse before microbubble injection. (D) The ultrasound image of the tumor 40 s after microbubble injection. (E) An overlay of the spectrally unmixed optoacoustic image on the ultrasound image after rigid regis-tration of the two images. (F) The graphic overlay on (E) to indicate the regions of interest analyzed, color-coded as red (blood vessel), purple dashed (upper rim), orange (upper body), light green dashed (core), dark green (lower body), and cyan dashed (lower rim). The yellow scale bars in (A) and (B) represent 5 mm. Adapted from Photoacoustics, 8, Shah, A.; Bush, N.; Box, G.; Eccles, S.; Bam-ber, J. Value of combining dynamic contrast-enhanced ultrasound and optoacoustic tomography for hypoxia imaging, 15–27, Copyright (2017), with permission from Elsevier [249].
Hasan and co-workers reported an ultrasound-guided photoacoustic imaging method to monitor tumor recurrence and therapy of a murine model of glioblastoma [250]. Because photoacoustic imaging can provide a three-dimensional map of tumor blood oxygen saturation by measuring oxygenated and deoxygenated hemoglobin pho-toacoustic imaging can be used to monitor the progress of photodynamic therapy and tumor recurrence. Photodynamic therapy consumes oxygen to generate cytotoxicity and thus causing changes in blood oxygen saturation. Therefore, by assessing blood oxygen saturation, hypoxic and normoxic tumors can be identified. The reported study distin-guishes oxygenated tumors and hypoxic tumors using ultrasound and photoacoustic im-aging. Imaging maps were spatially correlated with histological and immunofluorescence studies (Figure 6) [250].
Figure 5. (A) A reconstructed single wavelength multispectral optoacoustic tomography imageof tumor-bearing mouse at 800 nm. The yellow dashed line indicates the tumor region. (B) Thecorresponding deconvoluted image, showing the distribution of hemoglobin and oxyhemoglobincomponents in blue and red, respectively. (C) An ultrasound image of the tumor-bearing mousebefore microbubble injection. (D) The ultrasound image of the tumor 40 s after microbubble injection.(E) An overlay of the spectrally unmixed optoacoustic image on the ultrasound image after rigidregistration of the two images. (F) The graphic overlay on (E) to indicate the regions of interestanalyzed, color-coded as red (blood vessel), purple dashed (upper rim), orange (upper body), lightgreen dashed (core), dark green (lower body), and cyan dashed (lower rim). The yellow scale barsin (A,B) represent 5 mm. Adapted from Photoacoustics, 8, Shah, A.; Bush, N.; Box, G.; Eccles, S.;Bamber, J. Value of combining dynamic contrast-enhanced ultrasound and optoacoustic tomographyfor hypoxia imaging, 15–27, Copyright (2017), with permission from Elsevier [249].
Hasan and co-workers reported an ultrasound-guided photoacoustic imaging methodto monitor tumor recurrence and therapy of a murine model of glioblastoma [250]. Becausephotoacoustic imaging can provide a three-dimensional map of tumor blood oxygensaturation by measuring oxygenated and deoxygenated hemoglobin photoacoustic imagingcan be used to monitor the progress of photodynamic therapy and tumor recurrence.Photodynamic therapy consumes oxygen to generate cytotoxicity and thus causing changesin blood oxygen saturation. Therefore, by assessing blood oxygen saturation, hypoxic andnormoxic tumors can be identified. The reported study distinguishes oxygenated tumorsand hypoxic tumors using ultrasound and photoacoustic imaging. Imaging maps werespatially correlated with histological and immunofluorescence studies (Figure 6) [250].
4.3. MRI and SPECT Imaging
SPECT possesses excellent sensitivity and lower resolution compared to MRI whichhas greater resolution and lower sensitivity [251,252]. Therefore, dual-modal imagingusing SPECT and MRI exhibits both excellent sensitivity and high resolution. MnII-containing contrast agents are regarded as promising alternatives to GdIII-containing con-trast agents [253–255]. Zhou and co-workers reported the combining of MnOx-containingmesoporous silica nanoparticles with 99mTc to achieve SPECT-MRI dual-modal imagingcontrast agents [256]. MnOx nanoparticles dispersed within the mesopores of mesoporoussilica nanoparticles to synthesize Mn-based contrast agents for T1-weighted MRI. The pHof the tumor microenvironment is lower than that of normal tissues due to its upregulatedglycolytic metabolism. The MnII ions of the MnOx nanoparticles can therefore dissoci-ate under the weak acidic microenvironment of the tumor to increase the relaxivity forefficient T1-weighted MRI. Under these conditions, only the MnOx nanoparticles within

Biosensors 2022, 12, 478 14 of 87
the tumor can dissociate into MnII ions, which is beneficial for the detection of the tumormicroenvironment, thereby detecting the tumor at an early stage. 99mTc is a commonlyused radiotracer for SPECT, due to its suitable half-life (t1/2 = 6.02 h) and major γ-line at140 keV that enables high-quality optimal imaging and avoids excessive patient radiationexposure. The enhanced SPECT–MRI image quality in tumor-bearing mice was furtherevaluated using 7.0 T micro-MRI and SPECT which provides semi-quantitative informationabout the tumor (Figure 7) [256].
Biosensors 2022, 12, x FOR PEER REVIEW 14 of 86
Figure 6. Combined ultrasound and photoacoustic images of responders in 1 h post-injection of photosensitizer before and after (immediate, 6 h, and 24 h) photodynamic therapy (PDT). (Top row) Ultrasound image in grayscale overlaid with oxygen saturation (StO2) map where blue and red rep-resent hypoxic and oxygenated regions, respectively. (Bottom row) Ultrasound image in grayscale overlaid with total hemoglobin image (HbT). The green circle indicates the tumor region identified using ultrasound image. Adapted with permission from Mallidi, S.; Watanabe, K.; Timerman, D.; Schoenfeld, D.; Hasan, T. Prediction of tumor recurrence and therapy monitoring using ultrasound-guided photoacoustic imaging. Theranostics, 2015, 5, 289 [250].
4.3. MRI and SPECT Imaging SPECT possesses excellent sensitivity and lower resolution compared to MRI which
has greater resolution and lower sensitivity [251,252]. Therefore, dual-modal imaging us-ing SPECT and MRI exhibits both excellent sensitivity and high resolution. MnII-contain-ing contrast agents are regarded as promising alternatives to GdIII-containing contrast agents [253–255]. Zhou and co-workers reported the combining of MnOx-containing mes-oporous silica nanoparticles with 99mTc to achieve SPECT-MRI dual-modal imaging con-trast agents [256]. MnOx nanoparticles dispersed within the mesopores of mesoporous sil-ica nanoparticles to synthesize Mn-based contrast agents for T1-weighted MRI. The pH of the tumor microenvironment is lower than that of normal tissues due to its upregulated glycolytic metabolism. The MnII ions of the MnOx nanoparticles can therefore dissociate under the weak acidic microenvironment of the tumor to increase the relaxivity for effi-cient T1-weighted MRI. Under these conditions, only the MnOx nanoparticles within the tumor can dissociate into MnII ions, which is beneficial for the detection of the tumor mi-croenvironment, thereby detecting the tumor at an early stage. 99mTc is a commonly used radiotracer for SPECT, due to its suitable half-life (t1/2 = 6.02 h) and major γ-line at 140 keV that enables high-quality optimal imaging and avoids excessive patient radiation expo-sure. The enhanced SPECT–MRI image quality in tumor-bearing mice was further evalu-ated using 7.0 T micro-MRI and SPECT which provides semi-quantitative information about the tumor (Figure 7) [256].
Figure 6. Combined ultrasound and photoacoustic images of responders in 1 h post-injection ofphotosensitizer before and after (immediate, 6 h, and 24 h) photodynamic therapy (PDT). (Top row)Ultrasound image in grayscale overlaid with oxygen saturation (StO2) map where blue and redrepresent hypoxic and oxygenated regions, respectively. (Bottom row) Ultrasound image in grayscaleoverlaid with total hemoglobin image (HbT). The green circle indicates the tumor region identifiedusing ultrasound image. Adapted with permission from Mallidi, S.; Watanabe, K.; Timerman, D.;Schoenfeld, D.; Hasan, T. Prediction of tumor recurrence and therapy monitoring using ultrasound-guided photoacoustic imaging. Theranostics, 2015, 5, 289 [250].
Biosensors 2022, 12, x FOR PEER REVIEW 14 of 86
Figure 6. Combined ultrasound and photoacoustic images of responders in 1 h post-injection of photosensitizer before and after (immediate, 6 h, and 24 h) photodynamic therapy (PDT). (Top row) Ultrasound image in grayscale overlaid with oxygen saturation (StO2) map where blue and red rep-resent hypoxic and oxygenated regions, respectively. (Bottom row) Ultrasound image in grayscale overlaid with total hemoglobin image (HbT). The green circle indicates the tumor region identified using ultrasound image. Adapted with permission from Mallidi, S.; Watanabe, K.; Timerman, D.; Schoenfeld, D.; Hasan, T. Prediction of tumor recurrence and therapy monitoring using ultrasound-guided photoacoustic imaging. Theranostics, 2015, 5, 289 [250].
4.3. MRI and SPECT Imaging SPECT possesses excellent sensitivity and lower resolution compared to MRI which
has greater resolution and lower sensitivity [251,252]. Therefore, dual-modal imaging us-ing SPECT and MRI exhibits both excellent sensitivity and high resolution. MnII-contain-ing contrast agents are regarded as promising alternatives to GdIII-containing contrast agents [253–255]. Zhou and co-workers reported the combining of MnOx-containing mes-oporous silica nanoparticles with 99mTc to achieve SPECT-MRI dual-modal imaging con-trast agents [256]. MnOx nanoparticles dispersed within the mesopores of mesoporous sil-ica nanoparticles to synthesize Mn-based contrast agents for T1-weighted MRI. The pH of the tumor microenvironment is lower than that of normal tissues due to its upregulated glycolytic metabolism. The MnII ions of the MnOx nanoparticles can therefore dissociate under the weak acidic microenvironment of the tumor to increase the relaxivity for effi-cient T1-weighted MRI. Under these conditions, only the MnOx nanoparticles within the tumor can dissociate into MnII ions, which is beneficial for the detection of the tumor mi-croenvironment, thereby detecting the tumor at an early stage. 99mTc is a commonly used radiotracer for SPECT, due to its suitable half-life (t1/2 = 6.02 h) and major γ-line at 140 keV that enables high-quality optimal imaging and avoids excessive patient radiation expo-sure. The enhanced SPECT–MRI image quality in tumor-bearing mice was further evalu-ated using 7.0 T micro-MRI and SPECT which provides semi-quantitative information about the tumor (Figure 7) [256].
Figure 7. (A) SPECT images (C1 through C5) of a tumor-bearing mouse after intravenous admin-istration of 99mTc-containing MnOx-based mesoporous silica nanoparticles were combined with99mTc. The white arrow indicates the region where the tumor is located. (B) T1-weighted MRIimages of the tumor-bearing mouse before and after intravenous administration of MnOx-containingmesoporous silica nanoparticles. Adapted with permission of the Royal Society of Chemistry, from99mTc-conjugated manganese-based mesoporous silica nanoparticles for SPECT, pH-responsive MRI,and anti-cancer drug delivery, Gao, H.; Liu, X.; Tang, W.; Niu, D.; Zhou, B.; Zhang, H.; Liu, W.; Gu, B.;Zhou, X.; Zheng, Y.; Sun, Y.; Jia, X.; Zhou, L. 8, 47, 2016; permission conveyed through CopyrightClearance Center, Inc. [256].
Aime and co-workers reported 1H-MRI and SPECT to detect changes in pH using GdIII-containing complex 2 and its isostructural 166HoIII-containing analog 3 as a radiotracer [257].In this study, the radiotracer acted as a calibration standard to infer the concentration of 2.

Biosensors 2022, 12, 478 15 of 87
In acidic pH conditions (pH < 5), the sulfonamide bearing arm is not coordinated and thecoordination sphere of the GdIII ion (2a) therefore, the coordination sphere is filled with twowater molecules (q = 2). At pH 5 and 300 MHz, the observed relaxivity is 7.8 mM−1 s−1.Upon deprotonation, the sulfonamide group bearing a negatively charged nitrogen entersthe coordination sphere of the GdIII ion yielding a structure (2b) containing no watermolecules in the inner coordination sphere (q = 0). The relaxivity of the 2b at pH 8 and300 MHz is 2.6 mM−1 s−1. 166Ho (t1/2 = 26.8 h) emits γ-radiation that can be detected usinga gamma camera. Complexes 2 and 3 are expected to share the same biodistribution whenadministered in vivo, and hence, the mixture of 2 and 3 can be used as a dual MRI/SPECTprobe (Figure 8) [257].
Biosensors 2022, 12, x FOR PEER REVIEW 15 of 86
Figure 7. (A) SPECT images (C1 through C5) of a tumor-bearing mouse after intravenous admin-istration of 99mTc-containing MnOx-based mesoporous silica nanoparticles were combined with 99mTc. The white arrow indicates the region where the tumor is located. (B) T1-weighted MRI images of the tumor-bearing mouse before and after intravenous administration of MnOx-containing mes-oporous silica nanoparticles. Adapted with permission of the Royal Society of Chemistry, from 99mTc-conjugated manganese-based mesoporous silica nanoparticles for SPECT, pH-responsive MRI, and anti-cancer drug delivery, Gao, H.; Liu, X.; Tang, W.; Niu, D.; Zhou, B.; Zhang, H.; Liu, W.; Gu, B.; Zhou, X.; Zheng, Y.; Sun, Y.; Jia, X.; Zhou, L. 8, 47, 2016; permission conveyed through Copyright Clearance Center, Inc. [256].
Aime and co-workers reported 1H-MRI and SPECT to detect changes in pH using GdIII-containing complex 2 and its isostructural 166HoIII-containing analog 3 as a radio-tracer [257]. In this study, the radiotracer acted as a calibration standard to infer the con-centration of 2. In acidic pH conditions (pH < 5), the sulfonamide bearing arm is not coor-dinated and the coordination sphere of the GdIII ion (2a) therefore, the coordination sphere is filled with two water molecules (q = 2). At pH 5 and 300 MHz, the observed relaxivity is 7.8 mM–1 s–1. Upon deprotonation, the sulfonamide group bearing a negatively charged nitrogen enters the coordination sphere of the GdIII ion yielding a structure (2b) containing no water molecules in the inner coordination sphere (q = 0). The relaxivity of the 2b at pH 8 and 300 MHz is 2.6 mM–1 s–1. 166Ho (t1/2 = 26.8 h) emits γ-radiation that can be detected using a gamma camera. Complexes 2 and 3 are expected to share the same biodistribution when administered in vivo, and hence, the mixture of 2 and 3 can be used as a dual MRI/SPECT probe (Figure 8) [257].
Figure 8. (A) MRI images of four samples at pH (1) 5.9, (2) 6.4, (3) 6.9, and (4) 7.4: (left) before nor-malization and (right) after normalization with respect to the GdIII concentration of the four samples determined via SPECT measurements. (B) Chemical structures of complexes 2 and 3. Adapted with permission of the Royal Society of Chemistry, from Dual MRI-SPECT agent for pH-mapping, Gia-nolio, E.; Maciocco, L.; Imperio, D.; Giovenzana, G. B.; Simonelli, F.; Abbas, K.; Bisi, G.; Aime, S. 47, 5, 2011; permission conveyed through Copyright Clearance Center, Inc. [257].
Figure 8. (A) MRI images of four samples at pH (1) 5.9, (2) 6.4, (3) 6.9, and (4) 7.4: (left) beforenormalization and (right) after normalization with respect to the GdIII concentration of the foursamples determined via SPECT measurements. (B) Chemical structures of complexes 2 and 3.Adapted with permission of the Royal Society of Chemistry, from Dual MRI-SPECT agent for pH-mapping, Gianolio, E.; Maciocco, L.; Imperio, D.; Giovenzana, G. B.; Simonelli, F.; Abbas, K.; Bisi, G.;Aime, S. 47, 5, 2011; permission conveyed through Copyright Clearance Center, Inc. [257].
4.4. MRI and X-ray CT Imaging
In some cases, MRI and X-ray CT are complementary to each other [258]. MRI producesimages with high resolution and accuracy, and X-ray CT produces images with highspecificity [259,260]. Combined MRI and X-ray CT enable the precise determination ofseveral diseases through the generation of anatomical images [261–263].
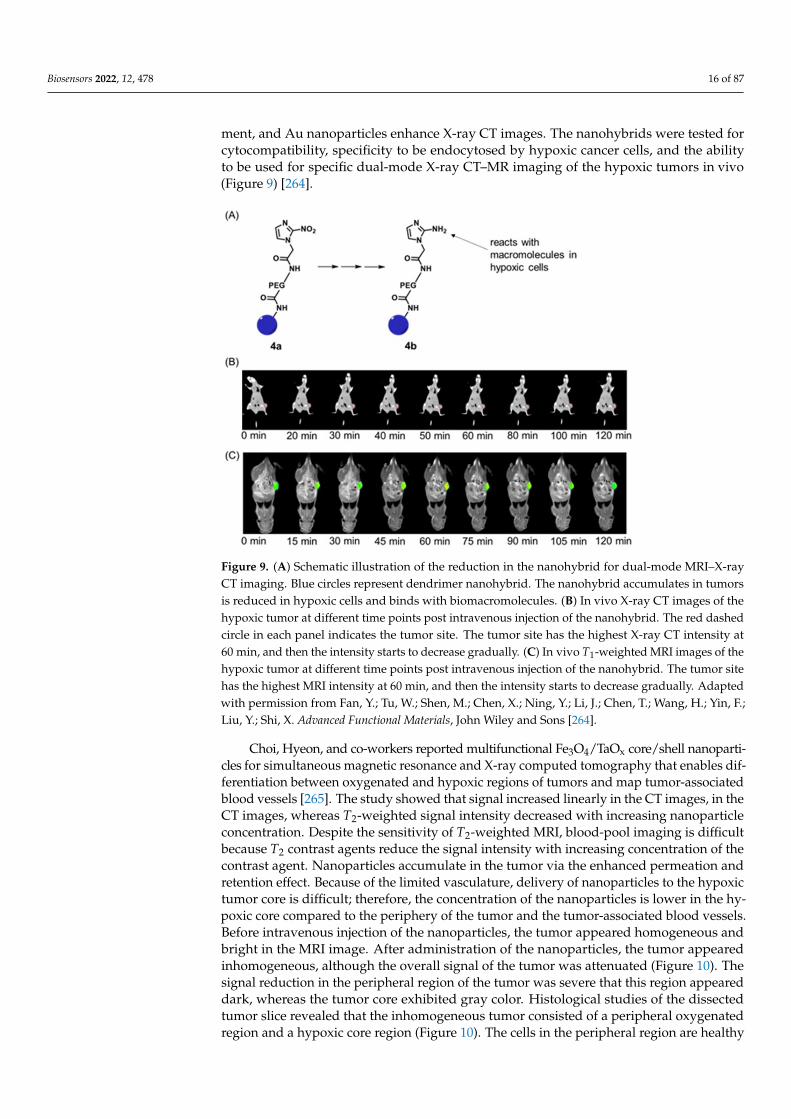
Liu, Shi, and co-workers reported multifunctional dendrimer nanohybrids that haveGdIII-containing complexes for T1-weighted MRI, Au nanoparticles for X-ray CT imaging,and 2-nitroimidazole moieties for hypoxia-responsiveness [264]. The reducing environmentassociated with hypoxic causes the nitro groups in the 2-nitroimidazole moieties in 4a toreduce to amines, 4b. Subsequently, the nanohybrids conjugate with macromolecules inhypoxic cells. As a consequence, the nanohybrid accumulates in hypoxic cells (Figure 9).After accumulation, GdIII-containing complexes produce T1-weighted contrast enhance-
Biosensors 2022, 12, 478 16 of 87
ment, and Au nanoparticles enhance X-ray CT images. The nanohybrids were tested forcytocompatibility, specificity to be endocytosed by hypoxic cancer cells, and the abilityto be used for specific dual-mode X-ray CT–MR imaging of the hypoxic tumors in vivo(Figure 9) [264].
Biosensors 2022, 12, x FOR PEER REVIEW 16 of 86
4.4. MRI and X-ray CT Imaging In some cases, MRI and X-ray CT are complementary to each other [258]. MRI pro-
duces images with high resolution and accuracy, and X-ray CT produces images with high specificity [259,260]. Combined MRI and X-ray CT enable the precise determination of several diseases through the generation of anatomical images [261–263].
Liu, Shi, and co-workers reported multifunctional dendrimer nanohybrids that have GdIII-containing complexes for T1-weighted MRI, Au nanoparticles for X-ray CT imaging, and 2-nitroimidazole moieties for hypoxia-responsiveness [264]. The reducing environ-ment associated with hypoxic causes the nitro groups in the 2-nitroimidazole moieties in 4a to reduce to amines, 4b. Subsequently, the nanohybrids conjugate with macromole-cules in hypoxic cells. As a consequence, the nanohybrid accumulates in hypoxic cells (Figure 9). After accumulation, GdIII-containing complexes produce T1-weighted contrast enhancement, and Au nanoparticles enhance X-ray CT images. The nanohybrids were tested for cytocompatibility, specificity to be endocytosed by hypoxic cancer cells, and the ability to be used for specific dual-mode X-ray CT–MR imaging of the hypoxic tumors in vivo (Figure 9) [264].
Figure 9. (A) Schematic illustration of the reduction in the nanohybrid for dual-mode MRI–X-ray CT imaging. Blue circles represent dendrimer nanohybrid. The nanohybrid accumulates in tumors is reduced in hypoxic cells and binds with biomacromolecules. (B) In vivo X-ray CT images of the hypoxic tumor at different time points post intravenous injection of the nanohybrid. The red dashed circle in each panel indicates the tumor site. The tumor site has the highest X-ray CT intensity at 60 min, and then the intensity starts to decrease gradually. (C) In vivo T1-weighted MRI images of the hypoxic tumor at different time points post intravenous injection of the nanohybrid. The tumor site has the highest MRI intensity at 60 min, and then the intensity starts to decrease gradually. Adapted with permission from Fan, Y.; Tu, W.; Shen, M.; Chen, X.; Ning, Y.; Li, J.; Chen, T.; Wang, H.; Yin, F.; Liu, Y.; Shi, X. Advanced Functional Materials, John Wiley and Sons [264].
Choi, Hyeon, and co-workers reported multifunctional Fe3O4/TaOx core/shell nano-particles for simultaneous magnetic resonance and X-ray computed tomography that en-ables differentiation between oxygenated and hypoxic regions of tumors and map tumor-associated blood vessels [265]. The study showed that signal increased linearly in the CT images, in the CT images, whereas T2-weighted signal intensity decreased with increasing
Figure 9. (A) Schematic illustration of the reduction in the nanohybrid for dual-mode MRI–X-rayCT imaging. Blue circles represent dendrimer nanohybrid. The nanohybrid accumulates in tumorsis reduced in hypoxic cells and binds with biomacromolecules. (B) In vivo X-ray CT images of thehypoxic tumor at different time points post intravenous injection of the nanohybrid. The red dashedcircle in each panel indicates the tumor site. The tumor site has the highest X-ray CT intensity at60 min, and then the intensity starts to decrease gradually. (C) In vivo T1-weighted MRI images of thehypoxic tumor at different time points post intravenous injection of the nanohybrid. The tumor sitehas the highest MRI intensity at 60 min, and then the intensity starts to decrease gradually. Adaptedwith permission from Fan, Y.; Tu, W.; Shen, M.; Chen, X.; Ning, Y.; Li, J.; Chen, T.; Wang, H.; Yin, F.;Liu, Y.; Shi, X. Advanced Functional Materials, John Wiley and Sons [264].
Choi, Hyeon, and co-workers reported multifunctional Fe3O4/TaOx core/shell nanoparti-cles for simultaneous magnetic resonance and X-ray computed tomography that enables dif-ferentiation between oxygenated and hypoxic regions of tumors and map tumor-associatedblood vessels [265]. The study showed that signal increased linearly in the CT images, in theCT images, whereas T2-weighted signal intensity decreased with increasing nanoparticleconcentration. Despite the sensitivity of T2-weighted MRI, blood-pool imaging is difficultbecause T2 contrast agents reduce the signal intensity with increasing concentration of thecontrast agent. Nanoparticles accumulate in the tumor via the enhanced permeation andretention effect. Because of the limited vasculature, delivery of nanoparticles to the hypoxictumor core is difficult; therefore, the concentration of the nanoparticles is lower in the hy-poxic core compared to the periphery of the tumor and the tumor-associated blood vessels.Before intravenous injection of the nanoparticles, the tumor appeared homogeneous andbright in the MRI image. After administration of the nanoparticles, the tumor appearedinhomogeneous, although the overall signal of the tumor was attenuated (Figure 10). Thesignal reduction in the peripheral region of the tumor was severe that this region appeareddark, whereas the tumor core exhibited gray color. Histological studies of the dissectedtumor slice revealed that the inhomogeneous tumor consisted of a peripheral oxygenatedregion and a hypoxic core region (Figure 10). The cells in the peripheral region are healthy

Biosensors 2022, 12, 478 17 of 87
because sufficient oxygen and nutrients were supplied by peripheral vasculature. Uponadministration of nanoparticles, signal enhancement of blood vessels, including the tumor-associated vessels and the periphery of the tumor, were observed in volume-rendered X-rayCT images. Therefore, combined X-ray CT and MRI differentiated oxygenated and hypoxicregions of a tumor and tumor-associated blood vessels [265].
Biosensors 2022, 12, x FOR PEER REVIEW 17 of 86
nanoparticle concentration. Despite the sensitivity of T2-weighted MRI, blood-pool imag-ing is difficult because T2 contrast agents reduce the signal intensity with increasing con-centration of the contrast agent. Nanoparticles accumulate in the tumor via the enhanced permeation and retention effect. Because of the limited vasculature, delivery of nanopar-ticles to the hypoxic tumor core is difficult; therefore, the concentration of the nanoparti-cles is lower in the hypoxic core compared to the periphery of the tumor and the tumor-associated blood vessels. Before intravenous injection of the nanoparticles, the tumor ap-peared homogeneous and bright in the MRI image. After administration of the nanopar-ticles, the tumor appeared inhomogeneous, although the overall signal of the tumor was attenuated (Figure 10). The signal reduction in the peripheral region of the tumor was severe that this region appeared dark, whereas the tumor core exhibited gray color. His-tological studies of the dissected tumor slice revealed that the inhomogeneous tumor con-sisted of a peripheral oxygenated region and a hypoxic core region (Figure 10). The cells in the peripheral region are healthy because sufficient oxygen and nutrients were supplied by peripheral vasculature. Upon administration of nanoparticles, signal enhancement of blood vessels, including the tumor-associated vessels and the periphery of the tumor, were observed in volume-rendered X-ray CT images. Therefore, combined X-ray CT and MRI differentiated oxygenated and hypoxic regions of a tumor and tumor-associated blood vessels [265].
Figure 10. T2-weighted MRI image (A) before and (B) after intravenous injection of the Fe3O4/TaOx core/shell nanoparticles prepared at a concentration 0.4 mg/mL Fe3O4. Tumor site indicated in a Figure 10. T2-weighted MRI image (A) before and (B) after intravenous injection of the Fe3O4/TaOx
core/shell nanoparticles prepared at a concentration 0.4 mg/mL Fe3O4. Tumor site indicated in awhite arrow. (C) Hematoxylin and eosin-stained section of the tumor. Whole-tumor image (left)shows that the interior is inhomogeneous. Magnified image (right) of tumor shows hypoxic region,oxygenated region, and blood vessel. Scale bar represents 200 µm. (D) Coronal maximum intensityprojection images of whole-body X-ray CT images of a rat before and after intravenous injectionof Fe3O4/TaOx core/shell nanoparticles. White arrows indicate the tumor site. Adapted withpermission from Lee, N.; Cho, H. R.; Oh, M. H.; Lee, S. H.; Kim, K.; Kim, B. H.; Shin, K.; Ahn, T. Y.;Choi, J. W.; Kim, Y. W.; Choi, S. H.; Hyeon, T. Multifunctional Fe3O4/TaOx Core/Shell nanoparticlesfor simultaneous magnetic resonance imaging and X-ray computed tomography. J. Am. Chem. Soc.,2012, 134, 10309–10312. Copyright 2012 American Chemical Society [265].
4.5. MRI and PET Imaging
Caravan and co-workers reported a bimodal 1H-MRI and PET agent 5 for quantitativepH imaging [266]. They used the positron-emitting isotope 18F for PET imaging and GdIII-containing moiety for T1-weighted MRI. Images were acquired using MRI and PET on two

Biosensors 2022, 12, 478 18 of 87
sets of samples. In one set, T1 was varied, and the probe concentration was kept constant.In the other set, T1 was kept constant, and the probe concentration was varied. In bothsets of samples, pH was varied. By combining PET and MRI datasets, pH values can bedetermined (Figure 11). Because acidic pH is an important biomarker of hypoxic tumors,their study was used to report pH values quantitatively and noninvasively (Figure 11) [266].
Biosensors 2022, 12, x FOR PEER REVIEW 18 of 86
white arrow. (C) Hematoxylin and eosin-stained section of the tumor. Whole-tumor image (left) shows that the interior is inhomogeneous. Magnified image (right) of tumor shows hypoxic region, oxygenated region, and blood vessel. Scale bar represents 200 μm. (D) Coronal maximum intensity projection images of whole-body X-ray CT images of a rat before and after intravenous injection of Fe3O4/TaOx core/shell nanoparticles. White arrows indicate the tumor site. Adapted with permission from Lee, N.; Cho, H. R.; Oh, M. H.; Lee, S. H.; Kim, K.; Kim, B. H.; Shin, K.; Ahn, T. Y.; Choi, J. W.; Kim, Y. W.; Choi, S. H.; Hyeon, T. Multifunctional Fe3O4/TaOx Core/Shell nanoparticles for simul-taneous magnetic resonance imaging and X-ray computed tomography. J. Am. Chem. Soc., 2012, 134, 10309–10312. Copyright 2012 American Chemical Society [265].
4.5. MRI and PET Imaging Caravan and co-workers reported a bimodal 1H-MRI and PET agent 5 for quantita-
tive pH imaging [266]. They used the positron-emitting isotope 18F for PET imaging and GdIII-containing moiety for T1-weighted MRI. Images were acquired using MRI and PET on two sets of samples. In one set, T1 was varied, and the probe concentration was kept constant. In the other set, T1 was kept constant, and the probe concentration was varied. In both sets of samples, pH was varied. By combining PET and MRI datasets, pH values can be determined (Figure 11). Because acidic pH is an important biomarker of hypoxic tumors, their study was used to report pH values quantitatively and noninvasively (Fig-ure 11) [266].
Figure 11. (A) Chemical structure of 5 used for dual-mode PET and 1H-MRI for quantitative pH measurements. Phosphonates are drawn singly protonated because of the expected first (pKa ≈ 2–3) and second (pKa ≈ 7–8) pKa values. (B) pH determined with the MRI/PET technique versus pH de-termined using a glass electrode. The solid line represents a linear fit of the data, and the dashed line represents a hypothetical 1:1 correspondence between the x- and y-axes. Adapted with permis-sion from Frullano, L.; Catana, C.; Benner, T.; Sherry, A. D.; Caravan, P. Angewandte Chemie Interna-tional Edition, John Wiley and Sons [266].
Aime and co-workers reported a noninvasive method for imaging tumor metabolism and pH by combining PET and CEST-MRI [267]. They assessed in vivo correlation be-tween tumor 18F-fluorodeoxyglucose, 6, uptake, and extracellular pH values in a murine
Figure 11. (A) Chemical structure of 5 used for dual-mode PET and 1H-MRI for quantitative pHmeasurements. Phosphonates are drawn singly protonated because of the expected first (pKa ≈2–3) and second (pKa ≈ 7–8) pKa values. (B) pH determined with the MRI/PET technique versuspH determined using a glass electrode. The solid line represents a linear fit of the data, and thedashed line represents a hypothetical 1:1 correspondence between the x- and y-axes. Adapted withpermission from Frullano, L.; Catana, C.; Benner, T.; Sherry, A. D.; Caravan, P. Angewandte ChemieInternational Edition, John Wiley and Sons [266].
Aime and co-workers reported a noninvasive method for imaging tumor metabolismand pH by combining PET and CEST-MRI [267]. They assessed in vivo correlation betweentumor 18F-fluorodeoxyglucose, 6, uptake, and extracellular pH values in a murine modalbearing a breast cancer (Figure 12). Hypoxic tumors exhibit enhanced glucose uptake andglycolysis which leads to enhanced production of lactic acid that decreases extracellularpH. Therefore, dysregulated tumor pH and upregulated glucose metabolism are hallmarksof tumors that are useful information to gain an understanding of tumor biology. In themethod described by Aime and co-workers, pH-responsive contrast agent 7 was used todemonstrate the occurrence of tumor pH. The extent of uptake of 6 was quantified usingPET imaging. The results showed that high uptake of 6 corresponds to lower extracellularpH in hypoxic tumor microenvironments [267].

Biosensors 2022, 12, 478 19 of 87
Biosensors 2022, 12, x FOR PEER REVIEW 19 of 86
modal bearing a breast cancer (Figure 12). Hypoxic tumors exhibit enhanced glucose up-take and glycolysis which leads to enhanced production of lactic acid that decreases ex-tracellular pH. Therefore, dysregulated tumor pH and upregulated glucose metabolism are hallmarks of tumors that are useful information to gain an understanding of tumor biology. In the method described by Aime and co-workers, pH-responsive contrast agent 7 was used to demonstrate the occurrence of tumor pH. The extent of uptake of 6 was quantified using PET imaging. The results showed that high uptake of 6 corresponds to lower extracellular pH in hypoxic tumor microenvironments [267].
Figure 12. Chemical structures of 6 and 7.
4.6. PET and X-ray CT Imaging In clinical imaging, a combination of anatomic X-ray CT and functional PET is fre-
quently used for comprehensive visualization, detection, and staging of malignancies [268–270]. Increased glucose metabolism is associated with hypoxia in the majority of solid tumors [271,272]. Because hypoxia is related to poor prognosis, promotes resistance to treatments, and increases metastatic potential, it is important to visualize and quantify tumor metabolism and hypoxia. Zegers and co-workers reported a comparison of tumor metabolism hypoxia using 6 and 8 for PET–X-ray CT imaging (Figure 13) [273]. Com-pound 8 is a nitroimidazole with pharmacokinetically attractive properties that has been used in preclinical imaging. They selected non-small cell lung cancer bearing patients be-cause hypoxia is present in the majority of non-small cell lung cancers that can be visual-ized and quantified using functional PET imaging with radiolabeled 2-nitroimidazoles. Because of the reduced oxygen concentration in hypoxic cells, the nitroimidazole moiety in 8 undergoes reduction and subsequently binds with cellular macromolecules. Further-more, because 6 is an analog of glucose, it provides functional information based on the increased glucose uptake and glycolysis of cancer cells. This study shows that 8 can be used to visualize and quantify tumor hypoxia in patients with non-small cell lung cancer. Furthermore, results showed that patients with larger tumor sizes and higher uptake are more likely to bear a larger hypoxic volume [273].
Figure 13. Chemical structure of 8.
Figure 12. Chemical structures of 6 and 7.
4.6. PET and X-ray CT Imaging
In clinical imaging, a combination of anatomic X-ray CT and functional PET is fre-quently used for comprehensive visualization, detection, and staging of malignancies [268–270].Increased glucose metabolism is associated with hypoxia in the majority of solid tu-mors [271,272]. Because hypoxia is related to poor prognosis, promotes resistance totreatments, and increases metastatic potential, it is important to visualize and quantifytumor metabolism and hypoxia. Zegers and co-workers reported a comparison of tumormetabolism hypoxia using 6 and 8 for PET–X-ray CT imaging (Figure 13) [273]. Compound8 is a nitroimidazole with pharmacokinetically attractive properties that has been usedin preclinical imaging. They selected non-small cell lung cancer bearing patients becausehypoxia is present in the majority of non-small cell lung cancers that can be visualizedand quantified using functional PET imaging with radiolabeled 2-nitroimidazoles. Becauseof the reduced oxygen concentration in hypoxic cells, the nitroimidazole moiety in 8 un-dergoes reduction and subsequently binds with cellular macromolecules. Furthermore,because 6 is an analog of glucose, it provides functional information based on the increasedglucose uptake and glycolysis of cancer cells. This study shows that 8 can be used to visual-ize and quantify tumor hypoxia in patients with non-small cell lung cancer. Furthermore,results showed that patients with larger tumor sizes and higher uptake are more likely tobear a larger hypoxic volume [273].
Biosensors 2022, 12, x FOR PEER REVIEW 19 of 86
modal bearing a breast cancer (Figure 12). Hypoxic tumors exhibit enhanced glucose up-take and glycolysis which leads to enhanced production of lactic acid that decreases ex-tracellular pH. Therefore, dysregulated tumor pH and upregulated glucose metabolism are hallmarks of tumors that are useful information to gain an understanding of tumor biology. In the method described by Aime and co-workers, pH-responsive contrast agent 7 was used to demonstrate the occurrence of tumor pH. The extent of uptake of 6 was quantified using PET imaging. The results showed that high uptake of 6 corresponds to lower extracellular pH in hypoxic tumor microenvironments [267].
Figure 12. Chemical structures of 6 and 7.
4.6. PET and X-ray CT Imaging In clinical imaging, a combination of anatomic X-ray CT and functional PET is fre-
quently used for comprehensive visualization, detection, and staging of malignancies [268–270]. Increased glucose metabolism is associated with hypoxia in the majority of solid tumors [271,272]. Because hypoxia is related to poor prognosis, promotes resistance to treatments, and increases metastatic potential, it is important to visualize and quantify tumor metabolism and hypoxia. Zegers and co-workers reported a comparison of tumor metabolism hypoxia using 6 and 8 for PET–X-ray CT imaging (Figure 13) [273]. Com-pound 8 is a nitroimidazole with pharmacokinetically attractive properties that has been used in preclinical imaging. They selected non-small cell lung cancer bearing patients be-cause hypoxia is present in the majority of non-small cell lung cancers that can be visual-ized and quantified using functional PET imaging with radiolabeled 2-nitroimidazoles. Because of the reduced oxygen concentration in hypoxic cells, the nitroimidazole moiety in 8 undergoes reduction and subsequently binds with cellular macromolecules. Further-more, because 6 is an analog of glucose, it provides functional information based on the increased glucose uptake and glycolysis of cancer cells. This study shows that 8 can be used to visualize and quantify tumor hypoxia in patients with non-small cell lung cancer. Furthermore, results showed that patients with larger tumor sizes and higher uptake are more likely to bear a larger hypoxic volume [273].
Figure 13. Chemical structure of 8. Figure 13. Chemical structure of 8.
Guan and co-workers reported a comparison between 8 and 18F-fluoromisonidazole,9, in human head and neck cancer [274]. Owing to the reducing environment in hypoxiccells, the nitro group in the 2-nitroimidazole moiety in 9 reduces to an amine. Subsequently,the nanohybrid forms conjugate with macromolecules in hypoxic cells via the amine group.As a consequence, an accumulation of 9 in the hypoxic cells can be detected using PETimaging. The uptake region of 6 was compared with the uptake regions of 8 and 9, and 8and 9 highlight similar hotspots as 6 (Figure 14) [274].

Biosensors 2022, 12, 478 20 of 87
Biosensors 2022, 12, x FOR PEER REVIEW 20 of 86
Guan and co-workers reported a comparison between 8 and 18F-fluoromisonidazole, 9, in human head and neck cancer [274]. Owing to the reducing environment in hypoxic cells, the nitro group in the 2-nitroimidazole moiety in 9 reduces to an amine. Subse-quently, the nanohybrid forms conjugate with macromolecules in hypoxic cells via the amine group. As a consequence, an accumulation of 9 in the hypoxic cells can be detected using PET imaging. The uptake region of 6 was compared with the uptake regions of 8 and 9, and 8 and 9 highlight similar hotspots as 6 (Figure 14) [274].
Figure 14. Chemical structure of 9.
Mortensen and co-workers evaluated an 18F-fluoroazomycin arabinoside, 10, for stag-ing tumor hypoxia in patients with head and neck squamous cell carcinoma using PET–X-ray CT imaging [275]. The reducing environment of hypoxic regions causes the nitro group in 10 to reduce to an amine group. Subsequently, the molecules form conjugates with macromolecules in hypoxic cells via the amine. As a consequence of conjugation, accumulation occurs in hypoxic cells. Patients with head and neck squamous cell carci-noma were treated with radiotherapy (66–76 Gy). Hypoxic volume was delineated using 10 and PET–X-ray CT imaging (Figure 15) [275].
Figure 15. (A) Chemical structure of 10. (B) PET–X-ray CT scan of a patient with oropharyngeal cancer before radiation therapy. The red solid line indicates the gross tumor volume. (C) Hypoxic volume after 12 Gy radiation therapy. After radiation therapy, the hypoxic volume decreased from 30.9 to 13.7 cm3. Adapted from Radiotherapy and Oncology, 105, 1, Mortensen, L. S.; Johansen, J.; Kalle-hauge, J.; Primdahl, H.; Busk, M.; Lassen, P.; Alsner, J.; Sørensen, B. S.; Toustrup, K.; Jakobsen, S.; Petersen, J.; Petersen, H.; Theil, J.; Nordsmark, M.; Overgaaerd, J. FAZA PET/CT hypoxia imaging in patients with squamous cell carcinoma of the head and neck treated with radiotherapy: results from the DAHANCA 24 trial. 14–20, Copyright 2012, with permission from Elsevier [275].
Figure 14. Chemical structure of 9.
Mortensen and co-workers evaluated an 18F-fluoroazomycin arabinoside, 10, forstaging tumor hypoxia in patients with head and neck squamous cell carcinoma usingPET–X-ray CT imaging [275]. The reducing environment of hypoxic regions causes thenitro group in 10 to reduce to an amine group. Subsequently, the molecules form conjugateswith macromolecules in hypoxic cells via the amine. As a consequence of conjugation,accumulation occurs in hypoxic cells. Patients with head and neck squamous cell carcinomawere treated with radiotherapy (66–76 Gy). Hypoxic volume was delineated using 10 andPET–X-ray CT imaging (Figure 15) [275].
Biosensors 2022, 12, x FOR PEER REVIEW 20 of 86
Guan and co-workers reported a comparison between 8 and 18F-fluoromisonidazole, 9, in human head and neck cancer [274]. Owing to the reducing environment in hypoxic cells, the nitro group in the 2-nitroimidazole moiety in 9 reduces to an amine. Subse-quently, the nanohybrid forms conjugate with macromolecules in hypoxic cells via the amine group. As a consequence, an accumulation of 9 in the hypoxic cells can be detected using PET imaging. The uptake region of 6 was compared with the uptake regions of 8 and 9, and 8 and 9 highlight similar hotspots as 6 (Figure 14) [274].
Figure 14. Chemical structure of 9.
Mortensen and co-workers evaluated an 18F-fluoroazomycin arabinoside, 10, for stag-ing tumor hypoxia in patients with head and neck squamous cell carcinoma using PET–X-ray CT imaging [275]. The reducing environment of hypoxic regions causes the nitro group in 10 to reduce to an amine group. Subsequently, the molecules form conjugates with macromolecules in hypoxic cells via the amine. As a consequence of conjugation, accumulation occurs in hypoxic cells. Patients with head and neck squamous cell carci-noma were treated with radiotherapy (66–76 Gy). Hypoxic volume was delineated using 10 and PET–X-ray CT imaging (Figure 15) [275].
Figure 15. (A) Chemical structure of 10. (B) PET–X-ray CT scan of a patient with oropharyngeal cancer before radiation therapy. The red solid line indicates the gross tumor volume. (C) Hypoxic volume after 12 Gy radiation therapy. After radiation therapy, the hypoxic volume decreased from 30.9 to 13.7 cm3. Adapted from Radiotherapy and Oncology, 105, 1, Mortensen, L. S.; Johansen, J.; Kalle-hauge, J.; Primdahl, H.; Busk, M.; Lassen, P.; Alsner, J.; Sørensen, B. S.; Toustrup, K.; Jakobsen, S.; Petersen, J.; Petersen, H.; Theil, J.; Nordsmark, M.; Overgaaerd, J. FAZA PET/CT hypoxia imaging in patients with squamous cell carcinoma of the head and neck treated with radiotherapy: results from the DAHANCA 24 trial. 14–20, Copyright 2012, with permission from Elsevier [275].
Figure 15. (A) Chemical structure of 10. (B) PET–X-ray CT scan of a patient with oropharyngealcancer before radiation therapy. The red solid line indicates the gross tumor volume. (C) Hypoxicvolume after 12 Gy radiation therapy. After radiation therapy, the hypoxic volume decreased from30.9 to 13.7 cm3. Adapted from Radiotherapy and Oncology, 105, 1, Mortensen, L. S.; Johansen, J.;Kallehauge, J.; Primdahl, H.; Busk, M.; Lassen, P.; Alsner, J.; Sørensen, B. S.; Toustrup, K.; Jakobsen, S.;Petersen, J.; Petersen, H.; Theil, J.; Nordsmark, M.; Overgaaerd, J. FAZA PET/CT hypoxia imaging inpatients with squamous cell carcinoma of the head and neck treated with radiotherapy: results fromthe DAHANCA 24 trial. 14–20, Copyright 2012, with permission from Elsevier [275].
4.7. SERS and Photoacoustic Imaging
Photoacoustic imaging has enhanced tissue penetration depth compared to fluores-cence imaging and enables real-time imaging [122,123,276–278]. SERS has high specificityand sensitivity due to its unique fingerprint vibration spectrum, and as a consequence, canbe used for multiplex imaging [279–281]. Therefore, combined SERS and photoacousticimaging is an approach that has been applied for cell and tumor imaging [282,283].
Excessive production of reactive oxygen species, including hydrogen peroxide, isan important indicator of hypoxic tumors [284]. Song and co-workers reported a dual

Biosensors 2022, 12, 478 21 of 87
ratiometric SERS and photoacoustic real-time quantitative visualizing method to detect hy-drogen peroxide in tumors and inflammation [285]. The reported core–satellite nanoprobewas prepared by forming an amide bond between the ammonia-modified mesoporoussilica-coated nano-gapped gold nanorods and the gold nanoparticles modified with 4-mercaptobenzoboric acid and D-(+)-galactose. A substrate and a peroxidase enzyme wereloaded onto the mesoporous silica shell. Due to the plasmonic coupling between theexternal gold nanoparticles, a strong electromagnetic field was generated, that enhancedthe SERS intensity of the modified Raman molecule and the optical absorption of thenanostructure in the second near-IR region. In the presence of hydrogen peroxide, the goldnanoparticles dissociated resulting in a decrease in the Raman signal at 2228 cm−1 but nochange in the Raman signal at 1418 cm−1 inside the nanogap of gold nanorods. During thedissociation, the substrate that was loaded in the mesoporous silica shell converted to anoxidized form in the presence of hydrogen peroxide and the peroxidase enzyme (catalyst)resulting in a strong absorption at 750 nm with the absorption at 1250 nm of gold nanorodsremaining nearly unchanged. Therefore, the ratiometric SERS and photoacoustic signalswere used to detect hydrogen peroxide in vivo and in vitro quantitatively and selectively(Figure 16) [285].
Biosensors 2022, 12, x FOR PEER REVIEW 21 of 86
4.7. SERS and Photoacoustic Imaging Photoacoustic imaging has enhanced tissue penetration depth compared to fluores-
cence imaging and enables real-time imaging [122,123,276–278]. SERS has high specificity and sensitivity due to its unique fingerprint vibration spectrum, and as a consequence, can be used for multiplex imaging [279–281]. Therefore, combined SERS and photoacous-tic imaging is an approach that has been applied for cell and tumor imaging [282,283].
Excessive production of reactive oxygen species, including hydrogen peroxide, is an important indicator of hypoxic tumors [284]. Song and co-workers reported a dual rati-ometric SERS and photoacoustic real-time quantitative visualizing method to detect hy-drogen peroxide in tumors and inflammation [285]. The reported core–satellite nanoprobe was prepared by forming an amide bond between the ammonia-modified mesoporous silica-coated nano-gapped gold nanorods and the gold nanoparticles modified with 4-mercaptobenzoboric acid and D-(+)-galactose. A substrate and a peroxidase enzyme were loaded onto the mesoporous silica shell. Due to the plasmonic coupling between the ex-ternal gold nanoparticles, a strong electromagnetic field was generated, that enhanced the SERS intensity of the modified Raman molecule and the optical absorption of the nanostructure in the second near-IR region. In the presence of hydrogen peroxide, the gold nanoparticles dissociated resulting in a decrease in the Raman signal at 2,228 cm–1 but no change in the Raman signal at 1,418 cm–1 inside the nanogap of gold nanorods. During the dissociation, the substrate that was loaded in the mesoporous silica shell con-verted to an oxidized form in the presence of hydrogen peroxide and the peroxidase en-zyme (catalyst) resulting in a strong absorption at 750 nm with the absorption at 1250 nm of gold nanorods remaining nearly unchanged. Therefore, the ratiometric SERS and pho-toacoustic signals were used to detect hydrogen peroxide in vivo and in vitro quantita-tively and selectively (Figure 16) [285].
Figure 16. Representative in vitro and in vivo images. (A) Photoacoustic images at 750 and 1,250 nm and the corresponding ratio images of the core-satellite with the changes of hydrogen peroxide con-centration. In the presence of hydrogen peroxide, the substrate loaded in the core–shell is converted to an oxidized form with an increased photoacoustic signal at 750 nm, while the signal at 1,250 nm of the nanorod remains unchanged, forming the ratiometric PA750/PA1250 signal. (B) Photoacoustic
Figure 16. Representative in vitro and in vivo images. (A) Photoacoustic images at 750 and 1250 nmand the corresponding ratio images of the core-satellite with the changes of hydrogen peroxide con-centration. In the presence of hydrogen peroxide, the substrate loaded in the core–shell is convertedto an oxidized form with an increased photoacoustic signal at 750 nm, while the signal at 1250 nmof the nanorod remains unchanged, forming the ratiometric PA750/PA1250 signal. (B) Photoacousticimaging at 750 and 1250 nm, and the corresponding signal ratio, of mice with subcutaneous 4T1tumors at different times after intravenous injection of the nanoprobe (scale bar is 1 mm). (C) ConfocalRaman imaging at 2228 cm−1 (red color, change peak) and 1418 cm−1 (green color, constant peak)and the ratio image (I2228/I1418) of normal and tumor tissues before and two hours after injection ofthe nanoprobe (scale bar is 10 µm). Adapted with permission from Li, Q.; Ge, X.; Ye, J.; Li, Z.; Su, L.;Wu, Y.; Yang, H.; Song, J. Angewandte Chemie International Edition, John Wiley and Sons [285].

Biosensors 2022, 12, 478 22 of 87
4.8. MRI, EPRI, and PET Imaging
Although EPR oximetry is not currently used in clinical imaging, combined EPRIand PET scanners provide information about tumor microenvironments in preclinicalstudies [281]. In combined systems, EPRI is used as a gold standard to measure thepartial pressure of oxygen in the environment to evaluate the accuracy of PET imaging.Additionally, the combination of PET and EPRI enables simultaneous measurement ofintra- and extracellular components of tissue microenvironments, for example, glucoseconsumption rate, hypoxia, and acidosis. Furthermore, simultaneous scanning increasesthe efficiency of the imaging process which is important for biomedical applications [286].
Raylman and co-workers reported a combined PET/EPRI prototype scanner for simul-taneous acquisition of EPR and PET images of hypoxic samples that are created by removingendogenous oxygen by adding glucose and glucose oxidase [287]. The PET/EPRI scannerwas used to detect oxygen-sensing EPR spin probe [per-deuterated ‘Finland’ trimethyl(trityl) radical (dFT)] and PET radiotracer 6 in samples (Figure 17). Because it is difficult tocontrol oxygen concentration in the samples, gadolinium was also added to the solution toemulate the presence of oxygen. The study demonstrated that the highest concentrationof gadolinium accurately corresponds to the samples with the lowest concentration of 6.As demonstrated by spectral-linewidth in the EPR images of the samples the scanner hasthe ability to map oxygen concentration as simulated by the addition of gadolinium. Thereported PET/EPRI scanner potentially enables the detection of cellular components oftumor microenvironments. Relatively low spatial resolution and detection sensitivity whichare common limitations of the reported preclinical scanner potentially can be overcomeusing EPR-compatible PET systems with higher resolution and detection sensitivity thanthe reported scanner [287].
Biosensors 2022, 12, x FOR PEER REVIEW 22 of 86
imaging at 750 and 1,250 nm, and the corresponding signal ratio, of mice with subcutaneous 4T1 tumors at different times after intravenous injection of the nanoprobe (scale bar is 1 mm). (C) Con-focal Raman imaging at 2,228 cm–1 (red color, change peak) and 1,418 cm–1 (green color, constant peak) and the ratio image (I2228/I1418) of normal and tumor tissues before and two hours after injection of the nanoprobe (scale bar is 10 μm). Adapted with permission from Li, Q.; Ge, X.; Ye, J.; Li, Z.; Su, L.; Wu, Y.; Yang, H.; Song, J. Angewandte Chemie International Edition, John Wiley and Sons [285].
4.8. MRI, EPRI, and PET Imaging Although EPR oximetry is not currently used in clinical imaging, combined EPRI and
PET scanners provide information about tumor microenvironments in preclinical studies [281]. In combined systems, EPRI is used as a gold standard to measure the partial pres-sure of oxygen in the environment to evaluate the accuracy of PET imaging. Additionally, the combination of PET and EPRI enables simultaneous measurement of intra- and extra-cellular components of tissue microenvironments, for example, glucose consumption rate, hypoxia, and acidosis. Furthermore, simultaneous scanning increases the efficiency of the imaging process which is important for biomedical applications [286].
Raylman and co-workers reported a combined PET/EPRI prototype scanner for sim-ultaneous acquisition of EPR and PET images of hypoxic samples that are created by re-moving endogenous oxygen by adding glucose and glucose oxidase [287]. The PET/EPRI scanner was used to detect oxygen-sensing EPR spin probe [per-deuterated ‘Finland’ tri-methyl (trityl) radical (dFT)] and PET radiotracer 6 in samples (Figure 17). Because it is difficult to control oxygen concentration in the samples, gadolinium was also added to the solution to emulate the presence of oxygen. The study demonstrated that the highest concentration of gadolinium accurately corresponds to the samples with the lowest con-centration of 6. As demonstrated by spectral-linewidth in the EPR images of the samples the scanner has the ability to map oxygen concentration as simulated by the addition of gadolinium. The reported PET/EPRI scanner potentially enables the detection of cellular components of tumor microenvironments. Relatively low spatial resolution and detection sensitivity which are common limitations of the reported preclinical scanner potentially can be overcome using EPR-compatible PET systems with higher resolution and detection sensitivity than the reported scanner [287].
Figure 17. Imaging studies to detect hypoxia using T1-weighted MRI, PET, and EPRI. (A) T1-weighted MRI representing the presence and absence of GdIII-diethylenetriaminepentaacetic acid (defined in this example as Gd), and the presence or absence of 18F. The two variants of PET/EPRI imaging solution include: 1 mM of dFT, 1 mM of Gd and 25 μCi of 6 (defined as the Gd+F– solution), and 1 mM of dFT and 49 μCi of 6 (defined as the GdoF+ solution). (B) PET image intensity is related to the concentration of 6. (C) EPR image of Lorentzian line width, and (D) EPR image of dFT con-centration. Image intensity is related to dFT concentration. Adapted with permission of IOP Pub-lishing, Ltd., from A combined positron emission tomography (PET)-electron paramagnetic reso-nance imaging (EPRI) system: initial evaluation of a prototype scanner, Tseytlin, M.; Stolin, A. V.; Guggilapu, P.; Bobko, A. A.; Khramtsov, V. V.; Tseytlin, O.; Raylman, R. R. 63, 2018; permission conveyed through Copyright Clearance Center, Inc. [287].
Kim and co-workers reported MRI-guided PET/EPRI scanner to probe oxygen con-centration in hypoxic regions of mice bearing squamous cell carcinoma [288]. T2-weighted MRI was used as an anatomical reference to delineate the tumor region. Trityl spin probe and 9 were used to acquire EPRI and PET imaging data, respectively. Because of the re-duced environment prevalent in hypoxic tumors, 9 tends to accumulate in hypoxic cells
Figure 17. Imaging studies to detect hypoxia using T1-weighted MRI, PET, and EPRI. (A) T1-weightedMRI representing the presence and absence of GdIII-diethylenetriaminepentaacetic acid (defined inthis example as Gd), and the presence or absence of 18F. The two variants of PET/EPRI imagingsolution include: 1 mM of dFT, 1 mM of Gd and 25 µCi of 6 (defined as the Gd+F− solution), and1 mM of dFT and 49 µCi of 6 (defined as the GdoF+ solution). (B) PET image intensity is related to theconcentration of 6. (C) EPR image of Lorentzian line width, and (D) EPR image of dFT concentration.Image intensity is related to dFT concentration. Adapted with permission of IOP Publishing, Ltd.,from A combined positron emission tomography (PET)-electron paramagnetic resonance imaging(EPRI) system: initial evaluation of a prototype scanner, Tseytlin, M.; Stolin, A. V.; Guggilapu, P.;Bobko, A. A.; Khramtsov, V. V.; Tseytlin, O.; Raylman, R. R. 63, 2018; permission conveyed throughCopyright Clearance Center, Inc. [287].
Kim and co-workers reported MRI-guided PET/EPRI scanner to probe oxygen concen-tration in hypoxic regions of mice bearing squamous cell carcinoma [288]. T2-weighted MRIwas used as an anatomical reference to delineate the tumor region. Trityl spin probe and 9were used to acquire EPRI and PET imaging data, respectively. Because of the reduced en-vironment prevalent in hypoxic tumors, 9 tends to accumulate in hypoxic cells via covalentbinding with macromolecules after the reduction in its nitro group. Furthermore, glu-tathione tends to bind with reduced 9 and accumulated in hypoxic regions. High uptake of9 is shown in red, and uptake appears within the tumor boundary defined by T2-weightedMRI. Furthermore, the pO2 image from EPRI shows hypoxic regions (pO2 ≤ 10 Torr) bydark blue color in the image. Although there are some discrepancies observed between

Biosensors 2022, 12, 478 23 of 87
PET and EPRI images, some hypoxic regions are overlapped in both PET images using 9and EPRI oxygen images (Figure 18) [288].
Biosensors 2022, 12, x FOR PEER REVIEW 23 of 86
via covalent binding with macromolecules after the reduction in its nitro group. Further-more, glutathione tends to bind with reduced 9 and accumulated in hypoxic regions. High uptake of 9 is shown in red, and uptake appears within the tumor boundary defined by T2-weighted MRI. Furthermore, the pO2 image from EPRI shows hypoxic regions (pO2 ≤ 10 Torr) by dark blue color in the image. Although there are some discrepancies observed between PET and EPRI images, some hypoxic regions are overlapped in both PET images using 9 and EPRI oxygen images (Figure 18) [288].
Figure 18. Tumor slice (Z = 2 mm) of a mouse (23.0 g) bearing a leg-born squamous cell carcinoma. (A) T2-weighted MR image defining the boundary of the tumor and marked by the pink line. (B) PET image of the same slice exhibits large uptake of 9 in the tumor, indicated by red color, and (C) pO2 image of the tumor slice acquired by EPRI. The hypoxic region is indicated by dark blue color. Adapted with permission of Royal Society of Chemistry, from Development of a PET/EPRI com-bined imaging system for assessing tumor hypoxia, Kim, H.; Epel, B.; Sundramoorthy, S.; Tsai, H. M.; Barth, E.; Gertsenshteyn, I.; Halpern, H.; Hua, Y.; Xie, Q.; Chen, C. T.; Kao, C. M. 16, 03, 2021; permission conveyed through Copyright Clearance Center, Inc. [288].
4.9. X-ray CT, MRI, and Photoacoustic Imaging The combination of X-ray CT, MRI, and photoacoustic imaging enhances the preci-
sion and accuracy of the study of tumor environments [289]. The combined system is used to guide the staging of tumors. Li, Li, and co-workers reported mesoporous polydopa-mine nanosponges with embedded tungsten disulfide quantum dots and MnO2 that are responsive to hydrogen peroxide in an acidic tumor microenvironment [285]. These na-noplatforms were evaluated as trimodal contrast agents for X-ray CT, MRI, and multi-spectral photoacoustic imaging. Acidic and elevated hydrogen peroxide levels of tumor microenvironments of 4T1 carcinoma in mice were visualized using this nanoplatform (Figure 19). Because of the presence of acidic hydrogen peroxide, the entry of nanosponges that contained MnO2 to hypoxic cells enhances the contrast of T1-weighted images. Fur-thermore, embedded tungsten disulfide quantum dots provide the radiation enhancement effect in X-ray CT [290].
Figure 18. Tumor slice (Z = 2 mm) of a mouse (23.0 g) bearing a leg-born squamous cell carcinoma.(A) T2-weighted MR image defining the boundary of the tumor and marked by the pink line. (B) PETimage of the same slice exhibits large uptake of 9 in the tumor, indicated by red color, and (C) pO2
image of the tumor slice acquired by EPRI. The hypoxic region is indicated by dark blue color.Adapted with permission of Royal Society of Chemistry, from Development of a PET/EPRI combinedimaging system for assessing tumor hypoxia, Kim, H.; Epel, B.; Sundramoorthy, S.; Tsai, H. M.; Barth,E.; Gertsenshteyn, I.; Halpern, H.; Hua, Y.; Xie, Q.; Chen, C. T.; Kao, C. M. 16, 03, 2021; permissionconveyed through Copyright Clearance Center, Inc. [288].
4.9. X-ray CT, MRI, and Photoacoustic Imaging
The combination of X-ray CT, MRI, and photoacoustic imaging enhances the preci-sion and accuracy of the study of tumor environments [289]. The combined system isused to guide the staging of tumors. Li, Li, and co-workers reported mesoporous poly-dopamine nanosponges with embedded tungsten disulfide quantum dots and MnO2 thatare responsive to hydrogen peroxide in an acidic tumor microenvironment [285]. Thesenanoplatforms were evaluated as trimodal contrast agents for X-ray CT, MRI, and multi-spectral photoacoustic imaging. Acidic and elevated hydrogen peroxide levels of tumormicroenvironments of 4T1 carcinoma in mice were visualized using this nanoplatform(Figure 19). Because of the presence of acidic hydrogen peroxide, the entry of nanospongesthat contained MnO2 to hypoxic cells enhances the contrast of T1-weighted images. Fur-thermore, embedded tungsten disulfide quantum dots provide the radiation enhancementeffect in X-ray CT [290].
Yu, Li, and co-workers reported a nanoshell that contained mesoporous silica nanopar-ticles hybridized with MnO2 nanoparticles and gold nanoseeds [291]. The nanoshellsenter hypoxic cells via enhanced permeability and retention effect. Upon entry, MnO2 wasdegraded and released MnII due to the presence of hydrogen peroxide and acidic milieu ofhypoxic cells, resulting in an increase in signal intensities of both multispectral optoacousticand T1-weighted MRI images (Figure 20) [291].

Biosensors 2022, 12, 478 24 of 87Biosensors 2022, 12, x FOR PEER REVIEW 24 of 86
Figure 19. (A) T1-weighted MRI and (B) X-ray CT images of pre and 12 h post-injection of nano-sponges into a 4T1 tumor-bearing mouse. (C) Multispectral optoacoustic images of 4T1 tumor in-jected with nanosponges. Dashed circles in (A,B) represent the tumor region. Adapted from Bio-materials, 220, Wang, Y.; Song, S.; Lu, T.; Cheng, Y.; Song, Y.; Wang, S.; Tan, F.; Li, J.; Li, N. Oxygen-supplementing mesoporous polydopamine nanosponges with WS2 QDs-embedded for CT/MSOT/MR imaging and thermoradiotherapy of hypoxic cancer. 119405, Copyright 2019, with permission from Elsevier [290].
Yu, Li, and co-workers reported a nanoshell that contained mesoporous silica nano-particles hybridized with MnO2 nanoparticles and gold nanoseeds [291]. The nanoshells enter hypoxic cells via enhanced permeability and retention effect. Upon entry, MnO2 was degraded and released MnII due to the presence of hydrogen peroxide and acidic milieu of hypoxic cells, resulting in an increase in signal intensities of both multispectral optoa-coustic and T1-weighted MRI images (Figure 20) [291].
Figure 20. (A) T1-weighted images, (B) X-ray CT images, and (C) multispectral optoacoustic images of 4T1 tumor before and after injection with nanoparticles. Dash circles of (A,B) represent the tumor
Figure 19. (A) T1-weighted MRI and (B) X-ray CT images of pre and 12 h post-injection ofnanosponges into a 4T1 tumor-bearing mouse. (C) Multispectral optoacoustic images of 4T1 tu-mor injected with nanosponges. Dashed circles in (A,B) represent the tumor region. Adaptedfrom Biomaterials, 220, Wang, Y.; Song, S.; Lu, T.; Cheng, Y.; Song, Y.; Wang, S.; Tan, F.; Li, J.; Li,N. Oxygen-supplementing mesoporous polydopamine nanosponges with WS2 QDs-embedded forCT/MSOT/MR imaging and thermoradiotherapy of hypoxic cancer. 119405, Copyright 2019, withpermission from Elsevier [290].
Biosensors 2022, 12, x FOR PEER REVIEW 24 of 86
Figure 19. (A) T1-weighted MRI and (B) X-ray CT images of pre and 12 h post-injection of nano-sponges into a 4T1 tumor-bearing mouse. (C) Multispectral optoacoustic images of 4T1 tumor in-jected with nanosponges. Dashed circles in (A,B) represent the tumor region. Adapted from Bio-materials, 220, Wang, Y.; Song, S.; Lu, T.; Cheng, Y.; Song, Y.; Wang, S.; Tan, F.; Li, J.; Li, N. Oxygen-supplementing mesoporous polydopamine nanosponges with WS2 QDs-embedded for CT/MSOT/MR imaging and thermoradiotherapy of hypoxic cancer. 119405, Copyright 2019, with permission from Elsevier [290].
Yu, Li, and co-workers reported a nanoshell that contained mesoporous silica nano-particles hybridized with MnO2 nanoparticles and gold nanoseeds [291]. The nanoshells enter hypoxic cells via enhanced permeability and retention effect. Upon entry, MnO2 was degraded and released MnII due to the presence of hydrogen peroxide and acidic milieu of hypoxic cells, resulting in an increase in signal intensities of both multispectral optoa-coustic and T1-weighted MRI images (Figure 20) [291].
Figure 20. (A) T1-weighted images, (B) X-ray CT images, and (C) multispectral optoacoustic images of 4T1 tumor before and after injection with nanoparticles. Dash circles of (A,B) represent the tumor Figure 20. (A) T1-weighted images, (B) X-ray CT images, and (C) multispectral optoacoustic imagesof 4T1 tumor before and after injection with nanoparticles. Dash circles of (A,B) represent the tumorregion. Adapted from Methods in Enzymology, 657, Xu, S.; Shi, X.; Chu, C.; Liu, G. A TME-activated insitu nanogenerator for magnetic resonance/fluorescence/photoacoustic imaging, 145–156, Copyright2021, with permission from Elsevier [291].

Biosensors 2022, 12, 478 25 of 87
4.10. Fluorescence, Photoacoustic Imaging, and MRI
Precise and reliable information about tumors can be obtained by combining fluores-cence, photoacoustic imaging, and MRI [292–296]. With this combination, high sensitivity,deep tissue penetration, and high-resolution imaging are combined to generate a compre-hensive picture of the hypoxic tumor region. Cao, Xue, and co-workers reported a hollowmesoporous copper sulfide and MnO2-based core–shell nanoplatform encapsulating afluorophore, chlorin e6 (Ce6) as a highly efficient imaging and therapeutic agent for tumorhypoxia (Figure 21) [297]. Upon entering into the tumor via the enhanced permeabilityand retention effect, mild acidic conditions with elevated hydrogen peroxide levels causedegradation of MnO2. The subsequent release of MnII causes enhanced MRI signal andexposes encapsulated Ce6 that increases both fluorescence and photoacoustic signals. Theacidic milieu of tumor microenvironments can be detected using this trimodal imagingstrategy because of the combined properties of each imaging modality [297].
Biosensors 2022, 12, x FOR PEER REVIEW 25 of 86
region. Adapted from Methods in Enzymology, 657, Xu, S.; Shi, X.; Chu, C.; Liu, G. A TME-activated in situ nanogenerator for magnetic resonance/fluorescence/photoacoustic imaging, 145–156, Copy-right 2021, with permission from Elsevier [291].
4.10. Fluorescence, Photoacoustic Imaging, and MRI Precise and reliable information about tumors can be obtained by combining fluores-
cence, photoacoustic imaging, and MRI [292–296]. With this combination, high sensitivity, deep tissue penetration, and high-resolution imaging are combined to generate a compre-hensive picture of the hypoxic tumor region. Cao, Xue, and co-workers reported a hollow mesoporous copper sulfide and MnO2-based core–shell nanoplatform encapsulating a fluorophore, chlorin e6 (Ce6) as a highly efficient imaging and therapeutic agent for tumor hypoxia (Figure 21) [297]. Upon entering into the tumor via the enhanced permeability and retention effect, mild acidic conditions with elevated hydrogen peroxide levels cause degradation of MnO2. The subsequent release of MnII causes enhanced MRI signal and exposes encapsulated Ce6 that increases both fluorescence and photoacoustic signals. The acidic milieu of tumor microenvironments can be detected using this trimodal imaging strategy because of the combined properties of each imaging modality [297].
Figure 21. In vivo multimodal imaging. (A) Fluorescence images of mice bearing 4T1 tumors at 0, 3, 6, 12, 24, and 48 h after the injection of nanocomposite and fluorescence images of ex vivo organs and tumors excised at 24 h post-injection. (B) T1-weighted MRI of mice bearing 4T1 tumors at dif-ferent time points after intravenous injection of nanocomposite, and (C) photoacoustic images in tumor region at 24 h before and after intravenous injection of nanocomposite. The white dashed lines enclose the tumor sites. Adapted with permission of the Royal Society of Chemistry, from A HMCuS@MnO2 nanocomplex responsive to multiple tumor environmental clues for photoacous-tic/fluorescence/magnetic resonance trimodal imaging-guided and enhanced photothermal/photo-dynamic therapy, Li, Q.; Ren, J.; Chen, Q.; Liu, W.; Xu, Z.; Cao, Y.; Kang, Y.; Xue, P. 12, 23, 2020; permission conveyed through Copyright Clearance Center, Inc. [297].
Figure 21. In vivo multimodal imaging. (A) Fluorescence images of mice bearing 4T1 tumors at0, 3, 6, 12, 24, and 48 h after the injection of nanocomposite and fluorescence images of ex vivoorgans and tumors excised at 24 h post-injection. (B) T1-weighted MRI of mice bearing 4T1 tumorsat different time points after intravenous injection of nanocomposite, and (C) photoacoustic im-ages in tumor region at 24 h before and after intravenous injection of nanocomposite. The whitedashed lines enclose the tumor sites. Adapted with permission of the Royal Society of Chem-istry, from A HMCuS@MnO2 nanocomplex responsive to multiple tumor environmental clues forphotoacoustic/fluorescence/magnetic resonance trimodal imaging-guided and enhanced photother-mal/photodynamic therapy, Li, Q.; Ren, J.; Chen, Q.; Liu, W.; Xu, Z.; Cao, Y.; Kang, Y.; Xue, P. 12, 23,2020; permission conveyed through Copyright Clearance Center, Inc. [297].
5. Dual-Mode Hypoxia-Responsive Probes
Information regarding the physiological status of tumors can be detected using molec-ular switches that are capable of differentiating hypoxic and normoxic conditions. Some

Biosensors 2022, 12, 478 26 of 87
multimodal imaging agents can be used to image tumors, and multiple imaging modalitiescan be used to detect these imaging agents. In this section, responsive imaging agents aredescribed that are both (1) sensitive to hypoxia or hypoxia-induced pathological changesand (2) detectable using more than one imaging modality (Table 4). Advantages of the useof dual-mode hypoxia-responsive probes include the ability to overcome the concentrationdependence of responsive probes, overcome the limitations of each method, and obtaininformation about tumor microenvironments.
Table 4. Summary of dual-mode hypoxia-responsive probes.
Dual-Mode Imaging Method Advantages Limitations
Optical imaging and MRI sensitivity, depth penetration, and spatialresolution
photostability of chromophores, contrastenhancement can beconcentration-dependent
Fluorescence and colorimetric imaging sensitivity, low cost photostability of chromophores
SERS and fluorescence imaging sensitivity, photostability Invasive
SERS and colorimetric imaging photostability, low cost Invasive
Fluorescence and photoacoustic imaging sensitivity, depth penetration,noninvasive photostability of chromophores
Photoacoustic imaging and MRI Noninvasive, sensitivity, resolution, anddepth penetration photostability of chromophores
T1- and T2-weighted MRI Accuracy of information Difficult designing probes that are bothT1 and T2 active
1H- and 19F-MRIAnatomical and tracer informationovercomes concentration dependency ofprobes
solubility of 19F-containing probes,sensitivity of 1H-MRI
T1-weighted MRI and CESTAnatomical and functional informationovercomes concentration dependencyof probes
Time-consuming, low sensitivity of1H-MRI
5.1. Optical Imaging and MRI
Among various types of optical imaging techniques, great attention has been placed onthe use of time-gated luminescence with lanthanide-containing complexes [298–301]. Thesecomplexes have luminescence lifetimes that are longer than hundreds of microseconds,and consequently, they enable the ability to avoid short-lived (~ns) background fluores-cence and scattered excitation in optical imaging, causing improvements in signal-to-noiseratios compared to steady-state experiments. Combined with MRI, which has high spatialresolution and nearly unlimited depth penetration, Song, Tan, and co-workers reported atime-gated luminescence and MRI dual-mode nanoprobe for glutathione detection, whereglutathione is one of the key biomarkers of hypoxic tumors [302]. A β-diketone-EuIII-containing complex served as the luminescent material, and it was anchored to layeredMnO2 nanosheets. The nanocomposite exhibited weak luminescence and MRI signal due tothe quenching of both signals by MnO2. After peritumoral injection of the nanoprobe, bothtime-gated luminescence enhancement and T2-weighted MRI contrast enhancement wereobserved in the tumor region compared to control experiments in the healthy subcutaneoustissue of the same mouse (Figure 22). This observation was attributed to the presence of alarge amount of glutathione that reduced MnO2 nanosheets into MnII ions. The study fo-cused on increasing hypoxia detection accuracy and combining complementary advantagesof fluorescence and MRI [302].
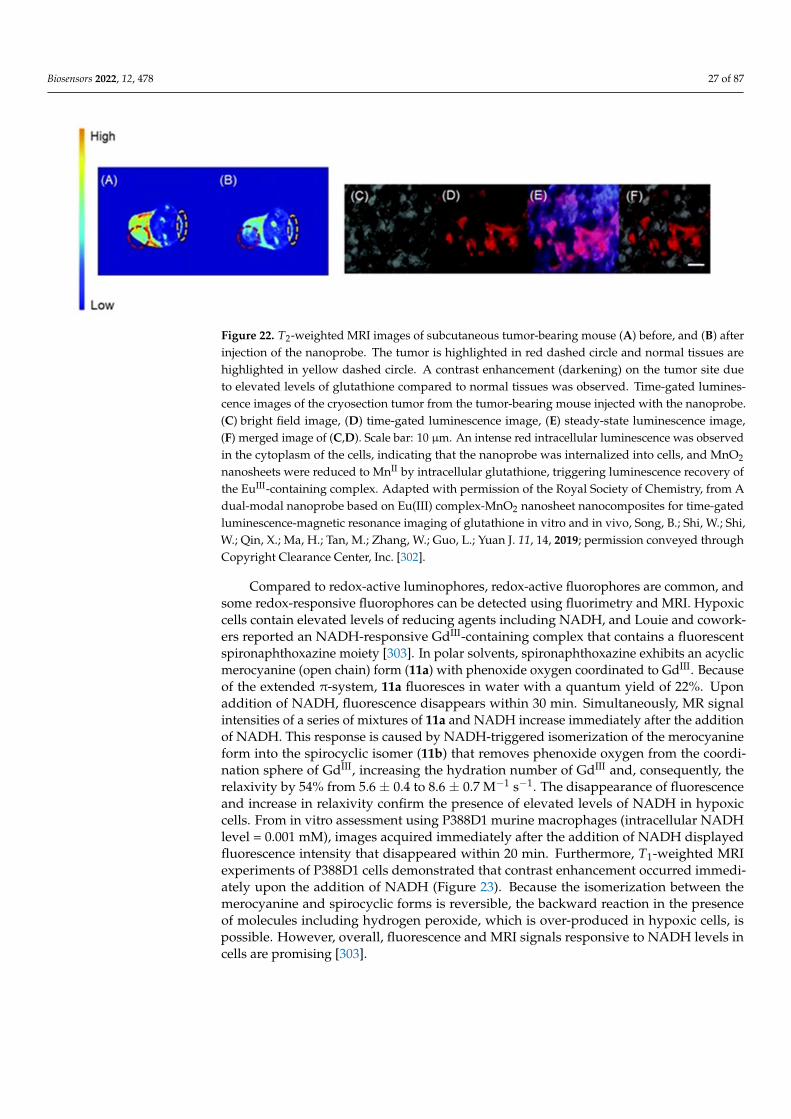
Biosensors 2022, 12, 478 27 of 87Biosensors 2022, 12, x FOR PEER REVIEW 27 of 86
Figure 22. T2-weighted MRI images of subcutaneous tumor-bearing mouse (A) before, and (B) after injection of the nanoprobe. The tumor is highlighted in red dashed circle and normal tissues are highlighted in yellow dashed circle. A contrast enhancement (darkening) on the tumor site due to elevated levels of glutathione compared to normal tissues was observed. Time-gated luminescence images of the cryosection tumor from the tumor-bearing mouse injected with the nanoprobe. (C) bright field image, (D) time-gated luminescence image, (E) steady-state luminescence image, (F) merged image of (C,D). Scale bar: 10 μm. An intense red intracellular luminescence was observed in the cytoplasm of the cells, indicating that the nanoprobe was internalized into cells, and MnO2 nanosheets were reduced to MnII by intracellular glutathione, triggering luminescence recovery of the EuIII-containing complex. Adapted with permission of the Royal Society of Chemistry, from A dual-modal nanoprobe based on Eu(III) complex-MnO2 nanosheet nanocomposites for time-gated luminescence-magnetic resonance imaging of glutathione in vitro and in vivo, Song, B.; Shi, W.; Shi, W.; Qin, X.; Ma, H.; Tan, M.; Zhang, W.; Guo, L.; Yuan J. 11, 14, 2019; permission conveyed through Copyright Clearance Center, Inc. [302].
Compared to redox-active luminophores, redox-active fluorophores are common, and some redox-responsive fluorophores can be detected using fluorimetry and MRI. Hy-poxic cells contain elevated levels of reducing agents including NADH, and Louie and coworkers reported an NADH-responsive GdIII-containing complex that contains a fluo-rescent spironaphthoxazine moiety [303]. In polar solvents, spironaphthoxazine exhibits an acyclic merocyanine (open chain) form (11a) with phenoxide oxygen coordinated to GdIII. Because of the extended π-system, 11a fluoresces in water with a quantum yield of 22%. Upon addition of NADH, fluorescence disappears within 30 min. Simultaneously, MR signal intensities of a series of mixtures of 11a and NADH increase immediately after the addition of NADH. This response is caused by NADH-triggered isomerization of the merocyanine form into the spirocyclic isomer (11b) that removes phenoxide oxygen from the coordination sphere of GdIII, increasing the hydration number of GdIII and, conse-quently, the relaxivity by 54% from 5.6 ± 0.4 to 8.6 ± 0.7 M–1 s–1. The disappearance of fluorescence and increase in relaxivity confirm the presence of elevated levels of NADH in hypoxic cells. From in vitro assessment using P388D1 murine macrophages (intracellu-lar NADH level = 0.001 mM), images acquired immediately after the addition of NADH displayed fluorescence intensity that disappeared within 20 min. Furthermore, T1-weighted MRI experiments of P388D1 cells demonstrated that contrast enhancement oc-curred immediately upon the addition of NADH (Figure 23). Because the isomerization between the merocyanine and spirocyclic forms is reversible, the backward reaction in the presence of molecules including hydrogen peroxide, which is over-produced in hypoxic cells, is possible. However, overall, fluorescence and MRI signals responsive to NADH levels in cells are promising [303].
Figure 22. T2-weighted MRI images of subcutaneous tumor-bearing mouse (A) before, and (B) afterinjection of the nanoprobe. The tumor is highlighted in red dashed circle and normal tissues arehighlighted in yellow dashed circle. A contrast enhancement (darkening) on the tumor site dueto elevated levels of glutathione compared to normal tissues was observed. Time-gated lumines-cence images of the cryosection tumor from the tumor-bearing mouse injected with the nanoprobe.(C) bright field image, (D) time-gated luminescence image, (E) steady-state luminescence image,(F) merged image of (C,D). Scale bar: 10 µm. An intense red intracellular luminescence was observedin the cytoplasm of the cells, indicating that the nanoprobe was internalized into cells, and MnO2
nanosheets were reduced to MnII by intracellular glutathione, triggering luminescence recovery ofthe EuIII-containing complex. Adapted with permission of the Royal Society of Chemistry, from Adual-modal nanoprobe based on Eu(III) complex-MnO2 nanosheet nanocomposites for time-gatedluminescence-magnetic resonance imaging of glutathione in vitro and in vivo, Song, B.; Shi, W.; Shi,W.; Qin, X.; Ma, H.; Tan, M.; Zhang, W.; Guo, L.; Yuan J. 11, 14, 2019; permission conveyed throughCopyright Clearance Center, Inc. [302].
Compared to redox-active luminophores, redox-active fluorophores are common, andsome redox-responsive fluorophores can be detected using fluorimetry and MRI. Hypoxiccells contain elevated levels of reducing agents including NADH, and Louie and cowork-ers reported an NADH-responsive GdIII-containing complex that contains a fluorescentspironaphthoxazine moiety [303]. In polar solvents, spironaphthoxazine exhibits an acyclicmerocyanine (open chain) form (11a) with phenoxide oxygen coordinated to GdIII. Becauseof the extended π-system, 11a fluoresces in water with a quantum yield of 22%. Uponaddition of NADH, fluorescence disappears within 30 min. Simultaneously, MR signalintensities of a series of mixtures of 11a and NADH increase immediately after the additionof NADH. This response is caused by NADH-triggered isomerization of the merocyanineform into the spirocyclic isomer (11b) that removes phenoxide oxygen from the coordi-nation sphere of GdIII, increasing the hydration number of GdIII and, consequently, therelaxivity by 54% from 5.6 ± 0.4 to 8.6 ± 0.7 M−1 s−1. The disappearance of fluorescenceand increase in relaxivity confirm the presence of elevated levels of NADH in hypoxiccells. From in vitro assessment using P388D1 murine macrophages (intracellular NADHlevel = 0.001 mM), images acquired immediately after the addition of NADH displayedfluorescence intensity that disappeared within 20 min. Furthermore, T1-weighted MRIexperiments of P388D1 cells demonstrated that contrast enhancement occurred immedi-ately upon the addition of NADH (Figure 23). Because the isomerization between themerocyanine and spirocyclic forms is reversible, the backward reaction in the presenceof molecules including hydrogen peroxide, which is over-produced in hypoxic cells, ispossible. However, overall, fluorescence and MRI signals responsive to NADH levels incells are promising [303].

Biosensors 2022, 12, 478 28 of 87Biosensors 2022, 12, x FOR PEER REVIEW 28 of 86
Figure 23. (A) The isomerization of complex 11 triggered by NADH and hydrogen peroxide. (B) Fluorescence images of P388D1 murine macrophages incubated with complex 11 obtained during the reaction with NADH (concentration of 11 = 0.103 mM, Gd/NADH molar ratio = 1:1). (C) T1-weighted MRI images of aqueous solutions of 11 immediately after addition of NADH (molar ratio between GdIII and NADH = 1:1). Adapted with permission from Tu, C.; Nagao R.; Louie, A. Y. An-gewandte Chemie International Edition, John Wiley and Sons [303].
Johnson and coworkers reported nitroxide radicals that can turn off MR signal and turn on fluorescence signal using redox-responsive branched-bottlebrush polymer nano-particles (Figure 24) [304]. The polymer backbone is composed of multiple repeating units of nitroxide-radical-containing organic molecules (12a) and cyanin5.5 near-IR fluoro-phores (12b). Nitroxide radicals are quenchers of excited singlet states of fluorophores, and therefore, the fluorescence emission of 12b is partially quenched in the nanoparticles. Because nitroxide contains a single unpaired electron, nitroxides catalytically shorten lon-gitudinal relaxation times of nearby water protons to enhance the contrast of T1-weighted images. However, upon reacting with ascorbate or glutathione, nitroxides are reduced to diamagnetic hydroxylamines, leading to a decreased MRI contrast enhancement coupled with a 2- to 3.5-fold increase in fluorescence emission. Glutathione is over-expressed in hypoxic cells, and therefore, glutathione and other reducing agents including ascorbate mimic hypoxic tumors. In vivo, MRI and fluorescence imaging was performed by admin-istering a solution of polymer nanoparticles in phosphate-buffered saline to mice (Figure 24) [304].
Figure 23. (A) The isomerization of complex 11 triggered by NADH and hydrogen peroxide.(B) Fluorescence images of P388D1 murine macrophages incubated with complex 11 obtained dur-ing the reaction with NADH (concentration of 11 = 0.103 mM, Gd/NADH molar ratio = 1:1). (C)T1-weighted MRI images of aqueous solutions of 11 immediately after addition of NADH (molarratio between GdIII and NADH = 1:1). Adapted with permission from Tu, C.; Nagao R.; Louie, A. Y.Angewandte Chemie International Edition, John Wiley and Sons [303].
Johnson and coworkers reported nitroxide radicals that can turn off MR signal andturn on fluorescence signal using redox-responsive branched-bottlebrush polymer nanopar-ticles (Figure 24) [304]. The polymer backbone is composed of multiple repeating units ofnitroxide-radical-containing organic molecules (12a) and cyanin5.5 near-IR fluorophores(12b). Nitroxide radicals are quenchers of excited singlet states of fluorophores, and there-fore, the fluorescence emission of 12b is partially quenched in the nanoparticles. Becausenitroxide contains a single unpaired electron, nitroxides catalytically shorten longitudinalrelaxation times of nearby water protons to enhance the contrast of T1-weighted images.However, upon reacting with ascorbate or glutathione, nitroxides are reduced to diamag-netic hydroxylamines, leading to a decreased MRI contrast enhancement coupled with a 2-to 3.5-fold increase in fluorescence emission. Glutathione is over-expressed in hypoxic cells,and therefore, glutathione and other reducing agents including ascorbate mimic hypoxictumors. In vivo, MRI and fluorescence imaging was performed by administering a solutionof polymer nanoparticles in phosphate-buffered saline to mice (Figure 24) [304].
Tan and co-workers reported a dual-activatable fluorescence and MRI bimodalglutathione-responsive nanoprobe that combined fluorescence cyanine5-labeled aptamerswith redox-active MnO2 nanosheets (Figure 25) [305]. MnO2 efficiently quenched the fluo-rescence of cyanine5-labeled aptamers adsorbed onto the MnO2 nanosheets. The bindingof aptamers to target cells caused partial recovery of fluorescence followed by endocytosisof the MnO2 nanosheets. Once endocytosed, the MnO2 nanosheets were reduced by intra-cellular glutathione, which is over-expressed in hypoxic cells, releasing MnII that enhancedcontrast in T1-weighted MRI. The study enabled the combination of fluorescence and MRIfor the precise detection of hypoxic cells with elevated glutathione levels (Figure 25) [305].

Biosensors 2022, 12, 478 29 of 87Biosensors 2022, 12, x FOR PEER REVIEW 29 of 86
Figure 24. (A) Chemical structures of nitroxide-radical-containing organic molecule (12a) and cya-nin5.5 near-IR fluorophore (12b) used to synthesize the polymer. (B) (left) T1-weighted MRI image of whole mouse before nanoparticle injection and (right) T1-weighted MRI image of the same mouse 30 min after nanoparticle injection. Some organs and tissues outlined for reference. The red asterisk indicates the structure labeled as aorta could also include inferior vena cava. The green asterisk indicates the structure labeled as renal pelvis could also include renal artery and renal vein. (C) Near-IR fluorescence imaging studies. (left) fluorescence image of whole mouse before nanoparticle injection. (right) fluorescence image of the same mouse in 30 min after injection. Maximum fluores-cence is observed in the liver and kidneys, implying that the nitroxide radical-containing nanopar-ticles accumulate in the liver mostly in the reduced state. Adapted by permission from Springer Nature and Copyright Clearance Center: Springer Nature, Nature Communications, Redox-respon-sive branched-bottlebrush polymers for in vivo MRI and fluorescence imaging, Sowers, M. A.; McCombs, J. R.; Wang, Y.; Paletta, J. T.; Morton, S. W.; Dreaden, E. C.; Boska, M. D.; Ottaviani, M. F.; Hammond, P. T.; Rajca, A.; Johnson, J. A. Copyright 2014 [304].
Tan and co-workers reported a dual-activatable fluorescence and MRI bimodal glu-tathione-responsive nanoprobe that combined fluorescence cyanine5-labeled aptamers with redox-active MnO2 nanosheets (Figure 25) [305]. MnO2 efficiently quenched the flu-orescence of cyanine5-labeled aptamers adsorbed onto the MnO2 nanosheets. The binding of aptamers to target cells caused partial recovery of fluorescence followed by endocytosis of the MnO2 nanosheets. Once endocytosed, the MnO2 nanosheets were reduced by intra-cellular glutathione, which is over-expressed in hypoxic cells, releasing MnII that en-hanced contrast in T1-weighted MRI. The study enabled the combination of fluorescence and MRI for the precise detection of hypoxic cells with elevated glutathione levels (Figure 25) [305].
Figure 24. (A) Chemical structures of nitroxide-radical-containing organic molecule (12a) andcyanin5.5 near-IR fluorophore (12b) used to synthesize the polymer. (B) (left) T1-weighted MRIimage of whole mouse before nanoparticle injection and (right) T1-weighted MRI image of the samemouse 30 min after nanoparticle injection. Some organs and tissues outlined for reference. The redasterisk indicates the structure labeled as aorta could also include inferior vena cava. The greenasterisk indicates the structure labeled as renal pelvis could also include renal artery and renal vein.(C) Near-IR fluorescence imaging studies. (left) fluorescence image of whole mouse before nanopar-ticle injection. (right) fluorescence image of the same mouse in 30 min after injection. Maximumfluorescence is observed in the liver and kidneys, implying that the nitroxide radical-containingnanoparticles accumulate in the liver mostly in the reduced state. Adapted by permission fromSpringer Nature and Copyright Clearance Center: Springer Nature, Nature Communications, Redox-responsive branched-bottlebrush polymers for in vivo MRI and fluorescence imaging, Sowers, M. A.;McCombs, J. R.; Wang, Y.; Paletta, J. T.; Morton, S. W.; Dreaden, E. C.; Boska, M. D.; Ottaviani, M. F.;Hammond, P. T.; Rajca, A.; Johnson, J. A. Copyright 2014 [304].
Additionally using aptamers, Li and co-workers reported glutathione-activated ap-tamer nanoprobes with excellent sensitivity and selectivity [306]. In this case, rolling circleamplification technology improved the fluorescence signal of the probe. Target speci-ficity of the probe was achieved by adsorbing fluorophore-labeled DNA aptamers ontoMnO2 nanosheets. The fluorescence of the adsorbed aptamers was quenched by the MnO2nanosheets. Reduction in MnO2 by intracellular glutathione released MnII that enhancescontrast in T1-weighted MRI followed by initiating rolling circle amplification reaction inthe presence of Phi29 DNA polymerase, circular DNA template, and deoxynucleotides(Figure 26). Long hairpin DNA probes carrying a large number of small hairpin DNAstrands were produced in situ because of the action of rolling circle amplification. Anamplified fluorescence signal enhances the sensitivity of the nanoprobe. The selectivity ofthe probe was demonstrated using various proteins, acids, and sugars that could provideinterference for glutathione in cells, and those interferences were minimal [306].

Biosensors 2022, 12, 478 30 of 87Biosensors 2022, 12, x FOR PEER REVIEW 30 of 86
Figure 25. (A) T1-weighted MRI images of CCRF-CEM (hypoxic tumor cell line) cells and (B) Ramos (normoxic cell line) cells incubated with nanosheet at various concentrations in media for 3 h. Once MnO2 nanosheets are endocytosed and reduced by glutathione, MnII ions are produced. As a result, enhancement in T1-weighted MRI images was observed in hypoxic cells compared to normoxic cells. (C,D) Confocal microscopic images of CCRF-CEM cells treated with nanosheets. (E,F) Confocal mi-croscopic images of Ramos cells treated with nanosheets. Red fluorescence was observed in the CCRF-CEM cells compared to Ramos cells after treated with nanosheets, indicating the fluorescence response of the nanosheets was activated in hypoxic cells. Adapted with permission from Zhao, Z.; Fan, H.; Zhou, G.; Bai, H.; Liang, H.; Wang, R.; Zhang, X.; Tan, W. Activatable fluorescence/MRI bimodal platform for tumor cell imaging via MnO2 nanosheet–aptamer nanoprobe. J. Am. Chem. Soc., 2014, 136, 11220–11223. Copyright 2014 American Chemical Society [305].
Additionally using aptamers, Li and co-workers reported glutathione-activated ap-tamer nanoprobes with excellent sensitivity and selectivity [306]. In this case, rolling circle amplification technology improved the fluorescence signal of the probe. Target specificity of the probe was achieved by adsorbing fluorophore-labeled DNA aptamers onto MnO2 nanosheets. The fluorescence of the adsorbed aptamers was quenched by the MnO2 nanosheets. Reduction in MnO2 by intracellular glutathione released MnII that enhances contrast in T1-weighted MRI followed by initiating rolling circle amplification reaction in the presence of Phi29 DNA polymerase, circular DNA template, and deoxynucleotides (Figure 26). Long hairpin DNA probes carrying a large number of small hairpin DNA strands were produced in situ because of the action of rolling circle amplification. An am-plified fluorescence signal enhances the sensitivity of the nanoprobe. The selectivity of the probe was demonstrated using various proteins, acids, and sugars that could provide in-terference for glutathione in cells, and those interferences were minimal [306].
Figure 25. (A) T1-weighted MRI images of CCRF-CEM (hypoxic tumor cell line) cells and (B) Ramos(normoxic cell line) cells incubated with nanosheet at various concentrations in media for 3 h. OnceMnO2 nanosheets are endocytosed and reduced by glutathione, MnII ions are produced. As a result,enhancement in T1-weighted MRI images was observed in hypoxic cells compared to normoxiccells. (C,D) Confocal microscopic images of CCRF-CEM cells treated with nanosheets. (E,F) Confocalmicroscopic images of Ramos cells treated with nanosheets. Red fluorescence was observed in theCCRF-CEM cells compared to Ramos cells after treated with nanosheets, indicating the fluorescenceresponse of the nanosheets was activated in hypoxic cells. Adapted with permission from Zhao, Z.;Fan, H.; Zhou, G.; Bai, H.; Liang, H.; Wang, R.; Zhang, X.; Tan, W. Activatable fluorescence/MRIbimodal platform for tumor cell imaging via MnO2 nanosheet–aptamer nanoprobe. J. Am. Chem. Soc.,2014, 136, 11220–11223. Copyright 2014 American Chemical Society [305].
Wu, Yu, Gan, and co-workers combined fluorescence and MRI to develop a dual-modehydrogen peroxide-responsive bio-imaging nanoprobe based on two-photon carbon quan-tum dots for fluorescence imaging and MnO2 for MRI (TP-CQDs@MnO2) [307]. Comparedto one-photon fluorescence, two-photon fluorescence imaging enables deeper tissue pene-tration and minimal background interference. The nanoprobe displayed high selectivityand spatial resolution with a low detection limit (1.425 pM) for hydrogen peroxide enablingdifferentiation between hydrogen peroxide levels in normal and hypoxic tissue. MnO2nanosheets in the probe serve as a carrier and fluorescence quencher of the quantum dots.Upon endocytosis, MnO2 sheets degrade to MnII and subsequently enhance the contrast ofT1-weighted MRI (Figure 27A). Additionally, upon degradation of MnO2 sheets, carbonquantum dots are released, increasing fluorescence intensity with two-photon fluorescenceimaging (Figure 27B) [307].
Li, Wang, and co-workers reported the use of fluorophore-bound Mn-based nanopar-ticles and nanosheets that have the ability to enhance T1-weighted contrast in MRI andfluorescence intensity under hypoxia-induced stimuli, including low pH and a reducingenvironment [308]. A hybrid silica nanoshell was prepared by encapsulating MnO nanopar-ticles and the fluorophore coumarin-545T. To enhance target specificity, the nanoprobeswere conjugated with folic acid to target tumor cells that overexpress folate receptors. In thisnanosystem, MnO nanoparticles serve as fluorescence quenchers of coumarin-545T. Uponreceptor-mediated endocytosis into tumor cells, acidic conditions cause dissolution of MnOinto MnII ions, resulting in contrast enhancement in T1-weighted MRI. Simultaneously,the fluorescence of coumarin-545T recovered. The presence of an acidic environment wasconfirmed using the nanoprobe that turns on both MRI and fluorescence signals. In vitroassessment of these nanoprobes was conducted using human dermal (HaCaT) and cervicalcancer (HeLa) cell lines. Green fluorescence and contrast enhancement in T1-weighted MRI

Biosensors 2022, 12, 478 31 of 87
was observed in HeLa cells more than in HaCaT cells because of the acidic environment ofthe HeLa cells (Figure 28) [308].
Biosensors 2022, 12, x FOR PEER REVIEW 31 of 86
Figure 26. (A,B) Confocal microscopic images of CCRF-CEM cells and (C,D) Ramos cells treated with the nanoprobe, and the fluorescence signal amplified using rolling circle amplification. CCRF-CEM cells exhibited a green fluorescence compared to Ramos cells indicating that the fluorescence response of the nanoprobe was target cell-specific and activated by hypoxia. T1-weighted images of (E) CCRF-CEM cells and (F) Ramos cells incubated with the nanoprobe at various volumes (left to right: untreated, 30 μL, and 100 μL). CCRF-CEM cells exhibited more contrast enhancement in T1-weighted images compared to Ramos cells. These results were attributed to the target-cell recognition of the nanoprobe and reduction in MnO2 by intracellular glutathione. Adapted with permission [306].
Wu, Yu, Gan, and co-workers combined fluorescence and MRI to develop a dual-mode hydrogen peroxide-responsive bio-imaging nanoprobe based on two-photon car-bon quantum dots for fluorescence imaging and MnO2 for MRI (TP-CQDs@MnO2) [307]. Compared to one-photon fluorescence, two-photon fluorescence imaging enables deeper tissue penetration and minimal background interference. The nanoprobe displayed high selectivity and spatial resolution with a low detection limit (1.425 pM) for hydrogen per-oxide enabling differentiation between hydrogen peroxide levels in normal and hypoxic tissue. MnO2 nanosheets in the probe serve as a carrier and fluorescence quencher of the quantum dots. Upon endocytosis, MnO2 sheets degrade to MnII and subsequently enhance the contrast of T1-weighted MRI (Figure 27A). Additionally, upon degradation of MnO2 sheets, carbon quantum dots are released, increasing fluorescence intensity with two-pho-ton fluorescence imaging (Figure 27B) [307].
Figure 26. (A,B) Confocal microscopic images of CCRF-CEM cells and (C,D) Ramos cells treatedwith the nanoprobe, and the fluorescence signal amplified using rolling circle amplification. CCRF-CEM cells exhibited a green fluorescence compared to Ramos cells indicating that the fluorescenceresponse of the nanoprobe was target cell-specific and activated by hypoxia. T1-weighted imagesof (E) CCRF-CEM cells and (F) Ramos cells incubated with the nanoprobe at various volumes (leftto right: untreated, 30 µL, and 100 µL). CCRF-CEM cells exhibited more contrast enhancementin T1-weighted images compared to Ramos cells. These results were attributed to the target-cellrecognition of the nanoprobe and reduction in MnO2 by intracellular glutathione. Adapted withpermission [306].

Biosensors 2022, 12, 478 32 of 87Biosensors 2022, 12, x FOR PEER REVIEW 32 of 86
Figure 27. In vitro studies of MCF-7 cells incubated with TP-CQDs@MnO2 (375.0 μg mL–1). (A) T1-weighted MRI images of MCF-7 cells: PMA = cells incubated with TP-CQDs@MnO2 and phorbol-12-myristate-13-acetate; control = cells incubated with TP-CQDs@MnO2; NAC = cells incubated with TP-CQDs@MnO2 and N-acetyl-L-cystein (NAC); and blank = cells in buffer without adding TP-CQDs@MnO2. PMA is a hydrogen peroxide stimulant and NAC is a hydrogen peroxide scavenger. The brightest fluorescence of the two-photon images was observed with cells incubated with PMA and the weakest fluorescence was observed with cells incubated with NAC. The bright T1-weighted image of the control sample compared to the blank indicates that the TP-CQDs@MnO2 probe selec-tively visualizes endogenous hydrogen peroxide in MCF-7 cells. (B) Two-photon fluorescence im-ages of MCF-7 cells incubated with TP-CQDs@MnO2 (375.0 μg mL–1). Blank = cells in buffer without adding TP-CQDs@MnO2; NAC = cells incubated with TP-CQDs@MnO2 and NAC; control = cells in-cubated with TP-CQDs@MnO2; PMA = cells incubated with TP-CQDs@MnO2 and PMA. Scale bars represent 20.0 μm. The fluorescence images show that the nanoprobe responds to endogenous hy-drogen peroxide in a tumor microenvironment using two-photon fluorescence. Adapted with per-mission of the Royal Society of Chemistry, from Two-photon fluorescence and MR bio-imaging of endogenous H2O2 in the tumor microenvironment using a dual-mode nanoprobe. Zhong, H.; Yu, S.; Li, B.; He, K.; Li, D.; Wang, X.; Wu, Y.-X. 57, 51, 2021; permission conveyed through Copyright Clearance Center, Inc. [307].
Li, Wang, and co-workers reported the use of fluorophore-bound Mn-based nano-particles and nanosheets that have the ability to enhance T1-weighted contrast in MRI and fluorescence intensity under hypoxia-induced stimuli, including low pH and a reducing environment [308]. A hybrid silica nanoshell was prepared by encapsulating MnO nano-particles and the fluorophore coumarin-545T. To enhance target specificity, the nano-probes were conjugated with folic acid to target tumor cells that overexpress folate recep-tors. In this nanosystem, MnO nanoparticles serve as fluorescence quenchers of coumarin-545T. Upon receptor-mediated endocytosis into tumor cells, acidic conditions cause dis-solution of MnO into MnII ions, resulting in contrast enhancement in T1-weighted MRI. Simultaneously, the fluorescence of coumarin-545T recovered. The presence of an acidic environment was confirmed using the nanoprobe that turns on both MRI and fluorescence signals. In vitro assessment of these nanoprobes was conducted using human dermal (Ha-CaT) and cervical cancer (HeLa) cell lines. Green fluorescence and contrast enhancement in T1-weighted MRI was observed in HeLa cells more than in HaCaT cells because of the acidic environment of the HeLa cells (Figure 28) [308].
Figure 27. In vitro studies of MCF-7 cells incubated with TP-CQDs@MnO2 (375.0 µg mL−1).(A) T1-weighted MRI images of MCF-7 cells: PMA = cells incubated with TP-CQDs@MnO2 andphorbol-12-myristate-13-acetate; control = cells incubated with TP-CQDs@MnO2; NAC = cells in-cubated with TP-CQDs@MnO2 and N-acetyl-L-cystein (NAC); and blank = cells in buffer withoutadding TP-CQDs@MnO2. PMA is a hydrogen peroxide stimulant and NAC is a hydrogen peroxidescavenger. The brightest fluorescence of the two-photon images was observed with cells incubatedwith PMA and the weakest fluorescence was observed with cells incubated with NAC. The brightT1-weighted image of the control sample compared to the blank indicates that the TP-CQDs@MnO2
probe selectively visualizes endogenous hydrogen peroxide in MCF-7 cells. (B) Two-photon fluo-rescence images of MCF-7 cells incubated with TP-CQDs@MnO2 (375.0 µg mL−1). Blank = cells inbuffer without adding TP-CQDs@MnO2; NAC = cells incubated with TP-CQDs@MnO2 and NAC;control = cells incubated with TP-CQDs@MnO2; PMA = cells incubated with TP-CQDs@MnO2 andPMA. Scale bars represent 20.0 µm. The fluorescence images show that the nanoprobe respondsto endogenous hydrogen peroxide in a tumor microenvironment using two-photon fluorescence.Adapted with permission of the Royal Society of Chemistry, from Two-photon fluorescence and MRbio-imaging of endogenous H2O2 in the tumor microenvironment using a dual-mode nanoprobe.Zhong, H.; Yu, S.; Li, B.; He, K.; Li, D.; Wang, X.; Wu, Y.-X. 57, 51, 2021; permission conveyed throughCopyright Clearance Center, Inc. [307].
Intracellular transportation of nanoparticles is often associated with mildly acidicorganelles including lysosomes, and this feature has been used to design pH-responsivepolymeric nanocarriers for tumor-targeted delivery of imaging agents and therapeuticdrugs. Jin, Liu, and co-workers reported core cross-linked polymeric micelles covalentlylabeled with GdIII-containing complexes for T1-weighted imaging and green-emittingfluorescent dyes [309]. Polymeric micelles are pH-responsive and exhibit mildly acidicpH-responsive signal enhancement for both fluorescence and MRI (Figure 29). Underneutral conditions, both MRI contrast agent and fluorophore are confined within the hy-drophobic microenvironment of the micelles. Therefore, T1-weighted contrast enhancementis suppressed because of the restricted water exchange between the contrast agent andsurrounding water. Additionally, fluorescence is quenched by deprotonated tertiary aminegroups and high local fluorophore concentration. In mild acidic environments, the cross-linked micelle cores are rendered hydrophilic due to the protonation of tertiary amineresidues. This phenomenon leads to recovery of both T1-weighted MRI signal and fluo-rescence due to efficient water exchange between contrast agent and surrounding waterand inefficient mechanisms of fluorescence quenching. Because acidic pH is a charac-teristic feature of hypoxia, these probes are potential agents for imaging hypoxic tumorregions [309].

Biosensors 2022, 12, 478 33 of 87Biosensors 2022, 12, x FOR PEER REVIEW 33 of 86
Figure 28. (A) Optical microscopy image and (B) fluorescence microscopy image of HaCaT cells. (C) Optical microscopy image and (D) fluorescence microscopy image of HeLa cells incubated with the nanoprobe. More green fluorescence was observed in HeLa cells compared to HaCaT cells, indicat-ing greater accumulation and dissolution of the nanoprobe in acidic hypoxic cells. (E–G) Fluores-cence microscopy images of HeLa cells treated with a MnO-based nanoprobe at 3, 12, and 24 h, respectively. Increase in fluorescence intensity was observed due to target-specific accumulation and dissolution of nanoprobe in hypoxic HeLa cells. (H) T1-weighted MRI images of HeLa cells incubated with the different nanoparticle concentrations (0–300 μg mL–1) for 24 h. Concentration-dependent MRI signal enhancement was observed as indicated by enhancement in in T1-weighted contrast of the samples containing HeLa cells. Adapted with permission from Hsu, B. Y. W.; Ng, M.; Tan, A.; Connell, J.; Roberts, T.; Lythgoe, M.; Zhang, Y.; Wong, S. Y.; Bhakoo, K.; Seifalian, A. M.; Li, X.; Wang, J. Advanced Healthcare Materials, John Wiley and Sons [308].
Intracellular transportation of nanoparticles is often associated with mildly acidic or-ganelles including lysosomes, and this feature has been used to design pH-responsive polymeric nanocarriers for tumor-targeted delivery of imaging agents and therapeutic drugs. Jin, Liu, and co-workers reported core cross-linked polymeric micelles covalently labeled with GdIII-containing complexes for T1-weighted imaging and green-emitting flu-orescent dyes [309]. Polymeric micelles are pH-responsive and exhibit mildly acidic pH-responsive signal enhancement for both fluorescence and MRI (Figure 29). Under neutral conditions, both MRI contrast agent and fluorophore are confined within the hydrophobic microenvironment of the micelles. Therefore, T1-weighted contrast enhancement is sup-pressed because of the restricted water exchange between the contrast agent and sur-rounding water. Additionally, fluorescence is quenched by deprotonated tertiary amine groups and high local fluorophore concentration. In mild acidic environments, the cross-linked micelle cores are rendered hydrophilic due to the protonation of tertiary amine residues. This phenomenon leads to recovery of both T1-weighted MRI signal and fluo-rescence due to efficient water exchange between contrast agent and surrounding water
Figure 28. (A) Optical microscopy image and (B) fluorescence microscopy image of HaCaT cells.(C) Optical microscopy image and (D) fluorescence microscopy image of HeLa cells incubatedwith the nanoprobe. More green fluorescence was observed in HeLa cells compared to HaCaTcells, indicating greater accumulation and dissolution of the nanoprobe in acidic hypoxic cells.(E–G) Fluorescence microscopy images of HeLa cells treated with a MnO-based nanoprobe at 3,12, and 24 h, respectively. Increase in fluorescence intensity was observed due to target-specificaccumulation and dissolution of nanoprobe in hypoxic HeLa cells. (H) T1-weighted MRI imagesof HeLa cells incubated with the different nanoparticle concentrations (0–300 µg mL−1) for 24 h.Concentration-dependent MRI signal enhancement was observed as indicated by enhancement in inT1-weighted contrast of the samples containing HeLa cells. Adapted with permission from Hsu, B. Y.W.; Ng, M.; Tan, A.; Connell, J.; Roberts, T.; Lythgoe, M.; Zhang, Y.; Wong, S. Y.; Bhakoo, K.; Seifalian,A. M.; Li, X.; Wang, J. Advanced Healthcare Materials, John Wiley and Sons [308].
Bao, Yu, and co-workers reported a series of responsive nanovehicles that can beused for intracellular pH mapping using T1-weighted MRI and fluorescence imaging [310].GdIII-containing complex 13a was used as the T1-weighted MRI component. Dual-sensitivefunctionalized nanoparticles were modified with a fluorescein derivative for basic pHmeasurements and rhodamine B derivative 13b for acidic pH measurements. Tumor-targeting ability was obtained through the inclusion of cyclic arginine-glycine-aspartic acidpeptide. All components were attached to gold nanoparticles via Au–S bonds. QuantitativepH measurements at the cellular level were performed using tumor-bearing mice. Asignal enhancement in T1-weighted MRI and fluorescence signal in the tumor region wasobserved post-injection of functionalized nanoparticles. A significant enhancement ofboth signals was observed in tumor sites injected with nanoparticles that contained tumor-targeting peptides (Figure 30). Because acidic pH is an indicator of hypoxia in tumors,these nanovehicles are potentially suitable imaging agents for the detection of a variety ofsolid tumors [310].

Biosensors 2022, 12, 478 34 of 87
Biosensors 2022, 12, x FOR PEER REVIEW 34 of 86
and inefficient mechanisms of fluorescence quenching. Because acidic pH is a character-istic feature of hypoxia, these probes are potential agents for imaging hypoxic tumor re-gions [309].
Figure 29. (A) T1-weighted spin-echo MRI images of HepG2 cells 4 h after incubation with core cross-linked polymeric micelles at varying GdIII concentrations (0–0.2 mM). (B) Confocal fluores-cence microscopy images of HepG2 cells incubated with cross-linked polymeric micelles. Adapted with permission from Hu, J.; Liu, T.; Zhang, G.; Jin, F.; Liu, S. Macromolecular Rapid Communications, John Wiley and Sons [309].
Bao, Yu, and co-workers reported a series of responsive nanovehicles that can be used for intracellular pH mapping using T1-weighted MRI and fluorescence imaging [310]. GdIII-containing complex 13a was used as the T1-weighted MRI component. Dual-sensitive functionalized nanoparticles were modified with a fluorescein derivative for basic pH measurements and rhodamine B derivative 13b for acidic pH measurements. Tumor-targeting ability was obtained through the inclusion of cyclic arginine-glycine-as-partic acid peptide. All components were attached to gold nanoparticles via Au–S bonds. Quantitative pH measurements at the cellular level were performed using tumor-bearing mice. A signal enhancement in T1-weighted MRI and fluorescence signal in the tumor re-gion was observed post-injection of functionalized nanoparticles. A significant enhance-ment of both signals was observed in tumor sites injected with nanoparticles that con-tained tumor-targeting peptides (Figure 30). Because acidic pH is an indicator of hypoxia
Figure 29. (A) T1-weighted spin-echo MRI images of HepG2 cells 4 h after incubation with corecross-linked polymeric micelles at varying GdIII concentrations (0–0.2 mM). (B) Confocal fluorescencemicroscopy images of HepG2 cells incubated with cross-linked polymeric micelles. Adapted withpermission from Hu, J.; Liu, T.; Zhang, G.; Jin, F.; Liu, S. Macromolecular Rapid Communications, JohnWiley and Sons [309].
Zhao, Yang, and co-workers reported a pH-sensitive magnetic nanogel conjugatedwith cyanin5.5-labeled lactoferrin for MRI and fluorescence imaging of tumors [311]. Thenanogel changed hydrophilic and hydrophobic properties and size as a function of pH.Under physiological conditions, the nanogel was hydrophilic and swollen. In acidic envi-ronments of tumor tissues, the nanogel became hydrophobic and shrunken. In vivo studiesof tumor-bearing mice injected with this nanogel demonstrated that pH-responsive struc-tural changes facilitate the accumulation of the nanogel in tumor tissues and internalizationby tumor cells (Figure 31) [311].

Biosensors 2022, 12, 478 35 of 87
Biosensors 2022, 12, x FOR PEER REVIEW 35 of 86
in tumors, these nanovehicles are potentially suitable imaging agents for the detection of a variety of solid tumors [310].
Figure 30. (A) Chemical structures of the 13a and 13b. (B) In vivo T1-weighted MRI images of U87 tumor-bearing nude mice before and after injection with nanovehicle. The red dashed circle indi-cates the tumor region. Larger signal intensity in the tumor site was observed post-injection in T1-weighted MRI compared to pre-injection, indicating acid-mediated dissolution of the nanovehicle and subsequent water exchange between surrounding and GdIII-containing complex. (C) The in vivo fluorescent images obtained using an excitation laser of 534 nm and an emission filter of 586 ± 20 nm. Adapted with permission of the Royal Society of Chemistry, from Multifunctional gold nano-particles as smart nanovehicles with enhanced tumor-targeting abilities for intracellular pH map-ping and in vivo MR/fluorescence imaging, Yu, K.-K.; Li, K.; Lu, C.-Y.; Xie, Y.-M.; Liu, Y.-H.; Zhou, Q.; Bao, J.-K.; Yu, X.-Q. 12, 3, 2020; permission conveyed through Copyright Clearance Center, Inc. [310].
Zhao, Yang, and co-workers reported a pH-sensitive magnetic nanogel conjugated with cyanin5.5-labeled lactoferrin for MRI and fluorescence imaging of tumors [311]. The nanogel changed hydrophilic and hydrophobic properties and size as a function of pH. Under physiological conditions, the nanogel was hydrophilic and swollen. In acidic envi-ronments of tumor tissues, the nanogel became hydrophobic and shrunken. In vivo stud-ies of tumor-bearing mice injected with this nanogel demonstrated that pH-responsive structural changes facilitate the accumulation of the nanogel in tumor tissues and inter-nalization by tumor cells (Figure 31) [311].
Figure 30. (A) Chemical structures of the 13a and 13b. (B) In vivo T1-weighted MRI images ofU87 tumor-bearing nude mice before and after injection with nanovehicle. The red dashed circleindicates the tumor region. Larger signal intensity in the tumor site was observed post-injection inT1-weighted MRI compared to pre-injection, indicating acid-mediated dissolution of the nanovehicleand subsequent water exchange between surrounding and GdIII-containing complex. (C) The in vivofluorescent images obtained using an excitation laser of 534 nm and an emission filter of 586 ± 20 nm.Adapted with permission of the Royal Society of Chemistry, from Multifunctional gold nanoparticlesas smart nanovehicles with enhanced tumor-targeting abilities for intracellular pH mapping andin vivo MR/fluorescence imaging, Yu, K.-K.; Li, K.; Lu, C.-Y.; Xie, Y.-M.; Liu, Y.-H.; Zhou, Q.; Bao,J.-K.; Yu, X.-Q. 12, 3, 2020; permission conveyed through Copyright Clearance Center, Inc. [310].
Conventional 1H-MRI techniques for hypoxia imaging are often limited by low sen-sitivity due to large background signals [312]. 19F-MRI is a promising complementarytechnique to 1H-MRI that can overcome the issue of background interference. 19F-MRIhas a negligible background signal in vivo [313]. Furthermore, the sensitivity of 18F-MRIcan be improved by developing 19F-loaded nanoprobes. Therefore, the design and syn-thesis of dual-mode imaging probes for hypoxia based on 19F-MRI and fluorescence isan emerging area in biomedical applications. For example, Hu, Wang, and co-workersreported glutathione/pH dual-responsive nanoprobe capable of both fluorescence imagingin cells and 19F-MRI in deep tissue [314]. The nanoprobe was synthesized by encapsulatingmanganese oleate on the surface of fluorinated fluorescent quantum dots. Manganeseoleate serves as an efficient quencher of both fluorescence and 19F-MRI signals. Uponentering hypoxic tumors that possess elevated levels of glutathione and mildly acidic pH,both fluorescence and 19F-MRI signals were turned on due to the degradation of Mn–Obonds within manganese oleate (Figure 32) [314].

Biosensors 2022, 12, 478 36 of 87Biosensors 2022, 12, x FOR PEER REVIEW 36 of 86
Figure 31. In vivo studies were performed with mice bearing gliomas (n = 9 in a group). Mice treated with saline (blank, upper row) and nanogel (bottom row). Images were acquired before and after tail vein injection (12 mg Fe/kg body weight). (Left) T2-weighted MRI images of gliomas before and 48 h post-injection. (Right) Normal photographs and ex vivo fluorescence images of gliomas at 48 h post-injection. T2-weighted MRI of brains acquired 6 h post-injection with nanogel exhibited con-trast enhancement (darkening) in the tumor area. Consistently, intense fluorescence images were also observed in the brain 6 h post-injection. Adapted from Biomaterials, 34, Jiang, L.; Zhou, Q.; Mu, K.; Xie, H.; Zhu, Y.; Zhu, W.; Zhao, Y.; Xu, H.; Yang, X. pH/temperature-sensitive magnetic nanogels conjugated with Cy5. 5-labeled lactoferrin for MR and fluorescence imaging of glioma in rats, 7418–7428, Copyright 2013, with permission from Elsevier [311].
Conventional 1H-MRI techniques for hypoxia imaging are often limited by low sen-sitivity due to large background signals [312]. 19F-MRI is a promising complementary tech-nique to 1H-MRI that can overcome the issue of background interference. 19F-MRI has a negligible background signal in vivo [313]. Furthermore, the sensitivity of 18F-MRI can be improved by developing 19F-loaded nanoprobes. Therefore, the design and synthesis of dual-mode imaging probes for hypoxia based on 19F-MRI and fluorescence is an emerging area in biomedical applications. For example, Hu, Wang, and co-workers reported gluta-thione/pH dual-responsive nanoprobe capable of both fluorescence imaging in cells and 19F-MRI in deep tissue [314]. The nanoprobe was synthesized by encapsulating manganese oleate on the surface of fluorinated fluorescent quantum dots. Manganese oleate serves as an efficient quencher of both fluorescence and 19F-MRI signals. Upon entering hypoxic tumors that possess elevated levels of glutathione and mildly acidic pH, both fluorescence and 19F-MRI signals were turned on due to the degradation of Mn–O bonds within man-ganese oleate (Figure 32) [314].
Figure 31. In vivo studies were performed with mice bearing gliomas (n = 9 in a group). Mice treatedwith saline (blank, upper row) and nanogel (bottom row). Images were acquired before and aftertail vein injection (12 mg Fe/kg body weight). (Left) T2-weighted MRI images of gliomas beforeand 48 h post-injection. (Right) Normal photographs and ex vivo fluorescence images of gliomas at48 h post-injection. T2-weighted MRI of brains acquired 6 h post-injection with nanogel exhibitedcontrast enhancement (darkening) in the tumor area. Consistently, intense fluorescence images werealso observed in the brain 6 h post-injection. Adapted from Biomaterials, 34, Jiang, L.; Zhou, Q.;Mu, K.; Xie, H.; Zhu, Y.; Zhu, W.; Zhao, Y.; Xu, H.; Yang, X. pH/temperature-sensitive magneticnanogels conjugated with Cy5. 5-labeled lactoferrin for MR and fluorescence imaging of glioma inrats, 7418–7428, Copyright 2013, with permission from Elsevier [311].
One of the limitations associated with some nanoprobes is long retention times, whichare undesirable in biomedical applications. However, in vivo studies demonstrated thatthe nanoprobe is a promising glutathione/pH-responsive agent that can selectively im-age tumor sites. Zhou and co-workers reported pH-responsive gold nanoparticle-cappedfluorescein-functionalized mesoporous silica nanoparticles for 19F-MRI and fluorescent can-cer cell imaging [315]. Under acidic conditions (pH < 6.0), the hydrazone linkers betweengold nanoparticles and fluorescein-functionalized mesoporous silica nanoparticles arecleaved, removing the gold caps and releasing the entrapped 19F-containing contrast agentand fluorescein-functionalized mesoporous nanoparticles. Therefore, internalization intothe acidic environment turns on both the 19F-MRI signal and fluorescence signal (Figure 33).Further, the gold nanoparticles were functionalized with folic acid to incorporate the tumortarget ability of the nanoparticles [315].

Biosensors 2022, 12, 478 37 of 87Biosensors 2022, 12, x FOR PEER REVIEW 37 of 86
Figure 32. In vitro studies of hypoxic 4T1 cells, normoxic MREPiC cells, and in vivo studies of 4T1 tumor-bearing mice. Confocal laser scanning microscopy fluorescence images of (A1–A3) hypoxic 4T1 cells and (B1–B3) MREPiC normoxic cells incubated with nanoprobe for 4 h (400 μg mL–1). The excitation wavelength was 405 nm. All of the scale bars = 25 μm. Hypoxic cells incubated with the nanoprobe exhibited intense luminescence compared to normoxic cells. (C) 1H-, (D) 19F-MRI, and (E) overlay images of 4T1 tumor-bearing mice after intratumoral injection of the nanoprobe (20 mg mL–1, 150 μL). The same dose of nanoprobe was subcutaneously injected into normal tissue for com-parison (white dashed lines denote the area). Yellow dashed lines mark the tumor site. Adapted with permission from Jiang, L.; Zhou, Q.; Mu, K.; Xie, H.; Zhu, Y.; Zhu, W.; Zhao, Y.; Xu, H.; Yang, X. pH/temperature-sensitive magnetic nanogels conjugated with Cy5.5-labeled lactoferrin for MR and fluorescence imaging of glioma in rats. Biomaterials, 2013, 34, 7418–7428. Copyright 2013 Amer-ican Chemical Society [314].
One of the limitations associated with some nanoprobes is long retention times, which are undesirable in biomedical applications. However, in vivo studies demonstrated that the nanoprobe is a promising glutathione/pH-responsive agent that can selectively image tumor sites. Zhou and co-workers reported pH-responsive gold nanoparticle-capped fluorescein-functionalized mesoporous silica nanoparticles for 19F-MRI and fluo-rescent cancer cell imaging [315]. Under acidic conditions (pH < 6.0), the hydrazone link-ers between gold nanoparticles and fluorescein-functionalized mesoporous silica nano-particles are cleaved, removing the gold caps and releasing the entrapped 19F-containing contrast agent and fluorescein-functionalized mesoporous nanoparticles. Therefore, inter-nalization into the acidic environment turns on both the 19F-MRI signal and fluorescence signal (Figure 33). Further, the gold nanoparticles were functionalized with folic acid to incorporate the tumor target ability of the nanoparticles [315].
Figure 32. In vitro studies of hypoxic 4T1 cells, normoxic MREPiC cells, and in vivo studies of 4T1tumor-bearing mice. Confocal laser scanning microscopy fluorescence images of (A1–A3) hypoxic4T1 cells and (B1–B3) MREPiC normoxic cells incubated with nanoprobe for 4 h (400 µg mL−1). Theexcitation wavelength was 405 nm. All of the scale bars = 25 µm. Hypoxic cells incubated withthe nanoprobe exhibited intense luminescence compared to normoxic cells. (C) 1H-, (D) 19F-MRI,and (E) overlay images of 4T1 tumor-bearing mice after intratumoral injection of the nanoprobe(20 mg mL−1, 150 µL). The same dose of nanoprobe was subcutaneously injected into normal tissuefor comparison (white dashed lines denote the area). Yellow dashed lines mark the tumor site.Adapted with permission from Jiang, L.; Zhou, Q.; Mu, K.; Xie, H.; Zhu, Y.; Zhu, W.; Zhao, Y.; Xu, H.;Yang, X. pH/temperature-sensitive magnetic nanogels conjugated with Cy5.5-labeled lactoferrin forMR and fluorescence imaging of glioma in rats. Biomaterials, 2013, 34, 7418–7428. Copyright 2013American Chemical Society [314].
Que and co-workers reported a dual-responsive 19F-MRI and fluorescence imagingprobe for hypoxia detection [316]. The CuII-containing probe, 14a, exhibited no 19F-MRIsignal and minimal fluorescence signal because of paramagnetic quenching. Upon enteringhypoxic cells, the ability of the probe to enhance both modes of imaging was turned-on because of the reduction in CuII to CuI. In vitro imaging studies using HeLa cellsdemonstrated that the imaging probe differentiates hypoxic and normoxic cells in bothmodalities (Figure 34) [316].

Biosensors 2022, 12, 478 38 of 87Biosensors 2022, 12, x FOR PEER REVIEW 38 of 86
Figure 33. In vitro studies of the nanoparticles. Confocal fluorescence micrographs of nanoparticles incubated with (A) normal human lung fibroblast cells (MRC-5) for 3 h, (B) human lung cancer cells (A549) for 30 min, and (C) A549 cells for 3 h. Nuclei of all the cells are stained red, and nanoparticles are shown as green spots. These results indicate that the nanoparticles are selectively endocytosed by lung cancer cells (A549). In vitro studies. 19F-MRI images of fluorinated nanoparticles in (D) pH 7.4 buffer (phosphate-buffered saline), (E) A549 lung cancer cells, (F) pH 6.0 buffer (phosphate-buff-ered saline), where incubation was performed for 1 h. Field of view = 33 × 33 mm2. Adapted with permission of the Royal Society of Chemistry, from pH/temperature-sensitive magnetic nanogels conjugated with Cy5. 5-labeled lactoferrin for MR and fluorescence imaging of glioma in rats, Jiang, L.; Zhou, Q.; Mu, K.; Xie, H.; Zhu, Y.; Zhu, W.; Zhao, Y.; Xu, H.; Yang, X. 34, 3, 2013; permission conveyed through Copyright Clearance Center, Inc [315].
Que and co-workers reported a dual-responsive 19F-MRI and fluorescence imaging probe for hypoxia detection [316]. The CuII-containing probe, 14a, exhibited no 19F-MRI signal and minimal fluorescence signal because of paramagnetic quenching. Upon enter-ing hypoxic cells, the ability of the probe to enhance both modes of imaging was turned-on because of the reduction in CuII to CuI. In vitro imaging studies using HeLa cells demonstrated that the imaging probe differentiates hypoxic and normoxic cells in both modalities (Figure 34) [316].
Figure 33. In vitro studies of the nanoparticles. Confocal fluorescence micrographs of nanoparticlesincubated with (A) normal human lung fibroblast cells (MRC-5) for 3 h, (B) human lung cancer cells(A549) for 30 min, and (C) A549 cells for 3 h. Nuclei of all the cells are stained red, and nanoparticlesare shown as green spots. These results indicate that the nanoparticles are selectively endocytosed bylung cancer cells (A549). In vitro studies. 19F-MRI images of fluorinated nanoparticles in (D) pH 7.4buffer (phosphate-buffered saline), (E) A549 lung cancer cells, (F) pH 6.0 buffer (phosphate-bufferedsaline), where incubation was performed for 1 h. Field of view = 33 × 33 mm2. Adapted withpermission of the Royal Society of Chemistry, from pH/temperature-sensitive magnetic nanogelsconjugated with Cy5. 5-labeled lactoferrin for MR and fluorescence imaging of glioma in rats, Jiang,L.; Zhou, Q.; Mu, K.; Xie, H.; Zhu, Y.; Zhu, W.; Zhao, Y.; Xu, H.; Yang, X. 34, 3, 2013; permissionconveyed through Copyright Clearance Center, Inc. [315].
5.2. Fluorescence and Colorimetric Imaging
Fluorescence and colorimetric-based dual-mode hypoxia imaging are mainly targetedto confirm the hypoxia-relevant conditions or parameters. However, compared to otherimaging techniques—including MRI, PET, and SPECT—fluorescence and colorimetricimaging require simple instrumentation and often can be performed at low costs. In thesemethods, organic dye molecules, quantum dots, and nanomaterials are usually used aschromophores.

Biosensors 2022, 12, 478 39 of 87Biosensors 2022, 12, x FOR PEER REVIEW 39 of 86
Figure 34. (A) Chemical structures and CuI elimination reaction that 14a undergoes upon entering hypoxic cells. (B) Fluorescence images of normoxic [(left: brightfield (top) and fluorescence image (bottom)] and hypoxic [(right: brightfield (top) and fluorescence image (bottom)] of HeLa cervical cancer cells after 1 h incubation with 14a (30 μM). Scale bar = 200 μm. (C) 19F-NMR spectra of lysed HeLa cells in anhydrous, d6-DMSO without incubating with 14a (control, bottom), normoxic cells incubated with 14a (60 μM) for 1 h (normoxic, middle), and hypoxic cells incubated with 14a (60 μM) for 1 h (hypoxia, top). Adapted with permission of the Royal Society of Chemistry, from A dual-responsive probe for detecting cellular hypoxia using 19F magnetic resonance and fluorescence. Kadakia, R. T.; Xie, D.; Martinez D. Jr.; Yu, M.; Que, E. L. 55, 60, 2019; permission conveyed through Copyright Clearance Center, Inc. [316].
5.2. Fluorescence and Colorimetric Imaging Fluorescence and colorimetric-based dual-mode hypoxia imaging are mainly tar-
geted to confirm the hypoxia-relevant conditions or parameters. However, compared to other imaging techniques—including MRI, PET, and SPECT—fluorescence and colorimet-ric imaging require simple instrumentation and often can be performed at low costs. In these methods, organic dye molecules, quantum dots, and nanomaterials are usually used as chromophores.
Figure 34. (A) Chemical structures and CuI elimination reaction that 14a undergoes upon enteringhypoxic cells. (B) Fluorescence images of normoxic [(left: brightfield (top) and fluorescence image(bottom)] and hypoxic [(right: brightfield (top) and fluorescence image (bottom)] of HeLa cervicalcancer cells after 1 h incubation with 14a (30 µM). Scale bar = 200 µm. (C) 19F-NMR spectra oflysed HeLa cells in anhydrous, d6-DMSO without incubating with 14a (control, bottom), normoxiccells incubated with 14a (60 µM) for 1 h (normoxic, middle), and hypoxic cells incubated with 14a(60 µM) for 1 h (hypoxia, top). Adapted with permission of the Royal Society of Chemistry, from Adual-responsive probe for detecting cellular hypoxia using 19F magnetic resonance and fluorescence.Kadakia, R. T.; Xie, D.; Martinez D. Jr.; Yu, M.; Que, E. L. 55, 60, 2019; permission conveyed throughCopyright Clearance Center, Inc. [316].
Some chromophores respond to physical parameters, including pH and the reductionpotential of the environment. Reports based on fluorescence and colorimetric detectionof pH in nonbiological samples (for example, wastewater) are common [317,318]; yet,a few examples have been reported to detect biomolecules and the pH of physiologicalenvironments [319–321]. Physiological pH is important in detecting hypoxic tissues becausepH tends to decrease as a consequence of reduced oxygen levels in cells [16,17]. Chen, Zhou,

Biosensors 2022, 12, 478 40 of 87
and co-workers reported orange-emissive carbon quantum dots for pH monitoring basedon colorimetric and fluorescent imaging [322]. Orange-emissive carbon quantum dots werecoated onto a medical cotton cloth and applied to chronic or infected wounds (where thepH is in the range of 5 to 9), and those cloths exhibited a response to pH variation viaboth fluorescence and visible colorimetric changes (Figure 35) [322]. Wounds occur due tovarious medical conditions including diabetes and hypoxic tumors [323,324]. Therefore,dual-mode monitoring of wound pH can be used as part of a diagnostic strategy for somechronic diseases.
Biosensors 2022, 12, x FOR PEER REVIEW 40 of 86
Some chromophores respond to physical parameters, including pH and the reduc-tion potential of the environment. Reports based on fluorescence and colorimetric detec-tion of pH in nonbiological samples (for example, wastewater) are common [317,318]; yet, a few examples have been reported to detect biomolecules and the pH of physiological environments [319–321]. Physiological pH is important in detecting hypoxic tissues be-cause pH tends to decrease as a consequence of reduced oxygen levels in cells [16,17]. Chen, Zhou, and co-workers reported orange-emissive carbon quantum dots for pH mon-itoring based on colorimetric and fluorescent imaging [322]. Orange-emissive carbon quantum dots were coated onto a medical cotton cloth and applied to chronic or infected wounds (where the pH is in the range of 5 to 9), and those cloths exhibited a response to pH variation via both fluorescence and visible colorimetric changes (Figure 35) [322]. Wounds occur due to various medical conditions including diabetes and hypoxic tumors [323,324]. Therefore, dual-mode monitoring of wound pH can be used as part of a diag-nostic strategy for some chronic diseases.
Figure 35. (A) Schematic representation of the medical cloth coated with quantum dots used in wound pH determination. (B) Photographs showing color under natural light and fluorescence im-ages under UV light (excited at 365 and 254 nm) of the orange-emissive quantum dots in a buffer solution at different pH values. Adapted with permission from Yang, P.; Zhu, Z.; Zhang, T.; Zhang, W.; Chen, W.; Cao, Y.; Chen, M.; Zhou, X. Small, John Wiley and Sons [322].
Elevated levels of glutathione and hydrogen peroxide are critical factors in hypoxic tissues [77,100]. Therefore, agents that are responsive to those chemicals can be used in hypoxia detection. Hasan and co-workers reported fluorescent nitrogen–sulfur dual-doped carbon quantum dots for colorimetric detection of hydrogen peroxide and gluta-thione in human blood serum [325]. This platform detected hydrogen peroxide colorimet-rically with a detection limit of 0.004 mM. Furthermore, glutathione was detected with this platform up to 0.07 μM using both colorimetric and fluorescence assays [325].
5.3. SERS and Fluorescence Imaging Despite high sensitivity and fast imaging speed, applications of single fluorescent
labeling techniques at the cellular level are limited because of photobleaching [326,327]. On the other hand, SERS possesses high photostability and little photobleaching com-pared to fluorescence imaging [328,329]. SERS also possesses the capability of recognizing different cell types [329]. However, in spite of its imaging properties, SERS suffers from slow detection speeds that limit the rapid recognition of pathological markers expressed in cancer cells [330,331]. Therefore, in modern cancer research, there is a growing interest to combine SERS and fluorescence imaging to enable fast and reliable sensing of multiple cancer cell types [332–334]. As a consequence, preclinical studies based on chromophores combined with metal nanoparticles have resulted in the visualization of biomolecules and physiological properties [335–337].
Gold nanoparticles have a strong binding affinity to sulfur-containing compounds including thiols and organosulfur compounds [338,339]. The surface of gold nanoparticles can be modified using nitrogen- or oxygen-containing chromophores to observe changes
Figure 35. (A) Schematic representation of the medical cloth coated with quantum dots used inwound pH determination. (B) Photographs showing color under natural light and fluorescenceimages under UV light (excited at 365 and 254 nm) of the orange-emissive quantum dots in a buffersolution at different pH values. Adapted with permission from Yang, P.; Zhu, Z.; Zhang, T.; Zhang,W.; Chen, W.; Cao, Y.; Chen, M.; Zhou, X. Small, John Wiley and Sons [322].
Elevated levels of glutathione and hydrogen peroxide are critical factors in hypoxictissues [77,100]. Therefore, agents that are responsive to those chemicals can be used inhypoxia detection. Hasan and co-workers reported fluorescent nitrogen–sulfur dual-dopedcarbon quantum dots for colorimetric detection of hydrogen peroxide and glutathione inhuman blood serum [325]. This platform detected hydrogen peroxide colorimetrically witha detection limit of 0.004 mM. Furthermore, glutathione was detected with this platform upto 0.07 µM using both colorimetric and fluorescence assays [325].
5.3. SERS and Fluorescence Imaging
Despite high sensitivity and fast imaging speed, applications of single fluorescentlabeling techniques at the cellular level are limited because of photobleaching [326,327]. Onthe other hand, SERS possesses high photostability and little photobleaching compared tofluorescence imaging [328,329]. SERS also possesses the capability of recognizing differentcell types [329]. However, in spite of its imaging properties, SERS suffers from slowdetection speeds that limit the rapid recognition of pathological markers expressed incancer cells [330,331]. Therefore, in modern cancer research, there is a growing interest tocombine SERS and fluorescence imaging to enable fast and reliable sensing of multiplecancer cell types [332–334]. As a consequence, preclinical studies based on chromophorescombined with metal nanoparticles have resulted in the visualization of biomolecules andphysiological properties [335–337].
Gold nanoparticles have a strong binding affinity to sulfur-containing compoundsincluding thiols and organosulfur compounds [338,339]. The surface of gold nanoparticlescan be modified using nitrogen- or oxygen-containing chromophores to observe changes inSERS and fluorescence signals in response to glutathione levels in cells because glutathionecan preferentially bind with gold nanoparticles and displace oxygen- or nitrogen-containingcompounds. Yao, Ma, and co-workers reported a SERS-fluorescence dual-mode imagingsystem to probe intracellular glutathione levels [340]. A luminophore was synthesizedby combining tris-(4-(pyridin-4-yl)-phenyl)amine and vinyl-benzylchloride, and the lu-minophore were loaded onto the surface of gold nanoparticles via Au–N bonds. As loaded,

Biosensors 2022, 12, 478 41 of 87
the fluorescence energy of the luminophore transferred to gold nanoparticles and con-sequently, quenched the fluorescence signal. Additionally, both gold nanoparticles andluminophores individually exhibited no Raman signals in the range of 250 to 3000 cm−1.However, gold nanoparticles loaded with luminophore exhibited a SERS effect. Upon enter-ing hypoxic cells, Raman signals weakened and fluorescence increased because Au–S bondswith glutathione are stronger than Au–N bonds formed with the luminophore (Figure 36).This study demonstrated the complementary advantages of SERS and fluorescence to detectglutathione, which is produced at elevated levels in hypoxic cells [340].
Biosensors 2022, 12, x FOR PEER REVIEW 41 of 86
in SERS and fluorescence signals in response to glutathione levels in cells because gluta-thione can preferentially bind with gold nanoparticles and displace oxygen- or nitrogen-containing compounds. Yao, Ma, and co-workers reported a SERS-fluorescence dual-mode imaging system to probe intracellular glutathione levels [340]. A luminophore was synthesized by combining tris-(4-(pyridin-4-yl)-phenyl)amine and vinyl-benzylchloride, and the luminophore were loaded onto the surface of gold nanoparticles via Au–N bonds. As loaded, the fluorescence energy of the luminophore transferred to gold nanoparticles and consequently, quenched the fluorescence signal. Additionally, both gold nanoparti-cles and luminophores individually exhibited no Raman signals in the range of 250 to 3,000 cm–1. However, gold nanoparticles loaded with luminophore exhibited a SERS ef-fect. Upon entering hypoxic cells, Raman signals weakened and fluorescence increased because Au–S bonds with glutathione are stronger than Au–N bonds formed with the luminophore (Figure 36). This study demonstrated the complementary advantages of SERS and fluorescence to detect glutathione, which is produced at elevated levels in hy-poxic cells [340].
Figure 36. (A) Fluorescence images of parallel samples (a, b, and c) of HepG2 cells incubated with functionalized gold nanoparticles (10 μg mL–1) for 20 min. Excitation and emission wavelengths are 438 and 613 nm, respectively, in different volumes of glutathione. (B) SERS intensity of gold nano-particles (AuNPs), immunoassay probe (TPPA-VCh), functionalized gold nanoparticle with immu-noassay probe (Au@TPPA-VCh), and gold nanoparticles functionalized with glutathione (Au@GSH). The inset shows the enlarged spectra of AuNPs, AuGSH, and TPPA-VCh, Excitation wavelength = 438 nm; exposure time = 10 s. Adapted from Spectrochimica Acta Part A: Molecular and Biomolecular Spectroscopy, 223, Yao, W.; Chang, L.; Yin, W.; Wang, T.; Yang, Y.; Yin, P.; Yang, M.; Ma, Y.; Qin, Y.; Ma, H. One immunoassay probe makes SERS and fluorescence two readout signals: Rapid imaging and determination of intracellular glutathione levels, 117303, Copyright 2019, with permission from Elsevier [340].
In addition to favorable binding affinities of SERS substrates, some fluorescence tags can be structurally modified to alter their fluorescence as a function of pH. Qu, Li, and co-workers demonstrated the pH sensing ability of fluorescein isothiocyanate combined with thiol-functionalized (15) gold nanorods using fluorescence and SERS imaging [341]. Flu-orescein isothiocyanate, 16, exhibits isoforms in an aqueous solution that change fluores-cence as a function of pH. At pH 3, the fluorescence of fluorescein isothiocyanate is com-pletely quenched, and fluorescence intensity increases with increasing pH (Figure 37). Additionally, the SERS spectra of the functionalized gold nanorods exhibit a characteristic spectral band at 1423 cm–1 (CO2– expansion) that is sensitive to pH. In acidic media, the CO2– stretching mode decreases because of the predominant existence of CO2H. When pH increases, CO2– is predominantly present, causing an increase in the CO2– stretching band
Figure 36. (A) Fluorescence images of parallel samples (a, b, and c) of HepG2 cells incubated withfunctionalized gold nanoparticles (10 µg mL−1) for 20 min. Excitation and emission wavelengthsare 438 and 613 nm, respectively, in different volumes of glutathione. (B) SERS intensity of goldnanoparticles (AuNPs), immunoassay probe (TPPA-VCh), functionalized gold nanoparticle withimmunoassay probe (Au@TPPA-VCh), and gold nanoparticles functionalized with glutathione(Au@GSH). The inset shows the enlarged spectra of AuNPs, AuGSH, and TPPA-VCh, Excitationwavelength = 438 nm; exposure time = 10 s. Adapted from Spectrochimica Acta Part A: Molecularand Biomolecular Spectroscopy, 223, Yao, W.; Chang, L.; Yin, W.; Wang, T.; Yang, Y.; Yin, P.; Yang, M.;Ma, Y.; Qin, Y.; Ma, H. One immunoassay probe makes SERS and fluorescence two readout signals:Rapid imaging and determination of intracellular glutathione levels, 117303, Copyright 2019, withpermission from Elsevier [340].
In addition to favorable binding affinities of SERS substrates, some fluorescence tagscan be structurally modified to alter their fluorescence as a function of pH. Qu, Li, andco-workers demonstrated the pH sensing ability of fluorescein isothiocyanate combinedwith thiol-functionalized (15) gold nanorods using fluorescence and SERS imaging [341].Fluorescein isothiocyanate, 16, exhibits isoforms in an aqueous solution that change flu-orescence as a function of pH. At pH 3, the fluorescence of fluorescein isothiocyanate iscompletely quenched, and fluorescence intensity increases with increasing pH (Figure 37).Additionally, the SERS spectra of the functionalized gold nanorods exhibit a characteristicspectral band at 1423 cm−1 (CO2
− expansion) that is sensitive to pH. In acidic media, theCO2
− stretching mode decreases because of the predominant existence of CO2H. WhenpH increases, CO2
− is predominantly present, causing an increase in the CO2− stretching
band at 1423 cm−1 (Figure 37). In vitro studies showed a fluorescence signal of tumor cellsincubated with the nanoprobe compared to healthy cells. A characteristic spectroscopicpeak at 1423 cm−1 of tumor cells incubated with nanoprobe is lower than that of healthycells, indicating that normal cells possess a higher pH compared to tumor cells [341].

Biosensors 2022, 12, 478 42 of 87
Biosensors 2022, 12, x FOR PEER REVIEW 42 of 86
at 1423 cm–1 (Figure 37). In vitro studies showed a fluorescence signal of tumor cells incu-bated with the nanoprobe compared to healthy cells. A characteristic spectroscopic peak at 1423 cm–1 of tumor cells incubated with nanoprobe is lower than that of healthy cells, indicating that normal cells possess a higher pH compared to tumor cells [341].
Figure 37. The sensing mechanism of functionalized gold nanoprobe in cells. (A) Under normoxic conditions. Internalized probe results in a carbon stretching band in the SERS spectrum at 1,423 cm–
1 and a strong absorption peak in fluorescence spectrum. (B) Upon entering into hypoxic cells, both signals disappear. (C) Chemical structures of 15 and 16. Adapted from Colloids and Surfaces A: Phys-icochemical and Engineering Aspects, 562, Yang, G.; Zhang, Q.; Liang, Y.; Liu, H.; Qu, L.-L.; Li, H. Flu-orescence-SERS dual-signal probes for pH sensing in live cells, 289–295, Copyright 2019, with per-mission from Elsevier [341].
Imaging probes can be used to image organelles within cancer cells that exhibit hy-poxia-induced pathological conditions. For example, the mitochondrial membrane in can-cer cells exhibits increased negative potential compared to healthy cells; therefore, cationic species are prone to accumulate within mitochondria in cancer cells [342,343]. Adawi, Bouillard, Stasiuk, and co-workers developed a pH-sensitive fluorescence probe using gold nanoparticles functionalized with a rhodamine thiol derivative for mitochondrial imaging (Figure 38) [344]. Cationic derivatives of rhodamine possess a high affinity to-ward mitochondria in cancer cells, and consequently, rhodamine-conjugated imaging agents are known to concentrate within cancer cells. The fluorescence emission intensity of the rhodamine-conjugated functionalized (17) gold nanoparticles increases with in-creasing pH. This pH response is based on the pKa of rhodamine changing from 4.59 to 6.62 upon conjugation with gold nanoparticles. This greater pKa is good for biological pH imaging between pH 6.5 and 7.4. The Raman spectra of rhodamine-functionalized gold nanoparticles exhibit clear enhancement of Raman signals compared to rhodamine (Fig-ure 38). This study incorporated the advantages of fluorescence and SERS to precisely monitor mitochondrial pH in cancer cells (Figure 38) [344].
Figure 37. The sensing mechanism of functionalized gold nanoprobe in cells. (A) Under normoxicconditions. Internalized probe results in a carbon stretching band in the SERS spectrum at 1423 cm−1
and a strong absorption peak in fluorescence spectrum. (B) Upon entering into hypoxic cells, bothsignals disappear. (C) Chemical structures of 15 and 16. Adapted from Colloids and Surfaces A:Physicochemical and Engineering Aspects, 562, Yang, G.; Zhang, Q.; Liang, Y.; Liu, H.; Qu, L.-L.; Li, H.Fluorescence-SERS dual-signal probes for pH sensing in live cells, 289–295, Copyright 2019, withpermission from Elsevier [341].
Imaging probes can be used to image organelles within cancer cells that exhibithypoxia-induced pathological conditions. For example, the mitochondrial membrane incancer cells exhibits increased negative potential compared to healthy cells; therefore,cationic species are prone to accumulate within mitochondria in cancer cells [342,343].Adawi, Bouillard, Stasiuk, and co-workers developed a pH-sensitive fluorescence probeusing gold nanoparticles functionalized with a rhodamine thiol derivative for mitochondrialimaging (Figure 38) [344]. Cationic derivatives of rhodamine possess a high affinity towardmitochondria in cancer cells, and consequently, rhodamine-conjugated imaging agentsare known to concentrate within cancer cells. The fluorescence emission intensity of therhodamine-conjugated functionalized (17) gold nanoparticles increases with increasingpH. This pH response is based on the pKa of rhodamine changing from 4.59 to 6.62 uponconjugation with gold nanoparticles. This greater pKa is good for biological pH imagingbetween pH 6.5 and 7.4. The Raman spectra of rhodamine-functionalized gold nanoparticlesexhibit clear enhancement of Raman signals compared to rhodamine (Figure 38). This studyincorporated the advantages of fluorescence and SERS to precisely monitor mitochondrialpH in cancer cells (Figure 38) [344].

Biosensors 2022, 12, 478 43 of 87Biosensors 2022, 12, x FOR PEER REVIEW 43 of 86
Figure 38. (A) Raman spectra of 17 (dashed lines) and gold nanoparticles functionalized with 17 (solid lines) at low pH (red) and high pH (black). (B) Co-localization of gold nanoparticles function-alized with 17 in A2780 cells visualized via confocal microscopy. (I) Lysotracker staining, (II) gold nanoparticles functionalized with 17, (III) Mitotracker staining, and (IV) overlay (298 K). (C) Chem-ical structure of 17. Adapted with permission from Eling, C. J.; Price, T. W.; Marshall, A. R. L.; Vis-comi, F. N.; Robinson, P.; Firth, G.; Adawi, A. M.; Bouillard, J.-S. G.; Stasiuk, G. J. ChemPlusChem, John Wiley and Sons [344].
One limitation of traditional SERS-based pH sensing probes is the inability to meas-ure the pH of acidic (pH < 5.5) media due to aggregation. Xu and co-workers reported a novel pH-sensing method based on pH-sensitive Janus microgels encapsulating 4-mer-captobenzoic acid-labeled gold nanoparticles and carbon dots [345]. Combining the ad-vantages of high specificity offered by SERS and the fast imaging ability of fluorescence imaging, this dual-mode method detected tumor cells with extracellular pH 5.5–6.0. The pH decreases in MCF-7 culture media were monitored as a function of time. The pH of the culture media dropped to 5.5–6.0 when the cells were cultured for 36 h (Figure 39). Acidic pH is one of the earliest signs of hypoxic tumors; therefore, it is important to mon-itor pH to enable the early diagnosis of tumors [345].
Figure 38. (A) Raman spectra of 17 (dashed lines) and gold nanoparticles functionalized with17 (solid lines) at low pH (red) and high pH (black). (B) Co-localization of gold nanoparticlesfunctionalized with 17 in A2780 cells visualized via confocal microscopy. (I) Lysotracker staining,(II) gold nanoparticles functionalized with 17, (III) Mitotracker staining, and (IV) overlay (298 K).(C) Chemical structure of 17. Adapted with permission from Eling, C. J.; Price, T. W.; Marshall, A. R.L.; Viscomi, F. N.; Robinson, P.; Firth, G.; Adawi, A. M.; Bouillard, J.-S. G.; Stasiuk, G. J. ChemPlusChem,John Wiley and Sons [344].
One limitation of traditional SERS-based pH sensing probes is the inability to mea-sure the pH of acidic (pH < 5.5) media due to aggregation. Xu and co-workers reporteda novel pH-sensing method based on pH-sensitive Janus microgels encapsulating 4-mercaptobenzoic acid-labeled gold nanoparticles and carbon dots [345]. Combining theadvantages of high specificity offered by SERS and the fast imaging ability of fluorescenceimaging, this dual-mode method detected tumor cells with extracellular pH 5.5–6.0. ThepH decreases in MCF-7 culture media were monitored as a function of time. The pH of theculture media dropped to 5.5–6.0 when the cells were cultured for 36 h (Figure 39). AcidicpH is one of the earliest signs of hypoxic tumors; therefore, it is important to monitor pH toenable the early diagnosis of tumors [345].
5.4. SERS and Colorimetric Imaging
Compared to other imaging techniques, colorimetry is simple and inexpensive. Com-bining SERS with colorimetry into high-specificity, dual-mode systems enable accuratedetection of a wide range of parameters related to hypoxia.
Lee and co-workers reported the use of colorimetric and SERS dual-mode sensing forselective and sensitive detection of endogenous H2S in live prostate cancer cells [346]. H2Sis a gaseous signaling molecule that plays an important role in biological processes in livingorganisms including tissue homeostasis and cardiovascular pathophysiology. Abnormallevels of H2S are related to various medical conditions including cancer. Therefore, thedetection of H2S levels in cells enables the detection of hypoxia. The study reported by Leeand co-workers is based on a silver nanoplate-coated paper assay to detect concentrationsof H2S below 100 nM. This method also possesses the ability to measure concentrations of

Biosensors 2022, 12, 478 44 of 87
H2S in the nanomolar or micromolar ranges depending on if colorimetry or SERS is usedfor detection [346].
Biosensors 2022, 12, x FOR PEER REVIEW 44 of 86
Figure 39. In vitro studies of Janus microgels. (A) Optical images of Janus microgels in buffer solu-tions with pH from 1.0 to 8.0 (scale bar = 200 μm). (B) SERS spectra of SERS hemispheres in buffer solutions with pH from 1.0 to 8.0. (C) Confocal laser scanning microscopy fluorescence images of Janus microgels in buffer solution with pH from 1.0 to 8.0 (scale bar = 200 μm). (D) Determination of pH values based on (blue, a) Raman intensity ratio of the peaks at 1,395 and 1,077 cm–1 and (red, b) fluorescence intensity. Adapted with permission from Yue, S.; Sun, X.; Wang, N.; Wang, Y.; Wang, Y.; Xu, Z.; Chen, M.; Wang, J. SERS–fluorescence dual-mode pH-sensing method based on Janus microparticles. ACS Appl. Mater. Interfaces, 2017, 9, 39699–39707, Copyright 2017 American Chemical Society [345].
5.4. SERS and Colorimetric Imaging Compared to other imaging techniques, colorimetry is simple and inexpensive. Com-
bining SERS with colorimetry into high-specificity, dual-mode systems enable accurate detection of a wide range of parameters related to hypoxia.
Lee and co-workers reported the use of colorimetric and SERS dual-mode sensing for selective and sensitive detection of endogenous H2S in live prostate cancer cells [346]. H2S is a gaseous signaling molecule that plays an important role in biological processes in liv-ing organisms including tissue homeostasis and cardiovascular pathophysiology. Abnor-mal levels of H2S are related to various medical conditions including cancer. Therefore, the detection of H2S levels in cells enables the detection of hypoxia. The study reported by Lee and co-workers is based on a silver nanoplate-coated paper assay to detect concentra-tions of H2S below 100 nM. This method also possesses the ability to measure concentra-tions of H2S in the nanomolar or micromolar ranges depending on if colorimetry or SERS is used for detection [346].
Figure 39. In vitro studies of Janus microgels. (A) Optical images of Janus microgels in buffersolutions with pH from 1.0 to 8.0 (scale bar = 200 µm). (B) SERS spectra of SERS hemispheres inbuffer solutions with pH from 1.0 to 8.0. (C) Confocal laser scanning microscopy fluorescence imagesof Janus microgels in buffer solution with pH from 1.0 to 8.0 (scale bar = 200 µm). (D) Determinationof pH values based on (blue, a) Raman intensity ratio of the peaks at 1395 and 1077 cm−1 and (red, b)fluorescence intensity. Adapted with permission from Yue, S.; Sun, X.; Wang, N.; Wang, Y.; Wang,Y.; Xu, Z.; Chen, M.; Wang, J. SERS–fluorescence dual-mode pH-sensing method based on Janusmicroparticles. ACS Appl. Mater. Interfaces, 2017, 9, 39699–39707, Copyright 2017 American ChemicalSociety [345].
Huang, Kong, and co-workers reported a dual-mode biosensor combining transitionmetal carbonyl-based SERS and a colorimetric readout for thiol detection [342]. The probewas developed using an unsaturated triosmium carbonyl cluster [Os3(CO)10(µ-H)2] thatundergoes color changes and shifts in the SERS spectrum carbonyl stretching vibration inthe presence of thiol (Figure 40). The probe has a detection limit of 0.1 µM by SERS [347].

Biosensors 2022, 12, 478 45 of 87
Biosensors 2022, 12, x FOR PEER REVIEW 45 of 86
Huang, Kong, and co-workers reported a dual-mode biosensor combining transition metal carbonyl-based SERS and a colorimetric readout for thiol detection [342]. The probe was developed using an unsaturated triosmium carbonyl cluster [Os3(CO)10(μ-H)2] that undergoes color changes and shifts in the SERS spectrum carbonyl stretching vibration in the presence of thiol (Figure 40). The probe has a detection limit of 0.1 μM by SERS [347].
Figure 40. (A) Photographs of the probe (purple solution) and after addition of cysteine to the probe (yellow solution). (B) UV–visible spectra and (C) SERS spectra of 1 mM probe before (purple) and after (yellow) the addition of 1 mM cysteine. Adapted with permission of the Royal Society of Chem-istry, from Dual-mode biosensor combining transition metal carbonyl-based SERS and colorimetric readout for thiol detection, Lin, D.; Zhou, J.; Yu, Y.; Chen, W.; Liao, P.-H.; Huang, H.; Kong, K. V. 11, 41, 2019; permission conveyed through Copyright Clearance Center, Inc. [347].
5.5. Fluorescence and Photoacoustic Imaging Combining fluorescence imaging and photoacoustic imaging has led to the synthesis
of dual-mode probes for imaging hypoxic tumor microenvironments. Li, Wang, Tang, and co-workers reported hypoxia-activated probe 18a for near-IR fluorescence and photoa-coustic dual-mode imaging of tumors [348]. Upon entering reduced environments, that are characteristic of hypoxic tumors, 18a is reduced to 18b. Due to aggregation-induced emission and the twisted intramolecular charge transfer features of 18b, the probe pos-sesses near-IR fluorescence and photoacoustic imaging properties that are useful in tumor imaging (Figure 41) [348].
Figure 40. (A) Photographs of the probe (purple solution) and after addition of cysteine to the probe(yellow solution). (B) UV–visible spectra and (C) SERS spectra of 1 mM probe before (purple) and after(yellow) the addition of 1 mM cysteine. Adapted with permission of the Royal Society of Chemistry,from Dual-mode biosensor combining transition metal carbonyl-based SERS and colorimetric readoutfor thiol detection, Lin, D.; Zhou, J.; Yu, Y.; Chen, W.; Liao, P.-H.; Huang, H.; Kong, K. V. 11, 41, 2019;permission conveyed through Copyright Clearance Center, Inc. [347].
5.5. Fluorescence and Photoacoustic Imaging
Combining fluorescence imaging and photoacoustic imaging has led to the synthesisof dual-mode probes for imaging hypoxic tumor microenvironments. Li, Wang, Tang, andco-workers reported hypoxia-activated probe 18a for near-IR fluorescence and photoa-coustic dual-mode imaging of tumors [348]. Upon entering reduced environments, thatare characteristic of hypoxic tumors, 18a is reduced to 18b. Due to aggregation-inducedemission and the twisted intramolecular charge transfer features of 18b, the probe pos-sesses near-IR fluorescence and photoacoustic imaging properties that are useful in tumorimaging (Figure 41) [348].
The reduced coenzymes, NADPH, and NADH are important metabolic products andare closely associated with the occurrence and development of cancer [96]. Therefore, it isimportant to detect these reduced coenzymes to improve cancer detection and treatment. Liand co-workers reported a near-IR fluorescence and photoacoustic dual-modal multifunc-tional probe that consisted of 19a [349]. The native version of the probe is not fluorescent inthe near-IR region of the electromagnetic spectrum. However, upon reacting with NADPH,near-IR fluorescence was observed due to the formation of the conjugated structure 19b(Figure 42). Furthermore, the probe exhibited photoacoustic signals upon reacting withNADPH. The probe was used to monitor NADPH during energy metabolism in tumor-bearing mice by fluorescence and photoacoustic dual-mode imaging (Figure 42) [349].

Biosensors 2022, 12, 478 46 of 87Biosensors 2022, 12, x FOR PEER REVIEW 46 of 86
Figure 41. (A) Chemical structures of 18a and 18b. Time-dependent in vivo photoacoustic images of the tumor region in mice after tail vein injection of (B) nanoparticles of 18a (200 μL, 1 mg mL–1) and (C) saline (200 μL) as control. (Left to right) Images were obtained after 6, 24, 48, and 72 h post-injection of nanoparticles. Scale bar = 2 mm. A strong photoacoustic signal was detected 6 h post-injection demonstrating the responsiveness of 18a to hypoxia. (D,E) Time-lapse near-IR fluorescence images of mice before (0 min) and after (10, 30, 60, and 100 min) being intratumorally injected with (D) 18a nanoparticles and (E) 18b nanoparticles (50 μL, 1 mg mL–1). Top panels are the fluorescence signals collected upon excitation at 500 nm, and the bottom panels are the fluorescence signals col-lected upon excitation at 570 nm. The fluorescence in mice injected with 18a decreases overtime with excitation at 500 nm, whereas fluorescence with 570 nm excitation increased overtime. The changes indicate the reduction in 18a upon entering hypoxic cells. Because 18b is not sensitive to hypoxia, fluorescence remained constant within 100 min post-injection regardless of the excitation wave-length. Adapted with permission [348].
The reduced coenzymes, NADPH, and NADH are important metabolic products and are closely associated with the occurrence and development of cancer [96]. Therefore, it is important to detect these reduced coenzymes to improve cancer detection and treatment. Li and co-workers reported a near-IR fluorescence and photoacoustic dual-modal multi-functional probe that consisted of 19a [349]. The native version of the probe is not fluores-cent in the near-IR region of the electromagnetic spectrum. However, upon reacting with NADPH, near-IR fluorescence was observed due to the formation of the conjugated struc-ture 19b (Figure 42). Furthermore, the probe exhibited photoacoustic signals upon react-ing with NADPH. The probe was used to monitor NADPH during energy metabolism in tumor-bearing mice by fluorescence and photoacoustic dual-mode imaging (Figure 42) [349].
Figure 41. (A) Chemical structures of 18a and 18b. Time-dependent in vivo photoacoustic imagesof the tumor region in mice after tail vein injection of (B) nanoparticles of 18a (200 µL, 1 mg mL−1)and (C) saline (200 µL) as control. (Left to right) Images were obtained after 6, 24, 48, and 72 hpost-injection of nanoparticles. Scale bar = 2 mm. A strong photoacoustic signal was detected6 h post-injection demonstrating the responsiveness of 18a to hypoxia. (D,E) Time-lapse near-IRfluorescence images of mice before (0 min) and after (10, 30, 60, and 100 min) being intratumorallyinjected with (D) 18a nanoparticles and (E) 18b nanoparticles (50 µL, 1 mg mL−1). Top panels are thefluorescence signals collected upon excitation at 500 nm, and the bottom panels are the fluorescencesignals collected upon excitation at 570 nm. The fluorescence in mice injected with 18a decreasesovertime with excitation at 500 nm, whereas fluorescence with 570 nm excitation increased overtime.The changes indicate the reduction in 18a upon entering hypoxic cells. Because 18b is not sensitive tohypoxia, fluorescence remained constant within 100 min post-injection regardless of the excitationwavelength. Adapted with permission [348].
Because cellular thiols are essential biomolecules that play a major role in redox home-ostasis and cellular growth, abnormal levels of thiols are closely associated with variousconditions including oxidative stress [96]. Optical techniques are suitable for the detectionof aminothiols because of their sensitivity, simple operation techniques, and low costs [350].Ajayaghosh, Zhao, and co-workers reported an unsymmetrical near-IR squaraine dye, 20a,as a contrast agent for real-time monitoring of aminothiol levels in live animals using near-IR fluorescence and photoacoustic bimodal imaging [351]. Squaraine exhibits a narrowabsorption band at 680 nm that generates a photoacoustic signal and a strong near-IRemission at 700 nm. However, in the presence of thiols in biological systems, both near-IRand photoacoustic signals disappear. In vitro and in vivo studies were performed usingmice with severe immune deficiency and demonstrated the applications of the squarainedye in biomedical applications (Figure 43) [351].

Biosensors 2022, 12, 478 47 of 87Biosensors 2022, 12, x FOR PEER REVIEW 47 of 86
Figure 42. In vivo imaging studies of 19. (A) Chemical structures and conversion of 19a into 19b in the presence of NADPH. (B) Time-dependent near-IR fluorescence images of tumor-bearing mice injected with 19a [images were collected at (left to right) 0, 5, 30, 60, 90, 120, and 150 min]. (C) Time-dependent photoacoustic images of tumor-bearing mice injected with 19a [images were collected at (left to right) 0, 30, 60, 90, and 120 min]. The tumor site is indicated by white dashed circles. Relative fluorescence intensity and photoacoustic intensity of images increase with time due to the formation of 19b. Adapted from Biomaterials, 271, Tian, Y.; Jiang, W.-L.; Wang, W.-X.; Mao, G.-J.; Li, Y.; Li, C.-Y. NAD(P)H-triggered probe for dual-modal imaging during energy metabolism and novel strategy of enhanced photothermal therapy in tumor, 120736, Copyright 2021, with permission from Elsevier [349].
Because cellular thiols are essential biomolecules that play a major role in redox ho-meostasis and cellular growth, abnormal levels of thiols are closely associated with vari-ous conditions including oxidative stress [96]. Optical techniques are suitable for the de-tection of aminothiols because of their sensitivity, simple operation techniques, and low costs [350]. Ajayaghosh, Zhao, and co-workers reported an unsymmetrical near-IR squaraine dye, 20a, as a contrast agent for real-time monitoring of aminothiol levels in live animals using near-IR fluorescence and photoacoustic bimodal imaging [351]. Squaraine exhibits a narrow absorption band at 680 nm that generates a photoacoustic signal and a strong near-IR emission at 700 nm. However, in the presence of thiols in biological sys-tems, both near-IR and photoacoustic signals disappear. In vitro and in vivo studies were performed using mice with severe immune deficiency and demonstrated the applications of the squaraine dye in biomedical applications (Figure 43) [351].
Cysteine is a thiol that plays a vital role in redox homeostasis [74–76]. Levels of cys-teine and homocysteine are closely related to multiple pathological processes; therefore, detection of these thiols is important for the early diagnosis of diseases including cancer [352–354]. Chen, He, and co-workers reported a near-IR fluorescence and photoacoustic dual-mode molecular probe, 21a, that is activated by cysteine or homocysteine [355]. The probe undergoes nucleophilic substitution and Smiles rearrangement in response to the presence of cysteine or homocysteine. This reaction turns on near-IR fluorescence and ra-tiometric photoacoustic signals. In vitro and in vivo studies were performed using the molecular probe to investigate its applications in biomedical applications (Figure 44) [355].
Figure 42. In vivo imaging studies of 19. (A) Chemical structures and conversion of 19a into 19b inthe presence of NADPH. (B) Time-dependent near-IR fluorescence images of tumor-bearing miceinjected with 19a [images were collected at (left to right) 0, 5, 30, 60, 90, 120, and 150 min]. (C) Time-dependent photoacoustic images of tumor-bearing mice injected with 19a [images were collectedat (left to right) 0, 30, 60, 90, and 120 min]. The tumor site is indicated by white dashed circles.Relative fluorescence intensity and photoacoustic intensity of images increase with time due to theformation of 19b. Adapted from Biomaterials, 271, Tian, Y.; Jiang, W.-L.; Wang, W.-X.; Mao, G.-J.; Li, Y.;Li, C.-Y. NAD(P)H-triggered probe for dual-modal imaging during energy metabolism and novelstrategy of enhanced photothermal therapy in tumor, 120736, Copyright 2021, with permission fromElsevier [349].
Cysteine is a thiol that plays a vital role in redox homeostasis [74–76]. Levels of cysteineand homocysteine are closely related to multiple pathological processes; therefore, detectionof these thiols is important for the early diagnosis of diseases including cancer [352–354].Chen, He, and co-workers reported a near-IR fluorescence and photoacoustic dual-modemolecular probe, 21a, that is activated by cysteine or homocysteine [355]. The probeundergoes nucleophilic substitution and Smiles rearrangement in response to the presenceof cysteine or homocysteine. This reaction turns on near-IR fluorescence and ratiometricphotoacoustic signals. In vitro and in vivo studies were performed using the molecularprobe to investigate its applications in biomedical applications (Figure 44) [355].
Homeostasis of H2S is disrupted in hypoxic tumors [99,100]. Yang, Guo, He, andco-workers reported a ratiometric optical/photoacoustic dual-mode probe that responds toH2S [356]. Some interferences inherent to both modalities including tissue scattering andautofluorescence are minimized in ratiometric imaging. The cyanine moiety of 22a exhibitsnear-IR absorption and emission. In the presence of HS−, the nucleophilic substitutionof the ester by HS− produces enolic heptamethine cyanine that undergoes keto–enoltautomerization to form 22b (Figure 45). Tautomerization shifts absorption and emissionproperties, enabling the detection of HS− using a ratiometric method. In vivo assessment ofthe probe demonstrated that it detects upregulation of H2S in mouse livers using ratiometricoptical and photoacoustic imaging (Figure 45) [356].

Biosensors 2022, 12, 478 48 of 87Biosensors 2022, 12, x FOR PEER REVIEW 48 of 86
Figure 43. (A) Chemical structures and conversion of 20a to 20b in the presence of aminothiols. (B) In vivo fluorescence reflectance images from dorsal side of a seven-week-old fasting mouse (top panels) and post-food mouse (bottom panels). (I) pre-injected with 20a in a fasting female mouse at 675 ± 15 nm excitation and 700 ± 10 nm emission. (II) and (III) images were recorded after 15 and 40 min, respectively, of injection of 20a under fasting conditions. Images of mouse in post-food condi-tions were recorded upon excitation of 675 ± 15 nm and 700 ± 10 nm emission. Images were recorded at (IV) 5, (V) 15, and (VI) 40 min. Scale bar = 1.5 mm. Under fasting conditions, low levels of amino-thiols are present in blood. Therefore, strong near-IR fluorescence and photoacoustic signals can be observed during fasting conditions. After food, high levels of aminothiols in blood are observed. Hence, both near-IR and fluorescence signals become weakened. Based on (II) and (III), a strong fluorescence emission indicates effective distribution of 20a in blood and its accumulation in the abdominal area. After feeding, images (IV), (V), and (VI) exhibit weak fluorescence, indicating that thiol production after food was high and as-generated thiols reacted with 20a. (C) Single wavelength multispectral optoacoustic images of a live mouse at 680 nm. (VII) Anatomy of the fasting mouse at 40 min post-injection of 20a. (VIII) Anatomy of the mouse under post-food conditions at 40 min post-injection of 20a. White arrows indicate fluorescence signals from 20a. Adapted from Ref. [351] with permission from the Royal Society of Chemistry.
Homeostasis of H2S is disrupted in hypoxic tumors [99,100]. Yang, Guo, He, and co-workers reported a ratiometric optical/photoacoustic dual-mode probe that responds to H2S [356]. Some interferences inherent to both modalities including tissue scattering and autofluorescence are minimized in ratiometric imaging. The cyanine moiety of 22a exhib-its near-IR absorption and emission. In the presence of HS–, the nucleophilic substitution of the ester by HS– produces enolic heptamethine cyanine that undergoes keto–enol tau-tomerization to form 22b (Figure 45). Tautomerization shifts absorption and emission properties, enabling the detection of HS– using a ratiometric method. In vivo assessment of the probe demonstrated that it detects upregulation of H2S in mouse livers using rati-ometric optical and photoacoustic imaging (Figure 45) [356].
Figure 43. (A) Chemical structures and conversion of 20a to 20b in the presence of aminothiols.(B) In vivo fluorescence reflectance images from dorsal side of a seven-week-old fasting mouse (toppanels) and post-food mouse (bottom panels). (I) pre-injected with 20a in a fasting female mouseat 675 ± 15 nm excitation and 700 ± 10 nm emission. (II) and (III) images were recorded after 15and 40 min, respectively, of injection of 20a under fasting conditions. Images of mouse in post-foodconditions were recorded upon excitation of 675 ± 15 nm and 700 ± 10 nm emission. Images wererecorded at (IV) 5, (V) 15, and (VI) 40 min. Scale bar = 1.5 mm. Under fasting conditions, low levels ofaminothiols are present in blood. Therefore, strong near-IR fluorescence and photoacoustic signals canbe observed during fasting conditions. After food, high levels of aminothiols in blood are observed.Hence, both near-IR and fluorescence signals become weakened. Based on (II) and (III), a strongfluorescence emission indicates effective distribution of 20a in blood and its accumulation in theabdominal area. After feeding, images (IV), (V), and (VI) exhibit weak fluorescence, indicating thatthiol production after food was high and as-generated thiols reacted with 20a. (C) Single wavelengthmultispectral optoacoustic images of a live mouse at 680 nm. (VII) Anatomy of the fasting mouseat 40 min post-injection of 20a. (VIII) Anatomy of the mouse under post-food conditions at 40 minpost-injection of 20a. White arrows indicate fluorescence signals from 20a. Adapted from Ref. [351]with permission from the Royal Society of Chemistry.

Biosensors 2022, 12, 478 49 of 87Biosensors 2022, 12, x FOR PEER REVIEW 49 of 86
Figure 44. (A) Conversion of 21a to 21b in the presence of cysteine and homocysteine. (B) Fluores-cence images of mice after intraperitoneal injection with 21a. (I) images were collected 20 min after injection (50 μM, 100 μL of 21a). (II) mice were injected with N-ethylmaleimide (a canonical biothiols scavenger) for 30 min, then 21a (50 μM, 100 μL) was injected and imaging performed after 20 min. (III) and (IV) mice were pre-injected with 1 mM N-ethylmaleimide and then injected intraperitone-ally with (III) cysteine (1 mM, 50 μL) or (IV) homocysteine (1 mM, 50 μL), and then 21a (50 μM, 100 μL) was injected and imaging occurred after 20 min. Excitation wavelength = 660 nm; Emission wavelength = 780 nm. (C,D) Representative in vivo photoacoustic images of mice subcutaneously injected with 21a. Signals were collected under two laser light sources 695 [top panels of both (C,D)] and 840 nm [bottom panels of both (C,D)]. (VI) before injection with 21a (50 μM, 100 μL); (VII) injection with 21a; (VIII) injection with saline (100 μL, left leg) and cysteine (100 μL, 1 mM, right leg); (IX) before injection with 21a (50 μM, 100 μL); (X) injection with 21a; (XI) injection with saline (100 μL, left leg) and homocysteine (100 μL, 1 mM, right leg). Scale bar = 5 mm. Adapted by permis-sion from Springer Nature and Copyright Clearance Center: Springer Nature, Science China Chemis-try, Springer, Fang, H.; Chen, Y.; Wang, Y.; Geng, S.; Yao, S.; Song, D.; He, W.; Guo, Z. A dual-modal probe for NIR fluorogenic and ratiometric photoacoustic imaging of Cys/Hcy in vivo. Sci. China Chem., 2020, 63, 699–706. Copyright 2020 [355].
Figure 45. In vivo studies of complex 22 were performed using 6-week-old mice. (A) Chemical struc-tures and schematic diagram of H2S-sensing mechanism of the probe. (B) Fluorescence images of
Figure 44. (A) Conversion of 21a to 21b in the presence of cysteine and homocysteine. (B) Fluo-rescence images of mice after intraperitoneal injection with 21a. (I) images were collected 20 minafter injection (50 µM, 100 µL of 21a). (II) mice were injected with N-ethylmaleimide (a canonicalbiothiols scavenger) for 30 min, then 21a (50 µM, 100 µL) was injected and imaging performedafter 20 min. (III) and (IV) mice were pre-injected with 1 mM N-ethylmaleimide and then injectedintraperitoneally with (III) cysteine (1 mM, 50 µL) or (IV) homocysteine (1 mM, 50 µL), and then 21a(50 µM, 100 µL) was injected and imaging occurred after 20 min. Excitation wavelength = 660 nm;Emission wavelength = 780 nm. (C,D) Representative in vivo photoacoustic images of mice subcuta-neously injected with 21a. Signals were collected under two laser light sources 695 [top panels of both(C,D)] and 840 nm [bottom panels of both (C,D)]. (VI) before injection with 21a (50 µM, 100 µL); (VII)injection with 21a; (VIII) injection with saline (100 µL, left leg) and cysteine (100 µL, 1 mM, right leg);(IX) before injection with 21a (50 µM, 100 µL); (X) injection with 21a; (XI) injection with saline (100 µL,left leg) and homocysteine (100 µL, 1 mM, right leg). Scale bar = 5 mm. Adapted by permission fromSpringer Nature and Copyright Clearance Center: Springer Nature, Science China Chemistry, Springer,Fang, H.; Chen, Y.; Wang, Y.; Geng, S.; Yao, S.; Song, D.; He, W.; Guo, Z. A dual-modal probe for NIRfluorogenic and ratiometric photoacoustic imaging of Cys/Hcy in vivo. Sci. China Chem., 2020, 63,699–706. Copyright 2020 [355].
Zeng, Pu, and co-workers reported a hemicyanine dye that is caged by a trifluo-romethyl ketone moiety for in vivo imaging of peroxynitrite (Figure 46) [357]. The probe isnon-fluorescent when caged by the trifluoromethyl ketone moiety that contains an electron-donating oxygen atom. In the presence of ONOO−, the trifluoromethyl ketone undergoesa series of cascade oxidation–elimination reactions. As a consequence, a phenolic groupis formed with enhanced electron-donating ability from the oxygen atom. The result is afluorescence turn-on with red-shifted near-IR absorption, enabling the probe to be usefulin dual-mode imaging. In vivo studies with 4T1 tumor-bearing mice demonstrated thatboth near-IR fluorescence and photoacoustic signals reached maximum values within threehours after tail vein administration of the probe. Relative to the background signals ofthe tumor, fluorescence, and photoacoustic signals exhibited 5.3- and 2.1-fold, respectively,greater intensities at three hours post-injection of the probe (Figure 46) [357].
Although levels of reactive oxygen species are important biomarkers of tumors, theirreactivity, low abundance, and short-lived nature limit the ability to image these speciesin vivo [358]. However, the levels of reactive oxygen species are good indicators of hy-poxic tumors, and therefore, it is important to develop probes that can accurately mapthese reactive species. Bohndiek and co-workers reported a probe (JW41) that contains aheptamethine carbocyanine dye scaffold, 2-deoxyglucose, and a boronic ester [359]. Thedye exhibits fluorescence and photoacoustic properties, 2-deoxyglucose acts as tumorlocalization moiety, and the boronic ester reacts with hydrogen peroxide. In vivo studiesdemonstrated that after intravenous injection of the probe into tumor-bearing mice, itaccumulated in tumors and visualized hydrogen peroxide in hypoxic cells [359].

Biosensors 2022, 12, 478 50 of 87
Biosensors 2022, 12, x FOR PEER REVIEW 49 of 86
Figure 44. (A) Conversion of 21a to 21b in the presence of cysteine and homocysteine. (B) Fluores-cence images of mice after intraperitoneal injection with 21a. (I) images were collected 20 min after injection (50 μM, 100 μL of 21a). (II) mice were injected with N-ethylmaleimide (a canonical biothiols scavenger) for 30 min, then 21a (50 μM, 100 μL) was injected and imaging performed after 20 min. (III) and (IV) mice were pre-injected with 1 mM N-ethylmaleimide and then injected intraperitone-ally with (III) cysteine (1 mM, 50 μL) or (IV) homocysteine (1 mM, 50 μL), and then 21a (50 μM, 100 μL) was injected and imaging occurred after 20 min. Excitation wavelength = 660 nm; Emission wavelength = 780 nm. (C,D) Representative in vivo photoacoustic images of mice subcutaneously injected with 21a. Signals were collected under two laser light sources 695 [top panels of both (C,D)] and 840 nm [bottom panels of both (C,D)]. (VI) before injection with 21a (50 μM, 100 μL); (VII) injection with 21a; (VIII) injection with saline (100 μL, left leg) and cysteine (100 μL, 1 mM, right leg); (IX) before injection with 21a (50 μM, 100 μL); (X) injection with 21a; (XI) injection with saline (100 μL, left leg) and homocysteine (100 μL, 1 mM, right leg). Scale bar = 5 mm. Adapted by permis-sion from Springer Nature and Copyright Clearance Center: Springer Nature, Science China Chemis-try, Springer, Fang, H.; Chen, Y.; Wang, Y.; Geng, S.; Yao, S.; Song, D.; He, W.; Guo, Z. A dual-modal probe for NIR fluorogenic and ratiometric photoacoustic imaging of Cys/Hcy in vivo. Sci. China Chem., 2020, 63, 699–706. Copyright 2020 [355].
Figure 45. In vivo studies of complex 22 were performed using 6-week-old mice. (A) Chemical struc-tures and schematic diagram of H2S-sensing mechanism of the probe. (B) Fluorescence images of
Figure 45. In vivo studies of complex 22 were performed using 6-week-old mice. (A) Chemicalstructures and schematic diagram of H2S-sensing mechanism of the probe. (B) Fluorescence images ofmice injected with 22 and saline S-adenosyl-L-methionine (trigger H2S upregulation). Photoacousticimages of livers from mice injected with 22 and S-adenosyl-L-methionine and saline. (p indicatesprobe 22). Images were recorded using channels 775 and 825 nm. Scale bar = 6 mm. Adaptedwith permission from Chen, Z.; Mu, X.; Han, Z.; Yang, S.; Zhang, C.; Guo, Z.; Bai, Y.; He, W. Anoptical/photoacoustic dual-modality probe: ratiometric in/ex vivo imaging for stimulated H2Supregulation in mice. J. Am. Chem. Soc., 2019, 141, 17973–17977. Copyright 2019 American ChemicalSociety [356].
Biosensors 2022, 12, x FOR PEER REVIEW 50 of 86
mice injected with 22 and saline S-adenosyl-L-methionine (trigger H2S upregulation). Photoacoustic images of livers from mice injected with 22 and S-adenosyl-L-methionine and saline. (p indicates probe 22). Images were recorded using channels 775 and 825 nm. Scale bar = 6 mm. Adapted with permission from Chen, Z.; Mu, X.; Han, Z.; Yang, S.; Zhang, C.; Guo, Z.; Bai, Y.; He, W. An opti-cal/photoacoustic dual-modality probe: ratiometric in/ex vivo imaging for stimulated H2S upregu-lation in mice. J. Am. Chem. Soc., 2019, 141, 17973–17977. Copyright 2019 American Chemical Society [356].
Zeng, Pu, and co-workers reported a hemicyanine dye that is caged by a trifluorome-thyl ketone moiety for in vivo imaging of peroxynitrite (Figure 46) [357]. The probe is non-fluorescent when caged by the trifluoromethyl ketone moiety that contains an electron-donating oxygen atom. In the presence of ONOO–, the trifluoromethyl ketone undergoes a series of cascade oxidation–elimination reactions. As a consequence, a phenolic group is formed with enhanced electron-donating ability from the oxygen atom. The result is a fluorescence turn-on with red-shifted near-IR absorption, enabling the probe to be useful in dual-mode imaging. In vivo studies with 4T1 tumor-bearing mice demonstrated that both near-IR fluorescence and photoacoustic signals reached maximum values within three hours after tail vein administration of the probe. Relative to the background signals of the tumor, fluorescence, and photoacoustic signals exhibited 5.3- and 2.1-fold, respec-tively, greater intensities at three hours post-injection of the probe (Figure 46) [357].
Figure 46. In vivo studies of the molecular probe 23. (A) Real-time fluorescence images of tumor-bearing mouse after systemic administration of 23a (50 μM in 100 μL saline) at 0, 3, and 4 h. (B) Representative photoacoustic maximum imaging projection of tumor from a systemic administra-tion of a living mouse at 0, 3, and 4 h post-injection of 23a (50 μM in 100 μL saline). (C) Chemical structures of 23a, 23b, and 23c, and the conversion of 23a to 23c. Adapted with permission from Zhang, J.; Zhen, X.; Zeng, J.; Pu, K. A dual-modal molecular probe for near-infrared fluorescence and photoacoustic imaging of peroxynitrite. Anal. Chem., 2018, 90, 9301–9307. Copyright 2018 Amer-ican Chemical Society [357].
Although levels of reactive oxygen species are important biomarkers of tumors, their reactivity, low abundance, and short-lived nature limit the ability to image these species in vivo [358]. However, the levels of reactive oxygen species are good indicators of hy-poxic tumors, and therefore, it is important to develop probes that can accurately map these reactive species. Bohndiek and co-workers reported a probe (JW41) that contains a heptamethine carbocyanine dye scaffold, 2-deoxyglucose, and a boronic ester [359]. The dye exhibits fluorescence and photoacoustic properties, 2-deoxyglucose acts as tumor lo-calization moiety, and the boronic ester reacts with hydrogen peroxide. In vivo studies demonstrated that after intravenous injection of the probe into tumor-bearing mice, it ac-cumulated in tumors and visualized hydrogen peroxide in hypoxic cells [359].
Hai and co-workers developed a near-IR probe for detection of hydrogen peroxide in mitochondria at a limit of detection of 0.348 μM [360]. The probe consists of three moi-
Figure 46. In vivo studies of the molecular probe 23. (A) Real-time fluorescence images of tumor-bearing mouse after systemic administration of 23a (50 µM in 100 µL saline) at 0, 3, and 4 h.(B) Representative photoacoustic maximum imaging projection of tumor from a systemic administra-tion of a living mouse at 0, 3, and 4 h post-injection of 23a (50 µM in 100 µL saline). (C) Chemicalstructures of 23a, 23b, and 23c, and the conversion of 23a to 23c. Adapted with permission fromZhang, J.; Zhen, X.; Zeng, J.; Pu, K. A dual-modal molecular probe for near-infrared fluorescence andphotoacoustic imaging of peroxynitrite. Anal. Chem., 2018, 90, 9301–9307. Copyright 2018 AmericanChemical Society [357].

Biosensors 2022, 12, 478 51 of 87
Hai and co-workers developed a near-IR probe for detection of hydrogen peroxide inmitochondria at a limit of detection of 0.348 µM [360]. The probe consists of three moietiesthat enable targeting of mitochondria, response to hydrogen peroxide, and generationof fluorescence and photoacoustic signals (Figure 47). Hemicyanine is a class of near-IR dyes that has outstanding absorption and emission properties due to intramolecularcharge transfer mechanisms. Because the hydroxyl group of 24a is caged before enteringthe mitochondria, fluorescence and photoacoustic signals are inhibited by intramolecularcharge transfer transitions. Upon entering mitochondria, hydrogen peroxide reacts withthe boronic acid moiety, causing its elimination from the probe. Removal of the boronic acidmoiety exposes hemicyanine dye and subsequent 2.4- and 4.7-fold increases in fluorescenceand photoacoustic signals, respectively, in HeLa cells (Figure 47) [360].
Biosensors 2022, 12, x FOR PEER REVIEW 51 of 86
eties that enable targeting of mitochondria, response to hydrogen peroxide, and genera-tion of fluorescence and photoacoustic signals (Figure 47). Hemicyanine is a class of near-IR dyes that has outstanding absorption and emission properties due to intramolecular charge transfer mechanisms. Because the hydroxyl group of 24a is caged before entering the mitochondria, fluorescence and photoacoustic signals are inhibited by intramolecular charge transfer transitions. Upon entering mitochondria, hydrogen peroxide reacts with the boronic acid moiety, causing its elimination from the probe. Removal of the boronic acid moiety exposes hemicyanine dye and subsequent 2.4- and 4.7-fold increases in fluo-rescence and photoacoustic signals, respectively, in HeLa cells (Figure 47) [360].
Figure 47. (A) Chemical structures of 24a and 24b. (B) Time-dependent near-IR fluorescence images and (C) time-dependent multispectral photoacoustic images of the abdomen of mice intraperitone-ally injected with 24a (250 μM, 200 μL). (B) (I) and (II) represent the (I) presence and (II) absence of lipopolysaccharide-induced inflammation. (C) (I) and (II) represent the (I) presence and (II) absence of lipopolysaccharide-induced inflammation. Adapted with permission from Chen, X.; Ren, X.; Zhang, L.; Liu, Z.; Hai, Z. Mitochondria-targeted fluorescent and photoacoustic imaging of hydro-gen peroxide in inflammation. Anal. Chem., 2020, 92, 14244–14250. Copyright 2020 American Chem-ical Society [360].
Nitric oxide plays an important role in hypoxia. Therefore, detection of nitric oxide in biological systems is important to the study of cancer. Zheng, Yuan, Zhang, and co-workers reported probe 25a which contains diphenylamine and benzothiadiazolediamine to determine endogenous nitric oxide levels in cells using fluorescence and photoacoustic imaging (Figure 48) [361]. In the presence of nitric oxide under aerobic conditions, 25a forms complex 24b. This change results in an increase in intramolecular charge transfer in the structure. The probe has an absorption centered at 368 nm, and upon reacting with nitric oxide, the absorption peak shifts to 568 nm. This difference can be used to detect nitric oxide using photoacoustic imaging. Additionally, the probe has a fluorescence on–
Figure 47. (A) Chemical structures of 24a and 24b. (B) Time-dependent near-IR fluorescence imagesand (C) time-dependent multispectral photoacoustic images of the abdomen of mice intraperitoneallyinjected with 24a (250 µM, 200 µL). (B) (I) and (II) represent the (I) presence and (II) absence oflipopolysaccharide-induced inflammation. (C) (I) and (II) represent the (I) presence and (II) absenceof lipopolysaccharide-induced inflammation. Adapted with permission from Chen, X.; Ren, X.;Zhang, L.; Liu, Z.; Hai, Z. Mitochondria-targeted fluorescent and photoacoustic imaging of hydrogenperoxide in inflammation. Anal. Chem., 2020, 92, 14244–14250. Copyright 2020 American ChemicalSociety [360].
Nitric oxide plays an important role in hypoxia. Therefore, detection of nitric oxidein biological systems is important to the study of cancer. Zheng, Yuan, Zhang, and co-workers reported probe 25a which contains diphenylamine and benzothiadiazolediamineto determine endogenous nitric oxide levels in cells using fluorescence and photoacousticimaging (Figure 48) [361]. In the presence of nitric oxide under aerobic conditions, 25aforms complex 24b. This change results in an increase in intramolecular charge transferin the structure. The probe has an absorption centered at 368 nm, and upon reacting with

Biosensors 2022, 12, 478 52 of 87
nitric oxide, the absorption peak shifts to 568 nm. This difference can be used to detectnitric oxide using photoacoustic imaging. Additionally, the probe has a fluorescence on–offresponse and excellent selectivity for nitric oxide compared to other reactive-oxygen andreactive-nitrogen species [361].
Biosensors 2022, 12, x FOR PEER REVIEW 52 of 86
off response and excellent selectivity for nitric oxide compared to other reactive-oxygen and reactive-nitrogen species [361].
Figure 48. (A) Transformation of 25a to 25b in the presence of nitric oxide. (B) Confocal fluorescence images for detection of nitric oxide in RAW264.7 cells. (1), (2), and (3) represent the red channel, bright field, and merged images, respectively. Columns left to right represent (a) Cells incubated with the probe (2 μM) for 1 h. (b) and (c) The cells were pretreated with 2 and 5 μg mL–1 lipopoly-saccharide, respectively, to induce inflammation for 4 h and then incubated with the probe (2 μM) for another 4 h. d) Cells were pretreated with N-acetylcystein (2 mM) to inhibit nitric oxide for 1 h, incubated with lipopolysaccharide (5 μg/mL) for 4 h, and then incubated with the probe (2 μM) for 4 h. Merged images were produced by combining the red channel and bright field. Excitation wave-length = 405 nm; emission wavelength = 500–600 nm. Scale bars = 20 μm. (C) In vivo photoacoustic images of subcutaneously injected seven-week-old mice (I) and (II) induce inflammation by lipo-polysaccharide (200 μL, 1 mg mL–1). (III) and (IV) injected with phosphate-buffered saline (200 μL, pH 7.4) as reference sites. (I) and (III) represent images acquired from the sites also subcutaneously injected with probe (150 μL, 10 μM). Adapted from Sensors and Acutators B: Chemical, 267, Wang, S.; Li, Z.; Liu, Y.; Feng, G.; Zheng, J.; Yuan, Z.; Zhang, X. Activatable photoacoustic and fluorescent probe of nitric oxide for cellular and in vivo imaging, 403–411, Copyright 2018, with permission from Elsevier [361].
Hypoxia can be studied by determining the amount of hydrogen sulfide in diseased tissue [99,100]. For example, hydrogen sulfide is significantly increased in colon cancer and thus imaging hydrogen sulfide in vivo enables the accurate diagnosis of colon cancer [362–364]. Wang, Sun, and co-workers reported nitrobenzoxadiazole amine derivatives that undergo H2S-specific thiolysis by cleavage of a C–N bond (Figure 49) [365]. Cleavage of the C–N bond was accelerated by incorporating electron-withdrawing groups. Com-
Figure 48. (A) Transformation of 25a to 25b in the presence of nitric oxide. (B) Confocal fluorescenceimages for detection of nitric oxide in RAW264.7 cells. (i), (ii), and (iii) represent the red channel,bright field, and merged images, respectively. Columns left to right represent (a) Cells incubatedwith the probe (2 µM) for 1 h. (b) and (c) The cells were pretreated with 2 and 5 µg mL−1 lipopolysac-charide, respectively, to induce inflammation for 4 h and then incubated with the probe (2 µM) foranother 4 h. d) Cells were pretreated with N-acetylcystein (2 mM) to inhibit nitric oxide for 1 h,incubated with lipopolysaccharide (5 µg/mL) for 4 h, and then incubated with the probe (2 µM)for 4 h. Merged images were produced by combining the red channel and bright field. Excitationwavelength = 405 nm; emission wavelength = 500–600 nm. Scale bars = 20 µm. (C) In vivo photoa-coustic images of subcutaneously injected seven-week-old mice (i) and (ii) induce inflammation bylipopolysaccharide (200 µL, 1 mg mL−1). (iii) and (iv) injected with phosphate-buffered saline (200 µL,pH 7.4) as reference sites. (i) and (iii) represent images acquired from the sites also subcutaneouslyinjected with probe (150 µL, 10 µM). Adapted from Sensors and Acutators B: Chemical, 267, Wang, S.;Li, Z.; Liu, Y.; Feng, G.; Zheng, J.; Yuan, Z.; Zhang, X. Activatable photoacoustic and fluorescentprobe of nitric oxide for cellular and in vivo imaging, 403–411, Copyright 2018, with permission fromElsevier [361].
Hypoxia can be studied by determining the amount of hydrogen sulfide in diseasedtissue [99,100]. For example, hydrogen sulfide is significantly increased in colon can-cer and thus imaging hydrogen sulfide in vivo enables the accurate diagnosis of colon

Biosensors 2022, 12, 478 53 of 87
cancer [362–364]. Wang, Sun, and co-workers reported nitrobenzoxadiazole amine deriva-tives that undergo H2S-specific thiolysis by cleavage of a C–N bond (Figure 49) [365].Cleavage of the C–N bond was accelerated by incorporating electron-withdrawing groups.Compound 26a showed a large fluorescence on–off response rate (k2 = 4.04 M−1 s−1) andselectivity for H2S over other thiols. Cleavage of the C–N bond of 26a by H2S and for-mation of 26b results in a bathochromic shift and decrease in fluorescence signal. Onthe other hand, due to the strong absorption of light by 26b, the photoacoustic signal isenhanced. Therefore, the probe exhibits fluorescence quenching and photoacoustic signalenhancement in response to the presence of H2S. Studies with HeLa cells treated with26a demonstrated a decrease in fluorescence signals in the presence of H2S (200 µM) anda strong photoacoustic signal that is about 2.9-fold larger than that of the control groupconsisting of only 26a without H2S [365].
Biosensors 2022, 12, x FOR PEER REVIEW 53 of 86
pound 26a showed a large fluorescence on–off response rate (k2 = 4.04 M–1 s–1) and selec-tivity for H2S over other thiols. Cleavage of the C–N bond of 26a by H2S and formation of 26b results in a bathochromic shift and decrease in fluorescence signal. On the other hand, due to the strong absorption of light by 26b, the photoacoustic signal is enhanced. There-fore, the probe exhibits fluorescence quenching and photoacoustic signal enhancement in response to the presence of H2S. Studies with HeLa cells treated with 26a demonstrated a decrease in fluorescence signals in the presence of H2S (200 μM) and a strong photoacous-tic signal that is about 2.9-fold larger than that of the control group consisting of only 26a without H2S [365].
Figure 49. (A) Chemical structures of 26a and 26b. (B) Photoacoustic images of HeLa cells incubated with (I) 26a and (II) pretreated with 26a (50 μM) for 30 min and then incubated with H2S (500 μM) for 40 min. Excitation wavelength = 532 nm; pulse energy = 100 nJ; scale bars = 50 μm. (C) Time-dependent photoacoustic images of living mice subcutaneously injected into a leg of each mouse. Excitation wavelength = 532 nm; fluence = 1.5 mJ/cm2. Matrigel mixed with phosphate-buffered sa-line (150 μL) and 26a. Matrigel mixed with H2S in phosphate-buffered saline (150 μL, final concen-tration 30 mM) and 26a (50 μL, 100 mM). Adapted with permission from Zhang, J.; Wen, G.; Wang, W.; Cheng, K.; Guo, Q.; Tian, S.; Liu, C.; Hu, H.; Zhang, Y.; Zhang, H.; Wang, L.; Sun, H. Controllable cleavage of C–N bond-based fluorescent and photoacoustic dual-modal probes for the detection of H2S in living mice. ACS Appl. Bio Mater., 2020, 4, 2020–2025. Copyright 2020 American Chemical Society [365].
Zeng, Liu, and co-workers reported a self-assembled albumin-based nanoprobe for in vivo pH mapping using photoacoustic and fluorescence imaging [366]. Two near-IR dyes, 27a and 27b, were induced to self-assemble with human serum albumin to form albumin–dye nanocomplexes. Absorbance and fluorescence of 27b are inert to pH changes, and thus 24b serves as an internal reference. Dye 27a is pH-responsive and acts as a pH indicator under both ratiometric photoacoustic and fluorescence imaging. In vivo applications of the nanoprobe as a pH indicator were demonstrated using tumor-bearing mice (Figure 50) [366].
Figure 49. (A) Chemical structures of 26a and 26b. (B) Photoacoustic images of HeLa cells incubatedwith (I) 26a and (II) pretreated with 26a (50 µM) for 30 min and then incubated with H2S (500 µM)for 40 min. Excitation wavelength = 532 nm; pulse energy = 100 nJ; scale bars = 50 µm. (C) Time-dependent photoacoustic images of living mice subcutaneously injected into a leg of each mouse.Excitation wavelength = 532 nm; fluence = 1.5 mJ/cm2. Matrigel mixed with phosphate-bufferedsaline (150 µL) and 26a. Matrigel mixed with H2S in phosphate-buffered saline (150 µL, finalconcentration 30 mM) and 26a (50 µL, 100 mM). Adapted with permission from Zhang, J.; Wen, G.;Wang, W.; Cheng, K.; Guo, Q.; Tian, S.; Liu, C.; Hu, H.; Zhang, Y.; Zhang, H.; Wang, L.; Sun, H.Controllable cleavage of C–N bond-based fluorescent and photoacoustic dual-modal probes for thedetection of H2S in living mice. ACS Appl. Bio Mater., 2020, 4, 2020–2025. Copyright 2020 AmericanChemical Society [365].
Zeng, Liu, and co-workers reported a self-assembled albumin-based nanoprobe forin vivo pH mapping using photoacoustic and fluorescence imaging [366]. Two near-IRdyes, 27a and 27b, were induced to self-assemble with human serum albumin to formalbumin–dye nanocomplexes. Absorbance and fluorescence of 27b are inert to pH changes,and thus 24b serves as an internal reference. Dye 27a is pH-responsive and acts as apH indicator under both ratiometric photoacoustic and fluorescence imaging. In vivoapplications of the nanoprobe as a pH indicator were demonstrated using tumor-bearingmice (Figure 50) [366].

Biosensors 2022, 12, 478 54 of 87Biosensors 2022, 12, x FOR PEER REVIEW 54 of 86
Figure 50. (A) Chemical structures of 27a and 27b. (B) Photoacoustic images of tumors having dif-ferent sizes after mice were intravenously injected with the 27a. Images were recorded at 680 and 825 nm excitations (II) 6, (III) 10, (IV) 14, and 18 days after injection. (I) represents the control (tumor without 27a). (C) Ex vivo fluorescence images of tumor with different sizes collected from mice (V) 6, (VI) 10, (VII) 14, and (VIII) 18 days after intravenous injection of 27a. Adapted with permission from Chen, Q.; Liu, X.; Chen, J.; Zeng, J.; Cheng, Z.; Liu, Z. Advanced Materials, John Wiley and Sons [361].
Gong, Cai, and co-workers reported a pH-sensitive small molecule for near-IR fluo-rescence and photoacoustic imaging [367]. The near-IR dye consisted of heptamethine cy-anine which possesses high extinction coefficients and tumor accumulation. The dye was combined with a proton receptor that specifically accumulates in tumors, and the fluores-cence of 27a is increased in acidic tumor microenvironments. The proton receptor exhibits photoacoustic imaging, and thus the probe can be used for pH imaging in hypoxic tumors. In vivo near-IR fluorescence and photoacoustic imaging studies of tumor-bearing mice demonstrated that the probe exhibits localization in the tumor and pH-responsiveness (Figure 51). Albumin-dye nanocomplexes reported by Zeng, Liu, and co-workers and the heptamethine cyanine near-IR dye-containing compound reported by Gong, Cai, and co-workers both require relatively long times for specific tumor imaging (10 h to days) [366,367]. Therefore, to enhance the tumor-targeting ability, it is important to incorporate tumor-targeting molecules into the imaging agents.
Figure 50. (A) Chemical structures of 27a and 27b. (B) Photoacoustic images of tumors havingdifferent sizes after mice were intravenously injected with the 27a. Images were recorded at 680 and825 nm excitations (II) 6, (III) 10, (IV) 14, and 18 days after injection. (I) represents the control (tumorwithout 27a). (C) Ex vivo fluorescence images of tumor with different sizes collected from mice (V) 6,(VI) 10, (VII) 14, and (VIII) 18 days after intravenous injection of 27a. Adapted with permission fromChen, Q.; Liu, X.; Chen, J.; Zeng, J.; Cheng, Z.; Liu, Z. Advanced Materials, John Wiley and Sons [361].
Gong, Cai, and co-workers reported a pH-sensitive small molecule for near-IR fluores-cence and photoacoustic imaging [367]. The near-IR dye consisted of heptamethine cyaninewhich possesses high extinction coefficients and tumor accumulation. The dye was com-bined with a proton receptor that specifically accumulates in tumors, and the fluorescenceof 27a is increased in acidic tumor microenvironments. The proton receptor exhibits photoa-coustic imaging, and thus the probe can be used for pH imaging in hypoxic tumors. In vivonear-IR fluorescence and photoacoustic imaging studies of tumor-bearing mice demon-strated that the probe exhibits localization in the tumor and pH-responsiveness (Figure 51).Albumin-dye nanocomplexes reported by Zeng, Liu, and co-workers and the heptamethinecyanine near-IR dye-containing compound reported by Gong, Cai, and co-workers bothrequire relatively long times for specific tumor imaging (10 h to days) [366,367]. There-fore, to enhance the tumor-targeting ability, it is important to incorporate tumor-targetingmolecules into the imaging agents.

Biosensors 2022, 12, 478 55 of 87Biosensors 2022, 12, x FOR PEER REVIEW 55 of 86
Figure 51. (A) Chemical structures of 28a and 28b. (B) Photoacoustic images of the tumor sites of MCF-7 tumor-bearing mice at different time points after intravenous injection of 28a. (C) near-IR fluorescence images of the tumor sites (represented by black dashed circles) of MCF-7 tumor-bear-ing living nude mice at different time points after intravenous injection of 28a. Adapted with per-mission of the Royal Society of Chemistry, from Tumor-targeted small molecule for dual-modal imaging-guided phototherapy upon near-infrared excitation. Meng, X.; Li, W.; Sun, Z.; Zhang, J.; Zhou, L.; Deng, G.; Gong, P.; Cai, L. 5, 47, 2017; permission conveyed through Copyright Clearance Center, Inc. [367].
Miki, Ohe, and co-workers reported pH-activatable cyanine dyes for selective tumor imaging using near-IR fluorescence and photoacoustic modalities [368]. The dye contains a cyclic structure under basic conditions, blocking the π-conjugation of indocyanine green for the near-IR absorption, making the molecule non-emissive. Under acidic conditions found in hypoxic tumors, the ring-opening process consequently recovers both fluores-cence and photoacoustic signals (Figure 52). Tumor-targeting was achieved by incorpo-rating tumor-targeting short peptide (cRGD), and short imaging times (6 h post-injection) were observed relative to previously reported methods (Figure 52) [368].
Figure 52. (A) Real-time fluorescence images of tumor-bearing mouse after administration of dye (100 μM in 200 μL of saline) at different time points. White dashed circles indicate the tumor site. M
Figure 51. (A) Chemical structures of 28a and 28b. (B) Photoacoustic images of the tumor sites ofMCF-7 tumor-bearing mice at different time points after intravenous injection of 28a. (C) near-IRfluorescence images of the tumor sites (represented by black dashed circles) of MCF-7 tumor-bearingliving nude mice at different time points after intravenous injection of 28a. Adapted with permissionof the Royal Society of Chemistry, from Tumor-targeted small molecule for dual-modal imaging-guided phototherapy upon near-infrared excitation. Meng, X.; Li, W.; Sun, Z.; Zhang, J.; Zhou, L.;Deng, G.; Gong, P.; Cai, L. 5, 47, 2017; permission conveyed through Copyright Clearance Center,Inc. [367].
Miki, Ohe, and co-workers reported pH-activatable cyanine dyes for selective tumorimaging using near-IR fluorescence and photoacoustic modalities [368]. The dye contains acyclic structure under basic conditions, blocking the π-conjugation of indocyanine greenfor the near-IR absorption, making the molecule non-emissive. Under acidic conditionsfound in hypoxic tumors, the ring-opening process consequently recovers both fluorescenceand photoacoustic signals (Figure 52). Tumor-targeting was achieved by incorporatingtumor-targeting short peptide (cRGD), and short imaging times (6 h post-injection) wereobserved relative to previously reported methods (Figure 52) [368].
Most responsive probes are activated by a single stimulation. As a consequence, falseresults can be generated in terms of tumor-specific imaging. Therefore, it is important todevelop probes that are responsive to more than one stimulus to enhance the accuracyof studies [40]. Yang, Yuan, and co-workers reported a dual-stimulus responsive near-IR reversible adenosine 5′-triphosphate (ATP) and pH probe, 29a, for fluorescence andphotoacoustic ratiometric imaging of tumors [369]. In hypoxic tumor microenvironments,H+ and ATP content are greater than in normal tissues because of the high tumor metabolicrate. Probe 29a was constructed using silicon rhodamine as the donor, and a dye as theacceptor. Upon binding both H+ and ATP into the acceptor units, the probe is activated.The probe was used in ratiometric photoacoustic and fluorescence tumor imaging todemonstrate its suitability for in vivo applications (Figure 53) [369].

Biosensors 2022, 12, 478 56 of 87
Biosensors 2022, 12, x FOR PEER REVIEW 55 of 86
Figure 51. (A) Chemical structures of 28a and 28b. (B) Photoacoustic images of the tumor sites of MCF-7 tumor-bearing mice at different time points after intravenous injection of 28a. (C) near-IR fluorescence images of the tumor sites (represented by black dashed circles) of MCF-7 tumor-bear-ing living nude mice at different time points after intravenous injection of 28a. Adapted with per-mission of the Royal Society of Chemistry, from Tumor-targeted small molecule for dual-modal imaging-guided phototherapy upon near-infrared excitation. Meng, X.; Li, W.; Sun, Z.; Zhang, J.; Zhou, L.; Deng, G.; Gong, P.; Cai, L. 5, 47, 2017; permission conveyed through Copyright Clearance Center, Inc. [367].
Miki, Ohe, and co-workers reported pH-activatable cyanine dyes for selective tumor imaging using near-IR fluorescence and photoacoustic modalities [368]. The dye contains a cyclic structure under basic conditions, blocking the π-conjugation of indocyanine green for the near-IR absorption, making the molecule non-emissive. Under acidic conditions found in hypoxic tumors, the ring-opening process consequently recovers both fluores-cence and photoacoustic signals (Figure 52). Tumor-targeting was achieved by incorpo-rating tumor-targeting short peptide (cRGD), and short imaging times (6 h post-injection) were observed relative to previously reported methods (Figure 52) [368].
Figure 52. (A) Real-time fluorescence images of tumor-bearing mouse after administration of dye (100 μM in 200 μL of saline) at different time points. White dashed circles indicate the tumor site. M Figure 52. (A) Real-time fluorescence images of tumor-bearing mouse after administration of dye(100 µM in 200 µL of saline) at different time points. White dashed circles indicate the tumor site.M = muscle. T = tumor. (B) Photoacoustic images of A549 tumor-bearing mice were obtained beforeand 1, 3, 6, 9, and 24 h after injection of dye (100 µM in 200 µL of saline). (I) and (II) representphotoacoustic and merged images, respectively. White dashed circles indicate the tumor sites.T = tumor. Adapted with permission from Mu, H.; Miki, K.; Harada, H.; Tanaka, K.; Nogita, K.;Ohe, K. pH-activatable cyanine dyes for selective tumor imaging using near-infrared fluorescenceand photoacoustic modalities. ACS Sens., 2021, 6, 123–129. Copyright 2021 American ChemicalSociety [368].
Biosensors 2022, 12, x FOR PEER REVIEW 56 of 86
= muscle. T = tumor. (B) Photoacoustic images of A549 tumor-bearing mice were obtained before and 1, 3, 6, 9, and 24 h after injection of dye (100 μM in 200 μL of saline). (I) and (II) represent photoacoustic and merged images, respectively. White dashed circles indicate the tumor sites. T = tumor. Adapted with permission from Mu, H.; Miki, K.; Harada, H.; Tanaka, K.; Nogita, K.; Ohe, K. pH-activatable cyanine dyes for selective tumor imaging using near-infrared fluorescence and pho-toacoustic modalities. ACS Sens., 2021, 6, 123–129. Copyright 2021 American Chemical Society [368].
Most responsive probes are activated by a single stimulation. As a consequence, false results can be generated in terms of tumor-specific imaging. Therefore, it is important to develop probes that are responsive to more than one stimulus to enhance the accuracy of studies [40]. Yang, Yuan, and co-workers reported a dual-stimulus responsive near-IR re-versible adenosine 5′-triphosphate (ATP) and pH probe, 29a, for fluorescence and photo-acoustic ratiometric imaging of tumors [369]. In hypoxic tumor microenvironments, H+ and ATP content are greater than in normal tissues because of the high tumor metabolic rate. Probe 29a was constructed using silicon rhodamine as the donor, and a dye as the acceptor. Upon binding both H+ and ATP into the acceptor units, the probe is activated. The probe was used in ratiometric photoacoustic and fluorescence tumor imaging to demonstrate its suitability for in vivo applications (Figure 53) [369].
Figure 53. (A) Chemical structures of 29a and 29b. (B) Time-dependent dual-channel flu-orescence images of tumor-bearing mice after intravenous injection of 29a. Excitation wavelength = 660 nm; emission wavelengths = 700 ± 10 and 780 ± 10 nm. (C) Time-depend-ent dual-channel photoacoustic images of tumor-bearing mice after intravenous injection of 29a. Excitation wavelengths = 680 and 740 nm. Adapted with permission from Liu, X.; Gong, X.; Yuan, J.; Fan, X.; Zhang, X.; Ren, T.; Yang, S.; Yang, R.; Yuan, L.; Zhang, X.-B. Dual-stimulus responsive near-infrared reversible ratiometric fluorescent and photoa-coustic probe for in vivo tumor imaging. Anal. Chem., 2021, 93, 5420–5429. Copyright 2021 American Chemical Society [369].
Figure 53. (A) Chemical structures of 29a and 29b. (B) Time-dependent dual-channel fluorescenceimages of tumor-bearing mice after intravenous injection of 29a. Excitation wavelength = 660 nm;emission wavelengths = 700 ± 10 and 780 ± 10 nm. (C) Time-dependent dual-channel photoacousticimages of tumor-bearing mice after intravenous injection of 29a. Excitation wavelengths = 680 and740 nm. Adapted with permission from Liu, X.; Gong, X.; Yuan, J.; Fan, X.; Zhang, X.; Ren, T.; Yang,S.; Yang, R.; Yuan, L.; Zhang, X.-B. Dual-stimulus responsive near-infrared reversible ratiometricfluorescent and photoacoustic probe for in vivo tumor imaging. Anal. Chem., 2021, 93, 5420–5429.Copyright 2021 American Chemical Society [369].

Biosensors 2022, 12, 478 57 of 87
5.6. Photoacoustic Imaging and MRI
Combining MRI and photoacoustic imaging enables detection of hypoxia-relatedpathological conditions with less error than either modality individually. Photoacousticimaging is a highly sensitive method that overcomes the low sensitivity of MRI. MRIovercomes the low soft tissue contrast and limited depth penetration of photoacousticimaging.
Redox potential is tightly regulated in cells, but hypoxia can trigger an imbalance of thelevels of redox-active molecules in cells [99,100]. Mehrmohammadi, Allen, and co-workersreported oxidation-responsive Eu-containing species 30a and 30b that are detected usingMRI and photoacoustic imaging (Figure 54) [370]. Complex 30a shows positive contrastenhancement in T1-weighted MRI and bright photoacoustic images relative to complex30b. Previous experiments performed using complexes 30a and 30b demonstrated that30a is oxidized to 30b when exposed to oxygen. Therefore, 30a is stable under hypoxicconditions, and both MRI and photoacoustic signals turn off upon oxidation into 30b [370].J. Clin. Med. 2022, 11, x FOR PEER REVIEW 4 of 17
Blood glucose after EVT was recorded as acute glycaemia. HbA1c was used to estimate the average chronic glucose
level according to the validated formula: chronic glucose levels (mg/dl) = 28.7 * HbA1c (%) - 46.7.21 All participants’
blood glucose and chronic glucose levels were utilized to calculate the acute/chronic glycaemic ratio and the absolute
difference between acute and chronic glycaemia (ΔA-C). Acute glycemia and HbA1c were measured using the fasting
blood sample after EVT. Serum creatinine was measured during hospitalization. The first measurement was done before
EVT, the second measurement was at the next morning after EVT and then assayed according to the change of the
disease. The minimum creatinine level during hospitalization was regarded as baseline creatinine. AKI was defined as
Figure 54. (A) Oxidation of 30a to 30b in the presence of oxygen. (B) Photoacoustic images of(I) 30a (100 mM in phosphate-buffered saline, pH 7.4); (II) 30a (60 mM in phosphate-bufferedsaline, pH 7.4); (III) 30a (30 mM in phosphate-buffered saline, pH 7.4); (IV) optical glass tube(wall thickness = 0.35 mm) containing distilled water; (V) 30b (100 mM in phosphate-buffered saline,pH 7.4); (VI) 30b (60 mM in phosphate-buffered saline, pH 7.4); (VII) 30b (30 mM in phosphate-buffered saline, pH 7.4); and (VIII) phosphate-buffered saline (pH 7.4). The color map representsthe normalized intensity for photoacoustic images. (C) T1-weighted MRI of (IX) phosphate-bufferedsaline (pH 7.4); (X) 30a (30 mM in phosphate-buffered saline, pH 7.4); and (XI) 30b (30 mM inphosphate-buffered saline, pH 7.4). The tube diameters for MRI and photoacoustic imaging were 3and 5 mm, respectively. Adapted with permission [370].

Biosensors 2022, 12, 478 58 of 87
Song and co-workers reported an activatable nanoprobe based on Prussian bluethat combines MRI and photoacoustic imaging for deep-tissue ONOO− imaging [371].ONOO− oxidizes FeII into FeIII. Oxidation results in the typical blue color of Prussianblue nanoparticles changing to light-yellow. As a consequence, the photoacoustic signalarising from the absorption at 710 nm due to electron transfer between FeII and FeIII
is weakened. Moreover, ONOO− ions degrade Prussian blue nanoparticles into smallfragments that shorten rotational correlation times and reduce the brightness of T1- andT2-weighted MRI. Therefore, both MRI and photoacoustic signal reduction were used as anindicator for sensing ONOO− ions in female mice that had elevated levels of ONOO− ions(Figure 55) [371].
Biosensors 2022, 12, x FOR PEER REVIEW 58 of 86
Song and co-workers reported an activatable nanoprobe based on Prussian blue that combines MRI and photoacoustic imaging for deep-tissue ONOO– imaging [371]. ONOO– oxidizes FeII into FeIII. Oxidation results in the typical blue color of Prussian blue nanopar-ticles changing to light-yellow. As a consequence, the photoacoustic signal arising from the absorption at 710 nm due to electron transfer between FeII and FeIII is weakened. More-over, ONOO– ions degrade Prussian blue nanoparticles into small fragments that shorten rotational correlation times and reduce the brightness of T1- and T2-weighted MRI. There-fore, both MRI and photoacoustic signal reduction were used as an indicator for sensing ONOO– ions in female mice that had elevated levels of ONOO– ions (Figure 55) [371].
Figure 55. (A) Photoacoustic images of mice (I) before and (II) after intraperitoneally injected with Prussian blue and then treated with (left) saline and (right) paracetamol. (B) T2-weighted MRI im-ages of mice (III) before and (IV) after intraperitoneally injected with Prussian blue and then treated with (left) saline and (right) paracetamol. Adapted with permission from Chen, F.; Teng, L.; Lu, C.; Zhang, C.; Rong, Q.; Zhao, Y.; Yang, Y.; Wang, Y.; Song, G.; Zhang, X. Activatable magnetic/photo-acoustic nanoplatform for redox-unlocked deep-tissue molecular imaging in vivo via Prussian blue nanoprobe. Anal. Chem., 2020, 92, 13452–13461. Copyright 2020 American Chemical Society [371].
Among overexpressed thiols in hypoxic cells, H2S signals oxygen deficiency in tis-sues.99,100 An, Tian, Yang, and co-workers constructed core–shell Fe3O4@Cu2O-lipid-mPEG (polyethylene glycol) nanoparticles that detect endogenous H2S in colon tumors [367]. H2S in the cellular environment can partially vulcanize Cu2O in the shell to form porous cop-per sulfide and, consequently, enhance near-IR absorption resulting in photoacoustic sig-nals. Moreover, due to the formation of the holes, inner-sphere water exchange at the Fe3O4 core is accelerated, generating contrast enhancement in T1-weighted MR images. In vivo studies performed using tumor-bearing mice with elevated levels of H2S exhibited bright photoacoustic and T1-weighted MRI in tumor sites compared to healthy tissues in the same mouse (Figure 56) [372].
Prasad and co-workers reported ultra-small NaYF4:NdIII/NaGdF4 nanocrystals coated with manganese dioxide (MnO2) for modulation and imaging of hypoxia in head and neck squamous cell carcinomas (Figure 57) [373]. MnO2 is oxidized to MnII in acidic environments by hydrogen peroxide to produce O2 and H2O. Degradation of MnO2 not only releases paramagnetic MnII but also exposes GdIII incorporated in the ultrasmall na-noparticles that enhance contrast in T1-weighted MRI. Because dissociation of MnO2 pro-duces O2, photoacoustic imaging was used to differentiate the optical absorption proper-ties between oxygenated hemoglobin and deoxygenated hemoglobin to estimate oxygen saturation in tumor hypoxic environments [373].
Figure 55. (A) Photoacoustic images of mice (I) before and (II) after intraperitoneally injected withPrussian blue and then treated with (left) saline and (right) paracetamol. (B) T2-weighted MRI imagesof mice (III) before and (IV) after intraperitoneally injected with Prussian blue and then treated with(left) saline and (right) paracetamol. Adapted with permission from Chen, F.; Teng, L.; Lu, C.; Zhang,C.; Rong, Q.; Zhao, Y.; Yang, Y.; Wang, Y.; Song, G.; Zhang, X. Activatable magnetic/photoacousticnanoplatform for redox-unlocked deep-tissue molecular imaging in vivo via Prussian blue nanoprobe.Anal. Chem., 2020, 92, 13452–13461. Copyright 2020 American Chemical Society [371].
Among overexpressed thiols in hypoxic cells, H2S signals oxygen deficiency in tis-sues. An, Tian, Yang, and co-workers constructed core–shell Fe3O4@Cu2O-lipid-mPEG(polyethylene glycol) nanoparticles that detect endogenous H2S in colon tumors [367]. H2Sin the cellular environment can partially vulcanize Cu2O in the shell to form porous coppersulfide and, consequently, enhance near-IR absorption resulting in photoacoustic signals.Moreover, due to the formation of the holes, inner-sphere water exchange at the Fe3O4core is accelerated, generating contrast enhancement in T1-weighted MR images. In vivostudies performed using tumor-bearing mice with elevated levels of H2S exhibited brightphotoacoustic and T1-weighted MRI in tumor sites compared to healthy tissues in the samemouse (Figure 56) [372].
Prasad and co-workers reported ultra-small NaYF4:NdIII/NaGdF4 nanocrystals coatedwith manganese dioxide (MnO2) for modulation and imaging of hypoxia in head and necksquamous cell carcinomas (Figure 57) [373]. MnO2 is oxidized to MnII in acidic environ-ments by hydrogen peroxide to produce O2 and H2O. Degradation of MnO2 not onlyreleases paramagnetic MnII but also exposes GdIII incorporated in the ultrasmall nanoparti-cles that enhance contrast in T1-weighted MRI. Because dissociation of MnO2 produces O2,photoacoustic imaging was used to differentiate the optical absorption properties betweenoxygenated hemoglobin and deoxygenated hemoglobin to estimate oxygen saturation intumor hypoxic environments [373].

Biosensors 2022, 12, 478 59 of 87Biosensors 2022, 12, x FOR PEER REVIEW 59 of 86
Figure 56. (A) T1-weighted MRI images of nude mice administered with probe and different amounts of NaHS (1, 3, 5, 7, and 10 mM; left side of the mouse) or phosphate-buffered saline (con-trol; right side of the mouse) acquired before and at 10 and 40 min after injection. Orange dashed circles indicate the H2S-enhanced regions. Control regions are indicated by blue dashed rectangles. (B) In vivo photoacoustic images of HCT-116 tumor-bearing mice acquired at 0 and 30 min after administration of the nanoprobe. (C) In vivo T1-weighted images of HCT-116 tumor-bearing mice acquired at 0 and 30 min after administration of the nanoprobe. S-adenosyl methionine (SAM) was used to facilitate the enhancement of photoacoustic signal. Adapted with permission from Yan, C.; Liu, D.; An, L.; Wang, Y.; Tian, Q.; Lin, J.; Yang, S. Magnetic–photoacoustic dual-mode probe for the visualization of H2S in colorectal cancer. Anal. Chem., 2020, 92, 8254–8261. Copyright 2020 American Chemical Society [372].
Figure 56. (A) T1-weighted MRI images of nude mice administered with probe and different amountsof NaHS (1, 3, 5, 7, and 10 mM; left side of the mouse) or phosphate-buffered saline (control; right sideof the mouse) acquired before and at 10 and 40 min after injection. Orange dashed circles indicatethe H2S-enhanced regions. Control regions are indicated by blue dashed rectangles. (B) In vivophotoacoustic images of HCT-116 tumor-bearing mice acquired at 0 and 30 min after administrationof the nanoprobe. (C) In vivo T1-weighted images of HCT-116 tumor-bearing mice acquired at 0 and30 min after administration of the nanoprobe. S-adenosyl methionine (SAM) was used to facilitate theenhancement of photoacoustic signal. Adapted with permission from Yan, C.; Liu, D.; An, L.; Wang,Y.; Tian, Q.; Lin, J.; Yang, S. Magnetic–photoacoustic dual-mode probe for the visualization of H2S incolorectal cancer. Anal. Chem., 2020, 92, 8254–8261. Copyright 2020 American Chemical Society [372].
Lu, Fan, and co-workers examined polymer–MnO2 nanoparticles for dual-activatablephotoacoustic and magnetic resonance bimodal imaging in tumor-bearing mice [369].MnO2 nanoparticles in their native form do not appreciably enhance the contrast of T1-weighted images. However, MnO2 nanoparticles exhibit near-IR absorption and serveas photoacoustic contrast agents for intravital imaging. Upon entry of the nanoparticlesinto hypoxic tumors, T1-weighted MRI signals are enhanced because of the degradationof MnO2 in the presence of hydrogen peroxide and mildly acidic conditions. Because thephotoacoustic signal of MnO2 nanoparticles turns off in tumor microenvironments, theparticles were conjugated with a fluorophore to show near-IR absorption with a peak at825 nm (Figure 58) [374].
Liang, Han, and Xing reported a pH-responsive FeIII-containing complex that can beused to monitor tumor photothermal therapy by magnetic resonance imaging and photoa-coustic imaging [375]. The complex exhibits both T1-weighted MRI contrast-enhancingproperties and optical absorption in the red and near-IR regions of the electromagneticspectrum. Optical absorption of the complex is pH-sensitive, with greater absorptionintensity in weakly acidic environments relative to neutral environments. With this system,MRI contrast enhancement and photoacoustic signals were used to monitor photothermaltherapy of tumors (Figure 59) [375].

Biosensors 2022, 12, 478 60 of 87
Biosensors 2022, 12, x FOR PEER REVIEW 59 of 86
Figure 56. (A) T1-weighted MRI images of nude mice administered with probe and different amounts of NaHS (1, 3, 5, 7, and 10 mM; left side of the mouse) or phosphate-buffered saline (con-trol; right side of the mouse) acquired before and at 10 and 40 min after injection. Orange dashed circles indicate the H2S-enhanced regions. Control regions are indicated by blue dashed rectangles. (B) In vivo photoacoustic images of HCT-116 tumor-bearing mice acquired at 0 and 30 min after administration of the nanoprobe. (C) In vivo T1-weighted images of HCT-116 tumor-bearing mice acquired at 0 and 30 min after administration of the nanoprobe. S-adenosyl methionine (SAM) was used to facilitate the enhancement of photoacoustic signal. Adapted with permission from Yan, C.; Liu, D.; An, L.; Wang, Y.; Tian, Q.; Lin, J.; Yang, S. Magnetic–photoacoustic dual-mode probe for the visualization of H2S in colorectal cancer. Anal. Chem., 2020, 92, 8254–8261. Copyright 2020 American Chemical Society [372].
Figure 57. Ultrasound-guided intratumoral (IT) injection of MnO2-containing nanoparticles intohead and neck squamous cell carcinoma-bearing mice. Panels of T2-weighted MRI and photoacousticimages showing before and after direct delivery of nanoparticles to hypoxic region (outlined inyellow) within the tumor (outlined in white). Adapted with permission [373].
Biosensors 2022, 12, x FOR PEER REVIEW 60 of 86
Figure 57. Ultrasound-guided intratumoral (IT) injection of MnO2-containing nanoparticles into head and neck squamous cell carcinoma-bearing mice. Panels of T2-weighted MRI and photoacous-tic images showing before and after direct delivery of nanoparticles to hypoxic region (outlined in yellow) within the tumor (outlined in white). Adapted with permission [373].
Lu, Fan, and co-workers examined polymer–MnO2 nanoparticles for dual-activatable photoacoustic and magnetic resonance bimodal imaging in tumor-bearing mice [369]. MnO2 nanoparticles in their native form do not appreciably enhance the contrast of T1-weighted images. However, MnO2 nanoparticles exhibit near-IR absorption and serve as photoacoustic contrast agents for intravital imaging. Upon entry of the nanoparticles into hypoxic tumors, T1-weighted MRI signals are enhanced because of the degradation of MnO2 in the presence of hydrogen peroxide and mildly acidic conditions. Because the photoacoustic signal of MnO2 nanoparticles turns off in tumor microenvironments, the particles were conjugated with a fluorophore to show near-IR absorption with a peak at 825 nm (Figure 58) [374].
Figure 58. (A) Representative photoacoustic images and (B) representative T1-weighted images of 4T1 neoplastic mice after tail vein injection of nanoparticles. The two photoacoustic imaging chan-nels represent hydrogen peroxide/pH-sensitive MnO2 nanoparticles that exhibit photoacoustic sig-nal at 680 nm and hydrogen peroxide/pH-inert polymeric nanoparticles that exhibit photoacoustic signal at 825 nm. Adapted with permission of the Royal Society of Chemistry, from Intelligent pol-ymer–MnO2 nanoparticles for dual-activatable photoacoustic and magnetic resonance bimodal im-aging in living mice. Hu, X.; Zhan, C.; Tang, Y.; Lu, F.; Li, Y.; Pei, F.; Lu, X.; Ji, Y.; Li, J.; Wang, W.; Fan, Q.; Huang, W. 55, 43, 2019; permission conveyed through Copyright Clearance Center, Inc. [374].
Liang, Han, and Xing reported a pH-responsive FeIII-containing complex that can be used to monitor tumor photothermal therapy by magnetic resonance imaging and photo-acoustic imaging [375]. The complex exhibits both T1-weighted MRI contrast-enhancing properties and optical absorption in the red and near-IR regions of the electromagnetic spectrum. Optical absorption of the complex is pH-sensitive, with greater absorption in-tensity in weakly acidic environments relative to neutral environments. With this system, MRI contrast enhancement and photoacoustic signals were used to monitor photothermal therapy of tumors (Figure 59) [375].
Figure 58. (A) Representative photoacoustic images and (B) representative T1-weighted images of4T1 neoplastic mice after tail vein injection of nanoparticles. The two photoacoustic imaging channelsrepresent hydrogen peroxide/pH-sensitive MnO2 nanoparticles that exhibit photoacoustic signal at680 nm and hydrogen peroxide/pH-inert polymeric nanoparticles that exhibit photoacoustic signal at825 nm. Adapted with permission of the Royal Society of Chemistry, from Intelligent polymer–MnO2
nanoparticles for dual-activatable photoacoustic and magnetic resonance bimodal imaging in livingmice. Hu, X.; Zhan, C.; Tang, Y.; Lu, F.; Li, Y.; Pei, F.; Lu, X.; Ji, Y.; Li, J.; Wang, W.; Fan, Q.; Huang, W.55, 43, 2019; permission conveyed through Copyright Clearance Center, Inc. [374].

Biosensors 2022, 12, 478 61 of 87Biosensors 2022, 12, x FOR PEER REVIEW 61 of 86
Figure 59. (A) Coronal MRI images of an EMT-6 tumor-bearing mouse before and after multi-site injection of the complex (16 mM Fe). The tumor site is indicated by yellow dashed circle in each image. Injected volumes are (I) 0, (II) 25, (III) 50, (IV) 75, and (V) 100 μL. (B) Photoacoustic imaging of a mouse with an EMT-6 tumor (upper panels) or muscle (bottom panels) injected with the FeIII-containing complex and under pulse laser irradiation at different wavelengths. Adapted with per-mission from Liang, G.; Han, J.; Xing, D. Advanced Healthcare Materials, John Wiley and Sons [375].
5.7. Complementary MRI Methods MRI offers different complementary imaging modes that enable some limitations of
any specific method to be overcome. In this section, different modes of MRI are described that are combined to image hypoxia and hypoxia-related pathological conditions.
5.7.1. T1- and T2-Weighted MRI Among molecular imaging techniques, MRI is excellent in soft tissue contrast. Addi-
tionally, the sensitivity of the method can be increased using contrast agents to enhance contrast in regions of interest. However, when using a single contrast agent to image hy-poxic tissues, there are challenges to overcome to achieve accurate results. One approach to overcome this limitation is to combine T1- and T2-weighted contrast agents creating T1/T2 dual-mode probes for MRI to produce accurate information about conditions rele-vant to hypoxia [376]. Wang, Han, Chen, and co-workers reported a hypoxia-targeted T1- and T2-based dual-mode contrast agent for MRI [377]. The contrast agent was synthesized using polyethylene glycol and MnII-modified iron oxide nanoparticles that are assembled with oligonucleotide HIF-1α aptamers. An HIF-1α-based aptamer ensures the accumula-tion of the nanoparticles in the hypoxic region. In vitro and in vivo studies were per-formed using human pancreatic carcinoma cell lines and a xenograft of Panc-1 showed enhanced accumulation of the nanoparticles in hypoxic regions (Figure 60) [377].
Figure 59. (A) Coronal MRI images of an EMT-6 tumor-bearing mouse before and after multi-siteinjection of the complex (16 mM Fe). The tumor site is indicated by yellow dashed circle in each image.Injected volumes are (I) 0, (II) 25, (III) 50, (IV) 75, and (V) 100 µL. (B) Photoacoustic imaging of a mousewith an EMT-6 tumor (upper panels) or muscle (bottom panels) injected with the FeIII-containingcomplex and under pulse laser irradiation at different wavelengths. Adapted with permission fromLiang, G.; Han, J.; Xing, D. Advanced Healthcare Materials, John Wiley and Sons [375].
5.7. Complementary MRI Methods
MRI offers different complementary imaging modes that enable some limitations ofany specific method to be overcome. In this section, different modes of MRI are describedthat are combined to image hypoxia and hypoxia-related pathological conditions.
5.7.1. T1- and T2-Weighted MRI
Among molecular imaging techniques, MRI is excellent in soft tissue contrast. Addi-tionally, the sensitivity of the method can be increased using contrast agents to enhancecontrast in regions of interest. However, when using a single contrast agent to image hy-poxic tissues, there are challenges to overcome to achieve accurate results. One approach toovercome this limitation is to combine T1- and T2-weighted contrast agents creating T1/T2dual-mode probes for MRI to produce accurate information about conditions relevant tohypoxia [376]. Wang, Han, Chen, and co-workers reported a hypoxia-targeted T1- andT2-based dual-mode contrast agent for MRI [377]. The contrast agent was synthesized usingpolyethylene glycol and MnII-modified iron oxide nanoparticles that are assembled witholigonucleotide HIF-1α aptamers. An HIF-1α-based aptamer ensures the accumulationof the nanoparticles in the hypoxic region. In vitro and in vivo studies were performedusing human pancreatic carcinoma cell lines and a xenograft of Panc-1 showed enhancedaccumulation of the nanoparticles in hypoxic regions (Figure 60) [377].

Biosensors 2022, 12, 478 62 of 87Biosensors 2022, 12, x FOR PEER REVIEW 62 of 86
Figure 60. (A) T1-weighted and (B) T2-weighted MRI at 3.0 T of tumor-bearing mice before and after injection of nanoparticles. Yellow circles mark the tumor site. Adapted with permission [377].
The carbonic anhydrase IX enzyme is overexpressed in the hypoxic microenviron-ment in the tumor [69]. Xu, Ren, and co-workers reported albumin/sulfonamide-stabilized iron porphyrin metal-organic framework nanocomposites that target tumor hypoxia through accumulation in tumors overexpressing carbonic anhydrase IX [378]. Iron in the reported nanocomposite serves as a contrast agent for T1- and T2-weighted MRI (r1 = 2.7 mM–1 s–1 and r2 = 19.68 mM–1 s–1). In vivo MRI ability of the nanocomposite was evaluated using a 4T1 tumor-bearing mouse. The results showed that the tumor location exhibited enhanced images relative to the pre-injection image (Figure 61). These results demonstrate that the nanocomposite-based T1/T2 contrast enhancement generated in MRI can be used to image hypoxic regions in tumor sites [378].
Figure 61. (A) T1- and (B) T2-weighted MRI images of a 4T1 tumor-bearing mouse. MRI images were acquired before and 6, 12, and 24 h after injection of the nanocomposites (10 mg kg–1). Solutions of nanocomposites were injected into the mouse through tail vein at different times. Red circles high-light the tumor site. Adapted with permission of the Royal Society of Chemistry, from Albumin/sul-fonamide stabilized iron porphyrin metal organic framework nanocomposites: targeting tumor hy-poxia by carbonic anhydrase IX inhibition and T1–T2 dual mode MRI guided photodynamic/photo-thermal therapy. Zhu, W.; Liu, Y.; Yang, Z.; Zhang, L.; Xiao, L.; Liu, P.; Wang, J.; Yi, C.; Xu, Z.; Ren, J. 6, 2, 2018; permission conveyed through Copyright Clearance Center, Inc. [378].
Figure 60. (A) T1-weighted and (B) T2-weighted MRI at 3.0 T of tumor-bearing mice before and afterinjection of nanoparticles. Yellow circles mark the tumor site. Adapted with permission [377].
The carbonic anhydrase IX enzyme is overexpressed in the hypoxic microenvironmentin the tumor [69]. Xu, Ren, and co-workers reported albumin/sulfonamide-stabilized ironporphyrin metal-organic framework nanocomposites that target tumor hypoxia throughaccumulation in tumors overexpressing carbonic anhydrase IX [378]. Iron in the reportednanocomposite serves as a contrast agent for T1- and T2-weighted MRI (r1 = 2.7 mM−1 s−1
and r2 = 19.68 mM−1 s−1). In vivo MRI ability of the nanocomposite was evaluated using a4T1 tumor-bearing mouse. The results showed that the tumor location exhibited enhancedimages relative to the pre-injection image (Figure 61). These results demonstrate that thenanocomposite-based T1/T2 contrast enhancement generated in MRI can be used to imagehypoxic regions in tumor sites [378].
Biosensors 2022, 12, x FOR PEER REVIEW 62 of 86
Figure 60. (A) T1-weighted and (B) T2-weighted MRI at 3.0 T of tumor-bearing mice before and after injection of nanoparticles. Yellow circles mark the tumor site. Adapted with permission [377].
The carbonic anhydrase IX enzyme is overexpressed in the hypoxic microenviron-ment in the tumor [69]. Xu, Ren, and co-workers reported albumin/sulfonamide-stabilized iron porphyrin metal-organic framework nanocomposites that target tumor hypoxia through accumulation in tumors overexpressing carbonic anhydrase IX [378]. Iron in the reported nanocomposite serves as a contrast agent for T1- and T2-weighted MRI (r1 = 2.7 mM–1 s–1 and r2 = 19.68 mM–1 s–1). In vivo MRI ability of the nanocomposite was evaluated using a 4T1 tumor-bearing mouse. The results showed that the tumor location exhibited enhanced images relative to the pre-injection image (Figure 61). These results demonstrate that the nanocomposite-based T1/T2 contrast enhancement generated in MRI can be used to image hypoxic regions in tumor sites [378].
Figure 61. (A) T1- and (B) T2-weighted MRI images of a 4T1 tumor-bearing mouse. MRI images were acquired before and 6, 12, and 24 h after injection of the nanocomposites (10 mg kg–1). Solutions of nanocomposites were injected into the mouse through tail vein at different times. Red circles high-light the tumor site. Adapted with permission of the Royal Society of Chemistry, from Albumin/sul-fonamide stabilized iron porphyrin metal organic framework nanocomposites: targeting tumor hy-poxia by carbonic anhydrase IX inhibition and T1–T2 dual mode MRI guided photodynamic/photo-thermal therapy. Zhu, W.; Liu, Y.; Yang, Z.; Zhang, L.; Xiao, L.; Liu, P.; Wang, J.; Yi, C.; Xu, Z.; Ren, J. 6, 2, 2018; permission conveyed through Copyright Clearance Center, Inc. [378].
Figure 61. (A) T1- and (B) T2-weighted MRI images of a 4T1 tumor-bearing mouse. MRI images wereacquired before and 6, 12, and 24 h after injection of the nanocomposites (10 mg kg−1). Solutionsof nanocomposites were injected into the mouse through tail vein at different times. Red circleshighlight the tumor site. Adapted with permission of the Royal Society of Chemistry, from Albu-min/sulfonamide stabilized iron porphyrin metal organic framework nanocomposites: targetingtumor hypoxia by carbonic anhydrase IX inhibition and T1–T2 dual mode MRI guided photody-namic/photothermal therapy. Zhu, W.; Liu, Y.; Yang, Z.; Zhang, L.; Xiao, L.; Liu, P.; Wang, J.; Yi, C.;Xu, Z.; Ren, J. 6, 2, 2018; permission conveyed through Copyright Clearance Center, Inc. [378].

Biosensors 2022, 12, 478 63 of 87
Glutathione plays a central role in cell growth and function, and hypoxic tumor cellshave greater glutathione concentrations than corresponding normal cells [100]. Haam, Huh,and co-workers reported redox-responsive heteronanocrystals, consisting of a superparam-agnetic Fe3O4 core, a paramagnetic Mn3O4 shell, and a surface modified with polysorbate80 [379]. The Mn3O4 shell is a redox-active switch that is activated by glutathione inintracellular reducing environments. Mn3O4 also protects the Fe3O4 core from aqueous en-vironments to attenuate T2 relaxation. Upon reduction in Mn3O4, magnetically decoupledMnII ions (for T1 relaxation enhancement) are released, enabling Fe3O4 to interact withthe water protons (T2 relaxation enhancement). The ability to use the reported materialwas demonstrated via effective passive tumor targeting for T1- and T2-weighted MRI intumor-bearing mice (Figure 62) [379].
Biosensors 2022, 12, x FOR PEER REVIEW 63 of 86
Glutathione plays a central role in cell growth and function, and hypoxic tumor cells have greater glutathione concentrations than corresponding normal cells [100]. Haam, Huh, and co-workers reported redox-responsive heteronanocrystals, consisting of a su-perparamagnetic Fe3O4 core, a paramagnetic Mn3O4 shell, and a surface modified with polysorbate 80 [379]. The Mn3O4 shell is a redox-active switch that is activated by gluta-thione in intracellular reducing environments. Mn3O4 also protects the Fe3O4 core from aqueous environments to attenuate T2 relaxation. Upon reduction in Mn3O4, magnetically decoupled MnII ions (for T1 relaxation enhancement) are released, enabling Fe3O4 to inter-act with the water protons (T2 relaxation enhancement). The ability to use the reported material was demonstrated via effective passive tumor targeting for T1- and T2-weighted MRI in tumor-bearing mice (Figure 62) [379].
Figure 62. (A) T1- and (B) T2-weighted MRI of tumor-bearing mice obtained before (Pre) and after (1 min, 1 h, and 2 h) intravenous injection of nanocrystals. Red dotted circles represent the tumor sites. Adapted from Biomaterials, 101, Kim, M.-H.; Son, H.-Y.; Kim, G.-Y.; Park, K.; Huh, Y.-M.; Haam, S. Redoxable heteronanocrystals functioning magnetic relaxation switch for activatable T1 and T2 dual-mode magnetic resonance imaging. 121–130, Copyright 2016, with permission from Elsevier [379].
Zou, Wu, and co-workers reported MnSiO3- and Fe3O4-containing nanoplatforms that are responsive to weakly acidic and large-concentration-glutathione conditions found in tumor microenvironments [380]. Fe3O4 nanoparticles effectively cover the pores of MnSiO3, and upon entering the weakly acidic and concentrated glutathione levels in the tumor microenvironment, the structure of the nanoplatform decomposes releasing MnII. Both Fe3O4 and MnII contribute to T2 and T1 relaxation enhancement. In vivo studies demonstrated that the nanoplatform targets the weakly acidic and large glutathione levels that are characteristic of hypoxic tumor microenvironments (Figure 63) [380].
Figure 63. T1- and T2-weighted MRI of tumor-bearing mice acquired pre- and post-injection of MnII and Fe3O4 samples. The tumor is marked by white arrows. Adapted from Biomaterials,194, Sun, X.;
Figure 62. (A) T1- and (B) T2-weighted MRI of tumor-bearing mice obtained before (Pre) and after(1 min, 1 h, and 2 h) intravenous injection of nanocrystals. Red dotted circles represent the tumorsites. Adapted from Biomaterials, 101, Kim, M.-H.; Son, H.-Y.; Kim, G.-Y.; Park, K.; Huh, Y.-M.;Haam, S. Redoxable heteronanocrystals functioning magnetic relaxation switch for activatable T1
and T2 dual-mode magnetic resonance imaging. 121–130, Copyright 2016, with permission fromElsevier [379].
Zou, Wu, and co-workers reported MnSiO3- and Fe3O4-containing nanoplatformsthat are responsive to weakly acidic and large-concentration-glutathione conditions foundin tumor microenvironments [380]. Fe3O4 nanoparticles effectively cover the pores ofMnSiO3, and upon entering the weakly acidic and concentrated glutathione levels in thetumor microenvironment, the structure of the nanoplatform decomposes releasing MnII.Both Fe3O4 and MnII contribute to T2 and T1 relaxation enhancement. In vivo studiesdemonstrated that the nanoplatform targets the weakly acidic and large glutathione levelsthat are characteristic of hypoxic tumor microenvironments (Figure 63) [380].
Yuan and co-workers reported a pH-responsive MnO2 functionalized cobalt phosphidenanocomposite to image hypoxic tumors [381]. MnO2 in the nanocomposite degradesupon entering the weakly acidic tumor microenvironment and releases MnII ions andactivates T1-weighted contrast enhancement in MRI. A cobalt phosphide core enabled T2-weighted MRI contrast enhancement. Results show that the signal intensity of T1-weightedimages of the tumor increased after injection, while the T2-weighted images became darker(Figure 64). The observed signal enhancements were attributed to the cellular uptakeand tumor accumulation of the nanocomposite, owing to the enhanced permeability andretention effect and tumor microenvironment responsiveness after administration [381].

Biosensors 2022, 12, 478 64 of 87
Biosensors 2022, 12, x FOR PEER REVIEW 63 of 86
Glutathione plays a central role in cell growth and function, and hypoxic tumor cells have greater glutathione concentrations than corresponding normal cells [100]. Haam, Huh, and co-workers reported redox-responsive heteronanocrystals, consisting of a su-perparamagnetic Fe3O4 core, a paramagnetic Mn3O4 shell, and a surface modified with polysorbate 80 [379]. The Mn3O4 shell is a redox-active switch that is activated by gluta-thione in intracellular reducing environments. Mn3O4 also protects the Fe3O4 core from aqueous environments to attenuate T2 relaxation. Upon reduction in Mn3O4, magnetically decoupled MnII ions (for T1 relaxation enhancement) are released, enabling Fe3O4 to inter-act with the water protons (T2 relaxation enhancement). The ability to use the reported material was demonstrated via effective passive tumor targeting for T1- and T2-weighted MRI in tumor-bearing mice (Figure 62) [379].
Figure 62. (A) T1- and (B) T2-weighted MRI of tumor-bearing mice obtained before (Pre) and after (1 min, 1 h, and 2 h) intravenous injection of nanocrystals. Red dotted circles represent the tumor sites. Adapted from Biomaterials, 101, Kim, M.-H.; Son, H.-Y.; Kim, G.-Y.; Park, K.; Huh, Y.-M.; Haam, S. Redoxable heteronanocrystals functioning magnetic relaxation switch for activatable T1 and T2 dual-mode magnetic resonance imaging. 121–130, Copyright 2016, with permission from Elsevier [379].
Zou, Wu, and co-workers reported MnSiO3- and Fe3O4-containing nanoplatforms that are responsive to weakly acidic and large-concentration-glutathione conditions found in tumor microenvironments [380]. Fe3O4 nanoparticles effectively cover the pores of MnSiO3, and upon entering the weakly acidic and concentrated glutathione levels in the tumor microenvironment, the structure of the nanoplatform decomposes releasing MnII. Both Fe3O4 and MnII contribute to T2 and T1 relaxation enhancement. In vivo studies demonstrated that the nanoplatform targets the weakly acidic and large glutathione levels that are characteristic of hypoxic tumor microenvironments (Figure 63) [380].
Figure 63. T1- and T2-weighted MRI of tumor-bearing mice acquired pre- and post-injection of MnII and Fe3O4 samples. The tumor is marked by white arrows. Adapted from Biomaterials,194, Sun, X.; Figure 63. T1- and T2-weighted MRI of tumor-bearing mice acquired pre- and post-injection of MnII
and Fe3O4 samples. The tumor is marked by white arrows. Adapted from Biomaterials, 194, Sun, X.;Zhang, G.; Du, R.; Xu, R.; Zhu, D.; Qian, J.; Bai, G.; Yang, C.; Zhang, Z.; Zhang, X.; Zou, D.; Wu, Z. Abiodegradable MnSiO3@ Fe3O4 nanoplatform for dual-mode magnetic resonance imaging guidedcombinatorial cancer therapy, 151–160, Copyright 2019, with permission from Elsevier [380].
Biosensors 2022, 12, x FOR PEER REVIEW 64 of 86
Zhang, G.; Du, R.; Xu, R.; Zhu, D.; Qian, J.; Bai, G.; Yang, C.; Zhang, Z.; Zhang, X.; Zou, D.; Wu, Z. A biodegradable MnSiO3@ Fe3O4 nanoplatform for dual-mode magnetic resonance imaging guided combinatorial cancer therapy, 151–160, Copyright 2019, with permission from Elsevier [380].
Yuan and co-workers reported a pH-responsive MnO2 functionalized cobalt phos-phide nanocomposite to image hypoxic tumors [381]. MnO2 in the nanocomposite de-grades upon entering the weakly acidic tumor microenvironment and releases MnII ions and activates T1-weighted contrast enhancement in MRI. A cobalt phosphide core enabled T2-weighted MRI contrast enhancement. Results show that the signal intensity of T1-weighted images of the tumor increased after injection, while the T2-weighted images be-came darker (Figure 64). The observed signal enhancements were attributed to the cellular uptake and tumor accumulation of the nanocomposite, owing to the enhanced permea-bility and retention effect and tumor microenvironment responsiveness after administra-tion [381].
Figure 64. [(A,B)] T1-weighted and [(C,D)] T2-weighted MRI images of a tumor-bearing mouse be-fore and after intravenous injection of nanocomposites at different times. Adapted with permission from Jin, L.; Liu, J.; Tang, Y.; Cao, L.; Zhang, T.; Yuan, Q.; Wang, Y.; Zhang, H. MnO2-Functionalized Co–P nanocomposite: a new theranostic agent for pH-triggered T1/T2 dual-modality magnetic reso-nance imaging-guided chemo-photothermal synergistic therapy. ACS Appl. Mater. Interfaces, 2017, 9, 41648–41658. Copyright 2017 American Chemical Society [381].
5.7.2. 1H- and 19F-MRI A challenge of contrast-enhanced MRI is the concentration dependency of contrast
enhancement that is difficult to determine in vivo; therefore, strategies are needed to over-come the concentration dependency of contrast agents [40]. This section includes descrip-tions of multimodal contrast agents that elicit orthogonal responses with two imaging modalities and thereby enhance the accuracy of hypoxia detection and overcoming the concentration dependency of contrast agents for MRI.
Some redox couples including EuII/III, CuI/II, FeII/III, CoII/III, and MnII/III exhibit redox re-sponsiveness in biologically relevant environments [382–392]. The different oxidation states of these metal ions exhibit different responses in MRI. For example, one oxidation state of a contrast agent might produce 1H-MRI signal enhancement, and upon oxidation,
Figure 64. (A,B) T1-weighted and (C,D) T2-weighted MRI images of a tumor-bearing mouse beforeand after intravenous injection of nanocomposites at different times. Adapted with permission fromJin, L.; Liu, J.; Tang, Y.; Cao, L.; Zhang, T.; Yuan, Q.; Wang, Y.; Zhang, H. MnO2-FunctionalizedCo–P nanocomposite: a new theranostic agent for pH-triggered T1/T2 dual-modality magneticresonance imaging-guided chemo-photothermal synergistic therapy. ACS Appl. Mater. Interfaces,2017, 9, 41648–41658. Copyright 2017 American Chemical Society [381].
5.7.2. 1H- and 19F-MRI
A challenge of contrast-enhanced MRI is the concentration dependency of contrastenhancement that is difficult to determine in vivo; therefore, strategies are needed toovercome the concentration dependency of contrast agents [40]. This section includes de-scriptions of multimodal contrast agents that elicit orthogonal responses with two imagingmodalities and thereby enhance the accuracy of hypoxia detection and overcoming theconcentration dependency of contrast agents for MRI.
Some redox couples including EuII/III, CuI/II, FeII/III, CoII/III, and MnII/III exhibit redoxresponsiveness in biologically relevant environments [382–392]. The different oxidation

Biosensors 2022, 12, 478 65 of 87
states of these metal ions exhibit different responses in MRI. For example, one oxidationstate of a contrast agent might produce 1H-MRI signal enhancement, and upon oxidation,the resultant ion completely turns off 1H-MRI signal enhancement and produces a 19F-MRIsignal. Pautler, Allen, and co-workers reported a fluorinated EuII-containing multimodalcontrast agent, 31a (Figure 65) that exhibits orthogonal responses towards 1H- and 19F-MRI [393]. Bright T1-weighted images were obtained after injecting 31a into the oxygen-rich intraperitoneal cavity of a mouse. After 9 min post-injection, the T1-weighted signalintensity disappeared and the 19F signal appeared (Figure 65). The concentration of oxygenin cells is a metric of hypoxia; therefore, the development of oxygen-responsive probesis important in studying hypoxia and hypoxia-related pathological conditions. In thiswork, the advantage of 1H- and 19F-MRI to orthogonally detect the contrast agent in vivohas been used to study the amount of oxygen present in the intraperitoneal cavity of themouse [393].
Biosensors 2022, 12, x FOR PEER REVIEW 65 of 86
the resultant ion completely turns off 1H-MRI signal enhancement and produces a 19F-MRI signal. Pautler, Allen, and co-workers reported a fluorinated EuII-containing multimodal contrast agent, 31a (Figure 65) that exhibits orthogonal responses towards 1H- and 19F-MRI [393]. Bright T1-weighted images were obtained after injecting 31a into the oxygen-rich intraperitoneal cavity of a mouse. After 9 min post-injection, the T1-weighted signal inten-sity disappeared and the 19F signal appeared (Figure 65). The concentration of oxygen in cells is a metric of hypoxia; therefore, the development of oxygen-responsive probes is important in studying hypoxia and hypoxia-related pathological conditions. In this work, the advantage of 1H- and 19F-MRI to orthogonally detect the contrast agent in vivo has been used to study the amount of oxygen present in the intraperitoneal cavity of the mouse [393].
Figure 65. T1-weighted MRI images of solutions of (A) aqueous 3-morpholinipropane-1-sulfonic acid buffer (20 mM, pH 7.0); (B) 31b (3.5 mM); (C) 31a (3.5 mM); (D) 31b after oxidation of 31a (3.5 mM). 19F-MRI images of (E) aqueous 3-morpholinipropane-1-sulfonic acid buffer (20 mM, pH 7.0); (F) 31b (3.5 mM); (G) 31a (3.5 mM); (H) 31b after oxidation of 31a (3.5 mM). The scale bar on the right of (H) represents signal intensity for all 19F-MRI images in the figure. Chemical structures of 31a (left) and 31b (right). Adapted with permission of the Royal Society of Chemistry, from Fluori-nated EuII-based multimodal contrast agent for temperature- and redox-responsive magnetic reso-nance imaging, Basal, L. A.; Bailey, M. D.; Romero, J.; Ali, M. M.; Kurenbekova, L.; Yustein, J. T.; Pautler, R. G.; Allen, M. J. 8, 12, 2017; permission conveyed through Copyright Clearance Center, Inc. [393].
Aime and co-workers used a combination of 1H- and 19F-MRI for measuring pH by incorporating 33a and 33b into poly-β-cyclodextrin [394]. The pH responsiveness is pro-vided by 33a with a coordination cage consisting of a tetraazamacrocycle bearing three acetate arms and one substituted sulfonamide arm. The protonation–deprotonation step of the sulfonamide moiety takes place at pH = 6.7. Upon deprotonation, the sulfonamide enters the coordination sphere of GdIII by replacing the two inner-sphere water molecules. The pH-dependent change in hydration of GdIII results in a change in the observed relax-ivity of the complex. Furthermore, by controlling the molar ratio of 33a/33b/poly-β-cy-clodextrin (1:5:20), the 19F-MRI signal was measured and quantified using an external standard (25 mM of NaPF6). A proof of concept of this approach was demonstrated in
Figure 65. T1-weighted MRI images of solutions of (A) aqueous 3-morpholinipropane-1-sulfonic acidbuffer (20 mM, pH 7.0); (B) 31b (3.5 mM); (C) 31a (3.5 mM); (D) 31b after oxidation of 31a (3.5 mM).19F-MRI images of (E) aqueous 3-morpholinipropane-1-sulfonic acid buffer (20 mM, pH 7.0); (F) 31b(3.5 mM); (G) 31a (3.5 mM); (H) 31b after oxidation of 31a (3.5 mM). The scale bar on the right of (H)represents signal intensity for all 19F-MRI images in the figure. Chemical structures of 31a (left) and31b (right). Adapted with permission of the Royal Society of Chemistry, from Fluorinated EuII-basedmultimodal contrast agent for temperature- and redox-responsive magnetic resonance imaging, Basal,L. A.; Bailey, M. D.; Romero, J.; Ali, M. M.; Kurenbekova, L.; Yustein, J. T.; Pautler, R. G.; Allen, M. J. 8,12, 2017; permission conveyed through Copyright Clearance Center, Inc. [393].
Aime and co-workers used a combination of 1H- and 19F-MRI for measuring pH by in-corporating 33a and 33b into poly-β-cyclodextrin [394]. The pH responsiveness is providedby 33a with a coordination cage consisting of a tetraazamacrocycle bearing three acetatearms and one substituted sulfonamide arm. The protonation–deprotonation step of thesulfonamide moiety takes place at pH = 6.7. Upon deprotonation, the sulfonamide entersthe coordination sphere of GdIII by replacing the two inner-sphere water molecules. ThepH-dependent change in hydration of GdIII results in a change in the observed relaxivity ofthe complex. Furthermore, by controlling the molar ratio of 33a/33b/poly-β-cyclodextrin(1:5:20), the 19F-MRI signal was measured and quantified using an external standard

Biosensors 2022, 12, 478 66 of 87
(25 mM of NaPF6). A proof of concept of this approach was demonstrated in vitro byacquiring 1H- and 19F-MRI of four samples containing the polymeric material at differentconcentrations and pH values (Figure 66) [394].
Biosensors 2022, 12, x FOR PEER REVIEW 66 of 86
vitro by acquiring 1H- and 19F-MRI of four samples containing the polymeric material at different concentrations and pH values (Figure 66) [394].
Figure 66. (A) Schematic representation of the supramolecular adduct between poly-β-cyclodextrin, GdIII-containing complex, 32a, and the 19F-reporting molecule 32b designed for pH mapping. (B) MRI images of solutions of (1) NaPF6 (25 mM); (2) poly-cyclodextrin (10 mM); 32b (2.5 mM); 32a (0.5 mM) at pH = 6.8; (3) poly-cyclodextrin (13 mM); 32b (3.25 mM); 32a (0.65 mM) at pH = 7.2; (4) poly-cyclodextrin (30 mM); 32b (7.5 mM); 32a (1.5 mM) at pH = 7.6; (5) poly-cyclodextrin (20 mM): 32b (5 mM); 32a (1 mM) at pH = 8.2. (I) T1-weighted spin-echo 1H-MR image acquired at 7.1 T (TR = 80, TE = 4.4, NEX = 32, 1 slice, 1 mm); (II) T1-weighted spin-echo 19F-MRI acquired at 7.1 T (TR = 2000, TE = 1.4, NEX = 384, 1 slice, 3 mm); (III) T1-weighted spin-echo 1H-MR image acquired at 7.1 T and nor-malized to the concentrations found from image (II); (IV) T1-weighted spin-echo 1H-MR image ac-quired at 1 T (TR = 80, TE = 7.2, NEX = 32), 1 slice, 2 mm) and normalized to the concentrations found from image (II); (V) pH-map image derived from image (IV). Adapted with permission of the Royal Society of Chemistry, from Poly-β-cyclodextrin based platform for pH mapping via a ratiometric 19F/1H MRI method. Gianolio, E.; Napolitano, R.; Fedeli, F.; Arena, F.; Aime, S. 40, 2009; permission conveyed through Copyright Clearance Center, Inc. [394].
Lin, Gao, and co-workers reported fluorinated gadolinium chelate-grafted palladium nanoconjugates for contrast-enhanced T1-weighted 1H-MRI and pH-activaTable 19F-MRI [395]. Thw 33a in the nanoconjugate acts as a contrast agent for 1H-MRI. The paramagnetic relaxation enhancement effect exerted by GdIII on 19F causes abatement of the 19F signal. Upon entering mildly acidic tumor microenvironments, cleavage of the hydrazone bond separates 19F nuclei from GdIII in 33b and subsequently increases the signal in 19F-MRI. In vivo studies demonstrated that this activatable probe can be used for contrast-enhanced T1-weighted and pH-responsive 19F dual-modal MRI for the sensitive and accurate study of the hypoxic regions in tumor-bearing mice (Figure 67) [395].
Figure 66. (A) Schematic representation of the supramolecular adduct between poly-β-cyclodextrin,GdIII-containing complex, 32a, and the 19F-reporting molecule 32b designed for pH mapping.(B) MRI images of solutions of (1) NaPF6 (25 mM); (2) poly-cyclodextrin (10 mM); 32b (2.5 mM); 32a(0.5 mM) at pH = 6.8; (3) poly-cyclodextrin (13 mM); 32b (3.25 mM); 32a (0.65 mM) at pH = 7.2; (4)poly-cyclodextrin (30 mM); 32b (7.5 mM); 32a (1.5 mM) at pH = 7.6; (5) poly-cyclodextrin (20 mM):32b (5 mM); 32a (1 mM) at pH = 8.2. (I) T1-weighted spin-echo 1H-MR image acquired at 7.1 T(TR = 80, TE = 4.4, NEX = 32, 1 slice, 1 mm); (II) T1-weighted spin-echo 19F-MRI acquired at 7.1 T(TR = 2000, TE = 1.4, NEX = 384, 1 slice, 3 mm); (III) T1-weighted spin-echo 1H-MR image acquiredat 7.1 T and normalized to the concentrations found from image (II); (IV) T1-weighted spin-echo1H-MR image acquired at 1 T (TR = 80, TE = 7.2, NEX = 32), 1 slice, 2 mm) and normalized tothe concentrations found from image (II); (V) pH-map image derived from image (IV). Adaptedwith permission of the Royal Society of Chemistry, from Poly-β-cyclodextrin based platform for pHmapping via a ratiometric 19F/1H MRI method. Gianolio, E.; Napolitano, R.; Fedeli, F.; Arena, F.;Aime, S. 40, 2009; permission conveyed through Copyright Clearance Center, Inc. [394].
Lin, Gao, and co-workers reported fluorinated gadolinium chelate-grafted palla-dium nanoconjugates for contrast-enhanced T1-weighted 1H-MRI and pH-activatable19F-MRI [395]. Thw 33a in the nanoconjugate acts as a contrast agent for 1H-MRI. Theparamagnetic relaxation enhancement effect exerted by GdIII on 19F causes abatement ofthe 19F signal. Upon entering mildly acidic tumor microenvironments, cleavage of thehydrazone bond separates 19F nuclei from GdIII in 33b and subsequently increases thesignal in 19F-MRI. In vivo studies demonstrated that this activatable probe can be used forcontrast-enhanced T1-weighted and pH-responsive 19F dual-modal MRI for the sensitiveand accurate study of the hypoxic regions in tumor-bearing mice (Figure 67) [395].

Biosensors 2022, 12, 478 67 of 87Biosensors 2022, 12, x FOR PEER REVIEW 67 of 86
Figure 67. (A) Chemical reaction behind the 19F signal recovery of 33a in response to mildly acidic tumor microenvironment. (B) T1-weighted 1H-MRI and 19F-MRI of tumor-bearing mice before and after administration of fluorinated gadolinium chelate-grafted palladium nanoconjugates at 9.4 T. Yellow and white arrows indicate the tumor and muscle, respectively. Adapted with permission from Tang, X.; Gong, X.; Ming, J.; Chen, D.; Lin, H.; Gao, J. Fluorinated Gadolinium Chelate-Grafted Nanoconjugates for Contrast-Enhanced T1-Weighted 1H and pH-ActivaTable 19F Dual-Modal MRI. Anal. Chem., 2020, 92, 16293–16300. Copyright 2020 American Chemical Society [395].
5.7.3. T1-Weighted MRI and CEST Dual-mode hypoxia-responsive probes have been designed based on contrast agents
that are responsive to complementary MRI techniques, including T1-MRI and CEST. Use of probes that exhibit on/off responses to complementary MRI techniques not only enables unambiguous detection of hypoxia but also can be used to confirm the physiological sta-tus of microenvironments. Allen and co-workers used the ability of EuII to oxidize to EuIII
Figure 67. (A) Chemical reaction behind the 19F signal recovery of 33a in response to mildly acidictumor microenvironment. (B) T1-weighted 1H-MRI and 19F-MRI of tumor-bearing mice before andafter administration of fluorinated gadolinium chelate-grafted palladium nanoconjugates at 9.4 T.Yellow and white arrows indicate the tumor and muscle, respectively. Adapted with permissionfrom Tang, X.; Gong, X.; Ming, J.; Chen, D.; Lin, H.; Gao, J. Fluorinated Gadolinium Chelate-GraftedNanoconjugates for Contrast-Enhanced T1-Weighted 1H and pH-Activatable 19F Dual-Modal MRI.Anal. Chem., 2020, 92, 16293–16300. Copyright 2020 American Chemical Society [395].
5.7.3. T1-Weighted MRI and CEST
Dual-mode hypoxia-responsive probes have been designed based on contrast agentsthat are responsive to complementary MRI techniques, including T1-MRI and CEST. Use ofprobes that exhibit on/off responses to complementary MRI techniques not only enables un-ambiguous detection of hypoxia but also can be used to confirm the physiological status of

Biosensors 2022, 12, 478 68 of 87
microenvironments. Allen and co-workers used the ability of EuII to oxidize to EuIII underaerobic physiologically relevant conditions, to design an oxidation-responsive dual-modecontrast agent [396]. EuII and EuIII ions exhibit orthogonal responses towards T1-weightedMRI and CEST. Liposome encapsulated EuII-containing complex, 34a, produces brightT1-weighted MR images but no observable signal in CEST. Upon oxidation under ambientatmosphere, the T1 relaxation time of the liposome solution containing 34a decreased by upto 86%. As a consequence, T1-weighted images of liposome solution were indistinguishablecompared to that of water. However, oxidation resulted in the recovery of the CEST signal(Figure 68) [396].
Biosensors 2022, 12, x FOR PEER REVIEW 68 of 86
under aerobic physiologically relevant conditions, to design an oxidation-responsive dual-mode contrast agent [396]. EuII and EuIII ions exhibit orthogonal responses towards T1-weighted MRI and CEST. Liposome encapsulated EuII-containing complex, 34a, pro-duces bright T1-weighted MR images but no observable signal in CEST. Upon oxidation under ambient atmosphere, the T1 relaxation time of the liposome solution containing 34a decreased by up to 86%. As a consequence, T1-weighted images of liposome solution were indistinguishable compared to that of water. However, oxidation resulted in the recovery of the CEST signal (Figure 68) [396].
Figure 68. (Left to right) MR images of water, EuII-containing liposomes, EuIII-containing liposomes (5 mm tube diameter, at 7 T and 24 0C). T1-weighted images (top row) and CEST map generated by subtracting presaturation at 1.2 ppm from presaturation at –1.2 ppm and the difference was divided by presaturation at –1.2 ppm (bottom row). %CEST represents the decrease in bulk water signal intensity as a result of presaturation of exchangeable water protons associated with liposomes. Adapted with permission of the Royal Society of Chemistry from Oxidation-responsive Eu2+/3+-lip-osomal contrast agent for dual-mode magnetic resonance imaging, Ekanger, L. A.; Ali, M. M.; Allen, M. J. 50, 94, 2014; permission conveyed through Copyright Clearance Center, Inc. [396].
An in vivo study with a EuIII-containing tetraamide complex was reported by Ratnakar, Kovacs, and co-workers [397]. After injecting the complex into mice, the com-plex generated strong T1 enhancement. The brightness of the T1-weighted image gradually diminished over several minutes followed by the appearance of a strong CEST effect at the injection site. This effect was caused by the oxidation of EuII into EuIII. Additionally, a fluorinated EuII-containing complex, 31a, reported by Pautler, Allen, and co-workers ex-hibits redox sensitivity towards an oxidative environment [393]. Under reduced oxygen levels, 31a showed strong T1 enhancement leading to a bright T1-weighted image. Upon oxidization into 31b under aerobic conditions, a dark T1-weighted image and bright CEST image were obtained (Figure 69). These pre-clinical studies demonstrate that EuII- and
Figure 68. (Left to right) MR images of water, EuII-containing liposomes, EuIII-containing liposomes(5 mm tube diameter, at 7 T and 24 ◦C). T1-weighted images (top row) and CEST map generatedby subtracting presaturation at 1.2 ppm from presaturation at −1.2 ppm and the difference wasdivided by presaturation at −1.2 ppm (bottom row). %CEST represents the decrease in bulk watersignal intensity as a result of presaturation of exchangeable water protons associated with liposomes.Adapted with permission of the Royal Society of Chemistry from Oxidation-responsive Eu2+/3+-liposomal contrast agent for dual-mode magnetic resonance imaging, Ekanger, L. A.; Ali, M. M.;Allen, M. J. 50, 94, 2014; permission conveyed through Copyright Clearance Center, Inc. [396].
An in vivo study with a EuIII-containing tetraamide complex was reported by Rat-nakar, Kovacs, and co-workers [397]. After injecting the complex into mice, the complexgenerated strong T1 enhancement. The brightness of the T1-weighted image graduallydiminished over several minutes followed by the appearance of a strong CEST effect atthe injection site. This effect was caused by the oxidation of EuII into EuIII. Additionally,a fluorinated EuII-containing complex, 31a, reported by Pautler, Allen, and co-workersexhibits redox sensitivity towards an oxidative environment [393]. Under reduced oxygenlevels, 31a showed strong T1 enhancement leading to a bright T1-weighted image. Upon

Biosensors 2022, 12, 478 69 of 87
oxidization into 31b under aerobic conditions, a dark T1-weighted image and bright CESTimage were obtained (Figure 69). These pre-clinical studies demonstrate that EuII- andEuIII-containing complexes that exhibit T1-weighted and CEST imaging capabilities arepotential contrast agents that can be used to detect oxygen levels and redox species inhypoxic tumors [393].
Biosensors 2022, 12, x FOR PEER REVIEW 69 of 86
EuIII-containing complexes that exhibit T1-weighted and CEST imaging capabilities are potential contrast agents that can be used to detect oxygen levels and redox species in hypoxic tumors [393].
Figure 69. MRI of solutions of samples in aqueous 3-morpholinopropane-1-sulfonic acid buffer (20 mM, pH 7.0) in glass (3 mm) or plastic tubes (5 mm). Scale bars correspond to the three images in the column above each bar. (Top row) T1-weighted MRI images of solutions of (A) aqueous 3-mor-pholinopropane-1-sulfonic acid buffer (20 mM, pH 7.0); (B) 31b (3.5 mM); (C) 31a (3.5 mM); and (D) 31b after oxidation of 31a (3.5 mM). (Bottom row) CEST MRI images of (E) aqueous 3-morpho-linopropane-1-sulfonic acid buffer (20 mM, pH 7.0); (F) 31b (3.5 mM); (G) 31a (3.5 mM); and (H) 31b after oxidation of 31a (3.5 mM). The scale bar on the right of (h) represents signal intensity for all CEST MRI images in Figure 69. Adapted with permission of the Royal Society of Chemistry, from Fluorinated EuII-based multimodal contrast agent for temperature- and redox-responsive magnetic resonance imaging, Basal, L. A.; Bailey, M. D.; Romero, J.; Ali, M. M.; Kurenbekova, L.; Yustein, J. T.; Pautler, R. G.; Allen, M. J. 8, 12, 2017; permission conveyed through Copyright Clearance Center, Inc. [398].
Allen and co-workers reported a EuII- and EuIII-containing tetraglycenate complexes as T1-weighted MRI and CEST agents [398]. The reduced version of the complex exhibits a strong T1 shortening effect and consequently produces a bright T1-weighted image, and it quenches the CEST signal. Upon oxidation into EuIII under aerobic conditions, the EuIII-containing complex does not appreciably shorten the T1 relaxation time of nearby water protons but recovers the CEST signal and thus produces a bright CEST image (Figure 70) [398].
Figure 69. MRI of solutions of samples in aqueous 3-morpholinopropane-1-sulfonic acid buffer(20 mM, pH 7.0) in glass (3 mm) or plastic tubes (5 mm). Scale bars correspond to the three imagesin the column above each bar. (Top row) T1-weighted MRI images of solutions of (A) aqueous3-morpholinopropane-1-sulfonic acid buffer (20 mM, pH 7.0); (B) 31b (3.5 mM); (C) 31a (3.5 mM);and (D) 31b after oxidation of 31a (3.5 mM). (Bottom row) CEST MRI images of (E) aqueous 3-morpholinopropane-1-sulfonic acid buffer (20 mM, pH 7.0); (F) 31b (3.5 mM); (G) 31a (3.5 mM); and(H) 31b after oxidation of 31a (3.5 mM). The scale bar on the right of (h) represents signal intensity forall CEST MRI images in Figure 69. Adapted with permission of the Royal Society of Chemistry, fromFluorinated EuII-based multimodal contrast agent for temperature- and redox-responsive magneticresonance imaging, Basal, L. A.; Bailey, M. D.; Romero, J.; Ali, M. M.; Kurenbekova, L.; Yustein, J.T.; Pautler, R. G.; Allen, M. J. 8, 12, 2017; permission conveyed through Copyright Clearance Center,Inc. [398].
Allen and co-workers reported a EuII- and EuIII-containing tetraglycenate complexesas T1-weighted MRI and CEST agents [398]. The reduced version of the complex exhibits astrong T1 shortening effect and consequently produces a bright T1-weighted image, andit quenches the CEST signal. Upon oxidation into EuIII under aerobic conditions, theEuIII-containing complex does not appreciably shorten the T1 relaxation time of nearbywater protons but recovers the CEST signal and thus produces a bright CEST image(Figure 70) [398].

Biosensors 2022, 12, 478 70 of 87Biosensors 2022, 12, x FOR PEER REVIEW 70 of 86
Figure 70. Images of (A) T1-weighted MRI and (B) CEST difference (55 ppm image subtracted from the –55 ppm image) of 5 mm diameter tubes containing (1) 30b, (2) 30a, (3) 30b after oxidation of 30a, and (4) water. Adapted with permission from Ekanger, L. A.; Mills, D. R.; Ali, M. M.; Polin, L. A.; Shen, Y.; Haacke, E. M.; Allen, M. J. Spectroscopic characterization of the 3+ and 2+ oxidation states of europium in a macrocyclic tetraglycinate complex. Inorg. Chem., 2016, 55, 9981–9988. Cop-yright 2016 American Chemical Society [398].
6. Conclusions Dual-mode imaging is a promising method to provide comprehensive information
for hypoxia research. The construction of dual-mode probes with sensitive responses to microenvironments not only combines complementary advantages of two imaging mo-dalities, but also minimizes the limitations of single-mode probes that otherwise are am-plified in complex physiological environments. For example, dual-mode imaging is used to overcome the limitation of concentration-dependent probe response [40]. It also can provide more information about tumor microenvironments than single imaging modali-ties [280,282,298]. When a complementary modality is selected, dual-mode imaging over-comes the limitations of single-mode techniques, including limited spatial resolution, low depth penetration, and low sensitivity [123,125].
In this review, advances in the sensitive detection of cancer using dual-mode imaging systems and a diverse group of responsive probes for hypoxia, oxidative stress, pH, and dysregulation of redox homeostasis are described. However, despite recent progress, most attempts are still in the preclinical stage and are not used in clinical imaging due to several challenges. Therefore, innovative strategies are needed to fill the gap between benchtop research and clinical imaging. Some aspects that are likely to be useful in future research to bridge laboratory research and tumor hypoxia imaging in cancer patients in-clude the following: (1) Dual-mode radiometric probes to overcome limitations of individual imaging mo-
dalities, for example, concentration dependency of contrast agents in MRI. Dual-mode imaging enables the integration of complementary advantages while minimiz-ing the limitations of each method; however, these advantages and limitations are
Figure 70. Images of (A) T1-weighted MRI and (B) CEST difference (55 ppm image subtracted fromthe –55 ppm image) of 5 mm diameter tubes containing (1) 30b, (2) 30a, (3) 30b after oxidation of 30a,and (4) water. Adapted with permission from Ekanger, L. A.; Mills, D. R.; Ali, M. M.; Polin, L. A.;Shen, Y.; Haacke, E. M.; Allen, M. J. Spectroscopic characterization of the 3+ and 2+ oxidation statesof europium in a macrocyclic tetraglycinate complex. Inorg. Chem., 2016, 55, 9981–9988. Copyright2016 American Chemical Society [398].
6. Conclusions
Dual-mode imaging is a promising method to provide comprehensive informationfor hypoxia research. The construction of dual-mode probes with sensitive responsesto microenvironments not only combines complementary advantages of two imagingmodalities, but also minimizes the limitations of single-mode probes that otherwise areamplified in complex physiological environments. For example, dual-mode imagingis used to overcome the limitation of concentration-dependent probe response [40]. Italso can provide more information about tumor microenvironments than single imagingmodalities [280,282,298]. When a complementary modality is selected, dual-mode imagingovercomes the limitations of single-mode techniques, including limited spatial resolution,low depth penetration, and low sensitivity [123,125].
In this review, advances in the sensitive detection of cancer using dual-mode imagingsystems and a diverse group of responsive probes for hypoxia, oxidative stress, pH, anddysregulation of redox homeostasis are described. However, despite recent progress,most attempts are still in the preclinical stage and are not used in clinical imaging dueto several challenges. Therefore, innovative strategies are needed to fill the gap betweenbenchtop research and clinical imaging. Some aspects that are likely to be useful in futureresearch to bridge laboratory research and tumor hypoxia imaging in cancer patientsinclude the following:
(1) Dual-mode radiometric probes to overcome limitations of individual imaging modali-ties, for example, concentration dependency of contrast agents in MRI. Dual-modeimaging enables the integration of complementary advantages while minimizing thelimitations of each method; however, these advantages and limitations are unique toinstrumentation or the physics of methodology (for example, energy, resolution, sensi-

Biosensors 2022, 12, 478 71 of 87
tivity, and background signal). The use of ratiometric probes is important to uniquelyaddress some of the critical challenges associated with each imaging modality (con-centration dependency and potential interferences associated with heterogeneousphysiological environments) and ratiometric probes enable obtaining precise informa-tion about environments and minimizes the chances of observing false negative andfalse positive results.
(2) Dual-mode probes to detect relevant differences in physiological environments. Al-most all reported probes are unable to detect the early stages of hypoxia. For example,pH-sensitive probes undergo stimuli-responsive changes in the probe when the pH isusually about 6.0–6.5. If a probe could detect a pH value slightly less than 7.4, suchtissues could be flagged as potential cancer early, although with a secondary confir-mation to avoid false positives. In PET imaging, most tracers detect tumors when theoxygen concentration is less than the clinically relevant hypoxic level (<10 mmHg).Detection of early stages of hypoxia can help maximize the survival rate of cancerpatients; therefore, the development of dual-mode probes that are responsive tosmall changes in physiological conditions is highly desirable in future biomedicalapplications.
(3) Increased biocompatibility of dual-mode probes for clinical imaging. Functionalizingdual-mode probes to increase biocompatibility, target solubility (water or lipid), andtarget specificity while minimizing toxicity is needed to use dual-mode probes inclinical imaging. Furthermore, imaging agents should be developed to remain activelong enough that the instrument can detect the probe within an imaging-relevant timeframe but short enough to clear within a reasonable amount of time.
(4) Development of multiple stimuli-responsive probes. Reported dual-mode probes todate are responsive to specific changes associated with tumor microenvironments.However, the development of probes that are capable of simultaneously detectingmore than one stimulus is likely to provide a more precise and accurate characteriza-tion of hypoxic tumors.
(5) Integration of dual-mode diagnostic agents with therapeutic agents to detect andtreat cancer simultaneously. New physical and chemical theories have been used insynthesizing activity-based sensing probes for tumor imaging and therapy [399,400].This strategy has the potential to minimize patient exposure to chemicals and harmfulradiation and increase the efficiency of clinical diagnosis and therapy of cancer, underthe right circumstances. Furthermore, theragnostic dual-mode probes could minimizepotential side effects that arise due to the use of multiple probes.
(6) The use of multiple imaging modalities to obtain accurate information about tumormicroenvironments. Several multi-modal imaging probes have been reported tomeasure hypoxia. The inclusion of extra modalities, when selected for a specificpurpose, can further overcome the limitations of using only two modalities; however,care must be shown to reasonably determine the utility of these extra modalities.
In summary, hypoxia is a critical medical condition that needs to be diagnosed in itsearly stages to increase the survival chances of patients and to develop new treatments fordiseases. Dual-mode imaging of hypoxia has the potential to enable accurate diagnosiswhile overcoming the limitations of single-mode imaging techniques. Existing methodsare still not capable of capturing subtle changes in tissue environment that help to identifytumors in their early stages. As a result, there is an opportunity to incorporate new ideasinto existing methods and use them in clinical imaging. As opposed to its advantages,dual-modality imaging of hypoxia has limitations as well. For example, the necessity touse more than one imaging mode can be costly and time-consuming, and the design andsynthesis of multimodal probes can be challenging. We expect that this review article willprovide guidance for future development of imaging science focused on understandingand imaging hypoxia using more than one imaging modality at a time.

Biosensors 2022, 12, 478 72 of 87
Funding: The authors gratefully acknowledge support from the National Institutes of Health, grantnumber R01EB026453.
Institutional Review Board Statement: Not applicable.
Informed Consent Statement: Not applicable.
Data Availability Statement: Not applicable.
Conflicts of Interest: The authors declare no conflict of interest.
References1. Shao, C.; Yang, F.; Miao, S.; Liu, W.; Wang, C.; Shu, Y.; Shen, H. Role of hypoxia-induced exosomes in tumor biology. Mol. Cancer
2018, 17, 120. [CrossRef] [PubMed]2. Jing, X.; Yang, F.; Shao, C.; Wei, K.; Xie, M.; Shen, H.; Shu, Y. Role of hypoxia in cancer therapy by regulating the tumor
microenvironment. Mol. Cancer 2019, 18, 157. [CrossRef]3. Ivankovic, I.; Deán-Ben, X.L.; Lin, H.C.A.; Zhang, Z.; Trautz, B.; Petry, A.; Görlach, A.; Razansky, D. Volumetric optoacoustic
tomography enables non-invasive in vivo characterization of impaired heart function in hypoxic conditions. Sci. Rep. 2019, 9,8369. [CrossRef] [PubMed]
4. Hassan, H.; Chen, R. Hypoxia in Alzheimer’s disease: Effects of hypoxia inducible factors. Neural Regen. Res. 2021, 16, 310.5. Ogunshola, O.O.; Antoniou, X. Contribution of hypoxia to Alzheimer’s disease: Is HIF-1α a mediator of neurodegeneration? Cell.
Mol. Life Sci. 2009, 66, 3555–3563. [CrossRef] [PubMed]6. Vaupel, P.; Mayer, A. Hypoxia in cancer: Significance and impact on clinical outcome. Cancer Metastasis Rev. 2007, 26, 225–239.
[CrossRef]7. Kumar, A.; Deep, G. Hypoxia in tumor microenvironment regulates exosome biogenesis: Molecular mechanisms and translational
opportunities. Cancer Lett. 2020, 479, 23–30. [CrossRef]8. Liu, J.N.; Bu, W.; Shi, J. Chemical design and synthesis of functionalized probes for imaging and treating tumor hypoxia. Chem.
Rev. 2017, 117, 6160–6224. [CrossRef]9. Brown, J.M.; Wilson, W.R. Exploiting tumour hypoxia in cancer treatment. Nat. Rev. Cancer 2004, 4, 437–447. [CrossRef]10. Nourazarian, A.R.; Kangari, P.; Salmaninejad, A. Roles of oxidative stress in the development and progression of breast cancer.
Asian Pac. J. Cancer Prev. 2014, 15, 4745–4751. [CrossRef]11. Al Tameemi, W.; Dale, T.P.; Kh Al-Jumaily, R.M.; Forsyth, N.R. Hypoxia-modified cancer cell metabolism. Front. Cell Dev. Biol.
2019, 7, 4. [CrossRef] [PubMed]12. Muz, B.; de la Puente, P.; Azab, F.; Azab, A.K. The role of hypoxia in cancer progression, angiogenesis, metastasis, and resistance
to therapy. Hypoxia 2015, 3, 83. [CrossRef] [PubMed]13. Keith, B.; Johnson, R.S.; Simon, M.C. HIF1α and HIF2α: Sibling rivalry in hypoxic tumour growth and progression. Nat. Rev.
Cancer 2012, 12, 9–22. [CrossRef] [PubMed]14. Dengler, V.L.; Galbraith, M.D.; Espinosa, J.M. Transcriptional regulation by hypoxia inducible factors. Crit. Rev. Biochem. Mol.
Biol. 2014, 49, 1–15. [CrossRef]15. Cerychova, R.; Pavlinkova, G. HIF-1, metabolism, and diabetes in the embryonic and adult heart. Front. Endocrinol. 2018, 9, 460.
[CrossRef]16. Justus, C.R.; Dong, L.; Yang, L.V. Acidic tumor microenvironment and pH-sensing G protein-coupled receptors. Front. Physiol.
2013, 4, 354. [CrossRef]17. Lin, B.; Chen, H.; Liang, D.; Lin, W.; Qi, X.; Liu, H.; Deng, X. Acidic pH and high-H2O2 dual tumor microenvironment-responsive
nanocatalytic graphene oxide for cancer selective therapy and recognition. ACS Appl. Mater. Interfaces 2019, 11, 11157–11166.[CrossRef]
18. Liou, G.-Y.; Storz, P. Reactive oxygen species in cancer. Free Radic. Res. 2010, 44, 479–496. [CrossRef]19. Aggarwal, V.; Tuli, H.S.; Varol, A.; Thakral, F.; Yerer, M.B.; Sak, K.; Varol, M.; Jain, A.; Khan, M.A.; Sethi, G. Role of reactive
oxygen species in cancer progression: Molecular mechanisms and recent advancements. Biomolecules 2019, 9, 735. [CrossRef]20. Wink, D.A.; Vodovotz, Y.; Laval, J.; Laval, F.; Dewhirst, M.W.; Mitchell, J.B. The multifaceted roles of nitric oxide in cancer.
Carcinogenesis 1998, 19, 711–721. [CrossRef]21. Zhang, J.; Zhen, X.; Zeng, J.; Pu, K. A dual-modal molecular probe for near-infrared fluorescence and photoacoustic imaging of
peroxynitrite. Anal. Chem. 2018, 90, 9301–9307. [CrossRef] [PubMed]22. Giles, G.I.; Tasker, K.M.; Jacob, C. Hypothesis: The role of reactive sulfur species in oxidative stress. Free Radic. Biol. Med. 2001, 31,
1279–1283. [CrossRef]23. Lin, V.S.; Chen, W.; Xian, M.; Chang, C.J. Chemical probes for molecular imaging and detection of hydrogen sulfide and reactive
sulfur species in biological systems. Chem. Soc. Rev. 2015, 44, 4596–4618. [CrossRef] [PubMed]24. Jorgenson, T.C.; Zhong, W.; Oberley, T.D. Redox imbalance and biochemical changes in cancer. Cancer Res. 2013, 73, 6118–6123.
[CrossRef]25. Debevec, T.; Millet, G.P.; Pialoux, V. Hypoxia-induced oxidative stress modulation with physical activity. Front. Physiol. 2017, 8,
84. [CrossRef]

Biosensors 2022, 12, 478 73 of 87
26. Saghiri, M.A.; Asatourian, A.; Orangi, J.; Sorenson, C.M.; Sheibani, N. Functional role of inorganic trace elements in angiogenesis—Part II: Cr, Si, Zn, Cu, and S. Crit. Rev. Oncol. Hematol. 2015, 96, 143–155. [CrossRef]
27. Wigerup, C.; Påhlman, S.; Bexell, D. Therapeutic targeting of hypoxia and hypoxia-inducible factors in cancer. Pharmacol. Ther.2016, 164, 152–169. [CrossRef]
28. Semenza, G.L. Hypoxia-inducible factors: Mediators of cancer progression and targets for cancer therapy. Trends Pharmacol. Sci.2012, 33, 207–214. [CrossRef]
29. Nordsmark, M.; Loncaster, J.; Aquino-Parsons, C.; Chou, S.-C.; Ladekarl, M.; Havsteen, H.; Lindegaard, J.C.; Davidson, S.E.; Varia,M.; West, C.; et al. Measurements of hypoxia using pimonidazole and polarographic oxygen-sensitive electrodes in human cervixcarcinomas. Radiother. Oncol. 2003, 67, 35–44. [CrossRef]
30. Knox, H.J.; Kim, T.W.; Zhu, Z.; Chan, J. Photophysical tuning of N-oxide-based probes enables ratiometric photoacoustic imagingof tumor hypoxia. ACS Chem. Biol. 2018, 13, 1838–1843. [CrossRef]
31. Sun, L.; Li, G.; Chen, X.; Chen, Y.; Jin, C.; Ji, L.; Chao, H. Azo-based iridium (III) complexes as multicolor phosphorescent probesto detect hypoxia in 3D multicellular tumor spheroids. Sci. Rep. 2015, 5, 14837. [CrossRef] [PubMed]
32. Okuda, K.; Okabe, Y.; Kadonosono, T.; Ueno, T.; Youssif, B.G.M.; Kizaka-Kondoh, S.; Nagasawa, H. 2-Nitroimidazole-tricarbocyanine conjugate as a near-infrared fluorescent probe for in vivo imaging of tumor hypoxia. Bioconjugate Chem. 2012, 23,324–329. [CrossRef] [PubMed]
33. Dang, X.; Bardhan, N.M.; Qi, J.; Gu, L.; Eze, N.A.; Lin, C.W.; Kataria, S.; Hammond, P.T.; Belcher, A.M. Deep-tissue opticalimaging of near cellular-sized features. Sci. Rep. 2019, 9, 3873. [CrossRef] [PubMed]
34. Thambi, T.; Park, J.H.; Lee, D.S. Hypoxia-responsive nanocarriers for cancer imaging and therapy: Recent approaches and futureperspectives. Chem. Commun. 2016, 52, 8492–8500. [CrossRef]
35. Knox, H.J.; Hedhli, J.; Kim, T.W.; Khalili, K.; Dobrucki, L.W.; Chan, J. A bioreducible N-oxide-based probe for photoacousticimaging of hypoxia. Nat. Commun. 2017, 8, 1794. [CrossRef]
36. Cai, Q.; Yu, T.; Zhu, W.; Xu, Y.; Qian, X. A turn-on fluorescent probe for tumor hypoxia imaging in living cells. Chem. Commun.2015, 51, 14739–14741. [CrossRef]
37. Zhao, J.; Chen, J.; Ma, S.; Liu, Q.; Huang, L.; Chen, X.; Lou, K.; Wang, W. Recent developments in multimodality fluorescenceimaging probes. Acta Pharm. Sin. B 2018, 8, 320–338. [CrossRef]
38. Brix, G.; Nekolla, E.A.; Borowski, M.; Noßke, D. Radiation risk and protection of patients in clinical SPECT/CT. Eur. J. Nucl. Med.Mol. Imaging 2014, 41, 125–136. [CrossRef]
39. Abuelhia, E.; Alghamdi, A. Evaluation of arising exposure of ionizing radiation from computed tomography and the associatedhealth concerns. J. Radiat. Res. Appl. Sci. 2020, 13, 295–300. [CrossRef]
40. Ekanger, L.A.; Allen, M.J. Overcoming the concentration-dependence of responsive probes for magnetic resonance imaging.Metallomics 2015, 7, 405–421. [CrossRef]
41. Fleming, I.N.; Manavaki, R.; Blower, P.J.; West, C.; Williams, K.J.; Harris, A.L.; Domarkas, J.; Lord, S.; Baldry, C.; Gilbert, F.J.Imaging tumour hypoxia with positron emission tomography. Br. J. Cancer 2015, 112, 238–250. [CrossRef] [PubMed]
42. Xue, T.; Shen, J.; Shao, K.; Wang, W.; Wu, B.; He, Y. Strategies for Tumor Hypoxia Imaging Based on Aggregation-InducedEmission Fluorogens. Chem. Eur. J. 2020, 26, 2521–2528. [CrossRef] [PubMed]
43. Tamaki, N.; Hirata, K. Tumor hypoxia: A new PET imaging biomarker in clinical oncology. Int. J. Clin. Oncol. 2016, 21, 619–625.[CrossRef] [PubMed]
44. Rajendran, J.G.; Krohn, K.A. F-18 fluoromisonidazole for imaging tumor hypoxia: Imaging the microenvironment for personalizedcancer therapy. Semin. Nucl. Med. 2015, 45, 151–162. [CrossRef] [PubMed]
45. Huang, Y.; Fan, J.; Li, Y.; Fu, S.; Chen, Y.; Wu, J. Imaging of Tumor Hypoxia with Radionuclide-Labeled Tracers for PET. Front.Oncol. 2021, 11, 3547. [CrossRef]
46. Kumari, R.; Sunil, D.; Ningthoujam, R.S.; Kumar, N.V.A. Azodyes as markers for tumor hypoxia imaging and therapy: Anup-to-date review. Chem. Biol. Interact. 2019, 307, 91–104. [CrossRef]
47. Pacheco-Torres, J.; López-Larrubia, P.; Ballesteros, P.; Cerdán, S. Imaging tumor hypoxia by magnetic resonance methods. NMRBiomed. 2011, 24, 1–16. [CrossRef]
48. McKeown, S.R. Defining normoxia, physoxia and hypoxia in tumours—Implications for treatment response. Br. J. Radiol. Suppl.2014, 87, 20130676. [CrossRef]
49. Baumann, M.U.; Zamudio, S.; Illsley, N.P. Hypoxic upregulation of glucose transporters in BeWo choriocarcinoma cells ismediated by hypoxia-inducible factor-1. Am. J. Physiol. Cell Physiol. 2007, 293, 477–485. [CrossRef]
50. Semenza, G.L. Regulation of cancer cell metabolism by hypoxia-inducible factor 1. Semin. Cancer Biol. 2009, 19, 12–16. [CrossRef]51. Kim, J.-W.; Dang, C.V. Cancer’s molecular sweet tooth and the Warburg effect. Cancer Res. 2006, 66, 8927–8930. [CrossRef]
[PubMed]52. Kim, J.-W.; Tchernyshyov, I.; Semenza, G.L.; Dang, C.V. HIF-1-mediated expression of pyruvate dehydrogenase kinase: A
metabolic switch required for cellular adaptation to hypoxia. Cell Metab. 2006, 3, 177–185. [CrossRef] [PubMed]53. Adeva-Andany, M.M.; Pérez-Felpete, N.; Fernández-Fernández, C.; Donapetry-García, C.; Pazos-García, C. Liver glucose
metabolism in humans. Biosci. Rep. 2016, 36, e00416. [CrossRef] [PubMed]54. Akram, M. Citric acid cycle and role of its intermediates in metabolism. Cell Biochem. Biophys. 2014, 68, 475–478. [CrossRef]
[PubMed]

Biosensors 2022, 12, 478 74 of 87
55. Papandreou, I.; Cairns, R.A.; Fontana, L.; Lim, A.L.; Denko, N.C. HIF-1 mediates adaptation to hypoxia by actively downregulatingmitochondrial oxygen consumption. Cell Metab. 2006, 3, 187–197. [CrossRef]
56. Semenza, G.L. Oxygen-dependent regulation of mitochondrial respiration by hypoxia-inducible factor 1. Biochem. J. 2007, 405,1–9. [CrossRef]
57. Zhao, T.; Zhu, Y.; Morinibu, A.; Kobayashi, M.; Shinomiya, K.; Itasaka, S.; Yoshimura, M.; Guo, G.; Hiraoka, M.; Harada, H.HIF-1-mediated metabolic reprogramming reduces ROS levels and facilitates the metastatic colonization of cancers in lungs. Sci.Rep. 2014, 4, 3793. [CrossRef]
58. Firth, J.D.; Ebert, B.L.; Ratcliffe, P.J. Hypoxic regulation of lactate dehydrogenase A. Int. J. Biol. Chem. 1995, 270, 21021–21027.[CrossRef]
59. De Milito, A.; Fais, S. Tumor acidity, chemoresistance and proton pump inhibitors. Future Med. 2005, 1, 779–786. [CrossRef]60. Hayashi, Y.; Edwards, N.A.; Proescholdt, M.A.; Oldfield, E.H.; Merrill, M.J. Regulation and function of aquaporin-1 in glioma
cells. Neoplasia 2007, 9, 777–787. [CrossRef]61. McIntyre, A.; Hulikova, A.; Ledaki, I.; Snell, C.; Singleton, D.; Steers, G.; Seden, P.; Jones, D.; Bridges, E.; Wigfield, S.; et al.
Disrupting hypoxia-induced bicarbonate transport acidifies tumor cells and suppresses tumor growth. Cancer Res. 2016, 76,3744–3755. [CrossRef] [PubMed]
62. Neri, D.; Supuran, C.T. Interfering with pH regulation in tumours as a therapeutic strategy. Nat. Rev. Drug Discov. 2011, 10,767–777. [CrossRef] [PubMed]
63. Ullah, M.S.; Davies, A.J.; Halestrap, A.P. The plasma membrane lactate transporter MCT4, but not MCT1, is up-regulated byhypoxia through a HIF-1α-dependent mechanism. Int. J. Biol. Chem. 2006, 281, 9030–9037. [CrossRef]
64. Rios, E.J.; Fallon, M.; Wang, J.; Shimoda, L.A. Chronic hypoxia elevates intracellular pH and activates Na+/H+ exchange inpulmonary arterial smooth muscle cells. Am. J. Physiol. Lung Cell Mol. Physiol. 2005, 289, 867–874. [CrossRef] [PubMed]
65. Parks, S.K.; Pouyssegur, J. The Na+/HCO3− Co-Transporter SLC4A4 Plays a Role in Growth and Migration of Colon and BreastCancer Cells. J. Cell. Physiol. 2015, 230, 1954–1963. [CrossRef] [PubMed]
66. Matoba, S.; Kang, J.-G.; Patino, W.D.; Wragg, A.; Boehm, M.; Gavrilova, O.; Hurley, P.J.; Bunz, F.; Hwang, P.M. p53 regulatesmitochondrial respiration. Science 2006, 312, 1650–1653. [CrossRef]
67. Böhme, I.; Bosserhoff, A.K. Acidic tumor microenvironment in human melanoma. Pigment. Cell Melanoma Res. 2016, 29, 508–523.[CrossRef]
68. Chiche, J.; Brahimi-Horn, M.C.; Pouysségur, J. Tumour hypoxia induces a metabolic shift causing acidosis: A common feature incancer. J. Cell. Mol. Med. 2010, 14, 771–794. [CrossRef]
69. Švastová, E.; Hulíková, A.; Rafajová, M.; Zat’ovicová, M.; Gibadulinová, A.; Casini, A.; Cecchi, A.; Scozzafava, A.; Supuran, C.T.;Pastorek, J.; et al. Hypoxia activates the capacity of tumor-associated carbonic anhydrase IX to acidify extracellular pH. FEBS Lett.2004, 577, 439–445. [CrossRef]
70. Schieber, M.; Chandel, N.S. ROS function in redox signaling and oxidative stress. Curr. Biol. 2014, 24, 453–462. [CrossRef]71. Starkov, A.A. The role of mitochondria in reactive oxygen species metabolism and signaling. Ann. N. Y. Acad. Sci. 2008, 1147,
37–52. [CrossRef]72. Dunn, J.D.; Alvarez, L.A.; Zhang, X.; Soldati, T. Reactive oxygen species and mitochondria: A nexus of cellular homeostasis.
Redox Biol. 2015, 6, 472–485. [CrossRef] [PubMed]73. Saikolappan, S.; Kumar, B.; Shishodia, G.; Koul, S.; Koul, H.K. Reactive oxygen species and cancer: A complex interaction. Cancer
Lett. 2019, 452, 132–143. [CrossRef] [PubMed]74. Ribas, V.; García-Ruiz, C.; Fernández-Checa, J.C. Glutathione and mitochondria. Front. Pharmacol. 2014, 5, 151. [CrossRef]
[PubMed]75. Rouschop, K.M.A.; Ramaekers, C.H.M.A.; Schaaf, M.B.E.; Keulers, T.G.H.; Savelkouls, K.G.M.; Lambin, P.; Koritzinsky, M.;
Wouters, B.G. Autophagy is required during cycling hypoxia to lower production of reactive oxygen species. Radiother. Oncol.2009, 92, 411–416. [CrossRef]
76. Jayalakshmi, K.; Sairam, M.; Singh, S.B.; Sharma, S.K.; Ilavazhagan, G.; Banerjee, P.K. Neuroprotective effect of N-acetyl cysteineon hypoxia-induced oxidative stress in primary hippocampal culture. Brain Res. 2005, 1046, 97–104. [CrossRef]
77. Fukuda, R.; Zhang, H.; Kim, J.-W.; Shimoda, L.; Dang, C.V.; Semenza, G.L. HIF-1 regulates cytochrome oxidase subunits tooptimize efficiency of respiration in hypoxic cells. Cell 2007, 129, 111–122. [CrossRef]
78. Yuan, G.; Khan, S.A.; Luo, W.; Nanduri, J.; Semenza, G.L.; Prabhakar, N.R. Hypoxia-inducible factor 1 mediates increasedexpression of NADPH oxidase-2 in response to intermittent hypoxia. J. Cell. Physiol. 2011, 226, 2925–2933. [CrossRef]
79. De Sanctis, F.; Sandri, S.; Ferrarini, G.; Pagliarello, I.; Sartoris, S.; Ugel, S.; Marigo, I.; Molon, B.; Bronte, V. The emergingimmunological role of post-translational modifications by reactive nitrogen species in cancer microenvironment. Front. Immunol.2014, 5, 69. [CrossRef]
80. Fionda, C.; Abruzzese, M.P.; Santoni, A.; Cippitelli, M. Immunoregulatory and effector activities of nitric oxide and reactivenitrogen species in cancer. Curr. Med. Chem. 2016, 23, 2618–2636. [CrossRef]
81. Thompson, L.; Dong, Y.; Evans, L. Chronic hypoxia increases inducible NOS-derived nitric oxide in fetal guinea pig hearts. Pediatr.Res. 2009, 65, 188–192. [CrossRef] [PubMed]
82. Jung, F.; Palmer, L.A.; Zhou, N.; Johns, R.A. Hypoxic regulation of inducible nitric oxide synthase via hypoxia inducible factor-1in cardiac myocytes. Circ. Res. 2000, 86, 319–325. [CrossRef] [PubMed]

Biosensors 2022, 12, 478 75 of 87
83. Guo, Y.; Ward, M.E.; Beasjours, S.; Mori, M.; Hussain, S.N.A. Regulation of cerebellar nitric oxide production in response toprolonged in vivo hypoxia. J. Neurosci. Res. 1997, 49, 89–97. [CrossRef]
84. Radi, R. Oxygen radicals, nitric oxide, and peroxynitrite: Redox pathways in molecular medicine. Proc. Natl. Acad. Sci. USA 2018,115, 5839–5848. [CrossRef]
85. Radi, R.; Cassina, A.; Hodara, R.; Quijano, C.; Castro, L. Peroxynitrite reactions and formation in mitochondria. Free Radic. Biol.Med. 2002, 33, 1451–1464. [CrossRef]
86. Ríos, N.; Prolo, C.; Álvarez, M.N.; Piacenza, L.; Radi, R. Peroxynitrite Formation and Detection in Living Cells. In Nitric Oxide,3rd ed.; Ignarro, L.J., Freeman, B.A., Eds.; Elsevier: Amsterdam, The Netherlands; Academic Press: Cambridge, MA, USA, 2017;pp. 271–288.
87. Cobbs, C.S.; Samanta, M.; Harkins, L.E.; Gillespie, G.Y.; Merrick, B.A.; MacMillan-Crow, L.A. Evidence for peroxynitrite-mediatedmodifications to p53 in human gliomas: Possible functional consequences. Arch. Biochem. Biophys. 2001, 394, 167–172. [CrossRef]
88. Cobbs, C.S.; Whisenhunt, T.R.; Wesemann, D.R.; Harkins, L.E.; Van Meir, E.G.; Samanta, M. Inactivation of wild-type p53 proteinfunction by reactive oxygen and nitrogen species in malignant glioma cells. Cancer Res. 2003, 63, 8670–8673.
89. Ida, T.; Sawa, T.; Ihara, H.; Tsuchiya, Y.; Watanabe, Y.; Kumagai, Y.; Suematsu, M.; Motohashi, H.; Fujii, S.; Matsunaga, T.; et al.Reactive cysteine persulfides and S-polythiolation regulate oxidative stress and redox signaling. Proc. Natl. Acad. Sci. USA 2014,111, 7606–7611. [CrossRef]
90. Shinkai, Y.; Abiko, Y.; Ida, T.; Miura, T.; Kakehashi, H.; Ishii, I.; Nishida, M.; Sawa, T.; Akaike, T.; Kumagai, Y. Reactive sulfurspecies-mediated activation of the Keap1–Nrf2 pathway by 1,2-naphthoquinone through sulfenic acids formation under oxidativestress. Chem. Res. Toxicol. 2015, 28, 838–847. [CrossRef]
91. Shefa, U.; Kim, M.-S.; Jeong, N.Y.; Jung, J. Antioxidant and cell-signaling functions of hydrogen sulfide in the central nervoussystem. Oxid. Med. Cell. Longev. 2018, 2018, 1–17. [CrossRef]
92. Cai, S.; Liu, C.; He, S.; Zhao, L.; Zeng, X. Mitochondria-targeted fluorescent probe for imaging endogenous hydrogen sulfide incellular antioxidant stress. Anal. Methods 2020, 12, 5061–5067. [CrossRef] [PubMed]
93. Jastrzab, A.; Skrzydlewska, E. Thioredoxin-dependent system. Application of inhibitors. J. Enzym. Inhib. Med. Chem. 2021, 36,362–371. [CrossRef] [PubMed]
94. Vucetic, M.; Cormerais, Y.; Parks, S.K.; Pouysségur, J. The central role of amino acids in cancer redox homeostasis: Vulnerabilitypoints of the cancer redox code. Front. Oncol. 2017, 7, 319. [CrossRef] [PubMed]
95. Aoyama, K.; Nakaki, T. Glutathione in cellular redox homeostasis: Association with the excitatory amino acid carrier 1 (EAAC1).Molecules 2015, 20, 8742–8758. [CrossRef]
96. Samanta, D.; Semenza, G.L. Maintenance of redox homeostasis by hypoxia-inducible factors. Redox Biol. 2017, 13, 331–335.[CrossRef]
97. Fernández-Checa, J.C.; Kaplowitz, N.; García-Ruiz, C.; Colell, A.; Miranda, M.; Marí, M.; Ardite, E.; Morales, A. GSH transport inmitochondria: Defense against TNF-induced oxidative stress and alcohol-induced defect. Am. J. Physiol. Gastrointest. Liver Physiol.1997, 273, 7–17. [CrossRef]
98. Lushchak, V.I. Glutathione homeostasis and functions: Potential targets for medical interventions. J. Amino Acids 2012, 2012,736837. [CrossRef]
99. Kimura, H. Hydrogen sulfide: Its production and functions. Exp. Physiol. 2011, 96, 833–835. [CrossRef]100. Kimura, Y.; Kimura, H. Hydrogen sulfide protects neurons from oxidative stress. FASEB J. 2004, 18, 1165–1167. [CrossRef]101. Wu, J.; Jin, Z.; Zheng, H.; Yan, L.-J. Sources and implications of NADH/NAD+ redox imbalance in diabetes and its complications.
Diabetes Metab. Syndr. Obes. 2016, 9, 145.102. Schafer, F.Q.; Buettner, G.R. Redox environment of the cell as viewed through the redox state of the glutathione disul-
fide/glutathione couple. Free Radic. Biol. Med. 2001, 30, 1191–1212. [CrossRef]103. Pinto, S.M.; Tomé, V.; Calvete, M.J.F.; Castro, M.M.C.A.; Tóth, É.; Geraldes, C.F.G.C. Metal-based redox-responsive MRI contrast
agents. Coord. Chem. Rev. 2019, 390, 1–31. [CrossRef]104. Berna, N.; Arnould, T.; Remacle, J.; Michiels, C. Hypoxia-induced increase in intracellular calcium concentration in endothelial
cells: Role of the Na+-glucose cotransporter. J. Cell. Biochem. 2002, 84, 115–131. [CrossRef]105. Solaini, G.; Baracca, A.; Lenaz, G.; Sgarbi, G. Hypoxia and mitochondrial oxidative metabolism. Biochim. Biophys. Acta Bioenerg.
2010, 1797, 1171–1177. [CrossRef] [PubMed]106. Rouslin, W.; Broge, C.W. Mechanisms of ATP conservation during ischemia in slow and fast heart rate hearts. Am. J. Physiol. Cell
Physiol. 1993, 264, 209–216. [CrossRef]107. Cheng, M.H.Y.; Mo, Y.; Zheng, G. Nano versus molecular: Optical imaging approaches to detect and monitor tumor hypoxia.
Adv. Healthc. Mater. 2021, 10, 2001549. [CrossRef]108. Min, K.H.; Min, H.S.; Lee, H.J.; Park, D.J.; Yhee, J.Y.; Kim, K.; Kwon, I.C.; Jeong, S.Y.; Silvestre, O.F.; Chen, X.; et al. H-controlled
gas-generating mineralized nanoparticles: A theranostic agent for ultrasound imaging and therapy of cancers. ACS Nano 2015, 9,134–145. [CrossRef]
109. Jo, J.; Lee, C.H.; Kopelman, R.; Wang, X. In vivo quantitative imaging of tumor pH by nanosonophore assisted multispectralphotoacoustic imaging. Nat. Commun. 2017, 8, 471. [CrossRef]
110. Urtasun, R.C.; Parliament, M.B.; McEwan, A.J.; Mercer, J.R.; Mannan, R.H.; Wiebe, L.I.; Morin, C.; Chapman, J.D. Measurement ofhypoxia in human tumours by non-invasive spect imaging of iodoazomycin arabinoside. Br. J. Cancer. 1996, 27, 209.

Biosensors 2022, 12, 478 76 of 87
111. Shi, H.; Wang, Z.; Huang, C.; Gu, X.; Jia, T.; Zhang, A.; Wu, Z.; Zhu, L.; Luo, X.; Zhao, X.; et al. A functional CT contrast agent forin vivo imaging of tumor hypoxia. Small 2016, 12, 3995–4006. [CrossRef]
112. Peeters, S.G.J.A.; Zegers, C.M.L.; Yaromina, A.; Van Elmpt, W.; Dubois, L.; Lambin, P. Current preclinical and clinical applicationsof hypoxia PET imaging using 2-nitroimidazoles. Q. J. Nucl. Med. Mol. Imaging 2015, 59, 39–57. [PubMed]
113. Krishna, M.C.; Matsumoto, S.; Yasui, H.; Saito, K.; Devasahayam, N.; Subramanian, S.; Mitchell, J.B. Electron paramagneticresonance imaging of tumor pO2. Radiat. Res. 2012, 177, 376–386. [CrossRef]
114. Gillies, R.J.; Raghunand, N.; Karczmar, G.S.; Bhujwalla, Z.M. MRI of the tumor microenvironment. J. Magn. Reason. Imaging 2002,16, 430–450. [CrossRef] [PubMed]
115. Jung, K.O.; Jo, H.; Yu, J.H.; Gambhir, S.S.; Pratx, G. Development and MPI tracking of novel hypoxia-targeted theranosticexosomes. Biomaterials 2018, 177, 139–148. [CrossRef] [PubMed]
116. Desvaux, E.; Courteau, A.; Bellaye, P.-S.; Guillemin, M.; Drouet, C.; Walker, P.; Collin, B.; Decréau, R.A. Cherenkov luminescenceimaging is a fast and relevant preclinical tool to assess tumour hypoxia in vivo. EJNMMI Res. 2018, 8, 111. [CrossRef] [PubMed]
117. Huang, Y.; He, S.; Cao, W.; Cai, K.; Liang, X.-J. Biomedical nanomaterials for imaging-guided cancer therapy. Nanoscale 2012, 4,6135–6149. [CrossRef] [PubMed]
118. Chen, Q.; Wen, J.; Li, H.; Xu, Y.; Liu, F.; Sun, S. Recent advances in different modal imaging-guided photothermal therapy.Biomaterials 2016, 106, 144–166. [CrossRef]
119. Grundfest, W.S.; Val-Mejias, J.; Monnet, E.; Knight, B.P.; Nazarian, S.; Berger, R.D.; Ferguson, T.B., Jr.; Roden, M.M.; Amundson, D.;Hanlin, J.; et al. Real-time percutaneous optical imaging of anatomical structures in the heart through blood using a catheter-basedinfrared imaging system. Semin. Thorac. Cardiovasc. Surg. 2007, 19, 336–341. [CrossRef]
120. Schäferling, M. The art of fluorescence imaging with chemical sensors. Angew. Chem. Int. Ed. 2012, 51, 3532–3554. [CrossRef]121. Barsanti, C.; Lenzarini, F.; Kusmic, C. Diagnostic and prognostic utility of non-invasive imaging in diabetes management. World J.
Diabetes 2015, 6, 792. [CrossRef]122. Massoud, T.F.; Gambhir, S.S. Molecular imaging in living subjects: Seeing fundamental biological processes in a new light. Genes
Dev. 2003, 17, 545–580. [CrossRef] [PubMed]123. James, M.L.; Gambhir, S.S. A molecular imaging primer: Modalities, imaging agents, and applications. Physiol. Rev. 2012, 92,
897–965. [CrossRef] [PubMed]124. Ramsay, D.T.; Kent, J.C.; Hartmann, R.A.; Hartmann, P.E. Anatomy of the lactating human breast redefined with ultrasound
imaging. J. Anat. 2005, 206, 525–534. [CrossRef]125. Pimlott, S.L.; Sutherland, A. Molecular tracers for the PET and SPECT imaging of disease. Chem. Soc. Rev. 2011, 40, 149–162.
[CrossRef] [PubMed]126. Ukil, S.; Reinhardt, J.M. Anatomy-guided lung lobe segmentation in X-ray CT images. IEEE Trans. Med. Imaging 2008, 28, 202–214.
[CrossRef]127. Sim, N.; Parker, D. Critical design issues in the targeted molecular imaging of cell surface receptors. Chem. Soc. Rev. 2015, 44,
2122–2134. [CrossRef]128. Villeirs, G.M.; Verstraete, K.L.; De Neve, W.J.; De Meerleer, G.O. Magnetic resonance imaging anatomy of the prostate and
periprostatic area: A guide for radiotherapists. Radiother. Oncol. 2005, 76, 99–106. [CrossRef]129. Ashur, I.; Allouche-Arnon, H.; Bar-Shir, A. Calcium fluoride nanocrystals: Tracers for in vivo 19F magnetic resonance imaging.
Angew. Chem. Int. Ed. 2018, 57, 7478–7482. [CrossRef]130. Yogo, K.; Matsushita, A.; Tatsuno, Y.; Shimo, T.; Hirota, S.; Nozawa, M.; Ozawa, S.; Ishiyama, H.; Yasuda, H.; Nagata, Y.; et al.
Imaging Cherenkov emission for quality assurance of high-dose-rate brachytherapy. Sci. Rep. 2020, 10, 3572. [CrossRef]131. Tay, Z.W.; Hensley, D.W.; Vreeland, E.C.; Zheng, B.; Conolly, S.M. The relaxation wall: Experimental limits to improving MPI
spatial resolution by increasing nanoparticle core size. Biomed. Phy. Eng. Express 2017, 3, 035003. [CrossRef]132. Yu, E.Y.; Chandrasekharan, P.; Berzon, R.; Tay, Z.W.; Zhou, X.Y.; Khandhar, A.P.; Ferguson, R.M.; Kemp, S.J.; Zheng, B.; Goodwill,
P.W.; et al. Magnetic particle imaging for highly sensitive, quantitative, and safe in vivo gut bleed detection in a murine model.ACS Nano 2017, 11, 12067–12076. [CrossRef] [PubMed]
133. Simpson, D.A.; Ryan, R.G.; Hall, L.T.; Panchenko, E.; Drew, S.C.; Petrou, S.; Donnelly, P.S.; Mulvaney, P.; Hollenberg, L.C. Electronparamagnetic resonance microscopy using spins in diamond under ambient conditions. Nat. Commun. 2017, 8, 458. [CrossRef][PubMed]
134. Buchberger, A.R.; DeLaney, K.; Johnson, J.; Li, L. Mass spectrometry imaging: A review of emerging advancements and futureinsights. Anal. Chem. 2018, 90, 240. [CrossRef] [PubMed]
135. Rizzuto, R.; Brini, M.; Pizzo, P.; Murgia, M.; Pozzan, T. Chimeric green fluorescent protein as a tool for visualizing subcellularorganelles in living cells. Curr. Biol. 1995, 5, 635–642. [CrossRef]
136. Gahlaut, N.; Miller, L.W. Time-resolved microscopy for imaging lanthanide luminescence in living cells. Cytom. A 2010, 77,1113–1125. [CrossRef]
137. Zhang, L.; Zheng, X.; Deng, W.; Lu, Y.; Lechevallier, S.; Ye, Z.; Goldys, E.M.; Dawes, J.M.; Piper, J.A.; Yuan, J.; et al. Practicalimplementation, characterization and applications of a multi-colour time-gated luminescence microscope. Sci. Rep. 2014, 4, 6597.[CrossRef]
138. Katz, J.E.; Clavijo, R.I.; Rizk, P.; Ramasamy, R. The basic physics of waves, soundwaves, and shockwaves for erectile dysfunction.Sex. Med. Rev. 2020, 8, 100–105. [CrossRef]

Biosensors 2022, 12, 478 77 of 87
139. Carovac, A.; Smajlovic, F.; Junuzovic, D. Application of ultrasound in medicine. Acta Inform. Med. 2011, 19, 168–171. [CrossRef]140. Tasnim, T.; Shuvo, M.M.H.; Hasan, S. Study of speckle noise reduction from ultrasound b-mode images using different filtering
techniques. In Proceedings of the 4th International Conference on Advances in Electrical Engineering (ICAEE), Dhaka, Bangladesh,28–30 September 2017; pp. 229–234.
141. Wang, Q.; Chan, K.F.; Schweizer, K.; Du, X.; Jin, D.; Yu, S.C.H.; Nelson, B.J.; Zhang, L. Ultrasound Doppler-guided real-timenavigation of a magnetic microswarm for active endovascular delivery. Sci. Adv. 2021, 7, 5914. [CrossRef]
142. Hynynen, K.; Jones, R.M. Image-guided ultrasound phased arrays are a disruptive technology for non-invasive therapy. Phys.Med. Biol. 2016, 61, 206. [CrossRef]
143. Wells, P.N.T.; Liang, H.-D. Medical ultrasound: Imaging of soft tissue strain and elasticity. J. R. Soc. Interface 2011, 8, 1521–1549.[CrossRef] [PubMed]
144. Culjat, M.O.; Goldenberg, D.; Tewari, P.; Singh, R.S. A review of tissue substitutes for ultrasound imaging. Ultrasound Med. Biol.2010, 36, 861–873. [CrossRef] [PubMed]
145. Gielen, J.; Ceulemans, R.; Holsbeeck, M.V. Ultrasound of soft tissue tumors. In Imaging of Soft Tumors, 3rd ed.; De Schepper, A.M.,Vanhoenacker, F., Gielen, J., Parizel, P.M., Eds.; Springer: Berlin/Heidelberg, Germany, 2006; Volume 28, pp. 3–18.
146. Mercep, E.; Deán-Ben, X.L.; Razansky, D. Imaging of blood flow and oxygen state with a multi-segment optoacoustic ultrasoundarray. Photoacoustics 2018, 10, 48–53. [CrossRef]
147. Ammirati, E.; Moroni, F.; Pedrotti, P.; Scotti, I.; Magnoni, M.; Bozzolo, E.P.; Rimoldi, O.E.; Camici, P.G. Non-invasive imaging ofvascular inflammation. Front. Immunol. 2014, 5, 399. [CrossRef]
148. Tam, A.C. Applications of photoacoustic sensing techniques. Rev. Mod. Phys. 1986, 58, 381. [CrossRef]149. Zhang, Y.; Hong, H.; Cai, W. Photoacoustic imaging. Cold Spring Harb. Protoc. 2011, 2011, 065508. [CrossRef] [PubMed]150. Karmacharya, M.B.; Sultan, L.R.; Kirkham, B.M.; Brice, A.K.; Wood, A.K.W.; Sehgal, C.M. Photoacoustic imaging for assessing
tissue oxygenation changes in rat hepatic fibrosis. Diagnostics 2020, 10, 705. [CrossRef]151. Karmacharya, M.B.; Sultan, L.R.; Sehgal, C.M. Photoacoustic monitoring of oxygenation changes induced by therapeutic
ultrasound in murine hepatocellular carcinoma. Sci. Rep. 2021, 11, 4100. [CrossRef]152. Okumura, K.; Matsumoto, J.; Iwata, Y.; Yoshida, K.; Yoneda, N.; Ogi, T.; Kitao, A.; Kozaka, K.; Koda, W.; Kobayashi, S.; et al.
Evaluation of renal oxygen saturation using photoacoustic imaging for the early prediction of chronic renal function in a modelof ischemia-induced acute kidney injury. PLoS ONE 2018, 13, 0206461. [CrossRef]
153. Li, M.; Tang, Y.; Yao, J. Photoacoustic tomography of blood oxygenation: A mini review. Photoacoustics 2018, 10, 65–73. [CrossRef]154. Knešaurek, K.; Machac, J. Comparison of 18F SPECT with PET in myocardial imaging: A realistic thorax-cardiac phantom study.
BMC Nucl. Med. 2006, 6, 5. [CrossRef] [PubMed]155. Khalil, M.M.; Tremoleda, J.L.; Bayomy, T.B.; Gsell, W. Molecular SPECT imaging: An overview. Int. J. Mol. Imaging 2011, 2011,
796025. [CrossRef] [PubMed]156. Ferrando, R.; Damian, A. Brain SPECT as a biomarker of neurodegeneration in dementia in the era of molecular imaging: Still a
valid option? Front. Neurol. 2021, 12, 640. [CrossRef] [PubMed]157. Waragai, M.; Yamada, T.; Matsuda, H. Evaluation of brain perfusion SPECT using an easy Z-score imaging system (eZIS) as an
adjunct to early-diagnosis of neurodegenerative diseases. J. Neurol. Sci. 2007, 260, 57–64. [CrossRef]158. Romero-Farina, G.; Aguadé-Bruix, S.; Candell-Riera, J.; Pizzi, M.N.; García-Dorado, D. Cut-off values of myocardial perfusion
gated-SPECT phase analysis parameters of normal subjects, and conduction and mechanical cardiac diseases. J. Nucl. Cardiol.2015, 22, 1247–1258. [CrossRef]
159. Flotats, A.; Carrió, I. Cardiac neurotransmission SPECT imaging. J. Nucl. Cardiol. 2004, 11, 587–602. [CrossRef]160. Simon, B.A. Non-invasive imaging of regional lung function using X-ray computed tomography. J. Clin. Monit. Comput. 2000, 16,
433–442. [CrossRef]161. Jorgensen, S.M.; Demirkaya, O.; Ritman, E.L. Three-dimensional imaging of vasculature and parenchyma in intact rodent organs
with X-ray micro-CT. Am. J. Physiol. Heart Circ. Physiol. 1998, 275, 1103–1114. [CrossRef]162. Kim, D.; Park, S.; Lee, J.H.; Jeong, Y.Y.; Jon, S. Antibiofouling polymer-coated gold nanoparticles as a contrast agent for in vivo
X-ray computed tomography imaging. J. Am. Chem. Soc. 2007, 129, 7661–7665. [CrossRef]163. Ricci, M.; Boldini, M.; Bonfante, E.; Sambugaro, E.; Vecchini, E.; Schenal, G.; Magnan, B.; Montemezzi, S. Cone-beam computed
tomography compared to X-ray in diagnosis of extremities bone fractures: A study of 198 cases. Eur. J. Radiol. Open 2019, 6,119–121. [CrossRef]
164. De Clerck, N.M.; Meurrens, K.; Weiler, H.; Van Dyck, D.; Vanhoutte, G.; Terpstra, P.; Postnov, A.A. High-resolution X-raymicrotomography for the detection of lung tumors in living mice. Neoplasia 2004, 6, 374–379. [CrossRef] [PubMed]
165. Zhou, Z.; Zhang, C.; Qian, Q.; Ma, J.; Huang, P.; Pan, L.; Gao, G.; Fu, H.; Fu, S.; Song, H.; et al. Folic acid-conjugated silica cappedgold nanoclusters for targeted fluorescence/X-ray computed tomography imaging. J. Nanobiotechnol. 2013, 11, 17. [CrossRef]
166. Zhang, C.; Zhou, Z.; Qian, Q.; Gao, G.; Li, C.; Feng, L.; Wang, Q.; Cui, D. Glutathione-capped fluorescent gold nanoclusters fordual-modal fluorescence/X-ray computed tomography imaging. J. Mater. Chem. B 2013, 1, 5045–5053. [CrossRef] [PubMed]
167. Popovtzer, R.; Agrawal, A.; Kotov, N.A.; Popovtzer, A.; Balter, J.; Carey, T.E.; Kopelman, R. Targeted gold nanoparticles enablemolecular CT imaging of cancer. Nano Lett. 2008, 8, 4593–4596. [CrossRef] [PubMed]
168. Liu, Y.; Welch, M.J. Nanoparticles labeled with positron emitting nuclides: Advantages, methods, and applications. BioconjugateChem. 2012, 23, 671–682. [CrossRef]

Biosensors 2022, 12, 478 78 of 87
169. Shukla, A.K.; Kumar, U. Positron emission tomography: An overview. J. Med. Phys. 2006, 31, 13–21. [CrossRef]170. Avril, N.; Menzel, M.; Dose, J.; Schelling, M.; Weber, W.; Jänicke, F.; Nathrath, W.; Schwaiger, M. Glucose metabolism of breast
cancer assessed by 18F-FDG PET: Histologic and immunohistochemical tissue analysis. J. Nucl. Med. 2001, 42, 9–16.171. Lortie, M.; Beanlands, R.S.; Yoshinaga, K.; Klein, R.; DaSilva, J.N.; deKemp, R.A. Quantification of myocardial blood flow with
82Rb dynamic PET imaging. Eur. J. Nucl. Med. Mol. Imaging 2007, 34, 1765–1774. [CrossRef]172. Buxton, D.B.; Nienaber, C.A.; Luxen, A.; Ratib, O.; Hansen, H.; Phelps, M.E.; Schelbert, H.R. Noninvasive quantitation of regional
myocardial oxygen consumption in vivo with [1-11C] acetate and dynamic positron emission tomography. Circulation 1989, 79,134–142. [CrossRef]
173. van Loon, J.; Janssen, M.H.; Öllers, M.; Aerts, H.J.; Dubois, L.; Hochstenbag, M.; Dingemans, A.M.C.; Lalisang, R.; Brans, B.;Windhorst, B.; et al. PET imaging of hypoxia using [18F] HX4: A phase I trial. Eur. J. Nucl. Med. Mol. Imaging 2010, 37, 1663–1668.[CrossRef]
174. Lapi, S.E.; Voller, T.F.; Welch, M.J. PET imaging of hypoxia. PET Clin. 2009, 4, 39–47. [CrossRef] [PubMed]175. Lewis, J.S.; Welch, M.J. PET imaging of hypoxia. Q. J. Nucl. Med. Mol. Imaging 2001, 45, 183–187.176. Shaffer, T.M.; Pratt, E.C.; Grimm, J. Utilizing the power of Cerenkov light with nanotechnology. Nat. Nanotechnol. 2017, 12,
106–117. [CrossRef] [PubMed]177. Dothager, R.S.; Goiffon, R.J.; Jackson, E.; Harpstrite, S.; Piwnica-Worms, D. Cerenkov radiation energy transfer (CRET) imaging:
A novel method for optical imaging of PET isotopes in biological systems. PLoS ONE 2010, 5, 13300. [CrossRef] [PubMed]178. Guo, H.; He, X.; Liu, M.; Zhang, Z.; Hu, Z.; Tian, J. Weight multispectral reconstruction strategy for enhanced reconstruction
accuracy and stability with Cerenkov luminescence tomography. IEEE Trans. Med. Imaging 2017, 36, 1337–1346. [CrossRef]179. Zhang, X.; Lam, S.K.; Palmer, G.; Das, S.; Oldham, M.; Dewhirst, M. Noninvasive measurement of tissue blood oxygenation with
Cerenkov imaging during therapeutic radiation delivery. Opt. Lett. 2017, 42, 3101–3104. [CrossRef]180. Cao, X.; Gunn, J.R.; Allu, S.R.; Bruza, P.; Jiang, S.; Vinogradov, S.A.; Pogue, B.W. Implantable sensor for local Cherenkov-excited
luminescence imaging of tumor pO2 during radiotherapy. J. Biomed. Opt. 2020, 25, 112704. [CrossRef]181. Richardson, J.C.; Bowtell, R.W.; Mäder, K.; Melia, C.D. Pharmaceutical applications of magnetic resonance imaging (MRI). Adv.
Drug Deliv. Rev. 2005, 57, 1191–1209. [CrossRef]182. Katti, G.; Ara, S.A.; Shireen, A. Magnetic resonance imaging (MRI)–A review. Int. J. Dent. Clin. 2011, 3, 65–70.183. Lee, S.W.; Hilal, S.K.; Cho, Z.H. A multinuclear magnetic resonance imaging technique-simultaneous proton and sodium imaging.
Magn. Reson. Imaging 1986, 4, 343–350. [CrossRef]184. Bachert, P.; Schad, L.R.; Bock, M.; Knopp, M.V.; Ebert, M.; Großmann, T.; Heil, W.; Hofmann, D.; Surkau, R.; Otten, E.W. Nuclear
magnetic resonance imaging of airways in humans with use of hyperpolarized 3He. Magn. Reason. Med. 1996, 36, 192–196.[CrossRef] [PubMed]
185. Albert, M.S.; Cates, G.D.; Driehuys, B.; Happer, W.; Saam, B.; Springer, C.S., Jr.; Wishnia, A. Biological magnetic resonanceimaging using laser-polarized 129Xe. Nature 1994, 370, 199–201. [CrossRef] [PubMed]
186. Seifert, A.C.; Wehrli, F.W. Solid-state quantitative 1H and 31P MRI of cortical bone in humans. Curr. Osteoporos. Rep. 2016, 14,77–86. [CrossRef] [PubMed]
187. Svyatova, A.; Skovpin, I.V.; Chukanov, N.V.; Kovtunov, K.V.; Chekmenev, E.Y.; Pravdivtsev, A.N.; Hövener, J.-B.; Koptyug, I.V.15N MRI of SLIC-SABRE Hyperpolarized 15N-Labelled Pyridine and Nicotinamide. Chem. Eur. J. 2019, 25, 8465–8470. [CrossRef][PubMed]
188. Fiat, D.; Hankiewicz, J.; Liu, S.; Trbovic, S.; Brint, S. 17O magnetic resonance imaging of the human brain. Neurol. Res. 2004, 26,803–808. [CrossRef] [PubMed]
189. Cho, M.H.; Shin, S.H.; Park, S.H.; Kadayakkara, D.K.; Kim, D.; Choi, Y. Targeted, stimuli-responsive, and theranostic 19F magneticresonance imaging probes. Bioconjugate Chem. 2019, 30, 2502–2518. [CrossRef] [PubMed]
190. Ruiz-Cabello, J.; Barnett, B.P.; Bottomley, P.A.; Bulte, J.W.M. Fluorine (19F) MRS and MRI in biomedicine. NMR Biomed. 2011, 24,114–129. [CrossRef]
191. Ferrauto, G.; Aime, S.; McMahon, M.T.; Morrow, J.R.; Snyder, E.M.; Li, A.; Bartha, R. Chemical exchange saturation transfer(CEST) contrast agents. In Contrast Agents for MRI: Experimental Methods, 1st ed.; Pierre, V.C., Allen, M.J., Eds.; Royal Society ofChemistry: Cambridge, UK, 2017; Volume 13, pp. 243–317.
192. Consolino, L.; Anemone, A.; Capozza, M.; Carella, A.; Irrera, P.; Corrado, A.; Dhakan, C.; Bracesco, M.; Longo, D.L. Non-invasiveinvestigation of tumor metabolism and acidosis by MRI-CEST imaging. Front. Oncol. 2020, 10, 161. [CrossRef]
193. Jones, K.M.; Pollard, A.C.; Pagel, M.D. Clinical applications of chemical exchange saturation transfer (CEST) MRI. J. Magn. Reson.Imaging 2018, 47, 11–27. [CrossRef]
194. Romdhane, F.; Villano, D.; Irrera, P.; Consolino, L.; Longo, D.L. Evaluation of a similarity anisotropic diffusion denoising approachfor improving in vivo CEST-MRI tumor pH imaging. Magn. Reson. Med. 2021, 85, 3479–3496. [CrossRef]
195. Rivlin, M.; Horev, J.; Tsarfaty, I.; Navon, G. Molecular imaging of tumors and metastases using chemical exchange saturationtransfer (CEST) MRI. Sci. Rep. 2013, 3, 3045. [CrossRef] [PubMed]
196. Rivlin, M.; Navon, G. Glucosamine and N-acetyl glucosamine as new CEST MRI agents for molecular imaging of tumors. Sci.Rep. 2016, 6, 32648. [CrossRef] [PubMed]
197. Harvey, P.; Blamire, A.M.; Wilson, J.I.; Finney, K.-L.N.; Funk, A.M.; Senanayake, P.K.; Parker, D. Moving the goal posts: Enhancingthe sensitivity of PARASHIFT proton magnetic resonance imaging and spectroscopy. Chem. Sci. 2013, 4, 4251–4258. [CrossRef]

Biosensors 2022, 12, 478 79 of 87
198. Yu, M.; Bouley, B.S.; Xie, D.; Enriquez, J.S.; Que, E.L. 19F PARASHIFT probes for magnetic resonance detection of H2O2 andperoxidase activity. J. Am. Chem. Soc. 2018, 140, 10546–10552. [CrossRef] [PubMed]
199. Ahmad, R.; Kuppusamy, P. Theory, instrumentation, and applications of electron paramagnetic resonance oximetry. Chem. Rev.2010, 110, 3212–3236. [CrossRef]
200. Epel, B.; Haney, C.R.; Hleihel, D.; Wardrip, C.; Barth, E.D.; Halpern, H.J. Electron paramagnetic resonance oxygen imaging of arabbit tumor using localized spin probe delivery. Med. Phys. 2010, 37, 2553–2559. [CrossRef]
201. Komarov, D.A.; Ichikawa, Y.; Yamamoto, K.; Stewart, N.J.; Matsumoto, S.; Yasui, H.; Kirilyuk, I.A.; Khramtsov, V.V.; Inanami, O.;Hirata, H. In vivo extracellular pH mapping of tumors using electron paramagnetic resonance. Anal. Chem. 2018, 90, 13938–13945.[CrossRef]
202. Swartz, H.M.; Williams, B.B.; Zaki, B.I.; Hartford, A.C.; Jarvis, L.A.; Chen, E.; Comi, R.J.; Ernstoff, M.S.; Hou, H.; Khan, N.; et al.Clinical EPR: Unique opportunities and some challenges. Acad. Radiol. 2014, 21, 197–206. [CrossRef]
203. Wu, L.C.; Zhang, Y.; Steinberg, G.; Qu, H.; Huang, S.; Cheng, M.; Bliss, T.; Du, F.; Rao, J.; Song, G.; et al. A review of magneticparticle imaging and perspectives on neuroimaging. Am. J. Neuroradiol. 2019, 40, 206–212. [CrossRef]
204. Graeser, M.; Knopp, T.; Szwargulski, P.; Friedrich, T.; Gladiss, A.V.; Kaul, M.; Krishnan, K.M.; Ittrich, H.; Adam, G.; Buzug, T.M.Towards picogram detection of superparamagnetic iron-oxide particles using a gradiometric receive coil. Sci. Rep. 2017, 7, 6872.[CrossRef]
205. Ferguson, R.M.; Khandhar, A.P.; Kemp, S.J.; Arami, H.; Saritas, E.U.; Croft, L.R.; Konkle, J.; Goodwill, P.W.; Halkola, A.; Rahmer,J.; et al. Magnetic particle imaging with tailored iron oxide nanoparticle tracers. IEEE Trans. Med. Imaging 2014, 34, 1077–1084.[CrossRef] [PubMed]
206. Lyon, L.A.; Keating, C.D.; Fox, A.P.; Baker, B.E.; He, L.; Nicewarner, S.R.; Mulvaney, S.P.; Natan, M.J. Raman spectroscopy. Anal.Chem. 1998, 70, 341–362. [CrossRef] [PubMed]
207. Mulvaney, S.P.; Keating, C.D. Raman spectroscopy. Anal. Chem. 2000, 72, 145–158. [CrossRef] [PubMed]208. Kumamoto, Y.; Harada, Y.; Takamatsu, T.; Tanaka, H. Label-free molecular imaging and analysis by Raman spectroscopy. Acta
Histochem. Cytochem. 2018, 51, 101–110. [CrossRef]209. Hagiwara, Y.; Yoshida, K.; Yoneda, A.; Torimoto, J.; Yamamoto, J. Experimental variable effects on laser heating of inclusions
during Raman spectroscopic analysis. Chem. Geol. 2021, 559, 119928. [CrossRef]210. Kneipp, K.; Haka, A.S.; Kneipp, H.; Badizadegan, K.; Yoshizawa, N.; Boone, C.; Shafer-Peltier, K.E.; Motz, J.T.; Dasari, R.R.; Feld,
M.S. Surface-enhanced Raman spectroscopy in single living cells using gold nanoparticles. Appl. Spectrosc. 2002, 56, 150–154.[CrossRef]
211. Qian, X.-M.; Nie, S.M. Single-molecule and single-nanoparticle SERS: From fundamental mechanisms to biomedical applications.Chem. Soc. Rev. 2008, 37, 912–920. [CrossRef]
212. Fikiet, M.A.; Khandasammy, S.R.; Mistek, E.; Ahmed, Y.; Halámková, L.; Bueno, J.; Lednev, I.K. Surface enhanced Ramanspectroscopy: A review of recent applications in forensic science. Spectrochim. Acta A Mol. Biomol. Spectrosc. 2018, 197, 255–260.[CrossRef]
213. De Jesus, M.A.; Giesfeldt, K.S.; Sepaniak, M.J. Use of a sample translation technique to minimize adverse effects of laser irradiationin surface-enhanced Raman spectrometry. Appl. Spectrosc. 2003, 57, 428–438. [CrossRef]
214. Cong, S.; Wang, Z.; Gong, W.; Chen, Z.; Lu, W.; Lombardi, J.R.; Zhao, Z. Electrochromic semiconductors as colorimetric SERSsubstrates with high reproducibility and renewability. Nat. Commun. 2019, 10, 678. [CrossRef]
215. Sjövall, P.; Lausmaa, J.; Johansson, B. Mass spectrometric imaging of lipids in brain tissue. Anal. Chem. 2004, 76, 4271–4278.[CrossRef] [PubMed]
216. Svatoš, A. Mass spectrometric imaging of small molecules. Trends Biotechnol. 2010, 28, 425–434. [CrossRef] [PubMed]217. de Hoffmann, E. Tandem mass spectrometry: A primer. J. Mass Spectrum. 1996, 31, 129–137. [CrossRef]218. Sullards, M.C.; Liu, Y.; Chen, Y.; Merrill, A.H., Jr. Analysis of mammalian sphingolipids by liquid chromatography tandem mass
spectrometry (LC-MS/MS) and tissue imaging mass spectrometry (TIMS). Biochim. Biophys. Acta Mol. Cell Biol. Lipids 2011, 1811,838–853. [CrossRef] [PubMed]
219. Konz, I.; Fernández, B.; Fernández, M.L.; Pereiro, R.; Sanz-Medel, A. Laser ablation ICP-MS for quantitative biomedicalapplications. Anal. Bioanal. Chem 2012, 403, 2113–2125. [CrossRef] [PubMed]
220. Van Malderen, S.J.M.; Laforce, B.; Van Acker, T.; Vincze, L.; Vanhaecke, F. Imaging the 3D trace metal and metalloid distributionin mature wheat and rye grains via laser ablation-ICP-mass spectrometry and micro-X-ray fluorescence spectrometry. J. Anal. At.Spectrom. 2017, 32, 289–298. [CrossRef]
221. Becker, J.S. Imaging of metals in biological tissue by laser ablation inductively coupled plasma mass spectrometry (LA–ICP–MS):State of the art and future developments. J. Mass. Spectrom. 2013, 48, 255–268. [CrossRef] [PubMed]
222. Oetjen, J.; Aichler, M.; Trede, D.; Strehlow, J.; Berger, J.; Heldmann, S.; Becker, M.; Gottschalk, M.; Kobarg, J.H.; Wirtz, S.; et al.MRI-compatible pipeline for three-dimensional MALDI imaging mass spectrometry using PAXgene fixation. J. Proteom. 2013, 90,52–60. [CrossRef]
223. Thiele, H.; Heldmann, S.; Trede, D.; Strehlow, J.; Wirtz, S.; Dreher, W.; Berger, J.; Oetjen, J.; Kobarg, J.H.; Fischer, B.; et al. 2D and3D MALDI-imaging: Conceptual strategies for visualization and data mining. Biochim. Biophys. Acta Proteins Proteom. 2014, 1844,117–137. [CrossRef]
Biosensors 2022, 12, 478 80 of 87
224. Siegel, T.P.; Hamm, G.; Bunch, J.; Cappell, J.; Fletcher, J.S.; Schwamborn, K. Mass spectrometry imaging and integration with otherimaging modalities for greater molecular understanding of biological tissues. Mol. Imaging Biol. 2018, 20, 888–901. [CrossRef]
225. Tata, A.; Zheng, J.; Ginsberg, H.J.; Jaffray, D.A.; Ifa, D.R.; Zarrine-Afsar, A. Contrast agent mass spectrometry imaging revealstumor heterogeneity. Anal. Chem. 2015, 87, 7683–7689. [CrossRef] [PubMed]
226. Santagata, S.; Eberlin, L.S.; Norton, I.; Calligaris, D.; Feldman, D.R.; Ide, J.L.; Liu, X.; Wiley, J.S.; Vestal, M.L.; Ramkissoon, S.H.;et al. Intraoperative mass spectrometry mapping of an onco-metabolite to guide brain tumor surgery. Proc. Natl. Acad. Sci. USA2014, 111, 11121–11126. [CrossRef] [PubMed]
227. Calligaris, D.; Norton, I.; Feldman, D.R.; Ide, J.L.; Dunn, I.F.; Eberlin, L.S.; Cooks, R.G.; Jolesz, F.A.; Golby, A.J.; Santagata, S.; et al.Mass spectrometry imaging as a tool for surgical decision-making. J. Mass Spectrom. 2013, 48, 1178–1187. [CrossRef] [PubMed]
228. Eberlin, L.S.; Norton, I.; Orringer, D.; Dunn, I.F.; Liu, X.; Ide, J.L.; Jarmusch, A.K.; Ligon, K.L.; Jolesz, F.A.; Golby, A.J.; et al.Ambient mass spectrometry for the intraoperative molecular diagnosis of human brain tumors. Proc. Natl. Acad. Sci. USA 2013,110, 1611–1616. [CrossRef] [PubMed]
229. Aichler, M.; Huber, K.; Schilling, F.; Lohöfer, F.; Kosanke, K.; Meier, R.; Rummeny, E.J.; Walch, A.; Wildgruber, M. SpatiallyResolved Quantification of Gadolinium (III)-Based Magnetic Resonance Agents in Tissue by MALDI Imaging Mass Spectrometryafter In Vivo MRI. Angew. Chem. 2015, 127, 4353–4357. [CrossRef]
230. Attia, A.S.; Schroeder, K.A.; Seeley, E.H.; Wilson, K.J.; Hammer, N.D.; Colvin, D.C.; Manier, M.L.; Nicklay, J.J.; Rose, K.L.; Gore,J.C.; et al. Monitoring the inflammatory response to infection through the integration of MALDI IMS and MRI. Cell Host Microbe2012, 11, 664–673. [CrossRef]
231. Sinha, T.K.; Khatib-Shahidi, S.; Yankeelov, T.E.; Mapara, K.; Ehtesham, M.; Cornett, D.S.; Dawant, B.M.; Caprioli, R.M.; Gore, J.C.Integrating spatially resolved three-dimensional MALDI IMS with in vivo magnetic resonance imaging. Nat. Methods 2008, 5,57–59. [CrossRef]
232. Becker, J.S.; Zoriy, M.; Matusch, A.; Wu, B.; Salber, D.; Palm, C.; Becker, J.S. Bioimaging of metals by laser ablation inductivelycoupled plasma mass spectrometry (LA-ICP-MS). Mass Spectrom. Rev. 2010, 29, 156–175. [CrossRef]
233. Becker, J.S.; Zoriy, M.; Dressler, V.L.; Wu, B.; Becker, J.S. Imaging of metals and metal-containing species in biological tissues andon gels by laser ablation inductively coupled plasma mass spectrometry (LA-ICP-MS): A new analytical strategy for applicationsin life sciences. Pure Appl. Chem. 2008, 80, 2643–2655. [CrossRef]
234. Becker, J.S.; Matusch, A.; Palm, C.; Salber, D.; Morton, K.A.; Becker, J.S. Bioimaging of metals in brain tissue by laser ablationinductively coupled plasma mass spectrometry (LA-ICP-MS) and metallomics. Metallomics 2010, 2, 104–111. [CrossRef]
235. Cruz-Alonso, M.; Lores-Padín, A.; Valencia, E.; González-Iglesias, H.; Fernández, B.; Pereiro, R. Quantitative mapping of specificproteins in biological tissues by laser ablation–ICP-MS using exogenous labels: Aspects to be considered. Anal. Bioanal. Chem.2019, 411, 549–558. [CrossRef] [PubMed]
236. O’Neill, E.S.; Kaur, A.; Bishop, D.P.; Shishmarev, D.; Kuchel, P.W.; Grieve, S.M.; Figtree, G.A.; Renfrew, A.K.; Bonnitcha, P.D.; New,E.J. Hypoxia-responsive cobalt complexes in tumor spheroids: Laser ablation inductively coupled plasma mass spectrometry andmagnetic resonance imaging studies. Inorg. Chem. 2017, 56, 9860–9868. [CrossRef] [PubMed]
237. Hester, S.C.; Kuriakose, M.; Nguyen, C.D.; Mallidi, S. Role of ultrasound and photoacoustic imaging in photodynamic therapy forcancer. Photochem. Photobiol. 2020, 96, 260–279. [CrossRef]
238. Meng, Z.; Zhou, X.; She, J.; Zhang, Y.; Feng, L.; Liu, Z. Ultrasound-responsive conversion of microbubbles to nanoparticles toenable background-free in vivo photoacoustic imaging. Nano Lett. 2019, 19, 8109–8117. [CrossRef] [PubMed]
239. Sun, Y.Y.; Li, Y.; Wali, B.; Li, Y.; Lee, J.; Heinmiller, A.; Abe, K.; Stein, D.G.; Mao, H.; Sayeed, I.; et al. Prophylactic edaravoneprevents transient hypoxic-ischemic brain injury: Implications for perioperative neuroprotection. Stroke 2015, 46, 1947–1955.[CrossRef] [PubMed]
240. Wang, S.; Zhao, Y.; Xu, Y. Recent advances in applications of multimodal ultrasound-guided photoacoustic imaging technology.Vis. Comput. Ind. Biomed. Art 2020, 3, 1–12. [CrossRef] [PubMed]
241. Zafar, H.; Breathnach, A.; Subhash, H.M.; Leahy, M.J. Linear-array-based photoacoustic imaging of human microcirculation witha range of high frequency transducer probes. J. Biomed. Opt. 2014, 20, 051021. [CrossRef]
242. Needles, A.; Heinmiller, A.; Sun, J.; Theodoropoulos, C.; Bates, D.; Hirson, D.; Yin, M.; Foster, F.S. Development and initialapplication of a fully integrated photoacoustic micro-ultrasound system. IEEE Trans. Ultrason. Ferroelectr. Freq. Control 2013, 60,888–897. [CrossRef]
243. Gerling, M.; Zhao, Y.; Nania, S.; Norberg, K.J.; Verbeke, C.S.; Englert, B.; Kuiper, R.V.; Bergström, A.; Hassan, M.; Neesse, A.; et al.Real-time assessment of tissue hypoxia in vivo with combined photoacoustics and high-frequency ultrasound. Theranostics 2014,4, 604–613. [CrossRef]
244. Packer, D.L.; Stevens, C.L.; Curley, M.G.; Bruce, C.J.; Miller, F.A.; Khandheria, B.K.; Oh, J.K.; Sinak, L.J.; Seward, J.B. Intracardiacphased-array imaging. J. Am. Coll. Cardiol. 2002, 39, 509–516. [CrossRef]
245. Chiou, R.K.; Anderson, J.C.; Tran, T.; Patterson, R.H.; Wobig, R.; Taylor, R.J. Evaluation of urethral strictures and associatedabnormalities using high-resolution and color Doppler ultrasound. Urology 1996, 47, 102–107. [CrossRef]
246. Bercoff, J.; Montaldo, G.; Loupas, T.; Savery, D.; Mézière, F.; Fink, M.; Tanter, M. Ultrafast compound Doppler imaging: Providingfull blood flow characterization. IEEE Trans. Ultrason. Ferroelectr. Freq. Control 2011, 58, 134–147. [CrossRef] [PubMed]
247. Silverman, R.H.; Kruse, D.E.; Coleman, D.J.; Ferrara, K.W. High-resolution ultrasonic imaging of blood flow in the anteriorsegment of the eye. Investig. Ophthalmol. Vis. Sci. 1999, 40, 1373–1381.

Biosensors 2022, 12, 478 81 of 87
248. Keša, P.; Pokorná, E.; Grajciarová, M.; Tonar, Z.; Vocková, P.; Trochet, P.; Kopecek, M.; Jakša, R.; Šefc, L.; Klener, P. Quantita-tive in vivo monitoring of hypoxia and vascularization of patient-derived murine xenografts of mantle cell lymphoma usingphotoacoustic and ultrasound imaging. Ultrasound Med. Biol. 2021, 47, 1099–1107. [CrossRef] [PubMed]
249. Shah, A.; Bush, N.; Box, G.; Eccles, S.; Bamber, J. Value of combining dynamic contrast enhanced ultrasound and optoacoustictomography for hypoxia imaging. Photoacoustics 2017, 8, 15–27. [CrossRef] [PubMed]
250. Mallidi, S.; Watanabe, K.; Timerman, D.; Schoenfeld, D.; Hasan, T. Prediction of tumor recurrence and therapy monitoring usingultrasound-guided photoacoustic imaging. Theranostics 2015, 5, 289–301. [CrossRef]
251. Murer, A.M.; Hirschmann, M.T.; Amsler, F.; Rasch, H.; Huegli, R.W. Bone SPECT/CT has excellent sensitivity and specificity fordiagnosis of loosening and patellofemoral problems after total knee arthroplasty. Knee Surg. Sports Traumatol. Arthrosc. 2020, 28,1029–1035. [CrossRef]
252. Bouziotis, P.; Fiorini, C. SPECT/MRI: Dreams or reality? Clin. Transl. Imaging 2014, 2, 571–573. [CrossRef]253. Devreux, M.; Henoumont, C.; Dioury, F.; Boutry, S.; Vacher, O.; Elst, L.V.; Port, M.; Muller, R.N.; Sandre, O.; Laurent, S. Mn2+
Complexes with Pyclen-Based Derivatives as Contrast Agents for Magnetic Resonance Imaging: Synthesis and RelaxometryCharacterization. Inorg. Chem. 2021, 60, 3604–3619. [CrossRef]
254. Gale, E.M.; Atanasova, I.P.; Blasi, F.; Ay, I.; Caravan, P. A manganese alternative to gadolinium for MRI contrast. J. Am. Chem. Soc.2015, 137, 15548–15557. [CrossRef]
255. Wang, J.; Wang, H.; Ramsay, I.A.; Erstad, D.J.; Fuchs, B.C.; Tanabe, K.K.; Caravan, P.; Gale, E.M. Manganese-based contrast agentsfor magnetic resonance imaging of liver tumors: Structure–activity relationships and lead candidate evaluation. J. Med. Chem.2018, 61, 8811–8824. [CrossRef] [PubMed]
256. Gao, H.; Liu, X.; Tang, W.; Niu, D.; Zhou, B.; Zhang, H.; Liu, W.; Gu, B.; Zhou, X.; Zheng, Y.; et al. 99mTc-conjugatedmanganese-based mesoporous silica nanoparticles for SPECT, pH-responsive MRI and anti-cancer drug delivery. Nanoscale 2016,8, 19573–19580. [CrossRef] [PubMed]
257. Gianolio, E.; Maciocco, L.; Imperio, D.; Giovenzana, G.B.; Simonelli, F.; Abbas, K.; Bisi, G.; Aime, S. Dual MRI-SPECT agent forpH-mapping. Chem. Commun. 2011, 47, 1539–1541. [CrossRef] [PubMed]
258. van Beek, E.J.; Hoffman, E.A. Functional imaging: CT and MRI. Clin. Chest Med. 2008, 29, 195–216. [CrossRef] [PubMed]259. Kovács, A.; Palásti, P.; Veréb, D.; Bozsik, B.; Palkó, A.; Kincses, Z.T. The sensitivity and specificity of chest CT in the diagnosis of
COVID-19. Eur. Radiol. 2021, 31, 2819–2824. [CrossRef]260. Stucht, D.; Danishad, K.A.; Schulze, P.; Godenschweger, F.; Zaitsev, M.; Speck, O. Highest resolution in vivo human brain MRI
using prospective motion correction. PLoS ONE 2015, 10, 0133921. [CrossRef]261. Hill, D.L.; Hawkes, D.J.; Crossman, J.E.; Gleeson, M.J.; Cox, T.C.S.; Bracey, E.E.C.M.L.; Strong, A.J.; Graves, P. Registration of MR
and CT images for skull base surgery using point-like anatomical features. Br. J. Radiol. Suppl. 1991, 64, 1030–1035. [CrossRef]262. Lee, Y.S.; Seon, J.K.; Shin, V.I.; Kim, G.-H.; Jeon, M. Anatomical evaluation of CT-MRI combined femoral model. Biomed. Eng.
Online 2008, 7, 6. [CrossRef]263. Czeibert, K.; Baksa, G.; Grimm, A.; Nagy, S.A.; Kubinyi, E.; Petneházy, Ö. MRI, CT and high resolution macro-anatomical images
with cryosectioning of a Beagle brain: Creating the base of a multimodal imaging atlas. PLoS ONE 2019, 14, 0213458. [CrossRef]264. Fan, Y.; Tu, W.; Shen, M.; Chen, X.; Ning, Y.; Li, J.; Chen, T.; Wang, H.; Yin, F.; Liu, Y.; et al. Targeted tumor hypoxia dual-mode
CT/MR imaging and enhanced radiation therapy using dendrimer-based nanosensitizers. Adv. Funct. Mater. 2020, 30, 1909285.[CrossRef]
265. Lee, N.; Cho, H.R.; Oh, M.H.; Lee, S.H.; Kim, K.; Kim, B.H.; Shin, K.; Ahn, T.Y.; Choi, J.W.; Kim, Y.W.; et al. MultifunctionalFe3O4/TaOx Core/Shell nanoparticles for simultaneous magnetic resonance imaging and X-ray computed tomography. J. Am.Chem. Soc. 2012, 134, 10309–10312. [CrossRef] [PubMed]
266. Frullano, L.; Catana, C.; Benner, T.; Sherry, A.D.; Caravan, P. Bimodal MR–PET agent for quantitative pH imaging. Angew. Chem.Int. Ed. 2010, 49, 2382–2384. [CrossRef] [PubMed]
267. Longo, D.L.; Bartoli, A.; Consolino, L.; Bardini, P.; Arena, F.; Schwaiger, M.; Aime, S. In vivo imaging of tumor metabolism andacidosis by combining PET and MRI-CEST pH imaging. Cancer Res. 2016, 76, 6463–6470. [CrossRef] [PubMed]
268. Murano, T.; Tateishi, U.; Iinuma, T.; Shimada, N.; Daisaki, H.; Terauchi, T.; Moriyama, N.; Inoue, T. Evaluation of the risk ofradiation exposure from new 18FDG PET/CT plans versus conventional X-ray plans in patients with pediatric cancers. Ann. Nucl.Med. 2010, 24, 261–267. [CrossRef] [PubMed]
269. Bernsdorf, M.; Berthelsen, A.K.; Wielenga, V.T.; Kroman, N.; Teilum, D.; Binderup, T.; Tange, U.B.; Andersson, M.; Kjær, A.; Loft,A.; et al. Preoperative PET/CT in early-stage breast cancer. Ann. Oncol. 2012, 23, 2277–2282. [CrossRef]
270. Paydary, K.; Seraj, S.M.; Zadeh, M.Z.; Emamzadehfard, S.; Shamchi, S.P.; Gholami, S.; Werner, T.J.; Alavi, A. The evolving role ofFDG-PET/CT in the diagnosis, staging, and treatment of breast cancer. Mol. Imaging Biol. 2019, 21, 1–10. [CrossRef]
271. Denko, N.C. Hypoxia, HIF1 and glucose metabolism in the solid tumour. Nat. Rev. Cancer 2008, 8, 705–713. [CrossRef]272. Zeng, W.; Liu, P.; Pan, W.; Singh, S.R.; Wei, Y. Hypoxia and hypoxia inducible factors in tumor metabolism. Cancer Lett. 2015, 356,
263–267. [CrossRef]273. Zegers, C.M.; Van Elmpt, W.; Reymen, B.; Even, A.J.; Troost, E.G.; Öllers, M.C.; Hoebers, F.J.; Houben, R.M.; Eriksson, J.;
Windhorst, A.D.; et al. In vivo quantification of hypoxic and metabolic status of NSCLC tumors using [18F] HX4 and [18F]FDG-PET/CT imaging. Clin. Cancer Res. 2014, 20, 6389–6397. [CrossRef]

Biosensors 2022, 12, 478 82 of 87
274. Chen, L.; Zhang, Z.; Kolb, H.C.; Walsh, J.C.; Zhang, J.; Guan, Y. 18F-HX4 hypoxia imaging with PET/CT in head and neck cancer:A comparison with 18F-FMISO. Nucl. Med. Commun. 2012, 33, 1096–1102. [CrossRef]
275. Mortensen, L.S.; Johansen, J.; Kallehauge, J.; Primdahl, H.; Busk, M.; Lassen, P.; Alsner, J.; Sørensen, B.S.; Toustrup, K.; Jakobsen, S.;et al. FAZA PET/CT hypoxia imaging in patients with squamous cell carcinoma of the head and neck treated with radiotherapy:Results from the DAHANCA 24 trial. Radiother. Oncol. 2012, 105, 14–20. [CrossRef] [PubMed]
276. Attia, A.B.E.; Balasundaram, G.; Moothanchery, M.; Dinish, U.S.; Bi, R.; Ntziachristos, V.; Olivo, M. A review of clinicalphotoacoustic imaging: Current and future trends. Photoacoustics 2019, 16, 100144. [CrossRef] [PubMed]
277. Attia, A.B.E.; Chuah, S.Y.; Razansky, D.; Ho, C.J.H.; Malempati, P.; Dinish, U.S.; Bi, R.; Fu, C.Y.; Ford, S.J.; Lee, J.S.-S.; et al.Noninvasive real-time characterization of non-melanoma skin cancers with handheld optoacoustic probes. Photoacoustics 2017, 7,20–26. [CrossRef]
278. Kim, J.; Park, S.; Jung, Y.; Chang, S.; Park, J.; Zhang, Y.; Lovell, J.F.; Kim, C. Programmable real-time clinical photoacoustic andultrasound imaging system. Sci. Rep. 2016, 6, 35137. [CrossRef]
279. Zavaleta, C.L.; Smith, B.R.; Walton, I.; Doering, W.; Davis, G.; Shojaei, B.; Natan, M.J.; Gambhir, S.S. Multiplexed imaging ofsurface enhanced Raman scattering nanotags in living mice using noninvasive Raman spectroscopy. Proc. Natl. Acad. Sci. USA2009, 106, 13511–13516. [CrossRef] [PubMed]
280. Wu, X.; Xia, Y.; Huang, Y.; Li, J.; Ruan, H.; Chen, T.; Luo, L.; Shen, Z.; Wu, A. Improved SERS-active nanoparticles with variousshapes for CTC detection without enrichment process with supersensitivity and high specificity. ACS Appl. Mater. Interfaces 2016,8, 19928–19938. [CrossRef] [PubMed]
281. Ramya, A.N.; Joseph, M.M.; Nair, J.B.; Karunakaran, V.; Narayanan, N.; Maiti, K.K. New insight of tetraphenylethylene-basedRaman signatures for targeted SERS nanoprobe construction toward prostate cancer cell detection. ACS Appl. Mater. Interfaces2016, 8, 10220–10225. [CrossRef] [PubMed]
282. Dinish, U.S.; Song, Z.; Ho, C.J.H.; Balasundaram, G.; Attia, A.B.E.; Lu, X.; Tang, B.Z.; Liu, B.; Olivo, M. Single molecule with dualfunction on nanogold: Biofunctionalized construct for in vivo photoacoustic imaging and SERS biosensing. Adv. Funct. Mater.2015, 25, 2316–2325. [CrossRef]
283. Shi, W.; Paproski, R.J.; Shao, P.; Forbrich, A.; Lewis, J.D.; Zemp, R.J. Multimodality Raman and photoacoustic imaging ofsurface-enhanced-Raman-scattering-targeted tumor cells. J. Biomed. Opt. 2016, 21, 020503. [CrossRef]
284. López-Lázaro, M. Dual role of hydrogen peroxide in cancer: Possible relevance to cancer chemoprevention and therapy. CancerLett. 2007, 252, 1–8. [CrossRef]
285. Li, Q.; Ge, X.; Ye, J.; Li, Z.; Su, L.; Wu, Y.; Yang, H.; Song, J. Dual Ratiometric SERS and Photoacoustic Core–Satellite Nanoprobefor Quantitatively Visualizing Hydrogen Peroxide in Inflammation and Cancer. Angew. Chem. Int. Ed. 2021, 60, 7323–7332.[CrossRef] [PubMed]
286. Gertsenshteyn, I.; Epel, B.; Barth, E.; Leoni, L.; Markiewicz, E.; Tsai, H.M.; Fan, X.; Giurcanu, M.; Bodero, D.; Zamora, M.; et al.Improving Tumor Hypoxia Location in 18F-Misonidazole PET with Dynamic Contrast-enhanced MRI Using Quantitative ElectronParamagnetic Resonance Partial Oxygen Pressure Images. Radiol. Imaging Cancer 2021, 3, 200104. [CrossRef] [PubMed]
287. Tseytlin, M.; Stolin, A.V.; Guggilapu, P.; Bobko, A.A.; Khramtsov, V.V.; Tseytlin, O.; Raylman, R.R. A combined positron emissiontomography (PET)-electron paramagnetic resonance imaging (EPRI) system: Initial evaluation of a prototype scanner. Phys. Med.Biol. 2018, 63, 105010. [CrossRef] [PubMed]
288. Kim, H.; Epel, B.; Sundramoorthy, S.; Tsai, H.-M.; Barth, E.; Gertsenshteyn, I.; Halpern, H.; Hua, Y.; Xie, Q.; Chen, C.-T.; et al.Development of a PET/EPRI combined imaging system for assessing tumor hypoxia. J. Instrum. 2021, 16, P03031. [CrossRef][PubMed]
289. Liu, Y.; Lv, X.; Liu, H.; Zhou, Z.; Huang, J.; Lei, S.; Cai, S.; Chen, Z.; Guo, Y.; Chen, Z.; et al. Porous gold nanocluster-decoratedmanganese monoxide nanocomposites for microenvironment-activatable MR/photoacoustic/CT tumor imaging. Nanoscale 2018,10, 3631–3638. [CrossRef]
290. Wang, Y.; Song, S.; Lu, T.; Cheng, Y.; Song, Y.; Wang, S.; Tan, F.; Li, J.; Li, N. Oxygen-supplementing mesoporous polydopaminenanosponges with WS2 QDs-embedded for CT/MSOT/MR imaging and thermoradiotherapy of hypoxic cancer. Biomaterials2019, 220, 119405. [CrossRef]
291. Wang, S.; You, Q.; Wang, J.; Song, Y.; Cheng, Y.; Wang, Y.; Yang, S.; Yang, L.; Li, P.; Lu, Q.; et al. MSOT/CT/MR imaging-guidedand hypoxia-maneuvered oxygen self-supply radiotherapy based on one-pot MnO2-mSiO2@ Au nanoparticles. Nanoscale 2019,11, 6270–6284. [CrossRef]
292. Hu, X.; Tang, Y.; Hu, Y.; Lu, F.; Lu, X.; Wang, Y.; Li, J.; Li, Y.; Ji, Y.; Wang, W.; et al. Gadolinium-chelated conjugated polymer-basednanotheranostics for photoacoustic/magnetic resonance/NIR-II fluorescence imaging-guided cancer photothermal therapy.Theranostics 2019, 9, 4168–4181. [CrossRef]
293. Huang, Q.; Wang, K.; Wanggou, S.; Tian, J.; Li, X. A novel co-targeting strategy of EGFR/SEC61G for multi-modality fluores-cence/MR/photoacoustic imaging of glioblastoma. Nanomed. Nanotechnol. Biol. Med. 2022, 40, 102509. [CrossRef]
294. Wang, Y.; Pang, X.; Wang, J.; Cheng, Y.; Song, Y.; Sun, Q.; You, Q.; Tan, F.; Li, J.; Li, N. Magnetically-targeted and nearinfrared fluorescence/magnetic resonance/photoacoustic imaging-guided combinational anti-tumor phototherapy based onpolydopamine-capped magnetic Prussian blue nanoparticles. J. Mater. Chem. B 2018, 6, 2460–2473. [CrossRef]

Biosensors 2022, 12, 478 83 of 87
295. Tian, R.; Zhu, L.; Qin, Z.; Wang, G.; Wang, J.; Zhang, H. Glypican-3 (GPC3) targeted Fe3O4 core/Au shell nanocomplex forfluorescence/MRI/photoacoustic imaging-guided tumor photothermal therapy. Biomater. Sci. 2019, 7, 5258–5269. [CrossRef][PubMed]
296. Xu, S.; Shi, X.; Chu, C.; Liu, G. A TME-activated in situ nanogenerator for magnetic resonance/fluorescence/photoacousticimaging. Meth. Enzymol. 2021, 657, 145–156.
297. Li, Q.; Ren, J.; Chen, Q.; Liu, W.; Xu, Z.; Cao, Y.; Kang, Y.; Xue, P. A HMCuS@MnO2 nanocomplex responsive to multi-ple tumor environmental clues for photoacoustic/fluorescence/magnetic resonance trimodal imaging-guided and enhancedphotothermal/photodynamic therapy. Nanoscale 2020, 12, 12508–12521. [CrossRef] [PubMed]
298. Tropiano, M.; Faulkner, S. A lanthanide based sensor for the time-gated detection of hydrogen sulfide. Chem. Commun. 2014, 50,4696–4698. [CrossRef]
299. Jin, D.; Piper, J.A. Time-gated luminescence microscopy allowing direct visual inspection of lanthanide-stained microorganismsin background-free condition. Anal. Chem. 2011, 83, 2294–2300. [CrossRef]
300. Zhang, K.Y.; Yu, Q.; Wei, H.; Liu, S.; Zhao, Q.; Huang, W. Long-lived emissive probes for time-resolved photoluminescencebioimaging and biosensing. Chem. Rev. 2018, 118, 1770–1839. [CrossRef]
301. Song, B.; Liu, Q.; Ma, H.; Tang, Z.; Liu, C.; Zou, J.; Tan, M.; Yuan, J. Tumor-targetable magnetoluminescent silica nanoparticles forbimodal time-gated luminescence/magnetic resonance imaging of cancer cells in vitro and in vivo. Talanta 2020, 220, 121378.[CrossRef]
302. Song, B.; Shi, W.; Shi, W.; Qin, X.; Ma, H.; Tan, M.; Zhang, W.; Guo, L.; Yuan, J. A dual-modal nanoprobe based on Eu(III)complex–MnO2 nanosheet nanocomposites for time-gated luminescence–magnetic resonance imaging of glutathione in vitro andin vivo. Nanoscale 2019, 11, 6784–6793. [CrossRef]
303. Tu, C.; Nagao, R.; Louie, A.Y. Multimodal magnetic-resonance/optical-imaging contrast agent sensitive to NADH. Angew. Chem.Int. Ed. 2009, 48, 6547–6551. [CrossRef]
304. Sowers, M.A.; McCombs, J.R.; Wang, Y.; Paletta, J.T.; Morton, S.W.; Dreaden, E.C.; Boska, M.D.; Ottaviani, M.F.; Hammond, P.T.;Rajca, A.; et al. Redox-responsive branched-bottlebrush polymers for in vivo MRI and fluorescence imaging. Nat. Commun. 2014,5, 5460. [CrossRef]
305. Zhao, Z.; Fan, H.; Zhou, G.; Bai, H.; Liang, H.; Wang, R.; Zhang, X.; Tan, W. Activatable fluorescence/MRI bimodal platform fortumor cell imaging via MnO2 nanosheet–aptamer nanoprobe. J. Am. Chem. Soc. 2014, 136, 11220–11223. [CrossRef] [PubMed]
306. Yuan, D.; Ding, L.; Sun, Z.; Li, X. MRI/Fluorescence bimodal amplification system for cellular GSH detection and tumor cellimaging based on manganese dioxide nanosheet. Sci. Rep. 2018, 8, 1747. [CrossRef] [PubMed]
307. Zhong, H.; Yu, S.; Li, B.; He, K.; Li, D.; Wang, X.; Wu, Y.-X. Two-photon fluorescence and MR bio-imaging of endogenous H2O2 inthe tumor microenvironment using a dual-mode nanoprobe. Chem. Commun. 2021, 57, 6288–6291. [CrossRef] [PubMed]
308. Hsu, B.Y.W.; Ng, M.; Tan, A.; Connell, J.; Roberts, T.; Lythgoe, M.; Zhang, Y.; Wong, S.Y.; Bhakoo, K.; Seifalian, A.M.; et al.pH-Activatable MnO-Based Fluorescence and Magnetic Resonance Bimodal Nanoprobe for Cancer Imaging. Adv. Healthc. Mater.2016, 5, 721–729. [CrossRef]
309. Hu, J.; Liu, T.; Zhang, G.; Jin, F.; Liu, S. Synergistically enhance magnetic resonance/fluorescence imaging performance ofresponsive polymeric nanoparticles under mildly acidic biological milieu. Macromol. Rapid Commun. 2013, 34, 749–758. [CrossRef]
310. Yu, K.-K.; Li, K.; Lu, C.-Y.; Xie, Y.-M.; Liu, Y.-H.; Zhou, Q.; Bao, J.-K.; Yu, X.-Q. Multifunctional gold nanoparticles as smartnanovehicles with enhanced tumour-targeting abilities for intracellular pH mapping and in vivo MR/fluorescence imaging.Nanoscale 2020, 12, 2002–2010. [CrossRef]
311. Jiang, L.; Zhou, Q.; Mu, K.; Xie, H.; Zhu, Y.; Zhu, W.; Zhao, Y.; Xu, H.; Yang, X. pH/temperature sensitive magnetic nanogelsconjugated with Cy5.5-labled lactoferrin for MR and fluorescence imaging of glioma in rats. Biomaterials 2013, 34, 7418–7428.[CrossRef]
312. Gallagher, F.A. An introduction to functional and molecular imaging with MRI. Clin. Radiol. 2010, 65, 557–566. [CrossRef]313. Srinivas, M.; Heerschap, A.; Ahrens, E.T.; Figdor, C.G.; de Vries, I.J.M. 19F MRI for quantitative in vivo cell tracking. Trends
Biotechnol. 2010, 28, 363–370. [CrossRef]314. Li, Y.; Zhang, H.; Guo, C.; Hu, G.; Wang, L. Multiresponsive nanoprobes for turn-on fluorescence/19F MRI dual-modal imaging.
Anal. Chem. 2020, 92, 11739–11746. [CrossRef]315. Chen, S.; Yang, Y.; Li, H.; Zhou, X.; Liu, M. pH-Triggered Au-fluorescent mesoporous silica nanoparticles for 19F MR/fluorescent
multimodal cancer cellular imaging. Chem. Commun. 2014, 50, 283–285. [CrossRef] [PubMed]316. Kadakia, R.T.; Xie, D.; Martinez, D., Jr.; Yu, M.; Que, E.L. A dual-responsive probe for detecting cellular hypoxia using 19F
magnetic resonance and fluorescence. Chem. Commun. 2019, 55, 8860–8863. [CrossRef] [PubMed]317. Wu, J.; Ye, Z.; Wu, F.; Wang, H.; Zeng, L.; Bao, G.-M. A rhodamine-based fluorescent probe for colorimetric and fluorescence
lighting-up determination of toxic thiophenols in environmental water and living cells. Talanta 2018, 181, 239–247. [CrossRef][PubMed]
318. Kaushik, R.; Singh, A.; Ghosh, A.; Jose, D.A. Selective colorimetric sensor for the detection of Hg2+ and H2S in aqueous mediumand waste water samples. ChemistrySelect 2016, 1, 1533–1540. [CrossRef]
319. Li, C.; Numata, M.; Takeuchi, M.; Shinkai, S. A sensitive colorimetric and fluorescent probe based on a polythiophene derivativefor the detection of ATP. Angew. Chem. 2005, 117, 6529–6532. [CrossRef]

Biosensors 2022, 12, 478 84 of 87
320. Rao, H.; Ge, H.; Wang, X.; Zhang, Z.; Liu, X.; Yang, Y.; Liu, Y.; Liu, W.; Zou, P.; Wang, Y. Colorimetric and fluorometric detection ofprotamine by using a dual-mode probe consisting of carbon quantum dots and gold nanoparticles. Microchim. Acta 2017, 184,3017–3025. [CrossRef]
321. Chao, J.; Song, K.; Zhang, Y.; Yin, C.; Huo, F.; Wang, J.; Zhang, T. A pyrene-based colorimetric and fluorescent pH probe withlarge stokes shift and its application in bioimaging. Talanta 2018, 189, 150–156. [CrossRef]
322. Yang, P.; Zhu, Z.; Zhang, T.; Zhang, W.; Chen, W.; Cao, Y.; Chen, M.; Zhou, X. Orange-emissive carbon quantum dots: Towardapplication in wound pH monitoring based on colorimetric and fluorescent changing. Small 2019, 15, 1902823. [CrossRef]
323. Tsourdi, E.; Barthel, A.; Rietzsch, H.; Reichel, A.; Bornstein, S.R. Current aspects in the pathophysiology and treatment of chronicwounds in diabetes mellitus. Biomed. Res. Int. 2013, 2013, 385641. [CrossRef]
324. Payen, V.L.; Brisson, L.; Dewhirst, M.W.; Sonveaux, P. Common responses of tumors and wounds to hypoxia. Cancer J. 2015, 21,75–87. [CrossRef]
325. Singh, V.K.; Yadav, P.K.; Chandra, S.; Bano, D.; Talat, M.; Hasan, S.H. Peroxidase mimetic activity of fluorescent NS-carbonquantum dots and their application in colorimetric detection of H2O2 and glutathione in human blood serum. J. Mater. Chem. B2018, 6, 5256–5268. [CrossRef] [PubMed]
326. Weiss, S. Fluorescence spectroscopy of single biomolecules. Science 1999, 283, 1676–1683. [CrossRef]327. Eggeling, C.; Widengren, J.; Rigler, R.; Seidel, C.A.M. Photobleaching of fluorescent dyes under conditions used for single-
molecule detection: Evidence of two-step photolysis. Anal. Chem. 1998, 70, 2651–2659. [CrossRef] [PubMed]328. Porter, M.D.; Lipert, R.J.; Siperko, L.M.; Wang, G.; Narayanan, R. SERS as a bioassay platform: Fundamentals, design, and
applications. Chem. Soc. Rev. 2008, 37, 1001–1011. [CrossRef] [PubMed]329. Wang, Y.; Seebald, J.L.; Szeto, D.P.; Irudayaraj, J. Biocompatibility and biodistribution of surface-enhanced Raman scattering
nanoprobes in zebrafish embryos: In vivo and multiplex imaging. ACS Nano 2010, 4, 4039–4053. [CrossRef] [PubMed]330. Niu, X.; Chen, H.; Wang, Y.; Wang, W.; Sun, X.; Chen, L. Upconversion fluorescence-SERS dual-mode tags for cellular and in vivo
imaging. ACS Appl. Mater. Interfaces 2014, 6, 5152–5160. [CrossRef]331. Lee, S.; Chon, H.; Yoon, S.-Y.; Lee, E.K.; Chang, S.-I.; Lim, D.W.; Choo, J. Fabrication of SERS-fluorescence dual modal nanoprobes
and application to multiplex cancer cell imaging. Nanoscale 2012, 4, 124–129. [CrossRef]332. Bamrungsap, S.; Treetong, A.; Apiwat, C.; Wuttikhun, T.; Dharakul, T. SERS-fluorescence dual mode nanotags for cervical cancer
detection using aptamers conjugated to gold-silver nanorods. Microchim. Acta 2016, 183, 249–256. [CrossRef]333. Wang, Z.; Zong, S.; Chen, H.; Wang, C.; Xu, S.; Cui, Y. SERS-Fluorescence Joint Spectral Encoded Magnetic Nanoprobes for
Multiplex Cancer Cell Separation. Adv. Healthc. Mater. 2014, 3, 1889–1897. [CrossRef]334. Saranya, G.; Joseph, M.M.; Karunakaran, V.; Nair, J.B.; Saritha, V.N.; Veena, V.S.; Sujathan, K.; Ajayaghosh, A.; Maiti, K.K.
Enzyme-driven switchable fluorescence-SERS diagnostic nanococktail for the multiplex detection of lung cancer biomarkers.ACS Appl. Mater. Interfaces 2018, 10, 38807–38818. [CrossRef]
335. Truman, L.K.; Comby, S.; Gunnlaugsson, T. pH-Responsive Luminescent Lanthanide-Functionalized Gold Nanoparticles with“On–Off” Ytterbium Switchable Near-Infrared Emission. Angew. Chem. 2012, 124, 9762–9765. [CrossRef]
336. Thomas, K.G.; Kamat, P.V. Chromophore-functionalized gold nanoparticles. Acc. Chem. Res. 2003, 36, 888–898. [CrossRef][PubMed]
337. Xu, J.; Yu, H.; Hu, Y.; Chen, M.; Shao, S. A gold nanoparticle-based fluorescence sensor for high sensitive and selective detectionof thiols in living cells. Biosens. Bioelectron. 2016, 75, 1–7. [CrossRef] [PubMed]
338. Engel, S.; Fritz, E.-C.; Ravoo, B.J. New trends in the functionalization of metallic gold: From organosulfur ligands to N-heterocycliccarbenes. Chem. Soc. Rev. 2017, 46, 2057–2075. [CrossRef]
339. Mahato, K.; Nagpal, S.; Shah, M.A.; Srivastava, A.; Maurya, P.K.; Roy, S.; Jaiswal, A.; Singh, R.; Chandra, P. Gold nanoparticlesurface engineering strategies and their applications in biomedicine and diagnostics. 3 Biotech 2019, 9, 57. [CrossRef]
340. Yao, W.; Chang, L.; Yin, W.; Wang, T.; Yang, Y.; Yin, P.; Yang, M.; Ma, Y.; Qin, Y.; Ma, H. One immunoassay probe makes SERS andfluorescence two readout signals: Rapid imaging and determination of intracellular glutathione levels. Spectrochim. Acta A 2019,223, 117303. [CrossRef]
341. Yang, G.; Zhang, Q.; Liang, Y.; Liu, H.; Qu, L.-L.; Li, H. Fluorescence-SERS dual-signal probes for pH sensing in live cells. ColloidsSurf. A Physicochem. Eng. Asp. 2019, 562, 289–295. [CrossRef]
342. Reshetnikov, V.; Daum, S.; Janko, C.; Karawacka, W.; Tietze, R.; Alexiou, C.; Paryzhak, S.; Dumych, T.; Bilyy, R.; Tripal, P.;et al. ROS-Responsive N-Alkylaminoferrocenes for Cancer-Cell-Specific Targeting of Mitochondria. Angew. Chem. 2018, 130,12119–12122. [CrossRef]
343. Lim, S.H.; Wu, L.; Burgess, K.; Lee, H.B. New cytotoxic rosamine derivatives selectively accumulate in the mitochondria of cancercells. Anticancer Drugs 2009, 20, 461–468. [CrossRef]
344. Eling, C.J.; Price, T.W.; Marshall, A.R.L.; Viscomi, F.N.; Robinson, P.; Firth, G.; Adawi, A.M.; Bouillard, J.-S.G.; Stasiuk, G.J.A Dual-Modal SERS/Fluorescence Gold Nanoparticle Probe for Mitochondrial Imaging. ChemPlusChem 2017, 82, 674–680.[CrossRef]
345. Yue, S.; Sun, X.; Wang, N.; Wang, Y.; Wang, Y.; Xu, Z.; Chen, M.; Wang, J. SERS–fluorescence dual-mode pH-sensing methodbased on Janus microparticles. ACS Appl. Mater. Interfaces 2017, 9, 39699–39707. [CrossRef] [PubMed]
346. Ahn, Y.J.; Gil, Y.-G.; Lee, Y.J.; Jang, H.; Lee, G.-J. A dual-mode colorimetric and SERS detection of hydrogen sulfide in live prostatecancer cells using a silver nanoplate-coated paper assay. Microchem. J. 2020, 155, 104724. [CrossRef]

Biosensors 2022, 12, 478 85 of 87
347. Lin, D.; Zhou, J.; Yu, Y.; Chen, W.; Liao, P.-H.; Huang, H.; Kong, K.V. A dual-mode biosensor combining transition metalcarbonyl-based SERS and a colorimetric readout for thiol detection. Anal. Methods 2019, 11, 5232–5236. [CrossRef]
348. Li, M.; Li, H.; Wu, Q.; Niu, N.; Huang, J.; Zhang, L.; Li, Y.; Wang, D.; Tang, B.Z. Hypoxia-activated probe for NIR fluorescence andphotoacoustic dual-mode tumor imaging. iScience 2021, 24, 102261. [CrossRef] [PubMed]
349. Tian, Y.; Jiang, W.-L.; Wang, W.-X.; Mao, G.-J.; Li, Y.; Li, C.-Y. NAD(P)H-triggered probe for dual-modal imaging during energymetabolism and novel strategy of enhanced photothermal therapy in tumor. Biomaterials 2021, 271, 120736. [CrossRef] [PubMed]
350. Tsogas, G.Z.; Kappi, F.A.; Vlessidis, A.G.; Giokas, D.L. Recent advances in nanomaterial probes for optical biothiol sensing: Areview. Anal. Lett. 2018, 51, 443–468. [CrossRef]
351. Anees, P.; Joseph, J.; Sreejith, S.; Menon, N.V.; Kang, Y.; Yu, S.W.-K.; Ajayaghosh, A.; Zhao, Y. Real time monitoring of aminothiollevel in blood using a near-infrared dye assisted deep tissue fluorescence and photoacoustic bimodal imaging. Chem. Sci. 2016, 7,4110–4116. [CrossRef]
352. Lin, J.; Lee, I.-M.; Song, Y.; Cook, N.R.; Selhub, J.; Manson, J.E.; Buring, J.E.; Zhang, S.M. Plasma homocysteine and cysteine andrisk of breast cancer in women. Cancer Res. 2010, 70, 2397–2405. [CrossRef]
353. Miller, J.W.; Beresford, S.A.A.; Neuhouser, M.L.; Cheng, T.-Y.D.; Song, X.; Brown, E.C.; Zheng, Y.; Rodriguez, B.; Green, R.; Ulrich,C.M. Homocysteine, cysteine, and risk of incident colorectal cancer in the Women’s Health Initiative observational cohort. Am. J.Clin. Nutr. 2013, 97, 827–834. [CrossRef]
354. Goodman, M.T.; McDuffie, K.; Hernandez, B.; Wilkens, L.R.; Selhub, J. Case-control study of plasma folate, homocysteine, vitaminB12, and cysteine as markers of cervical dysplasia. Cancer 2000, 89, 376–382. [CrossRef]
355. Fang, H.; Chen, Y.; Wang, Y.; Geng, S.; Yao, S.; Song, D.; He, W.; Guo, Z. A dual-modal probe for NIR fluorogenic and ratiometricphotoacoustic imaging of Cys/Hcy in vivo. Sci. China Chem. 2020, 63, 699–706. [CrossRef]
356. Chen, Z.; Mu, X.; Han, Z.; Yang, S.; Zhang, C.; Guo, Z.; Bai, Y.; He, W. An optical/photoacoustic dual-modality probe: Ratiometricin/ex vivo imaging for stimulated H2S upregulation in mice. J. Am. Chem. Soc. 2019, 141, 17973–17977. [CrossRef] [PubMed]
357. Nguyen, V.N.; Ha, J.; Cho, M.; Li, H.; Swamy, K.M.K.; Yoon, J. Recent developments of BODIPY-based colorimetric and fluorescentprobes for the detection of reactive oxygen/nitrogen species and cancer diagnosis. Coordin. Chem. Rev. 2021, 439, 213936.[CrossRef]
358. Griendling, K.K.; Touyz, R.M.; Zweier, J.L.; Dikalov, S.; Chilian, W.; Chen, Y.-R.; Harrison, D.G.; Bhatnagar, A. Measurementof reactive oxygen species, reactive nitrogen species, and redox-dependent signaling in the cardiovascular system: A scientificstatement from the American Heart Association. Circ. Res. 2016, 119, e39–e75. [CrossRef]
359. Weber, J.; Bollepalli, L.; Belenguer, A.M.; Di Antonio, M.; De Mitri, N.; Joseph, J.; Balasubramanian, S.; Hunter, C.A.; Bohndiek,S.E. An activatable cancer-targeted hydrogen peroxide probe for photoacoustic and fluorescence imaging. Cancer Res. 2019, 79,5407–5417. [CrossRef]
360. Chen, X.; Ren, X.; Zhang, L.; Liu, Z.; Hai, Z. Mitochondria-targeted fluorescent and photoacoustic imaging of hydrogen peroxidein inflammation. Anal. Chem. 2020, 92, 14244–14250. [CrossRef]
361. Wang, S.; Li, Z.; Liu, Y.; Feng, G.; Zheng, J.; Yuan, Z.; Zhang, X. Activatable photoacoustic and fluorescent probe of nitric oxide forcellular and in vivo imaging. Sens. Actuators B Chem. 2018, 267, 403–411. [CrossRef]
362. Szabo, C.; Coletta, C.; Chao, C.; Módis, K.; Szczesny, B.; Papapetropoulos, A.; Hellmich, M.R. Tumor-derived hydrogen sulfide,produced by cystathionine-β-synthase, stimulates bioenergetics, cell proliferation, and angiogenesis in colon cancer. Proc. Natl.Acad. Sci. USA 2013, 110, 12474–12479. [CrossRef]
363. Cai, W.-J.; Wang, M.-J.; Ju, L.-H.; Wang, C.; Zhu, Y.-C. Hydrogen sulfide induces human colon cancer cell proliferation: Role ofAkt, ERK and p21. Cell Biol. Int. 2010, 34, 565–572. [CrossRef]
364. Rose, P.; Moore, P.K.; Ming, S.H.; Nam, O.C.; Armstrong, J.S.; Whiteman, M. Hydrogen sulfide protects colon cancer cells fromchemopreventative agent β-phenylethyl isothiocyanate induced apoptosis. World J. Gastroenterol. 2005, 11, 3990–3997. [CrossRef]
365. Zhang, J.; Wen, G.; Wang, W.; Cheng, K.; Guo, Q.; Tian, S.; Liu, C.; Hu, H.; Zhang, Y.; Zhang, H.; et al. Controllable cleavage ofC–N bond-based fluorescent and photoacoustic dual-modal probes for the detection of H2S in living mice. ACS Appl. Bio Mater.2020, 4, 2020–2025. [CrossRef] [PubMed]
366. Chen, Q.; Liu, X.; Chen, J.; Zeng, J.; Cheng, Z.; Liu, Z. A self-assembled albumin-based nanoprobe for in vivo ratiometricphotoacoustic pH imaging. Adv. Mater. 2015, 27, 6820–6827. [CrossRef] [PubMed]
367. Meng, X.; Li, W.; Sun, Z.; Zhang, J.; Zhou, L.; Deng, G.; Gong, P.; Cai, L. Tumor-targeted small molecule for dual-modalimaging-guided phototherapy upon near-infrared excitation. J. Mater. Chem. B 2017, 5, 9405–9411. [CrossRef] [PubMed]
368. Mu, H.; Miki, K.; Harada, H.; Tanaka, K.; Nogita, K.; Ohe, K. pH-activatable cyanine dyes for selective tumor imaging usingnear-infrared fluorescence and photoacoustic modalities. ACS Sens. 2021, 6, 123–129. [CrossRef]
369. Liu, X.; Gong, X.; Yuan, J.; Fan, X.; Zhang, X.; Ren, T.; Yang, S.; Yang, R.; Yuan, L.; Zhang, X.-B. Dual-stimulus responsivenear-infrared reversible ratiometric fluorescent and photoacoustic probe for in vivo tumor imaging. Anal. Chem. 2021, 93,5420–5429. [CrossRef]
370. Basal, L.A.; Yan, Y.; Shen, Y.; Haacke, E.M.; Mehrmohammadi, M.; Allen, M.J. Oxidation-responsive, EuII/III-based, multimodalcontrast agent for magnetic resonance and photoacoustic imaging. ACS Omega 2017, 2, 800–805. [CrossRef]
371. Chen, F.; Teng, L.; Lu, C.; Zhang, C.; Rong, Q.; Zhao, Y.; Yang, Y.; Wang, Y.; Song, G.; Zhang, X. Activatable magnetic/photoacousticnanoplatform for redox-unlocked deep-tissue molecular imaging in vivo via Prussian blue nanoprobe. Anal. Chem. 2020, 92,13452–13461. [CrossRef]

Biosensors 2022, 12, 478 86 of 87
372. Yan, C.; Liu, D.; An, L.; Wang, Y.; Tian, Q.; Lin, J.; Yang, S. Magnetic–photoacoustic dual-mode probe for the visualization of H2Sin colorectal cancer. Anal. Chem. 2020, 92, 8254–8261. [CrossRef]
373. Rich, L.J.; Damasco, J.A.; Bulmahn, J.C.; Kutscher, H.L.; Prasad, P.N.; Seshadri, M. Photoacoustic and magnetic resonance imagingof hybrid manganese dioxide-coated ultra-small NaGdF4 nanoparticles for spatiotemporal modulation of hypoxia in head andneck cancer. Cancers 2020, 12, 3294. [CrossRef]
374. Hu, X.; Zhan, C.; Tang, Y.; Lu, F.; Li, Y.; Pei, F.; Lu, X.; Ji, Y.; Li, J.; Wang, W.; et al. Intelligent polymer–MnO2 nanoparticles fordual-activatable photoacoustic and magnetic resonance bimodal imaging in living mice. Chem. Commun. 2019, 55, 6006–6009.[CrossRef]
375. Liang, G.; Han, J.; Xing, D. Precise Tumor Photothermal Therapy Guided and Monitored by Magnetic Resonance/PhotoacousticImaging using A Safe and pH-Responsive Fe(III) Complex. Adv. Healthc. Mater. 2021, 10, 2001300. [CrossRef] [PubMed]
376. Sun, X.; Du, R.; Zhang, L.; Zhang, G.; Zheng, X.; Qian, J.; Tian, X.; Zhou, J.; He, J.; Wang, Y.; et al. A pH-responsive yolk-likenanoplatform for tumor targeted dual-mode magnetic resonance imaging and chemotherapy. ACS Nano 2017, 11, 7049–7059.[CrossRef] [PubMed]
377. Zhu, H.; Zhang, L.; Liu, Y.; Zhou, Y.; Wang, K.; Xie, X.; Song, L.; Wang, D.; Han, C.; Chen, Q. Aptamer-PEG-modified Fe3O4@Mnas a novel T1- and T2-dual-model MRI contrast agent targeting hypoxia-induced cancer stem cells. Sci. Rep. 2016, 6, 39245.[CrossRef]
378. Zhu, W.; Liu, Y.; Yang, Z.; Zhang, L.; Xiao, L.; Liu, P.; Wang, J.; Yi, C.; Xu, Z.; Ren, J. Albumin/sulfonamide stabilized ironporphyrin metal organic framework nanocomposites: Targeting tumor hypoxia by carbonic anhydrase IX inhibition and T1–T2dual mode MRI guided photodynamic/photothermal therapy. J. Mater. Chem. B 2018, 6, 265–276. [CrossRef] [PubMed]
379. Kim, M.-H.; Son, H.-Y.; Kim, G.-Y.; Park, K.; Huh, Y.-M.; Haam, S. Redoxable heteronanocrystals functioning magnetic relaxationswitch for activatable T1 and T2 dual-mode magnetic resonance imaging. Biomaterials 2016, 101, 121–130. [CrossRef]
380. Sun, X.; Zhang, G.; Du, R.; Xu, R.; Zhu, D.; Qian, J.; Bai, G.; Yang, C.; Zhang, Z.; Zhang, X.; et al. A biodegradable MnSiO3@ Fe3O4nanoplatform for dual-mode magnetic resonance imaging guided combinatorial cancer therapy. Biomaterials 2019, 194, 151–160.[CrossRef] [PubMed]
381. Jin, L.; Liu, J.; Tang, Y.; Cao, L.; Zhang, T.; Yuan, Q.; Wang, Y.; Zhang, H. MnO2-Functionalized Co–P nanocomposite: A newtheranostic agent for pH-triggered T1/T2 dual-modality magnetic resonance imaging-guided chemo-photothermal synergistictherapy. ACS Appl. Mater. Interfaces 2017, 9, 41648–41658. [CrossRef]
382. Ekanger, L.A.; Polin, L.A.; Shen, Y.; Haacke, E.M.; Allen, M.J. Evaluation of EuII-based positive contrast enhancement afterintravenous, intraperitoneal, and subcutaneous injections. Contrast Media Mol. Imaging 2016, 11, 299–303. [CrossRef]
383. Corbin, B.A.; Basal, L.A.; White, S.A.; Shen, Y.; Haacke, E.M.; Fishbein, K.W.; Allen, M.J. Screening of ligands for redox-activeeuropium using magnetic resonance imaging. Bioorg. Med. Chem. 2018, 26, 5274–5279. [CrossRef]
384. Prosser, K.E.; Xie, D.; Chu, A.; MacNeil, G.A.; Varju, B.R.; Kadakia, R.T.; Que, E.L.; Walsby, C.J. Copper(II) Pyridyl Aminophe-nolates: Hypoxia-Selective, Nucleus-Targeting Cytotoxins, and Magnetic Resonance Probes. Chem. Eur. J. 2021, 27, 9839–9849.[CrossRef]
385. Shearer, J.; Soh, P. The copper(II) adduct of the unstructured region of the amyloidogenic fragment derived from the human prionprotein is redox-active at physiological pH. Inorg. Chem. 2007, 46, 710–719. [CrossRef] [PubMed]
386. Wang, H.; Jordan, V.C.; Ramsay, I.A.; Sojoodi, M.; Fuchs, B.C.; Tanabe, K.K.; Caravan, P.; Gale, E.M. Molecular magnetic resonanceimaging using a redox-active iron complex. J. Am. Chem. Soc. 2019, 141, 5916–5925. [CrossRef] [PubMed]
387. O’Neill, H.A.; Gakh, O.; Park, S.; Cui, J.; Mooney, S.M.; Sampson, M.; Ferreira, G.C.; Isaya, G. Assembly of human frataxin is amechanism for detoxifying redox-active iron. Biochemistry 2005, 44, 537–545. [CrossRef] [PubMed]
388. Tsitovich, P.B.; Spernyak, J.A.; Morrow, J.R. A redox-activated MRI contrast agent that switches between paramagnetic anddiamagnetic states. Angew. Chem. Int. Ed. 2013, 52, 13997–14000. [CrossRef]
389. Bernhardt, P.V.; Chen, K.I.; Sharpe, P.C. Transition metal complexes as mediator-titrants in protein redox potentiometry. J. Biol.Inorg. Chem. 2006, 11, 930–936. [CrossRef]
390. Loving, G.S.; Mukherjee, S.; Caravan, P. Redox-activated manganese-based MR contrast agent. J. Am. Chem. Soc. 2013, 135,4620–4623. [CrossRef]
391. Batinic-Haberle, I.; Tovmasyan, A.; Spasojevic, I. Mn porphyrin-based redox-active drugs: Differential effects as cancer therapeu-tics and protectors of normal tissue against oxidative injury. Antioxid. Redox Signal. 2018, 29, 1691–1724. [CrossRef]
392. Tsitovich, P.B.; Burns, P.J.; McKay, A.M.; Morrow, J.R. Redox-activated MRI contrast agents based on lanthanide and transitionmetal ions. J. Inorg. Biochem. 2014, 133, 143–154. [CrossRef]
393. Basal, L.A.; Bailey, M.D.; Romero, J.; Ali, M.M.; Kurenbekova, L.; Yustein, J.T.; Pautler, R.G.; Allen, M.J. Fluorinated EuII-basedmultimodal contrast agent for temperature- and redox-responsive magnetic resonance imaging. Chem. Sci. 2017, 8, 8345–8350.[CrossRef]
394. Gianolio, E.; Napolitano, R.; Fedeli, F.; Arena, F.; Aime, S. Poly-β-cyclodextrin based platform for pH mapping via a ratiometric19F/1H MRI method. Chem. Commun. 2009, 40, 6044–6046. [CrossRef]
395. Tang, X.; Gong, X.; Ming, J.; Chen, D.; Lin, H.; Gao, J. Fluorinated Gadolinium Chelate-Grafted Nanoconjugates for Contrast-Enhanced T1-Weighted 1H and pH-Activatable 19F Dual-Modal MRI. Anal. Chem. 2020, 92, 16293–16300. [CrossRef] [PubMed]
396. Ekanger, L.A.; Ali, M.M.; Allen, M.J. Oxidation-responsive Eu2+/3+-liposomal contrast agent for dual-mode magnetic resonanceimaging. Chem. Commun. 2014, 50, 14835–14838. [CrossRef] [PubMed]

Biosensors 2022, 12, 478 87 of 87
397. Funk, A.M.; Jordan, V.C.; Sherry, A.D.; Ratnakar, S.J.; Kovacs, Z. Oxidative conversion of a europium(II)-based T1 agent intoa europium(III)-based paraCEST agent that can be detected in vivo by magnetic resonance imaging. Angew. Chem. 2016, 128,5108–5111. [CrossRef]
398. Ekanger, L.A.; Mills, D.R.; Ali, M.M.; Polin, L.A.; Shen, Y.; Haacke, E.M.; Allen, M.J. Spectroscopic characterization of the 3+ and2+ oxidation states of europium in a macrocyclic tetraglycinate complex. Inorg. Chem. 2016, 55, 9981–9988. [CrossRef]
399. Sun, W.; Li, M.; Fan, J.; Peng, X. Activity-based sensing and theranostic probes based on photoinduced electron transfer. Acc.Chem. Res. 2019, 52, 2818–2831. [CrossRef]
400. Wanderi, K.; Cui, Z. Organic fluorescent nanoprobes with NIR-IIb characteristics for deep learning. Exploration 2022, 2, 20210097.[CrossRef]


![kkt_6_dan_7_pemupukan_2014 [Compatibility Mode]](https://static.fdokumen.com/doc/165x107/6322b43c28c445989105e2db/kkt6dan7pemupukan2014-compatibility-mode.jpg)