
drowsiness detection for driver - ShareOK
75
DROWSINESS DETECTION FOR DRIVER ASSISTANCE By EYOSIYAS TADESSE Bachelor of Science in Electrical Engineering Jimma University Jimma, Ethiopia 2010 Submitted to the Faculty of the Graduate College of the Oklahoma State University in partial fulfillment of the requirements for the Degree of MASTER OF SCIENCE December, 2013
-
Upload
khangminh22 -
Category
Documents
-
view
2 -
download
0
Transcript of drowsiness detection for driver - ShareOK

DROWSINESS DETECTION FOR DRIVER
ASSISTANCE
By
EYOSIYAS TADESSE
Bachelor of Science in Electrical Engineering
Jimma University
Jimma, Ethiopia
2010
Submitted to the Faculty of the
Graduate College of the
Oklahoma State University
in partial fulfillment of
the requirements for
the Degree of
MASTER OF SCIENCE
December, 2013

ii
DROWSINESS DETECTION FOR DRIVER
ASSISTANCE
Thesis Approved:
Dr. Weihua Sheng
Thesis Adviser
Dr. Guoliang Fan
Dr. Damon Chandler
.

iii
Name: EYOSIYAS TADESSE
Date of Degree: DECEMBER, 2013
Title of Study: DROWSINESS DETECTION FOR DRIVER ASSISTANCE
Major Field: ELECTRICAL ENGINEERING
Abstract: This thesis presents a noninvasive approach to detect drowsiness of drivers
using behavioral and vehicle based measuring techniques. The system accepts stream of
driver’s images from a camera and steering wheel movement from G-27 Logitech racing
wheel system. It first describes a standalone implementation of the behavioral based
drowsiness detection method. The method accepts the input images and analyzes the
facial expressions of the driver through sets of processing stages. In order to improve the
reliability of the system, we also proposed a comprehensive approach of combining the
facial expression analysis with a steering wheel data analysis in decision level as well as
feature level integration. We also presented a new approach of modeling the temporal
information of facial expressions of drowsiness using HMM. Each proposed approach
has been implemented in a simulated driving setup. The detection performance of each
method is evaluated through experiments and its parameter settings were optimized.
Finally we present a case study which discusses the practicality of our system in a small-
scaled intelligent transportation system where it switches the driving mechanism between
manual and autonomous control depending on the state of the driver.
iv
TABLE OF CONTENTS
Chapter Page
I. INTRODUCTION ..................................................................................................1
1.1.Motivations ..................................................................................................1
1.2.Challenges ....................................................................................................2
1.3.Contributions ...............................................................................................3
II. RELATED WORK .................................................................................................6
2.1.Vehicle Based Measuring Techniques .........................................................6
2.2.Physiological Measuring Techniques ..........................................................8
2.3.Behavioral Measuring Techniques ..............................................................9
2.4.Hybrid Systems ..........................................................................................12
III.. DROWSINESS DETECTION BASED ON FACIAL EXPRESSION ...............14
3.1.Face Detection and Tracking .....................................................................15
3.2.Feature Extraction ......................................................................................18
3.3.Feature Selection ........................................................................................18
3.4.Classification..............................................................................................20
IV.DROWSINESS DETECTION THROUGH INTEGRATION OF FACIAL
EXPRESSION AND STEERING WHEEL MOVEMENT ............................24
4.1.Steering Wheel Data Analysis ...................................................................24
4.2.Overall Approach .......................................................................................26
4.3.Decision Level Integration .........................................................................27
4.4.Feature Level Integration ...........................................................................29
V.DROWSINESS DETECTION THROUGH HMM-BASED DYNAMIC MODELING
..........................................................................................................................31
5.1.Hidden Markov Models .............................................................................32
5.2.Feature Discretization ................................................................................33
5.3.Drowsiness Detection Using HMM ..........................................................35

v
Chapter Page
VI. EXPERIMENTS AND RESULTS .......................................................................37
6.1.Experimental Setup .....................................................................................37
6.2.Experimental Procedures .............................................................................39
6.2.1 Facial Expression Based Drowsiness Detection ............................39
6.2.2 Integration Based Drowsiness Detection .......................................41
6.2.3 HMM Based Drowsiness Detection...............................................42
6.3.Experimental Results ...................................................................................43
6.3.1 Facial Expression vs. Integration Based Drowsiness Detection ....43
6.3.2 Single Frame vs. HMM Based Drowsiness Detection...................50
7 APPLICATION OF DROWSINESS DETECTION IN DRIVER ASSISTANT
SYSTEMS............................................................................................................55
7.1.Small-scaled ITS Testbed ..........................................................................55
7.2.Manual to Autonomous Switching Control ...............................................58
8 CONCLUSIONS AND FUTURE WORK ............................................................60
8.1.Conclusion .................................................................................................60
8.2.Future Work ...............................................................................................61
8.3.Further Research Opportunities .................................................................62
REFERENCES ............................................................................................................64

vi
LIST OF TABLES
Table Page
1. Adaboost Algorithm............................................................................................20
2. Confusion matrices for decision level integration ..............................................47
3. Maximum classification accuracy for facial expression vs. integrated approaches
.............................................................................................................................49
4. Maximum classification accuracy for single frame vs. HMM based approaches
.............................................................................................................................54

vii
LIST OF FIGURES
Figure Page
1. The system diagram of drowsiness detection using facial expression ................15
2. Procedures of localizing the face region .............................................................16
3. Face Detection and Tracking ..............................................................................17
4. Classification Decision for N feature vectors using Adaboost ...........................21
5. Classification Decision for N feature vectors using SVM ..................................23
6. Steering wheel data with time increment of50ms. ..............................................25
7. Steering Wheel data analysis ..............................................................................26
8. Overall System Diagram .....................................................................................27
9. Decision Level Integration ..................................................................................28
10. Feature Level Integration ....................................................................................29
11. Feature Discretization using K-means and EM clustering .................................34
12. The system diagram of drowsiness detection using HMM dynamic modeling
.............................................................................................................................36
13. Experimental Setup .............................................................................................37
14. Driver view in the SimuRide software................................................................38
15. User Interface of Drowsiness Detection System ................................................39
16. Gabor filter bank with 2 scales and 4 orientations ..............................................40
17. Classification accuracy for averaging threshold computation ............................44
18. Classification accuracy for searching maximum threshold computation ...........45
19. Classification Accuracy for Steering Wheel Data Analysis ...............................46
20. Classification accuracy for decision level integration ........................................47
21. Classification accuracy for feature level integration ..........................................49
22. Classification accuracy for single frame based drowsiness detection ................51
23. Classification accuracy for 2 hidden states .........................................................52
24. Classification accuracy for 4 hidden states .........................................................52
25. Classification accuracy for 8 hidden states .........................................................53
26. Classification accuracy for 12 hidden states .......................................................53
27. Classification accuracy for 16 hidden states .......................................................53
28. Classification accuracy for 20 hidden states .......................................................53
29. Overview of the ITS testbed ...............................................................................56
30. Hardware setup of manual driving ......................................................................57
31. Manual/Autonomous switching experimental setup ...........................................58
32. Trajectories of the RC car ...................................................................................59

1
CHAPTER I
INTRODUCTION
1.1. Motivations
Drowsiness is one of the main causes of severe traffic accidents occurring in our daily life.
According to the US National Highway Traffic Safety Administration, approximately 100,000
crashes occur in US each year due to drivers’ drowsiness resulting in an estimated 1,550 deaths,
71,000 injuries and $12.5 billion losses [1]. Another report [2] states that the US government and
businesses spend an estimated $60.4 billion per year on accidents related to drowsy driving and it
also costs the consumer about $16.4 billion in terms of property damages, health claims, lost time
and productivity due to drowsy driving. In 2010, the National Sleep Foundation (NSF) reported
that 54% adult drivers had driven a vehicle while feeling drowsy and 28% had actually fallen
asleep[3]. The German Road Safety Council (DVR) claims that one in four highway traffic
fatalities are a result of momentary driver drowsiness [4].
The tremendous casualties, injuries and property damages caused by drowsiness call for a notable
initiative in developing an effective system that can detect drowsiness and take proper measures
before accidents could occur. The U.S. Department of Transportation has also progressed in the
making of intelligent vehicles in an effort to prevent such accidents [2]. With the increasing
interest towards intelligent transportation systems, the development of robust and practical
drowsiness detection system is a crucial step. Many researches are being conducted with the aim .
2
of finding drowsiness detection techniques that are not only affordable for public use but also
capable of real-time detection with appreciable accuracy.
Motor companies like Toyota, Ford, Mercedes-Benz and others are also currently employing car
safety technologies to prevent accidents from happening when the driver is getting drowsy. This
trend is expected to make the cars smarter and significantly reduce the accidents caused by
drowsiness of drivers. Adhering to these endeavors, our research is motivated by the statistical
significance of accidents due to drowsiness and provides an improved and systematic approach to
drowsiness detection.
1.2. Challenges
While the ongoing researches have shown promising advancements, there are still core challenges
yet to be addressed. They have used behavioral or physiological changes of the driver and sensing
the various responses of the vehicle to the driver’s actions as ways of detecting drowsiness. While
each method has its own merits and attributes, it also has drawbacks that pose a challenge in
making it practical and efficient.
Behavioral measures pertain to the visual information of the driver and are highly affected by the
lighting condition, the quality of the measuring device and other external factors. Physiological
changes include variation of pulse rate, brain waves or electric signals of body muscles. While
such measures could potentially give accurate indication of fatigue, they are highly affected by
artifacts. Vehicle based measures such as vehicle speed, steering activity and lane deviation are
highly affected by external factors and are unreliable to effectively detect drowsiness of drivers.
One obvious possibility to remedy this issue is to improve the measuring devices and processing
methods which many researchers have been trying to deal with. Another possible method is not
only improving the measuring methods but also combining them in a complementary way to
increase their reliability as a unit on which only little has been done.

3
Another main challenge is in setting a criterion as to how to define the critical events of interest
when accepting the input data. For vehicle based measures, for example, these events may
include steering movements with little or no corrections and frequent macro corrections (both
could indicate drowsiness). In behavioral measures, such events that could indicate drowsiness
could include muscle movements in the detected face as whole, the eyes region or the mouth
region. Another subtle challenge that goes hand in hand with defining the input parameters is
specifying the optimum time window to state the drowsiness of the driver as early as a critical
event has been detected. This can only be evaluated through experimentation and there exists an
unavoidable tradeoff between speed and accuracy of prediction. On one hand, if the time window
is too short, the system may be merely detecting “noise,” and may therefore generate excessive
number of false positives. On the other hand, if the time window is too long, the system may be
too slow to be of any practical use.
In our thesis, we have proposed a novel approach of drowsiness detection and addressed the
different challenges through sensor integration, parameter optimization, feature selection and
modeling.
1.3. Contributions
Our main objective is to come up with noninvasive, cost effective and efficient drowsiness
detection system that can easily be implemented in driver monitoring systems of actual vehicles.
We have primarily implemented behavioral based drowsiness detection method through facial
expression recognition. Many of the previous research works and commercially available
behavioral measuring methods mainly focus on eye closure and not on other facial expressions.
While notable results can be achieved through the analysis of eye closure, including other facial
motions and behavioral changes could give more reliability to the system which our research
focuses on.

4
In an effort to further increase the reliability of the behavioral based drowsiness detection system,
we integrated it with a vehicle based analysis of steering wheel movement in independent as well
as comprehensive approaches. Many of the previous works have mainly focused on developing a
drowsiness detection method using one of the two approaches and not so much has been done on
their integration. Our thesis presents a systematic approach of developing an integrated
drowsiness detection algorithm, implementing it and assessing its effectiveness in various virtual
driving scenarios. We explore different ways of integration and input processing techniques and
optimize the different system parameters to maximize the accuracy and speed of detection. By
accepting stream of images of the driver’s facial movements and the car controller data including
the steering wheel activity, the system can determine the status of the driver as drowsy or non-
drowsy.
We have also proposed a new method of modeling the dynamics of facial expressions of a driver
during drowsy and non-drowsy episodes. The facial expression based drowsiness detection
method initially proposed uses a single frame based static classifier which does not consider the
temporal information of the sequences of frames. This method uses dynamic classifier to model
the temporal information of the sequences of frames and gives decision according to the transition
of facial expression in the sequences of frames.
The system gives decision in real time and hence can easily be integrated with car safety systems
to alarm the driver, undertake safety measures or switch between manual and autonomous
driving. We first implemented the algorithm in a simulated driving setup and evaluated its
performance through experimental results. Later, we implemented the system as client application
connected to a server equipped with indoor localization and racing wheel system. The server is
connected to RC cars that can be controlled manually using the racing wheel system as well as
autonomously by generating commands from the server based on a designed trajectory. Our
system gives a real-time decision of the state of the driver to the server and the server will switch

5
the control between manual and autonomous driving according to the decision. The experimental
results from the implementation are satisfactory and have shown the practicality of our system.
The remainder of this thesis is organized as follows:
Chapter II. Presents a comprehensive review on various literatures of previous and current
works on drowsiness detection, relevant findings and successful methodologies that have
been implemented in drowsiness detection systems.
Chapter III. Describes the overall approach and the algorithm procedures of behavioral based
drowsiness detection system through facial expression recognition.
Chapter IV. Presents steering wheel analysis based drowsiness detection system and the
integration of the facial expression recognition with steering wheel data analysis in
decision level as well as feature level for an improved and more reliable drowsiness
detection system.
Chapter V. Gives a detailed explanation of Hidden Markov Models and drowsiness
detection using HMM based dynamic modeling.
Chapter VI. Describes the experimental setup and the experimental results for each of the
methods proposed, evaluated their classification accuracies and compared their
performances.
Chapter VII. Presents a case study of the application of the system in an intelligent
transportation test-bed.
Chapter VIII. Summarizes the work that has been done in this research and provides a
projection of what could be done in the future to improve the system.

6
CHAPTER II
RELATED WORK
The end applications of many of the researches that have been done on drowsiness detection are
mainly focused on car safety systems and monitoring of driver’s state of fatigue. These driver
assistant systems have been implemented through different sensors that indicate the driver’s
behavioral or physiological change while driving or the change in measure of the various
responses of the vehicle. In recent years, researchers have conducted experiments and
implemented various techniques in order to determine drowsiness of drivers in real-time
scenarios[5]. These techniques can be categorized in to four major groups:
1. Vehicle based measuring techniques
2. Physiological measuring techniques
3. Behavioral measuring techniques
4. Hybrid techniques
2.1. Vehicle based measuring techniques
Real time drowsiness detection has been implemented using different detection techniques
analyzing various types of input data. In this approach, the driver’s drowsiness is measured
through analyzing the different controller signals of the vehicle such as steering wheel movement,
the pressure from the gas and brake pedal, speed of the vehicle, change in shift lever and the

7
deviation from lane position [6, 7]. The measured data is constantly monitored and any data
variation that crosses a specified threshold indicates a significantly increased probability that the
driver is drowsy. The measurements of these signals are obtained from sensors attached to the
vehicle. These measurements are generally taken in controlled environments with a simulated
driving setup because conducting such experiments in real life scenarios is unsafe and could lead
to accidents.
Among the vehicle-based metrics that have been used to determine drowsiness, steering wheel
movement has been widely shown by researchers to give better detection capability [6, 8-10]. The
steering angle is constantly measured by a sensor and the change in angle movement is monitored
if it is within or exceeds the specified threshold. In normal driving, the driver makes many small
adjustments of steering wheel (between 1 – 5 degrees) to keep position within the lane and few
large adjustments (between 6 – 10 degrees) during lane change or at a road curvature[6]. When
the driver is drowsy, on the other hand, the driver anticipates making lane adjustments by making
many large steering wheel movements and less small adjustments. This leads to a significant and
unpredictable variation in steering wheel movement which can be analyzed to determine the state
of the driver. Steering wheel movement has been adopted by major car companies such as Nissan
and Renault to detect fatigue [11]. However, it works in very limited situations because it is more
dependent on the geometric characteristics of the road than the kinetic characteristics of the
vehicle.
The other vehicle based metrics have similar limitations as steering wheel movement in
accurately detecting the drowsiness of the driver. The measured data from these metrics does not
fully differentiate between normal and drowsy driving as it depends on the nature of the road, the
traffic and the vehicle. Moreover, the deviation in normal driving analyzed from the vehicle based
measurements may not necessarily be caused by drowsy driving. Similar measurements could be
read from a driver with a lack of experience or other driving impediments unrelated to
8
drowsiness. Generally, drowsy driving is bound to show certain signal variations in the vehicle
based measurements that can easily be analyzed and detected, however, the detection of such
variations in measurements may not necessarily come as result of drowsiness. This makes
vehicle-based measurements poor predictors of performance deter because of drowsiness.
2.2. Physiological measuring techniques
The second approach makes use of the measurement of physiological activities of the human
body such as brain wave (Electroencephalogram - EEG), heart rate (Electrocardiogram – ECG),
electric signals from muscle cells (Electromyogram – EMG) or eye movement
(Electrooculography – EOG) [12-14]. The electrodes are attached to the specific parts of the body
according to the measuring technique and the electric signal is measured and analyzed to
determine the drowsiness state of the driver.
Physiological signals are weak and can easily be distorted with noise. To minimize the noise,
researchers have used different techniques to preprocess the raw data. Patel et al. [15] used band
pass filters and thresholding to remove noise from the input ECG data in the low and high
frequencies. After preprocessing stage, the output data is analyzed in frequency domain by using
Fast Fourier Transforms (FFT) and important features are extracted for classification. Fu-Chang
et al. [16] performed similar experiments on EEG data to determine drowsiness of a driver. They
used Independent Component Analysis (ICA) to segregate and localize mixed EEG data to
distinct brain activities. From the preprocessed data, features are extracted in frequency domain
using FFT and classified using a Self-organizing Neural Fuzzy Inference Network. Hu and Zheng
[17] also implemented drowsiness detection system by making use of EOG data. They initially
identified the eye blinks from the recorded EOG data and extracted the eye lid movement
parameters as features to be classified using Support Vector Machines (SVM).
9
The main attribute of physiological measuring techniques is that they are able to determine the
decrease in level of alertness ahead of time before the actual drowsiness episode starts. Humans
do not naturally get drowsy in an instant and there is gradual decrease in response or activity of
the various body parts which eventually lead to drowsiness. For example, in EEG analysis, the
change in signal power at the alpha range (8 – 12Hz) and indicates early sign of drowsiness [6].
Physiological measuring techniques can measure such changes at the early stages and the person
can be alerted or the proper safety measure can be taken before accidents could occur. The
measured signals are also reliable to detect drowsiness as their correlation with the alertness of
the driver is quite accurate and they are usually independent of the external factors such as the
nature of the road, the type of vehicle or the traffic. Hence, they have a more accurate drowsiness
detection capability than vehicle based and behavioral measuring techniques. However, the main
limitations behind these techniques are:
They are not practical for everyday use as it would require the driver to always wear the
sensing devices which causes discomfort.
Physiological signals are generally very weak and can easily be contaminated by artifacts
that are caused by muscle movements of different body parts.
They need intricate hardware systems to sense, amplify and preprocess the signal for
analysis. The hardware cost of such systems is too high to be used commercially.
2.3. Behavioral measuring techniques
The third approach makes use of computer vision techniques to detect the changes in driver’s
behavior such as facial expressions, head movements, eye closure or constant blinking and
yawning [18]. These and other changes in patterns of behavior of a driver are manifested when
the person is feeling drowsy. Behavioral measuring techniques take the visual information of the
driver in real time, process the information and determine the state of the driver based on the level
of presence of the changes in the driver’s behavior.

10
Among the computer vision-based approaches, researchers have mainly focused on the analysis
of blinks and the percent of closure (PERCLOS) of the driver’s eyes to determine the drowsiness
of the driver [19-22]. According to the study by the Federal Highway Administration, PERCLOS
had been found to be the most reliable measure of drowsiness among many other measuring
techniques [23]. Initially, stream of images of the driver are obtained from video sources such as
webcam, digital video camera or infrared camera. The next step is preprocessing the images to
detect the face and eyes of the driver. The output from the preprocessing stage will be used to
extract certain features needed to determine the changes in behavior of the driver. Li et al. [24]
performed successive image filtering techniques such as image subtraction, morphologically
closed operations and binarization, and finally counted the number of pixels around the eyes
region to detect eye closure. Liu et al. [21] extracted simple features from the temporal difference
of consecutive image frames and used them to analyze the rules of eyelid movement during
drowsiness. Garcia et al. [25] have also presented a non-intrusive approach to drowsiness
detection. They used an IR illumination system and a high resolution camera to accept a stream of
images and perform face and eye detection. They applied filters on the eyes region and performed
horizontal and vertical projections of the pixel values of the detected eye area. The vertical
projection corresponds to the eye height which is used to evaluate the PERCLOS. Zutao and
Jiashu [22] initially performed face and eye detection and tracked the eye pupils using non-linear
Kalman and mean-shift tracking. They also performed vertical and horizontal projections of the
pixels around the eyes region. Since the eye ball color is much darker than the surrounding, they
calculated the pixel values in the vertical projection to determine the percentage of eyelid closure.
Flores et al. [26] computed the binary, gradient and logarithm image of eyes region, obtained
random samples around the region and used an elliptic shape to represent the eyes. They then
used an SVM classifier [27, 28] to decide whether the eyes are closed or not.

11
One of the main factors affecting the performance of PERCLOS based systems is the ambient
lighting condition. Using a webcam could be appropriate in day time or when there is sufficient
light to clearly see the eyes of the driver but could perform poorly when there is limited lighting
condition. On the other hand, a camera with infrared technology might work well during the night
but perform poorly in the daylight since the retinal reflections of infra-red cannot be obtained in
the presence of ambient sun light reflections [16]. Moreover, mere analysis of eye closure may
not be enough to predict drowsiness as the driver may not necessarily close his eyes throughout
the drowsy episodes especially during the early stages. A drowsy driver usually does not go to
deep sleep immediately rather alternates between nodding off and opening his eyes. The opening
of the eyes in such transitions can empirically be misinterpreted as being awake if eye closure is
the only parameter being analyzed. Hence, in recent years, some researchers are considering other
facial movements in addition to eye closure such as eyebrow raise[29], yawning[30] and head or
eye position orientation[31, 32].
In developing facial expression based drowsiness detection systems, the initial and profound task
is identifying and representing facial behaviors systematically. Gu and Ji were among the first to
present the idea of recognizing facial behaviors, such as facial expressions, orientation and gaze
in a systematic approach [33]. These facial expressions were represented by single or a
combination of individual muscle movements called action units. These action units have been
carefully coded with a unified description method of expression called Facial Action Coding
System (FACS) [34]. They adopted a dynamic Bayesian Network in order to capture the spatio-
temporal representation of the facial expressions and detect fatigue. Vural et al. [18] employed
machine learning methods to analyze facial movements during drowsy episodes. These facial
motions include blinking, yawn motions, eye-gaze, eyebrow raise and other movements that are
represented by action units of FACS[35]. They trained SVM classifiers for each action units with
a training dataset which is coded by certified FACS coders. Finally, they employed and compared

12
Adaboost and multinomial ridge regression to classify the action unit outputs and predict
drowsiness.
Many of the researches on behavior based drowsiness detection system used frame based
classification techniques that give decision based on the spatial features extracted from one input
image frame. While this is essentially sufficient for some scenarios where there is definite
separation of behavioral changes during drowsy and non-drowsy episodes, it lacks efficiency in
situations where there is non-uniform change in transition between drowsy and non-drowsy
episodes which actually is the case in most real life scenarios. Moreover, analysis of image
sequences gives more accurate description of facial expressions and frame based classification
approaches do not utilize all the information available in image sequences. The dynamic Bayesian
network in Gu and Ji’s work consists of a first-order HMM along with the Bayesian network to
capture the temporal dynamics of the facial movements during drowsiness across consequent
frames in a specific period of time[33]. Yin et al. [36] have also implemented dynamic
drowsiness detection system using multi-scale Gabor features from image sequences. To account
for the temporal aspect of human fatigue, they applied Local Binary Pattern (LBP) operators to
the multi-scale image sequences and divided them into region sequences. They computed the
histogram of each LBP region sequences and concatenated them as dynamic features. By
applying Adaboost weak learning algorithm [37], they selected the most important features and
constructed a strong cascaded classifier to detect fatigue. Generally, there is still a challenge in
extracting dynamic features of facial expressions for drowsiness detection and there have only
been few researches done on this area thus far.
2.4. Hybrid Systems
All the measuring techniques discussed have their own advantages and limitations. Vehicle-based
measures are nonintrusive but lack reliability. Physiological methods are reliable and accurate but
are intrusive. Behavioral methods are more reliable than vehicle based measures but are affected

13
by the ambient light. Hence it is wise to fuse the information from different measuring techniques
in a comprehensive manner that makes the best use of their advantages. However, there are only
few existing works on drowsiness detection by fusing different measuring techniques. Among the
pioneer researches conducted, the idea of integrating vehicle based and behavioral detection
methods was presented in the Advanced Driver Fatigue Research project report by A.
Eskandarian et al. [38] for the U.S. Department of Transportation. They preprocessed and formed
vectors using 15 seconds of steering wheel data. They also implemented eye tracking to record
the pupils’ diameter and formed a vector of eye closure data of 15 seconds. Then they
concatenated the two vectors and trained an Artificial Neural Network (ANN) to determine the
state of the driver. Cheng et al. [39] also combined behavioral measures and vehicle based
measures and concluded that the reliability and accuracy of the hybrid method was significantly
higher than those using single sensors.
14
CHAPTER III
DROWSINESS DETECTION BASED ON FACIAL EXPRESSION
RECOGNITION
Inspired by the previous researches of behavioral measuring techniques, we developed a real time
drowsiness detection system that incorporates facial expression changes instead of only eye
closure. It makes use of a computer vision approach to track the face of the user through time and
detect the facial motion and appearance changes occurring during drowsiness.
When a driver gradually feels drowsy, he/she manifests various behavioral changes that can be
analyzed and regarded to attest that the person is feeling drowsy. The behavioral changes can
include frequent blinking, prolonged eye closure, head tilting to a certain direction, eyebrow
rising in an effort to keep the eyes wide awake and seldom occurrences of jaw drop and yawning.
Our primary objective is to come with essential features that can clearly show these behavioral
changes on the face of the driver from a set of training videos recorded during drowsy and non-
drowsy episodes. We used data-driven feature selection technique to isolate the most important
features clustered around the face region manifesting the behavioral changes. We chose a
classification method that can analyze the cluster of selected features in real time and classify
them with appreciable confidence.
In this thesis, we addressed the optimization of the different parameters and settings of the
functional blocks of the system. We started with considering different regions of interest of the

15
driver’s visual information that we can use to extract and cluster the essential features for
classification. We proceeded to choosing different ways of setting the threshold to select features
that classify the training images with the minimum error. We also used different classification
methods and optimized their parameters for better classification accuracy.
Face Detection and Tracking
Feature Extraction
Feature Selection
ClassificationInput Image
Result
Figure 1. . The system diagram of drowsiness detection using facial expression.
The general block diagram of the system is shown in Figure 1. It accepts streams of input images
from a camera in front of the driver at a rate of 15 frames per second. It uses OpenCV’s library to
accept each frame and store it in an image structure that can easily be used for further processing
[40]. The stream of image frames then goes through four main image processing stages:
Face detection and tracking
Feature extraction
Feature selection
Classification
3.1. Face Detection and tracking
In this stage, we automatically identify the location and size of the face of the user in the captured
image frame. We similarly perform face detection on the sequences of incoming frames and use
an effective tracking algorithm to locate the face and record its changes in position over time. The
recorded face locations will later be used to select the face region and extract essential features
for further processing.
16
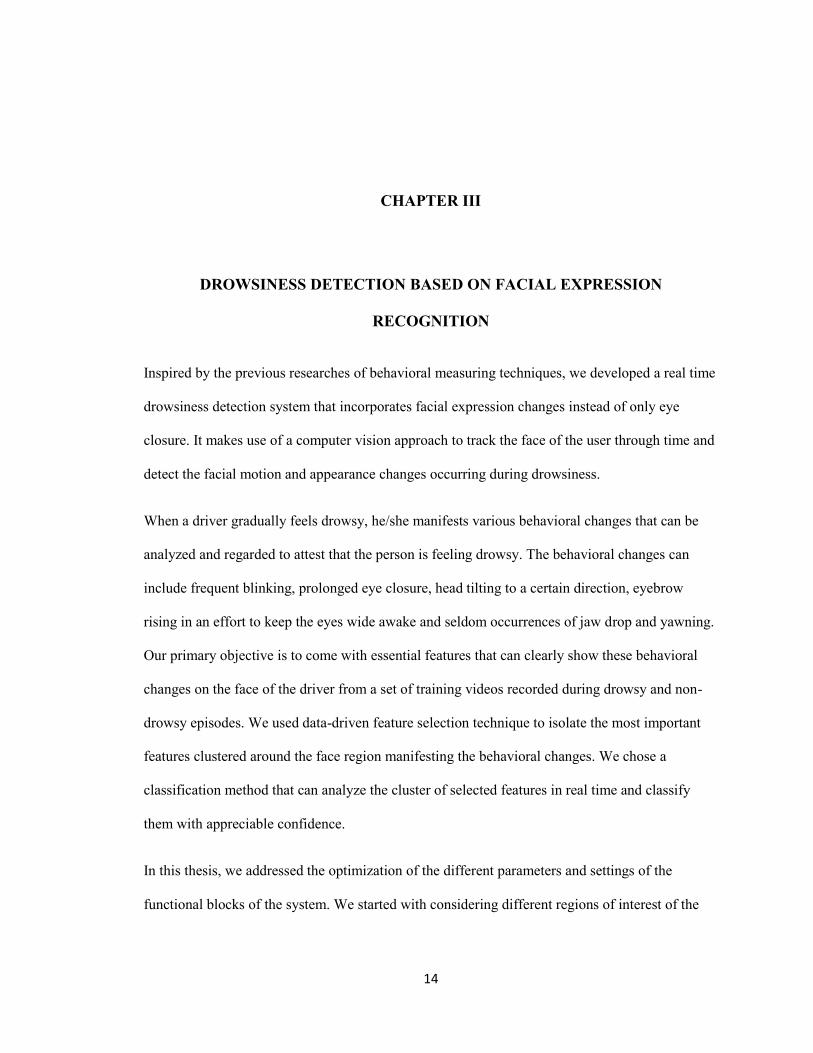
Figure 2. Procedures of localizing the face region
The procedures for localizing the face region from the input image are shown in Figure 2.
Originally, depending upon the light intensity of the environment, the captured image from the
camera may have a very small range of contrast between the driver’s face and the background.
Once the grayscale of the image is obtained, the system normalizes the brightness level and
increases the contrast of the image through histogram equalization. Next, it uses Viola-Jones
robust real time face detection algorithm [41] implemented in OpenCV to detect the face of the
user. Among the various techniques which have been proposed for face detection, this algorithm
is better suited for real time face interactive applications because of its low false positive rates
and low computational complexity. According to our experiment, however, using the face
detector alone is not reliable to effectively localize the face when the driver’s head rotates to a
certain angle or suddenly moves to a certain direction which frequently happens when the driver
is drowsy. Hence we implemented Camshift tracking algorithm [42, 43] to track the face of the

17
driver under different circumstances where the face detector fails to detect. The final face region
is determined according to the outputs from both face detector and tracker.
In Camshift tracking, we initially perform face detection and use the color information of the
detected face region as a template for the tracking of consecutive frames accepted from then on. It
first creates the color histogram of the detected face and calculates the probability that each pixel
belongs to the face region (face probability) based on the histogram. It recalculates the face
probability of each pixel for the new sequences of frames and estimates the face location that
covers the area with the highest concentration of pixels with high face probabilities.
When the next frame is captured, we perform face detection and Camshift tracking in separate
threads. This is because Camshift generally looks for a region having the same color makeup as
the detected face and it may include the neck and other unnecessary regions having similar color
makeup as the face region. Therefore, the region tracked from the Camshift will be adjusted
according to the size of the final face region from the previous frame and the size of the detected
face from the face detector if the face is detected as shown in Figure 3. The final face region is
then passed to the next processing stage to extract features.
Figure 3. Face Detection and Tracking

18
3.2. Feature extraction
The grayscale of the input image is passed to Matlab engine along with the locations of the
detected face. We have used two approaches of using the input image for feature extraction:
Crop the detected face of the user
Crop the region where the eyes are most likely located
The input image is reshaped to a fixed size and its Gabor features are extracted through Gabor
Wavelet Decomposition [44, 45]. We preferred Gabor wavelet features for detection because they
can represent changes in surface textures such as wrinkles, bulges and changes in feature shapes
and they are relatively more robust to illumination changes and random head movement.
3.3. Feature Selection – Adaboost weak learning Algorithm
The facial features from the Gabor decomposition are too many to be used for classification in
their entirety and hold a lot of redundant information. Hence we used the Adaboost weak learning
Algorithm [46] to select the most important features for classification.
Adaptive boosting is an algorithm for constructing a “strong” classifier as linear combination of
“weak” classifiers xh j .
T
j
jj xhxf1
)( (1)
Where, j is calculated from the training error
j of the thj weak classifier as:
j
j
j
1ln
2
1 (2)

19
The weak classifier used here is a simple threshold function xh j consisting of only one feature
xf j [47].
otherwise
pxfpifxh
jjjj
j1
1 (3)
where j is a threshold and jp is a parity to indicate the direction of the inequality.
We compute the threshold value in two different ways:
Averaging: It can be computed as the average of the mean value of the positive
samples and the mean value of the negative samples on the thj feature response:
m
p
l
n
nnjppjj yxfl
yxfm 1 1
1|1
1|1
2
1 (4)
Searching-maximum: We can also choose a threshold among the thj feature of all the
samples that maximizes separation between the classes:
STSSTSj ,minargmax (5)
Where S+ is the number of positive samples below threshold, S
- is the number of negative
samples below threshold, T+ is the total number of positive samples and T
- is the total number of
negative samples.
20
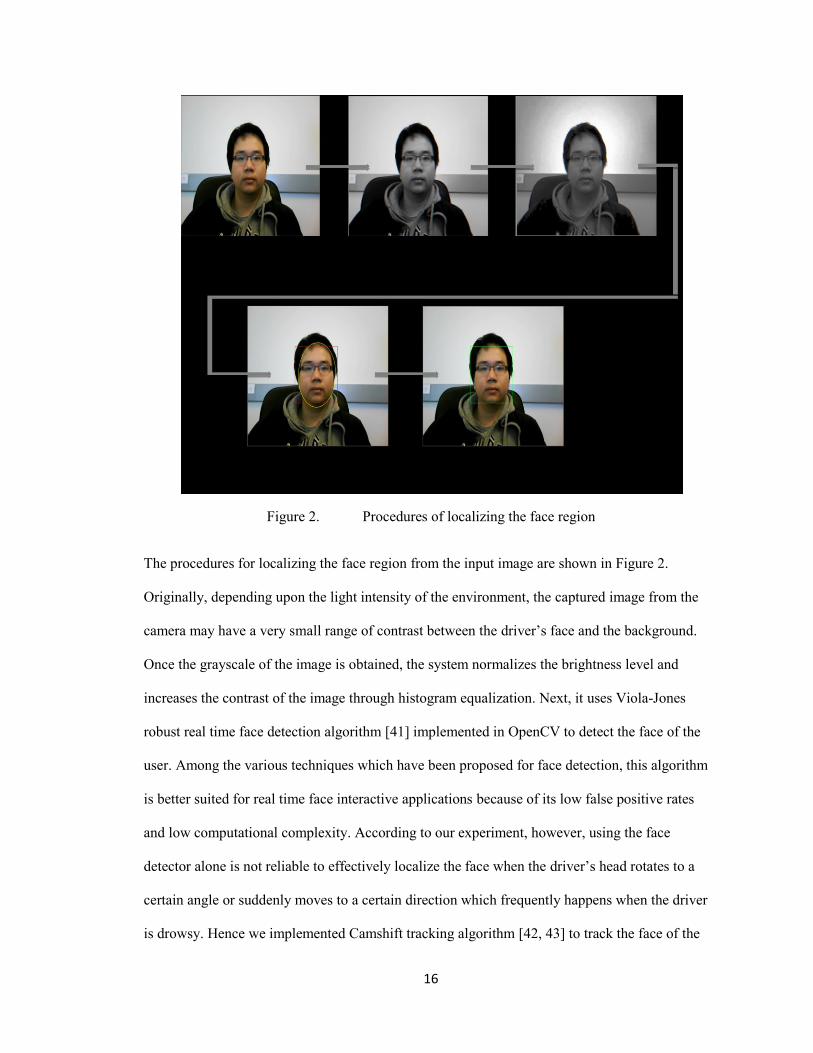
Algorithm: Adaboost (Schapire and Singer, 1999)
Input: N training samples with labels , with positive and
negative samples
Initialize: the weights of training samples :
Do for
1. Normalize all weights
2. For each feature , train a weak classifier with error
3. Choose with the lowest error
4. Update the weights:
where
and is a normalization
constant
Output: Final strong classifier
Table 1. Adaboost Algorithm
3.4. Classification
At this stage, the selected features from the Adaboost are classified to a state of either drowsy or
non-drowsy by using different classification methods. The cascaded linear classifier built from
the weak classifiers selected in the Adaboost feature selection can be used as one classification
method. We have also chosen Support Vector Machines (SVM) as another classifier as it has
been successfully used in a wide variety of data classification and pattern recognition applications
[48]. We evaluated the classification accuracies of each method and compared their results for the
different feature extraction and selection parameters. Each classification method gives an output

21
for the set of selected features extracted from a single frame. However, when giving a final
decision of the state of the driver, we consider a set of such classification outputs from sequence
of frames of predetermined window size. This helps make the system more robust and reliable.
i. Adaboost
We linearly combine the weak classifiers working on each selected feature to get a strong
classifier and obtain the classification output xH as follows:
T
j
jj xhsignxH1
)( (6)
For a final decision, we calculate the mode of the classification outputs of sequences of frames
and declare the state of the driver based on the majority of the outputs as shown in Figure 4.
Mode
Drowsy Non-drowsy
Decision
Selected Feature vectors from sequences of Frames of N window size
Adaboost Classification
Classification outputs of each Feature vector
N1
Figure 4. Classification Decision for N feature vectors using Adaboost

22
ii. Support Vector Machines (SVM)
We are essentially dealing with a two-class classification problem (drowsy or non-drowsy). We
chose SVM as it is generically used for binary classification problems and has attributes that
make it a perfect fit to our problem.
SVM does not depend on the dimensionality of the input space
It is less prone to over-fitting
It always gives an optimum global solution during training.
We feed the selected features to the SVM for nonlinear classification by using Radial Basis
Function (RBF) kernel method [49]which proved to have a gain in performance over the linear
combination of the Adaboost weak classifiers. The RBF kernel maps the training feature vectors
nonlinearly in to a high-dimensional feature space. In this space, an optimal separating hyper-
plane is constructed by the support vectors corresponding to the centers of the RBF kernels in the
input space.
When giving the final decision of the state of the driver based on sequences of frames, for each
classification output, we first calculated the point distance from the separating hyper-plane. Next
we used sigmoid function to convert the distance to a class probability as shown in Figure 5.
(7)
Where d is the point distance from separating hyper-plane
The output obtained from the sigmoid function ranges from 0.5 to 1 because its input is distance
which is positive. The output will be assigned as a class probability for the class output of the
SVM for each feature vector. The class probability for the complement class of each feature
vector will then be the sigmoid output subtracted to one. For example, if a given feature vector is

23
classified as drowsy by the SVM classifier, then we first obtain the class probability for drowsy
dP from the sigmoid output of the calculated point distance. The class probability for the non-
drowsy nP of the feature vector then becomes dn PP 1 . Then, for a final decision, we
calculate the average of both drowsy and non-drowsy class probabilities for sequences of such
feature vectors and declare the class with the larger average as the state of the driver.
Average
Drowsy Non-drowsy
Decision
Selected Feature vectors from sequences of Frames of N window size
SVM Classification
Point Distances from Separating Hyper-plane
Sigmoid Function
Class Probabilities for Drowsy and Non-
drowsy States
N1
Figure 5. Classification Decision for N feature vectors using SVM

24
CHAPTER IV
DROWSINESS DETECTION THROUGH INTEGRATION OF FACIAL
EXPRESSION AND STEERING WHEEL MOVEMENT
In this chapter, we include steering wheel movement as an additional input to the facial
expression based drowsiness detection method. While the detecting facial expressions of drivers
could give appreciable results in most cases, there are certain situations where the ambient light
could deteriorate the quality of input images, there could be certain occlusions covering part of
the face or the proposed algorithm could fail to correctly detect the state of the driver. By adding
steering wheel data analysis to the proposed algorithm, we increase the system’s reliability as it
can properly respond in these situations. Steering wheel data analysis is independent of the
ambient light, face occlusions or the limitations of the facial expression detection algorithm.
Moreover, it has been shown that there is a good correlation between the steering wheel
movement and the drop in the state of vigilance while driving [8, 9].
4.1. Steering Wheel Data Analysis
In an alert state, the driver tends to make small adjustments to the steering wheel angle and hence
there will only be small variation. When the driver is in a drowsy state, the way he/she drives
becomes unpredictable, resulting in a large change in trajectory, for example, zigzag driving and
there will be a larger amplitude of movement to keep the vehicle in the center of the lane. In
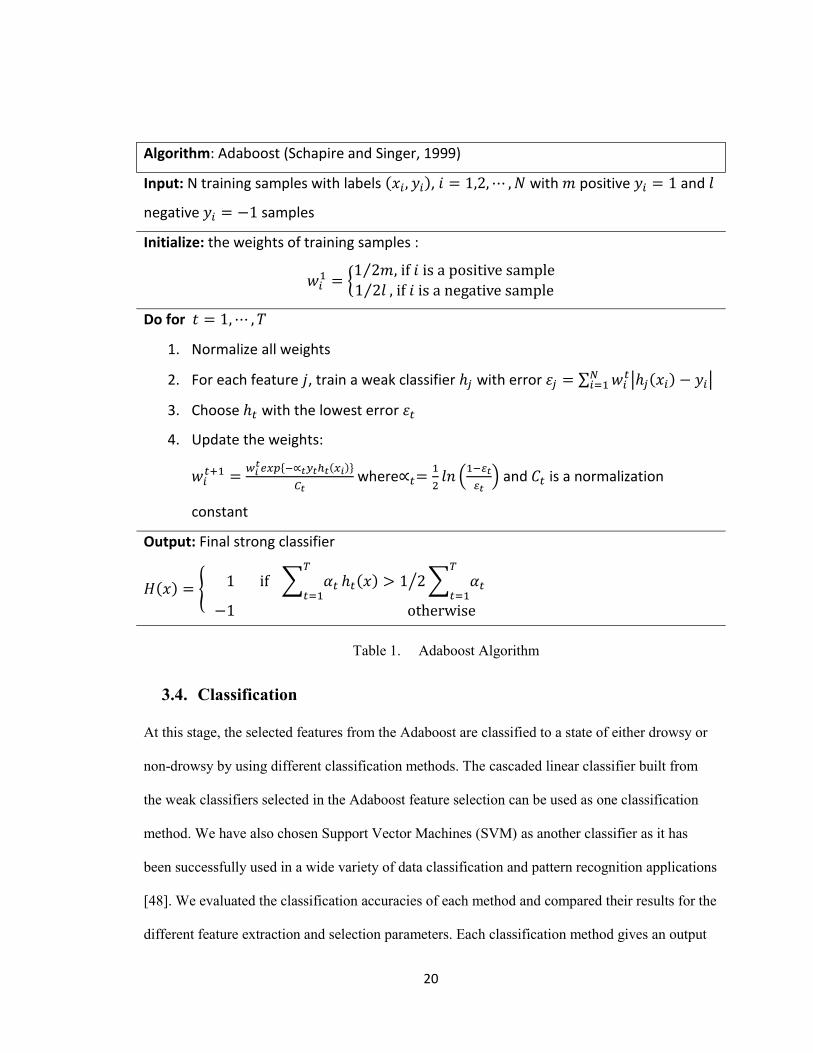
Figure 6, we plotted the steering wheel data with respect to time of one subject while driving in
25
drowsy and non-drowsy states. We collected 27sec duration of steering wheel data while the
driver is drowsy and 39sec duration of steering wheel data while the driver is non-drowsy. It
shows that the steering wheel angles during drowsiness randomly change in large magnitudes as
the time evolves. There are only small variations of steering wheel angles for non-drowsy
condition. Even if there are large magnitude changes, they are not as spiked as in the case of the
drowsy conditions. The steering wheel angle ranges from 0 to 250 and the wheel is neutral at 125.
Figure 6. Steering wheel data with time increment of 50ms. The unit of Y axis is degree.
Figure 7 shows the standalone implementation of steering wheel data analysis. The system
accepts the steering wheel data along with the entire car controller information at a rate of 15
packets per second and extracts the steering wheel data to a set of feature vectors for processing.
As mentioned above, the steering wheel angle obtained ranges from 0 to 250 with a neutral state
at 125. In order to change it to an angular measurement that ranges from -90 to 90 with a neutral
state of 0, we used a normalization equation:
(8)
Where, is the normalized steering feature vector and is the input steering
feature vector

26
After vectorization, the training set of feature vectors is used to build an SVM classifier model
that categorizes incoming data to either drowsy or non-drowsy. During the real time testing, the
steering wheel data is populated in a dynamic vector and passed to the SVM classifier.
VectorizationSteering Wheel Data Extraction
Normalization Classification
Car Controller Information
Result (Drowsy/Non-drowsy)
Figure 7. . Steering Wheel data analysis
Using steering wheel movement to detect drowsiness has its advantages as it performs better in
certain situations where the computer vision approach does not. However, as a standalone
drowsiness detection approach, it is also unreliable as it can be influenced by outside factors such
as nature of the road, the vehicle, the traffic and the driver’s way of driving. Hence, in this
chapter, we propose optimum ways of integrating the two methods so they can complement one
another.
4.2. Overall Approach
We proposed a system which implements the two well known non-invasive approaches:
drowsiness detection based on facial expression and steering wheel movement, in both
independent as well as comprehensive approaches. With the ultimate goal of finding a practical
and unobtrusive method of detecting drowsiness of a driver, the steering wheel data analysis or
the computer vision approach alone may not be sufficient to accurately determine the state of the
driver, especially under different circumstances and different behavioral manifestations of the

27
driver. Hence integrating the two sources of information will increase the detection reliability of
the system and deal with situations where a single source may not give sufficient results.
Feature Level Integration
Extracted Facial features
Steering Wheel Data Features
Result
Decision Level Integration
Classification
Classification
Result
Total Features
Figure 8. Overall System Diagram
The overall system diagram is shown in Figure 8. There are two main inputs to the system: the
stream of driver’s images and the stream of steering wheel data. The stream of images passes
through processing the following stages: face detection, feature extraction, feature selection and
classification. The steering wheel data pass through the feature extraction and classification stage.
As for integration of these two sources of information, the final output can be obtained through
data fusion at either decision level or feature level.
4.3. Decision Level Integration
One easy way of integration is at decision level where the outputs from both systems are
combined using simple Boolean algebra. The final decision of the state of the user is given by
calculating the mode of the classification results of sequences of images.
28
Feature Selection
Face Detection and Tracking
Feature Extraction
Input Image
Vectorization Normalization ClassificationSteering
Wheel Data
Result
Classification
Boolean Operator
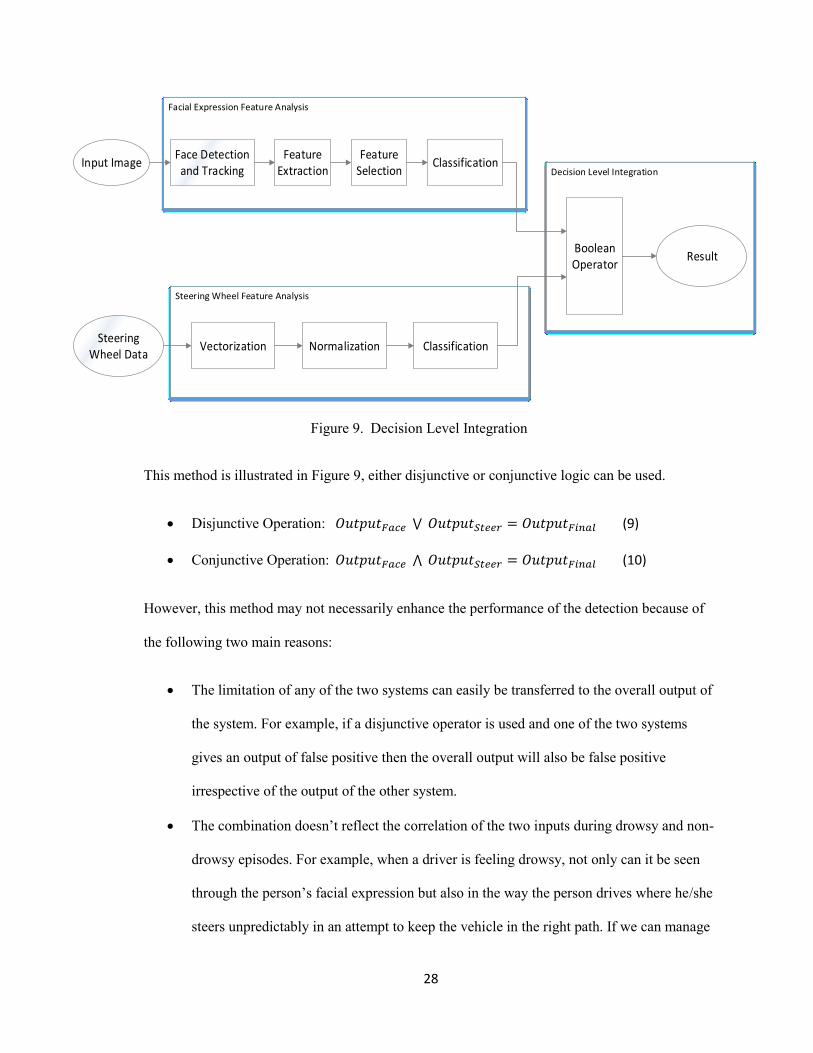
Figure 9. Decision Level Integration
This method is illustrated in Figure 9, either disjunctive or conjunctive logic can be used.
Disjunctive Operation: (9)
Conjunctive Operation: (10)
However, this method may not necessarily enhance the performance of the detection because of
the following two main reasons:
The limitation of any of the two systems can easily be transferred to the overall output of
the system. For example, if a disjunctive operator is used and one of the two systems
gives an output of false positive then the overall output will also be false positive
irrespective of the output of the other system.
The combination doesn’t reflect the correlation of the two inputs during drowsy and non-
drowsy episodes. For example, when a driver is feeling drowsy, not only can it be seen
through the person’s facial expression but also in the way the person drives where he/she
steers unpredictably in an attempt to keep the vehicle in the right path. If we can manage
29
to incorporate such variations in the steering wheel data along with the change in facial
patterns as complementary inputs to one another, we can empirically get better detection
outputs which is not so for this case.
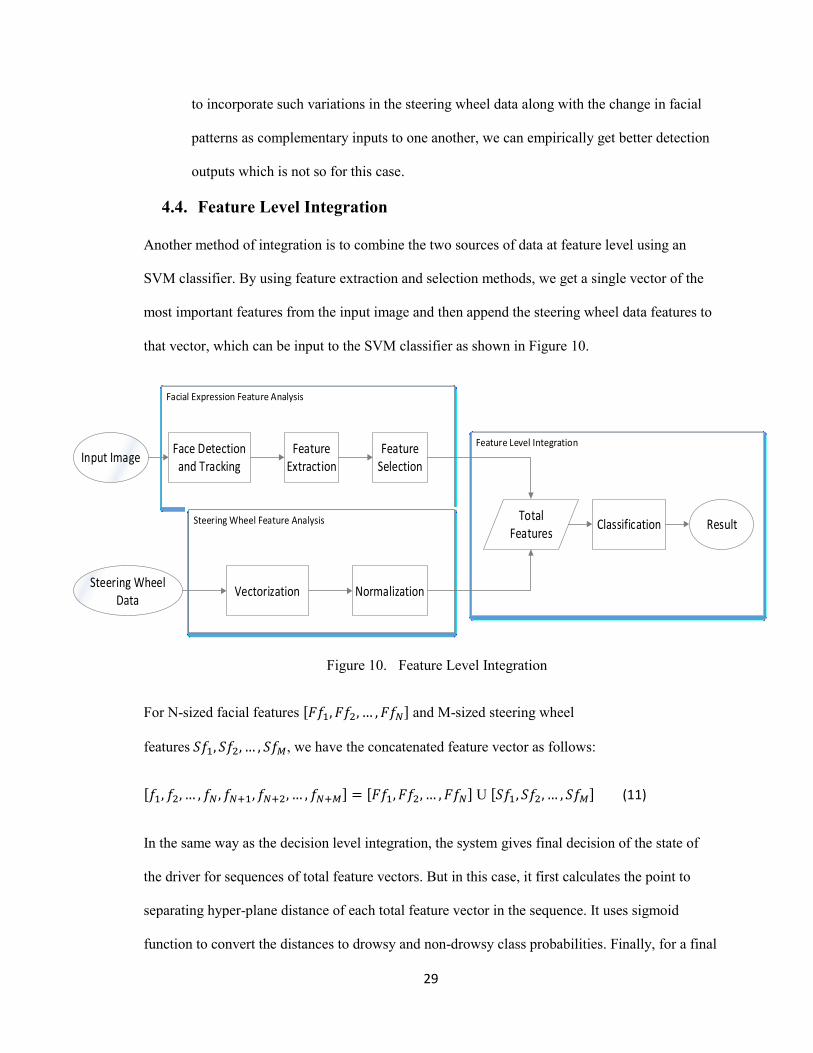
4.4. Feature Level Integration
Another method of integration is to combine the two sources of data at feature level using an
SVM classifier. By using feature extraction and selection methods, we get a single vector of the
most important features from the input image and then append the steering wheel data features to
that vector, which can be input to the SVM classifier as shown in Figure 10.
Feature Selection
Total Features
Classification
Face Detection and Tracking
Vectorization Normalization
Feature Extraction
Input Image
Steering Wheel Data
Result
Figure 10. Feature Level Integration
For N-sized facial features and M-sized steering wheel
features , we have the concatenated feature vector as follows:
U (11)
In the same way as the decision level integration, the system gives final decision of the state of
the driver for sequences of total feature vectors. But in this case, it first calculates the point to
separating hyper-plane distance of each total feature vector in the sequence. It uses sigmoid
function to convert the distances to drowsy and non-drowsy class probabilities. Finally, for a final

30
decision, it calculates the average of both class probabilities and declares the class with the larger
average as the state of the driver.

31
CHAPTER V
DROWSINESS DETECTION THROUGH HMM-BASED DYNAMIC
MODELING
In the facial expression based drowsiness detection method proposed previously, it performs
classification on frame by frame basis even if the final decision is given for a sequence of frames.
The main limitation in this approach is that it does not consider the temporal sequence of the
frames when it declares the state. This is because it either calculates the mode of the classification
of each frame or the average of the class probabilities of each frame. The position of the frames in
the sequence can be interchanged in different possible ways and the system would still give us the
same final decision.
According to a psychological research [50], analyzing facial motions through sequences of
frames is crucial in recognizing facial expressions. It also shows that humans are better at
recognizing facial expressions from sequences of frames than individual frames. This is because
facial expressions have a unique dynamic pattern of behavioral changes that can easily be
recognized in time. Consequently, more researches have started to be conducted with a particular
focus on modeling dynamic features to recognize facial expressions, and Hidden Markov Models
has been the most widely used method in modeling the temporal dynamics [51-54] . Basing our
work in these and other researches, we have proposed a method to model the dynamics of facial
expressions of drowsiness in the same way as the general facial expressions have been modeled
in recognition of human emotions.

32
In this chapter, we implement dynamic modeling approach to make use of the temporal sequences
of frames to recognize the driver’s expression. We model the dynamics of the driver’s drowsiness
by utilizing all the information available in the image sequences. We also optimize the modeling
parameters and the dynamic features that capture the temporal pattern of the facial expressions
indicating drowsiness.
5.1. Hidden Markov Models
Hidden Markov Models have been widely used for various dynamic classification problems and
statistical modeling. The main attribute of HMM is that it characterizes an input non stationary
signal as a parametric random process and the parameters can be determined or estimated in a
probabilistic manner. HMM is modeled to have a set of unobservable stochastic processes
(hidden states) that produce a sequence of observations. It uses the transition probabilities
between the hidden states and learns the conditional probabilities of the observations given the
state of the model.
Hence, an HMM model can be parameterized by the set of values of the hidden sates and
observation symbols, the initial state probabilities, the state transition probabilities and the
observation state probabilities [55].
BAKS ,,,, (12)
NssS 1: : are the values of the hidden states
MkkK 1: : are the values of the observation symbols
NjsqPp ji 1,: 1 : are the initial state probabilities.
NjisqsqPaA itjtij ,1,|: 1 : are the state transition probabilities.
33
MjNisqkoPbB itjtij 1,1,|: : are the state observation probabilities.
tt oq & : are the hidden state and observation symbol at time t.
In modeling an HMM, there are two main problems that need to be addressed:
Inference: We need to determine the probability that a given observation sequence
ToooO 21 is produced from a HMM parameterized by . This is a classification
problem as we will compute the probability that a given sequence of feature vectors,
which is represented by observation symbols, is produced from either the drowsy or
non-drowsy HMM. We choose the model which best matches the observation sequence
and hence classify the sequence as either drowsy or non-drowsy state.
Fitting: We need to choose a HMM that represents a sequence of past observations
well. This is a learning problem as we adjust the model parameters BA,, by
training both models with training image sequences.
5.2. Feature Discretization
The HMM model described above is trained by a sequence of training observations and once the
model parameters are optimized, it gives a probability of how likely a given sequence of
observations is produced by the model. While the observation sequences in HMM are essentially
discrete symbols, the input signal of our system is a multidimensional feature vector extracted
from the detected face of the driver. Hence, we use the two well-known unsupervised clustering
techniques: K-means and Expectation Maximization (EM), to quantize the multidimensional
continuous feature vectors to discrete symbols as shown in Figure 11.
34
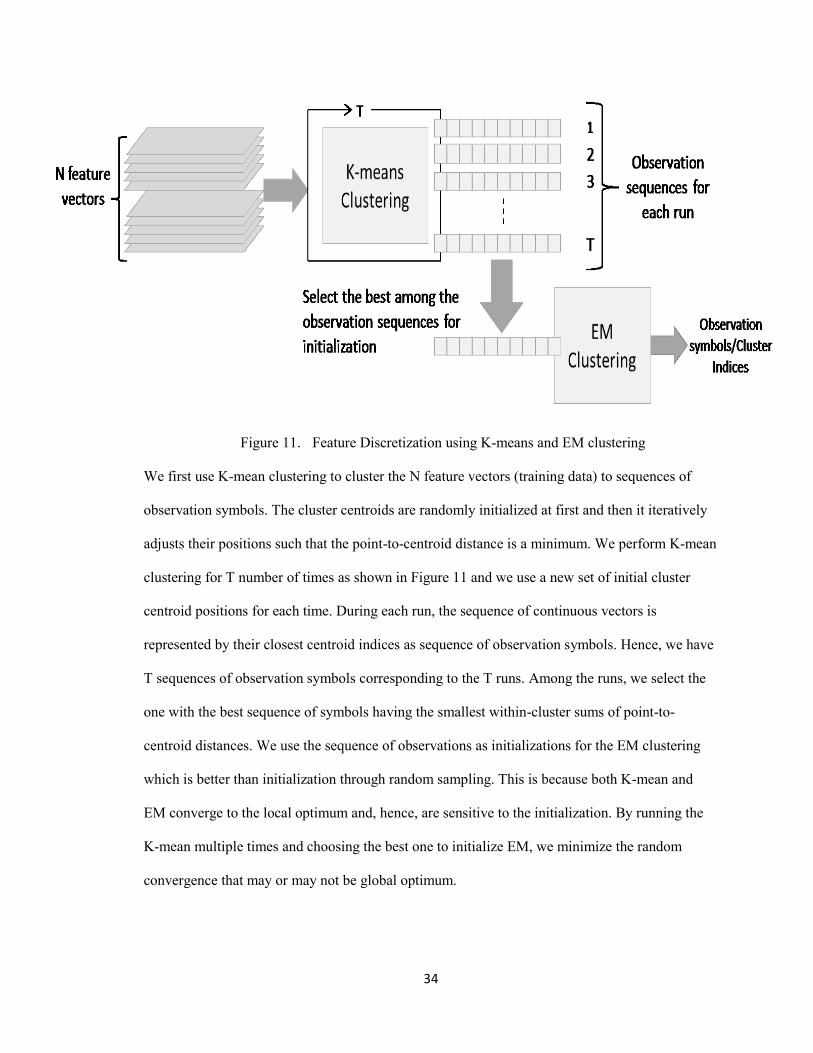
Figure 11. Feature Discretization using K-means and EM clustering
We first use K-mean clustering to cluster the N feature vectors (training data) to sequences of
observation symbols. The cluster centroids are randomly initialized at first and then it iteratively
adjusts their positions such that the point-to-centroid distance is a minimum. We perform K-mean
clustering for T number of times as shown in Figure 11 and we use a new set of initial cluster
centroid positions for each time. During each run, the sequence of continuous vectors is
represented by their closest centroid indices as sequence of observation symbols. Hence, we have
T sequences of observation symbols corresponding to the T runs. Among the runs, we select the
one with the best sequence of symbols having the smallest within-cluster sums of point-to-
centroid distances. We use the sequence of observations as initializations for the EM clustering
which is better than initialization through random sampling. This is because both K-mean and
EM converge to the local optimum and, hence, are sensitive to the initialization. By running the
K-mean multiple times and choosing the best one to initialize EM, we minimize the random
convergence that may or may not be global optimum.
35
The main limitation of K-means is that it fails to optimally cluster features having non-isotropic
distributions. The facial feature vectors, in our case, are multidimensional continuous values that
can best be modeled statistically through Multivariate Gaussian Distributions. Hence we used EM
clustering which uses Gaussian mixture models to optimize the cluster centroids. After having the
observation symbols, we adopted two HMM models for both drowsy and non drowsy facial
expression detections.
5.3. Drowsiness Detection Using HMM models
Drowsiness is a cognitive state created through series of changes of behavioral patterns occurring
through time. Such changes of facial expressions during drowsiness can be modeled just as many
researchers have been modeling facial expressions to recognize human emotions. The main
challenge in modeling drowsy behavioral patterns is that they have random transitions as opposed
to the universal facial expressions of emotions like happy, anger, fear, sadness and surprise that
have a well-defined transition going from neutral to apex. Expressions during drowsiness include,
but are not limited to, frequent blinking, prolonged eye closure and sudden opening of the eyes
followed by eye brow raise in an attempt to keep the eyes open, yawning, nodding and gradual
head tilting to certain direction. This poses difficulty in learning the models as it includes wide
variety of behavioral patterns to be considered for both drowsy and non-drowsy scenarios. In
modeling the HMM for drowsy expressions, we constructed a specific model that encompasses
the various transitions of expressions manifested during drowsiness. For non-drowsy expressions,
a general HMM model was constructed to account for all the behavioral changes outside the
drowsy expressions.

36
Feature Discretization
Facial Feature vectors from Adaboost
Result
HMM for drowsy expression
HMM for non drowsy expression
Figure 12. The system diagram of drowsiness detection using HMM dynamic modeling
The block diagram of the system is shown in Figure 12. The Gabor features selected through
Adaboost are quantized to discrete observation symbols by using K-means and EM clustering.
We used the same centroids to cluster the drowsy and non-drowsy image sequences and trained
both models with their respective observation sequences. During training, we used Viterbi
algorithm to estimate the state transition and state-to-observation probabilities of the HMMs.
During testing, a given sequence of selected Gabor feature vectors are fed to both models and
classified by calculating the probability of the sequences for each model.
37
CHAPTER VI
EXPERIMENTS AND RESULTS
In this chapter, we present the overall setup of our experiment, the procedures we have taken
when conducting the experiment of each drowsiness detection method and, finally, the
experimental results, comparisons and discussions.
6.1. Experimental Setup
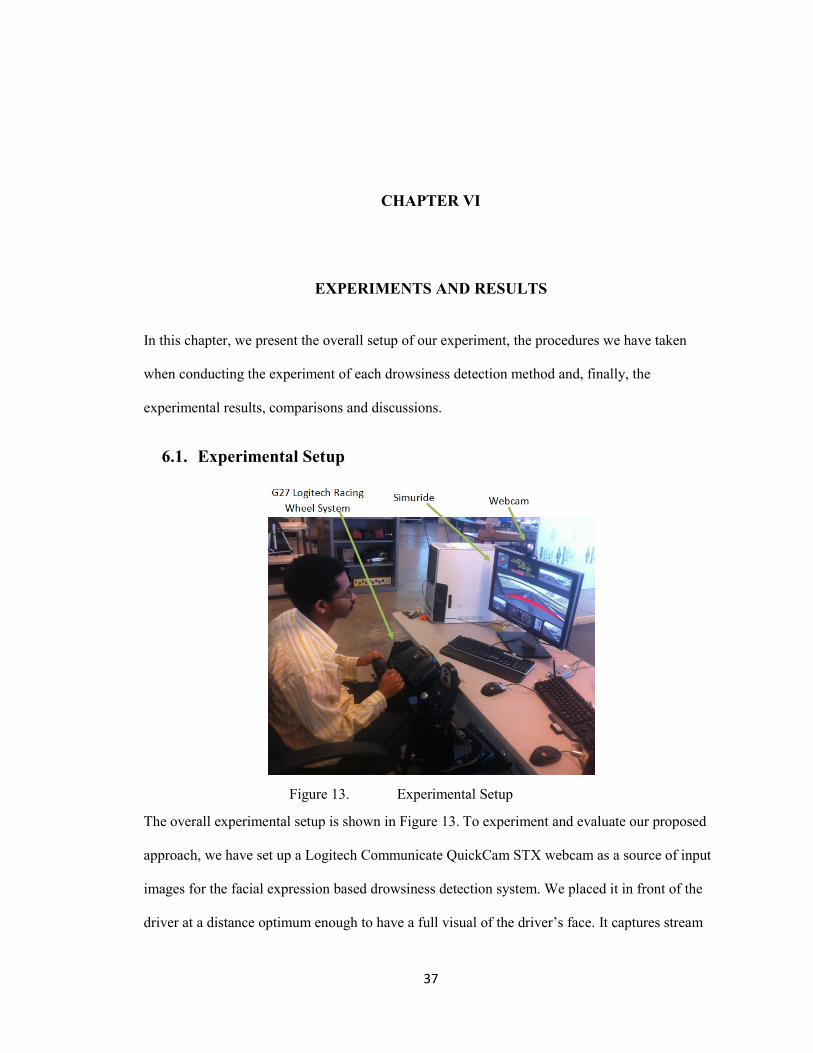
Figure 13. Experimental Setup
The overall experimental setup is shown in Figure 13. To experiment and evaluate our proposed
approach, we have set up a Logitech Communicate QuickCam STX webcam as a source of input
images for the facial expression based drowsiness detection system. We placed it in front of the
driver at a distance optimum enough to have a full visual of the driver’s face. It captures stream

38
of images of 320×240 pixels at rate of 30 frames per second. We have also setup a G27 Logitech
racing wheel system [56] as a source of the driver’s steering wheel movement for the experiment
of the integrated drowsiness detection system.
In an effort to simulate the actual driving scenarios, we have used the driving simulation software
Simuride [57] which is preconfigured to be easily used with the Logitech G27 racing wheel
system. The software gives a visual display of the actual traffic scenes along with the car
dashboard as shown in Figure 14. By using Simuride, we made the users drive in different
scenarios in both drowsy and non-drowsy conditions and collected training and testing data for
the analysis and evaluation of our approach.
Figure 14. Driver view in the SimuRide software.
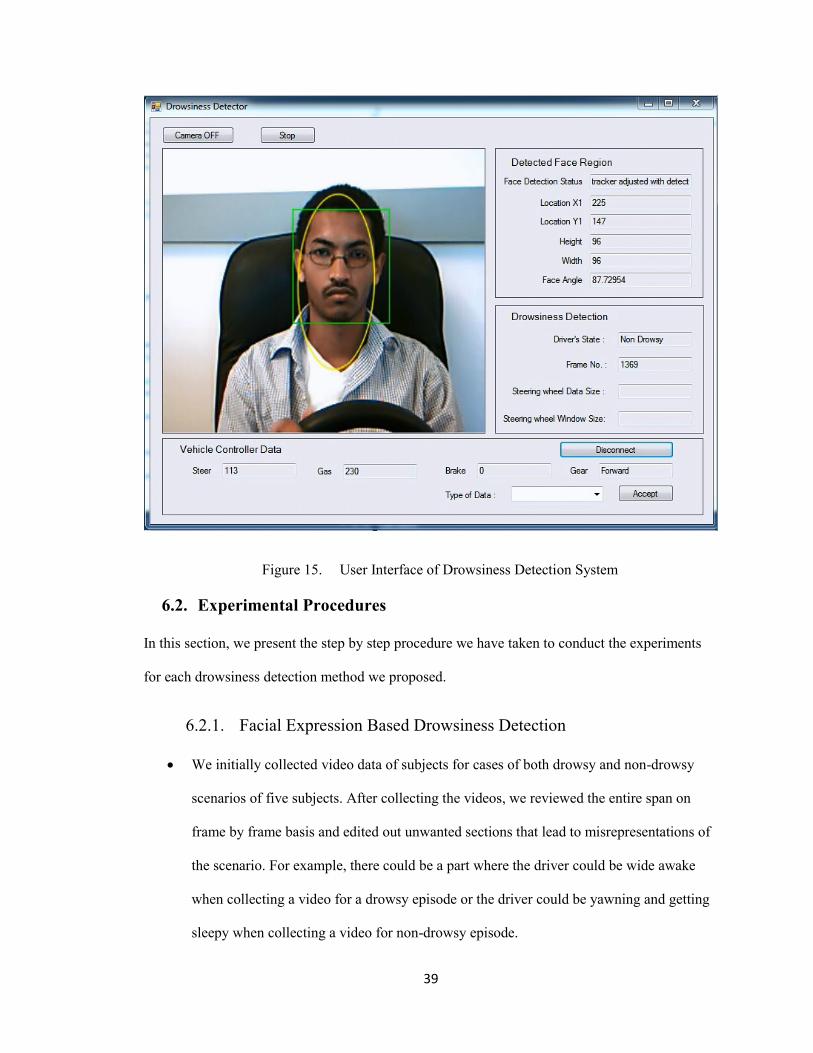
The user interface of the application is shown in Figure 15. It shows the stream of input images of
the driver from the webcam. The outputs from the face detector and Camshift tracker along with
the final face region are drawn on each input image and all the information of the face region
such as location and size are stated on the side. The car controller information from the vehicle
including the steering wheel, gas, brake and gear are also displayed. The driver’s state after
processing of sequences of frames is also stated.
39
Figure 15. User Interface of Drowsiness Detection System
6.2. Experimental Procedures
In this section, we present the step by step procedure we have taken to conduct the experiments
for each drowsiness detection method we proposed.
6.2.1. Facial Expression Based Drowsiness Detection
We initially collected video data of subjects for cases of both drowsy and non-drowsy
scenarios of five subjects. After collecting the videos, we reviewed the entire span on
frame by frame basis and edited out unwanted sections that lead to misrepresentations of
the scenario. For example, there could be a part where the driver could be wide awake
when collecting a video for a drowsy episode or the driver could be yawning and getting
sleepy when collecting a video for non-drowsy episode.

40
During the training stage, we selected 2/3 of the image frames of the labeled video data
recorded from each subject for both drowsy and non-drowsy scenarios. The remaining
1/3 of the image frames of the labeled video data were used for testing.
For each input image, the face locations are first determined from the face detection and
tracking stage. During feature extraction, the located face region is normalized to
different matrix sizes depending on the choice of region of interest. If the detected face is
the region of interest, the face region of each image frame is normalized to a matrix of
100×100 and if the cropped eye region from the detected face is the region of interest, the
eye region is normalized to a matrix of 200×80.
The Gabor wavelet decomposition is implemented with a 2 scales and 4 orientations filter
bank which is the minimum, yet optimum, combination for our system which performs
the detection in real-time.
Figure 16. Gabor filter bank with 2 scales and 4 orientations.
For the case of using the detected face as the input, each input image generates a feature
matrix of size 100×(100×2×4) =80000 of total features. On the other hand, when using
the cropped eye region as the input, then the total features will become
200×(80×2×4)=128000 of total features.
The total number of features obtained from the Gabor convolution is too large to be
entirely used for classification and hence the need for feature selection. In the Adaboost

41
feature selection algorithm, we have proposed Averaging and Searching Maximum
threshold computations.
During classification, we computed the average accuracy of the drowsiness detection for
different number of features, choice of region of interest, threshold computation, and
classification techniques (i.e. Adaboost or SVM).
Final decision is given for 15 sequences of frames which is the same as the frame rate of
the webcam used in our system.
6.2.2. Integrated Drowsiness Detection
We initially collected the steering wheel movement of each subject along with the image
frames of the driver’s face for both drowsy and non-drowsy scenarios. The steering wheel
data is appended to a dynamic vector in a separate thread from the one that captures the
input images. However, in order to synchronize the steering wheel movement with the
corresponding image frame, we selected a fixed size of steering wheel from the most
recently added side of the dynamic vector on the same thread as we captured the input
image.
Next, we independently implemented the steering wheel data analysis and evaluated its
detection accuracy. In a similar way as the facial expression based drowsiness detection,
we selected 2/3 of the collected steering wheel vectors for training an SVM classifier
with RBF kernel and the remaining 1/3 of the collected steering wheel vectors for testing
the classifier. We evaluated the classification accuracy of the system for different vector
sizes and determined the optimum vector size.
For the decision level integration, we combined the outputs from the facial expression
and steering wheel based detection systems with both disjunctive and conjunctive
operations. We evaluated the classification accuracies for both operations by varying the

42
different parameter settings of the facial expression based detection system while keeping
the vector size for the steering wheel data analysis constant at the optimum value.
For the feature level integration, we added the steering wheel data vectors as additional
inputs to the facial feature vectors from the Adaboost. We performed the classification in
the same way we did for the facial expression based drowsiness detection method. When
evaluating the classification accuracies, we kept the steering wheel data vector size
constant at the optimum value and varied the different parameter settings of the facial
expression part of the system.
In each method, final decision is given for 15 sequences of frames and steering wheel
vectors which is the same as the frame rate of the webcam used in our system.
6.2.3. HMM Based Drowsiness Detection
We first recorded videos of multiple subjects in drowsy and non-drowsy scenarios. We
edited out the unwanted parts of the videos in the same way we did for the facial
expression based drowsiness detection method. We also performed the same procedures
as the facial expression until the feature selection using Adaboost.
Next, we quantized the feature vectors to definite indices using EM clustering of
Gaussian Mixture models. We initialized the EM by running K-Means clustering for
repeated number of times and choosing the best set of clusters among all.
After representing the feature vectors with cluster indices, we trained two HMM models,
one for drowsy and another for non-drowsy scenarios, by using 2/3 of the collected
videos and tested the models with remaining part.
We evaluated the classification accuracies by varying the number of facial features, the
observation symbols, the hidden states and the window sizes and compared it with the
corresponding results from the facial expression based drowsiness detection method.

43
Final decision is given for 15 sequences of frames which is the same as the frame rate of
the webcam used in our system.
6.3. Experimental Results
6.3.1. Facial Expression vs. Integration Based Drowsiness Detection
For our experiment, we used two subjects to drive in drowsy and non-drowsy scenarios and we
collected the stream of images and the steering wheel data.
a. Facial Expression based Drowsiness Detection
In the training stage, we have selected 2/3 of the image frames of the labeled video data (7891
non-drowsy and 8427 drowsy images) from ten videos of five different drivers. For testing, 1/3 of
the image frames of the video data recorded (3948 non-drowsy images and 4215 drowsy images)
have been used. We computed the average accuracy of the detection method for different number
of facial features and choices of region interest, Adaboost threshold computation and
classification techniques (i.e. Adaboost or SVM). For the ease of understanding, we categorized
the performance evaluation scheme to the case of Averaging and Searching Maximum Adaboost
threshold computation approaches. In each case, we increased the number of features selected by
the Adaboost from 10 to 300 with an interval of 10 and observed the variation in performance.
o Averaging Threshold Computation
As the number of facial features selected for classification increases, the performance saturates to
the accuracy values shown in Figure 17 and 18 for the different system parameter settings. From
Figure 17, we can see that the accuracy roughly increases to near-maximum at a rapid rate until
the number of features reaches 100. For averaging threshold computation, the accuracy of
classification using Adaboost is generally significantly lower than that of the SVM classifier with

44
RBF kernel for the same region of interest chosen (either eye region or detected face). Moreover,
for the same classification technique chosen (either Adaboost or SVM), the classification
accuracy of the system using face region as ROI is better than using the eye region as shown in
Figure 17. This attests to the fact that using other facial expressions in addition to eye closure as
ways of detecting drowsiness gives more reliable performance than using eye closure alone. We
have obtained a maximum accuracy of 94.86% for 200 facial features selected, detected face
selected as ROI and SVM classification.
Figure 17. Classification accuracy for averaging threshold computation
o Searching Maximum Threshold Computation
Figure 18 depicts an interesting relation between the different methods of classification and
choice of ROI for searching-maximum threshold computation. By using Adaboost classification
method, we obtain a classification accuracy that almost remains constant which implies that the
increase in number of features being added to the cascaded combination will have little
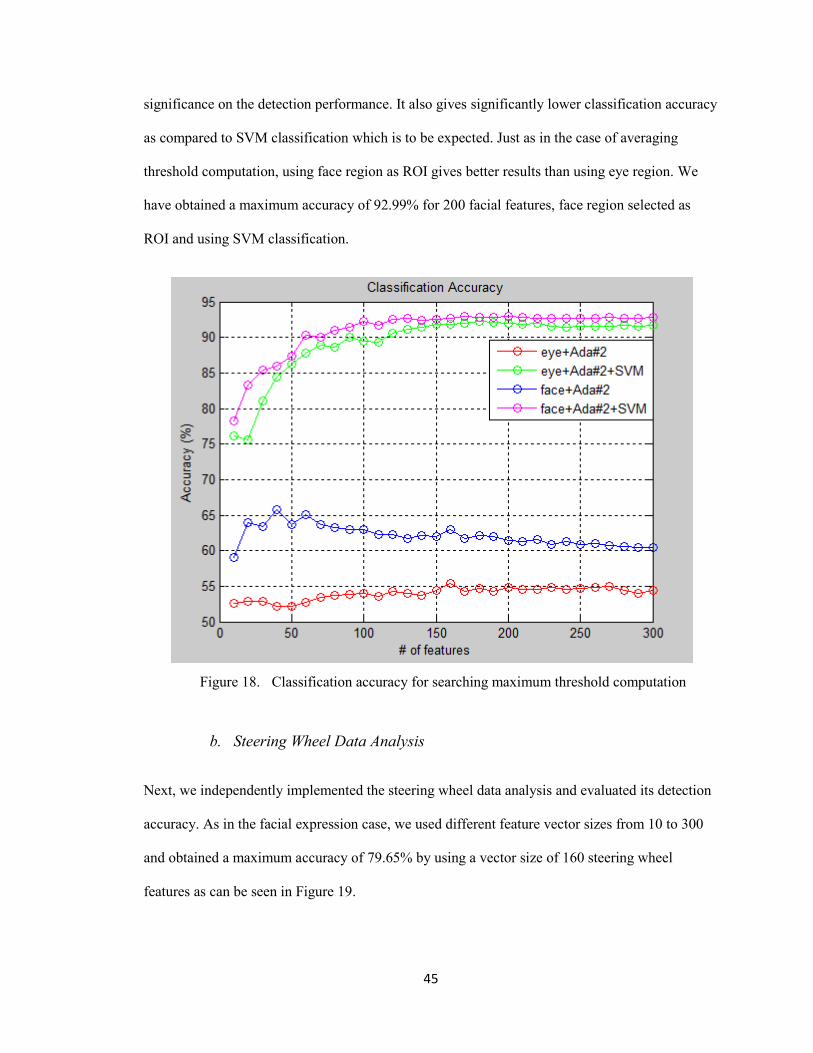
45
significance on the detection performance. It also gives significantly lower classification accuracy
as compared to SVM classification which is to be expected. Just as in the case of averaging
threshold computation, using face region as ROI gives better results than using eye region. We
have obtained a maximum accuracy of 92.99% for 200 facial features, face region selected as
ROI and using SVM classification.
Figure 18. Classification accuracy for searching maximum threshold computation
b. Steering Wheel Data Analysis
Next, we independently implemented the steering wheel data analysis and evaluated its detection
accuracy. As in the facial expression case, we used different feature vector sizes from 10 to 300
and obtained a maximum accuracy of 79.65% by using a vector size of 160 steering wheel
features as can be seen in Figure 19.

46
Figure 19. Classification Accuracy for Steering Wheel Data Analysis
c. Decision Level Integration
In the decision level integration of the two systems, we used disjunctive and conjunctive
operations to combine the outputs of the two systems and give the final output. We have already
obtained the maximum classification accuracy by using vector size of 160 features for the
steering wheel data analysis. Hence keeping the same steering wheel vector size, we tuned the
different parameters of the facial expression recognition and evaluated the classification
accuracies as shown in Figure 20. This figure shows that by using conjunctive operation, we
obtain a significant increase in accuracy as compared to its corresponding disjunctive operation.
However, due to the limitations of decision level integration we discussed previously, it does not
give a performance gain over the facial expression based drowsiness detection system.
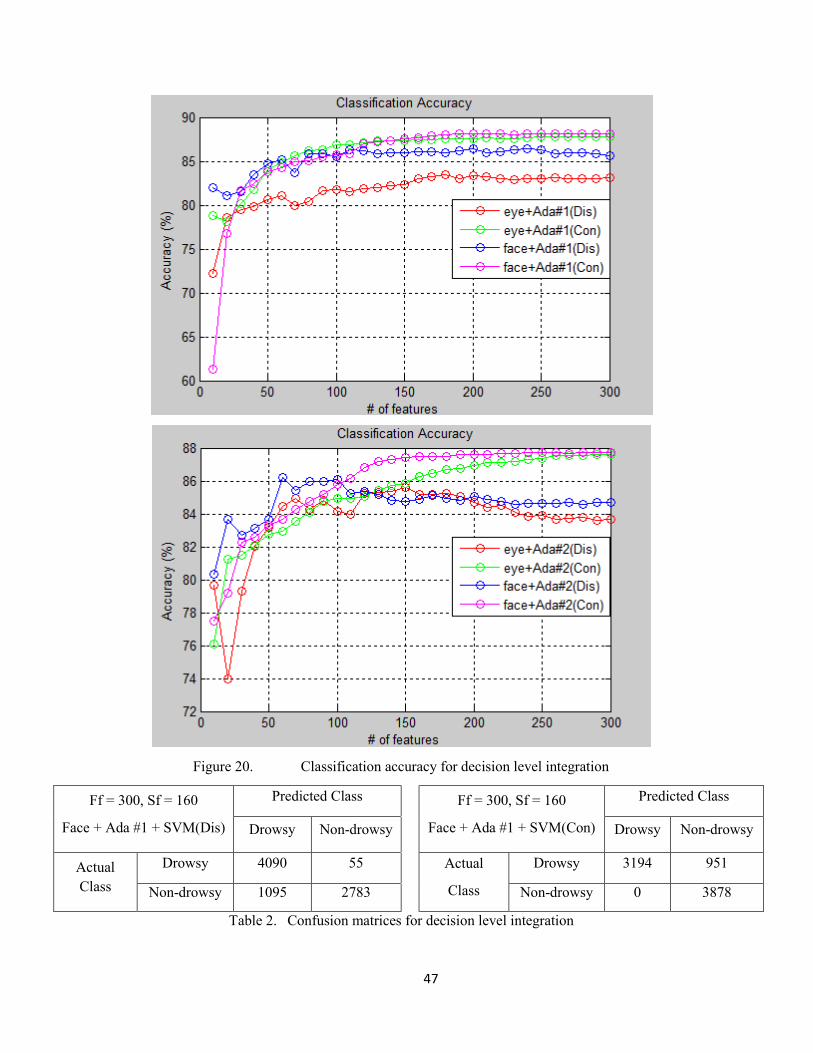
47
Figure 20. Classification accuracy for decision level integration
Ff = 300, Sf = 160
Face + Ada #1 + SVM(Dis)
Predicted Class Ff = 300, Sf = 160
Face + Ada #1 + SVM(Con)
Predicted Class
Drowsy Non-drowsy Drowsy Non-drowsy
Actual
Class
Drowsy 4090 55 Actual
Class
Drowsy 3194 951
Non-drowsy 1095 2783 Non-drowsy 0 3878
Table 2. Confusion matrices for decision level integration

48
As can be seen from the false positives and false negatives of the confusion matrices in Table 2,
the disjunctive method declares the state as drowsy if either of the methods outputs drowsy. This
implies that it penalizes more non-drowsy episodes than drowsy episodes and, hence, generates
large false positives. The conjunctive method declares the state as drowsy only if both methods
output a drowsy state and, hence, gives large false positives.
d. Feature Level Integration
For the feature level integration, we added the steering wheel data features as additional inputs to
the facial features. In the same way we did for the decision level integration, we used vector size
of 160 features of steering wheel data which gave us the maximum accuracy in the steering wheel
data analysis and then we varied the number of facial features and the classification parameter
settings to evaluate the classification accuracy of the system. Figure 21 shows that classification
accuracy for the different parameter settings increases at a rapid rate until the number of facial
features reaches 150 and then varies slowly afterwards. We can also infer from the graph that
using the detected face region as ROI gives better classification accuracy than the eye region.
This has also been true for the facial expression and decision level integration detection methods.
We can also see that by integrating the two systems at feature level, there is appreciable
performance gain attained over the facial expression and steering wheel data analysis. We
achieved a maximum accuracy of 98.75% for 250 facial features selected with averaging
threshold computation, face region used as a ROI and SVM with RBF kernel used for
classification.
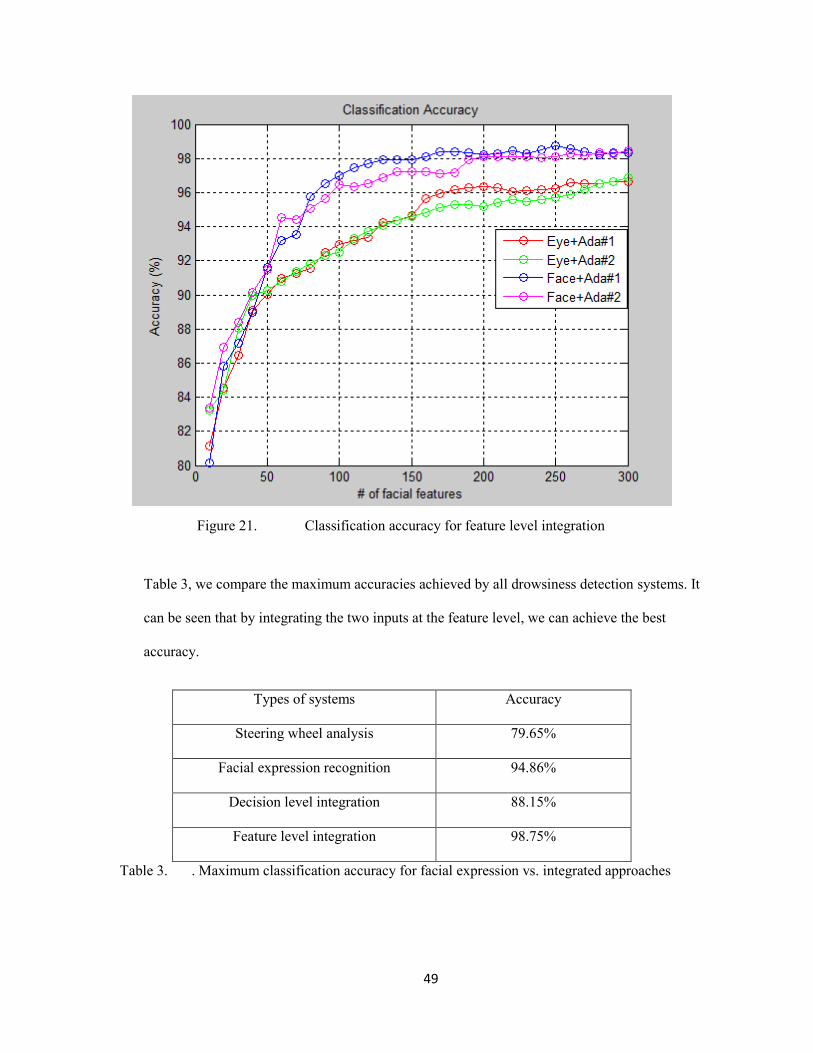
49
Figure 21. Classification accuracy for feature level integration
Table 3, we compare the maximum accuracies achieved by all drowsiness detection systems. It
can be seen that by integrating the two inputs at the feature level, we can achieve the best
accuracy.
Types of systems Accuracy
Steering wheel analysis 79.65%
Facial expression recognition 94.86%
Decision level integration 88.15%
Feature level integration 98.75%
Table 3. . Maximum classification accuracy for facial expression vs. integrated approaches

50
6.3.2. Single Frame vs. HMM Based Drowsiness Detection
For this experiment, we collected a larger video data from five different subjects driving in
drowsy and non-drowsy scenarios. In the training stage, we have selected 2/3 of the labeled video
data (8782 non-drowsy and 9000 drowsy images). For testing, 1/3 of the image frames of the
video data recorded (4394 non-drowsy images and 4504 drowsy images) have been used. By
having larger data samples from many subjects, we incorporated different variations in transitions
of behavioral patterns during drowsy and non-drowsy driving.
a. Single Frame Based Drowsiness Detection
We evaluated the classification accuracies for the newly collected data in the same way we did in
the last section. Figure 22 depicts the variation in classification accuracies of the cases of
Averaging and Searching Maximum Adaboost threshold computations respectively by varying
the number of facial features from 10 to 300, choice of ROI as either eye or face region and
classification technique as either Adaboost or SVM. There is a decrease in overall accuracy as
compared to the previous classification results since we have a larger and more varied video data.
We can also see a clear advantage of using face region as ROI instead of the eye region which is
also seen in the previous classification results. In general, it shows similar characteristics as in the
plots of the previous section.

51
Figure 22. Classification accuracy for single frame based drowsiness detection
b. HMM based Drowsiness Detection
Next, we implemented the dynamic approach of recognizing drowsy and non-drowsy facial
expressions from sequences of images. We trained two HMMs for drowsy and non-drowsy
scenarios with similar sets of training image sequences. We keep the number of features at 300
which is the maximum number of features selected and the window size 15 which is the same as
the frame rate of the video recorded.
We varied the number of observation symbols and the hidden states with a range of 2to 20 each
and evaluated the classification accuracies for different combinations. In the sets of figures from
Figure 23 – 28 shown below, we have plotted the classification accuracies by varying the
observation symbols while keeping the number of hidden states constant. In each case, the
classification accuracy has roughly similar pattern of variation for the different number of hidden
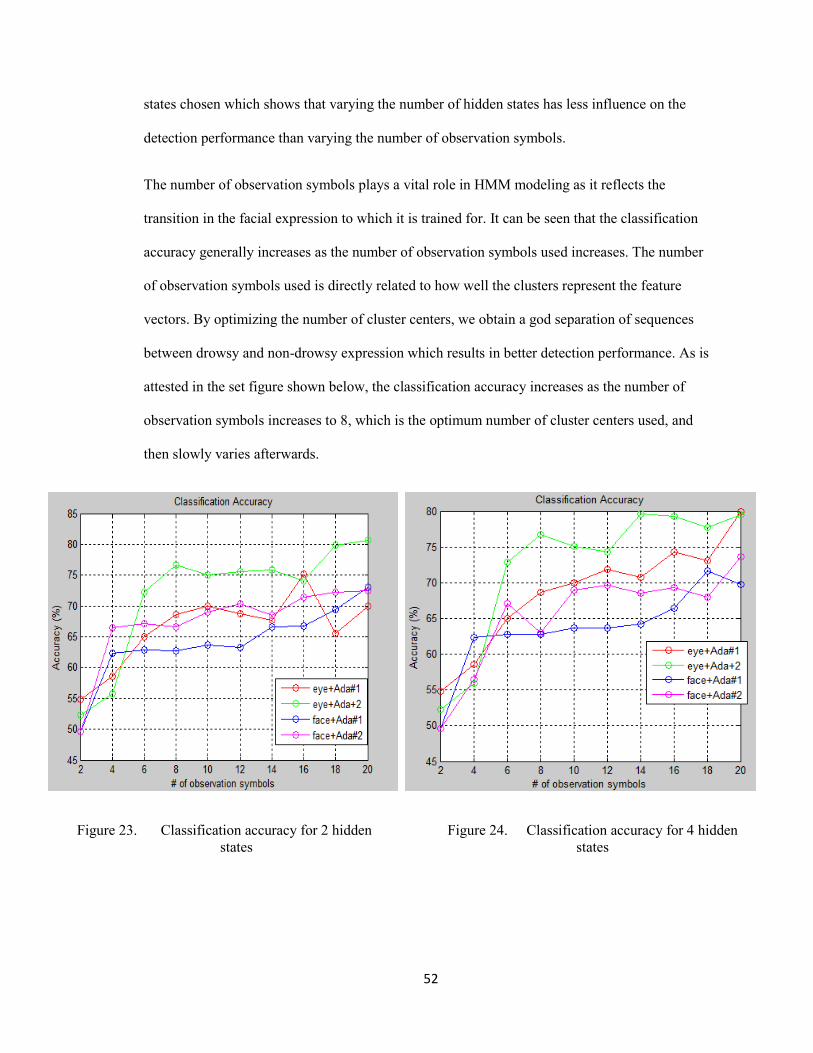
52
states chosen which shows that varying the number of hidden states has less influence on the
detection performance than varying the number of observation symbols.
The number of observation symbols plays a vital role in HMM modeling as it reflects the
transition in the facial expression to which it is trained for. It can be seen that the classification
accuracy generally increases as the number of observation symbols used increases. The number
of observation symbols used is directly related to how well the clusters represent the feature
vectors. By optimizing the number of cluster centers, we obtain a god separation of sequences
between drowsy and non-drowsy expression which results in better detection performance. As is
attested in the set figure shown below, the classification accuracy increases as the number of
observation symbols increases to 8, which is the optimum number of cluster centers used, and
then slowly varies afterwards.
Figure 23. Classification accuracy for 2 hidden
states
Figure 24. Classification accuracy for 4 hidden
states

53
Figure 25. Classification accuracy for 8 hidden
states
Figure 26. Classification accuracy for 12 hidden
states
..
Figure 27. Classification accuracy for 16 hidden
states
Figure 28. Classification accuracy for 20 hidden
states
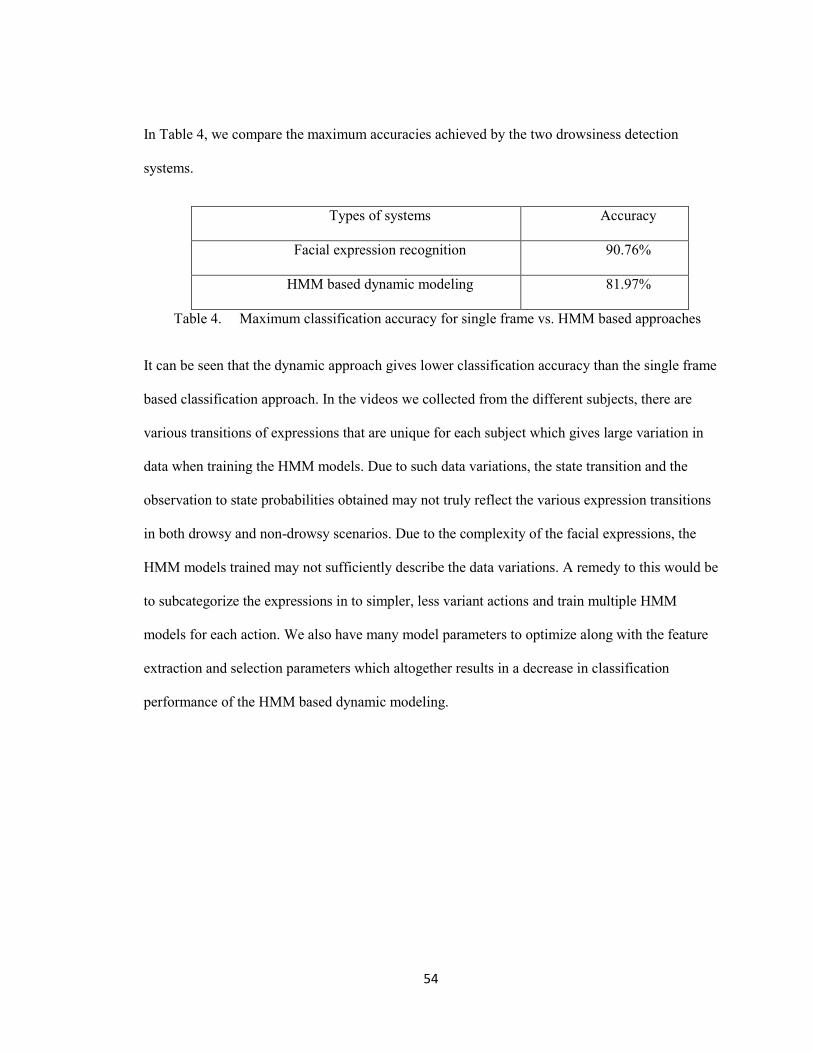
54
In Table 4, we compare the maximum accuracies achieved by the two drowsiness detection
systems.
Types of systems Accuracy
Facial expression recognition 90.76%
HMM based dynamic modeling 81.97%
Table 4. Maximum classification accuracy for single frame vs. HMM based approaches
It can be seen that the dynamic approach gives lower classification accuracy than the single frame
based classification approach. In the videos we collected from the different subjects, there are
various transitions of expressions that are unique for each subject which gives large variation in
data when training the HMM models. Due to such data variations, the state transition and the
observation to state probabilities obtained may not truly reflect the various expression transitions
in both drowsy and non-drowsy scenarios. Due to the complexity of the facial expressions, the
HMM models trained may not sufficiently describe the data variations. A remedy to this would be
to subcategorize the expressions in to simpler, less variant actions and train multiple HMM
models for each action. We also have many model parameters to optimize along with the feature
extraction and selection parameters which altogether results in a decrease in classification
performance of the HMM based dynamic modeling.

55
CHAPTER VII
APPLICATION OF DROWSINESS DETECTION IN DRIVER ASSISTANT
SYSTEMS
In this chapter, we present one application of our integrated drowsiness detection system in a
semi-autonomous driving mechanism which allows the car to drive autonomously when the
driver gets drowsy. The research is conducted in a small-scaled Intelligent Transportation System
(ITS) testbed [58] which can simulate real traffic environments, human driving experience,
autonomous driving and vehicle communications. This is preferred for initial study and reliability
tests while conducting ITS researches because using real vehicles poses significant cost in
modifying it for the research and a fail in the experiment can have great risks to drivers, vehicles
or nearby people.
7.1. Small-scaled Intelligent Transportation System (ITS) Testbed
The small-scaled ITS testbed is comprised of a set of hardware devices which includes an arena,
an indoor localization system, automated RC cars, a roadside monitoring facility and a server as
shown in Figure 29.
The arena is a wooden board with dimension of 16 feet by 12 feet which can mimic real
street environments. The carpet can imitate the friction from the real road and it has an
intersection with cross walks, street lanes, sidewalks and turning curves at an
approximate ratio of 1 to 14 (the ratio of the RC car to real car).

56
Figure 29. Overview of the ITS testbed.
The indoor localization system is an Opti-Track system manufactured by Natural Point
Inc[59]. It mimics the real world GPS system and localizes the RC cars.
The RC cars are toys cars with modified servo motor and control parts which can be
controlled either autonomously or manually. In autonomous driving, the server generates
commands based on the designed trajectory and the current location of the RC car. In
human or manual driving, commands are generated based on the steering data from the
Logitech G27 controller controlled by the driver. In order for the driver to have real
driving experience, a mini camera was placed on top of the RC car’s hood and it streams
the image continuously to the server. The whole human-driving setup is shown Figure 30.
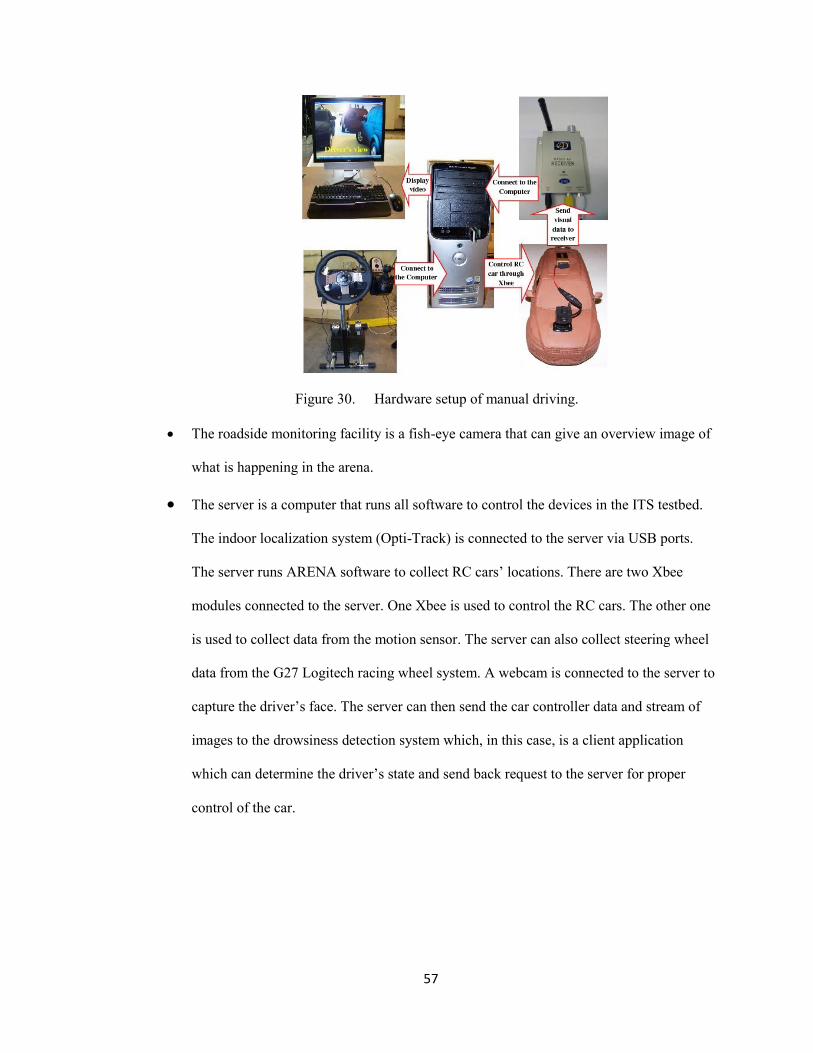
57
Figure 30. Hardware setup of manual driving.
The roadside monitoring facility is a fish-eye camera that can give an overview image of
what is happening in the arena.
The server is a computer that runs all software to control the devices in the ITS testbed.
The indoor localization system (Opti-Track) is connected to the server via USB ports.
The server runs ARENA software to collect RC cars’ locations. There are two Xbee
modules connected to the server. One Xbee is used to control the RC cars. The other one
is used to collect data from the motion sensor. The server can also collect steering wheel
data from the G27 Logitech racing wheel system. A webcam is connected to the server to
capture the driver’s face. The server can then send the car controller data and stream of
images to the drowsiness detection system which, in this case, is a client application
which can determine the driver’s state and send back request to the server for proper
control of the car.

58
7.2. Manual to Autonomous Switching Control
The driving mechanism, the server software and switching control was developed by Tran, a
member in our lab. In the switching control, the driver first controls the RC car manually by
looking at the video streamed from the mini camera on the RC car’s hood. His facial images are
captured by the webcam and sent to the client application. The overall setup is displayed in
Figure 31.
Figure 31. Manual/Autonomous switching experimental setup.
This client application always monitors the driver’s state. If the driver is non-drowsy, the client
sends request of keeping the driver control the RC car. If the driver is drowsy, the client can
request the server to switch to autonomous driving along a predefined path of a figure eight
trajectory. The results of the switching control can be displayed by plotting the RC car’s locations
in Figure 32. The RC car’s trajectories during manual driving are plotted in blue and green curve
while the trajectory during autonomous driving is plotted in red curve. The RC car was first
placed at the point (-250, 1000) and manually controlled by the driver to run along the blue curve.
The end of the blue curve indicates the point the driver gets drowsy and this is also the point
where the server autonomously controls the RC car and starts the red curve. The end of the red

59
curve indicates the switching point where the driver awoke and started driving manually along the
green curve. We can also observe that the switching is pretty smooth since the drowsiness
detection is in real-time.
Figure 32. Trajectories of the RC car.
60
CHAPTER VIII
CONCLUSION AND FUTURE WORK
Our research was undertaken with a main intent to develop an unobtrusive, low cost and reliable
drowsiness detection system that can easily be integrated with driver assistant systems. Among
the different types of drowsiness measuring techniques that have been proposed by various
researchers, behavioral measuring methods have been shown to be both practical and effective for
commercial vehicle monitoring systems. Basing our grounds on the various related researches
that have been done thus far; we proposed a behavioral drowsiness detection method that focuses
on the variation in facial motion of a driver.
8.1. Conclusion
In this thesis, we have implemented a drowsiness detection method using facial expression
recognition. We have developed efficient face detection and tracking method using a
multithreaded integration of Viola-Jones face detection algorithm and Camshift tracking which
are implemented in OpenCV. Gabor features can show the patterns in the muscle movements of
the driver’s facial expressions and have been extracted from the detected face region through
Gabor filter convolutions. We have also implemented Adaboost weak learning algorithm in order
to exclude a large majority of the Gabor features and focus on a small set of critical features
sufficient for classification.
As effective as it can be in most situations, the proposed facial expression based drowsiness
detection method can be affected by different factors and performs poorly in certain situation. In

61
order to improve the method, we proposed two different ways of integrating it with steering
wheel data analysis: decision level and feature level integration. In decision level integration, the
outputs from both the facial expression and steering wheel based drowsiness detection methods
are logically combined to get a final decision. In the feature level integration the facial features
extracted from the Adaboost are combined with the steering wheel features and classification is
done up on the combined feature vector. We have also proposed a new method of utilizing the
temporal information of facial expressions through dynamic modeling. In this approach, we
quantized the facial feature vectors to discrete values by using clustering techniques and
developed two HMM models for drowsy and non-drowsy scenarios.
We have demonstrated the experimental results for each method proposed and optimized their
parameter settings. By collecting training and testing data from different subjects, we evaluated
the performance of the system under different conditions and settings. The improvement in
performance due to the integration with the steering wheel data is attested through the increase in
classification accuracy of the system. We have also integrated the system with a small-scaled
Intelligent Transportation System and shown its applicability in switching of manual to
autonomous driving during driver’s drowsiness.
8.2. Future Work
In the future, there are certain improvements that can be made to the current system. It can also be
conceptually expanded to include more input sources of information, new approaches of
processing and better ways of decision making.
In order to reduce the influence of ambient light on the quality of input images, arranging a
combination of normal and IR cameras to account for both the day and night times can make the
system more robust. The Adaboost feature selection method can further be improved by
employing better threshold computation methods and non-linear region based weak classifiers
62
operating on a group of pixels. The correlation between the variation in steering wheel movement
and the behavioral patterns of a driver during drowsy and non-drowsy episodes can be thoroughly
studied and better ways of integrating these sources can be further explored. The performance of
the HMM based drowsiness detection method can also be improved by exploring better ways of
clustering the selected feature vectors and conducting further studies on modeling of drowsy and
non-drowsy expressions. Currently, the system has been trained and tested using inputs from few
subjects among our lab members. In order to increase the robustness of the system, collecting
more training and testing data from more number of subjects will help the recognition
performance.
By integrating our method with a semi-autonomous intelligent transportation system in a
controlled experimental setup, we have successfully shown its practicality in driver assistant
systems. The next step in the evaluation of the system is the development of a prototype system
that can be deployed in an actual vehicle.
8.3. Further Research Opportunities
This research lays the foundation for further studies in the development of behavioral based non-
invasive drowsiness detection systems. Such drowsiness detection systems can be very applicable
not only in driver monitoring systems but also in different areas of work where the attention of
the person is critical. However, many of the researches that have been conducted on drowsiness
detection are focused on driver’s drowsiness and prevention of car accidents due to drowsiness.
One of the main attributes of behavioral based drowsiness detection systems is that its only
source of input is a camera placed in front of the user. It is noninvasive and will in no way
interfere with the work of the user. This makes it an excellent choice to monitor the alertness of
workers in critical sectors where due attention is required such as surveillance systems of highly
secured facilities, air traffic control radar systems, maritime navigational radar systems, weather

63
surveillance systems and so on. Another very recent path of research in relation to our system is
using behavioral measuring techniques to determine the attention level of students in classrooms
while the teacher is giving a lecture[60]. The feedback can periodically be analyzed and can be
used by teachers to improve their teaching methods and interactions with their students.
64
REFERENCES
[1]. Hartman, K. and J. Strasser, Saving Lives Through Advanced Vehicle Safety
Technology:Intelligent Vehicle Initiative Final Report. 2005, Department of
Transportation: Washington, DC. p. 12.
[2]. A., E., M. A., and S. R., Drowsy and Fatigued Driving Problem Significance and
Detection Based on Driver Control Functions. Handbook of Intelligent Vehicles:
SpringerReference, ed. A. Eskandarian. 2012, Berlin, Germany: Springer-Verlag
Berlin Heifelberg.
[3]. Drivers Beware: Getting Enough Sleep Can Save Your Life this Memorial Day.
2010, National Sleep Foundation: Arlington, VA.
[4]. Husar, P., Eyetracker warns against momentary driver drowsiness. 2010,
Fraunhofer-Gesellschaft: Munich, Germany
[5]. Sahayadhas, A., K. Sundaraj, and M. Murugappan, Detecting driver drowsiness
based on sensors: a review. Sensors (Basel), 2012. 12(12): p. 16937-53.
[6]. Liu, C.C., S.G. Hosking, and M.G. Lenne, Predicting driver drowsiness using
vehicle measures: recent insights and future challenges. J Safety Res, 2009.
40(4): p. 239-45.
[7]. Forsman, P.M., et al., Efficient driver drowsiness detection at moderate levels of
drowsiness. Accident Analysis & Prevention, 2013. 50(0): p. 341-350.
[8]. Eskandarian, A. and A. Mortazavi. Evaluation of a Smart Algorithm for
Commercial Vehicle Driver Drowsiness Detection. in Intelligent Vehicles
Symposium, 2007 IEEE. 2007.
[9]. Eskandarian, A. and R. Sayed, Unobtrusive drowsiness detection by neural
network learning of driver steering. Proceedings of the Institution of Mechanical
Engineers, Part D: Journal of Automobile Engineering, 2001. 215(9): p. 969-975.
[10]. Eskandarian, A., et al., Advanced Driver Fatigue Research. 2007.
[11]. Vural, E., Video Based Detection of Driver Fatigue, in Graduate School of
Engineering and Natural Sciences. 2009, Sabanci University: Istanbul, Turkey.
[12]. Khushaba, R.N., et al., Driver Drowsiness Classification Using Fuzzy Wavelet-
Packet-Based Feature-Extraction Algorithm. Biomedical Engineering, IEEE
Transactions on, 2011. 58(1): p. 121-131.
65
[13]. Akin, M., et al., Estimating vigilance level by using EEG and EMG signals.
Neural Computing and Applications, 2008. 17(3): p. 227-236.
[14]. Kurt, M.B., et al., The ANN-based computing of drowsy level. Expert Systems
with Applications, 2009. 36(2, Part 1): p. 2534-2542.
[15]. Patel, M., et al., Applying neural network analysis on heart rate variability data to
assess driver fatigue. Expert Systems with Applications, 2011. 38(6): p. 7235-
7242.
[16]. Fu-Chang, L., et al., Generalized EEG-Based Drowsiness Prediction System by
Using a Self-Organizing Neural Fuzzy System. Circuits and Systems I: Regular
Papers, IEEE Transactions on, 2012. 59(9): p. 2044-2055.
[17]. Hu, S. and G. Zheng, Driver drowsiness detection with eyelid related parameters
by Support Vector Machine. Expert Systems with Applications, 2009. 36(4): p.
7651-7658.
[18]. Vural, E., et al., Machine Learning Systems for Detecting Driver Drowsiness, in
In-Vehicle Corpus and Signal Processing for Driver Behavior, K. Takeda, et al.,
Editors. 2009, Springer US. p. 97-110.
[19]. Bergasa, L.M., et al., Real-time system for monitoring driver vigilance. Intelligent
Transportation Systems, IEEE Transactions on, 2006. 7(1): p. 63-77.
[20]. McKinley, R.A., et al., Evaluation of eye metrics as a detector of fatigue. Hum
Factors, 2011. 53(4): p. 403-14.
[21]. Danghui, L., et al. Drowsiness Detection Based on Eyelid Movement. in
Education Technology and Computer Science (ETCS), 2010 Second International
Workshop on. 2010.
[22]. Zhang, Z. and J. Zhang, A new real-time eye tracking based on nonlinear
unscented Kalman filter for monitoring driver fatigue. Journal of Control Theory
and Applications, 2010. 8(2): p. 181-188.
[23. Dinges, D.F. and R. Grace, PERCLOS: A valid psychophysiological measure of
alertness as assessed by psychomotor vigilance. 1998, Federal Highway
Administration: Washington, DC.
[24]. Xing, L., et al. A new method for detecting fatigue driving with camera based on
OpenCV. in Wireless Communications and Signal Processing (WCSP), 2011
International Conference on. 2011.
[25]. Garcia, I., et al. Vision-based drowsiness detector for real driving conditions. in
Intelligent Vehicles Symposium (IV), 2012 IEEE. 2012.
[26]. Flores, M.J., J.M. Armingol, and A. Escalera. Real-time drowsiness detection
system for an intelligent vehicle. in Intelligent Vehicles Symposium, 2008 IEEE.
2008.
[27]. Cristianini, N. and J. Shawe-Taylor, An introduction to support Vector Machines:
and other kernel-based learning methods. 2000: Cambridge University Press.
189.
[28]. Chang, C.C. and C.J. Lin, LIBSVM: A library for support vector machines. ACM
Transactions on Intelligent Systems and Technology, 2013. 2(3): p. 27:1-27:27.
[29]. Vural, E., et al., Drowsy Driver Detection Through Facial Movement Analysis, in
Human–Computer Interaction, M. Lew, et al., Editors. 2007, Springer Berlin
Heidelberg. p. 6-18.
66
[30]. Smith, P., M. Shah, and N. da Vitoria Lobo, Determining driver visual attention
with one camera. Intelligent Transportation Systems, IEEE Transactions on,
2003. 4(4): p. 205-218.
[31]. Xuetao, Z., et al. Head pose estimation using isophote features for driver
assistance systems. in Intelligent Vehicles Symposium, 2009 IEEE. 2009.
[32]. Murphy-Chutorian, E. and M.M. Trivedi, Head Pose Estimation and Augmented
Reality Tracking: An Integrated System and Evaluation for Monitoring Driver
Awareness. Intelligent Transportation Systems, IEEE Transactions on, 2010.
11(2): p. 300-311.
[33]. Haisong, G. and J. Qiang. An automated face reader for fatigue detection. in
Automatic Face and Gesture Recognition, 2004. Proceedings. Sixth IEEE
International Conference on. 2004.
[34]. Ekman, P., W.V. Friesen, and J.C. Hager. Facial Action Coding System: The
Manual. 2002; On CD ROM].
[35]. Bartlett, M.S., et al., Automatic recognition of facial actions in spontaneous
expressions. Journal of Multimedia, 2006. 1(6): p. 22-35.
[36]. Yin, B.-C., X. Fan, and Y.-F. Sun, Multiscale dynamic features based driver
fatigue detection. International Journal of Pattern Recognition and Artificial
Intelligence, 2009. 23(03): p. 575-589.
[37]. Freund, Y. and R.E. Schapire, A Decision-Theoretic Generalization of On-Line
Learning and an Application to Boosting. Journal of Computer and System
Sciences, 1997. 55(1): p. 119-139.
[38]. Eskandarian, A., et al., Advanced Driver Fatigue Research 2007, U.S.
Department of Transportation: Washington, DC. p. 1-210.
[39]. Cheng, B., et al., Driver drowsiness detection based on multisource information.
Human Factors and Ergonomics in Manufacturing & Service Industries, 2012.
22(5): p. 450-467.
[40]. Bradski, G., The OpenCV Library. Dr. Bobb's Journal of Software Tools, 2000.
25(11): p. 120-+.
[41]. Viola, P. and M. Jones. Rapid object detection using a boosted cascade of simple
features. in Computer Vision and Pattern Recognition, 2001. CVPR 2001.
Proceedings of the 2001 IEEE Computer Society Conference on. 2001.
[42]. Donghe, Y. and X. Jinsong. Face Tracking Based on Camshift Algorithm and
Motion Prediction. in Intelligent Systems and Applications, 2009. ISA 2009.
International Workshop on. 2009.
[43]. Allen, J.G., R.Y.D. Xu, and J.S. Jin, Object tracking using CamShift algorithm
and multiple quantized feature spaces, in Proceedings of the Pan-Sydney area
workshop on Visual information processing. 2004, Australian Computer Society,
Inc. p. 3-7.
[44]. Movellan, J.R., Tutorial on Gabor Filters. Tutorial paper
http://mplab.ucsd.edu/tutorials/pdfs/gabor.pdf, 2008.
[45]. Oshidari, B. and B.N. Araabi. An effective feature extraction method for facial
expression recognition using adaptive Gabor wavelet. in Progress in Informatics
and Computing (PIC), 2010 IEEE International Conference on. 2010.
[46]. Freund, Y. and R. Schapire, A short introduction to boosting. Japonese Society
for Artificial Intelligence, 1999. 14(5): p. 771-780.

67
[47]. Shen, L. and L. Bai, AdaBoost Gabor Feature Selection for Classification. 2004.
[48]. Burges, C.C., A Tutorial on Support Vector Machines for Pattern Recognition.
Data Mining and Knowledge Discovery, 1998. 2(2): p. 121-167.
[49]. Chih-Wei Hsu, Chih-Chung Chang, and C.-J. Lin, A Practical Guide to Support
Vector Classification. 2003.
[50]. Bassili, J.N., Emotion recognition: the role of facial movement and the relative
importance of upper and lower areas of the face. J Pers Soc Psychol, 1979.
37(11): p. 2049-58.
[51]. Cohen, I., et al., Facial expression recognition from video sequences: temporal
and static modeling. Comput. Vis. Image Underst., 2003. 91(1-2): p. 160-187.
[52]. Punitha, A. and M.K. Geetha, HMM Based Real Time Facial Expression
Recognition. International Journal of Emergine Technology and Advanced
Engineering, 2013. 3(1): p. 180 - 185.
[53]. Cohen, I., A. Garg, and T.S. Huang. Emotion Recognition from Facial
Expressions using MultilevelHMM. in in In Neural Information Processing
Systems. 2000.
[54]. Xuefeng, J. A facial expression recognition model based on HMM. in Electronic
and Mechanical Engineering and Information Technology (EMEIT), 2011
International Conference on. 2011.
[55]. Rabiner, L., A tutorial on hidden Markov models and selected applications in
speech recognition. Proceedings of the IEEE, 1989. 77(2): p. 257-286.
[56]. G27 Racing Wheel System Getting Started Guide. Available from:
http://www.logitech.com/assets/47059/g27-racing-wheel-quickstart-guide.pdf.
[57]. SimuRide Home Edition (HE) Driving Simulation Software manual. Available
from: http://www.aplusbsoftware.com/simuride-he.html.
[58]. Hung Manh, L., et al., Development of a Small-Scale Research Platform for
Intelligent Transportation Systems. Intelligent Transportation Systems, IEEE
Transactions on, 2012. 13(4): p. 1753-1762.
[59]. Optitrack: V100-R2. 2013; Available from:
http://www.naturalpoint.com/optitrack/products/v100-r2/specs.html
[60]. Montgomery, S., et al. Engagence. 2013; Available from:
http://labs.sensorstar.com/sensorstar-hq.html.
.

VITA
Eyosiyas Tadesse
Candidate for the Degree of
Master of Science
Thesis: DROWSINESS DETECTION FOR DRIVER ASSISTANCE
Major Field: Electrical Engineering
Biographical:
Education:
Completed the requirements for the Master of Science in Electrical Engineering
at Oklahoma State University, Stillwater, Oklahoma in December, 2013.
Completed the requirements for the Bachelor of Science in Electrical
Engineering at Jimma University, Jimma, Ethiopia in 2010.
Experience:
Computer Vision
Pattern Recognition
Concurrent Programming
Software Development
System Design, Implementation, Integration and Testing
Professional Memberships:
Phi Kappa Phi Honor Society
Golden Key International Honor Society