
Drivers of Wearable Computing Adoption - pearl
294
University of Plymouth PEARL https://pearl.plymouth.ac.uk 04 University of Plymouth Research Theses 01 Research Theses Main Collection 2018 Drivers of Wearable Computing Adoption: An Empirical Study of Success Factors Including IT Security and Consumer Behaviour-Related Aspects Gribel, Lena http://hdl.handle.net/10026.1/11662 University of Plymouth All content in PEARL is protected by copyright law. Author manuscripts are made available in accordance with publisher policies. Please cite only the published version using the details provided on the item record or document. In the absence of an open licence (e.g. Creative Commons), permissions for further reuse of content should be sought from the publisher or author.
-
Upload
khangminh22 -
Category
Documents
-
view
0 -
download
0
Transcript of Drivers of Wearable Computing Adoption - pearl
University of Plymouth
PEARL https://pearl.plymouth.ac.uk
04 University of Plymouth Research Theses 01 Research Theses Main Collection
2018
Drivers of Wearable Computing
Adoption: An Empirical Study of
Success Factors Including IT Security
and Consumer Behaviour-Related
Aspects
Gribel, Lena
http://hdl.handle.net/10026.1/11662
University of Plymouth
All content in PEARL is protected by copyright law. Author manuscripts are made available in accordance with
publisher policies. Please cite only the published version using the details provided on the item record or
document. In the absence of an open licence (e.g. Creative Commons), permissions for further reuse of content
should be sought from the publisher or author.

COPYRIGHT STATEMENT This copy of the thesis has been supplied on condition that anyone
who consults it is understood to recognise that its copyright rests
with its author and that no quotation from the thesis and no
information derived from it may be published without the author's
prior consent.


University of Plymouth
Drivers of Wearable Computing Adoption:
An Empirical Study of Success Factors Including IT Security and
Consumer Behaviour-Related Aspects
by
Lena Gribel
A thesis submitted to the University of Plymouth
in partial fulfilment for the degree of
DOCTOR OF PHILOSOPHY
School of Computing, Electronics and Mathematics
Faculty of Science & Engineering
June 2018


V
Acknowledgments
This doctoral thesis would not have been possible without the advice and support of several people. First and
foremost, I would like to express my sincere gratitude to Prof. Stefanie Regier. It has been an honor to be her
first Ph.D. student. I am deeply grateful for her willingness to supervise a work in an emerging stream of
literature, for her invaluable support, professionalism, motivation and immense knowledge in the field of
empirical market research and consumer behaviour. Stefanie’s constructive suggestions not only guided the
direction of this work, but also helped shaping my personal and professional development. I could not have
imagined a better advisor and mentor for my study.
My sincere thanks also go to my other supervisors Prof. Ingo Stengel and Prof. Steven Furnell who played a
key role in the coordination of the project. I very much appreciate their patience when answering me various
organisational questions and proof reading my papers and thesis. Their continuous support helped me in all the
time of research and writing of this dissertation. In addition, I would like to extend my deepest gratitude to
Prof. Franz Nees and Prof. Udo Müller for the considerable trust they placed in me and the relevant resources
they provided for the research study. Very special thanks has to go to Prof. Karl Dübon, who actually inspired
the idea of doing a doctoral thesis. My gratitude to the members of the committee who accepted to examine
and evaluate my work.
I also owe many thanks to all experts who have participated in the qualitative study. The interviews were very
insightful and strongly supportive of this thesis. I appreciate very much the time and effort necessary to provide
the elaborate answers given.
Last but not the least, I would like to thank my family and my boyfriend Christoph for their unconditional faith
in me. They have always encouraged me to pursue my dreams. Above all, I give my heartfelt thanks to my
parents Olga and Juri. They helped me a lot to reach this stage in my life. The completion of this thesis will
mean a lot to them, so I dedicate this work to my parents, without whose support this work would not have
been possible.

VI
AUTHOR'S DECLARATION
At no time during the registration for the degree of Doctor of Philosophy has the author been
registered for any other University award without prior agreement of the Graduate Committee.
Work submitted for this research degree at the University of Plymouth has not
formed part of any other degree either at the University of Plymouth or at another
establishment.
Relevant scientific seminars and conferences were regularly attended at which work was presented.
Publications:
Proceedings of the Eleventh International Network Conference (INC 2016)
Proceedings of the 2017 European Collaborative Research Conference (CERC 2017)
Presentations at conferences:
Eleventh International Network Conference (INC 2016)
2017 European Collaborative Research Conference (CERC 2017)
Word count of main body of thesis: 80,434
Signed
Date


VIII
Abstract
Drivers of Wearable Computing Adoption: An Empirical Study of Success
Factors Including IT Security and Consumer Behaviour-Related Aspects
Lena Gribel
The recent advances in information technologies have dramatically changed the manner in which people
understand, experience and use IT systems. Wearable computers are emerging new technologies in the evolution
of mobile devices, which introduce a paradigm shift in the field of human computer-interaction. By equipping the
user with computational capabilities, ‘wearables’ provide context-aware and seamlessly integrated on-the-fly
computing across heterogeneous circumstances and irrespective of place and time. Not least the very promising
market prospects for wearable devices imply various unprecedented business opportunities and a vast economic
potential of these socio-technological gadgets. Nonetheless, analysis of the current market situation shows that the
wearable computing sector is still a niche, characterised by low public awareness and a high level of turbulence
and uncertainty. In view of the numerous efforts in the area of innovation, which failed due to a lack of consumer
acceptance, it becomes clear that facilitation of acceptability is a key issue for entrepreneurship. However, up to
now, there is only little scientific research on the acceptance of ubiquitous computing in general and, in particular,
on the latent success factors of the wearable computing phenomenon. At the same time, it is also significant that
personality variables have seldom been examined within the scope of Information Systems research. Therefore,
the overall aim of this study is to deepen understanding of latent psychographic factors that lead to either
acceptance or resistance towards wearable computing. Specifically, a new behavioural model is introduced, which
extends the well-established Technology Acceptance Model (TAM) by explicitly incorporating a dispositional
perspective into the conceptual framework.
By means of an extensive literature review that combines different streams of research, this thesis lays a theoretical
substantiation of the study. Based on the findings from the conceptual work together with the results from an
exploratory study, salient psychological factors are identified and integrated into a coherent system of hypotheses.
The derived cause-effect model conceptualises the behavioural intention to use wearables as a consequence of
cognitive beliefs and personality-related correlates. The validity of the structural model and its measurement
instruments is empirically tested with the aid of a web-based survey that was distributed to a sample of over 500
participants from the target population, of which 474 cases were accepted. The results of the quantitative study
identify the perceived support of health and fitness as well as the perceived enhancement of personal abilities as
strongest individual-level drivers that affect the intention to use wearable technologies. On the contrary, perceived
privacy risk was found to be a major barrier to adoption. Furthermore, the analysis of moderator effects shows that
both the level of personal innovativeness and past experience with wearables indirectly influence benefit
expectations. In other words, innovative individuals and those who are familiar with these technologies are more
likely to develop positive attitudes towards the use of wearable devices.
IX
The empirical findings not only contribute to the existing body of knowledge in Information Systems research, but
also have several important implications for marketing practitioners. Given the dominance of cognitive beliefs in
attitude formation, companies in the wearable sector should focus more on informative issues in their
communication to educate consumers about the main benefits of wearables. For wearables to be perceived as
useful, they should operate even more naturally and unobtrusively than preceding mobile innovations, what clearly
reinforces the significance of human-centred design principles and an implicit human-computer interaction. Since
the study findings reveal that potential breaches in data privacy represent the greatest IT security concern, vendors
should aim at improving consumer attitudes towards their privacy practices. Moreover, considering that risk
perceptions are heavily affected by trusting beliefs, building consumer trust appears to be key in reducing latent
uncertainties and resistance to adoption. In view of the individual differences that were proved to be of behavioural
relevance, it seems furthermore worthwhile to divide the consumer market psychographically into relevant
personality profiles: In the case of wearable computing, especially consumers who score high on the trait of
neuroticism will act as early adopters. By developing target-group oriented communication strategies, marketers
may efficiently approach the key segment of current and prospective wearable computing users.

X
XI
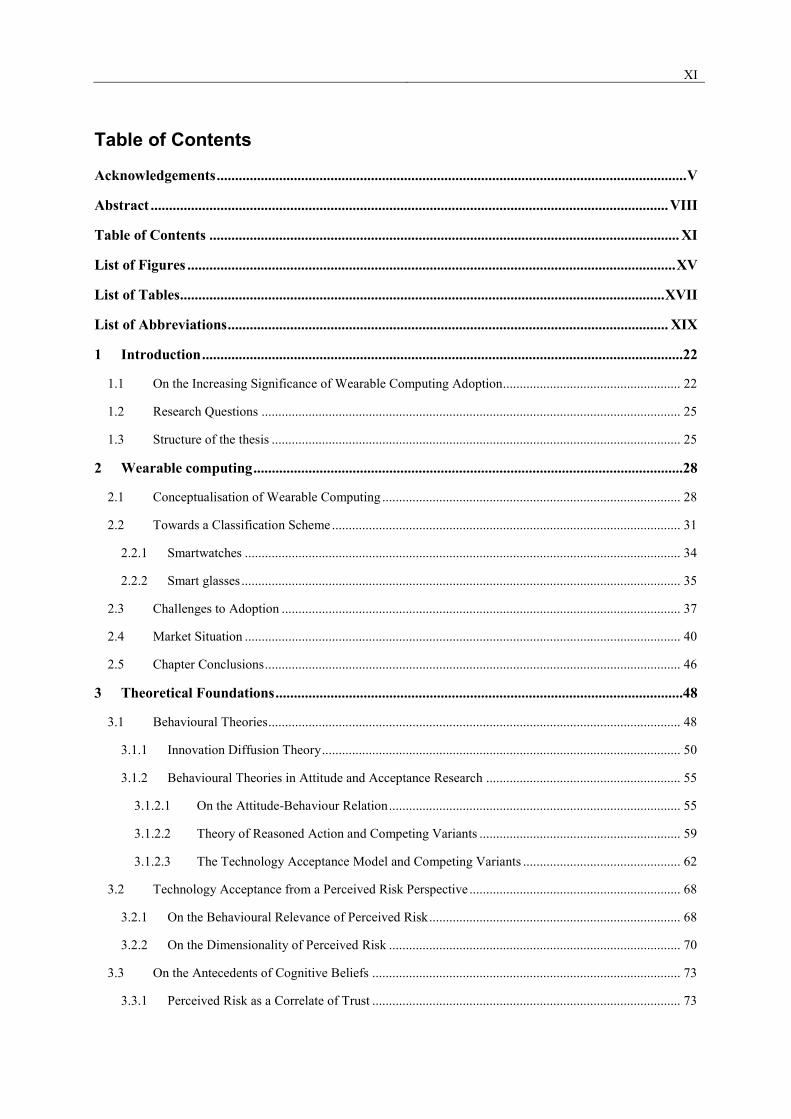
Table of Contents
Acknowledgements ................................................................................................................................ V
Abstract ............................................................................................................................................. VIII
Table of Contents ................................................................................................................................ XI
List of Figures ..................................................................................................................................... XV
List of Tables .................................................................................................................................... XVII
List of Abbreviations ........................................................................................................................ XIX
1 Introduction ...................................................................................................................................22
1.1 On the Increasing Significance of Wearable Computing Adoption..................................................... 22
1.2 Research Questions ............................................................................................................................. 25
1.3 Structure of the thesis .......................................................................................................................... 25
2 Wearable computing .....................................................................................................................28
2.1 Conceptualisation of Wearable Computing ......................................................................................... 28
2.2 Towards a Classification Scheme ........................................................................................................ 31
2.2.1 Smartwatches .................................................................................................................................. 34
2.2.2 Smart glasses ................................................................................................................................... 35
2.3 Challenges to Adoption ....................................................................................................................... 37
2.4 Market Situation .................................................................................................................................. 40
2.5 Chapter Conclusions ............................................................................................................................ 46
3 Theoretical Foundations ...............................................................................................................48
3.1 Behavioural Theories ........................................................................................................................... 48
3.1.1 Innovation Diffusion Theory ........................................................................................................... 50
3.1.2 Behavioural Theories in Attitude and Acceptance Research .......................................................... 55
3.1.2.1 On the Attitude-Behaviour Relation ....................................................................................... 55
3.1.2.2 Theory of Reasoned Action and Competing Variants ............................................................ 59
3.1.2.3 The Technology Acceptance Model and Competing Variants ............................................... 62
3.2 Technology Acceptance from a Perceived Risk Perspective ............................................................... 68
3.2.1 On the Behavioural Relevance of Perceived Risk ........................................................................... 68
3.2.2 On the Dimensionality of Perceived Risk ....................................................................................... 70
3.3 On the Antecedents of Cognitive Beliefs ............................................................................................ 73
3.3.1 Perceived Risk as a Correlate of Trust ............................................................................................ 73
XII
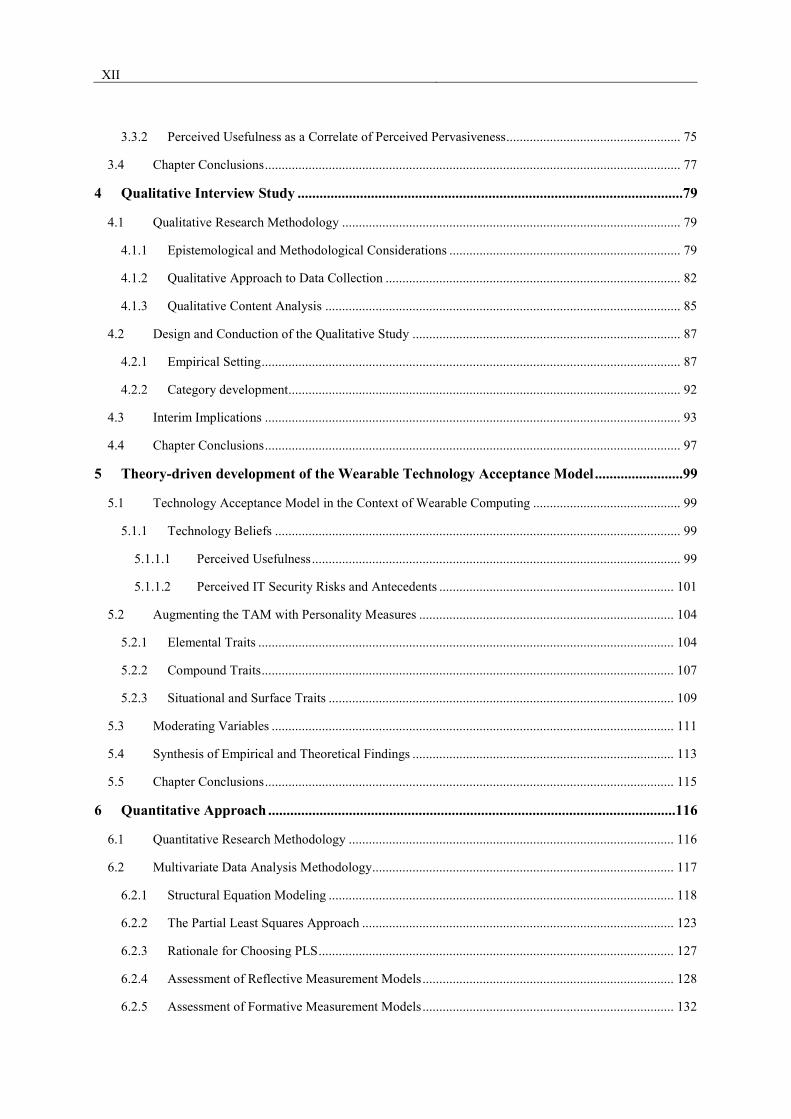
3.3.2 Perceived Usefulness as a Correlate of Perceived Pervasiveness.................................................... 75
3.4 Chapter Conclusions ............................................................................................................................ 77
4 Qualitative Interview Study .........................................................................................................79
4.1 Qualitative Research Methodology ..................................................................................................... 79
4.1.1 Epistemological and Methodological Considerations ..................................................................... 79
4.1.2 Qualitative Approach to Data Collection ........................................................................................ 82
4.1.3 Qualitative Content Analysis .......................................................................................................... 85
4.2 Design and Conduction of the Qualitative Study ................................................................................ 87
4.2.1 Empirical Setting ............................................................................................................................. 87
4.2.2 Category development..................................................................................................................... 92
4.3 Interim Implications ............................................................................................................................ 93
4.4 Chapter Conclusions ............................................................................................................................ 97
5 Theory-driven development of the Wearable Technology Acceptance Model ........................99
5.1 Technology Acceptance Model in the Context of Wearable Computing ............................................ 99
5.1.1 Technology Beliefs ......................................................................................................................... 99
5.1.1.1 Perceived Usefulness .............................................................................................................. 99
5.1.1.2 Perceived IT Security Risks and Antecedents ...................................................................... 101
5.2 Augmenting the TAM with Personality Measures ............................................................................ 104
5.2.1 Elemental Traits ............................................................................................................................ 104
5.2.2 Compound Traits ........................................................................................................................... 107
5.2.3 Situational and Surface Traits ....................................................................................................... 109
5.3 Moderating Variables ........................................................................................................................ 111
5.4 Synthesis of Empirical and Theoretical Findings .............................................................................. 113
5.5 Chapter Conclusions .......................................................................................................................... 115
6 Quantitative Approach ...............................................................................................................116
6.1 Quantitative Research Methodology ................................................................................................. 116
6.2 Multivariate Data Analysis Methodology.......................................................................................... 117
6.2.1 Structural Equation Modeling ....................................................................................................... 118
6.2.2 The Partial Least Squares Approach ............................................................................................. 123
6.2.3 Rationale for Choosing PLS .......................................................................................................... 127
6.2.4 Assessment of Reflective Measurement Models ........................................................................... 128
6.2.5 Assessment of Formative Measurement Models ........................................................................... 132
XIII
6.2.6 Assessment of the Structural Model .............................................................................................. 134
6.2.6.1 Analysis of Moderating Effects ............................................................................................ 137
6.2.6.2 Analysis of Mediating Effects .............................................................................................. 139
6.2.6.3 Analysis of Higher-Order Structures .................................................................................... 140
6.3 Operationalisation of Constructs ....................................................................................................... 143
6.3.1.1 Reflective Measurement Models .......................................................................................... 144
6.3.1.2 Higher-order Constructs ....................................................................................................... 150
6.3.1.3 Formative Measurement Model ............................................................................................ 152
6.4 Chapter Conclusions .......................................................................................................................... 153
7 Empirical Analysis ......................................................................................................................155
7.1 Research Strategy .............................................................................................................................. 155
7.1.1 Sample Design .............................................................................................................................. 157
7.1.2 Sampling Procedure ...................................................................................................................... 159
7.1.3 Questionnaire Development .......................................................................................................... 161
7.1.4 Data Preparation ............................................................................................................................ 164
7.1.5 Structure of the Survey Sample ..................................................................................................... 166
7.2 Empirical Purification of Measurement Models ................................................................................ 170
7.2.1 Validation of Reflective Scales ..................................................................................................... 170
7.2.2 Validation of Formative Scales ..................................................................................................... 174
7.3 Evaluation of the Structural Model .................................................................................................... 176
7.3.1 Mediating Effects .......................................................................................................................... 180
7.3.2 Moderating Effects ........................................................................................................................ 182
7.3.3 Multigroup Analysis ...................................................................................................................... 183
7.3.4 Analysis of Total Effects and Performance of Constructs ............................................................. 189
7.3.5 Summary of Findings .................................................................................................................... 190
7.4 Interpretation of Results .................................................................................................................... 193
8 Discussion of Results ...................................................................................................................202
8.1 Synopsis of Research ......................................................................................................................... 202
8.2 Theoretical Implications .................................................................................................................... 203
8.3 Managerial Implications .................................................................................................................... 205
8.4 Limitations and Directions for Future Research ................................................................................ 210
8.4.1 Limitations .................................................................................................................................... 210
XIV
8.4.2 Avenues for Future Research ........................................................................................................ 212
References ...........................................................................................................................................215
Appendix .............................................................................................................................................262
A.1) Interview Guide ...................................................................................................................................... 262
A.2) Interview Transcript 1 ............................................................................................................................. 263
A.3) Interview Transcript 2 ............................................................................................................................. 266
A.4) Interview Transcript 3 ............................................................................................................................. 269
A.5) Interview Transcript 4 ............................................................................................................................. 272
A.6) Interview Transcript 5 ............................................................................................................................. 274
A.7) Interview Transcript 6 ............................................................................................................................. 276
A.8) Interview Transcript 7 ............................................................................................................................. 278
A.9) Content Analysis Results Matrix ............................................................................................................ 280
B.1) Online Questionnaire .............................................................................................................................. 282
B.2) Cross-loadings ......................................................................................................................................... 292
XV
List of Figures
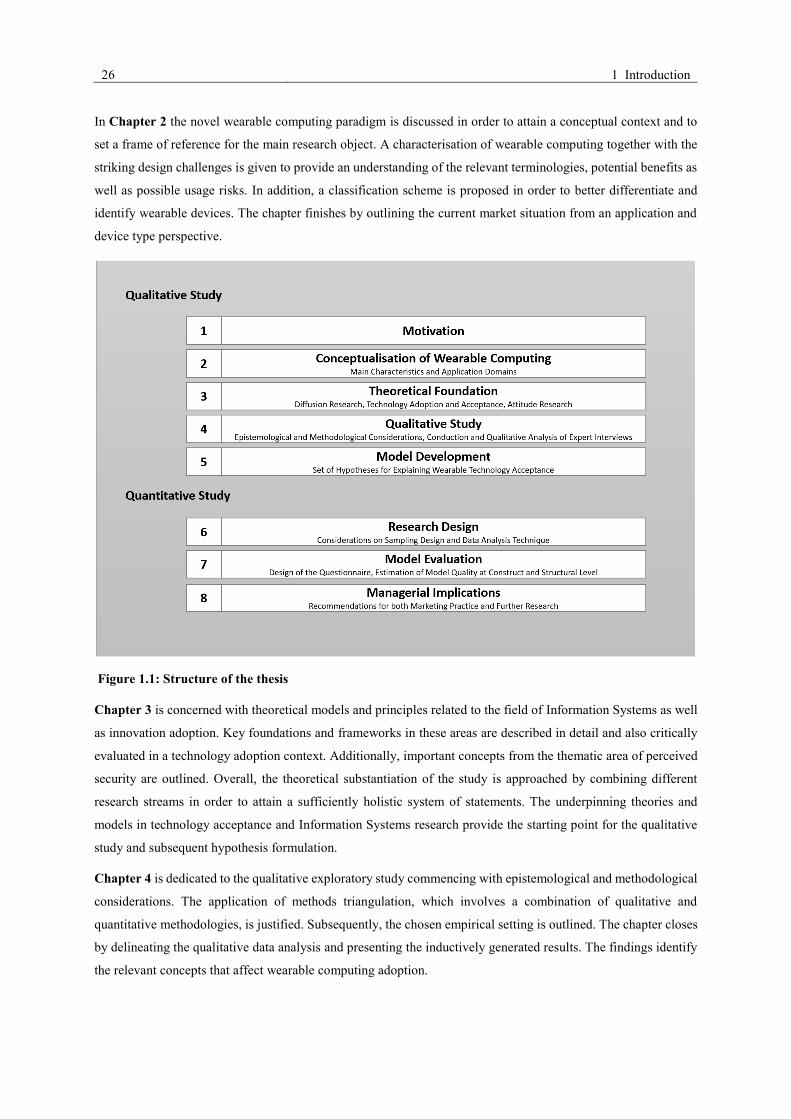
Figure 1.1: Structure of the thesis ......................................................................................................................... 26
Figure 2.1: Taxonomy of wearable computing devices (Based on Alrige et al., 2015, pp. 496-504) ................... 32
Figure 2.2: Design features of Google Glass (Rauschnabel, et al., 2015, p. 636) ................................................. 36
Figure 2.3: Total wearable technology shipments from 2015 to 2021 (IHS Markit, 2014) .................................. 41
Figure 2.4: Penetration of Wearables in four major European smartphone markets (Kantar, 2016) .................... 42
Figure 2.6: Global wearable technology sales forecasts by category from 2014 to 2018 (IDATE, 2014) ............ 44
Figure 2.7: Google Trends analysis for the search terms smartwatches, smart glasses, smart clothes, smart jewellery
and smart shoe (Retrieved on 01.06.2017) ............................................................................................................ 45
Figure 2.8: Consumer awareness of wearable devices in Asia Pacific regions (Tsui, 2015) ................................ 45
Figure 3.1: Overview of relevant adoption models ............................................................................................... 49
Figure 3.2: Diffusion of innovations and adopter categories (Planing 2014, p. 37) .............................................. 51
Figure 3.3: Structural model of attitude (Based on Breckler, 1984 p. 1192) ........................................................ 58
Figure 3.4: Path models for the theory of reasoned action (TRA) and the theory of planned behaviour (TPB) (Based
on Fishbein 2008, p. 838, and Ajzen 1991, p. 182) ............................................................................................... 60
Figure 3.5: Path model of the TAM and its extension (Based on Venkatesh & Davis 2000, p. 188) ................... 63
Figure 3.6: Trust-risk relationships (Based on Lim 2003, p. 217) ........................................................................ 74
Figure 3.7: The perceived pervasiveness construct related to the behavioural intention to use a pervasive
information system (Based on Karaiskos 2009, p. 153) ........................................................................................ 77
Figure 4.1: The process of inductive category development (Mayring 2015, p. 375) ........................................... 86
Figure 5.1: Conceptual frame of the sought structural model based on TAM .................................................... 102
Figure 5.2: Exemplified application of the 3M model ........................................................................................ 106
Figure 5.3: Integration of the 3M model into TAM ............................................................................................ 107
Figure 5.4: Hypothesised moderated relationships ............................................................................................. 112
Figure 5.5: System of hypotheses of the overall Wearable TAM to explain the adoption of wearables ............. 113
Figure 6.1: Formative versus reflective measurement models (Based on Bollen & Lennox, 1991, p. 306) ....... 120
Figure 6.2: Partially-recursive path diagram consisting of two measurement models and an inner structural model
(Notation based on Jöreskog and Sörbom, 1996, p. 6) ........................................................................................ 122
Figure 6.3: General PLS moderator model (Based on Chin, et al., 2003, p. 198) ............................................... 138
Figure 6.4: General PLS mediation model (Based on Baron & Kenny, 1986, p. 1176) ..................................... 140
Figure 6.5: Possible operationalisation approaches in second-order factor models (Jarvis, et al., 2003 p. 205) . 141
Figure 7.1: Comparison of gender and age distributions .................................................................................... 167
Figure 7.2: Distribution of respondent’s educational level ................................................................................. 168

XVI
Figure 7.3: Descriptive statistics on innovativeness and past experience ........................................................... 169
Figure 7.4: Path coefficients, significance values and predictive capacity of the integrative structural model .. 178
Figure 7.5: Total effects and performances of antecedent constructs of the intention to use wearables ............. 190
XVII
List of Tables
Table 2.1: Exemplary application of the taxonomy of wearable devices .............................................................. 34
Table 3.1: Relevant contemporary research in the area of IT innovations acceptance ........................................ 67
Table 4.1: Main distinguishing characteristics between qualitative and quantitative research (Based on Creswell et
al., 2018, p. 11 ff. and Hair et al. 2003, p. 212) .................................................................................................... 80
Table 4.2: Employed verification mechanisms to achieve validity in a qualitative sense ..................................... 85
Table 4.3: Characteristics of the study interviewees ............................................................................................. 89
Table 4.4: Selected example of the open coding procedure ................................................................................. 92
Table 4.5: Coding categories of the qualitative study ........................................................................................... 96
Table 5.1: Summary of hypotheses ..................................................................................................................... 115
Table 6.1: Reflective measurement model evaluation criteria ............................................................................ 132
Table 6.2: Formative measurement model evaluation criteria ............................................................................ 134
Table 6.3: Structural model evaluation criteria ................................................................................................... 136
Table 6.4: Scale on behavioural intention to adopt wearables ............................................................................ 144
Table 6.5: Scale on the involvement towards wearables ..................................................................................... 145
Table 6.6: Scale on trust in wearables ................................................................................................................. 146
Table 6.7: Scale on materialism .......................................................................................................................... 147
Table 6.8: Scale on need for cognition ................................................................................................................ 147
Table 6.9: Scale on personality ........................................................................................................................... 148
Table 6.10: Scale on innovativeness ................................................................................................................... 149
Table 6.11: Scale on pervasiveness ..................................................................................................................... 151
Table 6.12: Scale on perceived IT security ......................................................................................................... 152
Table 6.13: Scale on perceived usefulness .......................................................................................................... 153
Table 7.1: Extracted factors among the captured measures (unrotated factor solution) ...................................... 166
Table 7.2: Chi-Square Goodness-of-Fit Test for age characteristics ................................................................... 167
Table 7.3: Pearson’s Chi-Square test for demographic differences between early and late responses ............... 170
Table 7.4: Assessment of reflective scales .......................................................................................................... 173
Table 7.5: Assessment of formative scales ......................................................................................................... 175
Table 7.6: Multicollinearity diagnostics coefficients at structural model level ................................................... 177
Table 7.7: Multiple determination coefficients and Q2-statistics of the endogenous Wearable TAM constructs 179
Table 7.8: Effect sizes of exogenous constructs .................................................................................................. 180
Table 7.9: Effects of mediated relationships ....................................................................................................... 181
XVIII
Table 7.10: Effects of moderated relationships ................................................................................................... 182
Table 7.11: Segments for PLS-MGA .................................................................................................................. 184
Table 7.12: Gender group differences ................................................................................................................. 185
Table 7.13: Educational level differences ........................................................................................................... 186
Table 7.14: Age differences ................................................................................................................................ 187
Table 7.15: Generational cohort differences ....................................................................................................... 188
Table 7.16: Results of hypothesis testing ............................................................................................................ 192
Table 7.17: Non-standardised mean scores of Wearable TAM latent variables ................................................. 197
Table 7.18: Non-standardised mean scores of first-order risk dimensions ......................................................... 198
XIX
List of Abbreviations
AVE Average Variance Extracted
BFI Big Five Inventory
BS British Standard
BSI British Standards Institution
BYOD Bring Your Own Device
CAGR Compound Annual Growth Rate
CB-SEM Covariance-based Structural Equation Modeling
CIA Confidentiality Integrity Availability
CMV Common Method Variance
CPU Central Processing Unit
DTPB Decomposed Theory of Planned Behavior
e.g. exempli gratia
EC European Community
EEG Electroencephalogram
EFA Exploratory Factor Analysis
et al. et alii
EV eigenvalue
EV Expectancy Value
ff. pages following
FFM Five Factor Model
GLS Generalized Least Squares
HTMT Heterotrait-Monotrait Ratio
i.e. id est
ibid. ibidem
ICH Intelligence Compensation Hypothesis
ICT Information and Communication Technology
IDT Innovation Diffusion Theory
IEC International Electrotechnical Commission

XX
IEEE Institute of Electrical and Electronics Engineers
IoT Internet of Things
IPMA Importance-Performance-Map Analysis
ISO International Organization for Standardization
IT Information Technology
MGA Multigroup Analysis
ML Maximum Likelihood
NFC Need for Cognition
OLS Ordinary Least Squares
p. page
PC Personal Computer
PCA Principal Component Analysis
PII Personal Involvement Inventory
PIN Personal Identification Number
PLS Partial Least Squares
PLSc consistent PLS
R&D Research and Development
SEM Structural Equation Modeling
S-O-R Stimulus-Organism-Response
TAM Technology Acceptance Model
TPB Theory of Planned Behaviour
TRA Theory of Reasoned Action
UTAUT Unified Theory of Acceptance and Use of Technology
VAF Variance Accounted For
VIF Variance Inflation Factor
VR Virtual Reality
WiFi Wireless Fidelity
WLS Weighted Least Squares

XXI
22 1 Introduction
1 Introduction
The main purpose of this chapter is to provide an overview of the key issues associated with the subject of study.
The chapter commences with an introduction of the research context. Next, the research aims and questions are
established, followed by a brief outline of the thesis structure.
1.1 On the Increasing Significance of Wearable Computing Adoption
The exponential performance enhancement of microprocessors and miniature sensors as well as the significant
advances in multiple other technology parameters, such as data transfer rates in wired and wireless networks, has
led to an accelerating growth of computerisation. Particularly, the transition from encapsulated smart spaces to
more interconnected and even invisible computing environments entails an increasing integration of sensing,
communication, and computation into the physical world. This evolution opens up a wide range of fascinating
innovations in information and communication technologies (ICT). Wearable computing is an emerging
computing paradigm, which emphasises an omnipresent as well as unobtrusive mediation and augmentation of
context-related information in real-time. As the demand for mobile applications in numerous aspects of both the
consumer and enterprise realm grows, the ecosystem of intelligent wearable devices containing microchips,
sensors, network technologies and software is steadily prospering. Correspondingly, the market intelligence firm
Tractica (2016) predicts a market volume of up to 95.27 milliard U.S. dollars for the global wearable smart
electronics industry by 2021.
Driven by this enormous economic potential of ‘smart wearware’, large consumer brand companies, such as
Samsung, Apple, Siemens and Google, but also a variety of innovative start-ups engage in the rapid-growth
wearable market by tapping new business segments and launching own wearable products. For instance, the
‘Pebble Technology Corporation’, which largely financed its business venture via crowdfunding, greatly
succeeded with its e-paper based smartwatch (Smartwatch Group, 2015).
In the meantime, there is a high degree of product diversity in the area of wearable computers, ranging from smart
wristwatches, glasses, jewelleries, headgears and e-textiles to digital contact lenses, consumer EEGs and even
smart tattoos (Swan, 2012 p. 220-227; Titcomb, 2016). All these wearable products promise substantial efficiency
gains on the end-user’s side by creating seamless and convenient access to critical electronics and information
services. Given the added value through augmented reality applications and a more unobtrusive design in
comparison to conventional hand-held devices, wearables are currently influencing a multitude of non-consumer
niches including those in healthcare, education, transportation and manufacturing (Tehrani, et al., 2014; Amft,
2017). For instance, smart glasses are beneficial to heavy industry by providing interactive, hands-free manuals
and up-to-the-minute information (Gartner, Inc., 2013a). The practical implications of such lightweight devices
are far-reaching and, consequently, their application fields are expected to expand in scope and scale. An
illustrative example in the field of medical education is Google Glass, which already has been successfully utilised
to live stream surgical procedures for teaching purposes (Dolan, 2013; Chang, et al., 2016). From a cross-industry
perspective, the Gartner Hype Cycle for emerging technologies shows that human augmentation (in the sense of
1 Introduction 23
technology-enabled cognitive and physical improvements) is right at the beginning of the innovation trigger phase,
which promises a high degree of competitive advantage over the next ten years (Panetta, 2017). This indicates the
considerable impact wearable technologies might have not only on industry, but also on a variety of consumer
sectors in the near term.
To date, highly specialised wearables in the field of personal health and wellness (i.e. fitness tracking wrist-bands
such as FitBit Flex and Nike Fuelband) are the most established wearable devices (Nielsen, 2014; González, 2017).
These electronics are designed for single use-cases, meeting the trend among consumers toward the ‘quantified
self’ by offering purposeful functionality in vertical markets. However, despite the increasing application of other
multifunction wearable systems in professional and industrial settings (e.g. smart glasses or smartwatches), the
rate of adoption in mainstream markets is considered fairly low due to both an early stage of development and a
yet unclear value proposition (Bajarin, 2013; Gartner, Inc., 2016). As a consequence, many companies have to
face the dilemma that their wearable technology innovations still lack consumer acceptance (BI Intelligence,
2015). For instance, the sales numbers of Apple’s smartwatch were far behind the forecast figures only three
months after market launch (Arends, 2015). Since then, this branded product experienced a consecutive decline in
shipments which could only be counteracted with the launch auf the Apple Watch Series 2 and 3 in 2017 (Canalys,
2018).
Surprisingly, up to now it is still largely unknown what between-subject factors might play a key role for mass
market breakthrough of general-purpose wearables (Groopman, 2014; Briggs, 2014). From a rational point of
view, the decision as to whether or not to employ a new technology depends primarily on its price and usefulness.
However, consumers do not always act rationally and utility-maximising. Instead, their adoption behaviour heavily
depends on psychographic characteristics like subjective beliefs, personal values and lifestyles (Buenaflor, et al.,
2012 p. 579; Planing, 2014 p. 1). Therefore, identification of concrete socio-psychological antecedents of
technology acceptance appears to be highly important for an effective customer approach. In regard to the current
absence of product necessity and clear functional benefits of wearables, it seems also pivotal to ascertain
motivational drivers of consumers’ utility perception.
Furthermore, smart wearable products are associated with a number of specific challenges and adoption barriers.
Along with typical acceptance inhibitors of mobile devices including price, battery life and ease of use, particularly
information security concerns are vital (Lindström, 2007 p. 3-4; Rawassizadeh, et al., 2015). Although security
and privacy technologies are evolving, wearable computers still pose severe privacy issues and threat scenarios
(Zorz, 2014). Thus, the influence of consumers’ security perception on usage intention should be examined too,
so as to gain a holistic and comprehensive understanding of wearable technology acceptance. Taken together, this
unique research context constitutes a promising field for the application of Information Systems and acceptance
research. It may pave the ground for valuable insights into the area of innovation diffusion from a new perspective.
In light of the increasing importance of tiny, wireless-connected devices, it is noticeable that there is almost no
research that goes beyond descriptive studies on wearable technology adoption. Existing explanatory models
incorporate only partial aspects of attitude formation, as they seek to be as parsimonious as possible in a positivistic
manner (e.g. Chuah, et al., 2016, or Rauschnabel, et al., 2015a). Moreover, research in the field of technology
acceptance focusses mostly on traditional information technologies such as e-mail systems, electronic commerce
24 1 Introduction
applications or online banking. These approaches capture merely a fraction of the relevant factors that might play
a crucial role in the adoption of future information and communication technologies (Sharma, et al., 2014 p. 27).
Consequently, they might suffice for their individual domains, but clearly fall short for investigating acceptance-
enhancing factors of ultra-mobile devices in the evolving ‘post-PC’ era. However, a comprehensive understanding
of the inter-individual adoption process is essential for a successful market launch and rapid diffusion of wearables.
It is also striking that there is generally a lack of systematic research on the significance of personality parameters
in the context of Information Systems research (Zhou, et al., 2011 p. 545; Svendsen, et al., 2013 p. 323). Hence,
this thesis combines theoretical assumptions and conceptual frameworks from different research streams including
the fields of Information Systems (IS), consumer behaviour and personality psychology. Furthermore, available
research studies on technology acceptance mostly tend to address factors of innovation success and therefore
frequently neglect determinants that hinder the diffusion of new technologies. This phenomenon is due to a
shortcoming in diffusion research referred to as the pro-innovation-bias, which implicates that innovations are
adopted by all members of a given social system, ignoring either re-inventions or rejections (Rogers, 2010, p. 100).
Especially the perceived risk associated with adopting a new technology is commonly considered a major reason
for resistance to innovation (Ram, 1987 p. 208-212). Again, in a wearable computing context IT security risks
render particularly important. At this point, it is remarkable that the well-established goals in information security
have neither been analysed in detail from a consumer’s perspective nor incorporated into existing models in the
context of technology acceptance research. Therefore, the present research work also considers adoption inhibitors
in terms of security-related aspects of IT.
In sum, this thesis contributes to theory by providing an empirical (i.e. observation-based) investigation of
consumers’ adoption behaviour towards emerging wearable technologies. As regards the research methodology,
this study takes a sequential mixed-methods approach combining both qualitative and quantitative data, yet with
a bias towards quantitative methods. A justification for the methodological choices as well as the details of the
research processes employed are presented at each stage of this study. In a first step, important acceptance factors
of wearable computing are identified and conceptualised based on literature review and in-depth expert interviews.
Drawing on the proposed theoretical concepts from the qualitative research stage, a novel structural model for
explaining and predicting adoption behaviour in the relevant markets, the Wearable Technology Acceptance
Model (Wearable TAM), is successively derived and introduced. For theory verification purposes, this newly
developed model is then validated within the main quantitative study by means of a large-scale Internet survey.
Since the study focusses on latent (i.e. not directly measurable) individual-level factors that influence the adoption
decision, structural equation modeling is employed as a multivariate data analysis technique for assessing the
reliability and validity of model measures. Building on long-established theories of attitude and innovation
acceptance, the Wearable TAM seeks to provide a comprehensive picture of both intrinsic adopter-related and
extrinsic product-related acceptance drivers. It conceptualises the individual intention to use wearables as a
multicausal, dependent variable that serves as a proxy of actual acceptance behaviour. From a factor-analytical
perspective, the research model inherently adheres to an exploratory, prediction-oriented approach: By empirically
analysing the patterns of correlations among a set of hypothesised constructs, this study aims at deriving concrete
managerial recommendations on how to increase consumers’ willingness to adopt wearable computing. Finally, a

1 Introduction 25
profound understanding of the underlying mechanisms that drive the use of such innovations may help marketing
practitioners to better meet consumer needs and to develop more efficient communication strategies.
1.2 Research Questions
In consequence of the theoretical as well as practical importance of attitude formation in innovative technology
markets, this thesis’s object of cognition focusses on the consumer acceptance of wearable computing. Thus, the
overall aim of this study is to conceptualise and explain key factors that lead to either acceptance or rejection of
wearables. Building on this epistemological interest and considering the stated insufficiencies and knowledge gaps
in diffusion and Information Systems research, this thesis is guided by the following fundamental research
questions:
1) What domain-specific drivers at individual-level determine the acceptance decision towards wearable
computing?
2) What issues are most salient adoption inhibitors from a consumer’s viewpoint?
3) What personality traits influence technology adoption behaviour?
4) In terms of causality, how can these factors be suitably contextualised and transferred into a cohesive
explanatory model of wearable technology acceptance?
Drawing on the theoretical findings which are based upon extensive literature review as well as exploratory study
results, the quantitative research phase further investigates the following questions:
5) Based on empirical evidence, to what extent do the identified factors of the integrative framework affect
consumer acceptance?
6) What implications for marketing practice and research can be deduced from the empirical findings?
Along with these questions, both the research design and the thesis structure emerge, which are discussed in the
next section.
1.3 Structure of the thesis
In respect of the mentioned need for research in the chosen field, the present thesis should provide sufficient
evidence to answer the main questions. To achieve this objective and to gain profound insights, this work employs
a multi-methodological approach, interlinking conceptual, qualitative and quantitative studies. Hence, the outline
of this thesis follows the research strategy as depicted in Figure 1.1. In total, it encompasses eight chapters that are
divided in a qualitative and a quantitative part. The qualitative part provides both the theoretical background and
conceptual considerations on the research subject. Moreover, it describes the qualitative study design and
synthesises the identified relevant acceptance factors to a new, dedicated path model. The initial exploratory
thematic block therefore grounds the subsequent quantitative study, which aims at empirically validating the
proposed cause-effect model.
26 1 Introduction
In Chapter 2 the novel wearable computing paradigm is discussed in order to attain a conceptual context and to
set a frame of reference for the main research object. A characterisation of wearable computing together with the
striking design challenges is given to provide an understanding of the relevant terminologies, potential benefits as
well as possible usage risks. In addition, a classification scheme is proposed in order to better differentiate and
identify wearable devices. The chapter finishes by outlining the current market situation from an application and
device type perspective.
Figure 1.1: Structure of the thesis
Chapter 3 is concerned with theoretical models and principles related to the field of Information Systems as well
as innovation adoption. Key foundations and frameworks in these areas are described in detail and also critically
evaluated in a technology adoption context. Additionally, important concepts from the thematic area of perceived
security are outlined. Overall, the theoretical substantiation of the study is approached by combining different
research streams in order to attain a sufficiently holistic system of statements. The underpinning theories and
models in technology acceptance and Information Systems research provide the starting point for the qualitative
study and subsequent hypothesis formulation.
Chapter 4 is dedicated to the qualitative exploratory study commencing with epistemological and methodological
considerations. The application of methods triangulation, which involves a combination of qualitative and
quantitative methodologies, is justified. Subsequently, the chosen empirical setting is outlined. The chapter closes
by delineating the qualitative data analysis and presenting the inductively generated results. The findings identify
the relevant concepts that affect wearable computing adoption.
1 Introduction 27
Chapter 5 deals critically with the conceptualisation of acceptance-enhancing factors impacting the individual
intention to use wearable technologies. Based on the results from both the qualitative and the conceptual study,
hypotheses are successively derived for the Wearable TAM. The research model links the identified influence
factors by placing them in logical correlative interrelationships. Since contemporary research gaps as well as the
results of the qualitative study prompt this, particular attention is directed to commensurable theories in the area
of IT security and personality psychology. In order to augment the Wearable TAM with further informative
variables, interacting effects of relevant moderating variables are also identified and integrated into the
nomological net.
In Chapter 6 information is provided about philosophical approaches and the most appropriate research design.
Also, some basic methodological considerations with regard to multivariate data analysis are made and a specific
statistical method is chosen and detailed (i.e. structural equation modelling). The chapter is completed by a
literature-based operationalisation of measurement instruments for the hypothesised constructs that are used in
later analysis.
Chapter 7 elaborates on the chosen research strategy for the empirical study including the decision on the proper
sample size and sampling procedure. Careful consideration is also given to the development of a suitable
questionnaire design to reduce method bias. Afterwards, descriptive statistics of the survey results are presented
together with an assessment of the representativeness and normality of the selected sample data. The chapter
proceeds with an empirical purification of the operationalised measurement models to warrant quality of construct
measurement. Subsequently, the entire conceptual framework advanced in chapter 5 is evaluated quantitatively by
means of variance-based structural equation modelling. In addition, the research model is tested for systematic
group differences to determine its robustness. The section closes with a synthesis of the empirical findings in order
to establish new scientific insights.
Finally, Chapter 8 summarises the entire study and outlines the novel contributions of this work to current
Information Systems research. Based on the key findings, multiple implications for marketing practitioners are
deduced. The thesis concludes with an overview of the major limitations of the study and promising directions for
future research.
28 2 Wearable computing
2 Wearable computing
This chapter introduces the technological context of the present research. It presents a characterisation, definition
and classification of wearable computers, along with a brief demarcation from other mobile technologies. Two
actual examples are discussed in more detail. Also, major design challenges of wearables are portrayed to create a
thorough picture of the subject. Then an overview of the current market situation is given, which shows from
different angles the current state of diffusion of these new devices. In sum, this chapter sets the frame of reference
for the focal study object.
2.1 Conceptualisation of Wearable Computing
The convergence of various technological innovations in mobile and ubiquitous computing has fostered a
promising new transdisciplinary field referred to as wearable computing. This new paradigm has the goal of
providing computational services anytime and anywhere in an unobtrusive manner. By bringing together expertise
from diverse research fields, ranging from computer science and electrical engineering, through material science
to human-computer interaction and, not least, artificial intelligence, the integration of people, environment and
technology is becoming more and more foregrounded. Consequently, the universal notion of wearable computing
covers a broad spectrum of concepts and implementations: In the broadest sense, the terms ‘wearable technology’
or ‘wearables’ both relate to computer systems or electronic technologies that are body-worn and utilised mostly
hands-free (Bass, et al., 1997, pp. 34-39; Tehrani & Michael, 2014). Due to the remaining diversity in possible
functional and technical implementations arising from this ambiguous definition, wearable devices are generally
particularised and differentiated from other computer types by means of several concretising properties (Herzog
& Witt, 2009, p. 10). A first narrower conceptualisation is provided in (Rhodes, 1997, pp. 218-224). Here, wearable
computers are attributed by five characteristics:
• Portable while operational
• Enabling hands-free or one-handed utilisation
• Providing sensory features, e.g. Global Positioning System receivers, accelerometers or cameras
• Proactive notifications, attracting the user’s attention
• Constantly running and accessible
Specifically, the aspect of portability makes up the central differentiator between wearable and ubiquitous
computing (Rhodes, et al., 1999, pp. 141-149), since wearable computers are conventionally defined as “fully
functional, self-powered, self-contained computers” (Barfield & Baird, 1998, p. 157). In contrast, ubiquitous
computing necessitates distributed computing environments (Bauer, et al., 2002, p. 785), pervading our
surrounding world with small-scale, networked ICT components cumulatively.
Both the ability of sensing and attracting the user’s attention implicate certain interface capabilities as well as the
presence of a local storage, allowing for data capture and – in view of e.g. wireless sensors or other on-body
communication networks – a minimum level of communication-capability and connectivity. In comparison to
mobile computing, especially the wearable’s non-obtrusiveness character is accentuated in the academic
2 Wearable computing 29
literature. Mann (1998) clarifies this by introducing the “personal empowerment” requirement, focusing on a
synergetic symbiosis between man and machine. Within this new paradigm computing is seen as a peripheral task,
assisting the user’s primary activities seamlessly and unobtrusively to the greatest possible extent. Moreover, given
that wearables ought to be non-distracting, easily accessible everyday companions, multimodality (in terms of
the variety of human-computer interaction modes, e.g. speech, gesture or biometric iris recognition for data input)
has repeatedly been mentioned as another critical capability (Munteanu, et al., 2016). After all, the devices’ typical
small form factors place intrinsically high demands on the design of Input/Output modalities (e.g. gesture-based
data entry). Considering the dynamic environment changes in wearable computing settings, interaction modalities
should also be able to adapt to the given circumstances (Starner, 2001a, p. 46). Meanwhile, even thought control
of wearables is assumed to be an inevitable evolutionary step in next-generation technologies, as this kind of
interaction provides the most natural and intuitive way of manipulating information (Powell, et al., 2013, pp. 427-
435).
Complementarily, Kortuem et al. (1998, p. 61) postulate the ‘augmented-reality’ criterion, which means that
wearable computers should be capable of “focusing the user’s attention and presenting information in an
unobtrusive, context-dependent manner”. Hence, in comparison to the aforementioned five characteristics of
wearable devices the attribute context-awareness is particularly emphasised. Basically, context-awareness
describes the ability of a system to sense, interpret and respond to certain environmental states. Thereby, the term
‘context’ can be related to any interaction-relevant entity, such as a person, place or object (Abowd, et al., 1999,
pp. 304-307). Thus, context recognition scenarios should generally incorporate the wearer’s physiological state,
his current tasks and environment’s characteristics (e.g. location, time or available infrastructural components) as
well as the wearable’s internal state (Bristow, et al., 2004, pp. 798-800). Pascoe enumerates in (Pascoe, 1998, pp.
92 - 99) four core context-aware application categories, including:
• Contextual sensing
Detection and presentation of contextual information on the user’s behalf as a main feature.
• Contextual adapting
Behaviour depends on the prevailing circumstances.
• Contextual resource discovery
Recognition and exploitation of network-compatible, interoperable ICT systems in terms of machine-to-
machine interaction.
• Contextual augmentation
Annotating with descriptive metadata segments of reality that are of particular interest.
Context sensing enabled by enhanced multisensory capabilities is increasingly considered to be a constituting
property. For instance, Tehrani et al. stresses in (Tehrani & Michael, 2014) that advanced scanning and sensing
technologies still shape the distinct character of wearable computers compared to contemporary hand-held devices,
such as tablet PCs and laptops. Rather than responding to changing environmental states solely by explicit
communication, wearable computer devices should additionally observe and react to manifold contextual cues
automatically. As a consequence, context modelling is regarded as a basic supplementary criterion for sensory
augmented computing (Bharatula, et al., 2008, p. 123). Considering that smart wearable systems are individual’s
daily life supporting, omnipresent socio-technical tools, they should be able to model the situational context as
30 2 Wearable computing
well as the wearer’s preferences, abilities and prevailing needs in order to proactively provide adequate information
and behaviour. Ultimately, they should superimpose the reality with an associated information structure,
augmenting the human perception and thus enhancing the user’s efficiency (Barfield, 2015).
Taken together, the idea of wireless on-body communication bridges the gap between ubiquitous computing (also
being referred to as Internet of Things) and wearable technologies. The latter provide connectivity to the fixed
ubiquitous computing infrastructure in real-time and, therefore, can be rather described as an integral part of
ubiquitous computing. While the ubiquitous computing paradigm builds upon the pervasive presence of networked
objects such as radio-frequency identification (RFID) tags, actuators, mobile phones and sensors, wearables can
be used to connect humans to these networks (Hao & Helo, 2017). In other words, ubiquitous computing is
distributed to the surroundings, whereas wearable computing is performed by the user. Notably, the term ‘things’
in a ubiquitous computing sense refers to objects equipped with microchips, sensors and wireless communications
capabilities, e.g. connected cars, smart home appliances, drones, etc.
Furthermore, since wearables respond to the trend towards the Internet of Things (IoT), their primary
communication is rather with other interconnected devices than with the user (Marzec, 2014). Consequently, the
wearable computer research community often refers to the modular ecosystem of wearable electronics, built on
innovative types of sensors and other radio nodes, e.g. smartphones and smart home appliances (Gartner, Inc.,
2013b). As a result, electronics companies might increase customer retention by implementing a corresponding
product portfolio strategy that creates switching barriers. In an IoT sense, especially interoperability across devices
is thought to become a key differentiating factor that will contribute to the generation of brand loyalty (Marzec,
2014). In addition, beside the above stressed criteria of mobility and augmented reality, the author points out the
convergence of big data and smart wearable artefacts. Ultimately, employment of big data analytics in wearables
(considering e.g. health analytics companies) permits vendors to capitalise on non-transactional data and, thus, to
gain and sustain competitive advantage (Weathington, 2014).
Taking into account all above conceptual considerations, it is not surprising that scholarly literature does not yet
provide a profound definition of wearable computing. As Steve Mann put it, “[…] the definition of wearable
computing can be kind of fuzzy itself. Thousands of years ago, in China, people would wear an abacus around
their neck — that, in one sense, was a wearable computer” (Bilton, 2012). The concepts of wearables vary by both
researchers and practitioners and are apt to be adjusted as technology evolves. Nevertheless, to arrive at an
operational working definition, the key attributes of wearables made above may be condensed as follows:
Wearable technologies are constantly running, body-worn devices that provide computational power as
well as automated feedback and collect personal data through a range of sensors, so that information
processing and, where appropriate, communication is possible anywhere and anytime in an unobtrusive
and context-aware manner.
As opposed to classic handheld devices such as mobile phones, wearable technologies target at device
miniaturisation in order to operate as unobtrusively as possible. They work without any interruption and are even
stronger intertwined with the human body. Being the most pervasive implementation of IoT to date (European
Commission, 2016, p. 18), wearable devices have a great potential to fulfil the vision of ubiquitous computing.
They are considered the most personal devices in the evolution of communication and information technologies
2 Wearable computing 31
and, as such, carry huge potential to dramatically change the way people communicate and companies interact
with consumers (Ericsson Consumerlab, 2016; Rauschnabel & Ro, 2016, p. 124).
2.2 Towards a Classification Scheme
Although the first wearable computer as a cigarette pack-sized roulette prediction system was already pioneered
at Massachusetts Institute of Technology in 1960 (Edward O. Thorp‘s self-reported first wearable computer
consisted of a twelve-transistor CPU and was hidden in shoes, see Thorp 1998), the research field of wearable
technology is fairly new. In fact, the evolution of wearables has been spurred by the military sector almost 50 years
ago, where highly portable computer devices with constant and non-distracting access to information services,
such as head-mounted displays, feature great usefulness (Rizzo, 2013; Rhodes, 2001). Accordingly, wearable
technologies were initially employed in vertical niches, particularly in military and industrial spheres (Billinghurst,
et al., 1999 p. 58). The focus of those special purpose wearables was mainly on hands-free and instantaneous
interaction with information. Nonetheless, over the past decade there has been a shift in the primary scope and
understanding of the concept of wearable computing towards the ultimate goals ‘proactiveness’, ‘responsiveness’
and ‘context-awareness’ (Viseu, 2003 pp. 77-79). As a result, wearable computers migrated from simple
information processing equipment to ‘extensions of the self’ or a ‘second skin’, augmenting the physical world
through digital mediation.
The advent of wearable computing as a generally acknowledged study area can be traced back to the late 1990s
when the first IEEE international symposium on wearables was hosted in Cambridge (Cook & Song, 2009, p. 83).
Since then, the application domains as well as product diversity have expanded significantly, so that wearable
devices are expected to carry a disruptive influence on the technology market in the near future (PR Newswire,
2014). At present, there are several approaches to segment smart wearable devices. First of all, one can differentiate
between ‘wearable computers’ and ‘wearable technology’. The latter generic term subsumes not only the former
one, but by definition also the functional clothing platform in its broadest sense. Therefrom, the notion of wearable
technology does not necessarily include algorithmic processing (Hännikäinen, 2006, pp. 6-7). However, as this
concept is generally associated with some form of electronic functionality (e.g. transistors and independent
processing capabilities) by both the research community and the general public, in the following the term is
understood as involving some form of computational capability. Consequently, the concepts wearable computer
and wearable technology are used interchangeably throughout this thesis.
Up until now, though, there is no global system of classification available to understand the scope of impact
wearable devices have across different consumer markets. From a consumer point of view, Lajos (2010)
emphasises that categorisation of consumer goods is “[…] a fundamental cognitive phenomenon in the
consumption process because it enables consumers to differentiate between products.” In order to establish a
classification scheme that allows to properly systematise the landscape of wearable computing products, this thesis
follows the principles for taxonomy construction set out in (Alrige & Chatterjee, 2015, pp. 496-504). The authors
developed and tested a taxonomy for wearables in healthcare. They propose to first define the term for which the
taxonomy will be constructed. This has already been accomplished in section 2.1. Subsequently, based on the
definition laid down, the major dimensions of the taxonomy that characterise the focal concept should be specified.

32 2 Wearable computing
As shown, wearable computing is marked by both digital assistance of certain tasks (i.e. they serve a purpose) and
a garment or ‘wearability’ characteristic for effectively utilising human body areas. In line with this attribution,
in-depth literature search shows that field of use, functionality and form factor are common themes in
commercially available ICT products that correspond to the present working definition of wearable computers (see
chapter 2.1 on the characterisation of wearables which underlines the ubiquitous provision of assistive information
services, the context-awareness arising from single-sensor and multi-sensor functionality, as well as the
unobtrusiveness of such ultra-mobile devices). Hence, this research adopts a taxonomy for wearable technologies
that revolves around these three dimensions.
In terms of form factor, Kumari et al. (2016, p. 302) advocate to employ two broad groups of usage, namely
‘electronic devices’ and ‘apparels and textiles’. Generally, the former category refers to accessory type devices
that can easily be attached to the body including wristwear such as smartwatches and activity-tracking wristbands,
smart jewellery (e.g. rings and necklaces), belts, earbuds and eyeglasses. On the contrary, the latter category refers
to textile-integrated electronics (also known as ‘smart textiles’ or ‘e-textiles’), which can interact with the user or
environment and are potentially capable of accomplishing a wide spectrum of functions, as well. Such garment-
based wearable systems are intended to be worn throughout the day like an article of clothing. Examples would
include smart shirts and jackets, Bluetooth gloves, intelligent shoes, smart socks or underwear. Unlike accessory
type devices, smart garments are usually designed as special-purpose wearable computers (Hännikäinen, 2006, p.
7). Even though skin patchable devices and implants such as digital lenses and smart tattoos are deemed to play
an increasingly significant role in the future (Ray, et al., 2016, p. 124), this thesis does not include such wearable
appliances, since their installation naturally involves a quite invasive procedure. This would clearly run counter
the established understanding of wearables as being easily applicable day-to-day products for mass markets.
Figure 2.1: Taxonomy of wearable computing (Based on Alrige et al., 2015, pp. 496-504)

2 Wearable computing 33
Furthermore, wearable technologies can be categorised as single function (special purpose) or multi-functional
(multi-purpose) (Bruno, 2015, p. 13). For instance, activity trackers are usually designed to monitor specific
fitness-related metrics, whereas many smartwatches can serve a number of different functions at the same time
such as pulse measurement and navigation. In most cases, single function wearables can be directly allocated to a
distinct field of use (e.g. activity trackers support physical fitness), whereas multi-functional devices represent
often hybrid products that serve more than one application. With regard to the field of use, a widely adopted
categorisation is provided in a whitepaper by IHS Electronics and Media (IHS, 2013), a business intelligence
organisation which offers market data and forecasts in the electronics, medial, transportation, and energy
industries. The report assesses five applications, including healthcare and medical, fitness and wellness,
infotainment, industrial and military. Since the present research centres on the consumer market, the latter two
categories had to be discarded. In addition, a thorough literature review revealed that gaming and recreation,
assisted living, as well as lifestyle and fashion reflect further important purposes that should be considered in a
wearable computing context (cf. Hunn, 2015, p. 8; Park, et al., 2014, p. 8; Bothun, et al., 2014, p. 19; Tehrani &
Michael, 2014). All in all, the six relevant fields of use identified can be characterised as follows:
• Healthcare and medical: Used to monitor a diagnosed condition and to support diagnosis where
possible, e.g. diabetes care, blood pressure and ECG monitors, etc. Typical products include glucose
and blood pressure monitors (e.g. continuous glucose monitoring technologies such as ‘Google Contact
Lens’ which is capable of measuring blood sugar levels in tear fluid through integration of miniaturized
glucose sensors, wireless circuits and displays, see Park et al., 2018), biofeedback patches, hearing aids
and wireless EEG headsets.
• Fitness and wellbeing: Used to monitor bodily vital signs, e.g. nutrition, activity, emotional
measurement, etc. Typical products include activity-tracking wristbands, smartwatches and smart
sportswear such as heated jackets, GPS ski mask or smart training shoes.
• Infotainment and communication: Used to inform and entertain, e.g. emails, directions, notifications,
shopping insights, etc. Typical products include Bluetooth headsets, head-up displays, smart glasses and
smartwatches. This field of use may also contain tourism and education applications, e.g. library
applications or medical education. Again, typical products include smart glasses and smartwatches.
• Gaming and recreation: Used to make gaming more visually and physically engaging, e.g. through
virtual reality and interactive gaming. Typical products include virtual reality headsets and augmented
reality smart glasses.
• Assisted living: Used to increase productivity and simplify daily tasks, e.g. home automation, mobile
payment, automotive monitoring and controlling, remote identification, etc. Typical products include
smartwatches and smart glasses. This field of use may also subsume applications for safety that are used
for personal security (e.g. ‘wearable panic button’) and monitoring pet’s and other people’s activity
(e.g. babies, elderly). Typical products include smartwatches and wristbands, smart jewellery and key
chains.
• Lifestyle and fashion: Used for lifestyle and fashion statements, e.g. light embellishment, decorative
display, etc. Typical products include fashionable jewellery and smartwatches.
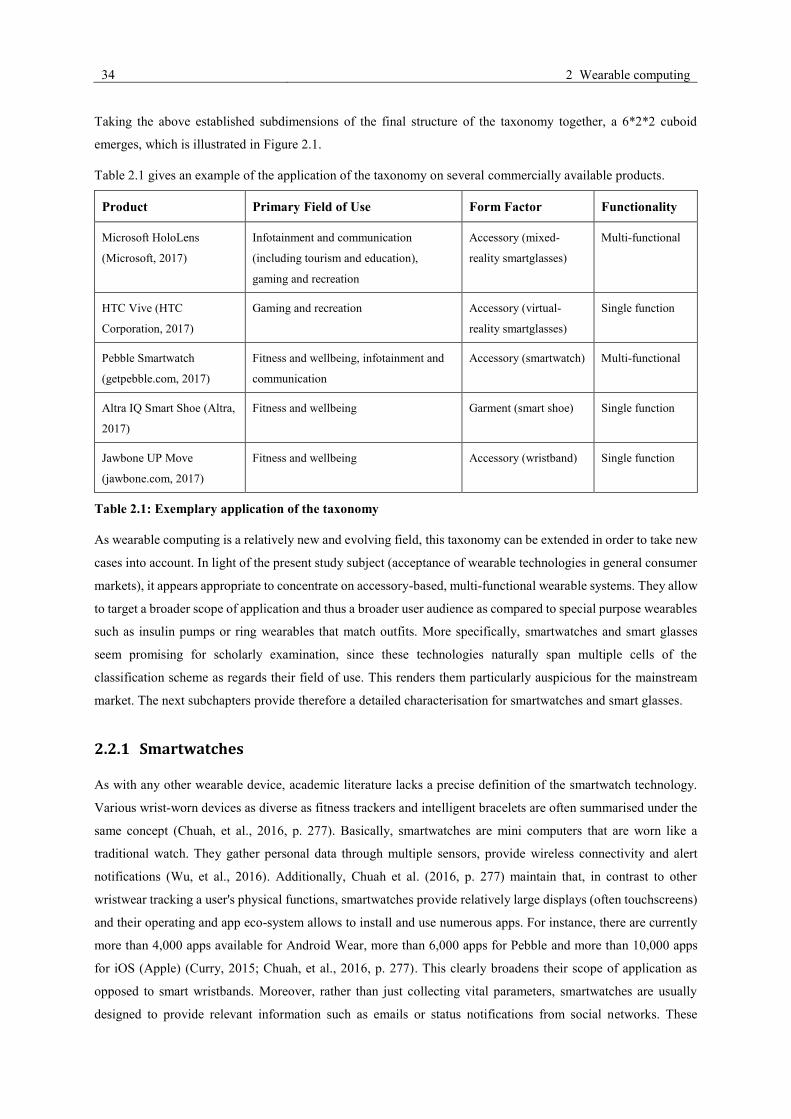
34 2 Wearable computing
Taking the above established subdimensions of the final structure of the taxonomy together, a 6*2*2 cuboid
emerges, which is illustrated in Figure 2.1.
Table 2.1 gives an example of the application of the taxonomy on several commercially available products.
Product Primary Field of Use Form Factor Functionality
Microsoft HoloLens
(Microsoft, 2017)
Infotainment and communication
(including tourism and education),
gaming and recreation
Accessory (mixed-
reality smartglasses)
Multi-functional
HTC Vive (HTC
Corporation, 2017)
Gaming and recreation Accessory (virtual-
reality smartglasses)
Single function
Pebble Smartwatch
(getpebble.com, 2017)
Fitness and wellbeing, infotainment and
communication
Accessory (smartwatch) Multi-functional
Altra IQ Smart Shoe (Altra,
2017)
Fitness and wellbeing Garment (smart shoe) Single function
Jawbone UP Move
(jawbone.com, 2017)
Fitness and wellbeing Accessory (wristband) Single function
Table 2.1: Exemplary application of the taxonomy
As wearable computing is a relatively new and evolving field, this taxonomy can be extended in order to take new
cases into account. In light of the present study subject (acceptance of wearable technologies in general consumer
markets), it appears appropriate to concentrate on accessory-based, multi-functional wearable systems. They allow
to target a broader scope of application and thus a broader user audience as compared to special purpose wearables
such as insulin pumps or ring wearables that match outfits. More specifically, smartwatches and smart glasses
seem promising for scholarly examination, since these technologies naturally span multiple cells of the
classification scheme as regards their field of use. This renders them particularly auspicious for the mainstream
market. The next subchapters provide therefore a detailed characterisation for smartwatches and smart glasses.
2.2.1 Smartwatches
As with any other wearable device, academic literature lacks a precise definition of the smartwatch technology.
Various wrist-worn devices as diverse as fitness trackers and intelligent bracelets are often summarised under the
same concept (Chuah, et al., 2016, p. 277). Basically, smartwatches are mini computers that are worn like a
traditional watch. They gather personal data through multiple sensors, provide wireless connectivity and alert
notifications (Wu, et al., 2016). Additionally, Chuah et al. (2016, p. 277) maintain that, in contrast to other
wristwear tracking a user's physical functions, smartwatches provide relatively large displays (often touchscreens)
and their operating and app eco-system allows to install and use numerous apps. For instance, there are currently
more than 4,000 apps available for Android Wear, more than 6,000 apps for Pebble and more than 10,000 apps
for iOS (Apple) (Curry, 2015; Chuah, et al., 2016, p. 277). This clearly broadens their scope of application as
opposed to smart wristbands. Moreover, rather than just collecting vital parameters, smartwatches are usually
designed to provide relevant information such as emails or status notifications from social networks. These

2 Wearable computing 35
wearable gadgets are thus most beneficial when they are connected to the Internet (Wifi, mobile Internet or
Bluetooth).
Because most smartwatches are supposed to seamlessly integrate with existing technologies in general (e.g. tablet
computers or smart TVs) and smartphones in particular, they can naturally be divided into two spheres of
wearables: as standalone devices that act as centralizing hubs for communication and information, and secondary
wearables, which serve as interfaces to smartphones that automatically synchronise their data in real-time (Bothun,
et al., 2014, p. 6). It is therefore not surprising that the magnitude of ICT vendors tries to create new demand for
their mobile devices by increasingly investing in wearable computing research and development (R&D) activities
(Jung, et al., 2016, p. 899). It is particularly since Apple launched its Apple Watch in early 2015, that the global
market for wearable devices gained its initial momentum. Especially enthusiastic Apple consumers were interested
in in the new product that the company has introduced to the market. They transferred more positive attributes to
the Apple Watch due to extant strong emotional connections with the brand (Rauschnabel & Ro, 2016, p. 130;
Richter, 2016). Driven by such spillover effects from one type of mobile device to another, the smartwatch market
has experienced a significant growth in 2015. Since then, various other companies including Samsung, Motorola
and LG have produced their own lines of smartwatches. Some market analysts even expect smartwatches to pave
the way for mainstreaming the entire wearable computing category (Jung, et al., 2016, p. 899).
Currently, smartwatches are mostly peripheral devices, indirectly connected to wireless networks via smartphones.
However, according to some researchers, untethered devices that can transmit and receive data without the need
for a connectivity hub (i.e. mobile phone) will considerably drive future market for wearable technology forward
(IDC, 2016). Correspondingly, a recent conjoint analysis suggests that consumers primarily value the functional
aspects of wrist computers and that potential users regard smartwatches as being independent digital devices rather
than accessories for smartphones (Jung, et al., 2016, p. 904). If smartwatches were more autonomous and capable
of standalone communication, they could serve diverse functions and ultimately even replace smartphones in some
respects (Elgan, 2016). Thus, standalone capability is of great significance to the positioning of smartwatches. It
may be concluded that this attribute is also key for other wearable device types such as smart glasses.
2.2.2 Smart glasses
Smart glasses mark the latest phase in the evolution of Internet technologies. They take the idea of the second and
third-generation Web even a step further: While both generations – commonly referred to as ‘Web 2.0’ and ‘Web
3.0’, respectively – emphasise interactive and semantic Internet technologies, smart glasses aim at melding the
real and the virtual world in the consumer’s view field (Rauschnabel, et al., 2015a). In this category of wearables,
Google Glass (‘Project Aura’) was the first commercially launched product for personal use. Smart glasses are
worn like regular eyeglasses but feature a prism positioned in front of the wearer’s right eye to display virtual
content. They capture data from the physical world through several sensors including camera, microphone as well
as GPS receiver, and they normally provide mobile Internet technologies (Quint & Loch, 2015, p. 205). Depending
on the model, users can seamlessly interact with the glasses by means of natural language voice commands, built-
in touchpad, head motion, or virtual displays (e.g., holographic buttons). Figure 2.2 exhibits the typical
functionality of augmented reality data glasses.
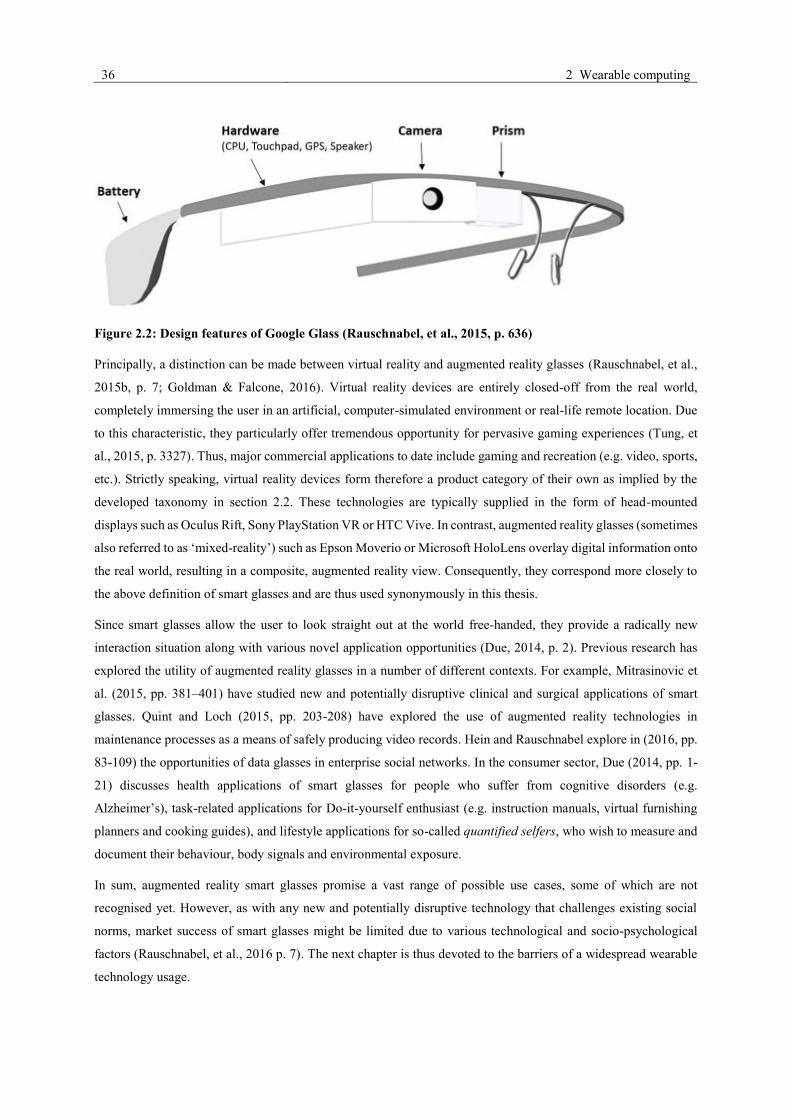
36 2 Wearable computing
Figure 2.2: Design features of Google Glass (Rauschnabel, et al., 2015, p. 636)
Principally, a distinction can be made between virtual reality and augmented reality glasses (Rauschnabel, et al.,
2015b, p. 7; Goldman & Falcone, 2016). Virtual reality devices are entirely closed-off from the real world,
completely immersing the user in an artificial, computer-simulated environment or real-life remote location. Due
to this characteristic, they particularly offer tremendous opportunity for pervasive gaming experiences (Tung, et
al., 2015, p. 3327). Thus, major commercial applications to date include gaming and recreation (e.g. video, sports,
etc.). Strictly speaking, virtual reality devices form therefore a product category of their own as implied by the
developed taxonomy in section 2.2. These technologies are typically supplied in the form of head-mounted
displays such as Oculus Rift, Sony PlayStation VR or HTC Vive. In contrast, augmented reality glasses (sometimes
also referred to as ‘mixed-reality’) such as Epson Moverio or Microsoft HoloLens overlay digital information onto
the real world, resulting in a composite, augmented reality view. Consequently, they correspond more closely to
the above definition of smart glasses and are thus used synonymously in this thesis.
Since smart glasses allow the user to look straight out at the world free-handed, they provide a radically new
interaction situation along with various novel application opportunities (Due, 2014, p. 2). Previous research has
explored the utility of augmented reality glasses in a number of different contexts. For example, Mitrasinovic et
al. (2015, pp. 381–401) have studied new and potentially disruptive clinical and surgical applications of smart
glasses. Quint and Loch (2015, pp. 203-208) have explored the use of augmented reality technologies in
maintenance processes as a means of safely producing video records. Hein and Rauschnabel explore in (2016, pp.
83-109) the opportunities of data glasses in enterprise social networks. In the consumer sector, Due (2014, pp. 1-
21) discusses health applications of smart glasses for people who suffer from cognitive disorders (e.g.
Alzheimer’s), task-related applications for Do-it-yourself enthusiast (e.g. instruction manuals, virtual furnishing
planners and cooking guides), and lifestyle applications for so-called quantified selfers, who wish to measure and
document their behaviour, body signals and environmental exposure.
In sum, augmented reality smart glasses promise a vast range of possible use cases, some of which are not
recognised yet. However, as with any new and potentially disruptive technology that challenges existing social
norms, market success of smart glasses might be limited due to various technological and socio-psychological
factors (Rauschnabel, et al., 2016 p. 7). The next chapter is thus devoted to the barriers of a widespread wearable
technology usage.
2 Wearable computing 37
2.3 Challenges to Adoption
Given the above characteristics of wearable computers, several derivable constraints on architecture design
become acute. In respect of the multitude of severe design issues, Siewiorek et al. (2008, p. 2) suggest to
systematise architectural challenges among three interacting axes for problem structuring. The first axis is referred
to as the human axis, which deals with the problem area of ‘wearability’. This concept primarily addresses the
ergonomics of the devices’ physical shape (Dunne & Smyth, 2007, pp. 299-302). Aside from traditional system
performance measures, the degree of physical, mental and emotional comfort is of particular relevance, as user
convenience is essential to effectively afford superior benefits for body-mounted computers. Accordingly, critical
design topics are e.g. form, weight, heat generation and aesthetic properties (Bharatula, et al., 2008, p. 124).
Closely related, the computer axis is concerned with hardware construction-related problems. Among other
properties, for example heat dissipation, size, power consumption and interface capabilities have to be considered
here. Finally, the application axis addresses the design of mobile application software with the objective of
developing most suitable software solutions for different purposes.
Yet, in technical terms there is a trade-off namely between the wearability and suitability criteria, in particular
with regard to the increasing importance of computation power and energy consumption. Whilst miniaturisation
proceeds to the benefit of user comfort, real-time applications grow increasingly sophisticated (e.g. by making
extensive use of sensors or by natural language and image processing) and therefore also computation- and energy-
intensive (Fernando, et al., 2013, p. 84). Moreover, due to the wearable’s reduced battery size which mainly
dominates its form factor (Lotfian & Jafari, 2013, p. 913), networking becomes more restricted compared to
stationary computers. In sum, their resource scarceness together with their limited computational capacities and
local storage facilities frequently force a thin-client approach, where services are provided by fixed-infrastructure
servers (Starner, 2001b, pp. 54-57). From an IoT perspective, some market analysts consider the ability of
wearables to account for and to interact with environmental surroundings even a critical inflection point of the
entire product category (Bothun, et al., 2014, p. 4; Ericsson Consumerlab, 2016).
Nonetheless, driven by fast progress in mobile wireless communication and hardware architecture, the stated
design constraints become more and more a non-issue. For instance, emerged mobile cloud computing
technologies enable a more efficient exploitation of external computing resources, such as storages, networks and
services (Cui, et al., 2013, p. 148). In addition, by way of example, innovative sensing technologies (Zhang, et al.,
2013, pp. 300-309), new wireless technology standards for data exchange, e.g. the Bluetooth v4.0 specification,
and current display solutions, such as the ‘electronic ink’ (E Ink Holdings Inc., 2012), promise a noticeable
reduction in energy consumption. On the contrary, IT security threats still remain a significant challenge for system
designers (Thierer, 2015, p. 5). What is more, in light of numerous unprecedented applications and services,
dynamic interconnections and a variety of sensors, several further multilateral information security and privacy
concerns arise (Migicovsky, et al., 2014, p. 1). Especially the continuous use of wearable technologies which
continually collect, process, and transmit personal data might lead to severe privacy implications and threats such
as data misuse by third parties or public surveillance (Motti, et al., 2015 p. 232).
In respect of the distinguished capabilities of wearable devices, the research agenda of wearable computing
ascribes security issues a very high priority (Hausman, 2013; Thierer, 2015, p. 4; Rawassizadeh, et al., 2015, p.
38 2 Wearable computing
47). The new vulnerabilities primarily introduced by the ubiquitous computing paradigm pose an imperative need
for novel prevention, avoidance and detection technologies beside those for traditional distributed systems
(Yamada & Kamioka, 2005, p. 846). In this context, ubiquitous computing-related security risks can be directly
transferred to the field of wearables, as smart garments can be deemed special applications of IoT (Want, et al.,
2015). In particular, the transient interconnections in heterogeneous ICT landscapes, where spontaneously invoked
interactions are mostly ad-hoc in nature, entail partially incompatible security schemes regarding the inter-
operating network nodes (Venkataram, 2010). Over and above the long-established security issues in wireless
environments (considering for example the greater susceptibility to eavesdropping and other malicious attacks due
to more contact points) these different levels of security may additionally give rise to unauthorised or unnoticed
manipulation of data (Lyytinen, et al., 2004, pp. 701-702). Overall, the absence of a centrally controlled network
imposes advanced information security mechanisms concerning data privacy and information integrity. However,
again the limited computational resources of wearables constrain available security mechanisms such as encryption
algorithms and integrity checks, as they place some demand on CPU power (Lindström, 2007, p. 4). In addition,
against the backdrop that small devices are generally equipped with very scarce resources like computing power
and energy, the propagation of denial of service attacks is significantly facilitated (Ochrymowicz, 2011). Again,
this marks a goal conflict between usability and security issues. Furthermore, apart from a possible non-
cooperation of nodes, compromising the availability of task-critical services just as is the case with the finite
battery power, a sufficiently complex, dynamic topology in conjunction with a plethora of novel services could
cause unexpected feature interactions as well as unplanned growth and unpredictable ensuing flaws (Stajano, 2010,
p. 282; Lyytinen, et al., 2004, p. 702). Needless to say, that achieving critical mass of adopters makes attacks more
profitable.
Yet, the above stated security threats, largely arising from arbitrary data exchange in partly unsecure networks, are
by far not all. One of the major concerns in the context of wearable computing environments is that of context
information privacy (Wrona & Gomez, 2005, p. 261; Robinson, et al., 2005, p. 5; Almutairi, et al., 2012, pp. 195-
198). As context-aware applications continuously capture and interpret the user’s physiological and environmental
state by several sensors, the wearable becomes a social surveillance system that incorporates a great deal of
privacy-sensitive information. Correspondingly, a recent survey found that privacy is one of the key apprehensions
of consumers (Li, et al., 2016, p. 8). According to the survey data, 82% of respondents were concerned that
wearable devices could invade their privacy. By means of a qualitative content analysis, Motti and Caine (2015,
p. 242) explored what privacy concerns users have. They identified different aspects of user interaction with a
wearable device including disclosure of sensitive information, subtle data collection (audio and video), public
posts in social media apps (sharing), and lack of control and awareness regarding who has access to the data
collected. Hence, protection from unauthorized data access and data abuse (i.e. the inappropriate use of data in
which private information is released to untrusted environments) seems crucial for a high adoption rate and
widespread diffusion of such systems.
Albeit privacy exhibits such a paramount of importance, information security is in general a holistic quality due
to its manifold nature, systemically inherent in ICT systems by addressing all layers of the protocol stack.
According to Stajano’s understanding of the term ‘security’, this concept basically refers to risk management,
focussing on worthwhile defences of assets (e.g. computer platforms or pieces of information) against threats,

2 Wearable computing 39
arising from intrinsic system weaknesses (Stajano, 2010, p. 4). This understanding conforms to U.S. law which
defines information security as “[...] protecting information and information systems from unauthorized access,
use, disclosure, disruption, modification, or destruction [...]” (44 U.S. Code § 3542, 2002; see also chapter 3.2.2
on the ISO 27000 international standard). Traditionally, the concept of security subsumes the following
fundamental triad of attributes, referred to as the CIA security goals:
• Confidentiality (Privacy): This security core principle is violated if privacy-sensitive or proprietary
information is accessed or disclosed by unauthorised entities – whether by human beings or machines.
Closely related to this criterion is the privacy aspect. In comparison, the latter security principle applies
to people, whereas the former applies to data. Thus, the concept of confidentiality represents semantically
an extending component of privacy (Andress, 2011, p. 4). As the present work seeks to gain insights into
the technology adoption process from a consumer perspective and given that the terms ‘privacy’ and
‘confidentiality’ are often used interchangeably in literature (Prewitt, 2011, p. 41), in the following course
of this thesis both concepts are treated synonymously.
• Integrity: The notion of integrity refers to the ability to safeguard information against unauthorised
modification or destruction, whereby data could be altered either within a host or during network
transmission.
• Availability: This final key concept is contravened whenever authorised principals cannot access task-
relevant information or services in a timely manner. High availability systems guarantee preservation of
reliability and availableness to the greatest possible extent by preventing service interruptions due to e.g.
power loss, application failures or network attacks.
Although these properties shape the cross-domain essence of information security, in a ubiquitous computing
environment there are further aspects to evaluate more specifically (Lyytinen, et al., 2004, p. 701; Ochrymowicz,
2011). For instance, as can be derived from the above stated ‘authorised’ predicate upon which the CIA properties
are based, mature authentication and authorisation mechanisms are fundamental in a pervasive computing
world. Wearable computers require enhanced electronic authentication solutions beyond traditional secret-
knowledge techniques due to both their small form factor and their extensive use of personally sensitive
information (Lindström, 2007, p. 4). After all, user authentication on such light-weight minidevices via password
entry is relatively time-consuming and difficult considering the strained finger placement and the resulting
latencies between successive keystrokes. Obviously, this procedure represents an interruption of the wearable
usage. Accordingly, a survey assessing mobile device security and usage in 2010 revealed that only 13% of mobile
phones are secured with Personal Identification Numbers (PINs) or screen-lock patterns for re-verification
(Breitinger & Nickel, 2010, pp. 139-144). This generally implies a high demand for fast and convenient access.
Besides, this prevalent method for access control exhibits well-known drawbacks, which oftentimes originate from
inappropriate selection and use of passwords (Teh, et al., 2013, p. 1). Therefore, under wearable computing
scenarios biometric verification as a mean of confident and user-friendly authentication is at present the most
promising procedure for verifying a user's legitimate right. For example, Witte et al. (2013, pp. 29-32) propose a
context-aware mobile biometric system, where retrievable behavioural characteristics unique to the user, e.g.
speech patterns, are interfaced by corresponding sensors and interpreted as contextual data. This would ultimately
meet the trend towards multi-factor authentication, which can be partially attributed to the rise of biometric security
40 2 Wearable computing
services (Bonderud, 2014). Furthermore, taking into consideration that smart wearable systems might also serve
as security tokens in terms of ‘master keys’ to ease access to multiple other network nodes (especially disconnected
hardware tokens which have no physical connection to the computer in combination with a password are a
recommended type of security token used in two-factor authentication, see Biryukov, 2015), it becomes clear that
a secure online identification is crucial for appropriate data protection (Sun, et al., 2008, p. 1784).
From an end-user’s perspective, the authentication property is perceived as both a discrete and substantial
dimension of information security (Linck, et al., 2007, pp. 6-8). Following this line of reasoning, the concept of
subjective security becomes apparent. This construct refers to the individual’s perceived information security in
terms of a subjectively anticipated probability of illegitimate disclosure, manipulation or destruction of personal
data (Chellappa & Pavlou, 2002, pp. 359-360). Yet, even though information security is a multifaceted concept
widely accepted, almost all studies on consumer behaviour conceptualise security as a unidimensional construct
(Hartono, et al., 2014, p. 11). The assessment of the unique influences which the underlying security dimensions
have on attitude formation, however, could provide valuable insights regarding consumer’s acceptance decision
towards innovative technologies. Hence, the nature of security perception should be specified with respect to its
dimensionality and against the backdrop of the investigation scope.
2.4 Market Situation
Due to the sheer number of potential application contexts, the wearable technology landscape is already populated
with various vendors across many sectors (Hanuska, et al., 2016, p. 13). Beside most major electronics and fashion
companies including Adidas, Google, Intel, Levi's, IBM and Samsung, an eclectic collection of new start-ups
emerged that cover a plethora of innovative products and applications, with health and fitness being a key category
(Salah, et al., 2014, p. 6). The discussed differences of wearables compared to preceding mobile technology
innovations offer various opportunities for existing and new businesses to create value, be it in regard to new
business models (e.g. new apps, advertisements, sales generations, etc.), or in terms of internal corporate value
creation, for example through improved collaboration and more process effectiveness (Hein & Rauschnabel, 2016,
p. 87). Based on the value chain concept that interrelates value-adding activities a firm performs, wearable
technologies may provide a source of revenue opportunity for multiple eco-system stakeholders at each link.
Effective cooperation models between the involved value chain actors (including device makers, network
operators, content and application providers, textile producers, clinicians, insurers, big data storage and data
analytics platform providers) can foster creation of business value and market acceptance (European Commission,
2016, p. 16). Within the emerging landscape, many globally established companies have now incorporated
wearable electronics into their portfolio to increase the value of their offerings. For instance, as a result of a year-
long effort between the Levi’s Innovation team and Google’s Advanced Technology and Projects (ATAP) group,
Levi's pioneered weaving conductive fibres and technology into a denim jacket that allows users to take phone
calls, get directions and check the time, by tapping and swiping their sleeves (Samaniego, 2016). Such innovations
focus on the existing audience of consumers by combining traditional functions with connected features. Other
early-stage entrepreneurial firms have entered the market, which build their business models solely around
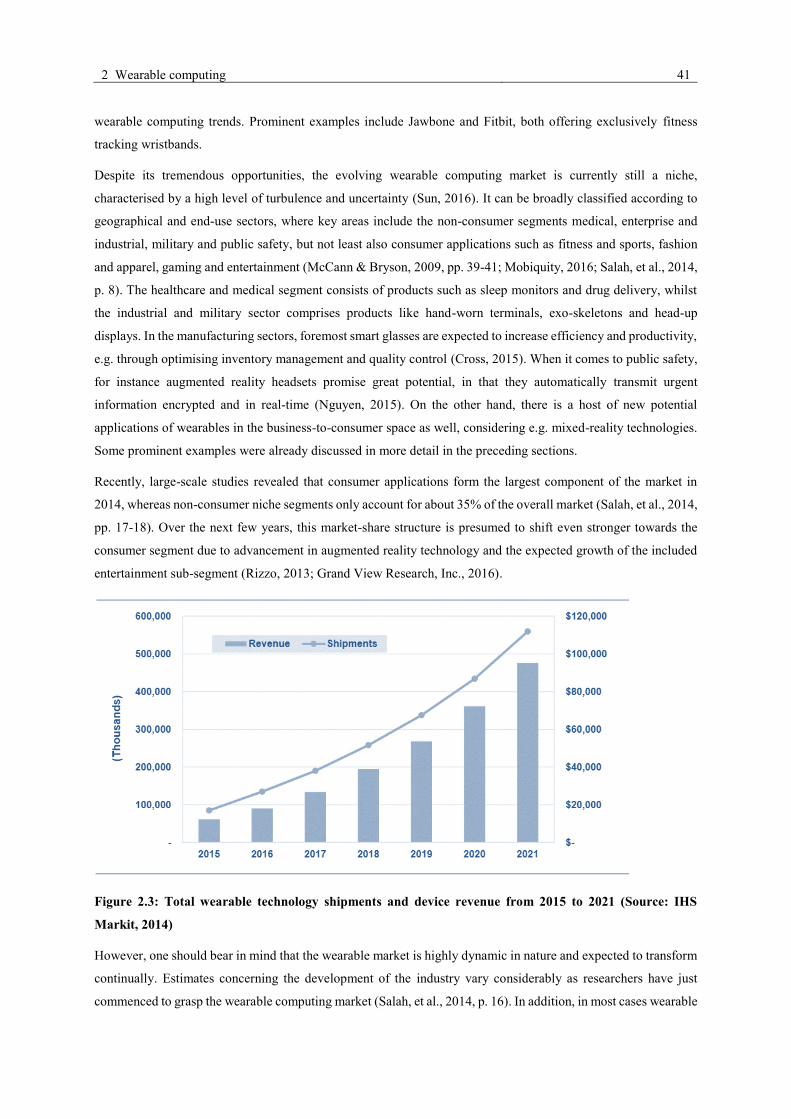
2 Wearable computing 41
wearable computing trends. Prominent examples include Jawbone and Fitbit, both offering exclusively fitness
tracking wristbands.
Despite its tremendous opportunities, the evolving wearable computing market is currently still a niche,
characterised by a high level of turbulence and uncertainty (Sun, 2016). It can be broadly classified according to
geographical and end-use sectors, where key areas include the non-consumer segments medical, enterprise and
industrial, military and public safety, but not least also consumer applications such as fitness and sports, fashion
and apparel, gaming and entertainment (McCann & Bryson, 2009, pp. 39-41; Mobiquity, 2016; Salah, et al., 2014,
p. 8). The healthcare and medical segment consists of products such as sleep monitors and drug delivery, whilst
the industrial and military sector comprises products like hand-worn terminals, exo-skeletons and head-up
displays. In the manufacturing sectors, foremost smart glasses are expected to increase efficiency and productivity,
e.g. through optimising inventory management and quality control (Cross, 2015). When it comes to public safety,
for instance augmented reality headsets promise great potential, in that they automatically transmit urgent
information encrypted and in real-time (Nguyen, 2015). On the other hand, there is a host of new potential
applications of wearables in the business-to-consumer space as well, considering e.g. mixed-reality technologies.
Some prominent examples were already discussed in more detail in the preceding sections.
Recently, large-scale studies revealed that consumer applications form the largest component of the market in
2014, whereas non-consumer niche segments only account for about 35% of the overall market (Salah, et al., 2014,
pp. 17-18). Over the next few years, this market-share structure is presumed to shift even stronger towards the
consumer segment due to advancement in augmented reality technology and the expected growth of the included
entertainment sub-segment (Rizzo, 2013; Grand View Research, Inc., 2016).
Figure 2.3: Total wearable technology shipments and device revenue from 2015 to 2021 (Source: IHS
Markit, 2014)
However, one should bear in mind that the wearable market is highly dynamic in nature and expected to transform
continually. Estimates concerning the development of the industry vary considerably as researchers have just
commenced to grasp the wearable computing market (Salah, et al., 2014, p. 16). In addition, in most cases wearable
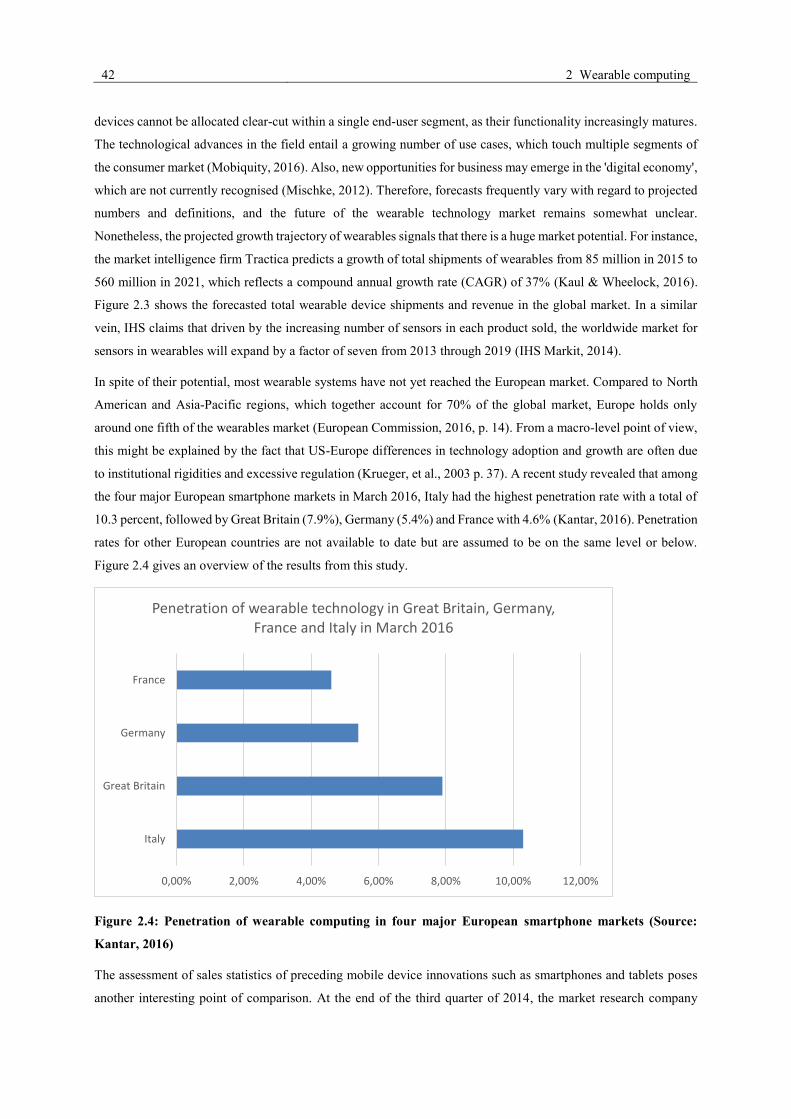
42 2 Wearable computing
devices cannot be allocated clear-cut within a single end-user segment, as their functionality increasingly matures.
The technological advances in the field entail a growing number of use cases, which touch multiple segments of
the consumer market (Mobiquity, 2016). Also, new opportunities for business may emerge in the 'digital economy',
which are not currently recognised (Mischke, 2012). Therefore, forecasts frequently vary with regard to projected
numbers and definitions, and the future of the wearable technology market remains somewhat unclear.
Nonetheless, the projected growth trajectory of wearables signals that there is a huge market potential. For instance,
the market intelligence firm Tractica predicts a growth of total shipments of wearables from 85 million in 2015 to
560 million in 2021, which reflects a compound annual growth rate (CAGR) of 37% (Kaul & Wheelock, 2016).
Figure 2.3 shows the forecasted total wearable device shipments and revenue in the global market. In a similar
vein, IHS claims that driven by the increasing number of sensors in each product sold, the worldwide market for
sensors in wearables will expand by a factor of seven from 2013 through 2019 (IHS Markit, 2014).
In spite of their potential, most wearable systems have not yet reached the European market. Compared to North
American and Asia-Pacific regions, which together account for 70% of the global market, Europe holds only
around one fifth of the wearables market (European Commission, 2016, p. 14). From a macro-level point of view,
this might be explained by the fact that US-Europe differences in technology adoption and growth are often due
to institutional rigidities and excessive regulation (Krueger, et al., 2003 p. 37). A recent study revealed that among
the four major European smartphone markets in March 2016, Italy had the highest penetration rate with a total of
10.3 percent, followed by Great Britain (7.9%), Germany (5.4%) and France with 4.6% (Kantar, 2016). Penetration
rates for other European countries are not available to date but are assumed to be on the same level or below.
Figure 2.4 gives an overview of the results from this study.
Figure 2.4: Penetration of wearable computing in four major European smartphone markets (Source:
Kantar, 2016)
The assessment of sales statistics of preceding mobile device innovations such as smartphones and tablets poses
another interesting point of comparison. At the end of the third quarter of 2014, the market research company
0,00% 2,00% 4,00% 6,00% 8,00% 10,00% 12,00%
Italy
Great Britain
Germany
France
Penetration of wearable technology in Great Britain, Germany, France and Italy in March 2016
2 Wearable computing 43
GlobalWebIndex interviewed more than 41,000 consumers in 32 markets including U.S., Canada, Brazil, the U.K.
and China (Wagner, 2015). The firm reports that four out of five adults surveyed possess a smartphone, nearly half
of them own a tablet, and almost 10% would use a smartwatch. Generally, adoption of wearables has grown in
2015 to around the same percentage as mobile tablet ownership was in 2012, i.e. about 20%. Global research firms
therefore project the adoption curve of wearables to parallelise that of tablets (Bothun, et al., 2014; eMarketer Inc.,
2015). However, it should be taken into account that after demand had peaked, sales of tablet computers had
flatlined and, thereby, proved these technologies to be less popular than smartphones. While mobile phones have
achieved s-shaped growth curves in mainstream markets, tablet-PCs still lack the breakthrough that leads towards
full acceptance (Titcomb, 2017; Dediu, 2013). From this perspective, it is questionable whether wearable devices
will experience the same market success as mobile phones. As Cathy Boyle, a senior mobile analyst, put it: “[…]
manufacturers, specifically their marketing teams, have significant work to do in convincing the average person
that a smart watch is as worthy of their time and money” (eMarketer Inc., 2015). In a high-tech context, many
emerging technologies even fail to gain any relevant market share (Planing, 2014 p. 18).
When looking at individual device types, it appears that watches and wristbands are experiencing a steady growth
since 2014 and are anticipated to remain the biggest market for wearables in the near term. In some literature,
smartwatch adoption is even considered to be the first step towards commercialised wearables (Jung, et al., 2016,
p. 899). Since many smartwatches are designed as peripherals to mobile phones, market analysts assume that it is
particularly the proliferation of smartphones that acts as a ‘complementor’ in terms of the diffusion of wearable
devices (Szopa, 2015, p. 236; Dahad, 2016). Also, the quantified self-movement is thought to have propelled the
trend towards smart wrist-worn technologies (Salah, et al., 2014, p. 18). This specific movement describes the
societal trend to self-track any kind of biological, physical, behavioural, or environmental information with the aid
of wearable sensors for self-knowledge and self-optimisation purposes (Swan, 2013 p. 85). Overall, the vibrant
wristwear market including smartwatches and wristbands is expected to grow at an annualised rate of 18% through
2021 to reach 70 million units sold (Beaver, 2016). Still, despite its steady growth, six months after the initial
launch of the Apple Watch in the second quarter of 2015, the market for smart wristwear is witnessing a slowdown
in sales ever since (Richter, 2016). Even worse, in the third quarter of 2016, the whole smartwatch market
experienced a steep downturn, decreasing by 51.6% in its year-over-year growth (IDC 2016). This development
is in line with prevailing forecasts on the sales figures of device types. Figure 2.6 shows the predicted global
wearable technology sales by product category from 2014 to 2018. As can be seen, the growth of both
smartwatches and smart wristband products is expected to stagnate from the year 2017 onwards, whereas smart
glasses and other types of wearables are supposed to gain momentum as of this date. Yet, in regard to the smart
watch category it should be kept in mind that the column displaying the estimation for 2015 also includes the
launch of the Apple Watch.
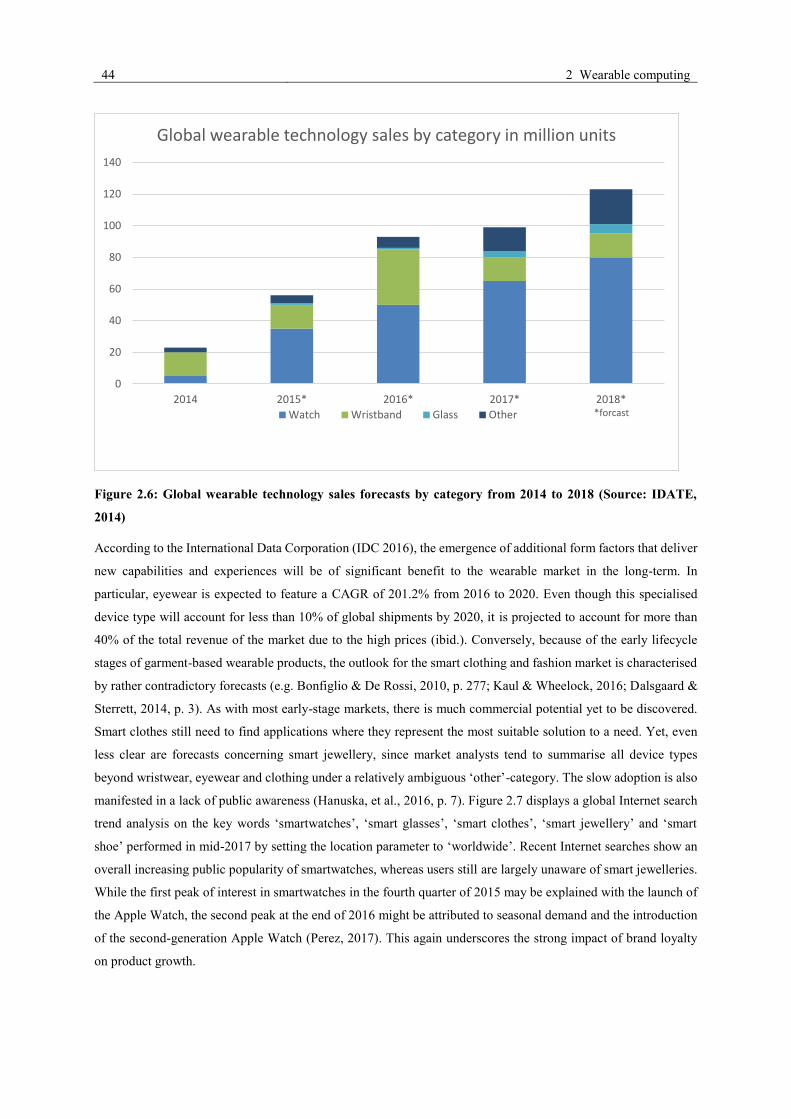
44 2 Wearable computing
Figure 2.6: Global wearable technology sales forecasts by category from 2014 to 2018 (Source: IDATE,
2014)
According to the International Data Corporation (IDC 2016), the emergence of additional form factors that deliver
new capabilities and experiences will be of significant benefit to the wearable market in the long-term. In
particular, eyewear is expected to feature a CAGR of 201.2% from 2016 to 2020. Even though this specialised
device type will account for less than 10% of global shipments by 2020, it is projected to account for more than
40% of the total revenue of the market due to the high prices (ibid.). Conversely, because of the early lifecycle
stages of garment-based wearable products, the outlook for the smart clothing and fashion market is characterised
by rather contradictory forecasts (e.g. Bonfiglio & De Rossi, 2010, p. 277; Kaul & Wheelock, 2016; Dalsgaard &
Sterrett, 2014, p. 3). As with most early-stage markets, there is much commercial potential yet to be discovered.
Smart clothes still need to find applications where they represent the most suitable solution to a need. Yet, even
less clear are forecasts concerning smart jewellery, since market analysts tend to summarise all device types
beyond wristwear, eyewear and clothing under a relatively ambiguous ‘other’-category. The slow adoption is also
manifested in a lack of public awareness (Hanuska, et al., 2016, p. 7). Figure 2.7 displays a global Internet search
trend analysis on the key words ‘smartwatches’, ‘smart glasses’, ‘smart clothes’, ‘smart jewellery’ and ‘smart
shoe’ performed in mid-2017 by setting the location parameter to ‘worldwide’. Recent Internet searches show an
overall increasing public popularity of smartwatches, whereas users still are largely unaware of smart jewelleries.
While the first peak of interest in smartwatches in the fourth quarter of 2015 may be explained with the launch of
the Apple Watch, the second peak at the end of 2016 might be attributed to seasonal demand and the introduction
of the second-generation Apple Watch (Perez, 2017). This again underscores the strong impact of brand loyalty
on product growth.
0
20
40
60
80
100
120
140
2014 2015* 2016* 2017* 2018**forcast
Global wearable technology sales by category in million units
Watch Wristband Glass Other
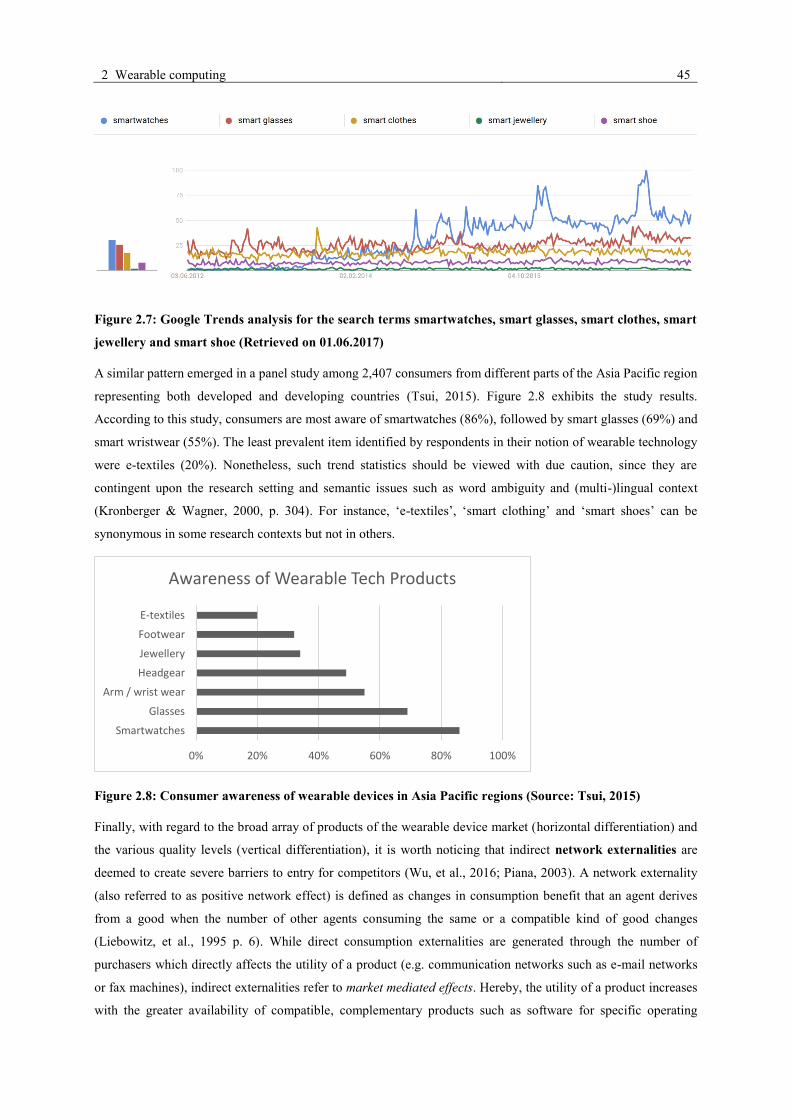
2 Wearable computing 45
Figure 2.7: Google Trends analysis for the search terms smartwatches, smart glasses, smart clothes, smart
jewellery and smart shoe (Retrieved on 01.06.2017)
A similar pattern emerged in a panel study among 2,407 consumers from different parts of the Asia Pacific region
representing both developed and developing countries (Tsui, 2015). Figure 2.8 exhibits the study results.
According to this study, consumers are most aware of smartwatches (86%), followed by smart glasses (69%) and
smart wristwear (55%). The least prevalent item identified by respondents in their notion of wearable technology
were e-textiles (20%). Nonetheless, such trend statistics should be viewed with due caution, since they are
contingent upon the research setting and semantic issues such as word ambiguity and (multi-)lingual context
(Kronberger & Wagner, 2000, p. 304). For instance, ‘e-textiles’, ‘smart clothing’ and ‘smart shoes’ can be
synonymous in some research contexts but not in others.
Figure 2.8: Consumer awareness of wearable devices in Asia Pacific regions (Source: Tsui, 2015)
Finally, with regard to the broad array of products of the wearable device market (horizontal differentiation) and
the various quality levels (vertical differentiation), it is worth noticing that indirect network externalities are
deemed to create severe barriers to entry for competitors (Wu, et al., 2016; Piana, 2003). A network externality
(also referred to as positive network effect) is defined as changes in consumption benefit that an agent derives
from a good when the number of other agents consuming the same or a compatible kind of good changes
(Liebowitz, et al., 1995 p. 6). While direct consumption externalities are generated through the number of
purchasers which directly affects the utility of a product (e.g. communication networks such as e-mail networks
or fax machines), indirect externalities refer to market mediated effects. Hereby, the utility of a product increases
with the greater availability of compatible, complementary products such as software for specific operating
0% 20% 40% 60% 80% 100%
Smartwatches
Glasses
Arm / wrist wear
Headgear
Jewellery
Footwear
E-textiles
Awareness of Wearable Tech Products
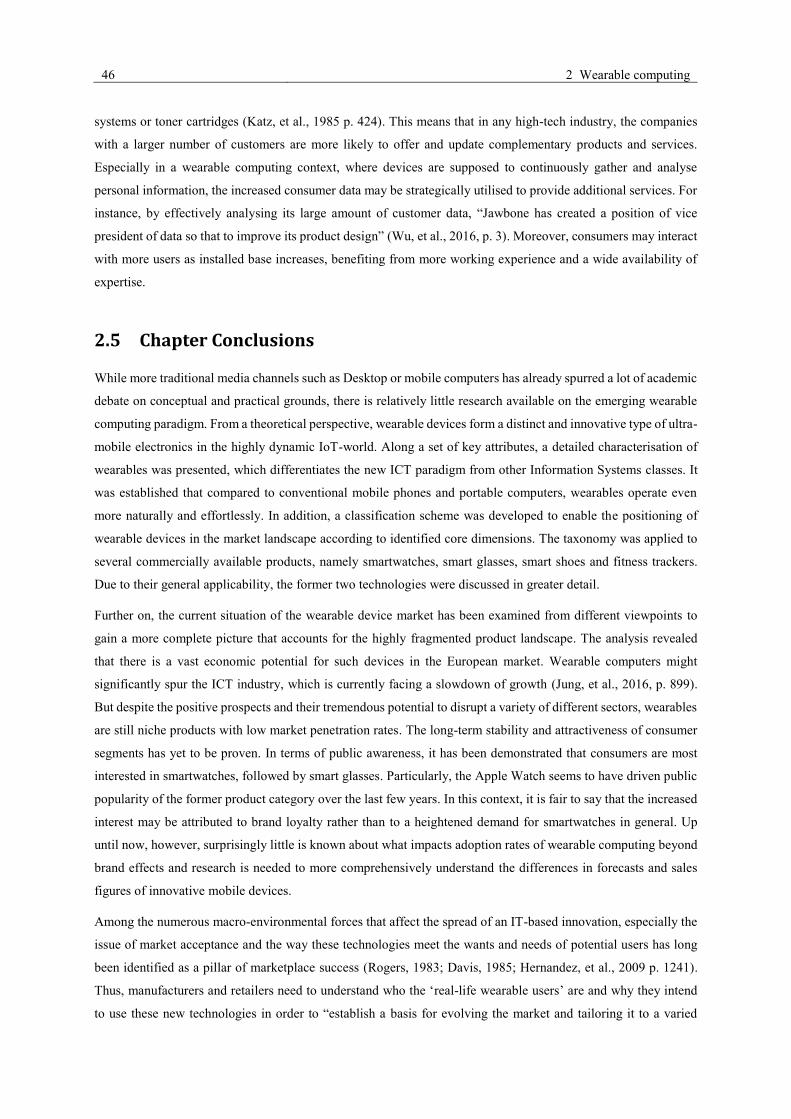
46 2 Wearable computing
systems or toner cartridges (Katz, et al., 1985 p. 424). This means that in any high-tech industry, the companies
with a larger number of customers are more likely to offer and update complementary products and services.
Especially in a wearable computing context, where devices are supposed to continuously gather and analyse
personal information, the increased consumer data may be strategically utilised to provide additional services. For
instance, by effectively analysing its large amount of customer data, “Jawbone has created a position of vice
president of data so that to improve its product design” (Wu, et al., 2016, p. 3). Moreover, consumers may interact
with more users as installed base increases, benefiting from more working experience and a wide availability of
expertise.
2.5 Chapter Conclusions
While more traditional media channels such as Desktop or mobile computers has already spurred a lot of academic
debate on conceptual and practical grounds, there is relatively little research available on the emerging wearable
computing paradigm. From a theoretical perspective, wearable devices form a distinct and innovative type of ultra-
mobile electronics in the highly dynamic IoT-world. Along a set of key attributes, a detailed characterisation of
wearables was presented, which differentiates the new ICT paradigm from other Information Systems classes. It
was established that compared to conventional mobile phones and portable computers, wearables operate even
more naturally and effortlessly. In addition, a classification scheme was developed to enable the positioning of
wearable devices in the market landscape according to identified core dimensions. The taxonomy was applied to
several commercially available products, namely smartwatches, smart glasses, smart shoes and fitness trackers.
Due to their general applicability, the former two technologies were discussed in greater detail.
Further on, the current situation of the wearable device market has been examined from different viewpoints to
gain a more complete picture that accounts for the highly fragmented product landscape. The analysis revealed
that there is a vast economic potential for such devices in the European market. Wearable computers might
significantly spur the ICT industry, which is currently facing a slowdown of growth (Jung, et al., 2016, p. 899).
But despite the positive prospects and their tremendous potential to disrupt a variety of different sectors, wearables
are still niche products with low market penetration rates. The long-term stability and attractiveness of consumer
segments has yet to be proven. In terms of public awareness, it has been demonstrated that consumers are most
interested in smartwatches, followed by smart glasses. Particularly, the Apple Watch seems to have driven public
popularity of the former product category over the last few years. In this context, it is fair to say that the increased
interest may be attributed to brand loyalty rather than to a heightened demand for smartwatches in general. Up
until now, however, surprisingly little is known about what impacts adoption rates of wearable computing beyond
brand effects and research is needed to more comprehensively understand the differences in forecasts and sales
figures of innovative mobile devices.
Among the numerous macro-environmental forces that affect the spread of an IT-based innovation, especially the
issue of market acceptance and the way these technologies meet the wants and needs of potential users has long
been identified as a pillar of marketplace success (Rogers, 1983; Davis, 1985; Hernandez, et al., 2009 p. 1241).
Thus, manufacturers and retailers need to understand who the ‘real-life wearable users’ are and why they intend
to use these new technologies in order to “establish a basis for evolving the market and tailoring it to a varied
2 Wearable computing 47
audience to increase appeal” (GfK, 2017). In regard to the outlined network externalities of wearable devices, for
the successful commercialisation of wearables it is particularly crucial to understand adoption behaviour in very
early stages of diffusion and to reach a critical mass of users soonest possible.
Yet, in-depth knowledge of the consumers’ beliefs and perceptions towards wearable computing is still lacking.
There is no clear understanding of the drivers and obstacles to the early adoption of these technologies. To fill the
gap, this thesis aims to shed light on the individual-level and cognitive factors that explain consumers’ intention
to use wearable technologies. The next sections therefore deal with the most influential behavioural theories that
were adopted by a great stream of previous Information Systems research, specifically addressing issues with
regard to innovation diffusion and user acceptance. The well-recognised theoretical frameworks and relevant
concepts may provide researchers with a good starting point for understanding ICT usage intention formation.
48 Theoretical Foundations
3 Theoretical Foundations
This chapter aims at laying a solid foundation for the sought theoretical framework by reviewing relevant literature
in the field of innovation acceptance. It synthesises different perspectives, important assumptions and key concepts
in order to provide an understanding of the structure of the subject and to place the proposed study into the existing
body of knowledge. The literature review thereby helps to frame and to justify the chosen approach and, moreover,
demonstrates how the present research advances the available knowledge base in the area of interest (Planing,
2014 p. 27).
To increase efficiency of the literature review, it was based upon a concept-centric approach (see Webster and
Watson, 2002). As opposed to the widespread author-centric approach, which primarily represents a summary of
relevant articles, the concept-centric approach concentrates rather on taxonomies in which relationships between
relevant concepts are considered. Given the identified need for a profound understanding of the underlying
mechanisms that drive wearable computing adoption at individual-level (cf. chapter 2.5), this research focuses on
the consumer acceptance of a technological innovation. Therefore, the two concepts ‘acceptance’ and ‘innovation’
particularly determined the organising structure of the review. In line with the operational understanding of the
term ‘acceptance’ in the broad ICT adoption literature, for the present purposes acceptance is defined as a relatively
enduring, positive attitude towards the use of a new technology (Gao & Bai, 2014, p. 215; Tuomela, 2000, p. 127).
This definition accentuates the latent willingness to use a system, rather than the actual usage behaviour. It is
conceptually closely related to the common definition of innovation adoption, which describes a process that starts
with the initial awareness of an innovation and moves to product evaluation, then to the decision to try the adoption
and finally to a “continued full-scale use” or repeat purchase decision in case of a non-durable innovation (Nabih,
et al., 1997, p. 191; Wisdom, et al., 2015). For research economic reasons, measurement of the actual usage
behaviour is not viable for the present study. Thus, the concepts acceptance and adoption are understood
interchangeably as the intention to use a technology throughout this thesis.
3.1 Behavioural Theories
Prior research on wearable devices possesses largely a technical or application perspective (Hein & Rauschnabel,
2016, p. 86). For instance, researchers have already investigated diverse applications and several aspects of smart
glasses in medical (e.g. Muensterer, et al., 2014) and industrial (e.g. Bauer, et al., 2016) settings. The few existing
studies with a behavioural perspective mostly focus on specific product categories (e.g. Li, et al., 2016) and single
base models (e.g. Chuah, et al., 2016). This theory monism, however, may not suffice to comprehensively explain
a complex phenomenon in the field of social sciences and marketing research (Wübben, 2009, p. 51). Therefore,
in the course of the present study an integrative approach is employed in order to frame a holistic as well as
coherent system of hypotheses. Within this model of cause and effect chains, wearable technology acceptance is
related to pervasive concepts in diffusion research (especially to key terminologies of innovation adoption) as well
as to the field of Information Systems (particularly to empirical findings from technology acceptance research), to
core principles of IT security, and to influential frameworks in personality psychology.
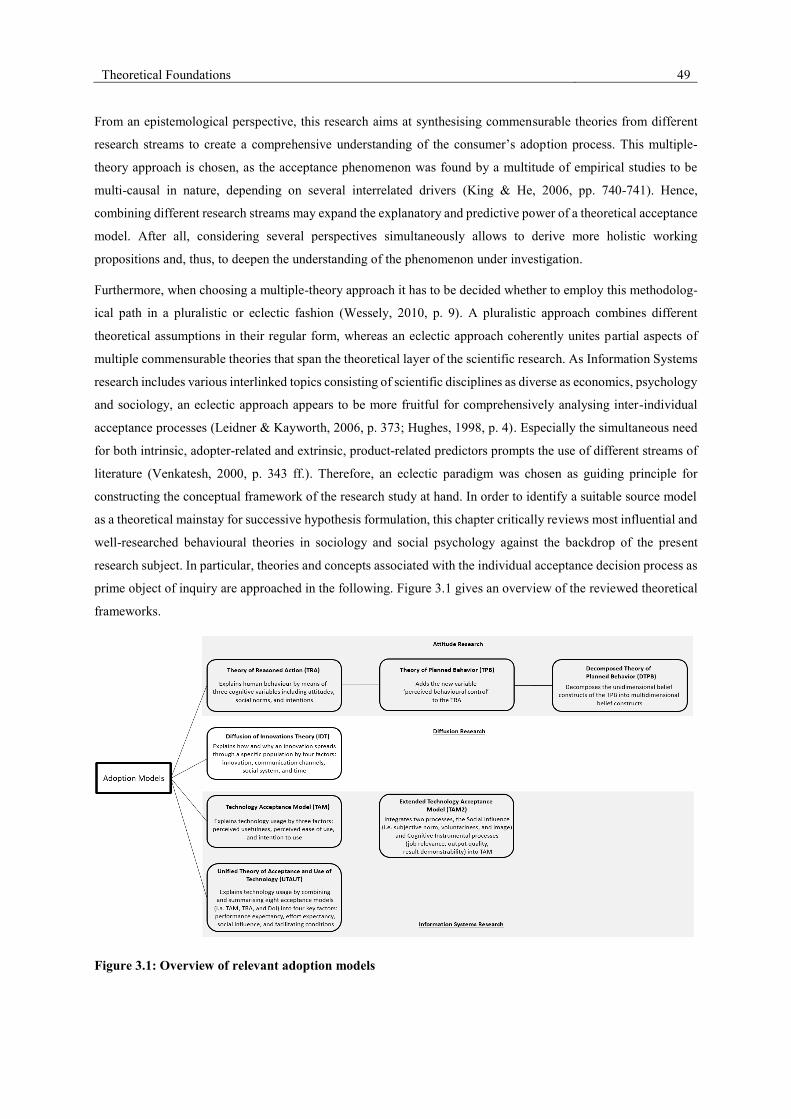
Theoretical Foundations 49
From an epistemological perspective, this research aims at synthesising commensurable theories from different
research streams to create a comprehensive understanding of the consumer’s adoption process. This multiple-
theory approach is chosen, as the acceptance phenomenon was found by a multitude of empirical studies to be
multi-causal in nature, depending on several interrelated drivers (King & He, 2006, pp. 740-741). Hence,
combining different research streams may expand the explanatory and predictive power of a theoretical acceptance
model. After all, considering several perspectives simultaneously allows to derive more holistic working
propositions and, thus, to deepen the understanding of the phenomenon under investigation.
Furthermore, when choosing a multiple-theory approach it has to be decided whether to employ this methodolog-
ical path in a pluralistic or eclectic fashion (Wessely, 2010, p. 9). A pluralistic approach combines different
theoretical assumptions in their regular form, whereas an eclectic approach coherently unites partial aspects of
multiple commensurable theories that span the theoretical layer of the scientific research. As Information Systems
research includes various interlinked topics consisting of scientific disciplines as diverse as economics, psychology
and sociology, an eclectic approach appears to be more fruitful for comprehensively analysing inter-individual
acceptance processes (Leidner & Kayworth, 2006, p. 373; Hughes, 1998, p. 4). Especially the simultaneous need
for both intrinsic, adopter-related and extrinsic, product-related predictors prompts the use of different streams of
literature (Venkatesh, 2000, p. 343 ff.). Therefore, an eclectic paradigm was chosen as guiding principle for
constructing the conceptual framework of the research study at hand. In order to identify a suitable source model
as a theoretical mainstay for successive hypothesis formulation, this chapter critically reviews most influential and
well-researched behavioural theories in sociology and social psychology against the backdrop of the present
research subject. In particular, theories and concepts associated with the individual acceptance decision process as
prime object of inquiry are approached in the following. Figure 3.1 gives an overview of the reviewed theoretical
frameworks.
Figure 3.1: Overview of relevant adoption models
50 Theoretical Foundations
3.1.1 Innovation Diffusion Theory
Since 1962 the Innovation Diffusion Theory (IDT) by Rogers has tremendously influenced multiple disciplines
including anthropology, rural sociology, communication, medicine, and education among others (McMaster &
Wastell, 2006, p. 384). Particularly within the field of Information Systems research the formal diffusion theory
has attracted considerable academic attention. In essence, diffusion is defined as a process of innovation
dissemination within a given population through both mass media and interpersonal communication exchange
(Rogers, 1983a p. 5). Diffusion is thus understood as a specific type of interpersonal communication, which
implicitly signifies some degree of social change within a given population. Accordingly, innovation diffusion is
a dynamic and time-attributed process, involving a gradual transfer of new information over a specified social
system (Lechman, 2015, p. 30). Marketing research is particularly interested in the evolutionary process from the
commercialisation of an invention turning into an innovation (i.e. market launch), to its large-scale diffusion within
a consumer market. In general, this implicates a rather erratic and idiosyncratic trajectory path.
In the empirical literature, there is a broad consensus that the innovation diffusion process is fairly complex. It
involves significant time lags due to varying adoption rates among the members of a given social system (Hoff,
2012 p. 33). It becomes apparent from the collected evidence in numerous exploratory surveys since the late 1950s
(Kemper, 2009, p. 98) that in a stylised form the diffusion of a single innovation approximates formally a logistic
distribution function: Assuming that the noncumulative adoption pattern follows typically a normal, bell-shaped
curve indicating the frequency distribution of actual period-by-period adoption decisions, the innovation and
diffusion process is commonly outlined as an S-curve that displays the cumulative demand of a novelty over time
(Rogers, 1983a p. 23; Mahajan, et al., 1995 p. G82). By its very nature, the market potential indicates the market
saturation level inherent to the system. Regarding the S-shaped curve phenomenon, the inflection point marks the
transition from the convex (take-off) to the concave growth shape. Thereby, both the progressive proliferation
among innovators (those with a constant propensity to adopt) and the degressive growth of imitators (those whose
propensity to adopt is affected by the amount of previous adoptions) are represented by respective coefficients
(Meade & Islam, 2006, p. 539; Bass, 1980, p. S56). Figure 3.2 illustrates the cumulative product growth together
with the noncumulative adoption curve as a function of time. Almost all basic mathematical descriptions of
innovation diffusion (in particular, the most frequently applied sigmoidal model by Bass) were established up to
the 1970s. The main modelling developments from this date onward have mostly been slight modifications of the
existing functions. These extensions aimed to add greater flexibility to the existing models, for example by means
of auxiliary marketing mix variables (e.g. pricing and promotion) in the model parameterisation. Further variants
focused on a generalisation of the base models, taking into account different diffusion stages in several countries
or successive generations of technologies (Meade, et al., 2006 p. 520 f.). Still, the bulk of those contributions
addresses the explanation of past behaviour rather than predicting future behaviour (ibid.).
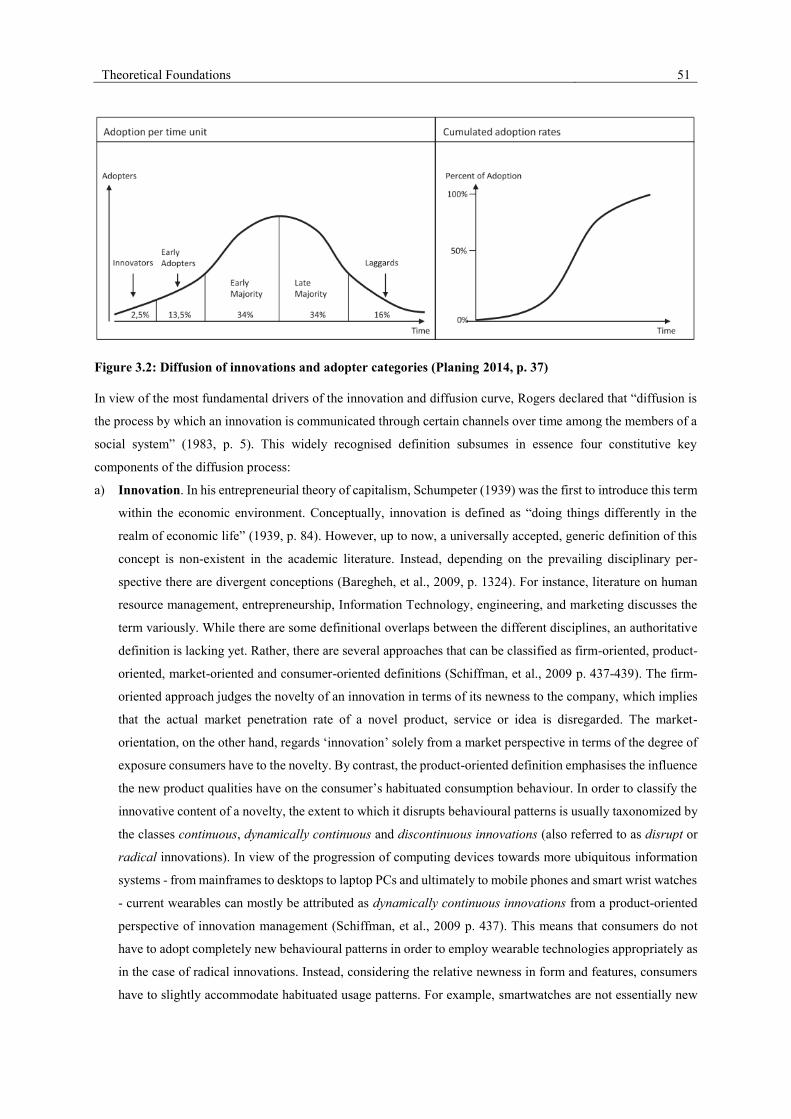
Theoretical Foundations 51
Figure 3.2: Diffusion of innovations and adopter categories (Planing 2014, p. 37)
In view of the most fundamental drivers of the innovation and diffusion curve, Rogers declared that “diffusion is
the process by which an innovation is communicated through certain channels over time among the members of a
social system” (1983, p. 5). This widely recognised definition subsumes in essence four constitutive key
components of the diffusion process:
a) Innovation. In his entrepreneurial theory of capitalism, Schumpeter (1939) was the first to introduce this term
within the economic environment. Conceptually, innovation is defined as “doing things differently in the
realm of economic life” (1939, p. 84). However, up to now, a universally accepted, generic definition of this
concept is non-existent in the academic literature. Instead, depending on the prevailing disciplinary per-
spective there are divergent conceptions (Baregheh, et al., 2009, p. 1324). For instance, literature on human
resource management, entrepreneurship, Information Technology, engineering, and marketing discusses the
term variously. While there are some definitional overlaps between the different disciplines, an authoritative
definition is lacking yet. Rather, there are several approaches that can be classified as firm-oriented, product-
oriented, market-oriented and consumer-oriented definitions (Schiffman, et al., 2009 p. 437-439). The firm-
oriented approach judges the novelty of an innovation in terms of its newness to the company, which implies
that the actual market penetration rate of a novel product, service or idea is disregarded. The market-
orientation, on the other hand, regards ‘innovation’ solely from a market perspective in terms of the degree of
exposure consumers have to the novelty. By contrast, the product-oriented definition emphasises the influence
the new product qualities have on the consumer’s habituated consumption behaviour. In order to classify the
innovative content of a novelty, the extent to which it disrupts behavioural patterns is usually taxonomized by
the classes continuous, dynamically continuous and discontinuous innovations (also referred to as disrupt or
radical innovations). In view of the progression of computing devices towards more ubiquitous information
systems - from mainframes to desktops to laptop PCs and ultimately to mobile phones and smart wrist watches
- current wearables can mostly be attributed as dynamically continuous innovations from a product-oriented
perspective of innovation management (Schiffman, et al., 2009 p. 437). This means that consumers do not
have to adopt completely new behavioural patterns in order to employ wearable technologies appropriately as
in the case of radical innovations. Instead, considering the relative newness in form and features, consumers
have to slightly accommodate habituated usage patterns. For example, smartwatches are not essentially new
52 Theoretical Foundations
products compared to the functionality of smart phones, but they offer a new channel as well as novel modes
of interaction. From a marketing perspective, the prevalent consumers’ consumption habits have to be
modified by ‘educating’ potential adopters about the relative benefit of the wearable product in order to
stimulate primary demand within the introductory stage of the product life cycle (Pride & Ferrell, 2015, p.
492).
b) Communication channels. According to Rogers, the rate of innovation adoption is, inter alia, basically deter-
mined by the efficiency of the respective means for information exchange within a homogenous group of
potential adopters (Rogers, 1983a pp. 17-18). These communication channels include both mass media in-
struments and interpersonal communication. As per prior empirical findings, word-of-mouth or informal
personal communication are the most effective means for persuading individuals of a referral social network,
whereas mass media channels are more efficient in creating awareness-knowledge (ibid.). More precisely,
research findings suggest that interpersonal communication moderates the effects of mass media considerably
by reinforcing recognition memory for the content in question (Southwell & Yzer, 2007, pp. 443-445).
However, in order to develop communication initiatives appropriately, a thorough knowledge of the social
context concerned is finally vital for choosing the most effectual instruments (McLeod & Vaughan, 2014).
c) Social system. This key element of diffusion refers to societal microstructures featuring a high degree of
homogeneity. A social system may include individuals, informal groups, organisational units, and subsystems,
where system members are alike among each other in certain attributes, such as beliefs, education and social
status (Rogers, 1983a p. 24). The level of homogeneity of a social network essentially determines the rate of
adoption. However, it must be emphasised that the classical diffusion theory rests on the implicit assumptions
that a) an innovation should be diffused more rapidly and adopted by all system units, regardless of possible
anti-diffusion programs (pro-innovation bias) and b) there are generally no user interdependencies (Fichman,
1992 p. 195-206; Perner, 2013; Rogers, 1983a p. 92).
Particularly, the latter assumption is frequently violated in practice as technological innovations are by nature
often subject to network externalities and organisational rules. The emerging value chains of wearable devices
enable new business models not only for manufacturers, but for all inter-organisational partners, occupying a
position within the chain (Rizzo, 2014). Such indirect network externalities are self-evidently the case for
software and hardware vendors whose interoperable applications and convergent technologies mutually
influence the technological trajectory of wearables. Nonetheless, despite the fact that network effects may
accelerate mass-market adoption, for achieving a breakthrough penetration rate where the diffusion curve
becomes self-sustaining, consumer acceptance is deemed the most important prerequisite (Davis, 1993, p.
475; Kleijnen, et al., 2009, p. 344).
d) Time. The time dimension is fundamentally intertwined with the concept of diffusion at three descriptive,
interrelated levels (Rogers, 1983a p. 20 ff.):
(1) From a micro-level perspective, diffusion is a multistage decision-making process that
encompasses five linear stages through which a message receiver goes. Roger’s phase model
essentially depicts information-seeking and information-processing activities for reducing un-
certainty about the anticipated consequences of the adoption or rejection of an innovation
(Planing, 2014 p. 38; Rogers, 1983a p. 163).
Theoretical Foundations 53
In the initial phase of knowledge, the individual or decision-making unit takes a relatively
passive role when developing awareness of an innovation and when gaining a substantial under-
standing about its meaning and utility. However, individuals tend to expose themselves to
communication messages that are consistent with their existing predispositions, such as interests,
needs and attitudes. Likewise, people are generally inclined to interpret new information in terms
of available beliefs, what is referred to as selective perception (Rogers, 1983a p. 166; Choi, et
al., 2010 p. 58). Some scholars therefore underline the relevance of the so-called ‘problem-recog-
nition’ stage, which precedes the creation of awareness knowledge (Schiffman, et al., 2009 p.
463).
At the subsequent persuasion stage of the innovation-decision process, individuals form an af-
fect-laden attitude towards the innovation in the sense of favourability or unfavorability. The
individual is hence more sensitively involved with the innovation, actively seeking information
by means of perceived innovation characteristics to reduce uncertainty about the expected con-
sequences of adoption. According to Rogers, the implementation of an innovation is, ceteris
paribus, relatively likely if the five product-related adoption factors are perceived to be salient
(Rogers, 1983a p. 15 f.): (1) relative advantage (2) compatibility (3, reverse) complexity (4)
triability, and (5) observability.
The relative advantage criterion broadly denotes a superior alternative in technological, eco-
nomic, social or emotional terms. This factor also comprises anticipated behavioural conse-
quences towards personal goals (Planing, 2014 p. 39). Compatibility refers to the degree to which
an innovation is congruent to either behavioural patterns and values or existing experiences and
practical needs of the potential adopter. Complexity, on the other hand, relates to the extent to
which an innovation raises cognitive efforts. Further, triability is the degree to which the
innovation is perceived as available for trial on a preliminary basis. Finally, the observability
characteristic relates to the communicability of the innovation’s utility and benefits. However,
only the first three innovation criteria were found to be significant adoption correlates
(Tornatzky, et al., 1982 p. 40 f.). Moreover, some authors question the dimensionality and thus
the simplified operationalisation of the theorised relative advantage construct, since it reflects a
multidimensional attribute, whilst the relative importance of its underlying facets is strongly
context-dependent (Dekimpe, et al., 2000, p. 29).
The third behaviourally relevant subprocess, i.e. decision, relates to the mental state change from
indifference towards the object of adoption to its adoption or rejection. Herein, the concept of
adoption describes an attitudinal construct that is directly determined by evaluative judgements.
When an individual decides to put an innovation into practice, the implementation stage
follows, what apparently involves an overt behavioural change.
Eventually, confirmation occurs when an individual seeks to avoid or reduce a state of internal
disequilibrium or dissonance by reinforcing the respective innovation decision. However, in case
of conflicting information the decision-making unit may also reverse the previous decision.
(2) As personal characteristics are thought to determine the diffusion time path significantly, the
second dimension refers to the degree of innovativeness, i.e. the extent to which a decision-
54 Theoretical Foundations
making unit is early in adopting new ideas compared to the social frame of reference. According
to their innovativeness in terms of a classificatory principle, Rogers segments the members of
homogenous social systems into five mutually exclusive and collectively exhaustive categories
(Rogers, 1983a p. 245 ff.): The first individuals to adopt an innovation are referred to as inno-
vators (approximately the first 2.5% of all adopters), followed by the early adopters (the next
13.5% of adopters), the early majority (the next 34%), the late majority (the next 34%) and the
laggards (the last 16%). Under the influence of innovators and early adopters, who play a catalyst
role for mass-market development, imitative consumers should become the main actors in the
diffusion process to achieve market penetration more quickly (Kim & Sim, 2012, p. 247).
(3) Finally, the rate of adoption reflects the relative speed with which an innovation is adopted by
the members of a given population (Rogers, 1983a p. 23). Plotting the number of adopters on a
cumulative frequency basis over time, most frequently the above outlined S-shape results.
Nonetheless, crucially depending on the nature of the innovation acceptance context the product
growth may show a different pattern resulting e.g. in more gradual or steeper slopes of the S-
curve. Thus, it must be noted that the proposed theoretical model neither holds for all innovations
(such as technology generations) nor for successive technologies (Hoff, 2012 p. 29).
In summary, diffusion is basically a macro-level process reflecting the dissemination of an innovation within a
social reference system. Hence, macroscopic diffusion models provide parsimonious and analytically tractable
ways to forecast demand growth of innovative consumer durables as well as to study whole markets and interpret
their behaviour (Bass, 1980, p. S51; Laciana, et al., 2013, p. 1873). However, due to its model-inherent simplicity
and universality the diffusion paradigm has also been subject to various criticism. One methodological criticism
addresses the lack of explanations for the inflection points indicating the transition from progressive to degressive
demand growth (Golder, et al., 2004 p. 207; Hoff, 2012 p. 30). This clearly decreases the predictive value of the
model and reduces empirical implications that can be derived for the purposes of proactive product management.
Furthermore, some critics argue that the diffusion process is not linear, but rather more complex, comprising feed-
back loops and interdependencies between the well-defined development stages. In addition, product growth is
influenced by various demand factors at the same time, such as social acceptability and changes in beliefs (Mehta,
2002, p. 270; Golder & Tellis, 1998, p. 260). Most importantly, such aggregated models are neither capable of
providing insights about the internal processes that determine adoption decisions nor able to reveal how individual-
level market interactions are tied to global market behaviour (Muller & Mahajan, 2010, p. 93). As recent research
on social networks has rightfully questioned the assumptions of homogeneity and perfect mixing underlying
aggregate diffusion models, diffusion research has increasingly broadened its scope from the aggregate level to an
individual-level perspective (ibid.). For instance, one well-recognised microlevel approach is agent-based
modelling, wherein individual adoption decisions are determined by decision rules including techniques such as
neural networks and cellular automata. However, the relax of the above premises at the expense of an increase of
model granularity entails inevitably computational costs which in turn limit sensitivity analysis and model scope
(Rahmandad & Sterman, 2008, p. 998). In particular, individual-level data for describing disaggregate details of
market dynamics are less available than market-level data (Laciana, et al., 2013, p. 1873). Ultimately,
disaggregated micro-level models require complete knowledge of agent-agent relationships as well as sufficient
Theoretical Foundations 55
information on the influence probability between two neighbouring adoption units. Due to information privacy
and data non-availability reasons, knowledge concerning both the detailed network structure and probabilities in
wearable technology markets is yet scarce (Quinn & Brachmann, 2015; Schooler, 2014; Luu, et al., 2012, p. 218).
Regarding the present research scope both aggregate and individual-level diffusion models thus appear to be
inappropriate for validly explaining and predicting consumer acceptance towards wearable computing devices. As
this research project focuses on an integrative approach to holistically conceptualise wearable technology adoption
in detail, the empirical findings and theoretical insights of social psychology and Information Systems research
are approached in the following.
3.1.2 Behavioural Theories in Attitude and Acceptance Research
According to the assumption of the widely acknowledged stimulus-organism-response (S-O-R) paradigm,
environmental stimuli induce affective and cognitive reactions. These reactions in turn engender specific
behaviours, particularly approach or avoidance responses towards a given trigger (Mehrabian & Russell, 1974, pp.
3-4). Thus, contrary to the standard neoclassical axioms of rationality (i.e. rigorous utility maximisation as well as
completeness, transitivity and consistency in consumer’s preferences), overt adoption behaviour is substantially
determined by intervening internal states (Goodwin, et al., 2015, p. 178). In the context of information systems
adoption, the most contributing internal factor for acceptance behaviours is the attitude towards the object in
question (Davis, et al., 1989 p. 983; Rogers, 1983a p. 36). Therefore, the attitude-behaviour relation along with its
underlying theoretical framework is discussed in-depth in the next section.
3.1.2.1 On the Attitude-Behaviour Relation
In general, the concept of behavioural attitude refers to an evaluative judgement on a bipolar continuum in terms
of the overall favourability of a psychological object. Accordingly, Ajzen and Fishbein (1975, p. 216) describe
attitude in their seminal work as “an individual’s positive or negative feelings (evaluative affect) about performing
the target behaviour.” In conclusion, an attitude reflects a learned predisposition or tendency to respond towards
an object or situation, producing consistency in verbal and physical behaviour and thus possessing a directional
quality (Churchill & Iacobucci, 2010, p. 234). In marketing literature, this concept is one of the most pervasive
notions as attitudes are deemed to directly influence consumer behaviour by connoting preferences and object
evaluations (ibid.). This implies that behavioural intention fully mediates the effects of attitude on behaviour,
which in fact has been frequently demonstrated by numerous earlier studies (Bagozzi, et al., 1990 p. 46). From an
innovation diffusion perspective, attitude is conceptually closely related to – and hence commonly equated with –
the acceptance or adoption decision (Davis, 1993, p. 477).
As a latent, i.e. hypothetical construct, this behavioural predisposition represents a not directly observable variable
that must be deduced from measurable responses. These responses reflect positive or negative net evaluations of
a given attitude object. They therefore constitute an instrument for predicting and explaining volitional human
behaviour (Ajzen, 2005, p. 3). However, despite the fact that the attitude construct has widely been employed as a
learned, affect-based response (Pyun & James, 2011, p. 35), the concrete intra-attitudinal structure is still subject
of an ongoing intense debate (Bakker, et al., 2014, p. 416; Fiske, et al., 2010, p. 355; Bagozzi & Burnkrant, 1979,
56 Theoretical Foundations
p. 295; Petty & Brinol, 2010, p. 217): According to Fishbein’s expectancy-value (EV) model, a person’s overall
attitude is substantially determined by salient beliefs (Fishbein, 1967, p. 257–266). Subjective beliefs are
understood as the person’s strength of belief that the behaviour in question will lead to the respective consequence,
weighted by the subjective value of each consequence. More formally, a compensatory value judgement can be
described as:
𝐴 = ∑ 𝑏𝑖 𝑒𝑖
𝑛
𝑖=1
(3.1)
where A is the attitude towards a given object, bi is the strength of belief that the attitude object has attribute i (in
terms of a subjective probability), and ei is the evaluation of attribute i (i.e. its desirability or emotional valence).
Nevertheless, critics argue that these predictors essentially comprise ordinal information. More specifically,
empirically obtained ratings are often not proportional to the true subjective values (van der Lans & Heiser, 1988,
pp. 1-4). Thus, the multiplicative interaction of cognitive beliefs and desirability may lead to invalid results given
the error terms for both, at best interval-scaled measures without a true rational zero point. The cognitive variables,
which already received weights, get multiplied with a motivational component and thereby inflated. This might
introduce systematic error of unknown magnitude into the resulting product term (Davis, 1993). Beside this, beliefs
about certain attributes are often correlated in product evaluations (Youjae, 1989 p. 71). From a nomological net
perspective, the algebraic conglomeration of attitudinal components has also strong confound effects on dependent
variables (Sheth, et al., 1974 p. 3; Bagozzi, 1984 p. 59). Therefore, the predictive validity of EV models of attitude
can be considered as empirically ambiguous. Against the backdrop of this – yet ongoing – scoring controversy, an
‘evaluative-belief structure’ in the above sense of compensatory rules for attitude measurement seems to be less
reasonable. Moreover, the methodological assumption that subjective expectancies equal objective probabilities
appears inappropriate since subjective probabilities have proven to possess other integral features. For example,
individual’s probabilities are not expected to sum to 1 (Hewstone & Young, 1988, p. 959; Ajzen & Fishbein, 2008,
p. 2228; Ahtola, 1975, pp. 52-59). This is deemed to be due to cognitive biases, replacing the laws of chance by
judgmental heuristics such as the cognitive availability or representativeness of relevant outcomes (Kahneman &
Tversky, 1972 p. 431). Furthermore, in comparison to self-stated expectancies (i.e. cognitive beliefs), statistically
estimated weights via regression models yield more robust results as could be shown by several IT adoption studies
(Davis, 1993, p. 477). Most importantly, the hypothesised nature of attitude as a function of the cognitive belief
system is maintained in a decomposed model, what is clearly suggested by social psychology literature (Breckler
& Wiggins, 1989, p. 253). The current study follows this view, that the attitudinal disposition and its inherent
evaluative belief system are conceptually different constructs.
In regard to the dimensionality of attitude, there are two major conceptualisations referred to as the single
component and multicomponent model of attitude (Bagozzi & Burnkrant, 1979, p. 295; Bagozzi & Burnkrant,
1980, pp. 339-344). The former perspective considers attitude to be a quasi-atomic, unitary construct, representing
the affective response towards a given psychological stimulus. In accordance with Fishbein (1967), this mediating
mental state can be directly inferred from people’s beliefs and placed on a dimension ranging from favourability
to unfavorability. Nonetheless, convincing empirical evidence in respect of the validity of the single component
concept is still missing, not least because of the lack of relevant psychometric properties in many earlier used
Theoretical Foundations 57
measures (Bagozzi, et al., 1979, p. 88; Millon, et al., 2003, p. 303; Petty, et al., 1997, p. 614). Assuming this single
factor conceptualisation of attitude, available study results differ significantly on the explained portion of variance
in behaviour (Zhou, et al., 2013).
Another perspective, the two-component attitude model, argues that attitude is a more complex, multifaceted con-
struct. It derives from affective and cognitive components, each based on distinct theoretical sources of infor-
mation. As per this dyadic model of attitude, the cognitive component relates to the knowledge, thoughts and
descriptive beliefs of an individual regarding the attitude object. On the contrary, the affective component involves
feelings of like or dislike as well as emotions associated with the behaviour or object in question. From a factor-
analytical view point, both the cognitive and the affective attitudinal facets are captured by distinct indicators.
Notably, the affective constituent relates to connotative evaluations, whereas cognition rather adheres to denotative
qualities of the reference object (Maler & Vincent, 2005, p. 949). The relevance of this attribution is especially
apparent from a marketing context, where the functional utility of a product derived from its physical attributes
(i.e. denotative features) is clearly distinguished from its symbolic benefits (i.e. connotative features), which relate
to needs of the psychological and social environment (Kocak, et al., 2007, p. 161). Both attitudinal properties form
the overall evaluative judgement, i.e. a distinct layer of explanation for the consumer’s behaviour. They fully
describe the composite construct and, in doing so, the very nature of the attitude concept.
However, multiple empirical studies have shown that the relative weight of affect versus cognition varies
considerably depending on the nature of behaviour in question (Crites, et al., 1994, pp. 619-620; Zhou, et al.,
2013). Specifically, focussing on the degree of personal relevance that the object of thought holds for the message
recipient, Petty et al. emphasise the influence of consumer’s involvement on attitude formation (Petty & Cacioppo,
1979, pp. 1915-1926). According to their well-recognised dual-process theory of attitude change, the elaboration
likelihood model (ELM), there are two pathways of cognitive processing: the central and the peripheral route,
which are understood as different poles of an elaboration continuum to process persuasive messages. The first
route of persuasion involves high-effort scrutiny of the given attitude object by means of a more elaborate,
conscious information processing. This corresponds to a cognitive attitude formation and prerequisites a high
degree of involvement (Tam & Ho, 2005, pp. 287-290; Petty & Cacioppo, 1986, pp. 144-148). Hence, when
elaboration likelihood is high, the degree of attitude change strongly depends on the quality of arguments relevant
to the attitude object. On the contrary, when the peripheral route is activated, judgement formation is tied to
affective associations or inferences based on contextual persuasion cues. Attitude is rather evoked by heuristic
assessments and, thus, primarily affectively based. Consequently, under low involvement conditions secondary
inducements (such as free samples or attractive packaging) are more important in the construction of attitude. Such
peripheral cues are most likely to evoke an affect-laden information processing.
In light of its impact on attitude-behaviour consistency, a growing body of acceptance literature considers the level
of emotions and feelings attached to a given object to be a central criterion in attitude formation. The emotional
dimension should therefore play a key role in the design of persuasive communication instruments (Zhou, et al.,
2013; Yang, et al., 2004 p. 19-21; Schiffman, et al., 2009 p. 292-293). By addressing this issue, many researchers
emphasise solely on affective experiences and, thereby, completely neglect cognitive aspects in judgmental
processes. But whether a single factor or a two-factor approach of attitude is more suitable depends ultimately on

58 Theoretical Foundations
the properties of the subject under investigation (Yang & Yoo, 2004, pp. 19-31; Davis, et al., 1989, p. 17; Davis,
et al., 1989). Given that dynamically continuous innovations like smartwatches intrinsically introduce novel
properties and, furthermore, carry a certain amount of purchase risk (Lantos, 2015, p. 309; Kuester & Hess, 2009,
p. 783; Labay & Kinnear, 1981, pp. 271-278; Debevec, et al., 1985, p. 273), adoption likely involves a more
elaborate information processing. In conclusion, a differentiation of attitude according to its cognitive and affective
content appears to be appropriate for the present study.
According to the prevalent tripartite model of attitude structure, attitude manifests in a third component: the con-
ative component. Conation refers to the behavioural domain of a person’s attitude, i.e. it reflects the behavioural
intention towards an attitude object. This action-oriented constituent is based upon the cognitive and affective
dimension and represents prescriptive (i.e. normative) beliefs (Lantos, 2015, pp. 503-505; Vaughan & Hogg, 2013,
pp. 136-138). In consumer and Information Systems research, this component is often treated as the consumer’s
intention to buy or intention to use. The interaction of the three attitude dimensions determines the consumer’s
consumption behaviour as illustrated in Figure 3.3. This tricomponent attitude model emphasises the ancient
trichotomy of human experience divided into thought, feeling and action. Therein, both cognitive and affective
facets of attitude mutually span the feature space of the evaluative construct (i.e. the consumer’s overall evaluative
judgement). The conative component, in contrast, constitutes an empirically as well as conceptually separate
attitudinal construct. Still, it should be noted that the validity of the attitude-behaviour relation strongly varies
under different conditions and contexts (Glasman & Albarracín, 2006, p. 778).
Figure 3.3: Structural model of attitude according to the three-component theory (Based on Breckler, 1984
p. 1192)
Firstly, the degree of specificity of both the attitudinal predictor and the behavioural criterion must correspond in
terms of their inherent qualities time, target and context, otherwise a low attitude-behaviour correlation may result
(Ajzen, et al., 1977 p. 889; Fazio, et al., 1978 p. 399). That is, the specificity of a measured attitude must meet the
same level of specificity of the attitude-relevant action in order to maximize the predictive power of evaluative
judgements. This precept is commonly referred to as correspondence principle. Secondly, with respect to the
structural properties of attitude, many research endeavours have been – and still are – devoted to the concept of
attitude strength. This concept is typically construed as the intensity and consistency of intra-attitudinal
Theoretical Foundations 59
components. By definition, attitude strength results in both attitudinal resistance towards environmental influences
(especially persuasion) and a high degree of correspondence between the object evaluation and the subsequent
overt action (Chaiken, et al., 2014, p. 388). In other words, strong attitudes are more likely to manifest
behaviourally than weak and they are more stable as well (Ajzen, 2001 p. 38). According to Fazio, attitude strength
is primarily indicated by the accessibility of object-evaluation associations from memory (2007, p. 2ff.). Thus, the
strength variable is best approximated by the latency between the recipient’s perception of the attitude object and
the retrieval of the pertaining evaluative knowledge (Fazio, et al., 1982, p. 341; Fabrigar, et al., 2014, p. 88).
Notably, personal involvement towards a specific behaviour is deemed to be an important aspect of attitude
strength. It amplifies the sensitivity to pertaining stimuli and thus leads to a greater attitude-behaviour
correspondence (Pomerantz, et al., 1995, p. 408).
Following the above line of reasoning, formation of attitude essentially means absorption and assimilation of more
or less conflicting knowledge (thus available information) in pre-existing mental structures. Festinger’s theory of
cognitive dissonance accordingly postulates that individuals experience a state of psychological tension if they
perceive contradictory information that oppose existent cognitions (Festinger, 1962). As humans latently strive for
internal consonance, perceived inconsistencies among cognitive, affective and conative components cause to
intensify this aversive tension state. There are substantially three strategies of dissonance reduction, whereby the
pressure of implementing these modes inherently covaries with the magnitude of dissonance. The first approach
rests upon changing salient dissonant elements a posteriori including attitudes, beliefs and behaviour. The second
strategy consists of developing consonant cognitions that temper the perceived psychological discomfort. The third
mode of dissonance reduction relates to the mitigation of the importance of incompatible cognitions, what is also
referred to as trivialisation in social psychology literature (Greenberg, et al., 1995, p. 247).
Especially under such conditions where attitude strength is well-marked and the specificity of the attitude construct
greatly corresponds to the behavioural measure, the cognitive dissonance paradigm provides a profound as well as
empirically supported theoretical substantiation for explaining positive correlations between cognitions and
actions. Still, attitude (in the above sense of a latent variable inferred from consistency in behaviour) is a necessary,
but not sufficient condition for subsequent consumption behaviour. Rather, some portion of variance in overt
behaviour has to be explained multicausally under consideration of further significant parameters. On account of
that, much research has been done in order to holistically understand intention behaviours and to accurately explain
decision-making in the context of accepting or resisting innovations. In view of their thematic relevance, the most
influential behavioural theories, constructs, and explanatory models in attitude and Information Systems research
are presented and critically discussed in the following section.
3.1.2.2 Theory of Reasoned Action and Competing Variants
The Theory of Reasoned Action (TRA) roots in social psychology and was initially introduced by Martin
Fishbein and Icek Ajzen in (Ajzen & Fishbein, 1975; Ajzen, et al., 1980). Occupying a central position in the field,
this theoretical model seeks to comprehensively analyse volitional human decision processes. To this end, the
model particularly focusses on behaviourally-relevant latent variables in a stimulus-organism-response
interpretation. Due to its integrative nature that links different research disciplines (e.g. learning theory and
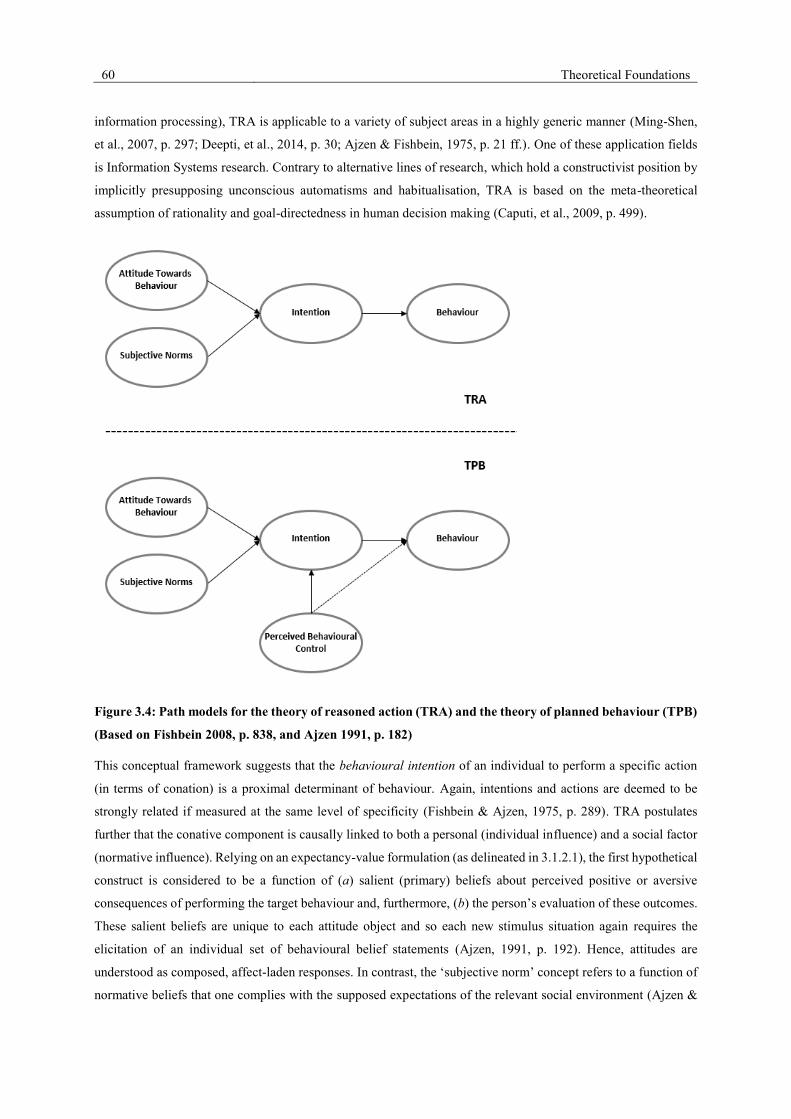
60 Theoretical Foundations
information processing), TRA is applicable to a variety of subject areas in a highly generic manner (Ming-Shen,
et al., 2007, p. 297; Deepti, et al., 2014, p. 30; Ajzen & Fishbein, 1975, p. 21 ff.). One of these application fields
is Information Systems research. Contrary to alternative lines of research, which hold a constructivist position by
implicitly presupposing unconscious automatisms and habitualisation, TRA is based on the meta-theoretical
assumption of rationality and goal-directedness in human decision making (Caputi, et al., 2009, p. 499).
Figure 3.4: Path models for the theory of reasoned action (TRA) and the theory of planned behaviour (TPB)
(Based on Fishbein 2008, p. 838, and Ajzen 1991, p. 182)
This conceptual framework suggests that the behavioural intention of an individual to perform a specific action
(in terms of conation) is a proximal determinant of behaviour. Again, intentions and actions are deemed to be
strongly related if measured at the same level of specificity (Fishbein & Ajzen, 1975, p. 289). TRA postulates
further that the conative component is causally linked to both a personal (individual influence) and a social factor
(normative influence). Relying on an expectancy-value formulation (as delineated in 3.1.2.1), the first hypothetical
construct is considered to be a function of (a) salient (primary) beliefs about perceived positive or aversive
consequences of performing the target behaviour and, furthermore, (b) the person’s evaluation of these outcomes.
These salient beliefs are unique to each attitude object and so each new stimulus situation again requires the
elicitation of an individual set of behavioural belief statements (Ajzen, 1991, p. 192). Hence, attitudes are
understood as composed, affect-laden responses. In contrast, the ‘subjective norm’ concept refers to a function of
normative beliefs that one complies with the supposed expectations of the relevant social environment (Ajzen &
Theoretical Foundations 61
Fishbein, 1975, p. 302). That is to say, such belief systems capture the perceived social pressure to behave in a
certain way. As stated by Ajzen and Fishbein (1975), variables external to the model are mediated exclusively by
either attitudes or subjective norms. The overall scheme of TRA is displayed in Figure 3.4.
Considerable evidence supporting this framework has been presented by numerous meta-analytic reviews investi-
gating its explanatory power, e.g. Sheppard et al. (1988) and Albarracin et al. (2001). Despite this scholarly con-
firmation, the TRA has frequently been criticised for different reasons, though. Firstly, empirical findings indicate
that attitudinal and normative variables may not always be completely independent of each other (Ryan, 1982, pp.
263-278). Rather, cognitive and normative evaluations exhibit a complex set of dependencies. In addition, it was
found that the interview setting (e.g. different wordings for questions) can systematically foster a change in the
hierarchy of individual’s beliefs (Sutton, et al., 2003, p. 246; Armitage & Christian, 2003, p. 194). Secondly,
referring to the abovementioned criticism on the aggregate expectancy-value structure, the operationalisation of
primary beliefs in a composed attitude model sense is still subject of a controversial discussion. Again, it must be
stressed that quantifying subjective beliefs in terms of probabilities is considered problematic from a
methodological perspective (Ahtola, 1975, p. 52 ff.).
In consequence of the restrictive assumptions of this explanatory model, TRA has often been applied in modified
and extended forms. One boundary condition consists of the presumption of a pure volitional control, where limited
resources such as time, environmental circumstances or personal ability do not restrict the freedom of action. Thus,
in order to explicitly address cases of incomplete volitional control, Ajzen proposed in (1985) an extension of
TRA, referred to as the Theory of Panned behaviour (TPB). This integrative theoretical framework predicts
behaviours by incorporating beliefs regarding the availability of relevant resources or pertaining opportunities.
The complete path model is shown in Figure 3.3. Therein, the additional predictor perceived behavioural control
is modelled as an exogenous construct that influences behaviour both directly and indirectly through intentions
(Madden, et al., 1992, p. 4). It borrows basically from Bandura’s hypothetical concept of ‘self-efficacy’, which
reflects the self-percept of operative capabilities in human agency (Bandura, 1977, p. 191 ff.). In addition, Ajzen’s
definition of behavioural control encompasses perceived external constraints on behaviour in that this construct
moderates the relationship between intention and behaviour. Hence, perceived behavioural control is regarded in
a broader sense as “both a proxy measure of actual control and a measure of confidence in one's ability” (Armitage
& Christian, 2003, p. 191).
Even though the TPB has proven to contribute significantly to the prediction of intention and behaviour (e.g.
Armitage and Conner 2002, Conner and Sparks 1996; Rivis and Sheeran 2003), in an innovation adoption context
perceived behavioural barriers can be disregarded for research economic reasons. As a rule, it is very difficult for
consumers to accurately estimate behaviourally relevant resources and abilities. Nevertheless, this conceptual
framework has received much attention in social psychology as a well-researched model for parsimoniously
explaining behavioural intentions and actual behaviour in various application fields, including health, pro-
environmental and travel behaviour (e.g. Glanz et al. 2008; Steg and Vlek 2008; Bamberg et al. 2003). In order to
extend the applicability of the TPB to specific goals and investigational contexts, some researches have further
improved the predictive efficiency of the model by adding a number of situational background factors to the system
of hypotheses. For example, additional predictors such as ‘knowledge’ (Harakeh, et al., 2004), ‘feelings of regret’
62 Theoretical Foundations
(Kaiser, 2006), ‘moral sensitivity’ (Buchan, 2005) and ‘self-identity’ (Smith, et al., 2008) have been developed so
far. To sum up, the TPB is principally open for further extensions and modifications.
Consequently, in (1995a) Tayler and Todd establish a Decomposed Theory of Planned Behavior (DTPB). In
order to consider possible crossover effects between the normative and attitudinal components, they extended the
original model by decomposing exogenous belief structures into multidimensional belief constructs. The main
objective for postulating this extended path model was to provide a more insightful and thus diagnostically more
valuable explanation of consumer adoption behaviour in a wide variety of settings (Tayler & Todd, 1995b, p. 151).
As the respective monolithic belief structures become more differentiated according to single influence factors
that could be manipulated (e.g. through system design strategies), the DTPB appears to be more managerially
relevant.
Drawing upon Roger’s innovation characteristics, this decomposition approach suggests the second-order latent
variables ‘relative advantage’, ‘compatibility’ and ‘complexity’ for particularising the underlying complex
attitudinal belief structures. In this way, it takes into account that the cognitive component of attitude formation
may not be organised into a single conceptual unit (Shimp & Kavas, 1984, p. 795‐809). With respect to the
aforementioned conceptual division of perceived behavioural control into internal and external behavioural
constraints, the controllability belief structure is further decomposed into ‘self-efficacy’ and ‘facilitating
conditions’. Moreover, the subjective norm construct provides exemplarily the two dimensions ‘peer influence’
and ‘superior’s influence’. Here, the decomposition is based upon the divergence of views among relevant referent
groups, such as peers, superiors and subordinates in organisational settings.
In the context of IT usage, the authors empirically found a comparatively high degree of explanatory power of the
decomposed TPB (Tayler & Todd, 1995b, p. 168 ff.). Yet, they concede that in comparison to other competing
behavioural models the DTPB is considerably less parsimonious by virtue of seven complementary second-order
constructs. Generally, for making an appropriate model selection it is recommended to consider the relative trade-
off between parsimony and contribution to knowledge (Mulaik, et al., 1989, pp. 430-445). Therefore, the value
added by means of the increased explanatory power should at least compensate the added structural complexity.
For the present investigational purposes, the decomposed version of TPB would be less valuable considering the
complexity and the lack of specificity for explaining wearable technology acceptance. Consequently, it appears
reasonable to draw rather on the original conceptual frameworks. In this context, several investigators strongly
suggest to improve the predictive power of attitude theory (i.e. TRA and TPB, respectively) by “trading specificity
for parsimony” (Bagozzi, 1992, p. 201), i.e. by integrating additional explanatory variables into the source models.
3.1.2.3 The Technology Acceptance Model and Competing Variants
The Technology Acceptance Model (TAM) originally introduced by Davis in (1980) has already been
successfully applied to different adoption behaviours across a broad range of information technologies and user
populations. Moreover, several meta-analytic reviews strongly support the theory's predictions in the Information
Systems field, e.g. (Ma & Liu, 2004). Since this nomological framework relates to IT acceptance in organisational
settings, primarily an extrinsically motivated system utilisation is central to the underlying causal-analytical
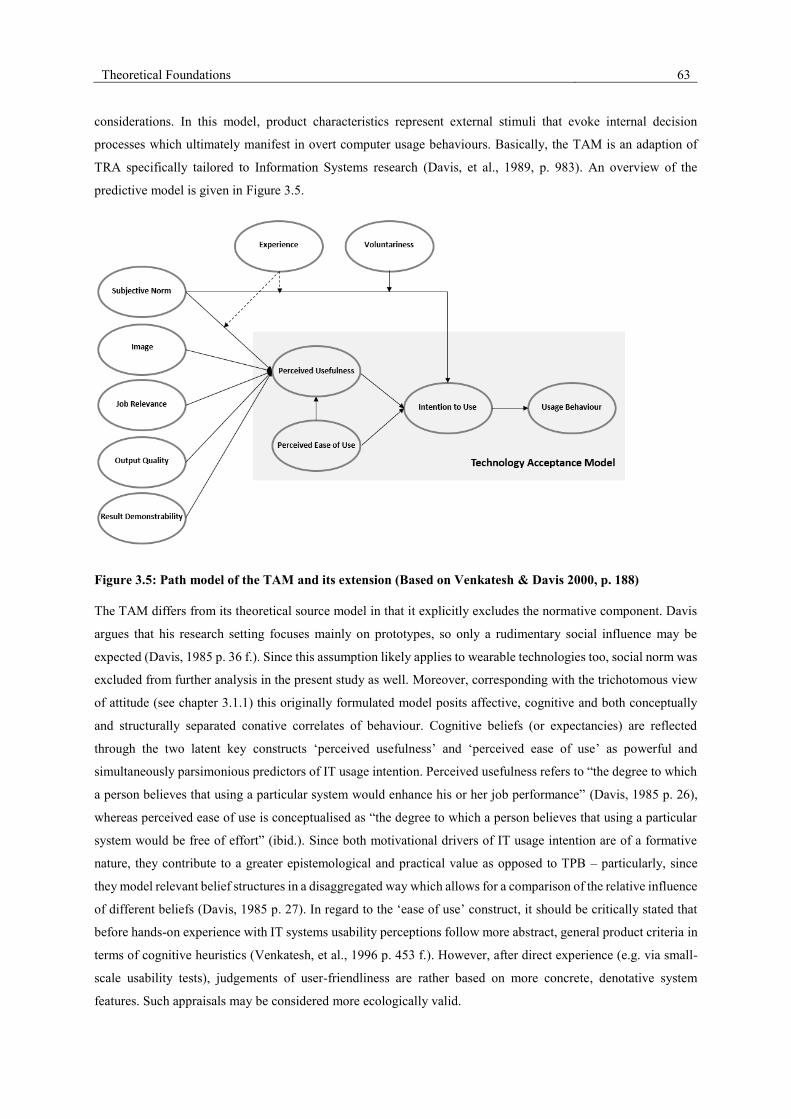
Theoretical Foundations 63
considerations. In this model, product characteristics represent external stimuli that evoke internal decision
processes which ultimately manifest in overt computer usage behaviours. Basically, the TAM is an adaption of
TRA specifically tailored to Information Systems research (Davis, et al., 1989, p. 983). An overview of the
predictive model is given in Figure 3.5.
Figure 3.5: Path model of the TAM and its extension (Based on Venkatesh & Davis 2000, p. 188)
The TAM differs from its theoretical source model in that it explicitly excludes the normative component. Davis
argues that his research setting focuses mainly on prototypes, so only a rudimentary social influence may be
expected (Davis, 1985 p. 36 f.). Since this assumption likely applies to wearable technologies too, social norm was
excluded from further analysis in the present study as well. Moreover, corresponding with the trichotomous view
of attitude (see chapter 3.1.1) this originally formulated model posits affective, cognitive and both conceptually
and structurally separated conative correlates of behaviour. Cognitive beliefs (or expectancies) are reflected
through the two latent key constructs ‘perceived usefulness’ and ‘perceived ease of use’ as powerful and
simultaneously parsimonious predictors of IT usage intention. Perceived usefulness refers to “the degree to which
a person believes that using a particular system would enhance his or her job performance” (Davis, 1985 p. 26),
whereas perceived ease of use is conceptualised as “the degree to which a person believes that using a particular
system would be free of effort” (ibid.). Since both motivational drivers of IT usage intention are of a formative
nature, they contribute to a greater epistemological and practical value as opposed to TPB – particularly, since
they model relevant belief structures in a disaggregated way which allows for a comparison of the relative influence
of different beliefs (Davis, 1985 p. 27). In regard to the ‘ease of use’ construct, it should be critically stated that
before hands-on experience with IT systems usability perceptions follow more abstract, general product criteria in
terms of cognitive heuristics (Venkatesh, et al., 1996 p. 453 f.). However, after direct experience (e.g. via small-
scale usability tests), judgements of user-friendliness are rather based on more concrete, denotative system
features. Such appraisals may be considered more ecologically valid.
64 Theoretical Foundations
Overall, contrarily to the TPB, the TAM’s belief set of extrinsic motives in terms of both usefulness and usability
dimensions readily generalises across different investigational situations that focus on the adoption of technologi-
cal innovations. Both cognitive components are themselves predictable from measures of specific external varia-
bles, such as system features and system experience (Davis, 1985 p. 24 f.). Actually, system characteristics were
among the first external stimuli found to predetermine usefulness and usability perceptions (Venkatesh, et al., 1996
p. 457).
Furthermore, the original conceptual model implies that the intention to use an IT system is a function of attitude
in the sense of an overall affective reaction to system usage (Davis, 1985 p. 43). However, after conducting a post
hoc data analysis, Davis et al. (1989, p. 999) found that the model only partially fit the empirical material. They
proposed in (1989) a revised version of TAM. The most notable deviation is the lack of the attitude construct. The
authors establish that empirical evidence indicates at best a partial mediation of the relationship between cognitive
beliefs and usage intention through attitude. Davis et al. (ibid.) conclusively argue that in working environments
IT usage intention is primarily induced by anticipated consequences on job performance – regardless of affective
reactions. In other words, an employee may have a negative attitude towards a computer system, but still use it by
reason of expected performance gains. On the other hand, mandatory adoption decisions can also be characterised
as situations where social norms to use an ICT system overpower beliefs about expected effects (Linders, 2006).
By empirically comparing eight prominent acceptance models in Information Systems research, Venkatesh et al.
figured out that affective processes are only significant in such instances, where performance and effort
expectancies are not anchored in the hypothesis system (2003, p. 455). The scholars therefore assume that in
mandatory work settings any observed covariation between attitude and volitional intention is immanently
spurious. Aside from that, the omission of attitude may provide valuable insights concerning the distinct influence
of perceived ease of use and perceived usefulness on usage intentions (Venkatesh, 2000, p. 343). Given the
assumption of a primarily cognition-based usage decision, much subsequent research on IT acceptance employing
the revised TAM has yielded fairly adequate reliability and validity results in predicting future IT use, including
Szajna (1996), Karahanna et al. (2006), Yi et al. (2006), as well as Saadé and Bahli (2005).
In sum, owing to its simplicity and specificity TAM qualifies as a well-suited and robust intention model within
an organisational application context. In settings of non-voluntary IT employment this causal model can explain
about 40% of variance in behavioural intentions and up to 30% of system usage (Venkatesh, 2000, p. 355; Meister
& Compeau, 2002). Given the considered utilitarian motives represented by perceived usefulness and ease of use,
praxeological recommendations for product policy may be derived: To the extent that these factors are behavioural
correlates, they provide direction to system designers as to where efforts should be focused, since a developer has
some degree of control over same (Tayler & Todd, 1995b, p. 145). However, the parsimony of TAM is
simultaneously its major drawback. In particular, some investigators have challenged the model’s ability to explain
consumer adoption of technologies in a private consumption context (Chen & Mort, 2007, p. 356). By drawing on
motivational theory, others claim that incorporating the hedonic, pleasure-oriented nature of IT system usage into
the explanatory model would be more meaningful (Van der Heijden, 2004, p. 695 ff.; Bagozzi, et al., 1992). Yet,
one of the most frequently cited and well explored aspects of system usage decisions is the social influence
dimension including subjective norm, image and voluntariness. As a consequence, Venkatesh and Davis theorise
in (2000) an extension of TAM by incorporating social influence as well as cognitive instrumental processes (i.e.
Theoretical Foundations 65
job relevance, output quality, and result demonstrability) into the underlying system of hypotheses. This integrated
cause-and-effect model, subsequently referred to as TAM2, was repeatedly validated in both voluntary and
mandatory settings. It outperforms the source model especially in volitional contexts and, therefore, also limits its
range of possible applications (Hossain, 2014, p. 4).
Due to the multitude of specific needs in Information Systems research, the TAM has undergone substantial
refinements and extensions since its publication. A growing body of research has tried to maximise the conceptual
model’s explanatory power by synthesising commensurable and complementary theories and concepts applying
to the acceptance formation process in context-specific domains. In response to the increasingly fragmented
landscape of theories attempting to tailor TAM to the respective investigational particularities, Venkatesh et al.
formulated in (2003) a Unified Theory of Acceptance and Use of Technology (UTAUT). In the course of a
critical review of several competing acceptance models (including TRA, TPB, TAM, the ‘C-TAM-TPB’ depicting
a hybrid of TAM and TPB, see Taylor & Todd, 1995a, the ‘Motivational Model’ by Bagozzi et al., 1992, the
‘Model of PC Utilization’ developed by Thompson et al., 1991, the ‘Social Cognitive Theory’ according to
Compeau and Higgins, 1995, and Roger’s IDT), they identified four main exogenous drivers of behavioural IT
usage tendencies: performance expectancy, effort expectancy and social influence are conceptualised as direct
antecedents of intention, whereas facilitating conditions directly influence usage behaviour (Venkatesh, et al., 2003
p. 447). These crucial key constructs all have been distilled from the above theoretical bases by means of
significance and unique explained variance. For instance, performance expectancy is, among others, based on the
constructs perceived usefulness (Davis, 1985) and relative advantage (Rogers, 1983a), circumscribing “the degree
to which an individual believes that using the system will help him or her to attain gains in job performance”
(Venkatesh, et al., 2003 p. 447). Effort expectancy in turn originates mainly from perceived ease of use (Davis
1985) and the innovation characteristic of complexity (Rogers, 1983), capturing the degree of conceived ergonom-
ics posed by a given technological system. The social influence construct, on the other hand, relies basically on
attitude theory (i.e. TRA, TPB and C-TAM-TPB), referring to the subjectively anticipated expectations of relevant
social groups. Eventually, facilitating conditions include perceived behavioural control (Ajzen, 1991) and thus
describe “the degree to which an individual believes that an organizational and technical infrastructure exists to
support use of the system” (Venkatesh, et al., 2003 p. 453). In refinement of this nomological network, the inter-
vening variables ‘gender’, ‘age’, ‘experience’ and ‘voluntariness of use’ were found to significantly moderate the
intention and usage dependencies.
Even though the UTAUT has consistently shown strong predictive and explanatory utility, it is relatively seldom
used in management practice, yet (Blagov & Bogolyubov, 2013, pp. 37-45). Rather, a large majority of contem-
porary research in the field of Information Systems draws upon the original base models TRA, TPB and TAM.
However, in order to fit specific needs and to improve predictive or explanatory power, the original formulations
have frequently been modified by extending the source models with domain-specific interacting constructs
(Planing, 2014 p. 53). Table 3.1 provides an overview of relevant empirical analyses focussing on technological
innovations in ubiquitous or mobile computing environments in a broader sense, which are akin to the research
subject of the present study as regards content.
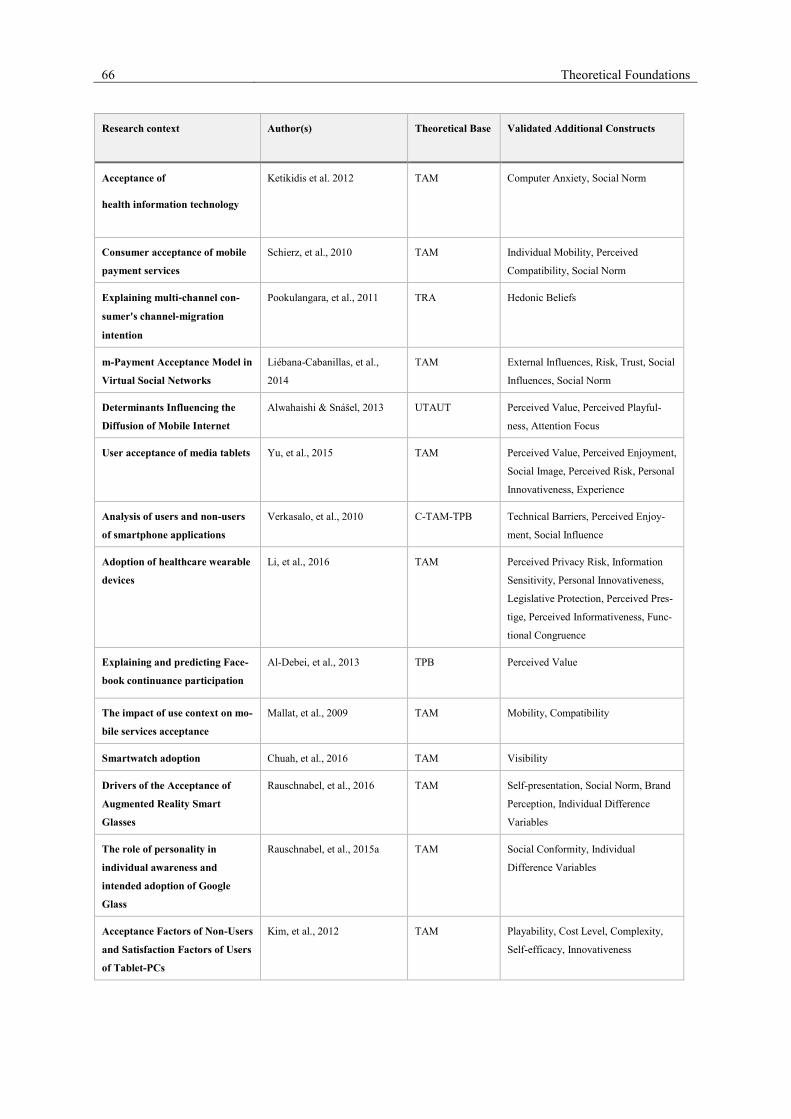
66 Theoretical Foundations
Research context Author(s) Theoretical Base Validated Additional Constructs
Acceptance of
health information technology
Ketikidis et al. 2012 TAM Computer Anxiety, Social Norm
Consumer acceptance of mobile
payment services
Schierz, et al., 2010 TAM Individual Mobility, Perceived
Compatibility, Social Norm
Explaining multi‐channel con-
sumer's channel‐migration
intention
Pookulangara, et al., 2011 TRA Hedonic Beliefs
m-Payment Acceptance Model in
Virtual Social Networks
Liébana-Cabanillas, et al.,
2014
TAM External Influences, Risk, Trust, Social
Influences, Social Norm
Determinants Influencing the
Diffusion of Mobile Internet
Alwahaishi & Snášel, 2013 UTAUT Perceived Value, Perceived Playful-
ness, Attention Focus
User acceptance of media tablets Yu, et al., 2015 TAM Perceived Value, Perceived Enjoyment,
Social Image, Perceived Risk, Personal
Innovativeness, Experience
Analysis of users and non-users
of smartphone applications
Verkasalo, et al., 2010 C-TAM-TPB Technical Barriers, Perceived Enjoy-
ment, Social Influence
Adoption of healthcare wearable
devices
Li, et al., 2016 TAM Perceived Privacy Risk, Information
Sensitivity, Personal Innovativeness,
Legislative Protection, Perceived Pres-
tige, Perceived Informativeness, Func-
tional Congruence
Explaining and predicting Face-
book continuance participation
Al-Debei, et al., 2013 TPB Perceived Value
The impact of use context on mo-
bile services acceptance
Mallat, et al., 2009 TAM Mobility, Compatibility
Smartwatch adoption Chuah, et al., 2016 TAM Visibility
Drivers of the Acceptance of
Augmented Reality Smart
Glasses
Rauschnabel, et al., 2016 TAM Self-presentation, Social Norm, Brand
Perception, Individual Difference
Variables
The role of personality in
individual awareness and
intended adoption of Google
Glass
Rauschnabel, et al., 2015a TAM Social Conformity, Individual
Difference Variables
Acceptance Factors of Non-Users
and Satisfaction Factors of Users
of Tablet-PCs
Kim, et al., 2012 TAM Playability, Cost Level, Complexity,
Self-efficacy, Innovativeness
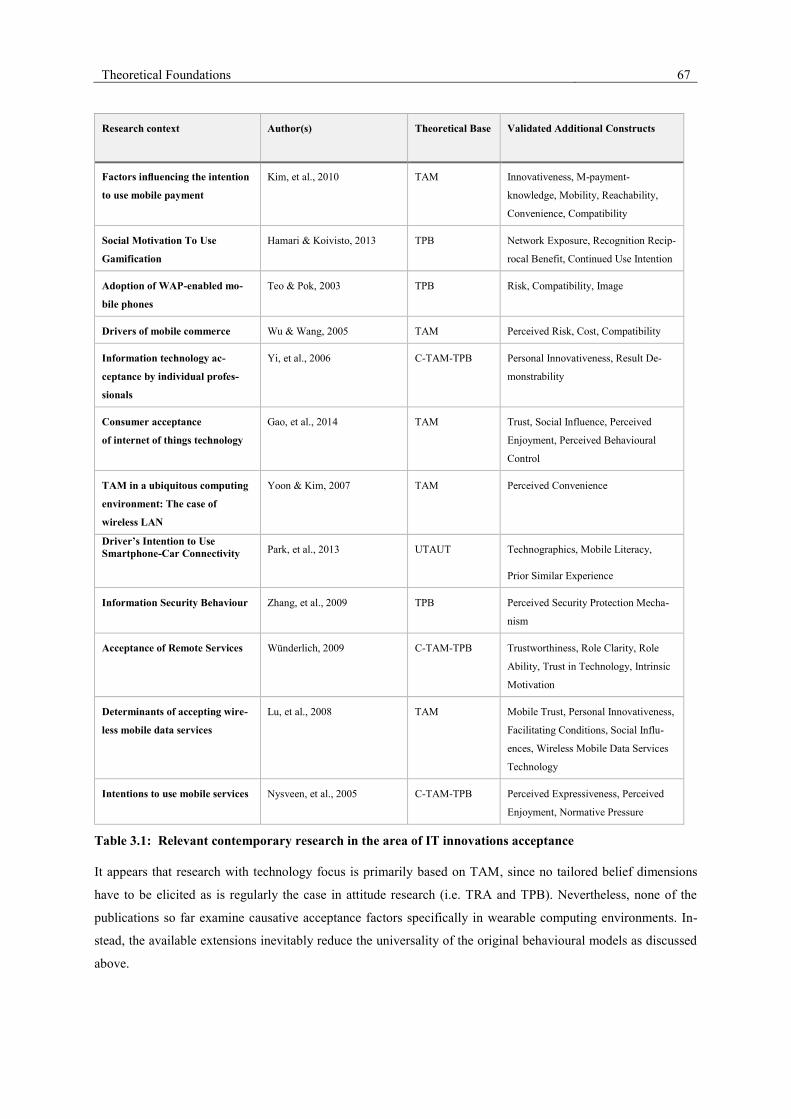
Theoretical Foundations 67
Research context Author(s) Theoretical Base Validated Additional Constructs
Factors influencing the intention
to use mobile payment
Kim, et al., 2010 TAM Innovativeness, M-payment-
knowledge, Mobility, Reachability,
Convenience, Compatibility
Social Motivation To Use
Gamification
Hamari & Koivisto, 2013 TPB Network Exposure, Recognition Recip-
rocal Benefit, Continued Use Intention
Adoption of WAP-enabled mo-
bile phones
Teo & Pok, 2003 TPB Risk, Compatibility, Image
Drivers of mobile commerce Wu & Wang, 2005 TAM Perceived Risk, Cost, Compatibility
Information technology ac-
ceptance by individual profes-
sionals
Yi, et al., 2006 C-TAM-TPB Personal Innovativeness, Result De-
monstrability
Consumer acceptance
of internet of things technology
Gao, et al., 2014 TAM Trust, Social Influence, Perceived
Enjoyment, Perceived Behavioural
Control
TAM in a ubiquitous computing
environment: The case of
wireless LAN
Yoon & Kim, 2007 TAM Perceived Convenience
Driver’s Intention to Use
Smartphone-Car Connectivity
Park, et al., 2013 UTAUT Technographics, Mobile Literacy,
Prior Similar Experience
Information Security Behaviour Zhang, et al., 2009 TPB Perceived Security Protection Mecha-
nism
Acceptance of Remote Services Wünderlich, 2009 C-TAM-TPB Trustworthiness, Role Clarity, Role
Ability, Trust in Technology, Intrinsic
Motivation
Determinants of accepting wire-
less mobile data services
Lu, et al., 2008 TAM Mobile Trust, Personal Innovativeness,
Facilitating Conditions, Social Influ-
ences, Wireless Mobile Data Services
Technology
Intentions to use mobile services Nysveen, et al., 2005 C-TAM-TPB Perceived Expressiveness, Perceived
Enjoyment, Normative Pressure
Table 3.1: Relevant contemporary research in the area of IT innovations acceptance
It appears that research with technology focus is primarily based on TAM, since no tailored belief dimensions
have to be elicited as is regularly the case in attitude research (i.e. TRA and TPB). Nevertheless, none of the
publications so far examine causative acceptance factors specifically in wearable computing environments. In-
stead, the available extensions inevitably reduce the universality of the original behavioural models as discussed
above.
68 Theoretical Foundations
Summing up the chapter, basic behaviour-oriented acceptance concepts and theories in the field of Information
Systems have been introduced. Relating these behavioural base models to the present research context, it seems
reasonable to rely on TAM as an empirically evident theoretical frame of reference for conceptualising
intermediary psychographic processes in an IT adoption context. However, as stated before the propositions in-
cluded in this conceptual source model are fairly generic in nature, disregarding the specificities of the actual
research questions under scrutiny. In order to contribute to the scientific body of knowledge in Information
Systems research as well as to enhance the predictive performance and explanatory power of TAM in the case of
wearable computing, a dedicated cause-effect model has to be synthesised. This framework should build on and
integrate relevant principles and insights in technology acceptance literature under the ontological assumption of
critical realism (cf. chapter 4).
3.2 Technology Acceptance from a Perceived Risk Perspective
From a managerial viewpoint, it is very important to account for consumer’s resistance to innovation as one of the
major causes for market failure (Hosseini, et al., 2016). In an ICT adoption context, especially information security
risks influence resistance behaviour (Tsiakis, 2012 p. 1265). The following sections therefore critically examine
risk perceptions in general and IT security risk perceptions in particular. In order to relate these concepts to the
study subject, the chapter takes a consumer’s perspective. To this end, the role of risk perceptions within the
adoption process is outlined in the first instance. Then the structure of subjective risk is delineated.
3.2.1 On the Behavioural Relevance of Perceived Risk
Suffering from the inherent pro-innovation bias, which is based on the premise that all innovations are good
without exception and that they always improve existing product substitutes (see chapter 3.1.1.), the vast amount
of academic literature on innovation diffusion has prevalently restricted itself to the adoption and diffusion
perspectives (Ram, 1987 p. 208; Rogers, 2010 p. 100). This leads to a systematic neglect of possible rejections or
discontinuances of innovations. However, innovations impose a change in existing behavioural patterns or belief
systems, whilst the process of change resistance is a normal consumer response, annually manifesting in a high
failure rate of new products and services in the economy (Claudy, et al., 2014, p. 528). By reflecting this research
gap, marketing approaches largely promote reasons for innovation adoption and, hence, primarily attempt to
stimulate adoption decisions rather than reducing consumers’ initial innovation resistance. However, any
marketing investments in later decision process stages are wasted if consumers reject innovations prior to evaluate
their benefits (Talke & Heidenreich, 2014, p. 895). Therefore, marketing instruments should also focus on potential
inhibitors to adoption that result in resistance.
While some scholars regard innovation resistance as a generic, personality-related predisposition, others equate
this phenomenon with an aversive attitudinal outcome following an unfavourable product evaluation (Talke &
Heidenreich, 2014, p. 896). The former explanation for the focal decision anomaly relates to an adopter-specific
propensity to resist changes, caused by a multifaceted personality trait including dimensions such as routine
seeking, emotional reaction to change, short-term focus, and cognitive rigidity (Oreg, 2003, p. 680). Interestingly,
Theoretical Foundations 69
in an Information Systems context, the willingness to change - as definitional antipode of the propensity to
innovation resistance - is reflected by the individual’s personal innovativeness in terms of an adopter-related
predisposition (Agarwal, et al., 1998 p. 206; Sheth, 1981 p. 274).
On the contrary, the latter form of consumer resistance evolves from innovation-specific factors. Sheth argues in
(1981, p. 275) that the most suitable theoretical constructs in understanding contra-adoption cognitions are, firstly,
habit towards existing practices or behaviours and, secondly, perceived risks associated with innovation adoption.
The first psychological barrier arises as soon as an individual perceives inconsistencies with past experiences,
since humans intrinsically strive for consistency and status quo maintenance. However, as per definition, disruptive
innovations call for a higher degree of adaption of habitual problem-solving behaviours on consumer side (see
chapter 3.1.1). Consequently, the compatibility of a new technology with existing practices can be neglected from
an epistemological point of view.
The second adoption barrier refers to the subjectively felt uncertainty about an innovation’s possible negative
performance outcomes. Correspondingly, Mitchell points out that perceived risk is a relatively powerful construct
for explaining consumer behaviour, as individuals tend to avoid mistakes rather than to maximise utility in pur-
chasing (1999, p. 163). The author demarks this concept from the notion of uncertainty by ascribing a known
probability component to the former term (1999, p. 166). Nonetheless, the ‘known’ probability element may also
describe a subjective probability having no relation to the actual intersubjective reality. This specification of
perceived risk relies on the two-component model of risk, which captures the risk perception by multiplying the
subjectively perceived probability of occurrence of a salient adverse behavioural consequence with the relative
cost or severity of that potential loss or exposure (Bettman, 1973, p. 189). Again, ordinally scaling the subjective
probability component and multiplicatively linking it to the germane severity component leads to comparable
methodological problems as stated in the case of expectancy-value structures in attitude measurement (see chapter
3.1.2.1). Cunningham accordingly establishes that such a risk conceptualisation may not contribute to a deeper
understanding of consumer behaviour, since humans do not think in probabilities (1967, p. 83; Gardner, et al.,
1998, p. 5). Therefore, the subjective probability of the occurrence of adverse outcomes will be disregarded in the
course of the present study. Instead, in the following the perceived risk concept is understood in terms of a
subjectively quantifiable measure of anticipated negative outcomes of innovation adoption.
Risk research in the context of TAM and related theories has empirically proved both direct and indirect attitude-
mediated influences of IT risk perceptions on behavioural intention. In contrast, other studies found no moderating
effect of the focal construct. For instance, Featherman and Pavlou showed a direct negative impact of perceived
risk on the perceived usefulness and adoption intention (2003, p. 456). On the contrary, Yang and Wu conceptu-
alised the risk construct as moderating the causal dependency structures of purchase intention (2009, p. 371): In
such instances where consumers perceive a greater risk of purchasing an innovation, the relationship between
consumer’s purchase intention and its antecedents becomes significantly weaker. However – as will be shown
hereafter – the incorporation of risk as a moderator variable into exploratory models of attitude is methodically
quite difficult insofar that this construct correlates with other central acceptance factors. This might lead to an
erroneous interpretation of statistical results.
70 Theoretical Foundations
Choi and Geisterfeld examined in (2004, p. 823 ff.) the online-shopping behaviour of American and Korean con-
sumers by defining perceived security as an important behavioural attitude towards e-shopping. This conceptuali-
sation of risk, however, seems questionable since consumer apprehension has variously been proven to be a clearly
discriminable determinant of attitude. A great number of studies in acceptance research found that it are rather
cost-benefit considerations that play an important role in purchase-decision making (Sweeney, et al., 1999 p. 79;
Kim, et al., 2007). Numerous frameworks on consumers’ decision-making thus regard perceived value (in the
sense of a cost-benefit ratio or cognitive attitude) as a dichotomous net-valence resulting from favourable and
unfavourable product properties. Expected utility theory – in turn originated from modern microeconomic theory
– provides a theoretical underpinning for these value concept (Snoj, et al., 2004, p. 157).
Zeithaml describes customer value perception as a trade-off between total benefits perceived (‘get’ component)
and total sacrifices (‘give’ component). The author thereby takes both positive and negative valences in purchase
decisions into account (1988, p. 13). Former interpretations of the benefit and sacrifice components mainly centre
on perceived quality and monetary price, ignoring the multidimensional nature of cognitive decision-making (Kim,
et al., 2007 p. 113). Especially perceived sacrifices have been shown to consist of diverse non-monetary costs
including time, effort and psychological costs for purchase and consumption. Sweeney et al. hence emphasise the
relevance of perceived risk to perceived value, as specifically in the case of durable goods consumers usually
consider longer-term implications of product ownership (1999, p. 80). Against the backdrop that such a structural
path explication evidently leads to a greater explanatory power, the present thesis follows this recommendation
and distinguishes between cost and benefit dimensions in terms of aversive and positive attitudinal beliefs at
behavioural level. Based on empirical evidence (Featherman, et al., 2003 p. 460), furthermore, a negative direct
relationship between perceived risk and behavioural intent to adopt a new technology is presumed.
3.2.2 On the Dimensionality of Perceived Risk
On the supposition that consumer behaviour could be regarded as an instance of risk taking (Bauer, 1960, pp. 389-
398), past social psychology research has exploratively identified five major categories of perceived risk including
performance, financial, social, psychological and physical risk facets. Notably, the relevance of each category in
cognitive risk processing differs between specific situations and adoption domains (Mitchell, 1999 p. 180 ff.). In
an e-services research context, the latter risk category has meanwhile been transferred into a privacy-related risk
dimension, since utilisation of ICT poses a direct threat to personal data rather than to physical safety (Featherman,
et al., 2003 p. 454). Moreover, researchers in the field of Information Systems increasingly maintain that in a
technology acceptance context, especially the appraisal of potential security incidents is of prime importance. On
that account, perceived risk has frequently been construed as two conceptually separate, unidimensional constructs
of privacy and information security perceptions (Liebermann & Stashevsky, 2002, p. 292 f.).
Prior research studies on IT adoption confirmed IT security perceptions (understood as an inverse measure of
perceived risk) to be significantly associated with online transaction behaviour (Vijayasarathy & Jones, 2000, p.
200; Cunningham, et al., 2005, pp. 357-372; Tsai & Yeh, 2010, p. 4059; Godwin, 2001, p. 171). Yet, drawing
from e-commerce empiricism, even though security is a key concern in online B2C environments, this central
concept has not received much academic attention (Im, et al., 2008 p. 1). With the advent of modern pervasive and
Theoretical Foundations 71
ubiquitous computing systems, perceived IT security hence may provide a renewed impetus to acceptance
research, raising the following questions (Diamantopoulos, et al., 2001 p. 271; Rossiter, 2002 p. 305):
• What conceptual working definition is appropriate for this phenomenon with respect to its content and
scope,
• what dimensionality does this conceptualisation include, and
• how should this latent variable be integrated into the sought overall system of statements, so as to attain
a holistic understanding of the acceptance formation towards innovative technologies.
First of all, marketing practitioners should keep in mind that risk is rather a subjective perception than an objective
characteristic of a product (Fain & Roberts, 1997, p. 53). Even though it is feasible to objectively measure the
degree of security inherent to a given technology environment, the congruence of this measure with the exact
consumer perceptions remains unclear (Chellappa & Pavlou, 2002, p. 359). Given that subjective perspectives
may differ from the scientific ones (what could be shown in an analysis of novice and expert judgements during
technology usage, see Schenk, et al., 1998, p. 9 ff.), it are ultimately personal anticipations of security threats that
influence trust in exchange environments. Subjective security beliefs from a user-centred perspective refer,
however, to theoretical mechanisms built upon concrete technological solutions. Because perceived security is
hence influenced by implicitly perceptible measures, the antecedents of risk perceptions should describe tangible
technical or legal aspects (Chellappa & Pavlou, 2002, p. 361; Flavián & Guinalíu, 2006, p. 604). In practical terms,
by accurately identifying these theoretical obstacles, more efficient marketing strategies will become available that
may stimulate demand. Finally, understanding crucial adoption inhibitors may enable providers to employ
appropriate means for reducing consumers’ risk levels (Liebermann & Stashevsky, 2002, p. 292).
Still, existing theoretical definitions of subjectively felt IT security risks in Information Systems and other relevant
literature are throughout positioned in B2C contexts and thus primarily focusing on on-line transactions in open
communication networks. For instance, Salisbury et al. define perceived security as “the extent to which one
believes that the Web is secure for transmitting sensitive information” (2001, p. 167), whereas Hartono et al.
theorise this construct to reflect “the degree to which the online buyer believes that conducting an online
transaction on the seller's website is safe in a manner consistent with the buyer's confident expectations” (2014, p.
12). On the contrary, Chellappa et al. understand security perceptions more comprehensively as “the subjective
probability with which consumers believe that their personal information will not be viewed, stored or manipulated
during transit or storage by inappropriate parties, in a manner consistent with their confident expectations” (2002,
p. 360).
Recent research, though, shows that consumers’ information security concerns regarding mobile ecosystems
considerably deviate from their attitudes towards traditional computing systems (Chin, et al., 2012, p. 1).
According to the studies, these deviations can mostly be attributed to differences in system usage contexts. This
applies all the more for wearable technologies since the wearables’ sensor capabilities together with their
continuous access and ubiquitous presence open up a new threat landscape. Particularly, the potentially constant
storage, access and transmission of private, sensitive or even critical information in sometimes unsecure network
environments may result in a conglomerate of familiar and unfamiliar types of data at an unprecedented rate,

72 Theoretical Foundations
raising unique security implications (Lee, et al., 2015). Therefore, a taxonomy of security threats based on how
information is affected appears to be applicable.
In IT security literature, the international standard ISO/IEC 27002:2013 is considered to be the most comprehen-
sive best practice framework for information security management (Saint-Germain, 2005, p. 60; Qingxiong &
Pearson, 2005, p. 578; Topi & Tucker, 2014, p. 59). Evolved out of the second part of the British Standard BS
7799 and superseding its previous versions ‘ISO 17799’ and ‘ISO 27002:2005’ (Chang & Ho, 2006, p. 348; BSI
Group, 2013), this conceptual framework for modelling information security principles and practices characterises
information as an asset that has value to interested parties and thus exerts a vital impact on operational efficiency
and competence. Consequently, the goal of information security as understood by this authoritative security norm
is to protect socio-technical systems from the ever-increasing spectrum of potential threats including i.a. technical
accidents and legal issues, such as personal data processing. These threats might result from various sources of
vulnerabilities (e.g. personnel, applications, communications, and environment software) which were abbreviated
in ISO 27000 series to the categories of confidentiality, integrity and availability (Chang & Ho, 2006, p. 347).
Following this abstract categorisation of IT security objectives, Lindström suggests to structure security
requirements in wearable computing environments according to the ‘higher requirement levels’ as encompassed
by the CIA triad (Lindström, 2007, p. 4). By drawing on EU Directives (Directive 95/46/EC) and other Council
decisions regarding data security and wearables, the author explicitly states that “when processing, storing or
transferring personal data, the confidentiality and integrity of the data must be secured” (ibid.). In addition, ad-hoc
networks and unreliable access points pose further security problems including the availability of network access
(Lindström & Hanken, 2013, p. 104). Particularly in view of the increasing reliance on pervasive computing sys-
tems in various aspects of daily life, information availability becomes even more apparent – all the more
considering the limited battery life-time of mobile devices. Ultimately, this information security issue constitutes
a point of vulnerability as well (Martin, et al., 2004, p. 309). Given that wearables are always-on and continuously
data gathering devices, Blum (2015) stresses that security executives should pay extra attention to preserve
information confidentiality, integrity and availability for wearable displays. Considering the above definitions
from Information Systems literature and adapting them to a wearable computing context, the following working
definition may adequately capture the essence of perceived security towards the focal object of investigation:
The degree to which users belief that relevant information services will be timely available and personal data will
not be viewed, stored, and manipulated during processing, storage or transfer by inappropriate parties in a
manner consistent with their confident expectations.
This definition implicitly suggests that security is conceived as an abstract higher-order factor, consisting of several
constitutive dimensions. Contrary to this conceptualisation, available empirical studies in the Information Systems
area has mostly ignored the concept’s multifaceted nature and operationalised measures that tend to capture only
one dimension of perceived security (Hartono, et al., 2014, p. 11). For instance, Salisbury et al. (2001, p. 173 ff.)
incorporated the singular construct ‘Perceived Web Security’ into the TAM and demonstrated by this means a
strong correlation between on-line purchase intentions and security-related perceptions. Furthermore, in an e-com-
merce context Liao and Cheung could increase predictive efficiency of their acceptance model by integrating a

Theoretical Foundations 73
unidimensional security construct (2002, p. 293). Certainly, these studies shed light on the role of perceived secu-
rity in various communication environments. However, the exclusion of underlying first-order factors prevents
from important insights concerning the priority of the respective formative paths influencing the overall security
perception, especially since different operational contexts pose a different need for security requirements
(Lindström, 2007, p. 4). In practice, analysis of the relative importance of salient risk beliefs should be included
in managerial resource allocation decisions.
The present study therefore seeks to refine the security-related adoption barrier in order to comprehensively un-
derstand consumer behaviour in wearable technology markets. According to Hartono et al. (2014, p. 12), the
earliest and most widely employed predictors in currently sparse literature on security perception issues are
reflected by the classic CIA triad framework. Former research has added various other security objectives over the
years, such as non-repudiation, authenticity, accountability, and privacy (Solms & Niekerk, 2013, p. 98; ISRMC,
LLC, 2009; Flavián & Guinalíu, 2006, p. 603). Nonetheless, the traditional three core principles still remain
overarching goals in information security management (Merkow & Breithaupt, 2014, p. 21). Given that recent
studies suggest to consider relevance, non-redundancy, and completeness as dimension inclusion criteria (Hartono,
et al., 2014, p. 13), for the sake of parsimony only the three traditional cornerstones of security are considered in
the following. In view of the relevance of the perceived risk phenomena as a central adoption inhibitor in wearable
technology markets, the next subchapter is devoted to latent variables exogenous to this theoretical construct in
order to broaden understanding of consumers’ resistance behaviour towards technical innovations.
3.3 On the Antecedents of Cognitive Beliefs
The following sections seek to determine the causes of both risk and benefit expectations in order to augment the
understanding of the latent mechanisms underlying an ICT adoption decision.
3.3.1 Perceived Risk as a Correlate of Trust
In many disciplines of behavioural sciences and economics, trust has been a key construct (Suh & Han, 2002, p.
249; Wünderlich, 2009, p. 75). This resulted in a plurality of definitions across different research areas including
marketing (e.g. Fisher et al. 2010; Hong 2015), economic (e.g. Dasgupta 1990; Goodwin 1996) and management
literature (e.g. Balasubramanian et al. 2003; Jeffries & Reed 2000). Despite the conceptually divergent
perspectives on trust, the following cross-disciplinary definition is well-accepted among most scholars: “Trust is
a psychological state comprising the intention to accept vulnerability based on positive expectations of the inten-
tions or behaviours of another” (Rousseau, et al., 1998, p. 395). By implication, trust is a party’s willingness to
rely on the assumption that another party concerned will not behave harmful or in an opportunistic manner under
conditions of dependence and risk (Currall, et al., 1995). In exchange environments, consumer trust is considered
to be crucial regarding the individual decision-making behaviour and, therefore, represents also a key success
factor in purchase situations (Pavlou, 2003, p. 70).
Given that the relevance of perceived risk in B2C electronic commerce is well-established – not least due to
inherent consumer’s apprehensions associated with online transactions via open e-infrastructures with unknown

74 Theoretical Foundations
Internet vendors – the increasing importance of online environments has heightened interest in trust as a significant
influencing factor of individual risk perceptions (Gefen, et al., 2008, p. 278; Pavlou, 2003, p. 79). Various
empirical studies on trusting beliefs in the online context indicate that this latent variable represents a key predictor
for approach and avoidance behaviour in Internet commerce. For instance, Jarvenpaa et al. (1999) found that a
trusting stance towards a merchant organisation helps consumers to overcome their reluctance to purchase online,
what generally emphasises the need of trust in online activities. Furthermore, by conducting a confirmatory
analysis, Pavlou (2003, p. 91) showed empirically that risk perceptions and trust jointly influence the intention to
perform transactions via electronic channels. This implies that uncertainty reduction is an integral component in
acceptance behaviour. In line with this school of thought, Gefen et al. (2003a, p. 74) integrated trust into TAM and
proved thereby that heightened levels of consumer trust (in terms of specific beliefs about an e-vendor) ultimately
result in an increase of the likelihood of customer retention in an electronic commerce context.
In most studies trust was found to influence behavioural intent indirectly through perceived costs, i.e. risk
perceptions. Still, the interwoven nexus between trust and risk has given rise to several, sometimes quasi
contradictory interpretations on how perceptions of trust and risk inter-relate. Lim (2003, p.217) provides a detailed
overview of the different conceptual models of the trust-risk nexus. Five main views dominate the understanding
of the trust-risk connection (see Figure 3.6): In the first instance (a), risk is considered to moderate the effect of
trust on consumer’s willingness to respond positively. A second paradigm theorises that trusting behaviour
prerequisites at least an equilibrium between trust and risk perceptions, where the level of trust must outweigh the
felt hazardousness of an action (b). A third view suppose that the relationship between perceived risk and trust is
recursive, representing a unidimensional effect (c). Thereby, most scholars regard risk perception as a dependent,
and trust as an exogenous variable (e.g. Cheung and Lee, 2001). Finally, other researches assume that the relation
between trust and risk perceptions is non-recursive (d) (e.g. Mitchell, 1999). Nonetheless, following the most
commonly modelled paths in acceptance research (Huijts, et al., 2012, p. 528), the present study assumes that trust
is a direct antecedent of perceived risk (c) and thus affects conative attitude indirectly through risk perceptions.
Figure 3.6: Trust-risk relationships (Based on Lim 2003, p. 217)
Until recently, the marketing literature has narrowly focused on transactional byer-seller interconnections, stress-
ing the relevance of sales agents as prime objects of trust in relationship marketing (Bart, et al., 2005, p. 134).
Unlike interpersonal trust in dyadic consumer-marketer interactions, in an ICT adoption context the object of trust
Theoretical Foundations 75
refers to technical aspects, such as a Web site, the Internet or a technology. In the Information Systems field,
consumer trust and trustworthiness make thus reference to a global belief that the technological product will
perform the required functions and that actors who are responsible for the technology will fulfil their obligations
as understood by the buyer (Gefen, 2004, p. 264). However, most trust-related studies in the field examine
primarily vendor- or institution-based effects of trust as a measure of interpersonal or person-to-firm relations, e.g.
Gefen (2004), Mathieson et al. (2001) as well as Pavlou and Gefen (2004).
In trust-related Information Systems research this theoretical view is reflected in the widely employed
conceptualisation of consumer trust as a tripartite construct, consisting of the sub-dimensions ‘ability’,
‘benevolence’, and ‘integrity’, which comprehensively shape the conceived trustworthiness of a trustee (Mayer,
et al., 1995, p. 715). However, just recently the central role of consumer trust in specific technologies has been
recognised in Information Systems research. In today’s complex computing environments, where individuals
increasingly develop greater dependence upon ICT systems, trusting beliefs involve not only human actors, but
more and more also IT artefacts (Wang & Benbasat, 2008, p. 268; Vance, et al., 2008, p. 74). Lippert and Forman
(2006, p. 271) thus allege that by virtue of anticipated aversive long‐term consequences (e.g. long learning curves
and additionally accruing operating costs), any technology adoption bears uncertainty from a user perspective.
Given that technological innovations might not feature the expected capabilities or functionality for accomplishing
an envisaged task, trustors largely lack control over consequences of IT usage as in the case of interpersonal ex-
change relationships. Accordingly, drawing upon prior research on interpersonal trust, McKnight et al. (2011, p.
12:5) understand technology trust as a second-order, object-specific belief set based on the respective system’s
functionality (related to ‘ability’), helpfulness (related to ‘benevolence’) and predictability (related to ‘integrity’).
In a mobile payment context, Luarn and Juo found in (2010, p. 889) a significant interaction term between trust in
an emerging technology itself and the actual usage behaviour. In supporting this finding, Thatcher et al. (2011, p.
66) empirically demonstrated that trust in a specific IT artefact substantially affects postadoption exploration of
the system. Vance et al. (2008, p. 74 ff.) investigated trust within a mobile commerce scenario and developed a
framework for understanding the system quality characteristics that build or diminish consumer’s willingness to
trust. They clearly emphasise the role of trust in the diffusion of an innovation (ibid.). Hence, from a commercial
point of view, deepening the extant understanding of the recently arisen trust concept is expected to lead to valuable
insights concerning consumer’s adoption patterns. In-depth knowledge of the effects of trust thus may help to
better understand the pace and nature of product growth in innovative markets (McKnight, et al., 2002, p. 334).
3.3.2 Perceived Usefulness as a Correlate of Perceived Pervasiveness
As outlined in chapter 3.1.2.3, TAM is considered to be a partial model that provides solely a middle range theory.
Due to its parsimony, it is generically applicable to traditional technology adoption and acceptance contexts.
Nonetheless, when technological paradigms change, this boundary condition of the current research stream hinders
scholarly investigation from specifically analysing the distinguishing characteristics inherent to an altering class
of technologies (Bagozzi, 2007, p. 245). In the Information Systems field scholars therefore call for further
research on technology acceptance. The base model should be augmented by means of a coherent integration of
additional generic or universal predictors that are particularly relevant to the prevailing object under scrutiny
76 Theoretical Foundations
(Bagozzi, 2007 p. 244; Sheng, et al., 2014 p. 462; Schierz, et al., 2010 p. 210). Such an introduction of further
exogenous variables should deepen the original TAM conceptualisation by explaining its central concepts of
cognition-based beliefs (i.e. perceived usefulness and perceived ease of use) to gain a better understanding of
consumer acceptance in different domains.
With respect to the present object under investigation, especially the shift towards ubiquitous computing becomes
apparent. This paradigm shift distinguishes pervasive or ubiquitous information systems from classical computing
environments insofar that seamless mobility, context-awareness as well as a sense of ‘unobtrusiveness’ turn into
key characteristics of the emerging genre of computing (Perich, et al., 2004, p. 630). As per definition, the
pervasive ICT system’s scope is substantially broader than those of traditional desktop PCs. Pervasive systems
dynamically apply to varying settings without being stationary or requiring explicit control of the user (Lyytinen,
et al., 2004, p. 64; Birnbaum, 1997, p. 41). Therefore, in pursuing to predict ubiquitous or pervasive information
systems adoption, the classical nomological net of technology adoption falls too short. In order to overcome this
shortcoming, the TAM was deepened for the present study by introducing a further hypothetical construct. This
latent variable should be able to explain a sufficient amount of variance in utility perceptions, specifically in a
ubiquitous computing context.
By correlating pervasive information systems with technology acceptance theories, Karaiskos (2009) initially con-
ceptualised and validated a measure of perceived pervasiveness in ubiquitous computing environments. Drawing
on the well-researched behavioural, normative and control beliefs in acceptance research (see chapter 3.1.2.2), the
author incorporated a new pervasiveness perspective into the original TAM, so as to reflect the inherent charac-
teristics of pervasive computing. In his introductory work he conceptualised and factor-analytically validated
pervasiveness, which is depicted in Figure 3.7. This exogenous construct is based on the theoretical assumption
that pervasiveness is an abstract formed, superordinate concept that particularly emphasises on the amalgamation
of information appliances and human’s living conditions (Karaiskos, 2009, p. 80 ff.; Xu, et al., 2007, p. 772). From
a causal-analytical viewpoint, pervasiveness acts as an antecedent of the endogenous cognitive and affective ac-
ceptance factors that are commonly considered to be behaviourally-relevant in Information Systems and marketing
literature (Karaiskos, 2009, p. 150). Substantially, three self-sustained dimensions synthesise the construct’s
conceptual scope and thus denote its dimensionality. These three constituting dimensions are framed as follows
(Karaiskos, 2009, p. 81 ff.):
• Ubiquity. This pervasiveness dimension relates to the continuous accessibility to a pervasive infor-
mation system’s resources without spatial or temporal boundaries.
• Unobtrusiveness. The unobtrusiveness dimension refers to the invisibility of the pervasive information
appliance in terms of a non-distracting and non-disrupting, but simultaneously proactive operational
support of the user.
• Context awareness. This dimension describes the dynamical adaptability of a system to contextual
cues. This includes the capture of context-relevant information through sensory capabilities as well as
the management of these data in real-time.
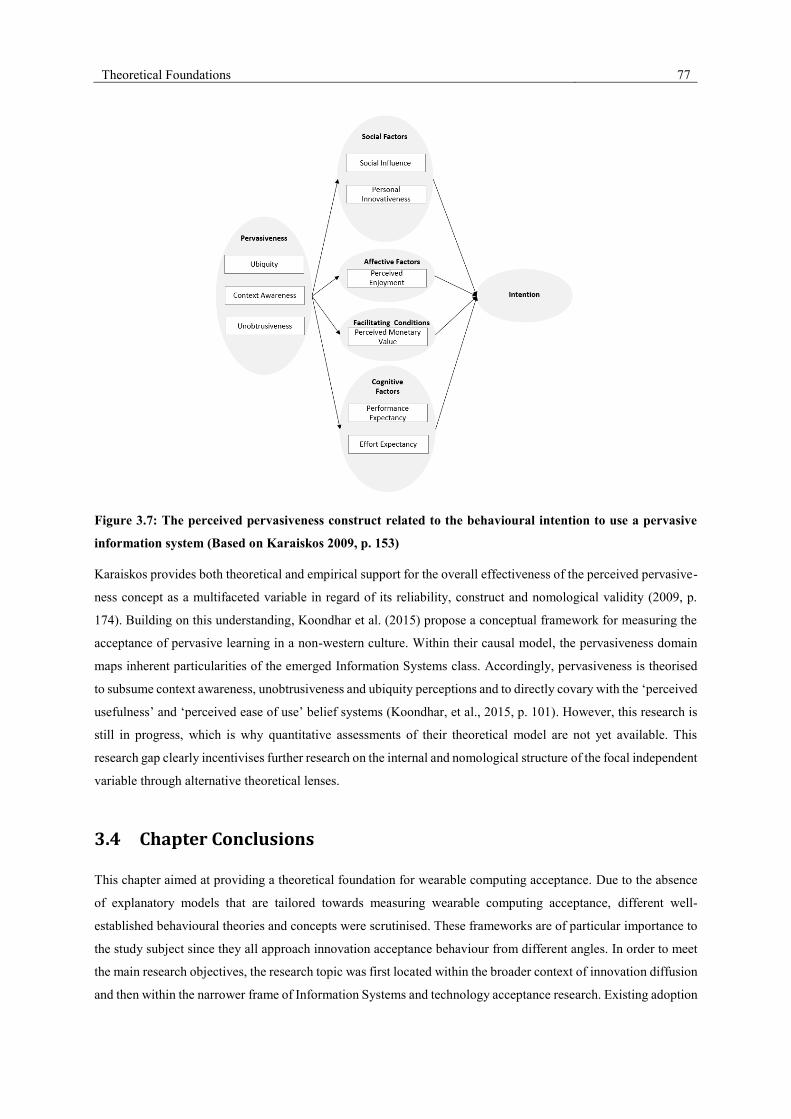
Theoretical Foundations 77
Figure 3.7: The perceived pervasiveness construct related to the behavioural intention to use a pervasive
information system (Based on Karaiskos 2009, p. 153)
Karaiskos provides both theoretical and empirical support for the overall effectiveness of the perceived pervasive-
ness concept as a multifaceted variable in regard of its reliability, construct and nomological validity (2009, p.
174). Building on this understanding, Koondhar et al. (2015) propose a conceptual framework for measuring the
acceptance of pervasive learning in a non-western culture. Within their causal model, the pervasiveness domain
maps inherent particularities of the emerged Information Systems class. Accordingly, pervasiveness is theorised
to subsume context awareness, unobtrusiveness and ubiquity perceptions and to directly covary with the ‘perceived
usefulness’ and ‘perceived ease of use’ belief systems (Koondhar, et al., 2015, p. 101). However, this research is
still in progress, which is why quantitative assessments of their theoretical model are not yet available. This
research gap clearly incentivises further research on the internal and nomological structure of the focal independent
variable through alternative theoretical lenses.
3.4 Chapter Conclusions
This chapter aimed at providing a theoretical foundation for wearable computing acceptance. Due to the absence
of explanatory models that are tailored towards measuring wearable computing acceptance, different well-
established behavioural theories and concepts were scrutinised. These frameworks are of particular importance to
the study subject since they all approach innovation acceptance behaviour from different angles. In order to meet
the main research objectives, the research topic was first located within the broader context of innovation diffusion
and then within the narrower frame of Information Systems and technology acceptance research. Existing adoption
78 Theoretical Foundations
models were critically evaluated and an overview was given of contemporary empirical investigations which
explicitly apply these models and which focus on comparable technological innovations. The literature review
revealed that the TAM has already been successfully employed across various research settings and that this
theoretical framework is best suited to explain and predict acceptance behaviour in an information systems context.
Still, the generic cause-effect relationships provided by the TAM fall too short in explaining the adoption of
emerging technologies such as wearable computing. To further augment this base model with new, subject-relevant
concepts that may improve predictive and explanatory power, perceived security risk as a salient belief was
discussed from a consumer perspective and put in relation to technology adoption theories. To reach a more
comprehensive understanding of what influences the reluctance to use an upcoming technology, perceived risk
was conceptualised as a multidimensional construct, which clearly stands in contrast to the usual specification of
IT security risk in innovation adoption literature. Finally, another recent topic in Information Systems research,
the perceived pervasiveness of a technology, has been introduced. This cognitive belief appears particularly
promising in the given study context since it captures the specific features of the novel wearable computing
paradigm. In order to identify further concepts that are implicated in the individual intention formation and, thus,
may serve as a starting point for model development, in the following the qualitative approach of this research is
discussed in detail.

Qualitative Interview Study 79
4 Qualitative Interview Study
This chapter deals with the exploratory part of the research programme at hand. It is organised as follows: Firstly,
it outlines the philosophical approach towards the research problem. Secondly, aligned with the research questions
under investigation, it discusses appropriate methods and procedures for collecting and analysing qualitative data.
Finally, based on the proposed research design and the obtained empirical material, it draws interim conclusions
on the market success factors of wearable computing. These findings may provide a well-founded starting point
for hypotheses formulation.
4.1 Qualitative Research Methodology
Constitutive to the practical part of the qualitative study, this section aims at circumscribing the methodological
base of the actual research. The rationale for choosing a mixed-methodological approach that combines qualitative
and quantitative data, is given. Also, information is provided about how a qualitative study ought to be carried out
in general and how inductively collected data can be evaluated adequately.
4.1.1 Epistemological and Methodological Considerations
At present, academic research in the area of ubiquitous and wearable computing acceptance is still relatively scarce
(Shin, 2010 p. 169; Chuah, et al., 2016). This makes an explorative research phase indispensable, so as to motivate
and legitimise research on interpersonal success factors of wearable computing adoption. In particular, the
explorative insights are expected to highlight the need for developing a new, multi-factor measurement model of
effectuation and causation from a consumer viewpoint. In a broader sense, a multi-methodological approach has
been employed for the purpose of the present research work which links conceptual, qualitative, and quantitative
research studies through sequential triangulation.
From a meta-theoretical perspective, prior to the definition of a methodological strategy it first has to be determined
if the research problem is primarily qualitative or quantitative in essence (Morse, 1991, p. 120). Qualitative re-
search is usually of a diagnostic exploratory nature, questioning search and simultaneously representing a search
for questions (de Ruyter & Scholl, 1998, p. 8). This research strategy finds its roots from the field of sociology,
which marks “a science which attempts the interpretive understanding of social action in order to arrive at a causal
explanation of its course and effects” (Weber, 1947, p. 88).
Qualitative Methods Quantitative Methods
Research goals Discovery of new ideas; preliminary
understanding of ideas and objects
Validation of facts, estimates, rela-
tionships and predictions
Type of research Exploratory designs Descriptive and causal designs

80 Qualitative Interview Study
Qualitative Methods Quantitative Methods
Strategies of inquiry Narrative research, case study,
Grounded Theory, Phenomenology,
Ethnography
Experimental and non-experimental
(e.g. surveys)
Type of questions Open-ended, unstructured, probing Mostly structured
Time of execution Relatively short time frame Generally, significantly longer time
frame
Representativeness Small samples; limited to sampled
individuals
Large samples; typically good rep-
resentation of population
Type of analysis Debriefing, subjective, content
analysis, interpretive
Statistical, descriptive, and causal
predictions
Generalisability Limited; only preliminary insights and
understanding
Normally very good, inferences about
facts and relationships
Table 4.1: Main distinguishing characteristics between qualitative and quantitative research (Based on
Creswell et al., 2018, p. 11 ff. and Hair et al. 2003, p. 212)
Under the premise of a socially constructed reality, qualitative research emphasises discovery over confirmation
by reconstructing subjective theories (Holliday, 2008, p. 6; Newman & Benz, 1998, p. xviii). This method of
inquiry differs from quantitative research in that it typically adopts analytic-inductive processes of reasoning.
Qualitative studies aim at theory building, rather than pursuing the deductive tradition in terms of theory testing.
They seek to put forth a richness of detailed data on a small number of individuals (Hyde, 2000, p. 84; Deshpande,
1983, p. 105). The main distinguishing characteristics between qualitative and quantitative research can be taken
from Table 4.1.
The central study’s assumption that attitudinal and behavioural dimensions of consumer decision-making play a
crucial role in wearable market’s growth already finds confirmation in diffusion and Information Systems literature
(see previous chapter). Still, this research issue lacks more detailed empirical-inductive research in order to arrive
at a sufficiently sound and meaningful theoretical foundation for hypothesis generating. Therefore, a preliminary
qualitative approach has been chosen in the course of this thesis. Drawing upon an extensive review of relevant
academic literature in the field of innovation diffusion, Information Systems and attitude research, the objectives
of the qualitative inquiry have been set as follows: (1) Formulate the research problem more precisely regarding
the scope of the empirical setting, (2) exploring subjective beliefs and perceptions current and prospective users
have towards wearable computing and (3) establish a proper theoretical basis for the development of a coherent
system of hypotheses by gaining deeper insights into relevant individual and situational circumstances that affect
the belief formation towards wearables.
More specifically, building upon the preceding literature review and seeking convergence to the main research
questions and theoretical findings, the exploratory study aims at clarifying the following areas in order to serve as
a prelude to subsequent quantitative research processes:
• Characteristics and causalities of the wearable technology market
Qualitative Interview Study 81
• Drivers of wearable computing adoption
• Inhibitors of wearable computing adoption
However, up to now, in marketing science and Information Systems research a mono-methodological employment
of standardised quantitative models clearly predominates (Planing, 2014). Yet, the historically developed over-
reliance on deductive processes in the context of social scientific studies has encountered multiple criticism. For
example, Deshpane (1983, p. 106) complains that marketing scholars tend to apply exclusively quantitative
methodological processes even on concepts that are still immature. In addition, Wells (1993, p. 490 ff.) criticises
that the comprehensiveness in theorising would be insufficient, that statistical significance would confer real
causality and, furthermore, that there is a dominance of one-shot studies. Especially the latter criticism has
increasingly become addressed in consumer research over the last decades (Johnson, et al., 2007, p. 112).
Given our limited access to the world through perceptual and theoretical lenses, the post-positivist paradigm (in a
Kantian sense) ontologically assumes that there is an objective, causally efficacious but only imperfectly
conceivable reality. Following this view, a mixed-methodological approach appears most promising, emphasising
the importance of multiple observations and methods with their different types of inherent deficiencies and unique
strengths (Guba & Lincoln, 1994, p. 100; Mingers, et al., 2013, p. 795). This relatively new research paradigm
acknowledges that the convergence of findings from two or more methods fallible in their own diverse ways “en-
hances our belief that the results are valid and not a methodological artefact” (Bouchard, 1976, p. 268). The
complementary combination of several methodological perspectives may compensate the specific weaknesses and
blind spots of each single method and hence reduce the overall error of measurement.
More precisely, in light of the study’s superior purpose of transferable and generalizable explanations and predic-
tions of consumer behaviour, critical realism comes more to fore (Mingers, et al., 2013, p. 800). This post-positivist
ontology assumes that subjectivity is inherent to all concepts in social sciences, since they are ultimately human
constructions (Bryman & Bell, 2015, p. 62). As a consequence, claims about reality have to be critically examined
to the greatest possible extent in order to advance apprehension of reality (Guba & Lincoln, 1994, p. 110).
Following this reasoning and given that qualitative approaches may compensate for deficiencies in quantitative
research, critical realism espouses the combination of both methodologies. Methodologically, this philosophical
tradition thus implies a mixed-method research design. It grounds the simultaneous use of qualitative and
quantitative methods in the same research endeavour and, consequently, shapes the logic of inference in the course
of the research process. In view of its particular suitability for Information Systems research (Zachariadis, et al.,
2013, p. 856), the present study holds the meta-theoretical stance of critical realism.
One of the most common functions of mixed methods is triangulation. This research strategy suggests that the
combination of data or methods in the study of the same social phenomenon results in superior explanations
(Bryman, 2006, p. 108; Johnson, et al., 2007, p. 115). According to Denzin (1978, p. 14) who coined this theoretical
term, there are basically three possible outcomes that may arise from triangulation strategy: convergence,
inconsistency, and contradiction. Whichever outcome predominates, the researcher attains more corroborating
evidence for constructing profound propositions about a given phenomenon (Mathison, 1988, p. 15).
82 Qualitative Interview Study
Thus, for validation purposes a multi-strategy research was employed in this study. The methodological triangu-
lation posed a multi-stage research process in which data from both the conceptual and the qualitative stage built
the foundation for subsequent quantitative research. The findings from the initial exploratory approach were
matched against the concepts that evolved from the review of the pertaining theoretical and empirical findings in
literature that relate to the adoption of new information technologies (such as utility and risk perceptions). The
resulting categories of beliefs towards wearable computing acceptance finally constituted the main content of the
Wearable TAM that could be further tested quantitatively.
4.1.2 Qualitative Approach to Data Collection
Overall, the aim of the qualitative study is to identify concepts that are involved in the individual belief formation
towards the adoption of wearable computing. However, this research phase is not intended to report on quality
criteria such as significance values or potential correlations between those concepts. Rather, in order to elaborate
and extend existing theory, it pursues to holistically conceptualise the individual decision to adopt wearable
technologies. The findings of this study constitute a building block for the development of the explanative model
and, as such, guide the proceeding of this research.
According to Mack et al. (2005, p. 2), the most common qualitative methods are: participant observation, in-depth
interviews and focus groups. As the present study aims at eliciting latent attitudinal factors, direct observations
may not be viable. Moreover, focus groups have the fundamental drawback that their results are a direct function
of group dynamics, potentially leading to biased findings (Churchill & Iacobucci, 2010, p. 67). In-depth interviews,
on the contrary, enable to bring out the ‘complex stock of knowledge’ (Flick, 2009, p. 156) persons have about the
topic under study. Since personal one-to-one interviews are very well suited for eliciting salient behavioural,
normative and efficacy beliefs (Montano, et al., 2008, p. 80), this qualitative research method matches the research
aims stated.
Previous qualitative research has developed various methodological alternatives to collect verbal data. In broad
terms, the different interview methods alternate between the goal of either producing openness or producing
structure (Flick, 2009, p. 211). Therefore, the choice of a method should be based on the given research objectives
as anchor points, which intrinsically pose the need for exploration or rather explanation. Recalling the research
goals of this study, the central aim is to develop a comprehensive understanding of which socio-psychological
factors influence the decision-making towards the acceptance of wearable computing. Thus, the interviews should
be oriented towards a thematic direction. At the same time, this study seeks to reveal latent beliefs towards
wearable computing adoption in mass markets as a new field, i.e. making implicit knowledge more explicit. In
view of this persisting research gap, the need for a supplementary explorative function to acquire more background
knowledge about the study topic becomes acute. Consequently, a semi-structured interview type appears appro-
priate for the present purposes.
A specific form of semi-structured interviews is the expert interview, which neither refers to highly open nor to
rigid structured question-answer schemes (Flick, 2009, p. 165). With regard to thematic directedness, interviews
are structured by an ex-ante devised interview guide, which essentially reflects its underlying conceptual
framework. This gives the interviewer the flexibility to vary or interpose questions, so that more elaborate
Qualitative Interview Study 83
responses may arise, which potentially lead to a disclosure of implicit knowledge or hidden facets of human
behaviour (Qu & Dumay, 2011, p. 246). On the other hand, the objectives of research are conveyed consistently
by the interview schedule, directing the conversion in a systematic way (Lienhard & Preuss, 2014, p. 74).
The target group of expert interviews comprises informants possessing a specific in-practice knowledge within a
professional sphere of activity (Schmitt, 2014, p. 33; Flick, 2009, p. 166). Considering that qualitative research
seeks transferability rather than generalisability of results, an adequate sample size is “one that adequately answers
the research question” (Marshall, 1996, p. 523). An iterative, nonprobability approach to sampling is thus required,
where data collection is a cybernetic process that is controlled by the emerging theory (Glaser & Strauss, 2009, p.
45; Ritchie, et al., 2013, p. 115). This means that further samples have to be selected iteratively for refining
emerging categories from initially analysed data. Typically, the population of interest is recruited on the basis of
the potential contribution to the body of knowledge its members have in a certain social system. Hence, in
qualitative research the sample is usually derived purposefully rather than randomly, focussing primarily on the
information-richness of each case (Onwuegbuzie & Leech, 2007, p. 242; Patton, 1990, p. 181). Consequently,
significant information redundancy marks the point of theoretical saturation, when no further insights or
perspectives are forthcoming from ongoing data collection and the conceptual categories or theories of relevance
are fully explicated (Morse, 2001, p. 66).
In view of the classical quality requirements (i.e. validity and reliability) in scientific research, qualitative methods
have frequently been criticised from quantitative research community because they are often regarded as failing
the standard criteria of scientific adequacy or rigor (Sandelowski, 1986, p. 27). Responding to this critique, various
qualitative methodologists have constructed new typologies of validity, transferring some basic aspects from
quantitative tradition to the field of qualitative inquiry (Seale, 1999, p. 465). These evaluation criteria make up a
huge array of new terms for the trustworthiness or credibility of qualitative research projects, redefining concepts
of validity and reliability in inductive contexts including authenticity, dependability, confirmability, goodness,
verisimilitude, fittingness and plausibility (Creswell & Miller, 2000, p. 124; Flick, 2009, p. 396; Golafshani, 2003,
p. 604). Yet, most inductive research methods adhere to a relative freedom of structure and rigour. Their very
nature suggests that the quality of qualitative studies should be assessed by its own paradigm’s concepts
(Stenbacka, 2001, p. 551). As qualitative research emphasises on meaning rather than on measurement, Stenbacka
(ibid.) argues that the traditional validity concept in its quantitative sense addressing the question of whether “the
intended object of measurement actually is measured” has no relevance in inductive approaches. Accordingly, in
qualitative research validity refers primarily to the fact “that constructs are closely aligned to their real-life context”
(de Ruyter & Scholl, 1998, p. 13). Therefore, results become significant only in relation to the informant’s
everyday reality. Insofar, de Ruyter and Scholl contend that qualitative inquiry provides the possibility of ‘eco-
logical validity’ as opposed to construct validity or internal validity (2003, p. 13; Wünderlich, 2009, p. 96).
External validity in the sense of a quality criteria for quantitative research refers to the validity structure of gener-
alised inferences (Johnson, 1997, p. 289). However, generalisability is usually not the prime purpose of qualitative
research, what is evident from the fact that qualitative methods seldom aim at selecting random samples as the
most appropriate sampling technique to generalise from a sample to a population. Qualitative methodologists focus
more on particularities than on universalistic findings. Thus, Yin translates in (1989, p. 21) statistical generalisation

84 Qualitative Interview Study
into analytical generalisation, where the investigator’s goal is to expand and generalise theories and not to numer-
ate frequencies. According to Stenbacka (2001, p. 552), an analytical understanding can be attained by elevating
the empirical material to a general level.
In quantitative research, reliability refers to how consistently a technique reproduces results from measuring a
specific concept repetitively (Rao & Perry, 2003, p. 241). Therefore, as reliability by definition concerns measure-
ment, Stenbacka (2001, p. 552) postulates that the issue of repetitive correctness has relatively little value in re-
search settings dominated by the inductive demand for conditional subjectivity. Other scholars argue that
qualitative research does not primarily demand reproducibility, but much more a systematic operation at the level
of the research design (i.e. methods and techniques) linking the empirical material to the central theoretical models
or concepts (de Ruyter & Scholl, 1998, p. 13).
Accordingly, Flick (2009, p. 397) gives rise to the question of whether qualitative research should generally look
for strategies of quality assessment rather than on inter-methodological evaluation criteria. Drawing upon the rec-
ommendations of qualitative methodologists in literature, best-practices in qualitative study should be integrated
into the preparatory design of a research project, so as to shape and direct the research during its development and
to establish the trustworthiness of its results (Creswell & Miller, 2000, p. 124; Morse, et al., 2002, p. 18). Thus, to
achieve validity and reliability in the above sense, this study employs eight quality verification mechanisms
adopted from literature in the field (Stenbacka, 2001; de Ruyter and Scholl, 1998; Rao and Perry, 2003; Healy and
Perry, 2000; Wünderlich, 2009), which are summarised in Table 4.2.
Employed Tactics Objective
Ecological Validity • All expert interviews were performed in the informant’s
own environment (de Ruyter, et al., 1998 p. 13;
Wünderlich, 2009 p. 98), i.e. they were interviewed at
their own place of work.
• The informants were given the opportunity to speak openly
according to their knowledge structures (Stenbacka, 2001,
p. 552). Consequently, closed-ended questions were not
asked.
• The interviews were performed in a flexible manner
including specific analytical in-depth probing where
appropriate (de Ruyter & Scholl, 1998, p. 13).
Ensuring valid perceptions
and beliefs aligned to the
informant’s real-life
context
External Validity • The informants were strategically well-chosen rather than
statistically drawn, as they are heavily involved in
innovative wearable computing issues and, thus,
assumingly more competent in the field for the sake of
particular “information-richness” (Stenbacka, 2001, p.
555). To avoid personal bias in the choice of respondents,
in three cases the snowballing technique was used, see
chapter 4.2.1.
Ensuring credibility and
generalisability of results
in respect to theory

Qualitative Interview Study 85
• To ensure a cross-section of opinions, professionals with
different perspectives on wearable technologies were
selected (Rao & Perry, 2003, p. 241), cf. chapter 4.2.1.
• The results of the analysis of the expert interviews (i.e. the
emerged categories) were related to relevant Information
Systems literature to be intersubjectively comprehensible
and to ensure theoretical consistency of empirical
interpretations (Creswell & Miller, 2000, p. 127; Bryant &
Charmaz, 2010, p. 19).
Reliability • The interview guide was built upon extant theoretical
frameworks and concepts in innovation adoption literature
(cf. chapter 3), seeking to meet the analytical goals
coherently (de Ruyter & Scholl, 1998, p. 13; Healy &
Perry, 2000, p. 122).
• The structured process for writing and interpreting data was
documented in detail by means of an in-depth description
of the employed study design in chapter 4.2 and a detailed
matrix of emerged coding categories (de Ruyter & Scholl,
1998, p. 13; Rao & Perry, 2003, p. 241).
Ensuring confirmability,
transparency and
traceability of the original
research design
Table 4.2: Employed verification mechanisms to achieve validity in a qualitative sense
4.1.3 Qualitative Content Analysis
Qualitative data analysis aims at transforming collected textual material into meaningful findings (Patton, 2002,
p. 275). According to Robson (2009, p. 456), there are up to now no clear and commonly agreed conventions for
analysis of qualitative data. Nevertheless, several approaches to a systematic content analysis exist, which can be
broadly categorised into three methodologies: conventional, directed, and summative analysis (Hsieh &
Shannon, 2005, p. 1278). Conventional content analysis deals with the description of a phenomenon on which
academic literature and theories are limited. By contrast, directed content analysis pursues to complement existing
theory or prior research that is deemed to be incomplete. Finally, summative content analysis aims at discovering
underlying meanings of expressions by analysing the appearance of a particular word or content in the qualitative
data.
Recalling the objectives of the explorative research phase, this thesis ought to employ a conventional content
analysis. In this context, Mayring (2000) has developed a procedural model for qualitative content analysis (see
Figure 4.1), which hallmarks an “[…] approach of empirical, methodological controlled analysis of texts within
their context of communication, following content analytical rules and step by step models, without rash
quantification”. Basically, it is an iterative as well as reductive process. It systematically categorises manifest and
latent content in a rule-bound way by employing at least partially inductively generated categories (i.e. derived
from the data) that are internally homogeneous and externally heterogeneous by nature (Forman & Damschroder,
2008, p. 40; Mayring, 2000). It should be noticed here that qualitative content analysis should always be theory-
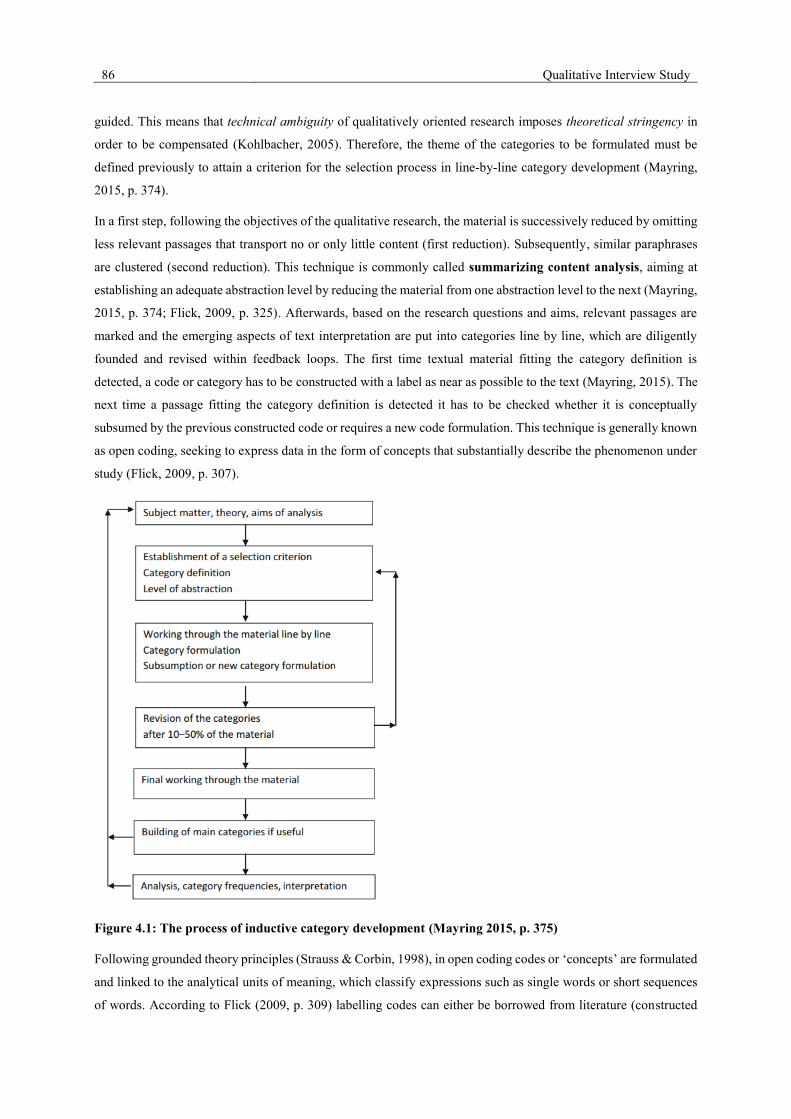
86 Qualitative Interview Study
guided. This means that technical ambiguity of qualitatively oriented research imposes theoretical stringency in
order to be compensated (Kohlbacher, 2005). Therefore, the theme of the categories to be formulated must be
defined previously to attain a criterion for the selection process in line-by-line category development (Mayring,
2015, p. 374).
In a first step, following the objectives of the qualitative research, the material is successively reduced by omitting
less relevant passages that transport no or only little content (first reduction). Subsequently, similar paraphrases
are clustered (second reduction). This technique is commonly called summarizing content analysis, aiming at
establishing an adequate abstraction level by reducing the material from one abstraction level to the next (Mayring,
2015, p. 374; Flick, 2009, p. 325). Afterwards, based on the research questions and aims, relevant passages are
marked and the emerging aspects of text interpretation are put into categories line by line, which are diligently
founded and revised within feedback loops. The first time textual material fitting the category definition is
detected, a code or category has to be constructed with a label as near as possible to the text (Mayring, 2015). The
next time a passage fitting the category definition is detected it has to be checked whether it is conceptually
subsumed by the previous constructed code or requires a new code formulation. This technique is generally known
as open coding, seeking to express data in the form of concepts that substantially describe the phenomenon under
study (Flick, 2009, p. 307).
Figure 4.1: The process of inductive category development (Mayring 2015, p. 375)
Following grounded theory principles (Strauss & Corbin, 1998), in open coding codes or ‘concepts’ are formulated
and linked to the analytical units of meaning, which classify expressions such as single words or short sequences
of words. According to Flick (2009, p. 309) labelling codes can either be borrowed from literature (constructed

Qualitative Interview Study 87
codes) or rephrasing parts of the source text (in-vivo codes). Thereupon, codes are categorised by grouping them
around the theoretically relevant phenomena found in the material. The resulting categories are again attached to
codes, which are now more abstract than those applied in the first step. The next step, commonly referred to as
‘axial coding’, refers to the elaboration of the relationships and dependability among the identified codes and
categories resulting from open coding (Strauss & Corbin, 1998, p. 127). Essentially, the structures of relations
between codes and categories are clarified by examining which code or category serves as a cause of the phenom-
enon and which category or code serves as a consequence of the phenomenon. Thus, axial coding is basically a
process of systematically relating subcategories to more abstract, logical concept categories, supported by contin-
uous comparison between categories and additional data. For instance, the subcategory ‘Privacy’ was condensed
into the superordinate concept of ‘IT security aspects’. Finally, selective coding aims at eliciting one core concept
or phenomenon from which a substantive theory can be developed (Flick, 2009, p. 312). The central concept or
phenomenon is systematically related to the fractured categories developed so far, whereby their interrelationships
become validated. The content-analytical procedure ends at that point, where theoretical saturation has been
reached, i.e. where further codes or categories no longer provide new knowledge (ibid.).
4.2 Design and Conduction of the Qualitative Study
This section describes how the interviews for the exploratory study were designed and administered. The
conducted qualitative data analysis of the interview transcripts is discussed in detail. Thereupon, the inductive
findings are presented.
4.2.1 Empirical Setting
As outlined above, the present exploratory research aims to provide an insight and understanding of attitude
formation in wearable computing markets at a holistic level. Hence, a purposive theoretical sampling procedure
was chosen to recruit particular informative respondents. Glaser and Holton (2004) define theoretical sampling as
“the process of data collection for generating theory whereby the analyst jointly collects, codes, and analyses his
data and decides which data to collect next and where to find them, in order to develop his theory as it emerges.
This process of data collection is controlled by the emerging theory, whether substantive or formal”. Thus, the
decision on where to sample next was made in concert with the emerging codes and categories.
Theoretical sampling involves the purposeful selection of informants at least in the early stages of research (Coyne,
1997, p. 625). In this context, Sandelowski (1995, p. 181) remarks that there are essentially three variation strate-
gies in purposive sampling: demographic, phenomenal, and theoretical variation. Demographic variation refers to
a kind of maximum variation in purposeful sampling where variation is sought on general socio-demographic
characteristics. The second kind of variation strategy represents a variation on the target phenomenon under study,
what is also labelled as selective or criterion sampling (1995, p. 182). Theoretical variation, finally, refers to the-
oretically derived variations discerned in the data.
The objective of the present sample selection was to attain a sufficient sample heterogeneity in terms of maximal
diversity of proficient interview participants. Accordingly, sampling was directed by the pursuit of including a
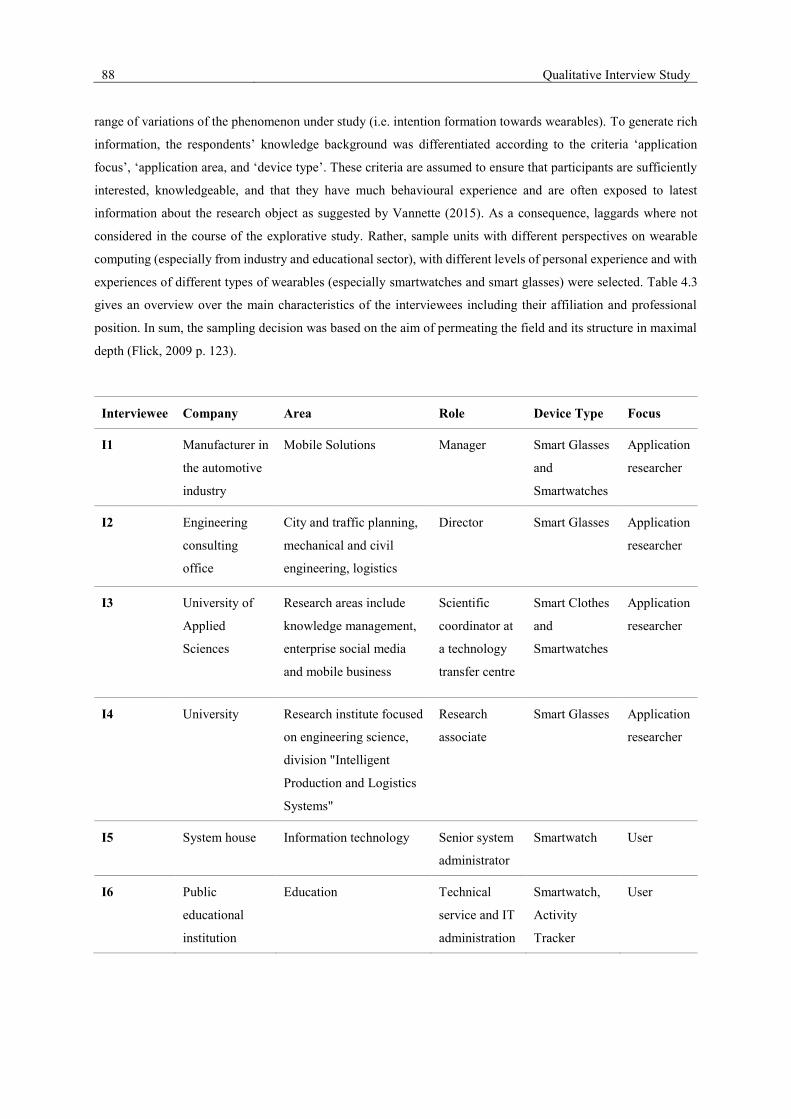
88 Qualitative Interview Study
range of variations of the phenomenon under study (i.e. intention formation towards wearables). To generate rich
information, the respondents’ knowledge background was differentiated according to the criteria ‘application
focus’, ‘application area, and ‘device type’. These criteria are assumed to ensure that participants are sufficiently
interested, knowledgeable, and that they have much behavioural experience and are often exposed to latest
information about the research object as suggested by Vannette (2015). As a consequence, laggards where not
considered in the course of the explorative study. Rather, sample units with different perspectives on wearable
computing (especially from industry and educational sector), with different levels of personal experience and with
experiences of different types of wearables (especially smartwatches and smart glasses) were selected. Table 4.3
gives an overview over the main characteristics of the interviewees including their affiliation and professional
position. In sum, the sampling decision was based on the aim of permeating the field and its structure in maximal
depth (Flick, 2009 p. 123).
Interviewee Company Area Role Device Type Focus
I1 Manufacturer in
the automotive
industry
Mobile Solutions Manager Smart Glasses
and
Smartwatches
Application
researcher
I2 Engineering
consulting
office
City and traffic planning,
mechanical and civil
engineering, logistics
Director Smart Glasses Application
researcher
I3 University of
Applied
Sciences
Research areas include
knowledge management,
enterprise social media
and mobile business
Scientific
coordinator at
a technology
transfer centre
Smart Clothes
and
Smartwatches
Application
researcher
I4 University Research institute focused
on engineering science,
division "Intelligent
Production and Logistics
Systems"
Research
associate
Smart Glasses Application
researcher
I5 System house Information technology Senior system
administrator
Smartwatch User
I6 Public
educational
institution
Education Technical
service and IT
administration
Smartwatch,
Activity
Tracker
User
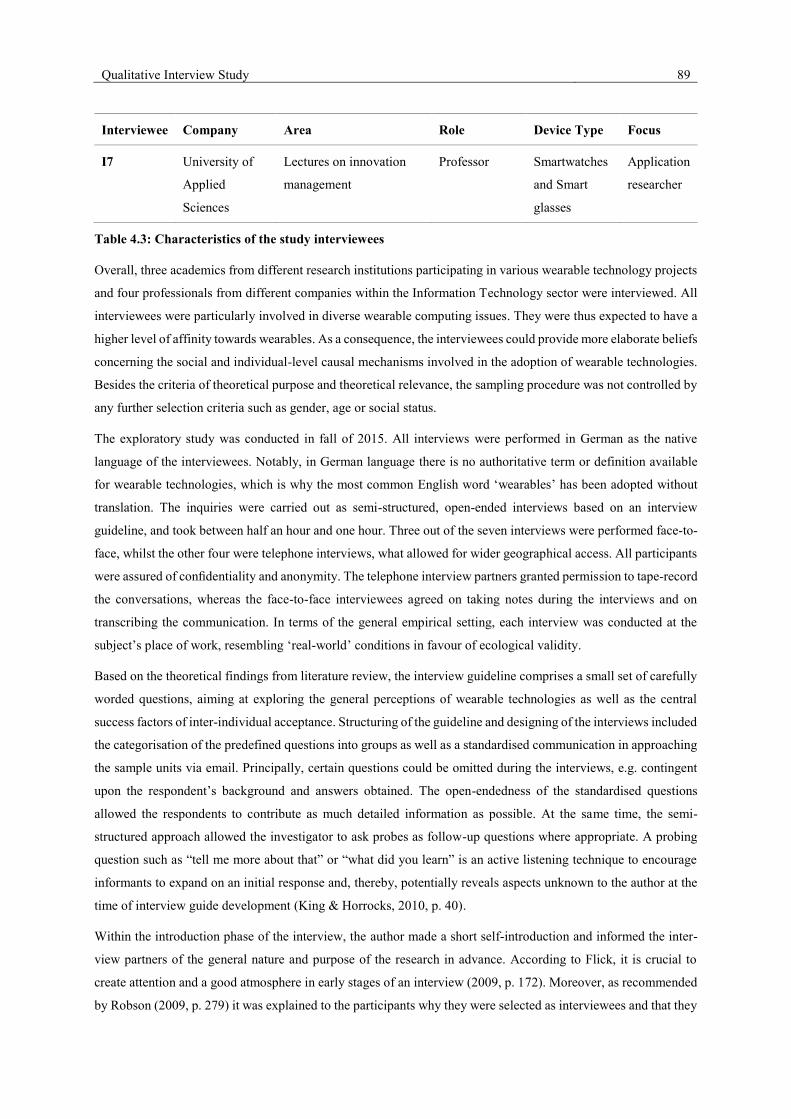
Qualitative Interview Study 89
Interviewee Company Area Role Device Type Focus
I7 University of
Applied
Sciences
Lectures on innovation
management
Professor Smartwatches
and Smart
glasses
Application
researcher
Table 4.3: Characteristics of the study interviewees
Overall, three academics from different research institutions participating in various wearable technology projects
and four professionals from different companies within the Information Technology sector were interviewed. All
interviewees were particularly involved in diverse wearable computing issues. They were thus expected to have a
higher level of affinity towards wearables. As a consequence, the interviewees could provide more elaborate beliefs
concerning the social and individual-level causal mechanisms involved in the adoption of wearable technologies.
Besides the criteria of theoretical purpose and theoretical relevance, the sampling procedure was not controlled by
any further selection criteria such as gender, age or social status.
The exploratory study was conducted in fall of 2015. All interviews were performed in German as the native
language of the interviewees. Notably, in German language there is no authoritative term or definition available
for wearable technologies, which is why the most common English word ‘wearables’ has been adopted without
translation. The inquiries were carried out as semi-structured, open-ended interviews based on an interview
guideline, and took between half an hour and one hour. Three out of the seven interviews were performed face-to-
face, whilst the other four were telephone interviews, what allowed for wider geographical access. All participants
were assured of confidentiality and anonymity. The telephone interview partners granted permission to tape-record
the conversations, whereas the face-to-face interviewees agreed on taking notes during the interviews and on
transcribing the communication. In terms of the general empirical setting, each interview was conducted at the
subject’s place of work, resembling ‘real-world’ conditions in favour of ecological validity.
Based on the theoretical findings from literature review, the interview guideline comprises a small set of carefully
worded questions, aiming at exploring the general perceptions of wearable technologies as well as the central
success factors of inter-individual acceptance. Structuring of the guideline and designing of the interviews included
the categorisation of the predefined questions into groups as well as a standardised communication in approaching
the sample units via email. Principally, certain questions could be omitted during the interviews, e.g. contingent
upon the respondent’s background and answers obtained. The open-endedness of the standardised questions
allowed the respondents to contribute as much detailed information as possible. At the same time, the semi-
structured approach allowed the investigator to ask probes as follow-up questions where appropriate. A probing
question such as “tell me more about that” or “what did you learn” is an active listening technique to encourage
informants to expand on an initial response and, thereby, potentially reveals aspects unknown to the author at the
time of interview guide development (King & Horrocks, 2010, p. 40).
Within the introduction phase of the interview, the author made a short self-introduction and informed the inter-
view partners of the general nature and purpose of the research in advance. According to Flick, it is crucial to
create attention and a good atmosphere in early stages of an interview (2009, p. 172). Moreover, as recommended
by Robson (2009, p. 279) it was explained to the participants why they were selected as interviewees and that they
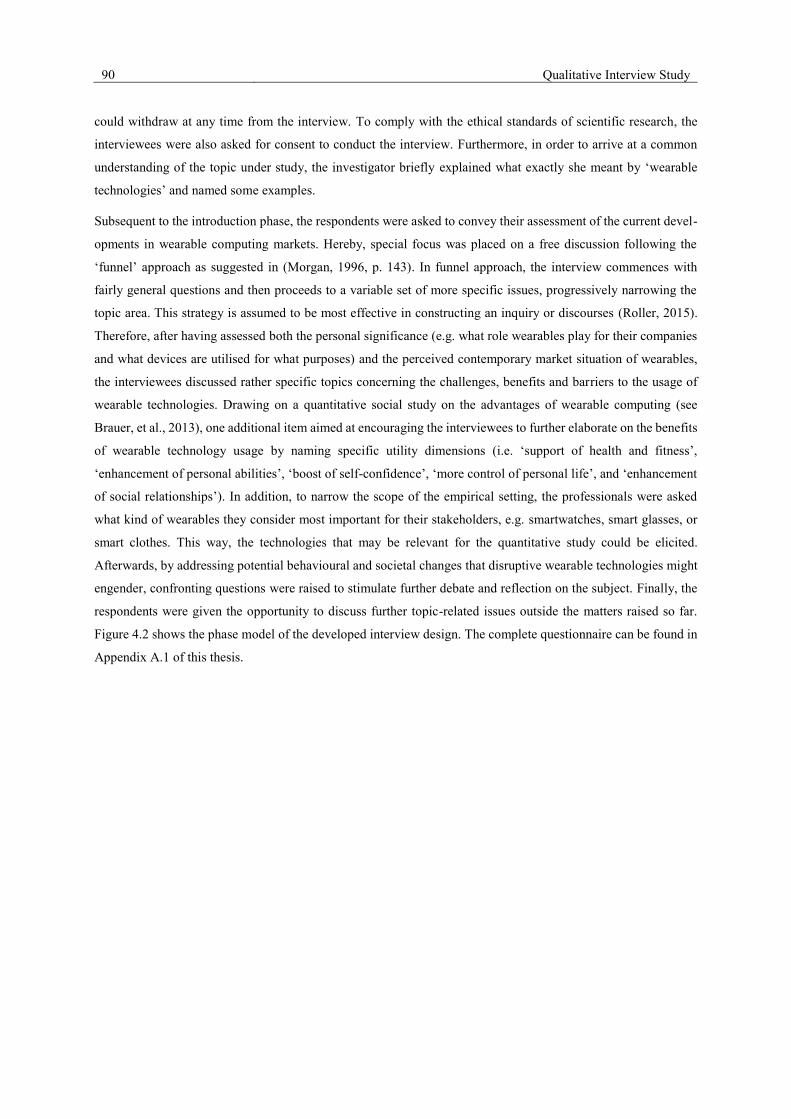
90 Qualitative Interview Study
could withdraw at any time from the interview. To comply with the ethical standards of scientific research, the
interviewees were also asked for consent to conduct the interview. Furthermore, in order to arrive at a common
understanding of the topic under study, the investigator briefly explained what exactly she meant by ‘wearable
technologies’ and named some examples.
Subsequent to the introduction phase, the respondents were asked to convey their assessment of the current devel-
opments in wearable computing markets. Hereby, special focus was placed on a free discussion following the
‘funnel’ approach as suggested in (Morgan, 1996, p. 143). In funnel approach, the interview commences with
fairly general questions and then proceeds to a variable set of more specific issues, progressively narrowing the
topic area. This strategy is assumed to be most effective in constructing an inquiry or discourses (Roller, 2015).
Therefore, after having assessed both the personal significance (e.g. what role wearables play for their companies
and what devices are utilised for what purposes) and the perceived contemporary market situation of wearables,
the interviewees discussed rather specific topics concerning the challenges, benefits and barriers to the usage of
wearable technologies. Drawing on a quantitative social study on the advantages of wearable computing (see
Brauer, et al., 2013), one additional item aimed at encouraging the interviewees to further elaborate on the benefits
of wearable technology usage by naming specific utility dimensions (i.e. ‘support of health and fitness’,
‘enhancement of personal abilities’, ‘boost of self-confidence’, ‘more control of personal life’, and ‘enhancement
of social relationships’). In addition, to narrow the scope of the empirical setting, the professionals were asked
what kind of wearables they consider most important for their stakeholders, e.g. smartwatches, smart glasses, or
smart clothes. This way, the technologies that may be relevant for the quantitative study could be elicited.
Afterwards, by addressing potential behavioural and societal changes that disruptive wearable technologies might
engender, confronting questions were raised to stimulate further debate and reflection on the subject. Finally, the
respondents were given the opportunity to discuss further topic-related issues outside the matters raised so far.
Figure 4.2 shows the phase model of the developed interview design. The complete questionnaire can be found in
Appendix A.1 of this thesis.
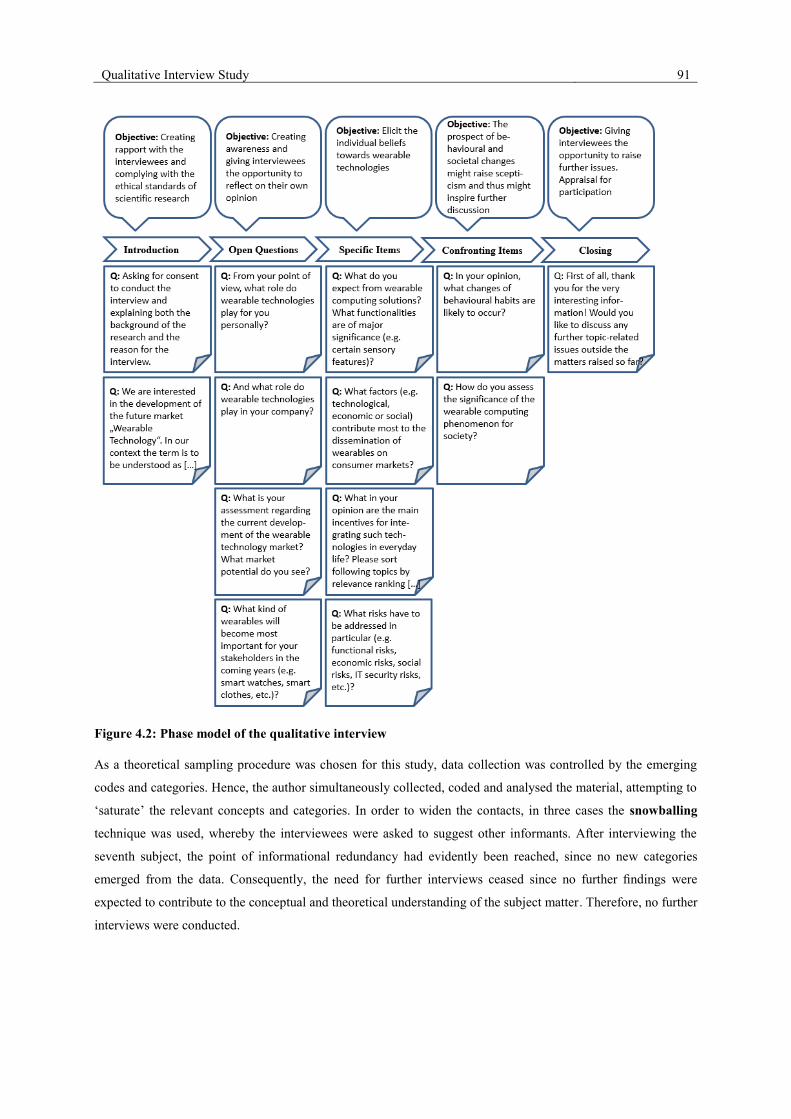
Qualitative Interview Study 91
Figure 4.2: Phase model of the qualitative interview
As a theoretical sampling procedure was chosen for this study, data collection was controlled by the emerging
codes and categories. Hence, the author simultaneously collected, coded and analysed the material, attempting to
‘saturate’ the relevant concepts and categories. In order to widen the contacts, in three cases the snowballing
technique was used, whereby the interviewees were asked to suggest other informants. After interviewing the
seventh subject, the point of informational redundancy had evidently been reached, since no new categories
emerged from the data. Consequently, the need for further interviews ceased since no further findings were
expected to contribute to the conceptual and theoretical understanding of the subject matter. Therefore, no further
interviews were conducted.
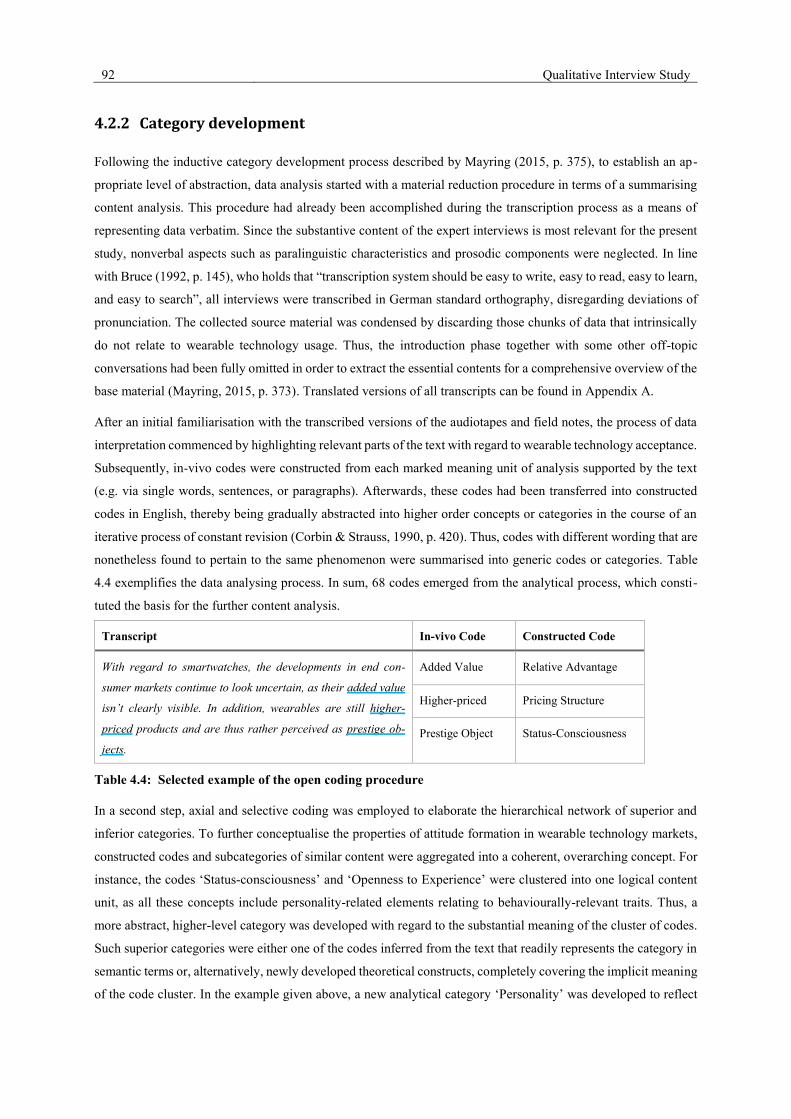
92 Qualitative Interview Study
4.2.2 Category development
Following the inductive category development process described by Mayring (2015, p. 375), to establish an ap-
propriate level of abstraction, data analysis started with a material reduction procedure in terms of a summarising
content analysis. This procedure had already been accomplished during the transcription process as a means of
representing data verbatim. Since the substantive content of the expert interviews is most relevant for the present
study, nonverbal aspects such as paralinguistic characteristics and prosodic components were neglected. In line
with Bruce (1992, p. 145), who holds that “transcription system should be easy to write, easy to read, easy to learn,
and easy to search”, all interviews were transcribed in German standard orthography, disregarding deviations of
pronunciation. The collected source material was condensed by discarding those chunks of data that intrinsically
do not relate to wearable technology usage. Thus, the introduction phase together with some other off-topic
conversations had been fully omitted in order to extract the essential contents for a comprehensive overview of the
base material (Mayring, 2015, p. 373). Translated versions of all transcripts can be found in Appendix A.
After an initial familiarisation with the transcribed versions of the audiotapes and field notes, the process of data
interpretation commenced by highlighting relevant parts of the text with regard to wearable technology acceptance.
Subsequently, in-vivo codes were constructed from each marked meaning unit of analysis supported by the text
(e.g. via single words, sentences, or paragraphs). Afterwards, these codes had been transferred into constructed
codes in English, thereby being gradually abstracted into higher order concepts or categories in the course of an
iterative process of constant revision (Corbin & Strauss, 1990, p. 420). Thus, codes with different wording that are
nonetheless found to pertain to the same phenomenon were summarised into generic codes or categories. Table
4.4 exemplifies the data analysing process. In sum, 68 codes emerged from the analytical process, which consti-
tuted the basis for the further content analysis.
Transcript In-vivo Code Constructed Code
With regard to smartwatches, the developments in end con-
sumer markets continue to look uncertain, as their added value
isn’t clearly visible. In addition, wearables are still higher-
priced products and are thus rather perceived as prestige ob-
jects.
Added Value Relative Advantage
Higher-priced Pricing Structure
Prestige Object Status-Consciousness
Table 4.4: Selected example of the open coding procedure
In a second step, axial and selective coding was employed to elaborate the hierarchical network of superior and
inferior categories. To further conceptualise the properties of attitude formation in wearable technology markets,
constructed codes and subcategories of similar content were aggregated into a coherent, overarching concept. For
instance, the codes ‘Status-consciousness’ and ‘Openness to Experience’ were clustered into one logical content
unit, as all these concepts include personality-related elements relating to behaviourally-relevant traits. Thus, a
more abstract, higher-level category was developed with regard to the substantial meaning of the cluster of codes.
Such superior categories were either one of the codes inferred from the text that readily represents the category in
semantic terms or, alternatively, newly developed theoretical constructs, completely covering the implicit meaning
of the code cluster. In the example given above, a new analytical category ‘Personality’ was developed to reflect
Qualitative Interview Study 93
the common contents of the constructed lower-level codes. Particular emphasis was laid on defining categories
that are collectively exhaustive and at the same time mutually exclusive (Krippendorff, 2011, p. 98). The code
clustering procedure was performed until all constructed codes were assigned to a higher-order category, reflecting
a specific theoretical construct. The final coding scheme consists of 13 main categories and 68 subcategories. The
coding scheme together with the number of text units attached to those codes are illustrated in Table 4.5.
However, it has to be acknowledged that these findings must be related to the objectives of the inductive research
endeavour (Planing, 2014 p. 116). Therefore, conclusions from the empirical results of the content analysis should
be drawn only in conjuncture with the research questions (see chapter 4.1.1). They moreover ought to be correlated
with existing theoretical and conceptual models in literature for a further refinement of the concepts identified.
This convergence process is discussed in the course of the development of the Wearable TAM in chapter 5.
4.3 Interim Implications
The results from the qualitative study give manifold insights concerning the inter-individual adoption decision
process in wearable technology markets. In total, 13 theoretical constructs have been developed from the qualita-
tive research phase that capture the selected respondents’ perceptions and interrelated beliefs on the intention
formation towards wearable technologies. These concepts are supposed to build the ground for deriving the sought
Wearable TAM in a theory-driven manner by providing important aspects and determinants of wearable technol-
ogy acceptance behaviour.
Two out of these ‘nominal’ categories emerged relate to non-psychographic factors that nonetheless contribute to
the body of knowledge in the chosen field. The frequent referrals to profound behavioural changes expected at a
societal level thus show that wearables, understood as intelligent standalone devices, exert indeed a disruptive
effect on habitual patterns of behaviour. They thus involve unique challenges for market preparation including
creating awareness and educating prospective consumers about the innovation (Sandberg, 2002, p. 189). Two
respondents (I.1, P.88 and I.3, P.9) stated that wearable computing will presumably transform private and business
life through an increase of consumer-originated technological devices and models that develop in the consumer
space and afterwards gain currency in enterprises. This market-structure-shifting movement that, i.a. also
comprises the Bring Your Own Device (BYOD) phenomenon is also referred to as ‘consumerization of IT’ (Fenn
& LeHong, 2011, p. 7) and can be regarded as the natural result of a society that is becoming more and more
‘digitised’ and mobile.
Interestingly, several respondents have made multiple references to the diffusion patterns of smartphones. In par-
ticular, two participants pointed to the evidence that it became prestigious to possess an Apple product such as an
iPhone or iPod and that they are hence consumed not least because of their symbolic or expressive value (I.1, P.77
and I.2, P.26). That is, the culturally constructed, social meaning associated with those products enables consumers
to communicate their identity and social status (Ravasi & Rindova, 2004, p. 3). Another respondent stressed the
importance of the iPhone’s usability for its commercial launch success and widespread dissemination (I.3, P.29).
Drawing conclusions by analogy, wearables should allow for intuitive operation and, additionally, satisfy hedonic
needs for self-expression in order to increase their adoption rate. However, it should be kept in mind that one
94 Qualitative Interview Study
cannot directly extrapolate from the diffusion patterns of smartphones to the diffusion patterns of wearables (cf.
chapter 2.4).
When asked about the current market development and anticipated economic potential of wearable devices, all
participants suppose either smart glasses or smartwatches to become most relevant for their stakeholders in the
long term. In the short to medium term, smartwatches and fitness bands are expected to continue acquiring the
largest share of the market. This backs the findings on the current market situation in chapter 2.4. One respondent
believes that smart clothes will lead to tremendous changes particularly in the health sector over the long run, as
they will tap completely new possibilities of communication (I.3, P. 94). Yet, in light of these findings it appears
to be reasonable to focus on both smartwatches and smart glasses as most prominent technologies for the purpose
of the present research project.
As indicated by the frequent referencing to acceptance-related determinants, product growth is actually influenced
by various demand factors, such as social acceptability and changes in beliefs. These aspects are summarised into
the central phenomenon ‘Acceptance behaviour’ that denotes the present study’s object of cognition, leading back
to the initially defined category formation criterion and, accordingly, to the studies research questions. Apart from
this, various non-psychographic macro-environmental forces were pointed at, which are, however, outside of the
scope of the present study as they cannot be altered by managerial actions. Especially, the points of pricing struc-
tures and technical immaturity emerged during the process of coding and analysis. From the latter it can be con-
cluded that the degree of usability may not be measured validly, as the respective technologies still lack sufficient
overall maturity and thus require further advances in many fields to comply with technological and human
standards. Furthermore, the results show that social influence plays a considerable role in wearable computing
adoption processes. From a social network perspective, this suggests that social proof might also have some con-
ative influence on usage decisions in terms of a sociocultural impetus that manifests in a bandwagon-based diffu-
sion gaining momentum.
In this context, for the adoption process to become endogenously self-sustaining it is of paramount importance to
achieve a critical mass of adopters first in order to adequately stimulate dynamics in consumer preferences
(Lechman, 2015, p. 51). In line with Rogers’ diffusion of innovations theory, the earliest consumers to purchase
innovations are categorised as innovators, followed by early adopters (see chapter 3.1.1). These individuals are
commonly characterised by a relatively high degree of venturesomeness and technical affinity compared to the
other members of their social system. This disposition leads to a greater innate willingness to adopt innovative
technologies (Rogers, 1983a p. 201). The nexus is well-supported by the present exploratory study, as several
respondents stressed the level of personal innovativeness in consumer decision-making by explicitly mentioning
‘early adopters’ as main target group of prospective consumers (e.g. I.6, P. 39 or I.7, P. 13).
Furthermore, the interview analysis revealed that personality-related correlates of behaviour exert actually an im-
portant - albeit indirect - influence on wearable computing acceptance. The most common predisposition to be-
haviour mentioned by the respondents is the personal relevance or involvement with mobile and wearable compu-
ting. Since this factor is deemed to directly interact with compound personality traits (Bosnjak, et al., 2007, p.
599), it may be considered as a more domain-specific trait relevant to consumption behaviour. Additionally, status
concerns emerged as another salient socio-psychological variable that affect the decision to adopt wearables.
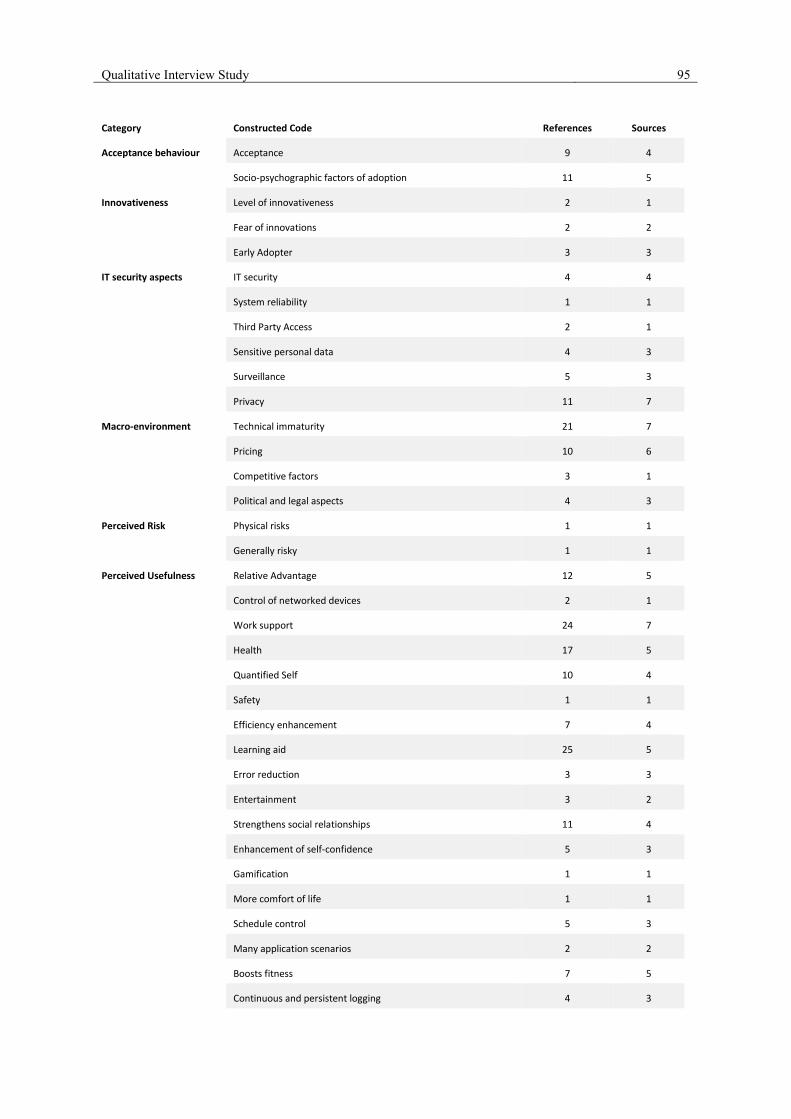
Qualitative Interview Study 95
Category Constructed Code References Sources
Acceptance behaviour Acceptance 9 4
Socio-psychographic factors of adoption 11 5
Innovativeness Level of innovativeness 2 1
Fear of innovations 2 2
Early Adopter 3 3
IT security aspects IT security 4 4
System reliability 1 1
Third Party Access 2 1
Sensitive personal data 4 3
Surveillance 5 3
Privacy 11 7
Macro-environment Technical immaturity 21 7
Pricing 10 6
Competitive factors 3 1
Political and legal aspects 4 3
Perceived Risk Physical risks 1 1
Generally risky 1 1
Perceived Usefulness Relative Advantage 12 5
Control of networked devices 2 1
Work support 24 7
Health 17 5
Quantified Self 10 4
Safety 1 1
Efficiency enhancement 7 4
Learning aid 25 5
Error reduction 3 3
Entertainment 3 2
Strengthens social relationships 11 4
Enhancement of self-confidence 5 3
Gamification 1 1
More comfort of life 1 1
Schedule control 5 3
Many application scenarios 2 2
Boosts fitness 7 5
Continuous and persistent logging 4 3
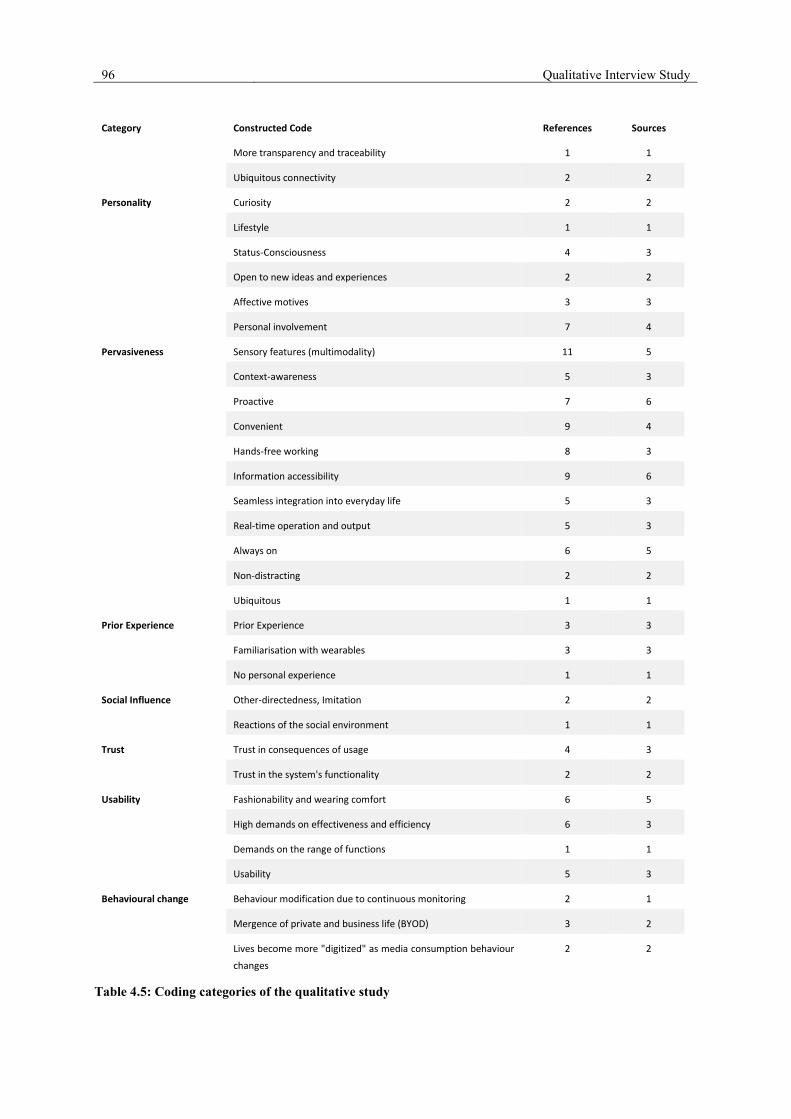
96 Qualitative Interview Study
Category Constructed Code References Sources
More transparency and traceability 1 1
Ubiquitous connectivity 2 2
Personality Curiosity 2 2
Lifestyle 1 1
Status-Consciousness 4 3
Open to new ideas and experiences 2 2
Affective motives 3 3
Personal involvement 7 4
Pervasiveness Sensory features (multimodality) 11 5
Context-awareness 5 3
Proactive 7 6
Convenient 9 4
Hands-free working 8 3
Information accessibility 9 6
Seamless integration into everyday life 5 3
Real-time operation and output 5 3
Always on 6 5
Non-distracting 2 2
Ubiquitous 1 1
Prior Experience Prior Experience 3 3
Familiarisation with wearables 3 3
No personal experience 1 1
Social Influence Other-directedness, Imitation 2 2
Reactions of the social environment 1 1
Trust Trust in consequences of usage 4 3
Trust in the system's functionality 2 2
Usability Fashionability and wearing comfort 6 5
High demands on effectiveness and efficiency 6 3
Demands on the range of functions 1 1
Usability 5 3
Behavioural change Behaviour modification due to continuous monitoring 2 1
Mergence of private and business life (BYOD) 3 2
Lives become more "digitized" as media consumption behaviour
changes
2 2
Table 4.5: Coding categories of the qualitative study
Qualitative Interview Study 97
As can be further seen from the identified categories listed in Table 4.5, the strongest intrapersonal factor that is
expected to support the acceptance of wearable computing is Perceived Usefulness, primarily attributed to work
and learning support. Most respondents named hands-free instruction guidelines and real-time notifications as
specific product features that they considered beneficial. Furthermore, the wearables’ potential assistance in the
field of health and fitness - particularly through offering the possibility of continuous self-monitoring - was
variously seen as a clear advantage. Based on the interviews, the usefulness of wearables can be mainly ascribed
to the unique attributes of the respective, newly emerged computing paradigm. Theses abstract attributes may be
subsumed under the concept of Pervasiveness, meaning that this innovative class of IT systems ought to provide
ubiquitous as well as context-aware information services and applications unobtrusively to the greatest possible
extent in order to generate substantial benefits. Accounting for the main differences between traditional desktop
systems and pervasive or ubiquitous computing models, wearables should be seamlessly integrated into the daily
life, proactively enhancing all routine activities. This is in line with previous research, which emphasises on the
importance of the perceived ubiquity, unobtrusiveness, and context-awareness of emerging technologies
(Karaiskos, 2009, p. 83).
Moreover, from the results of the qualitative study it is apparent that the main reason for wearable computing
resistance are IT security concerns. This finding backs contemporary Information Systems literature which
considers security risks to be a prime inhibitor to technology adoption (see chapter 3.2). In particular, a majority
of respondents reported that they would fear privacy risks in view of the fact that wearables would process highly
sensitive personal data at an unprecedented rate. Yet, perceived risks outside IT security risks have seldom been
mentioned, referring to ambiguous threats and physical risks due to possible distractions. The interview statements
(e.g. I.5, P. 50 and I.7, P. 51) show furthermore, that trust in the technology itself including its functionality and
predictability directly relates to risk perceptions. Besides, based on the interview results consumers’ prior
experience with a certain technology might lead to a higher acceptance of that system in terms of a greater tolerance
towards associated risks and habituation. One participant (I.3, P. 24-27) cites the increasing acceptance of CCTV
or Google Street View as a concrete example. Also, the degree of personal innovativeness seems to influence how
consumers assess the perceived risk and usefulness of such technologies (e.g. I.3 P. 43 and I.7 P. 13).
4.4 Chapter Conclusions
This chapter was centred on the qualitative approach of the present study, so as to identify important belief groups
and holistic insights on adopter perceptions towards wearable computing. The critically appraised theoretical
foundations and key concepts in chapter 3 formed thereby the basis for the semi-structured interview guideline. In
the course of the explorative research phase, 68 constructed codes rephrasing parts of the source texts and 13 main
concepts grouping these codes could be extracted from the interview transcripts. Eleven out of these categories
that were found to be particularly relevant in a wearable computing context reflect psychographic factors which
all relate to different concepts in Information Systems research.
In sum, the implications from the exploratory study are substantial from the point of view that they deliver unique
insights from a qualitative perspective. It is the first study focussing on the social and psychological origins and
contexts of wearable computing usage intention. The inductive findings provide not only single belief sets, but

98 Qualitative Interview Study
also a holistic perspective on the acceptance behaviour in innovative IoT markets. The empirical results from the
expert interviews contribute to Information Systems research by revealing the substantial role of personality traits
on the consumer’ willingness to adopt wearable computing. Additionally, the elicited significance of IT-related
risk perceptions underscores the importance of information security for technology acceptance. Also, this study
sheds light on the interplay between the extent of ‘perceived pervasiveness’ of respective technologies and attitude
formation. Therefore, the first three research questions of this thesis (i.e. what are the individual-level drivers,
obstacles, and personality-related aspects of wearable computing adoption) can be regarded as being addressed so
far. However, it has to be emphasised that the results are not readily generalizable to the broad consumer market,
as they are based on a theoretical sample. Rather, they serve as a basis for the theory-based hypotheses derivation
and subsequent development of the quantitative study.
Theory-driven development of the Wearable Technology Acceptance Model 99
5 Theory-driven development of the Wearable
Technology Acceptance Model
After having established the relevant theoretical reference points and concepts, this chapter is dedicated to the
development of an inter-individual path model of wearable technology acceptance. This model can be understood
as a methodological instrument on the basis of which the theoretical acceptance factors, their pathways as well as
significant background variables can be investigated in a causal-analytical manner. Overall, the Wearable TAM
aims at clarifying correlating effects of the hypothetical constructs and to explain the consumer’s intention to adopt
wearable technologies.
5.1 Technology Acceptance Model in the Context of Wearable
Computing
Building on the results of both the qualitative expert interviews and the findings of prior research in marketing and
Information Systems, the causal hypotheses are deduced in the following sections. The integration of convergent
conceptual frameworks from different research streams thereby ensures that the sought behavioural model allows
instructive conclusions to be inferred for marketing practice. Since contemporary research gaps as well as the
results of the qualitative study prompt this, particular attention is directed to commensurable theories in the area
of IT security and personality psychology. Subsequently, significant third variables relevant to the investigational
domain are identified and coherently incorporated into the total system of hypotheses that interconnects the
conceptualised factors of wearable technology acceptance.
5.1.1 Technology Beliefs
The following sections focus on salient cognitive concepts that are particularly relevant in a technology adoption
context.
5.1.1.1 Perceived Usefulness
In order to develop appropriate Wearable TAM hypotheses, a robust behavioural model (i.e. theoretical anchor)
must first be defined. Due to its efficiency as well as its dominant role within acceptance research (see chapter
3.1.2.3), in the present study TAM served as a basis for successively evolving the research hypotheses. As could
be shown, this model is specially geared towards understanding acceptance behaviour in technology markets. In
addition, this study implemented further complementary theoretical concepts. Augmenting the TAM with
additional constructs may counteract the conceptual criticism that – due to its universal applicability in Information
Systems research – the originary causal network features only limited transferability to specific problem areas. An
integrative modelling approach assumingly enables to make more precise assertions about attitude formation
within the newly emerged IT application domain under consideration. Moreover, the theory-driven
reconceptualization of the original TAM variables in the subsequent passages may lead to a higher specificity of

100 Theory-driven development of the Wearable Technology Acceptance Model
the sought explanatory model. The adapted nomological network is thus expected to explain a greater amount of
variance in wearable technology acceptance behaviour.
In the course of the systematic model modification, the guiding research question concerning the socio-
psychological antecedents of ICT adoption has primarily been addressed. Since the wearables market launch is
still progressing relatively slowly (McNutt, 2015), the actual usage behaviour as an originally provided TAM
construct had to be excluded on research economic reasons. Rather, the intra-attitudinal structure should be
established first, focussing on the dependent criterion variable of behavioural intention to use wearable computers.
As the most proximate predictor of behaviour (Ajzen, 1991, p. 181), in the following this conative component of
attitude is conceptually regarded as an acceptance response to adopt wearables. Consequently, the tripartite model
of attitude structure discussed in chapter 3.1.2.1 – where intention represents a structurally separated latent
construct – constitutes a suitable explanatory approach. Herein, the evaluative judgement subsuming affective and
cognitive properties of attitude exerts a direct, positive effect on individual’s intention to act.
Nevertheless, the decision to adopt innovative ICT products is often considered to be inherently fraught with risk
and comparably utilitarian in nature (Doole, et al., 1997 p. 52; Kim, et al., 2009 p. 68). Therefore, it can be expected
that IT adoption requires a relatively high level of careful consideration in terms of a more rational choice decision.
This assumption is supported by various acceptance studies, which indicate that the decision to adopt ICT systems
is primarily driven by a cognitive cost-benefit analysis (Chun, et al., 2012, p. 474). In addition, several studies
found that attitude did not fully mediate the effect of technology beliefs on usage intentions (Burton, et al., 2005
p. 59). Therefore, the most common modelling approach in technology acceptance literature that excludes the
affective attitude component from decision-making (cf. Yang & Yoo, 2004, p. 20) is followed in this study.
Furthermore, in technology acceptance research the ‘perceived ease of use’ construct has been observed to be a
relevant predictor of attitude in a wider variety of research. From a cognition-theoretical viewpoint, however,
predictive validity of this exogenous construct is considerably higher in such instances where users already have
product knowledge (Venkatesh, et al., 1996 p. 465). In the absence of previous experiences with innovative
technologies, decision-makers have to rely on more abstract product criteria as decision heuristics (Park & Lessig,
1981, p. 223). Correspondingly, some prior studies in the health care segment suggest that having no or only little
practice in the use of an IT system leads to a poorer estimate of user-friendliness. On the other hand, increasing
hands-on experience might completely diminish the importance of usability for acceptance and use (Holden, et al.,
2010). The frequent lack of empirical evidence for an ease of use-attitude link (see e.g. Chau, et al., 2001 p. 712,
or Agarwal, et al., 1997 p. 572) has some researchers even led to conclude that “no amount of ease of use (EOU)
will compensate for low usefulness” (Keil, et al., 1995 p. 89). With regard to dynamically-discontinuous and
radical innovations in fairly fragmented wearable computing markets, it has to be assumed that statements on the
usability of wearables may not yet be made validly. The different device types and products differ too strongly in
regard to their functional and ergonomic properties. All the more so as one finding of the qualitative study suggests
that several wearable technology solutions (particularly smart glasses and smart textiles) still lack sufficient overall
maturity. This renders a general statement on the usability of wearable technologies virtually impossible.
Moreover, systems tested in the past (e.g. e-mail programmes, e-commerce applications, internet banking or tools
for computer-aided software engineering) greatly differ from future information technologies like wearables in
Theory-driven development of the Wearable Technology Acceptance Model 101
terms of pervasiveness, context-awareness and the way of human-computer interaction. Therefore, Röcker
recommends in (2010, p. 241) to identify new factors that supersede the ease of use construct by explicitly
accounting for the characteristics of future ubiquitous systems (in the present study this is achieved by including
the pervasiveness construct as outlined in section 3.3.2). Thus, ease of use was excluded from the structural model
for methodological reasons, as well.
Besides the above outlined causal effect of the perceived system’s ergonomics on usage intention, TAM posits
further a perceived usefulness concept. According to Rogers’ diffusion of innovations theory, the perceived
superiority of an innovation (which may stem from the product’s enhanced capabilities) directly determines the
evaluative judgement towards the usage of the given system. This also includes anticipated behavioural
consequences in the sense of extrinsic rewards that accrue as a result of product usage, for example through
increases in time savings and efficiency gains (Bagozzi, et al., 1999; Bagozzi, et al., 1992 p. 662; Wünderlich,
2009 p. 137). The relevance of extrinsic motivations in decision-making manifests in the fact that benefits serve
as prime orientation and evaluation criteria in decision processes (Akturan & Tezcan, 2012, p. 449). Actually,
several meta-studies have shown that perceived usefulness is the most robust predictor of technology acceptance
in Information Systems application domains (e.g. Ma & Liu, 2004).
In the context of wearable computing acceptance, perceived usefulness is understood as the degree to which con-
sumers belief that using a wearable computing device would be utilitarian in enhancing one’s life. Borrowing from
a quantitative social study among over 4,000 UK and US adults, this latent variable is conceptualised as a
multidimensional construct, reflecting several salient benefits of wearables which primarily relate to enhancements
of living conditions (Brauer & Barth, 2013). In particular, this abstract construct is theorised to consist of the five
formative subdimensions ‘Enhancement of personal abilities’, ‘Improvement of health and fitness’, ‘Enhancement
of self-confidence’, ‘More control of life’, and ‘Enhancement of social relations’. This conceptualisation allows
to adapt the tradition-rich usefulness construct to the present study context and to gain more differential insights
with regard to the underlying causes of usefulness perceptions.
In sum, if a consumer believes that a wearable would be useful, he or she is more likely to intent to use it. Assuming
that intentions to use are proximate predictors of future usage behaviour and considering the degree of specificity
of perceived usefulness and the behavioural criterion, the following causal hypothesis is proposed:
H1: Increased consumer’s perception of the usefulness of wearable computing will result in an increase in the
intention to use a wearable computing device.
5.1.1.2 Perceived IT Security Risks and Antecedents
Especially in the course of limited and extensive purchase decision-making processes, the cost/benefit ratio plays
a major role in conscious attitude formation. Drawing on utility theory, the consumer’s perceived net value
represents a dichotomous characteristic, composed of benefits and sacrifices (Snoj, et al., 2004, p. 157). As
discussed in chapter 3.2, perceived sacrifices have empirically been shown to consist of diverse non-monetary
costs associated with product acquisition and usage. Moreover, risk perceptions have variously been found to
constitute a crucial impediment to the rate of adoption (Planing, 2014 p. 65).

102 Theory-driven development of the Wearable Technology Acceptance Model
Within the exploratory study, particularly IT security threats (linked to a set of legal requirements) emerged as a
dominant topic in the context of B2C markets (see chapter 4.3). Nonetheless, in published empirical acceptance
studies, the influence of traditional security goals on behavioural intention to use an information system, with one
notable exception (see Hartono et al., 2014), has not yet been analysed from a consumer perspective. Extant
quantitative research related to subjective security and rooted in TAM conceptualise consumer perceptions of
security commonly as unidimensional, e.g. as ‘website security’. For instance, in studies on electronic commerce
empirical evidence could be provided for the correlative relationship between Web security concerns and the usage
of the electronic medium for purchasing (Salisbury, et al., 2001), between perceived security with regard to the
handling of personal data and the loyalty shown to a Web site (Flavián & Guinalíu, 2006), and between subjective
information security of electronic commerce transactions and the acceptance of online transactions (Suh & Han,
2002; Chellappa & Pavlou, 2002).
In this study, perceived security is regarded as the subjective probability with which consumers believe that rele-
vant information services will be timely available and personal data will not be viewed, stored, and manipulated
during processing, storage or transfer by inappropriate parties in a manner consistent with their confident expec-
tations. Thus, the developed conceptual domain of security implies a multidimensional construct, linking objective
measures to subjective perceptions as introduced by Hartono et al. (2014). If the customer deems the technology-
driven environment to be confidential, integer and constantly available, he or she is more likely to intent to use the
system. Proceeding from the assumption, that perceived security is an abstract, second-order formed attribute, the
following correlative relationship is hypothesised:
H2: Decreased consumer’s perception of the security risk of wearable computing will result in an increase in the
intention to use a wearable computing device.
In sum, as a result of the TAM modification along the above findings, the structural model illustrated in Figure
5.1 emerges. Albeit this conceptual framework readily provides a solid theoretical basis, the high generalisability
of its statements across any technology adoption context inevitably leads to a less explanatory power as discussed
previously. Consequently, the partial model developed so far is ill-suited to address the above managerial
problems, yet. Therefore, the psychological process intervening between the behavioural intention to adopt
wearables and environmental stimuli has to be explicated more fine-grained by introducing additional predictors.
Figure 5.1: Conceptual frame of the sought structural model based on TAM

Theory-driven development of the Wearable Technology Acceptance Model 103
In behavioural economics, sociological and psychological sciences, subjective risk perceptions are conceptually
closely related to the notion of trust (Rousseau, et al., 1998, p. 395). This latent connection has already been
demonstrated in numerous empirical studies, e.g. in Mayer et al. (1995). Up to now, however, in technology-driven
environments trust has mostly been interpreted as a measure of interpersonal relations, focussing on the
trustworthiness of e.g. e-vendors, institutions or website owners (see chapter 3.2.3.1). On the contrary, recent
research endeavours clearly indicate a catalytic role of technology trust in attitude formation towards adoption
decisions fraught with risk (Thatcher, et al., 2011). Accordingly, Lee et al. (2011, p. 228) could show that business
user's willingness to switch from offline to online service channels increased when they placed trust in the internet
technology itself. In line with this finding, Planing (2014, p. 124) exploratively identified trust in technology to be
a major motive for the acceptance of advanced driver-assistance systems. From a nomological viewpoint, in mar-
keting and management literature trust is commonly assumed to be a direct antecedent of both attitude and per-
ceived risk (Lankton, et al., 2015, p. 885).
To recap the above discussion, in this study trust in technology refers to the trust the consumer has in wearable
computing devices and services. Because multiple empirical studies were able to prove evidence that consumer’s
trust positively affects their willingness to engage in a risk-taking behaviour, the subsequent relationship is postu-
lated:
H3: Increased consumer’s perception of trust in wearable computing will result in an increase in the intention to
use a wearable computing device.
Since trust becomes intrinsically relevant in situations where people have incomplete control over the outcome, as
the level of trust increases consumers are likely to perceive less ambiguity and risk than if trust were absent (Kim,
et al., 2008, p. 547). Therefore, the effect of trust on consumer’s intention to use wearables is supposed to be
mediated by perceived security risks. Given this relationship and responding to the call for a ‘deepening’ of the
TAM in the sense of reconceptualising its core predictors and introducing new exogenous variables (Bagozzi,
2007, p. 244), the following mediation hypothesis is proposed:
H3a: The relationship between the level of trust towards wearable computing and the intention to use wearables is
mediated by perceived security risk.
Still, the above modified TAM framework does not account for the distinctive characteristics of the newly emerged
Information Systems class of pervasive computing. For this reason, further suitable exogenous variables should be
considered, so as to holistically explain the intention to employ pervasive or ubiquitous computing systems.
Karaiskos hence postulates in (2009) a novel pervasiveness construct specifically defined to meet the inherent
particularities of this new computing paradigm (see chapter 3.3.2). Thereby, pervasiveness is deemed to determine
exploratory variables in research models of technology acceptance (Karaiskos, 2009, p. 147 ff.; Koondhar, et al.,
2015, p. 101). Karaiskos stresses the relevance to augment existing theories from the technology acceptance stream
with the concept of pervasiveness. Ultimately, knowledge of the demand side in ubiquitous computing diffusion
follows from an understanding of the properties that define the pervasive nature of a given information system
(Karaiskos, 2009, p. 77).
104 Theory-driven development of the Wearable Technology Acceptance Model
Motivated by this theoretical and practical interest, this study also implements a pervasiveness perspective into the
cause-and-effect chain of the sought Wearable TAM. In this way it substitutes the original ease of use component.
The pervasiveness concept is regarded as being constituted by the trichotomy of perceived ubiquity, unob-
trusiveness and context awareness of a wearable technology, determining the consumer’s cognition-based beliefs
(i.e. perceived usefulness). Thus, the following two conditional sentences are proposed:
H4: Increased consumer’s perception of the pervasiveness of wearable computing devices will result in an increase
in the intention to use a wearable computing device.
H4a: The relationship between the level of consumer’s perception of the pervasiveness of wearable computing and
the intention to use wearables is mediated by perceived usefulness.
5.2 Augmenting the TAM with Personality Measures
In marketing literature, the consumer’s psychological predispositions are well-recognised as relevant drivers of
decision-making behaviour (Peter, 1979, p. 13; Allport, 1961, p. 179; Baumgartner, 2002, p. 286). Correspond-
ingly, by referring to the concept of innovativeness the expert interviews implicitly suggest that adopter’s personal
characteristics are of considerable importance for the individual duration of adoption (see chapter 3.1.1). In line
with this finding, Ajzen posits in (2005, p. 6) that personality factors describe response tendencies in a given
domain and are thus expected to find expression in individual behaviour patterns. Therefore, as personal
predispositions are assumed to play a ubiquitous role in human cognition, it is plausible to suppose that traits affect
at least partially Information Systems-related processes (Devaraj, et al., 2008, p. 94). Nonetheless, personality
variables have seldom been examined within the scope of acceptance research (Zhou & Lu, 2011, p. 545), which
is why the following sections address this issue.
5.2.1 Elemental Traits
In personality and social psychology, a plethora of personality traits has been identified and conceptualised from
various theoretical perspectives and at numerous abstraction levels (John & Srivastava, 1999, p. 102). Commonly,
personality is defined as “the dynamic organization within the individual of those psycho-physiological systems
that determine his characteristic behaviour and thought” (Allport, 1961, p. 28). For the purpose of the present
study, this definition is adopted.
Despite the conceptual diversity and scientific pluralism, personality psychologists have reached a consensus that
the personality structure in terms of endurable individual differences may most appropriately be portrayed by the
Big Five trait taxonomy, alternatively also referred to as Five Factor Model (FFM) of personality (McCrae &
Costa, 1997, p. 509; Moore & McElroy, 2012, p. 268). This descriptive model both comprehensively and parsi-
moniously reflects the most salient, psychometrically sound dimensions of personality along five bipolar trait
concepts in a common classification schema. These five domains of personality are considered to be inferable
from external, observable cues. Even though there is a persistent lack on agreement regarding the exact labels for
Theory-driven development of the Wearable Technology Acceptance Model 105
each dimension, the following terms are increasingly employed in personality psychology literature (Devaraj, et
al., 2008, p. 94; McElroy, et al., 2007, p. 811; Barrick, et al., 2001, p. 11):
• Extraversion – Introversion: This personality facet indicates the sociability and talkativeness of a per-
son. Extraverts intrinsically place a high value on interpersonal relationships.
• Agreeableness – Disagreeableness: This dimension semantically relates to prosocial attributes such as
trust and cooperativeness.
• Conscientiousness – Lack of Direction: Conscientious personalities are highly goal-directed,
disciplined and responsible-minded. Those high on conscientiousness feature a higher level of self-
control reflected in their need for achievement and order.
• Neuroticism – Emotional Stability: This trait relates to the internal emotional stability. Standard
attributes of this dimension include anxiety, moodiness and irritability. Highly neurotic individuals
tend to be emotionally reactive and distrustful.
• Openness to Experiences – Closedness to Experiences: Those who score high in openness tend to hold
unconventional values, are more curious and willing to explore new ideas and embrace novel
approaches.
According to Briggs (1992, p. 254), the five-factor classification schema enjoys a substantial lead over its primary
competitors describing the universe of trait terms. The scholar demarcates this well-substantiated and agreed-upon
framework for the structure of personality as “the model of choice for the researcher wanting to represent the
domain of personality variables broadly and systematically” (ibid.). Subsequent research found the FFM to be the
most useful taxonomy in personality research (Barrick, et al., 2001, p. 11). Considering this theoretical support, it
seems reasonable to seize this framework in the course of the present study as well.
Empirical research on the influence of personality in consumer behaviour contexts supports the effect of these
cardinal traits on behavioural intention. For example, Svendsen et al. (2013) proved a significant interrelationship
between the big five personality variables and the TAM beliefs, suggesting that dispositional correlates of the
willingness to use ICT exist. Accordingly, Moore and McElroy (2012) empirically showed that traits exert influ-
ence on Facebook usage patterns and content. By focussing on collaborative technologies, Devaraj and colleagues
(2008) incorporated the five-factor model into the TAM and where thereby able to enhance the predictive power
of the original Information Systems model.
Conceptually, in psychology literature the personality structure is understood as a hierarchical system of traits at
different levels of specificity (Costa & McCrae, 1995, p. 22; Baumgartner, 2002, p. 286). At the broadest level of
abstraction, groups of covarying elemental traits represent the most basic temporally and situationally invariant
predispositions including the big five personality traits (Gosling, et al., 2003, p. 506; Goldberg, 1999, p. 9). Each
factor subsumes several more concrete facets at a lower-order taxonomy, which in turn summarise a number of
even more specific traits. Whilst a general consensus has been achieved on the five psychological traits at the top
of the hierarchy, there is still an ongoing controversy about the lower-level subcomponents (Judge, et al., 2013, p.
875).

106 Theory-driven development of the Wearable Technology Acceptance Model
In an attempt to bridge the theoretical gap between overarching intrapsychic predispositions and more concrete
consumption-relevant traits in an integrative framework, Mowen (2000) propose a meta-theoretic model of moti-
vation and personality, namely the 3M model. This fully mediated model posits an ordered nomological net com-
posed of elemental, compound, situational, and surface traits. Elemental traits exist at the deepest level of person-
ality and include the big five dimensions, whereas compound traits such as the need for cognition emerge from
the interplay between elemental traits, culture, subculture and the individual socialisation history (Mowen, 2004,
p. 53 f.). Situational traits are defined as dispositions to express consistent patterns of behaviour which apply to
general situational contexts. Situational traits are closely related to the concept of involvement (Bosnjak, et al.,
2007, p. 599). Finally, surface traits at the most concrete hierarchical level possess strong conative and affective
properties. Resulting from the effects of elemental, compound, and situational dispositions, consumer’s surface
traits are highly predictive of behaviour and thus frequently associated with the concept of behavioural intention
(ibid.). Figure 5.2 exemplifies the 3M model.
Figure 5.2: Exemplified application of the 3M model
The specific role of personality variables in a technology acceptance context can be derived from the theoretical
basis of the TAM (Devaraj, et al., 2008 p. 95). The TRA as a source model of TAM considers traits to be external
variables which are completely mediated by endogenous variables. Personality-related constructs exert therefore
only an indirect influence on behavioural intention by affecting factors that are more closely linked to the target
variable (Ajzen, 1991 p. 181). From this it follows that the impact of broader general traits is strongly attenuated
by the presence of more immediate personality factors. Transferring this line of reasoning to the TAM, the 3M
framework may be integrated into Information Systems models by conceptualising the intention to use a system
as a highly context-specific disposition that serves as a connecting factor for hierarchically less specific traits.
Figure 5.3 illustrates the incorporation of the 3M model into an integrated technology acceptance model. The
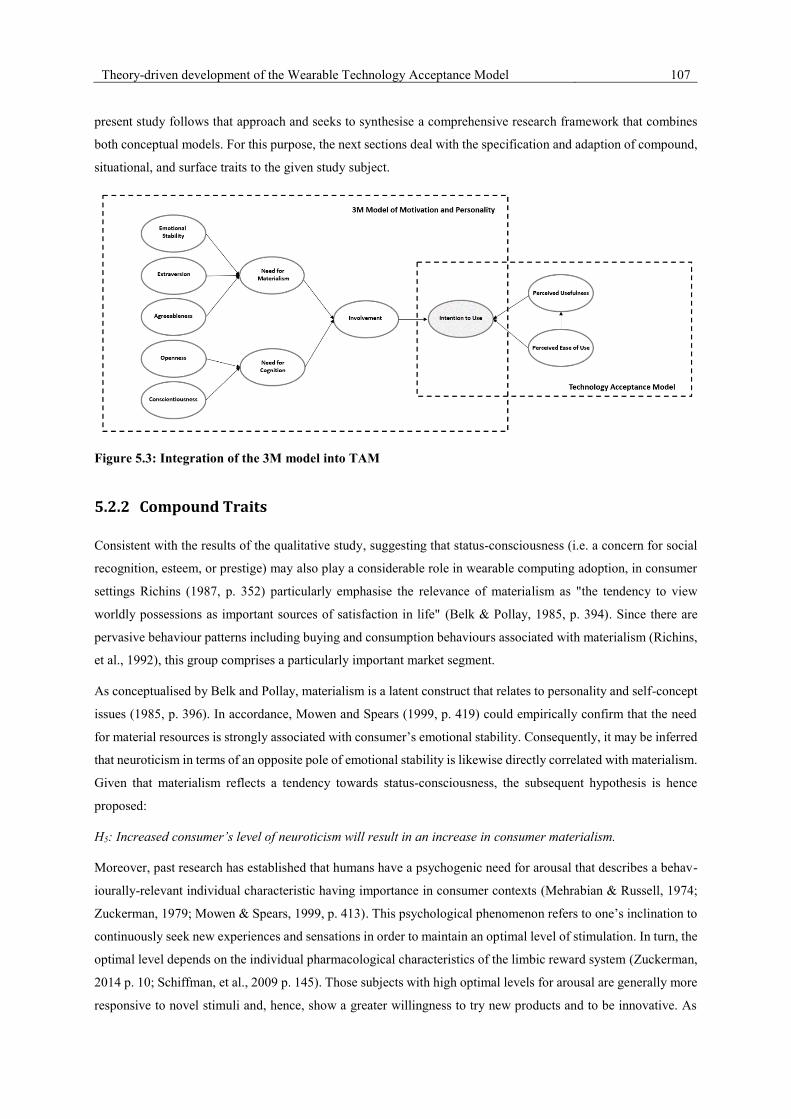
Theory-driven development of the Wearable Technology Acceptance Model 107
present study follows that approach and seeks to synthesise a comprehensive research framework that combines
both conceptual models. For this purpose, the next sections deal with the specification and adaption of compound,
situational, and surface traits to the given study subject.
Figure 5.3: Integration of the 3M model into TAM
5.2.2 Compound Traits
Consistent with the results of the qualitative study, suggesting that status-consciousness (i.e. a concern for social
recognition, esteem, or prestige) may also play a considerable role in wearable computing adoption, in consumer
settings Richins (1987, p. 352) particularly emphasise the relevance of materialism as "the tendency to view
worldly possessions as important sources of satisfaction in life" (Belk & Pollay, 1985, p. 394). Since there are
pervasive behaviour patterns including buying and consumption behaviours associated with materialism (Richins,
et al., 1992), this group comprises a particularly important market segment.
As conceptualised by Belk and Pollay, materialism is a latent construct that relates to personality and self-concept
issues (1985, p. 396). In accordance, Mowen and Spears (1999, p. 419) could empirically confirm that the need
for material resources is strongly associated with consumer’s emotional stability. Consequently, it may be inferred
that neuroticism in terms of an opposite pole of emotional stability is likewise directly correlated with materialism.
Given that materialism reflects a tendency towards status-consciousness, the subsequent hypothesis is hence
proposed:
H5: Increased consumer’s level of neuroticism will result in an increase in consumer materialism.
Moreover, past research has established that humans have a psychogenic need for arousal that describes a behav-
iourally-relevant individual characteristic having importance in consumer contexts (Mehrabian & Russell, 1974;
Zuckerman, 1979; Mowen & Spears, 1999, p. 413). This psychological phenomenon refers to one’s inclination to
continuously seek new experiences and sensations in order to maintain an optimal level of stimulation. In turn, the
optimal level depends on the individual pharmacological characteristics of the limbic reward system (Zuckerman,
2014 p. 10; Schiffman, et al., 2009 p. 145). Those subjects with high optimal levels for arousal are generally more
responsive to novel stimuli and, hence, show a greater willingness to try new products and to be innovative. As
108 Theory-driven development of the Wearable Technology Acceptance Model
the homeostatic need for activation empirically relates to particular configurations of behaviours, interests and
social roles, it is assumed that this personality trait is also reflected in information and media consumption patterns
(Donohew, et al., 1987, p. 256). Correspondingly, Donavan et al. (2005, p. 37) factor-analytically identified arousal
needs as important personality-related antecedents of sports fan behaviour. However, the need for activation has
empirically been found to be reflected among others by instrumental materialism in terms of an innate pursuit of
arousal (Richins & Dawson, 1992, p. 305). For the sake of explanatory efficiency of the proposed correlational
framework, the need for arousal has hence been substituted by the construct of consumer materialism.
In causal terms, by terminologically drawing upon Mowen’s 3M model, Bosnjak et al. (2007) conceptualised the
arousal construct as a compound trait that is directly affected by the agreeableness (in the sense of amiability and
community-orientation) of a person. They could empirically demonstrate a negative relationship between both
latent constructs (2007, p. 601). By analogy, it may be inferred that an interrelationship between the focal
exogenous FFM personality variable and materialistic values actually exists. This theoretical supposition has
already received strong experiential support in social research (Otero-López & Villardefrancos, 2013 p. 770).
Specifically, it was found that agreeableness has a great explanatory capability on materialism (ibid.). Therefore,
the following cause and effect chain is a priori proposed:
H6: Decreased consumer’s level of agreeableness will result in an increase in consumer materialism.
Furthermore, borrowing from information economics and cognitive costs theories, individual differences in need
for cognition appear as another promising personality factor (Cacioppo, et al., 1983, p. 806; Chatterjee, et al., 2005,
p. 1363). In this context, literature emphasises on the information asymmetry in endogenously uncertain markets
and the resulting search and evaluation costs incurred on consumer-side, which precede initial purchase decisions
(Wankhade & Dabade, 2010, p. 10). Vendees have to employ time- and money-consuming information acquisition
activities for the sake of a reduction of product uncertainty. This theorisation suggests that the willingness to adopt
innovations may covary with the behavioural disposition to engage in effortful thinking as a motivational ante-
cedent of information search efforts (Verplanken, et al., 1992, p. 130).
Subjects with higher values on need for cognition have a chronic tendency to spontaneously engage in cognitively
demanding activities and are more inclined to apply deeper information processing strategies (Petty & Cacioppo,
1986, p. 674). As in the case for other emotional and cognitive personality-related factors, this psychological phe-
nomenon has important managerial implications for designing convincing marketing communication policies. For
instance, the persuasive power of a product’s quality indicators (i.e. quality signals in terms of decision simplifying
heuristics such as warranties and certifications) significantly varies depending upon the consumers’ need for
cognition (Chatterjee, et al., 2002, p. 228). Consumers high in cognition needs are likely to spend more time
searching and processing product-related, factual information, whereas those relatively low in need for cognition
tend to be more attracted by peripheral cues of a message.
In empirical terms, research on consumers’ on-line shopping intention supports the presumed causal relationship
between need for cognition and attitude formation. Bosnjak et al. (2007) identify this construct as a strong driver
of consumer adoption of the internet in terms of a product purchase channel. In accordance with this finding,
Mowen understands this cognitive style construct as a precursor of certain situational traits such as value
consciousness. He deems this variable to be closely related to the elemental trait of openness to experience (2000,
Theory-driven development of the Wearable Technology Acceptance Model 109
p. 72). Further, in line with previous research (e.g. Tuten and Bosnjak, 2001, p. 395), Fleischhauer et al. (2010, p.
12) observed need for cognition to be positively correlated with openness, extraversion, and conscientiousness.
Under the assumption that the need for cognition may exist at the compound trait level, the subsequent three
hypotheses can be formulated:
H7: Increased consumer’s level of openness to experience will result in an increase in the need for cognition.
H8: Increased consumer’s level of extraversion will result in an increase in the need for cognition.
H9: Increased consumer’s level of conscientiousness will result in an increase in the need for cognition.
5.2.3 Situational and Surface Traits
In compliance with the correspondence principle (see chapter 3.1.2.1), empirical research findings suggest that the
specificity of overt action must meet the specificity of the independent trait construct, which leads to consistent
attitudinal and behavioural patterns within narrower contexts (e.g. Dash et al. (1976) and Schaninger (1976)).
Therefore, after having defined the global personality domains in terms of the ‘big five’ at the deepest, most
abstract hierarchical level of consumer personality as well as the more specific compound traits (need for
materialism and need for cognition) formed by the underlying elemental traits, adequate, more consumption-
related predispositions should be specified.
Among the situational trait level of the 3M framework, the involvement concept has repeatedly been included in
Information Systems and consumer behaviour literature. Generally, involvement is broadly defined as perceived
personal relevance of a stimulus or situation. This causal or motivational variable explains different phenomena
of purchasing behaviour, especially the intensity of the internal information processing and information search
behaviour, the nature of the exogenous communication impact (emotional or cognitive), and, consequently, the
individual attitude formation (Laurent & Kapferer, 1985, p. 42; Petty, et al., 1983, p. 137). According to Mitchell’s
frequently adopted terminology, involvement represents an “[…] internal state variable that indicates the amount
of arousal, interest or drive evoked by a particular stimulus or situation” (1979, p. 194). In marketing theory, this
construct is considered an individual difference variable with various consequences on consumer’s purchase and
communication behaviour (Laurent & Kapferer, 1985, p. 42).
With reference to their implicit temporal patterns, the antecedents preceding involvement are supposed to catego-
rise this concept into a person, a stimulus factor (i.e. product), as well as a situation-related construct type
(Zaichkowsky, 1986, p. 5; Bloch & Richins, 1983, p. 70). Whilst the first two categories are relatively independent
from time and thus refer to an enduring involvement (i.e. a general and permanent concern), situational involve-
ment marks a temporary amplification of product importance perceptions, typically within the time frame of a
purchase decision (Havitz & Howard, 1995, p. 256). As the present research work primarily focuses on general
acceptance of a new computing paradigm, transient situational elements of involvement such as cost features or
the surrounding environment has not been taken into account in this study. Rather, considering that the subject of
investigation references a novel Information Systems class, an enduring involvement at product class level
becomes foregrounded. Accordingly, previous research in the Information Systems field has already
acknowledged that a high degree of involvement with the product class correlates with a greater use of mobile

110 Theory-driven development of the Wearable Technology Acceptance Model
services (Malik, et al., 2013, p. 111). It must be noticed here, that even though product characteristics play an
important role, product involvement and, correspondingly, product class involvement varies systematically across
individual consumers (Gu, et al., 2012, p. 183).
Furthermore, there is a long tradition in consumer behaviour literature to distinguish between cognitive and affec-
tive or ego involvement (Park & Young, 1983, p. 320; Swaminathan, et al., 1996, p. 52). Affective involvement,
on the one hand, relates to the nexus between the attitude object and the domain of one’s ego. It is evoked by a
more value‐expressive motive, stressing the individual’s feelings and arousal (Zaichkowsky, 1994, p. 60). Corre-
spondingly, the qualitative study results suggest that emotional and hedonistic motives, which are associated with
affective involvement in literature (Putrevu, et al., 1994 p. 79), intrinsically determine the behavioural intent to
use an information system. Cognitive or issue involvement, on the other hand, relates to the extent to which an
attitude object may have important consequences for consumers, stressing the individual’s informational pro-
cessing activities evoked by more utilitarian motives. This dichotomy of involvement is usually justified by a
hemispheric lateralization explanation. According to this perspective, cognitive involvement induces intense
processing of factual information by the left brain, whereas affective involvement is characterised by right-brain
processing of symbolic or hedonic quality dimensions (Mittal, 1987 p. 42; Putrevu, et al., 1994 p. 79).
Consequently, communication strategies should emphasis either on a product’s functional attributes or rather
appeal emotional motivations (Kim, et al., 2008, p. 39).
Given the valuable managerial implications derivable from each facet of involvement, affective and cognitive
correlates of commitment behaviour should be considered individually in the context of wearable technology ac-
ceptance. However, empirical evidence has shown that the affective dimension is the sole facet of involvement
that significantly predicts online buying intentions (Bosnjak, et al., 2007 p. 602). Moreover, considering that
cognitive involvement resembles situational involvement and may raise empirical concerns in regard to its
potential collinearity with the cognitive component of attitude (Huang, 2009 p. 97), this thesis approaches affective
involvement. In an e-commerce context, Wang et al. (2006, p. 1366) have empirically demonstrated that
consumers' cognitive style and involvement level significantly interact with each other and directly affect the
consumers' decision-making. Correspondingly, according to recent studies, at compound trait level affective
involvement is determined by both the level of consumer materialism and need for cognition (Bosnjak, et al., 2007
p. 603). Hence, the subsequent both hypotheses are derived:
H10: Increased consumer’s level of materialism will result in an increase in affective involvement.
H11: Increased consumer’s need for cognition will result in an increase in affective involvement.
Finally, at surface trait level the hierarchical model should integrate more specific, consumption-related constructs
as stated before. Therefore, in the context of wearable computing acceptance the behavioural intention towards the
adoption and utilisation of respective technologies should be focused. In accordance with this, previous research
has related affective involvement with the intention to shop online (Bosnjak, et al., 2007 p. 602). Recalling that in
the frame of this study behavioural intention is understood as proximate predictor of future wearable technologies
usage, the following hypothesis is thus derived:
Theory-driven development of the Wearable Technology Acceptance Model 111
H12: Increased consumer’s affective involvement will result in an increase in the intention to use a wearable
computing device.
5.3 Moderating Variables
Depending upon the heterogeneity of a study population, the defined causal relationships might lead to divergent
results, i.e. the strength of the relationship between two study constructs can hinge on the value of an interacting
third variable (Hair, et al., 2016 p. 243). In this context, moderating variables can provide valuable insights since
they allow for a differentiated analysis of cause-and-effect chains (Frazier, et al., 2004, p. 116). Such segmentation
variables influence the strength (and potentially even the direction) of the causal relationship between a predictor
of interest and its criterion variable, without necessarily being explainable by the given structural model. Thus, the
integration of moderating variables may provide clues as to under what conditions the explained variation of
behavioural intent increases. Within the scope of the present research, especially moderating effects on intention
formation as focal behavioural response are of particular relevance. Besides sociodemographic factors such as age,
gender, and education background, psychographic variables can generally be applied (Baron, et al., 1986 p. 1174).
In a technology adoption context, particularly adopter-specific characteristics appear to be more revealing
contextual factors. Therefore, two moderating variables which were alluded to in the exploratory study and which
are of special significance to the proposed correlative framework are discussed in the following.
In innovation research, the individual difference variable of innovativeness proclaimed by Rogers has variously
proved to be of vital importance (Rogers, 2010 p. 268; Steffens, et al., 1992 p. 12). It describes the individual rate
of adoption and serves therefore as a segmentation variable that dichotomises a given consumer population into
innovators and imitators (or non-innovators) who each possesses different response characteristics to innovations.
This is in line with the expert interview results, which clearly suggest that personal innovativeness strongly influ-
ences the attitude formation towards wearables. Yet, it is important to note that in marketing and innovation liter-
ature a conceptual distinction is commonly drawn between general and domain-specific innovativeness (Varma
Citrin, et al., 2000, p. 295). For instance, a vendee’s propensity to innovate in the market for consumer electronics
does not indicate anything about his or her pioneering behaviour towards arts or fashion. It is clear from this that
an innate global innovativeness has only poor predictive power if applied to specific areas of decision-making.
Moreover, a general willingness to change is hypothesised to be possessed, to a greater or lesser extent, by all
individuals (Hirschman, 1980, p. 284). Otherwise, consumer behaviour would comprise a series of strongly
routinized buying responses to a static set of products. Therefrom, in the further course of this dissertation inno-
vativeness is understood as a product category-related measure.
Agarwal and Prasad claim that personal innovativeness in the domain of Information Technology acts as a key
moderator variable on the dependency structures of the intention to adopt any new IT system (1998, p. 206). The
innovation scholars point out that this trait induces relatively pronounced risk preferences as a moderator of the
consequences of perceptions (ibid.). It thus follows that two individuals showing the same level of utility percep-
tion may exhibit different conative reactions insofar their propensity to innovate diverges. In conformity with the
significant empirical findings in prior studies, the following both moderating effects are posited:

112 Theory-driven development of the Wearable Technology Acceptance Model
HM1: The relationship between the perceived usefulness of wearable computing and the behavioural intention to
adopt is positively moderated by the product category-related innovativeness.
HM2: The relationship between the perceived security risk of wearable computing and the behavioural intention to
adopt is negatively moderated by the product category-related innovativeness.
Beyond this, from the exploratory study the personal experience comes as a further potential moderating variable
more to the fore. It became apparent that individuals who have had more prior experiences with wearable
computing tend to give a more positive evaluation of wearables. Accordingly, past empirical research provides
evidence that the impact of the antecedents of IT usage intention changes with end-users’ level of experience
(Gefen, et al., 2003b p. 307; Venkatesh, et al., 2003 p. 442). Hence, as users get familiar with an information
system and learn more of its capabilities, they become more confident towards the focal technology.
Scholars in the field argue that the increased acquaintance with an IT system enhances the user’s understanding of
the interface and potential benefits from the system become more obvious (Rahman, et al., 2011, p. 271). Moreo-
ver, experience-based beliefs are assumed to be more readily accessible in memory, what results in a stronger
attitude-behaviour-nexus (Gefen, et al., 2003b, p. 310). Thus, theory suggests that the correlation between utility
perceptions and conative behaviour would be stronger for experienced users than for novices. In technology ac-
ceptance literature, the concept of experience is delimited in terms of either the frequency of prior usage or the
general familiarity with a target system in terms of the level of general product knowledge (Castañeda, et al., 2007
p. 386; Planing, 2014 p. 153). As wearable computers are still in their infancy, the latter definition will be employed
during the further work.
In light of the above evidence implying that product familiarity has an impact on the relative importance of
attitudinal components, the correlative framework developed so far should be refined based on the extent of end-
users’ experience. Thus, the next both moderation hypothesises are formulised:
HM3: The relationship between the perceived usefulness of wearable computing and the behavioural intention to
adopt is positively moderated by the level of personal experience.
HM4: The relationship between the perception of the security risk of wearable computing and the behavioural
intention to adopt is negatively moderated by the level of personal experience.
Figure 5.4 illustrates the moderated relationships inherent to the formulated research model.
Figure 5.4: Hypothesised moderated relationships
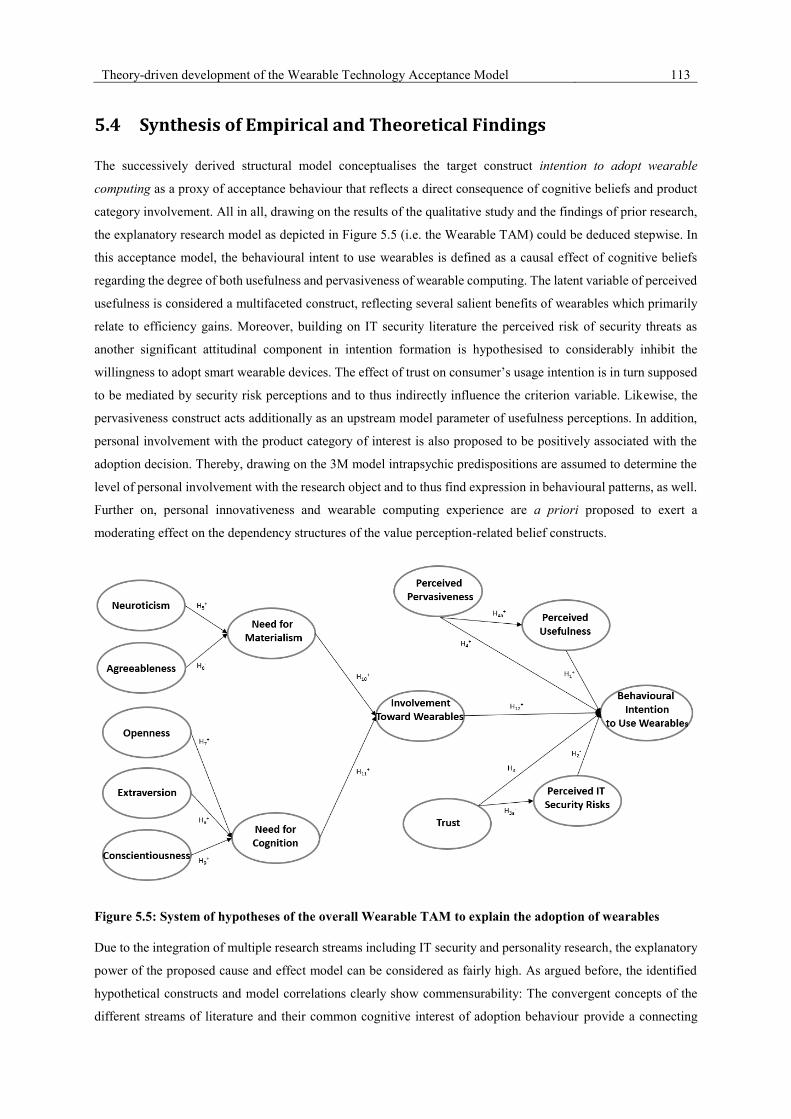
Theory-driven development of the Wearable Technology Acceptance Model 113
5.4 Synthesis of Empirical and Theoretical Findings
The successively derived structural model conceptualises the target construct intention to adopt wearable
computing as a proxy of acceptance behaviour that reflects a direct consequence of cognitive beliefs and product
category involvement. All in all, drawing on the results of the qualitative study and the findings of prior research,
the explanatory research model as depicted in Figure 5.5 (i.e. the Wearable TAM) could be deduced stepwise. In
this acceptance model, the behavioural intent to use wearables is defined as a causal effect of cognitive beliefs
regarding the degree of both usefulness and pervasiveness of wearable computing. The latent variable of perceived
usefulness is considered a multifaceted construct, reflecting several salient benefits of wearables which primarily
relate to efficiency gains. Moreover, building on IT security literature the perceived risk of security threats as
another significant attitudinal component in intention formation is hypothesised to considerably inhibit the
willingness to adopt smart wearable devices. The effect of trust on consumer’s usage intention is in turn supposed
to be mediated by security risk perceptions and to thus indirectly influence the criterion variable. Likewise, the
pervasiveness construct acts additionally as an upstream model parameter of usefulness perceptions. In addition,
personal involvement with the product category of interest is also proposed to be positively associated with the
adoption decision. Thereby, drawing on the 3M model intrapsychic predispositions are assumed to determine the
level of personal involvement with the research object and to thus find expression in behavioural patterns, as well.
Further on, personal innovativeness and wearable computing experience are a priori proposed to exert a
moderating effect on the dependency structures of the value perception-related belief constructs.
Figure 5.5: System of hypotheses of the overall Wearable TAM to explain the adoption of wearables
Due to the integration of multiple research streams including IT security and personality research, the explanatory
power of the proposed cause and effect model can be considered as fairly high. As argued before, the identified
hypothetical constructs and model correlations clearly show commensurability: The convergent concepts of the
different streams of literature and their common cognitive interest of adoption behaviour provide a connecting

114 Theory-driven development of the Wearable Technology Acceptance Model
factor in the sense of complementary theoretical explanations. Each research perspective focusses on different
behavioural aspects of the same knowledge object. This integrative approach increases the specificity of the
generic source model, so that a higher significance of the hypothesised causal relationships may be attained. For
validation purposes, a combined analysis of the qualitative study results and the findings from literature research
was performed. All formulated research hypotheses are summarised in Table 5.1.
LABEL HYPOTHESIS
H1 Increased consumer’s perception of the usefulness of wearable computing will result in an
increase in the intention to use a wearable computing device.
H2 Decreased consumer’s perception of the security risk of wearable computing will result in an
increase in the intention to use a wearable computing device.
H3 Increased consumer’s perception of trust in wearable computing will result in an increase in the
intention to use a wearable computing device.
H3A The relationship between the level of trust towards wearable computing and the intention to use
wearables is mediated by perceived security risk.
H4 Increased consumer’s perception of the pervasiveness of wearable computing devices will result
in an increase in the intention to use a wearable computing device.
H4A The relationship between the level of consumer’s perception of the pervasiveness of wearable
computing and the intention to use wearables is mediated by perceived usefulness.
H5 Increased consumer’s level of neuroticism will result in an increase in consumer materialism.
H6 Decreased consumer’s level of agreeableness will result in an increase in consumer materialism.
H7 Increased consumer’s level of openness to experience will result in an increase in the need for
cognition.
H8 Increased consumer’s level of extraversion will result in an increase in the need for cognition.
H9 Increased consumer’s level of conscientiousness will result in an increase in the need for
cognition.
H10 Increased consumer’s level of materialism will result in an increase in affective involvement.
H11 Increased consumer’s need for cognition will result in an increase in affective involvement.
H12 Increased consumer’s affective involvement will result in an increase in the intention to use a
wearable computing device.
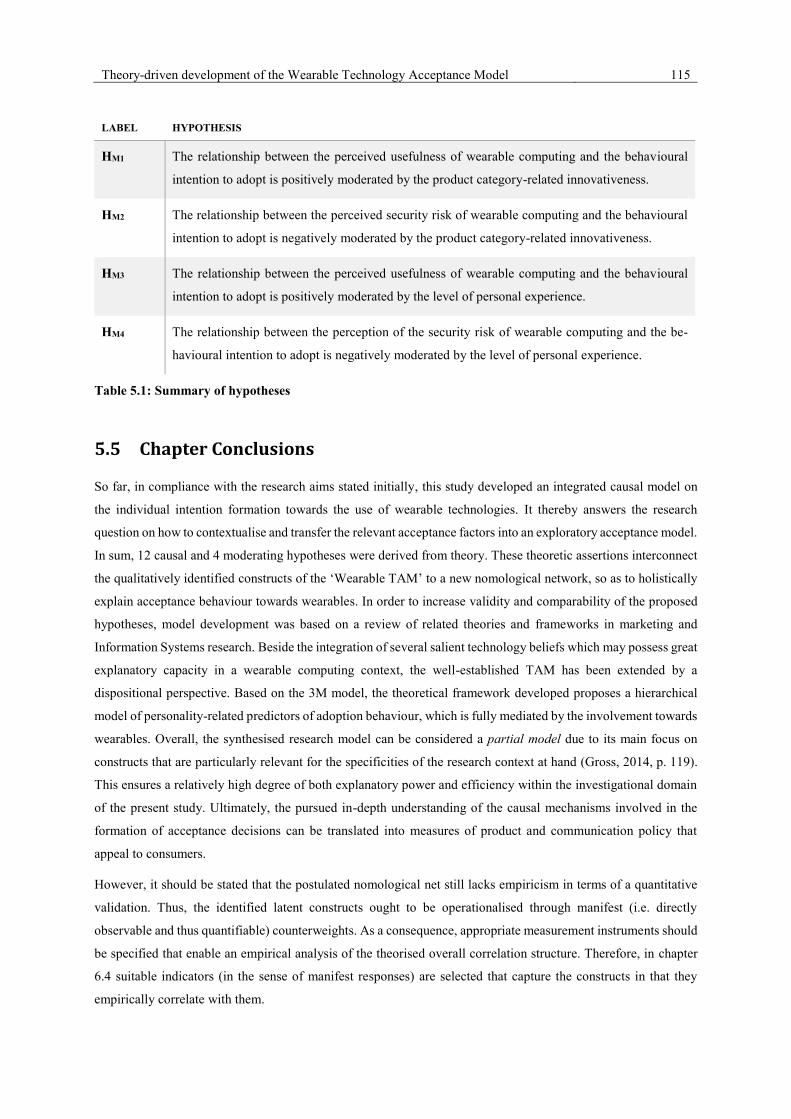
Theory-driven development of the Wearable Technology Acceptance Model 115
LABEL HYPOTHESIS
HM1 The relationship between the perceived usefulness of wearable computing and the behavioural
intention to adopt is positively moderated by the product category-related innovativeness.
HM2 The relationship between the perceived security risk of wearable computing and the behavioural
intention to adopt is negatively moderated by the product category-related innovativeness.
HM3 The relationship between the perceived usefulness of wearable computing and the behavioural
intention to adopt is positively moderated by the level of personal experience.
HM4 The relationship between the perception of the security risk of wearable computing and the be-
havioural intention to adopt is negatively moderated by the level of personal experience.
Table 5.1: Summary of hypotheses
5.5 Chapter Conclusions
So far, in compliance with the research aims stated initially, this study developed an integrated causal model on
the individual intention formation towards the use of wearable technologies. It thereby answers the research
question on how to contextualise and transfer the relevant acceptance factors into an exploratory acceptance model.
In sum, 12 causal and 4 moderating hypotheses were derived from theory. These theoretic assertions interconnect
the qualitatively identified constructs of the ‘Wearable TAM’ to a new nomological network, so as to holistically
explain acceptance behaviour towards wearables. In order to increase validity and comparability of the proposed
hypotheses, model development was based on a review of related theories and frameworks in marketing and
Information Systems research. Beside the integration of several salient technology beliefs which may possess great
explanatory capacity in a wearable computing context, the well-established TAM has been extended by a
dispositional perspective. Based on the 3M model, the theoretical framework developed proposes a hierarchical
model of personality-related predictors of adoption behaviour, which is fully mediated by the involvement towards
wearables. Overall, the synthesised research model can be considered a partial model due to its main focus on
constructs that are particularly relevant for the specificities of the research context at hand (Gross, 2014, p. 119).
This ensures a relatively high degree of both explanatory power and efficiency within the investigational domain
of the present study. Ultimately, the pursued in-depth understanding of the causal mechanisms involved in the
formation of acceptance decisions can be translated into measures of product and communication policy that
appeal to consumers.
However, it should be stated that the postulated nomological net still lacks empiricism in terms of a quantitative
validation. Thus, the identified latent constructs ought to be operationalised through manifest (i.e. directly
observable and thus quantifiable) counterweights. As a consequence, appropriate measurement instruments should
be specified that enable an empirical analysis of the theorised overall correlation structure. Therefore, in chapter
6.4 suitable indicators (in the sense of manifest responses) are selected that capture the constructs in that they
empirically correlate with them.

116 Quantitative Approach
6 Quantitative Approach
What we observe is not nature itself, but nature
exposed to our method of questioning.
Werner Heisenberg
This chapter outlines the quantitative study of present research. At first, the employed research design is discussed,
which includes also a detailed examination of the chosen data analysis technique. Next, measurement instruments
are developed in order to operationalise the formulated hypotheses and to establish a basis for questionnaire
development.
6.1 Quantitative Research Methodology
Since every research design is implicitly shaped by a philosophical worldview (i.e. epistemological and ontological
paradigm), it is important to state clearly which school of thought is taken for the purpose of a given research
project. It should also be clarified at which points this worldview interacts with the practice of research in terms
of a guiding paradigmatic underpinning (Creswell, 2013, p. 6). As the present research is approached through the
philosophical lenses of the post-positivist tradition (see chapter 4.1), it is assumed that scientific theories can never
be proven true conclusively and thus remain tentative in nature (Popper, 1959, p. 280). According to the principle
of falsifiability, hypotheses can only be provisionally accepted if they withstand continuous attempts to falsify
them (Scotland, 2012, p. 10). Thus, evaluating the truth-value of hypotheses becomes epistemologically a
deductive procedure that focusses on the refutation of the pertaining null hypotheses per empirical evidence of a
nonzero difference or correlation of the variables that comprise the research questions (DeLuca, et al., 2008, p.
57). The post-positivist stance therefore challenges the traditional positivistic notion of a total verification of
hypotheses. Post-positivism rather seeks corroboration or gradual empirical support for scientific claims by
quantitatively testing theoretical propositions in larger, well-defined social contexts. Since this worldview reflects
a deterministic philosophy in which reductively deducible causes probably determine specific outcomes (Creswell,
2013, p. 7), scientific research should be directed towards the nomothetic (i.e. general, lawful) goal of developing
explanans (i.e. testable hypotheses) that are reliable and both internally and externally valid to the greatest possible
extent within a specified domain (Amaratunga, et al., 2002, p. 22; Daly, 2007, p. 31; Harris, 2012, p. 32).
Post-positivism contends that the sustained success of a scientific proposition “gives us reason to believe that
‘something like’ the entities contained in the theories actually exist” (Hunt, 1990, p. 10). As opposed to strict
falsificationsim, the post-positivism ontology motivates modesty regarding falsification and verification alike
(Miller & Tsang, 2011, p. 140). In this sense, Carnap (1945, p. 531) refers to the metrical concept of the degree of
confirmation, whereby the binary logic of a theory to be either ‘true’ or ‘false’ is superseded by a multivalued
logic adhering to a continuous scale of probability. In other words, judgments concerning theoretical proposition
are not passed on the bipolar predicate ‘false-true’, but rather on a unipolar ‘false-not false’ spectrum accounting
for the probabilistic nature of claims. In the case of several competing theories, Bhaskar, who originally developed
Quantitative Approach 117
the post-positivists’ ontological domain of critical realism, recommends to prefer those scientific propositions that
possess the greatest explanatory power (1989, p.73). Complementarily, Lakatos (1970, p. 178) provides the
characteristic simplicity as a normative criterion for determining the adequacy of a theory. As stated before, the
Wearable TAM accordingly links multiple streams of literature to arrive at an explanatory efficient and
simultaneously powerful system of hypotheses in a wearable computing adoption context.
Summarising the above, the post-positivist philosophy stretches the percept of positivism by replacing absolute
certainty and objectivity with the tentativeness of falsifiable knowledge and inter-subjectivity (Daly, 2007, p. 30;
Riazi, 2016, p. 243; Plack, 2005, p. 227). In order to reduce inherent biases of any methodological technique, the
focal belief system suggests to converge upon conceivable objective truths by employing critical multiplicism or
triangulation in its most comprehensive sense (Plack, 2005, p. 227). Thus, given that total objectivity may never
be attained entirely, researchers should triangulate across multiple methodologies and sources of information
(Guba & Lincoln, 1994, p. 110; Planing, 2014, p. 83; see also chapter 4.1.1). Conforming to this central tenet of
post-positivism the quantitative study employs a confirmatory approach that is built upon the findings of the
conceptual and qualitative study applied so far.
Furthermore, conceding that human knowledge is always imperfect and fallible, the pursuit of rigor and control in
research design foregrounds as a prime value for post-positivists to explain social realities (Daly, 2007). Hence,
knowledge acquisition is centred on a search for neutrality, care in theorising and critical reflections upon empirical
results. In order to achieve this objectives, a scientific method (i.e. a set of standardised techniques for acquiring
scientific knowledge) has to be used throughout the validation of a proposed conceptual framework to meet the
four essential empirical criteria (Bhattacherjee, 2012, p. 5): replicability (a study should be independently
replicable), precision (theoretical concepts should be measurable), falsifiability (theories can be evaluated and
disproven), and parsimony (the most parsimonious theories has to be favoured). The confirmatory study should
thus rely on a scientific research process including (Bhattacherjee, 2012, p. 20):
• A representative sample of the target population
• A valid operationalisation of the identified abstract hypothetical constructs including clear definitions of
the concepts at both abstract (conceptual) and empirical levels.
• Appropriate statistical methods for comprehensively analysing the empirical results.
On that account, by taking a quantitative approach the validation phase of this thesis was conducted through a
multi-stage process of appropriate construct operationalisation, sampling, and analysis. In advance of the
development of suitable measurement instruments, the following subsection gives considerations on how the
conceptualised behavioural model on wearable technology acceptance can be evaluated empirically using a
scientific method. Afterwards, particular focus is put on scale construction and subsequently on available methods
for data collection and data analysis.
6.2 Multivariate Data Analysis Methodology
Generally, theoretical associations ought to be transferred into a set of structural relationships, so as to formalise
the proposed theoretical model and to allow for empirical evaluation of propositions (Hair, et al., 2017 p. 6). Hence,
118 Quantitative Approach
this chapter is guided by the central research question on how the generated system of hypotheses should be
formally explicated and how the proposed framework should be tested for its quality. After a comprehensive
introduction and justification of the chosen data analysis technique, the main quality criteria for empirically
assessing the propositions are thus presented in this subchapter.
6.2.1 Structural Equation Modeling
As the hypothesised research model consists of several interdependent variables, which simultaneously serve as
both predictor and criterion variables (i.e. intervening variables), traditional multiple regression approaches fall
too short (Hair, et al., 2010, p. 708). Further requirements arise from the theoretical nature of the incorporated
latent variables, i.e. the a priori conceptualised constructs have to be operationalised by means of corresponding
measurement models in order to become empirically accessible. In addition, considering the basic assumption in
psychometric theory, the analysis should account for error terms that are inherent in all measurement (Hair, et al.,
2016). Thus, in order to be capable of validating the proposed complex dependency structures adequately against
empirical data (i.e. to perform a confirmatory analysis), structural equation modeling (SEM) appears to be a
promising multivariate technique. The concept of SEM refers to a second-generation family of multivariate
statistical methods that seeks to estimate interrelated dependence relationships among multiple theoretical
constructs (Hair, et al., 2010, p. 708). SEM-based methods go beyond first-generation regression-based techniques
(e.g. principal component analysis, discriminant analysis, etc.) in that they combine multiple regression and factor
analytic models. Consequently, this hybrid coupling of both traditional econometric and psychometric perspectives
enables researchers to systematically conduct path analytic modelling with multiple layers of latent constructs at
once (Chin, 1998a, p. 295; Gefen, et al., 2000, p. 3 f.).
From a methodological view, SEM techniques express the structure of predictive or causal interrelationships of a
theory in a series of separate, but interdependent, multiple regression-like structural equations (Hair, et al., 2010,
p. 709). Therefore, SEM-based path models can also be referred to as multi-equation systems. Typically, structural
path modelling incorporates two major submodels: the structural model (also termed the inner model), which
depicts the system of hypotheses that interrelates the latent variables, and the measurement model (i.e. outer
model), which accounts for the relationships between the latent variables and their measures (Haenlein & Kaplan,
2004, p. 286). This distinction mirrors the two-language-theory by Carnap (1966), who distinguishes between a
theoretical language (i.e. level of hypothesised theoretical constructs) and an empirical level that reflects the level
of observable or quantifiable measurement variables.
Notably, since correlation does not necessarily imply causation, SEM analysis results can never provide conclusive
evidence for causation (see also the influential work on path analysis by Wright, 1921). Exogenous variables
cannot be controlled experimentally in SEM research, what might give rise to spurious correlations due to
multicollinearity effects between the predictor constructs and possible confounding third variables (Hair, et al.,
2010, p. 717). Assuming an underlying mechanism that leads to a theoretical covariance structure essentially
captured by the sought model, the parameters estimated by SEM suggest primarily inference relationships between
the hypothesised constructs and, thereby, provide merely cues to causal relationships (Iriondo, et al., 2003 p. 368;
Schumacker, et al., 2009 p. 48). Consequently, empirical correlation between latent factors serves in terms of a
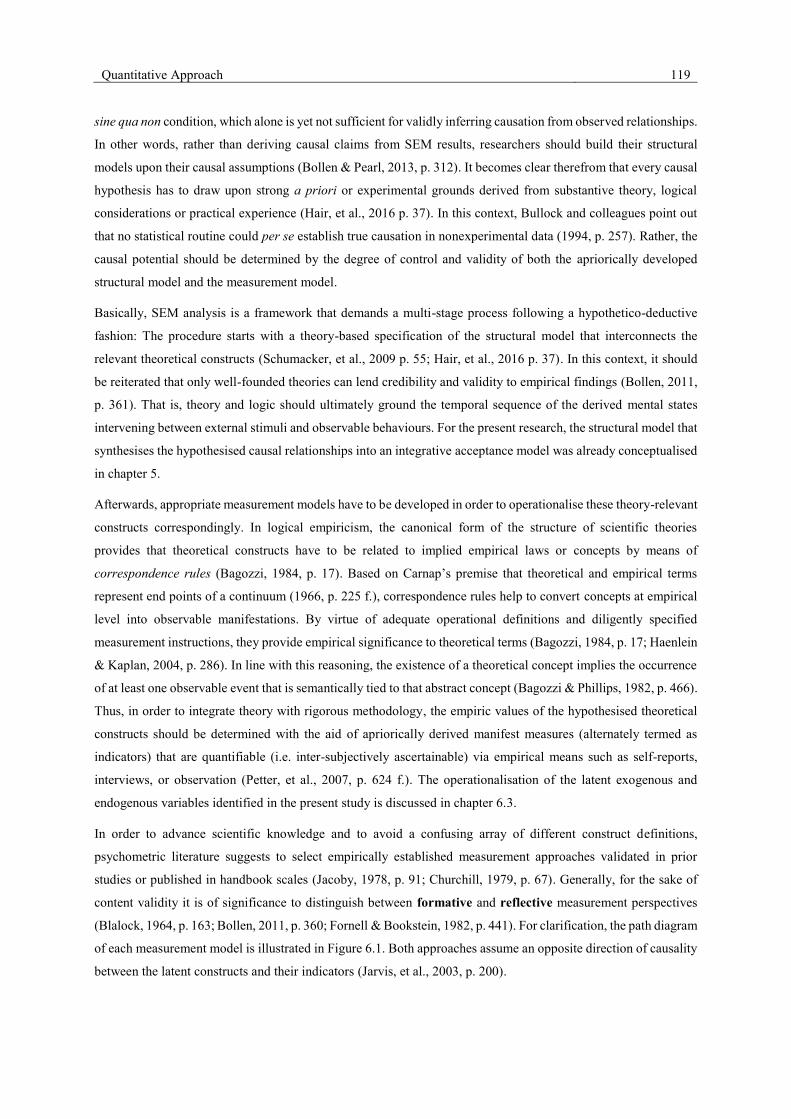
Quantitative Approach 119
sine qua non condition, which alone is yet not sufficient for validly inferring causation from observed relationships.
In other words, rather than deriving causal claims from SEM results, researchers should build their structural
models upon their causal assumptions (Bollen & Pearl, 2013, p. 312). It becomes clear therefrom that every causal
hypothesis has to draw upon strong a priori or experimental grounds derived from substantive theory, logical
considerations or practical experience (Hair, et al., 2016 p. 37). In this context, Bullock and colleagues point out
that no statistical routine could per se establish true causation in nonexperimental data (1994, p. 257). Rather, the
causal potential should be determined by the degree of control and validity of both the apriorically developed
structural model and the measurement model.
Basically, SEM analysis is a framework that demands a multi-stage process following a hypothetico-deductive
fashion: The procedure starts with a theory-based specification of the structural model that interconnects the
relevant theoretical constructs (Schumacker, et al., 2009 p. 55; Hair, et al., 2016 p. 37). In this context, it should
be reiterated that only well-founded theories can lend credibility and validity to empirical findings (Bollen, 2011,
p. 361). That is, theory and logic should ultimately ground the temporal sequence of the derived mental states
intervening between external stimuli and observable behaviours. For the present research, the structural model that
synthesises the hypothesised causal relationships into an integrative acceptance model was already conceptualised
in chapter 5.
Afterwards, appropriate measurement models have to be developed in order to operationalise these theory-relevant
constructs correspondingly. In logical empiricism, the canonical form of the structure of scientific theories
provides that theoretical constructs have to be related to implied empirical laws or concepts by means of
correspondence rules (Bagozzi, 1984, p. 17). Based on Carnap’s premise that theoretical and empirical terms
represent end points of a continuum (1966, p. 225 f.), correspondence rules help to convert concepts at empirical
level into observable manifestations. By virtue of adequate operational definitions and diligently specified
measurement instructions, they provide empirical significance to theoretical terms (Bagozzi, 1984, p. 17; Haenlein
& Kaplan, 2004, p. 286). In line with this reasoning, the existence of a theoretical concept implies the occurrence
of at least one observable event that is semantically tied to that abstract concept (Bagozzi & Phillips, 1982, p. 466).
Thus, in order to integrate theory with rigorous methodology, the empiric values of the hypothesised theoretical
constructs should be determined with the aid of apriorically derived manifest measures (alternately termed as
indicators) that are quantifiable (i.e. inter-subjectively ascertainable) via empirical means such as self-reports,
interviews, or observation (Petter, et al., 2007, p. 624 f.). The operationalisation of the latent exogenous and
endogenous variables identified in the present study is discussed in chapter 6.3.
In order to advance scientific knowledge and to avoid a confusing array of different construct definitions,
psychometric literature suggests to select empirically established measurement approaches validated in prior
studies or published in handbook scales (Jacoby, 1978, p. 91; Churchill, 1979, p. 67). Generally, for the sake of
content validity it is of significance to distinguish between formative and reflective measurement perspectives
(Blalock, 1964, p. 163; Bollen, 2011, p. 360; Fornell & Bookstein, 1982, p. 441). For clarification, the path diagram
of each measurement model is illustrated in Figure 6.1. Both approaches assume an opposite direction of causality
between the latent constructs and their indicators (Jarvis, et al., 2003, p. 200).

120 Quantitative Approach
Following a regression analytical approach, the formative perspective interprets indicators as distinct causes of
their underlying composite construct. Formative or composite indicators jointly define the domain of content that
constitutes the focal construct. Therefore, they do not have to be intercorrelated by necessity as would be the case
if they were conceptually interwoven (Diamantopoulos & Siguaw, 2006, p. 267). Accordingly, in measurement
literature the operationalisation of linear composite variables is commonly also referred to as index construction,
where the battery of indicators fully produces its respective index or construct with an R2-value of ideally 1.0
(Diamantopoulos, et al., 2001 p. 271). Based on the assumption that COV(xi,ζi) equals zero for all i, the theoretical
construct can be presented mathematically as follows (Bollen & Lennox, 1991, p. 306):
η = γ1 x1 + γ2 x2 + …. + γn xn + ζ (6.1)
where η denotes the deviation score of the construct, γ represents the weight, x depicts the respective formative
indicator and ζ is the disturbance term of the formatively measured construct, capturing all further possible causes
that are not incorporated in the model. Notably, if the residual variance at construct level would correlate with the
idiosyncratic error terms of the indicators, this would necessarily imply an incomplete model specification
(Diamantopoulos, 2006, p. 11). Since formative indicators jointly determine the focal construct’s meaning, they
are neither interchangeable nor eliminable, as is true with reflective indicators (Hair, et al., 2016 p. 47). Otherwise,
if an indicator would be omitted, this would alter the construct’s nature and, thus, would definitionally lead to
another conceptual domain.
Figure 6.1: Formative versus reflective measurement models (Based on Bollen & Lennox, 1991, p. 306)
On the contrary, according to the reflective measurement philosophy, the measures that represent the observed
variances are all caused by the same underlying construct (Bollen, 2011, p. 360). This means that variation in the
latent factor is reflected by similar directional changes in its dependent effect indicators. Due to their conceptual
unity, reflective indicators should be highly correlated with one another to provide internal consistency (Hair, et
al., 2016 p. 47). The subsequent equation represents the correspondence rule in the case of an endogenously
conceptualised, reflective construct (Bollen & Lennox, 1991, p. 305):
xi = λi η + εi (6.2)
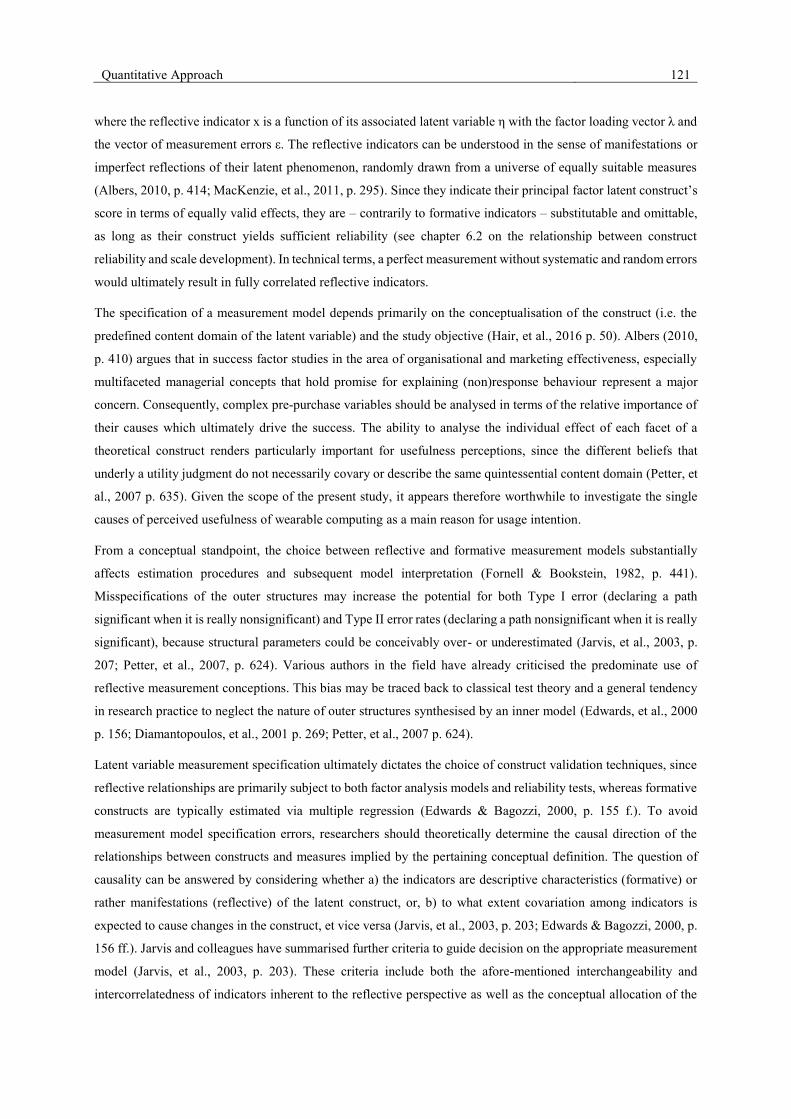
Quantitative Approach 121
where the reflective indicator x is a function of its associated latent variable η with the factor loading vector λ and
the vector of measurement errors ε. The reflective indicators can be understood in the sense of manifestations or
imperfect reflections of their latent phenomenon, randomly drawn from a universe of equally suitable measures
(Albers, 2010, p. 414; MacKenzie, et al., 2011, p. 295). Since they indicate their principal factor latent construct’s
score in terms of equally valid effects, they are – contrarily to formative indicators – substitutable and omittable,
as long as their construct yields sufficient reliability (see chapter 6.2 on the relationship between construct
reliability and scale development). In technical terms, a perfect measurement without systematic and random errors
would ultimately result in fully correlated reflective indicators.
The specification of a measurement model depends primarily on the conceptualisation of the construct (i.e. the
predefined content domain of the latent variable) and the study objective (Hair, et al., 2016 p. 50). Albers (2010,
p. 410) argues that in success factor studies in the area of organisational and marketing effectiveness, especially
multifaceted managerial concepts that hold promise for explaining (non)response behaviour represent a major
concern. Consequently, complex pre-purchase variables should be analysed in terms of the relative importance of
their causes which ultimately drive the success. The ability to analyse the individual effect of each facet of a
theoretical construct renders particularly important for usefulness perceptions, since the different beliefs that
underly a utility judgment do not necessarily covary or describe the same quintessential content domain (Petter, et
al., 2007 p. 635). Given the scope of the present study, it appears therefore worthwhile to investigate the single
causes of perceived usefulness of wearable computing as a main reason for usage intention.
From a conceptual standpoint, the choice between reflective and formative measurement models substantially
affects estimation procedures and subsequent model interpretation (Fornell & Bookstein, 1982, p. 441).
Misspecifications of the outer structures may increase the potential for both Type I error (declaring a path
significant when it is really nonsignificant) and Type II error rates (declaring a path nonsignificant when it is really
significant), because structural parameters could be conceivably over- or underestimated (Jarvis, et al., 2003, p.
207; Petter, et al., 2007, p. 624). Various authors in the field have already criticised the predominate use of
reflective measurement conceptions. This bias may be traced back to classical test theory and a general tendency
in research practice to neglect the nature of outer structures synthesised by an inner model (Edwards, et al., 2000
p. 156; Diamantopoulos, et al., 2001 p. 269; Petter, et al., 2007 p. 624).
Latent variable measurement specification ultimately dictates the choice of construct validation techniques, since
reflective relationships are primarily subject to both factor analysis models and reliability tests, whereas formative
constructs are typically estimated via multiple regression (Edwards & Bagozzi, 2000, p. 155 f.). To avoid
measurement model specification errors, researchers should theoretically determine the causal direction of the
relationships between constructs and measures implied by the pertaining conceptual definition. The question of
causality can be answered by considering whether a) the indicators are descriptive characteristics (formative) or
rather manifestations (reflective) of the latent construct, or, b) to what extent covariation among indicators is
expected to cause changes in the construct, et vice versa (Jarvis, et al., 2003, p. 203; Edwards & Bagozzi, 2000, p.
156 ff.). Jarvis and colleagues have summarised further criteria to guide decision on the appropriate measurement
model (Jarvis, et al., 2003, p. 203). These criteria include both the afore-mentioned interchangeability and
intercorrelatedness of indicators inherent to the reflective perspective as well as the conceptual allocation of the
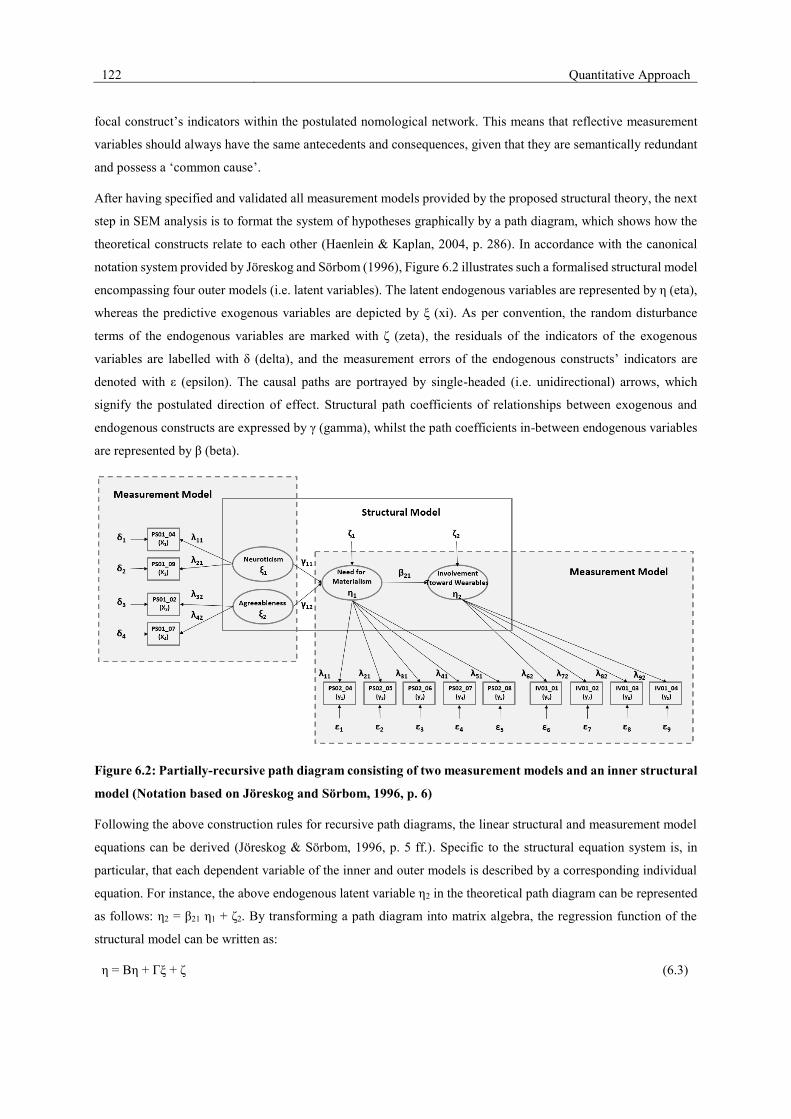
122 Quantitative Approach
focal construct’s indicators within the postulated nomological network. This means that reflective measurement
variables should always have the same antecedents and consequences, given that they are semantically redundant
and possess a ‘common cause’.
After having specified and validated all measurement models provided by the proposed structural theory, the next
step in SEM analysis is to format the system of hypotheses graphically by a path diagram, which shows how the
theoretical constructs relate to each other (Haenlein & Kaplan, 2004, p. 286). In accordance with the canonical
notation system provided by Jöreskog and Sörbom (1996), Figure 6.2 illustrates such a formalised structural model
encompassing four outer models (i.e. latent variables). The latent endogenous variables are represented by η (eta),
whereas the predictive exogenous variables are depicted by ξ (xi). As per convention, the random disturbance
terms of the endogenous variables are marked with ζ (zeta), the residuals of the indicators of the exogenous
variables are labelled with δ (delta), and the measurement errors of the endogenous constructs’ indicators are
denoted with ε (epsilon). The causal paths are portrayed by single-headed (i.e. unidirectional) arrows, which
signify the postulated direction of effect. Structural path coefficients of relationships between exogenous and
endogenous constructs are expressed by γ (gamma), whilst the path coefficients in-between endogenous variables
are represented by β (beta).
Figure 6.2: Partially-recursive path diagram consisting of two measurement models and an inner structural
model (Notation based on Jöreskog and Sörbom, 1996, p. 6)
Following the above construction rules for recursive path diagrams, the linear structural and measurement model
equations can be derived (Jöreskog & Sörbom, 1996, p. 5 ff.). Specific to the structural equation system is, in
particular, that each dependent variable of the inner and outer models is described by a corresponding individual
equation. For instance, the above endogenous latent variable η2 in the theoretical path diagram can be represented
as follows: η2 = β21 η1 + ζ2. By transforming a path diagram into matrix algebra, the regression function of the
structural model can be written as:
η = Bη + Γξ + ζ (6.3)
Quantitative Approach 123
given that B und Γ are coefficient matrices of the endogenous and exogenous variables, respectively. Furthermore,
from equation 6.2, where the indicators are expressed as a function of their pertaining latent variable, it follows
that (Henseler, et al., 2009 p. 285):
y = Λy η + ε (6.4)
where Λy denotes the loading (pattern) coefficients of the endogenous measurement models. Acknowledging that
each indicator represents an error-afflicated measurement, the corresponding regression residual is quantified by
ε. Analogously, the same applies for the vector of the exogenous latent variable:
x = Λx ξ + δ (6.5)
where the factor loadings of the exogenous measurement models are denoted by Λx, and the error variance
component by δ.
The herein introduced perspective considers composite variables to be hypothetical proxies for latent concepts,
which describe and assign significance to real phenomena in social collectives that might be of scientific discourse.
Remarkably, the understanding of constructs in the sense of theoretical surrogates for objectively real phenomena
represents a critical realist paradigm: It is recognised that these phenomena cannot be observed directly or with
absolute accuracy due to measurement error and imperfect epistemological lenses (Edwards & Bagozzi, 2000, p.
157). Nevertheless, by demonstrating ongoing usefulness, some constructs may contribute to the body of
knowledge and hence might aid managerial decision-making.
The next stage in structural equation modeling is to estimate the formulated regression paths (Hair, et al., 2016 p.
30). To this end, there are two main approaches: the covariance-based and the variance-based Partial Least Squares
(PLS) approach (Chin, 1998a, p. 297). Even though both methods apply to the same class of models (i.e. structural
equation models including unobservable variables and measurement error), they differ markedly in regard to the
epistemic relationship between data and theory (i.e. their parameter estimation mechanism), the properties of the
empirical data, and the objective of analysis (Chin, 1995, p. 316). Therefore, the next section contrasts the main
distinguishing statistical features and assumptions of these approaches.
6.2.2 The Partial Least Squares Approach
The covariance-based approach (CB-SEM) is anchored on the fundamental theorem of factor analysis. It holds
that each measurement variable can be described as a linear combination of its hypothetical factors and that the
correlation matrix of the collected data can be fully reproduced using the matrix of factor loadings and the
correlations between the factors (Meister, 2012, p. 187). Correspondingly, based on confirmatory factor analysis
CB-SEM attempts to reproduce the covariance matrix of the manifest variables in such a manner that the
discrepancies between the parameter matrices of the predicted theoretical model (e.g. Λy, Λx, B, Γ, Φ, Θε und Θδ)
and the sample covariances (e.g. of the manifest variables x1,…,x6 and y1,...,y6) are minimised (Chin & Newsted,
1999, p. 309). The CB-SEM algorithm therefore seeks to explain the covariances of all the indicators. There are
different estimation algorithms for minimising the fitting function between the population parameters that underlie
the empirical matrix and the model-implied covariance matrix, e.g. the maximum likelihood (ML), the generalized
124 Quantitative Approach
least squares (GLS), and the weighted least squares (WLS) method (Olsson, et al., 2000, p. 557; Savalei and
Rhemtulla, 2017, p. 8). Because of their computational simplicity and statistical accuracy, especially the ML and
GLS estimators are the most commonly applied normal-theory methods heretofore (Fischer, 2010 S. 167; Singer,
2015). Since these full-information estimation methods provide inference statistical criteria for holistically
assessing the consistency of the reproduced variance-covariance-matrix that mirrors the empirically measured
structural relations of all measurement variables, they are particularly appropriate for theory testing, given that
substantive theoretical knowledge already exists (Barroso, et al., 2010, p. 430).
As a multivariate technique that follows the common factor analytic approach, where p manifest measures are
conceived as both linear combinations of hypothetical factors and as decomposable into p factor variances and p
random error variances (cf. equation 6.4 and 6.5), CB-SEM models attempt to capture only those proportion of
variance that is caused by the latent factor (Chin, 1995, p. 315; McArdle, 1990, p. 81). Hence, correlation between
indicators is causally attributable to the pertaining latent factor in the sense of the reflective measurement
philosophy. This methodology implies the genuine problem with covariance-based model identification, according
to which the sample covariance matrix has to include at least as many structural equations as the number of model
parameters to be estimated (Reinartz, et al., 2009, p. 332 ff.). Since formative constructs can be thought of as linear
transformations of their respective indicators into one composite proxy variable, formative measurement models
can only be expressed by means of just one single equation, though. Therefore, CB-SEM-based estimators are
methodologically less suitable for rendering formative measurement approaches (Hair, et al., 2011, p. 143). A
technical side issue that has to be considered in this context is the factor indeterminacy problem that results from
the inability of covariance fitting approaches to estimate unique latent factor scores: Because an infinite number
of possible factor scores may equally fit the theoretical model, correlations between the latent variate and any
variable outside the factor structure are likewise indeterminate. For this reason, CB-SEM is highly inappropriate
for predictive applications and theory development (Hair, et al., 2016 p. 17).
Another restriction of traditional CB-SEM that arises from the underlying multivariate analysis perspective refers
to the assumption of multivariate normally distributed data, what is, however, rarely met in practice (Reinartz, et
al., 2009, p. 12 f.). Moreover, because parametric estimators require the population covariance matrix to be
positive-definite (i.e. the implied matrix must not contain correlation coefficients greater than 1.0), covariance
structure analysis demands both a minimum sample size and a minimum number of indicators per construct (ibid.,
Schumacker & Lomax, 2009, p. 40). In this regard, some studies indicate that under certain modeling conditions
even 5,000 cases do not suffice (Hu, et al., 1992, p. 356), whereas other authors recommend a ratio of 20 subjects
per item as a rule of thumb to generate results with error rates above an alpha-level of .05 (Osborne & Costello,
2005, p. 7). What is more, in literature the general consensus is to employ at least three to four indicators per latent
factor to assure more reliable parameter estimates (Reinartz, et al., 2009, p. 12). Assuming 13 conceptual variables
as is the case in the present study, this would result in a minimum sample size of 780 observations.
Due to these restrictions on model and sampling characteristics, partial least squares (PLS) path modeling has
gained considerable momentum in nonexperimental research over the last decade (Dijkstra & Henseler, 2015a, p.
10). The variance-based PLS approach that was originally developed by Wold is primarily intended for “[…]
causal-predictive analysis in situations of high complexity but low theoretical information” (Wold, 1982, p. 270).
Quantitative Approach 125
Instead of reproducing parametrically the population covariance matrix, the PLS-SEM framework aims at
minimising the residual variance of the endogenous latent variables. By increasing the explained variance of all
dependent variables through a series of ordinary least squares (OLS) regression-based analyses, PLS strives to
reproduce the case values of the raw data. Basically, the PLS-SEM optimisation algorithm follows a two-tier
approach, commencing with an iterative four-stage estimation procedure of the latent factor scores (Hair, et al.,
2011, p. 142):
(1) In the first step the outer proxies (i.e. tentative latent variable scores) are estimated as linear
combinations of their standardised manifest predictors. Initially, when no weights are available, PLS
utilises any “[…] arbitrary non-trivial linear combination of indicators […] as an outer proxy of a latent
variable” (Henseler, 2010, p. 111). In the following iterations, construct values are calculated based on
the coefficients of the paths between the latent constructs and their respective indicators estimated in
step 4.
(2) In the second step PLS computes the inner weights that approximate the strength of the structural model
relationships. For this purpose, there are three primary inner approximation weighting schemes
available, including the centroid scheme, which uses the sign of the correlation between two adjacent
variables, the factor weighting scheme that uses the bivariate correlations, and the path weighting
scheme, which draws on regression coefficients in the case of dependent variables and – similarly to the
factor weighting scheme – correlation coefficients in the case of independent variables. Because only
the path weighing scheme thus accounts for the direction of causality, this scheme is recommended in
methodologically oriented articles (Hair, et al., 2011, p. 142).
(3) Based on the scores of the latent constructs obtained in step 1 and the afore-determined inner weights
for the structural relationships from step 2, in a third step new constructs’ inner scores are computed as
linear combinations of their nomologically contiguous latent variables.
(4) Finally, based on the scores obtained from the previous step the outer weight coefficients (i.e. the
coefficients in the measurement models) are estimated. In the case of reflective indicators, a simple
regression of each manifest variable on the construct’s estimated inner proxy (outer loading) is applied.
Contrarily, in the case of formative indicators an OLS regression of the latent variables’ inner score on
its indicator block is calculated. The resulting outer weight coefficients are subsequently used in step 1.
The PLS optimisation algorithm iterates over these steps until the sum of absolute changes of the auxiliary weights
converge to a predefined threshold value (Chin, 1998a, p. 302). This convergence criterion for aborting the PLS
routine that oscillates back and forth between the inner and outer approximation of the constructed indices is
commonly set to 10-7 (Hair, et al., 2016, p. 91 f.). As both the inner and the outer estimators are based on a least
squares approach, each step of the algorithm successively minimises the unexplained variance, wherefore PLS is
considered as being “coherent in a predictive sense” (Chin, 1998a, p. 303).
Once the construct scores are calculated, the factor loadings of the outer models as well as the path coefficients of
the structural model are to be estimated in stage two of the PLS estimation algorithm. Drawing on PLS’s
econometric background with its traditional path analytic methodology, each endogenous latent variable score is
thereby regressed on its latent predictor variable scores via simple OLS regression (Henseler, 2010, p. 111).

126 Quantitative Approach
Finally, mean values and location parameters for the distribution of each latent construct can be determined (Chin,
1998a, p. 302).
Owing to the partial nature of PLS (i.e. the relational structures of the overall model are estimated partially), the
sample size requirements are much smaller compared to those of CB-SEM (Chin, 2010, p. 661). An often-cited
heuristic suggests that the sample size should be at least ten times larger than a) the largest number of formative
indicators for measuring a single index, or, b) the number of inner paths directed to the theoretical construct with
the most structural relations (Barclay, et al., 1995, p. 285 ff.). Empirical research could show that in technical
terms PLS is even able to provide interpretable estimates with only 50 cases (Chin & Newsted, 1999). Nonetheless,
even though the PLS approach outperforms ML-based CB-SEM in terms of parameter convergence behaviour in
small samples with n ≤ 200 observations (Boomsma & Hoogland, 2001, p. 139 ff.), as with other multivariate data
analysis techniques, statistical power and effect sizes should be taken into account to prevent Type II errors and to
ensure generalisability of results (Reinartz, et al., 2009, p. 13; Henseler, et al., 2014, p. 198; Goodhue, et al., 2012,
p. 983). In addition, because latent variable scores represent aggregates of manifest measures including their
inherent residual variance, path model relationships tend to be systematically underestimated, whereas outer model
parameters are typically overestimated (Chin, 2010, p. 663). This inconsistency in parameter estimates is
mistakenly termed PLS-SEM bias, which neglects the techniques’ differing purpose and its composite-based
character. Inherently, PLS treats theoretical constructs as exact weighted composites of their pertaining indicator
blocks (Rigdon, 2014, p. 162). Simulation studies have demonstrated that if sample and measurement model
characteristics meet the minimum recommended standards in terms of both sample size and number of manifest
measures, then the parameters estimated approximate the true population parameter values (Jakobowicz, 2006, p.
727; Chin, et al., 2003). This property of variance-based estimators is commonly referred to as consistency at large
(Schneeweiss, 1990, p. 38; Wold, 1982, p. 25; Lohmöller, 2013, p. 213 ff.). As a remedy for PLS-SEM’s lack of
consistency, Dijkstra and Henseler propose in (2015b, p. 297 ff.) the consistent PLS (PLSc) approach, which
produces disattenuated correlations by dividing the correlation of reflective latent variables by the geometric mean
of the constructs’ reliabilities. In PLSc, regression coefficients between formative constructs remain unchanged.
Yet, Hair and colleagues (2017, p. 303) emphasise that in complex path models collinearity among constructs as
well as low levels of construct reliability have strong adverse effects on PLSc results.
Aside from the relative efficiency of PLS being a partial-information approach, nonparametric techniques do not
require multivariate normally distributed indicators (Fornell & Bookstein, 1982, p. 442). Because of their
comparably soft distributional assumptions that comply with the central limit theorem (see chapter 6.2.1),
variance-based techniques work well with non-metric scales and dichotomous variables (Hair, et al., 2016 p. 27).
Furthermore, as latent construct scores are determinate under a principal component analysis (PCA) perspective,
PLS-SEM can easily handle formative measurement models without any identification problems, which regularly
occur in factor-based CB-SEM settings (Chin, 1998a, p. 303). Another often cited benefit of PLS refers to its
capability of managing complex research models with many structural relations, since a limited information
approach that estimates successively each subpart of a path model is not restricted by identification issues (Ringle,
et al., 2012, p. iv). Consequently, the composite-based PLS algorithm can efficiently handle hierarchical
component models as well as both moderating and higher-order interaction effects, what clearly expands its
applicability in behavioural and business science disciplines – especially against the backdrop that hypothesised
Quantitative Approach 127
relationships become increasingly complex in the context of social sciences (Hair, et al., 2011, p. 148; Henseler &
Chin, 2010, p. 83; Henseler & Fassott, 2010, p. 713).
However, since PLS parameter estimates focus on a local optimisation of partial model structures, there is no
adequate overall goodness-of-fit measure in a CB-SEM sense such as the chi-square (χ2) statistic (Henseler, et al.,
2009 p. 297). Instead, in PLS path modeling the global goodness of model fit is determined by the structural
model’s predictive capabilities (Hair, et al., 2016 p. 192). More precisely, the assessment of model fit relies on
empirical confidence intervals and hypothesis testing procedures such as jackknifing and bootstrapping, which
are outlined in chapter 6.2.4 (Henseler, et al., 2016, p. 9). Yet, the absence of a unique global scalar function to
judge the theoretical model’s overall quality severely limits the use of variance-based approaches for theory testing
and confirming (ibid.). Several relevant authors in the SEM field nevertheless question the meaningfulness of
model fit indices in a PLS-SEM context, since PLS does not aim at minimising the distance between observed and
model-implied covariance matrices as is the case for theory-oriented CB-SEM (Hair, et al., 2016 p. 194).
6.2.3 Rationale for Choosing PLS
In SEM literature, both the covariance fitting and the variance-based approach to causal modeling are considered
to be complementary rather than competitive in that they serve for distinct research contexts and objectives
(Henseler, et al., 2009 p. 296). Due to their underlying divergent measurement philosophies (factor-based versus
composite-based), they place different requirements on data and model characteristics as discussed above.
Accordingly, Hair et al. urge colleagues to align their choice of method with the individual research purpose, data
characteristics and model setup (2016, p. 22). Therefore, the following sections briefly discuss the suitability of
the PLS approach in the present study context.
The primary research aim of this study is to examine key factors that lead to either acceptance or rejection of
wearable computing. This research problem refers to a novel phenomenon for which no comprehensive structural
model has been developed so far. In addition, there is still a lack of systematic research on the inclusion of both
subjectively perceived IT security risks and personality-related correlates in Information Systems path models.
Thus, following an exploratory research strategy this study may benefit more from the predictive capabilities of
PLS-SEM than from the parameter accuracy of its common factor-based counterpart (Hair, et al., 2011, p. 147).
In particular, the total explained variation in the endogenous constructs is of practical relevance for the present
research. In praxeological terms, this study aims at transferring hypothesised cause-effect connections into
managerial means-end relations, rather than confirming a strong theoretical model in a well-researched domain.
Furthermore, the hypothesised nomological net incorporates an abstract higher-order construct of security-related
technology beliefs, which conforms to the multidimensional conceptualisation of security threats in the pertinent
IT literature. Based on a consumer value perspective, the empirical study also integrates an analysis of success
factors that are thought to induce technology usefulness perceptions. In the area of marketing effectiveness, drivers
of economic target parameters are often deemed to be causative in nature and, hence, require a formative
measurement mode (Albers, 2010, p. 419). As stated earlier, CB-SEM can handle formative structures only with
limitations in order to ensure model identification, which is why this approach renders problematic for
measurement model specification. Beside this, with the level of personal innovativeness and experience there are
128 Quantitative Approach
two interacting third variables inherent in the research model that moderate the influence of the proposed cognitive
beliefs on adoption intention. However, the covariance-based method assumes uncorrelated residual terms, while
the error terms of interacting variables are partially correlated with the error terms of the predictor and moderator
variables (i.e. interaction effects are calculated as the product of both variables, see section 6.2.6.1). Considering
the differing epistemic views of CB-SEM and PLS-SEM, due to its determinate nature the latter technique applies
best to the complex interrelations reflected by the developed structural model.
Finally, it has to be noted that especially in disciplines of marketing and management sciences the assumption of
normally distributed data is often violated (Ringle, et al., 2012, p. viii). Correspondingly, as can be seen from the
analysis of multivariate normality in chapter 7.1.5, this distributional assumption does not hold for the present
study since the collected data clearly shows non-zero skewness. Given that the PLS algorithm is quite robust
against moderate asymmetric data, again the variance-based SEM approach comes to the fore. Additionally, in
view of the structural complexity of the Wearable TAM, the less restrictive sample size requirements of PLS-SEM
are also favourable for research economic reasons.
To sum up, the PLS-SEM approach appears to be promising for validating the theoretically derived system of
statements. More precisely, this technique allows to efficiently evaluate both the psychometric properties of the
constructs identified and the proposed correlative influence of the relevant users’ traits and beliefs (Henseler, et
al., 2009 p. 277). As a consequence, PLS is well-suited for explaining and predicting consumer behaviour in
innovative wearable technology markets. In order to assess the validity and reliability of the partial structures of a
theoretical model, there is a series of heuristic evaluation criteria available in PLS-SEM. With regard to the analytic
goal of an empirical assessment of the Wearable TAM, the following chapters concentrate on the key criteria for
estimating the quality of PLS path models at both construct and structural level.
6.2.4 Assessment of Reflective Measurement Models
Recalling PLS-SEM’s relaxed distributional assumptions and the consequent lack of a classical parametric
inferential framework, covariance-based model fit measures are not fully transferrable to the PLS context. Rather,
the assessment of the quality of a structural equation model focusses on dedicated non-parametric metrics that
allow to separately assess the measurement models and the structural model. This biphasic evaluation is critical to
PLS path model analysis since the determination of structural parameters and factor scores relies heavily upon the
estimation of outer weight relations as implied by the core PLS algorithm in chapter 6.2.2. Hence, taking into
consideration that the psychometric quality of conceptual variables crucially characterises the ‘goodness’ of
structural parameter estimates, the diagnostic procedure should commence at construct level.
Essentially, the evaluation of reflective measurement models is based on the empiricist concepts of reliability and
validity (Hair, et al., 2016 p. 106 ff.). Whereas the concept of reliability refers to the repeatability of findings and,
thus, addresses the level of random measurement errors, the criterion of validity additionally requires
measurements that are free from systematic errors. Since an accurately captured content domain of a theoretical
concept would inevitably lead to a high level of reproducibility of results, reliability acts as a necessary but not
sufficient condition for measurement validity. On the contrary, reliable measurements do not necessarily imply a
Quantitative Approach 129
semantically complete coverage of the intended construct domain. Thus, a measurement is totally valid if both the
random and the systematic error term equals zero (Churchill, 1979, p. 65).
With respect to these operational definitions, various partial first- and second-generation criteria are available for
judging the reliability of a measurement model. In classical psychometric theory the purpose of reliability estimates
is to eliminate those indictors that are ill-suited to the measurement of an underlying principal factor latent
construct (Nunnally, 1975, p. 10). In order to achieve reliable results, multi-item scales ought to be purified. To
this effect, the psychometric constructs should be operationalised through a battery of manifest measures that all
reflect their underlying theoretical trait perfectly to the greatest possible extent in a content sampling sense. Yet,
under the premise that indicators are randomly drawn from a common conceptual domain and that the construct
score is defined as a composite measure of its indicator variable scores, the computation of a composite value is
only meaningful if the focal latent factor is acceptably unidimensional (Gerbing & Anderson, 1988, p. 186 f.). This
assumption is met if the measurement variables are both highly inter-correlated and attributable to their underlying
construct. From this it follows that residuals should be uncorrelated because otherwise there may be a third variable
effect that accounts for the shared non-random error variance in measurement items through a parallel pattern of
relationship (Gefen, 2003, p. 26).
Given that factorial unidimensionality is prerequisite for reliability, psychometric tests should generally
commence with the assessment of scale dimensionality (Gerbing & Anderson, 1988, p. 190). Traditional first-
generation criteria (e.g. Cronbach’s alpha and Dillon‐Goldstein's ρ, which are delineated in the following
paragraphs) are not sufficient for testing the dimensionality of a given factor structure, since they solely test for
internal consistency of items. In so doing, these statistics apriorically assume external consistency in terms of the
patterning of indicator cross-correlations (Segars, 1997, p. 116). Therefore, it is generally recommended by
psychometricians to undertake exploratory factor analysis (EFA) as a preliminary technique for scale
construction (Urbach & Ahlemann, 2010, p. 18). Accordingly, this study employs EFA to judge the
appropriateness of the specified outer models and to optimise the measurement instruments by item selection
where applicable.
EFA’s primary purpose is to identify the underlying factor structure among a set of scale items with as few factors
(structural dimensions) as possible by establishing the factor loading patterns of manifest measures (Hair, et al.,
2010, p. 93). It is thus an interdependence technique that allows to investigate and to reduce where necessary the
dimensionality of a given measurement instrument. For reflectively measured constructs it is assumed that items
are one-dimensional with respect to a single extracted factor (Gerbing & Anderson, 1988, p. 191). In applied
settings in which the sample size exceeds 250 cases, scale dimensionality can be assessed by means of principal
component analysis using the Kaiser criterion, which is based on the eigenvalue measure (Meister, 2012, p. 196;
Tenenhaus, 2005, p. 16). The eigenvectors of a rotated correlation matrix of factor loadings indicate the number
of extracted factors. Because an eigenvalue of 1 represents a substantial amount of variation, the eigenvalue of the
first principal component should be greater than 1 and the second smaller than 1 to meet the Kaiser criterion (Field,
2009, p. 640).
After verifying the factor structure’s unidimensionality, further quantitative evaluation of the outer models’
reliability is required. The reliability of an indicator quantifies the size of a standardised indicators’ outer loading
130 Quantitative Approach
λ (Bagozzi & Yi, 2012, p. 14). The square of an indicator’s outer loading is also referred to as communality of an
item and indicates how much of the variation in an item is explained by the underlying construct. At a minimum,
the reliability coefficient shall be greater than 0.7 to assure that at least 50% of the indicator’s variation are due to
the construct of interest (Hulland, 1999, p. 198; Nunnally, 1975, p. 10). In exploratory studies where item batteries
are newly developed, literature suggests also a threshold of 0.4 – indicators with lower loadings are to be discarded
from the measurement model (ibid.).
In order to estimate the statistical significance of the outer loadings obtained in a distribution-free PLS-SEM
context, inferential resampling procedures such as bootstrapping and jackknifing can provide standard errors for
significance tests (Chin, 1998a, p. 318 ff.; Chin, 2010, p. 659). Either resampling procedure randomly draws
subsamples from an original population sample to obtain empirical confidence statements that may compensate
for biases in statistical estimates. Consequently, nonparametric resampling techniques supersede the theoretical
distribution function of parametric normal-theory approaches by an empirical distribution that approximates the
true population distribution of a specific path coefficient. In accordance with jackknifing, for all subsamples a
predefined number of cases (d) is omitted, so that each subsample should span the original data set with the first d
cases being deleted. Contrarily, the bootstrapping procedure holds that each subsample is obtained through random
sampling with replacement from the original data set, but without omission of cases. As a rule, the number of
bootstrap samples must be at least equal to the number of observations in the original sample (Henseler, et al.,
2009 p. 305). Based on the mean value and standard deviation of the generated bootstrap distribution, robust
confidence intervals can be calculated by means of pseudo t-tests (Hair, et al., 2016 p. 153). Using the estimated
standard errors computed across all bootstrapping samples, the null hypothesis can be tested that the factor loading
is de facto not significantly different from zero. As a consensus among social scientists, estimated coefficients
should meet a significance level of 5% which corresponds to a critical t-value of 1.66 for a one-tailed test (Bartlett,
et al., 2001, p. 45). Since jackknife performs less well (Efron & Gong, 1983, p. 39), this research study will adopt
the bootstrap method.
When using multi-item measures, the extent to which constructs demonstrate reliability becomes a major concern
(Churchill, 1979, p. 70). For assessing the reliability of a measurement model at composite level, PLS-SEM
typically draws on both Cronbach’s alpha and Dillon-Goldstein’s rho as estimates of a latent variable’s internal
consistency (Henseler, et al., 2009 p. 298 f.). The traditional Cronbach’s alpha criterion quantifies the degree to
which items of a scale covary on average when the latent variable increases, providing an estimate of the common-
factor-concentration (Cronbach, 1951, p. 321). Alpha-values above 0.6 are regarded acceptable in empirical
research settings (Hair, et al., 2016 p. 112). A major deficiency of the coefficient alpha is its implicit assumption
of summated scales which holds that all indicators of a battery have equal weights. By way of contrast, PLS
prioritises manifest variables in correspondence with their individual loadings on the relevant construct (Henseler,
et al., 2009 p. 299). Technically, the alpha coefficient is therefore less compatible with the working principles of
PLS-SEM. In addition, the precision of Cronbach’s alpha is sensitive to the number of scale items and features a
general tendency to underestimate the internal consistency of latent constructs in PLS path models (ibid.). On these
grounds, the present study chooses to use additionally the Dillon-Goldstein’s rho (more commonly known as
composite reliability) for ascertaining internal consistency of measurement scales.
Quantitative Approach 131
As opposed to Cronbach’s alpha, composite reliability pc does not assume ‘tau equivalency’ among scale items
and provides less conservative reliability estimates (Chin, 1998a, p. 320). More formal, the pc index expresses the
ratio between the individual component loadings (rather than the alpha’s equal weightings) and the total variances
of the respective indicators. Thus, composite reliability indicates the capability of a latent variable to explain the
variance of its block of indicators. According to Bagozzi and Yi (2012, p. 17), the minimum level of composite
reliability should be .70. Levels inferior to this threshold indicate a lack of reliability and require corresponding
scale adjustments. Yet, it should be noted that very high levels of internal consistency close to a value of 1.0 may
imply semantically redundant items, which are also not desirable in terms of their adverse consequences on content
validity (Hair, et al., 2016 p. 112; Tavakol, et al., 2011 p. 54). Furthermore, prior research implies that the
composite reliability measure tends to slightly overestimate intra-scale reliability. Therefore, in current literature
it is advocated to consider both the more conservative Cronbach’s alpha and the composite reliability measure pc
to assess the degree of item homogeneity (Hair, et al., 2016 p. 112).
The last methodological step in evaluating reflective measurement instruments is the assessment of validity, which
is commonly subdivided into convergent validity and discriminant validity (Henseler, et al., 2009 p. 299).
Convergent validity is proven when measurement variables correlate positively with alternative indicators of the
same underlying trait (Hair, et al., 2016 p. 112; Bagozzi, et al., 2012 p. 18). It thus indicates how well indicators
of a block measure what they are intended to measure. Fornell and Larcker (1981) propose using the average
variance extracted (AVE) criterion for estimating the magnitude of measurement error. The AVE measures “the
amount of variance that is captured by the construct in relation to the amount of variance due to measurement
error” (Fornell & Larcker, 1981, p. 46). Assuming that all indicators are standardised, AVE would reflect the
average of the communalities in a given block (Chin, 1998a, p. 321). An AVE of more than 0.5 is considered to
be sufficient in literature, meaning that less than 50% of the variance that is captured by the construct is due to
measurement error.
Discriminant validity describes the extent to which a theoretical construct empirically discriminates from other
constructs within a given conceptual framework (Hulland, 1999, p. 199). This means that measurement variables
should not share too much variance with measures of other conceptual variables in a nomological network.
Consequently, the first approach in assessing discriminant validity is typically an examination of cross-loadings,
whereby the indicator’s factor loadings on their theoretically associated construct shall be greater than all of their
cross-loadings on conceptually distinct constructs (Hair, et al., 2016 p. 115). However, since this criterion is
considered to be rather liberal (especially in cases, where two neighbouring constructs are perfectly correlated), in
PLS communities it is frequently advised to employ the Fornell-Larcker criterion to check for discriminant
validity (Hair, et al., 2011 p. 146; Hair, et al., 2016 p. 118). Statistically, discriminant validity is indicated if a
construct’s AVE is greater than the common variances of this construct with any other of the model’s constructs
(Götz, et al., 2010, p. 696; Fornell & Larcker, 1981, p. 46).
From a conceptual standpoint, though, the efficacy of Fornell-Larcker’s criterion is subject to PLS-SEM bias
effects (see chapter 6.1.2.2), why this approach fails to reliably detect discriminant validity problems (Henseler,
et al., 2015 p. 116 ff.; Hair, et al., 2016 p. 118). Henseler et al. argue in (2015, p. 115 ff.) that the new heterotrait-
monotrait ratio (HTMT) is technically superior to AVE in terms of the reliability of results. In a nutshell, HTMT
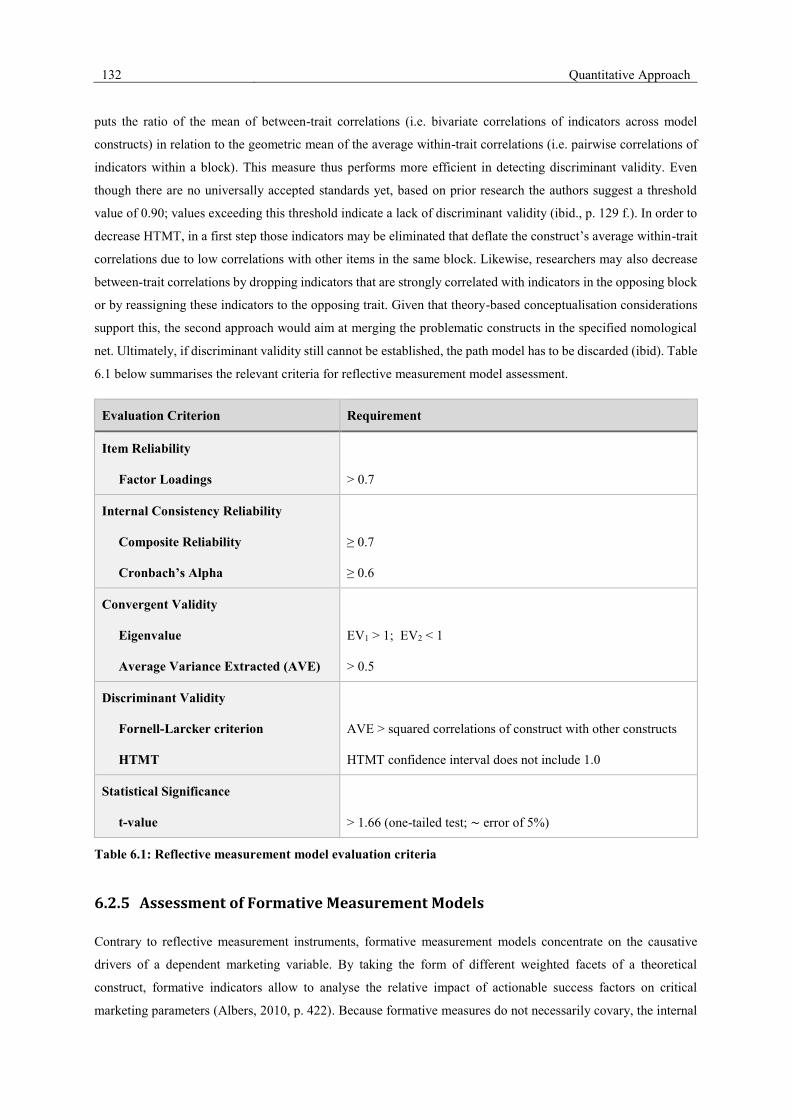
132 Quantitative Approach
puts the ratio of the mean of between-trait correlations (i.e. bivariate correlations of indicators across model
constructs) in relation to the geometric mean of the average within-trait correlations (i.e. pairwise correlations of
indicators within a block). This measure thus performs more efficient in detecting discriminant validity. Even
though there are no universally accepted standards yet, based on prior research the authors suggest a threshold
value of 0.90; values exceeding this threshold indicate a lack of discriminant validity (ibid., p. 129 f.). In order to
decrease HTMT, in a first step those indicators may be eliminated that deflate the construct’s average within-trait
correlations due to low correlations with other items in the same block. Likewise, researchers may also decrease
between-trait correlations by dropping indicators that are strongly correlated with indicators in the opposing block
or by reassigning these indicators to the opposing trait. Given that theory-based conceptualisation considerations
support this, the second approach would aim at merging the problematic constructs in the specified nomological
net. Ultimately, if discriminant validity still cannot be established, the path model has to be discarded (ibid). Table
6.1 below summarises the relevant criteria for reflective measurement model assessment.
Evaluation Criterion Requirement
Item Reliability
Factor Loadings
> 0.7
Internal Consistency Reliability
Composite Reliability
Cronbach’s Alpha
≥ 0.7
≥ 0.6
Convergent Validity
Eigenvalue
Average Variance Extracted (AVE)
EV1 > 1; EV2 < 1
> 0.5
Discriminant Validity
Fornell-Larcker criterion
HTMT
AVE > squared correlations of construct with other constructs
HTMT confidence interval does not include 1.0
Statistical Significance
t-value
> 1.66 (one-tailed test; ∼ error of 5%)
Table 6.1: Reflective measurement model evaluation criteria
6.2.5 Assessment of Formative Measurement Models
Contrary to reflective measurement instruments, formative measurement models concentrate on the causative
drivers of a dependent marketing variable. By taking the form of different weighted facets of a theoretical
construct, formative indicators allow to analyse the relative impact of actionable success factors on critical
marketing parameters (Albers, 2010, p. 422). Because formative measures do not necessarily covary, the internal
Quantitative Approach 133
consistency perspective of classical test theory cannot be directly transferred to formative contexts
(Diamantopoulos, et al., 2008 p. 1216; Henseler, et al., 2009 p. 300; Bollen, et al., 1991 p. 312). Consequently,
correlations among indicators of an index may not be sensibly interpreted, why traditional validity measures render
irrelevant for quality assessment of formative instruments. Moreover, due to the implicit assumption of error-free
measures in formative modes of measurement, reliability tests become inherently obsolete (Rossiter, 2002, p. 388).
Thus, either concept of construct validity (i.e., convergent and discriminant validity) and reliability lose their
meaning in the course of evaluating formatively operationalised constructs. Instead, due to causality reversal,
theoretical rational and expert opinions play generally a more pivotal role for index evaluation (Hair, et al., 2011,
p. 146; Götz, et al., 2010, p. 697).
As a result, under formative scenarios quality assessment is strongly focussed on testing validity at indicator level,
basically reflected by indicator relevance approaches and multicollinearity checks. Specifically, the estimated
weights of indicators provide information about the relative contribution of each facet to its construct (Chin, 1998a,
p. 307). Notably, since PLS-SEM strives to maximize the explained variance of latent index variables in a multiple
regression sense, outer weights are frequently smaller than reflective item’s factor loadings (Götz, et al., 2010, p.
698). Given that formative indicators do not measure the same conceptual content, omitting an indicator from a
coherent block would, however, carry the risk of altering the very nature of the construct itself (Diamantopoulos,
et al., 2001 p. 272). The exclusion of indicators with even minor explanatory contribution could potentially
undermine the content validity of their associated construct und ultimately lower the model’s theoretical and
empirical usefulness for researchers and practitioners alike (Coltman, et al., 2008, p. 1250; Diamantopoulos &
Siguaw, 2006, p. 276). Some authors in the field argue that a purely data-driven a posteriori deletion of indicators
would finally represent a trial-and-error philosophy which contradicts the domain-forming nature of indices
(Heinecke, 2010, p. 87).
Thus, in lieu of the strength of the indicator-construct relationships, their significance becomes more important
from a statistical conclusion validity perspective. The significance of weights should be assessed ex post upon the
basis of t-statistics (Henseler, et al., 2009 p. 302). Analogous to significance tests in reflective contexts, the
bootstrapping procedure lends itself to the computation of the accuracy of parameter estimates (Hair, et al., 2016
p. 153; Hair, et al., 2011 p. 146). Similarly, the critical t-values are to be at a significance level of 5%, which
corresponds to a value of 1.98 for two-tailed tests. Again, it has to be emphasised that any attempt to purify
composite indicators which entirely cover their construct’s domain might bear negative consequences on content
validity, provided that the elimination decision is divorced from any qualified theoretical or conceptual
consideration (Hair, et al., 2016 p. 148; Bollen, 2011 p. 362).
Furthermore, a central demand on the construct validity of a multi-faceted construct is the pairwise linear
independency among its formative indicators. From a methodological and interpretational view point, substantial
collinearity among items would result in severe biases in parameter estimates, which make it difficult to ascertain
the unique influence of individual indicators on their associated latent variable (Diamantopoulos, et al., 2001 p.
272; Götz, et al., 2010 p. 88). Because formative logic grounds on the principles of multiple regression, the outer
weights would be systematically underestimated if the predictor variables would effectively explain a large portion
of variance among each other (Cenfetelli & Bassellier, 2009, p. 693). Besides suppressed coefficient estimates,
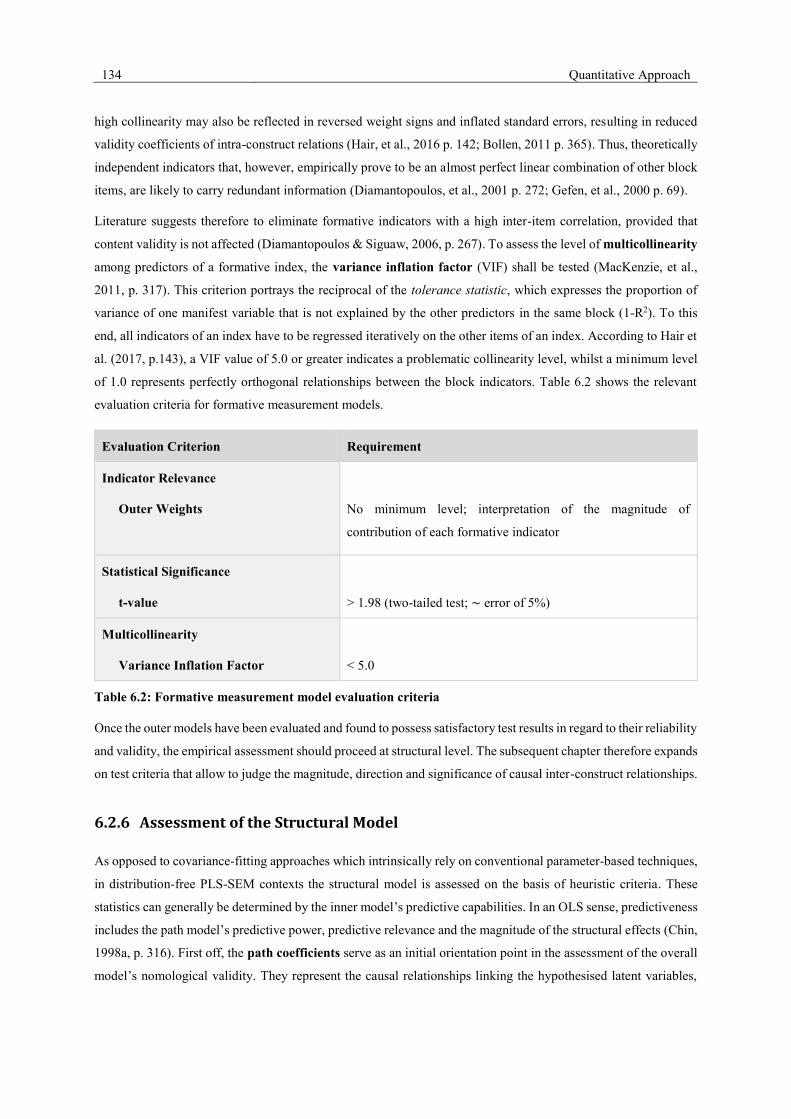
134 Quantitative Approach
high collinearity may also be reflected in reversed weight signs and inflated standard errors, resulting in reduced
validity coefficients of intra-construct relations (Hair, et al., 2016 p. 142; Bollen, 2011 p. 365). Thus, theoretically
independent indicators that, however, empirically prove to be an almost perfect linear combination of other block
items, are likely to carry redundant information (Diamantopoulos, et al., 2001 p. 272; Gefen, et al., 2000 p. 69).
Literature suggests therefore to eliminate formative indicators with a high inter-item correlation, provided that
content validity is not affected (Diamantopoulos & Siguaw, 2006, p. 267). To assess the level of multicollinearity
among predictors of a formative index, the variance inflation factor (VIF) shall be tested (MacKenzie, et al.,
2011, p. 317). This criterion portrays the reciprocal of the tolerance statistic, which expresses the proportion of
variance of one manifest variable that is not explained by the other predictors in the same block (1-R2). To this
end, all indicators of an index have to be regressed iteratively on the other items of an index. According to Hair et
al. (2017, p.143), a VIF value of 5.0 or greater indicates a problematic collinearity level, whilst a minimum level
of 1.0 represents perfectly orthogonal relationships between the block indicators. Table 6.2 shows the relevant
evaluation criteria for formative measurement models.
Evaluation Criterion Requirement
Indicator Relevance
Outer Weights
No minimum level; interpretation of the magnitude of
contribution of each formative indicator
Statistical Significance
t-value
> 1.98 (two-tailed test; ∼ error of 5%)
Multicollinearity
Variance Inflation Factor
< 5.0
Table 6.2: Formative measurement model evaluation criteria
Once the outer models have been evaluated and found to possess satisfactory test results in regard to their reliability
and validity, the empirical assessment should proceed at structural level. The subsequent chapter therefore expands
on test criteria that allow to judge the magnitude, direction and significance of causal inter-construct relationships.
6.2.6 Assessment of the Structural Model
As opposed to covariance-fitting approaches which intrinsically rely on conventional parameter-based techniques,
in distribution-free PLS-SEM contexts the structural model is assessed on the basis of heuristic criteria. These
statistics can generally be determined by the inner model’s predictive capabilities. In an OLS sense, predictiveness
includes the path model’s predictive power, predictive relevance and the magnitude of the structural effects (Chin,
1998a, p. 316). First off, the path coefficients serve as an initial orientation point in the assessment of the overall
model’s nomological validity. They represent the causal relationships linking the hypothesised latent variables,
Quantitative Approach 135
whereby their standardised values usually range from -1 to +1 (Hair, et al., 2016 p. 195). Structural model path
coefficients close to +1 signify strong positive correlations et vice versa for negative relationships.
In regard to the magnitude of regression coefficients, Information Systems-related literature typically suggests that
standardised values should be at least .20 and -.20 respectively in order to be regarded as meaningful (Chin, 1998b,
p. xiii). On the contrary, some researchers in the PLS community also tolerate beta coefficients of .10 in explorative
stages of research (e.g. Ravens, 2014, p. 161; Arnhold, 2010, p. 230; Lohmöller, 1989). Considering the newness
and complexity of the hypothesised structural model, the present study accepts relationships with path coefficients
greater than or equal to .10. The causal links may still contain valuable insights and should only be discarded from
the model if they prove to be statistically non-significant. Similar to the reliability of outer weights in measurement
models, the significance of an estimated path coefficient is contingent upon its standard error that can be obtained
from bootstrapping as preferred resampling method. Conventionally, critical t-values for two-sided tests should
be significant at the 5% alpha level, what corresponds to a minimum value of 1.98 (Heinecke, 2010, p. 92). On
condition that the structural path is satisfactorily significant and the path sign is consistent with the apriorically
postulated direction of effect, the standardised beta coefficient provides a partial empirical validation of the
respective hypothesis (Henseler, et al., 2009 p. 304).
Furthermore, the predictive power of a path model can be quantified by means of the coefficient of determination
R2-criterion (Chin, 1998a, p. 316). The R-squared measure determines the proportion of variance of an endogenous
construct that is explained by its preceding latent variables in the structural model. It is calculated by relating the
predicted to the actual values of a latent construct (i.e. the portion of explained variance to total variance).
Therefore, the R2-criterion can take values between zero and one, measuring the regression function’s ‘goodness
of fit’ against empirical data (Götz, et al., 2010, p. 701). According to Chin (1998a, p. 323), an R-squared value
of 0.67 can be interpreted as being substantial, whilst values of 0.33 and 0.19 respectively indicate moderate and
weak levels of explanatory power. However, it has to be noted that no universal statement can be made in regard
to generalisable cut-off points for a sufficient predictive accuracy. This is because the determination coefficient
intrinsically depends on the number of exogenous model constructs, whereas partial models that seek to be
parsimonious – as opposed to full models – are intended to explain only a few relevant aspects of a phenomenon
and thus do not strive for R²-values near one (Schulze, 2009, p. 99; Götz, et al., 2010). Therefore, in highly complex
research disciplines comprising multicausal phenomenona such as consumer behaviour even values of .20 are
perceived as high (Hair, et al., 2016 p. 199). Accordingly, following Falk and Miller (1992, p. 80) this study strives
for multiple determination coefficients ≥ 0.1.
The structural model evaluation should proceed with the analysis of effect sizes at structural level (Chin, 1998a,
p. 316). Following traditional partial F-tests, Cohen derives in (1988) the f 2-measure which is defined as the
increase in R2 relative to the proportion of unexplained variance of the dependent latent variable. The effect size
f2 thus provides information about the substantive impact of a specified exogenous construct on its endogenous
variable (Chin, 1998a, p. 316). The change in predictive power is calculated by estimating the path model twice,
once with the exogenous latent variable included, and once more with the exogenous variable excluded (Hair, et
al., 2016 p. 201; Götz, et al., 2010 p. 702). Values for effect sizes f2 of 0.02, 0.15, or 0.35 respectively suggest the
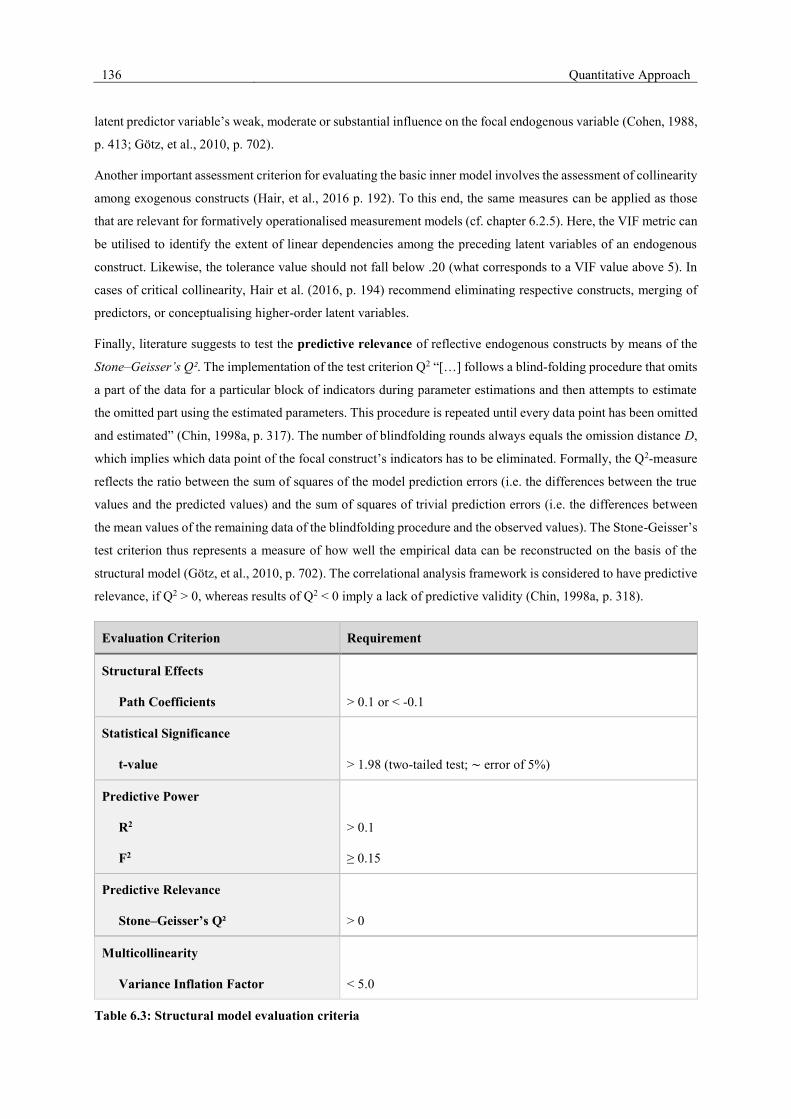
136 Quantitative Approach
latent predictor variable’s weak, moderate or substantial influence on the focal endogenous variable (Cohen, 1988,
p. 413; Götz, et al., 2010, p. 702).
Another important assessment criterion for evaluating the basic inner model involves the assessment of collinearity
among exogenous constructs (Hair, et al., 2016 p. 192). To this end, the same measures can be applied as those
that are relevant for formatively operationalised measurement models (cf. chapter 6.2.5). Here, the VIF metric can
be utilised to identify the extent of linear dependencies among the preceding latent variables of an endogenous
construct. Likewise, the tolerance value should not fall below .20 (what corresponds to a VIF value above 5). In
cases of critical collinearity, Hair et al. (2016, p. 194) recommend eliminating respective constructs, merging of
predictors, or conceptualising higher-order latent variables.
Finally, literature suggests to test the predictive relevance of reflective endogenous constructs by means of the
Stone–Geisser’s Q². The implementation of the test criterion Q2 “[…] follows a blind-folding procedure that omits
a part of the data for a particular block of indicators during parameter estimations and then attempts to estimate
the omitted part using the estimated parameters. This procedure is repeated until every data point has been omitted
and estimated” (Chin, 1998a, p. 317). The number of blindfolding rounds always equals the omission distance D,
which implies which data point of the focal construct’s indicators has to be eliminated. Formally, the Q2-measure
reflects the ratio between the sum of squares of the model prediction errors (i.e. the differences between the true
values and the predicted values) and the sum of squares of trivial prediction errors (i.e. the differences between
the mean values of the remaining data of the blindfolding procedure and the observed values). The Stone-Geisser’s
test criterion thus represents a measure of how well the empirical data can be reconstructed on the basis of the
structural model (Götz, et al., 2010, p. 702). The correlational analysis framework is considered to have predictive
relevance, if Q2 > 0, whereas results of Q2 < 0 imply a lack of predictive validity (Chin, 1998a, p. 318).
Evaluation Criterion Requirement
Structural Effects
Path Coefficients
> 0.1 or < -0.1
Statistical Significance
t-value
> 1.98 (two-tailed test; ∼ error of 5%)
Predictive Power
R2
F2
> 0.1
≥ 0.15
Predictive Relevance
Stone–Geisser’s Q²
> 0
Multicollinearity
Variance Inflation Factor
< 5.0
Table 6.3: Structural model evaluation criteria
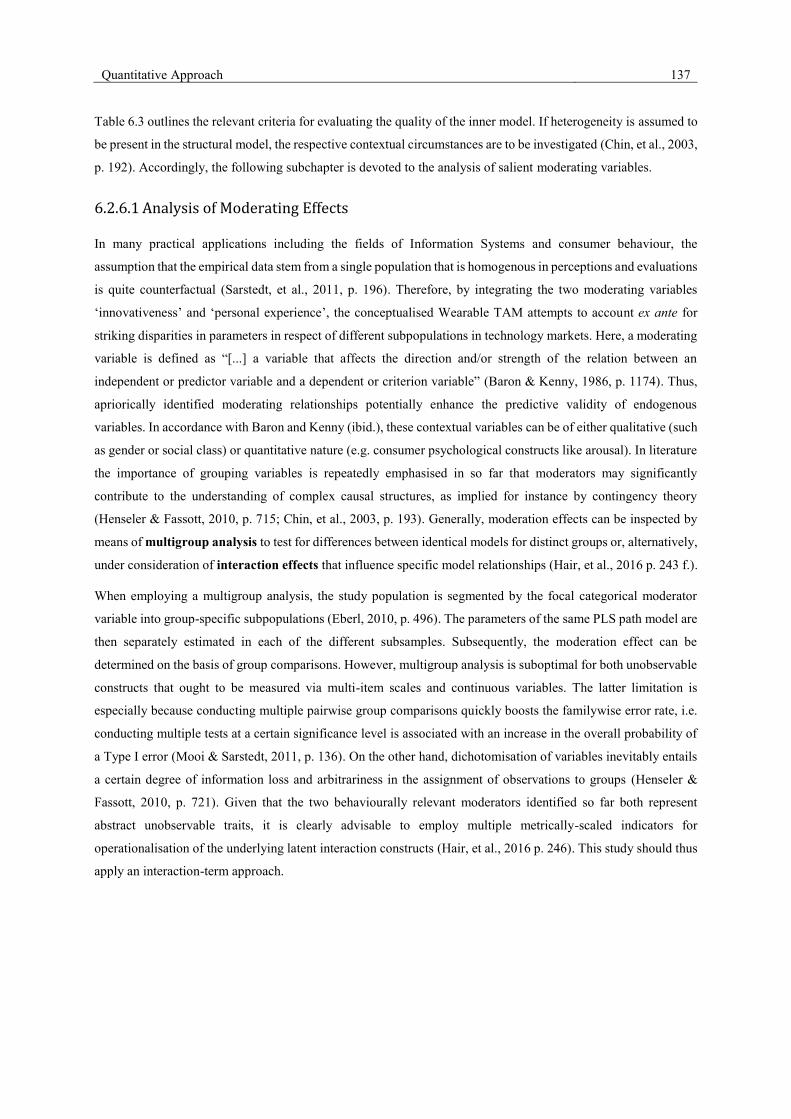
Quantitative Approach 137
Table 6.3 outlines the relevant criteria for evaluating the quality of the inner model. If heterogeneity is assumed to
be present in the structural model, the respective contextual circumstances are to be investigated (Chin, et al., 2003,
p. 192). Accordingly, the following subchapter is devoted to the analysis of salient moderating variables.
6.2.6.1 Analysis of Moderating Effects
In many practical applications including the fields of Information Systems and consumer behaviour, the
assumption that the empirical data stem from a single population that is homogenous in perceptions and evaluations
is quite counterfactual (Sarstedt, et al., 2011, p. 196). Therefore, by integrating the two moderating variables
‘innovativeness’ and ‘personal experience’, the conceptualised Wearable TAM attempts to account ex ante for
striking disparities in parameters in respect of different subpopulations in technology markets. Here, a moderating
variable is defined as “[...] a variable that affects the direction and/or strength of the relation between an
independent or predictor variable and a dependent or criterion variable” (Baron & Kenny, 1986, p. 1174). Thus,
apriorically identified moderating relationships potentially enhance the predictive validity of endogenous
variables. In accordance with Baron and Kenny (ibid.), these contextual variables can be of either qualitative (such
as gender or social class) or quantitative nature (e.g. consumer psychological constructs like arousal). In literature
the importance of grouping variables is repeatedly emphasised in so far that moderators may significantly
contribute to the understanding of complex causal structures, as implied for instance by contingency theory
(Henseler & Fassott, 2010, p. 715; Chin, et al., 2003, p. 193). Generally, moderation effects can be inspected by
means of multigroup analysis to test for differences between identical models for distinct groups or, alternatively,
under consideration of interaction effects that influence specific model relationships (Hair, et al., 2016 p. 243 f.).
When employing a multigroup analysis, the study population is segmented by the focal categorical moderator
variable into group-specific subpopulations (Eberl, 2010, p. 496). The parameters of the same PLS path model are
then separately estimated in each of the different subsamples. Subsequently, the moderation effect can be
determined on the basis of group comparisons. However, multigroup analysis is suboptimal for both unobservable
constructs that ought to be measured via multi-item scales and continuous variables. The latter limitation is
especially because conducting multiple pairwise group comparisons quickly boosts the familywise error rate, i.e.
conducting multiple tests at a certain significance level is associated with an increase in the overall probability of
a Type I error (Mooi & Sarstedt, 2011, p. 136). On the other hand, dichotomisation of variables inevitably entails
a certain degree of information loss and arbitrariness in the assignment of observations to groups (Henseler &
Fassott, 2010, p. 721). Given that the two behaviourally relevant moderators identified so far both represent
abstract unobservable traits, it is clearly advisable to employ multiple metrically-scaled indicators for
operationalisation of the underlying latent interaction constructs (Hair, et al., 2016 p. 246). This study should thus
apply an interaction-term approach.
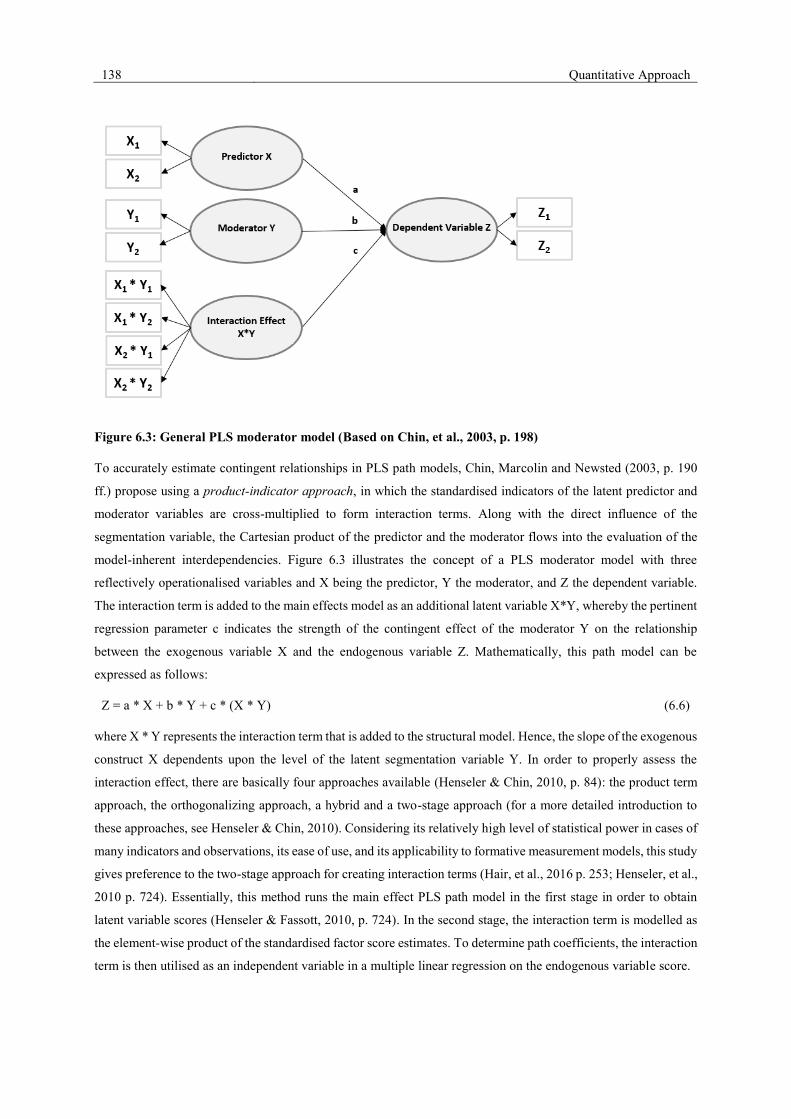
138 Quantitative Approach
Figure 6.3: General PLS moderator model (Based on Chin, et al., 2003, p. 198)
To accurately estimate contingent relationships in PLS path models, Chin, Marcolin and Newsted (2003, p. 190
ff.) propose using a product-indicator approach, in which the standardised indicators of the latent predictor and
moderator variables are cross-multiplied to form interaction terms. Along with the direct influence of the
segmentation variable, the Cartesian product of the predictor and the moderator flows into the evaluation of the
model-inherent interdependencies. Figure 6.3 illustrates the concept of a PLS moderator model with three
reflectively operationalised variables and X being the predictor, Y the moderator, and Z the dependent variable.
The interaction term is added to the main effects model as an additional latent variable X*Y, whereby the pertinent
regression parameter c indicates the strength of the contingent effect of the moderator Y on the relationship
between the exogenous variable X and the endogenous variable Z. Mathematically, this path model can be
expressed as follows:
Z = a * X + b * Y + c * (X * Y) (6.6)
where X * Y represents the interaction term that is added to the structural model. Hence, the slope of the exogenous
construct X dependents upon the level of the latent segmentation variable Y. In order to properly assess the
interaction effect, there are basically four approaches available (Henseler & Chin, 2010, p. 84): the product term
approach, the orthogonalizing approach, a hybrid and a two-stage approach (for a more detailed introduction to
these approaches, see Henseler & Chin, 2010). Considering its relatively high level of statistical power in cases of
many indicators and observations, its ease of use, and its applicability to formative measurement models, this study
gives preference to the two-stage approach for creating interaction terms (Hair, et al., 2016 p. 253; Henseler, et al.,
2010 p. 724). Essentially, this method runs the main effect PLS path model in the first stage in order to obtain
latent variable scores (Henseler & Fassott, 2010, p. 724). In the second stage, the interaction term is modelled as
the element-wise product of the standardised factor score estimates. To determine path coefficients, the interaction
term is then utilised as an independent variable in a multiple linear regression on the endogenous variable score.
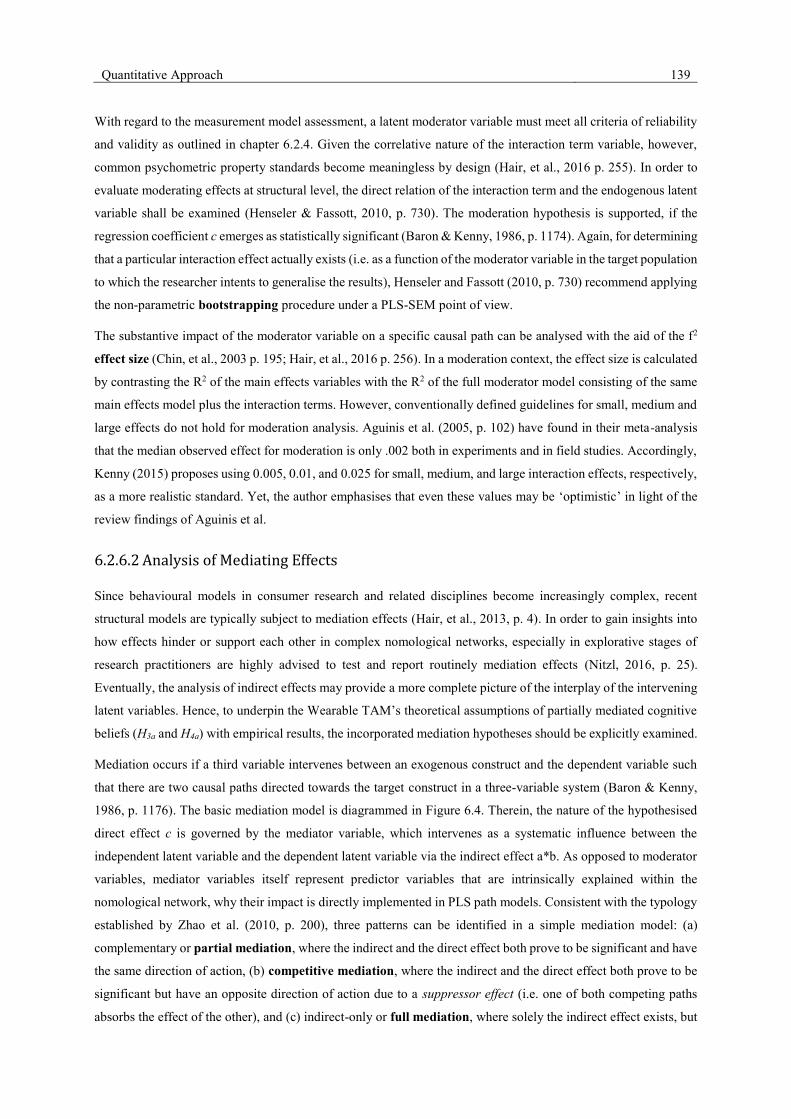
Quantitative Approach 139
With regard to the measurement model assessment, a latent moderator variable must meet all criteria of reliability
and validity as outlined in chapter 6.2.4. Given the correlative nature of the interaction term variable, however,
common psychometric property standards become meaningless by design (Hair, et al., 2016 p. 255). In order to
evaluate moderating effects at structural level, the direct relation of the interaction term and the endogenous latent
variable shall be examined (Henseler & Fassott, 2010, p. 730). The moderation hypothesis is supported, if the
regression coefficient c emerges as statistically significant (Baron & Kenny, 1986, p. 1174). Again, for determining
that a particular interaction effect actually exists (i.e. as a function of the moderator variable in the target population
to which the researcher intents to generalise the results), Henseler and Fassott (2010, p. 730) recommend applying
the non-parametric bootstrapping procedure under a PLS-SEM point of view.
The substantive impact of the moderator variable on a specific causal path can be analysed with the aid of the f2
effect size (Chin, et al., 2003 p. 195; Hair, et al., 2016 p. 256). In a moderation context, the effect size is calculated
by contrasting the R2 of the main effects variables with the R2 of the full moderator model consisting of the same
main effects model plus the interaction terms. However, conventionally defined guidelines for small, medium and
large effects do not hold for moderation analysis. Aguinis et al. (2005, p. 102) have found in their meta-analysis
that the median observed effect for moderation is only .002 both in experiments and in field studies. Accordingly,
Kenny (2015) proposes using 0.005, 0.01, and 0.025 for small, medium, and large interaction effects, respectively,
as a more realistic standard. Yet, the author emphasises that even these values may be ‘optimistic’ in light of the
review findings of Aguinis et al.
6.2.6.2 Analysis of Mediating Effects
Since behavioural models in consumer research and related disciplines become increasingly complex, recent
structural models are typically subject to mediation effects (Hair, et al., 2013, p. 4). In order to gain insights into
how effects hinder or support each other in complex nomological networks, especially in explorative stages of
research practitioners are highly advised to test and report routinely mediation effects (Nitzl, 2016, p. 25).
Eventually, the analysis of indirect effects may provide a more complete picture of the interplay of the intervening
latent variables. Hence, to underpin the Wearable TAM’s theoretical assumptions of partially mediated cognitive
beliefs (H3a and H4a) with empirical results, the incorporated mediation hypotheses should be explicitly examined.
Mediation occurs if a third variable intervenes between an exogenous construct and the dependent variable such
that there are two causal paths directed towards the target construct in a three-variable system (Baron & Kenny,
1986, p. 1176). The basic mediation model is diagrammed in Figure 6.4. Therein, the nature of the hypothesised
direct effect c is governed by the mediator variable, which intervenes as a systematic influence between the
independent latent variable and the dependent latent variable via the indirect effect a*b. As opposed to moderator
variables, mediator variables itself represent predictor variables that are intrinsically explained within the
nomological network, why their impact is directly implemented in PLS path models. Consistent with the typology
established by Zhao et al. (2010, p. 200), three patterns can be identified in a simple mediation model: (a)
complementary or partial mediation, where the indirect and the direct effect both prove to be significant and have
the same direction of action, (b) competitive mediation, where the indirect and the direct effect both prove to be
significant but have an opposite direction of action due to a suppressor effect (i.e. one of both competing paths
absorbs the effect of the other), and (c) indirect-only or full mediation, where solely the indirect effect exists, but

140 Quantitative Approach
not the direct one. Determining the type of mediation requires analysing the respective partial structures of the
three-variable system separately.
Again, testing for the quality of statistical mediation models necessitates all involved latent variables to meet both
the psychometric properties and the quality criteria for structural path models as proposed in the previous
subchapters (Hair, et al., 2016 p. 235). Notably, prior research analyses of the significance of mediational models
were dominated by the Sobel z-test (Sobel, 1982, p. 290 ff.) as recommended by Baron and Kenny in (1986, p.
1177). The Sobel test compares the strength of the indirect effect a*b with the squared standard errors of the
structural parameters a and b. However, this formula assumes multivariate normality for the standard error of the
distribution of the indirect effect a*b. In addition, Preacher and Hayes found that the z-test statistic is low in power
compared to bootstrap techniques (2004, p. 722). Therefore, Zhao et al. (2010, p. 204) advise strongly against the
use of the normal-theory approach by Sobel. Instead, researchers should perform bootstrap tests for determining
mediation effects.
Figure 6.4: General PLS mediation model (Based on Baron & Kenny, 1986, p. 1176)
Complementary to the analysis of the significance of mediating effects, the relative magnitude of the indirect effect
can be quantified by means of the variance accounted for (VAF) measure (Eberl, 2010, p. 500). The VAF
criterion depicts the ratio of the indirect effect (a*b) over the total effect (a*b+c) on the outcome variable. This
quotient expresses what proportion of the total effect of the predictor is due to the indirect effect. In case of a full
mediation the VAF measure takes on the value of 1.00, since the outcome variable’s variance is then fully
explained by the mediation process. Conversely, VAF estimates can become negative or even exceed the value of
1.00 if suppression occurs (Shrout & Bolger, 2002, p. 434). Given that the indirect pathways are significant, as a
rule of thumb a VAF value between 0.20 and 0.80 indicates a typical partial mediation, whereas a mediation
proportion greater than 80% characterises a full mediation (Nitzl, 2016, p. 20). Nonetheless, even though the VAF
criterion may provide deeper insights into mediation models, this measure should be interpreted with caution,
particularly in situations where suppression is present (i.e. in cases of competitive mediation or negative mediation
proportions, c.f. ibid).
6.2.6.3 Analysis of Higher-Order Structures
In addition to unidimensional measurement models, latent variables can also be conceptualized in terms of higher-
order hierarchical constructs, which involve more than one dimension (Wetzels, et al., 2009, p. 178; Jarvis, et al.,
2003, p. 204; Chin, 1998b). Higher-order latent variables are therefore not directly connected to manifest measures.
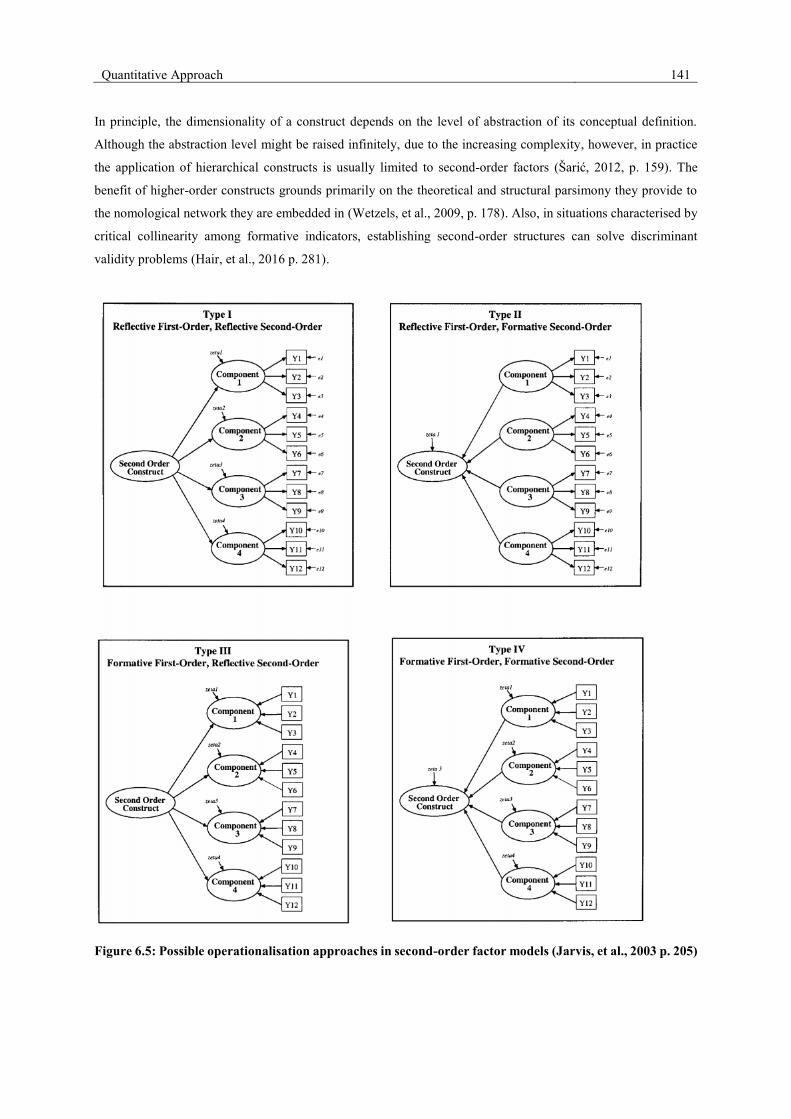
Quantitative Approach 141
In principle, the dimensionality of a construct depends on the level of abstraction of its conceptual definition.
Although the abstraction level might be raised infinitely, due to the increasing complexity, however, in practice
the application of hierarchical constructs is usually limited to second-order factors (Šarić, 2012, p. 159). The
benefit of higher-order constructs grounds primarily on the theoretical and structural parsimony they provide to
the nomological network they are embedded in (Wetzels, et al., 2009, p. 178). Also, in situations characterised by
critical collinearity among formative indicators, establishing second-order structures can solve discriminant
validity problems (Hair, et al., 2016 p. 281).
Figure 6.5: Possible operationalisation approaches in second-order factor models (Jarvis, et al., 2003 p. 205)
142 Quantitative Approach
As is apparent from the two possible measurement philosophies for each of both levels of a second-order model,
there are four alternative conceptualisation approaches for hierarchical models as illustrated in Figure 6.5:
• Type I (reflective-reflective): This hierarchical model contains only reflective measures at both first-
and second-order level. However, since the second-order construct might just as well be measured
directly by means of the second-order indicators, some researchers question the purpose of such models
(Šarić, 2012, p. 160).
• Type II (reflective-formative): This model consists of reflective indicators for the first-order latent
variables and formative first-order constructs that are, themselves, indicators for the underlying second-
order construct. Since the error term is measured at the level of the manifest measures associated with
the first-order constructs, this model is considered the most suitable type.
• Type III (formative-reflective): From a conceptual perspective, this model is particularly problematic,
as the first-order latent variables, which are measured formatively, represent themselves reflective and,
thus, interchangeable indicators.
• Type IV (formative-formative): Here, both the first-order and the second-order constructs are
conceptualised according to the formative mode, what may be particularly fruitful for success driver
studies.
In the present study, the latent variables Perceived Pervasiveness and Perceived IT Security Risk are defined as
Type II second-order constructs (see chapter 6.3 on the operationalisation of the reflective, lower-order
measurement models).
In technical terms, there are three approaches to model hierarchical latent variables in PLS-SEM: (1) the repeated
indicator approach, (2) the two-stage approach, and (3) the hybrid approach (Wilson & Henseler, 2007, p. 791 ff.;
Becker, et al., 2012, p. 365 ff.). The repeated indicator approach, originally suggested by Wold in (1982), uses
the indicators of all first-order constructs as direct measurement variables at higher level to operationalise a second-
order latent variable. This remedy allows estimating the higher-order and lower-order dimensions simultaneously
by means of standard PLS algorithms. Results from a Monte Carlo simulation study show that this modelling
approach should be used for Type II hierarchical component models, as it produces more precise parameter
estimates and more reliable higher-order factor scores (Becker, et al., 2012, p. 376). However, when modeling
formative hierarchical component models (Type II and Type IV), almost all of the higher-order constructs’
variance is explained by the lower-order layer. This may prove problematic from an overarching nomological
network perspective, since any further structural path that points to the focal multidimensional construct will render
insignificant due to the model’s artificially correlated residuals (Ringle, et al., 2012, p. 8). In addition, according
to the research community, the repeated indicator approach is only advisable if the first-order constructs are
measured by the same number of indicators (Becker, et al., 2012, p. 366), a condition which is nevertheless met in
this study.
Contrarily, for the two-stage approach, the factor scores of the latent first-order constructs are computed in a first
stage analysis without incorporating the second-order dimension. Subsequently, these first-stage construct scores
are used as manifest variables for the higher-order latent construct in a second-stage model. Similar to the repeated
Quantitative Approach 143
indicator approach, the hybrid approach repeats the manifest variables of the fist-order constructs at second-order
level. However, this technique splits all indicators randomly so that half of the measures are represented on the
first-order latent predictor and the other half are represented on the second-order construct side (Wilson &
Henseler, 2007, p. 792). Hereby, each indicator is used only once in a model. This may overcome the criticism
towards the interpretational confounding introduced by the two-stage approach. On the downside, however, the
hybrid approach diminishes the reliability of the measurement models having only half the number of manifest
variables. In the context of PLS-SEM, which is known to be ‘consistent at large’, this appears particularly
problematic.
Given that the study-inherent higher-order factor model Perceived IT Security Risk represents an endogenous
construct and that its first-order latent variables have an equal number of indicators, this study uses a mixture of
the repeated indicator approach and the two-stage approach as recommended in (Ringle, et al., 2012, p. 8): In the
first stage, the repeated indicator approach is utilised to obtain the latent factor scores for the lower-order
constructs, which then, in the second stage analysis, can serve as indicators for the higher-order construct.
Principally, reflective-formative second-order constructs are subject to the same assessment criteria as first-order
formative constructs (see chapter 6.2.5), i.e. they have to be evaluated by means of indicator weights, significance
of weights, and multicollinearity of indicators (Becker, et al., 2012, p. 376 f.). Finally, it should be noted that Type
II models require the use of the inner path-weighting scheme to ensure more precise parameter estimates and a
more reliable second-order factor score (ibid.).
6.3 Operationalisation of Constructs
According to the two-language-theory by Carnap (1966), theoretical concepts have to be translated into
corresponding terms at empirical level in order to become quantifiable. Operationalisation thus relies on the
assumption that latent constructs can be inferred from their observable effects. Therefore, applying the logic of
‘content sampling’, appropriate indicators or descriptive items have to be identified, which are based on the
conceptual domain of the construct in question and entirely cover its semantic scope (Hox, 1997, p. 60 f.). The
following sections delineate the selection of appropriate measurement instruments for each of the study-inherent
traits and behavioural attributes.
Following the recommendations and common practice in psychometrics (Churchill, 1979 p. 66; Hair, et al., 2016
p. 45), the operationalisation of the Wearable TAM variables relied thoroughly on approved measurement models
in personality psychology, marketing, and Information Systems research. These scales are characterized by a high
reliability and validity as evidenced by prior research. Since this study focusses on the emerging phenomenon of
wearable computing acceptance, some adaptions, however, had to be made to calibrate the theoretical concepts to
the given study context. Furthermore, given that multiple-item scales are often psychometrically superior to single-
item scales and that all of the main constructs in this study refer to conceptually more abstract, subjective
phenomena which are perceived as heterogonous by raters, exclusively multi-item scales were employed (cf.
Rossiter, 2011, p. 1566 ff.). As opposed to ‘global’ single-item questions, multi-item measures facilitate tests of
the internal consistency of latent variables and increase scale precision by enabling the discrimination of finer
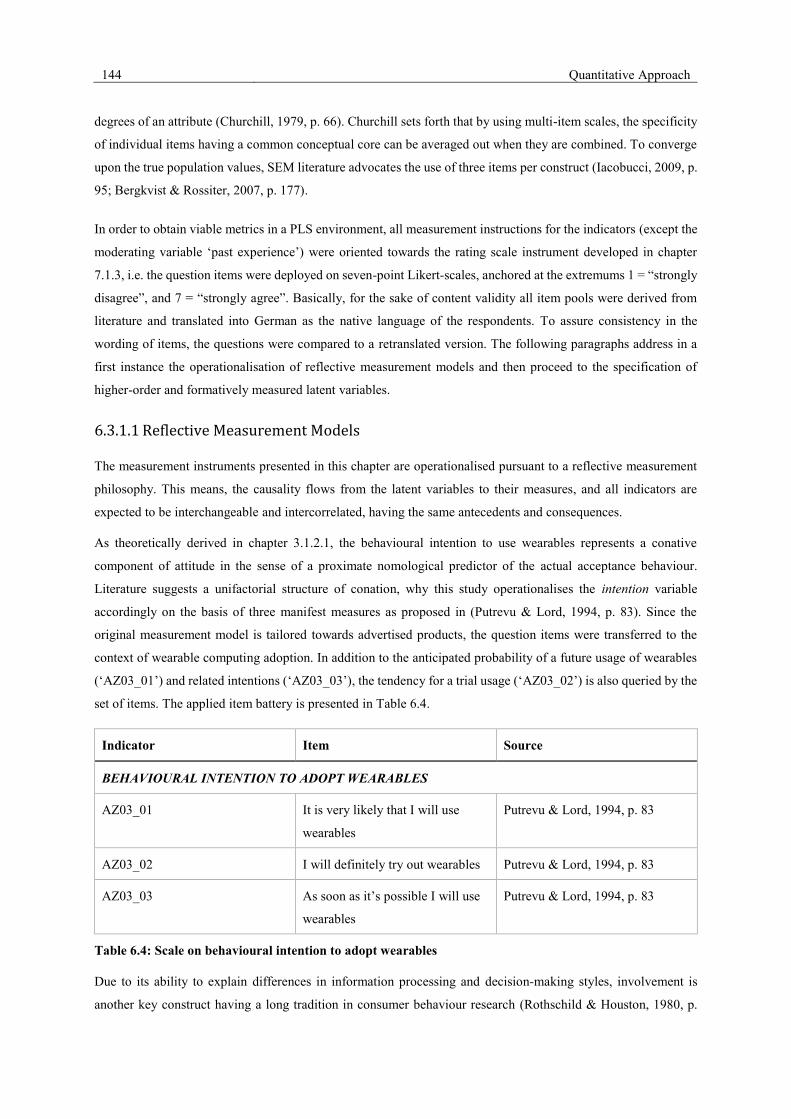
144 Quantitative Approach
degrees of an attribute (Churchill, 1979, p. 66). Churchill sets forth that by using multi-item scales, the specificity
of individual items having a common conceptual core can be averaged out when they are combined. To converge
upon the true population values, SEM literature advocates the use of three items per construct (Iacobucci, 2009, p.
95; Bergkvist & Rossiter, 2007, p. 177).
In order to obtain viable metrics in a PLS environment, all measurement instructions for the indicators (except the
moderating variable ‘past experience’) were oriented towards the rating scale instrument developed in chapter
7.1.3, i.e. the question items were deployed on seven-point Likert-scales, anchored at the extremums 1 = “strongly
disagree”, and 7 = “strongly agree”. Basically, for the sake of content validity all item pools were derived from
literature and translated into German as the native language of the respondents. To assure consistency in the
wording of items, the questions were compared to a retranslated version. The following paragraphs address in a
first instance the operationalisation of reflective measurement models and then proceed to the specification of
higher-order and formatively measured latent variables.
6.3.1.1 Reflective Measurement Models
The measurement instruments presented in this chapter are operationalised pursuant to a reflective measurement
philosophy. This means, the causality flows from the latent variables to their measures, and all indicators are
expected to be interchangeable and intercorrelated, having the same antecedents and consequences.
As theoretically derived in chapter 3.1.2.1, the behavioural intention to use wearables represents a conative
component of attitude in the sense of a proximate nomological predictor of the actual acceptance behaviour.
Literature suggests a unifactorial structure of conation, why this study operationalises the intention variable
accordingly on the basis of three manifest measures as proposed in (Putrevu & Lord, 1994, p. 83). Since the
original measurement model is tailored towards advertised products, the question items were transferred to the
context of wearable computing adoption. In addition to the anticipated probability of a future usage of wearables
(‘AZ03_01’) and related intentions (‘AZ03_03’), the tendency for a trial usage (‘AZ03_02’) is also queried by the
set of items. The applied item battery is presented in Table 6.4.
Indicator Item Source
BEHAVIOURAL INTENTION TO ADOPT WEARABLES
AZ03_01 It is very likely that I will use
wearables
Putrevu & Lord, 1994, p. 83
AZ03_02 I will definitely try out wearables Putrevu & Lord, 1994, p. 83
AZ03_03 As soon as it’s possible I will use
wearables
Putrevu & Lord, 1994, p. 83
Table 6.4: Scale on behavioural intention to adopt wearables
Due to its ability to explain differences in information processing and decision-making styles, involvement is
another key construct having a long tradition in consumer behaviour research (Rothschild & Houston, 1980, p.
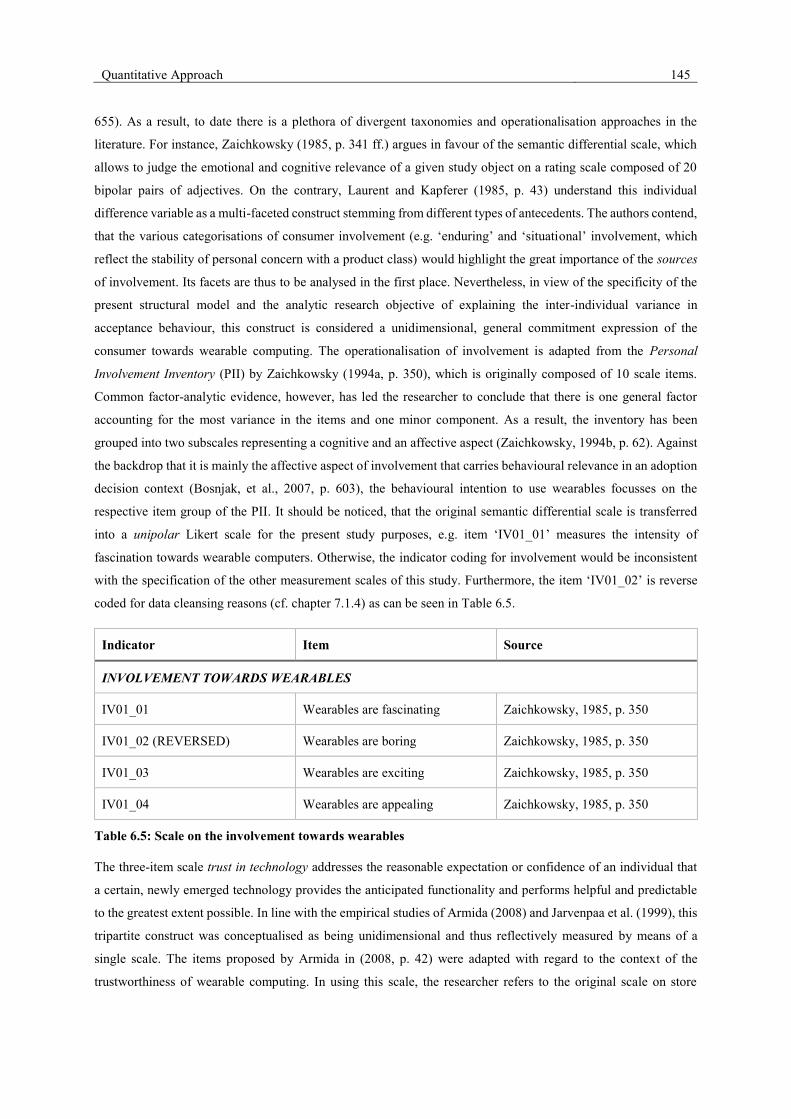
Quantitative Approach 145
655). As a result, to date there is a plethora of divergent taxonomies and operationalisation approaches in the
literature. For instance, Zaichkowsky (1985, p. 341 ff.) argues in favour of the semantic differential scale, which
allows to judge the emotional and cognitive relevance of a given study object on a rating scale composed of 20
bipolar pairs of adjectives. On the contrary, Laurent and Kapferer (1985, p. 43) understand this individual
difference variable as a multi-faceted construct stemming from different types of antecedents. The authors contend,
that the various categorisations of consumer involvement (e.g. ‘enduring’ and ‘situational’ involvement, which
reflect the stability of personal concern with a product class) would highlight the great importance of the sources
of involvement. Its facets are thus to be analysed in the first place. Nevertheless, in view of the specificity of the
present structural model and the analytic research objective of explaining the inter-individual variance in
acceptance behaviour, this construct is considered a unidimensional, general commitment expression of the
consumer towards wearable computing. The operationalisation of involvement is adapted from the Personal
Involvement Inventory (PII) by Zaichkowsky (1994a, p. 350), which is originally composed of 10 scale items.
Common factor-analytic evidence, however, has led the researcher to conclude that there is one general factor
accounting for the most variance in the items and one minor component. As a result, the inventory has been
grouped into two subscales representing a cognitive and an affective aspect (Zaichkowsky, 1994b, p. 62). Against
the backdrop that it is mainly the affective aspect of involvement that carries behavioural relevance in an adoption
decision context (Bosnjak, et al., 2007, p. 603), the behavioural intention to use wearables focusses on the
respective item group of the PII. It should be noticed, that the original semantic differential scale is transferred
into a unipolar Likert scale for the present study purposes, e.g. item ‘IV01_01’ measures the intensity of
fascination towards wearable computers. Otherwise, the indicator coding for involvement would be inconsistent
with the specification of the other measurement scales of this study. Furthermore, the item ‘IV01_02’ is reverse
coded for data cleansing reasons (cf. chapter 7.1.4) as can be seen in Table 6.5.
Indicator Item Source
INVOLVEMENT TOWARDS WEARABLES
IV01_01 Wearables are fascinating Zaichkowsky, 1985, p. 350
IV01_02 (REVERSED) Wearables are boring Zaichkowsky, 1985, p. 350
IV01_03 Wearables are exciting Zaichkowsky, 1985, p. 350
IV01_04 Wearables are appealing Zaichkowsky, 1985, p. 350
Table 6.5: Scale on the involvement towards wearables
The three-item scale trust in technology addresses the reasonable expectation or confidence of an individual that
a certain, newly emerged technology provides the anticipated functionality and performs helpful and predictable
to the greatest extent possible. In line with the empirical studies of Armida (2008) and Jarvenpaa et al. (1999), this
tripartite construct was conceptualised as being unidimensional and thus reflectively measured by means of a
single scale. The items proposed by Armida in (2008, p. 42) were adapted with regard to the context of the
trustworthiness of wearable computing. In using this scale, the researcher refers to the original scale on store
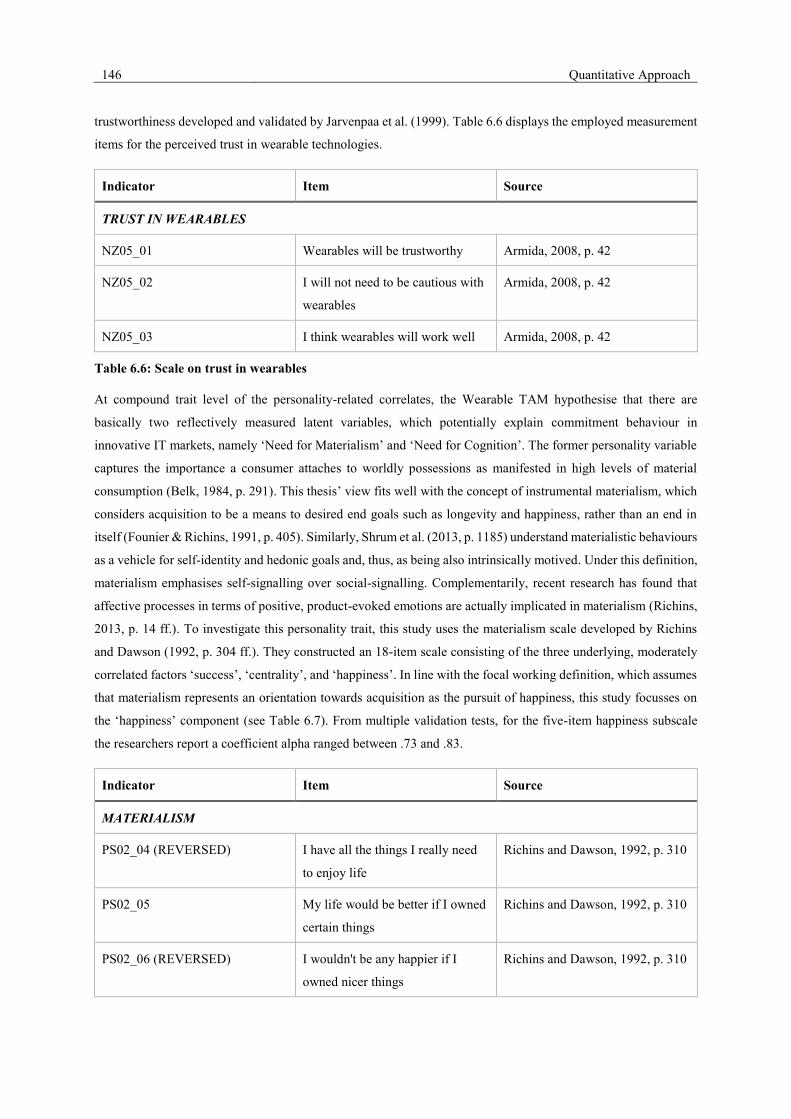
146 Quantitative Approach
trustworthiness developed and validated by Jarvenpaa et al. (1999). Table 6.6 displays the employed measurement
items for the perceived trust in wearable technologies.
Indicator Item Source
TRUST IN WEARABLES
NZ05_01 Wearables will be trustworthy Armida, 2008, p. 42
NZ05_02 I will not need to be cautious with
wearables
Armida, 2008, p. 42
NZ05_03 I think wearables will work well Armida, 2008, p. 42
Table 6.6: Scale on trust in wearables
At compound trait level of the personality-related correlates, the Wearable TAM hypothesise that there are
basically two reflectively measured latent variables, which potentially explain commitment behaviour in
innovative IT markets, namely ‘Need for Materialism’ and ‘Need for Cognition’. The former personality variable
captures the importance a consumer attaches to worldly possessions as manifested in high levels of material
consumption (Belk, 1984, p. 291). This thesis’ view fits well with the concept of instrumental materialism, which
considers acquisition to be a means to desired end goals such as longevity and happiness, rather than an end in
itself (Founier & Richins, 1991, p. 405). Similarly, Shrum et al. (2013, p. 1185) understand materialistic behaviours
as a vehicle for self-identity and hedonic goals and, thus, as being also intrinsically motived. Under this definition,
materialism emphasises self-signalling over social-signalling. Complementarily, recent research has found that
affective processes in terms of positive, product-evoked emotions are actually implicated in materialism (Richins,
2013, p. 14 ff.). To investigate this personality trait, this study uses the materialism scale developed by Richins
and Dawson (1992, p. 304 ff.). They constructed an 18-item scale consisting of the three underlying, moderately
correlated factors ‘success’, ‘centrality’, and ‘happiness’. In line with the focal working definition, which assumes
that materialism represents an orientation towards acquisition as the pursuit of happiness, this study focusses on
the ‘happiness’ component (see Table 6.7). From multiple validation tests, for the five-item happiness subscale
the researchers report a coefficient alpha ranged between .73 and .83.
Indicator Item Source
MATERIALISM
PS02_04 (REVERSED) I have all the things I really need
to enjoy life
Richins and Dawson, 1992, p. 310
PS02_05 My life would be better if I owned
certain things
Richins and Dawson, 1992, p. 310
PS02_06 (REVERSED) I wouldn't be any happier if I
owned nicer things
Richins and Dawson, 1992, p. 310

Quantitative Approach 147
Indicator Item Source
PS02_07 I'd be happier if I could afford to
buy more
Richins and Dawson, 1992, p. 310
PS02_08 It sometimes bothers me that I
can't afford to buy all the things I'd
like
Richins and Dawson, 1992, p. 310
Table 6.7: Scale on materialism
In contrast to materialism, the second trait ‘Need for Cognition’ (NFC) describes the intrinsic enjoyment
individuals derive from engaging in effortful cognitive endeavours (Petty, et al., 1986, p. 1033; Fortier & Burkell,
2014, p. 2). This motivational factor varies along a bipolar continuum form a high to low dispositional tendency
to expend cognitive effort. Individuals high in need for cognition naturally tend to seek information, prefer
complexity and enjoy cognitive stimulation, whereas individuals low in need for cognition are more likely to rely
on cognitive heuristics or cues as primary basis for their judgements (Cacioppo, et al., 1996, p. 198). This relatively
stable (albeit not invariant) personality trait was operationalised using four items from the original NFC-scale
propagated by Cacioppo et al. (1982, p. 121). As demonstrated in earlier research studies, this measurement
instrument is characterized by high reliability and validity (Sadowski, 1993, p. 453). However, during the pre-test
half of the respondents stated that one item (“I primarily think because I have to”, reversed item no. 25 from the
original NFC-scale) would be less comprehensible and meaningful. This item was therefore excluded from the
final questionnaire (see Table 6.8).
Indicator Item Source
NEED FOR COGNITION
PS03_01 (REVERSED) Simply knowing the answer rather
than understanding the reasons for
the answer to a problem is fine with
me
Cacioppo et al., 1982, p. 121
PS03_02 I prefer my life to be filled with
puzzles that I solve
Cacioppo et al., 1982, p. 121
PS03_04 I would prefer complex to simple
problems
Cacioppo et al., 1982, p. 121
Table 6.8: Scale on need for cognition
Against the backdrop that personality characteristics do relate to socio-economic factors such as occupational
attainment, in social sciences and Information Systems research there is a growing interest to extend the scope of
research models without psychological focus to the realm of personality psychology (Hahn, et al., 2012, p. 355;
Devaraj, et al., 2008, p. 93). Likewise, this study attempts to integrate latent individual traits into the technology
acceptance model in order to explore their influence on IT adoption behaviour. According to the influential and
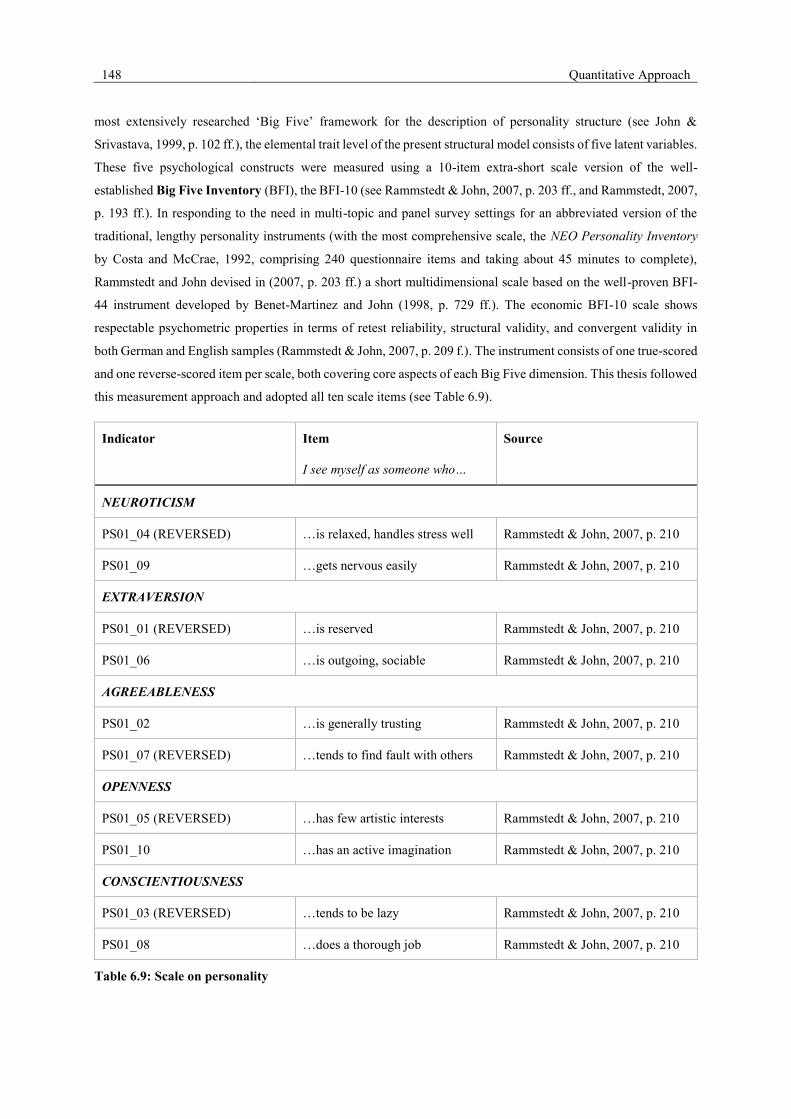
148 Quantitative Approach
most extensively researched ‘Big Five’ framework for the description of personality structure (see John &
Srivastava, 1999, p. 102 ff.), the elemental trait level of the present structural model consists of five latent variables.
These five psychological constructs were measured using a 10-item extra-short scale version of the well-
established Big Five Inventory (BFI), the BFI-10 (see Rammstedt & John, 2007, p. 203 ff., and Rammstedt, 2007,
p. 193 ff.). In responding to the need in multi-topic and panel survey settings for an abbreviated version of the
traditional, lengthy personality instruments (with the most comprehensive scale, the NEO Personality Inventory
by Costa and McCrae, 1992, comprising 240 questionnaire items and taking about 45 minutes to complete),
Rammstedt and John devised in (2007, p. 203 ff.) a short multidimensional scale based on the well-proven BFI-
44 instrument developed by Benet-Martinez and John (1998, p. 729 ff.). The economic BFI-10 scale shows
respectable psychometric properties in terms of retest reliability, structural validity, and convergent validity in
both German and English samples (Rammstedt & John, 2007, p. 209 f.). The instrument consists of one true-scored
and one reverse-scored item per scale, both covering core aspects of each Big Five dimension. This thesis followed
this measurement approach and adopted all ten scale items (see Table 6.9).
Indicator
Item
I see myself as someone who…
Source
NEUROTICISM
PS01_04 (REVERSED) …is relaxed, handles stress well Rammstedt & John, 2007, p. 210
PS01_09 …gets nervous easily Rammstedt & John, 2007, p. 210
EXTRAVERSION
PS01_01 (REVERSED) …is reserved Rammstedt & John, 2007, p. 210
PS01_06 …is outgoing, sociable Rammstedt & John, 2007, p. 210
AGREEABLENESS
PS01_02 …is generally trusting Rammstedt & John, 2007, p. 210
PS01_07 (REVERSED) …tends to find fault with others Rammstedt & John, 2007, p. 210
OPENNESS
PS01_05 (REVERSED) …has few artistic interests Rammstedt & John, 2007, p. 210
PS01_10 …has an active imagination Rammstedt & John, 2007, p. 210
CONSCIENTIOUSNESS
PS01_03 (REVERSED) …tends to be lazy Rammstedt & John, 2007, p. 210
PS01_08 …does a thorough job Rammstedt & John, 2007, p. 210
Table 6.9: Scale on personality
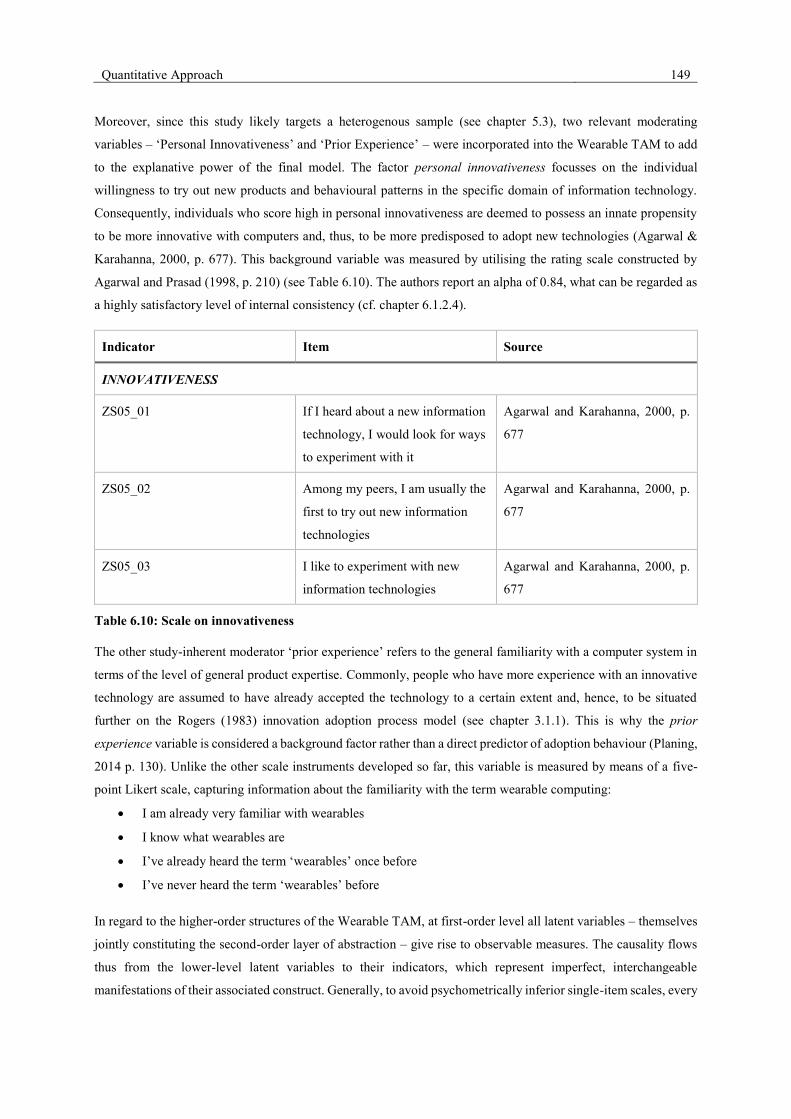
Quantitative Approach 149
Moreover, since this study likely targets a heterogenous sample (see chapter 5.3), two relevant moderating
variables – ‘Personal Innovativeness’ and ‘Prior Experience’ – were incorporated into the Wearable TAM to add
to the explanative power of the final model. The factor personal innovativeness focusses on the individual
willingness to try out new products and behavioural patterns in the specific domain of information technology.
Consequently, individuals who score high in personal innovativeness are deemed to possess an innate propensity
to be more innovative with computers and, thus, to be more predisposed to adopt new technologies (Agarwal &
Karahanna, 2000, p. 677). This background variable was measured by utilising the rating scale constructed by
Agarwal and Prasad (1998, p. 210) (see Table 6.10). The authors report an alpha of 0.84, what can be regarded as
a highly satisfactory level of internal consistency (cf. chapter 6.1.2.4).
Indicator Item Source
INNOVATIVENESS
ZS05_01 If I heard about a new information
technology, I would look for ways
to experiment with it
Agarwal and Karahanna, 2000, p.
677
ZS05_02 Among my peers, I am usually the
first to try out new information
technologies
Agarwal and Karahanna, 2000, p.
677
ZS05_03 I like to experiment with new
information technologies
Agarwal and Karahanna, 2000, p.
677
Table 6.10: Scale on innovativeness
The other study-inherent moderator ‘prior experience’ refers to the general familiarity with a computer system in
terms of the level of general product expertise. Commonly, people who have more experience with an innovative
technology are assumed to have already accepted the technology to a certain extent and, hence, to be situated
further on the Rogers (1983) innovation adoption process model (see chapter 3.1.1). This is why the prior
experience variable is considered a background factor rather than a direct predictor of adoption behaviour (Planing,
2014 p. 130). Unlike the other scale instruments developed so far, this variable is measured by means of a five-
point Likert scale, capturing information about the familiarity with the term wearable computing:
• I am already very familiar with wearables
• I know what wearables are
• I’ve already heard the term ‘wearables’ once before
• I’ve never heard the term ‘wearables’ before
In regard to the higher-order structures of the Wearable TAM, at first-order level all latent variables – themselves
jointly constituting the second-order layer of abstraction – give rise to observable measures. The causality flows
thus from the lower-level latent variables to their indicators, which represent imperfect, interchangeable
manifestations of their associated construct. Generally, to avoid psychometrically inferior single-item scales, every

150 Quantitative Approach
lower-order latent variable was operationalised by means of at least three reflective indicators. In the following
section, the operationalisation of the hierarchical component models is approached.
6.3.1.2 Higher-order Constructs
As indicated by the exploratory study findings in chapter 4.3, one striking feature which primarily generates the
added benefit in a ubiquitous computing context is the perceived pervasiveness of a technology. According to the
pioneering work of Karaiskos (2009, p. 174), the conceptual scope of the abstract pervasiveness construct is made
up of three reflectively measured independent dimensions, namely ubiquity, unobtrusiveness and context
awareness. Even though the author inductively derives and acknowledges the compound, multidimensional nature
of the pervasiveness construct, his study does not investigate the joint effect of the partial aspects at structural
model level. This view does not allow for exploring the individual impact of each pervasiveness facet on its
mediating, global second-order construct. Also, the unique explanatory capacity of the overall perceived
pervasiveness remains logically concealed. To address this theoretical and conceptual issue, the three
pervasiveness subdimensions are conceived as formative indicators in the present study. The Ubiquity scale
reflects the system’s mobility and availability, whereas the Unobtrusiveness measurement items tap into the level
of felt distraction or cognitive load caused by the technology. Complementarily, the Context Awareness inventory
addresses the system’s adaptability, proactivity, and the information relevancy it provides. Karaiskos’
multidimensional scale of pervasiveness produced alpha values above .840 for all facets (2009, p.143). However,
the original indicator batteries involve more than 7 question items per construct. Therefore, in order to decrease
respondent fatigue and to avoid aborts, the sub-scales were reduced to three and five items. The items were adapted
to measure the dimensions of pervasiveness with respect to wearable computers. Table 6.11 shows the employed
measurement scale.
Indicator Item Source
UBIQUITY
PV03_01 The wearable is available to use
wherever I need it
Karaiskos, 2009, p. 151
PV03_02 The wearable is available to use
whenever I need it
Karaiskos, 2009, p. 151
PV03_03 I am able to use the wearable
anytime
Karaiskos, 2009, p. 151
PV03_04 The wearable is accessible
everywhere
Karaiskos, 2009, p. 151
PV03_05 The wearable is always available
to me
Karaiskos, 2009, p. 151

Quantitative Approach 151
Indicator Item Source
UNOBTRUSIVENESS
PV02_01 My attention does not need to be
focused on the wearable the whole
time
Karaiskos, 2009, p. 151
PV02_02 I don’t have to concentrate fully
on the wearable when using it
Karaiskos, 2009, p. 151
PV02_03 The usage of the wearable does
not disrupt me from other
activities
Karaiskos, 2009, p. 151
PV02_04 The wearable does not distract me
too often
Karaiskos, 2009, p. 152
PV02_05 The wearable does not require
continuous attention
Karaiskos, 2009, p. 152
CONTEXT AWARENESS
PV01_01 Wearables are able to adapt to
changing conditions (e.g. show
track and heart rate during sports)
Karaiskos, 2009, p. 152
PV01_02 Wearables automatically adapt to
the situation at hand
Karaiskos, 2009, p. 152
PV01_03 Wearables can automatically
trigger actions relevant to the
situation (e.g. in the case of
smartwatches displaying the time
when turning the wrist)
Karaiskos, 2009, p. 152
Table 6.11: Scale on pervasiveness
The second model-relevant construct having a more complex factor structure refers to the subjectively perceived
IT security risk. In line with the classical conceptualisation in IT security literature, this construct was specified in
terms of a formative second-order latent variable, which is composed of the sub-dimensions confidentiality,
integrity, and availability. The latter two facets were operationalised by using the respective three-item-scales
from Hartono et al. (2014, p. 19). The items, which originally assess electronic commerce transactions, were
adapted to the special characteristics of wearable computing. Because the former scale on confidentiality
developed by Hartono and colleagues (ibid.) does not fit the need of this study, the instrument was replaced by a
more appropriate measurement scale taken from Dillon and Lending (2010, p. 29). Their empirical acceptance
study investigates the privacy of patient-care Information Systems in hospitals and can be easily transferred to the

152 Quantitative Approach
given study object. The researchers reported an alpha of .81 for their original privacy measure, which consists of
five items. Two of these items, however, focus strongly on the peculiarities of patient-care systems. Therefore,
only the remaining three items were adapted for the present study (see Table 6.12).
Indicator Item Source
AVAILABILITY
NZ02_04 I could not use the wearable due to
hardware failure (e.g. defective
sensors)
Hartono et al., 2014, p. 19
NZ02_05 I could not use the wearable due to
network failure
Hartono et al., 2014, p. 19
NZ02_06 I could not use the wearable due to
software failure (e.g. crashing
apps)
Hartono et al., 2014, p. 19
INTEGRITY
NZ06_01 My data could be processed or
transmitted incorrectly by the
wearable
Hartono et al., 2014, p. 19
NZ06_02 The recorded data could be altered Hartono et al., 2014, p. 19
NZ06_03 The recorded information could be
incorrect
Hartono et al., 2014, p. 19
CONFIDENTIALITY
NZ07_01 I would feel my recorded data
would not be secure from
unauthorised use
Dillon and Lending, 2010, p. 29
NZ07_02 My recorded data could be used
fraudulently by third parties
Dillon and Lending, 2010, p. 29
NZ07_03 Others could easily read
confidential data recorded by my
wearable
Dillon and Lending, 2010, p. 29
Table 6.12: Scale on perceived IT security
6.3.1.3 Formative Measurement Model
The utility characteristics of wearable computers are aggregated into a formative index describing the perceived
potential of wearables for enhancing one’s life. The formative specification of the usefulness measure may provide
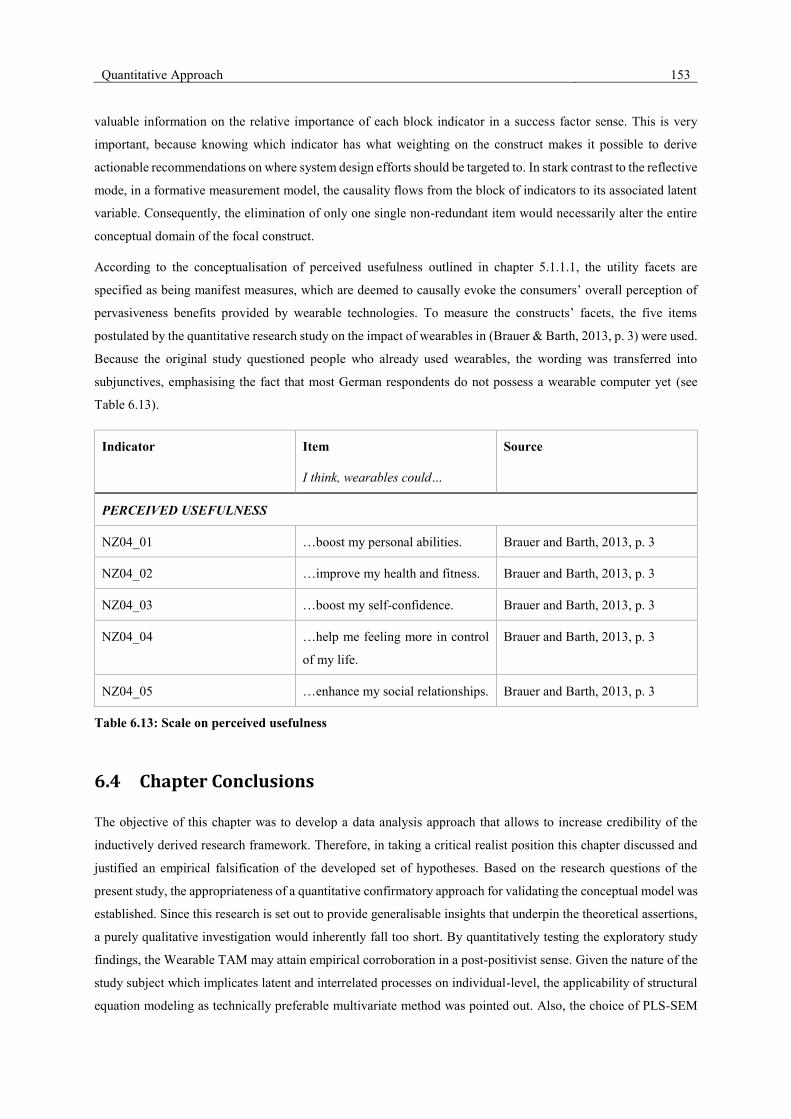
Quantitative Approach 153
valuable information on the relative importance of each block indicator in a success factor sense. This is very
important, because knowing which indicator has what weighting on the construct makes it possible to derive
actionable recommendations on where system design efforts should be targeted to. In stark contrast to the reflective
mode, in a formative measurement model, the causality flows from the block of indicators to its associated latent
variable. Consequently, the elimination of only one single non-redundant item would necessarily alter the entire
conceptual domain of the focal construct.
According to the conceptualisation of perceived usefulness outlined in chapter 5.1.1.1, the utility facets are
specified as being manifest measures, which are deemed to causally evoke the consumers’ overall perception of
pervasiveness benefits provided by wearable technologies. To measure the constructs’ facets, the five items
postulated by the quantitative research study on the impact of wearables in (Brauer & Barth, 2013, p. 3) were used.
Because the original study questioned people who already used wearables, the wording was transferred into
subjunctives, emphasising the fact that most German respondents do not possess a wearable computer yet (see
Table 6.13).
Indicator Item
I think, wearables could…
Source
PERCEIVED USEFULNESS
NZ04_01 …boost my personal abilities. Brauer and Barth, 2013, p. 3
NZ04_02 …improve my health and fitness. Brauer and Barth, 2013, p. 3
NZ04_03 …boost my self-confidence. Brauer and Barth, 2013, p. 3
NZ04_04 …help me feeling more in control
of my life.
Brauer and Barth, 2013, p. 3
NZ04_05 …enhance my social relationships. Brauer and Barth, 2013, p. 3
Table 6.13: Scale on perceived usefulness
6.4 Chapter Conclusions
The objective of this chapter was to develop a data analysis approach that allows to increase credibility of the
inductively derived research framework. Therefore, in taking a critical realist position this chapter discussed and
justified an empirical falsification of the developed set of hypotheses. Based on the research questions of the
present study, the appropriateness of a quantitative confirmatory approach for validating the conceptual model was
established. Since this research is set out to provide generalisable insights that underpin the theoretical assertions,
a purely qualitative investigation would inherently fall too short. By quantitatively testing the exploratory study
findings, the Wearable TAM may attain empirical corroboration in a post-positivist sense. Given the nature of the
study subject which implicates latent and interrelated processes on individual-level, the applicability of structural
equation modeling as technically preferable multivariate method was pointed out. Also, the choice of PLS-SEM

154 Quantitative Approach
was justified under consideration of the characteristics of the synthesised Wearable TAM and the research aims.
Subsequently, the relevant assessment criteria for both inner and outer models were presented.
Finally, measurement scales were developed in order to operationalise the hypothetical model constructs that
resulted from the qualitative interviews along with the conceptual study. All items were based on approved and
validated measurement models in literature and adjusted to the study context. Thereby, this research does not
further ‘inflate’ the available body of construct definitions in literature and ensures comparability to other research
models. That way, the theoretical concepts under examination were transformed into measurable factors which
enable a quantitative evaluation of the postulated research model.
Empirical Analysis 155
7 Empirical Analysis
Having determined the philosophical stance as well as both the statistical data analysis method and the
measurement instruments, the next step is to choose appropriate methodologies for answering the two last research
questions. This is done in section 7.1. Then, in sections 7.2 and 7.3 the proposed research model is validated at
both construct and structural level on the basis of the chosen statistical quality criteria. Finally, the yielded
estimation results are interpreted in depth.
7.1 Research Strategy
The formulated nomological net of cause-effect chains has to be examined quantitatively in order to determine
(i.e. corroborate or falsify) correlation in the hypothesised relationships between the selected cognitive and
personality-related acceptance factors. Accordingly, in response to the analytic research objective raised in section
1.2 (“To what extent do the identified factors of the integrative framework affect the acceptance phenomenon?”),
the next research stage aims at either confirming or rejecting the derived hypothetical generalisations by assessing
the quality of the theoretical assumptions against an empirical evidence-base.
Based on this research objective and the inherent validity requirements pertaining to an empirical establishment
of causal inferences, an experimental research design appears to be most appropriate (Hair, et al., 2003 p. 42;
Summers, et al., 2005 p. 120). However, laboratory or field experiments such as test markets are less viable for
the present research purposes from both an economical and methodological viewpoint. Particularly, the proposed
latent predispositions, by their very nature, cannot be manipulated actively within any experimental setup. In
addition, one can hardly hold the various extraneous variables constant, which generally coincide with a complex
nomological net of hypothetical constructs (de Vaus, 2005, p. 19). Following the traditions of empirical social
science and Information Systems research, the present explanatory study therefore implements a nonexperimental,
field-based research design that deals with a cross-section of data of the target population (Fischer, 2010, p. 142;
Radhakrishna & Doamekpor, 2008; Malhotra, et al., 2006, p. 1865).
In view of the newly synthesised behavioural model that focusses on the latent, intrapersonal intention formation
in innovative technology markets, meaningful secondary data is yet lacking within the intended scope. Hence, in
order to be able to conduct the envisaged confirmatory analysis (deductive research) adequately, the required raw
data should be gathered in the course of a primary study. Since survey research is best suited for positivist studies
that focus on individuals as units of analysis (Bhattacherjee, 2012, p. 73), achieving this purpose should thus
involve a field survey of consumer attitudes and perceptions.
In social sciences this vital data collection instrument is one of the most frequently employed techniques to test
theories or hypotheses (Malhotra & Birks, 2007, p. 265). Survey techniques are commonly based upon the use of
structured questionnaires given to a random sample of a specified population (ibid.). They provide a relatively
cost-efficient approach to the study of large samples of respondents what increases the researcher’s ability to make
generalized probabilistic inferences about predetermined segments of social systems (Hair, et al., 2003 p. 256).
Broadly, quantitative surveys can be classified according to the mode of questionnaire administration, for instance
156 Empirical Analysis
as personal face-to-face interviews, postal questionnaires, telephone interviews, or electronically, e.g. mail surveys
(Bowling, 2005, p. 282). Given their relative efficiency, global reach and flexible design (Evans & Mathur, 2005,
p. 197), web-based surveys seem to be particularly fruitful for the purpose of the intended data collection phase.
In addition, online approaches to survey research are deemed to be advantageous in that they eliminate interviewer
interaction biases (e.g. stereotyping, halo effect, etc.), certain response biases (e.g. common rater effects such as
social desirability) and data entry errors by means of greater anonymity and technology-based controls (Hair, et
al., 2003 p. 269; Podsakoff, et al., 2003 p. 888). However, especially the second source of systematic measurement
errors, which are commonly subsumed under the term common method variance (CMV), may be a concern when
self-report questionnaires are used (Chang, et al., 2010, p. 178).
These spurious variances or ‘measurement artifacts’ shared among perceptual measures are attributable to the use
of common measurement methods rather than to the constructs the measures represent (Podsakoff, et al., 2003, p.
879). CMV is problematic because it produces a false internal consistency of results and thus generates inflated
estimates of reliability by the operation of common source factors (Chang, et al., 2010, p. 178; Lindell & Whitney,
2001, p. 114). Potentially, this could lead to either Type I or Type II errors. That is, the null hypothesis (H0) could
be erroneously rejected, et vice versa, what clearly would jeopardise the validity of conclusions (Lindell &
Whitney, 2001, p. 119). Podsakoff et al. (2003, p. 882) identify four sources of method bias: common rater effects,
item characteristic effects, item context effects and measurement context effects. In order to reduce any potential
artifactual inflation of observed correlations, Chang and colleagues (2010, p. 179 ff.) suggest a range of both ex-
ante and ex-post remedies. Ex-ante approaches involve primarily the way the questionnaire is designed and
administered. On the contrary, ex-post strategies refer to measures of statistical analyses to detect and possibly
control for any artefactual covariation.
The authors argue that complex specifications of regression models that are unlikely to be part of the respondents’
‘cognitive maps’ would correct for CMV (ibid., p. 180). Considering the structural complexity of the herein
conceptualised network of multiply interrelated pre-purchase variables (the Wearable TAM), this may be the case
for the present study. In addition, Malhorta et al. found that method biases in the field of Information Systems
research are not as serious as compared to those in other disciplines (2006, p. 1881). Nonetheless, to account for
potential common method biases the present study followed the measures compiled by Krosnick and Presser (2010,
p. 264 ff.), MacKenzie and Podsakoff (2012, p. 545 ff.) and Chang et al. (2010, p. 179 ff.). The implementation of
the utilised procedural remedies is addressed in detail in the respective sections on sampling procedure (chapter
7.1.2), questionnaire design (chapter 7.1.3) and data preparation (chapter 7.1.4).
Beside possible method biases, the utility of electronic surveys may be limited due to their comparably poor level
of sample representativeness as computer-assisted inquiries naturally approach a more technophilic population
(Matsuo, et al., 2004, p. 3998). Recent research studies show that there is indeed a significant association between
socio-economic factors (particularly with regard to age and educational level) and Internet usage rates (Silver,
2014, p. 1030). However, accumulating evidence indicates that this gap is steadily narrowing and that the
demographic structure of users with Internet access is becoming more and more representative of the population
at large (Perrin & Duggan, 2015). Moreover, it should be noticed that in socio-economic terms there actually exists

Empirical Analysis 157
a parallel between the segment of Internet users and the universe of early adopters of wearable computers
(Goldberg & Hall, 2016). There are thus strong methodical grounds for drawing an on-line sample.
The methodological and research strategical foundations of the intended empirical analysis being set, the following
subchapters will discuss details of the data collection process including both the sampling design (chapter 7.1.1)
and sampling procedure (chapter 7.1.2) as well as the questionnaire design (chapter 7.1.3).
7.1.1 Sample Design
The target population of this study is defined as the population of potential adopters of wearables in Germany.
With a focus on this country, this research seeks to understand adoption behaviour in a technologically and
economically developed society. Given that technology adoption is significantly affected by the global attitude
towards computer-based technologies, this involves individuals with a certain level of technical affinity (Buabeng-
Andoh, 2012, p. 136; Nickell & Pinto, 1986, p. 301). Considering this very large study population focussed within
the scope of the present research project, it may not be feasible to gather data from the entire target group.
Therefore, a subset of individuals should be selected which is representative of the total population. In literature,
probability sampling is recommended for survey research projects involving a vast overall population (Saunders,
et al., 2009, p. 213). For probability sampling each population element has an equal, nonzero chance of being
included in the sample to be drawn. As any generalisation inferred from a sample is based on statistical probability,
the likely error in generalising decreases with an increasing number of sampling units, i.e. larger samples can be
more confidently generalised to the target population than smaller ones (ibid., p. 217).
However, due to research economic reasons an acceptable minimum sample size has to be determined considering
(1) the accuracy of a sample that is assumed to be tolerable, (2) the level of confidence needed, and (3) the
estimated variance within the sample (Bartlett, et al., 2001, p. 44; Ahn, et al., 2014, p. 2):
(1) The accuracy of a probability sample (also referred to as margin of sampling error or level of
precision) describes the range in which the true or hypothesised value of the population is
estimated to fall. For instance, given an accuracy level of 0.05, if 70% of eligible sample units
have adopted a new technology, then one can conclude that between 65% and 75% of subjects
in the target population have actually adopted the technology. As can be seen from the
confidence interval approach formula below (6.6), sample size varies inversely with the
squared error rate. The critical value for this parameter is arbitrary, however, most scholars in
social sciences agree that a margin of error rate of 5 percent is appropriate from a practical
standpoint (Bartlett, et al., 2001 p. 45; Burns, et al., 2003 p. 375).
(2) The level of confidence (which is associated with the ‘z value’) refers to the level of certainty
that the characteristics of the gathered data will reflect the actual characteristics of the total
population (Saunders, et al., 2009, p. 218). This concept is axiomatically based on the central
limit theorem that states that the distribution of sample means derived from a simple random
sample will approximate a Gaussian normal curve given that the sample size n is sufficiently
large, i.e. when n ≥ 30 (Hair, et al., 2003 p. 339 f.; Russell Bernard, 2006 p. 173). This holds
true even if the original population parameter is not normally distributed (Saunders, et al.,
158 Empirical Analysis
2009, p. 340). As the sample mean value of a repeatedly sampled parent population fluctuates
around the true mean value µ and entails an approximately normal distribution, there is a high
probability that the mean of any sample drawn would converge upon the actual population
mean (Saunders, et al., 2009, p. 340; Friedman, 2015, p. 162). Transferred to the concept of
confidence this implies that if a 90% level of confidence is selected, 90 out of 100 samples will
have approximately the true population value within the specified range of accuracy. Statistical
confidence is incorporated into the formula for sample size determination (see equation 6.6) by
employing the z value for the defined level of confidence. Conventionally, in social sciences
and information research literature a confidence level of 95% (corresponding to a z-statistic of
1.96) is considered to be adequate (Albers, 2017 p. 26).
(3) The degree of variability within a sample refers to the range of attributes in the population
(Singh, et al., 2014 p. 10). As a consequence, sample size determination can be regarded as a
function of the social heterogeneity: the more heterogeneous a population, the larger the
required sample size to arrive at a fixed level of precision (ibid.). Since no preliminary data on
the primary variables of interest exist for the purpose of the present study (e.g. from pilot study
results) the population structure has to be estimated a priori (Bartlett, et al., 2001, p. 45).
Consequently, sample size calculation becomes inherently hypothetical (Ahn, et al., 2014, p.
2). Considering that a proportion of 50% indicates the maximum social heterogeneity in terms
of a 50 to 50 percent split in responses, most researchers recommend to assume a proportion of
0.5 in such instances, where the population structure is unknown (Krejcie & Daryle, 1970, p.
607 ff.; Israel, 1992, p. 2; Hair, et al., 2003, p. 345).
Based on these three components the required minimum sample size can be calculated according to Cochran’s
formula for large and non-finite populations (1977, p. 75):
2
2
0
)1)((*)(
e
ppzn
−= 385384.16
0.05
0.5)(0.5)(1*(1.96)2
2
=−
= (6.6)
which is valid where n0 is the sample size, z represents the abscissa of the normal sampling distribution curve that
cuts off the defined α-score at the tails (which corresponds in this case to a confidence level of 95% for two-sided
tests), p denotes the supposed standard deviation in the population (the current calculations are conservatively
based on a proportion of 0.5), e is the acceptable tolerance level of error (in the present case 0.05).
Aside from an adequate statistical significance, another important goal in correlation studies is to avoid Type II or
false-negative errors in hypothesis testing (i.e. to decrease the probability of incorrectly accepting the null
hypothesis). Inversely related to the probability of a Type II error is the statistical power of a test, which is defined
as a direct function of the sample size and the effect size (in terms of the magnitude of a treatment effect)
(Konstantopoulos, 2009). In order to compute a sample size required to achieve a target for statistical power,
researchers typically use power tables such as those published by Algina et al. (2003). As per convention, statistical
power is set to .80, i.e. there is a 20% chance of erroneously accepting the null hypothesis when the alternative
hypothesis is true (Prajapati, et al., 2010 p. 10). A commonly used measure for the overall effect size of a regression
model is Cohen’s f2 (Aguirre-Urreta, et al., 2015 p. 36). Assuming a medium effect size of about .15 for the model
Empirical Analysis 159
predictors (see chapter 6.2.6) and given 12 predictors in the research model, the required sample size for a two-
tailed test and a target power of .80 is 357 (cf. the power table for multiple regression analysis by Algina, et al.,
2003, p. 319). Still, this number is below the calculated sample size based on the desired level of confidence. As
this study seeks for a nationally representative cross-sectional sample of individuals in Germany, a minimum of
385 observations is hence prerequisite. The next section outlines the chosen strategy to reach this minimum
acceptable sample size. the lowest path coefficient
7.1.2 Sampling Procedure
In order to gather efficiently the primary data, participants were recruited via the online panel Toluna Inc. (Toluna
USA, Inc., 2016a), i.e. the sample was bought from a panel provider who rewards participants in sponsored
surveys. This service provider has been chosen due to its longstanding experience, panel size and membership at
several industry associations that are concerned with developing guidelines for panel management and data quality
(Toluna, Inc., 2018). Due to the widespread availability of the Internet among various groups, online research
panels are increasingly utilised as a valid, cost-effective and efficient mean of data collection (Roster, et al., 2004,
p. 359 ff.; Toft, et al., 2014). According to Couper, collecting cross-sectional datasets from pre-recruited panels of
Internet users with regard to certain quota adheres to probability-based sampling approaches (2000, p. 487 f.). In
support of this, a great number of researchers in the field of social inquiry argue that, due to the massively increased
Internet penetration rate, the representativeness of collected data from Internet has become increasingly akin to
data from probability-based general population samples (Salsman, et al., 2014, p. 4).
Yet, it has to be stated that pre-recruiting of panel members per se may not meet the criteria for probability
sampling in a narrower sense, since pre-recruiting techniques inevitably involve some degree of self-selection at
the point of inviting new panel members (Arnhold, 2010, p. 198; Loosveldt & Sonck, 2008, p. 94). Nonetheless,
several empirical studies have found that results from web panels differ only modestly from the outcomes of
traditional modes of survey (Hansen & Pedersen, 2012, p. 238). Moreover, with regard to the total market, Olsen
points out that online panel surveys would finally introduce a different, rather than an additional self-selection
process compared to e.g. mail sampling (2009, p. 607). In the course of a consumer preference study on the
valuation of non-market goods, the author shows that the selection bias differences between Internet panel and
mail surveys are of minor importance (ibid.). Considering the fairly broad nature of the present sampling frame,
reflecting actual and potential adopters of wearable computing, and trading off accuracy requirements and analysis
expectations against cost and operational concerns, a web panel recruitment strategy appears to be a suitable data
collection approach (Arnhold, 2010, p. 202).
The consolidated Toluna online access pool comprises about 352.000 community members in Germany
(Toluna.com, 2016, p. 23), who voluntarily registered on the web site and expressed their willingness to participate
in incentivized online surveys. The panel provider concerned guarantees high data quality by means of diverse
standard operating procedures (Toluna USA, Inc., 2016b). For example, GeoIP (a form of geolocation based on
IP addresses) as well as postal code validations are used to verify that the panelists provide valid postal addresses.
Further procedures for data quality control are described on the provider’s website (Toluna USA, Inc., 2016b).
160 Empirical Analysis
According to MacKenzie and Podsakoff (2012, p. 546), aligning the difficulty of surveys with the capabilities of
respondents (i.e. selecting participants who have the required experience thinking about the issue of interest) would
reduce artifactual covariation among perceptual measures. Thus, in order to ensure that the sample is representative
of the population-of-interest as regards a minimum level of technical affinity, a cross quota with slight restrictions
on income and educational structure was selected by the panel provider. That is, to ascertain response accuracy,
the sample was drawn from a recruitment cohort that closely reflects the relevant socio-demographic
characteristics – otherwise, there would be a chance that participants with lacking technical understanding might
generate a considerable amount of non-plausible data. It has to be noticed in this context that several survey
methodologists explicitly suggest to employ certain quotas in order to adjust the sample composition to the target
population (Terhanian & Bremer, 2012, p. 755; Craig et al., 2013).
Following approval by the ‘Science and Environment’ faculty research ethics committee at Plymouth University,
adult subjects were recruited from the German population by the Internet survey company (Toluna USA, Inc.,
2016a). All prospective participants were verified extensively and underwent checks to ensure their identity and
location. In addition, to prevent duplicate enrolments, double opt-in procedures together with the application of
cookie-based technologies during the panelist-registration process were employed as an integral part of the panel
provider’s ongoing quality-control measures (Toluna USA, Inc., 2016b). After having screened the panel members
for eligibility, potential study participants were sent electronic invitations from Toluna and asked to complete the
on-line questionnaire as outlined in chapter 7.1.3. For survey completion, each sample unit obtained incentive-
based compensation from Toluna in terms of panel points worth 2,05 €, which could be redeemed for cash or for
vouchers for selected shops and services.
The first wave of the fieldwork was conducted from July 13, 2016 – July 15, 2016. During this period 425 study
participants started the questionnaire, of whom 385 completely filled-in the questionnaire (i.e. the target number
of individuals to ensure estimation accuracy as agreed with the panel provider). This corresponds to a satisfactory
cumulative completion rate of 90.6 %, what can be considered as a reasonably high ratio with regard to an opt-in
online panel setup (DiSogra & Callegaro, 2015, p. 2; Louviere, et al., 2013, p. 28). However, to further mitigate
issues of over- and underrepresentation, additional participants were recruited via postings in diverse discussion
boards. For the present research, several Internet forums were targeted, some of which focussed on technical topics
(e.g. https://forum.garmin.de/) and others which were thematically open (e.g. https://forum.unicum.de/ and
https://www.surveycircle.com).
These on-line tools for Internet-mediated interviewing are effective one-to-many communication channels through
which new information can diffuse rapidly within a certain online community (Saunders, et al., 2009, p. 350).
According to Ridings and Gefen (2004), virtual communities can be defined as social groups of peers with shared
characteristics such as behaviours, beliefs or interests. This intra-group homophily leads to an enormous
information potential, turning discussion boards into even more effective communication instruments as compared
to classical direct marketing channels (Garg, et al., 2011, p. 11 ff.). Along with technically-oriented bulletin boards
that were targeted, this study included also non-technical web forums in order to reduce sampling bias, i.e. to avoid
an overrepresentation of technophiles. This second-wave survey was administered from July 19, 2016 – August
31, 2016. In total, 216 further respondents started the computer-mediated interview, of whom 144 answered the
Empirical Analysis 161
survey completely, what results in a total of 529 cases. Likewise, the corresponding survey completion rate
(66.7%) can be regarded as fairly satisfactory with respect to web-based surveys (Archer, 2008).
7.1.3 Questionnaire Development
Essentially, the survey design should serve to test the hypotheses of the Wearable TAM. The devised questionnaire
therefore comprises a set of questions that operationalise and measure the theoretically relevant constructs
proposed (see Appendix B.1). More precisely, those question items reflect manifest measures which quantify the
underlying latent study constructs in terms of proxy variables at empirical level. In doing so, they bridge the gap
between the theoretical construct and the phenomenal observation. Principally, scale construction was based on
the procedure proposed by Churchill (1979, p. 64 ff.). This means, a precise understanding of the constructs was
first developed in the course of the conceptualisation of the structural model (cf. chapter 5). Then, appropriate
measurement items were adopted from literature and, where necessary, adjusted to the given study context. The
applied measurement models for the latent Wearable TAM variables were introduced in detail in chapter 6.3.
Thereafter, the questionnaire design has been developed as described in the following sections.
As stated before, data collection was done through field research by means of a web-based online survey. In respect
of effectiveness, this asynchronous mode of communication allows for a dynamic questionnaire design including
the rotation of items and real-time data consistency checks (Gediehn, 2010, p. 114). The online questionnaire was
programmed with the web-based service SoSci Suvey (SoSci Survey GmbH, 2015), because it provides free
available and completely customisable survey templates and data collection tools. With regard to the SEM
requirements, the questionnaire was designed in a standardised format with structured questions. In terms of
response completeness and data analysis facilitation, this question format is well suited for transforming qualitative
phenomena into quantitative measures (Hair, et al., 2003 p. 424). Hence, to account for the confirmative nature of
the study, all questions were asked in a closed-ended manner and single choice design.
The assignment of numbers to categories of responses (e.g. scale points) is commonly referred to as coding. Since
coding determines the scale type that most likely satisfies the study objectives, this process is crucial for scale
development (Hair, et al., 2016 p. 9). In general, scaling involves a continuum upon which measured attributes of
objects are located according to a set of rules, such as allocating numerals corresponding to the empirical intensity
of a behaviour (Bradley, 2007, p. 209). Overall, there are four basic types of measurement scales, each of which
provides an ascending level of admissible mathematical operations on measurement results, namely nominal
scales (quantities can only be classified), ordinal scales (quantities can be ordered), interval or cardinal scales
(intervals between adjacent ranks are equal, so that the difference between ranks can be determined), and ratio
scales (there is a meaningful zero, so comparison of absolute magnitudes is possible and the ratio of scale values
can be computed) (Churchill, et al., 2010 p. 234; Easterby-Smith, et al., 2008 p. 230 f.).
In social science research, attitudinal scales are widely used to measure latent phenomena which are not numeric
in nature, e.g. opinions, mental dispositions and preferences (Kumar, 2011, p. 157). Strictly speaking, the problem
of attitude measurement suggests an ordinal interpretation of attitude scales. However, empirical data are
frequently to be analysed with techniques designed for cardinal measurements to fulfil the requirement of
equidistance (Hair, et al., 2016 p. 9). This means, the measurement scale must use equally spaced intervals as units
162 Empirical Analysis
of measurement, each category having equal importance or 'attitudinal value', such that the self-reported attitude
intensity of one person can be measured in relation to the gathered attitudinal score of another individual.
To enable multivariate data analysis with multiple PLS-regression models at interval level, Likert scaling was
employed. Likert scales represent summative scales ranging from a group of ordered response categories – from
least to most – for measuring unidimensional concepts of scientific interest in general and cognitive-based beliefs
in particular (Hair, et al., 2003 p. 422; Likert, 1932 p. 5 ff.). Even though Likert scales serve to collect ordinal-
level data, they behave more like interval scales provided that they possess clearly defined qualifiers for each
category. Also, scale items shall be symmetrically distributed on each side of a neutral middle alternative, which
allows to indicate either emotional ambivalence or indifference (Hair, et al., 2016 p. 9; Krosnick, et al., 2010 p.
274). In terms of scale granularity, there has been much debate among psychometricians concerning the optimal
number of scale items (Finstad, 2010, p. 105; Krosnick & Presser, 2010, p. 268). On the one hand, more sensitive
scales evidently permit to maximise information retrieval due to higher discriminating power. Conversely, less
fine-grained scales tend to contribute to improper measures through subtle but repeated data loss (Finstad, 2010,
p. 109). However, human mind has a limited short-term memory span capable of discriminating about 7±2 different
stimuli at once, what implies a cognitive numeric limit of about seven items for making one-dimensional
judgments (Preston & Colman, 2000, p. 2; see also the original article by Miller, 1956, p. 343 ff.). In line with this,
several studies show that seven-point scales are preferable to maximize reliability and validity (Krosnick &
Presser, 2010, p. 272). This study therefore employs a seven-point, unipolar Likert scale with both extremums
“strongly disagree” and “strongly agree” as well as the midpoint category “neither agree nor disagree”.
In accordance with the native language of the survey participants, the catalogue of questions was originally
prepared in German. To address and prevent potential common method biases, the final questionnaire was
developed according to Krosnick’s and Presser’s recommendations in (2010, p. 264 ff.) and MacKenzie’s and
Podsakoff’s ex ante strategies in (2012, p. 545 ff.) for controlling method bias in questionnaire design. The authors
emphasise that when respondents are unwilling or unable to expend the necessary cognitive effort to answer
accurately to a long series of questions, their responses become more prone to method bias (MacKenzie &
Podsakoff, 2012, p. 545). Particularly in web-based, single source studies, where the researcher is not present when
the questionnaire is completed by the respondents, the appearance of the questionnaire and especially the first
impression is germane to the credibility and overall response rate of a survey (Planing, 2014 p. 145; Podsakoff, et
al., 2003 p. 887).
As a consequence, the introductory remarks on the cover page of the questionnaire implement remedies for the
respondent’s susceptibility to ‘satisfice’ (i.e. to apply cognitive decision heuristics to generate satisfactory
answers) in that they assure the respondents of the anonymity and confidentiality of the study, that it is their
personal opinion that is of importance, and that there are no right or wrong answers (MacKenzie & Podsakoff,
2012, p. 548 f.; Krosnick, 1991, p. 214). Additionally, to increase trust and to mitigate suspicions the introduction
page briefly outlines the study purpose and provides information on the author, the affiliated institution, and the
approximated duration for completing the questionnaire. Furthermore, an electronic informed consent has been
integrated into the start page to conform to the relevant ethical requirements. Also included was a note of thanks
to the respondents in advance for taking the time to fill out the questionnaire.
Empirical Analysis 163
Even though there are no well-established procedures for an optimal question design, various versions of
conventional guidelines and procedures are offered in pertinent methodology textbooks. Krosnick and Presser
(2010, p. 264) agree that the most valuable design rules in this common wisdom include e.g. a clear and simple
wording and syntax which allow an easy interpretation and do not push respondents towards an answer. Vague
and complex concepts should always be clarified by clear examples and explanations to decrease the likelihood of
satisficing (MacKenzie & Podsakoff, 2012, p. 546). With regard to the abstractness of the taxonomy of ubiquitous
computing, this is of particular importance for the present study. Therefrom, to reduce response bias the second
page of the online questionnaire contains a short definition of the term ‘wearable computing’ including the two
most prominent examples of this novel IT class – ‘smartwatches’ and ‘smart glasses’ – so as to create a common
conceptual understanding.
Since the context in which a question is asked may affect the survey results as well, ordering of items is also of
significance. Krosnick and Presser (2010, p. 264) state that a good survey should take into account the following
advice about how to optimise question order:
• Early questions are supposed to raise interest and to build rapport between the respondent and the
researcher, why they should be easy and pleasant to answer
• Introductory questions should explicitly address the topic of the survey
• Questions on the same topic should be grouped together to facilitate memory retrieval and judgment
formation
• Questions on the same topic should proceed from general to specific (i.e. a good questionnaire should
implement the funnel approach)
Moreover, Lindell and Whitney (2001, p. 117 f.) posit that acquiescence can be reduced by reverse scoring some
of the items. Hence, the developed questionnaire contains three reverse coded items (‘IV01_02’, ‘PS02_04’,
‘PS02_06’, and ‘PS03_01’) plus the reversed items of the Big Five personality traits (see chapter 6.3.1.1).
Additionally, since socio-demographic items require relatively little cognitive processing, the authors recommend
to place these items at the end of the questionnaire. This should reduce the respondents’ susceptibility to response
styles, peripheral cues and acquiescence due to an increasing fatigue when answering the questionnaire. To
develop an understanding of the sample’s structure and to assess the degree of representativeness of the sample,
demographic items have thus been queried on the last page. Furthermore, Chang et al. (2010, p. 180) maintain that
randomising the order of items would also make CMV less likely. This functionality is directly supported by the
SoSci Survey software and, consequently, was also employed in the study. In sum, the overall questionnaire design
reflects the well-accepted funnel approach, which is advised in (Churchill, et al., 2010 p. 220).
Even though all hypothetical constructs were operationalised and carefully translated into corresponding question
items, a questionnaire is rarely flawless (Neelankavil, 2007, p. 184). Therefore, to eliminate design problems and
to safeguard the quality of the questionnaire, a field-based pre-test should be performed with respect to the general
design, wording and logical flow of the survey (MacKenzie & Podsakoff, 2012, p. 545; Malhotra & Grover, 1998,
p. 412). Hence, prior to conducting the panel survey, the questionnaire was first submitted to the scrutiny of two
experienced academics and two target respondents, who have been excluded from further participation thereafter.
The survey software SoSci Survey provides a pre-test modus, whereby completed questionnaires can be viewed
164 Empirical Analysis
and commented online via a password-protected access. During this process, both the question wording and the
question sequence could be improved. To reach maximum comprehensibility, ambiguous terms (e.g. context-
awareness or security risks such as hardware and software failures) were clarified by virtue of concrete examples.
Also, to reduce potential fatigue and irritation of respondents, adjustments were made to some multi-item measures
by eliminating ambiguous question items.
Overall, the pre-test provided positive feedback for the online questionnaire. After correction of the detected minor
flaws, the survey instrument was finalised to go into the field. Following the first and second wave of the field
phase, the collected data sets were directly exported from the online questionnaire into the software package IBM
SPSS Statistics for statistical analysis. This automatism certainly reduces the risk of human error in the process of
entering empirical data into a specialised evaluation software (Planing, 2014 p. 178). It should be noted that simple
survey page visits (i.e. empty data records) were not considered by the survey software and, consequently,
excluded from further statistical evaluation.
7.1.4 Data Preparation
Prior to any inferential statistical analysis, researchers should examine the quality of the collected data in respect
of missing values, outliers, suspicious response patterns, and the normality of data distribution (Hair, et al., 2016
p. 56; Mooi, et al., 2011 p. 91 ff.). Moreover, since the dependent and independent variables in this study might
be subject to CMV, statistical procedures should be used to examine the extent to which method bias may be a
concern (Podsakoff, et al., 2003, p. 889). To prepare the primary data for analysis, identified invalid and suspicious
cases have to be eliminated first. As the online questionnaire implements only fixed response options, outliers
were not an issue for the present study. Moreover, with the aid of the chosen data collection software, all pages of
the questionnaire were automatically checked for completeness during reply. In cases of incomplete pages, the
users were directly informed about the respective missing responses by a pop-up dialog window when attempting
to move to the next page. This setting together with the fact that this study employed a panel survey within the
first wave ensured that nearly all data sets were complete.
Furthermore, atypical response patterns are problematic in terms of data quality. In particular, these anomalies
may be observed by screening for data sets with a very high proportion of same responses (straight lining), such
as 3,3,3,3,3 for each response option of a five-point multi-item scale. Within the collected data, no such case exists.
However, respondents might also be uncommitted when they choose different ratings for the multiple items of a
scale. Specifically, self-administration and panel structures might create incentives for completing a questionnaire
quickly without expending the proper cognitive effort, what ultimately biases measurement results (Malhotra,
2008, p. 930). According to this, response times should additionally be taken into account as a post hoc data quality
indicator for identifying inattentive or meaningless responses (Leiner, 2013, p. 10; DeSimone, et al., 2015, p. 173
f.). To this effect, SoSci Survey delivers a sophisticated approach, which relates the individual average response
time per page with an index relative to the median page completion time of the entire sample. This indicator is
normed in such way that values above 100 points suggest low-quality data, implying that the pages has been filled
out five times as fast as the median response time of the sample (SoSci Survey GmbH, 2015; Leiner, 2013, p. 10).
Empirical Analysis 165
A more conservative threshold has deliberately not been used in this study to eschew the risk of excluding very
fast respondents. After applying this criterion on the gathered sample data, 19 data sets were excluded.
In addition, prior to distributing a questionnaire to the public, screening questions should be inserted to ensure that
only those cases flow into the empirical assessment, which likely provide thoughtful responses (Hair, et al., 2016
p. 59; DeSimone, et al., 2015 p. 172). Hence, a reversed item (“Wearables are boring”) in the introductory question
at the beginning of the questionnaire served as a screening question to identify inconsistency in answers. Thereby,
contradicting responses, which simultaneously indicate the same level of involvement and boredom towards the
research object, have been excluded from further statistical analysis. Due to this quality control measure, 474 cases
remained.
Furthermore, although PLS is a non-parametric method, extremely aberrant data may inflate standard errors and
thus increase the likelihood of a false-negative error. Hair et al. (2016, p. 61) therefore suggest to assess both the
skewness and kurtosis of parameter distributions. Instead of employing the prominent Kolmogorov/Smirnov and
the Shapiro/Wilks tests, the authors particularly recommend using skewness and kurtosis statistics, since these
measures are in line with the requirements of the PLS-algorithm (ibid.). Skewness indicates the extent to which a
frequency curve is symmetrical, whereas the kurtosis indicates the ‘peakedness’ of a distribution. When both
measures are close to zero, the data distribution is considered to be perfectly normal. The general guideline for
skewness and kurtosis is that values below one or above minus one indicate univariate normality. However, in
scholarly research this cut-off value is often considered to be too strict (Fraß, 2016, p. 202). Thus, literature even
suggests absolute threshold values of 2.0 for skewness and 7.0 for kurtosis as moderate departures from a univariate
normal distribution (Finch, et al., 1997, p. 91 f.). Skewness values for the Wearable TAM items range from -1.252
up to .559, and kurtosis values range from -1.176 up to 1.818, and, hence, fall under the recommended cut-off
values. Since the given data is assessed as predominately normally distributed with only a few, not extremely non-
normal cases, it can be regarded as fulfilling the distributional condition for the PLS algorithm.
Even though multiple ex ante measures have been implemented to reduce CMV (see sections 7.1.2, and 7.1.3), the
existence of a method bias cannot safely be ruled out. Harman’s single-factor test represents a widely used ex post
exploratory procedure to address concerns regarding common method bias (Podsakoff, et al., 2003, p. 889). By
loading all exogenous and endogenous variables of a research model into an EFA and assessing the unrotated
factor solution, it can be established whether one factor accounts for the majority of the variance among the
manifest measures. If this is the case, a substantial amount of common method variance is present. An EFA of all
dependent and independent Wearable TAM variables results in a twelve-factor solution, with the first factor
explaining about 30.9% of the variance in the data (cf. Table 7.1). Because the analysis yielded neither a single
factor nor a general factor that accounts for the majority of the variance (i.e. more than 50%), Harman’s test
provides no evidence of substantial common method bias in this study. Still, it has to be emphasised that this test
does nothing to statistically control for method effects; since this technique just indicates significant CMV in terms
of a systematic measurement error, some problems due to a common source for predictor and criterion variables
may persist.
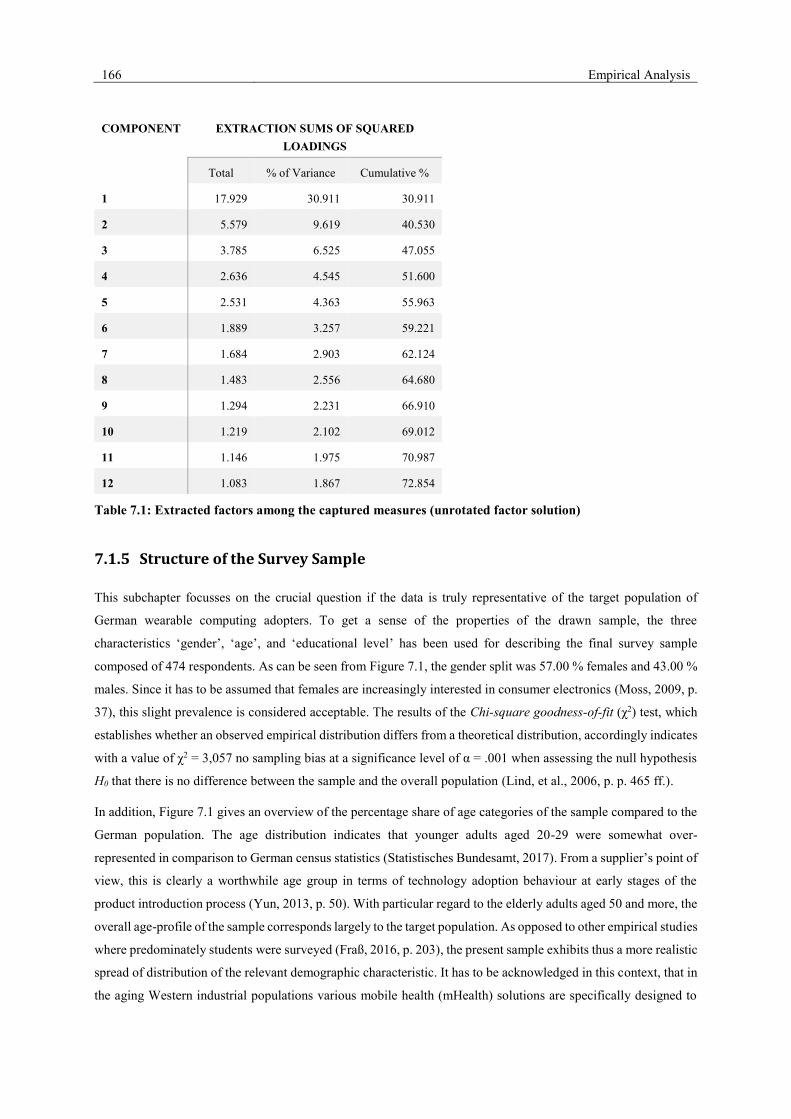
166 Empirical Analysis
COMPONENT EXTRACTION SUMS OF SQUARED
LOADINGS
Total % of Variance Cumulative %
1 17.929 30.911 30.911
2 5.579 9.619 40.530
3 3.785 6.525 47.055
4 2.636 4.545 51.600
5 2.531 4.363 55.963
6 1.889 3.257 59.221
7 1.684 2.903 62.124
8 1.483 2.556 64.680
9 1.294 2.231 66.910
10 1.219 2.102 69.012
11 1.146 1.975 70.987
12 1.083 1.867 72.854
Table 7.1: Extracted factors among the captured measures (unrotated factor solution)
7.1.5 Structure of the Survey Sample
This subchapter focusses on the crucial question if the data is truly representative of the target population of
German wearable computing adopters. To get a sense of the properties of the drawn sample, the three
characteristics ‘gender’, ‘age’, and ‘educational level’ has been used for describing the final survey sample
composed of 474 respondents. As can be seen from Figure 7.1, the gender split was 57.00 % females and 43.00 %
males. Since it has to be assumed that females are increasingly interested in consumer electronics (Moss, 2009, p.
37), this slight prevalence is considered acceptable. The results of the Chi-square goodness-of-fit (χ2) test, which
establishes whether an observed empirical distribution differs from a theoretical distribution, accordingly indicates
with a value of χ2 = 3,057 no sampling bias at a significance level of α = .001 when assessing the null hypothesis
H0 that there is no difference between the sample and the overall population (Lind, et al., 2006, p. p. 465 ff.).
In addition, Figure 7.1 gives an overview of the percentage share of age categories of the sample compared to the
German population. The age distribution indicates that younger adults aged 20-29 were somewhat over-
represented in comparison to German census statistics (Statistisches Bundesamt, 2017). From a supplier’s point of
view, this is clearly a worthwhile age group in terms of technology adoption behaviour at early stages of the
product introduction process (Yun, 2013, p. 50). With particular regard to the elderly adults aged 50 and more, the
overall age-profile of the sample corresponds largely to the target population. As opposed to other empirical studies
where predominately students were surveyed (Fraß, 2016, p. 203), the present sample exhibits thus a more realistic
spread of distribution of the relevant demographic characteristic. It has to be acknowledged in this context, that in
the aging Western industrial populations various mobile health (mHealth) solutions are specifically designed to

Empirical Analysis 167
assist older people with medical issues by means of body-worn sensors (Allen, 2016). An under-representation of
elderly (which is frequently observable in studies on technology acceptance) would therefore result in a neglect of
a promising future consumer market (Gartner, Inc., 2013b).
Figure 7.1: Comparison of gender and age distributions
Moreover, the direct comparison of age groups reveals that respondents aged 40-49 are clearly underrepresented.
Thus, the sample is biased by too many youngest-group and too few middle-aged participants. As a consequence,
the resulting summarised Chi-square (χ2 = 33.483) indicates that H0 should be rejected. However, when looking at
the other age categories individually (cf. Table 7.2), it becomes evident that most of them are representative of the
target population: The acceptance region for the null hypothesis at a significance level of α = .01 with 1 degree of
freedom is below the critical value of 6.635 (Lind, et al., 2006, p. 494). Thus, more than half of the observed age
categories of the sample can be judged as truly representative of the target population. Therefore, the overall
targeting is viewed as being successful.
20 - 29 30 - 39 40 - 49 50 - 59 60 - 69 Total
Observed 125 88 77 107 77
Expected 86 84 120 104 80
Difference 39 4 43 3 3
χ2 17,686 0,19 15,408 0,086 0,113 33,483
Table 7.2: Chi-Square Goodness-of-Fit Test for age characteristics
Furthermore, the descriptive analysis shows that the educational level of the survey respondents can be regarded
as far above-average; the distribution of the survey participants is clearly skewed towards better-educated (see
Figure 7.2). Nearly 40% of respondents state that they hold a university degree, while 20% have a general
qualification for university entrance. This group distribution corresponds well with the socio-economic structure
of innovators and early adopters, who are considered to be generally more qualified (Yun, 2013, p. 91). Since there
is no data on the population distribution of this characteristic available, no additional chi-squared test has been
performed for educational level.
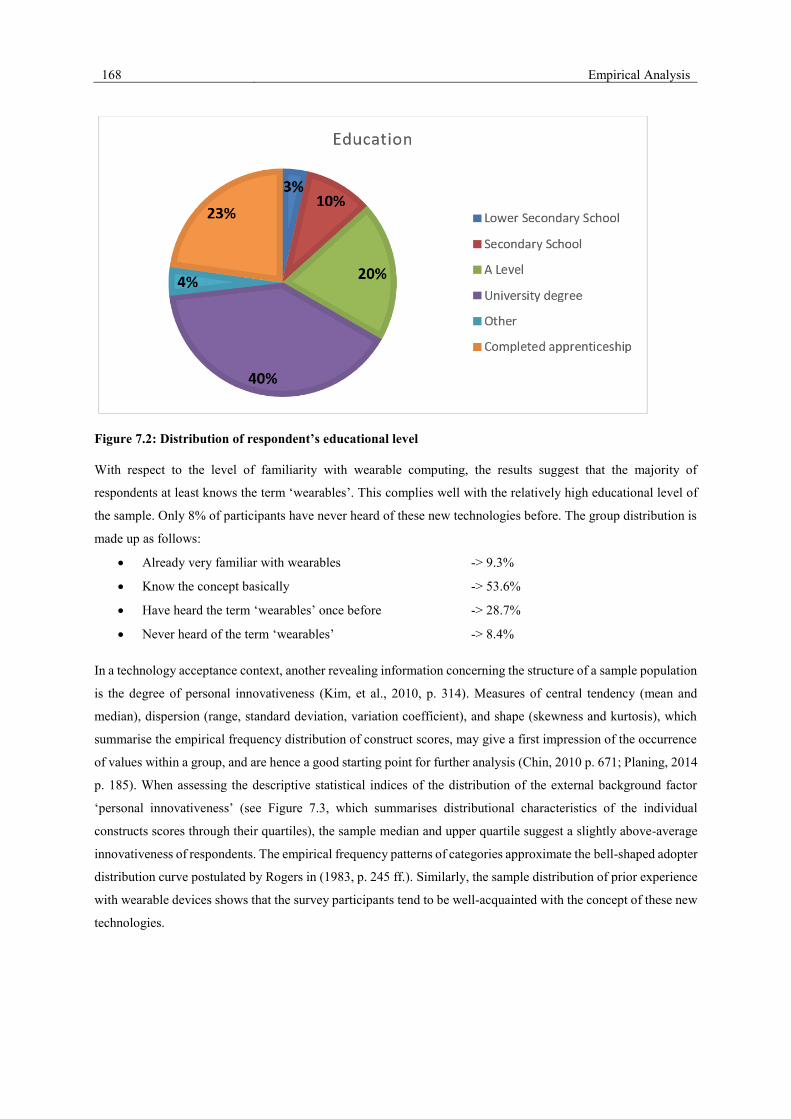
168 Empirical Analysis
Figure 7.2: Distribution of respondent’s educational level
With respect to the level of familiarity with wearable computing, the results suggest that the majority of
respondents at least knows the term ‘wearables’. This complies well with the relatively high educational level of
the sample. Only 8% of participants have never heard of these new technologies before. The group distribution is
made up as follows:
• Already very familiar with wearables -> 9.3%
• Know the concept basically -> 53.6%
• Have heard the term ‘wearables’ once before -> 28.7%
• Never heard of the term ‘wearables’ -> 8.4%
In a technology acceptance context, another revealing information concerning the structure of a sample population
is the degree of personal innovativeness (Kim, et al., 2010, p. 314). Measures of central tendency (mean and
median), dispersion (range, standard deviation, variation coefficient), and shape (skewness and kurtosis), which
summarise the empirical frequency distribution of construct scores, may give a first impression of the occurrence
of values within a group, and are hence a good starting point for further analysis (Chin, 2010 p. 671; Planing, 2014
p. 185). When assessing the descriptive statistical indices of the distribution of the external background factor
‘personal innovativeness’ (see Figure 7.3, which summarises distributional characteristics of the individual
constructs scores through their quartiles), the sample median and upper quartile suggest a slightly above-average
innovativeness of respondents. The empirical frequency patterns of categories approximate the bell-shaped adopter
distribution curve postulated by Rogers in (1983, p. 245 ff.). Similarly, the sample distribution of prior experience
with wearable devices shows that the survey participants tend to be well-acquainted with the concept of these new
technologies.
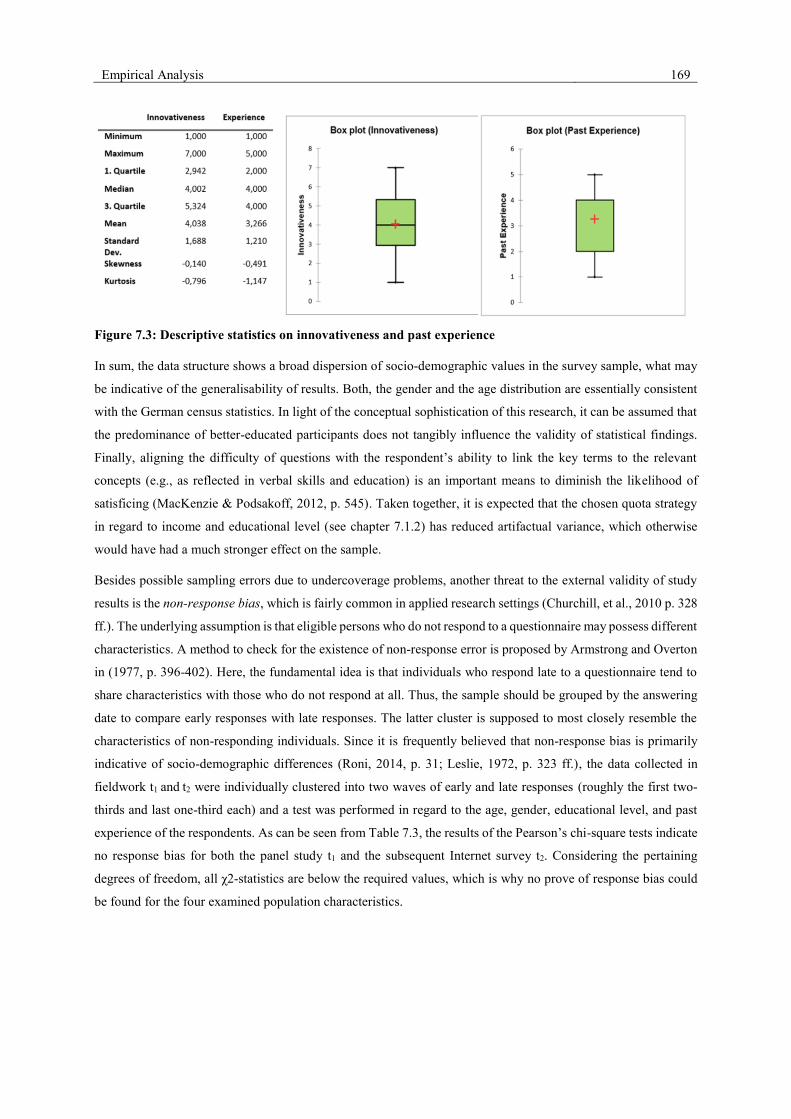
Empirical Analysis 169
Figure 7.3: Descriptive statistics on innovativeness and past experience
In sum, the data structure shows a broad dispersion of socio-demographic values in the survey sample, what may
be indicative of the generalisability of results. Both, the gender and the age distribution are essentially consistent
with the German census statistics. In light of the conceptual sophistication of this research, it can be assumed that
the predominance of better-educated participants does not tangibly influence the validity of statistical findings.
Finally, aligning the difficulty of questions with the respondent’s ability to link the key terms to the relevant
concepts (e.g., as reflected in verbal skills and education) is an important means to diminish the likelihood of
satisficing (MacKenzie & Podsakoff, 2012, p. 545). Taken together, it is expected that the chosen quota strategy
in regard to income and educational level (see chapter 7.1.2) has reduced artifactual variance, which otherwise
would have had a much stronger effect on the sample.
Besides possible sampling errors due to undercoverage problems, another threat to the external validity of study
results is the non-response bias, which is fairly common in applied research settings (Churchill, et al., 2010 p. 328
ff.). The underlying assumption is that eligible persons who do not respond to a questionnaire may possess different
characteristics. A method to check for the existence of non-response error is proposed by Armstrong and Overton
in (1977, p. 396-402). Here, the fundamental idea is that individuals who respond late to a questionnaire tend to
share characteristics with those who do not respond at all. Thus, the sample should be grouped by the answering
date to compare early responses with late responses. The latter cluster is supposed to most closely resemble the
characteristics of non-responding individuals. Since it is frequently believed that non-response bias is primarily
indicative of socio-demographic differences (Roni, 2014, p. 31; Leslie, 1972, p. 323 ff.), the data collected in
fieldwork t1 and t2 were individually clustered into two waves of early and late responses (roughly the first two-
thirds and last one-third each) and a test was performed in regard to the age, gender, educational level, and past
experience of the respondents. As can be seen from Table 7.3, the results of the Pearson’s chi-square tests indicate
no response bias for both the panel study t1 and the subsequent Internet survey t2. Considering the pertaining
degrees of freedom, all χ2-statistics are below the required values, which is why no prove of response bias could
be found for the four examined population characteristics.
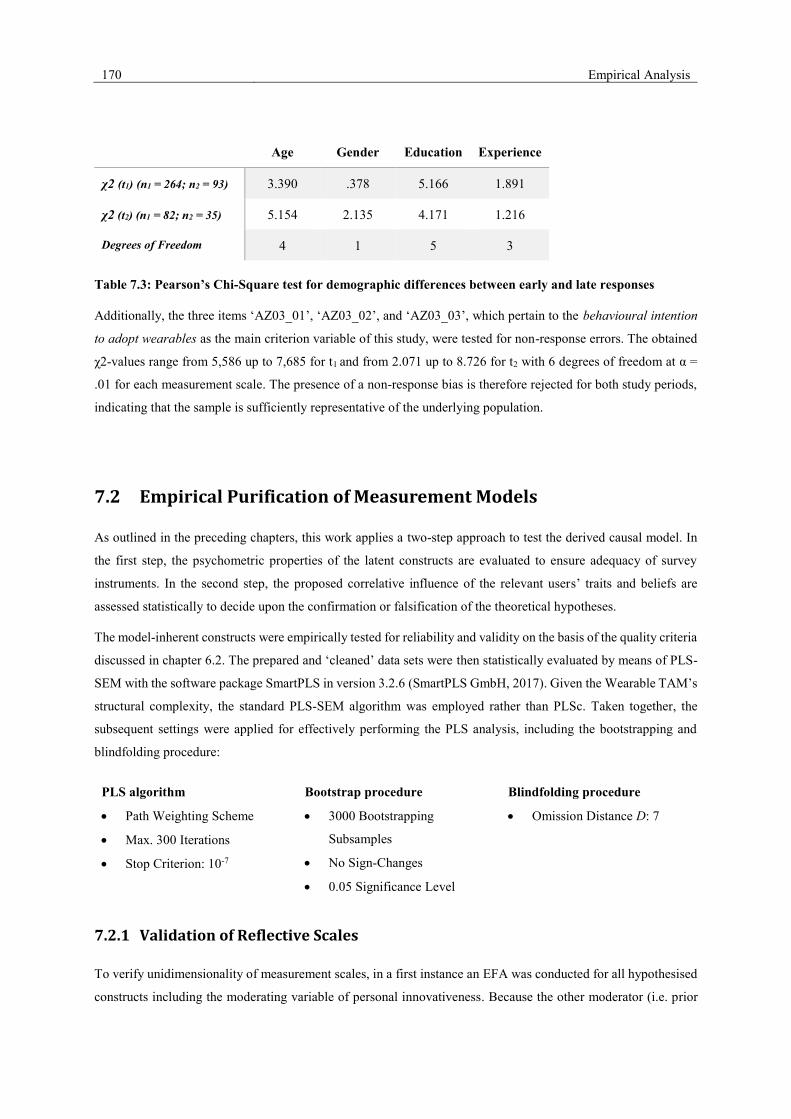
170 Empirical Analysis
Age Gender Education Experience
χ2 (t1) (n1 = 264; n2 = 93) 3.390 .378 5.166 1.891
χ2 (t2) (n1 = 82; n2 = 35) 5.154 2.135 4.171 1.216
Degrees of Freedom 4 1 5 3
Table 7.3: Pearson’s Chi-Square test for demographic differences between early and late responses
Additionally, the three items ‘AZ03_01’, ‘AZ03_02’, and ‘AZ03_03’, which pertain to the behavioural intention
to adopt wearables as the main criterion variable of this study, were tested for non-response errors. The obtained
χ2-values range from 5,586 up to 7,685 for t1 and from 2.071 up to 8.726 for t2 with 6 degrees of freedom at α =
.01 for each measurement scale. The presence of a non-response bias is therefore rejected for both study periods,
indicating that the sample is sufficiently representative of the underlying population.
7.2 Empirical Purification of Measurement Models
As outlined in the preceding chapters, this work applies a two-step approach to test the derived causal model. In
the first step, the psychometric properties of the latent constructs are evaluated to ensure adequacy of survey
instruments. In the second step, the proposed correlative influence of the relevant users’ traits and beliefs are
assessed statistically to decide upon the confirmation or falsification of the theoretical hypotheses.
The model-inherent constructs were empirically tested for reliability and validity on the basis of the quality criteria
discussed in chapter 6.2. The prepared and ‘cleaned’ data sets were then statistically evaluated by means of PLS-
SEM with the software package SmartPLS in version 3.2.6 (SmartPLS GmbH, 2017). Given the Wearable TAM’s
structural complexity, the standard PLS-SEM algorithm was employed rather than PLSc. Taken together, the
subsequent settings were applied for effectively performing the PLS analysis, including the bootstrapping and
blindfolding procedure:
PLS algorithm
• Path Weighting Scheme
• Max. 300 Iterations
• Stop Criterion: 10-7
Bootstrap procedure
• 3000 Bootstrapping
Subsamples
• No Sign-Changes
• 0.05 Significance Level
Blindfolding procedure
• Omission Distance D: 7
7.2.1 Validation of Reflective Scales
To verify unidimensionality of measurement scales, in a first instance an EFA was conducted for all hypothesised
constructs including the moderating variable of personal innovativeness. Because the other moderator (i.e. prior

Empirical Analysis 171
experience with wearables) represents a single-item measure, it was excluded from outer model validation.
Employing principal component extraction with varimax rotation, a one-dimensional factor structure could be
affirmed for all latent variables, except the need for cognition scale. Here, the loading pattern of the PS03_01
indicator led to the extraction of two components with each showing an eigenvalue greater than one. This
heterogeneous item was therefore eliminated from further analysis, what resulted in a one-component solution for
the remaining two-item-scale. The obtained empirical statistics for each question item are summarised in Table
7.4.
Afterwards, for all reflective indicators reliability was examined by computing the individual factor loading.
Overall, the results indicate that the operationalised constructs prove reliable at item level; most factor loadings
exceed the conservative threshold value of 0.7 and are also high of significance. Correspondingly, the same is true
for AVE ratios which all surpass the 0.6 benchmark. However, the items PS02_04, PS02_06, PS01_02, and
PS01_05 fall clearly below the required λ-value. Following the recommendations in (Bagozzi, et al., 1991, p. 427
ff.) and (Hair, et al., 2011, p. 145 f.), rather than automatically eliminating weaker indicators from their
theoretically associated reflective scale, in the present study the decision on item removal rested additionally upon
plausibility considerations and a careful examination of the effects of a model adjustment on composite reliability.
Because for the endogenous construct ‘Materialism’ item removal has led to a considerable increase in convergent
validity, the respective indicator was dropped. In the case of PS01_02 (‘Agreeableness’) and PS01_05 (‘Openness
to Experience’) indicator elimination resulted in single-item measures, why considerations on scale purification
could not be based sensibly upon construct validity criteria. Therefore, Type I error probability of the concerning
outer loadings was assessed. Here, one-tailed t-values are reported due to directional predictions. Since the loading
of item PS01_02 shows acceptable significance at a 0.01 level, it has been retained in the initial measurement
model, whereas PS01_05 had to be eliminated from further analysis due to its statistically insignificant loading on
its assigned ‘Openness to Experience’ construct.
Moreover, when inspecting the matrix of loadings and cross-loadings, it becomes apparent that the items AZ03_02
and AZ03_03 pertaining to the usage intention as well as IV01_03, which measures the involvement towards
wearables, exhibit substantial collinearity with lambda-values well above 0.7. Drawing on the tripartite model of
attitude structure (see chapter 3.1.2.1), this may be explained by the fact that involvement reflects rather affective
attitudinal facets of evaluative judgements. However, in accordance with the underlying theoretical and conceptual
considerations, this study is supposed to explicitly analyse the singular effect of both behavioural intention and
affective involvement at nomological level. Therefore, merging the problematic constructs into a more general
higher-order structure was not an option. Even though all items load highest on their own construct with a delta
above 0.1 compared to their cross-loadings as recommended by Gefen and Straub (2005, p. 93 f.), to establish
discriminant validity all three problematic indicators were removed from their respective instruments.
Subsequently, reliability was assessed on construct level. For the endogenous latent variables, the postulated
measurement models deliver very good results in terms of internal consistency. The Cronbach’s alpha statistics
exceed the minimum level of 0.6, while composite reliability values correspondingly meet the given benchmark
of 0.7. Yet, with an alpha reliability of 0.410 for ‘Conscientiousness’ and 0.537 for ‘Neuroticism’, the exogenous
personality scale shows relatively poor internal consistency. Nevertheless, given that Cronbach’s alpha is a

172 Empirical Analysis
conservative measure and that the true reliability usually lies between the Cronbach’s alpha and the composite
reliability score (which by contrast tends to overestimate internal consistency, c.f. Hair et al., 2016 p. 112), both
criteria should be considered. As the latter first-generation criterion is fulfilled for the two sub-dimensions, both
items were retained.
Latent
Variable
Item
Item
Reliab.
Sign. Internal
Consistency
Reliability
Convergent
Validity
Discriminant Validity
Loading t-value Cronb.
Alpha
Comp.
Reliab.
Eigen-
value
AVE Fornell-
Larcker
HTMT
Unobtrusiveness PV02_01 0.766*** 21.119
0.897 0.924 3.547,
.512 0.709
√ (Corrmax =
0.523)
√ HTMTmax
= 0.573
PV02_02 0.848*** 48.857
PV02_03 0.874*** 65.999
PV02_04 0.842*** 39.680
PV02_05 0.875*** 62.503
Ubiquity PV03_01 0.942*** 113.44
0.967 0.974 4.418,
.271 0.884
√ (Corrmax =
0.726)
√ HTMTmax
= 0.771
PV03_02 0.943*** 100.58
PV03_03 0.944*** 92.592
PV03_04 0.927*** 78.566
PV03_05 0.945*** 100.52
Context
Awareness
PV01_01 0.930*** 118.12
0.906 0.941 2.526,
.302 0.842
√ (Corrmax =
0.679)
√ HTMTmax
= 0.725 PV01_03 0.934*** 115.85
PV01_04 0.889*** 57.405
Availability NZ02_04 0.932*** 121.25
0.915 0.946 2.565,
.247 0.855
√ (Corrmax =
0.706)
√ HTMTmax
= 0.775 NZ02_05 0.912*** 75.87
NZ02_06 0.930*** 102.99
Integrity NZ06_01 0.912*** 88.125
0.906 0.941 2.524,
.268 0.841
√ (Corrmax =
0.706)
√ HTMTmax
= 0.775 NZ06_02 0.912*** 78.207
NZ06_03 0.927*** 97.804
Confidentiality NZ07_01 0.970*** 218.71
0.973 0.983 2.848,
.091 0.949
√ (Corrmax =
0.649)
√ HTMTmax
= 0.690 NZ07_02 0.974*** 172.84
NZ07_03 0.979*** 322.39
Trust NZ05_01 0.928*** 113.09
0.918 0.948 2.579,
.226 0.860
√ (Corrmax =
0.774)
√ HTMTmax
= 0.771 NZ05_02 0.923*** 96.543
NZ05_03 0.931*** 99.853
AZ03_01 0.960*** 215.04 -a -a -a -a -a -a
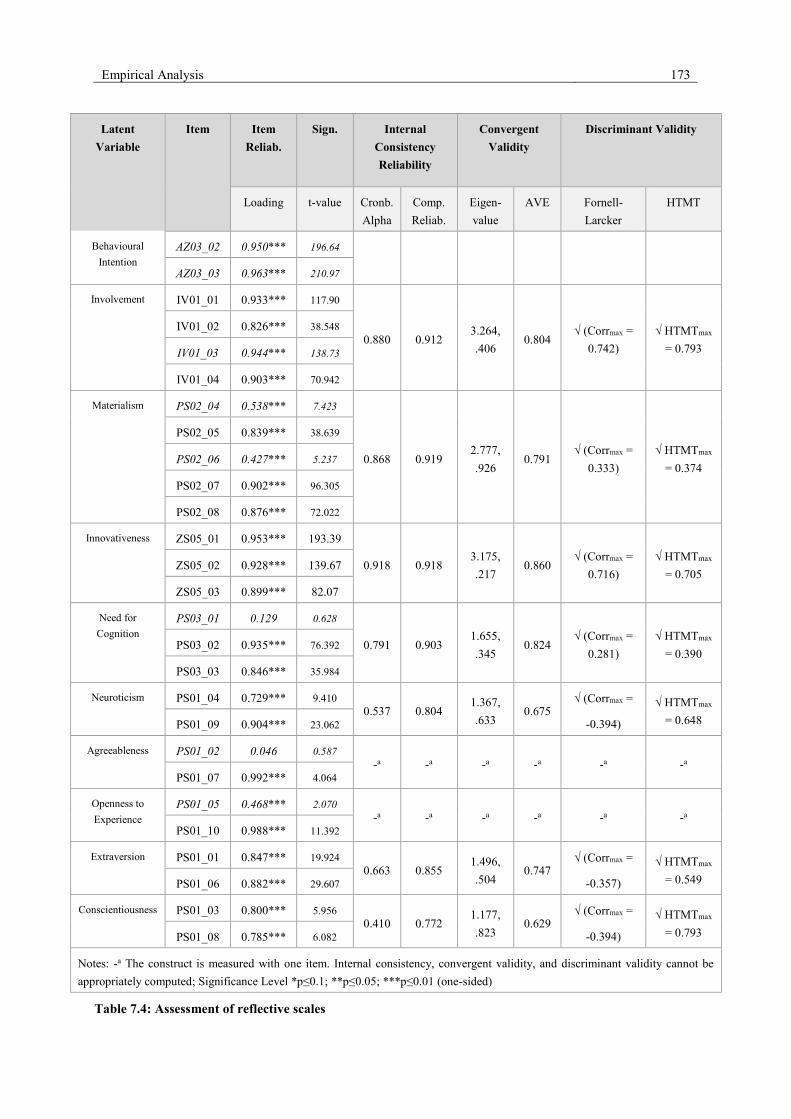
Empirical Analysis 173
Latent
Variable
Item
Item
Reliab.
Sign. Internal
Consistency
Reliability
Convergent
Validity
Discriminant Validity
Loading t-value Cronb.
Alpha
Comp.
Reliab.
Eigen-
value
AVE Fornell-
Larcker
HTMT
Behavioural
Intention
AZ03_02 0.950*** 196.64
AZ03_03 0.963*** 210.97
Involvement IV01_01 0.933*** 117.90
0.880 0.912 3.264,
.406 0.804
√ (Corrmax =
0.742)
√ HTMTmax
= 0.793
IV01_02 0.826*** 38.548
IV01_03 0.944*** 138.73
IV01_04 0.903*** 70.942
Materialism PS02_04 0.538*** 7.423
0.868 0.919 2.777,
.926 0.791
√ (Corrmax =
0.333)
√ HTMTmax
= 0.374
PS02_05 0.839*** 38.639
PS02_06 0.427*** 5.237
PS02_07 0.902*** 96.305
PS02_08 0.876*** 72.022
Innovativeness ZS05_01 0.953*** 193.39
0.918 0.918 3.175,
.217 0.860
√ (Corrmax =
0.716)
√ HTMTmax
= 0.705 ZS05_02 0.928*** 139.67
ZS05_03 0.899*** 82.07
Need for
Cognition
PS03_01 0.129 0.628
0.791 0.903 1.655,
.345 0.824
√ (Corrmax =
0.281)
√ HTMTmax
= 0.390 PS03_02 0.935*** 76.392
PS03_03 0.846*** 35.984
Neuroticism PS01_04 0.729*** 9.410 0.537 0.804
1.367,
.633 0.675
√ (Corrmax =
-0.394)
√ HTMTmax
= 0.648 PS01_09 0.904*** 23.062
Agreeableness PS01_02 0.046 0.587 -a -a -a -a -a -a
PS01_07 0.992*** 4.064
Openness to
Experience
PS01_05 0.468*** 2.070 -a -a -a -a -a -a
PS01_10 0.988*** 11.392
Extraversion PS01_01 0.847*** 19.924 0.663 0.855
1.496,
.504 0.747
√ (Corrmax =
-0.357)
√ HTMTmax
= 0.549 PS01_06 0.882*** 29.607
Conscientiousness PS01_03 0.800*** 5.956 0.410 0.772
1.177,
.823 0.629
√ (Corrmax =
-0.394)
√ HTMTmax
= 0.793 PS01_08 0.785*** 6.082
Notes: -a The construct is measured with one item. Internal consistency, convergent validity, and discriminant validity cannot be
appropriately computed; Significance Level *p≤0.1; **p≤0.05; ***p≤0.01 (one-sided)
Table 7.4: Assessment of reflective scales
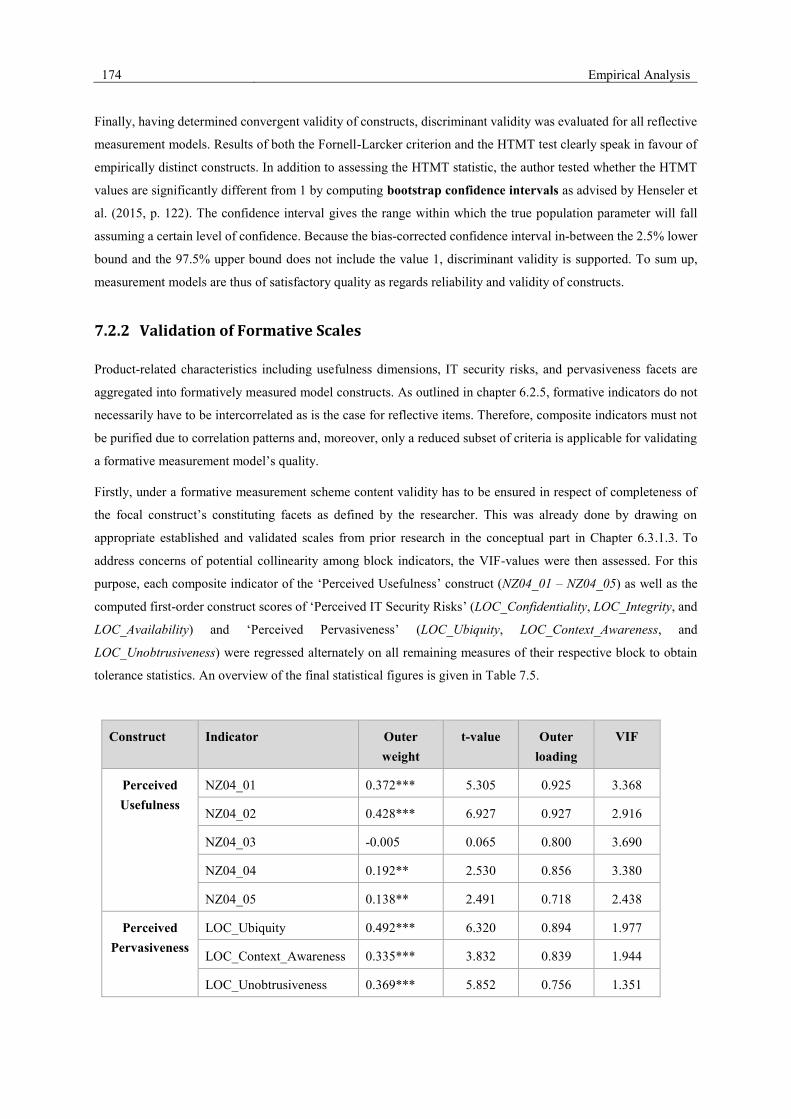
174 Empirical Analysis
Finally, having determined convergent validity of constructs, discriminant validity was evaluated for all reflective
measurement models. Results of both the Fornell-Larcker criterion and the HTMT test clearly speak in favour of
empirically distinct constructs. In addition to assessing the HTMT statistic, the author tested whether the HTMT
values are significantly different from 1 by computing bootstrap confidence intervals as advised by Henseler et
al. (2015, p. 122). The confidence interval gives the range within which the true population parameter will fall
assuming a certain level of confidence. Because the bias-corrected confidence interval in-between the 2.5% lower
bound and the 97.5% upper bound does not include the value 1, discriminant validity is supported. To sum up,
measurement models are thus of satisfactory quality as regards reliability and validity of constructs.
7.2.2 Validation of Formative Scales
Product-related characteristics including usefulness dimensions, IT security risks, and pervasiveness facets are
aggregated into formatively measured model constructs. As outlined in chapter 6.2.5, formative indicators do not
necessarily have to be intercorrelated as is the case for reflective items. Therefore, composite indicators must not
be purified due to correlation patterns and, moreover, only a reduced subset of criteria is applicable for validating
a formative measurement model’s quality.
Firstly, under a formative measurement scheme content validity has to be ensured in respect of completeness of
the focal construct’s constituting facets as defined by the researcher. This was already done by drawing on
appropriate established and validated scales from prior research in the conceptual part in Chapter 6.3.1.3. To
address concerns of potential collinearity among block indicators, the VIF-values were then assessed. For this
purpose, each composite indicator of the ‘Perceived Usefulness’ construct (NZ04_01 – NZ04_05) as well as the
computed first-order construct scores of ‘Perceived IT Security Risks’ (LOC_Confidentiality, LOC_Integrity, and
LOC_Availability) and ‘Perceived Pervasiveness’ (LOC_Ubiquity, LOC_Context_Awareness, and
LOC_Unobtrusiveness) were regressed alternately on all remaining measures of their respective block to obtain
tolerance statistics. An overview of the final statistical figures is given in Table 7.5.
Construct Indicator Outer
weight
t-value Outer
loading
VIF
Perceived
Usefulness
NZ04_01 0.372*** 5.305 0.925 3.368
NZ04_02 0.428*** 6.927 0.927 2.916
NZ04_03 -0.005 0.065 0.800 3.690
NZ04_04 0.192** 2.530 0.856 3.380
NZ04_05 0.138** 2.491 0.718 2.438
Perceived
Pervasiveness
LOC_Ubiquity 0.492*** 6.320 0.894 1.977
LOC_Context_Awareness 0.335*** 3.832 0.839 1.944
LOC_Unobtrusiveness 0.369*** 5.852 0.756 1.351

Empirical Analysis 175
Construct Indicator Outer
weight
t-value Outer
loading
VIF
Perceived IT
Security
LOC_Confidentiality 0.687*** 4.834 0.946 1.732
LOC_Integrity 0.495** 2.687 0.851 2.633
LOC_Availability -0.126 0.752 0.558 2.000
Significance Level *p≤0.1; **p≤0.05; ***p≤0.01 (two-sided)
Table 7.5: Assessment of formative scales
As per empirical results, pairwise linear dependency of indicators does not reach critical levels in any of the
formative scales. VIF-statistics range between 3.690 and 1.351 and are thus uniformly below the recommended
cut-off value of 5.0.
Since no substantial collinearity issues exist, next, the significance and relevance of outer weights have to be
assessed. Therefore, the bootstrap re-sampling procedure was conducted, so that every indicator´s outer weight
(relative importance) could be analysed with regard to its significance. The t-values suggest that all weights, with
two exceptions, are significant on an α 0.05 level. Only NZ04_03 and LOC_Availability fail with a t-value of 0.065
and 0.752. Correspondingly, the relative contribution to their assigned constructs is of minor importance,
exhibiting even reversed weight signs, which are hardly interpretable. Nonetheless, it should be reiterated that also
small interaction effects among formative measures may cause biased estimates and suppressor effects. When
assessing the magnitude of correlation between the negatively weighted variables concerned (NZ04_03 and
LOC_Availability) and the other predictors of the same formative block and between the negatively weighted
variables and their regression criterion (i.e. construct), it becomes evident that crucial correlation patterns among
the measures are present, violating the independence hypothesis of the classical regression model.
In the case of NZ04_03, the VIF-value provide indication that there is indeed a technically problematic level of
collinearity; almost 73% of variance of this indicator are explained by the other formative items. Additional
analyses revealed that there is no suppressor effect involved in the model but rather a confounding third variable
effect as implied by the tolerance statistic. Notably, removing this indicator from its battery does not change the
multiple determination index (R2) of the ‘Perceived Usefulness’ scale, since the regression coefficients of the other
indicators are not suppressed by the item NZ04_03, et vice versa. In the event of nonsignificant indicator weights,
Hair et al. (2017, p. 147) propose to consider the absolute contribution of the respective manifest measures to
their associated index. The authors content that Lambda-values should be ≥ 0.5 to be indicative of the factors’
usefulness in prediction. Due to its high outer loading (λ = 0.8), this formative indicator was thus retained in the
measurement model.
On the contrary, further analyses showed that LOC_ Integrity is actually acting as a suppressor variable on
LOC_Availability. The latter variable positively correlates with the suppressor and the dependent variable but at
the same time, paradoxically, receives a negatively weighted beta coefficient. Suppression can be detected by
comparing the effect of an independent variable X on a criterion variable Y in two regression models, one
predicting Y from only the X variable, the other predicting Y from both the X variable and the confounding third
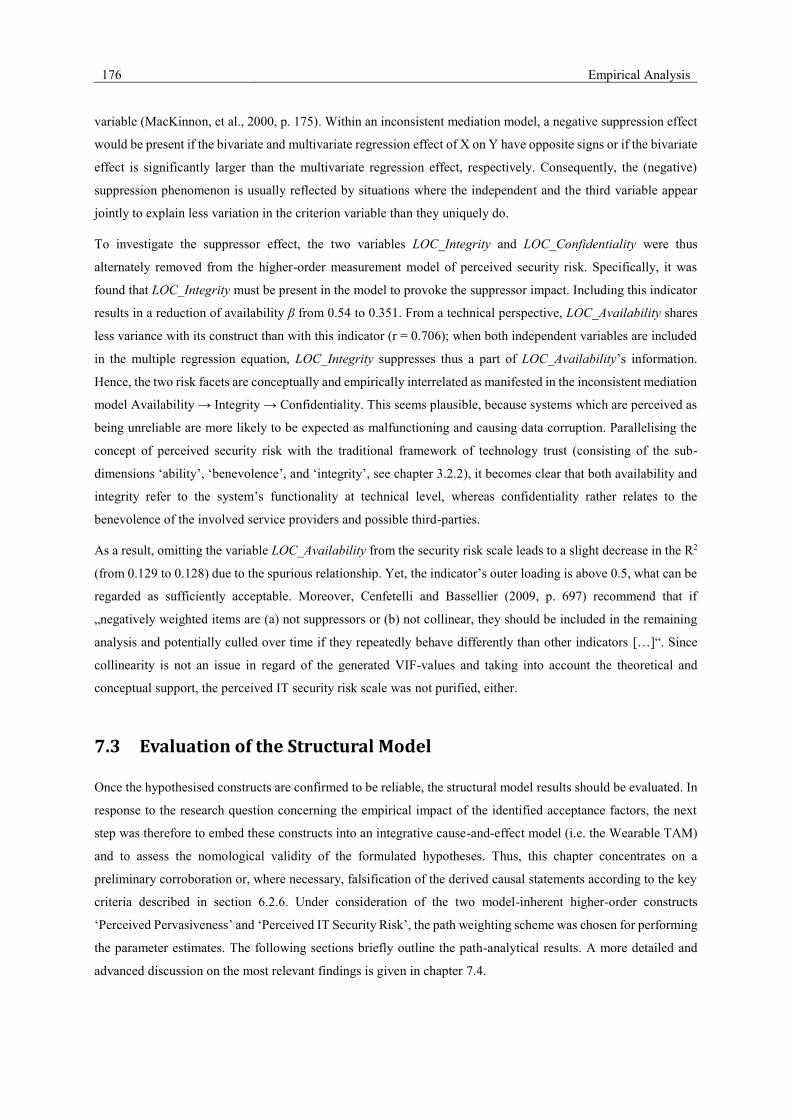
176 Empirical Analysis
variable (MacKinnon, et al., 2000, p. 175). Within an inconsistent mediation model, a negative suppression effect
would be present if the bivariate and multivariate regression effect of X on Y have opposite signs or if the bivariate
effect is significantly larger than the multivariate regression effect, respectively. Consequently, the (negative)
suppression phenomenon is usually reflected by situations where the independent and the third variable appear
jointly to explain less variation in the criterion variable than they uniquely do.
To investigate the suppressor effect, the two variables LOC_Integrity and LOC_Confidentiality were thus
alternately removed from the higher-order measurement model of perceived security risk. Specifically, it was
found that LOC_Integrity must be present in the model to provoke the suppressor impact. Including this indicator
results in a reduction of availability β from 0.54 to 0.351. From a technical perspective, LOC_Availability shares
less variance with its construct than with this indicator (r = 0.706); when both independent variables are included
in the multiple regression equation, LOC_Integrity suppresses thus a part of LOC_Availability’s information.
Hence, the two risk facets are conceptually and empirically interrelated as manifested in the inconsistent mediation
model Availability → Integrity → Confidentiality. This seems plausible, because systems which are perceived as
being unreliable are more likely to be expected as malfunctioning and causing data corruption. Parallelising the
concept of perceived security risk with the traditional framework of technology trust (consisting of the sub-
dimensions ‘ability’, ‘benevolence’, and ‘integrity’, see chapter 3.2.2), it becomes clear that both availability and
integrity refer to the system’s functionality at technical level, whereas confidentiality rather relates to the
benevolence of the involved service providers and possible third-parties.
As a result, omitting the variable LOC_Availability from the security risk scale leads to a slight decrease in the R2
(from 0.129 to 0.128) due to the spurious relationship. Yet, the indicator’s outer loading is above 0.5, what can be
regarded as sufficiently acceptable. Moreover, Cenfetelli and Bassellier (2009, p. 697) recommend that if
„negatively weighted items are (a) not suppressors or (b) not collinear, they should be included in the remaining
analysis and potentially culled over time if they repeatedly behave differently than other indicators […]“. Since
collinearity is not an issue in regard of the generated VIF-values and taking into account the theoretical and
conceptual support, the perceived IT security risk scale was not purified, either.
7.3 Evaluation of the Structural Model
Once the hypothesised constructs are confirmed to be reliable, the structural model results should be evaluated. In
response to the research question concerning the empirical impact of the identified acceptance factors, the next
step was therefore to embed these constructs into an integrative cause-and-effect model (i.e. the Wearable TAM)
and to assess the nomological validity of the formulated hypotheses. Thus, this chapter concentrates on a
preliminary corroboration or, where necessary, falsification of the derived causal statements according to the key
criteria described in section 6.2.6. Under consideration of the two model-inherent higher-order constructs
‘Perceived Pervasiveness’ and ‘Perceived IT Security Risk’, the path weighting scheme was chosen for performing
the parameter estimates. The following sections briefly outline the path-analytical results. A more detailed and
advanced discussion on the most relevant findings is given in chapter 7.4.

Empirical Analysis 177
First of all, analogous to the formative index construction in subchapter 7.2.2, to avoid deflated path coefficients
possible collinearity among model-inherent latent variables should be detected before testing the inner model
(Hair, et al., 2016 p. 192). Therefore, the variance inflation statistics for the structural model were assessed first.
Since the highest resultant inner VIF-value amounts to 2.895 and hence turns out to be considerably below 5.0,
the model can be regarded as bearing no critical multicollinearity. The key results of the performed PLS-SEM
algorithm are shown in Table 7.6.
Endogenous Construct Predictor VIF
Intention to Use Perceived Usefulness 3.225
Perceived Pervasiveness 2.838
Perceived Security Risk 1.163
Trust in Wearables 3.364
Involvement 2.659
Involvement Need for Materialism 1.000
Need for Cognition 1.000
Need for Cognition Conscientiousness 1.110
Extraversion 1.209
Openness to Experience 1.100
Need for Materialism Agreeableness 1.025
Neuroticism 1.025
Table 7.6: Multicollinearity diagnostics coefficients at structural model level
The effect of the postulated predictor constructs on the intention to use wearables was measured by examining the
standardised beta coefficients obtained from the multiple regression, so the magnitude and sign of path coefficients
can be interpreted in regard to the strength and direction of the formulated structural relationships. Figure 7.4
displays the structural model. The effects are visualised as arrow paths and the strength and significance of the
pertaining structural coefficients (β) is given for each hypothesised relationship. In addition, R-squared values,
which indicate the portion of a dependent variable’s explained variance, and the Stone-Geisser’s Q2-test criterion
as a measure for the predictive relevance of a reflective regressand are reported. Non-significant relationships are
illustrated by dotted lines. As shown, most of the obtained structural parameters suggest strong empirical relations
by means of the produced path coefficients. Correspondingly, the estimated Q2-values above 0.0 indicate
predictive relevance of the model equations. Only the proposed dependency structures denoted by H3, H4, and H9
fail to meet the established requirement level (β > 0.1). To verify the significance of the hypothesised causal links,
two-tailed t-tests were used due to the bidirectional nature of the nomological net (i.e. some hypotheses such as
H2 and H3a operate in opposite direction). Again, all three hypotheses H3, H4, and H9 can be considered as being
not supported by the data, since the error probability for the respective path coefficients is greater than 0.1.
Moreover, the effect sizes of the concerning predictor constructs (i.e. ‘Conscientiousness’, ‘Perceived
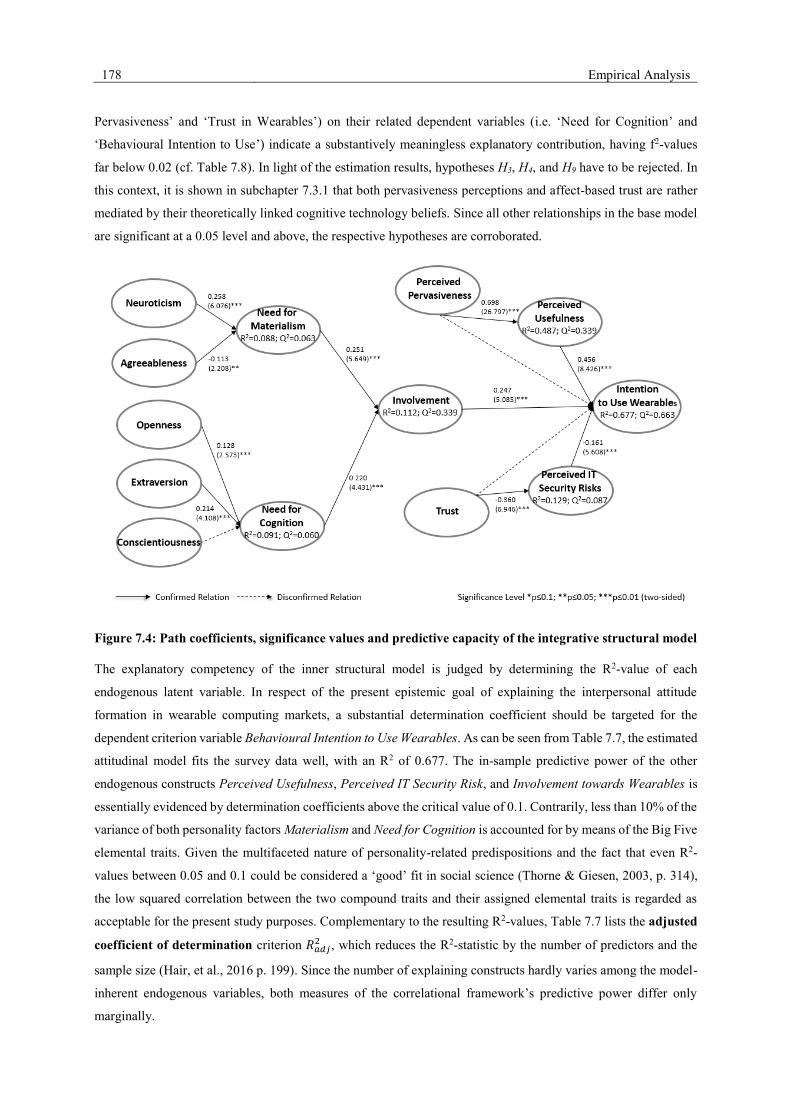
178 Empirical Analysis
Pervasiveness’ and ‘Trust in Wearables’) on their related dependent variables (i.e. ‘Need for Cognition’ and
‘Behavioural Intention to Use’) indicate a substantively meaningless explanatory contribution, having f2-values
far below 0.02 (cf. Table 7.8). In light of the estimation results, hypotheses H3, H4, and H9 have to be rejected. In
this context, it is shown in subchapter 7.3.1 that both pervasiveness perceptions and affect-based trust are rather
mediated by their theoretically linked cognitive technology beliefs. Since all other relationships in the base model
are significant at a 0.05 level and above, the respective hypotheses are corroborated.
Figure 7.4: Path coefficients, significance values and predictive capacity of the integrative structural model
The explanatory competency of the inner structural model is judged by determining the R2-value of each
endogenous latent variable. In respect of the present epistemic goal of explaining the interpersonal attitude
formation in wearable computing markets, a substantial determination coefficient should be targeted for the
dependent criterion variable Behavioural Intention to Use Wearables. As can be seen from Table 7.7, the estimated
attitudinal model fits the survey data well, with an R2 of 0.677. The in-sample predictive power of the other
endogenous constructs Perceived Usefulness, Perceived IT Security Risk, and Involvement towards Wearables is
essentially evidenced by determination coefficients above the critical value of 0.1. Contrarily, less than 10% of the
variance of both personality factors Materialism and Need for Cognition is accounted for by means of the Big Five
elemental traits. Given the multifaceted nature of personality-related predispositions and the fact that even R2-
values between 0.05 and 0.1 could be considered a ‘good’ fit in social science (Thorne & Giesen, 2003, p. 314),
the low squared correlation between the two compound traits and their assigned elemental traits is regarded as
acceptable for the present study purposes. Complementary to the resulting R2-values, Table 7.7 lists the adjusted
coefficient of determination criterion 𝑅𝑎𝑑𝑗2 , which reduces the R2-statistic by the number of predictors and the
sample size (Hair, et al., 2016 p. 199). Since the number of explaining constructs hardly varies among the model-
inherent endogenous variables, both measures of the correlational framework’s predictive power differ only
marginally.
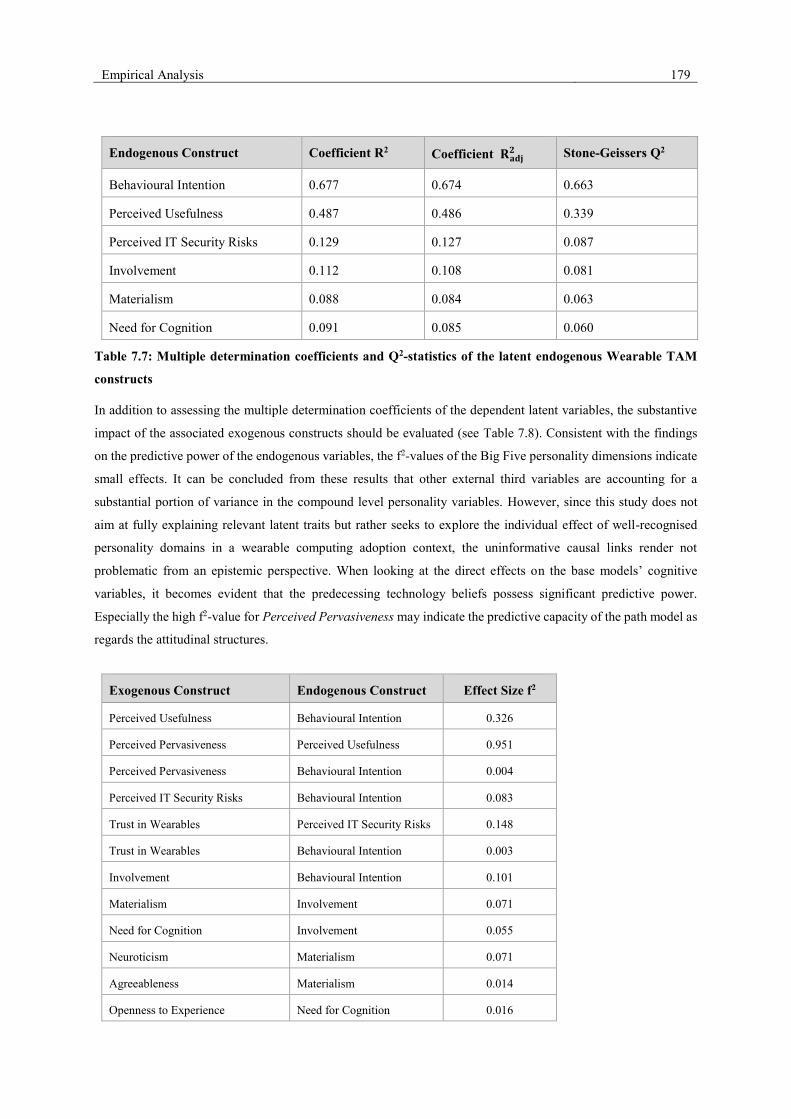
Empirical Analysis 179
Endogenous Construct Coefficient R2 Coefficient 𝐑𝐚𝐝𝐣𝟐 Stone-Geissers Q2
Behavioural Intention 0.677 0.674 0.663
Perceived Usefulness 0.487 0.486 0.339
Perceived IT Security Risks 0.129 0.127 0.087
Involvement 0.112 0.108 0.081
Materialism 0.088 0.084 0.063
Need for Cognition 0.091 0.085 0.060
Table 7.7: Multiple determination coefficients and Q2-statistics of the latent endogenous Wearable TAM
constructs
In addition to assessing the multiple determination coefficients of the dependent latent variables, the substantive
impact of the associated exogenous constructs should be evaluated (see Table 7.8). Consistent with the findings
on the predictive power of the endogenous variables, the f2-values of the Big Five personality dimensions indicate
small effects. It can be concluded from these results that other external third variables are accounting for a
substantial portion of variance in the compound level personality variables. However, since this study does not
aim at fully explaining relevant latent traits but rather seeks to explore the individual effect of well-recognised
personality domains in a wearable computing adoption context, the uninformative causal links render not
problematic from an epistemic perspective. When looking at the direct effects on the base models’ cognitive
variables, it becomes evident that the predecessing technology beliefs possess significant predictive power.
Especially the high f2-value for Perceived Pervasiveness may indicate the predictive capacity of the path model as
regards the attitudinal structures.
Exogenous Construct Endogenous Construct Effect Size f2
Perceived Usefulness Behavioural Intention 0.326
Perceived Pervasiveness Perceived Usefulness 0.951
Perceived Pervasiveness Behavioural Intention 0.004
Perceived IT Security Risks Behavioural Intention 0.083
Trust in Wearables Perceived IT Security Risks 0.148
Trust in Wearables Behavioural Intention 0.003
Involvement Behavioural Intention 0.101
Materialism Involvement 0.071
Need for Cognition Involvement 0.055
Neuroticism Materialism 0.071
Agreeableness Materialism 0.014
Openness to Experience Need for Cognition 0.016

180 Empirical Analysis
Exogenous Construct Endogenous Construct Effect Size f2
Extraversion Need for Cognition 0.041
Conscientiousness Need for Cognition 0.003
Table 7.8: Effect sizes of exogenous constructs
The final assessment of the structural equation model addresses the predictive relevance of the reflectively
measured, endogenous constructs. This criterion is assessed with the help of Stone-Geisser Q2, which is calculated
by means of the blindfolding procedure. As the resulting Q2-values for all reflectively measured dependent
variables are positive (cf. Table 7.7), sufficient predictive relevance of the path model can be assumed. What is
more, given that Q2 effect sizes of 0.02, 0.15, and 0.35 indicate that an endogenous construct has a small, medium,
or large predictive relevance, respectively (Hair, et al., 2016 p. 208), the proposed path model demonstrates out-
of-sample predictive power for the dependent criterion variable of wearable computing acceptance. The
endogenous variables Perceived Usefulness and Perceived IT Security Risk are specified as formative first and
second-order constructs. For this reason, Q² is not interpretable for both constructs.
Overall, based on the above discussed second generation quality criteria, the developed cause-and-effect model
indicates that both personality structures and cognitive beliefs (i.e. subjective benefit and cost expectations) exert
significant total effects on the decision to adopt wearable technologies. The magnitude and statistical significance
of parameter estimates together with the obtained determination coefficients and the demonstrated predictive
validity of model constructs clearly underline the importance of attitudinally-relevant value perceptions and
predispositions in a ubiquitous computing setting. In particular, the PLS estimation results highlight the utmost
important role usefulness perceptions play in intention formation processes. In line with the apriorically defined
conceptual framework, the felt pervasiveness of wearables is completely mediated by utilitarian considerations.
On the contrary, the hypothesised relationship between conscientiousness and the tendency to engage in cognitive
tasks is not supported by the empirical data. Aside from this, both drivers of benefit and cost perceptions (i.e. the
perceived pervasiveness and trust towards wearables) do not show a significant association to the target construct.
However, their effect on usage intention is largely intervened by cognitive dimensions of attitude and, thus, of
indirect nature, as will be shown hereafter. In conclusion, quantitative evidence for the nomological validity of the
conceptualised structural model is found since the relevant quality standards are fulfilled. Yet, prior to conclusively
accepting and interpreting these findings, the next sections examine further interacting effects pertinent to the
causal model.
7.3.1 Mediating Effects
Overall, the developed nomological net implies two indirect relationships among the attitude-forming constructs.
Such interdependencies, which are directed towards an endogenous variable by means of an intermediate element,
are referred to as ‘mediating effects’ in structural equation research (see chapter 6.2.6.2). Within a PLS-SEM path
model, mediator variables are directly implemented and their effects are automatically considered. However, the
resulting parameters do not readily permit an evaluation of the character and magnitude of mediating effects.
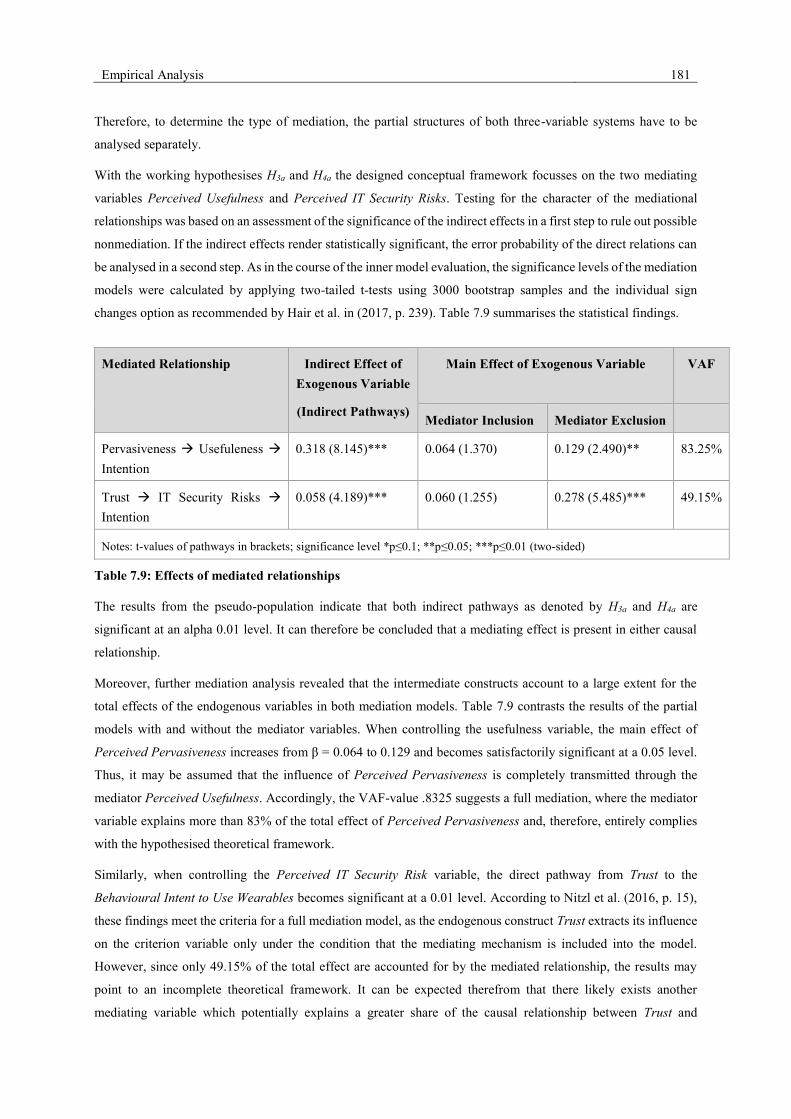
Empirical Analysis 181
Therefore, to determine the type of mediation, the partial structures of both three-variable systems have to be
analysed separately.
With the working hypothesises H3a and H4a the designed conceptual framework focusses on the two mediating
variables Perceived Usefulness and Perceived IT Security Risks. Testing for the character of the mediational
relationships was based on an assessment of the significance of the indirect effects in a first step to rule out possible
nonmediation. If the indirect effects render statistically significant, the error probability of the direct relations can
be analysed in a second step. As in the course of the inner model evaluation, the significance levels of the mediation
models were calculated by applying two-tailed t-tests using 3000 bootstrap samples and the individual sign
changes option as recommended by Hair et al. in (2017, p. 239). Table 7.9 summarises the statistical findings.
Mediated Relationship Indirect Effect of
Exogenous Variable
(Indirect Pathways)
Main Effect of Exogenous Variable
VAF
Mediator Inclusion Mediator Exclusion
Pervasiveness → Usefuleness →
Intention
0.318 (8.145)*** 0.064 (1.370) 0.129 (2.490)** 83.25%
Trust → IT Security Risks →
Intention
0.058 (4.189)*** 0.060 (1.255) 0.278 (5.485)*** 49.15%
Notes: t-values of pathways in brackets; significance level *p≤0.1; **p≤0.05; ***p≤0.01 (two-sided)
Table 7.9: Effects of mediated relationships
The results from the pseudo-population indicate that both indirect pathways as denoted by H3a and H4a are
significant at an alpha 0.01 level. It can therefore be concluded that a mediating effect is present in either causal
relationship.
Moreover, further mediation analysis revealed that the intermediate constructs account to a large extent for the
total effects of the endogenous variables in both mediation models. Table 7.9 contrasts the results of the partial
models with and without the mediator variables. When controlling the usefulness variable, the main effect of
Perceived Pervasiveness increases from β = 0.064 to 0.129 and becomes satisfactorily significant at a 0.05 level.
Thus, it may be assumed that the influence of Perceived Pervasiveness is completely transmitted through the
mediator Perceived Usefulness. Accordingly, the VAF-value .8325 suggests a full mediation, where the mediator
variable explains more than 83% of the total effect of Perceived Pervasiveness and, therefore, entirely complies
with the hypothesised theoretical framework.
Similarly, when controlling the Perceived IT Security Risk variable, the direct pathway from Trust to the
Behavioural Intent to Use Wearables becomes significant at a 0.01 level. According to Nitzl et al. (2016, p. 15),
these findings meet the criteria for a full mediation model, as the endogenous construct Trust extracts its influence
on the criterion variable only under the condition that the mediating mechanism is included into the model.
However, since only 49.15% of the total effect are accounted for by the mediated relationship, the results may
point to an incomplete theoretical framework. It can be expected therefrom that there likely exists another
mediating variable which potentially explains a greater share of the causal relationship between Trust and
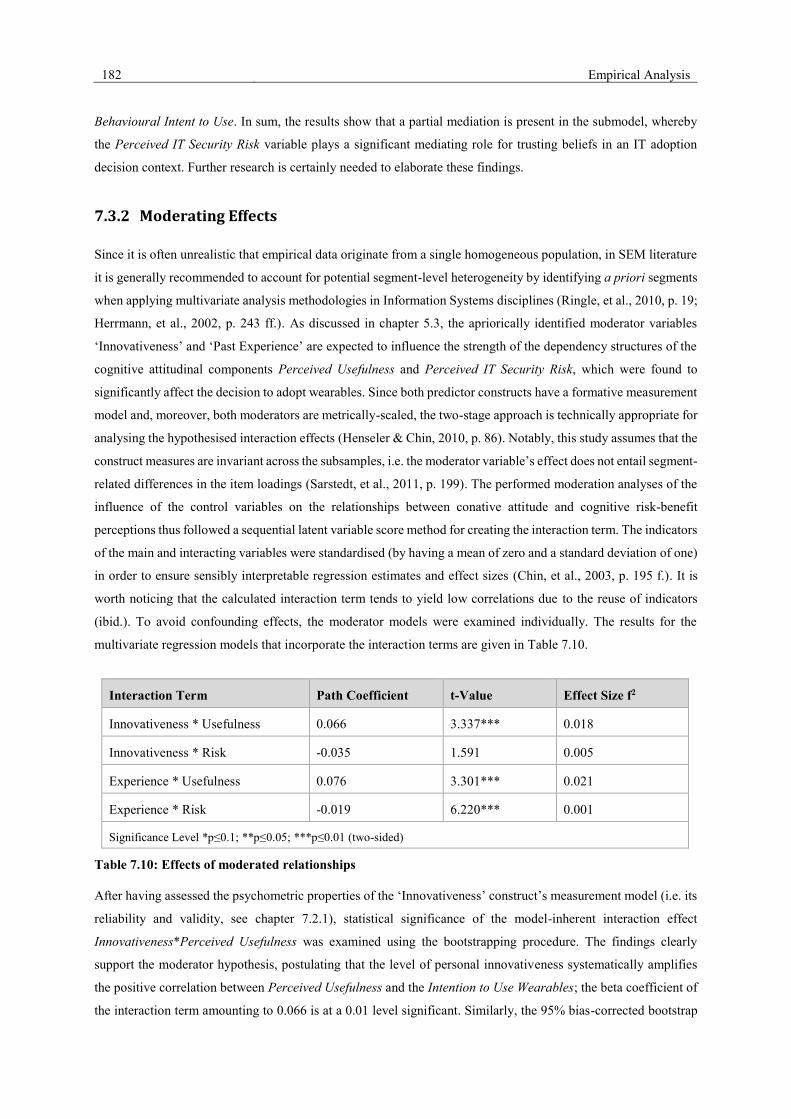
182 Empirical Analysis
Behavioural Intent to Use. In sum, the results show that a partial mediation is present in the submodel, whereby
the Perceived IT Security Risk variable plays a significant mediating role for trusting beliefs in an IT adoption
decision context. Further research is certainly needed to elaborate these findings.
7.3.2 Moderating Effects
Since it is often unrealistic that empirical data originate from a single homogeneous population, in SEM literature
it is generally recommended to account for potential segment-level heterogeneity by identifying a priori segments
when applying multivariate analysis methodologies in Information Systems disciplines (Ringle, et al., 2010, p. 19;
Herrmann, et al., 2002, p. 243 ff.). As discussed in chapter 5.3, the apriorically identified moderator variables
‘Innovativeness’ and ‘Past Experience’ are expected to influence the strength of the dependency structures of the
cognitive attitudinal components Perceived Usefulness and Perceived IT Security Risk, which were found to
significantly affect the decision to adopt wearables. Since both predictor constructs have a formative measurement
model and, moreover, both moderators are metrically-scaled, the two-stage approach is technically appropriate for
analysing the hypothesised interaction effects (Henseler & Chin, 2010, p. 86). Notably, this study assumes that the
construct measures are invariant across the subsamples, i.e. the moderator variable’s effect does not entail segment-
related differences in the item loadings (Sarstedt, et al., 2011, p. 199). The performed moderation analyses of the
influence of the control variables on the relationships between conative attitude and cognitive risk-benefit
perceptions thus followed a sequential latent variable score method for creating the interaction term. The indicators
of the main and interacting variables were standardised (by having a mean of zero and a standard deviation of one)
in order to ensure sensibly interpretable regression estimates and effect sizes (Chin, et al., 2003, p. 195 f.). It is
worth noticing that the calculated interaction term tends to yield low correlations due to the reuse of indicators
(ibid.). To avoid confounding effects, the moderator models were examined individually. The results for the
multivariate regression models that incorporate the interaction terms are given in Table 7.10.
Interaction Term Path Coefficient t-Value Effect Size f2
Innovativeness * Usefulness 0.066 3.337*** 0.018
Innovativeness * Risk -0.035 1.591 0.005
Experience * Usefulness 0.076 3.301*** 0.021
Experience * Risk -0.019 6.220*** 0.001
Significance Level *p≤0.1; **p≤0.05; ***p≤0.01 (two-sided)
Table 7.10: Effects of moderated relationships
After having assessed the psychometric properties of the ‘Innovativeness’ construct’s measurement model (i.e. its
reliability and validity, see chapter 7.2.1), statistical significance of the model-inherent interaction effect
Innovativeness*Perceived Usefulness was examined using the bootstrapping procedure. The findings clearly
support the moderator hypothesis, postulating that the level of personal innovativeness systematically amplifies
the positive correlation between Perceived Usefulness and the Intention to Use Wearables; the beta coefficient of
the interaction term amounting to 0.066 is at a 0.01 level significant. Similarly, the 95% bias-corrected bootstrap
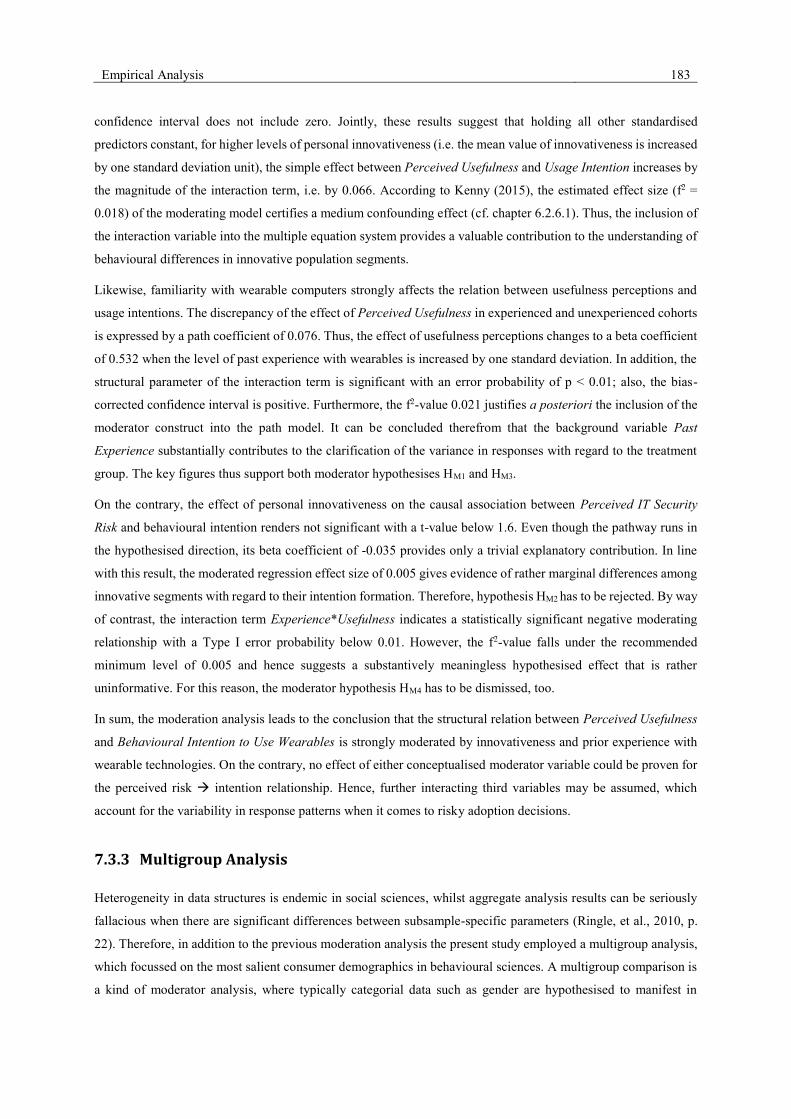
Empirical Analysis 183
confidence interval does not include zero. Jointly, these results suggest that holding all other standardised
predictors constant, for higher levels of personal innovativeness (i.e. the mean value of innovativeness is increased
by one standard deviation unit), the simple effect between Perceived Usefulness and Usage Intention increases by
the magnitude of the interaction term, i.e. by 0.066. According to Kenny (2015), the estimated effect size (f2 =
0.018) of the moderating model certifies a medium confounding effect (cf. chapter 6.2.6.1). Thus, the inclusion of
the interaction variable into the multiple equation system provides a valuable contribution to the understanding of
behavioural differences in innovative population segments.
Likewise, familiarity with wearable computers strongly affects the relation between usefulness perceptions and
usage intentions. The discrepancy of the effect of Perceived Usefulness in experienced and unexperienced cohorts
is expressed by a path coefficient of 0.076. Thus, the effect of usefulness perceptions changes to a beta coefficient
of 0.532 when the level of past experience with wearables is increased by one standard deviation. In addition, the
structural parameter of the interaction term is significant with an error probability of p < 0.01; also, the bias-
corrected confidence interval is positive. Furthermore, the f2-value 0.021 justifies a posteriori the inclusion of the
moderator construct into the path model. It can be concluded therefrom that the background variable Past
Experience substantially contributes to the clarification of the variance in responses with regard to the treatment
group. The key figures thus support both moderator hypothesises HM1 and HM3.
On the contrary, the effect of personal innovativeness on the causal association between Perceived IT Security
Risk and behavioural intention renders not significant with a t-value below 1.6. Even though the pathway runs in
the hypothesised direction, its beta coefficient of -0.035 provides only a trivial explanatory contribution. In line
with this result, the moderated regression effect size of 0.005 gives evidence of rather marginal differences among
innovative segments with regard to their intention formation. Therefore, hypothesis HM2 has to be rejected. By way
of contrast, the interaction term Experience*Usefulness indicates a statistically significant negative moderating
relationship with a Type I error probability below 0.01. However, the f2-value falls under the recommended
minimum level of 0.005 and hence suggests a substantively meaningless hypothesised effect that is rather
uninformative. For this reason, the moderator hypothesis HM4 has to be dismissed, too.
In sum, the moderation analysis leads to the conclusion that the structural relation between Perceived Usefulness
and Behavioural Intention to Use Wearables is strongly moderated by innovativeness and prior experience with
wearable technologies. On the contrary, no effect of either conceptualised moderator variable could be proven for
the perceived risk → intention relationship. Hence, further interacting third variables may be assumed, which
account for the variability in response patterns when it comes to risky adoption decisions.
7.3.3 Multigroup Analysis
Heterogeneity in data structures is endemic in social sciences, whilst aggregate analysis results can be seriously
fallacious when there are significant differences between subsample-specific parameters (Ringle, et al., 2010, p.
22). Therefore, in addition to the previous moderation analysis the present study employed a multigroup analysis,
which focussed on the most salient consumer demographics in behavioural sciences. A multigroup comparison is
a kind of moderator analysis, where typically categorial data such as gender are hypothesised to manifest in
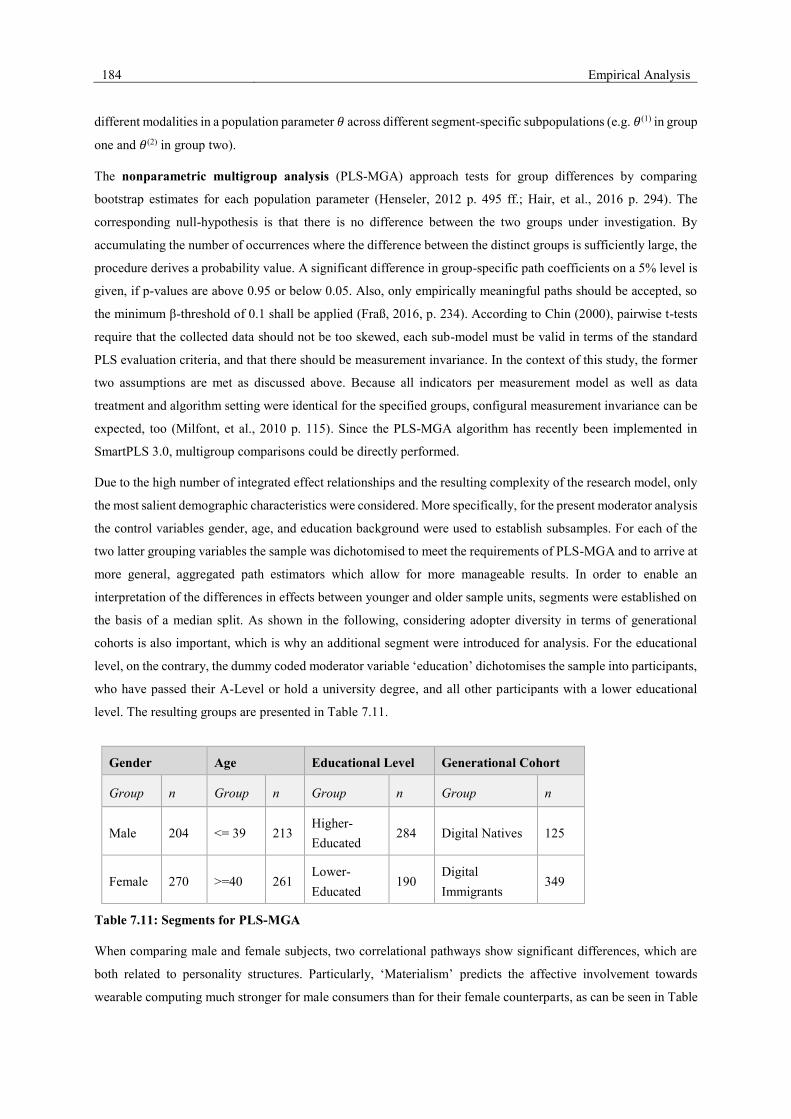
184 Empirical Analysis
different modalities in a population parameter 𝜃 across different segment-specific subpopulations (e.g. 𝜃(1) in group
one and 𝜃(2) in group two).
The nonparametric multigroup analysis (PLS-MGA) approach tests for group differences by comparing
bootstrap estimates for each population parameter (Henseler, 2012 p. 495 ff.; Hair, et al., 2016 p. 294). The
corresponding null-hypothesis is that there is no difference between the two groups under investigation. By
accumulating the number of occurrences where the difference between the distinct groups is sufficiently large, the
procedure derives a probability value. A significant difference in group-specific path coefficients on a 5% level is
given, if p-values are above 0.95 or below 0.05. Also, only empirically meaningful paths should be accepted, so
the minimum β-threshold of 0.1 shall be applied (Fraß, 2016, p. 234). According to Chin (2000), pairwise t-tests
require that the collected data should not be too skewed, each sub-model must be valid in terms of the standard
PLS evaluation criteria, and that there should be measurement invariance. In the context of this study, the former
two assumptions are met as discussed above. Because all indicators per measurement model as well as data
treatment and algorithm setting were identical for the specified groups, configural measurement invariance can be
expected, too (Milfont, et al., 2010 p. 115). Since the PLS-MGA algorithm has recently been implemented in
SmartPLS 3.0, multigroup comparisons could be directly performed.
Due to the high number of integrated effect relationships and the resulting complexity of the research model, only
the most salient demographic characteristics were considered. More specifically, for the present moderator analysis
the control variables gender, age, and education background were used to establish subsamples. For each of the
two latter grouping variables the sample was dichotomised to meet the requirements of PLS-MGA and to arrive at
more general, aggregated path estimators which allow for more manageable results. In order to enable an
interpretation of the differences in effects between younger and older sample units, segments were established on
the basis of a median split. As shown in the following, considering adopter diversity in terms of generational
cohorts is also important, which is why an additional segment were introduced for analysis. For the educational
level, on the contrary, the dummy coded moderator variable ‘education’ dichotomises the sample into participants,
who have passed their A-Level or hold a university degree, and all other participants with a lower educational
level. The resulting groups are presented in Table 7.11.
Gender Age Educational Level Generational Cohort
Group n Group n Group n Group n
Male 204 <= 39 213 Higher-
Educated 284 Digital Natives 125
Female 270 >=40 261 Lower-
Educated 190
Digital
Immigrants 349
Table 7.11: Segments for PLS-MGA
When comparing male and female subjects, two correlational pathways show significant differences, which are
both related to personality structures. Particularly, ‘Materialism’ predicts the affective involvement towards
wearable computing much stronger for male consumers than for their female counterparts, as can be seen in Table
Empirical Analysis 185
7.12. This indicates that materialistic values play a much more important role in the adoption decision process for
men than for women.
Moreover, ‘Agreeableness’ is not a significant predictor for the subgroup ‘females’, but for the subgroup ‘males’
it is. Thus, the more a male subject strives for social harmony, the less he is materialistically-oriented. Interestingly,
with a β-weight difference of 0.272 this is much less the case in the female subsample. In contrast, for the causal
relationship between ‘Need for Cognition’ and the ‘Involvement towards Wearables’ significance is narrowly
missed at p = 0.056; even though this link is considerably stronger for female persons, the respective H0-
hypothesis, that the path coefficient is not statistically significant, cannot be rejected therefore.
Causal Pathway β-weight
difference
p-Value Female Male
Agreeableness -> Need for Materialism 0,272 0,006 -0,001 -0,272
Conscientiousness -> Need for Cognition 0,010 0,541 0,057 0,067
Extraversion -> Need for Cognition 0,016 0,441 0,236 0,221
IT Security Risks -> Behavioural Intent to Use Wearables 0,096 0,939 -0,203 -0,107
Involvement towards Wearables -> Behavioural Intent to Use
Wearables 0,090 0,820 0,202 0,292
Need for Cognition -> Involvement towards Wearables 0,163 0,056 0,290 0,127
Need for Materialism -> Involvement towards Wearables 0,143 0,957 0,197 0,340
Neuroticism -> Need for Materialism 0,044 0,694 0,234 0,278
Openness to Experience -> Need for Cognition 0,041 0,661 0,110 0,151
Perceived Pervasiveness -> Behavioural Intent to Use Wearables 0,041 0,336 0,087 0,046
Perceived Pervasiveness -> Perceived Usefulness 0,056 0,145 0,725 0,669
Perceived Usefulness -> Behavioural Intent to Use Wearables 0,009 0,530 0,458 0,467
Trust -> Behavioural Intent to Use Wearables 0,002 0,492 0,055 0,053
Trust -> IT Security Risks 0,050 0,684 -0,387 -0,337
Table 7.12: Gender group differences
Based on the two ‘educational background’ subsamples, only one relevant difference occurs due to group effects:
The influence of ‘Trust in Wearables’ on ‘Perceived IT security Risk’ is comparably strong amongst higher-
educated subjects, as illustrated by Table 7.13. This segment-specific impact manifests in a weight difference of
0.160 and is thus sufficiently meaningful. With regard to this finding, it can be concluded that especially in better-
educated segments risk perceptions might be attenuated by creating trust towards wearable technologies.
Contrarily, the analysis of the present data shows that when dividing the sample based on the educational level,
the group-related deviation of the ‘Need for Cognition’ → ‘Involvement towards Wearables’ relationship fails
slightly to achieve the required significance level of 0.05.
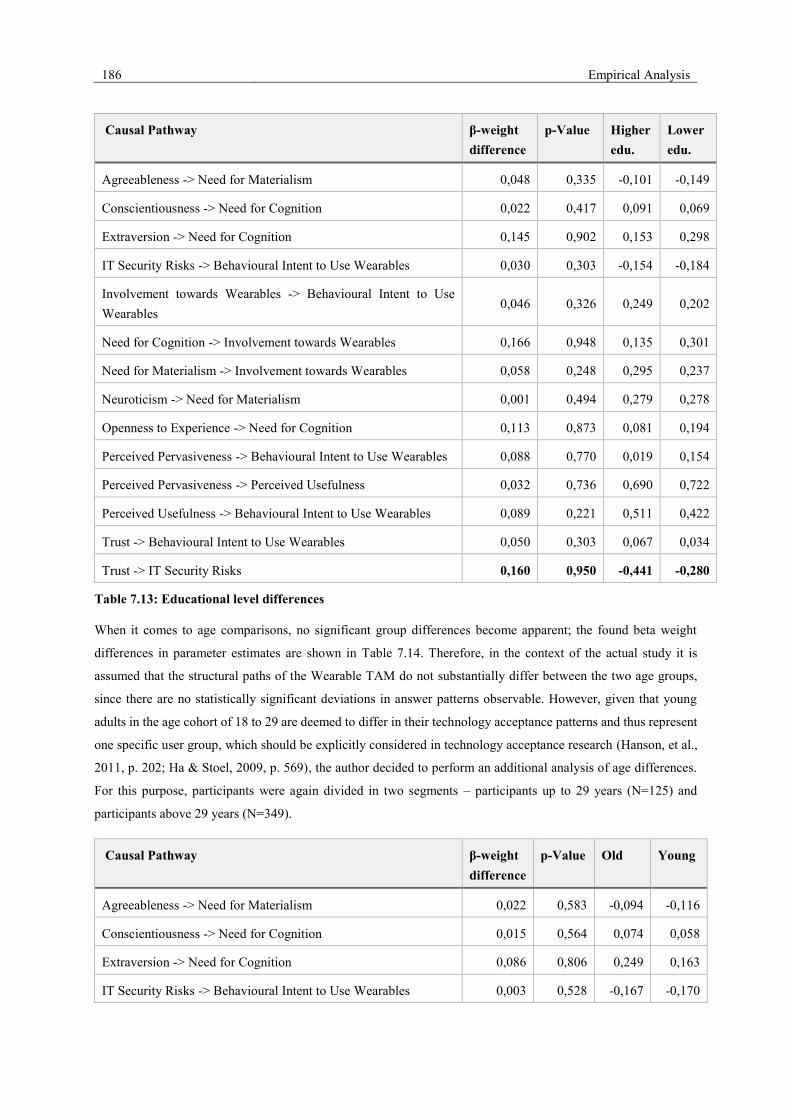
186 Empirical Analysis
Causal Pathway β-weight
difference
p-Value Higher
edu.
Lower
edu.
Agreeableness -> Need for Materialism 0,048 0,335 -0,101 -0,149
Conscientiousness -> Need for Cognition 0,022 0,417 0,091 0,069
Extraversion -> Need for Cognition 0,145 0,902 0,153 0,298
IT Security Risks -> Behavioural Intent to Use Wearables 0,030 0,303 -0,154 -0,184
Involvement towards Wearables -> Behavioural Intent to Use
Wearables 0,046 0,326 0,249 0,202
Need for Cognition -> Involvement towards Wearables 0,166 0,948 0,135 0,301
Need for Materialism -> Involvement towards Wearables 0,058 0,248 0,295 0,237
Neuroticism -> Need for Materialism 0,001 0,494 0,279 0,278
Openness to Experience -> Need for Cognition 0,113 0,873 0,081 0,194
Perceived Pervasiveness -> Behavioural Intent to Use Wearables 0,088 0,770 0,019 0,154
Perceived Pervasiveness -> Perceived Usefulness 0,032 0,736 0,690 0,722
Perceived Usefulness -> Behavioural Intent to Use Wearables 0,089 0,221 0,511 0,422
Trust -> Behavioural Intent to Use Wearables 0,050 0,303 0,067 0,034
Trust -> IT Security Risks 0,160 0,950 -0,441 -0,280
Table 7.13: Educational level differences
When it comes to age comparisons, no significant group differences become apparent; the found beta weight
differences in parameter estimates are shown in Table 7.14. Therefore, in the context of the actual study it is
assumed that the structural paths of the Wearable TAM do not substantially differ between the two age groups,
since there are no statistically significant deviations in answer patterns observable. However, given that young
adults in the age cohort of 18 to 29 are deemed to differ in their technology acceptance patterns and thus represent
one specific user group, which should be explicitly considered in technology acceptance research (Hanson, et al.,
2011, p. 202; Ha & Stoel, 2009, p. 569), the author decided to perform an additional analysis of age differences.
For this purpose, participants were again divided in two segments – participants up to 29 years (N=125) and
participants above 29 years (N=349).
Causal Pathway β-weight
difference
p-Value Old Young
Agreeableness -> Need for Materialism 0,022 0,583 -0,094 -0,116
Conscientiousness -> Need for Cognition 0,015 0,564 0,074 0,058
Extraversion -> Need for Cognition 0,086 0,806 0,249 0,163
IT Security Risks -> Behavioural Intent to Use Wearables 0,003 0,528 -0,167 -0,170
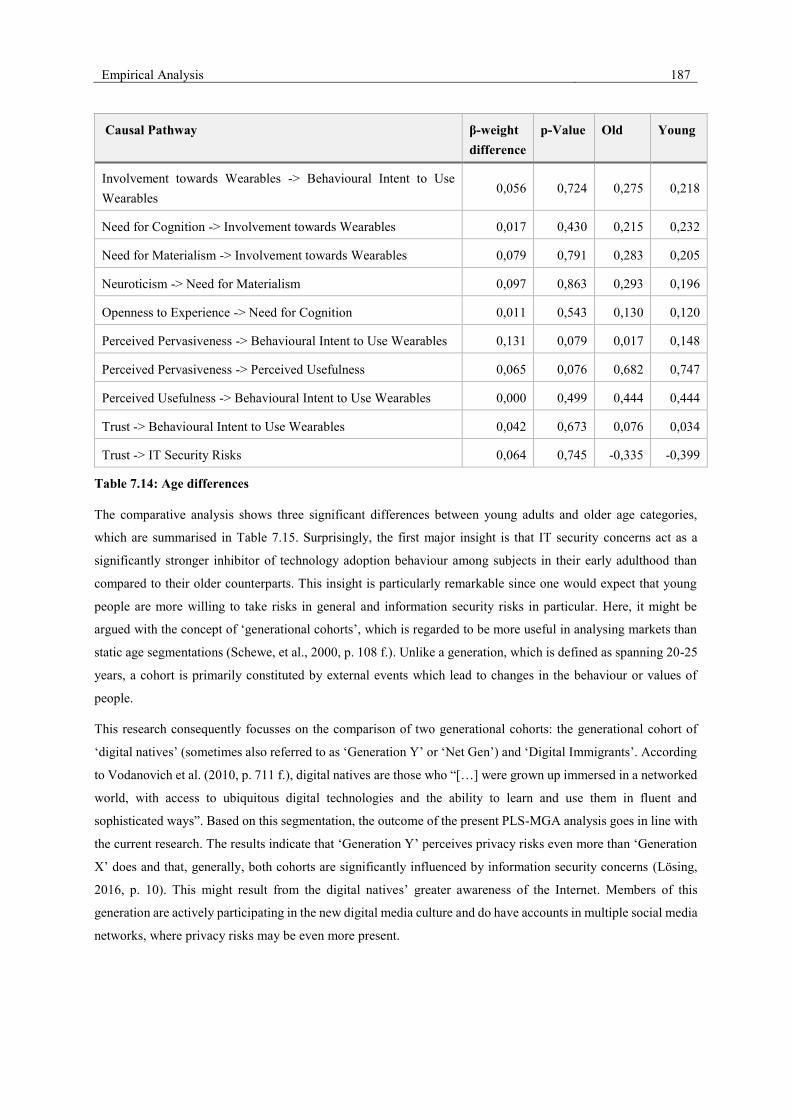
Empirical Analysis 187
Causal Pathway β-weight
difference
p-Value Old Young
Involvement towards Wearables -> Behavioural Intent to Use
Wearables 0,056 0,724 0,275 0,218
Need for Cognition -> Involvement towards Wearables 0,017 0,430 0,215 0,232
Need for Materialism -> Involvement towards Wearables 0,079 0,791 0,283 0,205
Neuroticism -> Need for Materialism 0,097 0,863 0,293 0,196
Openness to Experience -> Need for Cognition 0,011 0,543 0,130 0,120
Perceived Pervasiveness -> Behavioural Intent to Use Wearables 0,131 0,079 0,017 0,148
Perceived Pervasiveness -> Perceived Usefulness 0,065 0,076 0,682 0,747
Perceived Usefulness -> Behavioural Intent to Use Wearables 0,000 0,499 0,444 0,444
Trust -> Behavioural Intent to Use Wearables 0,042 0,673 0,076 0,034
Trust -> IT Security Risks 0,064 0,745 -0,335 -0,399
Table 7.14: Age differences
The comparative analysis shows three significant differences between young adults and older age categories,
which are summarised in Table 7.15. Surprisingly, the first major insight is that IT security concerns act as a
significantly stronger inhibitor of technology adoption behaviour among subjects in their early adulthood than
compared to their older counterparts. This insight is particularly remarkable since one would expect that young
people are more willing to take risks in general and information security risks in particular. Here, it might be
argued with the concept of ‘generational cohorts’, which is regarded to be more useful in analysing markets than
static age segmentations (Schewe, et al., 2000, p. 108 f.). Unlike a generation, which is defined as spanning 20-25
years, a cohort is primarily constituted by external events which lead to changes in the behaviour or values of
people.
This research consequently focusses on the comparison of two generational cohorts: the generational cohort of
‘digital natives’ (sometimes also referred to as ‘Generation Y’ or ‘Net Gen’) and ‘Digital Immigrants’. According
to Vodanovich et al. (2010, p. 711 f.), digital natives are those who “[…] were grown up immersed in a networked
world, with access to ubiquitous digital technologies and the ability to learn and use them in fluent and
sophisticated ways”. Based on this segmentation, the outcome of the present PLS-MGA analysis goes in line with
the current research. The results indicate that ‘Generation Y’ perceives privacy risks even more than ‘Generation
X’ does and that, generally, both cohorts are significantly influenced by information security concerns (Lösing,
2016, p. 10). This might result from the digital natives’ greater awareness of the Internet. Members of this
generation are actively participating in the new digital media culture and do have accounts in multiple social media
networks, where privacy risks may be even more present.

188 Empirical Analysis
Causal Pathway β-weight
difference
p-Value Immi. Natives
Agreeableness -> Need for Materialism 0,016 0,572 -0,110 -0,126
Conscientiousness -> Need for Cognition 0,056 0,661 0,075 0,019
Extraversion -> Need for Cognition 0,058 0,284 0,206 0,264
IT Security Risks -> Behavioural Intent to Use Wearables 0,149 0,984 -0,135 -0,284
Involvement towards Wearables -> Behavioural Intent to Use
Wearables 0,071 0,790 0,275 0,204
Need for Cognition -> Involvement towards Wearables 0,131 0,874 0,253 0,121
Need for Materialism -> Involvement towards Wearables 0,056 0,676 0,268 0,212
Neuroticism -> Need for Materialism 0,070 0,605 0,284 0,214
Openness to Experience -> Need for Cognition 0,265 0,985 0,188 -0,077
Perceived Pervasiveness -> Behavioural Intent to Use
Wearables
0,075 0,220 0,036 0,111
Perceived Pervasiveness -> Perceived Usefulness 0,019 0,600 0,707 0,688
Perceived Usefulness -> Behavioural Intent to Use Wearables 0,041 0,370 0,450 0,491
Trust -> Behavioural Intent to Use Wearables 0,111 0,870 0,073 -0,038
Trust -> IT Security Risks 0,213 0,987 -0,315 -0,528
Table 7.15: Generational cohort differences
Moreover, as compared with the older generational cohort, study participants born between 1986 and 1996
demonstrated a significantly lower level of perceived information security risk when they reported a trusting stance
towards wearable technologies. This result is consistent with the findings of prior studies, which indicate that
digital immigrants are less driven by underlying affective factors and that they more hesitantly adopt new
technologies, as they frequently don’t consider themselves as reasonably technology-savvy and as being in control
of security risks (Morris & Venkatesh, 2009, p. 392; Miltgen & Peyrat-Guillard, 2014, p. 107 f.). Accordingly,
higher levels of ‘computer self-efficacy’ defined as the self-assessment of one’s computer competence – which is
particularly inherent to digital natives – may moderate attitudinal relationships in an ICT adoption context
(Topolovcan & Matijevic, 2015, p. 163; Marakas, et al., 1998, p. 126). Additionally, in terms of generational
cohort differences, the multigroup comparison shows that the relationship between ‘Openness to Experience’ and
‘Need for Cognition’ is significant only for the older section of the subdivided sample. Thus, it can be concluded
that individuals born before 1996 are more likely to engage in effortful thinking when they are broad-minded and
intellectually curious as compared to their younger counterparts. In contrast, this causal nexus does not hold to the
same extent for digital natives. This could be explained by the fact that the ‘Net Gens’ are generally characterised
by their preference for social openness, multitasking, and learning through discovery, which has a direct bearing
on how they learn (Ryberg, et al., 2010, p. 303; Kivunja, 2014, p. 102).
Empirical Analysis 189
In conclusion, the PLS-MGA analysis revealed several important insights, which can be directly used for deriving
concrete praxeological recommendations. Nevertheless, it should be noted that only very few differences exist
between demographic segments when it comes to wearable computing adoption. While gender differences refer
primarily to personality-related correlates of behaviour, the ‘digital divide’ of the sample population results in
substantially diverging IT security perceptions and risk processing relations, which require a more differential
perspective on the structural model. At the same time, no significant age differences could be proven empirically,
whereas a single, trust-related deviation in response patterns can be observed when comparing individuals with
different educational backgrounds.
7.3.4 Analysis of Total Effects and Performance of Constructs
In order to holistically examine the role of a particular target construct’s key sources, the total effects of the path
model (importance) and the average values of the latent variable scores (performance) need to be assessed (Ringle
& Sarstedt, 2016, p. 1867). The importance-performance map analysis (IPMA) contrasts the total effects (i.e.
the sum of direct and indirect effects) of antecedent constructs with the average values of their latent variable
scores and, thereby, extends the standard PLS reporting in order to “present in an easily understandable and
convincing manner the results of success factor research” (Henseler, 2016, p. 1843). By implication, this method
can highlight significant areas for improvement of management activities and thus help decision makers to
prioritize their actions. Consequently, performance improvement of a construct that exhibits a low average score
but at the same time a strong influence on the target construct would be an effective anchor point.
The PLS-IPMA performance values are determined by indicator scores, which are rescaled on a range between
zero (lowest performance) and 100 (highest performance) to facilitate interpretation of performance levels.
According to Ringle and Sarstedt (2016, p. 1868), applications of IPMA must meet three requirements. Firstly, all
indicators in the structural model must use a metric or quasi-metric scale. Secondly, none of the indicators should
be reverse coded, so all variables are in the same direction. Otherwise it could not be concluded that a higher
construct score represents a better performance. Thirdly, irrespective of formatively or reflectively measured
constructs, all outer weight estimates must be positive.
As this study epistemically focusses on the adoption of wearable computing, all direct effects on the endogenous
target variable should be considered. In view of the perceived risk facets, this would also involve reverse coded
items. The indicator coding of the first-order constructs of Perceived IT Security Risk has therefore been rescaled,
so the requirements for IPMA application were met and for all of the indicators a higher value represents a better
outcome. The focal reverse-scaled higher-order construct may be reinterpreted in terms of the perceived security
of wearable technologies. Moreover, as both composite indicators NZ04_03 and LOC_Availability yield negative
outer weights, these indicators were removed to meet the above requirements – especially, since the analysis should
be conducted solely on the construct level. The summary of the obtained IPMA data is presented in Figure 7.5.

190 Empirical Analysis
Figure 7.5: Total effects and performances of antecedent constructs of the intention to use wearables
In the created importance-performance map, the x-axis depicts the total effects of the direct predictors of the target
phenomenon Behavioural Intention to Use Wearables. The y-axis represents the average rescaled latent variable
scores (i.e. the performance) of the five determinants. As can be seen from the results of the combined assessment
of total effects and performances, the construct Perceived Usefulness, located at the lower right area of the
importance-performance map, possesses the lowest performance-importance ratio. Thus, there is a particularly
high potential for improving the performance of this decision parameter. When looking at the total effects,
improvement of aspects related to the Perceived Pervasiveness of wearables follows as a second priority. Given
the poor performance value of Perceived IT Security (≈36.54), improving consumer attitudes towards the
information security of wearable technologies should also come more to the fore. Contrarily, boosting the
performance of trusting beliefs towards wearables would has the lowest relevance for managerial actions due to
this perspective.
7.3.5 Summary of Findings
Having determined the reliability and validity of the outer and inner structures of the evolved Wearable TAM, in
the following the formulated hypotheses are conclusively accepted or falsified where appropriate in order to
prepare the ground to answer the praxeological research question.
The proposed causal relationships have been quantitatively tested with the help of a representative sample of 474
potential German adopters of wearable computing, which is assumingly not subject to any bias such as common
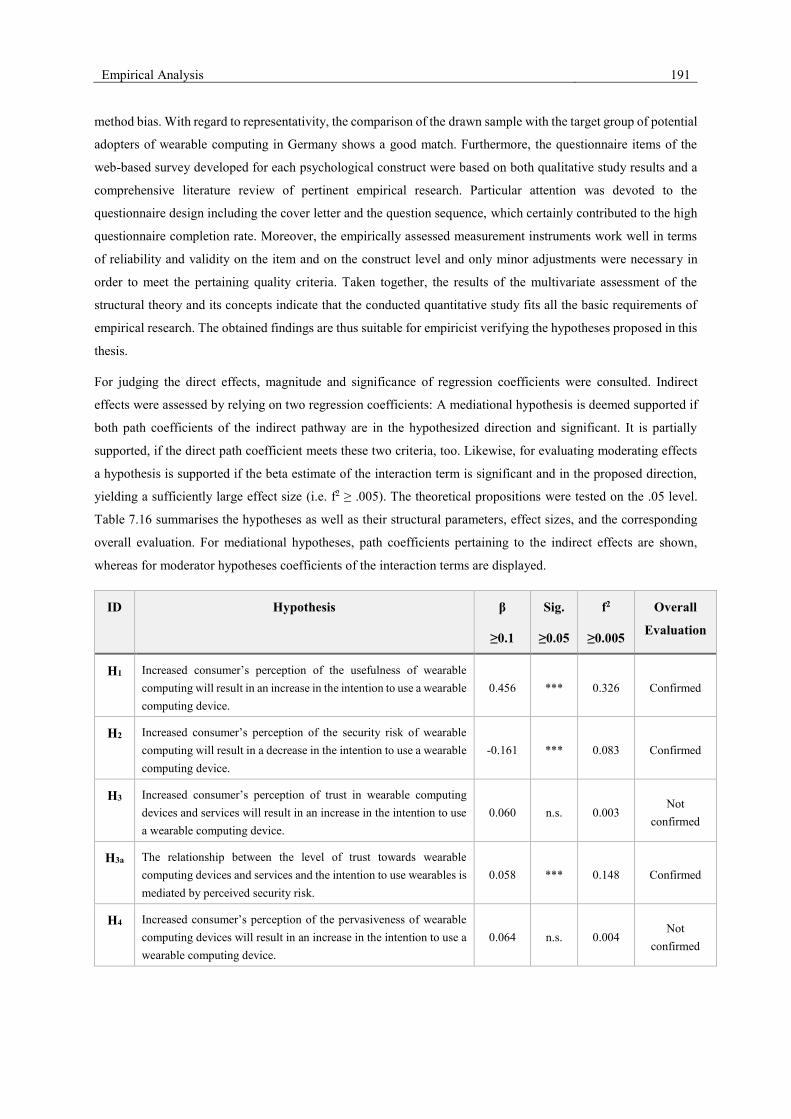
Empirical Analysis 191
method bias. With regard to representativity, the comparison of the drawn sample with the target group of potential
adopters of wearable computing in Germany shows a good match. Furthermore, the questionnaire items of the
web-based survey developed for each psychological construct were based on both qualitative study results and a
comprehensive literature review of pertinent empirical research. Particular attention was devoted to the
questionnaire design including the cover letter and the question sequence, which certainly contributed to the high
questionnaire completion rate. Moreover, the empirically assessed measurement instruments work well in terms
of reliability and validity on the item and on the construct level and only minor adjustments were necessary in
order to meet the pertaining quality criteria. Taken together, the results of the multivariate assessment of the
structural theory and its concepts indicate that the conducted quantitative study fits all the basic requirements of
empirical research. The obtained findings are thus suitable for empiricist verifying the hypotheses proposed in this
thesis.
For judging the direct effects, magnitude and significance of regression coefficients were consulted. Indirect
effects were assessed by relying on two regression coefficients: A mediational hypothesis is deemed supported if
both path coefficients of the indirect pathway are in the hypothesized direction and significant. It is partially
supported, if the direct path coefficient meets these two criteria, too. Likewise, for evaluating moderating effects
a hypothesis is supported if the beta estimate of the interaction term is significant and in the proposed direction,
yielding a sufficiently large effect size (i.e. f2 ≥ .005). The theoretical propositions were tested on the .05 level.
Table 7.16 summarises the hypotheses as well as their structural parameters, effect sizes, and the corresponding
overall evaluation. For mediational hypotheses, path coefficients pertaining to the indirect effects are shown,
whereas for moderator hypotheses coefficients of the interaction terms are displayed.
ID Hypothesis β
≥0.1
Sig.
≥0.05
f2
≥0.005
Overall
Evaluation
H1 Increased consumer’s perception of the usefulness of wearable
computing will result in an increase in the intention to use a wearable
computing device.
0.456 *** 0.326 Confirmed
H2 Increased consumer’s perception of the security risk of wearable
computing will result in a decrease in the intention to use a wearable
computing device.
-0.161 *** 0.083 Confirmed
H3 Increased consumer’s perception of trust in wearable computing
devices and services will result in an increase in the intention to use
a wearable computing device.
0.060 n.s. 0.003 Not
confirmed
H3a The relationship between the level of trust towards wearable
computing devices and services and the intention to use wearables is
mediated by perceived security risk.
0.058 *** 0.148 Confirmed
H4 Increased consumer’s perception of the pervasiveness of wearable
computing devices will result in an increase in the intention to use a
wearable computing device.
0.064 n.s. 0.004 Not
confirmed
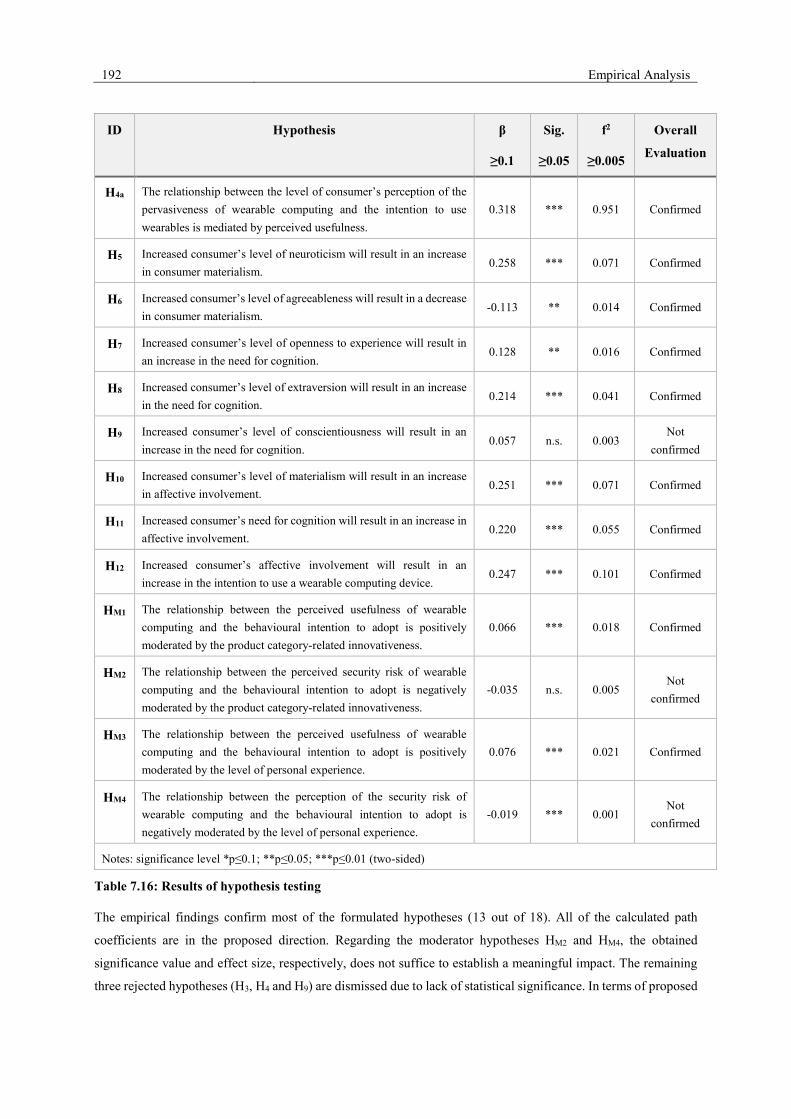
192 Empirical Analysis
ID Hypothesis β
≥0.1
Sig.
≥0.05
f2
≥0.005
Overall
Evaluation
H4a The relationship between the level of consumer’s perception of the
pervasiveness of wearable computing and the intention to use
wearables is mediated by perceived usefulness.
0.318 *** 0.951 Confirmed
H5 Increased consumer’s level of neuroticism will result in an increase
in consumer materialism. 0.258 *** 0.071 Confirmed
H6 Increased consumer’s level of agreeableness will result in a decrease
in consumer materialism. -0.113 ** 0.014 Confirmed
H7 Increased consumer’s level of openness to experience will result in
an increase in the need for cognition. 0.128 ** 0.016 Confirmed
H8 Increased consumer’s level of extraversion will result in an increase
in the need for cognition. 0.214 *** 0.041 Confirmed
H9 Increased consumer’s level of conscientiousness will result in an
increase in the need for cognition. 0.057 n.s. 0.003
Not
confirmed
H10 Increased consumer’s level of materialism will result in an increase
in affective involvement. 0.251 *** 0.071 Confirmed
H11 Increased consumer’s need for cognition will result in an increase in
affective involvement. 0.220 *** 0.055 Confirmed
H12 Increased consumer’s affective involvement will result in an
increase in the intention to use a wearable computing device. 0.247 *** 0.101 Confirmed
HM1 The relationship between the perceived usefulness of wearable
computing and the behavioural intention to adopt is positively
moderated by the product category-related innovativeness.
0.066 *** 0.018 Confirmed
HM2 The relationship between the perceived security risk of wearable
computing and the behavioural intention to adopt is negatively
moderated by the product category-related innovativeness.
-0.035 n.s. 0.005 Not
confirmed
HM3 The relationship between the perceived usefulness of wearable
computing and the behavioural intention to adopt is positively
moderated by the level of personal experience.
0.076 *** 0.021 Confirmed
HM4 The relationship between the perception of the security risk of
wearable computing and the behavioural intention to adopt is
negatively moderated by the level of personal experience.
-0.019 *** 0.001 Not
confirmed
Notes: significance level *p≤0.1; **p≤0.05; ***p≤0.01 (two-sided)
Table 7.16: Results of hypothesis testing
The empirical findings confirm most of the formulated hypotheses (13 out of 18). All of the calculated path
coefficients are in the proposed direction. Regarding the moderator hypotheses HM2 and HM4, the obtained
significance value and effect size, respectively, does not suffice to establish a meaningful impact. The remaining
three rejected hypotheses (H3, H4 and H9) are dismissed due to lack of statistical significance. In terms of proposed

Empirical Analysis 193
indirect effects, both mediational hypotheses H3a and H4a receive empirical corroboration. Yet, the former
hypothesis is only partially supported due to a small total effect of the mediated relationship.
In order to deepen the understanding of the relevant research context, after all hypotheses were tested a multigroup
analysis was conducted to provide additional information. Similar to moderator hypothesis testing, assumptions
about group differences are supported if most regression estimates are significantly different when subsamples are
compared. Since just a fraction of the beta weight discrepancies is significantly different from zero for the given
pairs of models (cf. section 7.3.3), the supposed group-specific heterogeneity in data receives only partial support.
To conclude, the PLS multigroup comparison for demographic control variables does not severely question the
results of the main effects model. Therefore, the obtained parameter estimates are considered robust with respect
to group effects. Overall, the generated findings are indicative of the main effects model’s capability to predict the
target construct of wearable computing adoption.
7.4 Interpretation of Results
Along the lines of the research questions outlined in chapter 1.2, in this chapter the study’s empirical key findings
from the previous sections are critically discussed. To form a holistic picture, the results are confronted with the
germane body of literature. In particular, the discussion focusses on the role of the predictors in the synthesised
structural model as well as on the interacting effect of several salient segmentation variables. Based on these
considerations, concrete recommendations for marketing researchers and practitioners are derived in chapter 8 in
order to effectively address the opportunities and challenges in wearable technology markets.
The main research objective of this study was to theoretically and empirically investigate the success factors of
the adoption of wearable computing. Guided by the concepts which successively evolved during the qualitative
study and literature review, a new causal model that interconnects the identified acceptance factors, the Wearable
TAM, could be developed and subsequently tested. The underlying assumption of this model is that the intention
to use wearables in the sense of a conative attitudinal component has a two-fold nature: It is determined by both
cognitive beliefs (denoted by hypotheses H1 and H2) and the product category-related involvement, which
intrinsically relates to the affective dimension of attitude (H12). At the upstream level of explanation, perceived
pervasiveness (H4) and trust (H3) in wearable technologies are hypothesised to shape the individual acceptance
judgment indirectly in terms of exogenous latent variables. Moreover, as per directional hypotheses H5 to H9 the
theoretical framework proposes a fully mediated, hierarchical model of dispositional predictors of adoption
behaviour. Figure 7.6 gives an overview of the predictor structure formulated in this thesis. Non-significant
relationships are not illustrated for the sake of conciseness.
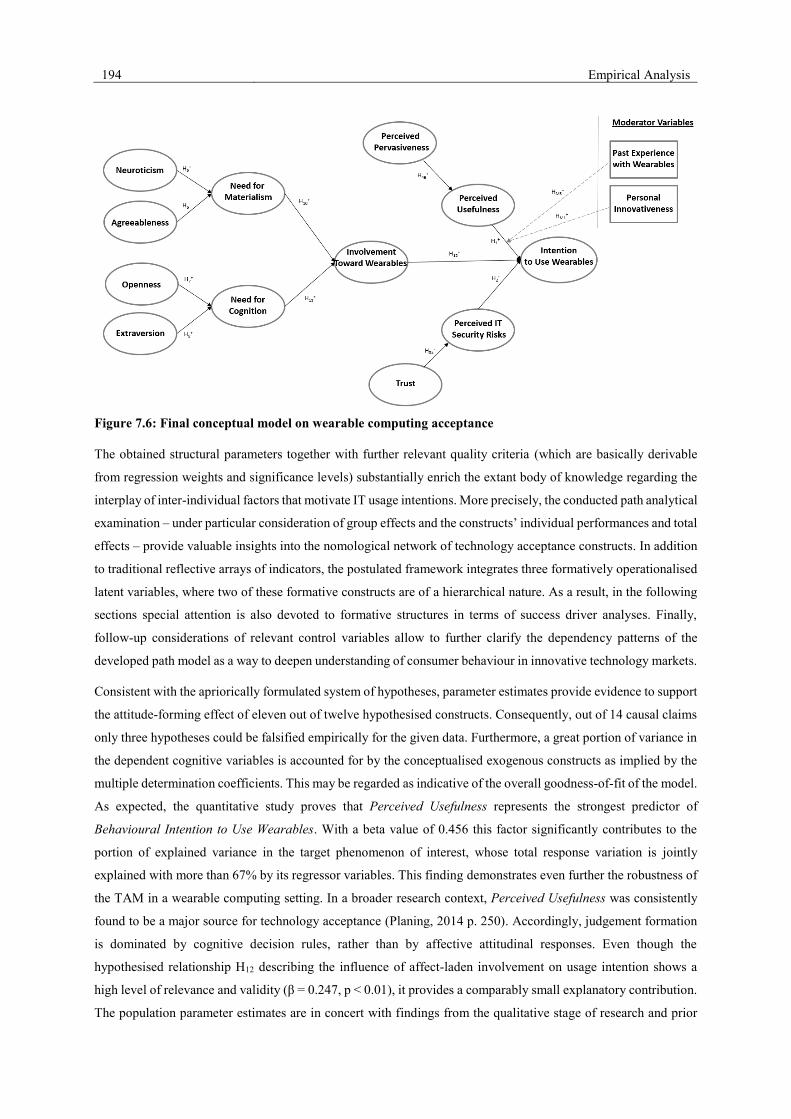
194 Empirical Analysis
Figure 7.6: Final conceptual model on wearable computing acceptance
The obtained structural parameters together with further relevant quality criteria (which are basically derivable
from regression weights and significance levels) substantially enrich the extant body of knowledge regarding the
interplay of inter-individual factors that motivate IT usage intentions. More precisely, the conducted path analytical
examination – under particular consideration of group effects and the constructs’ individual performances and total
effects – provide valuable insights into the nomological network of technology acceptance constructs. In addition
to traditional reflective arrays of indicators, the postulated framework integrates three formatively operationalised
latent variables, where two of these formative constructs are of a hierarchical nature. As a result, in the following
sections special attention is also devoted to formative structures in terms of success driver analyses. Finally,
follow-up considerations of relevant control variables allow to further clarify the dependency patterns of the
developed path model as a way to deepen understanding of consumer behaviour in innovative technology markets.
Consistent with the apriorically formulated system of hypotheses, parameter estimates provide evidence to support
the attitude-forming effect of eleven out of twelve hypothesised constructs. Consequently, out of 14 causal claims
only three hypotheses could be falsified empirically for the given data. Furthermore, a great portion of variance in
the dependent cognitive variables is accounted for by the conceptualised exogenous constructs as implied by the
multiple determination coefficients. This may be regarded as indicative of the overall goodness-of-fit of the model.
As expected, the quantitative study proves that Perceived Usefulness represents the strongest predictor of
Behavioural Intention to Use Wearables. With a beta value of 0.456 this factor significantly contributes to the
portion of explained variance in the target phenomenon of interest, whose total response variation is jointly
explained with more than 67% by its regressor variables. This finding demonstrates even further the robustness of
the TAM in a wearable computing setting. In a broader research context, Perceived Usefulness was consistently
found to be a major source for technology acceptance (Planing, 2014 p. 250). Accordingly, judgement formation
is dominated by cognitive decision rules, rather than by affective attitudinal responses. Even though the
hypothesised relationship H12 describing the influence of affect-laden involvement on usage intention shows a
high level of relevance and validity (β = 0.247, p < 0.01), it provides a comparably small explanatory contribution.
The population parameter estimates are in concert with findings from the qualitative stage of research and prior
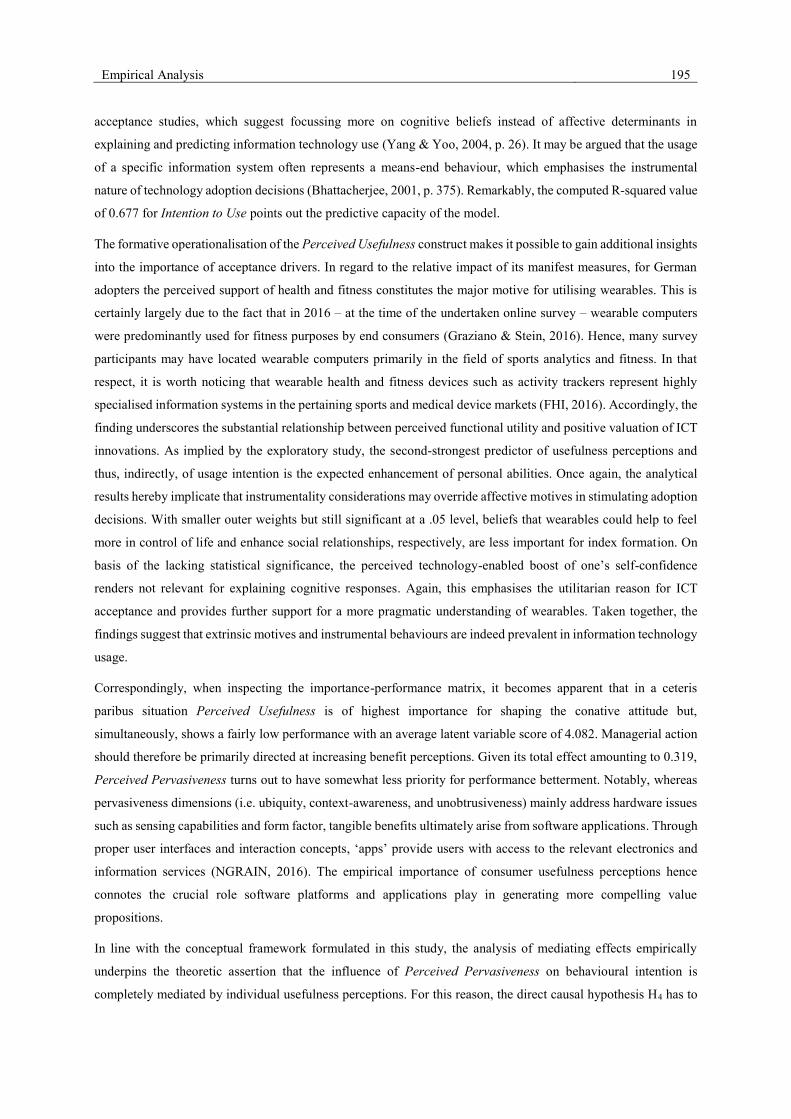
Empirical Analysis 195
acceptance studies, which suggest focussing more on cognitive beliefs instead of affective determinants in
explaining and predicting information technology use (Yang & Yoo, 2004, p. 26). It may be argued that the usage
of a specific information system often represents a means-end behaviour, which emphasises the instrumental
nature of technology adoption decisions (Bhattacherjee, 2001, p. 375). Remarkably, the computed R-squared value
of 0.677 for Intention to Use points out the predictive capacity of the model.
The formative operationalisation of the Perceived Usefulness construct makes it possible to gain additional insights
into the importance of acceptance drivers. In regard to the relative impact of its manifest measures, for German
adopters the perceived support of health and fitness constitutes the major motive for utilising wearables. This is
certainly largely due to the fact that in 2016 – at the time of the undertaken online survey – wearable computers
were predominantly used for fitness purposes by end consumers (Graziano & Stein, 2016). Hence, many survey
participants may have located wearable computers primarily in the field of sports analytics and fitness. In that
respect, it is worth noticing that wearable health and fitness devices such as activity trackers represent highly
specialised information systems in the pertaining sports and medical device markets (FHI, 2016). Accordingly, the
finding underscores the substantial relationship between perceived functional utility and positive valuation of ICT
innovations. As implied by the exploratory study, the second-strongest predictor of usefulness perceptions and
thus, indirectly, of usage intention is the expected enhancement of personal abilities. Once again, the analytical
results hereby implicate that instrumentality considerations may override affective motives in stimulating adoption
decisions. With smaller outer weights but still significant at a .05 level, beliefs that wearables could help to feel
more in control of life and enhance social relationships, respectively, are less important for index formation. On
basis of the lacking statistical significance, the perceived technology-enabled boost of one’s self-confidence
renders not relevant for explaining cognitive responses. Again, this emphasises the utilitarian reason for ICT
acceptance and provides further support for a more pragmatic understanding of wearables. Taken together, the
findings suggest that extrinsic motives and instrumental behaviours are indeed prevalent in information technology
usage.
Correspondingly, when inspecting the importance-performance matrix, it becomes apparent that in a ceteris
paribus situation Perceived Usefulness is of highest importance for shaping the conative attitude but,
simultaneously, shows a fairly low performance with an average latent variable score of 4.082. Managerial action
should therefore be primarily directed at increasing benefit perceptions. Given its total effect amounting to 0.319,
Perceived Pervasiveness turns out to have somewhat less priority for performance betterment. Notably, whereas
pervasiveness dimensions (i.e. ubiquity, context-awareness, and unobtrusiveness) mainly address hardware issues
such as sensing capabilities and form factor, tangible benefits ultimately arise from software applications. Through
proper user interfaces and interaction concepts, ‘apps’ provide users with access to the relevant electronics and
information services (NGRAIN, 2016). The empirical importance of consumer usefulness perceptions hence
connotes the crucial role software platforms and applications play in generating more compelling value
propositions.
In line with the conceptual framework formulated in this study, the analysis of mediating effects empirically
underpins the theoretic assertion that the influence of Perceived Pervasiveness on behavioural intention is
completely mediated by individual usefulness perceptions. For this reason, the direct causal hypothesis H4 has to
196 Empirical Analysis
be rejected. This means that the unique technological features that distinguish pervasive computing from the
classical desktop paradigm only take effect on device usage if they are translated into concrete applications that
are found to be useful. This result fits earlier conceptual and empirical works, which indicate that motivational
variables entirely mediate system design features, which in turn have no additional direct effect on system use
(Davis, 1993 p. 482). With a path coefficient of 0.698 and an error probability below 0.01, consumer perception
of the particular characteristics of pervasive information systems highly significantly predicts individual benefit
expectations. Likewise, the effect size of Perceived Pervasiveness can be considered extremely large (f2 = 0.951).
Against the backdrop of the large R2-value of Perceived Usefulness, it is reasonable to assume that cognitive
beliefs regarding a wearables’ positive utility are substantively formed by perceptions of system pervasiveness. In
fact, this is in line with the general argumentation of Karaiskos (2009) who found that pervasiveness dimensions
represent mediated drivers of acceptance. However, a more accurate picture is obtained by looking at the average
score of individual components of the perceived pervasiveness construct. An overview of all mean values of first-
order latent variable scores obtained from descriptive analysis is given in Table 7.17. Here it becomes apparent,
that survey respondents averagely tend to perceive Unobtrusiveness to be the least developed pervasiveness
dimension. As a consequence, particular attention should be paid to the design of input modalities and form factor
to improve social acceptability. Considering the pseudo t-values obtained from re-sampling, nonetheless, all
drivers of Perceived Pervasiveness can be regarded highly significant on a 0.01 level. Whilst perceived ubiquity
has the largest effect on its composite construct, unobtrusiveness perceptions and, lastly, context-awareness
expectations both contribute to conative attitude variability with almost even predictive efficiency (0.369 and
0.335, respectively).
Construct Mean Score Standard Deviation
Intention to Use 4.050 1.885
Perceived Usefulness 4.082 1.623
Perceived Pervasiveness 4.810 1.196
Perceived IT Security Risk 4.477 1.894
Trust 4.391 1.355
Involvement 4.912 1.552
Materialism 3.743 1.337
Need for Cognition 4.040 1.262
Neuroticism 3.336 1.271
Agreeableness 4.180 1.296
Conscientiousness 5.331 1.102
Openness to Experience 5.136 1.199
Extraversion 4.532 1.332
Ubiquity 5.074 1.526
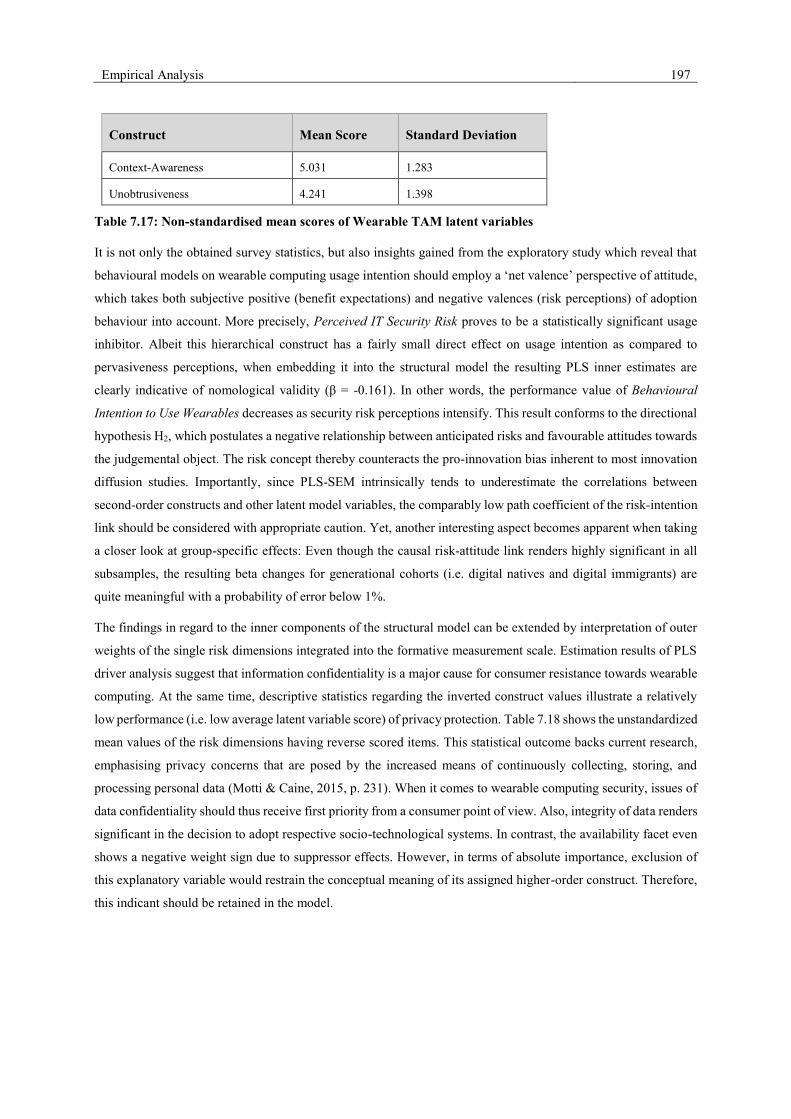
Empirical Analysis 197
Construct Mean Score Standard Deviation
Context-Awareness 5.031 1.283
Unobtrusiveness 4.241 1.398
Table 7.17: Non-standardised mean scores of Wearable TAM latent variables
It is not only the obtained survey statistics, but also insights gained from the exploratory study which reveal that
behavioural models on wearable computing usage intention should employ a ‘net valence’ perspective of attitude,
which takes both subjective positive (benefit expectations) and negative valences (risk perceptions) of adoption
behaviour into account. More precisely, Perceived IT Security Risk proves to be a statistically significant usage
inhibitor. Albeit this hierarchical construct has a fairly small direct effect on usage intention as compared to
pervasiveness perceptions, when embedding it into the structural model the resulting PLS inner estimates are
clearly indicative of nomological validity (β = -0.161). In other words, the performance value of Behavioural
Intention to Use Wearables decreases as security risk perceptions intensify. This result conforms to the directional
hypothesis H2, which postulates a negative relationship between anticipated risks and favourable attitudes towards
the judgemental object. The risk concept thereby counteracts the pro-innovation bias inherent to most innovation
diffusion studies. Importantly, since PLS-SEM intrinsically tends to underestimate the correlations between
second-order constructs and other latent model variables, the comparably low path coefficient of the risk-intention
link should be considered with appropriate caution. Yet, another interesting aspect becomes apparent when taking
a closer look at group-specific effects: Even though the causal risk-attitude link renders highly significant in all
subsamples, the resulting beta changes for generational cohorts (i.e. digital natives and digital immigrants) are
quite meaningful with a probability of error below 1%.
The findings in regard to the inner components of the structural model can be extended by interpretation of outer
weights of the single risk dimensions integrated into the formative measurement scale. Estimation results of PLS
driver analysis suggest that information confidentiality is a major cause for consumer resistance towards wearable
computing. At the same time, descriptive statistics regarding the inverted construct values illustrate a relatively
low performance (i.e. low average latent variable score) of privacy protection. Table 7.18 shows the unstandardized
mean values of the risk dimensions having reverse scored items. This statistical outcome backs current research,
emphasising privacy concerns that are posed by the increased means of continuously collecting, storing, and
processing personal data (Motti & Caine, 2015, p. 231). When it comes to wearable computing security, issues of
data confidentiality should thus receive first priority from a consumer point of view. Also, integrity of data renders
significant in the decision to adopt respective socio-technological systems. In contrast, the availability facet even
shows a negative weight sign due to suppressor effects. However, in terms of absolute importance, exclusion of
this explanatory variable would restrain the conceptual meaning of its assigned higher-order construct. Therefore,
this indicant should be retained in the model.
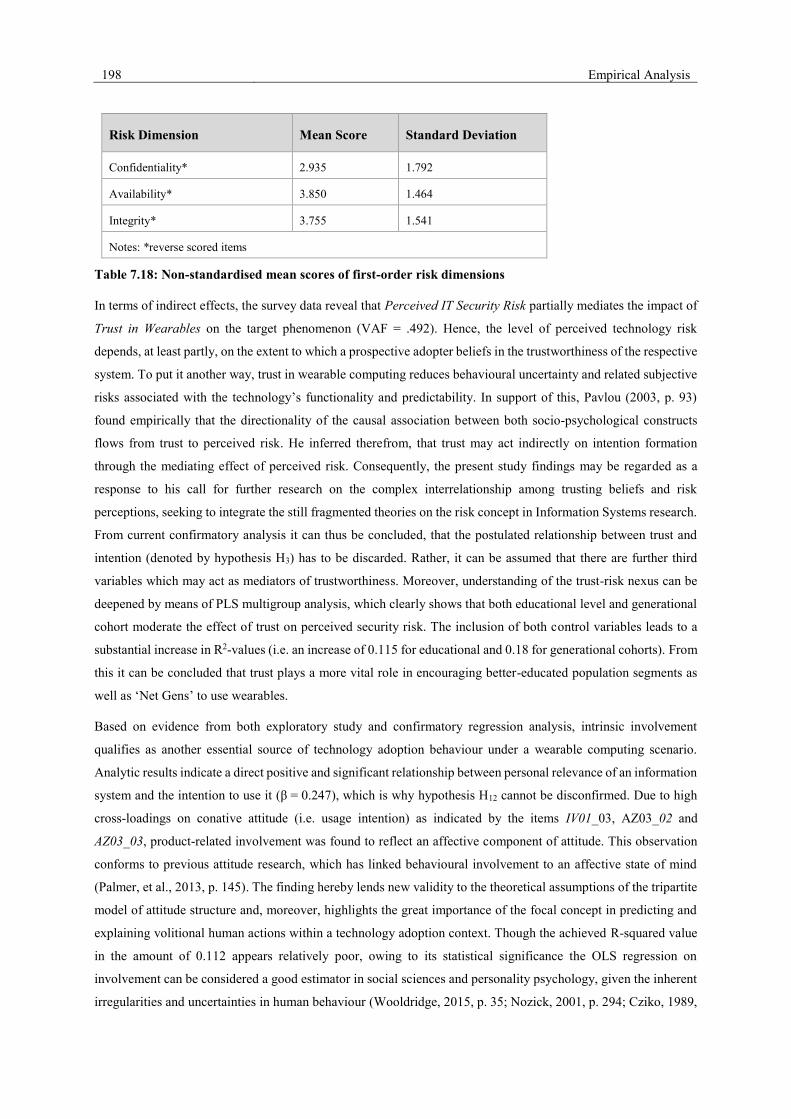
198 Empirical Analysis
Risk Dimension Mean Score Standard Deviation
Confidentiality* 2.935 1.792
Availability* 3.850 1.464
Integrity* 3.755 1.541
Notes: *reverse scored items
Table 7.18: Non-standardised mean scores of first-order risk dimensions
In terms of indirect effects, the survey data reveal that Perceived IT Security Risk partially mediates the impact of
Trust in Wearables on the target phenomenon (VAF = .492). Hence, the level of perceived technology risk
depends, at least partly, on the extent to which a prospective adopter beliefs in the trustworthiness of the respective
system. To put it another way, trust in wearable computing reduces behavioural uncertainty and related subjective
risks associated with the technology’s functionality and predictability. In support of this, Pavlou (2003, p. 93)
found empirically that the directionality of the causal association between both socio-psychological constructs
flows from trust to perceived risk. He inferred therefrom, that trust may act indirectly on intention formation
through the mediating effect of perceived risk. Consequently, the present study findings may be regarded as a
response to his call for further research on the complex interrelationship among trusting beliefs and risk
perceptions, seeking to integrate the still fragmented theories on the risk concept in Information Systems research.
From current confirmatory analysis it can thus be concluded, that the postulated relationship between trust and
intention (denoted by hypothesis H3) has to be discarded. Rather, it can be assumed that there are further third
variables which may act as mediators of trustworthiness. Moreover, understanding of the trust-risk nexus can be
deepened by means of PLS multigroup analysis, which clearly shows that both educational level and generational
cohort moderate the effect of trust on perceived security risk. The inclusion of both control variables leads to a
substantial increase in R2-values (i.e. an increase of 0.115 for educational and 0.18 for generational cohorts). From
this it can be concluded that trust plays a more vital role in encouraging better-educated population segments as
well as ‘Net Gens’ to use wearables.
Based on evidence from both exploratory study and confirmatory regression analysis, intrinsic involvement
qualifies as another essential source of technology adoption behaviour under a wearable computing scenario.
Analytic results indicate a direct positive and significant relationship between personal relevance of an information
system and the intention to use it (β = 0.247), which is why hypothesis H12 cannot be disconfirmed. Due to high
cross-loadings on conative attitude (i.e. usage intention) as indicated by the items IV01_03, AZ03_02 and
AZ03_03, product-related involvement was found to reflect an affective component of attitude. This observation
conforms to previous attitude research, which has linked behavioural involvement to an affective state of mind
(Palmer, et al., 2013, p. 145). The finding hereby lends new validity to the theoretical assumptions of the tripartite
model of attitude structure and, moreover, highlights the great importance of the focal concept in predicting and
explaining volitional human actions within a technology adoption context. Though the achieved R-squared value
in the amount of 0.112 appears relatively poor, owing to its statistical significance the OLS regression on
involvement can be considered a good estimator in social sciences and personality psychology, given the inherent
irregularities and uncertainties in human behaviour (Wooldridge, 2015, p. 35; Nozick, 2001, p. 294; Cziko, 1989,
Empirical Analysis 199
p. 17). In spite of the seemingly noisy, high-variability residuals, the predecessor constructs of involvement still
provide valuable information about tendencies in consumer responses – particularly, as this thesis does not aim at
precisely predicting intrapsychic predispositions, but rather at determining which explanatory traits are statistically
significant and how one-unit increases in these individual difference variables relate to changes in the emotional
attitude towards wearables. Hence, for the sake of model parsimony, no further explanatory variables and pathways
were added to the Wearable TAM to artificially increase its predictive value.
Adopting the reasoning of Mowen (2000), the present study conceptualises involvement as a consumption-relevant
situational trait that entirely mediates underlying dispositions in terms of a hierarchical personality structure. In
line with literature, empirical data indicates that Need for Material Resources and Need for Cognition jointly evoke
personal commitment towards innovative information systems at lower level of abstractness, which is why both
hypotheses H10 and H11 can be confirmed. As compared to need for cognition, the former compound personality
characteristic is more predictive of situational traits (β = 0.251, p < 0.01). This hypothetico-deductive finding
clearly underlines the materialistic dimension of the early adopter of wearable computing. A closer examination
of results shows that this positive relationship holds even more true in the male subsample, yielding a structural
coefficient of 0.340 and a t-value far above the critical threshold of 2.57. Accordingly, earlier studies on gender
differences in consumer behaviour suggest that men score generally higher in terms of materialism and
consumption patterns (Segal & Podoshen, 2013, p. 190). Yet, in view of the fairly small structural parameters
achieved, it has to be acknowledged that although significant, the correlations between materialism and personality
characteristics were typically weak across preceding empirical studies, ranging from −0.37 to 0.33 (Górnik-Durose
& Pilch, 2016, p. 103). In a similar vein, need for cognition is significantly related to attitudinal outcomes (β =
0.220, p < 0.01), whereas the path coefficient is considerably higher in the female subsample (β = 0.290) than
compared to the male group (β = 0.127). However, the produced beta change barely misses the 5% level of
significance. Thus, there is no satisfactory evidence to suggest that male adults are less affected by cognitive
motivation than their female counterparts in regard to wearable computing enthusiasm. In respect of predictive
competency, validation of the inner model confirms that both, materialistic values (R2 = 0.088) and need for
cognition (R2 = 0.091) represent highly complex, multi-causally determined traits, which may not be sufficiently
explained by the Big Five personality dimensions.
At most elemental level of personality structure, neuroticism and agreeableness are both found to significantly
interact with materialistic values. As a consequence, the directional hypotheses H5 and H6 on the causes of
materialism are respectively corroborated. Showing a path coefficient of 0.258 and an error probability < .01,
neuroticism has the strongest formative influence on the outcome variable. In contrast, the tendency to be pleasant
and accommodating in social situations is significantly negatively correlated with materialism (β = -0.113). It may
be concluded therefrom, that high neuroticism and low agreeability jointly reflect an important predispositional
source of materialistic tendencies, what strongly conforms to previous research in the field of personality
psychology (Watson, 2014, p. 197). However, follow-up analysis of group differences revealed that gender-related
patterns substantially shape the distribution of responses: The negative relationship between agreeableness and
materialism is only significant for male subjects, producing a beta coefficient of -0.272 in the pertaining submodel.
Thus, the inhibitory effect of agreeableness on materialistic attitudes may solely be expected among the male
population segment. This result corresponds with the broad body of research on gender differences in personality,
200 Empirical Analysis
which posits that the connection strength between agreeableness and other motivational traits strongly varies with
gender (Rey & Extremera, 2016, p. 105; Chapman, et al., 2007, p. 1594).
Furthermore, the findings on need for cognition suggest that extraversion is a significant personality antecedent,
which positively affects individual differences in cognitive activity on a .01 level (β = 0.214). Having a beta value
of 0.128 and a two-sided p-value below .01, openness to experience emerges as the second most influential
determinant of consumer responses as regards the inclination to cognition. In-depth analyses via group comparison,
however, show that salience of this trait varies with generational cohort. From PLS-MGA it follows that digital
immigrants – characterised by a beta increase of 0.265 – were more likely to engage in effortful thinking when
they scored high in intellectual curiosity as compared to digital natives. By challenging prior research in the field,
this new insight surely warrants further scientific studies about the moderating effect of generational cohorts on
personality correlates. In view of their satisfactorily low error probability (p < .01 for two-sided tests) at aggregate
model level, both theoretical assertions H7 and H8 are accepted.
On the contrary, due to non-significance of parameter estimates, questionnaire data does not provide any evidence
in favour of a positive association between conscientiousness and the motivation for cognitive challenges, why
hypothesis H9 can be regarded as being falsified. Here, it may be argued that related research on personality traits
frequently reported contradictory results on conscientiousness-personality relations (Soubelet & Salthouse, 2011,
p. 304). For instance, published correlations between cognitive capacity and conscientiousness have sometimes
been negative and sometimes either positive or zero. Literature provides some indication for this mixed evidence.
According to the Intelligence Compensation Hypothesis (ICH) some “[…] individuals with low cognitive ability
become more organized, hardworking, and persistent over time as a means of compensating for their low ability
[…]” (Curtis, et al., 2015, p. 14; Moutafi, et al., 2004, p. 1013). In challenging this line of reasoning, Murray et al.
(2014, p. 21) point out that cognitive functioning and conscientiousness-related traits mutually influence one
another and that the impact is heterogeneous across individuals but nearly zero in the aggregate. For instance,
persons with low ability may become discouraged by their failures and could grow to expend less effort acting
conscientiously and vice versa. The scholars infer from their study results that selected research samples comprised
of participants with occupational or academic achievement above certain thresholds would artificially bias the
association in the negative direction. Assuming a positive link between need for cognition and cognitive ability
(Hill, et al., 2016, p. 225), and considering the current sample structure, which is clearly skewed towards better-
educated participants, a similar effect may be expected for the produced parameter estimates. The impact of
conscientiousness might be cancelled out by effects in the opposite direction. Therefore, future research should
account for further interacting variables such as achievement-striving or social setting, which probably confound
the ramifications of conscientiousness. Nevertheless, except this single suspicious correlation, in total the present
study supports the general applicability of the 3M model of motivation to explain consumer behaviour in
innovative technology markets.
To elaborate context-relevant insights that go beyond the postulated model structure, additional in-depth analyses
were performed on the attitudinal relationships of the Wearable TAM. Specifically, the contingencies of the
strength of the relationships between the attitude-linked cognitive variables were modelled by means of the a priori
identified background variables Personal Innovativeness and Past Experience. In a technology acceptance context,

Empirical Analysis 201
both adopter-specific characteristics appear to be particularly informative exogenous factors (Rogers, 2010 p. 268;
Gefen, et al., 2003b p. 307; Venkatesh, et al., 2003 p. 442). The moderation analysis revealed that the level of
innovativeness and past experience with wearables both provide a significant explanatory contribution to the base
model. This means that raters, who are latently innovative or relatively familiar with wearables, evaluate wearable
computing more positively than average. For the present sample, the hypothesised moderating relationships HM1
and HM3 are empirically demonstrated by both the large effect sizes (f2 = 0.018 and 0.021, respectively) and
statistical significance of the interaction terms on a 1% level. On the contrary, as far as IT risk-related perceptions
are concerned, neither innate consumer innovativeness nor the familiarity moderator exerts a significant effect on
the focal risk-attitude relation. According to literature (Kenny 2015), results from the moderated regression
analysis indicate that both interaction terms (i.e. Innovativeness*Risk and Experience*Risk) bring forth no
meaningful change in explained variance of usage intention. This clearly runs contrary to the a priori theoretical
considerations of the study. Thus, both moderatos may reinforce benefit perceptions rather than reducing salient
risk anticipations. Since the risk-intention link is robust across the two interacting constructs, hypotheses HM2 and
HM4 have to be rejected. Further detailed analyses are needed which might consider other potential third variables.
In sum, having critically scrutinised the obtained parameter estimates, this chapter corresponds to the empirical
research objective of this thesis. In particular, the results of the structural model evaluation underscore the crucial
role of cognitive beliefs and individual dispositions in motivating marketplace behaviours. By linking findings
from factor and path analysis with the results from qualitative expert interviews, the final acceptance model is able
to explain more than two-thirds in the variance of the endogenous variable Behavioural Intention to Use
Wearables. The developed framework may thus be viewed as a valid instrument for explaining and predicting the
adoption of wearable computing. To address the praxeological objective of research, the next chapter first derives
managerial implications and then, finally, points out several limitations to this study in order to provide guidance
and suggestions for future research.
202 Discussion of Results
8 Discussion of Results
This chapter is concerned with a general discussion on the contribution of the empirical findings to marketing
theory and practice. Conclusively, the limitations of the present study are presented together with propositions for
future research.
8.1 Synopsis of Research
In view of the significant business opportunities the wearable computing market is expected to create (cf. chapter
2.4), understanding user adoption behaviour of new wearable technologies becomes an economic imperative for
management of companies. However, due to the emerging nature of the novel concepts of ubiquitous and wearable
computing, extensive theoretical and empirical gaps still exist in Information Systems research. To fill these gaps,
this thesis represents an initial study about the socio-psychographic acceptance factors of wearable computing and
their nomological interdependencies.
In order to attain scientifically sound insights, this research project employed a hypothetico-deductive approach,
linking conceptual, qualitative and quantitative research studies via methodological triangulation. Initially, the
wearable computing phenomenon was systematised based on a thorough literature review in order to form a
conceptual foundation. Then, through the exploratory study, single belief groups and traits have been identified as
potential influence factors on the intention to use wearable computers. Since this qualitative research stage has
proven to be highly useful for determining relevant consumer beliefs as well as for substantiating and refining
hypotheses, this study provides clear grounds for applying methods triangulation in innovation acceptance
research. According to Planing (2014, p. 269), a two-staged research process that sequentially gathers qualitative
interview data and quantitative survey data is still a widely untapped methodological approach in the field. Overall,
in the first phase of present research, seven semi-structured interviews with professionals from industry and from
educational sector were conducted to gain preliminary insights into the research subject.
The qualitative results were discussed against the backdrop of the relevant literature and integrated into the newly
developed conceptual framework, the ‘Wearable TAM’, that ultimately comprises thirteen behaviourally-relevant
constructs. In terms of theory building, this study seeks to provide a new structural model by grounding the
identified latent variables in a well-recognised general acceptance model (i.e. TAM) and applying them to a new
context. Because the Wearable TAM combines the view of traditional innovation research with pervasive
computing, IT security and personality psychology disciplines, it contributes to multiple literature streams. In
particular, it allows researchers to jointly analyse consumer’s beliefs about the trustworthiness, usefulness and
security of wearables, the unique characteristics of the underlying pervasive computing paradigm, as well as the
adopter’s predispositions. The simultaneous investigation of such a broad range of product and adopter-related
factors is still uncommon in most related studies on technology acceptance, which usually concentrate on
functional product characteristics.
The proposed relationships were tested by following a post-positivistic research methodology. Thus, in the second
research phase, a questionnaire was distributed among a random sample of 425 on-line panel members and 216
Discussion of Results 203
Internet users. The final population sample consisted of 474 respondents, yielding an effective response rate of
73.95%. In terms of representativity, a distinguishing feature of this study is its relatively heterogeneous sample
covering a broad spectrum of diverse socioeconomic profiles. So far, empirical studies on IT adoption has
frequently used smaller student samples as surrogate of consumers. However, since certain conditions suggest that
students might differ from nonstudents, this has been considered a severe limitation to generalisability of results
for both social and technological variables related to adoption (Kim & Peterson, 2017, p. 47; Ashraf & Merunka,
2016). By having such a diverse sample as in this research, it appears that there is sufficient variance in the
constructs and that the results are thus generalisable to the target population.
In order to statistically assess the psychometric properties of the elicited success factors and to investigate whether
the proposed correlative influences of the relevant users’ traits and beliefs hold empirically, PLS-SEM was
subsequently used as the best-fitting method for the analytical research objectives. After having evaluated the
reliability and validity of the proposed measurement models, the findings from the inner model validation were
consolidated to decide upon the confirmation or falsification of the theoretical hypotheses. In sum, the yielded
parameter estimates allowed to generate reliable assertions about the role of the identified model predictors within
the consumer adoption process in a wearable computing context. Focussing on the research questions set out in
the first chapter of this thesis, in a next step the final conceptual model towards the acceptance of wearable
computing was delivered and critically discussed. The new empirical insights substantially foster managerial
understanding of the topic and provide concrete practical recommendations on how to overcome initial consumer’s
adoption barriers. The following sections thus focus on the implications for marketing theory and practice that can
be derived from this research.
8.2 Theoretical Implications
This study advances contemporary knowledge in Information Systems research in several ways. Based on the
exploratory interview study, single cognitive and personality-related factors could be identified that affect the
perception of wearable technologies. The results were synthesised into a new conceptual framework on wearable
computing acceptance, the Wearable TAM. Previous research contributions on the wearable adoption phenomenon
are mainly of descriptive nature, which limits insights for theory building. The few existing path-analytical
investigations draw primarily on single, generic base models in the sense of theoretical monism (see chapter 3.1).
An integrated approach that exhausts the subject matter from a behavioural perspective is still lacking. The present
research work thus contributes to the body of knowledge in that it provides a new behavioural model that is capable
of explaining holistically the interpersonal decision to adopt wearable computing.
Motivated by the actual contrast between objective measures and subjective perceptions of IT security, the current
research furthermore delivers empirical insights into consumer concerns about concrete security risks associated
with wearable devices. In doing so, it bridges the gap between the traditional multifaceted conceptualisation of IT
risk in security literature and its unidimensional measurement in most empirical studies. That way, it could be
proven that privacy risks pose a major impediment to the rate of adoption in wearable technology markets, though
system integrity can also be considered an important aspect. Interestingly, the data implies an inconsistent
mediation model es regards the first-order constructs perceived availability, perceived integrity, and perceived

204 Discussion of Results
confidentiality. Specifically, system integrity perceptions appear to possess a suppressor effect on availability
perceptions which is a unique insight into subjective information security assessment. From a path model point of
view, this research could confirm a recursive linear relationship between trust as an exogenous and IT risk
perception as a negatively affected endogenous construct. Another interesting study finding is that contrary to
expectations neither personal innovativeness nor experience does show any significant moderating effect on the
relationship between perceived risk and behavioural intention. This certainly deserves further attention in
technology acceptance research.
Unlike most empirical works with similar theoretical focus, based on a consumer value perspective this research
further advances knowledge on usefulness perceptions by combining a series of utilitarian beliefs into an index
representing the wearables’ positive usage consequences. This allowed to identify the perceived support of health
and fitness as a ‘success factor’ that primarily drives usefulness perceptions of wearable computers. Also, to
calibrate the research model to the particularities of the study object, issues concerning a new pervasiveness
construct including its conceptual properties, constituents and effects were considered, an approach not previously
undertaken. It could be shown that unobtrusiveness is the most important pervasiveness dimension that indirectly
affects the intention to use wearables, which is an unprecedented finding in Information Systems research.
However, according to study results, system pervasiveness characteristics have to be translated into concrete
application scenarios that are perceived as beneficial in order to become behaviourally relevant.
In addition, by incorporating personality-related correlates within the synthesised nomological net, this thesis
contributes to contemporary research on the role psychological predispositions play in the technology adoption
process. Specifically, the effect of the well-established Big Five personality dimensions on the intention to use an
innovative technology is still an underdeveloped area in the chosen field. In order to be able to investigate traits at
each level in the personality hierarchy of behaviour, the 3M model was applied. Albeit this framework has been
used in several consumer research contexts including compulsive buying (Mowen & Spears, 1999) and travel
behaviour (Scott & Mowen, 2007), online shopping (Bosnjak, et al., 2007), volunteering (Mowen & Sujan, 2005),
word-of-mouth communications (Mowen, et al., 2007), online social shopping (Kang & Johnson, 2015), and
financial satisfaction (Davis & Runyan, 2016), it has not yet been applied to technology adoption. In particular,
this study could shed light on the great significance materialistic values and agreeableness have on affective
involvement towards innovative technologies. Yet, one remarkable finding is that the effect of the latter elemental
trait is particularly strong in the male subpopulation. In regards to the causative impact of the conscientiousness
trait on NFC, the empirical results clearly disprove its exploratory role in a technology acceptance context.
Still, only little is known about the facilitating conditions of wearable technology usage. In an effort to deepen the
established understanding of the attitudinal dependencies, this study also investigated the contingencies that
underlie the relationships between usage intention and its cognitive causes. More precisely, two salient moderator
variables, which emerged during the conceptual and exploratory research stage, were integrated into the model to
elevate its explanatory power. As mentioned above, their moderating influence does only hold for the perceived
usefulness-intention link, which helps increasing the predictive power of the hypothesised structural model. Beside
this, relevant demographic control variables were also considered to check the robustness of the formulated system
of hypotheses. In the course of the multigroup analysis, generational cohorts in terms of digital natives and digital
Discussion of Results 205
immigrants emerged as promising background variables that are particularly worthwhile giving further
investigation in an information technology acceptance context. Consequently, this study adds to extant literature
on socio-demographic differences in individual technology adoption, as well.
8.3 Managerial Implications
In order to remain competitive in the fast-paced technology sector that is characterised by increasingly shortened
product life cycles, enterprises must constantly strive to create innovative products which deliver new customer
value in the marketplace. The significance of ICT-based innovations becomes particularly apparent in the case of
the mobile phone industry: In many cultures, e.g. Apple iPhone has nowadays transformed into a platform for self-
expression and social learning, taking on greater emotional importance in people’s lives (Morris & Aguilera, 2012,
p. 622). In a similar vein, technological advances including new sensors and low-power radio chips has led the
consumer electronics industry to believe that wearable computing will be ‘the next big thing’ (Hunn, 2015).
However, unlike smartphones, wearables clearly fail to grow at forecasted rates and still struggle to gain
momentum beyond innovators (see chapter 2.4). To achieve market penetration more quickly, innovation research
emphasises the pivotal role of social acceptability in commercialising new technologies. Considering that
wearables’ business models are typically built around ‘technology push’ rather than around market needs (Topor,
2016, p. 381), identifying socio-psychological success factors becomes even more crucial to cross the chasm
between early market and mainstream market customers. Therefore, the implications derived from this study are
of practical importance for wearable manufacturers and other strategic partners of the wearable technology
ecosystem alike.
Since the ‘willingness to use’ an information system has repeatedly been proven to serve as a proxy of actual
adoption behaviour in prior research, consumers who score high in wearable usage intention may be deemed the
target audience for the wearable industry (cf. chapter 3.1.21). According to present study results, it is noticeable
that both cognitive and affective responses strongly covary with usage intention. Still, cognitive information
processing comes more to the fore in the context of wearable computing adoption. In line with numerous prior
Information System studies, the empirical investigation thereby corroborates the dominance of cognitive beliefs
in attitude formation. From this it can be concluded that wearables actually represent high-involvement products.
As opposed to low-involvement products that are typically subject to routine response behaviours based on limited
information, they are rather purchased after careful consideration. Thus, the primary goal of innovating companies
should be to affect the cognitive component of users' attitudes. Vendors should concentrate more on informative
issues in their communication-mix than building brands with less informative advertisement. For achieving
susceptibility to persuasion, consumers need to be educated about the product’s main attributes by means of
comprehensive, issue-relevant information delivered in a logical, verifiable manner (cf. Chen et al., 2007, p. 1048,
and Ha, 2002). Due to their rational purchase motives, wearable technology consumers may be deemed more
willing and capable of processing new, product-related information via the central rout to persuasion. As a result,
they are more likely to be persuaded by rational claims and product-inherent value message arguments. Thus,
providing easy available means-end information may reduce consumer search costs and facilitate decision-making.
206 Discussion of Results
However, wearable technologies are still hardware dominant innovations and the majority of consumers consider
wearables to be of limited usefulness. In the first instance, marketers should therefore give priority to the
development of more compelling service models to drive greater adoption. Particularly, the conducted field study
accentuates the relevancy of software innovation for hardware success, in that the hardware-enabled pervasiveness
of devices has a smaller total effect on usage intentions than compared to application-based benefits. Consequently,
it appears worthwhile for device makers to develop innovation networks, strategic alliances or joint ventures with
software, content and service providers across the value chain. This enables the individual actors to concentrate
on their core competencies and to access new markets and value potentials. In this context, Swiss watch
manufacturer TAG Heuer may be alleged as a positive example, who partnered with Google and Intel to move
into the smartwatch market with a luxury Android wristwatch (TAG Heuer, 2015). Another example would be the
German optical manufacturer Carl Zeiss AG, who just recently announced future collaboration with Deutsche
Telekom in the field of smart glasses in order to ensure network connectivity of their smart lens prototypes (ZEISS
Group, 2017). The company thereby strives to develop data glasses which feel and look like usual eyeglasses.
As demonstrated by the survey data, perceived support of health and fitness appears to be the core reason to date
why consumers are interested in adopting wearables. This underlines the tremendous entrepreneurial and economic
opportunities for the health and wellbeing sector. Since the expected enhancement of personal abilities emerged
to be the second strongest driver of usage intention, software developers and service providers should focus their
attention on devising tailored applications that improve efficiency, productivity and engagement across different
industries such as healthcare, fitness, retail, travel and entertainment. Advertisers should highlight the role of
functional benefits for users in improving their lives at home, work or recreation. They should help prospective
users envision how wearables can make everyday tasks more effective and enjoyable. For instance, health and
fitness applications might engage users with incentives and gamification to create easier means to achieve goals,
while e.g. retail apps could deliver a more integrated shopping experience with stronger shopping insights and
faster payment, as proposed in (Gartner, Inc., 2016) and (Bothun, et al., 2014). To be considered efficiency-
enhancing tools, wearables should not just provide data that is informative, but also real-time information that is
prescriptive (Bothun, et al., 2014). That is, in order to offer some tangible value-added, advanced analytics should
help users to turn insights into specific actions, ultimately leading to efficiency gains or changes in behaviour.
Behavioural relevancy of individual benefit expectations, however, is significantly affected by both experience
with wearables and personal innovativeness in the domain of information technology. The more individuals gather
experiences with wearable technologies, the more positively they will evaluate these devices. Thus, frequent
product demonstrations and pre-purchase trials appear suitable as they can give a vivid impression of the benefits
of wearable computing. According to Rogers (2003, p. 16), innovations that can be experimented on a limited
basis are generally adopted more rapidly. This also implies that these smart gadgets will more likely pervade and
accompany everyday life when companies fund wearable computers for their employees, rather than implementing
a BYOD model. In addition, since usefulness perceptions show a higher predictive power in innovative population
segments, target-group oriented marketing campaigns seem promising. Innovators may serve as key change agents
and opinion leaders to foster further diffusion of wearables (Agarwal & Prasad, 1998, p. 205). When
implementation resources are scarce, targeting this segment renders particularly efficient. Of course, marketing
efforts should be directed to those on-line and offline paths of communication, which possess the highest
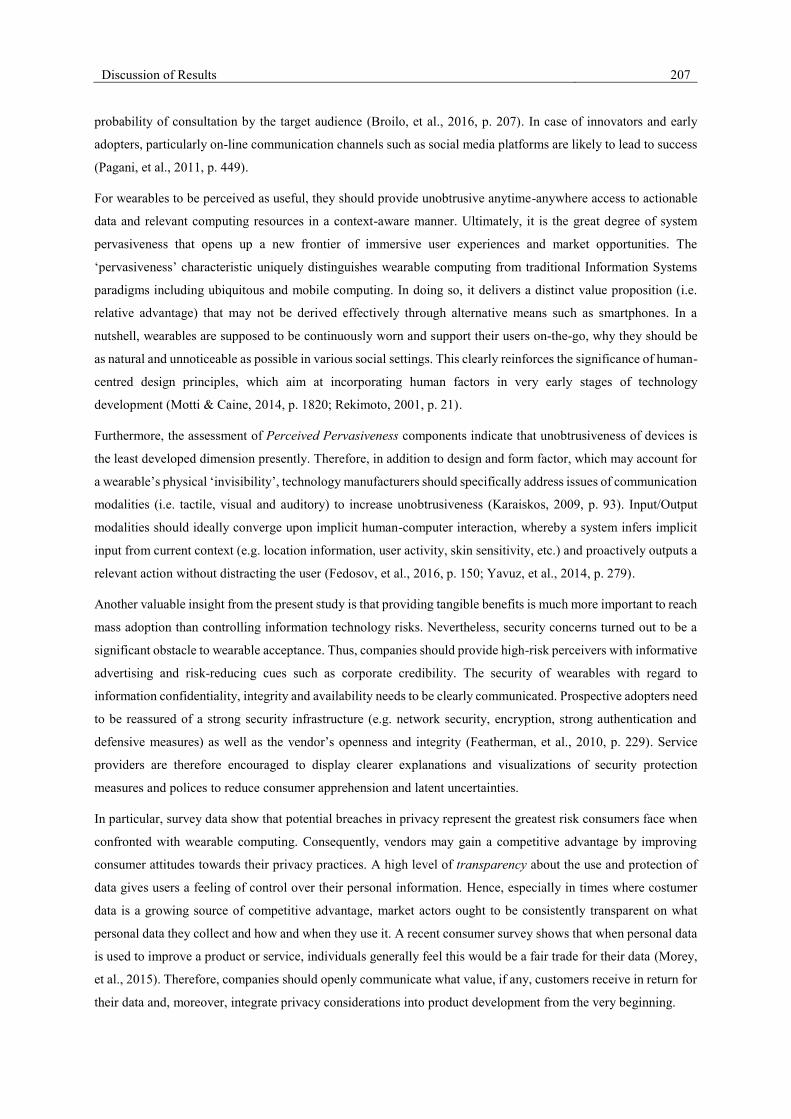
Discussion of Results 207
probability of consultation by the target audience (Broilo, et al., 2016, p. 207). In case of innovators and early
adopters, particularly on-line communication channels such as social media platforms are likely to lead to success
(Pagani, et al., 2011, p. 449).
For wearables to be perceived as useful, they should provide unobtrusive anytime-anywhere access to actionable
data and relevant computing resources in a context-aware manner. Ultimately, it is the great degree of system
pervasiveness that opens up a new frontier of immersive user experiences and market opportunities. The
‘pervasiveness’ characteristic uniquely distinguishes wearable computing from traditional Information Systems
paradigms including ubiquitous and mobile computing. In doing so, it delivers a distinct value proposition (i.e.
relative advantage) that may not be derived effectively through alternative means such as smartphones. In a
nutshell, wearables are supposed to be continuously worn and support their users on-the-go, why they should be
as natural and unnoticeable as possible in various social settings. This clearly reinforces the significance of human-
centred design principles, which aim at incorporating human factors in very early stages of technology
development (Motti & Caine, 2014, p. 1820; Rekimoto, 2001, p. 21).
Furthermore, the assessment of Perceived Pervasiveness components indicate that unobtrusiveness of devices is
the least developed dimension presently. Therefore, in addition to design and form factor, which may account for
a wearable’s physical ‘invisibility’, technology manufacturers should specifically address issues of communication
modalities (i.e. tactile, visual and auditory) to increase unobtrusiveness (Karaiskos, 2009, p. 93). Input/Output
modalities should ideally converge upon implicit human-computer interaction, whereby a system infers implicit
input from current context (e.g. location information, user activity, skin sensitivity, etc.) and proactively outputs a
relevant action without distracting the user (Fedosov, et al., 2016, p. 150; Yavuz, et al., 2014, p. 279).
Another valuable insight from the present study is that providing tangible benefits is much more important to reach
mass adoption than controlling information technology risks. Nevertheless, security concerns turned out to be a
significant obstacle to wearable acceptance. Thus, companies should provide high-risk perceivers with informative
advertising and risk-reducing cues such as corporate credibility. The security of wearables with regard to
information confidentiality, integrity and availability needs to be clearly communicated. Prospective adopters need
to be reassured of a strong security infrastructure (e.g. network security, encryption, strong authentication and
defensive measures) as well as the vendor’s openness and integrity (Featherman, et al., 2010, p. 229). Service
providers are therefore encouraged to display clearer explanations and visualizations of security protection
measures and polices to reduce consumer apprehension and latent uncertainties.
In particular, survey data show that potential breaches in privacy represent the greatest risk consumers face when
confronted with wearable computing. Consequently, vendors may gain a competitive advantage by improving
consumer attitudes towards their privacy practices. A high level of transparency about the use and protection of
data gives users a feeling of control over their personal information. Hence, especially in times where costumer
data is a growing source of competitive advantage, market actors ought to be consistently transparent on what
personal data they collect and how and when they use it. A recent consumer survey shows that when personal data
is used to improve a product or service, individuals generally feel this would be a fair trade for their data (Morey,
et al., 2015). Therefore, companies should openly communicate what value, if any, customers receive in return for
their data and, moreover, integrate privacy considerations into product development from the very beginning.
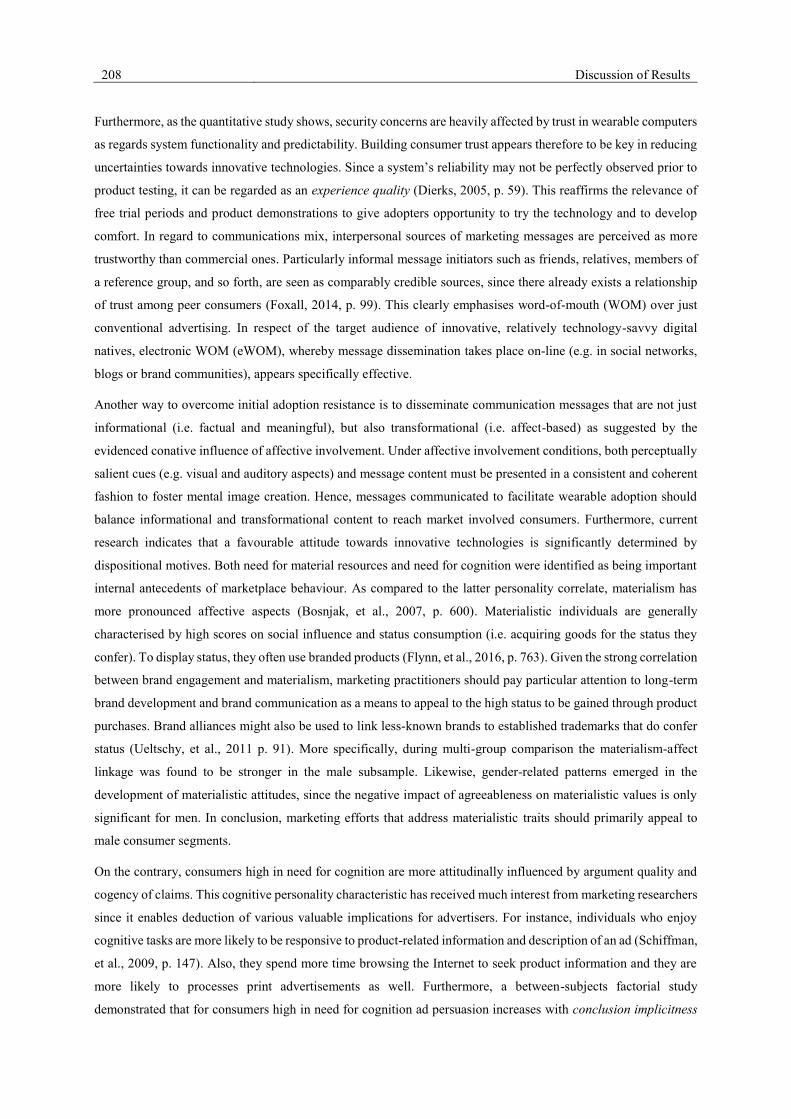
208 Discussion of Results
Furthermore, as the quantitative study shows, security concerns are heavily affected by trust in wearable computers
as regards system functionality and predictability. Building consumer trust appears therefore to be key in reducing
uncertainties towards innovative technologies. Since a system’s reliability may not be perfectly observed prior to
product testing, it can be regarded as an experience quality (Dierks, 2005, p. 59). This reaffirms the relevance of
free trial periods and product demonstrations to give adopters opportunity to try the technology and to develop
comfort. In regard to communications mix, interpersonal sources of marketing messages are perceived as more
trustworthy than commercial ones. Particularly informal message initiators such as friends, relatives, members of
a reference group, and so forth, are seen as comparably credible sources, since there already exists a relationship
of trust among peer consumers (Foxall, 2014, p. 99). This clearly emphasises word-of-mouth (WOM) over just
conventional advertising. In respect of the target audience of innovative, relatively technology-savvy digital
natives, electronic WOM (eWOM), whereby message dissemination takes place on-line (e.g. in social networks,
blogs or brand communities), appears specifically effective.
Another way to overcome initial adoption resistance is to disseminate communication messages that are not just
informational (i.e. factual and meaningful), but also transformational (i.e. affect-based) as suggested by the
evidenced conative influence of affective involvement. Under affective involvement conditions, both perceptually
salient cues (e.g. visual and auditory aspects) and message content must be presented in a consistent and coherent
fashion to foster mental image creation. Hence, messages communicated to facilitate wearable adoption should
balance informational and transformational content to reach market involved consumers. Furthermore, current
research indicates that a favourable attitude towards innovative technologies is significantly determined by
dispositional motives. Both need for material resources and need for cognition were identified as being important
internal antecedents of marketplace behaviour. As compared to the latter personality correlate, materialism has
more pronounced affective aspects (Bosnjak, et al., 2007, p. 600). Materialistic individuals are generally
characterised by high scores on social influence and status consumption (i.e. acquiring goods for the status they
confer). To display status, they often use branded products (Flynn, et al., 2016, p. 763). Given the strong correlation
between brand engagement and materialism, marketing practitioners should pay particular attention to long-term
brand development and brand communication as a means to appeal to the high status to be gained through product
purchases. Brand alliances might also be used to link less-known brands to established trademarks that do confer
status (Ueltschy, et al., 2011 p. 91). More specifically, during multi-group comparison the materialism-affect
linkage was found to be stronger in the male subsample. Likewise, gender-related patterns emerged in the
development of materialistic attitudes, since the negative impact of agreeableness on materialistic values is only
significant for men. In conclusion, marketing efforts that address materialistic traits should primarily appeal to
male consumer segments.
On the contrary, consumers high in need for cognition are more attitudinally influenced by argument quality and
cogency of claims. This cognitive personality characteristic has received much interest from marketing researchers
since it enables deduction of various valuable implications for advertisers. For instance, individuals who enjoy
cognitive tasks are more likely to be responsive to product-related information and description of an ad (Schiffman,
et al., 2009, p. 147). Also, they spend more time browsing the Internet to seek product information and they are
more likely to processes print advertisements as well. Furthermore, a between-subjects factorial study
demonstrated that for consumers high in need for cognition ad persuasion increases with conclusion implicitness
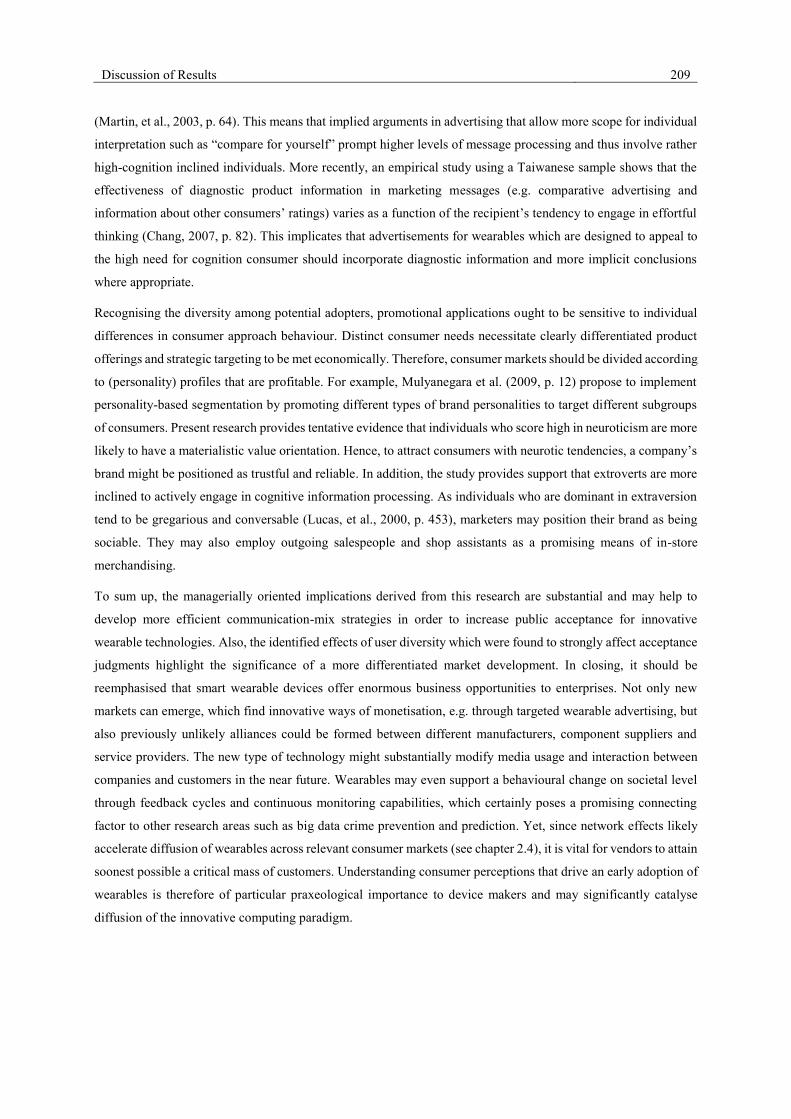
Discussion of Results 209
(Martin, et al., 2003, p. 64). This means that implied arguments in advertising that allow more scope for individual
interpretation such as “compare for yourself” prompt higher levels of message processing and thus involve rather
high-cognition inclined individuals. More recently, an empirical study using a Taiwanese sample shows that the
effectiveness of diagnostic product information in marketing messages (e.g. comparative advertising and
information about other consumers’ ratings) varies as a function of the recipient’s tendency to engage in effortful
thinking (Chang, 2007, p. 82). This implicates that advertisements for wearables which are designed to appeal to
the high need for cognition consumer should incorporate diagnostic information and more implicit conclusions
where appropriate.
Recognising the diversity among potential adopters, promotional applications ought to be sensitive to individual
differences in consumer approach behaviour. Distinct consumer needs necessitate clearly differentiated product
offerings and strategic targeting to be met economically. Therefore, consumer markets should be divided according
to (personality) profiles that are profitable. For example, Mulyanegara et al. (2009, p. 12) propose to implement
personality-based segmentation by promoting different types of brand personalities to target different subgroups
of consumers. Present research provides tentative evidence that individuals who score high in neuroticism are more
likely to have a materialistic value orientation. Hence, to attract consumers with neurotic tendencies, a company’s
brand might be positioned as trustful and reliable. In addition, the study provides support that extroverts are more
inclined to actively engage in cognitive information processing. As individuals who are dominant in extraversion
tend to be gregarious and conversable (Lucas, et al., 2000, p. 453), marketers may position their brand as being
sociable. They may also employ outgoing salespeople and shop assistants as a promising means of in-store
merchandising.
To sum up, the managerially oriented implications derived from this research are substantial and may help to
develop more efficient communication-mix strategies in order to increase public acceptance for innovative
wearable technologies. Also, the identified effects of user diversity which were found to strongly affect acceptance
judgments highlight the significance of a more differentiated market development. In closing, it should be
reemphasised that smart wearable devices offer enormous business opportunities to enterprises. Not only new
markets can emerge, which find innovative ways of monetisation, e.g. through targeted wearable advertising, but
also previously unlikely alliances could be formed between different manufacturers, component suppliers and
service providers. The new type of technology might substantially modify media usage and interaction between
companies and customers in the near future. Wearables may even support a behavioural change on societal level
through feedback cycles and continuous monitoring capabilities, which certainly poses a promising connecting
factor to other research areas such as big data crime prevention and prediction. Yet, since network effects likely
accelerate diffusion of wearables across relevant consumer markets (see chapter 2.4), it is vital for vendors to attain
soonest possible a critical mass of customers. Understanding consumer perceptions that drive an early adoption of
wearables is therefore of particular praxeological importance to device makers and may significantly catalyse
diffusion of the innovative computing paradigm.
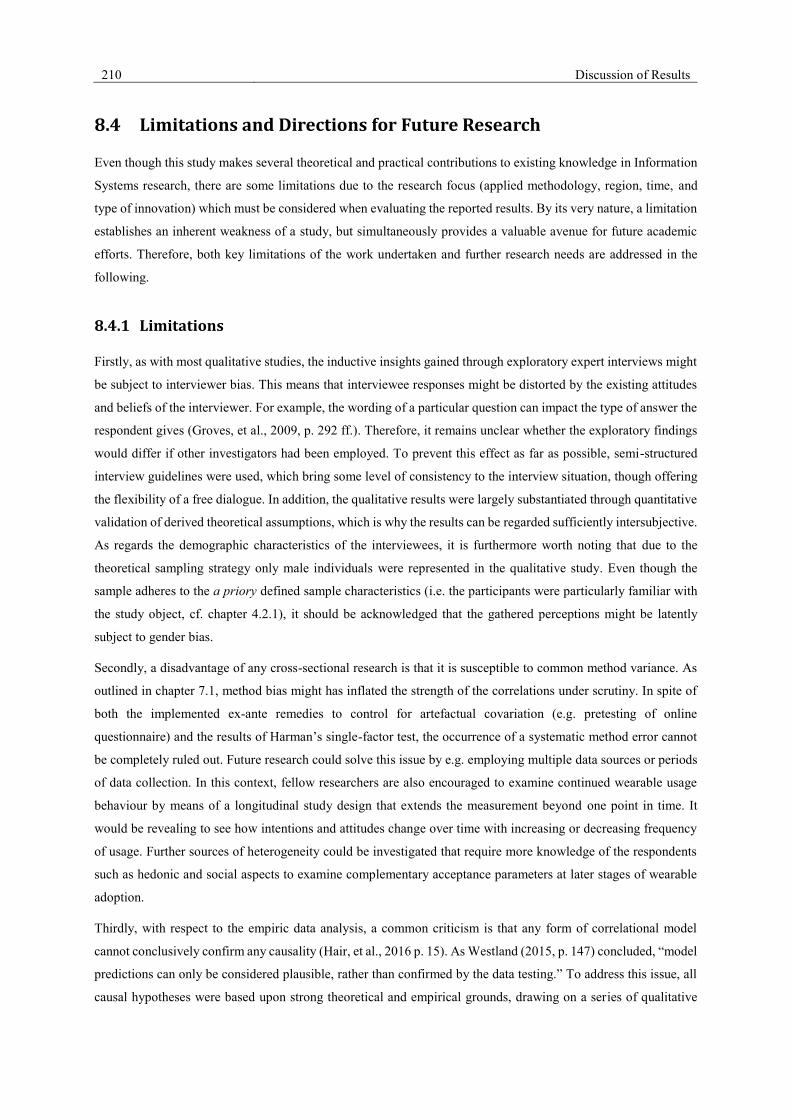
210 Discussion of Results
8.4 Limitations and Directions for Future Research
Even though this study makes several theoretical and practical contributions to existing knowledge in Information
Systems research, there are some limitations due to the research focus (applied methodology, region, time, and
type of innovation) which must be considered when evaluating the reported results. By its very nature, a limitation
establishes an inherent weakness of a study, but simultaneously provides a valuable avenue for future academic
efforts. Therefore, both key limitations of the work undertaken and further research needs are addressed in the
following.
8.4.1 Limitations
Firstly, as with most qualitative studies, the inductive insights gained through exploratory expert interviews might
be subject to interviewer bias. This means that interviewee responses might be distorted by the existing attitudes
and beliefs of the interviewer. For example, the wording of a particular question can impact the type of answer the
respondent gives (Groves, et al., 2009, p. 292 ff.). Therefore, it remains unclear whether the exploratory findings
would differ if other investigators had been employed. To prevent this effect as far as possible, semi-structured
interview guidelines were used, which bring some level of consistency to the interview situation, though offering
the flexibility of a free dialogue. In addition, the qualitative results were largely substantiated through quantitative
validation of derived theoretical assumptions, which is why the results can be regarded sufficiently intersubjective.
As regards the demographic characteristics of the interviewees, it is furthermore worth noting that due to the
theoretical sampling strategy only male individuals were represented in the qualitative study. Even though the
sample adheres to the a priory defined sample characteristics (i.e. the participants were particularly familiar with
the study object, cf. chapter 4.2.1), it should be acknowledged that the gathered perceptions might be latently
subject to gender bias.
Secondly, a disadvantage of any cross-sectional research is that it is susceptible to common method variance. As
outlined in chapter 7.1, method bias might has inflated the strength of the correlations under scrutiny. In spite of
both the implemented ex-ante remedies to control for artefactual covariation (e.g. pretesting of online
questionnaire) and the results of Harman’s single-factor test, the occurrence of a systematic method error cannot
be completely ruled out. Future research could solve this issue by e.g. employing multiple data sources or periods
of data collection. In this context, fellow researchers are also encouraged to examine continued wearable usage
behaviour by means of a longitudinal study design that extends the measurement beyond one point in time. It
would be revealing to see how intentions and attitudes change over time with increasing or decreasing frequency
of usage. Further sources of heterogeneity could be investigated that require more knowledge of the respondents
such as hedonic and social aspects to examine complementary acceptance parameters at later stages of wearable
adoption.
Thirdly, with respect to the empiric data analysis, a common criticism is that any form of correlational model
cannot conclusively confirm any causality (Hair, et al., 2016 p. 15). As Westland (2015, p. 147) concluded, “model
predictions can only be considered plausible, rather than confirmed by the data testing.” To address this issue, all
causal hypotheses were based upon strong theoretical and empirical grounds, drawing on a series of qualitative
Discussion of Results 211
interviews and comprehensive literature review. A further critical point is that causal models such as the Wearable
TAM generally simplify complex relationships as linear relations. However, structural models might also be non-
recursive, i.e. they can contain circular relationships between latent variables. For instance, prior research suggests
that conscientiousness and need for cognition mutually influence one another, what questions the implied
endogeneity of the latter construct in the current conceptual framework. From a technical perspective, PLS-SEM
is intrinsically not able to deal with such causal loops (Hair, et al., 2016 p. 18). Considering that among any given
structural theory several alternative models potentially exist that are equivalent in terms of overall goodness-of-fit
(Chin, 1998b, p. xii), conceptualising alternative candidate models that may contain more complex relationships
and comparing them with the aid of CB-SEM could help to gain better insights. SEM literature recommends to
search for different predictor structures via a step-by-step approach to model creation that uses the same data in
each step, e.g. by post-hoc modifications such as eliminating insignificant pathways or adding new relations as
suggested by modification indices (Gross, 2014, p. 233).
Fourthly, it has to be acknowledged that the research had a national focus on Germany for both the qualitative and
the quantitative part. Potential effects of culture-specific attitudes hence remain unexplored. This empirical setting
might pose a threat to external validity, as pertinent research works frequently reported a significant impact of
socio-cultural differences on the acceptance of innovations (e.g. Bagozzi, 2007, p. 248). This applies all the more
to personality-related variables such as extraversion and agreeableness, which have been proven to be particularly
sensitive to ‘cultural effects’ in previous studies (Gurven, et al., 2013 p. 355). Therefore, it is questionable whether
the study results are readily applicable to other geographical areas. In order to broaden the basis for empirical
evidence and to alleviate cultural bias, future research is encouraged to extend the scope of the current survey
design to further localities such as the U.S. market, where penetration of smart glasses has already begun.
Moreover, this thesis has a clear defined research subject (i.e. acceptance of wearable computing). Pertinent
literature, however, indicates that findings in the field of technology acceptance can never be transferred directly
from one context to another without any adjustment (Planing, 2014 p. 276). It is very likely that any other
individual research context would have yielded slightly different analytical findings. Thus, to provide insight into
the generalisability of the developed nomological structure, this study should be replicated on further markets and
related technological areas in the context of ubiquitous and pervasive computing (e.g. smart home appliances or
connected car). Similarly, a final limitation revolves around the chosen technologies (i.e. smartwatches and smart
glasses) as test objects of study. Since the underlying conceptual framework was designed to be relevant and
applicable to other wearable technologies, additional insights could be gained from broadening the research setting
to further types of wearables such as smart jewellery or smart clothes. As wearables represent just a small, but
dynamically developing part of an “emerging larger cohesion widely known as the ‘Internet of Things’” (European
Commission, 2016 p. 4), only experience will show which form factors and applications will dominate the future
of wearable computing.
All in all, more studies need to be done under varying conditions to elaborate wearable computing adoption in
greater depth regarding different applications and subpopulations, so that a comprehensive picture can be drawn.
Nonetheless, considering the scarce resources of this study, the applied research design and methodology can be
regarded appropriate and efficient. As could be shown, this thesis provides a strong contribution to theory and
practice in spite of the named restrictions. Also, the pioneering character of research has to be stressed, too.
212 Discussion of Results
Throughout the course of this thesis, it was referred to the early stages of wearable computing diffusion and the
resultant extensive research gaps. This leaves ample room for further academic endeavours. Specifically, some
findings of the current study pose new interesting issues, which go beyond the actual investigational scope.
Therefore, the next sections discuss propositions for future research activities.
8.4.2 Avenues for Future Research
This thesis represents a first comprehensive study entirely dedicated to the emerging phenomenon of wearable
computing adoption. Due to the clearly defined study focus, several knowledge gaps in related fields were
identified, which should be addressed by future large-scale efforts. The following subsections delineate the most
striking issues from a conceptual angle.
To date, the prevalent perspective for explaining user attitudes towards information technologies is still cognition-
based. However, an interesting analytical finding is that acceptance judgments are not only determined by
cognitive beliefs, but also significantly shaped by the personal importance attached to the new type of technology.
This strongly supports the call of recent Information Systems research to take greater account of the emotional
nature of Information Systems usage (Leger, et al., 2014, p. 466). The demonstrated effect of involvement extends
the cognitive concept of conative attitude by a further explanatory dimension and, in doing so, increases
informativeness of the explanans. Since product involvement reflects a quite enduring motivational state of arousal
and interest that strongly relates to repeat purchases (Blythe, 2013, p. 89), the gained survey findings are of special
significance for future innovation research in the field. In particular, the observed collinearity among the measures
of involvement and adoption decision bears witness to the conceptual proximity of affective and cognitive
appraisals. Thus, a promising approach would be to merge affective involvement (in the sense of attitude strength)
and behavioural intention into a more general higher-order construct that mirrors the cognitive-affective structure
of conative attitude. Furthermore, the relatively weak R-squared value of 0.112 for involvement suggests that there
are other important factors influencing affect-laden consumer responses besides the personality-related variables
included in the research model of this study. Future replications should therefore try to develop a better
understanding of the involvement phenomenon by considering further potential antecedents. A starting point for
the identification of involvement sources may be the influential work of Laurent and Kapferer (1985), who
identified five antecedent conditions including perceived pleasure and perception of sign value (self‐expression or
self-identity).
Regarding the operationalisation of the Big Five personality traits, further inventories should be taken into account.
The ultra-short BFI-10 scale of personality structure that was employed due to resource constraints delivered only
weak internal consistency results. Confirmatory factor analysis revealed low alpha reliabilities ranging from 0.410
to 0.663. Here, it should be reemphasised that even elemental traits are commonly assumed to possess a
hierarchical structure with each individual personality domain being comprised of several sub-facets (Costa &
McCrae, 1995, p. 21; Credé, et al., 2012, p. 876). Thus, there is reason to suspect that two-item scales could fully
capture the breath of a specific personality domain. In addition, in measurement theory brief measurement
instruments with less than three items are considered not suitable for latent factor modeling (Maroof, 2012, p. 31).
Since problematic items were dropped in the course of scale validation, data integrity might be even more
Discussion of Results 213
compromised. Given these psychometric concerns, if greater resources are available, future research should make
use of more comprehensive inventories of personality such as the original standard BFI-44 scale as described in
(Benet-Martinez & John, 1998). By enabling a higher level of detail, this instrument is more predictively capable,
which is important for an accurate psychographic market segmentation.
Furthermore, the multigroup analysis evinced that individual difference variables (i.e. specifically age subcultures)
significantly interact with IT-related risk perceptions. Due to conceptual limitations (the Wearable TAM strives
for parsimony at the cost of accuracy), only a few salient demographics were employed to disaggregate the risk-
intention relation for the sake of increased variance explained. However, a growing body of literature broaches the
issue of heterogeneity in security risk perceptions and attitudes (cf. Joo & Hovav, 2016, p. 109). It is thus quite
likely that further contextual variables have an effect on this relationship. Moving beyond the present theoretical
framework, further effort should be made to enrich current understanding of contextual dependencies of IT risk
perceptions. For example, Chi et al. (2012, p. 99) empirically demonstrated that under the interactive effect of
perceived risk and subjective norm, usage intention gradually diminishes. In contrast, Colobran (2016, p. 2)
assumes that the degree of security knowledge strongly modifies subjective security perceptions. In light of the
study results and under the premise that digital natives are typically more computer literate, incorporating IT
security expertise as an additional grouping variable into the structural model appears particularly worthwhile.
Finally, it should to be stressed that this study makes no claim to completeness. The empirical findings in support
of the hypothesised structural model do not preclude the acceptance phenomenon from also being explained by
other latent variables. As stated by Yang et al. (2016, p. 267), owing to their possible visibility to others (which
depends on product type), many wearables are both high-tech electronic devices and fashion items at the same
time. Therefore, it would seem informative to know how e.g. brand experiences or aesthetics and design
perceptions interrelate to the adoption predictors. Further in-depth investigation that considers additional
explanatory variables is needed to produce a holistic understanding of innovation adoption in the area of wearable
computing. In view of the fact that research on wearable computing is still in the early stages of its development,
reconceptualization of composite constructs may also be considered in prospective research endeavours to ensure
content validity. For instance, perceived authentication and authorisation mechanisms might be important criteria
in the consumer’s overall valuation of the security of ultra-mobile devices, as discussed earlier in chapter 2.3.
Moreover, when looking at the benefit side of the evaluative judgement, it should be acknowledged that the
employed scale on perceived usefulness was established at the time of research. Therefore, the construed index
naturally neglects potential future usage scenarios that may translate into relevant utility dimensions. However,
only time will tell which exciting new applications and ensuing benefits might emerge in fields as diverse as
emotional communication and telemedicine. In order to elicit consumer preferences, conjoint analysis might prove
useful. Jaeger et al. propose in (2013, p. 3682 ff.) to use PLS regression for analysing interval-level conjoint data.
From a methodological standpoint, this would be an interesting rout for future research.
As shown, wearable computing represents a promising new field of study. Even though this thesis provides some
valuable insights, a lot of questions remain unanswered to date. The new issues raised by the current work will
hopefully inspire other scholars to further explore the interesting phenomenon from a consumer perspective. In

214 Discussion of Results
light of the continuous evolution of new wearable devices, however, it is reasonable to expect that in the future
wearable computing will receive even more attention from researchers and practitioners alike.
References 215
References
44 U.S. Code § 3542. 2002. Pub. L. 107–347, title III, § 301(b)(1). [Online] 2002.
http://www.law.cornell.edu/uscode/text/44/3542.
Abowd, G. D., et al. 1999. Towards a better understanding of context and context-awareness. Handheld and
ubiquitous computing. s.l. : Springer, 1999.
Agarwal, R. and Karahanna, E. 2000. Time flies when you're having fun: Cognitive absorption and beliefs
about information technology usage. MIS quarterly. 2000, Vol. 24, 4.
Agarwal, R. and Prasad, J. 1997. The role of innovation characteristics and perceived voluntariness in the
acceptance of information technologies. Decision sciences. 1997, Vol. 28, 3.
—. 1998. A conceptual and operational definition of personal innovativeness in the domain of information
technology. Information systems research. 1998, Vol. 9, 2.
Aguinis, H., et al. 2005. Effect size and power in assessing moderating effects of categorical variables using
multiple regression: a 30-year review. Journal of Applied Psychology. 2005, Vol. 90, 1.
Aguirre-Urreta, M. & Rönkkö, M., 2015. Sample Size Determination and Statistical Power Analysis in PLS
Using R: An Annotated Tutorial. Communications of the Association for Information System, Volume 36.
Ahn, C., Heo, M. and Zhang, S. 2014. Sample Size Calculations for Clustered and Longitudinal Outcomes in
Clinical Research. s.l. : CRC, 2014.
Ahtola, O. T. 1975. The vector model of preferences: An alternative to the Fishbein model. Journal of
Marketing Research. 1975, Vol. 12.
Ajzen, I. 2005. Attitudes, Personality and Behavior (2nd Edition). s.l. : Open University Press, 2005.
—. 1985. From intentions to actions: A theory of planned behavior. s.l. : Springer, 1985.
—. 2001. Nature and operation of attitudes. Annual review of psychology. 2001, Vol. 52, 1.
—. 1991. The Theory of Planned Behavior. Organizational Behavior and Human Decision Processes. 1991,
Vol. 50.
Ajzen, I. and Fishbein, M. 1975. Belief, Attitude, Intention, and Behavior: An Introduction to Theory and
Research. s.l. : Addison-Wesley, 1975.
—. 2008. Scaling and Testing Multiplicative Combinations in the Expectancy–Value Model of Attitudes.
Journal of Applied Social Psychology. 2008, Vol. 38, 9.
Ajzen, I., Fishbein, M. and Heilbroner, R. L. 1980. Understanding Attitudes and Predicting Social Behavior.
s.l. : Prentice Hall, 1980.
Ajzen, J. and Fishbein, M. 1977. Attitude-Behavior Relations: A Theoretical Analysis and Review of
Empirical Research. Psychological Bulletin. 1977, Vol. 84, 5.
Akturan, U. and Tezcan, N. 2012. Mobile banking adoption of the youth market: Perceptions and intentions.
Marketing Intelligence & Planning. 2012, Vol. 30, 4.
Aladwani, A. M. 2001. Change management strategies for successful ERP implementation. Business Process
Management Journal. 2001, Vol. 7, 3.

216 References
Albarracin, D., et al. 2001. Theories of reasoned action and planned behavior as models of condom use: a meta-
analysis. Psychological bulletin. 2001, Vol. 127, 1.
Albers, M. J., 2017. Introduction to Quantitative Data Analysis in the Behavioral and Social Sciences. s.l.:John
Wiley & Sons.
Albers, S. 2010. PLS and Success Factor Studies in Marketing. [ed.] V. E. Vinzi, et al. Handbook of Partial
Least Squares: Concepts, Methods and Applications. s.l. : Springer Science & Business Media, 2010.
Al-Debei, M. M., Al-Lozi, E. and Papazafeiropoulou, A. 2013. Why people keep coming back to Facebook:
Explaining and predicting continuance participation from an extended theory of planned behaviour perspective.
Decision Support Systems. 2013, Vol. 55, 1.
Algina, J. & Olejnik, S., 2003. Sample size tables for correlation analysis with applications in partial correlation
and multiple regression analysis. Multivariate Behavioral Research, 38(3).
Allen, J. 2016. How wearables can improve independence for the elderly. Wareable.com. [Online] 2016.
http://www.wareable.com/health-and-wellbeing/how-wearables-can-improve-elderly-peoples-independence.
Allport, G. W. 1961. Pattern and Growth in Personality. s.l. : Harcourt College Publishers, 1961.
Almutairi, S., Aldabbas, H. and Abu-Samaha, A. 2012. Review on the security related issues in context aware
system. International Journal of Wireless & Mobile Networks. 2012.
Alrige, M. and Chatterjee, S. 2015. Toward a taxonomy of wearable technologies in healthcare. International
Conference on Design Science Research in Information Systems. s.l. : Springer International Publishing, 2015.
Altra. 2017. Altra IQ. [Online] 2017. [Cited: 13. 07 2017.] https://www.altrarunning.com/iq.
Alwahaishi, S. and Snášel, V. 2013. Modeling the Determinants Influencing the Diffusion of Mobile Internet.
Journal of Physics: Conference Series. 2013, Vol. 423, 1.
Amaratunga, D., et al. 2002. Quantitative and qualitative research in the built environment: application of
“mixed” research approach. Work study. 2002, Vol. 51, 1.
Amft, O., 2017. Smart Eyeglasses, e-Textiles, and the Future of Wearable Computing. In Advances in Science
and Technology, Vol. 100, pp. 141-150.
Anderson, R. L. and Ortinau, D. J. 1988. Exploring Consumers’ Postadoption Attitudes and Use Behaviors in
Monitoring the Diffusion of a Technology-Based Discontinuous Innovation. Journal of Business Research.
1988, Vol. 17, 3.
Andress, J. 2011. The Basics of Information Security: Understanding the Fundamentals of InfoSec in Theory
and Practice. s.l. : Elsevier, 2011.
AppAdvice LLC. 2017. WatchWare. [Online] 2017. [Cited: 17. 07 2017.] https://watchaware.com/.
Archer, T. M. 2008. Response Rates to Expect from Web-Based Surveys and What to Do About It . Journal of
Extension. 2008, Vol. 46, 3.
Arends, B. 2015. Opinion: Apple Watch sales plunge 90%. [Online] MarketWatch, Inc. , 2015.
http://www.marketwatch.com/story/apple-watch-may-not-be-ticking-with-customers-2015-07-07.
Armida, E. E. 2008. Adoption Process for VOIP: The Influence of Trust in the UTAUT Model. s.l. : ProQuest,
2008.
References 217
Armitage, C. J. and Christian, J. 2003. From attitudes to behaviour: Basic and applied research on the theory
of planned behaviour. Current Psychology. 2003, Vol. 22, 3.
Armitage, C. J. and Conner, M. 2002. Social cognition models and health behaviour: A structured review.
Psychology and health. Psychology and health. 2002, Vol. 15, 2.
Armstrong, J. S. and Overton, T. S. 1977. Estimating Nonresponse Bias in Mail Surveys. Journal of
Marketing Research. 1977, Vol. 14, 3.
Arnhold, U. 2010. User Generated Branding - Integrating User Generated Content into Brand Management. 1.
s.l. : Gabler Research, 2010.
Ashraf, R. and Merunka, D. 2016. The use and misuse of student samples: An empirical investigation of
European marketing research. Journal of Consumer Behaviour. 2016.
Bagozzi, R. P. 1984. A Prospectus for Theory Construction in Marketing. Journal of Marketing. 1984, Vol. 48,
1.
Bagozzi, R. P. and Burnkrant, R. E. 1979. Attitude Measurement and Behavior Change: a Reconsideration of
Attitude Organization and Its Relationship to Behavior. NA - Advances in Consumer Research. 1979, Vol. 06.
Bagozzi, R. P. and Burnkrant, R. E. 1980. Single Component Versus Multicomponent Models of Attitude:
Some Cautions and Contingencies For Their Use. Advances in Consumer Research. 1980, Vol. 7.
Bagozzi, R. P. and Phillips, L. W. 1982. Representing and testing organizational theories: A holistic construal.
Administrative Science Quarterly. 1982.
Bagozzi, R. P. and Yi, Y. 2012. Specification, evaluation, and interpretation of structural equation models.
Journal of the academy of marketing science. 2012, Vol. 40, 1.
Bagozzi, R. P. 1984. Expectancy-value attitude models an analysis of critical measurement issues. International
Journal of Research in Marketing. 1984, Vol. 1, 4.
—. 2007. The Legacy of the Technology Acceptance Model and a Proposal for a Paradigm Shift. Journal of the
association for information systems. 2007, Vol. 8, 4.
—. 1992. The self regulation of attitudes, intentions, and behavior. Social Psychology Quarterly. 1992, Vol. 55.
Bagozzi, R. P. and Lee, K.-H. 1999. Consumer Resistance To, and Acceptance Of, Innovations. Association for
Consumer Research. [Online] Association for Consumer Research, 1999.
http://acrwebsite.org/volumes/7902/volumes/v26/NA-26.
Bagozzi, R. P., Davis, F. D. and Warshaw, P. R. 1992. Development and test of a theory of technological
learning and usage. Human relations. 1992, Vol. 45, 7.
Bagozzi, R. P., Yi, Y. and Phillips, L. W. 1991. Assessing construct validity in organizational research.
Administrative science quarterly. 1991, Vol. 36.
Bagozzi, R., et al. 1979. The Construct Validity of the Tripartite Classification of Attitudes. Journal Of
Marketing Research. 1979, Vol. 16, 1.
Bajarin, B. 2013. Wearable Gadgets: In Search of a Value Proposition. [Online] 2013.
http://techland.time.com/2013/09/16/wearable-gadgets-in-search-of-a-value-proposition/.
Bakker, I., et al. 2014. Pleasure, Arousal, Dominance: Mehrabian and Russell revisited. Current Psychology.
2014, Vol. 33.

218 References
Balasubramanian, S., Konana, P. and Menon, N. M. 2003. Customer satisfaction in virtual environments: A
study of online investing. Management Science. 2003, Vol. 49, 7.
Bamberg, S., Ajzen, I. and Schmidt, P. 2003. Choice of travel mode in the theory of planned behavior: The
roles of past behavior, habit, and reasoned action. Basic and applied social psychology. 2003, Vol. 25, 3.
Bandura, A. 1977. Self-efficacy: toward a unifying theory of behavioral change. Psychological review. 1977,
Vol. 84, 2.
Barclay, D. W., Higgins, C. A. and Thompson, R. 1995. The partial least squares approach to causal
modeling: personal computer adoption and use as illustration. Technology Studies. 1995, Vol. 2, 2.
Baregheh, A., Rowley, J. and Sambrook, S. 2009. Towards a multidisciplinary definition of innovation.
Management Decision. 2009, Vol. 47.
Barfield, W. 2015. Fundamentals of wearable computers and augmented reality. s.l.:CRC Press.
Barfield, W. and Baird, K. 1998. Issues in the design and use of wearable computers. Virtual Reality. 1998.
Baron, R. M. and Kenny, D. A. 1986. The moderator–mediator variable distinction in social psychological
research: Conceptual, strategic, and statistical considerations. Journal of personality and social psychology.
1986, Vol. 51, 6.
Barrick, M. R., Mount, M. K. and Judge, T. A. 2001. Personality and performance at the beginning of the new
millennium: What do we know and where do we go next? International Journal of Selection and assessment.
2001, Vol. 9, 1/2.
Barroso, C., Carrión, G. C. and Roldán, J. L. 2010. Applying Maximum Likelihood and PLS on Different
Sample Sizes: Studies on SERVQUAL Model and Employee Behavior Model. Handbook of Partial Least
Squares: Concepts, Methods and Applications. s.l. : Springer Science & Business Media, 2010.
Bart, Y., et al. 2005. Are the drivers and role of online trust the same for all web sites and consumers? A large-
scale exploratory empirical study. Journal of marketing. 2005, Vol. 69, 4.
Bartlett, J. E., Kotrlik, J. W. and Higgins, C. C. 2001. Organizational Research: Determining Appropriate
Sample Size in Survey Research. Information Technology, Learning, and Performance Journal. 2001, Vol. 19,
1.
Bass, F. M. 1980. The relationship between diffusion rates, experience curves, and demand elasticities for
consumer durable technological innovations. Journal of Business. 1980, Vol. 53, 3.
Bass, L., et al. 1997. Issues in Wearable Computing: A CHI 97 Workshop. SIGCHI Bulletin. Vol. 29, 1997, Vol.
No. 4, pp. 34-39.
Bauer, D., Wutzke, R. and Bauernhansl, T. 2016. Wear@Work – A New Approach for Data Acquisition
Using Wearables. Procedia CIRP. 2016, Vol. 50.
Bauer, M., et al. 2002. An Architecture Concept for Ubiquitous Computing Aware Wearable Computers.
Proceedings of the 22 nd International Conference on Distributed Computing Systems Workshops
(ICDCSW’02). 2002.
Bauer, R. A. 1960. Consumer behavior as risk taking. [ed.] R. S. Hancock. Dynamic marketing for a Changing
World. 1960.
Baumgartner, H. 2002. Toward a personology of the consumer. Journal of Consumer Research. 2002, Vol. 29,
2.
References 219
Beaver, L. 2016. The Smartwatch Report: Forecasts, adoption trends, and why the market isn't living up to the
hype. [Online] 2016. [Cited: 30 5 2017.] http://www.businessinsider.de/smartwatch-and-wearables-research-
forecasts-trends-market-use-cases-2016-9?r=US&IR=T.
Becker, J. M., Klein, K. and Wetzels, M. 2012. Hierarchical latent variable models in PLS-SEM: guidelines
for using reflective-formative type models. Long Range Planning. 2012, Vol. 45, 5.
Belk, R. W. and Pollay, R. W. 1985. Materialism and magazine advertising during the twentieth century.
Advances in consumer research. 1985, Vol. 12, 1.
Belk, R. W. 1984. Worldly Possessions: Issues and Criticisms. [ed.] T. Kinnear. Advances in Consumer
Research. Provo, UT : Association for Consumer Research, 1984, Vol. 10.
Benet-Martinez, V. and John, O. P. 1998. Los Cinco Grandes across cultures and ethnic groups: Multitrait-
multimethod analyses of the Big Five in Spanish and English. Journal of personality and social psychology.
1998, Vol. 75, 3.
Bergkvist, L. and Rossiter, J. R. 2007. The predictive validity of multiple-item versus single-item measures of
the same constructs. Journal of marketing research. 2007, Vol. 44, 2.
Bettman, J. R. 1973. Perceived risk and its components: a model and empirical test. Journal of marketing
research. 1973, Vol. 10.
Bharatula, N. B., Lukowicz, P. and Tröster, G. 2008. Functionality-power-packaging considerations in
context aware wearable systems. Personal and Ubiquitous Computing. 2008.
Bhaskar, R. A. 1989. Reclaiming Reality: A Critical Introduction to Contemporary Philosophy. London :
Verso, 1989.
Bhattacherjee, A. 2012. Social Science Research: Principles, Methods, and Practices. 2nd. s.l. : University of
South Florida, 2012.
—. 2001. Understanding Information Systems Continuance: An Expectation-Confirmation Model. MIS
Quarterly. 2001, Vol. 25, 3.
BI Intelligence. 2015. The Wearables Report: Growth trends, consumer attitudes, and why smartwatches will
dominate. Businessinsider. [Online] 2015. http://www.businessinsider.de/the-wearable-computing-market-
report-2014-10?r=US&IR=T.
Billinghurst, M. and Starner, T. 1999. Wearable devices: new ways to manage information. [ed.] IEEE.
Computer. 1999, Vol. 32.
Bilton, N. 2012. One on one: Steve Mann, wearable computing pioneer. [Online] The New York Times
Company, 2012. [Cited: 28 5 2017.] https://bits.blogs.nytimes.com/2012/08/07/one-on-one-steve-mann-
wearable-computing-pioneer/?_r=0.
Birnbaum, J. 1997. Pervasive information systems. Communications of the ACM. 1997, Vol. 40, 2.
Biryukov, V. 2015. Five ways to protect your private photos. [Online] Available at:
https://www.kaspersky.com/blog/multi-factor-authentication/9669/ [Accessed 01 05 2018].
Biswas, D., Biswas, A. and Das, N. 2006. The differential effects of celebrity and expert endorsements on
consumer risk perceptions. The role of consumer knowledge, perceived congruency, and product technology
orientation. Journal of Advertising. 2006, Vol. 35, 2.

220 References
Blagov, E. and Bogolyubov, P. 2013. Corporate Web 2.0 systems adoption in Russian companies: testing the
UTAUT validity. In Proceedings of the International Conference on Innovation and Entrepreneurship. 2013.
Blalock, H. M. 1964. Causal Inferences in Nonexperimental Research. Chapel Hill : University of North
Carolina Press, 1964.
Bloch, P. H. and Richins, M. L. 1983. A theoretical model for the study of product importance perceptions. The
Journal of Marketing. 1983, Vol. 47, 3.
Blum, B. 2015. Are Your Wearables Safe from Cyber-Security Threats? [Online] 2015.
https://www.accenture.com/us-en/blogs/blogs-are-your-wearables-safe-from-cyber-security-threats.
Blythe, J. 2013. Principles and Practice of Marketing. 3rd. s.l. : Sage, 2013.
Bollen, K. A. and Pearl, J. 2013. Eight myths about causality and structural equation models. [ed.] S. L.
Morgan. Handbook of causal analysis for social research. s.l. : Springer, 2013, pp. 301-328.
Bollen, K. A. 2011. Evaluating effect, composite, and causal indicators in structural equation models. Mis
Quarterly. 2011, Vol. 35, 2.
Bollen, K. and Lennox, R. 1991. Conventional wisdom on measurement: A structural equation perspective.
Psychological bulletin. 1991, Vol. 110, 2.
Bonderud, D. 2014. Multifactor Authentication Market to Be Worth $10 Billion by 2017 — But Is the Model
All Wrong? Security Intelligence. [Online] IBM, 2014. https://securityintelligence.com/news/multifactor-
authentication-market-worth-10-billion-2017-model-wrong/.
Bonfiglio, A. and De Rossi, D. 2010. Wearable Monitoring Systems. s.l. : Springer Science & Business Media,
2010.
Boomsma, A. and Hoogland, J. J. 2001. The robustness of LISREL modeling revisited. Structural equation
models: Present and future. 2001.
Bosnjak, M., Galesic, M. and Tuten, T. 2007. Personality determinants of online shopping: Explaining online
purchase intentions using a hierarchical approach. Journal of Business Research. 2007, Vol. 60, 6.
Bothun, D., et al. 2014. The Wearable Future. [Online] pwc, 2014.
http://www.pwc.com/us/en/technology/publications/wearable-technology.html.
Bouchard, T. J. 1976. Unobtrusive measures an i nventory of uses. Sociological Methods & Research. 1976,
Vol. 4, 3.
Bowling, A. 2005. Mode of questionnaire administration can have serious effects on data quality. Journal of
public health. 2005, Vol. 27, 3.
Bradley, N. 2007. Marketing research. Tools & techniques. Oxford : Oxford University Press, 2007.
Brauer, C. and Barth, J. 2013. The Human Cloud: Wearable Technology from Novelty to Production.
Whitepaper. [Online] 2013. http://www.rackspace.co.uk/sites/default/files/whitepapers/The_Human_Cloud_-
_June_2013.pdf.
Breckler, S. J. and Wiggins, E. C. 1989. Affect versus evaluation in the structure of attitudes. Journal of
Experimental Social Psychology. 1989, Vol. 25.
Breckler, S. J. 1984. Empirical validation of affect, behavior, and cognition as distinct components of attitude.
Journal of personality and social psychology. 1984, Vol. 47, 6.
References 221
Breitinger, F. and Nickel, C. 2010. User Survey on Phone Security and Usage. In Proc. of the Int’l Conf. of the
Biometrics Special Interest Group (BIOSIG’10). 2010.
Briggs, B. 2014. Wearable Technology: Why We Should Look to Businesses to Show Us the Way. [Online]
2014. http://www.wired.com/2014/02/wearable-technology-look-businesses-show-us-way/.
Briggs, S. R. 1992. Assessing the Five‐Factor Model of Personality Description. Journal of Personality. 1992,
Vol. 60, 2.
Bristow, H. W., et al. 2004. Defining and evaluating context for wearable computing. International Journal of
Human-Computer Studies. 2004.
Broilo, P. L., Espartel, L. B. and Basso, K. 2016. Pre-purchase information search: too many sources to
choose. Journal of Research in Interactive Marketing. 2016, Vol. 10, 3.
Bruce, G. 1992. Comments. [book author] J. Svartvik. Directions in Corpus Linguistics: Proceedings of Nobel
Symposium 82, Stokholm, 4-8 August 1991. s.l. : Walter de Gruyter, 1992.
Bruno, T. 2015. Wearable Technology: Smart Watches to Google Glass for Libraries. s.l. : Rowman &
Littlefield, 2015.
Bryant, A. and Charmaz, K. 2010. The SAGE Handbook of Grounded Theory: Paperback Edition. s.l. : Sage,
2010.
Bryman, A. and Bell, E. 2015. Business Research Methods. Fourth. Oxford : Oxford University Press, 2015.
Bryman, A. 2006. Integrating quantitative and qualitative research: how is it done? Qualitative Research. 2006,
Vol. 6, 1.
BSI Group. 2013. Moving from ISO/IEC 27001:2005 to ISO/IEC 27001:2013. BSI UK. [Online] 2013.
http://www.bsigroup.com/LocalFiles/en-GB/iso-iec-27001/resources/BSI-ISO27001-transition-guide-UK-EN-
pdf.pdf.
Buabeng-Andoh, C. 2012. Factors influencing teachers' adoption and integration of information and
communication technology into teaching: A review of the literature. International Journal of Education and
Development using Information and Communication Technology. 2012, Vol. 8, 1.
Buchan, H. F. 2005. Ethical Decision Making in the Public Accounting Profession: An Extension of Ajzen’s
Theory of Planned Behavior. Journal of Business Ethics. 2005, Vol. 61.
Buenaflor, C. and Kim, H.-C. 2012. Wearable Computers in Human Perspective: The Decision Process of
Innovation Acceptance with User Issues and Concerns. International Journal of Emerging Technology and
Advanced Engineering. 2012.
Bullock, H. E., Harlow, L. L. and Mulaik, S. A. 1994. Causation issues in structural equation modeling
research. Structural Equation Modeling: A Multidisciplinary Journal. 1994, Vol. 1, 3.
Burns, A. C. and Bush, R. F. 2003. Marketing Research. 4. s.l. : Pearson Prentice Hall, 2003.
Burton, A. and Hubona, G. S. 2005. Individual differences and usage behavior: revisiting a technology
acceptance model assumption. ACM Sigmis Database. 2005, Vol. 36, 2.
Cacioppo, J. T., et al. 1996. Dispositional differences in cognitive motivation: The life and times of individuals
varying in need for cognition. Psychological bulletin. 1996, Vol. 119, 2.

222 References
Cacioppo, J. T., Petty, R. E. and Morris, K. J. 1983. Effects of Need of Cognition on Message Evaluation,
Recall, and Persuasion. Journal of personality and social psychology. 1983, Vol. 45, 4.
Canalys, 2018. Apple Watch unit shipments worldwide from 2015 to 2017, by model (in millions). [Online]
Available at: https://www.statista.com/statistics/805037/worldwide-apple-watch-shipments-by-model/ [Accessed
10 05 2018].
Caputi, P., Hunter, M. G. and Tan, F. B. 2009. Personal Construct Theory. [book auth.] Y. K. Dwivedi, S. L.
Schneberger and M. R. Wade. Handbook of Research on Contemporary Theoretical Models in Information
Systems. 2009.
Carnap, R. 1966. An introduction to the philosophy of science. New York : Basic Books, 1966.
—. 1945. The two concepts of probability: The problem of probability. Philosophy and phenomenological
research. 1945, Vol. 5, 4.
Castañeda, J. A., Muñoz-Leiva, F. and Luque, T. 2007. Web Acceptance Model (WAM): Moderating effects
of user experience. Information & Management. 2007, Vol. 44, 4.
Cenfetelli, R. T. and Bassellier, G. 2009. Interpretation of formative measurement in information systems
research. Mis Quarterly. 2009, Vol. 33, 4.
Chaiken, S., Pomerantz, E. M. and Giner-Sorolla, R. 2014. Structural Consistency and Attitude Strength.
[book author] R. E. Petty and J. A. Krosnick. Attitude Strength: Antecedents and Consequences. s.l. : Psychology
Press, 2014.
Chang, C. 2007. Diagnostic advertising content and individual differences: Testing a resource-matching
perspective with a Taiwanese sample. Journal of Advertising. 2007, Vol. 36, 3.
Chang, J. Y., et al. 2016. Surgical Vision: Google Glass and Surgery. Surgical Innovation. 2016, Vol. 23, 4.
Chang, S. E. and Ho, C. B. 2006. Organizational factors to the effectiveness of implementing information
security management. Industrial Management & Data Systems. 2006, Vol. 106, 3.
Chang, S.-J., van Witteloostuijn, A. and Eden, L. 2010. From the Editors: Common method variance in
international business research. Journal of International Business Studies. 2010, Vol. 41.
Chapman, B. P., et al. 2007. Gender Differences in Five Factor Model Personality Traits in an Elderly Cohort:
Extension of Robust and Surprising Findings to an Older Generation. Personality and Individual Differences.
2007, Vol. 43, 6.
Chatterjee, S., Heath, T. B. and Mishra, D. P. 2002. Communicating quality through signals and substantive
messages: the effects of supporting information and need for cognition. Advances in consumer research. 2002,
Vol. 29, 1.
Chatterjee, S., Kang, Y. S. and Mishra, D. P. 2005. Market signals and relative preference: the moderating
effects of conflicting information, decision focus, and need for cognition. Journal of Business Research. 2005,
Vol. 58, 10.
Chau, P. Y. and Hu, P. J. H. 2001. Information technology acceptance by individual professionals: A model
comparison approach. Decision sciences. 2001, Vol. 32, 4.
Chellappa, R. K. and Pavlou, P. A. 2002. Perceived information security, financial liability and consumer trust
in electronic commerce transactions. Logistics Information Management. 2002.
References 223
Chen, C.-H. and Mort, G. S. 2007. Consumers’ technology adoption behaviour: an alternative model. The
Marketing Review. 2007, Vol. 7, 4.
Chen, C.-W., Shen, C.-C. and Chiu, W.-Y. 2007. Marketing communication strategies in support of product
launch: An empirical study of Taiwanese high-tech firms. Industrial Marketing Management. 2007, Vol. 36.
Cheung, C. and Lee, M. K. O. 2001. Trust in Internet shopping: a proposed model and measurement
instrument. Proceedings of the 6th Americas Conference on Information Systems. 2001, S. 681–689.
Chi, H., Yeh, H. and Hung, W.-C. 2012. The Moderating Effect of Subjective Norm On Cloud Computing.
User's Perceived Risk and Usage Intention. International Journal of Marketing. 2012, Vol. 4, 6.
Chin, E., et al. 2012. Measuring user confidence in smartphone security and privacy. [ed.] ACM. In
Proceedings of the Eighth Symposium on Usable Privacy and Security. 2012, Vol. 1.
Chin, W. W. and Newsted, P. R. 1999. Structural equation modelling analysis with small samples using. [ed.]
R. H. Hoyle. Statistical strategies for small sample research. s.l. : Sage, 1999.
Chin, W. W. 1998b. Commentary: Issues and Opinion on Structural Equation Modeling. MIS Quarterly. 1998b,
Vol. 22, 1.
—. 2000. Frequently Asked Questions – Partial Least Squares & PLS-Graph. Home Page. [Online] 2000.
http://disc-nt.cba.uh.edu/chin/plsfaq.htm.
—. 2010. How to Write Up and Report PLS Analyses. Handbook of Partial Least Squares: Concepts, Methods
and Applications. s.l. : Springer Science & Business Media, 2010.
—. 1995. Partial least squares is to LISREL as principal components analysis is to common factor analysis.
Technology Studies. 1995, Vol. 2, 2.
—. 1998a. The partial least squares approach to structural equation modeling. Modern methods for business
research. 1998a, Vol. 295, 2.
Chin, W. W., Marcolin, B. L. and Newsted, P. R. 2003. A partial least squares latent variable modeling
approach for measuring interaction effects: Results from a Monte Carlo simulation study and an electronic-mail
emotion/adoption study. Information systems research. 2003, Vol. 14, 2.
Choi, J. and Geistfeld, L. V. 2004. A cross-cultural investigation of consumer e-shopping adoption. Journal of
Economic Psychology. 2004, Vol. 25, 6.
Choi, M. and Ruona, W. E. 2010. Individual readiness for organizational change and its implications for
human resource and organization development. Human Resource Development Review. 2010.
Chuah, S. H.-W., et al. 2016. Wearable technologies: The role of usefulness and visibility in smartwatch
adoption. Computers in Human Behavior. 2016, Vol. 65.
Chun, H., Lee, H. and Kim, D. 2012. The integrated model of smartphone adoption: Hedonic and utilitarian
value perceptions of smartphones among Korean college students. Cyberpsychology, Behavior, and Social
Networking. 2012, Vol. 15, 9.
Churchill, G. A. 1979. A paradigm for developing better measures of marketing constructs. Journal of
marketing research. 1979, Vol. XVI.
Churchill, G. A. and Iacobucci, D. 2010. Marketing research: methodological foundations. 10. s.l. : South-
Western Cengage Learning, 2010.
224 References
—. 2010. Marketing research: methodological foundations. 10. s.l. : South-Western Cengage Learning, 2010.
Claudy, M. C., Garcia, R. and O’Driscoll, A. 2014. Consumer resistance to innovation—a behavioral
reasoning perspective. Journal of the Academy of Marketing Science. 2014, Vol. 43.
Cochran, W. G. 1977. Sampling Techniques. 3. s.l. : John Wiley & Sons, 1977.
Cohen, J. 1988. Statistical Power Analysis for the Behavioral Sciences. 2nd. s.l. : Taylor & Francis Inc., 1988.
Colobran, M. 2016. Modeling human perceived security: A conceptual framework and its application to health.
Computers in Human Behavior. 2016, Vol. 62.
Coltman, T., et al. 2008. Formative versus reflective measurement models: Two applications of formative
measurement. Journal of Business Research. 2008, Vol. 61, 12.
Compeau, D. R. and Higgins, C. A. 1995. Application of social cognitive theory to training for computer skills.
Information systems research. 1995, Vol. 6, 2.
Conger, Anthony J. 1974. A Revised Definition for Suppressor Variables: a Guide To Their Identification and
Interpretation. Educational and Psychological Measurement. 1, 1974, Vol. 34.
Conner, M. and Sparks, P. 1996. The theory of planned behaviour and health behaviours. s.l. : Open
University Press, 1996.
Cook, D. J. and Song, W. Z. 2009. Ambient Intelligence and Wearable Computing: Sensors on the Body, in the
Home, and Beyond. Journal of Ambient Intelligence and Smart Environments. 2, 2009, Vol. 1.
Corbin, J. M. and Strauss, A. 1990. Grounded theory research: Procedures, canons, and evaluative criteria.
Qualitative sociology. 1990, Vol. 13, 1.
Costa, P. T. and McCrae, R. R. 1992. Revised NEO Personality Inventory (NEO PI-R) and NEO Five-Factor
Inventory (NEO-FFI) professional manual. Odessa, FL : Psychological Assessment Resources, 1992.
—. 1995. Domains and facets: Hierarchical personality assessment using the Revised NEO Personality
Inventory. Journal of personality assessment. 1995, Vol. 64, 1.
Couper, M. P. 2000. Review: Web surveys: A review of issues and approaches. The Public Opinion Quarterly.
2000, Vol. 64, 4.
Coyne, I. T. 1997. Sampling in qualitative research. Purposeful and theoretical sampling; merging or clear
boundaries? Journal of Advanced Nursing. 1997, Vol. 26, 1.
Craig, B. M., et al. 2013. Comparison of US Panel Vendors for Online Surveys. National Center for
Biotechnology Information, U.S. National Library of Medicine. [Online] 2013.
http://www.ncbi.nlm.nih.gov/pmc/articles/PMC3869084/.
Credé, M., et al. 2012. An evaluation of the consequences of using short measures of the Big Five personality
traits. Journal of personality and social psychology. 2012, Vol. 102, 4.
Creswell, J. W. & Creswell, J. D. 2018. Research Design: Qualitative, Quantitative, and Mixed Methods
Approaches. 5th ed. s.l.:SAGE Publications.
Creswell, J. W. 2013. Research Design: Qualitative, Quantitative, and Mixed Methods Approaches. s.l. : Sage
Publications, 2013.
Creswell, J. W. and Miller, D. L. 2000. Determining Validity in Qualitative Inquiry. Theory into practice.
2000, Vol. 39, 3.
References 225
Crites, S., Petty, R. E. and Fabrigar, L. R. 1994. Measuring the affective and cognitive properties of attitudes:
Conceptual and methodological issues. Personality and Social Psychology Bulletin. 1994, Vol. 20, 6.
Cronbach, L. J. 1951. Coefficient alpha and the internal structure of tests. Psychometrika. 1951, Vol. 16, 3.
Cross, A. 2015. Wearable Tech Takes on the Enterprise. Wearable Technologies. [Online] Wearable
Technologies AG, 2015. https://www.wearable-technologies.com/2015/07/wearable-tech-takes-on-the-
enterprise/.
Cui, Y., et al. 2013. A Survey of Energy Efficient Wireless Transmission and Modeling in Mobile Cloud
Computing. Mobile Networks and Applications. 2013.
Cunningham, L. F., et al. 2005. Perceived risk and the consumer buying process: internet airline reservations.
International Journal of Service Industry Management. 2005, Vol. 16, 4.
Cunningham, S. M. 1967. Risk taking and information handling in consumer behavior. Boston : Harvard
Univ. : In: COX, D. F., Risk Taking and Information Handling in Consumer Behavior, 1967.
Currall, S. C. & Judge, T. A., 1995. Measuring trust between organizational boundary role persons.
Organizational behavior and Human Decision processes, 64(2).
Curry, D. 2015. Apple Watch hits 10,000 apps: How do Android Wear, Pebble, and Samsung compare? Digital
Trends. [Online] 2015. [Cited: 02 06 2017.] https://www.digitaltrends.com/wearables/apple-watch-apps-
comparison/.
Curtis, R. G., Windsor, T. D. and Soubelet, A. 2015. The relationship between Big-5 personality traits and
cognitive ability in older adults–a review. Aging, Neuropsychology, and Cognition. 2015, Vol. 22, 1.
Cziko, G. A. 1989. Unpredictability and Indeterminism in Human Behavior: Arguments and Implications for
Educational Research. Educational Researcher. 1989, Vol. 18, 3.
Dahad, N. 2016. Wearable technology will be the heart of pervasive computing of the future. [Online] 2016.
[Cited: 30 5 2017.] http://www.thenextsiliconvalley.com/2016/04/01/6010-wearable-technology-will-be-the-
heart-of-pervasive-computing-of-the-future/.
Dalsgaard, C. and Sterrett, R. 2014. White paper on smart textile garments and devices: a market overview of
smart textile wearable technologies. Ohmatex ApS. 2014.
Daly, K. J. 2007. Qualitative Methods for Family Studies and Human Development. s.l. : Sage Publications,
2007.
Dasgupta, P. 1990. Trust as A Commodity. Oxford : Basil Blackwell, 1990.
Dash, J. F., Schiffman, L. G. and Berenson, C. 1976. Risk-and personality-related dimensions of store choice.
The Journal of Marketing. 1976, Vol. 40, 1.
Davis, F. D. 1985. A Technology Acceptance Model for Empirically Testing New End-user. Massachusetts :
Wayne State University, 1985.
—. 1993. User acceptance of information technology: system characteristics, user perceptions and behavioral
impacts. International journal of man-machine studies. 1993, Vol. 38.
Davis, F. D., Bagozzi, R. P. and Warshaw, P. R. 1989. User acceptance of computer technology: a comparison
of two theoretical models. Management science. 1989, Vol. 35, 8.
226 References
Davis, K. and Runyan, R. C. 2016. Personality Traits and Financial Satisfaction: Investigation of a Hierarchical
Approach. Journal of Financial Counseling and Planning. 2016, Vol. 27, 1.
de Ruyter, K. and Scholl, N. 1998. Positioning qualitative market research: reflections from theory and
practice. Qualitative market research: An international journal. 1998, Vol. 1, 1.
de Vaus, D. A. 2005. Research Design in Social Research. s.l. : Sage Publications, 2005.
Debevec, K., Meyers, P. W. and Chan, K. K. 1985. The Effects of Knowledge and Imagery on Advertising
Responses to an Innovation. Advances in Consumer Research. 1985, Vol. 12.
Dediu, H. 2013. The diffusion of iPhones as a learning process. Asymco.com. [Online] 2013. [Cited: 30 5 2017.]
https://sternspeakers.com/speakers/horace-dediu/.
Deepti, M., Ibrahim, A. and Alok, M. 2014. Theory of Reasoned Action application for Green Information
Technology. Computers in Human Behavior. 2014, Vol. 36.
Dekimpe, M. G., Parker, P. M. and Sarvary, M. 2000. “Globalization”: modeling technology adoption timing
across countries. Technological Forecasting and Social Change. 2000, Vol. 63, 1.
DeLuca, D., Gallivan, M. J. and Kock, N. 2008. Furthering Information Systems Action Research: A Post-
Positivist Synthesis of Four Dialectics. Journal of the Association for Information Systems. 2008, Vol. 9, 2.
Denzin, N. K. 1978. The research act: A theoretical introduction to sociological methods. New York : Praeger,
1978.
Deshpande, R. 1983. Paradigms Lost: on theory and method in research in marketing. The Journal of
Marketing. 1983, Vol. 47, 4.
DeSimone, J. A., Harms, P. D. and DeSimone, A. J. 2015. Best practice recommendations for data screening.
Journal of Organizational Behavior. 2015, Vol. 36, 2.
Devaraj, S., Easley, R. F. and Crant, J. M. 2008. Research note-how does personality matter? Relating the
five-factor model to technology acceptance and use. Information Systems Research. 2008, Vol. 19, 1.
Diamantopoulos, A. and Siguaw, J. A. 2006. Formative versus reflective indicators in organizational measure
development: A comparison and empirical illustration. British Journal of Management. 2006, Vol. 17, 4.
Diamantopoulos, A. 2006. The error term in formative measurement models: interpretation and modeling
implications. Journal of Modelling in Management. 2006, Vol. 1, 1.
Diamantopoulos, A. and Winklhofer, H. M:. 2001. Index construction with formative indicators: An
alternative to scale development. Journal of Marketing Research. 2001, Vol. 38, 2.
Diamantopoulos, A., Riefler, P. and Roth, K. P. 2008. Advancing formative measurement models. Journal of
business research. 2008, Vol. 61, 12.
Dierks, L. H. 2005. Trust as a Determinant of Consumer Behaviour Under Uncertainty: An Empirical Analysis
of Consumers' Reactions to a Random External Shock in Europe. s.l. : Cuvillier, 2005.
Dijkstra, T. K. and Henseler, J. 2015a. Consistent and asymptotically normal PLS estimators for linear
structural equations. Computational Statistics and Data Analysis. 2015a, Vol. 81.
Dillon, T. W. and Lending, D. 2010. Will They Adopt? Effects of Privacy and Accuracy. Journal of Computer
Information Systems. 2010, Vol. 50, 4.
References 227
DiSogra, C. and Callegaro, M. 2015. Metrics and Design Tool for Building and Evaluating Probability-Based
Online Panels. Social Science Computer Review. 2015.
Dolan, B. 2013. Frothy times for Google Glass in healthcare. [Online] 2013.
http://mobihealthnews.com/24364/frothy-times-for-google-glass-in-healthcare/.
Donavan, D. T., Carlson, B. D. and Zimmerman, M. 2005. The influence of personality traits on sports fan
identification. Sport Marketing Quarterly. 2005, Vol. 14, 1.
Donohew, L., Palmgreen, P. and Rayburn, J. D. 1987. Social and psychological origins of media use: A
lifestyle analysis. Journal Of Broadcasting & Electronic Media. 1987, Vol. 31, 3.
Doole, I. and Lowe, R. 1997. International Marketing Strategy: Contemporary Readings. s.l. : Cengage
Learning, 1997.
Dudenhoeffer, C. 2014. The Existing Wearable Technology Landscape. Wearable World Inc. [Online] 2014.
http://wearableworldnews.com/2014/05/06/wearable-world-taxonomy/.
Due, B. L. 2014. The future of smart glasses:: An essay about challenges and possibilities with smart glasses.
Working papers on interaction and communication. 2, 2014, Vol. 1.
Dunne, L. E. and Smyth, B. 2007. Psychophysical elements of wearability. Proceedings of the SIGCHI
conference on Human factors in computing systems. 2007.
E Ink Holdings Inc. 2012. Ink Technology - Electrophoretic Ink explained. [Online] 2012.
http://www.eink.com/technology.html.
Easterby-Smith, M., Thorpe, R. and Jackson, P. R. 2008. Management Research. Los Angeles : Sage Pub.,
2008.
Eberl, M. 2010. An Application of PLS in Multi-Group Analysis: The Need for Differentiated Corporate-Level
Marketing in the Mobile Communications Industry. Handbook of Partial Least Squares: Concepts, Methods and
Applications. s.l. : Springer Science & Business Media, 2010.
Edwards, J. R. and Bagozzi, R. P. 2000. On the nature and direction of relationships between constructs and
measures. 2000, Vol. 5, 2.
Efron, B. and Gong, G. 1983. A leisurely look at the bootstrap, the jackknife, and cross-validation. The
American Statistician. 1983, Vol. 37, 1.
Egger, F.N. and Abrazhevich, D. 2001. Security & Trust: Taking Care of the Human Factor. [Online] 2001.
http://www.telono.com/fr/nos-articles/security-trust-taking-care-of-the-human-factor/.
Elgan, M. 2016. Why wearables will replace your smartphone. [Online] 2016. [Cited: 02 06 2017.]
http://www.computerworld.com/article/3090559/wearables/why-wearables-will-replace-your-smartphone.html.
eMarketer Inc. 2015. Putting Smart Watch Adoption in Perspective. [Online] 2015. [Cited: 30 5 2017.]
https://www.emarketer.com/Article/Putting-Smart-Watch-Adoption-Perspective/1012595.
Englert, R. and Muschiol, J. 2016. An Extendible Communication as a Service Platform for Wearables and
Future-Oriented Devices. [ed.] H. C. Mayr and M. Pinzger. Informatik. 2016.
Ericsson Consumerlab. 2016. Wearable Technology and the Internet of Things. Consumer views on wearables
beyond health and wellness. [Online] 2016. [Cited: 04 06 2017.]
https://www.ericsson.com/res/docs/2016/consumerlab/wearable-technology-and-the-internet-of-things-ericsson-
consumerLab-2016.pdf.
228 References
European Commission. 2016. Smart Wearables: Reflection and Orientation Paper. Brussels : s.n., 2016.
Evans, J. R. and Mathur, A. 2005. The value of online surveys. Internet research. 2005, Vol. 15, 2.
Fabrigar, L. R., MacDonald, T. K. and Wegener, D. T. 2014. The Handbook of Attitudes. s.l. : Psychology
Press, 2014.
Fain, D. and Roberts, M. L. 1997. Technology vs. consumer behavior: The battle for the financial services
customer. Journal of Interactive Marketing. 1997, Vol. 11, 1.
Falk, R. F. and Miller, N. B. 1992. A Primer for Soft Modeling. s.l. : University of Akron Press, 1992.
Fazio, R. H. 2007. Attitudes as object-evaluation associations of varying strength. Social Cognition. 2007, Vol.
25, 5.
Fazio, R. H. and Zanna, M. P. 1978. Attitudinal qualities relating to the strength of the attitude-behavior
relationship. Journal of Experimental Social Psychology. 1978, Vol. 14, 4.
Fazio, R. H., et al. 1982. Attitude accessibility, attitude-behavior consistency, and the strength of the object-
evaluation association. Journal of experimental social psychology. 1982, Vol. 18, 4.
Featherman, M. S. and Pavlou, P. A. 2003. Predicting e-services adoption: a perceived risk facets perspective.
International journal of human-computer studies. 2003, Vol. 59, 4.
Featherman, M. S., Miyazaki, A. D. and Sprott, D. E. 2010. Reducing online privacy risk to facilitate e‐
service adoption: the influence of perceived ease of use and corporate credibility. Journal of Services Marketing.
2010, Vol. 24, 3.
Fedosov, A., et al. 2016. Design and evaluation of a wearable AR system for sharing personalized content on ski
resort maps. Proceedings of the 15th International Conference on Mobile and Ubiquitous Multimedia. s.l. :
ACM, 2016.
Fenn, J. and LeHong, H. 2011. Hype cycle for emerging technologies. [Online] 2011.
http://isites.harvard.edu/fs/docs/icb.topic1360759.files/hype_cycle_for_emerging_tech_215650.pdf.
Fernando, N., Loke, S. W. and Rahayu, W. 2013. Mobile cloud computing: A survey. Future Generation
Computer Systems. 2013.
Festinger, L. 1962. A Theory of Cognitive Dissonance. s.l. : Stanford University Press, 1962.
FHI. 2016. The history of wearables. The Future Health Index. [Online] 2016.
https://www.futurehealthindex.com/2016/09/29/infographic-history-wearables/.
Fichman, R. G. 1992. Information technology diffusion: a review of empirical research. ICIS. 1992.
Field, A. 2009. Discovering statistics using IBM SPSS statistics. 3rd. s.l. : Sage, 2009.
Finch, J. F., West, S. G. and MacKinnon, D. P. 1997. Effects of sample size and nonnormality on the
estimation of mediated effects in latent variable models. Structural Equation Modeling: A Multidisciplinary
Journal. 1997, Vol. 4, 2.
Finstad, K. 2010. Response interpolation and scale sensitivity: Evidence against 5-point scales. Journal of
Usability Studies. 2010, Vol. 5, 3.
Fischer, F. M. 2010. The Application of the Controllability Principle and Managers’ Responses: A Role Theory
Perspective. s.l. : Gabler Research, 2010.

References 229
Fishbein, M. 1967. A consideration of beliefs, and their role in attitude measurement. Readings in attitude
theory and measurement. New York : John Wiley & Sons, Inc., 1967.
—. 2008. A Reasoned Action Approach to Health Promotion. Medical Decision Making. 2008, Vol. 28, 6.
Fishbein, M. and Ajzen, I. 1975. Belief, attitude, intention, and behavior: an introduction to theory and
research. s.l. : Addison-Wesley Pub. Co., 1975.
Fisher, J. E., Till, B. D. and Stanley, S. M. 2010. Signaling trust in print advertisements: An empirical
investigation. Journal of Marketing Communications. 2010, Vol. 16, 3.
Fiske, S. T., Gilbert, D. T. and Lindzey, G. 2010. Handbook of Social Psychology. 1st. s.l. : John Wiley &
Sons, 2010.
Flavián, C. and Guinalíu, M. 2006. Consumer trust, perceived security and privacy policy. Industrial
Management & Data Systems. 2006, Vol. 106, 5.
Fleischhauer, M., et al. 2010. Same or different? Clarifying the relationship of need for cognition to personality
and intelligence. Personality and Social Psychology Bulletin. 2010, Vol. 36, 1.
Flick, U. 2009. An introduction to qualitative research. 4. s.l. : Sage, 2009.
Flynn, L. R., Goldsmith, R. E. and Pollitte, W. 2016. Psychology & Marketing. Materialism, Status
Consumption, and Market Involved Consumers. 2016, Vol. 33, 9.
Forman, J. and Damschroder, L. 2008. Qualitative content analysis. Empirical Research for Bioethics: A
Primer. 2008, Vol. 11, 1.
Fornell, C. and Bookstein, F. L. 1982. Two structural equation models: LISREL and PLS applied to consumer
exit-voice theory. Journal of Marketing research. 1982, Vol. XIX.
Fornell, C. and Larcker, D. F. 1981. Evaluating structural equation models with unobservable variables and
measurement error. Journal of marketing research. 1981, Vol. 18, 1.
Fortier, A. and Burkell, J. 2014. Influence of need for cognition and need for cognitive closure on three
information behavior orientations. Proceedings of the American Society for Information Science and
Technology. 2014, Vol. 51, 1.
Founier, S. and Richins, M. L. 1991. Some theoretical and popular notions concerning materialism. Journal of
Social Behavior and Personality. 1991, Vol. 6, 6.
Foxall, G. 2014. Strategic Marketing Management (RLE Marketing). s.l. : Routledge, 2014.
Fraß, A. 2016. Achieving Brand Loyalty in China through After-Sales Services: With a Particular Focus on the
Influences of Cultural Determinants. Hamburg, Germany : Springer, 2016.
Frazier, P. A., Tix, A. P. and Barron, K. E. 2004. Testing moderator and mediator effects in counseling
psychology research. Journal of counseling psychology. 2004, Vol. 51, 1.
Friedman, A. 2015. Statistics for Library and Information Services: A Primer for Using Open Source R
Software for Accessibility and Visualization. s.l. : Rowman & Littlefield, 2015.
Gao, L. and Bai, X. 2014. A unified perspective on the factors influencing consumer acceptance of internet of
things technology. Asia Pacific Journal of Marketing and Logistics. 2014, Vol. 26, 2.
Gardner, K. W., et al. 1998. Cognitive Patterns: Problem-Solving Frameworks for Object Technology.
Cambridge University Press : SIGS, 1998.
230 References
Garg, R., Smith, M. D. and Telang, R. 2011. Measuring information diffusion in an online community.
Journal of Management Information Systems. 2011, Vol. 28, 2.
Gartner, Inc. 2012. Gartner Reveals Top Predictions for IT Organizations and Users for 2013 and Beyond.
[Online] 2012. http://www.gartner.com/newsroom/id/2211115.
—. 2013b. Gartner Says Silver Surfers Represent a More Important Technology Market than Generations X and
Y. [Online] 2013b. http://www.gartner.com/newsroom/id/2615818.
—. 2013a. Gartner Says Smartglasses Will Bring Innovation to Workplace Efficiency. [Online] 2013a.
http://www.gartner.com/newsroom/id/2618415.
—. 2016. Gartner Survey Shows Wearable Devices Need to Be More Useful. Newsroom. [Online] 2016.
http://www.gartner.com/newsroom/id/3537117.
Gediehn, O. 2010. Management Accounting Practice and Strategic Behavior. s.l. : Gabler, 2010.
Gefen, D. and Straub, D. 2005. A practical guide to factorial validity using PLS-Graph: Tutorial and annotated
example. Communications of the Association for Information systems. 2005, Vol. 16, 1.
Gefen, D. 2003. Assessing unidimensionality through LISREL: An explanation and an example.
Communications of the Association for Information Systems. 2003, Vol. 12, 1.
—. 2004. What makes an ERP implementation relationship worthwhile: Linking trust mechanisms and ERP
usefulness. Journal of Management Information Systems. 2004, Vol. 21, 1.
Gefen, D., Benbasat, I. and Pavlou, P. 2008. A research agenda for trust in online environments. Journal of
Management Information Systems. 2008, Vol. 24, 4.
Gefen, D., Karahanna, E. and Straub, D. W. 2003b. Inexperience and experience with online stores: The
importance of TAM and trust. IEEE Transactions on Engineering Management. 2003b, Vol. 50, 3.
—. 2003a. Trust and TAM in online shopping: an integrated model. MIS quarterly. 2003a, Vol. 27, 1.
Gefen, D., Straub, D. and Boudreau, M. C. 2000. Structural equation modeling and regression: Guidelines for
research practice. Communications of the association for information systems. 2000, Vol. 4, 1.
Gerbing, D. W. and Anderson, J. C. 1988. An updated paradigm for scale development incorporating
unidimensionality and its assessment. Journal of marketing research. 1988, Vol. 25.
getpebble.com. 2017. apps.getpebble.com. [Online] 2017. [Cited: 17. 07 2017.]
https://apps.getpebble.com/en_US/watchapps.
GfK. 2017. Tech Trends 2017 - Wearables. [Online] 2017. [Cited: 05 06 2017.]
http://www.gfk.com/de/insights/infographic/tech-trends-2017-wearables/.
Glanz, K., Rimer, B. K. and Viswanath, K. 2008. Health Behavior and Health Education: Theory, Research,
and Practice. s.l. : John Wiley & Sons, 2008.
Glaser, B. G. and Holton, J. 2004. Remodeling Grounded Theory. Forum: Qualitative Social Research.
[Online] 2004. http://www.qualitative-research.net/index.php/fqs/article/view/607/1315Volume.
Glaser, B. G. and Strauss, A. L. 2009. The Discovery of Grounded Theory: Strategies for Qualitative
Research. s.l. : Transaction Publishers, 2009.
Glasman, L. R. and Albarracín, D. 2006. Forming Attitudes That Predict Future Behavior: A Meta-Analysis of
the Attitude–Behavior Relation. Psychological Bulletin. 2006, Vol. 132.
References 231
Godwin, J. U. 2001. Privacy and security concerns as major barriers for e-commerce: a survey study.
Information Management & Computer Security. 2001, Vol. 9, 4.
Golafshani, N. 2003. Understanding reliability and validity in qualitative research. The qualitative report. 2003,
Vol. 8, 4.
Goldberg, L. R. 1999. A broad-bandwidth, public domain, personality inventory measuring the lower-level
facets of several five-factor models. Personality psychology in Europe. 1999, Vol. 7, 1.
Goldberg, R. and Hall, T. 2016. New Insights into the Emerging Internet of Things. National
Telecommunications and Information Administration. [Online] NTIA, 2016.
https://www.ntia.doc.gov/blog/2016/new-insights-emerging-internet-things.
Golder, P. N. and Tellis, G. J. 1998. Beyond Diffusion: An Affordability Model of the Growth of New
Consumer Durables. Journal of Forecasting. 1998, Vol. 17.
—. 2004. Growing, growing, gone: Cascades, diffusion, and turning points in the product life cycle. Marketing
Science. 2004, Vol. 23, 2.
Goldman, J. and Falcone, F. 2016. Virtual reality doesn't mean what you think it means. [Online] 2016. [Cited:
03 06 2017.] https://www.cnet.com/news/virtual-reality-terminology-vr-vs-ar-vs-360-video/.
González, Z. D. 2017. Latest Forecasts on Wearables. Wearable Technologies. [Online] 2017. [Cited: 10 06,
2017.] https://www.wearable-technologies.com/2017/04/latest-forecasts-on-wearables/.
Goodhue, D. L., Lewis, W. and Thompson, R. 2012. Does PLS have advantages for small sample size or non-
normal data? Mis Quarterly. 2012, Vol. 36, 3.
Goodwin, N. R. 1996. Economic meanings of trust and responsibility. s.l. : The University of Michigan Press,
1996.
Goodwin, N., et al. 2015. Principles of Economics in Context. s.l. : Routledge, 2015.
Górnik-Durose, M. E. and Pilch, I. 2016. The dual nature of materialism. How personality shapes materialistic
value orientation. Journal of Economic Psychology. 2016, Vol. 57.
Gosling, S. D., Rentfrow, P. J. and Swann, W. B. 2003. A very brief measure of the Big-Five personality
domains. Journal of Research in personality. Journal of Research in personality. 2003, Vol. 37, 6.
Götz, O., Liehr-Gobbers, K. and Krafft, M. 2010. Evaluation of Structural Equation Models Using the Partial
Least Squares (PLS) Approach. Handbook of Partial Least Squares: Concepts, Methods and Applications. s.l. :
Springer Science & Business Media, 2010.
Grand View Research, Inc. 2016. Wearable Technology Market Worth $196.5 Billion By 2022. [Online] 2016.
[Cited: 28 5 2017.] http://www.grandviewresearch.com/press-release/global-wearable-technology-market.
Graziano, D. and Stein, S. 2016. Wearable tech at CES 2016 was all about one thing: fitness. [Online] CBS
Interactive Inc., 2016. https://www.cnet.com/news/wearable-tech-at-ces-2016-was-all-about-one-thing-fitness/.
Greenberg, L. S., Greenberg, J. and Brehm, J. 1995. Trivialization: the forgotten mode of dissonance
reduction. Journal of personality and social psychology. 1995, Vol. 68, 2.
Groopman, J. 2014. Four Big Barriers To Mass Adoption Of Wearables. [Online] 2014.
http://wearableworldnews.com/2014/03/25/four-big-barriers-mass-adoption-wearables/.

232 References
Gross, P. 2014. Growing Brands Through Sponsorship: An Empirical Investigation of Brand Image Transfer in
a Sponsorship Alliance. Hanover : Springer, 2014.
Groves, R. M., et al. 2009. Survey Methodology. s.l. : John Wiley & Sons, 2009.
Gu, B., Park, J. and Konana, P. 2012. The Impact of External Word-of-Mouth Sources on Retailer Sales of
High-Involvement Products. Information Systems Research. 2012, Vol. 23, 1.
Guba, E. G. and Lincoln, Y. S. 1994. Competing paradigms in qualitative research. [book auth.] N. K. Denzin
and Y. S. Lincoln. Handbook of qualitative research. 2. 1994.
Ha, H.-Y. 2004. Factors influencing consumer perceptions of brand trust online. Journal of Product & Brand
Management. 2004, Vol. 13, 5.
—. 2002. The Effects of Consumer Risk Perception on Pre-purchase Information in Online Auctions: Brand,
Word-of-Mouth, and Customized Information. [Online] 2002. http://onlinelibrary.wiley.com/doi/10.1111/j.1083-
6101.2002.tb00160.x/full#.
Ha, S. and Stoel, L. 2009. Consumer e-shopping acceptance: Antecedents in a technology acceptance model.
Journal of Business Research. 2009, Vol. 62, 5.
Haenlein, M. and Kaplan, A. M. 2004. A beginner's guide to partial least squares analysis. Understanding
statistics. 2004, Vol. 3, 4.
Hahn, E., Gottschling, J. and Spinath, F. M. 2012. Short measurements of personality–Validity and reliability
of the GSOEP Big Five Inventory (BFI-S). Journal of Research in Personality. 2012, Vol. 46, 3.
Hair, J. F., Babin, B. J. and Anderson, R. E. 2010. Multivariate Data Analysis. 7th. s.l. : Pearson Prentice
Hall, 2010.
Hair, J. F., Bush, R. P. and Ortinau, D. J. 2003. Marketing Research. 2nd. New York : McGraw-Hill/Irwin,
2003.
Hair, J. F., et al. 2016. A Primer on Partial Least Squares Structural Equation Modeling. 2nd. s.l. : Thousand
Oaks: Sage, 2016.
Hair, J. F., et al. 2017. Advanced Issues in Partial Least Squares Structural Equation Modeling. s.l. : SAGE
Publications, 2017.
Hair, J. F., Ringle, C. M. and Sarstedt, M. 2013. Editorial Partial Least Squares Structural Equation Modeling:
Rigorous Applications, Better Results and Higher Acceptance. Long Range Planning. 2013, Vol. 46.
—. 2011. PLS-SEM: Indeed a silver bullet. Journal of Marketing theory and Practice. 2011, Vol. 19, 2.
Hamari, J. and Koivisto, J. 2013. Social Motivations To Use Gamification: An Empirical Study Of Gamifying
Exercise. Utrecht : In Proceedings of the 21st European Conference on , 2013.
Hännikäinen, J. 2006. Electronic intelligence development for wearable applications. Tampere University of
Technology : s.n., 2006. Vol. Publication 630.
Hansen, K. M. and Pedersen, R. T. 2012. Efficiency of Different Recruitment Strategies for Web Panels.
International Journal of Public Opinion Research. 2012, Vol. 24, 2.
Hanson, C., et al. 2011. Use and acceptance of social media among health educators. American Journal of
Health Education. 2011, Vol. 42, 4.
Hanuska, A., et al. 2016. Smart Clothing Market Analysis. Berkeley : University of California, 2016.

References 233
Hao, Y. and Helo, P. 2017. The role of wearable devices in meeting the needs of cloud manufacturing: A case
study. Robotics and Computer-Integrated Manufacturing. 2017, Vol. 45.
Harakeh, Z., et al. 2004. Parental factors and adolescents’ smoking behavior: an extension of The theory of
planned behavior. Preventive Medicine. 2004, Vol. 39.
Harris, M. M. 2012. Handbook of Research in International Human Resource Management. s.l. : Psychology
Press, 2012.
Hartono, E., et al. 2014. Measuring perceived security in B2C electronic commerce website usage: A
respecification and validation. Decision Support Systems. 2014, Vol. 62.
Haugtvedt, C. P., Petty, R. E. and Cacioppo, J. T. 1992. Need for cognition and advertising: Understanding
the role of personality variables in consumer behavior. Journal of Consumer Psychology. 1992, Vol. 1, 3.
Hausman, S. 2013. Wearable technology: Security’s next dilemma? [Online] 2013.
http://www.securityinfowatch.com/article/11275419/wearable-technology-presents-potential-benefits-and-
challenges-to-security?page=2.
Havitz, M. E. and Howard, D. R. 1995. How enduring is enduring involvement? A seasonal examination of
three recreational activities. Journal of Consumer Psychology. 1995, Vol. 4, 3.
Healy, M. and Perry, C. 2000. Comprehensive criteria to judge validity and reliability of qualitative research
within the. Qualitative Market Research: An International Journal. 2000, Vol. 3, 3.
Hein, D. W. and Rauschnabel, P. A. 2016. Augmented reality smart glasses and knowledge management: A
conceptual framework for enterprise social networks. Enterprise Social Networks. Wiesbaden : Springer
Fachmedien, 2016.
Heinecke, P. 2010. Success Factors of Regional Strategies for Multinational Corporations. Heidelberg :
Physica, 2010.
Henseler, J. and Fassott, G. 2010. Testing Moderating Effects in PLS Path Models: An Illustration of
Available Procedures. Handbook of Partial Least Squares: Concepts, Methods and Applications: Concepts,
Methods and Applications. s.l. : Springer Science & Business Media, 2010.
Henseler, J. 2016. Guest editorial special issue on using partial least squares (PLS) in industrial management.
Industrial management & data systems. 2016, Vol. 116, 9.
—. 2010. On the convergence of the partial least squares path modeling algorithm. Computational statistics.
2010, Vol. 25, 1.
—. 2012. PLS-MGA: A non-parametric approach to partial least squares-based multi-group analysis. Challenges
at the interface of data analysis, computer science, and optimization. s.l. : Springer Berlin Heidelberg, 2012.
Henseler, J. and Chin, W. W. 2010. A comparison of approaches for the analysis of interaction effects between
latent variables using partial least squares path modeling. Structural Equation Modeling. 2010, Vol. 17, 1.
Henseler, J., et al. 2014. Common beliefs and reality about PLS comments on Rönkkö and Evermann (2013).
Organizational Research Methods. 2014, Vol. 17, 2.
Henseler, J., Hubona, G. and Ray, P. A. 2016. Using PLS Path Modeling in New Technology Research:
Updated Guidelines. Industrial Management & Data Systems. 2016, Vol. 116, 1.
Henseler, J., Ringle, C. M. and Sarstedt, M. 2015. A new criterion for assessing discriminant validity in
variance-based structural equation modeling. Journal of the Academy of Marketing Science. 2015, Vol. 43, 1.
234 References
Henseler, J., Ringle, C. M. and Sinkovics, R. R. 2009. The use of partial least squares path modeling in
international marketing. Advances in international marketing. 2009, Vol. 20, 1.
Hernandez, B., Jimenez, J. and José Martín, M. 2009. Adoption vs acceptance of e-commerce: two different
decisions. European Journal of Marketing. 2009, Vol. 43, 9/10.
Herrmann, A., et al. 2002. Capturing customer heterogeneity using a finite mixture PLS approach.
Schmalenbach Business Review. 2002, Vol. 54.
Herzog, O. and Witt, H. 2009. User Interfaces for Wearable Computers: Development and Evaluation. s.l. :
Springer, 2009.
Hewstone, M. and Young, L. 1988. Expectancy-Value Models of Attitude: Measurement and Combination of
Evaluations and Beliefs. Journal of Applied Psychology. 1988, Vol. 18.
Hill, B. D., et al. 2016. The interaction of ability and motivation: Average working memory is required for Need
for Cognition to positively benefit intelligence and the effect increases with ability. Personality and Individual
Differences. 2016, Vol. 98.
Hirschman, E. C. 1980. Innovativeness, novelty seeking, and consumer creativity. Journal of consumer
research. 1980, Vol. 7, 3.
Hoff, P. H. 2012. Greentech Innovation and Diffusion. A Financial Economics and Firm-Level Perspective. 1.
St. Gallen : Gabler Researcch, 2012.
Holden, R. J. and Karsh, B. T. 2010. The technology acceptance model: its past and its future in health care.
Journal of biomedical informatics. 2010, Vol. 43, 1.
Holliday, A. 2008. Doing and Writing Qualitative Research. 2nd. s.l. : Sage, 2008.
Hong, I. B. 2015. Understanding the consumer's online merchant selection process: The roles of product
involvement, perceived risk, and trust expectation. International Journal of Information Management. 2015,
Vol. 35, 3.
Hong, J. I. and Landay, J. A. 2004. An architecture for privacy-sensitive ubiquitous computing. Proceedings of
the 2nd international conference on Mobile systems, applications, and services. 2004.
Hossain, M. A. 2014. Radio frequency identification (RFID) adoption: a cross-sectional comparison of
voluntary and mandatory contexts. Information Systems Frontiers. 2014.
Hosseini, M. H., Delaviz, M., Derakhshide, H. & Delaviz, M., 2016. Factors affecting consumer resistance to
innovation in mobile phone industry. International Journal of Asian Social Science, 6(9)
Hox, J. J. 1997. From theoretical concept to survey question. [ed.] L. Lyberg, et al. Survey Measurement and
Process Quality. New York : John Wiley & Sons, 1997.
Hsieh, H. F. and Shannon, S. E. 2005. Three approaches to qualitative content analysis. Qualitative health
research. 2005, Vol. 15, 9.
HTC Corporation. 2017. Vive. [Online] 2017. [Cited: 08 20, 2017.] https://www.vive.com/uk/.
Hu, L. T., Bentler, P. M. and Kano, Y. 1992. Can test statistics in covariance structure analysis be trusted.
Psychological bulletin. 1992, Vol. 112, 2.
Huang, H. H. C. 2009. Self-identity and consumption: a study of consumer personality, brand personality, and
brand relationship. s.l. : Doctoral dissertation, University of Warwick, 2009.

References 235
Hughes, J. 1998. The development of the GIST (Grounding Information SysTems) methodology: determining
situated requirements in information systems analysis. Doctoral dissertation : University of Salford, 1998.
Huijts, N. M. A., Molin, E. J. E. and Steg, L. 2012. Psychological factors influencing sustainable energy
technology acceptance: A review-based comprehensive framework. Renewable and Sustainable Energy Reviews.
2012, Vol. 16, 1.
Hulland, J. 1999. Use of partial least squares (PLS) in strategic management research: A review of four recent
studies. Strategic management journal. 1999, Vol. 20, 2.
Hunn, N. 2015. The Market for Smart Wearable Technology: A Consumer Centric Approach. [Online] 2015.
http://www.nickhunn.com/wp-content/uploads/downloads/2014/08/The-Market-for-Smart-Wearables.pdf.
Hunt, S. D. 1990. Truth in marketing theory and research. The Journal of Marketing. 1990, Vol. 54.
Hyde, K. F. 2000. Recognising deductive processes in qualitative research. Qualitative Market Research: An
International Journal. 2000, Vol. 3, 2.
Iacobucci, D. 2009. Structural equations modeling: Fit indices, sample size, and advanced topics. Journal of
Consumer Psychology. 2009, Vol. 20, 1.
IDATE. 2014. Global wearable technology sales by category from 2014 to 2018 (in million units). Statista.
[Online] 2014. [Cited: 31 5 2017.] https://www.statista.com/statistics/538159/share-of-global-wearables-sales-
by-category/.
IDC. 2016. IDC Forecasts Wearables Shipments to Reach 213.6 Million Units Worldwide in 2020 with Watches
and Wristbands Driving Volume While Clothing and Eyewear Gain Traction. [Online] 2016. [Cited: 29 5 2017.]
http://www.idc.com/getdoc.jsp?containerId=prUS41530816.
IDTechEx. 2015. Key wearable technology markets. [Online] 2015. [Cited: 28 5 2017.]
http://www.idtechex.com/research/articles/key-wearable-technology-markets-00008386.asp.
IHS Markit. 2014. Wearable Sensor Market to Expand Sevenfold in Five Years. [Online] 2014. [Cited: 28 5
2017.] http://news.ihsmarkit.com/press-release/technology/wearable-sensor-market-expand-sevenfold-five-years.
IHS. 2013. Wearable Technology – Market Assessment. An IHS Whitepaper. [Online] IHS Electronics &
Media, 2013. http://www.ihs.com/pdfs/Wearable-Technology-sep-2013.pdf.
Im, I., Kim, Y. and Han, H.-J. 2008. The effects of perceived risk and technology type on users’ acceptance of
technologies. Information & Management. 2008, Vol. 45, 1.
Iriondo, J. M., Albert, M. J. and Escudero, A. 2003. Structural equation modelling: an alternative for
assessing causal relationships in threatened plant populations. Biological Conservation. 2003, Vol. 113.
Israel, G. D. 1992. Determining sample size. Florida : University of Florida Cooperative Extension Service,
Institute of Food and Agriculture Sciences, EDIS, 1992.
ISRMC, LLC. 2009. Confidentiality, Integrity & Availability. Information Security Handbook. [Online] 2009.
http://ishandbook.bsewall.com/risk/Methodology/CIA.html.
Jacoby, J. 1978. Consumer research: A state of the art review. The Journal of Marketing. 1978.
Jakobowicz, E. 2006. Understanding PLS path modeling parameters estimates: a study based on Monte Carlo
simulation and customer satisfaction surveys. COMPSTAT 2006, 17th Symposium on Computational Statistics:
Rome, Italy. 2006.

236 References
Jarvenpaa, S. L., Tractinsky, N. and Saarinen, L. 1999. Journal of Computer‐Mediated Communication.
Consumer trust in an internet store: a cross‐cultural validation. 1999, Vol. 5, 2.
Jarvis, C. B., MacKenzie, S. B. and Podsakoff, P. M. 2003. A critical review of construct indicators and
measurement model misspecification in marketing and consumer research. Journal of consumer research. 2003,
Vol. 30, 2.
jawbone.com. 2017. UPmove. [Online] 2017. [Cited: 21. 07 2017.] https://jawbone.com/fitness-tracker/upmove.
Jeffries, F. L. and Reed, R. 2000. Trust and adaptation in relational contracting. Academy of Management
Review. 2000, Vol. 25, 4.
Jeong, S. C., et al. 2017. Domain-specific innovativeness and new product adoption: A case of wearable
devices. Telematics and Informatics. 2017, Vol. 34, 5.
John, O. P. and Srivastava, S. 1999. The Big Five trait taxonomy: History, measurement, and theoretical
perspectives. [book author] L. A. Pervin and O. P. John. Handbook of personality: Theory and research. s.l. :
Elsevier, 1999, S. 102-138.
Johnson, R. B. 1997. Examining the validity structure of qualitative research. Education. 1997, Vol. 118, 2.
Johnson, R. B., Onwuegbuzie, A. J. and Turner, L. A. 2007. Toward a Definition of Mixed Methods
Research. Journal of Mixed Methods Research. 2007, Vol. 1, 2.
Joo, J. and Hovav, A. 2016. The influence of information security on the adoption of web-based integrated
information systems: an e-government study in Peru. Information Technology for Development. 2016, Vol. 22.
Jöreskog, K. G. and Sörbom, D. 1996. LISREL 8: User's Reference Guide. Uppsala University : Scientific
Software International, 1996.
Judge, T. A., et al. 2013. Hierarchical representations of the five-factor model of personality in predicting job
performance: integrating three organizing frameworks with two theoretical perspectives. Journal of Applied
Psychology. 2013, Vol. 98, 6.
Jung, Y., Kim, S. and Choi, B. 2016. Consumer valuation of the wearables: The case of smartwatches.
Computers in Human Behavior. 2016, Vol. 63.
Kahneman, D. and Tversky, A. 1972. Subjective probability: A judgment of representativeness. Cognitive
psychology. 1972, Vol. 3, 3.
Kaiser, F. G. 2006. A moral extension of the theory of planned behavior: Norms and anticipated feelings of
regret in conservationism. Personality and Individual Differences. 2006, Vol. 41, 1.
Kang, J. Y. M. and Johnson, K. K. 2015. F-Commerce platform for apparel online social shopping: Testing a
Mowen’s 3M model. International Journal of Information Management. 2015, Vol. 35, 6.
Kantar. 2016. Penetration of wearable technology in Great Britain, Germany, France and Italy in March 2016.
Statista - The Statistics Portal. 2016.
Karahanna, E., Agarwal, R. and Angst, C. L. 2006. Reconceptualizing compatibility beliefs in technology
acceptance research. MIS Quarterly. 2006, Vol. 30, 4.
Karaiskos, D. C. 2009. A predictive model for the acceptance of pervasive information systems by individuals.
Athens University of Economics and Business : PhD Dissertation, 2009.
References 237
Katz, M. L. and Shapiro, C. 1985. Network externalities, competition, and compatibility. The American
economic review. 1985, Vol. 75, 3.
Kaul, A. and Wheelock, C. 2016. Wearable Device Market Forecasts. [Online] Tractica LLC., 2016. [Cited: 28
5 2017.] https://www.tractica.com/wp-content/uploads/2016/03/MD-WDMF-1Q16-Executive-Summary.pdf.
Keil, M., Beranek, P.M. and Konsynski, B. R. 1995. Usefulness and ease of use: field study evidence
regarding task considerations. Decision Support Systems. 1995, Vol. 13, 1.
Kemper, A. 2009. Valuation of Network Effects in Software Markets: A Complex Networks Approach. s.l. :
Springer Science & Business Media, 2009.
Kenny, D. A. 2015. Moderation. [Online] 2015. http://davidakenny.net/cm/moderation.htm.
Ketikidis, P., et al. 2012. Acceptance of health information technology in health professionals: An application
of the revised technology acceptance model. Health Informatics Journal. 2012, Vol. 18, 2.
Kim, C., Mirusmonov, M. and Lee, I. 2010. An empirical examination of factors influencing the intention.
Computers in Human Behavior. 26, 2010.
Kim, D. J., Ferrin, D. L. and Rao, H. R. 2008. A trust-based consumer decision-making model in electronic
commerce: The role of trust, perceived risk, and their antecedents. Decision Support Systems. 2008, Vol. 44, 2.
Kim, H. W., Chan, H. C. and Gupta, S. 2007. Value-based adoption of mobile internet: an empirical
investigation. Decision Support Systems. 2007, Vol. 43, 1.
Kim, K. and Prabhakar, B. 2000. Initial trust, perceived risk, and the adoption of Internet banking.
Proceedings of the 21st International Conference on Information Systems. 2000, S. 537–543.
Kim, S., Haley, E. and Koo, G. 2009. Comparison of the paths from consumer involvement types to ad
responses between corporate advertising and product advertising. Journal of Advertising. 2009, Vol. 38, 3.
Kim, S., Haley, E. and Yoon-Joo, L. 2008. Does Consumers' Product-Related Involvement Matter When It
Comes to Corporate Ads? Journal Of Current Issues & Research In Advertising (CTC Press). 2008, Vol. 30, 2.
Kim, Y. and Peterson, R. A. 2017. A Meta-analysis of Online Trust Relationships in E-commerce. Journal of
Interactive Marketing. 2017, Vol. 38.
Kim, Y. J. and Sim, J. B. 2012. Acceptance-diffusion strategies for Tablet-PCs: focused on acceptance factors
of non-users and satisfaction factors of users. Etri Journal. 2012, Vol. 34, 2.
King, N. and Horrocks, C. 2010. Interviews in Qualitative Research. s.l. : Sage, 2010.
King, W. R. and He, J. 2006. A meta-analysis of the technology acceptance model. Information &
Management. 2006, Vol. 43.
Kivunja, C. 2014. Theoretical perspectives of how digital natives learn. International Journal of Higher
Education. 2014, Vol. 3, 1.
Kleijnen, M., Lee, N. and Wetzels, M. 2009. An exploration of consumer resistance to innovation and its
antecedents. Journal of Economic Psychology. 2009, Vol. 30, 3.
Kocak, A., Abimbola, T. and Özer, A. 2007. Consumer brand equity in a cross-cultural replication: An
evaluation of a scale. Journal of Marketing Management. 2007, Vol. 23.
238 References
Kohlbacher, F. 2005. The Use of Qualitative Content Analysis in Case Study Research. Forum: Qualitative
Social Research. [Online] 2005. http://www.qualitative-
research.net/index.php/fqs/article/view/75/153January%202006.
Konstantopoulos, S., 2009. Using Power Tables to Compute Statistical Powerin Multilevel Experimental
Designs. Practical Assessment, Research & Evaluation, 14(10).
Koondhar, M. Y., et al. 2015. A conceptual framework for measuring the acceptance of pervasive learning.
[ed.] ICOCI 2015. Proceedings of the 5th International Conference on Computing and Informatics. 2015.
Kortuem, G., Segall, Z. and Bauer, M. 1998. Context-aware, adaptive wearable computers as remote interfaces
to'intelligent'environments. 16th International Symposium on Wearable Computers. s.l. : IEEE Computer
Society Press, 1998.
Krejcie, R. V. and Daryle, W. M. 1970. Determining Sample Size for Research Activities. Educational and
Psychological Measurement. 1970.
Krippendorff, K. 2011. Agreement and information in the reliability of coding. Communication Methods and
Measures. 2011, Vol. 5, 2.
Kronberger, N. and Wagner, W. 2000. Keywords in context: Statistical analysis of text features. Qualitative
researching with text, image and sound. A pratical handbook. s.l. : Sage, 2000.
Krosnick, J. A. and Presser, S. 2010. Question and Questionnaire Design. Handbook of Survey Research. 2nd.
s.l. : Emerald, 2010.
Krosnick, J. A. 1991. Response strategies for coping with the cognitive demands of attitude measures in
surveys. Applied cognitive psychology. 1991, Vol. 5, 3.
Krueger, D. & Kumar, K. 2003. US-Europe differences in technology adoption and growth: The role of education
and other policies. Manuscript prepared for the Carnegie-Rochester Conference.
Kuester, S. and Hess, S. 2009. How to Overcome Customers Adoption Barriers. Advances in Consumer
Research. 2009, Vol. 36.
Kumar, R. 2011. Research Methodology: A Step-by-Step Guide for Beginners. 3rd. s.l. : SAGE Publications
Ltd, 2011.
Kumari, P., Mathew, L. and Syal, P. 2016. Increasing trend of wearables and multimodal interface for human
activity monitoring: A review. Biosensors and Bioelectronics. 2016, Vol. 90.
Labay, D. G. and Kinnear, T. C. 1981. Exploring the consumer decision process in the adoption of solar
energy systems. Journal of consumer research. 1981, Vol. 8.
Laciana, C. E., Rovere, S. L. and Podestá, G. P. 2013. Exploring associations between micro-level models of
innovation diffusion and emerging macro-level adoption patterns. Physica A: Statistical Mechanics and its
Applications. 2013, Vol. 392, 8.
Lajos, J. 2010. Understanding Categorisation as a Guide to Marketing Strategy. [Online] HEC Paris, 2010.
http://www.hec.edu/Knowledge/Marketing/Marketing-Strategy/Understanding-Categorisation-as-a-Guide-to-
Marketing-Strategy.
Lakatos, I. 1970. Falsification and the methodology of scientific research. [book author] I. Lakatos and A.
Musgrave. Criticism and the Growth of Knowledge. s.l. : Cambridge University Press, 1970.
References 239
Lankton, N. K., McKnight, D. H. and Tripp, J. 2015. Technology, Humanness, and Trust: Rethinking Trust in
Technology. Journal of the Association for Information Systems. 2015, Vol. 16, 10.
Lantos, G. P. 2015. Consumer Behavior in Action: Real-life Applications for Marketing Managers. s.l. :
Routledge, 2015.
Laurent, G. and Kapferer, J. 1985. Measuring Consumer Involvement Profiles. Journal Of Marketing
Research. 1985, Vol. 22, 1.
Lechman, E. 2015. ICT Diffusion in Developing Countries. Towards a New Concept of Technological Takeoff.
s.l. : Springer, 2015.
Lee, J., Kim, H. J. and Ahn, M. J. 2011. The willingness of e-Government service adoption by business users:
The role of offline service quality and trust in technology. Government Information Quarterly. 2011, Vol. 28, 2.
Lee, L. N., et al. 2015. Risk Perceptions for Wearable Devices. Cornell University Library. [Online] 2015.
http://arxiv.org/pdf/1504.05694.pdf.
Leger, P.-M., Riedl, R. and Brocke, J. 2014. Emotions and ERP information sourcing: the moderating role of
expertise. Industrial Management & Data Systems. 2014, Vol. 114, 3.
Leidner, D. E. and Kayworth, T. 2006. Review: a review of culture in information systems research: toward a
theory of information technology culture conflict. MIS Quarterly. 2006, Vol. 30, 2.
Leiner, D. J. 2013. Too Fast, too Straight, too Weird: Post Hoc Identification of Meaningless Data in Internet
Surveys. Munich, Germany : Ludwig-Maximilians-University Munich, 2013. Working Paper.
Leslie, L. L. 1972. Are high response rates essential to valid surveys? Social Science Research. 1972, Vol. 1, 3.
Li, H., et al. 2016. Examining individuals’ adoption of healthcare wearable devices: An empirical study from
privacy calculus perspective. International Journal of Medical Informatics. 2016, Vol. 88, 1.
Liao, Z. and Cheung, M. T. 2002. Internet-based e-banking and consumer attitudes: an empirical study.
Information & Management. 2002, Vol. 39, 4.
Liébana-Cabanillas, F., Sánchez-Fernández, J. and Muñoz-Leiva, F. 2014. The moderating effect of
experience in the adoption of mobile payment tools in Virtual Social Networks: The m-Payment Acceptance
Model in Virtual Social Networks (MPAM-VSN). International Journal of Information Management. 2014, Vol.
34, 2.
Liebermann, Y. and Stashevsky, S. 2002. Perceived risks as barriers to Internet and e-commerce usage.
Qualitative Market Research: An International Journal. 2002, Vol. 5, 4.
Liebowitz, S. J. and Margolis, S. E. 1995. Are network externalities a new source of market failure? Research
in Law and Economics. 1995, Vol. 17.
Lienhard, P. and Preuss, H. 2014. Legacy, Sustainability and CSR at Mega Sport Events: An Analysis of the
UEFA EURO 2008 in Switzerland. s.l. : Springer, 2014.
Likert, R. 1932. A technique for the measurement of attitudes. New York : Archives of psychology, 1932.
Lim, N. 2003. Consumers’ perceived risk: sources versus consequences. Electronic Commerce Research and
Applications. 2003, Vol. 2, 3.
Linck, K., Pousttchi, K. and Wiedemann, D. G. 2007. Security Issues in Mobile Payment from the Customer
Viewpoint. Proceedings of the 14th European Conference on Information Systems. 2007.
240 References
Lind, D. A., Marchal, W. G. and Wathen, S. A. 2006. Basic statistics for business and economics. 5th. s.l. :
McGraw-Hill Education, 2006.
Lindell, M. K. and Whitney, D. J. 2001. Accounting for Common Method Variance in Cross-Sectional
Research Designs. Journal of Applied Psychology. 86, 2001, Vol. 1.
Linders, S., 2006. Using the Technology Acceptance Model in determining strategies for implementation of
mandatory IS. 4th Twente Student Conference on IT.
Lindström, J. 2007. Security challenges for wearable computing-a case study. Applied Wearable Computing
(IFAWC). 4th International Forum on. VDE. 2007.
Lindström, J. and Hanken, C. 2013. Wearable Computing: Security Challenges, BYOD, Privacy and Legal
Aspects. [book author] H. R. Nemati. Analyzing Security, Trust, and Crime in the Digital World. s.l. : IGI
Global, 2013.
Lippert, S. K. and Forman, H. 2006. A supply chain study of technology trust and antecedents to technology
internalization consequences. International Journal of Physical Distribution & Logistics Management. 2006,
Vol. 36, 4.
Lohmöller, J.-B. 2013. Latent Variable Path Modeling with Partial Least Squares. s.l. : Springer Science &
Business Media, 2013.
—. 1989. Latent Variable Path Modeling with Partial Least Squares. s.l. : Physica, 1989.
Loosveldt, G. and Sonck, N. 2008. An evaluation of the weighting procedures for an online access panel
survey. Survey Research Methods. 2008, Vol. 2, 2.
Lösing, T. 2016. The influence of privacy perceptions on online shopping behavior: a comparison between
millennials and baby boomers. 7th IBA Bachelor Thesis Conference. 2016.
Lotfian, R. and Jafari, R. 2013. An ultra-low power hardware accelerator architecture for wearable computers
using dynamic time warping. Proceedings of the Conference on Design, Automation and Test in Europe. EDA
Consortium. 2013.
Louviere, J. J., et al. 2013. Sequential preference questions factors influencing completion rates and response
times using an online panel. The Journal of Choice Modelling. 2013, Vol. 8.
Lu, J., et al. 2008. Determinants of accepting wireless mobile data services in China. Information &
Management. 2008, Vol. 45, 1.
Luarn, P. and Juo, W. J. 2010. The role of trust in technology within the TAM in the context of NFC mobile
payment. Journal of Information and Optimization Sciences. 2010, Vol. 31, 4.
Lucas, R. E., et al. 2000. Cross-cultural evidence for the fundamental features of extraversion. Journal of
personality and social psychology. 2000, Vol. 79, 3.
Luu, M.-D., et al. 2012. Modeling Diffusion in Social Networks Using Network Properties. [ed.] Association
for the Advancement of Artificial Intelligence. Proceedings of the Sixth International AAAI Conference on
Weblogs and Social Media. 2012.
Lyytinen, K., et al. 2004. Surfing the Next Wave: Design and Implementation Challenges of Ubiquitous
Computing. Environments. Communications of the Association for Information Systems. 2004.
Ma, Q. and Liu, L. 2004. The technology acceptance model: A meta-analysis of empirical findings. Journal of
End User Computing. 2004, Vol. 16, 1.
References 241
Mack, N., et al. 2005. Qualitative research methods: a data collectors field guide. North Carolina : Family
Health International, 2005.
MacKenzie, S. B. and Podsakoff, P. M. 2012. Common Method Bias in Marketing: Causes, Mechanisms, and
Procedural Remedies. Journal of Retailing. 2012, Vol. 88, 4.
MacKenzie, S. B., Podsakoff, P. M. and Podsakoff, N. P. 2011. Construct measurement and validation
procedures in MIS and behavioral research: Integrating new and existing techniques. MIS quarterly. 2011, Vol.
35, 2.
MacKinnon, D. P., Krull, J. L. and Lockwood, C. M. 2000. Equivalence of the mediation, confounding and
suppression effect. Prevention science. 2000, Vol. 1, 4.
Madden, T. J., Ellen, P. S. and Ajzen, I. 1992. A comparison of the theory of planned behavior and the theory
of reasoned action. Personality and social psychology Bulletin,. 1992, Vol. 18, 1.
Mahajan, V., Muller, E. and Bass, F. M. 1995. Diffusion of new products: Empirical generalizations and
managerial uses. Marketing Science. 1995, Vol. 14, 3.
Maler, K.-G. and Vincent, J. R. 2005. Handbook of Environmental Economics: Valuing Environmental
Changes. s.l. : Elsevier, 2005.
Malhotra, M. K. and Grover, V. 1998. An assessment of survey research in POM: from constructs to theory.
Journal of Operations Management. 1998, Vol. 16.
Malhotra, N. and Birks, D. 2007. Marketing research: an applied approach. 3rd. s.l. : Prentice Hall, 2007.
Malhotra, N. 2008. Completion time and response order effects in web surveys. Public Opinion Quarterly.
2008, Vol. 72, 5.
Malhotra, N., Kim, S. and Patil, A. 2006. Common Method Variance in IS Research: A Comparison of
Alternative Approaches and a Reanalysis of Past Research. Management Science. 2006, Vol. 52, 12.
Malik, A., Kumra, R. and Srivastava, V. 2013. Determinants of Consumer Acceptance of M-Commerce.
South Asian Journal Of Management. 2013, Vol. 20, 2.
Mallat, N., et al. 2009. The impact of use context on mobile services acceptance: The case of mobile ticketing.
Information & Management. 2009, Vol. 46, 3.
Mann, S. 1998. Wearable Computing as means for Personal Empowerment, Keynote Address for The First
International Conference on Wearable Computing, ICWC-98. [Online] 1998.
http://wearcomp.org/wearcompdef.html.
Marakas, G. M., Yi, M. Y. and Johnson, R. D. 1998. The multilevel and multifaceted character of computer
self-efficacy: Toward clarification of the construct and an integrative framework for research. Information
systems research. 1998, Vol. 9, 2.
Maroof, D. A. 2012. Statistical Methods in Neuropsychology: Common Procedures Made Comprehensible. s.l. :
Springer Science & Business Media, 2012.
Marshall, M. N. 1996. Sampling for qualitative research. Family practice. 1996, Vol. 13, 6.
Martin, B. A. S., Lang, B. and Wong, S. 2003. Conclusion explicitness in advertising: The moderating role of
need for cognition (NFC) and argument quality (AQ) on persuasion. Journal of Advertising. 2003, Vol. 32, 4.
242 References
Martin, T., et al. 2004. Denial-of-service attacks on battery-powered mobile computers. [ed.] IEEE.
Proceedings of the Second IEEE Annual Conference on Pervasive Computing and Communications
(PERCOM’04). 2004.
Marzec, E. 2014. The truth about wearables: What they are (and aren’t). [Online] Deloitte Digital, 2014.
http://www.deloittedigital.com/us/blog/the-truth-about-wearables-what-they-are-and-arent.
Mathieson, K., Peacock, E. and Chin, W. W. 2001. Extending the technology acceptance model: the influence
of perceived user resources. ACM SigMIS Database. 2001, Vol. 32, 3.
Mathison, S. 1988. Why triangulate? Educational researcher. 1988, Vol. 17, 2.
Matsuo, H., et al. 2004. The online survey: Its contributions and potential problems. ASA Section on Survey
Research Methods. 2004.
Mayer, R. C., Davis, J. H. and Schoorman, F. D. 1995. An integrative model of organizational trust. Academy
of management review. 1995, Vol. 20, 3.
Mayring, P. 2000. Qualitative Content Analysis. Forum Qualitative Sozialforschung / Forum: Qualitative
Social Research. [Online] 2000. http://www.qualitative-research.net/index.php/fqs/article/view/1089/2385#g4.
—. 2015. Qualitative Content Analysis: Theoretical Background and Procedures. [book author] A. Bikner-
Ahsbahs, C. Knipping and N. Presmeg. Approaches to Qualitative Research in Mathematics Education. s.l. :
Springer, 2015.
McArdle, J. J. 1990. Principles versus principals of structural factor analyses. Multivariate Behavioral
Research. 1990, Vol. 25, 1.
McCann, J. and Bryson, D. 2009. Smart Clothes and Wearable Technology. s.l. : Elsevier, 2009.
McCrae, R. R. and Costa, P. T. 1997. Personality trait structure as a human universal. American psychologist.
1997, Vol. 52, 5.
McElroy, J. C., et al. 2007. Dispositional factors in internet use: personality versus cognitive style. MIS
quarterly. 2007, Vol. 31, 4.
McIntyre, A. 2014. Wearable Computing in the Workplace to be Dependent on Apps and Services. [Online]
2014. http://www.forbes.com/sites/gartnergroup/2014/03/06/wearable-computing-in-the-workplace-to-be-
dependent-on-apps-and-services/.
McKnight, D. H., Choudhury, V. and Kacmar, C. 2002. Developing and validating trust measures for e-
commerce: An integrative typology. Information systems research. 2002, Vol. 13, 3.
Mcknight, D. H., et al. 2011. Trust in a specific technology: An investigation of its components and measures.
ACM. Transactions on Management Information Systems. 2011, Vol. 2, 2.
McLeod, M. and Vaughan, R. 2014. Knowledge Networks and Tourism. s.l. : Routledge Chapman & Hall,
2014.
McMaster, T. and Wastell, D. 2006. Diffusion – or delusion? Challenging an IS research tradition. Information
Technology & People. 2006, Vol. 18, 4.
McNutt, C. 2015. New Study Shows Slow Adoption of Wearables. AndroidHeadlines. [Online] 2015.
http://www.androidheadlines.com/2015/10/new-study-shows-slow-adoption-wearables.html.
References 243
Meade, N. and Islam, T. 2006. Modelling and forecasting the diffusion of innovation – A 25-year review.
International Journal of Forecasting. 2006, Vol. 22.
Mehrabian, A. and Russell, J. 1974. An Approach to Environmental Psychology. Cambridge : MIT Press,
1974.
Mehta, M. D. 2002. Nanoscience and nanotechnology: assessing the nature of innovation in these fields.
Bulletin of science, technology & Society. 2002, Vol. 22, 4.
Meister, D. B. and Compeau, D. R. 2002. Infusion of innovation adoption: an individual perspective.
Winnipeg : Annual Conference of the Administrative Sciences Association of Canada (ASAC), 2002.
Meister, S. 2012. Brand Communities for Fast Moving Consumer Goods: An Empirical Study of Members
‘Behavior and the Economic Relevance for the Marketer. s.l. : Springer Science & Business Media, 2012.
Merkow, M. S. and Breithaupt, J. 2014. Information Security: Principles and Practices. Second. s.l. : Pearson
IT Certification, 2014.
Microsoft. 2017. HoloLens. [Online] 2017. [Cited: 17. 07 2017.] https://www.microsoft.com/de-
de/hololens/apps.
Migicovsky, A., et al. 2014. Outsmarting Proctors with Smartwatches: A Case Study on Wearable Computing
Security. Proc. 18th Intl. Conference on Financial Cryptography and Data Security. 2014.
Milfont, T. L. and Fischer, R. 2010. Testing measurement invariance across groups: Applications in
crosscultural research. International Journal of psychological research. 2010, Vol. 3, 1.
Miller, G. A. 1956. The Magical Number Seven, Plus or Minus Two. Some Limits on Our Capacity for
Processing Information. Psychological Review. 1956, Vol. 101, 2.
Miller, K. D. and Tsang, E. W. 2011. Testing management theories: critical realist philosophy and research
methods. Strategic Management Journal. 2011, Vol. 32, 2.
Millon, T., Lerner, M. J. and Weiner, I. B. 2003. Handbook of Psychology, Personality and Social Psycholog.
s.l. : John Wiley & Sons, 2003.
Miltgen, C. L. and Peyrat-Guillard, D. 2014. Cultural and generational influences on privacy concerns: a
qualitative study in seven European countries. European Journal of Information Systems. 2014, Vol. 23, 2.
Mingers, J., Mutch, A. and Willcocks, L. 2013. Critical Realism in Information Systems Research. MIS
Quarterly. 2013, Vol. 37, 3.
Ming-Shen, W., et al. 2007. Effects of online shopping attitudes, subjective norms and control beliefs on online
shopping intentions: A test of the theory of planned behaviour. International Journal of Management. 2007, Vol.
24, 2.
Mischke, J. 2012. Wearable Technology Creates Significant Growth Opportunities. [Online] 2012.
https://www.wearable-technologies.com/2012/08/wearable-technology-creates-significant-growth-opportunities/.
Mitchell, A. A. 1979. Involvement: a potentially important mediator of consumer behavior. Advances in
consumer research. 1979, Vol. 6, 1.
Mitchell, V. W. 1999. Consumer perceived risk: conceptualisations and models. European Journal of
marketing. 1999, Vol. 33, 1/2.
244 References
Mitrasinovic, S., et al. 2015. Clinical and surgical applications of smart glasses. Technology and Health Care.
2015, Vol. 23.
Mittal, B. 1987. A framework for relating consumer involvement to lateral brain functioning. Advances in
Consumer Research. 1987, Vol. 14, 1.
Mobiquity. 2016. Defining the Wearable Technology Landscape. [Online] 2016.
https://www.mobiquityinc.com/defining-the-wearables-landscape.
Montano, D. E., et al. 2008. Theory of reasoned action, theory of planned behavior, and the integrated
behavioral model. Health Behavior: Theory, Research, and Practice. s.l. : John Wiley & Sons, 2008.
Mooi, E. and Sarstedt, M. 2011. A Concise Guide to Market Research: The Process, Data, and Methods Using
IBM SPSS Statistics. s.l. : Springer, 2011.
Moons, I. and De Bont, C.J.P.M. 2009. The motivational determinants in adopting sustainable products.
Seoul : s.n., 2009.
Moore, K. and McElroy, J. C. 2012. The influence of personality on Facebook usage, wall postings, and regret.
Computers in Human Behavior. 2012, Vol. 28, 1.
Morey, T., Forbath, T. and Schoop, A. 2015. Customer Data: Designing for Transparency and Trust. Harvard
Business Review. [Online] Harvard Business School Publishing, 2015. https://hbr.org/2015/05/customer-data-
designing-for-transparency-and-trust.
Morgan, D. L. 1996. Focus groups. Annual review of sociology. 1996, Vol. 22, 1.
Morris, M. E. and Aguilera, A. 2012. Mobile, social, and wearable computing and the evolution of
psychological practice. Professional Psychology: Research and Practice. 2012, Vol. 43, 6.
Morris, M. G. and Venkatesh, V. 2009. ge differences in technology adoption decisions: Implications for a
changing work force. Personnel psychology. 2009, Vol. 53, 2.
Morse, J. M. 1991. Approaches to qualitative-quantitative methodological triangulation. Nursing research.
1991, Vol. 40, 2.
—. 2001. Situating grounded theory within qualitative inquiry. [book author] R. S. Schreiber and P. N. Stern.
Using grounded theory in nursing. New York : Springer Publishing Company, 2001.
Morse, J. M., et al. 2002. Verification Strategies for Establishing Reliability and Validity in Qualitative
Research. International Journal of Qualitative Methods. 2002, Vol. 1, 2.
Moss, G. 2009. Gender, Design and Marketing: How Gender Drives Our Perception of Design and Marketing.
s.l. : Gower Publishing, 2009.
Motti, V. G. and Caine, K. 2014. Human Factors Considerations in the Design of Wearable Devices.
Proceedings of the Human Factors and Ergonomics Society Annual Meeting. 2014, Vol. 58.
—. 2015. Users’ privacy concerns about wearables. International Conference on Financial Cryptography and
Data Security. Berlin, Heidelberg : Springer, 2015.
Moutafi, J., Furnham, A. and Paltiel, L. 2004. Why is Conscientiousness negatively correlated with
intelligence? Personality and Individual Differences. 2004, Vol. 37, 5.
Mowen, J. and Sujan, H. 2005. Volunteer behavior: A hierarchical model approach for investigating its trait
and functional motive antecedents. Journal of Consumer. 2005, Vol. 15.
References 245
Mowen, J. C. 2004. Exploring the trait of competitiveness and its consumer behavior consequences. Journal of
Consumer Psychology. 2004, Vol. 14, 1.
—. 2000. The 3M model of motivation and personality: Theory and empirical applications to consumer
behavior. s.l. : Springer Science & Business Media, 2000.
Mowen, J. C. and Spears, N. 1999. Understanding compulsive buying among college students: A hierarchical
approach. Journal of Consumer Psychology. 1999, Vol. 8, 4.
Mowen, J., Park, S. and Zablah, A. 2007. Toward a theory of motivation and personality with application to
word-of-mouth communications. Journal of Business Research. 2007, Vol. 60.
Muensterer, O. J., et al. 2014. Google Glass in pediatric surgery: An exploratory study. International Journal
of Surgery. 2014, Vol. 12, 4.
Mulaik, S. A., et al. 1989. Evaluation of goodness-of-fit indices for structural equation models. Psychological
Bulletin. 1989, Vol. 105, 3.
Muller, P. R. and Mahajan, V. 2010. Innovation diffusion and new product growth models: A critical review
and research directions. International Journal of Research in Marketing. 2010, Vol. 27, 2.
Mulyanegara, R. C., Tsarenko, Y. and Anderson, A. 2009. The Big Five and brand personality: Investigating
the impact of consumer personality on preferences towards particular brand personality. Journal of Brand
Management. 2009, Vol. 16, 4.
Munteanu, C. et al., 2016. Designing Speech and Multimodal Interactions for Mobile, Wearable, and Pervasive
Applications. Proceedings of the 2016 CHI Conference Extended Abstracts on Human Factors in Computing
Systems, pp. 3612-3619.
Murray, A. I., et al. 2014. How are conscientiousness and cognitive ability related to one another? Personality
and Individual Differences. 2014, Vol. 70.
Nabih, M. I., Bloem, J. G. and Poiesz, T. B. C. 1997. Conceptual Issues in the Study of Innovation Adoption
Behavior. Advances in Consumer Research. 1997, Vol. 24.
Neelankavil, J. P. 2007. International business research. Armonk : Sharpe, 2007.
Neuert, J. 2014. Contemporary Approaches of International Business Management, Economics, and Social
Research. s.l. : epubli, 2014.
Newman, I. and Benz, C. R. 1998. Qualitative-quantitative Research Methodology: Exploring the Interactive
Continuum. s.l. : SIU Press, 1998.
NGRAIN. 2016. 3 reasons why the future of wearables is in software. [Online] 2016. http://www.ngrain.com/3-
reasons-why-the-future-of-wearables-is-in-software/.
Nguyen, M. 2015. Wearable Devices For First Responders. [Online] Wearable Technologies AG, 2015.
https://www.wearable-technologies.com/2015/12/wearable-devices-for-first-responders/.
Nickell, G. S. and Pinto, J. N. 1986. The computer attitude scale. Computers in Human Behavior. 1986, Vol. 2,
4.
Nielsen. 2014. Tech-Styles: Are Consumers Really Interested in Wearing Tech on their Sleeves? [Online] 2014.
http://www.nielsen.com/us/en/newswire/2014/tech-styles-are-consumers-really-interested-in-wearing-tech-on-
their-sleeves.html.
246 References
Nitzl, C. 2016. The use of partial least squares structural equation modelling (PLS-SEM) in management
accounting research: Directions for future theory development. Journal of Accounting Literature. 2016, Vol. 37.
Nitzl, C., Roldán, J. L. and Cepeda Carrión, G. 2016. Mediation Analysis in Partial Least Squares Path
Modeling: Helping Researchers Discuss More Sophisticated Models. Industrial Management & Data Systems.
2016.
Nozick, R. 2001. Invariances: The Structure of the Objective World. s.l. : Harvard University Press, 2001.
Nunnally, J. C. 1975. Psychometric Theory. 25 Years Ago and Now. Educational Researcher. 1975, Vol. 4, 10.
Nysveen, H., Pedersen, P. E. and Thorbjørnsen, H. 2005. Intentions to use mobile services: Antecedents and
cross-service comparisons. Journal of the academy of marketing science. 2005, Vol. 33, 3.
Ochrymowicz, R. 2011. Security – are current security mechanisms adequate in a ubiquitous model? [Online]
2011. http://www.comp.dit.ie/mcollins/ubicomp/assignment/Radek%20Ochrymowicz%20-
%20Security%20in%20Ubicomp.pdf.
Olsen, S. B. 2009. Choosing between internet and mail survey modes for choice experiment surveys considering
non-market goods. Environmental and Resource Economics. 2009, Vol. 44, 4.
Olsson, U. H., et al. 2000. The performance of ML, GLS, and WLS estimation in structural equation modeling
under conditions of misspecification and nonnormality. Structural equation modeling. 2000, Vol. 7, 4.
Onwuegbuzie, A. J. and Leech, N. L. 2007. Sampling designs in qualitative research: Making the sampling
process more public. The qualitative report. 2007, Vol. 12, 2.
Oreg, S. 2003. Resistance to change: developing an individual differences measure. Journal of applied
Psychology. 2003, Vol. 88, 4.
Osborne, J. W. and Costello, A. B. 2005. Best practices in exploratory factor analysis: Four recommendations
for getting the most from your analysis. Practical Assessment Research & Evaluation. 2005, Vol. 10, 7.
Otero-López , J. M. and Villardefrancos, E. 2013. Five-Factor Model personality traits, materialism, and
excessive buying: A mediational analysis. Personality and Individual Differences. 2013, Vol. 54.
Pagani, M., Hofacker, C. and Goldsmith, R. E. 2011. The Influence of Personality on Active and Passive Use
of Social Networking Sites. Psychology and Marketing. 2011, Vol. 28, 5.
Palmer, A., Koenig-Lewis, N. and Jones, L. E. M. 2013. The effects of residents' social identity and
involvement on their advocacy of incoming tourism. 2013, Vol. 38, 1.
Panetta, K., 2017. Top Trends in the Gartner Hype Cycle for Emerging Technologies, 2017. [Online]
Available at: https://www.gartner.com/smarterwithgartner/top-trends-in-the-gartner-hype-cycle-for-emerging-
technologies-2017/ [Accessed 01 05 2018].
Park, C. W. and Lessig, V. P. 1981. Familiarity and its impact on consumer decision biases and heuristics.
Journal of consumer research. 1981, Vol. 8.
Park, C. W. and Young, S. M. 1983. Types and Levels of Involvement and Brand Attitude Formation.
Advances In Consumer Research. 1983, Vol. 10, 1.
Park, J. et al., 2018. Soft, smart contact lenses with integrations of wireless circuits, glucose sensors, and
displays. [Online] Available at: http://advances.sciencemag.org/content/4/1/eaap9841.full [Accessed 01 05
2018].

References 247
Park, J., et al. 2013. Driver’s Intention to Use Smartphone-Car Connectivity. 24th European Regional
Conference of the International Telecommunication Society. 2013.
Park, S., Chung, K. and Jayaraman, S. 2014. Wearables: Fundamentals, Advancements, and a Roadmap for
the Future. [ed.] E. Sazonov and M. R. Neuman. Wearable Sensors: Fundamentals, Implementation and
Applications. s.l. : Elsevier, 2014.
Pascoe, J. 1998. Adding generic contextual capabilities to wearable computers. Digest of Papers. Second
International Symposium on Wearable Computers. 1998.
Patton, M. Q. 1990. Qualitative Evaluation and Research Methods. Newbury Park : Sage, 1990.
—. 2002. Two decades of developments in qualitative inquiry a personal, experiential perspective. Qualitative
social work. 2002, Vol. 1, 3.
Pavlou, P. A. 2003. Consumer acceptance of electronic commerce: Integrating trust and risk with the technology
acceptance model. International journal of electronic commerce. 2003, Vol. 7, 3.
Pavlou, P. and Gefen, D. 2004. Building effective online marketplaces with institution-based trust. Information
Systems Research. 2004, Vol. 15, 1.
Perez, B. 2017. Smartwatch market hits record 21.1 million sales in 2016, as Apple pulls ahead of Samsung,
Chinese brands. [Online] Available at: http://www.scmp.com/tech/article/2067481/smartwatch-market-hits-
record-211-million-sales-2016-apple-pulls-ahead-samsung [Accessed 10 05 2018].
Perez, S. 2016. U.S. wearables market is doing much worse than expected. [Online] Aol Tech, 2016.
https://techcrunch.com/2016/12/21/u-s-wearable-market-is-doing-much-worse-than-expected/.
Perich, F., et al. 2004. On data management in pervasive computing environments. [ed.] IEEE. Knowledge and
Data Engineering. 2004, Vol. 16, 5.
Perner, L. 2013. Diffusion of Innovation. Consumer Psychologist. [Online] 2013.
http://www.consumerpsychologist.com/cb_Diffusion_of_Innovation.html.
Perrin, A. and Duggan, M. 2015. Americans’ Internet Access: 2000-2015. Pew Research Center. [Online]
2015. http://www.pewinternet.org/2015/06/26/americans-internet-access-2000-2015/.
Peter, J. P. 1979. Reliability: A review of psychometric basics and recent marketing practices. Journal of
marketing research. 1979, Vol. 16, 1.
Petter, S., Straub, D. and Rai, A. 2007. Specifying formative constructs in information systems research. Mis
Quarterly. 2007, Vol. 31, 4.
Petty, R. E. and Brinol, P. 2010. Attitude change. Advanced social psychology: The state of the science. 2010.
Petty, R. E. and Cacioppo, J. T. 1979. Issue involvement can increase or decrease persuasion by enhancing
message-relevant cognitive responses. Journal of Personality and Social Psychology. 1979, Vol. 37, 10.
—. 1986. The elaboration likelihood model of persuasion. s.l. : Springer New York, 1986.
Petty, R. E., Cacioppo, J. T. and Schumann, D. 1983. Central and peripheral routes to advertising
effectiveness: The moderating role of involvement. Journal of consumer research. 1983, Vol. 10, 1.
Petty, R. E., et al. 1986. Central and peripheral routes to persuasion: An individual difference perspective.
Journal of Personality and Social Psychology. 1986, Vol. 51, 5.

248 References
Petty, R. E., Wegener, D. T. and Fabrigar, L. R. 1997. Attitudes and attitude change. Annual review of
psychology. 1997, Vol. 48, 1.
Piana, V. 2003. Product Differentiation. Economics Web Institute. [Online] 2003. [Cited: 10. 08 2017.]
http://www.economicswebinstitute.org/glossary/product.htm.
Plack, M. M. 2005. Human Nature and Research Paradigms: Theory Meets Physical Therapy Practice. The
Qualitative Report. 2005, Vol. 10, 2.
Planing, P. 2014. Innovation acceptance: the case of advanced driver-assistance systems. s.l. : Springer Science
& Business Media, 2014.
Podsakoff, P. M., et al. 2003. Common method biases in behavioral research: a critical review of the literature
and recommended remedies. Journal of applied psychology. 2003, Vol. 88, 5.
Pomerantz, E. M., Chaiken, S. and Tordesillas, R. S. 1995. Attitude strength and resistance processes.
Journal of personality and social psychology. 1995, Vol. 69, 3.
Pookulangara, S., Hawley, J. and Xiao, G. 2011. Explaining multi‐channel consumer's channel‐migration
intention using theory of reasoned action. International Journal of Retail & Distribution. 2011, Vol. 39, 3.
Popper, K. 1959. The logic of scientific discovery. London : Routledge, 1959.
Powell, C., et al. 2013. Towards Thought Control of Next-Generation Wearable Computing Devices. Springer
International Publishing Switzerland. 2013.
PR Newswire. 2014. Wearable Computing: Technologies, Applications and Global Markets. MarketWatch.
[Online] 2014.
Prajapati, B., Dunne, M. & Armstrong, R., 2010. Sample size estimation and statistical power analyses.
Optometry today, 16(7).
Preacher, K. J. and Hayes, A. F. 2004. SPSS and SAS procedures for estimating indirect effects in simple
mediation models. Behavior research methods, instruments, & computers. 2004, Vol. 36, 4.
Preston, C. C. and Colman, A. M. 2000. Acta Psychologica. Optimal number of response categories in rating
scales: reliability, validity, discriminating power, and respondent preferences. 2000, Vol. 104.
Prewitt, K. 2011. Why It Matters to Distinguish Between Privacy & Confidentiality. Journal of Privacy and
Confidentiality. 2011.
Pride, W. and Ferrell, O. C. 2015. Marketing 2016. s.l. : Cengage Learning, 2015.
PRWeb. 2014. Global Wearable Medical Technology Market: Analysis, Size, Share, Growth, Trends And
Forecast 2013 - 2019. [Online] 2014. http://www.prweb.com/releases/2014/05/prweb11860445.htm.
Purvis, M. 2014. ON World: 1 in 5 Americans Will Own a Wearable Technology Product by 2015. [Online]
2014. http://www.prweb.com/releases/2014/04/prweb11803485.htm.
Putrevu, S. and Lord, K. R. 1994. Comparative and Noncomparative Advertising: Attitudinal Effects under
Cognitive and Affective Involvement Conditions. 1994, Vol. 23, 2.
Pyun, D. Y. and James, J. D. 2011. Attitude toward advertising through sport: A theoretical framework. Sport
Management Review. 2011, Vol. 14.
Qingxiong, M. and Pearson, J. M. 2005. ISO 17799:" Best Practices" in Information Security Management?
Communications of the Association for Information Systems. 2005, Vol. 15, 1.
References 249
Qu, S. Q. and Dumay, J. 2011. The qualitative research interview. Qualitative Research in Accounting &
Management. 2011, Vol. 8, 3.
Quinn, G. and Brachmann, S. 2015. Growing market for wearable tech increases value for security.
ipwatchdog. [Online] 5. 4 2015. http://www.ipwatchdog.com/2015/04/05/growing-market-for-wearable-tech-
increases-value-for-security/id=56244/.
Quint, F. and Loch, F. 2015. Using Smart Glasses to Document Maintenance Processes. Mensch & Computer
Workshopband. 2015.
Radhakrishna, R. and Doamekpor, P. 2008. Strategies for Generalizing Findings in Survey Research. Journal
of Extension. [Online] Extension Journal, Inc., 2008. http://www.joe.org/joe/2008april/tt1.php.
Rahman, A. L. A., Jamaludin, A. and Mahmud, Z. 2011. Intention to use digital library based on modified
UTAUT model: Perspectives of Malaysian postgraduate students. World academy of science, Engineering and
technology. 2011, Vol. 5, 3.
Rahmandad, H. and Sterman, J. 2008. Heterogeneity and network structure in the dynamics of diffusion:
Comparing agent-based and differential equation models. Management Science. 2008, Vol. 54, 5.
Ram, S. 1987. A Model of Innovation Resistance. Advances in consumer research. 1987, Vol. 14, 1.
Rammstedt, B. and John, O. B. 2007. Measuring personality in one minute or less: A 10-item short version of
the Big Five Inventory in English and German. Journal of research in Personality. 2007, Vol. 41, 1.
Rammstedt, B. 2007. The 10-item Big Five Inventory: Norm values and investigation of sociodemographic
effects based on a German population representative sample. European Journal of Psychological Assessment.
2007, Vol. 23, 3.
Rao, S. and Perry, C. 2003. Convergent interviewing to build a theory in under‐researched areas: principles and
an example investigation of Internet usage in inter‐firm relationships. Qualitative Market Research: An
International Journal. 2003, Vol. 6, 4.
Rauschnabel, P. A. and Ro, Y. K. 2016. Augmented reality smart glasses: an investigation of technology
acceptance drivers. International Journal of Technology Marketing. 2016, Vol. 11, 2.
Rauschnabel, P. A., Brem, A. and Ivens, B. S. 2015a. Who will buy smart glasses? Empirical results of two
pre-market-entry studies on the role of personality in individual awareness and intended adoption of Google
Glass wearables. Computers in Human Behavior. 2015a, Vol. 49.
Rauschnabel, P. A., Brem, A. and Ro, Y. 2015b. Augmented reality smart glasses: definition, conceptual
insights, and managerial importance. Working paper. The University of Michigan-Dearborn. 2015b.
Ravasi, D. and Rindova, V. 2004. Creating symbolic value: a cultural perspective on production and exchange.
s.l. : SDA Bocconi, 2004. Vol. 111, 4.
Ravens, C. 2014. Internal Brand Management in an International Context. s.l. : Springer Gabler, 2014.
Rawassizadeh, R., Price, B. A. and Petre, M. 2015. Wearables: Has the age of smartwatches finally arrived?
Communications of the ACM. 2015, Vol. 58, 1.
Ray, S., Park, J. and Bhunia, S. 2016. Wearables, Implants, and Internet of Things: The Technology Needs in
the Evolving Landscape. IEEE Transactions on Multi-Scale Computing Systems. 2016, Vol. 2, 2.
Reinartz, W., Haenlein, M. and Henseler, J. 2009. An empirical comparison of the efficacy of covariance-
based and variance-based SEM. International Journal of research in Marketing. 2009, Vol. 26, 4.
250 References
Rekimoto, J. 2001. GestureWrist and GesturePad: unobtrusive wearable interaction devices. Proceedings Fifth
International Symposium on Wearable Computers. 2001.
Rey, L. and Extremera, N. 2016. Agreeableness and interpersonal forgiveness in young adults: the moderating
role of gender. Terapia Psicológica. 2016, Vol. 34, 2.
Rhodes, B. 2001. A brief history of wearable computing. MIT Wearable Computing Project . [Online] 2001.
http://www.media.mit.edu/wearables/lizzy/timeline.html.
Rhodes, B. J. 1997. The wearable remembrance agent: a system for augmented memory. Personal Technologies
Journal Special Issue on Wearable Computing. 1997.
Rhodes, B. J., Minar, N. and Weaver, J. 1999. Wearable computing meets ubiquitous computing: reaping the
best of both worlds. The Proceedings of The Third International Symposium on Wearable Computers (ISWC
'99). 1999.
Riazi, A. M. 2016. The Routledge Encyclopedia of Research Methods in Applied Linguistics. s.l. : Routledge,
2016.
Richins, M. L. 1987. Media, materialism, and human happiness. Advances in consumer research. 1987, Vol. 14,
1.
Richins, M. L. and Dawson, S. 1992. A consumer values orientation for materialism and its measurement:
Scale development and validation. Journal of consumer research. 1992, Vol. 19, 3.
Richins, M. L. 2013. When Wanting Is Better than Having: Materialism, Transformation Expectations, and
Product-Evoked Emotions in the Purchase Process. Journal of Consumer Research. 2013, Vol. 40, 1.
Richter, F. 2016. Smartwatches - The Next Big Thing That Wasn't . [Online] 2016. [Cited: 31 5 2017.]
https://www.statista.com/chart/5328/smartwatch-shipments/.
Ridings, C. M. and Gefen, D. G. 2004. Virtual Community Attraction: Why People Hang Out Online. Journal
of Computer‐Mediated Communication. 2004, Vol. 10, 1.
Rigdon, E. E. 2014. Rethinking Partial Least Squares Path Modeling: Breaking Chains and Forging Ahead.
Long Range Planning. 2014, Vol. 47.
Ringle, C. M. and Sarstedt, M. 2016. Gain more insight from your PLS-SEM results: The importance-
performance map analysis. Industrial Management & Data Systems. 2016, Vol. 116, 9.
Ringle, C. M., Sarstedt, M. and Mooi, E. A. 2010. Response-based segmentation using finite mixture partial
least squares. Data Mining. s.l. : Springer US, 2010.
Ringle, C. M., Sarstedt, M. and Straub, D. W. 2012. A Critical Look at the Use of PLS-SEM in MIS
Quarterly. MIS Quarterly. 2012, Vol. 36, 1.
Ritchie, J., et al. 2013. Qualitative Research Practice: A Guide for Social Science Students and Researchers.
s.l. : Sage, 2013.
Rivera, J. and van der Meulen, R. 2014. Gartner's 2014 Hype Cycle for Emerging Technologies Maps the
Journey to Digital Business. Press Release. [Online] Gartner, Inc., 2014.
http://www.gartner.com/newsroom/id/2819918.
Rivis, A. and Sheeran, P. 2003. Descriptive norms as an additional predictor in the theory of planned
behaviour: A meta-analysis. Current Psychology. 2003, Vol. 22, 3.
References 251
Rizzo, T. 2014. Google's Contact Lens for Diabetes - a Lesson in Real Wearable Tech Revenue Generation.
Wearable Tech World Feature Article. [Online] 2014. http://www.wearabletechworld.com/topics/from-the-
experts/articles/367472-googles-contact-lens-diabetes-lesson-real-wearable-tech.htm.
—. 2013. Wearable Technology - The Next Mobility Market is Booming! Wearable Tech World Feature Article.
[Online] 2013. http://www.wearabletechworld.com/topics/from-the-experts/articles/323855-wearable-
technology-next-mobility-market-booming.htm.
Robinson, P., Vogt, H. and Wagealla, W. 2005. Some research challenges in pervasive computing. Privacy,
Security and Trust within the Context of Pervasive Computing. s.l. : Springer Science + Business Media, Inc.,
2005.
Robson, C. 2009. Real world research. A resource for social scientists and Practitioner-Researchers. s.l. :
Blackwell, 2009.
Röcker, C. 2010. Why traditional technology acceptance models won't work for future information
technologies. World Academy of Science, Engineering and Technology. 2010, Vol. 65.
Rogers, E. M. 2010. Diffusion of Innovations, 4th Edition. 4. s.l. : Simon and Schuster, 2010.
—. 1983. Diffusion of Innovations. Third Edition. 3rd. s.l. : Free Press, 1983.
Roller, M. R. 2015. Interview Guide Development: A 4-Stage “Funnel” Approach. Research Design Review.
[Online] 2015. http://researchdesignreview.com/2015/06/28/interview-guide-development-a-4-stage-funnel-
approach/.
Roni, S. M. 2014. Introduction to SPSS. Joondalup, Australia : SOAR Centre, Edith Cowan University, 2014.
Rossiter, J. R. 2011. Marketing measurement revolution: The C-OAR-SE method and why it must replace
psychometrics. European Journal of Marketing. 2011, Vol. 45, 11/12.
—. 2002. The C-OAR-SE procedure for scale development in marketing. International Journal of Research in
Marketing. 2002, Vol. 19, 4.
Roster, C. A., et al. 2004. A comparison of response characteristics from web. International Journal of Market
Research. 2004, Vol. 46, 3.
Rothschild, M. L. and Houston, M. J. 1980. Individual Differences in Voting Behavior: Further Investigations
of Involvement. Advances in Consumer Research. 1980, Vol. 7.
Rousseau, D. M., et al. 1998. Not so different after all: A cross-discipline view of trust. Academy of
management review. 1998, Vol. 23, 3.
Russell Bernard, H. 2006. Research Methods in Anthropology: Qualitative And Quantitative Approaches. 4.
University Of Florida : AltaMira Press, 2006.
Ryan, M. J. 1982. Behavioral intention formation: The interdependency of attitudinal and social influence
variables. Journal of Consumer Research. 1982.
Ryberg, T., Dirckinck-Holmfeld, L. and Jones, C. 2010. Catering to the needs of the “digital natives” or
educating the “Net Generation”. [ed.] M. J.W. Lee and C. McLoughlin. Web 2.0-Based E-Learning:Applying
Social Informatics forTertiary Teaching. Hershey, New York : Information Science Reference, 2010.
Saadé, R. and Bahli, B. 2005. The impact of cognitive absorption on perceived usefulness and perceived ease of
use in on-line learning: an extension of the technology acceptance model. Information & Management. 2005,
Vol. 42, 2.
252 References
Sadowski, C. J. 1993. An examination of the short Need for Cognition Scale. Journal Of Psychology. 1993,
Vol. 127, 4.
Saint-Germain, R. 2005. Information security management best practice based on ISO/IEC 17799. Information
Management Journal. 2005, Vol. 39, 4.
Salah, H., MacIntosh, E. and Rajakulendran, N. 2014. Wearable Tech: Leveraging Canadian Innovation to
Improve Health. s.l. : MaRS Discovery District, 2014.
Salisbury, W. D., et al. 2001. Perceived security and World Wide Web purchase intention. Industrial
Management & Data Systems. 2001, Vol. 101, 4.
Salsman, J. M., et al. 2014. Assessing psychological well-being: self-report instruments for the NIH Toolbox.
Quality of Life Research. 2014, Vol. 23, 1.
Samaniego, D. 2016. Function Meets Fashion: Levi’s® Commuter x Jacquard by Google. Levistrauss.com.
[Online] 2016. [Cited: 05 06 2017.] http://www.levistrauss.com/unzipped-blog/2016/05/function-meets-fashion-
levis-commuter-x-jacquard-by-google/.
Sandberg, B. 2002. Creating the market for disruptive innovation: market proactiveness at the launch stage.
Journal of Targeting, Measurement and Analysis for Marketing. 2002, Vol. 11, 2.
Sandelowski, M. 1995. Sample size in qualitative research. Research in Nursing & Health. 1995, Vol. 18, 2.
—. 1986. The problem of rigor in qualitative research. Advances in nursing science. 1986, Vol. 8, 3.
Šarić, S. 2012. Competitive Advantages through Clusters. An Empirical Study with Evidence from China. s.l. :
Gabler, 2012.
Sarstedt, M. and Ringle, C. M. 2010. Treating unobserved heterogeneity in PLS path modeling: a comparison
of FIMIX-PLS with different data analysis strategies. Journal of Applied Statistics. 2010, Vol. 37, 8.
Sarstedt, M., Henseler, J. and Ringle, C. M. 2011. Multigroup Analysis in Partial Least Squares (PLS) Path
Modeling: Alternative Methods and Empirical Results. Measurement and research methods in international
marketing, advances in international marketing. 2011, Vol. 22.
Saunders, M., Lewis, P. and Thornhill, A. 2009. Research Methods for Business Students. 5. s.l. : Pearson
Education Limited, 2009.
Savalei, V. and Rhemtulla, M. 2017. Normal Theory GLS Estimator for Missing Data: An Application to Item-
Level Missing Data and a Comparison to Two-Stage ML. Frontiers in Psychology. 2017, Vol. 8.
Schaninger, C. M. 1976. Perceived risk and personality. Journal of Consumer Research. 1976, Vol. 3, 2.
Schenk, K. D., Vitalari, N. P. and Davis, K. S. 1998. Differences between Novice and Expert Systems
Analysts: What Do We Know and What Do We Do? Journal of Management Information Systems. 1998, Vol.
15, 1.
Schewe, C. D., Meredith, G. E. and Noble, S. M. 2000. Defining moments: Segmenting by cohorts. Marketing
Management. 2000, Vol. 9, 3.
Schierz, P. G., Schilke, O. and Wirtz, B. W. 2010. Understanding consumer acceptance of mobile payment
services: An empirical analysis. Electronic Commerce Research and Applications. 2010, Vol. 9, 3.
Schiffman, L. G., Hansen, H. and Kanuk, L. L. 2009. Consumer Behaviour. s.l. : Pearson Education, 2009.
References 253
Schmitt, J. 2014. Social Innovation for Business Success: Shared Value in the Apparel Industry. s.l. : Springer
Science & Business Media, 2014.
Schneeweiss, H. 1990. Models with latent variables: LISREL versus PLS. Contemporary Mathematics. 1990,
Vol. 112.
Schooler, L. 2014. Wearable Technology Future is Ripe for Growth – Most Notably among Millennials, Says
PwC US. PwC US. [Online] 21. 10 2014. http://www.pwc.com/us/en/press-releases/2014/wearable-technology-
future.html.
Schulze, P. 2009. Balancing Exploitation and Exploration: Organizational Antecedents and Performance
Effects of Innovation Strategies. s.l. : Gabler, 2009.
Schumacker, R. E. and Lomax, R. G. 2009. A Beginner's Guide to Structural Equation Modeling. 3rd. s.l. :
Routledge Academic, 2009.
Schumpeter, J. A. 1939. Business cycles. A theoretical, historical, and statistical analysis of the capitalist
process. s.l. : McGraw-Hill, 1939.
Scotland, J. 2012. Exploring the philosophical underpinnings of research: relating ontology and epistemology to
the methodology and methods of the scientific, interpretive, and critical research paradigms. English Language
Teaching. 2012, Vol. 5, 9.
Scott, K. and Mowen, J. 2007. Travelers and their traits: A hierarchical model approach. Journal of Consumer
Behavior. 2007, Vol. 6.
Seale, C. 1999. Quality in qualitative research. Qualitative inquiry. 1999, Vol. 5, 4.
Segal, B. and Podoshen, J. S. 2013. An examination of materialism, conspicuous consumption and gender
differences. International Journal Of Consumer Studies. 2013, Vol. 37, 2.
Segars, A. H. 1997. Assessing the unidimensionality of measurement: A paradigm and illustration within the
context of information systems research. Omega. 1997, Vol. 25, 1.
Sharma, R. and Mishra, R. 2014. A Review of Evolution of Theories and Models of Technology Adoption.
Indore Management Journal, 6(2).
Sheng, X. and Zolfagharian, M. 2014. Consumer participation in online product recommendation services:
augmenting the technology acceptance model. Journal of Services Marketing. 2014, Vol. 28, 6.
Sheppard, B. H., Hartwick, J. and Warshaw, P. R. 1988. The theory of reasoned action: A meta-analysis of
past research with recommendations for modifications and future research. Journal of consumer research. 1988,
Vol. 15.
Sheth, J. N. 1981. Psychology of innovation resistance: the less developed concept. Research in Marketing.
1981, Vol. 4, 3.
Sheth, J. N. and Tuncalp, S. 1974. The Expectancy Value Models: The Case of the Fishbein Model.
Researchgate. [Online] 1974.
http://www.researchgate.net/profile/Jagdish_Sheth/publication/239939142_The_Expectancy_Value_Models_Th
e_Case_of_the_Fishbein_Model/links/00b4951c399047331e000000.pdf.
Shimp, T. and Kavas, A. 1984. The theory of reasoned action applied to coupon usage. Journal of Consumer
Research. 1984, Vol. 11.
254 References
Shin, D. H. 2010. Ubiquitous computing acceptance model: end user concern about security, privacy and risk.
International Journal of Mobile Communications. 2010, Vol. 8, 2.
Shrout, P. E. and Bolger, N. 2002. Mediation in Experimental and Nonexperimental Studies: New Procedures
and Recommendations. Psychological Methods. 2002, Vol. 7, 4.
Shrum, L. J., et al. 2013. Reconceptualizing materialism as identity goal pursuits: Functions, processes, and
consequences. Journal of Business Research. 2013, Vol. 66, 8.
Siewiorek, D. P., Smailagic, A. and Starner, T. 2008. Application Design for Wearable Computing. s.l. :
Morgan & Claypool Publishers, 2008.
Silver, M. P. 2014. Socio-economic status over the lifecourse and internet use in older adulthood. Ageing and
Society. 2014, Vol. 34, 6.
Singer, H. 2015. SEM modeling with singular moment matrices Part III: GLS estimation. The Journal of
Mathematical Sociology, 40(3).
Singh, A. S. & Masuku, M. B., 2014. Sampling techniques & determination of sample size in applied statistics
research: An overview. International Journal of Economics, Commerce and Management, 2(11).
SmartPLS GmbH. 2017. SmartPLS. [Online] 20. 03 2017. https://www.smartpls.com/.
Smartwatch Group. 2015. Pebble - Smartwatch Group. [Online] 2015.
http://www.smartwatchgroup.com/pebble/.
Smith, J. R., et al. 2008. The attitude–behavior relationship in consumer conduct: The role of norms, past
behavior, and self-identity. The Journal of Social Psychology. 2008, Vol. 148, 3.
Smith, S.C., et al. 2007. Development of a new measure of health-
related quality of life for people with dementia: DEMQOL. Psychological Medicine. 2007, Vol. 37.
Snoj, B., Korda, A. P. and Mumel, D. 2004. The relationships among perceived quality, perceived risk and
perceived product value. Journal of Product & Brand Management. 2004, Vol. 13, 3.
Sobel, M. E. 1982. Asymptotic confidence intervals for indirect effects in structural equation models. [book
auth.] S. Leinhart. Sociological methodology. San Francisco : Jossey-Bass, 1982.
Solms, R., von and Niekerk, J., van. 2013. From information security to cyber security. computers & security.
2013, Vol. 38.
SoSci Survey GmbH. 2015. SoSci Survey. [Online] 2015. https://www.soscisurvey.de/.
Soubelet, A. and Salthouse, T. A. 2011. Developmental Psychology. Personality–Cognition Relations Across
Adulthood. 2011, Vol. 47, 2.
Southwell, B. G. and Yzer, M. C. 2007. The Roles of Interpersonal Communication in Mass Media Campaigns.
Communication Yearbook. 31, 2007.
Stajano, F. 2010. Security Issues in Ubiquitous Computing. Handbook of Ambient Intelligence and Smart
Environments. s.l. : Springer US, 2010.
Starner, T. 2001a. The challenges of wearable computing: Part 1. IEEE Micro. 2001a.
—. 2001b. The challenges of wearable computing: Part 2. IEEE Micro. 2001b.
Statistisches Bundesamt. 2017. Destatis. Zahlen & Fakten. [Online] 2017. [Cited: 09 01 2017.]
https://www.destatis.de/DE/Startseite.html.
References 255
Steffens, P. R. and Murthy, D. N. P. 1992. A mathematical model for new product diffusion: The influence of
innovators and imitators. Mathematical and Computer Modelling. 1992, Vol. 16, 4.
Steg, L. and Vlek, C. 2008. Encouraging pro-environmental behaviour: An integrative review and research.
Journal of Environmental Psychology. 2008, Vol. 29.
Stenbacka, C. 2001. Qualitative research requires quality concepts of its own. Management Decision. 2001,
Vol. 39, 7.
Stewart, K. J. 1999. Transference as a means of building trust in world wide web sites. Proceedings of the 20th
International Conference on Information Systems. 1999, S. 459–464.
Strauss, A. L. and Corbin, J. M. 1998. Basics of qualitative research. . s.l. : Sage Publications, 1998.
Suh, B. and Han, I. 2002. Effect of trust on customer acceptance of Internet banking. Electronic Commerce
Research and Applications. 2002, Vol. 1.
Summers, J. 2005. Sports Marketing. s.l. : Cengage Learning Australia, 2005.
Summers, J. and Johnson-Morgan , M. 2005. Sports Marketing. s.l. : Cengage Learning Australia, 2005.
Sun, D.-Z., et al. 2008. A New Design of Wearable Token System for Mobile Device Security. IEEE
Transactions on Consumer Electronics. 2008.
Sun, L. 2016. Wearables Stocks: What to Watch in 2017. [Online] 2016. [Cited: 05 06 2017.]
https://www.fool.com/investing/2016/11/29/wearables-stocks-what-to-watch-in-2017.aspx.
Sutton, S., et al. 2003. Eliciting salient beliefs in research on the theory of planned behaviour: The effect of
question wording. Current Psychology. 2003, Vol. 22, 3.
SVB. 2014. The Quantified Self - Market Overview and ProprietaryFinancial Intelligence. Silicon Valley Bank.
[Online] 2014. https://www.svb.com/uploadedFiles/Blogs/Steve_Allan/svb-quantified-self-report-0614.pdf.
Svendsen, G. B., et al. 2013. Personality and technology acceptance: the influence of personality factors on the
core constructs of the Technology Acceptance Model. Behaviour & Information Technology. 2013, Vol. 32, 4.
Swaminathan, V., Zinkhan, G. M. and Reddy, S. K. 1996. The evolution and antecedents of transformational
advertising: A conceptual model. Advances in consumer research. 1996, Vol. 23, 1.
Swan, M. 2013. The quantified self: Fundamental disruption in big data science and biological discovery. Big
Data, 1(2).
Swan, M. 2012. Sensor Mania! The Internet of Things, Wearable Computing, Objective Metrics, and the
Quantified Self 2.0. Journal of Sensor and Actuator Networks. 2012.
Sweeney, J. C., Soutar, G. N. and Johnson, L. W. 1999. The role of perceived risk in the quality-value
relationship: A study in a retail environment. Journal of retailing. 1999, Vol. 75, 1.
Szajna, B. 1996. Empirical evaluation of the revised technology acceptance model. Management science. 1996,
Vol. 42, 1.
Szopa, A. 2015. Competitive Strategies for Academic Entrepreneurship: Commercialization of Research-Based
Products. s.l. : IGI Global, 2015.
TAG Heuer. 2015. TAG Heuer, Google, and Intel Announce Swiss Smartwatch Collaboration. [Online] 2015.
https://www.tagheuer.com/en/news/tag-heuer-google-and-intel-announce-swiss-smartwatch-collaboration.
256 References
Talke, K. and Heidenreich, S. 2014. How to Overcome Pro‐Change Bias: Incorporating Passive and Active
Innovation Resistance in Innovation Decision Models. Journal of Product Innovation Management. 2014, Vol.
31, 5.
Tam, K. Y. and Ho, S. Y. 2005. Web Personalization as a Persuasion Strategy: An Elaboration Likelihood
Model Pespective. Information Systems Research. 2005, Vol. 16, 3.
Tan, S. J. 1999. Strategies for reducing consumers’ risk aversion in Internet shopping. Journal of Consumer
Marketing. 1999, Vol. 16, 2.
Tavakol, M. and Dennick, R. 2011. Making sense of Cronbach's alpha. International Journal of Medical
Education. 2011.
Tayler, S. and Todd, P. 1995b. Understanding information technology usage: A test of competing models.
Information systems research. 1995b, Vol. 6, 2.
Taylor, S. and Todd, P. 1995a. Decomposition and crossover effects in the theory of planned behavior: A study
of consumer adoption intentions. International Journal of Research in Marketing. 1995a, Vol. 12, 2.
Teh, P. S., Teoh, A. B. J. and Yue, S. 2013. A survey of keystroke dynamics biometrics. The Scientific World
Journal. 2013.
Tehrani, K. and Michael, A. 2014. Wearable Technology and Wearable Devices: Everything You Need to
Know. Wearable Devices Magazine. [Online] 03 2014. http://www.wearabledevices.com.
Tenenhaus, M. 2005. Structural Equation Modelling for small samples. s.l. : Groupe HEC, 2005.
Teo, T. 2008. Modelling technology acceptance in education: A study of pre-service teachers. Computers &
Education. 2008.
Teo, T. S. H. and Pok, S. H. 2003. Adoption of WAP-enabled mobile phones among Internet users. Omega
International Journal of Management Science. 2003, Vol. 31.
Terhanian, G. and Bremer, J. 2012. A smarter way to select respondents for surveys. International Journal of
Market Research. 2012, Vol. 54, 6.
Thatcher, J. B., et al. 2011. The role of trust in postadoption it exploration: An empirical examination of
knowledge management systems. [ed.] IEEE. Transactions on Engineering Management. 2011, Vol. 58, 1.
Thierer, A. D. 2015. The internet of things and wearable technology: Addressing privacy and security concerns
without derailing innovation. [ed.] George Mason University. Virginia : Mercatus Center, 2015.
Thompson, R. L., Higgins, C. A. and Howell, J. M. 1991. Personal computing: toward a conceptual model of
utilization. MIS quarterly. 1991, Vol. 15, 1.
Thorne, M. and Giesen, M. 2003. Statistics for the Behavioral Sciences. 4th. s.l. : McGraw-Hill Education,
2003.
Thorp, E. O. 1998. The invention of the first wearable computer. [ed.] IEEE. Wearable Computers, 1998.
Digest of Papers. Second International Symposium on. 1998.
Titcomb, J. 2016. Researchers create 'smart tattoos' that can control your phone. The Telegraph. [Online] 2016.
[Cited: 08 19, 2017.] http://www.telegraph.co.uk/technology/2016/08/15/researchers-create-smart-tattoos-that-
are-able-to-control-your-p/.
References 257
—. 2017. Tablet sales to fall for third successive year as PC market stabilises . [Online] 2017. [Cited: 30 5
2017.] http://www.telegraph.co.uk/technology/2017/01/11/tablet-sales-fall-third-successive-year-pc-market-
stabilises/.
Toft, M. B., Schuitema, G. and Thøgersen, J. 2014. Responsible technology acceptance: Model development
and application to consumer acceptance of Smart Grid technology. Applied Energy, Vol. 134.
Toluna, Inc. 2018. Corporate Memberships. [Online] Available at: http://www.toluna-group.com/en-gb/about-
toluna/about/awards-associations [Accessed 06 05 2018].
Toluna USA, Inc. 2016b. Data Quality Approach. toluna-group. [Online] 2016b. http://www.toluna-
group.com/about-toluna/about/data-quality-approach.
—. 2016a. toluna-group. [Online] 2016a. http://www.toluna-group.com/en-gb/.
Toluna.com. 2016. PanelBook 2016. [Online] 2016. http://www.toluna-group.com/docs/default-
source/Brochure_Docs/panelbook.pdf?sfvrsn=12.
Topi, H. and Tucker, A. 2014. Computing Handbook, Third Edition: Information Systems and Information
Technology. s.l. : CRC Press, 2014.
Topolovcan, T. and Matijevic, M. 2015. Distinctions between computer self-efficacy of pupils and teachers in
elementary school. European Journal of Open, Distance and E-learning. 2015, Vol. 18, 2.
Topor, F. S. 2016. Handbook of Research on Individualism and Identity in the Globalized Digital Age. s.l. : IGI
Global, 2016.
Tornatzky, L. G. and Klein, K. J. 1982. Innovation characteristics and innovation adoption-implementation: A
meta-analysis of findings. IEEE Transactions on Engineering Management. 1982, Vol. 29, 1.
Tractica. 2016. Wearable device sales revenue worldwide from 2015 to 2021 (in billion U.S. dollars). Statista.
[Online] 2016. [Cited: 08. 06 2017.] https://www.statista.com/statistics/610447/wearable-device-revenue-
worldwide/.
Tsai, Y. C. and Yeh, J. C. 2010. Perceived risk of information security and privacy in online shopping: A study
of environmentally sustainable products. African Journal of Business Management. 2010, Vol. 4, 18.
Tsiakis, T., 2012. Consumers’ Issues and Concerns of Perceived Risk of Information Security in Online
Framework. The Marketing Strategies. Procedia - Social and Behavioral Sciences, Volume 62.
Tsui, J. 2015. The relationship between consumers, wearable technology and fashion brands. [Online]
Lightspeed GMI APAC (Kantar, WPP Group), 2015. [Cited: 01 06 2017.]
http://www.lightspeedresearch.com/newsletter-q3-2015/relationship-consumers-wearable-technology-fashion-
brands/.
Tung, Y. C., et al. 2015. User-defined game input for smart glasses in public space. Proceedings of the 33rd
Annual ACM Conference on Human Factors in Computing Systems. 2015.
Tuomela, R. 2000. Belief versus acceptance. Philosophical Explorations. 2000.
Tuten, T. L. and Bosnjak, M. 2001. Understanding differences in web usage: The role of need for cognition
and the five factor model of personality. Social Behavior and Personality: an international journal. 2001, Vol.
29, 4.
Ueltschy, L. C. and Laroche, M. 2011. Co-Branding Internationally: Everyone Wins? Journal of Applied
Business Research. 2011, Vol. 20, 3.
258 References
Urbach, N. and Ahlemann, F. 2010. Structural equation modeling in information systems research using partial
least squares. Journal of Information Technology Theory and Application. 2010, Vol. 11, 2.
Van der Heijden, H. 2004. User acceptance of hedonic information systems. MiS Quarterly. 2004, Vol. 28, 4.
van der Lans, I. A. and Heiser, W. J. 1988. Nonlinear analysis of multiplicative rules in expectancy-value
models. [Online] 1988. http://www.datatheory.nl/pdfs/88/88_06.pdf.
Vance, A., Elie-Dit-Cosaque, C. and Straub, D. W. 2008. Examining trust in information technology artifacts:
the effects of system quality and culture. Journal of Management Information Systems. 2008, Vol. 24, 4.
Vannette, D. 2015. 4 Things You Need to Know About Your Respondents Before You Survey Them. [Online]
Available at: https://www.qualtrics.com/blog/the-4-things-you-need-to-know-about-your-respondents-before-
you-survey-them/ [Accessed 03 05 2018].
Varma Citrin, A., et al. 2000. Adoption of Internet shopping: the role of consumer innovativeness. Industrial
management & data systems. 2000, Vol. 100, 7.
Vaughan, G. M. and Hogg, M. A. 2013. Social Psychology. s.l. : Pearson Higher Education AU, 2013.
Venkataram, P. 2010. Wireless & Mobile N/W Security. s.l. : Tata McGraw-Hill Education, 2010.
Venkatesh, V. 2000. Determinants of perceived ease of use: Integrating control, intrinsic motivation, and
emotion into the technology acceptance model. Information systems research. 2000, Vol. 11, 4.
Venkatesh, V. and Davis, F. D. 1996. A model of the antecedents of perceived ease of use: Development and
test. Decision Sciences. 1996, Vol. 27, 3.
—. 2000. A theoretical extension of the technology acceptance model: Four longitudinal field studies.
Management science. 2000, Vol. 46, 2.
Venkatesh, V., et al. 2003. User acceptance of information technology: Toward a unified view. MIS quarterly.
2003, Vol. 27, 3.
Verkasalo, H., et al. 2010. Analysis of users and non-users of smartphone applications. Telematics and
Informatics. 2010, Vol. 27, 3.
Verplanken, B., Hazenberg, P. T. and Palenewen, G. R. 1992. Need for cognition and external information
search effort. Journal of Research in Personality. 1992, Vol. 26, 2.
Vijayasarathy, L. R. and Jones, J. M. 2000. Print and Internet catalog shopping: assessing attitudes and
intentions. Internet Research. 2000, Vol. 10, 3.
Viseu, A. 2003. Social dimensions of wearable computers: an overview. Technoetic Arts. 2003, Vol. 1.
Vodanovich, S., Sundaram, D. and Myers, M. 2010. Digital Natives and Ubiquitous Information Systems.
Information Systems Research. 2010, Vol. 21, 4.
Wagner, A. 2015. New study examines smartphone and tablet adoption, Android vs. iOS across many countries.
[Online] PhoneDog, LLC, 2015. [Cited: 30 5 2017.] http://www.phonedog.com/2015/01/13/new-study-
examines-smartphone-and-tablet-adoption-android-vs-ios-across-many-countries.
Wang, H. C., Pallister, J. G. and Foxall, G. R. 2006. Innovativeness and involvement as determinants of
website loyalty: II. Determinants of consumer loyalty in B2C e-commerce. Technovation. 2006, Vol. 26, 12.
Wang, W. and Benbasat, I. 2008. Attributions of trust in decision support technologies: A study of
recommendation agents for e-commerce. Journal of Management Information Systems. 2008, Vol. 24, 4.
References 259
Wankhade, L. and Dabade, B. 2010. Quality Uncertainty and Perception: Information Asymmetry and
Management of Quality Uncertainty and Quality Perception. s.l. : Springer Science & Business Media, 2010.
Want, R., Schilit, B. N. & Jenson, S. 2015. Enabling the internet of things. Computer, 48(1).
Watson, D. C. 2014. Materialism: Profiles of agreeableness and neuroticism. Personality and Individual
Differences. 2014, Vol. 56.
Weathington, J. 2014. Double down on your big data play in wearables. TechRepublic. [Online] 2014.
http://www.techrepublic.com/article/double-down-on-your-big-data-play-in-wearables/.
Weber, M. 1947. The Theory Of Social And Economic Organization. s.l. : Oxford University Press, 1947.
Webster, J. and Watson, R. T. 2002. Analyzing the past to prepare for the future: Writing a literature review.
MIS quarterly. 2002.
Wells, W. D. 1993. Discovery-oriented consumer research. Journal of Consumer Research. 1993, Vol. 19, 4.
Wessely, P. 2010. Value Determination of Supply Chain Initiatives: A Quantification Approach Based on Fuzzy
Logic and System Dynamics. St. Gallen : Springer Science & Business Media, 2010.
Westland, J. C. 2015. Structural Equation Models. From Paths to Networks. s.l. : Springer International
Publishing Switzerland, 2015.
Wetzels, M., Odekerken-Schröder, G. and Van Oppen, C. 2009. Using PLS path modeling for assessing
hierarchical construct models: Guidelines and empirical illustration. MIS Quarterly. 2009, Vol. 33, 1.
Wilson, B. and Henseler, J. 2007. Modeling reflective higher-order constructs using three approaches with PLS
path modeling: a Monte Carlo comparison. ANZMAC. 2007.
Wisdom, J. P., et al. 2015. Innovation Adoption: A Review of Theories and Constructs. [Online] 2015. [Cited:
06 06 2017.] https://www.ncbi.nlm.nih.gov/pmc/articles/PMC3894251/.
Witte, H., Rathgeb, C. and Busch, C. 2013. Context-Aware Mobile Biometric Authentication based on
Support Vector Machines. In Proceedings of the 4th International Conference on Emerging Security
Technologies (EST13). 2013.
Wold, H. 1982. Soft modeling: The basic design and some extensions. [ed.] K. G. Jöreskog. Systems under
indirect observation: Causality, structure, prediction. Amsterdam : North-Holland, 1982.
Wooldridge, J. M. 2015. Introductory Econometrics: A Modern Approach. s.l. : Cengage Learning, 2015.
Wright, S. 1921. Correlation and causation. Journal of agricultural research. 1921, Vol. 20, 7.
Wrona, K. and Gomez, L. 2005. Context-aware security and secure context-awareness in ubiquitous computing
environments. XXI Autumn Meeting of Polish Information Processing Society. 2005.
Wu, J., et al. 2016. Competition in wearable device market: the effect of network externality and product
compatibility. Electronic Commerce Research. 2016.
Wu, J.-H. and Wang, S.-C. 2005. What drives mobile commerce?: An empirical evaluation of the revised
technology acceptance model. Information & Management. 2005, Vol. 42, 5.
Wu, L.-H., Wu, L.-C. and Chang, S.-C. 2016. Exploring consumers' intention to accept smartwatch.
Computers in Human Behavior. 2016, Vol. 64.
Wübben, M. 2009. Analytical CRM: Developing and Maintaining Profitable Customer Relationships in Non-
Contractual Settings. s.l. : Springer Science & Business Media, 2009.
260 References
Wünderlich, N. 2009. Acceptance of Remote Services: Perception, Adoption, and Continued Usage in
Organizational Settings. s.l. : Springer, 2009.
Xu, W., Xin, Y. and Lu, G. 2007. A System Architecture for Pervasive Computing. [ed.] ICNC 2007. Third
International Conference on Natural Computation. 2007, Vol. 5.
Yamada, S. and Kamioka, E. 2005. Access control for security and privacy in ubiquitous computing
environments. IEICE transactions on communications. 2005.
Yang, H. E. and Wu, C. C. 2009. Effects of image interactivity technology adoption on e-shoppers' behavioural
intentions with risk as moderator. Production Planning and Control. 2009, Vol. 20, 4.
Yang, H., et al. 2016. User acceptance of wearable devices: An extended perspective of perceived value.
Telematics and Informatics. 2016, Vol. 33, 2.
Yang, H.-D. and Yoo, Y. 2004. It’s all about attitude: revisiting the technology. Decision Support Systems.
2004, Vol. 38, 1.
Yavuz, S. U., Bordegoni, M. and Carulli, M. 2014. A Design Practice on Communicating Emotions Through
Visual, Tactile and Auditory Simulations. [ed.] A. Chakrabarti. ICoRD’15 – Research into Design Across
Boundaries Volume 1: Theory, Research Methodology, Aesthetics, Human Factors and Education. s.l. :
Springer, 2014.
Yi, M. Y., et al. 2006. Understanding information technology acceptance by individual professionals: Toward an
integrative view. Information & Management. 2006, Vol. 43, 3.
Yin, R. K. 1989. Case study research: design and methods. Newbury : Sage Publications, 1989.
Yoon, C. and Kim, S. 2007. Convenience and TAM in a ubiquitous computing environment: The case of
wireless LAN. Electronic Commerce Research and Applications. 2007, Vol. 6, 1.
Youjae, Y. I. 1989. An investigation of the structure of expectancy-value attitude and its implications.
International Journal of Research in Marketing. 1989, Vol. 6, 2.
Yu, J., et al. 2015. User acceptance of media tablets: An empirical examination of perceived value. Telematics
and Informatics. 2015.
Yun, Y. 2013. Understanding Product Attachment and Expected Product Lifetime by Extending Technology
Acceptance Model (TAM) with Product Personalization and Innovation Diffusion Theory (IDT). East Lansing,
USA : Michigan State University, 2013. Dissertation.
Zachariadis, M., Scott, S. and Barrett, M. 2013. Methodological Implications of Critical Realism for Mixed-
Methods Research. MIS quarterly. 2013, Vol. 37, 7.
Zaichkowsky, J. L. 1986. Conceptualizing involvement. Journal of advertising. 1986, Vol. 15, 2.
—. 1985. Measuring the involvement construct. Journal of consumer research. 1985, Vol. 12, 3.
—. 1994a. Research Notes: The Personal Involvement Inventory: Reduction, Revision, and Application to
Advertising. Journal Of Advertising. 1994, Vol. 23, 4.
—. 1994b. The personal involvement inventory: Reduction, revision, and application to advertising. Journal of
advertising, 23(4).
ZEISS Group. 2017. Deutsche Telekom and ZEISS Collaborate in the Field of Smart Glasses. ZEISS optics and
Telekom's network technology may make data glasses easy to use and wear in the future. [Online] 2017.

References 261
https://www.zeiss.com/corporate/int/zeiss-corporate-newsroom/news/press-releases.html?id=smart-
glasses_2017.
Zeithaml, V. A. 1988. Consumer perceptions of price, quality, and value: a means-end model and synthesis of
evidence. Journal of Marketing. 1988, Vol. 52, 3.
Zhang, J., Reithel, B. J. and Li, H. 2009. Impact of perceived technical protection on security behaviors.
Information Management & Computer Security. 2009, Vol. 17, 4.
Zhang, Z., et al. 2013. Compressed sensing for energy-efficient wireless telemonitoring of noninvasive fetal
ECG via block sparse Bayesian learning. Biomedical Engineering, IEEE Transactions on. 2013.
Zhou, J., Dovidio, J. and Wang, E. 2013. How Affectively-Based and Cognitively-Based Attitudes Drive
Intergroup Behaviours: The Moderating Role of Affective-Cognitive Consistency. PLoS ONE. 2013, Vol. 8, 11.
Zhou, T. and Lu, Y. 2011. The effects of personality traits on user acceptance of mobile commerce. Intl.
Journal of Human–Computer Interaction. 2011.
Zorz, M. 2014. Wearable technology privacy and security issues. [Online] 2014. http://www.net-
security.org/article.php?id=2002&p=1.
Zuckerman, M. 1979. Sensation seeking. s.l. : Corsini Encyclopedia of Psychology, 1979.
—. 2014. Sensation Seeking (Psychology Revivals): Beyond the Optimal Level of Arousal. s.l. : Psychology
Press, 2014.

262 Appendix
Appendix
A.1) Interview Guide
Research Project: Acceptance of Wearable Computing
Institution: School of Computing, Electronics and Mathematics, Plymouth University
Interviewer: Lena Gribel
• Entry to subject area
o We are interested in the development of the future market „Wearable Technology“. In our con-
text the term “Wearable Computing” is to be understood as the constant application of porta-
ble, continuously running computer systems, e.g. smartwatches or smart glasses. From your
point of view, what role do wearable technologies play for you personally? And what role do
wearable technologies play in your company? What technologies are utilized for what
purposes?
• Assessment wearable technologies
o What is your assessment regarding the current development of the wearable technology
market? What market potential do you see?
o What factors (e.g. technological, economic or social) contribute most to the dissemination of
wearables on consumer markets?
• Wearable technologies in companies
o What insights did you gain about wearables in respect of customer relevance and productive
use?
o What kind of wearables will become most important for stakeholders in the coming years, e.g.
smartwatches, smart glasses, smart clothes?
o What in your opinion are the main incentives for integrating such technologies in everyday
life? Please sort the following topics by relevance ranking:
i. Boost of personal abilities,
ii. Improvement of health and fitness,
iii. Boost of self-confidence,
iv. Helps feel more in control of personal life,
v. Enhancement of social relationships.
o What do you expect from wearable computing solutions? What functionalities are of major
significance, e.g. certain sensory features or context-awareness?
o What risks have to be addressed in particular (e.g. functional risk, economic risk, social risk,
IT security risk, etc.)?
o In your opinion, what changes of behavioural habits are likely to occur? How do you assess the
significance of the wearable computing phenomenon for society?
• Closing question
o First of all, thank you for your information! Would you like to discuss any further topic-related
issues outside the matters raised so far?

Appendix 263
A.2) Interview Transcript 1
We are interested in the development of the future market „Wearable Technology“. In our context the term 1
“Wearable Computing” is to be understood as the constant application of portable, continuously running 2
computer systems, e.g. smartwatches or smart glasses. From your point of view, what role do wearable 3
technologies play for you as a professional? And what role do wearable technologies play in your company? 4
What technologies are utilized for what purposes? 5
Personally, a relatively small role, as there are no real application scenarios yet in a company context where we 6
actually use wearables. But in our company, there are now diverse activities that are slowly leading us in this 7
direction. We realise that wearables represent a technology which surely will widely disseminate on the market 8
and it is thus important to deal with this subject generally. We now have developed a first application that lets you, 9
for instance, park a car by means of a smartwatch. However, there are furthermore diverse thoughts for e.g. 10
production support in industries; capture things by the use of wearable technologies, that is to accelerate processes, 11
but also to capture the state of the employees. Indeed, the topic ‘health’ is something that in agreement with the 12
works council sooner or later will become a very interesting matter, but also the topic ‘support’, that is, the 13
application of wearables in the daily doing is quite promising. There, wearable technologies will be extremely 14
useful for sure. 15
What is your assessment regarding the current development of the wearable technology market? Can you 16
see there any market potential? 17
Yes, indeed. There are certain products that actually, upon closer inspection, seem more promising than they 18
actually are. However, the issue sensor technology and wearables - everything that doesn’t heavily depend on the 19
shell of man - possesses market potential. 20
To me, glasses are not that promising, as their technological level still is fairly low. It depends on the person 21
wearing the glasses; for example, visual impairments, different proportions and so forth should be considered. This 22
does not hold for smartwatches or smart wristbands since they can be used comparatively freely. 23
24
What kind of wearables will become most important for stakeholders in the coming years, e.g. 25
smartwatches, smart glasses, smart clothes? 26
Smartwatches, wristbands. Further on, there are also smart rings for controlling and diverse sensory that gather 27
data from the person him/herself. 28
29
What factors (e.g. technological, economic or social) contribute most to the dissemination of wearables on 30
consumer markets? 31
None of these aspects of use, neither nor. I think this is because people have understood that even smartphones are 32
already complicated devices. I mean, it’s like this: They are not made in a way that one continuously checks them, 33
they don’t provide hands-free working; at least one hand is always blocked and information is comparably difficult 34
to access. I mean, in the meantime there are people who perceive their smartphone’s vibration in the pocket where 35
there is no actual vibration. Then they get their phones out of their pockets and take a look and if there is no call 36
or notification they put it back in the pocket what is clearly very cumbersome. Even though these devices are 37
always carried around, they are not fully integrated into the working environment. They continue to represent 38
foreign objects and, in some situations, even pose a danger. For example, at hazardous workplaces, where staff 39

264 Appendix
have to climb a ladder in order to measure something by electronical device. Traditionally, these devices have to 40
be get out of the pocket first, what might be very dangerous. Against this backdrop, wearables offer more security. 41
Things become just very much characterised by technology by now. People realise that things become simpler by 42
means of technologies. Thereby, information can be accessed quicker and easier. That information can be rapidly 43
accessed is particularly interesting from a company perspective, as well. 44
For example, a study of a German automobile manufacturer: two productions lines had been set up and the new 45
products had supported the processes differently: 46
• number 1 with a smart glass (primarily for documentation) 47
• number 2 with a smartwatch 48
It has been shown that on average four mistakes in the production could be reduced to 2,2 errors with smart glasses 49
and with smartwatches even up to 0,8 errors, simply because there was support regarding which step had to be 50
performed next. Thus, efficiency enhancement has been generated within the frame of the process. The smartwatch 51
has helped the employees without impeding them from work. It is also clear, that there are reservations which hold 52
also for the smartphone, for instance that it would be just a toy. Also, personal data pose severe concerns as well 53
as IT security threats. In addition, hygiene factors are relevant, for example in the course of varying work shifts 54
where employees have to share one pair of smart glasses this probably would be a problem. 55
56
What in your opinion are the main incentives for integrating such technologies in everyday life? Please sort 57
the following topics by relevance ranking: 58
I. Boost of personal abilities, 59
II. Improvement of health and fitness, 60
III. Boost of self-confidence, 61
IV. Helps feel more in control of personal life, 62
V. Enhancement of social relationships. 63
From the point of view of a company, boost of personal abilities is absolutely important in specific areas. 64
Permanent Control: if a process gets boring, it sometimes is too bothersome to look explicitly at the instructions 65
once more. The easier an information is accessibly the more likely it is that you look a glance once again and that 66
mistakes are avoided. Our workplace is becoming more and more complex; people have to cope with new tasks 67
that are no more ordinary. For example, if one has to check an object whether it is working or not and, at the same 68
time, processes are still not internalised, then such information concerning what to do are very valuable. In other 69
words, enhancement of proficiencies and benefits of reduced workload; you have always your instructions with 70
you and can browse it rapidly where necessary. 71
Social relationships if related to communication in a wider sense may be enhanced as well. This short chat-based 72
information would be interesting, that is if you could have relevant information sent to you in real time. 73
Improvement of health and fitness goes along the lines of fitness, what isn’t of relevance from a company’s 74
viewpoint. Health should be considered as a separate aspect. 75
Hopefully, wearables will be given to those people who need them, especially in financial terms. We need to get 76
away from a society which conceives the iPhone as awesome. This is a work equipment and if an employee gets 77
a watch it is not meant as a means of expressing oneself, but rather it serves to optimise his/her processes and if 78
he or she thereby gets more self-confidence it would be not the prime objective from a company’s view point. 79
Social relationships should be treated with caution; sure, there are companies which consider this, but only a few 80
in Germany. From a company perspective, I would thus focus primarily on the enhancement of abilities. 81
82

Appendix 265
In your opinion, what changes of behavioural habits are likely to occur? How do you assess the importance 83
of the wearable computing phenomenon for society? 84
I am very much in favour of the idea of gamification and I could image that if one succeeds in analysing the basic 85
human vital signs that it would be of great benefit to be able to challenge with others, as people could live report 86
everything. Or in the area of health: that for specific professions the workload would be captured without the need 87
for monitoring, so that their work environment can better be organised. It could lead to a mergence of private and 88
business life and we would have to face the challenge that people would use wearables in private life, as well. The 89
problem here is that companies would have access to personal data. These are the considerations one must face. It 90
would be a nightmarish thought if a company would know about all employees how long and how well he/she has 91
slept; this would be this surveillance phenomenon regarding the privacy risks.92
93

266 Appendix
A.3) Interview Transcript 2
We are interested in the development of the future market „Wearable Technology“. In our context the term 1
“Wearable Computing” is to be understood as the constant application of portable, continuously running 2
computer systems, e.g. smartwatches or smart glasses. From your point of view, what role do wearable 3
technologies play for you as a professional? 4
It is interesting what progress we have made here. At the moment we have mobile phones and laptops. Wearables 5
are very important to me. Yet, their development is at the beginning. We have to wait and see what the future holds 6
and how acceptance could be developed in the population; and will wearables be affordable for all end consumers 7
or will we see them only in the professional sector. 8
9
And what role do wearable technologies play in your company? What technologies are utilized for what 10
purposes? 11
At the moment we don’t sell many, but we are gearing ourselves to a future where the field of wearable computing 12
is much more extended. 13
14
What is your assessment regarding the current development of the wearable technology market? What 15
market potential do you see? 16
I can see a great market potential for wearables, but as I said, wearables like Google Glass are crucially contingent 17
upon the pricing structure. Everything that goes beyond 1.000 € won’t function for sure. If we succeed to manage 18
wearables which are in the 300 € range, what we had experienced with tablet PCs, then they will assert themselves. 19
Sometimes the banal principle of Microsoft suffices, where the product matures on the customer’s side […] then 20
I think that the development needs to find its way. 21
22
What factors (e.g. technological, economic or social) contribute most to the dissemination of wearables on 23
consumer markets? 24
Social aspects, i.e. definitely the topic styling. I don’t think that you can assess this under an exclusively practical 25
point of view, as can be seen from the success of Apple’s Iphone. Not the most important product on market wins, 26
but rather the product with the greatest innovativeness; what moreover, let me put it like this, is effective as good 27
publicity. Well, I think that Microsoft has done well with its HoloLens. They have realised that the soft factors 28
particularly make a decisive contribution to the acceptance of the product. In the end, the topic is pretty complex, 29
lying in a grey zone, so that the question can’t be answered by yes or no. 30
31
What insights did you gain about wearables in respect of customer relevance and productive use? 32
You can notice that the customers are very curious and want to participate. However, as I said above, Microsoft 33
got on its knees with its Google Glasses; since then, they have become much more cautious. 34
35
What kind of wearables will become most important for stakeholders in the coming years, e.g. 36
smartwatches, smart glasses, smart clothes? 37

Appendix 267
In any case smartwatches, as they have already been established and it represents a fashion product. This fits very 38
well into contemporary times. I guess that in future more will happen with smart glasses. 39
40
What do you expect from wearable computing solutions? What functionalities are of major significance, 41
e.g. certain sensory features or context-awareness? 42
That prices will be favourable, that is, that they will become affordable and that they will fit well into the personal 43
lifestyle. Besides, they should be based on standards; however, one still doesn’t know in which direction they will 44
develop. For example, by means of the HoloLens many peripherals could be eliminated; all monitors, all displays, 45
all that stuff could be left out. Iphones and stuff could be left out. This would bring much development potential 46
and cost-saving opportunities at other points. Yet, it requires a certain standardisation upon extant standards and 47
the possibility, that they gain broad acceptance and an according lobby. I furthermore don’t believe that the 48
manufacturers of monitors will simply let things go their own course. The free market will not permit this. The 49
macro-environmental factors are too complex. The development heavily depends on whether a major manufacturer 50
exterminating the others will get established or a technology will be developed at great expense that generate added 51
value. Manufacturers which don’t contribute to the glasses’ development will make every effort to impede them 52
from succeeding. It doesn’t depend on whether or not people want this, but on whether this will be enforced. 53
54
What risks have to be addressed in particular (e.g. functional risk, economic risk, social risk, IT security 55
risk, etc.)? 56
I can see a financial risk in terms of a corporate risk. I would approve such standards, which were for example 57
developed at Fraunhofer Institute and which then would be offered to other companies and thus could slip the new 58
techniques in. This would be certainly helpful; better than if a concern would obtain exclusive rights to it and then 59
would attempt to get started on market as a standalone player. 60
61
What risks have to be addressed from a consumer perspective? 62
Undoubtedly, data privacy and IT security play a role; but this is a more global theme. My answer above referred 63
to the hardware, not to the software. If there would be a complex operating system and it would be spurred and 64
certain data could be derived by sensors and these data would be provided for economy, then this would pose a 65
risk to the protection of personal data. But this risk is not inherent to wearable technologies. In other words: the 66
problem doesn’t start with wearables, but with data security. For instance: the operating system Microsoft – this 67
is literally a spy in the house. We should try to maintain our data protection and security standards and not to focus 68
on what could happen; because you can intercept this in the case of wearables. In the case of things that proceed 69
in the background, for example fingerprint, it becomes much more complicated. In sum, I don’t think that the end 70
user is more jeopardised than usual. The risk must be differentiated according to a hardware and a software 71
perspective. Nevertheless, I would not exclude it that wearables might fuel the possibility of eavesdropping 72
sensitive data. However, I do not want to indicate this: the main point is that we have new technologies. 73
74
In your opinion, what changes of behavioural habits are likely to occur? How do you assess the importance 75
of the wearable computing phenomenon for society? 76
The society will have to deal with the fact that you have your high-performance electronics always with you and 77
that you can make full use of it. This will lead to a division of society, as there are on the one hand those who can 78

268 Appendix
use it as they can afford it and on the other hand those who can’t use it because of financial and other aspects. For 79
instance, people with and those without an iPhone; some just can’t afford them. As a result, the society already 80
diverges heavily what poses also a risk. The society will definitely change and become more reliantly. By means 81
of wearables people will begin to live increasingly with digital data. The living comfort will be put upward 82
pressure. One can already see smartphones everywhere, in every tram, in every bus. And in the case of wearables 83
it becomes even easier to take a quick look and also to access information ubiquitously, permanently. You can see 84
who have called you, all appointments, the heart rate, and such things. People will increasingly start to network. 85
86
First of all, thank you for your information! Would you like to discuss any further topic-related issues 87
outside the matters raised so far? 88
One ends up wondering how this will be implemented as a whole and how to live and to cope with it. Only because 89
all is possible it doesn’t mean that you must do all. If this were to be the case than you have to take advantage of 90
it – or can you skip a thing in advance due to data privacy or ethical or other reasons? We have manufacturers of 91
the new virtual reality glasses where FSK approval only be obtained from 10 years onwards. I think this is rightly. 92
You have no experience yet regarding to those who grew up with these technologies and who are just technophile. 93
It is also not yet known what will happen later in the market. You have to look forward to this. But particularly in 94
the private sector it is exciting in any case how all this will develop.95
96
97
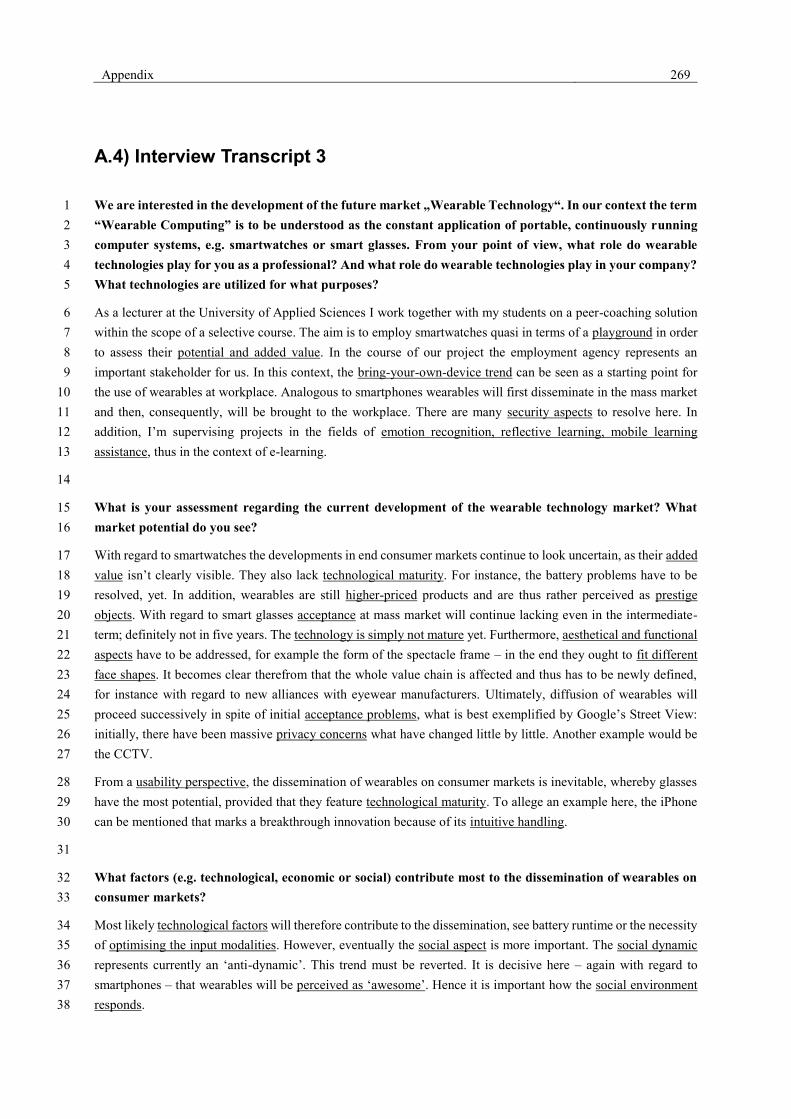
Appendix 269
A.4) Interview Transcript 3
We are interested in the development of the future market „Wearable Technology“. In our context the term 1
“Wearable Computing” is to be understood as the constant application of portable, continuously running 2
computer systems, e.g. smartwatches or smart glasses. From your point of view, what role do wearable 3
technologies play for you as a professional? And what role do wearable technologies play in your company? 4
What technologies are utilized for what purposes? 5
As a lecturer at the University of Applied Sciences I work together with my students on a peer-coaching solution 6
within the scope of a selective course. The aim is to employ smartwatches quasi in terms of a playground in order 7
to assess their potential and added value. In the course of our project the employment agency represents an 8
important stakeholder for us. In this context, the bring-your-own-device trend can be seen as a starting point for 9
the use of wearables at workplace. Analogous to smartphones wearables will first disseminate in the mass market 10
and then, consequently, will be brought to the workplace. There are many security aspects to resolve here. In 11
addition, I’m supervising projects in the fields of emotion recognition, reflective learning, mobile learning 12
assistance, thus in the context of e-learning. 13
14
What is your assessment regarding the current development of the wearable technology market? What 15
market potential do you see? 16
With regard to smartwatches the developments in end consumer markets continue to look uncertain, as their added 17
value isn’t clearly visible. They also lack technological maturity. For instance, the battery problems have to be 18
resolved, yet. In addition, wearables are still higher-priced products and are thus rather perceived as prestige 19
objects. With regard to smart glasses acceptance at mass market will continue lacking even in the intermediate-20
term; definitely not in five years. The technology is simply not mature yet. Furthermore, aesthetical and functional 21
aspects have to be addressed, for example the form of the spectacle frame – in the end they ought to fit different 22
face shapes. It becomes clear therefrom that the whole value chain is affected and thus has to be newly defined, 23
for instance with regard to new alliances with eyewear manufacturers. Ultimately, diffusion of wearables will 24
proceed successively in spite of initial acceptance problems, what is best exemplified by Google’s Street View: 25
initially, there have been massive privacy concerns what have changed little by little. Another example would be 26
the CCTV. 27
From a usability perspective, the dissemination of wearables on consumer markets is inevitable, whereby glasses 28
have the most potential, provided that they feature technological maturity. To allege an example here, the iPhone 29
can be mentioned that marks a breakthrough innovation because of its intuitive handling. 30
31
What factors (e.g. technological, economic or social) contribute most to the dissemination of wearables on 32
consumer markets? 33
Most likely technological factors will therefore contribute to the dissemination, see battery runtime or the necessity 34
of optimising the input modalities. However, eventually the social aspect is more important. The social dynamic 35
represents currently an ‘anti-dynamic’. This trend must be reverted. It is decisive here – again with regard to 36
smartphones – that wearables will be perceived as ‘awesome’. Hence it is important how the social environment 37
responds. 38

270 Appendix
39
How did your students respond to the smartwatches? 40
My students think that smartwatches are very cool, but actually only a few students use wearables. The real issue 41
at stake here is how far smartwatches are useful as interface of the mobile phone - the added value continues 42
lacking. For technically oriented students wearables represent rather a technical gimmick. 43
44
What kind of wearables will become most important for stakeholders in the coming years, e.g. 45
smartwatches, smart glasses, smart clothes? 46
In the industry, within the working environment in the years ahead particularly smart glasses will be on the rise 47
primarily due to their property that they allow for a seamless integration into the everyday life and provide all 48
relevant information without the need of explicitly accessing the information ambidextrously. That is, you can 49
handle them hands-free. I can imagine that in the private environment the application scenario ‘cooking’ would be 50
very useful; but also ‘Ikea instructions’, which you can retrieve during the installation hands-free. With regard to 51
smart clothes there will be especially in the health area decisive changes. In particular, the point of continuous 52
monitoring will change the healthcare world in the long term. Internet doctors represent a viable application, as 53
well. However, at the moment such scenarios are still in an early prototype stage. Overall, smart clothes will open 54
completely new communication possibilities. 55
56
What in your opinion are the main incentives for integrating such technologies in everyday life? Please sort 57
the following topics by relevance ranking: 58
i. Boost of personal abilities, 59
ii. Improvement of health and fitness, 60
iii. Boost of self-confidence, 61
iv. Helps feel more in control of personal life, 62
v. Enhancement of social relationships. 63
In professional environments I would assume the following prioritisation: i. (here it is of particular importance to 64
be proactively informed, to access information easily), iii., iv., v., ii. 65
In a private environment, especially with regard to smartwatches, I would assume the following: ii., iv., iii., i., v. 66
67
What do you expect from wearable computing solutions? What functionalities are of major significance, 68
e.g. certain sensory features or context-awareness? 69
You have your wearable always with you, so that processes become more targeted, for example by means of 70
Location Based Services. This implies huge time savings, as both hands are free. In logistics, for example in the 71
building industry, there is a great need for such devices. Of course, on the hardware side it must be adequate, for 72
example with regard to the battery management. Ultimately, however, it is also a question of acceptance; one 73
should learn from the iPhone diffusion. One should take away the fears to use wearables for the first time. Adopters 74
will only be ready to accept this new technology if it is opportune for them. For instance, the fear of total 75
surveillance should be compensated by the benefit that one can communicate with colleagues in the course of 76
monotonous tasks. The focus here is on process acceleration. It is the constant availability, but also the prestige. 77
Here we are again on the subject of Bring Your Own Device. In particular soft factors, that is motivational and 78
affective aspects, play a vital role; thus, deliver an advantage. 79

Appendix 271
80
What risks have to be addressed in particular (e.g. functional risk, economic risk, social risk, IT security 81
risk, etc.)? 82
In legal terms, particularly smart glasses will pose surveillance concerns. It may come to no-go areas, what would 83
pose a social dimension, as well. In functional terms for instance face recognition implies a security risk. 84
Smartwatches to be understood as an interface rather than a standalone device do not have a disruptive effect and 85
thus do not harbour additional risks. On the contrary, smart glasses are riskier; you can make much more things 86
persistent, all becomes more traceable. For instance, in a Dictaphone scenario: in traditional conferences there are 87
no protocols off the record involved. You don’t know which data is critical in retrospect. 88
89
In your opinion, what changes of behavioural habits are likely to occur? How do you assess the importance 90
of the wearable computing phenomenon for society? 91
The ubiquitous connectedness will increase, while on can deliberately disable the online status, of course. The 92
change will be rather a slow process. At the beginning not much will change. In respect of smart clothes completely 93
new communication channels may emerge, for instance how we can show emotions. This opens up entirely new 94
dimensions of communication. It means that there will be a new way of measuring emotions and, moreover, to 95
share emotions. In a business context capturing of emotions is more accepted to some extent in the meantime. 96
Increasingly important topics are the consciousness-raising of emotions, reflection and reflective learning, for 97
example in the field of fitness and health. Wearables will certainly have a supra-individual ramification, 98
particularly in respect of the relation to the topic measurement. A target/performance comparison will be possible 99
that affects at behavioural level. 100

272 Appendix
A.5) Interview Transcript 4
We are interested in the development of the future market „Wearable Technology“. In our context the term 1
“Wearable Computing” is to be understood as the constant application of portable, continuously running 2
computer systems, e.g. smartwatches or smart glasses. From your point of view, what role do wearable 3
technologies play for you as a professional? And what role do wearable technologies play in your company? 4
We currently work on a research project in the area of wind energy. Wearable technologies are used for 5
maintenance works. An attempt is being made to support this with wearables. Accordingly, we have contacts to 6
several manufacturers of hardware. In our company it is a matter of smart glasses which can be employed to 7
process data as well as for devaluation and deactivation activities. The aim is to transfer these benefits into other 8
areas and ultimately into the consumer market. 9
10
What is your assessment regarding the current development of the wearable technology market? What 11
market potential do you see? 12
It’s very promising. We have an older generation of glasses, i.e. the Epson glasses. But nowadays there is a new 13
generation of glasses; the new Epson glasses are considerable more powerful. The quality is very good in the 14
meanwhile and thus I also think that wearables will establish themselves on the market. We are going to work a 15
lot with image recognition, wherefore technological maturity is of great importance. 16
17
What factors (e.g. technological, economic or social) contribute most to the dissemination of wearables on 18
consumer markets? 19
The technical requirements must be met, so that the system works and can be employed properly, but occupational 20
safety is also very important. For example, in the area of wind energy one has to record where to go next and, 21
furthermore, have to wear the glasses under the helmet and a suitable handling must be available. That is, the 22
glasses should remain on the nose and, at the same time, the reliability of the system must be given as well. 23
Otherwise one gets no acceptance, but this is a rather technical aspect. The customers will surely also play a role, 24
but this is yet not a topic in our company. Yet, wearables have become affordable, indeed. 25
26
What insights did you gain about wearables in respect of customer relevance and productive use? 27
With our project we have not quite reached that point yet, that is the product isn’t finished yet. However, there is 28
a great interest in applying them. We're already getting huge resonance by now. There was a tremendous feedback 29
from companies which collaborate with us, particularly with regard to the features. 30
31
What kind of wearables will become most important for stakeholders in the coming years, e.g. 32
smartwatches, smart glasses, smart clothes? 33
At the moment I am focussing primarily on smart glasses, but once we had talked about a magnet that can be 34
mounted on arms. Through muscle contractions hand gestures can be interpreted and this could be linked to another 35
wearable technology. The market is there, indeed, but I can’t reduce it to a single technology. For smart glasses 36
there is definitely a great interest, but at the moment I cannot give further details concerning the other technologies. 37
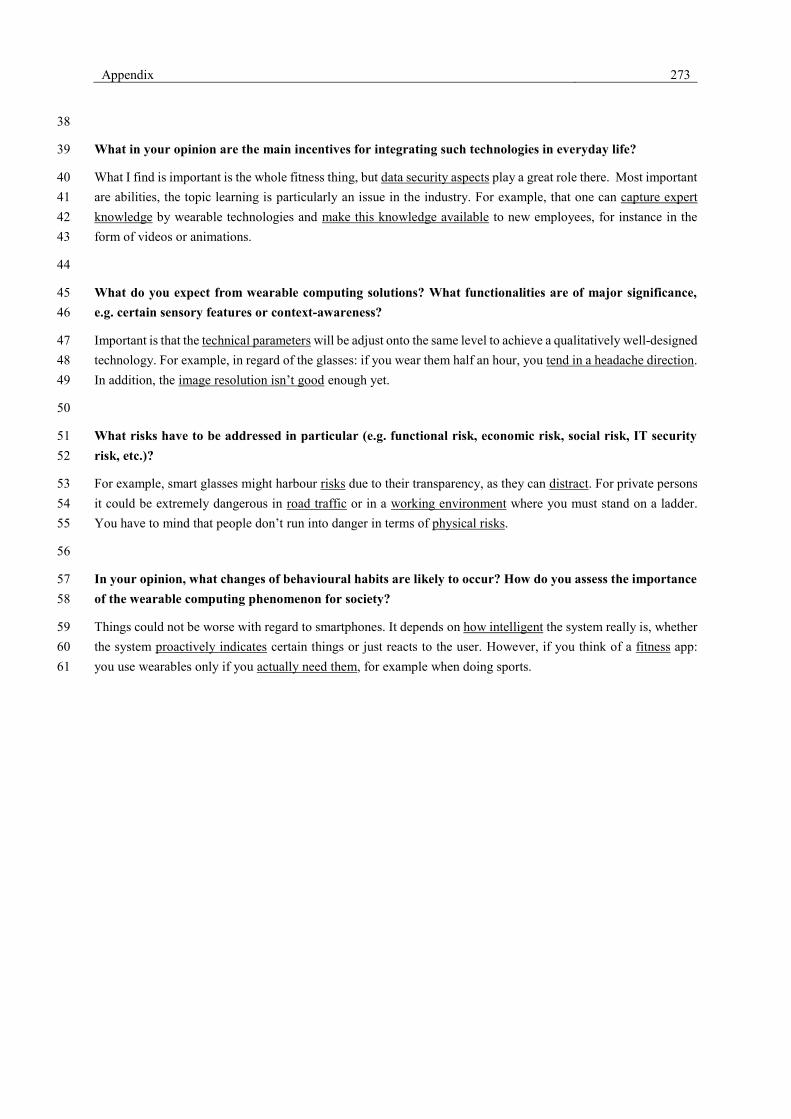
Appendix 273
38
What in your opinion are the main incentives for integrating such technologies in everyday life? 39
What I find is important is the whole fitness thing, but data security aspects play a great role there. Most important 40
are abilities, the topic learning is particularly an issue in the industry. For example, that one can capture expert 41
knowledge by wearable technologies and make this knowledge available to new employees, for instance in the 42
form of videos or animations. 43
44
What do you expect from wearable computing solutions? What functionalities are of major significance, 45
e.g. certain sensory features or context-awareness? 46
Important is that the technical parameters will be adjust onto the same level to achieve a qualitatively well-designed 47
technology. For example, in regard of the glasses: if you wear them half an hour, you tend in a headache direction. 48
In addition, the image resolution isn’t good enough yet. 49
50
What risks have to be addressed in particular (e.g. functional risk, economic risk, social risk, IT security 51
risk, etc.)? 52
For example, smart glasses might harbour risks due to their transparency, as they can distract. For private persons 53
it could be extremely dangerous in road traffic or in a working environment where you must stand on a ladder. 54
You have to mind that people don’t run into danger in terms of physical risks. 55
56
In your opinion, what changes of behavioural habits are likely to occur? How do you assess the importance 57
of the wearable computing phenomenon for society? 58
Things could not be worse with regard to smartphones. It depends on how intelligent the system really is, whether 59
the system proactively indicates certain things or just reacts to the user. However, if you think of a fitness app: 60
you use wearables only if you actually need them, for example when doing sports. 61

274 Appendix
A.6) Interview Transcript 5
We are interested in the development of the future market „Wearable Technology“. In our context the term 1
“Wearable Computing” is to be understood as the constant application of portable, continuously running 2
computer systems, e.g. smartwatches or smart glasses. From your point of view, what role do wearable 3
technologies play for you as a professional? And what role do wearable technologies play in your company? 4
I work as a senior system administrator in a data processing company. I use the Pebble smartwatch primarily as a 5
notification tool, since we receive a lot of crucial customer requests upon which we should react as soon as 6
possible. I’m not always sitting at my desk, so the watch notifies me directly about incoming mails and I can also 7
read them directly on the watch. The watch, which I’m bringing in privately, represents an interface to my business 8
mobile phone. Several of my colleagues handle things the same way. 9
10
What is your assessment regarding the current development of the wearable technology market? What 11
market potential do you see? 12
It is a booming market that increasingly expands into other fields. For example, in the toy sector or in the field of 13
fashion wearable technologies are becoming more and more integrated. 14
15
What factors (e.g. technological, economic or social) contribute most to the dissemination of wearables on 16
consumer markets? 17
First of all, the technology must be mature. Once a certain number of technically-oriented adopters will be 18
achieved, wearables will progressively enter ordinary households. 19
20
What insights did you gain about wearables in respect of customer relevance and productive use? 21
They are practical. Furthermore, wearing them opens the possibility to enter discussions with customers and to 22
arouse their interest regarding smartwatches and even to sell some. 23
24
What kind of wearables will become most important for stakeholders in the coming years, e.g. 25
smartwatches, smart glasses, smart clothes? 26
Smartwatches and fitness trackers have already succeeded and will continue to be successful, followed by smart 27
glasses in the middle-term. 28
29
What in your opinion are the main incentives for integrating such technologies in everyday life? Please sort 30
the following topics by relevance ranking: 31
i. Boost of personal abilities, 32
ii. Improvement of health and fitness, 33
iii. Boost of self-confidence, 34
iv. Helps feel more in control of personal life, 35
v. Enhancement of social relationships. 36

Appendix 275
iv., i., ii., iii., v., whereby one must mention that some colleagues are using their smartwatch to check e-mails of 37
their friends in a timely manner. 38
39
What do you expect from wearable computing solutions? What functionalities are of major significance, 40
e.g. certain sensory features or context-awareness? 41
Informing of messages and reminders are most important to me at the moment. Basically, functions for monitoring 42
the physiological condition are very useful, too. 43
44
What risks have to be addressed in particular (e.g. functional risk, economic risk, social risk, IT security 45
risk, etc.)? 46
Data security is very important, as wearables capture and store sensitive personal data that is highly worth 47
protecting. For example, to take advantage of wearables in many cases having access to cloud computing 48
technologies is compulsory, so that all data are stored at the provider’s end. In the end, usage of such services 49
depends on the perceived trustworthiness of the cloud computing technologies. 50
51
In your opinion, what changes of behavioural habits are likely to occur? How do you assess the importance 52
of the wearable computing phenomenon for society? 53
The urge for self-tracking will widely increase and the use of social media will perhaps be even more compulsive. 54

276 Appendix
A.7) Interview Transcript 6
We are interested in the development of the future market „Wearable Technology“. In our context the term 1
“Wearable Computing” is to be understood as the constant application of portable, continuously running 2
computer systems, e.g. smartwatches or smart glasses. From your point of view, what role do wearable 3
technologies play for you as a professional? 4
I use wearables – in particular with regard to my smartwatch – as an interface to my smart phone in order to support 5
my work by means of notifications. 6
7
What is your assessment regarding the current development of the wearable technology market? What 8
market potential do you see? 9
Overall, there is clearly an upward trend visible, especially in respect of wristwatches and wristbands. 10
11
What factors (e.g. technological, economic or social) contribute most to the dissemination of wearables on 12
consumer markets? 13
I think technological, economic and social aspects; in that order. 14
15
What insights did you gain about wearables in respect of customer relevance and productive use? 16
Wearables provide relevant information in real-time and, what is more, they provide the information proactively. 17
18
What kind of wearables will become most important for stakeholders in the coming years, e.g. 19
smartwatches, smart glasses, smart clothes? 20
I think smartwatches and fitness bands will continue to propel this trend; at least in the near future. 21
22
What in your opinion are the main incentives for integrating such technologies in everyday life? Please sort 23
the following topics by relevance ranking: 24
i. Boost of personal abilities, 25
ii. Improvement of health and fitness, 26
iii. Boost of self-confidence, 27
iv. Helps feel more in control of personal life, 28
v. Enhancement of social relationships. 29
In particular the enhancement of performance efficiency is at the forefront. Apart from that I think that the 30
improvement of health is very important. 31
32
What do you expect from wearable computing solutions? What functionalities are of major significance, 33
e.g. certain sensory features or context-awareness? 34

Appendix 277
I would expect a seamless integration of information services into everyday life. Thereby, both the work processes 35
and decision-making should be supported. 36
What risks have to be addressed in particular (e.g. functional risk, economic risk, social risk, IT security 37
risk, etc.)? 38
Apart from the current acceptance problem […] early adopters are particularly capable of suffering. However, in 39
the end one opens up the Pandora’s Box. You don’t know how all will develop with respect to the constant 40
monitoring. For example, insurance carrier could calculate their risk models according to the captured data, what 41
to my knowledge is the case for at least one health insurance. 42
43
In your opinion, what changes of behavioural habits are likely to occur? How do you assess the importance 44
of the wearable computing phenomenon for society? 45
By means of the increasing surveillance that is caused not only by wearables, but represents a more general 46
phenomenon, we change our behavioural habits. Ultimately, this represents a restriction on personal rights in a 47
hitherto unknown extent. This will certainly also prove for wearables, that is, wearable technologies will contribute 48
additionally to the mass surveillance. This really verges almost on a deprivation of liberty from my viewpoint.49

278 Appendix
A.8) Interview Transcript 7
We are interested in the development of the future market „Wearable Technology“. In our context the term 1
“Wearable Computing” is to be understood as the constant application of portable, continuously running 2
computer systems, e.g. smartwatches or smart glasses. From your point of view, what role do wearable 3
technologies play for you as a professional? And what role do wearable technologies play in your company? 4
First and foremost, I think of smartwatches when confronted with the term “wearable computing”. Personally, I 5
don’t employ wearable technologies. However, in the course of my research semester at a research and 6
development department of Google Zurich smart glasses were used by several employees for the purpose of pilot 7
studies. 8
9
What is your assessment regarding the current development of the wearable technology market? What 10
market potential do you see? 11
Wearables are yet in an early stage of diffusion. In the long term they will certainly proliferate massively. At the 12
moment they are primarily adopted by early adopters what is commonly the case for technology-based innovations. 13
14
What factors (e.g. technological, economic or social) contribute most to the dissemination of wearables on 15
consumer markets? 16
The most important factor is surely the economical one; that is, how the pricing system develops in the course of 17
time. In addition, general technical conditions always play a crucial role. In this context I can further on come up 18
with the topic of data privacy, especially when I’m thinking of Google Glasses. Here, political parameters will 19
likely have a significant impact on their dissemination. Nevertheless, eventually the user will certainly determine 20
the success of wearables. 21
22
What insights did you gain about wearables in respect of customer relevance and productive use? 23
As the glasses had been worn only for testing purposes during my stay there at Google Zurich, I can’t say anything 24
on this. 25
26
What in your opinion are the main incentives for integrating such technologies in everyday life? Please sort 27
the following topics by relevance ranking: 28
i. Boost of personal abilities, 29
ii. Improvement of health and fitness, 30
iii. Boost of self-confidence, 31
iv. Helps feel more in control of personal life, 32
v. Enhancement of social relationships. 33
I would put it like this: i., ii., iv., iii., v. 34
35
What kind of wearables will become most important for stakeholders in the coming years, e.g. 36
smartwatches, smart glasses, smart clothes? 37
Appendix 279
I think that particularly activity trackers and other sport accessories will continue to gain popularity. With regard 38
to various criteria such as battery power I would expect that smart glasses supposedly will take a long time to 39
diffuse in the mass market. 40
41
What do you expect from wearable computing solutions? What functionalities are of major significance, 42
e.g. certain sensory features or context-awareness? 43
You don’t have to input data explicitly; the sensors automatically capture all relevant information. In particular I 44
think of efficiency improvements in work processes. 45
46
What risks have to be addressed in particular (e.g. functional risk, economic risk, social risk, IT security 47
risk, etc.)? 48
Especially data privacy is here, undoubtedly, of uttermost importance. Information may be disclosed elsewhere 49
then originally intended by the users or contingently be tapped or eavesdropped by third parties. One has thus to 50
trust that this won’t happen. 51
52
In your opinion, what changes of behavioural habits are likely to occur? How do you assess the importance 53
of the wearable computing phenomenon for society? 54
In the short term there won’t be big changes. However, in the long term the consequences of the wearable 55
computing phenomenon for society are not foreseeable. In any case, wearable computing will foster an always-on 56
culture. 57
58
First of all, thank you for your information! Would you like to discuss any further topic-related issues 59
outside the matters raised so far? 60
I think that wearables – in particular with regard to health-related data – will play an important role in future. For 61
me as a lecturer it would also be an interesting possibility if I could just read off the names of my students from 62
my smart glass. 63
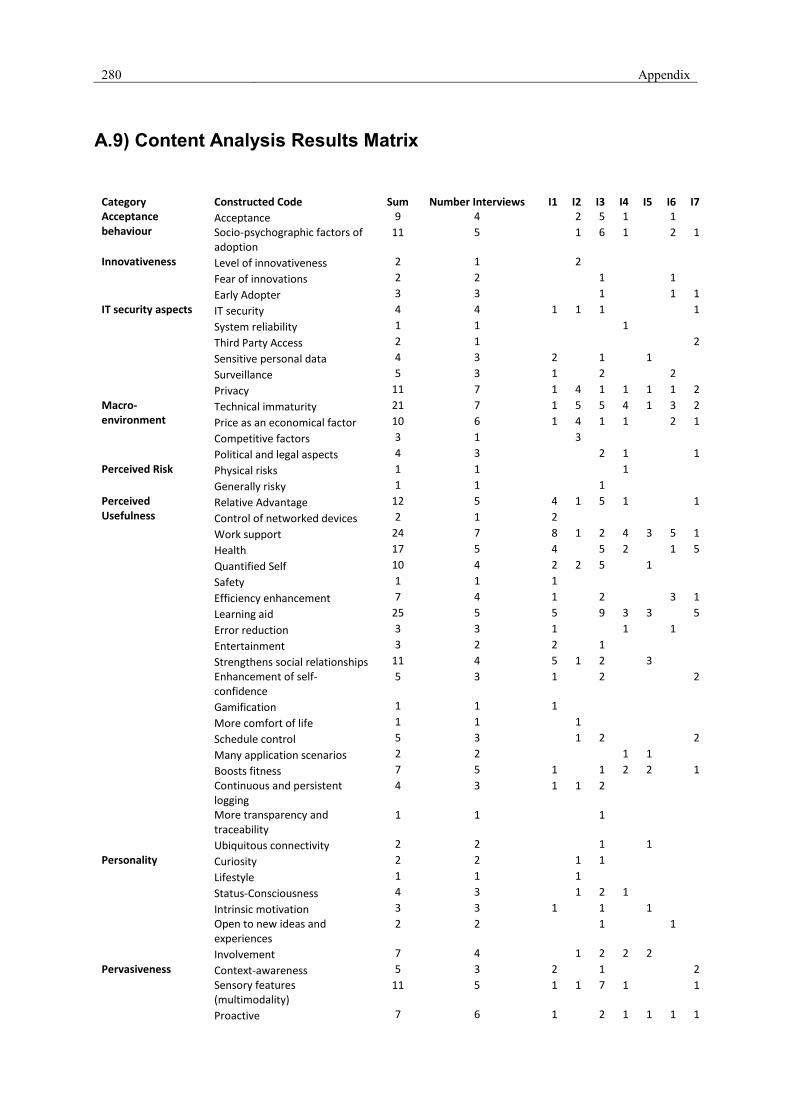
280 Appendix
A.9) Content Analysis Results Matrix
Category Constructed Code Sum Number Interviews I1 I2 I3 I4 I5 I6 I7 Acceptance behaviour
Acceptance 9 4
2 5 1
1
Socio-psychographic factors of adoption
11 5
1 6 1
2 1
Innovativeness Level of innovativeness 2 1
2
Fear of innovations 2 2
1
1
Early Adopter 3 3
1
1 1
IT security aspects IT security 4 4 1 1 1
1
System reliability 1 1
1
Third Party Access 2 1
2
Sensitive personal data 4 3 2
1
1
Surveillance 5 3 1
2
2
Privacy 11 7 1 4 1 1 1 1 2
Macro-environment
Technical immaturity 21 7 1 5 5 4 1 3 2
Price as an economical factor 10 6 1 4 1 1
2 1
Competitive factors 3 1
3
Political and legal aspects 4 3
2 1
1
Perceived Risk Physical risks 1 1
1
Generally risky 1 1
1
Perceived Usefulness
Relative Advantage 12 5 4 1 5 1
1
Control of networked devices 2 1 2
Work support 24 7 8 1 2 4 3 5 1
Health 17 5 4
5 2
1 5
Quantified Self 10 4 2 2 5
1
Safety 1 1 1
Efficiency enhancement 7 4 1
2
3 1
Learning aid 25 5 5
9 3 3
5
Error reduction 3 3 1
1
1
Entertainment 3 2 2
1
Strengthens social relationships 11 4 5 1 2
3
Enhancement of self-confidence
5 3 1
2
2
Gamification 1 1 1
More comfort of life 1 1
1
Schedule control 5 3
1 2
2
Many application scenarios 2 2
1 1
Boosts fitness 7 5 1
1 2 2
1
Continuous and persistent logging
4 3 1 1 2
More transparency and traceability
1 1
1
Ubiquitous connectivity 2 2
1
1
Personality Curiosity 2 2
1 1
Lifestyle 1 1
1
Status-Consciousness 4 3
1 2 1
Intrinsic motivation 3 3 1
1
1
Open to new ideas and experiences
2 2
1
1
Involvement 7 4
1 2 2 2
Pervasiveness Context-awareness 5 3 2
1
2
Sensory features (multimodality)
11 5 1 1 7 1
1
Proactive 7 6 1
2 1 1 1 1
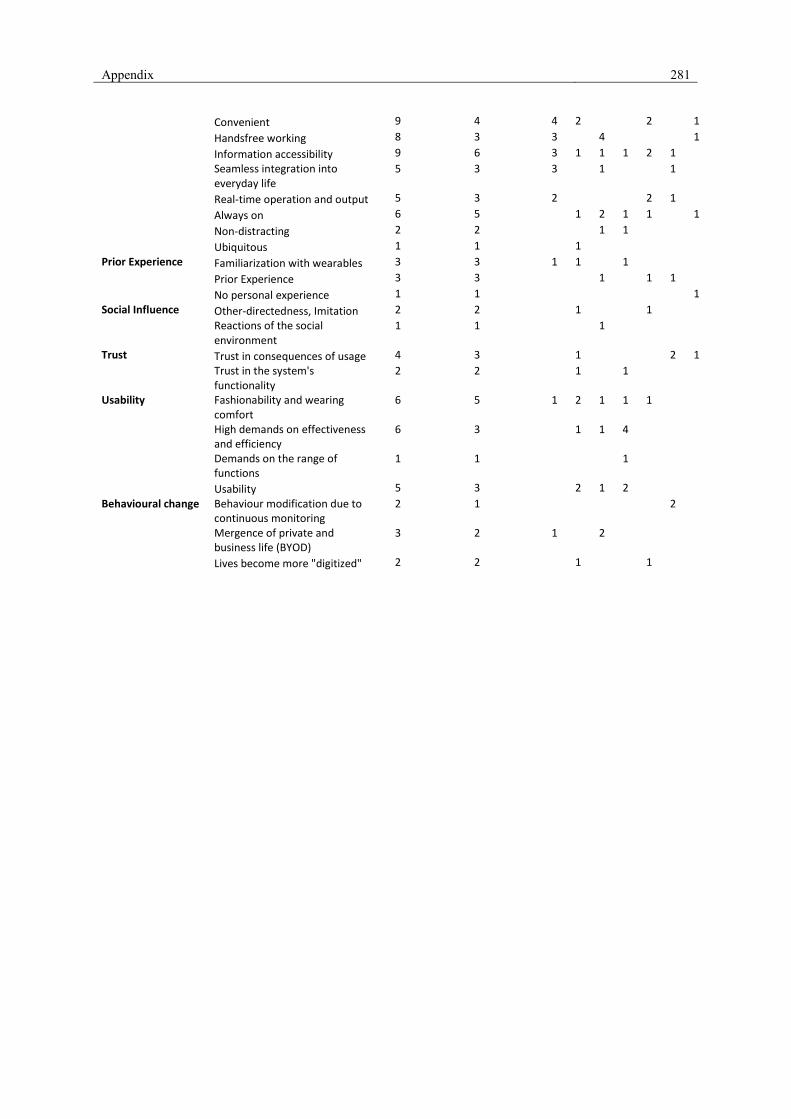
Appendix 281
Convenient 9 4 4 2
2
1
Handsfree working 8 3 3
4
1
Information accessibility 9 6 3 1 1 1 2 1
Seamless integration into everyday life
5 3 3
1
1
Real-time operation and output 5 3 2
2 1
Always on 6 5
1 2 1 1
1
Non-distracting 2 2
1 1
Ubiquitous 1 1
1
Prior Experience Familiarization with wearables 3 3 1 1
1
Prior Experience 3 3
1
1 1
No personal experience 1 1
1
Social Influence Other-directedness, Imitation 2 2
1
1
Reactions of the social environment
1 1
1
Trust Trust in consequences of usage 4 3
1
2 1
Trust in the system's functionality
2 2
1
1
Usability Fashionability and wearing
comfort 6 5 1 2 1 1 1
High demands on effectiveness and efficiency
6 3
1 1 4
Demands on the range of functions
1 1
1
Usability 5 3
2 1 2
Behavioural change Behaviour modification due to
continuous monitoring 2 1
2
Mergence of private and business life (BYOD)
3 2 1
2
Lives become more "digitized" 2 2
1
1

282 Appendix
B.1) Online Questionnaire
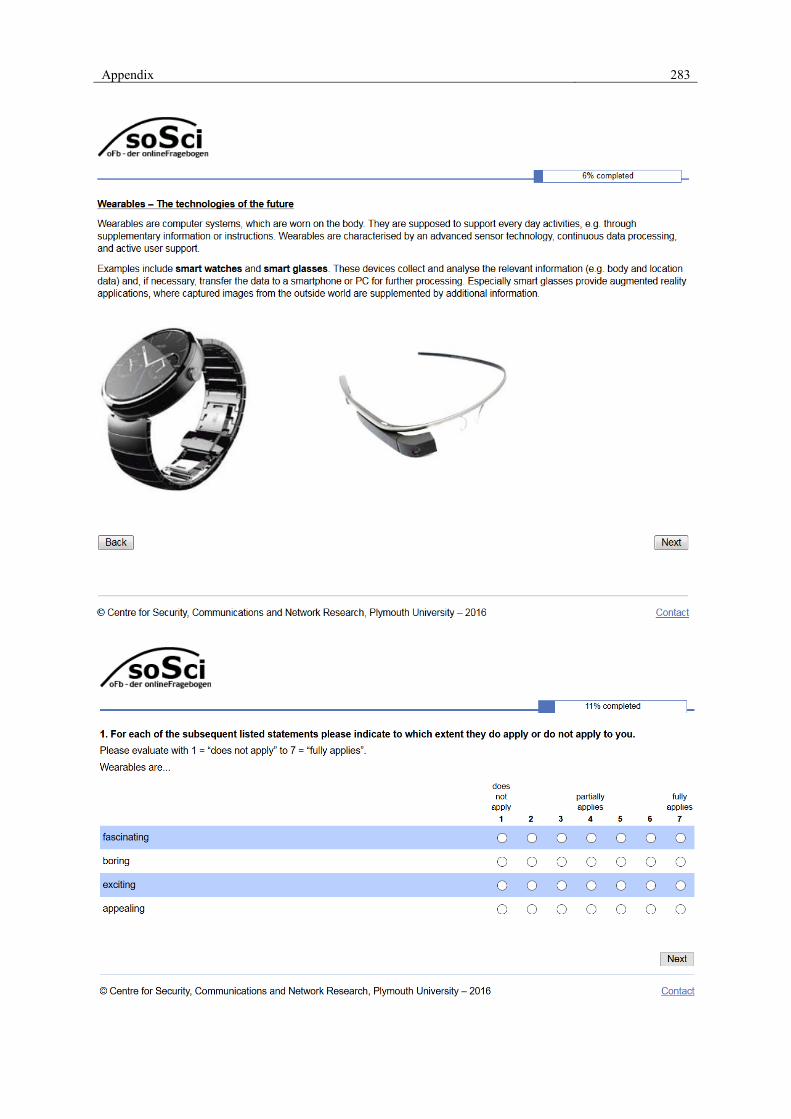
Appendix 283
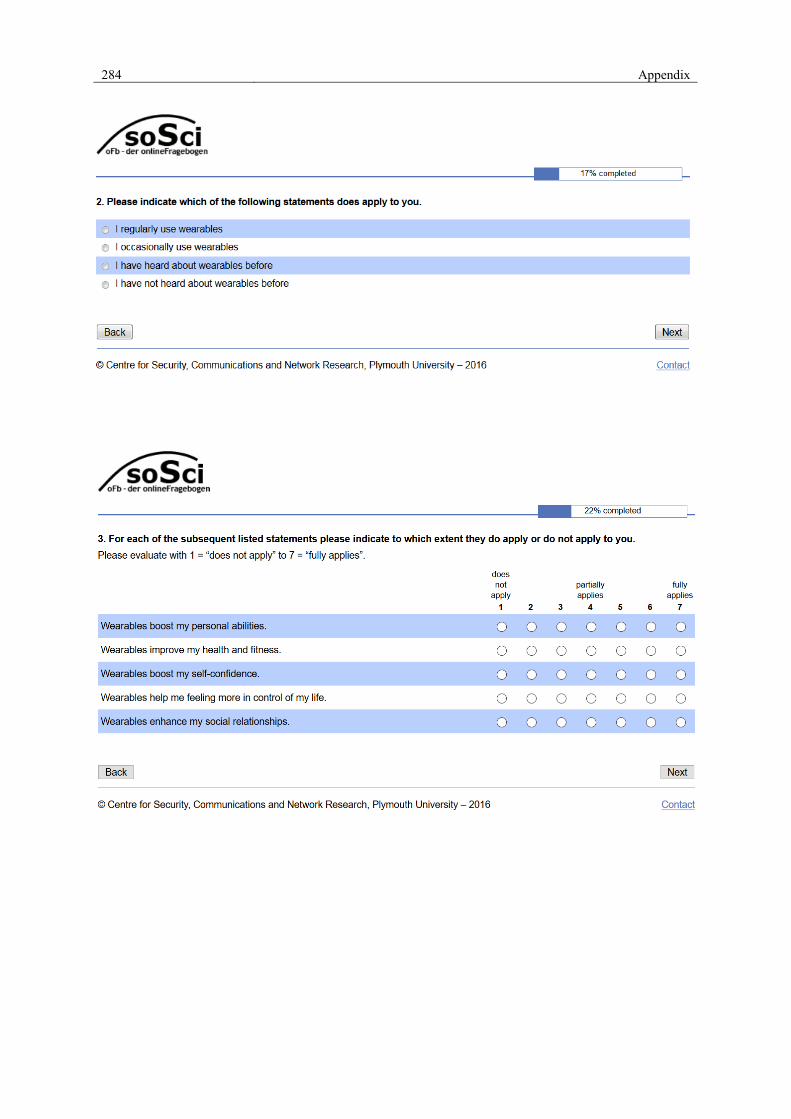
284 Appendix
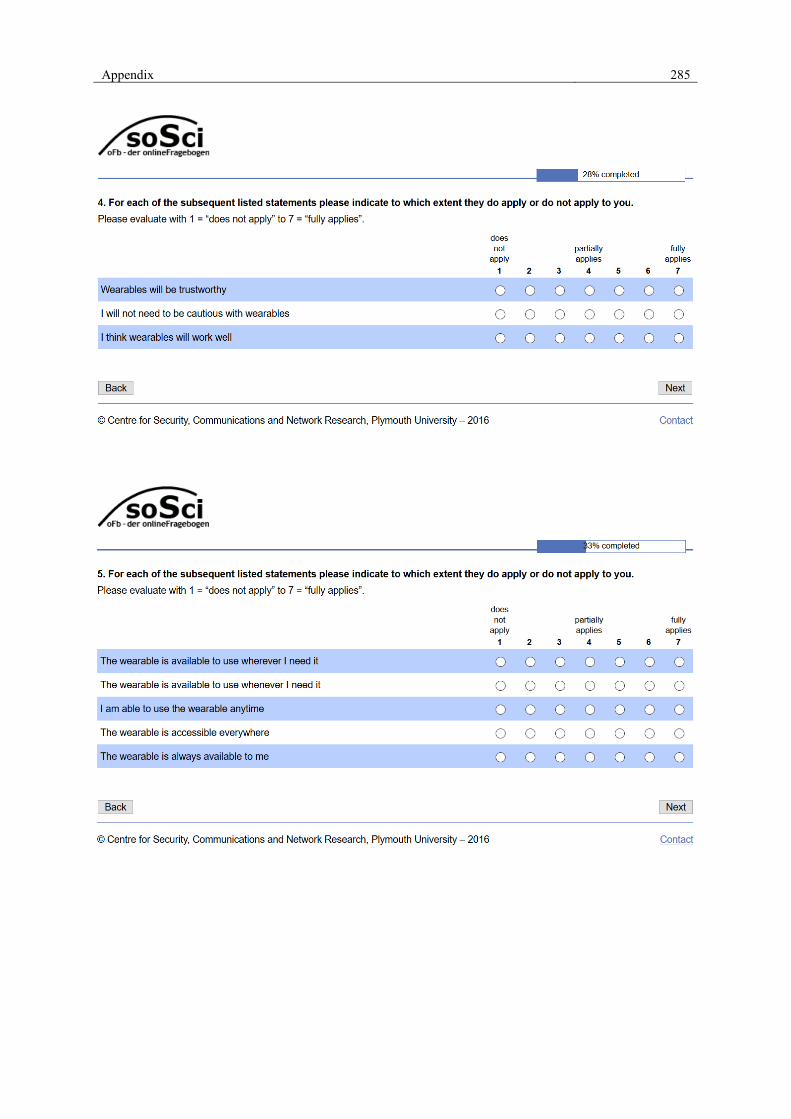
Appendix 285
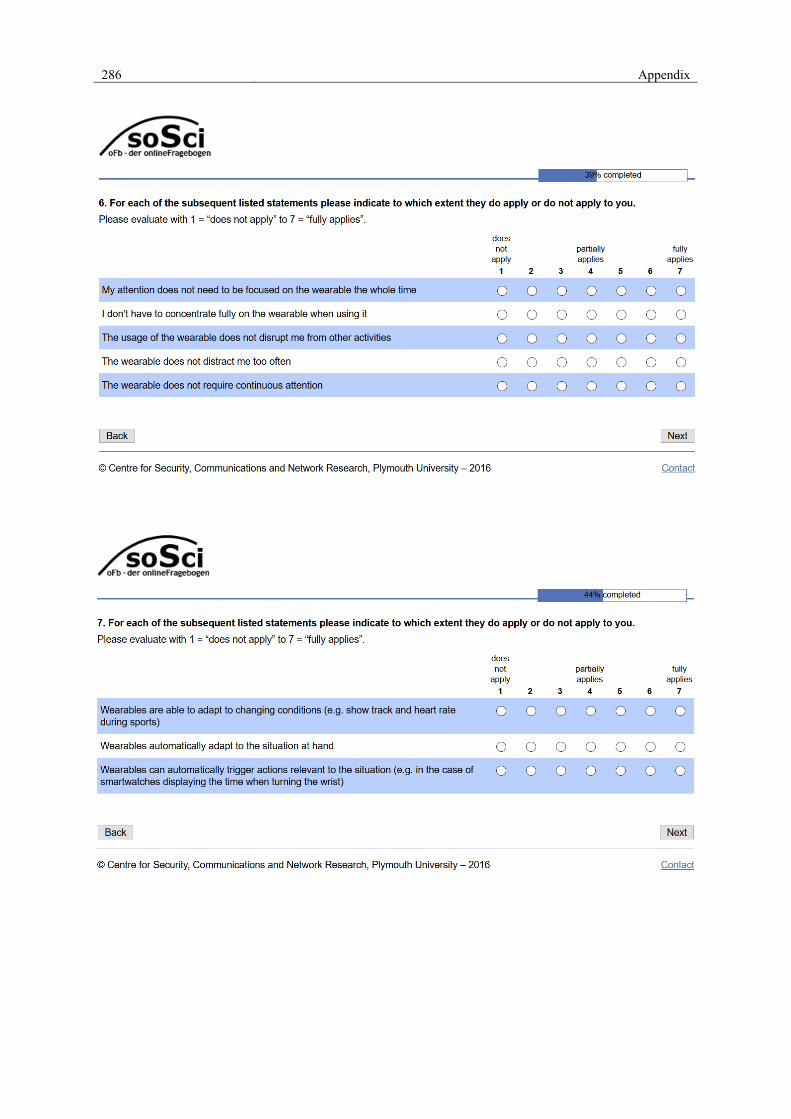
286 Appendix

Appendix 287

288 Appendix
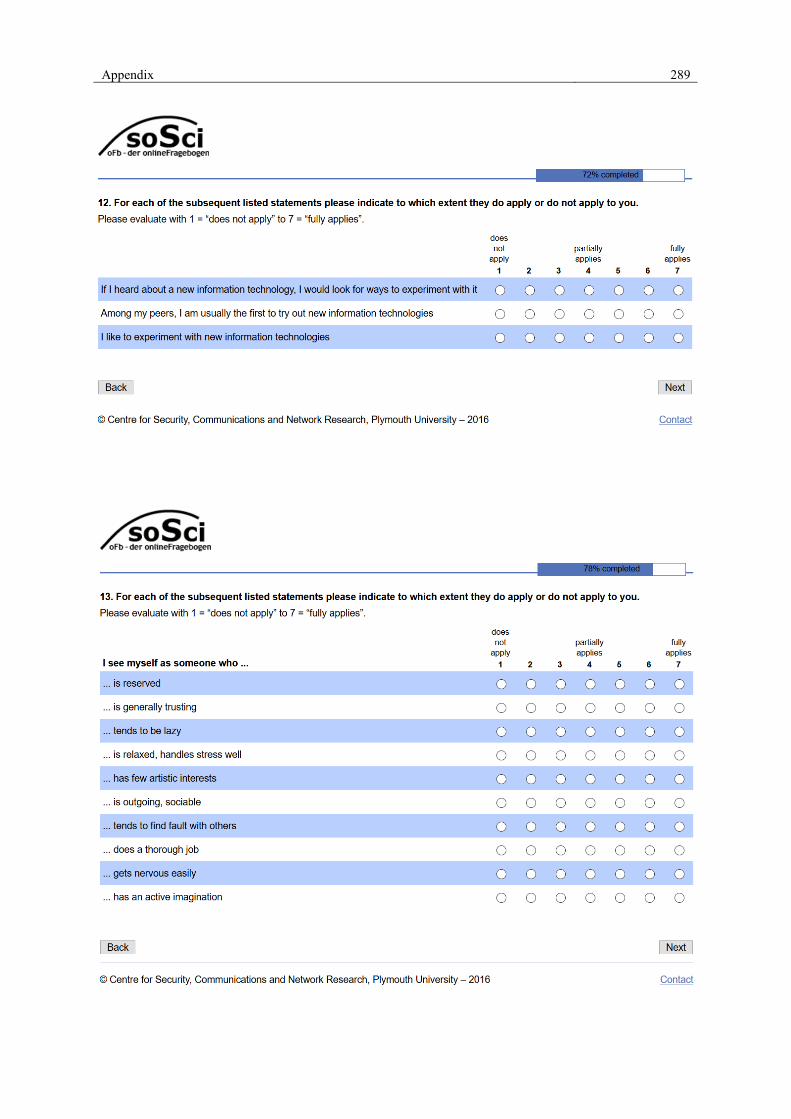
Appendix 289
290 Appendix
Appendix 291
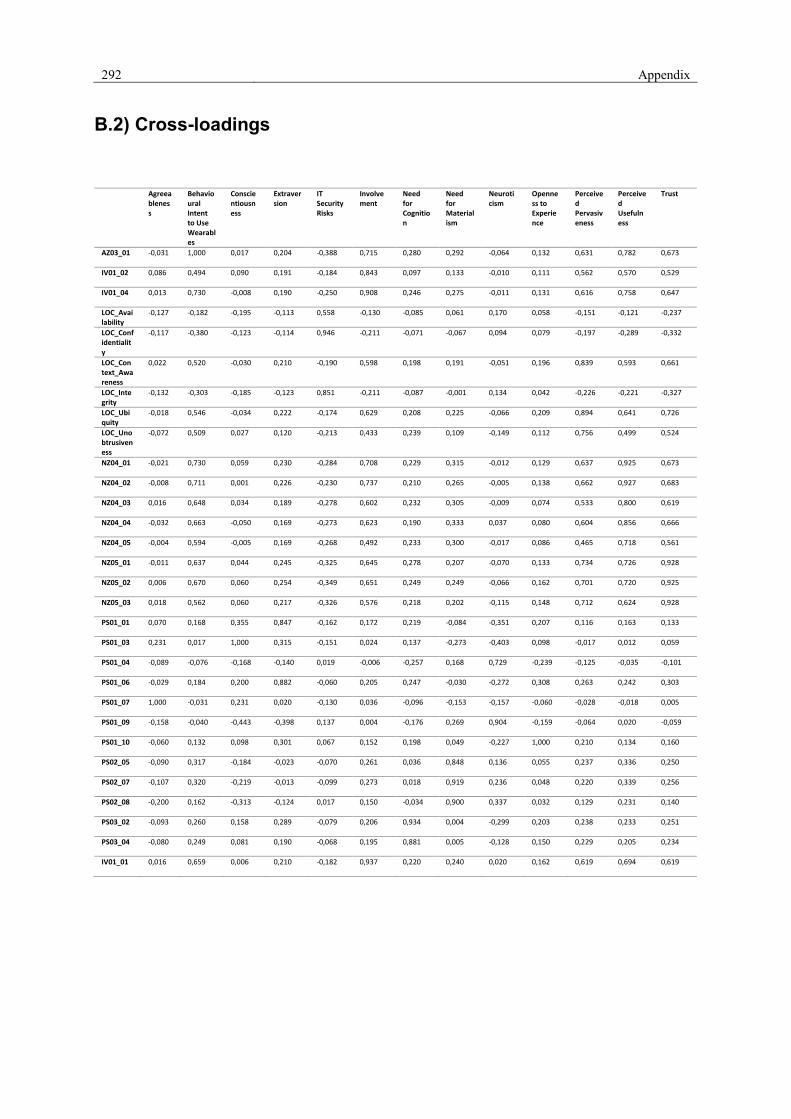
292 Appendix
B.2) Cross-loadings
Agreeableness
Behavioural Intent to Use Wearables
Conscientiousness
Extraversion
IT Security Risks
Involvement
Need for Cognition
Need for Materialism
Neuroticism
Openness to Experience
Perceived Pervasiveness
Perceived Usefulness
Trust
AZ03_01 -0,031 1,000 0,017 0,204 -0,388 0,715 0,280 0,292 -0,064 0,132 0,631 0,782 0,673
IV01_02 0,086 0,494 0,090 0,191 -0,184 0,843 0,097 0,133 -0,010 0,111 0,562 0,570 0,529
IV01_04 0,013 0,730 -0,008 0,190 -0,250 0,908 0,246 0,275 -0,011 0,131 0,616 0,758 0,647
LOC_Availability
-0,127 -0,182 -0,195 -0,113 0,558 -0,130 -0,085 0,061 0,170 0,058 -0,151 -0,121 -0,237
LOC_Confidentiality
-0,117 -0,380 -0,123 -0,114 0,946 -0,211 -0,071 -0,067 0,094 0,079 -0,197 -0,289 -0,332
LOC_Context_Awareness
0,022 0,520 -0,030 0,210 -0,190 0,598 0,198 0,191 -0,051 0,196 0,839 0,593 0,661
LOC_Integrity
-0,132 -0,303 -0,185 -0,123 0,851 -0,211 -0,087 -0,001 0,134 0,042 -0,226 -0,221 -0,327
LOC_Ubiquity
-0,018 0,546 -0,034 0,222 -0,174 0,629 0,208 0,225 -0,066 0,209 0,894 0,641 0,726
LOC_Unobtrusiveness
-0,072 0,509 0,027 0,120 -0,213 0,433 0,239 0,109 -0,149 0,112 0,756 0,499 0,524
NZ04_01 -0,021 0,730 0,059 0,230 -0,284 0,708 0,229 0,315 -0,012 0,129 0,637 0,925 0,673
NZ04_02 -0,008 0,711 0,001 0,226 -0,230 0,737 0,210 0,265 -0,005 0,138 0,662 0,927 0,683
NZ04_03 0,016 0,648 0,034 0,189 -0,278 0,602 0,232 0,305 -0,009 0,074 0,533 0,800 0,619
NZ04_04 -0,032 0,663 -0,050 0,169 -0,273 0,623 0,190 0,333 0,037 0,080 0,604 0,856 0,666
NZ04_05 -0,004 0,594 -0,005 0,169 -0,268 0,492 0,233 0,300 -0,017 0,086 0,465 0,718 0,561
NZ05_01 -0,011 0,637 0,044 0,245 -0,325 0,645 0,278 0,207 -0,070 0,133 0,734 0,726 0,928
NZ05_02 0,006 0,670 0,060 0,254 -0,349 0,651 0,249 0,249 -0,066 0,162 0,701 0,720 0,925
NZ05_03 0,018 0,562 0,060 0,217 -0,326 0,576 0,218 0,202 -0,115 0,148 0,712 0,624 0,928
PS01_01 0,070 0,168 0,355 0,847 -0,162 0,172 0,219 -0,084 -0,351 0,207 0,116 0,163 0,133
PS01_03 0,231 0,017 1,000 0,315 -0,151 0,024 0,137 -0,273 -0,403 0,098 -0,017 0,012 0,059
PS01_04 -0,089 -0,076 -0,168 -0,140 0,019 -0,006 -0,257 0,168 0,729 -0,239 -0,125 -0,035 -0,101
PS01_06 -0,029 0,184 0,200 0,882 -0,060 0,205 0,247 -0,030 -0,272 0,308 0,263 0,242 0,303
PS01_07 1,000 -0,031 0,231 0,020 -0,130 0,036 -0,096 -0,153 -0,157 -0,060 -0,028 -0,018 0,005
PS01_09 -0,158 -0,040 -0,443 -0,398 0,137 0,004 -0,176 0,269 0,904 -0,159 -0,064 0,020 -0,059
PS01_10 -0,060 0,132 0,098 0,301 0,067 0,152 0,198 0,049 -0,227 1,000 0,210 0,134 0,160
PS02_05 -0,090 0,317 -0,184 -0,023 -0,070 0,261 0,036 0,848 0,136 0,055 0,237 0,336 0,250
PS02_07 -0,107 0,320 -0,219 -0,013 -0,099 0,273 0,018 0,919 0,236 0,048 0,220 0,339 0,256
PS02_08 -0,200 0,162 -0,313 -0,124 0,017 0,150 -0,034 0,900 0,337 0,032 0,129 0,231 0,140
PS03_02 -0,093 0,260 0,158 0,289 -0,079 0,206 0,934 0,004 -0,299 0,203 0,238 0,233 0,251
PS03_04 -0,080 0,249 0,081 0,190 -0,068 0,195 0,881 0,005 -0,128 0,150 0,229 0,205 0,234
IV01_01 0,016 0,659 0,006 0,210 -0,182 0,937 0,220 0,240 0,020 0,162 0,619 0,694 0,619

Appendix 293