Download (4.16MB) - Institute for Global Environmental ...
183
-
Upload
khangminh22 -
Category
Documents
-
view
0 -
download
0
Transcript of Download (4.16MB) - Institute for Global Environmental ...


International Review for Environmental Strategies
Volume 6 Number 1 2006
Institute for Global Environmental Strategies Japan

Orders and product inquires: Please contact the IGES Secretariat, Institute for Global Environmental Strategies, 2108-11 Kamiyamaguchi, Hayama, Kanagawa, 240-0115 Japan; Tel: +81-46-855-3700; Fax: +81-46-855-3709; E-mail: [email protected].
Submissions: For queries relating to the general submission of manuscripts including electronic text, and the status of accepted manuscripts,please contact the IGES Secretariat, Institute for Global Environmental Strategies; Tel: +81-46-855-3700;Fax: +81-46-855-3709; E-mail: [email protected].
© 2006 Institute for Global Environmental Strategies. All rights reserved.
Exclusive copyrights of papers in IRES belong to IGES. No part of this publication may be reproduced or transmitted in any form or by any means, electronic or mechanical, including photocopy, recording, or any information storage and retrieval system, without permission in writing from IGES.
Although every effort is made to ensure objectivity and balance, the printing of a book or translation does not imply IGES endorsement or acquiescence with its conclusions or the endorsement of IGES financers.
IGES maintains a position of neutrality at all times on issues concerning public policy. Hence conclusions that are reached in IGES publications should be understood to be those of the authors and not attributed to staff-members, officers, directors, trustees, funders, or to IGES itself.
Copy-Edit: Caspar Trimmer Print: Sato Printing Co. Ltd.
IGES has entered into a licensing partnership with EBSCO Publishing, a leading database provider to the library marketplace. The text of IRES can be found in these databases, marketed worldwide to libraries.

International Review for Environmental Strategies
1
Editor’s Note
Asia is becoming the focus of global environmental concern. Of the world’s 15 most polluted cities, 13 are in Asia; a third of Asians have no access to safe drinking water; and half of Asians have no access to adequate sanitation facilities.1 The rapid growth of two Asian giants, India and China, hints at a new world order coming, including a great increase in Asia’s influence over international affairs and the future of the planet. Given these trends, I believe that the mission of IGES to illuminate environmental issues in the Asia-Pacific region is becoming more and more important. IGES will continue to deliver practical solutions to tackle the challenges facing the region, and the world.
This issue of the International Review for Environmental Strategies (IRES) presents expert views on a broad range of environmental concerns of direct relevance to Asia.
K. S. Kavi Kumar and S. Tholkappian present an integrated vulnerability index that is designed to help understand and predict the impacts of climate change, and prioritize adaptation, focusing on the threats to coastal regions of India from sea-level rise. In addition, the authors recommend that instead of post-disaster assistance, the Indian government should focus on developing the insurance market (including the international reinsurance market), and on micro-finance assistance, so that residents of vulnerable coastal regions are better prepared for disasters.
K. Murthy and others compare two types of forest-management system prevalent in India: community-initiated forest management and the newer state-initiated joint forest management. Despite population pressure and higher utilization of forest resources, community forest management offers a good level of protection and biodiversity preservation, strong compliance with rules, and effective complaints mechanisms. Highlighting the underlying strengths of community-forest management, the authors demonstrate that participatory decision making and decentralization are important elements in effective forest management and sustainable development.
In Asia, as in the rest of the world, an increasing number of nature tourism sites are promoting themselves with the label of ecotourism, yet their claims are often questionable. Ravinder N. Batta develops a set of indicators of ecotourism and then applies these to three neighboring nature tourism destinations in the Indian Himalayas. Using data from surveys with tourists, local residents, tourism operators and local authorities, the study assesses how well tourism in the area measures against the indicators of ecotourism, and recommends how to bridge the substantial gaps.
Lutz Wicke and Gerd Duerr-Pucher argue persuasively that the current Kyoto system of national commitments is fundamentally flawed. As an alternative, they introduce a flexible global cap-and-trade scheme, the Global Climate Certificate System, which would benefit both industrialized and developing nations while limiting global emissions to levels that could prevent dangersou climate change.
The credibility of the Kyoto Protocol and its effectiveness in mitigating climate change have been badly affected by the decision of the United States to opt out. Drawing on game theory, Claudia Kemfert
1. Institute for Global Environemntal Strategies (IGES). 2005. Sustainable Asia 2005 and Beyond: In the Pursuit of Innovative
Policies. Hayama, Japan: IGES.

Vol. 6, No. 1 International Review for Environmental Strategies 2006
2
assesses different options to draw non-cooperating nations back into the climate regime. In particular she looks at the implications of trade sanctions for both non-cooperating and cooperating nations and suggests that more positive incentives such as bringing in developing nations and cooperating on R & D could be much more appropriate.
Anna Korppoo and Kayo Ikeda highlight the huge unrealized potential for cooperation on energy and climate between the Russian Far East and Japan. The authors scrutinize past experiences and current obstacles to cooperation, and the prospects for joint implementation projects under the Kyoto Protocol that would exchange Japanese technological expertise for Russian energy.
Abel Afon’s experiment with using a comibination of Residents’ Satisfaction Index and Actual Aspiration Index to identify the priorities for urban regeneration in a Nigerian city has much to offer the Asia-Pacific region. Upgrading city centers with scarce resources is a challenge that many Asian cities are tackling today. This study demonstrates how these tools can be easily applied to democratize the urban development process and to target resources efficiently where they are most needed.
China is estimated to have between 25 and 45 percent of the world’s potential for clean development mechanism (CDM) implementation, as much as the rest of Asia combined, yet so far it has lagged behind other countries in putting the CDM into practice. Duan Maosheng and Erik Haites present the considerable progress China has made in preparing for CDM implementation, and suggest ways to overcome the remaining constraints.
Finally, Axel Michaelowa reviews the new book Climate Trading: Development of Kyoto Protocol Markets by Deborah Stowell, a solid introduction to the Kyoto Protocol.
I would like to take this opportunity to offer our sincere thanks to each of the IRES editorial board members who served until last year.
Dr Hoesung Lee, President of the Council on Energy and Environment Korea and a founding member of the IRES board, who has been a source of encouragement and support for his fellow board members with his gentle manner.
Dr Peter deJanosi, Senior Adviser of LEAD international, has given direction to both IGES and the IRES with his keen yet kind leadership. His contribution to establishing the foundations of publication procedures has became an indispensable part of IRES.
Dr Ryokichi Hirono, Professor Emeritus of Seikei University, has always been ready to proffer a generous helping hand. With his wide network of contacts and his kind support, he led many of the peer reviews.
As always, we look forward to further contributions from readers of IRES, to ensure that future issues remain fertile ground for ideas, debate, and solutions to the environmental problems we face in the Asia-Pacific region, today and tomorrow.
Akio Morishima
Chair of the Editorial Board, International Review for Environmental Strategies
Chair of the Board of Directors, President, Institute for Global Environmental Strategies

International Review for Environmental Strategies Vol. 6, No. 1, pp. 3 – 22, 2006
© 2006 by the Institute for Global Environmental Strategies. All rights reserved.
3
Article
Relative Vulnerability of Indian Coastal Districts to Sea-Level Rise and Climate Extremes
K.S. Kavi Kumar a and S. Tholkappianb This study estimates the relative vulnerability of coastal districts of India using an integrated
vulnerability index, which is defined as a function of the exposure, sensitivity, and adaptive capacity of the districts to present and future climate risks. The study also ranks districts in terms of the likely number of human casualties due to potential surge associated with cyclonic storms. The results indicate that the districts on the east coast are relatively more vulnerable than those on the west coast. Relative rankings of the coastal districts based on predicted storm-induced casualties are similar to the rankings based on the integrated vulnerability index, indicating the robustness of the findings. The primary purpose of the relative vulnerability measures developed in this study is to provide insights on prioritizing adaptation for specifically vulnerable regions. The study discusses policy issues with reference to the “adapt to what” and “how to adapt” aspects of adaptation and argues in favor of avoiding maladaptation to present-day extreme climate events and harmonizing climate-change adaptation with integrated coastal-zone management practices.
Keywords: Climate change, Coastal zones, Vulnerability, Adaptation
1. Introduction
Climate change and associated sea-level rise (SLR) are believed to be inevitable, and the Intergovernmental Panel on Climate Change (IPCC) observes in its third assessment report (2001, p.10) that “there is new and stronger evidence that most of the warming observed over the last 50 years is attributable to human activities.” While changing climate poses challenges to humanity as a whole, the available evidence suggests that the developing countries are particularly vulnerable. Most of the available impact estimates, however, do not account for impacts due to extreme climate events such as cyclones and droughts, whose frequency and intensity could also increase under changed climatic conditions. These natural disasters currently cause significant damage in developing countries. Asia, for example, accounted for almost 38 percent of hydrological and meteorological disasters that occurred during the period 1991 and 2000 around the world. Of those reported killed by natural disasters, 83 percent lived in Asia, while 67 percent lived in nations with low Human Development Indexes (IFRC 2001).Thus, from the developing country perspective, present-day vulnerability due to natural disasters, the possibility of increase in frequency and intensity of such events with climate change, and the
. Corresponding author,. Madras School of Economics, Gandhi Mandapam Road, Chennai – 600 025, India. Tel. +91 44-
22300304, Fax +91 44-22352155; Email: [email protected] a. Associate Professor, Madras School of Economics, India. b. Academic Associate, Indian School of Business, Hyderabad, India.

Vol. 6, No. 1 International Review for Environmental Strategies 2006
4
potential high impact of climate change on the performance of climate-sensitive sectors make a strong case for focus on adaptation options as part of climate-change policy. A fundamental input necessary for formulating adaptation policy is knowledge about impacts induced by climate change on, and the vulnerability of, climate-sensitive sectors.
The threat of rising sea levels as a result of climate change makes coastal resources, coastal infrastructure, and population living in coastal areas highly vulnerable. At the same time, as the rise in sea levels is likely to be a gradual process, numerous adaptation options, such as building dikes and floodwalls, wetland restoration, afforestation, and relocation of threatened buildings, also exist. Moreover, climate change could manifest itself through extreme events such as cyclones, and hence a proper understanding of current management practices for coastal zones, such as early-warning systems and hazard insurance, could provide useful insights about potential adaptation strategies.
India, with more than 7,500 km of coastline covering the Gujarat, Konkan, and Malabar coasts in the west and Tamil Nadu, Andhra Pradesh, Orissa, and West Bengal coasts in the east, is the specific focus of this study. There are a total of 53 coastal districts and six union territories, and a large proportion of the total population lives in these areas. The objective of this study is to assess the relative vulnerability of coastal districts of India to present-day and future climate threats. The paper is organized as follows: the rest of this section briefly reviews the related literature; section 2 describes the methodology adopted and data used; section 3 presents the results; and the last section discusses the policy implications of the results.
Literature on SLR impacts is vast and well advanced. However, given that the focus of the present study is on assessing the relative vulnerability of coastal regions, the discussion here is limited to only a few aspects of this literature. After providing a brief overview of evidence for SLR and extreme climate events in India, this section outlines the literature on SLR impact assessment and India-specific studies.
The studies by Emery and Aubrey (1989) and Mahadevan (1992) have established weak evidence for rise in the mean sea level along the Indian coast. Analysis of historical tide-gauge data along peninsular India shows an average rise of sea level by 0.67 mm/yr as against the global average of 1.8 mm/yr (Asthana 1993). There are also studies refuting the link between sea-level rise and climate change and arguing that interdecadal changes in sea level along the Indian coast can be linked to the variability of the monsoon (for example, Shankar 1998).
Table 1 shows the occurrence of cyclonic storms in the Bay of Bengal during the period 1877 to 1995. According to Ali (1999), India is hit by 3.34 percent of the world’s total tropical cyclonic storms; India and Bangladesh together are hit by only 4.27 percent of the world storms but suffer most, with 76 percent of total storm-related deaths occurring in the two countries. One necessary but insufficient condition for tropical cyclone formation is that the sea’s surface should have a minimum temperature of about 26 to 27oC. This leads to speculation that any rise in sea surface temperature (SST) due to climate change is likely to be accompanied by an increase in cyclone frequency. However, evidence from the Bay of Bengal region suggests that even though there has been an increase in the SST since 1950, no corresponding increase in the frequency of cyclones can be established.

Vol. 6, No. 1 Relative Vulnerability of Indian Coastal Districts 2006
5
Table 1. Cyclonic storms in the Bay of Bengal, 1877–1995
India Bangladesh Dead Total
All types 848 154 115 1,223
Depressions 539 68 69 715
Cyclonic storms (CS) 197 43 35 310
Severe cyclonic storms (SCS) 112 43 11 198
CS + SCS 309 86 46 508
% of global total (CS + SCS) 3.34 0.93 0.5 5.5
Source: Ali 1999.
Besides evidence from historical records, predictive climate models can also be used to analyze extreme climate events. In a recent study, Palmer and Raisanen (2002) analyzed the output of 19 climate models and estimated that the Asian monsoon region would experience a fivefold increase in amount of summer rainfall, escalating the risk of flooding in already flood-prone areas. On the other hand, there are reasons to expect the storm-surge height to increase, both due to climate change (and hence increase in SST) and to SLR. Using a numerical storm-surge model, Ali (1999) showed that the surge height of a cyclonic storm that hit the Bangladesh coast in April 1991 would be increased by as much as 40 percent if SST were to increase by 4oC and the sea level were to rise by 1 m.
The impact assessment studies can be classified into four generations of models (West and Dowlatabadi 1999). The first-generation models overlaid SLR scenarios onto topographical maps of coastal regions to assess the physical and economic impacts (Yohe 1990), whereas the second-generation models accounted for the possibility of human adaptation (Titus et al. 1991). The third-generation models brought in the possibility of perfect foresight of the markets while assessing the value of property at risk of inundation (Yohe et al. 1996). Fourth-generation models share the features of third-generation models but also take into consideration the present-day influence of extreme climate events such as cyclones (West, Dowlatabadi, and Small 2000).
The study coordinated by Jawaharlal Nehru University for Ministry of Environment and Forests, Government of India (Asthana 1993) is by far the most comprehensive effort undertaken to assess potential land loss due to SLR and the associated population at risk in India. Using the methodology of the first generation of impact models, this study estimated that a total area of 5,763 km2 (i.e., 0.4 percent of the total area of the coastal states) would be affected, and that about 7.1 million people (some 4.6 percent of the total coastal population) would be at risk. ADB (1994) expressed these physical impacts in value terms by making some broad assumptions about the land value and population displacement costs. The overall economic damage was estimated to be as high as 43 percent of India’s 1988 gross domestic product (GDP), while the annualized costs spread over a period of 40 years are estimated at 0.18 percent of GDP.
In a more recent study, TERI (1996) assumed that changes in GDP could be used as a proxy for land and capital losses due to SLR. An interesting observation of this study is that the cost of protection is

Vol. 6, No. 1 International Review for Environmental Strategies 2006
6
relatively low in districts that are prone to high economic impacts such as Mumbai, whereas the protection costs are higher in districts like Balasore and Goa where the impacts are likely to be less.
2. Methodology and data
To assess economic impacts due to SLR in accordance with the third- and fourth-generation models mentioned above, more precise estimates of the physical impacts than those available from Asthana (1993) would be required. In the absence of such information, the present study adopts two distinct but related strategies to assess the relative vulnerability of Indian coastal districts: First, given that the impacts due to sea-level rise are likely to be varied across different parts of the country, a district-level composite vulnerability index is developed to identify the most vulnerable coastal districts. Also, the vulnerability index would take both climate and non-climate factors into consideration and hence the analysis is a step forward from impact assessment. Second, Indian coastal districts are often affected by cyclonic storms. However, there are significant differences across districts in terms of their exposure and vulnerability to such storms. Hence, using human casualties—which are the most significant impacts due to the storms—it is possible to study the relative vulnerability of coastal districts.
2.1. Coastal vulnerability index
Two aspects of index computation that deserve attention, namely the choice of components and the method of computation, are discussed in detail here. Use of the term vulnerability here is in accordance with the broad definition used in IPCC literature: vulnerability of a system is a function of its exposure and sensitivity to climate change, and its adaptive capacity. A wide range of characteristics of the system, including ecological, economic, social, demographic, technological, and political factors, is considered here to assess vulnerability. District-specific data on the following parameters (which are considered to influence vulnerability) is assembled:
Demographic: (a) population density based on the 2001 census (GoI 2001); (b) annual growth rate of population; (c) population at risk due to sea-level rise.
Physical: (a) coast length; (b) insularity (defined as ratio of coastal length to the area of the district); (c) frequency of cyclones (weighted to account for cyclones of different intensities) based on historic data; (d) probable maximum surge height; (e) area at risk of inundation due to SLR; (f) number of vulnerable houses—both those at risk of damage and of destruction (based on the 1991 census).
Economic: (a) agricultural dependency (expressed in terms of population dependent on agriculture and other primary sectors); (b) income and/or infrastructure index.
Social: (a) literacy; (b) spread of institutional set-up.
In terms of the IPCC definition of vulnerability, indicators like coastal length and frequency of cyclones represent the region’s exposure, whereas population density and its growth rate, insularity, agricultural dependency of the population, area and population at risk due to SLR, probable maximum surge height, and number of vulnerable houses represent the region’s sensitivity. Together these two sets characterize the potential impacts on the region. Socio-economic indicators like literacy and income represent the adaptive capacity of the region, and the vulnerability is the net result of potential impacts

Vol. 6, No. 1 Relative Vulnerability of Indian Coastal Districts 2006
7
and adaptive capacity. It may be noted that income can be considered both as a measure of adaptive capacity and as an indicator of sensitivity.
Table 2 shows district-specific data on the above parameters. It may be noted that some of the districts are clubbed for data consistency.1 Income data at district level is not readily available and state-level value added in primary, secondary, and tertiary sectors is allocated across districts using the following procedure:
Income for kth district is estimated as:
Incomek = Agricultural NDDPk + Industrial NDDPk + Services NDDPk
where, NDDP is net district domestic product and NSDP is net state domestic product. Sector-wise NDDP for kth district is calculated as:
Since the components of the index are often measured in different units, the observations have to be standardized or normalized to enable their use in index computation. The normalization procedure most commonly used is one that adjusts the observation to take a value of between 0 and 1, using the formula
Vij = (Xij – min Xi) / (max Xi – min Xi)
where, Vij stands for the standardized observation associated with the ith component for region j; Xij
stands for the value of the ith component in the vulnerability index, for region j; max Xi and min Xi stand for the maximum and minimum values of the ith component for all regions in the index. The method is further refined to reduce the undue impact of outliers on the distribution of the observations, by
1. In Andhra Pradesh, Prakasam District is clubbed with Nellore District, and Vizianagaram District is clubbed with
Vishakapatnam District. In Tamil Nadu, Pudukottai District is clubbed with the Thanjavur District, and Chidambaranar District is clubbed with Tirunelveli-Kattabomman District.
NSDPalAgriculturstatein theareasownnetTotal
districtin theareasownNetNDDPalAgricultur k
NSDPIndustrialsec
sec
NDDPIndustrial k
statetheintorindustrialinemployedPopulationdistricttheintorindustrialinemployedPopulation
NSDPServicessec
secNDDPServices k statetheintorserviceinemployedPopulationdistricttheintorserviceinemployedPopulation

Vol. 6, No. 1 International Review for Environmental Strategies 2006
8
Tabl
e 2.
Cha
ract
eris
tics
of c
oast
al d
istri
cts
No.
of v
ulne
rabl
e ho
uses
f
1 Ea
st G
odav
ari
And
hra
Prad
esh
4,87
2,73
17.
3045
158
195.
767
.89
25.5
1 18
5,07
8 8
3.50
211,
265
116,
369
263,
149
2 G
untu
r A
ndhr
a Pr
ades
h4,
405,
578
7.27
387
5659
.873
.29
41.5
1 17
7,14
4 3
6.00
2,89
694
,858
116,
098
3 K
rishn
a A
ndhr
a Pr
ades
h4,
218,
519
14.0
548
362
124.
866
.27
33.9
6 17
8,41
7 14
5.50
9,08
179
,694
221,
357
4 N
ello
reg
And
hra
Prad
esh
5,71
4,66
310
.93
186
5419
2.5
75.9
048
.51
227,
115
215.
005,
574
102,
039
265,
090
5 Sr
ikak
ulam
A
ndhr
a Pr
ades
h2,
499,
992
7.71
386
4719
9.1
76.5
330
.01
235,
801
143.
0020
,069
44,6
4226
7,65
7
6 V
isak
hapa
tnam
hA
ndhr
a Pr
ades
h6,
224,
866
15.3
634
052
129.
862
.24
21.3
6 14
8,98
8 8
3.00
4,89
693
,664
275,
456
7 W
est G
odav
ari
And
hra
Prad
esh
3,79
6,15
97.
9249
065
13.7
71.9
935
.35
144,
176
04.
001,
219
80,9
7014
5,85
2
8 N
orth
Goa
G
oa
757,
411
13.9
344
276
41.5
27.6
318
.12
59,4
82
03.
409,
645
16,1
040
9 So
uth
Goa
G
oa
586,
595
16.1
630
171
67.2
28.5
315
.54
42,9
02
03.
406,
042
12,5
160
10
Ahm
edab
ad
Guj
arat
6,
079,
574
26.6
166
770
35.0
26.5
911
.99
401,
289
04.
0016
,425
67,1
8762
,223
11
Am
reli
Guj
arat
1,
333,
381
6.45
206
5857
.967
.20
48.6
0 81
,943
0
4.00
31,8
2817
,689
37,4
85
12
Bha
ruch
G
ujar
at
1,82
3,46
417
.94
208
6112
7.8
68.7
441
.44
83,1
00
04.
808,
346
38,8
700
13
Bha
vnag
ar
Guj
arat
2,
734,
158
19.2
922
157
155.
955
.97
32.7
2 15
4,48
2 2
4.70
11,3
2741
,666
111,
006
14
Jam
naga
r G
ujar
at
1,91
3,63
922
.39
135
5528
5.1
57.5
842
.44
114,
594
32.
5011
,421
42,8
0612
1,30
1
15
Juna
garh
G
ujar
at
2,79
1,91
416
.58
281
5924
1.0
67.4
338
.86
126,
270
102.
803,
002
47,8
2222
1,77
4
16
Kac
hchh
G
ujar
at
1,52
6,37
120
.90
3361
472.
257
.68
52.5
2 11
0,74
0 3
2.50
37,7
7456
,868
71,7
67
17
Khe
da
Guj
arat
3,
893,
011
13.1
453
964
27.8
70.4
329
.87
143,
548
04.
8033
,872
38,7
590
18
Sura
t G
ujar
at
4,99
6,27
247
.04
653
6551
.544
.84
14.4
5 22
6,99
5 0
4.80
12,5
2675
,750
0
19
Val
sad
Guj
arat
2,
639,
894
21.4
550
363
74.5
62.1
822
.27
108,
127
05.
0014
,479
62,3
250
20
Dak
shin
Kan
nad
Kar
nata
ka
3,00
5,99
411
.57
356
7315
1.1
42.5
311
.06
144,
389
23.
4019
,209
49,8
340
laireS t cirtsi
D .o
N1002 no ita lupoP
etatS
htw org . poP
eta r10–1991
.poPyti sne d
1002
yca retiLetar10 02
tsaoC
)mk( h tgn el
arobal .irg
A1991 ecrof
erahSfo
ni .irgae
mocnI dedd a eulav
benolcy
C. qerfc
HSMP
daer
A).ah( detceffa
ede yor tse
Ddega
m aD

Vol. 6, No. 1 Relative Vulnerability of Indian Coastal Districts 2006
9
.2 elbaTd eunitnoc
23109.01
862,353,1 akatanra
K danna
K rattU
12521,12
123,907.3
0 104,44
01.8154.56
3.24176
0
848
67 6,112 .5
0 84 ,501,2 al are
K ahzupp al
A 22
453,5 4841,1
0 0.30
407,2 7 54 .22
31 .040.2
0
8782 ,1
90 .9 3 23 ,3 70 ,3
alareK
malukanr E
32622,8 4
0230 0.3
1 669, 611
51.421 2.23
0.6 44
0
828
50831.7
572,214,2 alare
K runn a
K 42
570,34259
0 0. 31
362,3 9 71 .2 3
4 7. 930. 2
0
0747
41603 .21
3 03,302,1 a lar e
K do gar asa
K 52
6 03,420 28 ,1
00 .31
04 7, 74 7 6. 44
1 2.8 40.
0
318
200,133.7
1 40,4 85,2 ala re
K
ma lloK
62339, 25
85 3, 204.2
0 31 2, 38
71 .7 28 2. 64
0. 70
728
822,178.9
925 ,878,2 alar e
K edok ihzo
K 72
321,75034,1
05.32
213,701 79.32
62.230.1
0
32 0,122.71
81 5,926,3 a lare
K
m aru ppa laM
8 2856,45
99904.3
1 689,79
25 .2361.35
0.0 767
0
,187.9
23 8,4 32,3 ala re
K
m arupah tn an avuri hT 92
35 3,06400,2
03.21
221,49 6 0.42
89.640.87
0 8674
0
538
18907.8
754,579,2 al are
K russ irhT
03885,3 5
8690 4.3
0 191, 301
29.3254 .83
0.40
130 .02
672,4 19,11 art hsaraha
M iab
muM reta er
G 13
924,96576,8
02. 43
200,77 3,1 00.0
76.03.85
77978,1
0
76903
98.02 020,602,2
arthsa rahaM
h ragiaR
23931,34
809,401.4
2 954,67
49.0535.58
7.7210
6602
78.9 554,696,1
arthsarahaM
irigantaR
33802,4
808,100.3
2 763,96
86.4241.67
7.4815
0
11 7
56155.3
396,168 arthsaraha
M grudu hdn iS
4 3023,63
52.1267.57
9.01258,22
142,309.2
0
0
07058
68.45 797 ,821, 8
arthsar ahaM
enahT 53
226,39727,22
02 .40
086,825 86.3
18.230.481
0
.03126
23537.91
402,5 53,3 assir
O ra
whselaB
63039,093
821,9008,11
08.991
683,0 7 26.04
19.773
66.051
86224
06.31 427,37 2,6
assirO
kcattuC
73861,465
156,65007,71
05.571
731,271 79.42
99.5
0 .2645
05210.6 1
2 84 ,46 6, 3 assi r
O
maj naG
83944, 831
30 4,4600 1
07 .27
789 ,08 14.73
59 .67 62.74 1
0 713 3
41. 02 232 ,3 13, 4
as sirO
iruP 93
915 ,61 29 45, 94
00 6,7 102 .3
01 5 02,301
20. 6136.4
, 80 6, 5 uda nli
maT u ttaplagneh
C 04
5 2 85.11
0 2.159.251
864 17
3 5.02 50 9
954, 66 3174, 001
044,3100.3
51 110,8
66 ,1 u da nl i
maT ira
mukayi nnaK
1443 1,5 2
71 107.2
2 10 6,3 7
47 .012 8.85
0. 5697
29 94 3.4
408 ,90
371 32,42
67 .9 6 13, 612 ,4
u danl imaT
sardaM
24536,19
056,68873,3
54. 551
896,673 00.0
49.00.71 1
46082
37.5 395,902,1
ud anlima T
marup aht ana
maR
34527, 1
1 11,228 09,9
00. 113
519,84 8 4.04
12.4 72 .68 7
06084
90 .7 763 ,42 2,5
u da nlim aT
tocrA htu oS
44940, 912
3 06,4 9272,4
00.35
914,351 23.73
61.0 84.9
r uvajnahT 54
i3
3 0.379 .522
7 688 4
07. 7 76 9,9 03, 6
ud an lima T
260,2 647 6,9 52
00 3,4 100. 7
3 1 716,4 22
94.0
sesuoh elbarenluv fo .oN
f
laireS t cirtsi
D .o
N1002 no ita lupoP
etatS
h tw org . poP
etar10–1991
.poPyti sne d
1002
yca re tiLetar1002
tsaoC
)mk( htgnel
arobal .irg
A1991 ecrof
erahSfo
ni .irgae
mocnI dedda eulav
benolcy
C.qerfc
HSMP
daer
A).ah( detceffa
edeyortse
Ddega
maD

Vol. 6, No. 1 International Review for Environmental Strategies 2006
10
.2 elbaTdeunitnoc
:setoN
. b ;SIG gnisu noitaluclac s’r oh tu
A .a gn isu ,snoi ta
mi ts e s’r ohtua eht no desaB
ni ,at ad PD S 19 –0991
( sdnasuoht-derdnuhhkal
at ad no desaB .c ;seepu r fo )
igoloroeteM aidnI eht
morf suoirav ni tne
mtrapeD lac
fo seussim as ua
Mded ivorp secnerefer cificeps o
N .eni zagam
ad morf ;thgi eh e gr us
mumixa
m elbabor P .d .ete
m ni ,7991 CPT
MB at
a serugi f ehT .e ;sr rof era dna 3991
UN J
morf er
CPTM
B morf ata
D .f ;RLS
m 1 no des ab ,7991
.atad susnec 19 91
sesuoh elbarenluv fo .oN
f
laireS t cirtsi
D .o
N1002 no ita lupoP
etatS
h tw org . poP
etar10– 1991
.poPy ti sne d
1002
yca re tiLetar10 02
tsaoC
)mk ( h tgn e l
arobal .irg
A1991 ecrof
erahSfo
ni .irgae
mocnI dedda eulav
benolcy
C. qerfc
HSMP
daer
A).ah( detceffa
edeyortse
Ddega
maD
ilev lenur iT 64
j379,65
585,1200.6
2 787,612
59.7146.55
3.36107
2 8343.01
5 99,66 3,4 ud anli
ma T0
7 015 6
5 8686.51
653,836,9 lagne
B .W
rupinideM
74574,732,1
127,46007,02
05.2121
836,843 94.84
03.961 0. .
l agneB .
W sanagra P 4 2 htro
N 84
81 ,246.2 2
99 4,039 ,8042, 075
200,63 1765, 92
00.2132
8 54,2 83 6 5.41
4 7.532 .47
071
l agn eB .
W san agra P 42 htuoS
943 2
00.1 385.9 5
81 106
49 698 .02
009,8 09,6442, 995
680, 763 39,17
52.2132
3 79,3

Vol. 6, No. 1 Relative Vulnerability of Indian Coastal Districts 2006
11
assigning the value of 1 to the top decile of values in the observations of a particular variable and a value of 0 to the bottom decile.
The averaging procedure to compute the final index can be based on assigning equal or varying weights to each component. Briguglio (1995) experimented with varying weights for each component, but the preferred method was that involving equal weights. Many index-based studies have followed this procedure (for example, Brenkert and Malone 2004; Briguglio 1995, 1997; O’Brien et al. 2004; Wells 1996).2
In this study, the composite index for each district is calculated by taking the average of all the standardized observations over all the components. The averaging procedure implies that equal weights are assigned to each component. The procedure is similar to that followed in the construction of the Human Development Index by the UNDP (see UNDP 2002). The index computations are made for a range of combinations of the parameters listed above. The components of the different indices are as follows:
V1 = Insularity, population density, population growth, population dependent on agriculture, literate population, vulnerable houses (total), probable maximum surge height, and cyclone frequency.
V2 = Insularity, population density, population growth, population in agriculture, literate population, vulnerable houses (at risk of being destroyed), probable maximum surge height, and cyclone frequency.
V3 = Insularity, population density, population growth, population in agriculture, literate population, vulnerable houses (at risk of being damaged), probable maximum surge height, and cyclone frequency.
V4 = V1 + income as vulnerability indicator.
V5 = V1 + income as resilience indicator.
V6 = V1 – insularity + area affected due to sea-level rise.
V7 = V6 + income as vulnerability indicator.
V8 = V6 + income as resilience indicator.
The indices V3, V2, and V1 differ in terms of categories of vulnerable houses: V2 includes houses at risk of being destroyed, V3 includes houses at risk of being damaged but not destroyed, and V1 includes houses in both categories. Three different indices are considered because in some coastal districts, more houses are at risk of damage, whereas in other districts, more houses are at risk of destruction. The indices V4 and V5 are more complete indices (in comparison to V1), as they include an income component also. However, they differ in terms of considering income as an indicator of adaptive capacity (or resilience) and as an indicator of sensitivity. The index V6 is a variant of index V1 but
2. Other methods include: (a) mapping on a categorical scale, which is suitable for qualitative data and involves mapping the
scores on a categorical scale ranging from the lowest possible incidence to the highest (see Kaly et al. 1998); and (b) the regression method, which lets the data produce the weights and does not require normalization of the observations. However, the regression method has a number of methodological problems that limit the operationalization and reliability of the index, the most important limitation being the need to identify a proxy for vulnerability to serve as a dependent variable (see ; Atkins,Mazzi, and Ramlogan 1998; Wells 1996).

Vol. 6, No. 1 International Review for Environmental Strategies 2006
12
replaces the insularity indicator with the estimated potential area affected due to SLR. Finally, indices V7 and V8 again represent improvements over V6 as they include an income component. Different indices are constructed to check whether relative ranking across districts varies with the choice of components for the index.
2.2. Storms and human casualties
Given sufficient warning and resources, it is always possible to minimize the human loss during cyclonic storms. Broadly, the loss of human lives would depend on the risk level of the region, warning time, and compliance with the evacuation plan. Compliance with a warning would further depend on the preparedness of the region to evacuate the affected population to cyclone shelters as well as the confidence of the people in the reliability of the warning. Due to high levels of literacy and the credibility of the forecasts, in developed countries non-compliance factors would typically be low, whereas they would be high in a developing country.
The loss of human lives in any region can be estimated using the formula
H = i P C i ri
where P is the population of the region, C is the non-compliance factor, i is the fraction of the region’s area related to a given hazard level, and ri is the risk coefficient for the hazard level.
For each coastal district, the area with different hazard levels—which are defined based on wind velocities that would prevail during a storm and the storm penetration—is assessed using the Vulnerability Atlas of India (BMTPC 1997). The Vulnerability Atlas defines the following hazard levels for various wind speeds: very high (VH): 50 to 55 m/sec; high (H): 47 to 50 m/sec; moderate (M): 39 to 47 m/sec; and low (L): 33 to 39 m/sec. Each VH hazard zone is further classified into two zones, because part of a VH zone would be at higher risk due to the influence of surge. The surge influence factor for a district is calculated by the formula
surge influence factor = (coast length inland penetration)/(area)
where the coast length and area represent the district-specific values, and inland penetration is a parameter that is changed to generate different scenarios.
Thus for the analysis, four hazard levels are considered: VH + surge, VH, H, and M. The risk coefficients for various hazard levels are gathered from disaster-management literature (Krishna and Bhandari 1999): VH + surge: 5 10-2; VH: 5 10-3; H: 5 10-5; and M: 5 10-8. These risk coefficients reflect the probability of death due to storm; estimates of human casualties during the two major cyclones that crossed the coast of Andhra Pradesh in 1977 and 1990 made using these coefficients are close to the real figures (BMTPC 1998). The surge influence factor is calculated for two different scenarios of surge penetration: 10 km and 30 km. Two different scenarios for non-compliance factors are used to represent the extent of compliance observed during the 1977 and 1990 Andhra Pradesh cyclones. Since the present analysis assumes that the non-compliance factor is linearly related to human casualties, the two scenarios merely represent the extent of impact under different confidence levels in the cyclone warnings.

Vol. 6, No. 1 Relative Vulnerability of Indian Coastal Districts 2006
13
Tabl
e 3.
Vul
nera
bilit
y in
dice
s fo
r coa
stal
dis
trict
s
Seria
l N
o.
Dis
trict
V
1V
1ra
nk
V2
V2
rank
V3
V3
rank
V4
V4
rank
V5
V5
rank
V6
V6
rank
V
7 V
7ra
nkV
8 V
8 ra
nk
1Ea
st G
odav
ari
0.31
92
17
0.30
11
170.
3260
210.
2967
170.
3818
160.
4224
6
0.38
857
0.47
366
2G
untu
r0.
2786
30
0.
2633
31
0.30
1231
0.26
0030
0.34
6433
0.27
52
26
0.25
6926
0.34
3426
3K
rishn
a0.
3887
9
0.37
49
100.
3852
120.
3579
110.
4441
110.
3772
12
0.
3477
110.
4339
12
4N
ello
re0.
3872
10
0.
3750
9
0.38
6211
0.36
0610
0.43
8812
0.38
41
9 0.
3578
90.
4360
10
5Sr
ikak
ulam
0.
3416
15
0.
3301
15
0.31
2327
0.32
0816
0.39
7614
0.33
43
15
0.31
4315
0.39
1115
6V
isak
hapa
tnam
0.28
75
28
0.27
60
260.
2829
410.
2656
250.
3566
280.
2770
25
0.
2562
270.
3473
25
7W
est G
odav
ari
0.27
18
36
0.25
60
370.
2854
390.
2512
320.
3431
340.
2719
27
0.
2513
290.
3432
27
8N
orth
Goa
0.
2363
48
0.
2210
49
0.27
9543
0.21
2749
0.31
8548
0.21
27
48
0.19
1748
0.29
7546
9So
uth
Goa
0.
2443
45
0.
2291
45
0.28
7137
0.21
8546
0.32
7042
0.20
52
49
0.18
3749
0.29
2348
10A
hmed
abad
0.
2352
49
0.
2268
48
0.24
9748
0.23
9937
0.28
9449
0.24
14
34
0.24
5431
0.29
4947
11A
mre
li 0.
2397
47
0.
2291
46
0.24
4149
0.21
7548
0.31
9647
0.24
91
33
0.22
5934
0.32
8032
12B
haru
ch0.
2735
35
0.
2561
36
0.32
2422
0.24
7735
0.34
9631
0.26
18
31
0.23
7332
0.33
9228
13B
havn
agar
0.29
38
23
0.28
01
220.
2921
360.
2717
220.
3618
240.
2841
23
0.
2630
230.
3532
23
14Ja
mna
gar
0.30
76
20
0.28
93
200.
3030
300.
2806
200.
3773
170.
2898
20
0.
2648
220.
3615
19
15Ju
naga
rh0.
3693
14
0.
3567
14
0.33
8419
0.33
6414
0.43
1213
0.34
33
13
0.31
3316
0.40
8113
16K
achc
hh0.
2935
24
0.
2668
29
0.33
3420
0.26
7824
0.36
5120
0.30
41
19
0.27
7219
0.37
4617
17K
heda
0.25
02
40
0.24
29
400.
2710
460.
2320
410.
3240
430.
2670
29
0.
2469
300.
3388
29
18Su
rat
0.30
94
19
0.29
35
190.
3539
170.
2914
180.
3697
190.
3097
17
0.
2918
180.
3700
18
19V
alsa
d0.
2883
27
0.
2645
30
0.35
4916
0.26
2926
0.36
0726
0.28
01
24
0.25
5628
0.35
3422
20D
aksh
in K
anna
d 0.
2464
43
0.
2343
44
0.28
0442
0.22
8643
0.32
0545
0.23
62
39
0.21
9635
0.31
1440
21U
ttar K
anna
d 0.
2487
42
0.
2362
42
0.28
3840
0.22
2545
0.33
0840
0.
2380
36
0.
2129
380.
3212
35
22A
lapp
uzha
0.29
99
21
0.28
62
210.
3385
180.
2704
230.
3740
18
0.22
71
45
0.20
5646
0.30
9241
23Er
naku
lam
0.24
62
44
0.23
58
430.
2756
440.
2262
440.
3226
44
0.22
33
47
0.20
5945
0.30
2245
24K
annu
r 0.
2608
38
0.
2478
38
0.29
7634
0.23
7338
0.33
7539
0.
2272
44
0.
2074
440.
3077
43

Vol. 6, No. 1 International Review for Environmental Strategies 2006
14
.3 elbaTdeunitnoc
laireS tcirtsi
D .o
N 1
V1
V 2
V kn ar
2V
3V
knar3
V 4
Vknar
4V
5V
knar5
V 6
V knar
6V
7V
knar7
V 8
Vknar
8V
knar
52 dogarasa
K63
2742.052
2913.033
9062.0 13
2672.063
9613.034
2902.004
4332.0 92
0553.0
62
malloK
748 712.0
544472. 0
74 5722.0
64 8932.0
443503.0
744302.0
64 632 2.0
647913.0
72 edokihzo
K43
7 942.062
2613. 053
3852.0 43
5372.073
0513.073
0712.083
86 32.0 23
7743.0
82
maru ppalaM
1 3675 2.0
421 123.0
72 7962.0
92 2 382.0
133633.0
338 632.0
23 9952.0
720753.0
92
maru pahtnanavurihT3 3
99 42.082
7 803.023
0362.0 33
0 572.093
6113.00 4
5112.024
7132.0 03
0053.0
03russirhT
2 478 22.0
835682.0
14 3732. 0
14 2 052.0
248803.0
2 42012.0
34 4922.0
143723.0
13 iab
muM retaer
G0
60 254.0
84393.0
8 008 3. 0
31 5383.0
945532.0
216643.0
03 94 62.0
639043.
2 3h ragia
R91
34 82.051
1853.081
1003. 0 81
3513.061
0083. 002
0772.08 1
170 3. 0 51
378 3. 0
33ir igan ta
R93
143 2.074
7 062.043
0952.0 93
5952.083
8 413.014
60 12.014
0332.0 83
3833.0
43grud uhd niS
0 4133 2.0
929 703.0
93 8442.0
73 4162.0
433 123.0
937 112.0
73 4732.0
537243.0
53enahT
5 1233 3.0
413 953.0
61 5713.0
61 5823.0
421353.0
415 423.0
61 6813.0
528163.0
63ra
w hs elaB
03
3315. 05
245 4.01
4375.0 1
4375.02
2 106 .04
279 4.02
35 55. 0 1
3 716 .
73kca tt u
C0
70 224.0
97093. 0
6 5 454.0
6 4 164.0
55405.0
52714.0
5 0654.0
63905.
83majn a
G72
2262 .05 3
55 92.052
3 772.0 52
0 092.00 2
3063.042
185 2.022
4582.0 22
5463.0
93iruP
21084 3.0
3199 53.0
11 2 373.0
21 4 483.0
870 44.0
31124 3.0
11 8773.0
016 644.0
04u ttaplagneh
C0
82083.0
015783 .0
7 8093.0
7 3604.0
949 34.0
83 663. 0
8 7 093.0
733 54.
1 4 ira
muk ay innaK
821 162.0
323223. 0
42 7772. 0
62 4982. 0
336123.0
631812.0
53 11 42.0
125463.0
24sard a
M0
42405 .0
180 75.0
5 5315 .0
4 9435 .0
7484 4.0
684 93.0
7 8114.0
4875 5.
34
maru pahtanama
R41
8704.071
3 003.041
8533.0 8
8154.031
3443.07
1224.021
6173.0 11
3583.0
44 t ocr
A h tuoS12
9172 .03 3
28 92.032
8 972.0 22
2 492.012
6753.012
2762.012
0982.0 32
2263.0
54ruvajn ahT
1155 34.0
019653.0
01 2383.0
96644.0
9086 3. 0
46974.0
31 8263.0
8 759 3.0
64i le vlenuriT
9290 62.0
232992.0
82 7762. 0
23 0672. 0
032733.0
523 752.0
82 917 2. 0
738043.0
74 ru pinide
M0
57394 .0
636 24.0
4 5225. 0
5 6525. 0
4555 5.0
337 94.0
4 7925. 0
5915 5.
84 sa nag raP 42 htr o
N0
22515 .0
250 25.0
3 7235. 0
3 7645. 0
3046 5.0
241 15.0
3 4245. 0
3876 5.

Vol. 6, No. 1 Relative Vulnerability of Indian Coastal Districts 2006
15
laireS tcirt si
D . o
N 1
V1
V 2
V kn ar
2V
3V
knar3
V 4
Vk nar
4V
5V
knar5
V 6
Vknar
6V
7V
knar7
V 8
Vkn ar
8V
kna r
94 s anagr aP 42 htuoS
01
771 5.03
23 94.02
0 555.0 2
3365. 01
40 26.01
434 5. 0 1
1295.0 2
8495.
.3 elbaTdeunitnoc

Vol. 6, No. 1 International Review for Environmental Strategies 2006
16
3. Results and discussion
Computed vulnerability indices for the coastal districts along with their ranks according to each of the specifications described in the previous section are shown in table 3, while figure 1 shows the vulnerability index as per specification V1. The rank correlation between various vulnerability indices is shown in table 4. The correlations are significantly high between various indices, indicating that the relative ranking of the districts across different index specification is robust. Discussion here focuses on the highlighted rank correlations shown in table 4. Very high (0.99) and high (0.91) rank correlation between indices V1 and V2 and between V1 and V3, respectively, suggest that including either total vulnerable houses or houses that are at risk of destruction or damage may not change the overall ranking. Interestingly, the very high correlations between V1 and V4 and between V1 and V5 indicate that including income as either a resilience indicator or a sensitivity indicator does not influence the vulnerability rankings. One may argue, based on this result, that vulnerability across the Indian coastal districts is mainly determined by the potential physical impacts. However, rankings change significantly when the literacy component is taken out of the overall index calculation, justifying a role for adaptive capacity in the definition of vulnerability. High correlation between indices V4 and V5 (and also between V7 and V8) is surprising because these indices treat income in opposite ways. A careful look at the rankings in table 3 shows that the ranking of Greater Mumbai is reversed across these indices, in accordance with the hypothesis. However, it does not translate into the overall rank correlation because of the large difference between income levels of Greater Mumbai (which includes the commercial hub of India) and other districts.
Table 4. Rank correlation between various vulnerability indices
V1 V2 V3 V4 V5 V6 V7 V8
V1 1.00 - - - - - - -
V2 0.99 1.00 - - - - - -
V3 0.91 0.89 1.00 - - - - -
V4 0.98 0.98 0.89 1.00 - - - -
V5 0.96 0.94 0.87 0.92 1.00 - - -
V6 0.89 0.87 0.75 0.90 0.87 1.00 - -
V7 0.90 0.89 0.77 0.92 0.83 0.98 1.00 -
V8 0.86 0.83 0.72 0.83 0.90 0.96 0.89 1.00

Vol. 6, No. 1 Relative Vulnerability of Indian Coastal Districts 2006
17
The vulnerability index indicates that:
The districts along the east coast are relatively more vulnerable than those on the west coast.
The coastal districts in the states of West Bengal, Orissa, Andhra Pradesh, and Tamil Nadu are only marginally different from each other in terms of their vulnerability.
The districts that are frequently affected by cyclonic storms are relatively more vulnerable—these include districts like 24 Paraganas, Baleshwar, and Krishna.
As well as districts on the east coast of India being more vulnerable compared to those on the west coast, more cyclones hit the east coast than hit the west coast. The estimated human casualties for the coastal districts along the east coast under different scenarios are presented in table 5. The last two
Figure 1. Map of Indian coastal districts showing vulnerability index (using index V1)

Vol. 6, No. 1 International Review for Environmental Strategies 2006
18
columns show the likely losses due to more-severe cyclonic storms with higher inland surge penetration, which are expected under climate-change conditions. As mentioned in the previous section, the non-compliance factors are chosen merely to reflect the extent of damage observed in the two earlier cyclones that crossed the coast of Andhra Pradesh. In 1977, the early warnings were not sufficiently credible and compliance was very low. Added to that, the cyclone surge was very severe and the damage was some of the worst in India’s history. In contrast, the 1990 cyclone, while comparable in severity to that of 1977, was marked by credible early warning and, as a result, high compliance. Table 5 shows damage corresponding to non-compliance factors of 0.1 and 0.0065 (adapted from BMTPC 1998), reflecting these two extreme scenarios.
Comparison of the results shown in table 5 with those presented under the vulnerability index shows that the relative ranking of districts remains more or less similar between the two analyses. This is an important result because the two analyses address vulnerability from two related but different perspectives and their similarity shows the robustness of the findings.
4. Conclusions and policy implications
This study estimated the relative vulnerability of coastal districts of India using an integrated vulnerability index that takes into account impact—induced by present-day and future climate pressures,
Table 5: Expected Casualties due to Storms
Surge Penetration – 10 km
Surge Penetration – 30 km
NCF
District
0.1 0.0065 0.1 0.0065
East Godavari 167 334 374 747 Guntur 34 68 56 112 Krishna 105 211 224 448 Nellore 79 158 136 273 Srikakulam 218 436 476 952 Visakhapatnam 94 187 168 336 West Godavari 33 66 42 84 Baleshwar 192 384 441 882 Cuttack 186 372 390 780 Ganjam 36 71 57 115 Puri 98 196 209 417 South Arcot 71 142 127 254 Medinipur 310 620 562 1124
N 24 Parganas 470 940 1053 2105 S 24 Parganas 286 571 580 1160
Note: NCF – non-compliance factor, value 0.1 represents the extent of non-compliance observed during 1970 cyclone in Andhra Pradesh and 0.0065 represents the same during 1990 cyclone in Andhra Pradesh.

Vol. 6, No. 1 Relative Vulnerability of Indian Coastal Districts 2006
19
as well as the adaptive capacity of the districts, characterized by a range of physical, economic, social, and demographic parameters. Using information on areas with different hazard levels in the coastal districts, the study also estimated the number of human casualties across coastal districts due to potential surge associated with cyclonic storms.
Relative rankings of Indian coastal districts based on the integrated vulnerability index indicate that districts on the east coast are relatively more vulnerable than those on the west coast. Relative rankings of the coastal districts based on predicted storm-induced casualties are similar to the rankings based on integrated vulnerability index, indicating the robustness of the findings.
The primary purpose of the relative vulnerability measures developed in this study is to provide insights to guide prioritization of adaptation strategies for specially vulnerable regions. Given that adaptation is an important policy response, this section looks a little more closely at two important aspects of adaptation, namely what to adapt to and how to adapt.
4.1. Adapt to what?
As climate change may actually be experienced as a change in the frequency and/or intensity of extreme climatic events, disaster preparedness is an important component of climate-change action plans. Understanding vulnerability to present-day climate extremes such as cyclones would provide useful insights about the adaptive capacity of a region. Adaptation measures taken in anticipation of climate change can and usually should be harmonized with responses to current extreme climatic events. However, human activities are not always as well adapted to the current extreme events as one would want them to be. As argued by Burton, Kates, and White (1993), the losses suffered due to climate extremes cannot be ascribed to the events alone, because lack of appropriate human adaptation and sometimes maladaptation account for significant losses.
In this context it may be worth noting the experiences with the super-cyclone in 1999 that devastated the state of Orissa. There is general agreement that the cyclone’s devastating impacts were worsened significantly by deforestation on the coast. Satellite pictures show that 2.5 km2 of mangrove forest was lost every year during the 1970s. Without the protection of forests, the super-cyclone was believed to have traveled as far as 50 km inland. Mangrove forests make ideal places for conversion into ponds for shrimp farming, and India is one of the top four shrimp exporters in the world, with production growing by 15 percent a year. Orissa, a major center for the business, specializes in raising tiger prawns.
A rough estimate by the UN Food and Agriculture Organization (FAO 1999) indicates that in the past three decades, Andhra Pradesh has lost 40 percent of its mangrove forest to shrimp farming, while the corresponding losses in Orissa, Tamil Nadu, and West Bengal are 26 percent, 26 percent, and 1.25 percent respectively. It may be noted that the majority of the highly vulnerable districts according to the estimations in this study are located in these four states. An important policy lesson is to avoid these maladaptations and aim for sustainable resource-management practices.
4.2. How to adapt
Coastal zone management is about making trade-offs aimed at resolving competing sectoral demands, rather than optimizing the output of a single resource. Solving such problems requires integration of

Vol. 6, No. 1 International Review for Environmental Strategies 2006
20
management objectives and hence there is increasing interest in integrated coastal zone management (ICZM). In terms of responding to climate change, ICZM can be seen as an essential institutional mechanism that can deal with all competing pressures on a coast, including short-, medium-, and long-term issues. Vulnerability assessment of the type addressed in this study is often described as one possible trigger for ICZM; at the same time, ICZM will increase the need for more sophisticated and detailed assessment of the implications of climate change—while accounting for other climatic and non-climatic stresses on the coastal zones. Thus, an interactive evolution of vulnerability assessment within the ICZM framework can be envisaged, progressively contributing to an improved knowledge base for decision making. In India, ICZM plans are being drawn up for more and more coastal regions. The coastal zone regulations can be cited as an early manifestation of the ICZM plans.
Though risk management is well developed in the Indian context, with early warning systems and post-disaster management systems firmly in place, use of effective mechanisms for enabling people to better manage their own catastrophe risks are still lacking. While government’s role in disaster management cannot be eliminated entirely, efforts should be made to reduce the burden substantially. Once disaster assistance is institutionalized, as it is in the Indian context, then it has many of the longer-term effects of an insurance subsidy that inadvertently worsens future problems by encouraging people to increase their exposure to potential losses. For example, compensation for cyclone damage to homes can lead to construction of more houses in cyclone-prone areas. Insurance against natural disasters should have little or no government subsidy, to avoid the problems of moral hazard and adverse selection. New approaches like index-based or area-based contracts to insure against natural disasters should be attempted, and these approaches, in conjunction with developments in micro-finance, could make insurance an increasingly viable proposition for poor people to better manage risk.3
The insurer often faces high exposure because of the covariate nature of the insured risk. When a payment is due, then all those who have purchased insurance against the same risk must be paid at the same time. To hedge against this risk, the insurer can sell part of it on the international reinsurance and financial markets. Even though the global reinsurance market is well developed, its benefits are reaped almost entirely by the developed world. While the United States, the United Kingdom, and Japan account for almost 55 percent of the total reinsurance market, the developing countries in Asia, where most natural-disaster-related damage is borne, accounts for less than 8 percent of the global market. It is into this area that government should put most of its efforts, rather than into actual disaster assistance.
3. Area based (or index-based) insurance is specific to an area instead of each individual. Since buyers in a region pay the same
premium and receive the same indemnity per standard unit contract (SUC), it avoids all adverse selection problems. Moreover, the insured’s management decisions will not be influenced by the index contract, eliminating moral hazard. A farmer with rainfall insurance, for example, possesses the same economic incentives to produce a profitable crop as the uninsured farmer. Itcould be very inexpensive to administer, since there are no individual contracts to write, no on-site inspections, and no individual loss assessments. It uses only data on a single regional index, and this is based on data that is available and generally reliable. It is also easy to market—SUCs are sold rather like travelers’ checks, and presentation of the certificate issufficient to claim a payment when one is due.

Vol. 6, No. 1 Relative Vulnerability of Indian Coastal Districts 2006
21
Acknowledgements
This study is part of a project undertaken under the EMCaB (Environmental Management Capacity Building Technical
Assistance) Program of the World Bank and the Ministry of Environment and Forests, Government of India. The financial
assistance received from the Environmental Economics Research Committee is gratefully acknowledged. The authors would also
like to acknowledge helpful comments received from two anonymous reviewers. The usual disclaimer applies.
References
Ali, A. 1999. Climate change impacts and adaptation assessment in Bangladesh. Climate Research 12: 109–116.
Atkins, J., S. Mazzi, and C. Ramlogan. 1998. A study on the vulnerability of developing and island states: A composite index. London: Commonwealth Secretariat.
Asian Development Bank (ADB). 1994. Climate change in Asia: India country report. Manila: ADB.
Asthana, V. 1993. Impacts of Greenhouse Induced Sea-level Rise on the Islands and Coasts of India, Project report submitted to Ministry of Environment and Forests, Government of India, Delhi: JNU.
Brenkert, A.L. and E.L. Malone..2004. Modeling Vulnerability and Resilience to Climate Change: A Case Study of India and Indian States, Climatic Change, 72(1):57-102.
Briguglio, L. 1995.“Small island states and their economic vulnerabilities. World Development 23: 1,615–1,632.
———. 1997. Alternative economic vulnerability indices for developing countries. Report prepared for the Expert Group on Vulnerability Index, UN (DESA), 17–19 December.
Building Materials and Technology Promotion Council (BMTPC). 1997. Vulnerability atlas of India: Earthquake, windstorm and flood hazard maps and damage risk to housing, report of Expert Group on Natural Disaster Prevention, Preparedness and Mitigation. New Delhi: BMTPC, Ministry of Urban Affairs and Employment, Government of India.
———. 1998. Techno-legal aspects of earthquake, windstorm and flood hazards and land use zoning, report of Expert Group on Natural Disaster Prevention, Preparedness and Mitigation. New Delhi: BMPTC, Ministry of Urban Affairs and Employment, Government of India.
Burton, I., R. W. Kates, and G. F. White. 1993. The environment as hazard. 2nd ed. New York: Guilford Press.
Emery, K. O., and D. G. Aubrey. 1989. Tide gauges of India. Journal of Coastal Research 5(3):489–501.Food and Agriculture Organization (FAO). 1999. Rural aquaculture in India. RAP publication 1999/21. Bangkok: FAO Regional
Office for Asia and Pacific.
Government of India (GoI). 2001. Census of India 2001: Series I (India). New Delhi: Office of the Registrar General.
Intergovernmental Panel on Climate Change (IPCC). 2001. Climate change 2001: The scientific basis. Cambridge, UK: Cambridge University Press.
International Federation of the Red Cross and Red Crescent Societies (IFRC). 2001. World Disaters Report, Geneva, Switzerland:IFRC.
Kaly, U., L. Briguglio, H. McLeod, A. Schmall, C. Pratt, and R. Pal. 1999. Environmental vulnerability index (EVI) to summarisenational environmental vulnerability profiles. South Pacific Applied Geoscience Commission (SOPAC) Technical Report 275. Suva, Fiji: SOPAC.
Krishna, P., and N. M. Bhandari. 1999. Vulnerability and risk assessment for regions prone to cyclones. Paper presented at the Special Unit for Technical Cooperation among Developing Countries Workshop on Natural Disaster Reduction—Policy Issues and Strategies, December 21–22, Structural Engineering Research Council, Chennai.
Mahadevan, R. 1992. Impact of Sea-level Rise due to Greenhouse Effect: Statistical Analysis of the Past Tide Gauge Data along the East Coast of India, Project report submitted to Ministry of Environment and Forests, Government of India, Delhi.

Vol. 6, No. 1 International Review for Environmental Strategies 2006
22
O'Brien K L, R.M. Leichenko, U. Kelkar, H. Venema, G. Aandahl, H. Tompkins, A. Javed, S. Bhadwal, S. Barg, L. Nygaard, and J. West. 2004. Mapping vulnerability to multiple stressors: climate change and globalization in India. Global Environmental Change 14(4):303-313.
Palmer, T. N. and J. Raisanen 2002. Quantifying the risk of extreme seasonal precipitation events in a changing climate. Nature 415: 512–514.
Shankar, D. 1998. Low-frequency variability of sea-level along the coast of India. PhD thesis, Goa University.
Tata Energy and Resources Institute (TERI). 1996. The economic impact of a one metre sea-level rise on the Indian coastline: Method and case studies. Report submitted to Ford Foundation. New Delhi: TERI.
Titus, J.G., R. A. Park, S. P. Leatherman, J. R. Weggel, M. S. Greene, P. W. Mausel, S. Brown, C. Gaunt, M. Trehan, and G. Yohe. 1991. Greenhouse effect and sea-level rise: The cost of holding back the sea. Coastal Management 19(2):171–204.
United Nations Development Programme (UNDP). 2002. Human development report 2002. Oxford, UK: Oxford University Press.
Wells, J. 1996. Composite vulnerability index: A preliminary report. London: Commonwealth Secretariat.
West, J .J. and H. Dowlatabadi. 1999. Assessing economic impacts of sea-level rise. In Climate change and risk, ed. T. E. Downing, A. A. Olsthoorn, and R. Tol, 205–220. London: Routledge.
West, J. J., H. Dowlatabadi, and M. J. Small. 2000. Storms, investor decisions, and the economic impacts of sea-level rise. Working paper, Center for Integrated Study of the Human Dimensions of Global Change, Carnegie Mellon University.
Yohe, G. 1990. The cost of not holding back the sea: Toward a national sample of economic vulnerability. Coastal Management18: 403–431.
Yohe, G., J. Neumann, P. Marshall, and H. Ameden. 1996. The economic cost of greenhouse induced sea-level rise for developed property in the United States. Climatic Change 32(4): 387–410.

International Review for Environmental Strategies Vol. 6, No. 1, pp. 23 – 40, 2006
© 2006 by the Institute for Global Environmental Strategies. All rights reserved.
23
Article
Sustainable Community Forest Management Systems: A Study on Community Forest
Management and Joint Forest Management Institutions from India
K. S. Muralia, Indu K. Murthy b, and N. H. Ravindranathc
Our study covered 25 villages in India, comparing the functioning of forest protection groups founded under state initiatives, including institutions under the Joint Forest Management program and community forest management systems formed by communities on a voluntary basis. The study revealed that the length of time for which the forest has been protected has a lot of influence over biodiversity and regeneration of species. Further, voluntary forest protection groups have strong rules, complaints mechanisms, and respect for the rules. Therefore, despite higher population pressures per unit of forest land, voluntary forest protection groups have demonstrated stringency in resource use and sustainable harvesting mechanisms. This paper examines the impacts of different forms of forest management on protection mechanisms and forest regeneration. It also discusses the implications of the findings for policymaking.
Keywords: Community forestry, Joint forest management, Sustainable forestry, India
1. Introduction
Exploitation of forests by the people and government during the era of British rule continued as forests were considered inexhaustible and their ecological importance long remained unrecognized (Gadgil and Guha 1992; Stebbing 1921–26). However, the open access system that further accelerated loss of forests forced people to realize their mistake, leading to the first steps towards government control of forests in 1864. Subsequently, the Indian Forest Act was passed in 1878 and the "reserve and protected" forests were constituted. This abrogated the grazing, forest-based gathering, and forest-based swidden or rotational agriculture rights of local people (Poffenberger and Singh 1992). The policies that evolved over time also failed to recognize the role of local people in forest management, keeping them out of the forests and even banning selective logging in protected areas. This resulted in acute shortages of firewood, small timber, and non-timber forest products among local people. In response, communities started taking initiatives to protect their local forests, and thus evolved the community-based forest management (CFM) systems operating in many states of India, including Orissa, Madhya Pradesh, Karnataka, and Gujarat.
a. Centre for Ecological Sciences and Centre for Sustainable Technologies, Indian Institute of Science, Bangalore, India.
. Corresponding author,. Madras School of Economics, Gandhi Mandapam Road, Chennai – 600 025, India. Tel. +91 44-22300304, Fax +91 44-22352155; Email: [email protected]
b. Centre for Ecological Sciences and Centre for Sustainable Technologies, Indian Institute of Science, Bangalore, India. c. Centre for Ecological Sciences and Centre for Sustainable Technologies, Indian Institute of Science, Bangalore, India.

Vol. 6, No. 1 International Review for Environmental Strategies 2006
24
In this paper, data from a number of linked studies conducted under the aegis of the Ecological and Economics Research (EER) Network (Ravindranath, Murali, and Malhotra 2000) is used and presented with new analysis. The primary aimof this paper is to compare voluntary CFM systems with the current government-initiated Joint Forest Management (JFM) program in terms of their methods of ensuring compliance with rules and their contribution to changes in social behavior, protection practices, and ecology that have taken place over time, and then draw lessons for the JFM program. CFM systems have generally been operating for a long period relative to JFM, making it difficult to compare ecological parameters. Nevertheless, comparisons can help in understanding the directions of change and possible outcomes from such community action. Furthermore, those patterns that have proved their worth, if incorporated into state policies, may result in enhanced green cover and a larger forest resource base.
2. Methods and study locations
2.1. Features of self-initiated forest protection groups
Prudent resource use through regulatory measures has been an integral characteristic of most human societies. These measures range from restrictions on harvesting in terms of quantity, quality, and techniques employed, to total protection for a given species or entire biota within a restricted geographic area, often referred to as "refugia" (Gadgil and Berkes 1991). These refugia can be small, dispersed patches or whole hectares of forest, and are often protected through attribution of sacred qualities. Systems of refugia are found all over the world (Frazer 1978). Gadgil and Vartak have published an inventory of the sacred groves in the state of Maharashtra (Gadgil and Vartak 1976), and Alexander has reported kavus (sacred groves) in Tamil Nadu and Kerala (Alexander 1949). Sacred groves have also been protected in the Khasi hills of Meghalaya. Other refugia in India include the kan of Uttara Kannada in Karnataka, sacred groves in the Himalayas, the oran in Rajasthan, the shamilat forests in Punjab, the “safety forests” of Mizoram, and the "Cumindad " lands in Goa (Malhotra et al. 2000). The primary objective of these prudent user- or self-initiated groups is protection of forests and biodiversity.
In the past 10 to 50 years, thousands of community organizations have emerged, primarily in response to scarcity of biomass, land degradation, depletion of water resources, and similar problems. More than 200,000 hectares of forests on both state and community lands in some parts of Karnataka, Gujarat, and Punjab are being protected on a small scale (Kaul 1993) along with over 500,000 hectares in the states of Orissa and Bihar (Singh and Singh 1994). These village-level institutions could be categorized into two types based on when they started: traditional management systems, which have existed for hundreds of years, and recently self-initiated forest management systems formed in response to forest degradation and shortage of biomass.
2.2. Study locations
The EER studies spanned all major states across the country where JFM has been initiated on a large scale. Care was taken to select study locations so that both forests with a long history of protection and those only newly protected were included. The chosen sites of Orissa, West Bengal, Gujarat, Rajasthan, Karnataka, Andhra Pradesh, Jammu and Kashmir, and the Northeastern States had substantial new and

Vol. 6, No. 1 Are Community Initiatives in Forest Management Sustainable? 2006
25
traditional forest protection initiatives. They also spanned most, if not all, agro-climatic zones of the country. The sites included sal (shorea robusta)-dominated degraded deciduous forest, as in Orissa and West Bengal; mahua (madhuca indica)-dominated forests in Orissa; high mountain forests and grasslands of the Himalayas and Siwaliks in Jammu and Kashmir dominated by chir pine (pinusroxburghii sergeant); teak-dominated deciduous forests in Gujarat and Rajasthan; scrub forests in Andhra Pradesh; evergreen forests in the northeastern state of Tripura and the southern state of Karnataka; and a coastal forest in the Western Ghats of Karnataka. There were well-documented and well-managed forests in Gadabanikilo (Orissa), where details of membership and meetings during the last 50 years were maintained, and Hunasur and Halakar (Karnataka), with no records but well-protected forests. There were 11 villages with CFM and 17 villages under JFM. The period of forest protection ranged from over 100 years in Hunasur and Halakar to just three or four years in many JFM villages. There was also one site, Bada Bhilwara in Rajasthan, where JFM had been initiated but CFM already existed.
2.3. Approach and methods
One of the important features of the EER Network is the use of shared methodology, making it easy to compare results across regions. Methods adopted for study of ecological, institutional, and analytical aspects are given below. The social, economic, and ecological parameters of study villages are given in the appendix to this article.
Ecological study: To obtain information on vegetation, quadrats of 50 x 50 m were randomly selected across the entire forest. These were further divided into tree, shrub, and herb quadrats to collect information on a specific plant habitat. All data regarding plants falling within the boundary of the quadrat were recorded. The size and number of quadrats were decided based on the heterogeneity of the area.
Institutional study: Group discussions were held with the chairman or president and members of each village forest management committee and with village elders, in order to elicit responses on various issues relating to ecology, institutional structure, and forest management. Separate discussions were also held with women, artisans, and low-income farmers in each village. The issues addressed included the history of, and motivation for, forest protection; the state of the forest before protection; the nature of the forest management organization; management practices; modes of protection and extraction; regulations for collection of different non-timber forest products (NTFPs); benefit-sharing mechanisms; cases of misuse or abuse; the role of women in decision making and enforcement of regulations; the relationship with the Forest Department; and the role of NGOs and educational and other institutions. When records pertaining to the year of initiation of the forest protection committee and the area under village forest, plantations, etc. were available, they were collected from the Forest Department or village panchayat (village-level administrative office).
Sustainability index: An index of sustainability was developed based on restrictions placed on collection of NTFPs, fuelwood gathering, grazing, equity (representation of different socio-economic categories in a village), representation of women in the management committee, quantity of fuelwood collected, and year of protection. Ranking based on these parameters ranged between a cumulative score

Vol. 6, No. 1 International Review for Environmental Strategies 2006
26
of 0 (none of the parameters showed clear indicators of sustainability) and 7 (highest level of sustainability). If a committee imposed restrictions on grazing in the forest, then this parameter was given a value of 1; 0 if the committee did not restrict grazing. A village scored another 1 if there were restrictions on NTFP and fuelwood collection, 0 if there were not. Representation of women and of other social classes on the committee each earned a score of 1. If the system had been operating for more than five years, it earned a score of 1, while newer organizations were attributed a score of 0.
3. Findings
3.1. Community forest management a. Institutional arrangements
CFM systems have existed in India from time immemorial. Such systems range from sacred grove management, where no extraction is allowed, to community-managed forests where a number of management practices are followed. Such systems are found in Orissa, Tripura, Gujarat, and Karnataka. In many states, even sacred groves are in a state of severe degradation, though some are still intact. For example, in Coorg District of Karnataka, many temple forests or sacred groves are in good condition (Chandrakant and Nagaraja 1997), whereas in Uttara Kannada District, many kan (sacred groves consisting of small patches of evergreen forest) are in a degraded state. Similarly, in the Northeastern States, many sacred groves are under varying amounts of pressure (Malhotra et al. 2000).
Among the villages in the EER study were 11 with community-initiated protection groups. In Bada Bhilwara, Rajasthan, an old CFM committee and a new JFM committee co-exist. The oldest CFM committees are in Kugwe and Hunasur in Karnataka, which have been operating for over 100 years. Gadabanikilo in Orissa also has a long protection history of over 50 years.
The formation and continuation of the various protection groups have been motivated primarily by shortages of fuelwood, fodder, and NTFPs. One of the major reasons for protection of the forest in Gadabanikilo was scarcity of fuelwood so severe that not enough could be found for funerals. The motivation for formation of older protection committees such as those in Halakar and Alalli (both in Karnataka) was fear that ownership of village land would be transferred to the Forest Department, whereas communities in Orissa, Gujarat, Andhra Pradesh, and Rajasthan started CFM primarily in response to biomass scarcity. Isolated protection groups in some Gujarat study villages had resulted in a “demonstration effect” and the formation of similar protection groups in neighboring villages.
Institutional structures and representation in the executive committee vary between villages with CFM. In almost every case, the general body of the committee consists of all adult members in the village. The only exception found in the study was in Melaghar, Tripura, where membership of the general body of the committee is restricted to people of a particular socio-economic category. In CFM systems, the executive committee generally consists of between seven and 22 members. The mode of selection of executive committee members varies from consensus (for example, Gadabanikilo) to election (for example, Alalli). In cases like Gadabanikilo, leadership quality is the primary criterion or qualification for a person to become an executive committee member; people with good characters and those who

Vol. 6, No. 1 Are Community Initiatives in Forest Management Sustainable? 2006
27
have worked for the village are selected by consensus. In cases like Bada Bhilwara, committee membership is hereditary.
Representation of different stakeholders within executive committees also varies. In Halakar, each caste in the village is represented, whereas in Bada Bhilwara, the committee consists mostly of the dominant caste. In protection committees where more than one village or settlement is involved, each village is represented in the committee, as seen in Asundariya in Gujarat and Nabra in Orissa. In Kutling, Orissa, representation is open to all castes or classes, a more democratic form of governance.
Women are underrepresented in all CFM villages, though there are no written rules restricting their membership. Even in villages where women are represented in the committee, they usually play no active role. Executive committees generally take most decisions following rules already laid down by the general body, as in the case of Asundariya. However, when new resolutions are to be made, the general body’s decision is sought. This is particularly prevalent in Bada Bhilwara, Kutling, and Alalli.
b. Protection mechanisms and enforcement
Enforcement of regulations laid down by the committee is mostly done by the community on a voluntary basis. In Melaghar, the executive committee members themselves guard the forest, which is supervised by a para committee. In Asundariya, Baluji-Na-Muvada, Gadabanikilo, Garda, and Johnu, a paid watcher guards the forest and informs the committee whenever he notices a violation of the rules. In some places, such as Gadabanikilo, the watcher is paid cash, while in Asundariya and Baluji-Na-Muvada of Orissa, the watcher is paid in kind, for example in food grain. In cases of violation of the rules, the executive committee decides on the penalties to be imposed. Under normal circumstances, first-time offenders receive only a warning, while subsequent offenses are viewed seriously and the perpetrators are subject to either a cash penalty or social boycott. In communities with voluntary guarding, penalties are also imposed when community members do not fulfill their duties. For example, in Bharuch of Gujarat, a fine of 50 rupees is levied for failure to participate in patrolling. Enforcing these regulations has been extremely effective in many community-managed institutions.
Enforcing fuelwood collection regulations in many places, for example Asundariya, Baluji-Na-Muvada, and Bada Bhilwara, was found to be so effective that dependency on protected forest for fuelwood was very low. Similarly, grazing and other NTFP harvesting practices were also very stringent. Allowing seasonal grazing and restricting goat and sheep grazing in the forest has been very effective. Regulations on collection of NTFPs vary. In most villages, only dry wood can be collected. In Gadabanikilo, only mahua flowers that have fallen on the ground can be collected, while in Kannaram, Andhra Pradesh, certain NTFP products are collected only on specific days in the year. By and large, there are no restrictions in most CFM institutions on collection of NTFPs for subsistence.
There are numerous reasons to account for the success of forest protection in different places. In many cases, such as Orissa, Gujarat, and Karnataka, individual leadership makes forest protection and rule enforcement more effective, while in Andhra Pradesh and Melaghar, non-governmental organizations (NGOs) have a similar beneficial influence. In Gadabanikilo, it is tradition that makes conservation efforts effective. Generally, older institutions, such as those in Hunasur and Kugwe in Karnataka and Gadabanikilo and Kutling in Orissa, thrive not only on the established traditions, but also on the pride

Vol. 6, No. 1 International Review for Environmental Strategies 2006
28
engendered by the distinction the communities have earned through awards. Institutions that have recently started (that is, in the last 20 or 30 years), have local leaders who influence villagers to protect the forest. In Baluji-Na-Muvada, village chief Police Patel has inspired the villagers to protect the forest, while in Kutling and Nabra of Orissa, it is local schoolteachers. These locally influential individuals successfully promote forest protection, but it remains to be seen whether the mechanisms will continue to work effectively in the long run. For these movements to be successful, the need to conserve the forests should be recognized and felt by community members, and not come from external forces or personalities outside the system. Equally, it remains to be seen whether initiatives started by some NGOs in forest protection will be sustained after the NGOs leave.
In most of the successful conservation efforts by CFM committees, the role of the Forest Department is negligible or non-existent. In fact, recently instituted CFM systems are deterring intervention by the Forest Department, which has in the past tried to persuade villages to undertake protection. In Alalli and Halakar, fear that Forest Department activities may denude their revenue forest has led to community-initiated protection.
Conservation is, by and large, effective in forests under CFM. Exploitation of forest resources is generally regulated through sets of rules, which vary depending on the availability of resources, demand, and traditional requirements. A noteworthy example is found in Gadabanikilo, where practices are devised based on the objectives of management. Some of the management practices are similar to current scientific forestry practices, allowing varying degrees of exploitation, from total protection to a high level of exploitation, in specific areas of the forest. An important aspect of these CFM systems is the combination of collective responsibility for guarding the forest and collective right to share in the benefits from it. Villages with longer traditions of forest protection have maintained good forest stands with high species diversity. The institutional structures are varied and have evolved in response to different necessities. Thus, a lesson that can be learned from these experiences is that institutional structures should be site specific and even culture specific.
3.2. Joint forest management a. Institutional arrangements
JFM committees or forest protection groups are primarily state initiated and draw a lot of support from the Forest Department, donor agencies (both international and local), and the NGO sector. Because the JFM program is state sponsored, the institutional arrangements are predetermined and are stated in government regulations. The evolution of the village forest committees (VFCs) under the program mostly follows that of other official government or government-affiliated bodies such as cooperative societies or banks. This means that there is a common structure among management committees in each JFM village. Differences in structure between the general bodies or executive bodies, if any, are influenced by directives issued by the respective state governments. Several common features in JFM institutions were found in all 18 JFM study sites, spanning eight states:
1. The general body consists of at least one representative from each household in the village. However, recently some states have amended this so that in each household one male adult and one female adult is a member of the general body. This move is primarily intended to involve women and

Vol. 6, No. 1 Are Community Initiatives in Forest Management Sustainable? 2006
29
increase their representation in general bodies. Further, the rules state that profits from sales of harvested produce should be shared among two members of the household rather than going to a single member.
2. The executive committee is elected from among the general body membership, and there is representation of all castes, tribes, and vocational groups. Further, there is at least one woman in each executive committee.
3. The secretary of the executive committee is from the Forest Department and is in charge of bookkeeping and other finance-related activities.
4. Protection is normally done by a warden appointed by the Forest Department during the initial years of the program in each community, and responsibility is later shifted to the community.
5. Members of the VFC exercise usufructuary rights, such as collection of NTFPs and fuelwood for subsistence.
The JFM institutions share many common features throughout the entire country, with minimal differences. The emphasis in these systems more on formalizing or institutionalizing the structure than on rationalizing it. Some representation is guaranteed for women in all states and for other disadvantaged classes and minorities in some states. When disadvantaged classes and minority groups are not found, the allotted seats are kept vacant. External representation in most management committees is high because this program is state sponsored. In each committee there are three to four members who are ex officio, representing, in different locations, the Forest Department, local bodies such as the panchayat, NGOs, the Rural Development Department, etc. Although these people do not have the power to vote, they certainly are in a position to influence the proceedings and decisions of the committee. On the one hand, the members of external institutions may view situations in an unbiased manner, but on the other hand they may not be well aware of the local situation, and their contributions may be guided by state policies.
b. Protection mechanisms and enforcement
Modes of protection employed by JFM systems are by and large determined by the Forest Department, though the VFC committee, in theory, has the right to frame rules on forest protection, membership norms etc. In most situations, the Forest Department appoints one guard or watcher who guards the forests. However, there are exceptions. In the JFM villages of Gujarat and West Bengal, the community undertakes patrolling of the forest separately from the Forest Department guard. In Kunbar, Gujarat, the vara patrol system (a weekly patrol system) is used. Similarly, all the Gujarat VFCs in the current study patrol the forests in groups of three to five on a rotation basis. All households are involved in protection in such cases. In the Western Ghats of Karnataka, barbed wire fencing and cattle-proof trenches are used to protect forests from grazing along with a guard appointed by the Forest Department for the first three years of JFM implementation. However, as in most other places, the transition to participatory forest management that is supposed to take place after this first three year has not taken place, but Forest Department support has been completely removed. This demonstrates that the Forest Department has not effectively promoted the concept of participatory forest management. As most of the forests are

Vol. 6, No. 1 International Review for Environmental Strategies 2006
30
plantations, NTFP availability is negligible and the only available forest product is fuelwood from cutback or thinning.
In many JFM set-ups, first-time offenders from within the village are normally cautioned not to disobey the rules set by the committee, and are exempted from punishment. On repetition of the offense, offenders are given a stern warning, and if they continue to offend, a fine is levied. At a later stage, the person may lose membership of the committee, thereby forfeiting the associated privileges. If the violator is from a neighboring village, the concerned village chief is contacted to report the incident. The issue is normally settled amicably between the villages.
Experiences of enforcing regulations are varied. In West Bengal, there have been cases of inter-village conflicts due to enforcement of JFM rules; for example, in Bhagawathichowk of Midnapore District, the entire village defended the committee secretary, who had punished a person from a neighboring village for trespassing on their forest area. However, few instances of such conflicts have been reported in villages under JFM management.
3.3. Vegetation and forest regeneration
Regeneration of species other than those planted in plantations by the Forest Department is reported from Asunsariya and Baluji-Na-Muvada villages of Panchmahal District of Gujarat and from Halakar village of Uttara Kannada District in Karnataka. In five villages of Uttara Kannada (Bhat et al. 1984) wherein mixed plantations of five species have been raised under JFM, over 20 naturally occurring species regenerated, with an approximate density of over 100 individuals per hectare. Similar results in parts of Uttara Kannada have been reported by Murali, Murthy, and Ravindranath (2002). In Panchmahal, similar results were reported (Shah 1996), though the quantity of species and their density are not known.
On the contrary, traditional CFM committees have managed natural forests rather than plantations with many management restraints and practices. Any regeneration found in these CFM forests has been primarily of the naturally occurring flora rather than of exotic species. Such efforts to conserve natural forests increase the evolutionary potential of species and also provides for continued traditional use by the people. Below is a summary of the differences between JFM and CFM forests in the study sites.
Table 1 shows that the areas of forest under protection are far smaller in CFM villages than in JFM villages, whereas the numbers of households dependent on the forest are higher in CFM villages, meaning that the pressure per unit area of forest in CFM villages is much higher. Yet it is interesting to note that despite this higher pressure, the biodiversity observed in CFM villages, as measured by the number of trees per hectare, is higher than in JFM areas. It is also interesting to note that the growing stock per hectare is higher in CFM than in JFM forests. Further, the mean annual increment of biomass is higher in CFM than in JFM areas. This is purely by virtue of greater standing biomass rather than due to any intrinsic differences.

Vol. 6, No. 1 Are Community Initiatives in Forest Management Sustainable? 2006
31
Table 1. Vegetation and socio-economic parameters in JFM and CFM villages
Parameters JFM (mean ± SD) CFM (mean ± SD) Mann-Whitney U test*
Area 190.75 ± 183.51 93.09 ± 75.54 68.5, p<0.05
Households 87.17 ± 52.38 173 ± 133.26 52 p<0.2
Tree species (t/ha) 19.8 ± 9.9 36.00 ± 12.80 25 p< 0.001
Basal area (m2/ha) 12.63 ± 13.16 17.08 ± 12.96 59 p<0.2
Period under protection (y) 4.60 ± 3.14 31.73 ± 35,77 8.5 p<0.0001
Growing stock (t/ha/y) 129.26 ± 90.61 179.91 ± 84.62 54 p<0.15
Fuelwood extraction (kg/ha/y) 253 ± 183 2748 ± 3829 42 p<0.08
Fuelwood demand (t/y) 221.44 ± 162.47 471.0 ± 204.75 26 p<0.015
Fuelwood consumption (kg/hh) 6.23 ± 4.28 7.66 ± 3.83 63 p<0.5
Income per hh (Rs) 3118.29 ± 2568.70 1990.54± 2441.87 34 p<0.13
Income per ha (Rs) 1856.15 ± 1483 10921 ± 25058.26 52 p<0.75
Number of NTFPs 9.00±6.54 5.38 ± 1.69 36.5 p<0.17
Employment (person days/y/hh) 175.02 ± 143.42 84.08 ± 115,78 8 p<0.17
Mean annual increment (t/ha) 3.65 ± 2.66 4.85 ± 2.4 54 p< 0.15
Sustainability index 5.05 ± 1.64 5.09 ± 0.54 83 p<0.63
Note: SD = standard deviation; hh = household; Rs = Indian rupees. * The differences in values between JFM and CFM were statistically tested using this non-parametric test, which indicates
differences in medians.
Fuelwood demand and consumption are also higher in CFM areas, as is the income generated from the forest per hectare, suggesting both a greater variety of products being harvested from these forests and communities’ dependency on such forests. However, the trend is different with respect to employment generation. More employment is generated in JFM than in CFM areas. This difference may be because people in JFM areas are involved in work related to managing plantations, particularly in the initial years, and are thereby earning income, although JFM areas support smaller diversity of species and growing stock (Murali 2004).
The sustainability index based on the prevailing management practices indicates that there is not much difference between CFM and JFM. This shows that people in JFM as well CFM areas take good care of the forests by regulating or restricting access. It also indicates that both types of management system are good for the survival of the forests. However, this index has to be correlated to the forests’ regenerative capacities. Further, no data on the regenerative capacities of natural species in plantations is available,

Vol. 6, No. 1 International Review for Environmental Strategies 2006
32
making it difficult to derive any conclusion at this stage. Also, there is a need to improvise the index itself to accommodate various new socio-economic and vegetation parameters in order to give an overall picture of the sustainability of the institution and of the forest.
3.4. Flow of benefits
Benefit flow is considered one of the major reasons or incentives for promoting community forestry. The benefits need not be cash; they could be meeting of daily needs, environmental benefits (such as cleaner water or air, or raising of the water table), community pride, recreation opportunities, or simply a sense of satisfaction. Thus, it becomes difficult to argue in quantitative terms how far increased biodiversity has improved economic conditions.
Some of the studies in Uttara Kannada have shown that the value of NTFPs and the returns per hectare from NTFP extraction are high in evergreen and semi-evergreen forests (Ravindranath, Sukumar, and Deshingkar 1997). These forest types have more species than deciduous forests. Thus it may be concluded that a higher overall number of species increases the number of NTFP species, and thus enhances income. However, this phenomenon is found only in isolated instances and was not a general trend among the villages studied.
There is, thus, no direct correlation between the forest type or species richness and forest quality and the income levels of villagers living around the forest. However, another consideration is the degree of dependency on the forest among local people. Although there is no direct correlation between species number and income levels, the utility value of species tends to be much higher than the monetary value. Further, it is difficult to monetize all the products or species that are being used. Changes in values of products and the value system over time would also add to the difficulty in assigning the products a monetary value.
3.5. Extent of dependency on NTFPs
Dependency on NTFPs among people within a village varies with economic and social class. Small farmers and landless households generally depend more on forest resources than the large-scale farmers. Large-scale farmers’ economic dependency on the forest is mostly for agriculture or related activities, but small farmers or landless households depend on commercial NTFPs that fetch greater returns than agriculture. For example, a study in Uttara Kannada indicates that large farmers account for a substantially higher proportion of total forest resources being used than small farmers or landless households. Thus a more detailed analysis is needed in order to understand dependency and issues related to equity in profit sharing.
Based on income generated per household, dependency on forests is highest in Kannaram, Andhra Pradesh and Kutling, Orissa. However, if the income per household for a unit of land available is considered, Nabra village in Orissa has higher earnings per unit of forest area available; thus, dependency is higher in this village. However, it is risky to conclude that this village derives more benefit from the forest, because it is difficult to ensure that all the income derived comes only from the protected forest—income may be generated from the adjacent forest as well.

Vol. 6, No. 1 Are Community Initiatives in Forest Management Sustainable? 2006
33
3.6. Regulation of NTFPs
NTFPs are being extracted without any regulation in most study villages. It has been demonstrated that regeneration of most NTFP species is under threat and there have been no systematic studies to show how NTFPs could be used sustainably. However, the effect of extraction on regeneration has been one of the major concerns of some village communities, leading to some restrictions on collection. In the case of Gadabanikilo, Orissa, dedicated patches of forest for NTFP extraction are designated, while in Asundariya and Baluji-Na-Muvada, Gujarat, collection is restricted to chutti days (holidays). Thus both temporal and spatial restriction on collection of NTFPs is used, depending on local convenience and necessity. In Halakar and Hunasur, Karnataka, all collection is banned. Grazing has been similarly restricted in many villages, especially by allowing it only seasonally. Restrictions sometimes also depend on the type of animal. Wherever the major livestock type is cattle, regulations are not very stringent compared to the restrictions on grazing by goats and sheep.
3.7. Issues of equity, subsistence, and sustainability
It is imperative that benefit flow is equitable among community members in order for JFM or CFM to operate smoothly and sustainably. Achieving such equity seems to be difficult, although there may be one or two successful cases. It is believed that forest-dependent communities hold more of a stake in benefit flows than less forest-dependent communities (Murali et al. 2003). However, it is a matter of subjective judgment who is considered dependent on forests and who is not. People who directly use the forest for subsistence and commercial needs require a larger share of benefit. Further, people who contribute to forest conservation should also claim a greater share of the benefits. Thus the issue becomes more value loaded than objective, and it becomes difficult to argue whether the system should be equity based or equality based.
By and large, the flow of benefits in the study villages is equally distributed, with fuelwood being collected based on household requirements, though this basis is not clearly defined. It is also sometimes observed that fuelwood is commercially exploited. In the case of NTFPs, there are no regulations. Any person in the village can collect NTFPs from the forest. The NTFPs that are used for subsistence only can be considered as being used on an equitable basis—that is, based on the requirements of the family—while benefits from NTFPs of commercial value do not flow equitably. In general, the classes with larger landholdings depend less on NTFPs for commercial purposes than small landowners and landless households. Sometimes it may happen that large landowning families who normally organize collection of NTFPs as agents or traders do not enter the picture as direct dependents from the village. Thus, the situation is different for different villages, depending on the heterogeneity of class and caste.
4. Discussion
Table 2 indicates that the length of time for which a forest has been under protection has a strong correlation with various parameters such as the number of species and fuelwood demand. It is increasingly evident that protection improves the biodiversity of the forest area. Further, the basal area or standing biomass also increases, thereby making more biomass available for consumption. Income per household is less in areas where the protection history is longer. If these values are read in

Vol. 6, No. 1 International Review for Environmental Strategies 2006
34
conjunction with the earlier table, we find that the income per household is less in CFM areas compared to JFM areas, though income per unit of area is higher in CFM areas. This is primarily because the number of households in CFM villages is higher while the area protected is smaller. As already discussed, more employment is generated under JFM, but the means through which it is achieved are not clear, making it difficult to reach any firm conclusion about the relative employment-generation benefits of JFM and CFM. It is worth noting that another study (Murali 2004) indicates that a larger marginal worker force has enhanced forest cover in several states in India.
Table 2. Spearman’s rank correlation co-efficient for various economic and ecological parameters of forests under JFM and CFM management systems
Period of protection
Total tree species Basal area
Currentfuelwooddemand
Per capita fuelwood
consumptionIncome per household
Number of NTFPspecies
Labor(person/
household)
Area under protection (ha)
0.234 (26) -0.019 (25) 0.140 (25) 0.118 (22) -0.196 (23) 0.192 (20) 0.062 (20) -0.297 (10)
Period of protection
0.458 (25) 0.341 (25) 0.488 (22) 0.238 (22) -0.462 (19) 0.227 (19) -0.192 (9)
Total tree species
0.661 (24) 0.174 (22) 0.298 (23) -0.398 (20) -0.275 (20) -0.341 (10)
Basal area 0.010 (22) 0.453 (22) -0.417 (19) -0.004 (19) -0.183 (9)
Fuelwooddemand
-0.011 (22) -0.196 (19) -0.041 (19) -0.283 (9)
Per capita fuelwoodconsumption
-0.280 (22) -0.011(22) 0.560 (12)
Incomegenerated per household
0.265 (22) 0.667 (12)
Number of NTFP species
-0.161 (12)
Note: Values in parenthesis indicate sample size. Values in bold type significantly differ at probability 0.05, whereas italicized values differ at probability <0.1.
In villages in Panchmahal District, Gujarat, and the Western Ghats of Karnataka, grazing was banned outright during the initial years of forest protection, based on the belief that grazing affects regeneration, but was later resumed, suggesting that at least in the initial years, restriction on grazing is essential. In other villages, such as Bharuch in Gujarat, grazing is restricted only during summer months. It is not clear whether use of such a strategy was primarily due to lack of availability of fodder or to other reasons. Similarly, fuelwood collection strategies vary in different sites from complete prohibition to no restriction. It has been shown that in Midnapore village of West Bengal and Bada Bhilwara of Rajasthan, where there is little or no regulation, little biomass has accumulated. An analysis of required biomass and extracted biomass indicates that the restricted villages have been using biomass in a sustainable manner compared with villages with no regulation. It is interesting that in Jammu and Kashmir, where there are adequate farm forestry practices, villages with significant biomass on their lands followed the same strategies. It is important to note that villages that restrict use of biomass from protected forest

Vol. 6, No. 1 Are Community Initiatives in Forest Management Sustainable? 2006
35
either rely on adjacent forest or their own farmland to meet demand for fuelwood, poles and similar biomass products. There are fewer and fewer instances where these people rely on alternative energy sources. Restriction of exploitation of other NTFPs exists only for mahua, an economically important species in Gadabanikilo, Orissa. There are no restrictions on other NTFPs in any village.
The JFM program, on the other hand, an alternative to full state-controlled forest protection, is attempting to find out whether the protection accorded to forests by local people will help succession and regeneration in a cost-effective fashion. Afforestation through plantation cost approximately Rs. 14,000. This cost includes monoculture of exotic species for fuelwood and small timber, with a nearly 75 percent seedling survival rate. Thus, such plantations, yielding few NTFP species, have no monetary advantages to offer local communities. However, the protection accorded enhances the regeneration of natural species in these plantations, which in turn enhances the ability of the forest to offer a greater variety of products of both commercial and subsistence importance in later years. The cost of community protection is estimated to be nearly Rs. 400 to Rs. 800 per hectare per year. Thus, although it appears that JFM may be cost-effective in its true sense, it may prove ineffective if not properly implemented.
Community decision making is also important in JFM. It was found that in Asundariya, Gujarat, collection of shrubs was hampering regeneration of some species. Therefore, the community decided to stop collection of certain species of shrubs during chutti days. This decision has certainly improved the regeneration of the vegetation. Such periodic changes in management would help achieve better regeneration. This also necessitates periodic monitoring of vegetation for various parameters such as population structure, biomass, stem density, and basal area.
5. Conclusions
Devolution of power through participatory decision making is an important process of governance at national level. Community forest protection institutions have shown the success of transparent and participatory decentralized decision making. The success of such informal institutional arrangements is evident from their sustained existence and continued working on issues pertaining to forest protection and management. These institutions have demonstrated clearly enhanced resources and resource use due to sustainable forestry. Also, successful conflict resolution mechanisms and innovative ways of enforcing rules and regulations pertaining to use of forest resources developed within such institutions have clearly contributed to their effectiveness, as witnessed by improved biomass stock in the protected forests.
Study findings in many villages have demonstrated that local communities are highly sensitive to resource extraction rules, especially when they are strongly motivated to protect and benefit from the resources over time. In Gujarat, communities refrained from firewood extraction for two years to ensure recovery of biomass, while in Karnataka, village communities have enforced strict regulations such as banning extraction of green wood and cutting of twigs and branches and green leaves. Thus, communities have employed adaptive forest management, in contrast to the afforestation programs
Vol. 6, No. 1 International Review for Environmental Strategies 2006
36
implemented by the Government, which lack the flexibility to change and adopt protection and extraction regulations in accordance with the current resource status.
Communities have been successful in meeting their biomass requirements to a large extent in a sustainable manner in the majority of locations studied. However, the sustainability of a community institution depends on increasing the community’s long-term stake in the forests that are being protected. Assured rights and control over a protected patch play a critical role in initiation and sustaining protection efforts. Support and recognition from government creates a long-term stake for community institutions and reduces internal and external conflicts.
Community forest management institutions have contributed significantly to regeneration of forests, to conservation and promotion of biodiversity, and to achieving moderate to high biomass productivity. Therefore, these village-level institutions need to be formalized to give them stronger legal status. The transition from informal to formal institutions should be brought about as smoothly as possible, with dedicated and concerted efforts to retain the existing institutions’ strengths such as flexibility and acceptability to the community, although minor modifications to promote equity are necessary.
The management system for forests has come full circle, and forest management with the involvement of local communities is once again being emphasized. The Indian states should therefore initiate a drive to recognize traditional forest protection institutions to support their cause. Further, the Government may want to take these principles and practices of CFM systems to state-supported JFM areas through training programs and exposure trips for JFM committee members at the village level. The Government may also consult CFM institutions to assist in JFM areas.
Acknowledgements
The authors would like to thank the Ford Foundation for supporting the Ecological and Economics Research Network in
conducting this study and the Ministry of Environment and Forests of India for its support to the Centre for Ecological Sciences.
We also thank all the network members who conducted the studies in the states of Andhra Pradesh, Gujarat, Orissa, Rajasthan,
Tripura, and West Bengal.
References
Alexander, P. C. 1949. Buddhism in Kerala. Annamalai University Historical Series 8. Annamalainagar, India: Annamalai University.
Bhat, D. M., N. Prasad, S. Hegde. and C. J. Saldanha. 1984 . Plant diversity studies in the Uttara Kannada district. CES Technical Report 9. Bangalore: Indian Institute of Science.
Chandrakant, M. G. and M. G. Nagaraja 1997. Existence value of Kodagu sacred groves: Implications for policy. Deccan Herald,July 6.
Frazer, J. G. 1978. The golden bough: A study in magic and religion. Basingstoke, UK: Macmillan. (2 vols., 1890, 3rd ed., 12 vols., 1907-15)
Gadgil, M., and R. Guha. 1992. This fissured land: Ecological history of India. New Delhi: Oxford University Press.

Vol. 6, No. 1 Are Community Initiatives in Forest Management Sustainable? 2006
37
Gadgil, M., and V. D. Vartak. 1976. Sacred groves of Western Ghats of India. Economic Botany 30: 127–55.
Kaul, M. C. 1993. Durability in diversity: Two centuries of co-management in the Punjab forests:. An institutional analysis. Draft paper for publication, mimeo.
Malhotra, K., Y. Gokhale, S. Chatterjee, and S. Srivastava. 2000. Sacred groves in India: An overview. Bhopal, India: Indira Gandhi Rashtriya Manav Sangrahalaya (National Museum of Mankind).
Murali, K. S. 2004. Marginal worker force and forest cover change in India. International Journal for Environmental Quality15(4):443–449.
Murali, K. S., R. Jagannatha Rao, P. Sudha, G. Sangeetha, I. K. Murthy, and N. H. Ravindranath. 2003. Evaluation studies of JFMin India: Social and institutional implication. Journal of Environment and Sustainable Development 2(1):19–35.
Murali, K. S., I. K. Murthy, and N. H. Ravindranath. 2002. Joint forest management in India and its ecological impacts. Environment Management and Health 13(5):512–528.
Poffenberger, M., and C. Singh. 1992. Emerging directions in Indian forest policy: Legal framework for joint management. Wasteland News VII(3):4–11.
Ravindranath, N. H., K. S. Murali, and K. C. Malhotra. 2000. Joint forest management and community forestry in India: An ecological and institutional assessment. Oxford: IBH Publishers.
Ravindranath, N. H., R. Sukumar, and P. Deshingkar. 1997. Climate change and forests: Impacts and adaptation—A regional assessment for the Western Ghats, India. Stockholm: Stockholm Environment Institute.
Shah, S. A. 1996. Ecological aspects of Indian forest management. In New voices in Indian forestry, ed. V. S. P. Kurup, 49–82, New Delhi: Society for Promotion of Wastelands Development.
Singh N. M., and K. K. Singh. 1994. Forest protection by communities: The Balangir experience. Mimeo.
Stebbing, E. P. 1921–26. The forests of India. 3 vols. Reprint. New Delhi: AJ Reprints Agency, 1982.

o li ki naba daG
)as sirO(
– –
36152.5
5 8165.02
6 5 05
06
MFC
––
–4
08.713
41 84 2
MF
C ) as sir
O( gniltuK
442.624,3
05.2 0.955
29888.2
201–
5
5602.2
3 2 8
84
MFC
) ass irO( arba
N4
5 7. 553 ,7 07.2
0.90 7410, 1
48.1–
6
ayi radnu sA
)t arajuG(
11 .4541
34.4163
8 281
MF
C4
00.686 48.01
0.615221
–5
adavuM-a
N-ijulaB
)tarajuG(
57.9343
19 .441 3
11 2 21
MF
C4
00.052,2 86.9
0 .45564
–5
95.9 48
53.523 00.01
0.6140
3 0.4241
00. 4123
81 37
MF
C ) aka tanra
K( il la lA
5
rusan uH
)ak at anraK(
4262
55.76 62
00 .3 32 6
001 94
MF
C00 .65 2
700 .44 3, 1
2 1.0 1 0 .6 9
5
200.5 2
34 00 1
261
M FC
)a kat anraK( e
wguK
87.117
0 0.042 34.01
0. 796902
52.60 1
6
raka laH
)akat anr aK(
39.8 15
00.792 2 8.11
0.125701
7 9.5022
05.0133
01 02
M F
C5
um
ma J( ra bbaD
)rim hs a
K dn a–
80. 6 3 .19
066.3
9210 0. 21
32 0 2
0 5
MFC
––
5
dn a um
ma J( unho J)ri
mhsaK
– 34.2
7.0510
70.237
05.362
01 01
MF
C–
–5
d na um
maJ( it tiR
) rimhsa
K–
2 2.2 8.5 33
046.1
850 1.1
81 5
02
MFJ–
––
tseW( ras aula
K)la gne
B–
– –
––
33.5881
00.12–
6 99
MFJ
–6
inahtam akir ah
K ) l agn e
B ts eW(
.26178
8 1.27 7
00. 41 1
3 7 5
MFJ
85.7336
00.007,2 34.21
07
98 .5702
00.4281
9 645
M FJ
margayannaht
U–
– –
–
6
Vol. 6, No. 1 International Review for Environmental Strategies 2006
38
imon oce dna ,lai cos , lacigo loc E :x idn ep p
A yduts rednu segalliv fo srete
m arap c
ega lliv eht fo ema
N) et at s(
fo epy Tnoitutit sni
aerA
)ah(
d oire Pr ednu
noitcetorp)s ra ey (
rebm u
N eert fos eic eps
l asaB
aera m(2
)ah/gni
worG
kcots*
naeM
lau nnatne
m er cni†
tnerruC
noitcartxe)snot(
tnerruC
dnamed
)raey/t(
atipac rePdoo
wleuf noitp
musnoc hh/gk
rep emocnI
dlohesuoh
rebmu
Nfo
sPFTN
tnemyolp
mEdetareneg
)syad nosrep(ytilibaniatsuS
xedni

)lagneB tse
W(
tseW( ragania
meN
)lagneB
85.7336
00.007,2 34.21
––
––
––
– –
MFJ
5
tseW( iru
manahK
) lagneB
85.7336
00.007,2 3 4.21
––
––
––
– –
MFJ
7
ts eW( a iragsapa
K)la gne
B35.3
52 123.1 1
41 5
52
MFJ01
34.464 43.6
9310.8
–5
tseW( ara
magnaL)lagne
B–
– –
––
––
–02
0 74 1
MFJ
–6
kwohc ita
w ag ahB
)la gn eB tse
W(45
83.36 11
84 .015 1
11 35
M FJ
217 9.54 4,1
5 7. 11 6 71
0.–
6
ar awlih
B adaB
) na ht sa jaR(
29.3831
0 4.310 2
9 216
MFJ
3253.942,2
02.0 624
??–
7
.211
3 881
MFJ
)tarajuG ( r ab nu
K 316
2.1618.1
4600
700.483,1
20.1–
5
. 301
4 0 21
MFJ
)t ar ajuG( r up
maR
2120.49
99.107
0 011
00.582,7 86.4
–5
0 2.132
6 001
MFJ
) ta ra juG( adra
G4
00.553 ,3 82 .1
3 434.83
66.185
–6
alojurdnoV
)hsedarP arhd nA(
00.254
63.25 7,2 66.5
598.52
00.00
39.081
2 002
MFJ
4
mela padat tuJ ) hse da rP arhd n
A(MF J
.008 .9
54301.54
04 2
50 100 .62
209 .6 97
82 .5 47
03
melapayyardnahC
)hse darP arhdnA(
MFJ01
7.040 5.2
8827.5
52 2
0 5400.241
787.811,6
96.6 3
1
arhdnA(
mar annaK
)h sed arPMF J
0.6306 .7
9623 5. 33
53 2
00100.351
526.659, 8
36.6 79
3
032
MFJ )arupirT( rahgale
M24.41
3206.747
64.4 –
––
––
53 –
4
alumrof e ht gn is u de vir e
D *05
+ 25. 6 x aera la sa b = ssa
m oib 5 = tne
merc ni lau nna n aeM † .
.ss amoib gn idnat s fo tnecr ep
Vol. 6, No. 1 Are Community Initiatives in Forest Management Sustainable? 2006
39
egalliv eht fo ema
N)etats(
fo epy Tnoitu titsni
aerA
)ah(
do ir ePredn u
noitcetorp)sraey(
rebmu
N e er t f oseic e ps
lasaB
aera m(2
)ah/gni
worG
kco ts*
naeM
la un natne
mercni†
tnerruC
noitcartxe)snot(
tnerruC
dnamed
)raey/t(
atipac rePdoo
wleuf noitp
musnoc hh/gk
rep emocnI
dlohesuoh
rebmu
Nfo
sPFTN
tnemyolp
mEdetareneg
)syad nosrep(ytilibaniatsuS
xedni

Vol. 6, No. 1 International Review for Environmental Strategies 2006
40
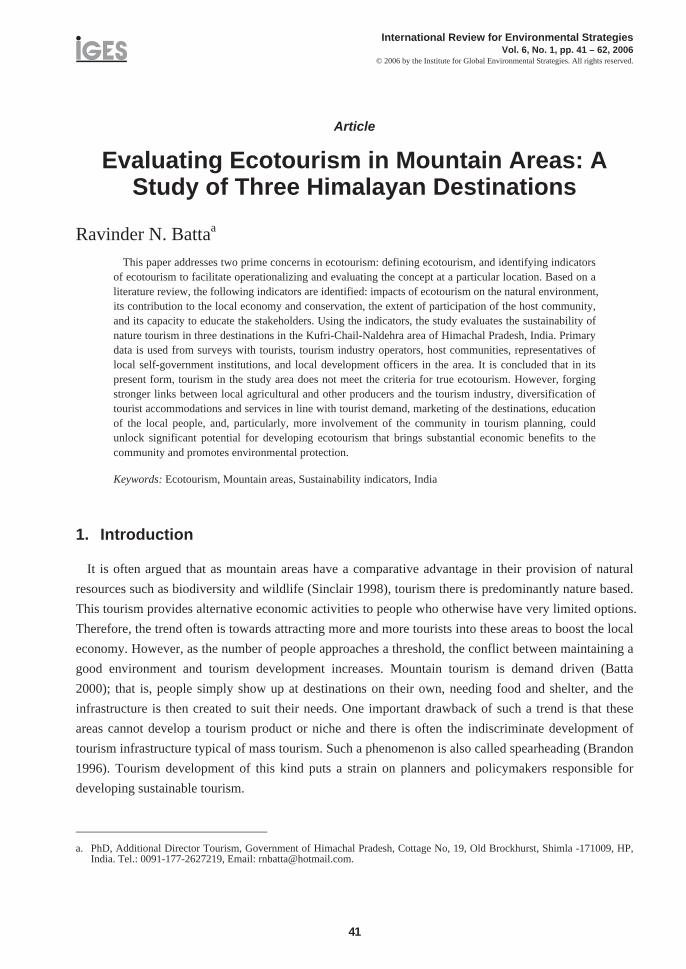
International Review for Environmental Strategies Vol. 6, No. 1, pp. 41 – 62, 2006
© 2006 by the Institute for Global Environmental Strategies. All rights reserved.
41
Article
Evaluating Ecotourism in Mountain Areas: A Study of Three Himalayan Destinations
Ravinder N. Battaa
This paper addresses two prime concerns in ecotourism: defining ecotourism, and identifying indicators of ecotourism to facilitate operationalizing and evaluating the concept at a particular location. Based on a literature review, the following indicators are identified: impacts of ecotourism on the natural environment, its contribution to the local economy and conservation, the extent of participation of the host community, and its capacity to educate the stakeholders. Using the indicators, the study evaluates the sustainability of nature tourism in three destinations in the Kufri-Chail-Naldehra area of Himachal Pradesh, India. Primary data is used from surveys with tourists, tourism industry operators, host communities, representatives of local self-government institutions, and local development officers in the area. It is concluded that in its present form, tourism in the study area does not meet the criteria for true ecotourism. However, forging stronger links between local agricultural and other producers and the tourism industry, diversification of tourist accommodations and services in line with tourist demand, marketing of the destinations, education of the local people, and, particularly, more involvement of the community in tourism planning, could unlock significant potential for developing ecotourism that brings substantial economic benefits to the community and promotes environmental protection.
Keywords: Ecotourism, Mountain areas, Sustainability indicators, India
1. Introduction
It is often argued that as mountain areas have a comparative advantage in their provision of natural resources such as biodiversity and wildlife (Sinclair 1998), tourism there is predominantly nature based. This tourism provides alternative economic activities to people who otherwise have very limited options. Therefore, the trend often is towards attracting more and more tourists into these areas to boost the local economy. However, as the number of people approaches a threshold, the conflict between maintaining a good environment and tourism development increases. Mountain tourism is demand driven (Batta 2000); that is, people simply show up at destinations on their own, needing food and shelter, and the infrastructure is then created to suit their needs. One important drawback of such a trend is that these areas cannot develop a tourism product or niche and there is often the indiscriminate development of tourism infrastructure typical of mass tourism. Such a phenomenon is also called spearheading (Brandon 1996). Tourism development of this kind puts a strain on planners and policymakers responsible for developing sustainable tourism.
a. PhD, Additional Director Tourism, Government of Himachal Pradesh, Cottage No, 19, Old Brockhurst, Shimla -171009, HP,
India. Tel.: 0091-177-2627219, Email: [email protected].

Vol. 6, No. 1 International Review for Environmental Strategies 2006
42
The term ecotourism has often been equated with a number of terms like alternative tourism, greentourism, and sustainable tourism (Butler 1991). Usually considered more than just tourism to natural areas, the recent definitions of ecotourism (for example from Black 1996; Ceballos-Lascurain 1996; Scace 1992) include evaluation of aspects like the impacts of tourism on the environment, contribution to conservation, and community participation as essential components. However, the lack of a precise definition of the term has encouraged increasing free use of the term to gain competitive advantage. Such a trend has also flourished in the absence of standard indicators for measuring the success of ecotourism at a particular site. Thus, along with defining the concept, the real challenges lie in operationalizing it at specific locations and in developing indictors for evaluating the sustainability of ecotourism.
This paper addresses two prime concerns in ecotourism: defining what ecotourism is, and identifying indicators to facilitate operationalizing and evaluating the concept at a particular location. Indicators identified through a review of the literature—impacts of ecotourism on the natural environment, its contribution to the local economy and conservation, the extent of participation of the host community, and the capacity of tourism to educate the stakeholders—are studied with the help of primary data collected through field surveys in a mountain tourism area in Himachal Pradesh, India. For collecting and analyzing the data, the paper uses a multidisciplinary approach. While the indicators framework is taken from the tourism discipline, methodology to study the economic impacts of tourism is taken from economics, and methodology to study the willingness-to-pay (WTP) of the stakeholders is taken from environmental economics.
With its 32 wildlife sanctuaries, two nature parks, and 66 percent land under forest, Himachal Pradesh—a small province in the Indian Himalayas—has great advantages in nature-based tourism and ecotourism activities. The craze for calling any nature-based tourism destination an ecotourism destination has spread in the state, and many governmental agencies are also falling prey to it. Endowed with natural beauty, thick forest cover, biodiversity, and wildlife, the Kufri-Chail-Naldehra area has been promoted as an ecotourism destination by both government agencies and private operators. Recently, the state Forest Department has formed the Ecotourism Society to manage a nature park at Kufri.
This paper is divided into six sections. Section 2 examines definitions and indicators of ecotourism. Sections 3, 4, and 5 are devoted to the study of the Kufri-Chail-Naldehra nature-based tourism area, with reference to the selected indicators. Finally, section 6 offers conclusions and recommendations of the study. Based on the findings, it is concluded that in its current form, tourism in the study area has adverse as well as positive environmental impacts, contributes little to the local economy and conservation, does not elicit local community participation, and fails to educate the stakeholders. However, there exists great potential for development of sustainable ecotourism in the area. This could be realized through, among other things, linking local farmers and other producers with the tourism industry, proper marketing of the destination, diversification of tourist accommodations and services (in line with real demand), education of the local people, and greater community involvement in tourism planning.

Vol. 6, No. 1 Evaluating Ecotourism in Mountain Areas 2006
43
2. Ecotourism and the indicator framework
The notion of ecotourism was initially developed in 1987 by Hector Ceballos-Lascurain, who defined ecotourism as an experience of:
traveling to relatively undisturbed areas with the specific objective of studying, admiring, and enjoying the scenery and its wild plants and animals as well as any existing cultural manifestations found in these areas. (Boo 1990, xiv)
The Ceballos-Lascurain definition confined the scope of the ecotourism concept to the objective of traveling and the area traveled. The World Tourism Organization gives a very similar definition:
tourism that involves traveling to relatively undisturbed natural areas with the specified object of studying, admiring and enjoying the scenery and its wild plants and animals, as well as any existing cultural aspects (both of the past and the present) found in the areas. (McIntyre and Hetherington 1993, 23)
As is obvious from these definitions, the focus is solely on visiting these relatively undisturbed natural areas.
Later definitions, however, have included the impacts on the area visited as important ingredients of ecotourism. Rosemary Black has defined ecotourism as:
an experience with a focus on the natural and cultural environment, ecologically sustainable activity, an activity with a predominant educative and interpretative programme, and an activity that contributes to local community groups and projects and to the conservation of the surrounding environment. (Black 1996, 4)
A later definition by Ceballos-Lascurain also offers a wider scope: environmentally responsible, enlightening travel and visitation to relatively undisturbed natural areas in order to enjoy and appreciate nature (and any accompanying cultural features both past and present) that promotes conservation, has low visitor impact, and provides for beneficially active socio-economic involvement of local population.” (Ceballos-Lascurain 1996, 20 ).
This study adopts Black’s definition of ecotourism.
Studies in the recent past have focused on development of indicators for assessing the success of ecotourism at a specific location. Notable contributions in this respect come from Brandon (1996), Loon and Polakow (2001), Nepal (2000), Ross and Wall (1999), Scheyvens (1999), and Wallace and Pierce (1996). Brandon (1996) reviews the concept of ecotourism and identifies five key benefits that ecotourism should give to an area: a source of financing for parks; economic justification for park protection; economic alternatives for the local people; constituency building; and impetus to private conservation efforts. This study concludes that in many cases, nature-based tourism and ecotourism have not come up to expectations. Wallace and Pierce (1996) identify six indicators, namely: minimizes negative impacts on the environment and local people; involves people in natural and cultural systems; contributes to conservation; maximizes local participation; provides direct economic benefits to the local people that complement traditional practices; and provides special opportunities to the employees and local people to learn more about the area. In their study evaluating ecotourism in Amazonas, Brazil, they conclude that ecotourism could only partially satisfy the above six principles.

Vol. 6, No. 1 International Review for Environmental Strategies 2006
44
Ross and Wall (1999) identify the specific roles that ecotourism could play and then shortlist five indicators of ecotourism, namely: preserves natural environment and biodiversity; generates money to finance conservation; contributes to the local economy; promotes community partnership; and educates the visitors and the local stakeholders. Broadly, Wallace and Pierce’s above six principles are covered in these five indicators. Scheyvens (1999) gives an empowerment framework (economic, psychological, social, and political empowerment) to test the sustainability of ecotourism. However, she acknowledges that as the central concern in the framework is empowerment, it is useful only for evaluating the contribution of tourism to the community. Nepal (2000) reviews ecotourism in the Himalayas but does not offer any framework for similar studies at other locations. Finally, the whole focus of the study by Loon and Polakow (2001) is on economic aspects. The paper provides a generalized model to evaluate the financial viability of investment in ecotourism ventures. Comparing the internal rates of return from various forms of accommodations offered (campsites, lodges, and chalets), the study concludes that campsite accommodations offer the highest returns compared to lodges and chalets.
From the above it is clear that though Brandon (1996) made an early attempt to identify indicators of ecotourism, the model is not comprehensive. It fails to include protection of the natural environment and community participation as components of the ecotourism framework, which are identified as essential prerequisites in Black’s definition of ecotourism. Similarly, the focus of other studies, such as Loon and Polakow (2001), Nepal (2000), and Scheyvens (1999), is rather limited. However, the indicators identified by Wallace and Pierce (1996) and the framework offered by Ross and Wall (1999) are similar and cover all aspects of ecotourism included in Black’s definition (Black 1996).
Based on the fundamental functions of ecotourism identified in the literature, we can say that its success at a site is reflected by the extent to which it satisfies these key requirements: preserves natural resources and biodiversity; generates money to finance conservation; contributes to the local economy; promotes community partnership; and educates visitors and members of local communities. Thus the
ECONOMY STAKEHOLDERS
NATURAL RESOURCES
Human resources
Income and employmentopportunities
Figure 1. Indicators framework

Vol. 6, No. 1 Evaluating Ecotourism in Mountain Areas 2006
45
focus of the indicators is three dimensional: natural resources, local economy, and stakeholders. Individually, these indicators are interrelated and together they make nature tourism, ecotourism. The natural resources are protected and strengthened through conservation plans; the local economy gets a boost with the operation of multiplier effects; and the stakeholders are consulted and educated while developing tourism. For nature tourism to be ecotourism, it has to fulfill all of the above criteria.
3. The study area
The study area, comprising three hamlets—Kufri, Chail, and Naldehra—is located in the outskirts of Shimla town (figure 2). Naldehra-Mashobra, Kufri-Koti, and Chail are promoted as ecotourism destinations.
Figure 2. The Kufri-Chail-Naldehra area

Vol. 6, No. 1 International Review for Environmental Strategies 2006
46
3.1. Kufri
About 16 kilometers (km) from Shimla, at an altitude of 2,633 meters (m), Kufri stands as a winter sports center of the Shimla circuit. It earlier had the distinction of being the winter sports capital of the state, but with the emergence of the Solang Nallah slopes in the Kullu Manali area, it has been relegated to second place. Nevertheless, it has vast potential for developing winter sports to reduce the seasonality of the circuit. Among the species of flora found here are chil (chir pine, Pinus roxburghii Sarj.), kail(blue pine, Pinus wallichiana Jack.), spruce, and deodar cedar (Himalayan cedar, Cedrus deodar). There is a zoo in the nature park. Tourism is the second main source of employment of the local people after agriculture.
Koti village is adjacent to Kufri and falls on the route to Chail. While the village does not offer any special attractions for tourists, all tourists going to Chail pass through it. Agriculture is the main occupation of its people. Put together, the total population of both the villages comes to 467 people, with a literacy rate of 46 percent, which is far lower than the state average of 67 percent.
3.2. Naldehra
About 22 km from Shimla, at an altitude of 2,078 m, Naldehra offers a refreshing retreat into woods of tall deodars and undulating hilly terrain. A well-kept nine-hole golf course is an attraction for visitors. The main occupation of the 217 people living in the village is agriculture. Tourism is picking up as the second main avenue of employment in the area.
Mashobra is a small village located close to Naldehra. Being on the way to Naldehra, Mashobra attracts people visiting that village. It has nice forest cover, nature trails, and a well-kept historical guesthouse built during the British rule. Being 5 km from the capital town, the majority of the local population is in civil employment. Literacy rates are quite high at 84 percent.
3.3. Chail
At an altitude of 2,250 m and about 45 km away from Shimla, Chail is a small mountain resort. A palace of the nineteenth century and some pretty cottages are part of the Chail Holiday Resorts. Chail is also well known for having the highest cricket pitch in the world. Chail has attractive walks and trails that meander through the dense pine forests, home to barking deer, wild bear, pheasant, and a variety of bird species. A small hill township, Chail has a total population of 534 people living in 93 households. The major occupation of the local people is agriculture, followed by business and tourism.
It is estimated that about 300,000 tourists visit the area every year. Of these, 89 percent are Indian nationals and only 11 percent are foreign. A majority of the domestic tourists (65 percent) are from the neighboring provinces of Punjab, Haryana, Chandigarh, and Delhi, while the remaining are from the provinces of western India. Among the foreign tourists, Europe accounts for 65 percent of total arrivals, followed by Asia (20 percent), and America and Canada (11 percent). Forty-five percent of the tourists are first timers, 36 percent second timers, and 20 percent have already visited more than twice. There are relatively fewer repeat visitors among foreigners (9 percent). The tendency for repeat visiting among domestic tourists can be attributed to the proximity factor.

Vol. 6, No. 1 Evaluating Ecotourism in Mountain Areas 2006
47
At the time the study was carried out, there were 16 hotels, nine guesthouses, and seven resorts with 467 rooms and 767 beds. There was only one travel agency operating in the area. Two resorts in Naldehra, four in Kufri, and one in Chail were under construction. Most of the upcoming accommodations were for higher-income visitors. Two very distinct allied activities have emerged as a result of tourism in this area: gift shops and mule and yak operators. Gift shops mostly stock handwoven and handicraft items, art pieces, souvenirs, cola, chips, biscuits, and sweets. Mule and yak operators provide rides up to nearby adjoining sight-seeing areas at rates ranging from US$0.20 to $3.00 per ride. In Kufri, there are so many such operators that a special body has been set up to regulate deployment of mules for the tourists. There are no guides in the area. However, outdoor photographers registered with the state Tourism Department provide services to the tourists. The area therefore has some infrastructure to cater to tourist demand.
4. Methodology
Data for the study were collected through five surveys: a tourist survey, a tourism industry survey, a host community survey, a survey of panchayat (village council) representatives, and a survey of local development officers in the area. The tourist survey was conducted at Kufri, Naldehra, and Chail during the main tourist seasons: summer, autumn, and winter. Some 200 schedules were filled out on each visit. The survey instrument included questions on various socio-economic aspects, impressions of the tourists about the strengths of the area, environmental impacts, and WTP for protection of environmental resources in these areas.
There exist four basic methods for evaluating economic impacts: the inventory/budget method; input-output method; social accounting matrices and computable general equilibrium models; and benefit-cost analysis (Baumol 1977). The first is simply a summarization of the total value produced and total resources used by a firm or an industry. The input-output method uses matrix algebra to find out how much can be left over for consumption and how much output will be used up in the productive activity to obtain the final net output. However, it is quite a rigorous method imposing substantial data requirements. The social accounting matrices and the computable general equilibrium models are advanced and more sophisticated versions of input-output analysis and hence they also suffer from the same shortcomings. Finally, benefit-cost analysis is more popular for analyzing economic impact, as it is usually used to assess the economic costs and benefits of a project (Kottke 1988).
As the focus of the present study is on local economic impacts, it principally focuses on the distribution of economic benefits from the first round of tourism expenditure using the inventory/budget method. Economic multipliers result from the process by which tourist spending stimulates further spending and increased economic activity. Traditional economic analyses would estimate impacts using macroeconomic techniques such as input-output analysis, but such large-scale techniques are inappropriate for local-level inquiries where significant data are often unavailable. As the second and subsequent rounds of expenditure are not being studied, estimation of multiplier values is not possible. Although future spending rounds may be important for assessing the level of integration of tourism into the local economy, the estimation of multipliers requires considerable data that were not available

Vol. 6, No. 1 International Review for Environmental Strategies 2006
48
locally, and thus it was beyond the scope of this study. Since there were only 32 tourism units, the tourism industry survey covered all of them. Information on the profile of the tourism industry included the type of tourism unit (hotel, resort, or guesthouse), number of rooms, total investment made by the unit, the number of persons employed, educational level and area of origin of the workers, the sourcing of raw material by the unit, and WTP for protecting the environment.
With the growing interest in ecosystem protection and restoration, economic research has continued to seek improved methods for valuing environmental amenities. Among the methods used for this purpose are the travel cost method, the hedonic price method, and the contingent valuation method. While both the travel cost method and the hedonic price method rely on revealed preferences of the users, these can only measure the use values and are unable to take account of non-use values. One non-market valuation tool, the contingent valuation method, relies on surveys to ask individuals directly about the value of a specific change in environmental quality. In the case of recreational areas, particularly the study area, rich biodiversity, nature parks, and mountain landscapes give a location a high non-use value. Therefore, for a true reflection, the contingent valuation method was used to assess the non-use values.
To elicit values from tourists and tourism industry representatives, the scenarios below were presented and the respondents were asked about their WTP. Those who expressed a willingness to pay were asked to indicate how much, in monetary terms, they would pay, on a payment card schedule. In the case of those who were unwilling to pay, reasons for their unwillingness were ascertained.
Scenario for tourists and tourism industry representatives
Suppose some agency wanted to promote sustainable tourism in this area by:
Setting up an independent agency to handle natural resource management in the area by visitation based on a carrying capacity plan, with emphasis on guided eco-tours;
Economic development focusing on tourism with emphasis on the quality of existing environmental assets and developing missing services like sport, entertainment, nature trails, etc;
More emphasis on afforestation, beautification, pollution control, solid waste management, biodiversity conservation, and water management that ensures better facilities.
The agency needs some capital to initiate these activities, and monthly maintenance and running expenditure (labor costs, electricity, etc.). Would you be willing to pay towards the cost and maintenance of such a project?
The host community scenario included enhancement of environmental resources so as to improve the availability of fuel, fodder, and water. In both the cases, those who replied in the affirmative were asked to indicate the monetary level they were willing to contribute.
Scenario for host communities
Suppose some agency took this site for conservation of its natural environment in terms of afforestation, beautification, pollution control, biodiversity conservation, and water resource management so that you get more fuelwood, fodder, and water. The agency needs some capital to initiate these activities and funds for monthly maintenance and running expenditure (labor costs, electricity, etc.). Would you be willing to pay for such a project?

Vol. 6, No. 1 Evaluating Ecotourism in Mountain Areas 2006
49
The approach adopted to study host communities was akin to the socio-economic survey approach except that in addition to the questions on socio-economic variables, respondents were quizzed about their perceptions regarding impacts of tourism development and the way tourism should be developed in the area. Out of the 18 villages falling within the area, a sample of five was selected using a stratified sampling method, taking into consideration factors like distance from Shimla (the state capital of Himachal Pradesh), cropping patterns, and position on other socio-economic variables like education and occupational patterns. Along with Kufri, Chail, and Naldehra villages, which happened to be the main focus of the study because they are nature tourism destinations, Mashobra and Koti were also included (Mashobra because it is closer to the town and Koti because it has an agrarian economy). Each village had 25 to 30 households. A random sample of 20 households from every village was drawn for the host community survey.
The survey instrument used for host communities was divided into three parts. The first part sought information on socio-economic variables like size of the family, educational status, occupational pattern, composition of family assets, sources of fuelwood and fodder, and the gender distribution of collection efforts. The second part was based on the scenario to elicit WTP above. The third part included questions soliciting community members’ views on impacts of tourism on the rural economy and the environment, the extent of their participation in decision making, and their suggestions on tourism development in the area. Following the Hunter and Green (1995) definition of environment, the environmental effects were studied in three parts: effects on natural environment, built environment, and socio-cultural environmental.
Local self-government institutions in Himachal Pradesh are organized in three tiers. At the grassroots level is the panchayat for a group of villages, followed by the panchayat samiti at the level of a development block, while at the district level is the zilla parishad. Each panchayat is headed by a panchayat president and has five other members. The survey of local representatives covered panchayatpresidents. The interview schedule for the panchayat presidents included seeking their views on economic and environmental impacts of tourism in the area.
Another important stakeholder in tourism in the area is government, operating through its functionaries working in the villages. The survey instrument used for governmental functionaries included questions eliciting their opinions on impacts of tourism development and level of public participation. There are two key governmental functionaries connected with tourism and development in the area: the divisional forest officer and the block development officer
5. Findings
The success of ecotourism in the Kufri-Chail-Naldehra area was analyzed in terms of its performance against the indicators identified in section 2. The findings are presented below.
5.1. Preservation of natural environment and biodiversity
As definitions of ecotourism indicate, natural resources (land, water, and forest) and biodiversity are essential components of the ecotourism experience. It could even be said that they constitute the core of the ecotourism product. Nature-based tourism,which is defined as tourism that features nature (Priskin

Vol. 6, No. 1 International Review for Environmental Strategies 2006
50
2001), is a broad phenomenon that includes many forms of tourism like adventure tourism, cultural tourism, rural tourism, and ecotourism; like other forms of tourism, it is known to be hazardous to the natural environment if not developed in a planned manner. Both civic (roads, drainage, and sewerage) and tourism-specific (hotels, airports and parking) infrastructure requires land, which is often made available by clearing forests, causing soil erosion, and change in land use. Besides, increased activity and consumption may lead to rapid depletion of renewable and non-renewable natural resources like construction materials, forests, water, and animal life. Tourism-led deforestation and degradation of forest are issues widely reported (Batta 2000; Mieczkowski 1995). Furthermore, with increased construction activities and floating populations, there is increased demand for water and resultant depletion of water resources.
As there was no baseline data available with reference to which tourism’s impacts on the natural environment of the study area could be analyzed, all the five surveys conducted during the study included questions on impacts of tourism on the natural, built, and cultural environment. This was done to capture the stakeholders’ impressions of the changes seen in a historical perspective. The findings revealed that negative impacts often attributed to tourism in the area are littering, deforestation, soil erosion, water scarcity and deterioration in water quality, and unscientific disposal of solid waste.
A majority of tourists (55 percent) visiting the area noticed littering with non-biodegradable garbage in the open. Most of it comprised disposable glasses, plates, and cans and other packaging. Even the hoteliers also felt concerned about this problem. With the popularity of fast food growing in the developing countries, the problem of disposal of packaging materials is assuming alarming proportions. Waste management is yet to be introduced in the area, even though composting of organic waste is easy. By disposing of waste in the open, the hoteliers revealed their preference for lower private costs and higher social costs, as the natural resources in the area are open-access resources. It has been argued (Dixon and Sherman 1990) that social and private interests often do not coincide; what is good for an individual may impose costs for the society. This disparity between private and social costs and benefits, coupled with the nature of property rights on these resources, exacerbates the damage.
On the issue of impacts on the natural environment, the most useful information came from the household survey and the survey of local representatives. A majority of households in Naldehra and Kufri villages (45 percent and 52 percent respectively) felt that tourism had benefited the natural environment in the area, with improvements in the existing wildlife sanctuary and the golf course located there. However, in Mashobra, Koti, and Chail villages a majority felt that tourism had had no impact. The largest number of households noticing no change was in Koti, where 91 percent of households felt that tourism had had no impact on the natural environment. Those who felt that tourism had damaged the local environment (32 percent in Kufri and 23 percent in Mashobra) attributed the problems of soil erosion prevalent in the area to the construction of hotels.
The perception of the households seems to have been influenced by the level of tourism development in the area. In places already exposed to tourism (such as Naldehra, Kufri, and Chail), the state government had invested money on maintenance of environmental assets and hence the positive impact

Vol. 6, No. 1 Evaluating Ecotourism in Mountain Areas 2006
51
was visible, while in places where tourism was not an important activity (like Koti), the perception was of no impact from tourism.
Soil erosion was an issue of serious concern with the panchayat presidents. While the host populations did not notice it, the presidents cited examples of cutting the hillside by particular hoteliers. The panchayat presidents from Koti and Mashobra felt that tourism had destroyed natural resources, with hotels causing soil erosion and dumping waste in the open. They even pointed out specific sites where erosion had occurred due to large-scale cutting of hills by the hotels. On the other hand, the presidents of Kufri, Naldehra, and Chail panchayats felt that tourism had increased the natural capital in the area in the form of nature parks, nature trails, and increased biodiversity.
As for water, hoteliers, villagers, and panchayat presidents felt concerned about the scarcity of water and deteriorating water quality in the area. Among the major reasons for scarcity were increasing demand from hoteliers, golf course managers, and the floating population. Water pollution was due to littering by tourists, unscientific disposal of solid waste, and the discharge of untreated wastewater by the hotels. The panchayat presidents cited quite a few locations where waste was being dumped in the open by hotels.
As can be seen from the above, tourism’s impacts on the environment arose mostly due to lack of a proper environmental management system. Problems of littering, waste disposal, and discharge could be solved by education of tourists and accommodations providers and by having a common treatment plant and incinerator.
5.2. Contribution to the local economy
Protected areas and their surroundings are among the most remote and agriculturally marginal lands in many countries. One of the most important factors in community involvement is that residents living in or adjacent to a protected area should be receiving economic and social benefits or compensation that support or complement their livelihoods (Lindberg and Enriquez 1994). The economic benefits often flow in the form of foreign-exchange earnings, generation of income due to the operation of multipliers, and creation of employment opportunities. While foreign-exchange earnings tend to benefit the country/region as a whole, the income and employment effects usually have local benefits. Additional incomes are generated as tourist spending boosts trade and business and creates demand for local products and handicrafts. Alongside enhancing economic activities, ecotourism can also contribute to providing markets for the products of cottage and small-scale industries. The most significant benefit for most rural communities from ecotourism is creating a range of employment opportunities. The types of employment generated are strongly linked to the way in which tourism is managed and the level of local control. If local people lack the requisite skills, people from outside will grab the opportunities arising from nature-based tourism development.

Vol. 6, No. 1 International Review for Environmental Strategies 2006
52
On the economic impacts of tourism, the survey results show that about 30 percent of revenue was generated and retained in the places of origin. Analysis of the expenditure pattern revealed that 33 percent of expenditure incurred was on interest, dividends, and taxes (15 percent, 10 percent, and 18 percent respectively). While interest and taxes were payments made to the Government and to
Taxes
Suppliesfrom outside
Touristexpenditure
Touristexpenditure
Interest and dividends
TaxesSupplies
from outside Purchases
from outside
Purchases by hotels Profits from
retail sales
Tourist expenditure
Earnings from yak/mule transport operations
Profits from locallyownedaccommodations
HOUSEHOLDS
SHOPS
Direct earnings into local economy
Indirect earnings into households and wholesale sector
Leakage of tourism-generated income out from the local economy
Interest
ACCOMMODATIONS
Figure 3. Economic impacts of tourism in the study area

Vol. 6, No. 1 Evaluating Ecotourism in Mountain Areas 2006
53
financial institutions located outside the study area, with 86 percent of resorts and 12 percent hotels owned by outsiders, a major share of dividends was also being filtered out. Even expenditure on account of water (2 percent), electricity (4 percent), and transport (3 percent) was also leaking, as this was given to outside parties and nothing was ploughed back into the local economy. Therefore, 52 percent of total earnings generated by the tourism units went to outside agencies. Of the remaining 48 percent, 23 percent was spent on raw materials, 15 percent on wages, and 10 percent on maintenance. Analysis of the procurement of raw materials by the tourism units showed that 95 percent of the raw materials (fruits and vegetables, pulses, beverages, grains, bread, butter and eggs, and liquor) used by resorts, 65 percent of the raw materials used by hotels, and 40 percent of raw materials used by guesthouses were being procured from outside the study area.
Even in allied sectors (shops, mule operators, photographers, etc.), leakage was very heavy. Of shops, the survey covered only gift shops catering exclusively to tourists. Most of these stocked souvenirs, gift items, and handwoven and handicraft items. Not a single item being sold here was produced locally; all were imported from outside. Handwoven items came from Kullu, Ludhiana, and Shimla towns, while souvenir and gift items were imported from the adjoining cities of Delhi and Chandigarh. The shopkeepers thus retained their commission on sales. However, mule and yak operators and photographers, being locals, retained their earnings.
As for employment in tourism, a total of 206 jobs in Kufri-Koti, 62 in Chail, and 103 in Naldehra-Mashobra areas were totally dependent on tourism (only direct employment in tourist accommodations included). Besides these, about 843 full-time jobs were created indirectly in the supporting service sector.
Table 1. Estimates of tourism and related employment in the study area
Number of direct jobs offeredIndirect jobs created
in allied sectors
Hotels Resorts Guesthouses Total Shops
Yak/muleoperators
Taxioperators
Indirect employment as% of direct employment
Kufri-Koti 60 166 – 206 64 515 30 295
Chail 42 32 8 62 22 56 33 179
Naldehra-Mashobra 25 84 4 103 – 82 41 119
Total 77 282 12 371 86 653 104 284
The overall ratio of direct to indirect employment was 1:2.2. An analysis of employment per room gives a ratio of rooms to direct and indirect employment of 1:2.6. This ratio is close to the national average of 1:3 (Seth 1996). Eight hotels, and three resorts created direct employment to 206 people and indirect employment to 609 people in the Kufri area. The ratio of direct to indirect employment there came to 1:2.9, the highest in the study region. The reason for this high ratio is the large number of mule and yak operators working in the area. Set against this, the ratios in Chail and Naldehra were 1:1.8 and 1:1.2 respectively.

Vol. 6, No. 1 International Review for Environmental Strategies 2006
54
The overall ratio of skilled employment (with a diploma or higher qualification in hotel management and catering) to unskilled employment (without any formal training in hotel management and catering) was 42:58. The proportion of skilled employment was higher in resorts (48 percent) compared to hotels (20 percent). While 85 percent of unskilled labor came from the study area, only 15 percent of skilled workers were local. However, 87 percent of shopkeepers, 76 percent of taxi operators, and almost 100 percent of mule and yak operators were local. Low levels of skilled employment in hotels could be attributed to two factors. First, unskilled labor was available in the local area at very cheap rates, and thus the hotels preferred to employ cheap labor. Second, interestingly, the Himachal Pradesh Tourist Trade Act and the Star Classification Guidelines of the Government of India do not lay down any requirements for qualified staff.
Both in terms of income generation and employment opportunities, there are problems of low retention of benefits in the local economy. What is needed, therefore, is integration of tourism with other sectors of the economy.
5.3. Generation of money for conservation
Ecotourism should be able to generate resources for the conservation of the protected areas on which it thrives. For any protected area to be successful in the long run, it should satisfy two major conditions, as follows. A justification is first needed to show that the benefits from conservation and preservation are greater than the total costs (establishment, operation, management cost, and the opportunity cost or value of output forgone). Second, while computing benefits, social benefits may also be included that may not bring direct revenues. Therefore, these private benefits that accrue to the affected population need to be encashed in the form of consumer surplus. This could be achieved through realization of environmental values by the development agencies. Designation as a nature-based tourism destination is an important avenue for conservation and preservation of the environment and biodiversity. Both the use and non-use values (use values are the values assigned by the users on use of the environmental resources; non-use, or “existence” values, on the other hand, are derived not by direct use but by the existence of the environmental resource) are potentially recoverable from tourism to finance the tourist area. However, due to lack of understanding of the magnitudes of these values, very often, the protected areas are dependent on government support. With budgetary resources diminishing day by day, the very existence of these areas and the quality of the experience they offer are falling under threat. Studies have shown (Batta 2003; Brandon 1996; Dharmaratne, Sang, and Walling 2000) that while use values are often recovered, the non-use values are not.
It is argued (Batta 2003; Dharmaratne, Sang, and Walling 2000) that the recovery of non-use values could play an important role in providing funds for environmental causes. Individual WTP for the preservation of unique species and habitats in the world has been estimated to provide a huge new potential flow of finances (Pearce 1994; Pearce and Moran 1995). Furthering the argument, Tietenberg (1995) cites the example of the world’s largest privately owned reserve system, Nature Conservancy, which is managing 3.5 million acres of ecosystems and biodiversity throughout the world thanks to liberal donations from people living on different parts of the globe. Similar is the example of Saba

Vol. 6, No. 1 Evaluating Ecotourism in Mountain Areas 2006
55
Marine Park, which is able to attract in donations from former visitors some 9 percent of its total revenue (Dharmaratne, Sang, and Walling 2000).
Presently, an entry fee of US$0.20 per head for adults and $0.10 per head for children is being charged in Nature Park Kufri. Enquires revealed that during the peak season, the daily takings at this zoological park were around $80, falling to $12–14 during the off-season. The average annual revenue from entry fees was $5,000–6,000, which was not even sufficient to cover the costs of food and other related items for zoo animals. On average, the zoo authorities spent $15,000 per annum on these costs alone, and must also cover staff salaries.
The study attempted to find out the willingness of tourists, the tourism industry, and the local population to pay for environmental protection.
Table 2. Estimates of tourists’ willingness to pay for environmental protection
Bid amount (in US$) Domestic tourists Foreign tourists Total
$0 246 (46%) 0 246 (41%)
< $1.00 102 (19%) 0 102 (17%)
$1.00 121 (23%) 12 (18%) 133 (22%)
$2.00 45 (8%) 9 (15%) 54 (9%)
$3.00 8 (2%) 25 (38%) 33 (6%)
$4.00 12 (2%) 20 (30%) 32 (5%)
$5.00 0 0 0
$10.00 0 0 0
Total respondents 534 (100%) 66 (100%) 600 (100%)
Mean value $0.65 $2.75 $0.86
With almost half of tourists unwilling to contribute to environmental protection, their WTP was rather low. One of the major factors for such low WTP was lack of information among tourists. Not enough literature and on-site information is available. The inability of tourism managers to develop forest trails and wildlife viewing towers inside the sanctuary area, exacerbated by a lack of coordinated approach, was also responsible. The mean WTP of foreign tourists was $2.75 per head, while it was $0.65 for domestic tourists. The combined mean WTP for all tourists was $0.86. With 300,000 tourists visiting the area every year, the total income could therefore potentially reach $255,000.

Vol. 6, No. 1 International Review for Environmental Strategies 2006
56
Table 3. Estimates of the local tourism industry’s WTP for environmental protection
WTP values (US$) per annum Hotels Resorts Guesthouses
$100 - - -
$200 - - 7 (77%)
$300 7 (44%) - 2 (23%)
$500 7 (44%) - -
$1,000 2 (12%) - -
$2,000 - 7 (100%) -
Tourism units were equally interested in contributing towards protecting the environment, as table 3 shows. The difference between hotels’, resorts’, and guesthouses’ WTP was marked. Resorts were willing to pay much more than hotels, which in turn were willing to pay more than guesthouses. Among the factors that contribute to this difference were variation in paying capacity of resorts and hotels and differences between their stakes in the business. The total revenues for environmental protection from tourism units could potentially reach $23,600.
The survey results showed that households completely refused to pay anything towards environmental protection, even though the scenario included afforestation, which would have increased the availability of fuel, fodder, and water. Among the reasons given for this unwillingness were low incomes and a strong belief that environmental protection is the responsibility of the Government. Two factors could be at work here. First, it is often argued (O’Neill 2001) that the true non-use values will frequently be recognized, and WTP therefore rise, if the respondents feel some real threat to the environmental resources. The host populations in this case felt that tourism had had positive impacts on the environment, so they did not fear losing the natural resources. Second, it is possible that the host populations could not understand the design of the survey. Such problems have been noticed in surveys of local populations elsewhere. For instance, in contingent valuation studies of a wildlife enhancement scheme in England (O’Neill 2001), the WTP was quoted as zero by the local population. However, when the effects of such a decision were explained to the respondents, one of them commented, “I feel quite strongly that if we would have known a bit more, and the influence perhaps that the questions and answer could have, our response would have been different.” A similar problem may well have occurred in the present study.
In summary, given the importance of the environment to all the stakeholders, the study attempted to find out the WTP of tourists, tourism industry representatives, and the local population. The outcome was very interesting. Both tourists and the tourism industry said they were willing to pay. This is an important finding for two reasons. First, environment being an important component of the tourism product of Himachal Pradesh, the industry and the tourists both benefit from it, in the forms of improved business and high-quality recreational experiences. Therefore, it is appropriate for these groups to be made to pay. Second, it gives an indication of values being realized from an important resource—forests and wildlife—which have high use, option, and non-use values. Total income from tourists and tourism

Vol. 6, No. 1 Evaluating Ecotourism in Mountain Areas 2006
57
units could potentially reach US$278,000. The current entry fees are therefore far below the potential. Even if half of this sum could be realized, it would be a great contribution toward conservation.
5.4. Promoting community partnership
To ensure greater percolation of benefits, it is important for any ecotourism venture to work in harmony with local communities. This in turn requires greater control to be put in the hands of the communities. The participation and involvement of local communities is one of the essential elements of true ecotourism (Boo 1990; Brandon 1996; Ceballos-Lascurain 1996). Basically, in a symbiotic relationship between the local population and the protected area’s resources or biodiversity, local residents act as stewards of the natural resources and in return benefit from the protected areas through sustainable harvesting and water catchments. Brandon (1996) identifies key factors that promote local input. Among them are maintenance of a dialogue to permit understanding of local needs and concerns; avoidance of decisions that may impact negatively on local residents; encouragement of a form of empowerment or decentralization that allows people some control over decision making that affects them; strengthening links between conservation and development goals with local benefits; facilitation of the local distribution of benefits; and provision of local capacity to monitor and evaluate progress of projects.
According to information available from the local land revenue authorities, local people enjoy the rights of timber extraction for construction of houses and of extraction of minor forest produce like herbs growing naturally in the forest. Attempts to regulate entry without consultation could cause serious tensions (Ziffer 1989).
The inquiry into community participation in tourism development in the study areas included questions about the levels of community participation and levels of consultation of panchayats by local authorities in formulating tourism plans. On involvement of local bodies by the government functionaries, all respondents felt that plans and programs were framed at the government level and local bodies were not consulted. The responses to the question on consultation of the Panchayats/ community in tourism development were also negative.
The opinion of local government officers on reasons for the lack of public participation was different. Both the block development officer and the divisional forest officer of the area felt that the public response in the developmental process was very poor. The block development officer backed up his argument by citing the problem of low participation in village meetings The divisional forest officer said the relation of the public with the forest was “one way”—the community simply demanded rights and benefits. Both felt that owing to these reasons, they could not consult the local community in the formulation of developmental plans, including tourism. However, this cloud had a silver lining: the ecotourism society of Kufri has included representatives of the local panchayat, mahila mandals(women’s club), NGOs, and hoteliers in its executive body.
On the modes of participation, most community respondents felt that the matter should be considered in the village assembly. Both host communities and panchayat presidents complained that they were not consulted in policymaking for tourism. The villagers offered different suggestions as to how tourism should be developed and what should be done to make tourism more beneficial to the area. A large

Vol. 6, No. 1 International Review for Environmental Strategies 2006
58
majority (71 percent) felt that tourism policy should promote employment in the area, 16 percent were in favor of better water management to overcome the water shortages and improve water quality, and 13 percent also favored the idea of developing recreational sites and parks in the destination area.
5.5. Educating the stakeholders
Finally, there is the issue of educating visitors and stakeholders, also referred to as constituency building (Brandon 1996). One often overlooked way in which ecotourism supports conservation is that ecotourists, upon returning home, act as advocates for the area visited. This advocacy can help in many ways. First, ecotourists are likely to give more generously for the conservation of the area. Second, they can also donate their time for lobbying in favor of policies that help conservation.
According to the findings of the tourist survey, 85 percent of the tourists visiting the study area came for its scenic beauty and had no idea of the strengths of the area in terms of biodiversity and wildlife. There are no on-site plaques to educate tourists. Even the tourism units in the study area chose the place for its scenic beauty and not due to its environmental wealth. The local community was equally ignorant about their endowments and the likely impacts of tourism on the area. No guides were available to educate or to answer questions. Lack of information among tourists causes problems of irresponsible behavior in waste disposal and unsympathetic attitudes towards the fauna and flora.
From the point of view of the local communities, this lack of knowledge could be detrimental in three ways. First, a community that becomes aware of its present situation and possibilities for tourism can plan for tourism. This lack of knowledge therefore deprives them of this benefit. Second, unplanned flow of benefits often results in their inequitable distribution and hence dissent among host communities. (A small hamlet near Koti village called Dharbhog already faces this problem, with the village community divided into two groups, for and against tourism, based on economic considerations.) A unified community is likely to participate to a high degree for common interests (Mitchell and Reid 2001). Finally, community awareness about tourism opportunities is closely linked to tourism planning and development. It basically entails educating the community about the benefits of promoting tourism. It also transfers control over tourism to the local community.
6. Conclusions and recommendations
Since its introduction by Ceballos-Lascurain in 1987, the concept of ecotourism has undergone fundamental change. As the priority for development of tourism shifted from purely economic benefits in the 1960s to environmental concerns and community participation in the 1980s and 1990s, definitions of ecotourism have adapted to include these new aspects. However, since ecotourism remains a subset of nature-based tourism, there is still potential for confusion of ecotourism other forms of nature-based tourism. The task of properly defining the two and developing indicators for their evaluation therefore gains importance.
Owing to its dependence on natural resources, ecotourism has not only to protect the natural resources in the destination area but also to contribute to strengthening the area’s natural resource base (by adding to the biodiversity and landscape of the area). One important way of doing so is to enlist the support of the local population by providing economic benefits. As the dependence of the local population on the

Vol. 6, No. 1 Evaluating Ecotourism in Mountain Areas 2006
59
natural resources is very high in mountain areas (due to subsistence farming and a higher percentage of the population being dependent on agriculture for their livelihood), developing tourism has a double-dividend property: reducing overexploitation of natural resources by local people, and providing additional sources of income and employment for local people. In mountain areas, high dependence on natural resources (for instance, land and forests) for livelihood tends to accelerate the rate of their exploitation. Tourism can offer alternative avenues for income and employment, which are generally absent in these areas. The economic activities typically found in mountain areas depend very highly on natural resources (Batta 2000). For instance, the cottage and small-scale units existing in the study area included three sawmills and one art gallery making wooden artifacts. Both were heavily dependent on forestry. Tourism development could reduce dependence on such activities by offering alternate remunerative avenues of employment and increasing disposable income.
Economic attractions very often become the starting point for developing a favorable disposition towards nature tourism among host communities. For greater percolation of economic benefits, the range of accommodations offered to tourists and their locations are very influential. They should include both on-site and off-site accommodations. On-site accommodations may be relatively primitive, such as camping in remote areas or guesthouses in remote villages. These can be located inside the sanctuary area. Since these do not involve much capital, locals can develop these very easily. Owing to the low capital requirements, developing these forms of accommodation also offers a high internal rate of return and higher profits (Loon and Polakow 2001). This will bring tourists into closer contact with the local population, give tourists more experience of local culture and cuisine, and generate local employment.
Off-site accommodations, like the present resort areas, are more comfortable for those taking day tours to nature-tourism areas. Providers of these accommodations should focus on internal aspects of management as well. Practices like efficient use and conservation of natural resources, waste disposal and recycling, green purchasing policies, and sympathetic building and architecture can be adopted. However, an important caveat relating to both off-site and on-site accommodations is that they will only bring economic benefits if there is sufficient demand. Accommodations development should go hand in hand with market research and with promotion of the destination through appropriate channels, both of which will require cooperation between local people and outside agencies.
Perhaps more important, and certainly safer, is to promote the use of local agricultural and other products by tourist accommodations and service providers. If there is insufficient tourist demand, the excess products can still benefit the community by being used locally, stocked up, or marketed elsewhere, whereas empty accommodation generates no income or material benefits.
Having offered a reasonable economic package, another important task would be to involve local communities in tourism planning and development. Tourism planning has to emphasize a strategy that promotes host-community-oriented tourism, to ensure that tourism is environmentally sensitive and guarantees that the members of the local community control the activities taking place and a significant proportion of benefits also accrue to them. In the context of the present study, it has been seen from the data that ecotourism could be credited with bringing some benefits of environmental conservation through governmental efforts. However, owing to high leakage and low employment effects, tourism

Vol. 6, No. 1 International Review for Environmental Strategies 2006
60
remains divorced from the host communities’ aspirations. While it utilizes and damages the local resources on which the local populations heavily depend, it does not bring commensurate benefits to the local people. A balance sheet of gains and losses to the host community due to tourism ultimately becomes the acid test.
Any attempt to develop ecotourism should enlist community participation at all stages: conceptualization, planning, development, marketing, and management of the area. Involvement of the stakeholders also ensures their education. In the process of participative management, the stakeholders will come to recognize the strengths of the area and the value of maintaining it for both present and future generations. As the study area has all the features necessary—natural beauty, biodiversity, and wildlife—it could potentially develop into a successful ecotourism destination that offers non-farm income and employment avenues to the local people. What is needed is a planned effort.
References
Batta, R. N. 2000. Tourism and the environment: A quest for sustainability. New Delhi: Indus Publishing Company.
———. 2003. Tourism’s potential of financing conservation areas. Tourism Recreation Research 28(1):57–65.
Baumol, W. J. and W. E. Oates. 1988. Economics, environmental policy and quality of life. London: Prentice Hall.
Black, R. 1996. Ecotourism. What does it really mean? Range 34: 4–7.
Baumol, W. J. 1977. Economic theory and operation analysis 4th ed.. Englewood Cliffs, NJ: Prentice Hall.
Boo, E. 1990. Eco-tourism: The potential and pitfalls. Washington, DC: World Wildlife Fund.
Bon, E. 2000. Common property resources: Two case studies. Economic and Political Weekly ( July 15): 2,569–73.
Brandon, K. 1996. Ecotourism and conservation: A review of key issues. World Bank Environment Department Papers, no. 033, Biodiversity Series.
Butler R. W. 1980. The concept of a tourism area cycle of evolution and implications for management. Canadian Geographer 24:5–12.
———. 1991. Tourism, environment and sustainable development. Environment Conservation 18(3):201–209.
Cater, E. 1994. Ecotourism in the third world: Problems and prospects for sustainability. In Ecotourism: A sustainable option?, ed. E. Cater and G. Lowman, 68–87. Chichester, UK: Wiley.
Ceballos-Lascurain, H. 1996. Tourism, ecotourism and protected areas. Gland, Switzerland: World Conservation Union.
Dharmaratne, G. S., F. Y. Sang, and L. J. Walling. 2000. Tourism potential for financing protected areas. Annals of Tourism Research 27(3):590–610.
Dixon, J and P. B. Sherman. 1990. Economics of protected area: A new look at the benefits and costs. London: Earthscan.
Grahn, P. 1991. Using tourism to protect existing culture: A project in Swedish Lapland. Leisure Studies 10(1):33–47.
Hunter, C. and H. Green. 1995. Tourism and the environment: A sustainable relationship. London: Routledge.
Karshenas, M. 1994. Environment, technology and employment: Towards a new definition of sustainable development. Development and Change 25(4):723–756.
Kottke, M. 1988. Estimating economic impacts of tourism. Annals of Tourism Research 15: 122–133.
Lindberg, K. and J. Enriquez. 1994. An analysis of ecotourism’s economic contribution to conservation and development in Belize.2 vols. Washington, DC: World Wildlife Fund.

Vol. 6, No. 1 Evaluating Ecotourism in Mountain Areas 2006
61
Loon, R. M and D. Polakow 2001. Ecotourism ventures: Rags or riches? Annals of Tourism Research 28(4):892–907.
McIntyre, G. and A. Hetherington. 1993. Sustainable tourism development: Guidelines for local planners. Madrid: World Tourism Organization.
Mieczkowski, Z. 1995. Environmental issues of tourism and recreation. New York: University Press of America.
Mitchell, R. E. and D. G. Reid. 2001. Community integration: Island tourism in Peru. Annals of Tourism Research 28(1):113–139.
Nepal, S. 2000. Tourism in protected areas: The Nepalese Himalayas. Annals of Tourism Research 27(3):661–681.
O’Neill, J. 2001. Markets and the environment: The solution is the problem. Economic and Political Weekly (May 26): 1,865–73.
Pearce, D. W. and D. Moran. 1995. The economic value of biodiversity. London: Earthscan.
Pearce, D. W. 1994. Capturing global environmental values. Norwich, UK: University of East Anglia Centre for Social and Economic Research on Global Environment.
Priskin, J. 2001. Assessment of natural resources for nature-based tourism: Ihe case of the Central Coast Region of Western Australia. Tourism Management 22: 637–648.
Ross, S. and G. Wall. 1999. Ecotourism: Towards congruence between theory and practice. Tourism Management 20:123–132.
Scace, R. 1992. Ecotourism in Canada. Ottawa: Canadian Environmental Advisory Council.
Scheyvens, R. 1999. Ecotourism and the empowerment of local communities. Tourism Management 20: 245–249.
Sinclair, M. T. 1998. Tourism and economic development: A aurvey. Journal of Development Studies 34(5) (June):1–49.
Tietenberg, T. 1995. Design lessons from existing air pollution control systems: The United States. In Property rights in a social and ecological context: Case studies and design applications, ed. S. Hanna and M. Munasinghe, 15–32. Washington, DC: World Bank.
———. 1998. Environmental economics and policy. 2nd ed. Washington, DC: Addison-Wesley.
Wall, G. 1997. Impacts of tourism: Theory and practice. Tourism Recreation Research 22(2):57–60.
Wallace, G. N. and S. M. Pierce. 1996. An evaluation of ecotourism in Amazonas, Brazil. Annals of Tourism Research 23(4):843–873.
Weaver, D., B. Faulkner, and L. Lawton. 1998. Nature-based tourism in Australia and beyond: A preliminary investigation. CRC Tourism Work in Progress Report Series, Report I. Brisbane, Australia: Griffith University.
Weiler, B., and C. M. Hall. 1992.. Special interest tourism. London: Bellhaven Press.
Wells, M. P. 1993. Neglect of biological riches: The economics of nature tourism in Nepal. Biodiversity and Conservation 2(4):445–464.
Ziffer, K. 1989. Ecotourism: The Uneasy Alliance. Washington, D.C: Conservation International.

Vol. 6, No. 1 International Review for Environmental Strategies 2006
62

International Review for Environmental Strategies Vol. 6, No. 1, pp. 63 – 92, 2006
© 2006 by the Institute for Global Environmental Strategies. All rights reserved.
63
Article
Beyond Kyoto 2012: No Prevention of Dangerous Climate Change Without an
Internationally Acceptable “Beyond Kyoto” Global Cap-and-Trade Scheme
Lutz Wicke a and Gerd Duerr-Pucherb
The Kyoto Protocol, in its present form, is quantitatively and structurally totally inadequate to combat dangerous climate change. That is—to the authors of this paper—the inevitable conclusion to be drawn from three careful scientific studies on behalf of the Ministry of Environment of the German federal state of Baden-Wuerttemberg, two published in Beyond Kyoto—A New Global Climate Certificate System. Continuing Kyoto Commitments or a New Global Climate “Cap-and-Trade Scheme” for a Sustainable Climate Policy? (Wicke 2005) and one in Cost Impacts of a “Beyond Kyoto”-Global Cap and Trade Scheme (Wicke 2006) However, as the cited publications demonstrate, by a “structural evolution” of the climate regime, there can and should be an efficient and internationally acceptable beyond-Kyoto system. It is only necessary to combine some brilliant ideas that have already been proposed: the flexible Kyoto cap-and-trade mechanisms (emission trading between states, joint implementation, and the clean development mechanism) “invented” by US scientists and implemented in the Kyoto Protocol should be enlarged to a global cap-and-trade system, while the idea of equal per capita emission rights from India and Pakistan—which has been unfairly written off as not a serious proposal—can be the basic key to fair distribution of emission rights.1 Additionally, there must be economic corrections and mechanisms within such a free-market-oriented cap-and-trade scheme to make it economically acceptable for all countries to combat successfully dangerous climate change. This system would give incentives for climate-efficient behavior and structures worldwide and provide adequate means and incentives for sustainable, climate-friendly development and for the elimination of poverty—especially in developing countries. This paper attempts to prove both the inadequacy of the current Kyoto system and the feasibility and necessity of such a global cap-and-trade scheme—being nearly completely in line with a recent urgent call for a global cap-and-trade scheme by the World Economic Forum (World Economic Forum 2005).
Keywords: Beyond Kyoto, Global Climate Certificate System, Kyoto Protocol, Cap and trade, Prevention of dangerous climate change
1. The importance and merits of the Kyoto Protocol process
The expected dangerous climate change is one of the biggest challenges the world has ever faced. Its destructive potential has forced the world community into a multilateral process of negotiations to
Corresponding author, Institute for Environmental Management (IfUM), ESCP-EAP European School of Management, Berlin,
Paris, London, Madrid, Torino, Heubnerweg 6 D 14059 Berlin, Germany. Tel. +49 30 365 2307, Fax. +49 30 3680 2580.a . Professor for environmental management and director of IfUM, ESCP-EAP European School of Management, Berlin;
formerly scientific director at the Federal Environmental Agency of Germany (UBA) and secretary of state for environmental protection, Government of Germany.
b. CEO and managing director, German Environmental Aid (Deutsche Umwelthilfe, DUH), Berlin and Radolfzell, Germany.1. The equal per capita distribution concept—starting with the “grandfathering” principle after a transition period of 30 to 50
years—is incorporated also within the contraction and convergence proposal of the London-based Global Commons Institute (GCI 1999) and its head Aubrey Meyer (Meyer 2000), put forward in the 1990s.

Vol. 6, No. 1 International Review for Environmental Strategies 2006
64
prevent at least the most horrific consequences and to slow the speed of the change. The first step towards this goal was the UN Framework Convention on Climate Change (UNFCCC), and specifically the Kyoto Protocol, which entered into force in February 2005.
Besides all the inefficiencies of the Protocol, which we discuss below, it is astounding that the international community has come so far with this treaty. Why? On the one hand, there exists very reliable scientific evidence for anthropogenic climate change (a global temperature rise of 0.6°C since 1760). However, there are powerful international forces acting “under the command” of fossil fuel energy companies like Exxon, which try to ignore scientific evidence and, by lobbying massively, to influence national governments.2 Within the US Senate, these forces have, since 1997, been in the overwhelming majority, which is largely why the United States left the Kyoto process at a very early stage.3 However, overall this process was a success and has led to an international binding obligation to make significant efforts, mainly in the industrialized countries and those in transition (the “Annex I countries”), aimed at reducing greenhouse gas (GHG) emissions.
The maxim “Never change a winning team” captures why we should be very careful of criticizing this process: in case there is no better alternative. We fully understand that some environmentalists feared that criticizing the Kyoto Protocol before its final ratification and talking about a better alternative could have been dangerous. On the other hand, it is our obligation as scientists and as environmentalists to search for an alternative, since we cannot shut our eyes to the obvious serious quantitative and structural failures and shortcomings in the Kyoto process. The most important of these is not the fact that we will not reach the reduction goals of the first commitment period but rather the lack of sufficient incentives for industrialized countries, even greater for developing countries, to go further in the second period in order to trigger economic development that really can prevent dangerous climate change.
Although the Global Climate Certificate System (GCCS) has already been developed in much detail—so much so that co-author Lutz Wicke is convinced that it is “in a condition generally ready for application” (Wicke and Knebel 2003b, 1), we nevertheless know that in this paper we will be comparing a system that is still a model with the Kyoto Protocol, which has been developed in a very complicated political environment and through very sensitive negotiations (even if it has not followed its theoretical road map).4 This, in fact, is not quite fair and may be methodologically disputable. Nevertheless, an unbiased evaluation of the Kyoto Protocol and comparison with the GCCS, which has been carefully designed to be both in theory and in practice an optimal climate-protection system, should lead to necessary reflection by the Kyoto community as to whether we are on the right track for climate protection.
2. In Ecologist (2001) can be found a (somewhat biased) compilation of Exxon’s ecological and other sins, and those of its head,
Lee Raymond.3. As demonstrated by the 95:0 adoption of the Byrd-Hagel Resolution in the US Senate in 1997 (US Congress 1997).4. Although GCCS has not yet been discussed in detail with and within the “Kyoto community”, there has already been hot
discussion of it (and of the clear shortcomings of the Kyoto Protocol) with climate-protection specialists of German non-government organizations in January 2004 (at the headquarters of Bund für Umwelt and Naturschutz Deutschland, Germany’s biggest environmental non-governmental organization), with the German Federal Environmental Agency (Umweltbundesamt) in December 2003, and with the heads of the German delegation to the Kyoto Protocol Conference of the Parties in January 2005, and a presentation at a side event of the Twenty-second Sessions of the Subsidiary Bodies of the UNFCCC in Bonn, May 2005.

Vol. 6, No. 1 Beyond Kyoto 2012: A global cap-and-trade scheme 2006
65
As with all other conceivable effective schemes for improving the current system, extremely high hurdles will have to be passed when implementing the GCCS. This system will need to be incorporated into an approved, ratified, and reformed multinational climate-protection treaty. However, thanks to the important merits of the GCCS, which are outlined below, it still offers a small chance for mankind to prevent dangerous climate change.
2. The foreseeable but regrettable failure of the Kyoto commitment strategy
Two figures among thousands in the latest World Energy Outlook of the International Energy Agency (IEA 2004) clearly show the complete failure of the Kyoto climate-protection strategy’s reliance on national climate commitments: taking into account all energy- and CO2-relevant decisions worldwide—also initiated by the Kyoto process—up to the summer of 2004, the IEA’s projection reveals that up to the year 2010, the industrialized countries (the members of the Organisation for Economic Cooperation in Development, OECD) will increase their CO2 emissions by 25.3 percent (ibid., 437, “change since 1990”) instead of reducing them by (at least) 5.2 percent, their original commitment in the Kyoto Protocol. Thus they will miss the target by as much as 30.5 percent!5 Even the European Union (EU), the self-declared world leader in CO2 reduction, will also fail dramatically; instead of its members’ CO2
emissions falling by 8 percent, they will increase by 9.1 percent (IEA 2004, 469), missing the ratified, and therefore legally binding, target by 17.1 percent!6
These figures clearly show that with the failure to achieve the very limited emission reductions committed to by the industrialized countries, particularly the EU, the whole future Kyoto strategy, which was very unrealistic from the beginning, falls apart; industrialized countries are de facto not taking the lead in combating climate change.
Even if there is some overestimation in the IEA projection,7 given this situation, clearly there is no chance whatsoever of persuading even one newly industrialized or developing country to commit to a reduction of its emissions growth or even of its absolute emissions. The failure to meet commitments by the Annex I countries adds a new and decisive argument to the two traditional and understandable arguments cited by developing countries for refusal to commit to emissions reduction: that they have
5. The quoted 5.2 percent reduction is a target for all Annex I countries. The projected rise among OECD countries of
25.3.percent, therefore, is only partly comparable with the reduction target. However, all of the OECD member countries have higher reduction targets than the average for Annex I countries!
6. The EU’s target of an 8 percent reduction of emissions would require a reduction of around 700 million tons of CO2; in fact, it is predicted to increase its emissions up to around 4.1 billion tons by 2010 (IEA 2004, 469). It is inconceivable that it will takeappropriate measures internally by 2010 to reach this target. The only way it will be able to fulfill its commitment is by buyingemission credits from non-EU countries. Besides gaining emission credits through joint implementation (JI) in Annex I countries or through clean development mechanism (CDM) measures in developing non-Annex I countries, the EU can legally buy up to around 1.5 billion tons of “hot air”. This is defined by Grubb et al. (1999, xxviii) as the excess emission allowancesover projected business-as-usual emissions in the commitment period, believed to exist mainly in Russia and some Central and Eastern European states—presumably primarily from Russia or the Ukraine. However, buying “hot air” is not a means to reduce climate change. According to Grubb et al., the existence of too much “hot air” could undermine the trading regime or even the whole climate change regime. The EU case seems to confirm Grubb and his co-authors’ belief, especially for the example of Russia: Russia has negotiated emission allowances (so called assigned amounts) on the basis of zero emission growth up to 2012, while in fact its business-as-usual path is predicted to lead to a reduction in emissions of at least 30 percent, a difference of nearly 1.5 billion tons of “hot air” CO2! (European Commission 2002, 45).
7. The IEA claims that, “since 1993, IEA projections for global energy demand have been within 2.2% of the most recently reported data.” (IEA 2004, 519).

Vol. 6, No. 1 International Review for Environmental Strategies 2006
66
much lower per capita emissions and income, and the indubitable historic guilt of industrialized nations (that is, their contribution to the current anthropogenic CO2 concentration in the atmosphere). Thus it is the final nail in the coffin of the current Kyoto commitment-based strategy. There will be no inclusion of non-Annex I countries in the Kyoto commitment system; even the completely inadequate commitments by the industrialized countries and countries in transition have no future!8 There is no chance at all that future commitment periods will start with appropriate commitments by all of the countries that originally signed the Protocol in 1997.
This means no prevention of dangerous climate change; in fact it means its reverse: if there is no radical and efficient structural evolution of the existing Kyoto system, the world is directly heading towards a CO2 concentration of 750 ppm or more, as shown in figure 1, if the IEA projected increase up to 2030—90 percent(!) on 1990 levels, or 38.2 billion tons of CO2 emissions (IEA 2004, 76 and 433)—proves correct.9 And this—there can be no doubt for any serious scientist—will produce dangerous, if not catastrophic, climate change! To achieve the EU’s target of limiting the rise in average global temperature by and after 2100 to 2°C (and keep atmospheric concentrations of CO2 at or below 550 ppm) in order to prevent dangerous climate change, worldwide emissions up to 2050 must be reduced by 60 percent, as can be (indirectly) seen in the 550 ppm CO2 stabilization curve in figure 1. Even this, according to the latest findings in various climate-change scenarios (Berk and den Elzen 2001; Hare and Meinshausen 2004), is not enough of a reduction to reach the EU temperature target; only a concentration of 450 ppm CO2 equivalent (including all other GHGs) would be sufficient (Hare and Meinshausen 2004). There remains only the vague hope that in the second half of the twenty-first century there might be enormous decreases of worldwide GHG emissions, thus compensating for the projected overshoot in the first half of the century, enabling the world to realize the EU temperature target.
3. The structural inadequacy of the Kyoto commitment strategy
This section will demonstrate, as objectively as possible, that the commitment system of the Kyoto Protocol is indeed structurally unable to meet the UNFCCC’s main objective, “to prevent dangerous anthropogenic interference with the climate system” (UNFCCC, article 2). This can be demonstrated based on careful studies of relevant literature evaluating the prospects of success of different climate-protection systems, chiefly Philibert and Pershing (2001, 2002) and Höhne et al. (2002). By taking into account the experiences and the evaluation criteria of these sources, the authors of this article, and of the book on which it is based (Wicke 2005), have developed a comprehensive standard system for evaluating the prospect of success of different climate-protection systems. All the criteria and 19 sub-criteria of the abovementioned literature have been integrated and given individual weighting. The possibility of achieving climate sustainability with a certain climate-protection system counts for 50
8. Contrary to some pronouncements, it seems inconceivable that even climate-committed Annex I states will commit, at the end
of the first commitment period, to adequate reductions for global climate stabilization, in the light of their predicted failure to comply in the first period and the disaster of the non-compliance of the whole group of Annex I states, by both subgroups of countries that have and have not ratified the Kyoto Protocol.
9. Additionally, one has to consider the (almost proved) dramatic increase of worldwide CO2 emissions since 1990 of 38.9 percent by 2010, or plus 7.8 billion tons per annum (IEA 2004, 433).

Vol. 6, No. 1 Beyond Kyoto 2012: A global cap-and-trade scheme 2006
67
percent of the total score, and is thus called the paramount criterion. Another study by Höhne et. al (2002) evaluates climate sustainability with a weight of only 33 percent. However, the weighting assigned in this study is fully in line with the following remarks:
Environmental effectiveness—measured in terms of the ability of a policy to stabilize atmospheric concentrations of GHGs—is in this sense the overriding priority of international climate policy. Political considerations of equity, efficiency and so on must take second place to this priority; there would be little point in implementing a politically feasible approach that isn’t up to the environmental job in hand. (Evans and Simms 2002, 5)
The remaining 50 percent is made up of economic efficiency, counting for 18 percent, technicalapplicability for 8 percent, and political acceptability for 24 percent of the maximum score. On that basis, which of course is open to scientific debate and criticism, Lutz Wicke makes a comprehensive evaluation of the Kyoto Protocol and of the GCCS.
Criterion 1: Climate sustainability
To start with the paramount criterion of climate sustainability or effectiveness, the important question here is whether, if the climate-protection targets laid down in the system in question are implemented,
Figure 1. CO2 emission levels needed to achieve atmospheric concentrations between 450 and 750 parts per million (ppm), compared with IEA emission forecast to 2030
Source: For stabilization paths at various levels, WRI (1998), based on IPCC (1995, 10, figure 1b) and on results of Wigley, Richels, and Edmonds (1995). For the IEA emissions forecasts, IEA (2004).
Note. According to figure 6-1 and table 6-1 of IPCC (2001), the 550 ppm stabilization curve peaks between 2020 and 2030 and drops to a level below the 1990 value between 2030 and 2100. However, this represents the 550 ppm CO2 equivalents of all GHGs and sources. The 650ppm CO2 equivalents stabilization curve which comes closer to the EU's 550ppm CO2
stabilization target (which is solely based on CO2 emissions), peaks between 2030 and 2045 and falls to below 1990 emission levels between 2055 and 2145. This is also reflected by the abovementioned WRI stabilization curve on the basis of the IPCC's Second Assessment Report (IPCC 1995).Thus the WRI 550ppm curve (largely) corresponds to the 650ppm IPCC stabilization curve.

Vol. 6, No. 1 International Review for Environmental Strategies 2006
68
the climate goals will be reached. As far as the weighting of the nine sub-criteria under this criterion (shown in table 1) is concerned, it must be noted that because most of them were taken directly from the sources cited above, they sometimes evaluate similar effects. This is why some very important sub-criteria (for instance, those regarding the opportunity to fully and actively include developing countries in the global climate-protection system) appear in at least three sub-criteria. To compensate for this, the weights of the relevant sub-criteria (in this example, 1, 3, and 4) have to be summed up. Also, the incentives and compulsions of all countries and GHG emitters for climate-friendly behavior are so important that they are counted in several different sub-criteria.
Especially in this paramount criterion, it can be shown that the Kyoto Protocol commitment system, based on negotiated commitments of only Annex I countries and with no greenhouse-gas-relevant commitments at all among developing or newly industrialized countries, is structurally unable to “do its environmental job in hand,” to produce climate stability.
As can be seen in table 1, the Kyoto Protocol performs extremely poorly (scoring only 4 points out of a total 22) against the first four sub-criteria. These are taken directly from demands by the IEA (Philibert and Pershing 2002), thus including the most important US and other literature, and the positions of IEA’s Standing Group on Long-Term Cooperation and of the expert group of the Annex-I states (IEA and OECD 2002, 3). The scores given for each sub-criterion are explained below.
Sub-criterion 1: There exists virtually no general incentive in the regulations of the Kyoto Protocol for developing countries to reduce the increase of their CO2 emissions (0 points out of 4).10
Sub-criterion 2: Deplorably, the second sub-criterion of the IEA for a successful climate-protection system— additional action to stop the rise in developed countries’ aggregate emissions (Philibert and Pershing 2002, 40), preferably by “permanent incentive/compulsion for substantial reduction measures in developed industrialized countries whose aggregate emissions continue to rise,” (ibid., 40)—is fulfilled by the Kyoto Protocol only to a very limited extent; only the Annex I countries that have ratified the Protocol have a legally binding commitment.
As shown above, on balance, those countries will not meet that objective. Even the EU will not meet its commitments or will do so only, if at all, with the help of some JI or CDM projects and mainly by buying “hot air” (see note 6 above). The Marrakech compliance and sanctions modalities under article 18 of the Kyoto Protocol for non-complying countries (UBA 2003) seem to be pretty dull weapons.11
Taking into account the fact that nearly all industrialized countries are almost certain to fail to meet their commitments, a score of 3 out of 10 is rather optimistic for this sub-criterion.
10. The very small incentives supplied by financing of CDM projects are evaluated under sub-criterion 5. 11. An example is the threat of a reduced assigned amount of emission allowances in the following commitment period, by a
“reparation factor” of 1.3 times the amount by which a country misses its target in the current commitment period. This is hardly effective now because in 2006 nobody can really predict whether there will be a second commitment period or what modalities a second commitment period would have.

Vol. 6, No. 1 Beyond Kyoto 2012: A global cap-and-trade scheme 2006
69
Table 1. Evaluation of the climate sustainability of the Kyoto Protocol and the GCCS
Actual score Paramount criterion (50 points): Ensuring that with the help of the international climate-protection system, the concentration of CO2 in the atmosphere does not exceed the EU’s minimum level of 550 ppm on a permanent basis. (Are the rules agreed to in the contract and adhered to?)
Maximumscore
KyotoProtocol GCCS
Sub-criteria for securing the main criterion:
1. General incentive to reduce the increase in CO2 in developing countries 4 0 4
2. Incentive/compulsion for fast, substantial reductions in industrialized nations 10 3 7
3. Fastest possible involvement of developing countries 4 0 4
4. Financing emission reductions in developing countries 4 1 4
5. Encouraging early action worldwide 4 0 4
6. Avoidance of emission shifting (leakage) effects 4 0 4
7. Permanent interest in climate-friendly behavior worldwide 10 0 10
8. Quantified climate protection aim of the climate system 6 0 6
9. Avoidance of "hot air" worldwide 4 0 2
Total 50 4 45
Source: Based on Wicke 2005, 38
Sub-criterion 3: From the very beginning, developing countries categorically refused to take part in the Kyoto Protocol commitment system, mainly because of much smaller per capita emissions and income and also because of the “historic emission guilt” of the industrialized countries. As noted above, the failure of the industrialized countries to take the lead and meet their initial commitments makes it even more unlikely that developing countries will be willing to be integrated into that commitment system (0 points out of 4).
Sub-criterion 4: Philibert and Pershing (2002, 40) rightly demand that “solutions must be found to finance emission reduction costs, particularly in the developing world” because “GDP levels projected for developing countries imply that capital resources to reduce emissions will be extremely scarce.” The financial assistance mechanisms outlined in article 11 of the UNFCCC and in the Kyoto Protocol are inadequate compared with the huge capital needed even to slow CO2 emission growth in developing and newly industrialized countries. Above that, some additional emission-reduction measures can be financed by foreign investors within the scope of the extremely complicated CDM to meet the obligations resulting from their countries’ commitments under the Kyoto Protocol. But this mechanism again can bring only a very small contribution to the huge costs of financing emission reductions in developing countries. Hence the score of 1 out of 4 for the fourth sub-criterion again is very optimistic.
The fifth to ninth sub-criteria are taken directly from the literature, especially from a literature summary by Höhne et al. (2002). Lamentably, the Kyoto Protocol also cannot fulfill these sub-criteria, and hence scores 0 for each of them.
Sub-criterion 5: Early action in developing and industrialized countries is not encouraged by the Kyoto Protocol. As long as reducing emissions is more costly than not doing so, the Kyoto mechanisms

Vol. 6, No. 1 International Review for Environmental Strategies 2006
70
actually promote late action in these countries, and even more so in non-committed developing and newly industrialized countries (0 points out of 4).
Sub-criterion 6: There is no “avoidance of emission shifting (leakage) effects” (sub-criterion 6) through the Kyoto Protocol. On the contrary, industrialized countries in principle can comply with their commitments (of reduction or limiting their CO2 emissions) by shifting their highly emitting industry to non-committed developing countries. There are even incentives for such behavior for countries that are “taking their Kyoto commitments seriously”! (0 points out of 4)
Sub-criterion 7: Because the Kyoto Protocol is based on commitments and not on a market-oriented incentive system, CO2 emission remains free of cost worldwide. Thus the Protocol does not stimulate permanent interest on the part of all states and economic players worldwide in contributing to climate-friendly behavior and minimizing CO2 emissions. There may be some tiny incentives to adopt more climate-friendly behavior by way of the flexible mechanisms of the Protocol and of the EU Emissions Trading System, but as long no state or group of states really cares about compliance with their commitments, these mechanisms have no significant effect on CO2 emissions at the global scale. It must be admitted that some spectators who have high confidence in the willingness of Annex I states to comply with their commitments may evaluate this very important sub-criterion higher than the 0 out of 10 points given by the—at this point—pessimistic author.
Sub-criterion 8: Evidently there exists no clear link between the climate-protection system in place and a targeted, quantified climate-sustainability/CO2-stabilization goal (Höhne et al. 2002). Besides the overall 5.2 percent reduction target of Annex I states, there exists no overall global emission or GHG concentration target whatsoever (0 points out of 6).12
Sub-criterion 9: Finally, the European Commission’s World Energy, Technology and Climate Policy Outlook (European Commission 2002) demonstrates that there exists at least 1.5 billion tons of “hot air” in the current Kyoto commitments. Every new commitment period negotiation can be expected to produce new “hot air”. This is because the interest of each party would be to obtain a commitment that can be easily fulfilled, in order to be able to sell unused assigned amounts for a profit. Such a bargaining result cannot be blocked as long the rule requiring decisions to be unanimous is in place! Hence a score of 0 out of 4 for the last sub-criterion.
Thus the Kyoto system scores a very sobering 4 points out of 50 for climate sustainability or effectiveness —far below even a “poor” result, and therefore completely inadequate!
Criterion 2: Economic efficiency
The Kyoto Protocol scores slightly better in terms of the second criterion, economic efficiency, as can be seen in table 2. In the overall evaluation score of 100 points, this criterion accounts for 18 points. It should be noted that economic efficiency also plays an important role in political acceptance, and is thus included in evaluation of that criterion too (see table 4). The various economic criteria and sub-criteria
12. The UNFCCC’s objective of preventing dangerous interference with the climate system was never officially quantified by the
Conferences of the Parties, unlike the EU’s target of +2°C or its now outdated second target of a maximum atmospheric concentration of 550 ppm CO2.

Vol. 6, No. 1 Beyond Kyoto 2012: A global cap-and-trade scheme 2006
71
of Philibert and Pershing (2001), Höhne et al. (2002), and Böhringer and Welsch (1999) have been merged into four sub-criteria. The scores assigned under each are explained below.
The first two sub-criteria are cost-efficiency (minimizing global costs), and flexibility during national implementation (minimizing national costs) and financial assistance for development countries. The JI, emissions trading, and CDM flexible elements, supplemented by the EU Emissions Trading System, contribute, with overall low (climate-based) requirements, toward cost-efficiency and financing. Therefore these two sub-criteria are both given scores of 2, out of 6 and 5 points respectively.
The third sub-criterion takes into account structural differences in climate-related requirements. Because developing countries and transition countries are not subject to any targets, and because there are only very low and differentiated (climate-based) commitments for industrialized countries, the structural differences of various countries are recognized to a high degree within the Kyoto Protocol, which thus receives 3 out of 4 points for this sub-criterion.
Because the commitments of the industrialized countries are quite low, the potential positive (growth) impetus for an energy- and cost-saving restructuring of the various national economies of industrialized states, as well as for developing countries through CDM measures, remains low (1 out of 3 points for sub-criterion 4).
Overall, the economic efficiency of the Kyoto Protocol is evaluated at 8 points out of 18.
Criterion 3: Technical applicability
Technical applicability also plays an important role in the implementation capability of a system. This criterion accounts for 8 points out of the total 100. This criterion and its sub-criteria are evaluated in table 3.
Only Höhne et al. (2002) provide data and references on this criterion. The following issues are mentioned there: compatibility with the UNFCCC and the Kyoto Protocol, and moderate political and technical requirements in the negotiating process (simple approach, low number of decisions, data, and
Table 2. Evaluation of the economic efficiency of the Kyoto Protocol and the GCCS
Actual score Economic efficiency (18 points): Minimizing adverse economic effects and promoting positive economic impetus whilst implementing the climate-related goals of the climate-policy instrument examined.
Maximumscore
KyotoProtocol GCCS
Sub-criteria for securing the main criterion:
1) Cost-efficiency: Minimizing global costs 6 2 6
2) Flexibility during national implementation (minimizing national costs) and financial assistance for development countries
5 2 4
3) Taking into account structural differences in climate-related requirements 4 3 3
4) Positive economic (growth) impetus 3 1 2
Total 18 8 15
Source: Based on Wicke 2005, 38.

Vol. 6, No. 1 International Review for Environmental Strategies 2006
72
calculation methods available). These aspects are certainly important for the negotiation process. They are, however, certainly not exclusively technical applicability criteria. The following sub-criteria are therefore defined for this criterion: easy applicability of elements, and capacity to implement and check adherence to the rules in order to achieve climate sustainability and avoid fraud and corruption.
The first sub-criterion is fulfilled completely (4 out of 4 points). If one looks into the extremely high and complicated prescription of the Marrakech Accords about the functioning of the Kyoto Protocol and its supervision, one sees that its application is not easy; nevertheless it has been successfully set in operation. Therefore the Kyoto Protocol scores 3 out of 4 points for sub-criterion 2, giving 7 out of 8 points for technical applicability.
Table 3: Evaluation of the technical applicability of the Kyoto Protocol and the GCCS
Actual score Technical applicability (8 points): Do the structure and individual elements of the system meet the requirements of easy technical applicability? Maximum
scoreKyoto
Protocol GCCS
Sub-criteria for securing the main criterion:
1) Ability to fit into the international climate-protection system and the negotiation process
4 4 3
2) Easy applicability and control capability in order to ensure practical functioning
4 3 3
Total 8 7 6
Source: Based on Wicke 2005, 3.
Criterion 4: Political acceptability
The fourth criterion, which is the second most important with a weight of 24 out of 100 points, is political acceptability of the climate-protection system. Unlike the climate sustainability criterion, the decisive question for the political acceptance criterion is just how likely is it that the system will be accepted in international climate-protection negotiations, leading to the signing of an agreement.
Höhne et al. (2002, vii), writing for the environmental consultancy ECOFYS, give the following—largely acceptable—political criteria: equity/fairness principles (are the three equity principles of need, capability, and responsibility covered?), and agreement with fundamental positions of all major constituencies. The latter issue seems to be somehow problematic, because only if a climate-protection system does not demand serious effort by all parties can it be acceptable for all major constituencies from the very beginning.
Despite the principle of unanimity in international climate-protection treaties and negotiations, one should not rule out from the very beginning the possibility that conceivable (large) majorities in favor of certain further-developed or new climate-protection systems could in fact lead to unanimous acceptance. This holds true not least because the negotiating process and compromise (as well as international

Vol. 6, No. 1 Beyond Kyoto 2012: A global cap-and-trade scheme 2006
73
pressure on countries that refuse at first) could make many initially inconceivable proposals acceptable for all states.
Taking into consideration the lengthy negotiating process that will be necessary during the first commitment period of the ratified Kyoto Protocol, the further-developed Kyoto Protocol (second commitment period) or an alternative climate-protection concept will not come into effect before the year 2013. The second ECOFYS political criterion is hence broken down into two sub-criteria: acceptance by all key players (and groups of players), and acceptance by the largest possible number of contracting states.
These sub-criteria, together with two sub-criteria to give a more detailed analysis of the equity principles described by Höhne et al. and others, are shown in table 4.
Table 4. Evaluation of the political acceptability of the Kyoto Protocol and the GCCS
Actual score Political acceptability (24 points): Does the climate-protection system comply with the principles of equity and how likely is it that it will be accepted by all or a majority of the contracting states?
Maximumscore
KyotoProtocol GCCS
Sub-criteria for securing the main criterion
Fulfillment of the equity principles
1) Promotion/non-prevention of sustainable development 5 3 4
2) Stronger burden on industrialized nations bearing main responsibility and capable of bearing more burdens
5 3 5
Political acceptability
3) Acceptance by all key players (and groups of players) 5 4 3
4) Acceptance by the largest possible number of contracting states 9 8 6
Total 24 18 18
Source: Based on Wicke 2005, 39.
The Kyoto Protocol fulfills the two equity sub-criteria only around 60 percent. On the one hand, there are relatively few incentives for sustainable development, both in industrialized and in developing countries; on the other hand, the climate-related requirements and commitments of industrialized states are in total very low.
As for the political acceptability of the Protocol, it was originally signed in Kyoto, though it was quickly rejected by the US administration (and the Australian). On balance, then, the political acceptability of the Kyoto Protocol is quite high, and scores 18 points out of 24.
The result of this evaluation of the existing Kyoto system—a score of only 37 out of 100—sends a very depressing message: the existing Kyoto system is, according to the English scoring system (see Wicke 2005, 15), “poor” or even a “complete failure”.
Interested readers can read the appendix to this article for a much more detailed discussion of the structural deficits of the Kyoto Protocol.

Vol. 6, No. 1 International Review for Environmental Strategies 2006
74
4. Structural evolution towards a global cap-and-trade scheme
The preceding sections have constituted an unofficial review of the Kyoto Protocol in advance of the official review, which is to be initiated in 2005 according to articles 3.2, 3.9, 13.4.a, and 13.4.b of the Protocol. According to article 9.1, the Conference and Meeting of the Parties must take “appropriate action” if the official review findings are as poor as those of our review, as they inevitably must be. In Wicke’s book (2005), all major proposals for an incremental evolution (Berk and den Elzen 2001) summarized and described by Höhne et al. (2002) are awarded—because of the same or similar structural deficits—a similarly poor score. Therefore, in order to actually prevent dangerous interference with the climate system, there must be a substantial structural change and reformation, leading to a new beyond-Kyoto-2012 system.
After evaluating all the major proposals, Wicke (2005) demonstrates that an effective climate-protection system can be achieved only by expanding the existing flexible Kyoto mechanisms to a global cap-and-trade scheme. These mechanisms are: emissions trading between ratifying Annex I countries; JI; the CDM; and the additional EU Emissions Trading System, which comes into operation in 2005.
World economic leaders, members of the Climate Change Roundtable of the World Economic Forum recently made a similar urgent call for a global cap-and-trade scheme:13
The current “patchwork” scheme of regulatory, financial, and technology incentives that has evolved in various parts of the world is not conducive to a cost-effective and efficient approach to the problem of climate change. The difficulty is exacerbated by the short term nature of the Kyoto Protocol and related policy mechanisms whose targets and timetables do not extend beyond 2012. For an investor seeking to gain a fair return on low capital projects whose life cycle may often be in the 25–60 year range (e.g. power plants), the level of risk can become a significant disincentive. The same kind of uncertainty clouds the future value of tradable . emission credits and the value of investment in low carbon infrastructure in emerging markets. …
For these reasons, we urge the G8 governments to
establish a long term, market-based policy framework extending to 2030, that will give investors in climate change mitigation confidence in the long term value of their investments. Establishing indicative signals extending to 2050 would also be beneficial.
Ensure that the policy framework is global in scope—utilizing a coordinated and consistent set of national or regional regimes, with maximum fungibility between regimes, and opportunity for future consolidation into a single regime.
Define greenhouse gas emission rights through a cap-and-trade system or other market-based mechanisms that can be adjusted over time to reflect evolving scientific, technological and/or economic developments and that will help shape consumer choices.
Address climate change as part of an overall sustainable development agenda, putting in place mechanisms which address the challenges of poverty, energy, and economic growth in
13. The members of the roundtable represent 24 top-level international corporations—ABB, Alcan, BP, British Airways, BT,
Cinergy, Cisco Systems, Deloitte, Deutsche Bank, E.ON, EADS, EdF, Eskom, Ford, HP, HSCB, Petrobas, RAO UESR, Rio Tinto, Siemens, Swiss Re, Toyota, Vattenfall, and Volkswagen—in collaboration with the government of the United Kingdom.

Vol. 6, No. 1 Beyond Kyoto 2012: A global cap-and-trade scheme 2006
75
emerging markets while mitigating greenhouse gas emissions.” (World Economic Forum 2005, 3. Emphasis by the authors.)
Up to now, two such global cap-and-trade schemes have been proposed. The first is the contraction-and-convergence (C&C) approach from GCI (1999) and Meyer (2000), strongly backed by Wissenschaftlicher Beirat der Bundesregierung Globale Umweltveränderungen, the Scientific Advisory Board of the German Federal Government for Global Environmental Changes (Graßl et al. 2003). The second approach, which has been elaborated in much more detail to the stage of “general application maturity,” is presented by Wicke (2005) in the form of the Global Climate Certificate System.14
Both of these schemes, which involve structural evolution of the existing Kyoto Protocol, have in principle at least an unquestionable advantage over all incremental-evolution approaches: with cap-and-trade schemes—if they are properly implemented—the paramount criterion of preventing dangerous interference with the climate can be achieved, because they include a clear-cut emission cap set expressly to prevent dangerous climate change. This is one important reason why these two schemes score much higher than the Kyoto system (Wicke 2005; see also section 6 below and tables 1 to 4 for evaluation of the GCCS). Global cap-and-trade schemes should be the preferred approaches for future climate negotiations.
5. Brief description of the GCCS
A clear definition of how to avoid “dangerous interference with the climate system” in terms of maximum temperature rise or GHG concentration (which could be readjusted over time and with new scientific knowledge) is essential for successful international negotiations. For all negotiators, it clarifies from the outset what is globally needed and what should be the outcome of the negotiations. Without this, the negotiators immediately lose sight of the stabilization target. If negotiations for the future climate-protection system are not based on a global emission target, as was the case with the current Kyoto Protocol, and again focus only on commitments to limit or reduce CO2 emissions by developed and—hopefully—some developing countries based on their past emission levels, the commitments and limitations will once again be without any real connection to the overall stabilization target and the maximum annual global emissions with which it can be achieved. In this article, the authors can give only an overview and quick evaluation of the GCCS global cap-and-trade system developed in great detail by Wicke (2005).15 In 1996 (before the Kyoto negotiations), the EU became the first, and up to now the only, political entity to define clearly the conditions that would lead to dangerous anthropogenic interference with the climate system: if global temperature increase cannot be stabilized by 2100 at a level below 2°C above the pre-industrialized level; and if the concentration of CO2
becomes higher than “well below” 550 ppm. According to the majority of climate scientists (for example, Hare and Meinshausen 2004) and NGOs, the second target is far too high to achieve the first
14. Recently, an improvement of the C&C proposal has been put forward, called “common but differentiated convergence”, in
Höhne et al. (2005). 15. A four-page summary cannot, of course, adequately reflect nearly 200 pages in Wicke (2005), with a lot of complicated
questions and answers. Interested readers should read the relevant sections of the book, starting on page 115.

Vol. 6, No. 1 International Review for Environmental Strategies 2006
76
target. But even this concentration target will be very hard—in fact nearly impossible—to achieve, as demonstrated below.
In its World Energy Outlook for 2004, the IEA compared the CO2 emissions of its projected “reference scenario” (that which is most likely to come about given current trends) up to 2030—38.2 billion tons annually, a rise of 90 percent since 1990!—with the best achievable alternative CO2
emission scenario, which could be realized if all major CO2-emitting countries and regions (including developing and emerging countries) do their very best and fully implement policies and measures to reduce CO2 emissions, or at least slow the rate at which they are increasing.16 This would result in emissions of around 31.5 billion tons by 2030. If all new fossil fuel power plants in OECD countries from 2015 onwards were equipped for carbon-capture and subsequent safe-storage facilities (at a cost of around US$50 per ton of CO2), the emissions could be reduced further to around 30 billion tons (IEA 2004). This is the maximum amount of CO2 emissions that would still allow stabilization at 550ppm CO2 concentration, as computed by the IPCC (see figures 1 and 2).
A global cap-and-trade system with a strict emissions cap and worldwide incentives for climate-friendly development is the only way to ensure that countries implement adequate policies and measures so that the EU's maximum concentration level is not exceeded, and that the most cost-effective solutions are found. The stabilizing line for 550 ppm in figure 2 shows how much CO2 per annum can be emitted globally (the area below the 550 ppm curve).17 On the basis of the second EU objective, a temperature rise of no more than 2°C, GCCS can be divided into eight main elements, which are discussed below.
1. Global CO2 emissions, and therefore the cap maximum, are fixed as of 2013–5 at around 30 billion tons for at least 50 years. Since this amount is almost equal to future emissions as of the year 2015 (according to the IEA), there will be no global shortage in the beginning. The annual allowance of 30 billion tons of CO2 is represented by 30 billion climate certificates (CCs) (see figure 2).
16. These enormous but necessary efforts by all major groups of countries are listed in IEA (2004). 17. The figures given here only illustrate a conceivable compromise between industrialized and developing countries after long
negotiations about the GCCS.

Vol. 6, No. 1 Beyond Kyoto 2012: A global cap-and-trade scheme 2006
77
2. The fairly limited number of countries directly importing or domestically producing fossil fuel (fuel and resources providers, or FRPs) require a sufficient number of CCs in order to cover CO2 emissions resulting from their trading of fossil fuel products. Unlike the EU Emissions Trading System, the GCCS starts at the first level of trading—that is, at the level of domestic FRPs, who are the sources of subsequent CO2 emissions. This constitutes a significant simplification of the emissions-trading system, because all upstream sources of CO2 emissions (industry, traffic, commerce, trade, and services, as well as the household sector) are thus included. (The costs for the CCs will be passed on to the buyers of the fossil fuels at all selling stages.) This is termed an upstream regime, and is described and discussed at length in the literature, as well as being one of the basics within the two studies of Lutz Wicke for the Ministry of Environment of the German federal state of Baden-Württemberg (Wicke and Knebel 2003a, 2003b), which are summarized in his Beyond Kyoto book (Wicke 2005).
3. The CCs, valid only for the year of their distribution, are at first distributed annually free of charge to all states (and national CC banks, or NCCBs) on the basis of the generally fair distribution scheme of “one person, one climate emission right”—that is, in proportion to the country’s population during a certain fixed reference year.18 Taking the global population of 6.1 billion in 2000 as the basic population figure, these CCs would represent 4.9 tonnes of CO2 per capita—for example, 400 million tons for Germany; for the United Kingdom and for France, 290 million tons; for the USA 1.39 billion tons; and for India 4.9 billion tons. Developing countries would be able to sell their surplus CCs.
18. This equal per capita distribution key is based on proposals both from India and Pakistan (Agarwal 2000; Agarwal and Narain
1998; Aslam 2002. Note that since August 2004, Mr Malik Aslam has been the minister for environment of Pakistan). Former Indian prime minister Shri Atal Bihari Vajpayee advocated this distribution key in his closing address at the ninth Conference of the Parties in New Delhi at the end of 2002 (frequently quoted in the press after this conference). Mr Vajpayee certainly also spoke for the vast majority of developing countries when he commented on the prospects for achieving climate sustainability: "We don't believe that the ethical principles of democracy could support any norm other than that all citizens inthe world should have equal rights to use ecological resources!"
Figure 2. Comparison of emissions 2000–2250 needed to stabilize atmospheric CO2
levels at 550ppm with projected actual rise of energy-related CO2 emissions 2000–2030
Sources: As for figure 1.

Vol. 6, No. 1 International Review for Environmental Strategies 2006
78
Industrialized countries could buy CCs in order to continue producing and/or consuming as before. However, under this scheme, emitting CO2 would, for the first time, no longer be free of charge. 19
Special assistance could be provided within the GCCS to least-developed countries with small populations (and possibly higher per capita CO2 emissions as a result), as these are particularly vulnerable to the adverse effects of climate change and may not get enough surplus transfer to support climate-friendly development and adequate preparations for the effects of dangerous climate change. The Arctic and Antarctic regions would also need special considerations (Wicke 2005).
4. On a global scale, this would create an enormous incentive for sustainable development. By implementing the GCCS, developing countries would be able to sell large quantities of CCs over several years whilst industrialized countries would have to buy (expensive) CCs. But this textbook type of cap and trade would lead to annual multi-billion dollar or euro transfers from industrialized to developing countries. This, in turn, would lead to unacceptable disruption of the world economy. This huge prima facie problem was the reason why the basic idea proposed by India and Pakistan was widely dismissed from the start by Western authors (for example, Michaelowa et al. 2003), without any attempt to develop it into an implementation plan.
Notwithstanding that position, to have a good chance of acceptance by an overwhelming number of states, the GCCS must guarantee at least three conditions:
The transfer sum between industrialized and developing countries must be limited to an acceptable level—but still giving enough incentives for developing countries to participate in the GCCS
There must be a guarantee that FRPs get a basic CC supply with moderate prices—but still have enough incentive to limit and reduce CO2
There must be guarantees against runaway prices on the CC market
This is why the GCCS requires a clear-cut division of markets, as follows:
5. There would be a market for transfer of CCs between states. Via a World Climate Certificate Bank (WCCB), developing countries would (have to) sell their surplus CCs for US$2 per CC to industrialized nations. On the basis of the total amount of CCs (based on the countries’ population as of 2000) allocated free of charge to the NCCBs, plus the CCs returned by developing countries (obligatory CC-surplus re-transfers at US$2), the NCCBs of industrialized countries would allocate CCs to their FRPs on the basis of their demand for the previous year. The FRPs thus would receive a reasonable basic supply. If the US$2 price of the CCs were passed on to consumers, this would add around US$0.005 to the price of a liter or US$0.02 of a gallon of petrol. Of course, there must and can be an efficient system of supervision of all the allocated and marketed CCs, such as that described in detail by Grubb et al. (1998) defining the principles, modalities, rules and guidelines for verification, reporting and accountability for GHG emissions trading. No NCCB of a developing country would be allowed to sell CCs on the free market nor to allocate to the FRPs more than a well-defined number of CCs (an FRP’s demand for fossil fuel sales during the previous year plus a
19. In principle, NGOs both on the environmental and on the development aid side are backing a certificate or cap-and-trade
solution for the fight against dangerous climate change (see BUND and Misereor 1996).

Vol. 6, No. 1 Beyond Kyoto 2012: A global cap-and-trade scheme 2006
79
national CO2 growth margin). For more information on these important details, see Wicke (2005, sections VI.E. to VI.H).
6. There would also be a free CC market between FRPs. FRPs would have to buy additional CCs if they wished to sell more fossil fuels and resources than in the previous year (for example, due to expanding business) and if this demand were not covered by their basic supply of CCs, as shown in number 5 above. Since developing countries have per capita emissions far below the global average, their (hopefully climate-friendly) development cannot and should not be restricted. Therefore, developing countries would get more CCs according to their economic growth, and the re-transfer of surplus CCs to industrialized nations would anyway decline over the course of time.
In order to prevent runaway CC prices on the free market, the WCCB would sell—by an official market intervention—a sufficient quantity of CCs at an initial free-market price of US$30 per CC. This would establish a price cap on the free market (proposed by Aldy, Orzag, and Stiglitz 2000) and would prevent any overburdening of economies and consumers worldwide. This price cap and the transfer price would be raised every 10 years in order to boost incentives for climate-friendly action on a global scale.
Such a hybrid system, based on free trading of CCs with a price cap, combines “the best features of an emission tax and a pure permit system” (Aldy, Orzag, and Stiglitz 2001, 25). There remains the ecological problem that the WCCB, over the course of time, might sell more CCs than are compatible with the intended emission cap of 30 billion tons of CO2 yearly. This problem could be—to a certain extent—compensated by purchases of CCs by the WCCB if the price sinks below the price cap. Despite these concerns, such a price cap, or “safety valve” is essential to make the GCCS acceptable to industrialized countries and their businesses, which otherwise could quite realistically fear serious harm to their economies by skyrocketing prices of CCs.20
7. Developing countries could only use the revenue from their sales of surplus CCs to finance measures for climate-friendly sustainable development and elimination of poverty, in line with plans (including climate change adaptation measures) that are developed on a national level and approved on a supra-national scale—thus avoiding fraud and corruption to the highest possible degree. This condition is essential to make the GCCS acceptable to the fossil fuel and resources consumers from industrialized nations who may offer transfer financing. Besides the important humanitarian and development reasons, this would ensure that transferred money was used also in the these countries’ interests, because with sustainable development, the rise in use of CCs by developing countries would be slower, leaving more for the industrialized countries.
8. Efficient measures to supervise and control the amounts of fossil fuels and resources sold according to a simplified IPCC reference system, and to protect against fraud and corruption in implementing
20. “It is worth emphasizing that the safety valve is not intended to set an inefficiently low carbon price over time. Indeed, the
safety valve may allow a higher price of carbon than would be otherwise be the case, because it provides assurance that the costs will not exceed that level. Risk-adverse households and firms may therefore be willing to tolerate a higher price for carbon under the safety valve approach than they would be willing to tolerate under a pure quantity-based approach.” Aldy, Orzag, and Stiglitz (2001, 26).

Vol. 6, No. 1 International Review for Environmental Strategies 2006
80
measures and programs for sustainable development and elimination of poverty, would guarantee correct implementation of the GCCS both in industrialized and in developing countries.
Figure 3 shows how all of these elements interact. As already noted, chapter VI of Wicke (2005) describes all the key elements in such detail that the author considers the GCCS to be in a condition generally ready for application.
The GCCS largely satisfies and embodies almost all of the important wishes, apprehensions, and constructive proposals of both industrialized and developing countries relating to flexible mechanisms within the Kyoto Protocol that are reported in the literature. The GCCS would, of course, be modified in many respects during the course of potential international negotiations up to the years 2010–12.
6. A short evaluation of the GCCS and comments on its chances of implementation
Everybody knows that whatever efficiency improvements we aspire to in a post-Kyoto-2012 global climate-protection system, they will be extremely difficult to obtain, because of the unanimity principle in international treaties. But there are several reasons why GCCS has a relatively good chance of being implemented. These are discussed below.
As can be seen in tables 1–4, the GCCS earns altogether 84 points out of 100, an excellent score, especially because it fulfills all the sub-criteria of climate effectiveness or sustainability nearly completely (see table 1). In this article there is not room to explain in depth the rationale for the individual scores given to the GCCS, but this is done in Wicke (2005). That book also discusses all of the main arguments and criteria for evaluating the prospects of success of different climate-protection schemes (Wicke 2005, 11ff.) put forward in the literature (for example, Höhne et al. 2002; IEA and OECD 2002; Philibert and Pershing 2002). However, for a fair and unbiased evaluation of the GCCS and its prospects of implementation, the following issues are important:
1. The GCCS is an upstream system that exactly fulfills a central requirement of the 2002 Environmental Report by the Rat von Sachverständigen für Umweltfragen (RSU; German Council of Environmental Advisers): "What would be desirable both from an ecological as well as from an economic point of view is a strictly quantity-related trading system with the largest possible international basis which involves all emission sources and which is based on the first trading level." (RSU 2002).21 By addressing the interests of all countries to the greatest extent possible, while also achieving the EU's climate stabilization target, GCCS is in principle also feasible in political terms. (The question of acceptability of the GCCS to the United States is discussed in nos 7 and 8 below.)
2. The climate community can be sure that the GCCS would prevent dangerous climate change—or at least achieve the EU’s ambitious but still realistic 550 ppm CO2 concentration target—without dangerous disruption of the global economic system. (Under realistic assumptions—in a GCCS-plus -target version—it could even lead to achievement of the EU’s original target of a maximum temperature rise of 2°C; Wicke 2006, section VIII.E.) It would involve only:
21. In fact, the GCCS requires no strict cap (see Wicke 2005, chapter V).

Vol. 6, No. 1 Beyond Kyoto 2012: A global cap-and-trade scheme 2006
81
Moderate price increases at the beginning of implementation, rising gradually to achieve the necessary climate efficiency;
Still-acceptable amounts of transfer payments to developing countries (financed by fossil fuels users, not by states or taxpayers!); and
No overburdening of the users of fossil resources through high CC prices, because of the price cap.
3. The GCCS also includes an important component in that it would include developing countries for the first time in a global climate-protection scheme by its implementation of the excellent idea of equal per capita emission rights. As their per capita emissions are currently lower than the average in industrialized countries, developing countries could and should use their CCs to generate revenue. With the requirement that such revenues be used for sustainable development and poverty elimination, the GCCS simultaneously encourages climate protection and positive national development, avoiding the “eco-imperialism” often feared by developing countries under the Kyoto commitment system.
4. There should, therefore, be a good chance that a pro-GCCS movement will grow up among some developing countries, especially in South Asia, which first proposed the basic principles that the GCCS is based on. The GCCS concept could certainly be endorsed by many other countries. It should, hence, go without saying that developing countries in particular can and should mount a campaign for the GCCS or a modified form thereof.
5. Such a campaign could lead to a completely changed battle order within the Conferences of the Parties: instead of developing countries being (extremely) critical of present international efforts to prevent dangerous climate change, they could become the driving force. This, in turn, would provide, at the outset of the negotiation process, a two-thirds majority in favour of structural evolution of the Kyoto Protocol into a global cap-and-trade scheme.
6. There even seems to be a good chance that the United States, after intensive negotiations, could accept the GCCS. The GCCS was developed under the premise that it is completely counter-productive (and, even worse, arrogant) to negate the criticism of the Kyoto Protocol in the United States. The main US criticisms were that the emissions from strongly growing economies of developing countries might outweigh potential efforts on the part of the United States in the climate sector and that the US economy might suffer serious harm if action by the United States and other industrialized countries was not matched by similar action from developing countries. These cannot be dismissed as irrational, even if one is critical of the resulting US policy.

Vol. 6, No. 1 International Review for Environmental Strategies 2006
82
Figu
re 3
. Ope
ratio
n of
the
Glo
bal C
limat
e C
ertif
icat
e S
yste
m
Sour
ce: W
icke
200
5, 2
11.

Vol. 6, No. 1 Beyond Kyoto 2012: A global cap-and-trade scheme 2006
83
For this reason, these and other points arising from US political and scientific discussions are explicitly taken into consideration in the design of the GCCS. There will be no “inconsistent exemption for Developing Countries Parties” nor “serious harm to the United States economy” (US Senate 1997), and there will be no runaway prices for CCs and only a moderate rise in the prices of fossil fuels. The GCCS system is the most efficient system conceivable that still ensures maximum business compatibility.
Thus, the GCCS imposes upon the United States the lightest burdens possible while also demanding the smallest possible degree of change in order to achieve climate stabilization. It is greatly in the interests of the United States to avoid the growing dangerous consequences of accelerated climate change, like the possible halt of the Gulf Stream (a real possibility, not just a fictional “Day After Tomorrow”!) Even the energy-intensive American Way of Life will, under the GCCS, not be forbidden or even restricted under stringent directions or instructions, though it will be more expensive. Therefore, energy saving through more climate-friendly behavior by individuals and businesses, by the use of more energy-efficient vehicles and household and other appliances, and by the better insulation of buildings will be much more worthwhile in the United States and in other countries around the world than it is in the present!
7. The global cap-and-trade scheme also has relatively good chances of international acceptance because, unlike the Kyoto I commitment strategy, it imposes no specific reduction limits on single countries or groups. As Kyoto I has shown, many Annex I countries like the United States, Australia, and (nearly) all newly industrialized and developing countries, are unable and/or unwilling (very probably permanently!) to accept distinct individual (reduction or capping) commitments. In addition to that, many of the committed Annex I states are unable to comply even with their very limited commitments in the first commitment period. A global cap and trade system puts tasks of reduction and capping on the market, not on individual governments—by way of international incentives!
7. Conclusions
Given the arguments above and the findings of comparisons of the GCCS with the most important proposals so far made for the incremental evolution of the Kyoto Protocol and the two most important proposals for its structural change (Wicke 2005, 29ff.), the authors are convinced of the following conclusions:
Should it be at all possible—and the authors are both sceptical and hopeful at the same time in this respect—to reduce global GHG emissions to such an extent that dangerous climate change can be prevented (at least to the EU target), this can only be achieved with the help of a global incentive system in the form of a cap-and-trade emissions-trading scheme where allocation is, at least substantially, based on the principle of “one person—one emission right” (although of course this would be open to variation through generally accepted correction factors).
The design of such a system must ensure that it offers developing countries sufficient incentives to join in, on the one hand, while also ensuring the highest possible degree of economic compatibility in

Vol. 6, No. 1 International Review for Environmental Strategies 2006
84
order to avoid overburdening any country, and still giving worldwide incentives for energy saving and for climate-friendly consumption and production patterns and future development in that direction.
Therefore, the key element of the GCCS—the “one person—one emission right” principle—can and should also be used as the crucial key to solving global climate-change problems to the benefit of all the children and grandchildren of the people currently living on this planet.
References
Agarwal, A. 2000. Making the Kyoto Protocol work: Ecological and economic effectiveness, and equity in the climate regime. Centre for Science and Environment Statement. New Delhi: Centre for Science and Environment. http://www.cseindia.org /html/eyou/climate/pdf/cse_stat.pdf.
Agarwal, A. and S. Narain. 1998. The atmospheric rights of all people on earth: Why is it necessary to move towards the “ultimate objective” of the Framework Convention on Climate Change?. Centre for Science and Environment Statement. New Delhi: Centre for Science and Environment: http://www.cseindia.org/html/eyou/climate/atmospher.htm.
Aldy, J. E., P. R. Orszag, and J. E. Stiglitz. 2001. Climate change: An agenda for global collective action. Paper prepared for the Conference on the Timing of Climate Change Policies, Pew Center on Global Climate Change. October 2001. http://www.aei-brookings.org/admin/authorpdfs/page.php?id=133.
Aslam, M. A. 2002. Equal per capita entitlements. In Building a climate of trust: The Kyoto Protocol and beyond, ed. K.A. Baumert, O. Blanchard, S. Llosa, and J. Parkhaus, 175–201. Washington, DC: World Resources Institute.
Böhringer, C. and H. Welsch. 1999. C&C—contraction and convergence of carbon emissions: The implications of permit trading. Journal of Policy Modeling 26(1):21–39.
BUND and Misereor, eds. 1996. Zukunftsfähriges Deutschland. Ein Beitrag zu einer global nachhaltigen Entwicklung. Studie des Wuppertal Instituts für Klima, Umwelt und Energie. Berlin: Birkhäuser Verlag.
Ecologist. 2001. Lee Raymond: Profile of the head of Exxon. May 22.
European Commission. 2002. World Energy, Technology and Climate Policy Outlook (WETO; preliminary results)—Review of long-term energy scenarios: Implications for nuclear energy. Community research. Presentation at the Russian Academy of Sciences, April 25–26..http:// www.energy.ru/rus/news/inpro/Rossetti_di_Valdalbero.pdf.
Evans, A., and A. Simms. 2002. Fresh air? Options for the future architecture of international climate change policy. London: New Economics Foundation. http://www.neweconomics.org/gen/uploads/freshair.pdf.
Global Commons Institute (GCI). 1999. Climate change—a global problem; Contraction and convergence—a global solution: The history 1996–1999. http://www.gci.org.uk/contconv/cchist.html#contents.
Graßl, H., J. Kokott, M. Kulessa, J. Luther, R. Sauerborn, H. J. Schellnhuber, E. D. Schulze, and R. Schutz. 2003. Über Kioto hinaus denken—Klimaschutzstrategien für das 21. jahrhundert: Sondergutachten. Berlin: Wissenschaftlicher Beirat der Bundesregierung Globale Umweltveränderungen. http://www.wbgu.de/wbgu_sn2003.pdf.
Grubb, M., A. Michaelowa, B. Swift, T. Tietenberg, and Z. Zhang. 1998. Greenhouse gas emissions trading—Defining the principles, modalities, rules and guidelines for verification, reporting and accountability. Draft, August 1998. Published in 1999 as International rules for greenhouse gas emissions trading: Defining the principles, modalities, rules and guidelines for verification, reporting and accountability. Geneva: United Nations Conference on Trade and Development. http://www.unctad.org/en/docs/pogdsgfsbm6.en.pdf.
Grubb, M., C. Vrolijk, and D. Brack. 1999. The Kyoto Protocol: A guide and assessment. Reprint, London: Royal Institute of International Affairs, 2001.
Hare, B. and M. Meinshausen. 2004. How much warming are we committed to and how much can be avoided? Potsdam Institute for Climate Impact Research (PIK) report 93. Potsdam, Germany: PIK.

Vol. 6, No. 1 Beyond Kyoto 2012: A global cap-and-trade scheme 2006
85
Höhne, N., J. Harnisch, D. Phylipsen, K. Blok, and C. Galleguillos. 2002. Evolution of commitments under the UNFCCC: Involving newly industrialized economies and developing countries. Federal Environmental Agency (Umweltbundesamt) research report 201 41 255. Berlin: Federal Environmental Agency.
Höhne, N., D. Phylipsen, S. Ullrich, and K. Blok. 2005. Options for the second commitment period of the Kyoto Protocol. FederalEnvironmental Agency (Umweltbundesamt) research report 203 41 148/01. Berlin: Federal Environmental Agency. http://www.umweltbundesamt.org/fpdf-l/2847.pdf.
Houghton, J. T., L. G. Meira Filho, B. A. Callender, N. Harris, A. Kattenberg, and K. Maskell, eds. 1995. The science of climatechange: Contribution of Working Group I to the Second Assessment Report of the Intergovernmental Panel on Climate Change. Cambridge: Cambridge University Press.
Intergovernmental Panel on Climate Change (IPCC). 1995. IPCC second assessment—climate change 1995. Geneva: IPCC.
———. 2001. Climate change 2001: Synthesis report. Cambridge: Cambridge University Press.
International Energy Agency (IEA). 2002. World Energy Outlook 2002. Paris: Organisation for Economic Co-operation and Development (OECD)/IEA.
———. 2004. World Energy Outlook 2004. Paris: OECD/IEA.
IEA and OECD 2002. Beyond Kyoto: Energy dynamics and climate stabilisation. Paris: OECD.
Knebel, J., L. Wicke, and G. Michael. 1999. Selbstverpflichtungen und normersetzende Umweltverträge als Instrumente des Umweltschutzes. Reports by the Federal Environmental Agency (Umweltbundesamt), 5/99 Berlin 1999
Meyer, A. 2000. Contraction and convergence: the global solution to climate change (Schumacher briefing). Totnes, UK: Green Books.
Michaelowa, A., S. Butzengeiger, M. Jung, and M. Dutschke. 2003. Beyond 2012: Evolution of the Kyoto Protocol regime. .Hamburg: Wissenschaftlicher Beirat der Bundesregierung Globale Umweltveränderungen. http://www.wbgu.de /wbgu_sn2003_ex02.pdf.
Philibert, C. and J. Pershing. 2001. Considering options: Climate target for all countries. Climate Policy 1, no. 2 (2001):211–227.
———. 2002. Beyond Kyoto: Energy dynamics and climate stabilization. Paris: OECD/IEA. http://philibert.cedric.free.fr /Downloads/Beyond Kyoto_NS.
Rat von Sachverständigen für Umweltfragen (RSU). 2002. Für eine neue Vorreiterrolle. Publication 14/8792. Berlin: Deutscher Bundestag. (in German)
Umweltbundesamt (UBA; Federal Environmental Agency of Germany). 2003. Klimaverhandlungen: Ergebnisse aus dem Kyoto-Protokoll, den Bonn-Agreements und Marrakesh-Accords. UBA Climate Change series 04/03. Berlin: UBA..
US Congress. Senate. 1997. Byrd-Hagel Resolution. 105th Congress, 1st session. S. Res. 98. http://www.nationalcenter.org /KyotoSenate.html.
Wicke, L. 1994. Umweltökonomie. 4th ed. Munich: Vahlen.
———. 2005. Beyond Kyoto—a new global climate certificate system: Continuing Kyoto commitments or a new global climate “cap and trade scheme” for sustainable climate policy? Heidelberg: Springer Verlag.
———. 2006. Cost impacts of a “Beyond Kyoto”-Global Cap and Trade Scheme—illustrated at the example of the GCCS—Global Climate Certificate System (with a chapter, “Macroeconomic impact analysis of GCCS and GCCS PLUS” by Prof. Dr. Christoph Boehringer, ZEW Mannheim/Unisversität Heidelberg). Report on behalf of the Ministry of Environment of Baden-Württemberg. Berlin and Stuttgart: Ministry for Environment of the German Federal State of Baden-Wuerttemberg.
Wicke, L., and J. Knebel. 2003a. Nachhaltige Klimaschutzpolitik durch ein markt- und anreizorientiertes Globales Klima-Zertifikatssystem. Teil A: Evaluierung denkbarer Klimatschutzsystem zur Erreichung des Klimastabilisierungszieles der Europäischen Union. Entwurf, October 2003. Berlin and Stuttgart: Ministry for Environment of the German Federal State of Baden-Wuerttemberg.

Vol. 6, No. 1 International Review for Environmental Strategies 2006
86
———. 2003b. Nachhaltige Klimaschutzpolitik durch ein markt- und anreizorientiertes Globales Klima-Zertifikatssystem. Teil B: Prinzipiell anwendungsreife Entwicklung des GCCS zur Erreichung des Klimastabilisierungszieles der EU. Berlin and Stuttgart: Ministry for Environment of the German Federal State of Baden-Wuerttemberg.
Wigley, T. M. L., R. Richels, and J. A. Edmonds. 1995. Economic and environmental choices in the stabilization of CO2
concentrations: Choosing the "right" emissions pathway. Nature 379:240–243.
World Economic Forum (WEF). 2005. Statement of G8 Climate Change Roundtable, convened by the WEF in collaboration with Her Majesty’s Government, June 9, 2005. http://www.weforum.org/pdf/g8_climate change.pdf.
World Resources Institute (WRI). 1998 Global CO2 emission scenarios of the IPPC, Second Assessment Report (1995), for stabilizing at concentrations levels between 450 and 750 ppm CO2. (http://powerpoints.wri.org/climate.ppt.)

Vol. 6, No. 1 Beyond Kyoto 2012: A global cap-and-trade scheme 2006
87
Appendix
More details about the structural efficiency deficits of the Kyoto commitment strategy. This section is taken from Beyond Kyoto—A New Global Climate Certificate System: Continuing Kyoto Commitments or a New Global Climate “Cap and Trade Scheme” for Sustainable Climate Policy? By Prof. Dr. Lutz Wicke (Wicke 2005, 32ff.).
There is unfortunately little to no hope at all that this foreseeable development of dangerously growing global GHG emission can be changed within the current Kyoto Protocol commitment system. This system is designed in such a manner that it bears from the very beginning the—very likely—risk of failure because of the following structural deficits:
1. There is no global, quantified climate sustainability target (and no intermediate target up to 2010). Contrary to the EU, the 'Kyoto' community was unable or unwilling to define the concentration level of GHGs that may not be exceeded in order to prevent dangerous anthropogenic interference with the climate system. Therefore, this system lacks the one decisive basic precondition for evaluating the success or failure of the climate-protection process.
2. Developing countries have refused and still refuse—and rightly so from their point of view—to restrict or reduce in any manner the increase in their CO2 or climate gas emissions in light of
their economic development backlog and
their by far below-average per capita emissions and
the large share of blame borne by industrial countries for burdening the earth's atmosphere with accumulated CO2 emissions (about 85%, 'historic greenhouse gas debt').
This is true irrespective of the fact that overall emissions by developing countries and newly industrialized countries are on balance rising strongly and, according to forecasts by the IEA, this will result in their emissions being higher than those of industrial countries in and around 2025.1 (Per-capita emissions of developing countries, however, will still be far below those of industrial countries.)2
3. This is why, pursuant to the Kyoto protocol, industrial countries should and are to go ahead (initially) alone with effective reductions ('taking the lead'). More or less as a form of voluntary commitment ('voluntary agreement') within the international framework3, the various Annex-I states (or the EU as a whole) offered in the aftermath of a lengthy round of 'poker' negotiations to restrict or reduce in as far as they deemed (at that time) to be possible their increases in emissions—based on (and proportional to) their globally far above-average per capita emissions (grandfathering). This in balance ultimately led to a commitment of an overall emission reduction of 5.2% by 2010/12 against 1990 by industrial Annex I countries. The quantities agreed to were then included in the Kyoto Protocol and thus have been made binding under international law as Assigned Amounts (AA equal to
1. IEA 2002 , World Energy Outlook 2002, Paris, 73. 2. Ibidem, p. 78. 3. Cf. Knebel, J./ Wicke, L./ Michael, G.: Selbstverpflichtungen und normersetzende Umweltverträge als Instrumente des
Umweltschutzes. Report by the Federal Environmental Agency (Umweltbundesamt), 5/99 Berlin 1999, p. 283 and following.

Vol. 6, No. 1 Beyond Kyoto 2012: A global cap-and-trade scheme 2006
88
the emission permits allocated to the countries (average per year) in the period 2008 - 2012) for the individual countries or the EU as whole.4
4. This (voluntary commitment) principle of negotiation and agreement leads to a complete misguidance of the players involved against the global climate protection interest. The result of comprehensive investigations into 'voluntary commitments/agreements (even if they are integrated in a national or international legal binding system') for solving environmental problems is very clear. Voluntary commitments cannot solve really costly environmental problems (even if these commitments should become legally binding immediately or at a later point in time)5.
Recurring to the climate change problem this means: As soon as energy savings and the resultant cost reductions (or other positive economic effects) make climate protection no longer 'profitable' on a single-economy or a national level, and therefore greenhouse gas reduction can only be reached by increasing costs and reducing consumption, the 'free rider effect' will prevail6: All the industrial countries affected try to reduce their climate gas emissions burdens to a level that is economically "painless" and possible without any (economic) sacrifice (thus doing no harm to national economy). The effect of every nation’s single possible share (of slowing dangerous climate change) is small to rather limited (USA, Russia), every nation hopes—‘free rider idea’ - that other countries will bear the necessary GHG reduction burden. This means for the climate efficiency of the negotiated 'voluntary commitment' system: Emission reductions cannot and will not be defined as what is necessary in terms of climate policy and climate protection, but as what can be expected from and implemented in the individual countries or groups of countries. This even leads to a ‘negotiable’ CO2 (growth) potential compared to the business as usual development (example Russia: ‘negotiated’ zero emission ‘growth’ up to 2012 compared to a predicted business as usual path of at least minus 30%, difference: 1.5 bill. t of ‘hot air’ CO2!
7).
5. One hence must note that the instrumental approach of the international Kyoto self-commitment system is in no way capable of solving the problem of climate change. The environmental instrument of 'self-commitment' is in fact the weakest instrument of all when it comes to overcoming environmental problems: This instrumental approach is normally adopted if
there is no chance that nations or supranational institutions are able to set clear standards in order to restrict emissions—here greenhouse gases—to the extent necessary, or
if no consensus can be reached in order to introduce effective emission charges or taxes on a global scale that 'automatically' steer the behaviour of all relevant businesses and private consumers in the right direction, i.e. towards reduction.
In such a dilemma (the world community wants do something but is unable to take the right and adequate steps), the instrument of voluntary commitments is adopted merely in order 'to do something' and to 'go in the right direction', but with the implicit and clear aim not to harm national economies or businesses as a whole.
4. Due to the binding definition of percentage increases or reductions, which are based on the starting emissions of individual
countries, these historically above-proportion per capita and/or absolute national emissions were implicitly recognised as beingthe basis for agreements governed by international law (the so-called 'grandfathering principle').
5. Cf. Knebel, J./ Wicke, L./ Michael, G.: Selbstverpflichtungen und normersetzende Umweltverträge als Instrumente des Umweltschutzes. Reports by the Federal Environmental Agency (Umweltbundesamt), 5/99 Berlin 1999, p. 520 and following.
6. Refer also to the following fourth (very long) footnote (starting with this footnote) 7. Refer to European Commission 2002: “Evaluation of the reference case against Kyoto targets” in: European Commission
(Community Research): World Energy, Technology and Climate Policy Outlook (WETO)—Review of long-term energy scenarios. Moscow 4/2002. ([email protected], http://www.energy.ru/rus/news/inpro/Rosseti_di_Valdabero.pdf ), p.45.

Vol. 6, No. 1 Beyond Kyoto 2012: A global cap-and-trade scheme 2006
89
Like in the Kyoto process, the outcome is that the world community continues on a course of self-commitments accompanied by disappointment over inadequate commitments where most nations fail to comply with their legally binding commitments or evade their commitments under the Kyoto Protocol.
If we continue to focus on improving the commitments undertaken by the adopting states (with zero success up to now) and on increasing the number of self-committing nations, our attention will in the long run be distracted even more from the ecological objective, i.e. 'to stabilize greenhouse gas concentrations in the atmosphere in order to prevent dangerous anthropogenic interference with the atmosphere'.
Failure of the Kyoto system of self-commitment is unfortunately pre-programmed: If self-commitment approaches don't work for (far less) costly environmental problems on a national level, there is no way that they are going to work for the most expensive environmental problem either. Reaching climate stabilization does in fact represent the world's most expensive environmental problem: In order to solve this problem, consumption and production patterns of the world economy must be totally transformed in a climate-friendly and sustainable manner. The 'binding international self commitment approach' of the Kyoto Protocol in fact seems to be its basic instrumental error from the very beginning!
6. Furthermore the UNFCCC/Kyoto process
neither offered or offers any incentives whatsoever for Annex-I states to enter into particularly far-reached obligations,
nor does the Kyoto Protocol offer any particular incentives to actually ratify the Kyoto Agreement (as is demonstrated by the departure of the USA and by Russia's hesitance)
nor are there sufficient incentives or sufficient 'draconian and feasible sanctions' to observe the commitments entered into (after ratification). (In light of the current failure on the part of many key states to observe their commitments, the performance checks and sanctions pursuant to Article 18 of the Kyoto Protocol, which are defined in great detail in the Marrakesh Accords, including pre-warnings, reporting on the violation of the emission budget, the requirement to buy a corresponding quantity of certificates and the deduction of a higher emission share in the subsequent commitment period8 seem to be 'dud weapons'.)
7. The market-orientated incentives that were justly included in the Kyoto Protocol 'merely' serve to make implementation on the respective national (or collective—as in the case of the EU) commitments easier and more cost effective, which can without doubt be seen to serve a 'catalyst' function. However, these flexible instruments provide no incentive to reduce emissions further than the level that was ultimately agreed to. Since some states have been granted more (tradable) emission rights9 than the emissions that would be generated with 'business-as-usual' development, the instrument of joint implementation at least ensures that more emissions than otherwise expected are actually permitted under international law.
Taking a somewhat closer look at the basic problems, the main shortcoming of the Kyoto climate protection system arises from the injustice of the currently free use of the atmosphere, which has not been changed by the Kyoto Protocol. On the contrary, the commitments by Annex-I countries to reduce or maintain or even allowing them to increase their emissions on the basis of emission levels in the 1990s clearly constitute 'recognition' or factual 'acceptance' of these high, absolute and per-capita, zero-cost emissions that pollute the atmosphere with
8. UBA (Umweltbundesamt) 2003: Klimaverhandlungen - Ergebnisse aus dem Kyoto-Protokoll, den Bonn-Agreements und
Marrakesh-Accords. Published in the UBA's series on 'Climate Change', edition 04/03 Berlin 2003 (ISBN 1611-8655), p. 26. 9. According to Grubb et. al. 1999, such 'hot air' is primarily in the states of the former Soviet Union (Russia, Ukraine and the
Baltic states as well as in central and in the eastern European states). (Refer to Grubb, M. et.al. 1999,. xxviii)

Vol. 6, No. 1 Beyond Kyoto 2012: A global cap-and-trade scheme 2006
90
(potentially) dangerous greenhouse gases. Around a fifth of the world's population emits approx. four fifths of all climate gases. This means that developing and threshold countries (and hence approx. 80% of the world's population) are of the opinion that industrial countries with very high per capita climate gas emissions must first of all perform drastic reductions before one can even think of including developing countries into a system of climate gas restrictions or even reductions.
This was the basis for developing and enforcing the inefficient Kyoto climate protection strategies according to the "grandfathering principle" (each industrial state reduces a certain 'negotiated' percentage on the basis of its former climate gas emission, developing countries being not included10). This results in the "Unfairness trap of climate policy" with the following fatal impact on climate policy:
a. Individual industrial countries and the entire group of states have—among other things, due to the 'multiplied global commons problem' with climate protection11—no self-interest, or at least very little self-interest, in suitable climate gas reductions (of a total of 5.2% between 1990 and 2010 or even of up to 80% by the end of the 21st century). This means that the targeted reduction in emissions in industrial countries will in no way be so 'impressive' that it substantially reduces the difference in per capita emissions between industrial and developing countries.
b. Therefore—according to the basic idea on which the system is based and which is the source of a sense of justice, i.e. that 'industrial countries with high emissions must first reduce their emissions significantly ('should take the
10. 'Grandfathering' allocates emission budgets cost-free according to emissions in a specified base year. ... grandfathering
advantages countries with high emission in the reference year ... which basically are industrialized countries.' (Michaelowa, A./Butzengeiger, S./ Jung, M./Dutschke, M. (HWWA Hamburg): Beyond 2012—evolution of the Kyoto Protocol regime. An environmental and development economics analysis. Hamburg April 2003, p. 35.)
11. Cf. Wicke, L: Umweltökonomie. § 5 des Handbuches des deutschen und internationalen Umweltrechtes. Vol. 1, 2nd edition 2002, p. 37 and following. Here, the section "The exponentiated global commons problem with environmental protection" deals with the capacity to solve national and the general incapacity to solve global environmental problems (which is summed up briefly here): Each individual climate (protection) contributes only to a small, at best to a restricted (USA, approx. 20%),degree to climate destruction. The contribution towards global climate protection is just as low and extremely restricted. Thisfamiliar collective asset problem with climate protection is aggravated further (with the trend towards 'free riders') by the following aspects:
A climate-influencing reduction can only be achieved, if at all, by all the players affecting climate. This joint action, this global will to take on responsibility and to implement is not yet recognisable and can hardly be expected.
As long as climate protection is not possible at no extra cost or even with added revenue (e.g. through energy savings), but continues to be linked with higher costs and sacrifice of whatever kind, citizens living today (and voters in the majority of countries) must be become convinced that they must bear costs and sacrifices (above all) in the interest of future generations.
In view of the haziness of forecasts on the impact of climate development/climate change (even the IPCC doesn't dare to definequantitatively at what level 'dangerous interference with the climate' starts!), it is very difficult to forecast with certainty
whether future generations in one's own country (one's 'own' children and grandchildren) will have 'climate disadvantages' or even advantages (e.g. more favourable climate) and
when (in 10, 50 or 100 years?) the impact of the—minimum, usually not 'measurable'—effect of reduction of one's own actions will be felt.
These are hence additional—completely uncertain—preconditions for the vast majority of voters to accept the disadvantages of climate policy for themselves. This implies with (almost) certainty that voters and politicians alike—just as with the "usual" political problems—will decide in favour of current welfare and—unfortunately—against the welfare of future generations. This is particularly true when it comes to serious restrictions and disadvantages which are to be expected (on the basis of current findings) in conjunction with the very high climate gas reductions rates required in particular in industrial countriesand/or the serious emission-related 'growth curb' in developing and threshold countries. This is why each climate protection policy is doomed to failure, no matter how committed it is. This can already been seen, for example, with the initial, still very low reduction commitments according to the Kyoto mechanism (and the related, relatively slight increase in prices and disadvantages), for instance, in the blockade behaviour exercised by the USA. Nobody in the EU should "hide" behind the bad example set by the USA and should not be deceived: If really serious sacrifices are expected, the majority of European voters and European politicians will behave just like the political class in the US!
At first glance, it appears that this fatal logic of the "exponentiated global commons problem of climate protection" can only be overcome by an incentive-based climate protection system that makes it possible to mobilize the economic interest of all the players in climate protection and hence to boost eco-efficiency enormously. The GCCS, described and designed in chapter V and following, attempts to trigger precisely this situation.

Vol. 6, No. 1 Beyond Kyoto 2012: A global cap-and-trade scheme 2006
91
lead')'—developing and threshold countries will continue to have no inclination and cannot be enticed to restrict emissions in any way.
c. Global climate policy thus remains caught in its own 'unfairness trap' with the resultant consequence: In general, first modest climate gas reductions by some states or groups of states (for example, Germany and Great Britain) will be compensated for or even over-compensated for by higher emissions by other countries. This is the only way to explain the previously stated forecast—fatal from the point of view of climate policy—issued by the International Energy Agency of a large increase in global emissions between 1990 and 2010 (plus 29.1%(!), see above) and beyond.
Summarizing the structural deficits of the Kyoto Protocol:
Without a clear and quantified climate protection objective and
with the (wrong) instrumental approach of binding self-commitments,
which therefore includes far too small self-commitments by industrialized countries only (which they are even unable to achieve),
therefore without the least chance of including developing and newly industrialized countries in the climate protection system with substantial emission growth limits and
with no (economic) incentives for climate-friendly behavior for all nations and all fossil fuel consumers worldwide,
there is no chance whatsoever that climate sustainability will be reached, thus preventing dangerous interference with the climate system.
Even worse: By not achieving the ‘commited’ very limited emission (growth) reduction by industrialized countries the whole basic future Kyote strategy falls apart: Because industrialized countries de facto are ‘not taking the lead’ in combating climate change but—on balance fail to comply with their obligations—there will be no chance at all, to go on with appropriate commitments of Annex I states in future ‘commitment periods’ and to include even one single newly industrialized or developing country.

Vol. 6, No. 1 Beyond Kyoto 2012: A global cap-and-trade scheme 2006
92

International Review for Environmental Strategies Vol. 6, No. 1, pp. 93 – 116, 2006
© 2006 by the Institute for Global Environmental Strategies. All rights reserved.
93
Article
Strategies to Induce Non-cooperating Countries to Join a Climate-policy Coalition
Claudia Kemferta
International climate-control or environmental agreements have substantial impacts on international terms of trade. This would seem to suggest that international environmental coalitions cooperating on climate control could penalize non-cooperating countries through trade sanctions. However, alternative approaches exist in which cooperating nations provide incentives for non-cooperating nations to join their coalition. This paper investigates potential impacts of trade sanctions against non-cooperating nations. It compares different climate coalitions and their impacts on trade and international spillover effects if free- riding countries are sanctioned with trade restrictions. Specifically, the paper looks at the Kyoto Protocol as the prime example of a climate-policy coalition, and the United States as the most important non-cooperating country. Modeling indicates that trade restrictions are not the right tool to induce non-cooperating nations to join a coalition. The United States could most likely be persuaded to cooperate if developing nations participated in a climate-policy coalition in which they both benefited from technology transfer and from emissions trading. Further, it appears that developing countries would benefit most if they participated in international emissions trading without binding emission-reduction targets.
Keywords: Climate coalition, Kyoto Protocol, United States, Research and development, Developing countries
1. Introduction
A continued accumulation of anthropogenic greenhouse gases will ultimately have severe consequences on the climatic, ecological, and social systems. Irreversible climate change has significant costs, and no future efforts can repair the resulting damage. Reduction of greenhouse gas emissions is an international public goal necessitating long-term and global economic efforts, with cooperation between countries. The formulation of the Kyoto Protocol and the subsequent negotiations are one initial outcome of cooperative international climate-control policy action.
The progress of the Kyoto Protocol negotiations confirms that individual countries are mainly concerned with potential economic disadvantages from emission reduction. Whether a stable climate-control policy coalition can be achieved depends on opportunities to reduce conflicts of interest in a minimum agreement. A bargaining process provides opportunities to collaborate for mutual benefit; however, full agreement of all players is unlikely. More realistically, some players may act independently or unilaterally to maximize their own interests, while others create small and stable coalitions (Carraro and Siniscalo 1992, 1993; Hoel 1994). The decision to join a coalition or initiate a a. Head of the Department of Energy, Transport and Environment, German Institute for Economic Research (DIW Berlin) and
Professor of Environmental Economics at Humboldt University. Department of Energy, Transport and Environment, DIW Berlin, Koenigin-Luise-Straße 5, D-14195 Berlin, Germany. Tel. +49 30 89789-663, Email: [email protected].

Vol. 6, No. 1 International Review for Environmental Strategies 2006
94
partial coalition is usually taken based on a comparison of the net benefits of cooperative and non-cooperative strategies (Barrett 1994b). As long as the environment and climate are treated as a public good and there are no penalties or sanction mechanisms for polluters, there will be less economic incentives to unilaterally or cooperatively protect the environment. Moreover, as long as cooperative behavior is only voluntary, a common or global agreement will be shaped by the varying interests of the negotiating countries and incentives will be small to join a climate coalition. These interests must be harmonized between nations or groups of nations. Extensive economic literature on game-theory approaches to international cooperation on climate change has been produced since the early 1990s (Barrett 1992, 1995; Carraro 1999, 2000; Carraro and Siniscalco 1992, 1993; Cesar 1994; Chander and Tulkens 2001; Courtois, Pireau, and Tazda 2001; Endres and Finus 1998; Finus 2000; Finus and Rundshagen 2001; Hoel 1994; Kemfert 2002a, 2004; Kemfert, Lise, and Tol 2003).
A variety of incentives exist for countries to free ride (that is, to benefit from others’ efforts to reduce emissions, but take no action themselves). A free-riding position can be seen in the decision of the United States to leave the previously established Kyoto climate-control coalition. Its primary reasons were that compliance would be too costly and that the coalition would not establish emission-limitation commitments for developing countries. In February 2002, President George W. Bush announced a unilateral target of reducing the US economy’s greenhouse gas intensity by 18 percent between 2002 and 2012.1 This would represent a small reduction from projected "business as usual" emissions, and is expected to lead to a rise in total emissions rather than the reduction in total emissions in the United States’ proposed commitment under the Kyoto Protocol.
The United States’ action has several implications. First, the environmental benefits of the commitments undertaken by Annex B parties will be lower than the benefits they anticipated when the commitments were negotiated.2 Second, the cost to Annex B parties of meeting their commitments will be higher than anticipated if they participate and accept emission-reduction targets.3 Third, since the Annex B parties will be committed to larger reductions from their projected emissions than the United States, businesses in Annex B parties might be adversely affected by competition from US businesses. The climate-control coalition might therefore want to persuade the United States to adopt a more stringent emission-reduction target. Strategies to do this might have costs for Annex B parties. However, as long as these costs are less than the costs of a comparable emissions reduction by these parties, the strategy remains viable.
This paper investigates potential strategies that could be used by diverse climate-control coalitions to induce non-cooperating nations, like the United States, to adopt more-stringent greenhouse gas targets. The analysis focuses on trade restrictions, but also includes more-positive incentives for them to return to the climate-control coalition. The impacts of various emission-reduction implementation by non-
1. The aim is to reduce the greenhouse gas intensity of the US economy from its present 183 tons of carbon equivalent emissions
per million dollars of GDP in 2002 to 151 tons by 2012. 2. Annex B countries are those countries that ratified the Kyoto protocol with concrete emission-reduction targets. 3. The Kyoto Protocol establishes several forms of emissions trading. The United States was expected to be the largest net buyer
of permits. Its withdrawal from the protocol reduces the demand for permits, thus reducing the market price and the compliance cost for Annex B parties.

Vol. 6, No. 1 Incentives for Non-cooperating Countries to Join a Climate Coalition 2006
95
cooperating nations and the costs and benefits of forming small coalitions like that under the North American Free Trade Agreement (NAFTA) are analyzed. Furthermore, the paper studies the potential impacts of trade sanctions against non-cooperating nations. Finally, it examines the potential impacts of global coalition games, and incentives for non-cooperating countries to return to the climate-control coalition.
2. The international climate-control coalition—a game theory perspective
The greatest success of international climate-control policy to date has been the establishment of the Kyoto Protocol. It is one of the most prominent and most important international environmental agreements in the history of global negotiation and bargaining policies. However, subsequent climate-change negotiation processes confirm that the initial coalition was not stable; the United States, the world’s largest economy and emitter of greenhouse gases, has left the coalition and now acts as a singleton and free rider. The reason for this behavior can be explained by game-theory validation: the economic payoffs of free riding are higher than those of joining the coalition.4
Cooperation to reduce greenhouse gas emissions must be voluntary, as there is no international authority compelling action by sovereign nations. Unfortunately, as the game-theory literature on climate negotiations indicates (see the list of sources above), cooperation can also increase the incentives for each country to free ride and not fulfill its commitment. If the marginal benefits of additional emission reductions decline, each country gains the benefits of the emission reductions implemented by others and stands to reap fewer benefits from its own action. Although the rules adopted for the Kyoto Protocol include penalties for non-compliance, they may be difficult to enforce, making it effectively a self-enforcing agreement. 5 From a review of the literature, the following conclusions appear to be most important:
A global, self-enforcing agreement that is stable and profitable to all signatories is highly unlikely to be reached.6
Self-enforcing international environmental agreements are likely to include only a limited number of countries.
An equilibrium is likely to consist of multiple agreements of different sizes and with different commitments.
Equity and efficiency cannot be separated because the number of signatories affects the compliance cost each member bears. The compliance cost, in turn, affects the number of signatories (Carraro 2000).
4. The February 14, 2002 announcement by the US administration proposed a voluntary environmental program avoiding huge
economic losses resulting from reduction in economic growth. 5. An Annex B party not meeting its commitment can be penalized 1.3 permits from its allocation for the next commitment
period for each ton of excess emissions. However, a penalized country can threaten to withdraw from the Protocol. In practice, the penalties, if any, are likely to be negotiated.
6. An agreement is stable if none of the parties has an incentive to leave and no non-parties have an incentive to join. An agreement is profitable if welfare is higher under the agreement than without the agreement. An agreement must be profitable to be stable (Bosello et al. 2001).

Vol. 6, No. 1 International Review for Environmental Strategies 2006
96
The existence of stable agreements is threatened by leakage; i.e., increased economic activity and emissions by non-members due to emission-reduction action by members. Leakage reduces the environmental benefits due to cooperation, creating an increased incentive to free ride.
According to the game-theoretic literature, the withdrawal of the United States from the Kyoto Protocol is not surprising, especially since it perceived the cost of participation to be high. The adoption of low-cost unilateral action or formation of a separate agreement similar to NAFTA would be consistent with game theory.
3. Preliminary review of some possible incentive strategies
A variety of possible incentive strategies exist to attract free riders or keep partners in an unstable coalition in the game. These include financial transfers (Carraro and Siniscalco 1993; Hoel 1994); issue linkage (Barrett 1995; Carraro and Siniscalco 1995; Folmer and van Mouche 1993; Folmer, van Mouche, and Ragland 1993; Kemfert 2004; Kroeze-Gil and Folmer 1998; Mohr 1995); 7 legal enforcement through third-party arbitration (Barrett 1992); matching (Barrett 1995; Guttman 1978, 1987);8 self-enforcing strategies (Barrett 1994b; Endres and Finus 1998); 9 social norms (Hoel and Schneider 1997);10 tit-for-tat (Cesar 1994);11 trigger strategies (Barrett 1994a; Cesar 1994);12 and unilateral action (Barrett 1995; Hoel 1991).13
Comparison of these strategies indicates that the best for increasing the number of participants and/or emission reductions and for ensuring compliance with commitments appear to be transfers and issue linkage. Unilateral action does not prevent free riding and may lead to increased levels of emissions. Trigger strategies require penalties to be effective and hence are not suitable for a self-enforcing agreement, as they are not renegotiation-proof. Legal enforcement is not feasible where the participants are sovereign nations. Matching, over time, leads all countries to behave in the same manner as the country making the least effort to reduce emissions. Tit-for-tat has been shown to be highly effective, especially if participants in a game are likely to meet again (Axelrod 1984), but governments may not maintain tit-for-tat strategies for climate policy if other policy priorities arise. While social norms may reduce free riding, they differ across countries and may not be effective in ensuring compliance.
If an agreement is profitable, there is a net gain to the parties. In principle, this net gain can be distributed so that each cooperating party is a net beneficiary and attracts new parties. Transfers can take the form of differential emission-reduction commitments with emission-trading mechanisms, such as those established by the Kyoto Protocol. A stable global agreement requires a policy mix that couples global emission trading with a transfer mechanism designed to offset ex-post incentives to free ride
7. Issue linkage means that the issue of climate control or emissions reduction is linked with other economic incentives, such as
trade coalitions or technological cooperation. 8. A matching process describes the game where those players cooperate that fit most. 9. Self-enforcing strategies are those in which incentives can lead to reactions by some player to act further in the direction that
is intended. 10. That is, cooperation is triggered by some players sharing social norms. 11. Tit-for-tat strategies can merge diverse actions as players react on other players’ reactions. 12. Trigger strategies encompass all trigger mechanisms that activate players to join a coalition. 13. That is, individual strategies by some player(s) who do not cooperate.

Vol. 6, No. 1 Incentives for Non-cooperating Countries to Join a Climate Coalition 2006
97
(Bosello et al. 2001). Transfers to the United States to induce it to adopt a more stringent emissions target are not considered as a strategy for the Kyoto Protocol parties, since this would require renegotiation of the Protocol.
3.1. Issue linkage
If countries that do not benefit from an environmental agreement could benefit from agreement on another issue, and vice versa, linking agreements on two or more issues may enable countries to cooperate on both issues. In principle, issue linkage can improve both profitability and stability of an agreement. Issues that it has been suggested could be linked to climate change include: trade (Barrett 1992, 1995, 1997; Cesar 1994; Conconi and Perroni 2000; Kemfert 2002b; Whalley 1991), research and development (Buchner et al. 2002; Carraro and Siniscalco 1995, 1997; Katsoulacos 1997; Kemfert 2004; Tol, Lise, and Van der Zwaan 2000), international debt (Mohr 1995), other environmental issues such as biodiversity conservation (Barrett 1994a), and international trade (Batyabal 1995; Heister 1993).14 Issue linkage is more likely to be successful when the benefits of the linked issue can be limited to the parties, unlike climate-control agreements, which benefit all countries regardless of their participation.
As links with other issues merely increase the possible set of solutions (Kroeze-Gil and Folmer 1998), linkage per se does not necessarily lead to better outcomes. Accordingly, studies examining potential links between climate change and international trade conclude that such links will not certainly lead to participation by a larger number of countries. Imposing trade sanctions on non-cooperating countries does not guarantee greater cooperation (Courtois, Pireau, and Tazda 2001). Kemfert (2004) finds that, trade sanctions against non-parties would not provide a significant incentive for countries to join an emission-reduction agreement. Conconi and Perroni (2000) find that the effect of linking trade and environmental agreements is ambiguous;15 it helps if the environmental policy stakes are small relative to the welfare effects of trade policies.
3.2. Research and development cooperation
Cooperation on research and development (R & D), especially on energy technologies, appears to be a more promising way of expanding cooperation on climate change. Tol, Lise, and Van der Zwaan (2000) find that technology and capital transfers increase the incentive to cooperate. Kemfert (2004) finds that full cooperation on climate change and technological innovation benefits all countries relative to unilateral action, although technological spillover effects reduce the effectiveness of this strategy. Buchner et al. (2002) find that linking R & D cooperation with cooperation on climate-change control is profitable and guarantees the stability of the linked agreement.16
14. A strategy that links climate change to international debt is not considered. It is assumed that debt concessions offered by
negotiating parties to the United States would be politically unacceptable even in return for more aggressive climate-change targets given the high per capita income of the United States relative to the Kyoto Protocol parties.
15. They distinguish between issue linkage, where a country is free to participate in none, either, or both agreements, and issue tie-in, where a country must be a party to both or none of the agreements.
16. These results are sensitive to the level of technological spillover assumed.

Vol. 6, No. 1 International Review for Environmental Strategies 2006
98
3.3. Trade restrictions
Barrett (1994) states that trade restrictions are the most obvious enforcement mechanism for an international climate-change agreement, but are difficult to apply for climate change due to the very large number of goods affected, the difficulty of calculating the appropriate border tax for each product, and likely inconsistency with international trade agreements (Barrett 2004b). Aldy, Orszag, and Stiglitz (2001) suggest tariffs or trade restrictions based on the emissions associated with production, including standards that place the production of non-parties at a disadvantage.
World Trade Organization (WTO) rules allow border-tax adjustments for environmental taxation or charging for products (ozone-depleting substances) or physically incorporated inputs (chemicals in plastic products), but not on production processes (CO2 emissions) or non-physically incorporated inputs (energy used in production). This means that border-tax adjustments are not allowed for production processes or methods (PPMs) used in the exporting country. However, the Shrimp/Turtle case seems to signal an evolution of the WTO rules towards dealing with issues of PPMs (Vikhlyaev 2001).
Some multilateral environmental agreements (MEAs), including CITES (the Convention on International Trade in Endangered Species of Wild Flora and Fauna), the Montreal Protocol on Substances that Deplete the Ozone Layer, and the Basel Convention Basel Convention on the Control of Transboundary Movements of Hazardous Wastes and their Disposal, define "specific" trade measures, usually against non-coalition countries. The Montreal Protocol imposes trade restrictions on goods made with, but not containing, ozone-depleting substances.17 So far, no trade measure taken pursuant to an MEA has been challenged in the WTO by a non-party. However, the legal ambiguity surrounding the possibility of such a challenge raises uncertainty over the effectiveness of such measures (Vikhlyaev 2001, 18). Buck and Verheyen (2001) conclude that trade sanctions that simply discriminate against goods or services from non-coalition nations are very likely to be incompatible with WTO rules. However, the economic effects of measures allowed under WTO law taken by countries willing to act on climate change should exert pressure on climate change laggards. Buck and Verheyen (2001) conclude that:
Product (e.g., energy efficiency) standards applied in a non-discriminatory way to imported and domestic products would be compatible with WTO law.
Eco-labeling schemes that consider indirect environmental impacts of products would most likely violate WTO provisions.
Procurement programs developed and implemented in the context of an MEA would not violate WTO law even if they included PPM-based technical specifications.
Trade-restrictive environmental measures—including PPM-based measures—can be justified under the provisions of the General Agreement on Trade and Tariffs (GATT) if such measures have been agreed to and negotiated on a multilateral basis. Trade disputes are more likely to arise from such
17. In other words, the Montreal Protocol imposes trade restrictions based on PPMs despite the fact that WTO rules do not allow
border-tax adjustments based on PPMs.

Vol. 6, No. 1 Incentives for Non-cooperating Countries to Join a Climate Coalition 2006
99
national measures undertaken to fulfill obligations under an MEA than from the provisions of the MEA itself (Zhang and Assunção 2004).
In summary, there are several precedents for multilateral environmental agreements that specify trade measures to be taken against non-party countries. At least one agreement imposes trade restrictions based on production processes or methods. The WTO may be moving towards greater acceptance of trade restrictions based on PPMs. However, considerable legal uncertainty remains in all of these areas. Nevertheless, it appears that the parties to the Kyoto Protocol could amend it to include specific trade measures to be taken against non-cooperating countries such as the United States, provided that they were related to climate change. Those measures could include trade restrictions on specified products based on their method of production.
De Moor et al. (2002) note that President Bush has proposed $4.5 billion in research funding (R&D), suggesting that technology development could be a promising area for cooperation. Barrett (2004b) proposes:
Collectively funded R & D (including developing countries based on the UNDP’s assessment)
Coordinated adoption of national standards to drive adoption of lower-emitting technologies.
4. The scenarios modeled
This paper investigates different policy strategies of climate negotiations related to trade to induce the United States to adopt a more stringent emission-limitation target. First, it is assumed that the climate-control coalition under the Kyoto Protocol, consisting of Annex B regions Europe (EU), Japan (JPN), Russia (REC), and Canada (CAN), buys no coal from the United States. Second, the climate-control coalition imposes border-tax adjustments on imports from the United States. Third, different climate-control coalitions act strategically against each other; for example, the United States creates a climate-control coalition with Mexico and Canada (NAFTA). Furthermore, the paper studies the potential effectiveness of the incentive strategy of R & D cooperation to bring non-cooperating countries into the coalition. In this scenario, the climate-control coalition and the United States cooperate on R & D, with payments to the United States equal to the reduction in the compliance costs of the Kyoto Protocol parties. Additionally, it is assumed that developing countries adopt national emission-control commitments equal to their "business as usual" emissions, beginning in 2020.
These scenarios can be summarized as follows:
Scenario name Description
Base case Emission reduction according to the Kyoto Protocol commitments, excepting the United States; strategic action by Russia restricting 50 percent of emission allowances.
No coal The climate-control coalition buys no coal from the non-cooperating United States.
Trade restriction The climate-control coalition imposes border taxes to reduce imports from the United States.
NAFTA A new climate-control coalition between the United States, Mexico, and Canada.
DEV Developing nations participate in a climate-control coalition.
R & D Cooperation between members and non-members of the climate-control coalition on R & D for technological progress of energy technologies.

Vol. 6, No. 1 International Review for Environmental Strategies 2006
100
The study and scenario investigation is based on the interregional, multisectoral trade model WIAGEM, which is described in section 7.
5. The role of technological change in emission reduction
Environmental and climate interventions create constraints and incentives that affect the process of technological change. The imposition of climate-control instruments can stimulate invention and innovation. This invention and innovation is carried out primarily in private firms, through increased R & D. A technological innovation can become widely available by technological diffusion processes. The induced-innovation hypothesis, which assumes that policies trigger innovation, recognizes R & D investments as profit-motivated and stimulated by relative price changes. Climate-control policies that increase the price of fossil fuels increase the market for low-carbon technologies. This creates incentives for increased R & D expenditure in the sectors affected by climate change. Increased R & D expenditure should lead to technological developments that reduce the costs of low-carbon technologies. These effects reduce compliance costs and can lead to increased profits (Porter and Van der Linde 1995). However, investment in R & D could also crowd out other types of investments (Gray and Shadbegian 1998), reducing firms’ profits. Econometric tests confirm these ambiguous results. Jaffe and Palmer (1997) find that a carbon tax reduces aggregate R & D, causing a decline of knowledge accumulation and the rate of technological progress, which results in a deterioration of income and output. Recent findings, however, illustrate that environmental policies can have a strong positive feedback effect on innovation and may induce beneficial economic outcomes (Popp 2001, 2002).
In economic-energy-environmental modeling concepts, the representation of technological changes is one of the most important sources of uncertainty in determining the economic costs of climate-policy strategies (see Jaffe 2000; Jaffe et al. 1995). In previous modeling concepts, technological changes were treated as exogenous. Economy-climate models that incorporate technological changes endogenously determine technological innovations either by investment in R & D as induced technological progress, by integration of spillover from R & D, or by including technological learning processes, particularly learning-by-doing practices. Numerous modeling approaches investigate the economic effects of technological innovation. On a micro or bottom-up scale, different kinds of technologies are assessed in detail. On a macro-level or top-down scale, aggregated economic feedback effects of technological progress are evaluated. In top-down models, technological progress is mostly represented as an innovation to produce the same amount of output (expressed in terms of gross domestic product (GDP)) with smaller amounts of input. This means an increase in input-factor productivity. In contrast to an exogenous representation of technological progress, induced technological progress triggers endogenously increased productivities by different sources, such as investment-induced technological progress or R & D-induced technological progress.
As reported by Löschel (2002), various modeling results confirm that exclusion of the representation of endogenously determined technological changes tends to overestimate compliance costs. Because initial installation of technological innovations are very often expensive, costs decline over time with increasing experience. A learning curve describes technological progress as a function of accumulated

Vol. 6, No. 1 Incentives for Non-cooperating Countries to Join a Climate Coalition 2006
101
experience in production. Many applied modeling concepts, including bottom-up modeling concepts with a detailed representation of energy technologies, apply learning curves as a meaningful description of technological change (Azar and Dowlatabadi 1999; Gerlagh and Van der Zwaan 2003; Grübler, Nakicenovic, and Victor 1999). Dowlatabadi (1998) finds that emission-abatement costs decline substantially if technological change is induced by technological progress, and when learning-by-doing is considered. Gerlagh and Van der Zwaan (2003) find that the learning-by-doing effects that make cheaper non-carbon technologies available induce positive economic impacts and reduce the costs of climate policies.
Some models that incorporate induced technological changes by increased investment in R & D but also increased opportunity costs do not find large impacts on abatement costs (Buonnano, Carrario, and Galeotti 2003; Goulder and Schneider 1999; Nordhaus 2002). Popp (2004) finds that induced technological change leads to substantial welfare gains but only small climate impacts in the long run. Goulder and Matthai (2000) find that abatement costs are lower with the existence of induced technological change than without. The main difference between modelling experiments that do and do not include induced technological change is that some approaches find productivity increases for some sectors that are positively influenced by induced technological changes, but decreased productivity for other sectors that are influenced negatively. These exercises find that induced technological changes significantly raise the benefits of a specific climate-policy strategy, but do not largely reduce the costs.
In this paper, induced technological changes are modelled by an increase of R & D expenditure that increases energy efficiency. It is found that although R & D spending competes with other investments, abatement costs are reduced (Kemfert 2005).
6. Previous modeling of the impacts of climate-change coalitions
Impacts of different climate-control coalitions have been analyzed by many scientists using a variety of applied modeling concepts. Investigations of the international permit market subsequent to the United States’ withdrawal have assumed both a competitive market and strategic behavior by Russia, the Ukraine, and other countries with “hot air”.18 The models used to analyze the international permit market differ in several ways that affect the price, including the emissions covered (from only energy-related CO2 to all greenhouse gas emissions), the coverage of sinks (from none to the maximum allowable sinks), the projected 2010 emissions in the absence of emission-limitation policies, the scale of clean development mechanism activity (from none to all reductions from “business as usual” emissions in developing countries), and transaction costs for project-based mechanisms (from none to 30 percent). Such differences lead to a range of price estimates from different models.
The United States’ withdrawal from the Kyoto Protocol lowers the estimated emission permit price for 2008–2012. If the international permit market is competitive, the price is estimated to be US$(1995)9.20 per ton of carbon (tC), with a range from $0 to $45.90/tC. One-quarter of the studies estimate the amount of “hot air” to be larger than the demand for permits resulting in a zero price. If
18. The emission-limitation commitments of Russia, the Ukraine, and a few other countries are greater than their projected
emissions during the 2008–2012 period. This leaves them with a supply of surplus permits that have no cost, so-called hot air.

Vol. 6, No. 1 International Review for Environmental Strategies 2006
102
Russia and the Ukraine are able to act strategically, the permit price is estimated to be $42.60/tC with a range from $4.00 to $110.80/tC. Russia and the Ukraine would need to limit permit sales to 50 percent or less of their “hot air”. Any domestic policy in the United States that allows the use of foreign permits for compliance will affect the international permit market. Depending upon the size of the US demand, the supply of Kyoto-mechanism permits from other countries could increase enough to reduce the market power of Russia and the Ukraine, leading to a price of between $9.20 and $42.60/tC.
7. The applied modelling tool, WIAGEM
The analysis of different strategies to induce non-cooperating countries to join or return to a climate coalition is performed using the WIAGEM model. WIAGEM is an integrated assessment model merging models of the global economy, based on a dynamic intertemporal general equilibrium approach, global and regional energy markets, and climate changes (Kemfert 2002). The model covers the period 2000 through 2050 in five-year time steps. This structure allows the economic and climate impacts of proposed climate change mitigation policies to be evaluated.
In the model, the global economy is aggregated into 11 trading regions. The economy of each region is disaggregated into 14 sectors, including five energy sectors: coal, natural gas, crude oil, petroleum and coal products, and electricity. Fossil fuels are produced from fuel-specific resources. Goods are produced for the domestic and export markets. The output of the non-energy sectors is aggregated into a non-energy macro good. The production function for this macro good incorporates technology through transformation possibilities on the output side and constant elasticity substitution (CES) possibilities on the input side. The CES production structure combines a nested energy composite with a capital-labor-land composite. The energy-capital-labor-land composite is combined with material inputs to get the total output of the non-energy macro good.
A representative household in each region allocates lifetime income across consumption in different time periods to maximize lifetime utility. In each period, households choose between current consumption and future consumption, which can be purchased via savings. The trade-off between current consumption and savings is given by a constant intertemporal elasticity of substitution. Domestic and imported varieties of the non-energy macro good are imperfect substitutes in each region, as specified by a CES Armington aggregation function constrained to constant elasticities of substitution. Producers invest as long as the marginal return on investment equals the marginal cost of capital formation. The rates of return are determined by a uniform and endogenous world interest rate such that the marginal productivity of a unit of investment and a unit of consumption is equalized within and across regions.

Vol. 6, No. 1 Incentives for Non-cooperating Countries to Join a Climate Coalition 2006
103
Table 1. Estimates of international emissions permit prices in 2010: The effects of the US withdrawal from the Kyoto regime
After US withdrawal from the Protocol
With the US in the Protocol
Competitivemarket
Strategic behavior by Annex B sellers
Source/model Currency units $/tCO2a $/tCO2
a $/tCO2a
“hot air” sold
Babiker et al. (2002) US$(1995) <13.60 <1.40 6.80 50%
Blanchard, Criqui, and Kitous (2002)
US$(1995) 7.60 0 4.60 10%
Böhringer (2001) US$(1995)b 16.90 0 15.50 40%
Böhringer and Löschel (2001)
US$(1995)c 10.10 0 8.70 50%
Buchner, Carraro, and Cersosimo (2001)
US$(1990) 7.20d
13.50e4.70d
12.50e
Ciorba, Lanza, and Pauli (2001)
US$(1997) 10.20f 3.40f
De Moor et al. (2002) US$(1995) 4.10–5.50g
Den Elzen and de Moor (2001)
US$(1990) 9.30 2.600–2.90g
5.50k
4.60–6.20g60%
Eyckmans, Van Regemorter, and van Steenberghe (2001)
US$(1995) 22.00 5.400.90–12.00g
14.80 100%
Grötter (2001) US$(1995)b 4.10–5.50g 0–3.80g 0–30.00g
Hagem and Holtsmark (2001)
US$(1995)h 15.00 5.00
Jotzo and Michaelowa(2001)
US$(1995) 1.60 0.900.60–1.20g
1.10 50%
Jotzo and Tanujaya (2001) US$(1995)b 0.30i 12.10 50%
Kemfert (2002) US$(1995) 14.20 2.20
Löschel and Zhang (2002) US$(1995)c 11.20 0 18.00j
12.50j
9.80j
36% 43% 45%
Manne and Richels (2001)k US$(1997) 35.10 0.70l 30.20m 15%
MIT EPPAn US$(1995) 0.50
Nordhaus (2002) US$(1995)b 3.20o
Average (US$/1995)p
Range
13.40
4.10–35.10
2.50
0–12.50
11.60
1.10–30.20
Average ($/tC)
Range ($/tC)
49.20
15.00–128.80
9.20
0–45.90
42.60
4.00–110.80

Vol. 6, No. 1 International Review for Environmental Strategies 2006
104
Table 1 continued
Notes:a. Where necessary, reported values are converted from tC to t/CO2, converted to US$(1995) using the GDP implicit price index
(1990 = 86.51, 1995 = 98.10, 1997 = 101.95 and 2000 = 107.04), and rounded to the nearest $0.10. b. Currency units not specified. c. Currency units not specified, but results are derived using the POLES (Prospective Outlook on Long-term Energy Systems)
model, which uses US$(1995). d. Including induced technological innovation and diffusion, but no spillover effects. e. Including induced technological innovation and diffusion with spillover effects. f. Annex I trading only. g. Price range for the sensitivity cases analyzed. h. A separate report on the model indicates that the currency unit is US$(1995). i. A minimum price of $1/tC is assumed. j. The estimates assume respectively (1) a cartel involving all countries with “hot air” that maximizes the revenue from the sale of
permits, (2) countries with “hot air” maximizing their revenue from the sale of “hot air” subject to the behavior of the other sellers (Nash equilibrium), and (3) Russia maximizing its revenue from the sale of permits with other sellers accepting the market price.
k. Values are scaled from the figures in the paper. l. Assumes banking is prohibited, so all hot air permits are sold during the first commitment period. m. Assumes anticipatory behavior and banking. n. Massachusetts Institute of Technology Emissions Prediction and Policy Analysis model, according to John Reilly (personal
communication, October 2001), US$(1995)2/tC. o. Nordhaus calculates the shadow price of carbon as $9.68/tC in 2005 and $13.99/tC in 2015, averaging these values yields
$11.84/tC or $3.22/tCO2 for 2010. p. Ranges are excluded from the calculation of the average.
Technological change is determined endogenously. R & D spending improves energy efficiency in the CES production function and so enables a region to meet its emission-reduction target with less loss of output. Since the production function is non-linear, the marginal return to R & D decreases as spending rises. Spending on R & D, about 2–3 percent of GDP, competes with other expenditures (crowding out). Technological change has spillover effects reflected through trade effects and capital flows, so countries that do not cooperate in R & D can benefit from the spillover effects.
In addition to the macro good, oil, coal, and gas are traded internationally. The global oil market is characterized by imperfect competition to reflect the ability of the OPEC (Organization of the Petroleum Exporting Countries) regions to use their market power to influence prices. Coal trades in a competitive global market, and gas trades in competitive regional markets, with prices determined by supply and demand in the relevant global or regional market.
Emissions of CO2, methane (CH4), and nitrous dioxide (N2O) occur as a result of energy consumption and economic production activities.27 These gases are considered to have the most influence on climate change over the 50-year period covered by the model, so exclusion of the remaining gases does not invalidate insights from the analyses.
The climate model estimates the climatic changes due to greenhouse gas emissions and calculates the associated market and non-market damage. The atmospheric concentrations of CO2, CH4, and N2O are

Vol. 6, No. 1 Incentives for Non-cooperating Countries to Join a Climate Coalition 2006
105
based on the first atmospheric lifetime of each gas because of the 50-year time horizon of the model. The atmospheric concentrations affect radiative forcing, which influences the potential and actual surface temperature and the sea level. Market and non-market damage associated with these impacts is calculated as a function of the potential temperature change, the change in regional GDP, and regional coastal protection costs.
The "business-as-usual" case for WIAGEM is similar to the A1B scenario group of the Intergovernmental Panel on Climate Change (IPCC), with global CO2, CH4, and N2O emissions rising from 10 gigatons of carbon (GtC) in 2000 to 16 GtC in 2050, and global GDP rising from US$(1995)26 trillion in 2000 to $161 trillion in 2050. Global CO2 emissions due to energy and land use under the A1B scenario are 16.4 GtC (range 12.7 to 26.7 GtC) in 2050, and global GDP in the same year is $186 to $205 trillion (IPCC 2001).
8. Results of the modeling
8.1. Base case
The base case assumes that all countries other than the United States ratify the Kyoto Protocol so that it comes into force. The emission-limitation commitments of Annex B parties for the first commitment period are assumed to remain unchanged through 2050 at 3,112 MtC.19 The base case also assumes that the US target of an 18 percent emission-intensity reduction over 10 years remains in effect through 2050; the emission intensity further declines each decade. The Kyoto Protocol parties and the United States are assumed to comply with their respective commitments. The United States is assumed to implement domestic policies to meet its target.20
The base case allows the use of sinks for compliance by Annex B parties in accordance with the provisions of the Marrakech Accords, i.e. full use of sinks in Annex B parties plus 1 percent of the Annex B base-year emissions for afforestation and reforestation in developing countries. Full emission trading among Annex B parties and full use of the CDM are allowed; no Annex B party imposes a supplementarity limit on purchases of permits, and with full compliance the commitment period reserve is not binding.
An important assumption is strategic behavior by Russia and the Ukraine, limiting the quantity of permits sold in an effort to maximize revenue. The United States was expected to be a large net buyer of permits. Its withdrawal from the coalition reduces the demand for permits substantially. After the US withdrawal, the amount of “hot air” is large relative to the remaining demand for permits. Since Russia and the Ukraine control almost all of the “hot air”, they could maximize the revenue they receive from
19. This is the annual equivalent of the Annex B commitments (excluding the United States) adjusted slightly to reflect the fact
that WIAGEM covers only CO2, CH4 and N2O emissions. 20. Current US domestic policies include the following. The state of Oregon requires new energy facilities to offset part of their
greenhouse gas emissions. Massachusetts and New Hampshire have passed legislation that will cap CO2 emissions by fossil-fuel-fired generating units in those states beginning in 2004. California has passed legislation mandating the establishment ofCO2 emission standards for vehicles. Proposals for a national cap on CO2 emissions by fossil-fuel-fired generating units are under consideration by the US Congress. Capping the CO2 emissions of electricity generators at the 2000 level while placing no limits on other sources is not sufficient to meet the national target.

Vol. 6, No. 1 International Review for Environmental Strategies 2006
106
the sale of permits by restricting the quantity sold. It is assumed that 50 percent of their surplus permits for the first commitment period are banked rather than traded.
Note: JPN: Japan; CHN: China; USA: United States; SSA: Sub-Saharan Africa; ROW: Other countries; CAN: Canada, Australia, and New Zealand; EU15: European Union; REC: Russia and Eastern and Central European countries; LSA: Latin America (Argentina, Brazil, Chile, etc.); ASIA: India and other Asian countries (Republic of Korea, Indonesia, Malaysia, Philippines, Singapore, Thailand, Hong Kong, Taiwan); MIDE: Middle East and North Africa; MEX: Mexico.
Figure 1. Percentage welfare changes to the base case
Russia and the Ukraine restrict permit sales to 50 percent of their surplus permits in 2010. The banked permits are used for compliance purposes during later periods. The resulting market price for Kyoto Protocol permits is $31/tC (US$(1995)) in 2010, about 25 percent lower than the average price shown in Table 1. The market price rises to $164/tC in 2050 because Annex B parties must achieve ever-larger reductions from "business as usual" emissions to meet their commitments.
The base case imposes a net cost on the Kyoto Protocol parties but yields a net benefit to the United States.21 There is a net cost to the Annex B parties other than Russia and the Ukraine, a smaller net benefit to Russia and the Ukraine, and a net cost to developing countries, making an overall net cost to the Kyoto Protocol parties. Developing countries bear a net cost despite having no emission-limitation commitments and selling CDM permits due to lower oil exports and the trade impacts of lower
21. Consistent with these results, de Moor et al. (2002) conclude that the unilateral US target is much less ambitious than those
for Annex II parties (that is, Annex B parties excluding Russia, the Ukraine, and other Eastern European countries). They estimate the cost of meeting the US target at US$(1995)0.3 billion per year in 2010, compared with a cost of $13 billion to meet the United States’ Kyoto Protocol commitment. They also estimate the domestic permit price in the United States in 2010 to be US$(1995)12.85/tC, compared with an international price under the Kyoto Protocol of US(1995)$20.90.
-0.15
-0.1
-0.05
0
0.05
0.1
0.15
JPN CHN USA SSA ROW CAN EU15 REC LSA ASIA MIDE MEX
perc
enta
ge fr
om b
ase
case
wel
fare
NAFTA Trade sanctions No coal DEV R&D

Vol. 6, No. 1 Incentives for Non-cooperating Countries to Join a Climate Coalition 2006
107
economic activity in Annex B parties.22 The United States reaps a net benefit due to the shift in economic activity from Annex B parties.
Figure 2 illustrates emission-permit prices returned by the model for each of the scenarios.
8.2. NAFTA climate-control coalition scenario
The NAFTA climate-control coalition increases competition on the international emission-permits market. Here, the demand for emission permits increases and therefore so does the price. This leads to economic welfare reductions in the Kyoto coalition, but increases the revenues to the selling region Russia. On the other hand, the NAFTA coalition brings positive economic impacts to Canada, as it could benefit from trade effects within the climate-control coalition. The United States and Mexico could not increase benefits because both countries face real emissions targets, in contrast to the base case.
8.3. No coal scenario
The no coal scenario assumes a restriction on US coal exports. The United States is a large coal exporter. Kyoto Protocol parties—all countries except the United States—are assumed to stop buying coal from the United States, causing its coal exports to drop to zero. This might be achieved through an informal agreement among Kyoto Protocol parties or through an amendment to the Protocol to forbid coal purchases from non-parties, which might allow the restriction to be challenged under WTO rules.
As expected, coal prices in the United States decline slightly (13 percent in 2010), leading to greater coal consumption and higher greenhouse gas emissions (18 percent in 2010), but the United States continues to meet its emission-intensity target. As shown in figure 1, this strategy penalizes the United States by reducing the benefits it reaps from Annex B emission-mitigation actions relative to the base case. In the rest of the world, coal prices rise slightly (5 percent in 2010) and American coal exports are largely replaced by higher production in Russia. As a result, Central and Eastern European countries benefit more from Annex B parties’ emission-mitigation actions.
In short, while this strategy would impose a cost on the United States, it is unlikely to be a viable strategy because it would also increase the costs to non-Annex B parties and to Annex B parties other than the Central and Eastern European countries.
8.4. Trade restrictions scenario
The trade restrictions scenario imposes constraints on the United States’ trade. The Kyoto Protocol parties are assumed to adopt various product standards and eco-labels to promote the use of less greenhouse-gas-intensive products. These may include both voluntary initiatives promoted by environmental groups and mandatory standards established by governments, and are likely to include standards and labels based both on the product characteristics and on production processes and methods.
22. Babiker, Reilly, and Jacoby (1999) analyze the adverse economic impacts on developing countries resulting from
implementation of policies by Annex B parties to meet their Kyoto Protocol commitments and find that selection of efficient policies by Annex B parties largely eliminates the adverse economic impacts on developing countries while reducing the economic costs for Annex B countries.

Vol. 6, No. 1 International Review for Environmental Strategies 2006
108
To be more acceptable under GATT, some may be adopted as amendments to the Kyoto Protocol. These actions are modeled as a combination of two changes: the emission intensity of goods produced in Kyoto Protocol parties is reduced from the base case by 10 percent in 2010 to reflect the effect of the standards on domestically produced goods; and the Armington elasticities of Kyoto Protocol party regions are adjusted so that consumers in these countries give greater preference to goods and services produced domestically or imported from other Kyoto Protocol parties, at the expense of products from the United States. The combined effect of these adjustments is to reduce imports from the United States by Kyoto Protocol parties by 10 percent from the base case in 2010. The emission intensities and Armington elasticities remain constant thereafter.
The lower emission intensity lowers greenhouse gas emissions by Kyoto Protocol parties, but at a cost. As figure 1 demonstrates, nearly all world regions suffer from trade restrictions. The reduced trade lowers incomes in both the United States and the Kyoto Protocol countries due to the reduced gains from trade. It turns out that trade restrictions actually represent self-induced penalties.
8.5. Developing countries scenario
The developing countries scenario imposes emission restrictions on developing countries based on their “business as usual” emissions. Despite the adoption of the CDM under the Kyoto Protocol, one of the reasons given by President Bush for withdrawing from the Protocol was that it does not require participation by developing countries. The literature contains various proposals for possible developing-
0
50
100
150
200
250
300
2010 2020 2030 2040 2050
US
$(19
90)
Base case NAFTA No coal Trade sanctions DEV R&D
Figure 3. Emission permit prices in different scenarios

Vol. 6, No. 1 Incentives for Non-cooperating Countries to Join a Climate Coalition 2006
109
country commitments, including: targets that allow emissions growth for the least-developed countries, with graduation to different levels of commitment as per capita income rises (Baumert, Bhandari, and Kete 1999; Aldy, Orszag, and Stiglitz 2001), per capita convergence (Meyer 1999), and the Argentine Proposal which means reduction of CO2 emissions relative to the “business as usual” emissions (Menem 1998) or the implementation of energy-efficiency or other standards specified as amendments to the Kyoto Protocol.23
One of the principles of the UN Framework Convention on Climate Change is that developed countries should take the lead in combating climate change.24 Since the analysis focuses on the initial commitments of developed countries and assumes they remain unchanged after 2010, a modest target for developing countries seems appropriate.
The specific commitment analysis states that developing countries must limit their emissions to their "business as usual" level beginning in 2020.25 A more stringent commitment would result in a relatively larger emission reduction by developing countries than by the United States. Delaying the adoption of a developing-country target beyond 2020 would mean a negligible impact by 2010, the focus of the analysis. Limiting developing-country emissions prevents leakage and therefore leads to larger climate-change benefits from the emission reductions implemented by Annex B parties and the United States.
Our analysis disregards a Kuznets curve relationship whereby pollutant emissions rise with per capita income at relatively low incomes and then decline as per capita income further increases. Average turning-point estimates range at the level of per capita income from US$5000 to $8000 (Dasgupta et al. 2002).26 The notion of the environmental Kuznets curve has been contested on theoretical grounds (Galeotti, Lanza, and Pauli 2001). Arguments include the view that the curve only presents a snapshot of development, and globalization will promote a "race to the bottom" of environmental standards.
Others have argued that such a race will not occur, because other location incentives dominate those of environmental regulation (Eskeland and Harrison 1997; Van Beers and Van den Bergh 1997). Evidence from empirical studies suggests that environmental regulation is the dominant factor in bringing about an environmental Kuznets curve. Put differently, in countries without active environmental policies, an environmental Kuznets curve will not automatically result even if per capita incomes rise sufficiently.27
Even if the assumption of the Kuznets curve was to hold in all cases, the turning points estimated for the major greenhouse gas, CO2, are higher than the levels of per capita emissions that can be expected
23. See Berk et al. (2001, 29–30, box 2) for a useful summary. 24. United Nations Framework Convention on Climate Change, article 3.1. 25. The Montreal Protocol incorporates a 10-year lag between developed and developing countries’ commitments. 26. Reasons why pollution levels may decline with increasing per capita emissions are that as per capita levels are higher, society
has completed basic investments in health and education and can then turn to the environment. Additionally, more human and material resources are available for monitoring and enforcement of environmental regulations in wealthier societies. Finally, local communities are more apt to, and capable of, defending their rights when income and education increase.
27. Theoretical work on the environmental Kuznets curve indicates that it can result under a certain set of circumstances, including that the type of pollution concerned is local and not cross-border (Dasgupta et al. 2002). In addition, environmentalregulation can produce positive economic returns, as shown in the cases of China (Dasgupta, Wang, and Wheeler 1997) or Indonesia (Calkins 1994).
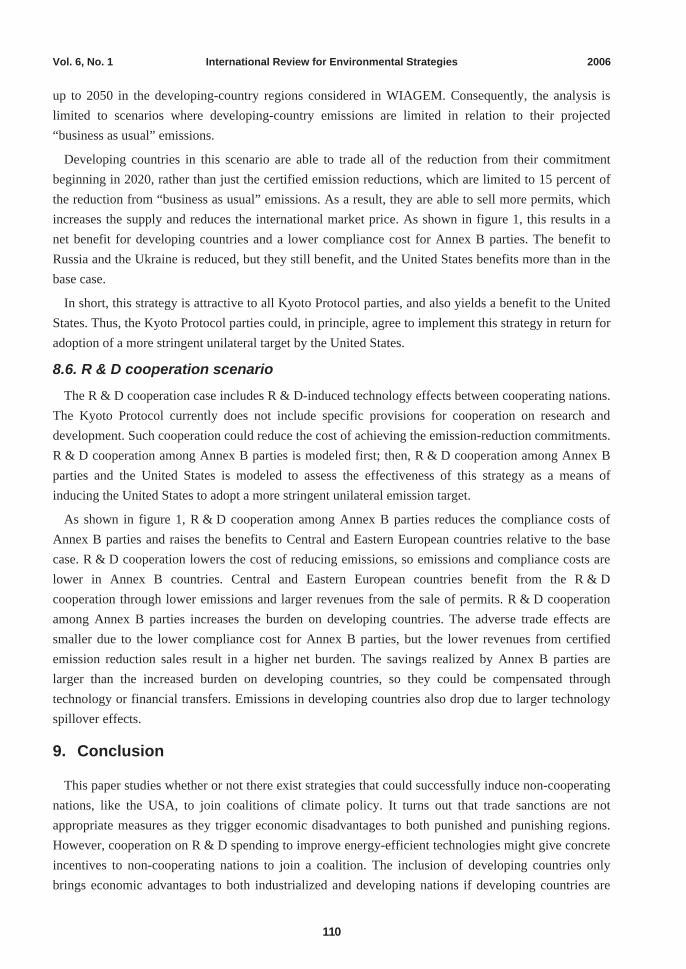
Vol. 6, No. 1 International Review for Environmental Strategies 2006
110
up to 2050 in the developing-country regions considered in WIAGEM. Consequently, the analysis is limited to scenarios where developing-country emissions are limited in relation to their projected “business as usual” emissions.
Developing countries in this scenario are able to trade all of the reduction from their commitment beginning in 2020, rather than just the certified emission reductions, which are limited to 15 percent of the reduction from “business as usual” emissions. As a result, they are able to sell more permits, which increases the supply and reduces the international market price. As shown in figure 1, this results in a net benefit for developing countries and a lower compliance cost for Annex B parties. The benefit to Russia and the Ukraine is reduced, but they still benefit, and the United States benefits more than in the base case.
In short, this strategy is attractive to all Kyoto Protocol parties, and also yields a benefit to the United States. Thus, the Kyoto Protocol parties could, in principle, agree to implement this strategy in return for adoption of a more stringent unilateral target by the United States.
8.6. R & D cooperation scenario
The R & D cooperation case includes R & D-induced technology effects between cooperating nations. The Kyoto Protocol currently does not include specific provisions for cooperation on research and development. Such cooperation could reduce the cost of achieving the emission-reduction commitments. R & D cooperation among Annex B parties is modeled first; then, R & D cooperation among Annex B parties and the United States is modeled to assess the effectiveness of this strategy as a means of inducing the United States to adopt a more stringent unilateral emission target.
As shown in figure 1, R & D cooperation among Annex B parties reduces the compliance costs of Annex B parties and raises the benefits to Central and Eastern European countries relative to the base case. R & D cooperation lowers the cost of reducing emissions, so emissions and compliance costs are lower in Annex B countries. Central and Eastern European countries benefit from the R & D cooperation through lower emissions and larger revenues from the sale of permits. R & D cooperation among Annex B parties increases the burden on developing countries. The adverse trade effects are smaller due to the lower compliance cost for Annex B parties, but the lower revenues from certified emission reduction sales result in a higher net burden. The savings realized by Annex B parties are larger than the increased burden on developing countries, so they could be compensated through technology or financial transfers. Emissions in developing countries also drop due to larger technology spillover effects.
9. Conclusion
This paper studies whether or not there exist strategies that could successfully induce non-cooperating nations, like the USA, to join coalitions of climate policy. It turns out that trade sanctions are not appropriate measures as they trigger economic disadvantages to both punished and punishing regions. However, cooperation on R & D spending to improve energy-efficient technologies might give concrete incentives to non-cooperating nations to join a coalition. The inclusion of developing countries only brings economic advantages to both industrialized and developing nations if developing countries are

Vol. 6, No. 1 Incentives for Non-cooperating Countries to Join a Climate Coalition 2006
111
granted emission permits. An international permit-trading market could reduce compliance costs of industrialized countries. This would make it highly advantageous for the USA to join a climate-policy coalition. Therefore, both strategies to increase incentives to join a climate-policy coalition by R & D cooperation and international emission trading (including developing countries) could be effective strategies.
References
Aldy, J. E., P. R. Orszag, and J. E. Stiglitz. 2001. Climate change: An agenda for global collective action. Prepared for the Conference on the Timing of Climate Change Policies, Pew Center on Global Climate Change, Arlington, Virginia, October 2001.
Axelrod, R. 1984. The evolution of co-operation. London: Penguin.
Azar, C. and H. Dowlatabadi. 1999. A review of the treatment of technological change in energy economic models. AnnualReview of Energy and the Environment 24:513–544.
Babiker, M., H. D. Jacoby, J. M. Reilly, and D. M. Reiner. 2002. The evolution of a climate regime: Kyoto to Marrakech. Report No. 82, Massachusetts Institute of Technology (MIT) Joint Program on the Science and Policy of Global Change. Cambridge, MA: MIT..
Babiker, M., J. M. Reilly, and H. D. Jacoby. 1999. The Kyoto Protocol and developing countries. Report No. 56, MIT Joint Program on the Science and Policy of Global Change. Cambridge, MA: MIT.
Barrett, S. 1992. Convention on climate change—Economic aspects of negotiations. Paris: Organisation for Economic Co-operation and Development.
———. 1994a. The biodiversity supergame. Environmental and Resource Economics. 4:111–122.
———. 1994b. Self-enforcing international environmental agreements. Oxford Economics Papers 46:878–894.
———. 1995. The Strategy of Joint Implementation in the Framework Convention on Climate Change, UNCTAD/GID/10, Geneva.
–——. 1997. Towards a theory of international cooperation. In New directions in the economic theory of the environment, ed. C. Carraro, 35–51. Cambridge, UK: Cambridge University Press.
Batyabal, A. A. 1995. Game models of environmental policy and an open economy. Annals of Regional Science 30:185–200.
Baumert, K. A., R. Bhandari, and N. Kete. 1999. What might a developing country climate commitment look like? Climate Notes. Washington, DC: World Resources Institute.
Berk, M. M., J. G. van Minnen, B. Metz, and W. Moomaw. 2001. Keeping our options open—A strategic vision on near-term implications of long-term climate policy options. COOL Project, Dutch National Research Programme on Global Air Pollution and Climate Change. Bilthoven, Netherlands: 2001.
Blanchard, O., P. Criqui, and A. Kitous. 2002. After The Hague, Bonn and Marrakech: The future international market for emissions permits and the issue of hot air. Cahier de recherche no. 27 bis. Grenoble, France: Institut d'Economie et de Politique de l'Energie.
Böhringer, C. 2001. Climate politics from Kyoto to Bonn: From little to nothing? Energy Journal 23(2):51–71.
Böhringer, C. and A. Löschel. 2001. Market power in international emissions trading: The impact of U.S. withdrawal from the Kyoto Protocol. Discussion Paper 01-58. Mannheim, Germany: Zentrum für Europäische Wirtschaftsforschung GmbH.
Bosello, F., B. Buchner, C. Carraro, and D. Raggi. 2001. Can equity enhance efficiency? Lessons from the Kyoto Protocol. Nota di lavoro 49.2001. Milan: Fondazione Eni Enrico Mattei.

Vol. 6, No. 1 International Review for Environmental Strategies 2006
112
Buchner, B., C. Carraro, and I. Cersosimo. 2001. On the consequences of the US Withdrawal from the Kyoto/Bonn Protocol. Nota di lavoro 102.2001. Milan: Fondazione Eni Enrico Mattei.
Buchner, B., C. Carraro, I. Cersosimo, and C. Marchiori. 2002. Back to Kyoto? US participation and the linkage between R & D and climate cooperation. Milan: Fondazione Eni Enrico Mattei.
Buck, M. and R. Verheyen. 2001. International trade law and climate change—A positive way forward. Bonn: Stabsabteilung der Friedrich-Ebert-Stiftung.
Buonanno, P., C. Carraro, C., and M. Galeotti. 2003. Endogenous induced technical change and the costs of Kyoto. Resource and Energy Economics 25:11–34.
Calkins, R. 1994. Indonesia: Environment and development. Washington, DC: World Bank.
Carraro, C. 1999. The structure of international agreements on climate change. In International environmental agreements on climate change, ed. C. Carraro, 121–134. Dordecht, Nertherlands: Kluwer Academic Publisher.
———. 2000. Costs, structure and equity of international regimes for climate change mitigation. Nota di lavoro 61.2000. Milan: Fondazione Eni Enrico Mattei.
Carraro, C. and D. Siniscalco. 1992. The international dimension of environmental policy. European Economic Review 26:379–387.
———. 1993. Strategies for the international protection of the environment. Journal of Public Economics 52:309–328.
———. 1995. Policy coordination for sustainability: Commitments, transfers, and linked negotiations. In The economics of sustainable development, ed. I. Goldin and A. Winters. Cambridge, UK: Cambridge University Press.
———. 1997. R & D cooperation and the stability of international environmental agreements. In International environmental agreements: Strategic policy issues, ed. C. Carraro, 65–78. Cheltenham, UK: Edward Elgar.
Chander, P. and H. Tulkens. 2001. Limits to climate change. Nota di lavoro 42.2001. Milan: Fondazione Eni Enrico Mattei.
Ciorba, U., A. Lanza, and F. Pauli. 2001. Kyoto Protocol and emission trading: Does the US make a difference? Nota di lavoro 90.2001. Milan: Fondazione Eni Enrico Mattei.
Conconi, P. and C. Perroni. 2000. Issue linkage and issue tie-in in multilateral negotiations. Nota di lavoro 5.7.2000. Milan: Fondazione Eni Enrico Mattei.
Courtois, P., J. C. Pireau, and T. Tazda. 2001. An evolutionary approach to the climate change negotiation game. Nota di lavoro81.2001. Milan: Fondazione Eni Enrico Mattei.
Dasgupta, S., B. Laplante, H. Wang, and D. Wheeler. 2002. Confronting the environmental Kuznets curve. Journal of Economic Perspectives 16, no. 1 (Winter): 147–168.
Dasgupta, S., H. Wang, and D. Wheeler. 1997. Surviving success: Policy reform and the future of industrial pollution in China.World Bank Research Department Working Paper, PRDEI.
De Moor, A. P. G., M. M. Berk, M. G. J. den Elzen, and D. P. van Vuuren. 2002. Evaluating the Bush climate change initiative. Report 728001019/2002, RIVM, Bilthoven.
Den Elzen, Michel G.J. and Andre P.G. de Moor. 2001. "The Bonn Agreement and Marrakech Accords: An Updated Analysis," Report 728001017/2001. Bilthoven, Netherlands: RIVM.
Dowlatabadi, H. 1998. Sensitivity of climate change mitigation estimates to assumptions about technical change. EnergyEconomics, 20(5–6):473–493.
Endres, A. and M. Finus. 1998. Renegotiation-proof equilibria in a bargaining game about global emission reductions—Does the instrumental framework matter? In Game theory and the global environment, ed. N. Hanley and H. Folmer, 135–164. Cheltenham, UK: Edward Elgar.
Eskeland, G. and A. Harrison. 1997. Moving to greener pastures? Multinationals and the pollution-haven hypothesis. World Bank Working Paper Series 1744. Washington, DC: World Bank.

Vol. 6, No. 1 Incentives for Non-cooperating Countries to Join a Climate Coalition 2006
113
Eyckmans, J., D. van Regemorter, and V. van Steenberghe. 2001. Is Kyoto fatally flawed? Working paper 2001–18. Leuven, Netherlands: Center for Economic Studies, Katholieke Universiteit Leuven.
Finus, M. and B. Rundshagen. 2001. Endogenous coalition formation in global pollution control. Nota di lavoro 43.2001. Milan: Fondazione Eni Enrico Mattei.
Finus, M. 2000. Game theory and international environmental co-operation: A survey with an application to the Kyoto Protocol. Nota di lavoro 86.2000. Milan: Fondazione Eni Enrico Mattei.
Folmer, H., P. van Mouche, and S. Ragland. 1993. Interconnected games and international environmental problems. Environmental and Resource Economics 3:313–335.
Galeotti, M., A. Lanza, and F. Pauli. 2001.Desperately seeking (environmental) Kuznets: A nNew look at the evidence. Nota di lavoro 67.2001, climate change modeling and policy. Milan: Fondazione Eni Enrico Mattei.
Gerlagh, R. and R. van der Zwaan. 2003. Gross world product and consumption in a global warming model with endogenous technological change. Resource and Energy Economics 25(1):25–58.
Goulder, L. and K. Matthai. 2000. Optimal CO2 abatement in the presence of induced technological change. Journal of Environmental Economics and Management 39:1–38.
Goulder, L. and S. Schneider. 1999. Induced technological change and the attractiveness of CO2 abatement policies. Resource and Energy Economics 21(3–4):211–253.
Gray, W. B. and R. J. Shadbegian. 1998. Environmental regulation, investment timing and technological choice. Journal of Industrial Economics 46:235–256.
Groenenberg, H., D. Phylipsen, and K. Blok. 2001. Differentiating the burden world wide—Global burden differentiation of GHG emissions reductions based on the triptych approach: A preliminary assessment. Energy Policy 29:1,007–1,030.
Grötter, J. 2001. The GHG market after Bonn. Joint Implementation Quarterly 7(3):9.
Grübler, A., N. Nakicenovic, and D. G. Victor. 1999. Modeling technological change: Implications for global environment. Annual Review of Energy and the Environment 24:545–569.
Guttman, J. M. 1978. Understanding collective action: Matching behaviour. American Economic Review 68:251–255.
———. 1987. A non-Cournot model of voluntary collective action. Economica 54:1–19.
Hagem, C. and B. Holtsmark. 2001. From small to insignificant: Climate impact of the Kyoto Protocol with and without US. Policy note 2001:1. Oslo: CICERO Center for International Climate and Environmental Research.
Heister, J. 1993. Who will win the ozone game? Kiel working paper 579. Kiel, Germany: Institute of World Economics.
Hoel, M. and K. Schneider. 1997. Incentives to participate in an international environmental agreement. Environmental and Resource Economics 9:153–170.
Hoel, M. 1991. Global environmental problems: The effects of unilateral actions taken by one country. Journal of Environmental Economics and Management 20:55–70.
———. Efficient climate policy in the presence of free riders. Journal of Environmental Economics and Management 27:259–274.
IPCC. 2001. Climate change 2001: Economic and social dimensions. Cambridge, UK: Cambridge University Press.
Jaffe, A. B. 2000. The US patent system in transition: Policy innovation and the innovation process. Research Policy 29:531–558.
Jaffe, A. B. and K. Palmer. 1997. Environmental regulation and innovation: A panel data study. Review of Economics and Statistics 79:610–619.
Jaffe, A. B., S. Peterson, P. Portney, and R. N. Stavins. 1995. Environmental regulation and the competitiveness of the U.S. manufacturing: What does the evidence tell us? Journal of Economic Literature 33:132–163.
Jotzo, F. and A. Michaelowa. 2001. Estimating the CDM market under the Bonn Agreement. Discussion paper 145. Hamburg: Hamburg Institute of International Economics (HWWA).

Vol. 6, No. 1 International Review for Environmental Strategies 2006
114
Jotzo, F. and O. Tanujaya. 2001. Hot air vs CDM: Limiting supply to make Kyoto work without the United States. Pelangi working paper. Jakarta: Pelangi (Policy Research for Sustainable Development).
Katsoulacos, Y. 1997. R & D spillovers, R & D cooperation, innovation and international environmental agreements. InInternational environmental agreements: Strategic policy issues, ed. C. Carraro, 89–97. Cheltenham, UK: Edward Elgar.
Kemfert, C. 2002. An integrated assessment model of economy-energy-climate—The model WIAGEM. Integrated Assessment3(4):281–299.
———. 2004. International climate coalitions and trade—Assessment of cooperation incentives by issue linkage. Energy Policy 32(4):455–465.
———. 2005. Induced technological change in a multi-regional, multi-sectoral trade model. Ecological Economics 54(2–3):293–305.
Kemfert, C., W. Lise, and R.Tol. 2003. Games of climate change with international trade. Environmental and Resource Economics 28:209–232.
Kroeze-Gil, J. and H. Folmer. 1998. Linking environmental and non-environmental problems in an international setting: The interconnected games approach. In Game theory and the global environment, ed. N. Hanley and H. Folmer, 165–180. Cheltenham, UK: Edward Elgar.
Löschel, A. 2002. Technological change in economic models of environmental policy: A survey. Nota di lavoro 04.2002. . Milan: Fondazione Eni Enrico Mattei.
Löschel, A. and Z. Zhang. 2002. The economic and environmental implications of the US repudiation of the Kyoto Protocol and subsequent deals in Bonn and Marrakech. East-West Center working paper 52. Honolulu: East-West Center.
Manne, A. S. and R. G. Richels. 2001. US rejection of the Kyoto Protocol: The impact on compliance costs and CO2 emissions. Working paper 01–12. Washington, DC: AEI-Brookings Joint Center for Regulatory Studies.
Menem, C. S. 1998. Statement of Mr Carlose Saul Menem, President of the Republic of Argentina, at the UNFCCC Fourth Conference of the Parties, Buenos Aires, November 11.
Meyer, A. 1999. The Kyoto Protocol and the emergence of “Contraction and Convergence” as a framework for an international political solution to greenhouse gas emissions abatement. In Man-made climate change: Economic aspects and policy options,ed. O. Hohmeyer and K. Rennings. Heidelberg: Physica-Verlag.
Mohr, E. 1995. International environmental permits trade and debt: The consequences of country sovereignty and cross default policies. Review of International Economics 1:1–19.
Morgenstern, R. D., M. Ho, J.-S. Shih, and X. Zhang. 2002. The near-term impacts of carbon mitigation policies on manufacturingindustries. Discussion paper 02–06. Washington, DC: Resources for the Future.
Nordhaus, W. D. 2001. Global warming economics. Science 294 (9 November): 1,283–1,284.
Popp, D. 2002. Induced innovation and energy prices. American Economic Review 92(1):160–180.
Popp, D. 2004. ENTICE: Endogenous technological change in the DICE model of global warming. Journal of Environmental Economics and Management 48:742–768.
Porter, M. E. and C. van der Linde. 1995. Towards a new conception of the environment-competitiveness relationship. Journal of Economic Perspectives 9:97–118.
Rutherford, T. 1993. MILES: A mixed inequality and non-linear equation solver. GAMS—The solver manuals. Washington, DC: C.G. D. Corporation.
Van Beers, C. and J. C. J. M. van den Bergh. 1997. The impact of environmental policy on foreign trade: Tobey revisited with a bilateral flow model. Tinbergen Institute discussion paper 00-069/3. Rotterdam: Tinbergen Institute.
Vikhlyaev, A. 2001. The use of trade measures for environmental purposes—Globally and in the EU context. Nota di lavoro68.2001. Milan: Fondazione Eni Enrico Mattei.
Whalley, J. 1991. The interface between environmental and trade policies. Economic Journal 101 (March): 180–189.

Vol. 6, No. 1 Incentives for Non-cooperating Countries to Join a Climate Coalition 2006
115
Zhang, Z. and L. Assunção. 2004. Domestic climate policies and the WTO. World Economy 27(3):359–386.

Vol. 6, No. 1 International Review for Environmental Strategies 2006
116

International Review for Environmental Strategies Vol. 6, No. 1, pp. 117 – 136, 2006
© 2006 by the Institute for Global Environmental Strategies. All rights reserved.
117
Article
Russia and Japan: Combining Energy and Climate Goals
Anna Korppoo a and Kayo Ikedab
Japan and Russia share interests in energy and climate, but currently cooperation between these neighboring countries is small. The Russian Far East seems like a logical ground for cooperation due to its proximity to Japan; however, it is difficult to establish whether this part of Russia could have a special role in Japanese plans. The lack of Russian preparedness to implement the Kyoto mechanisms is currently the main reason why Japan has developed no Kyoto-related cooperation with the country. The lack of reliable greenhouse gas inventories and lack of institutional organization are especially problematic. Even so, Japanese domestic policies also play a role in the lack of cooperation. Japanese feasibility studies in Russia did not lead to implemented projects, and the program has been frozen since 2000. However, large infrastructure projects in the Russian energy sector have gained significant Japanese interest and financing. Existing industrial and energy-sector cooperation could facilitate projects under the Kyoto Protocol. Potential joint implementation (JI) cooperation areas include gas, power, and steel sectors; energy efficiency improvements; and non-carbon-dioxide projects. Russian JI pilot-phase experiences were discouraging, but many Russian project hosts have since become more active and better prepared. Bidding systems could contribute to the success of selecting appropriate Russian project hosts. Emissions trading between Japan and Russia seems unlikely to happen in the absence of a “greening” arrangement, which could also support Russian compliance. However, such a bilateral arrangement would require mutual trust.
Keywords: Russian-Japanese cooperation, Russian Far East, Energy, Climate, Japanese feasibility studies
1. Introduction
Both Japan and the Russian Federation are important players in the Kyoto market. Cooperation on the Kyoto mechanisms and energy issues in the Russian Far East could provide both countries with significant strategic benefits. Japan needs to find a larger supply of fossil fuels outside the Middle East and to buy Kyoto emission allowances in order to meet its commitments. Russia has plenty of fossil fuels and spare Kyoto allowances to sell, and needs significant investment to reform and develop its energy sector. Even though the interests of the two countries seem to converge, their energy cooperation to date has been surprisingly small, and they have made hardly any preparations for future Kyoto cooperation.
At the time of writing, the price of oil remains high, at some US$50 per barrel. The main reasons for this include the growth of—especially US and Chinese—demand, reduction of supply from the Middle East, and the instability of the region due to the Iraq war and terrorism. These developments seem
Corresponding author,. Centre for Environmental Policy, Imperial College London, South Kensington Campus, London SW7
2AZ, United Kingdom. Tel.: +44 (0)20 7594 7307, email: [email protected]. Researcher, Finland Futures Research Centre, and Doctoral Researcher, Imperial College London. b. Program officer, Institute for Global Environmental Strategies, Kanagawa, Japan.

Vol. 6, No. 1 International Review for Environmental Strategies 2006
118
favorable to Russia as an oil exporter, while Japan’s dependency on imported oil paints a different picture. But reducing the consumption of oil is relevant for both countries.
Now that the Kyoto Protocol has entered into force, the implementation of the Kyoto trading mechanisms is in preparation. The first Meeting of Parties of the Kyoto Protocol at the end of 2005 is expected to further define the rules for joint implementation (JI), to be launched at the beginning of the first commitment period in 2008. So far, JI has been divided into two categories based on the compliance status of the host country. Full compliance under the Kyoto Protocol delivers independent project approval (Track 1). Failure to comply fully with the requirements leads to project approval supervised by a United Nations Framework Convention on Climate Change (UNFCCC) Committee, similarly to the clean development mechanism (CDM; Track 2). International emissions trading (IET) is only allowed under full compliance. Further, “greening” projects by voluntarily recycling revenues from IET to further projects has also been discussed outside the framework of the Kyoto Protocol but based on its commitments. Crediting of the CDM began in 2000. So far, the CDM has been characterized by high transaction costs and lack of institutional capacity.
This paper provides an overview of the potential of Japanese-Russian cooperation on energy and climate-change-mitigation sectors and discusses the problems and possible focus of future cooperation. The main aim of the paper is to explore the prospects for Japanese-Russian cooperation, and what could be done to enhance this potential. The authors supplemented their knowledge by conducting a poll of seven Japanese climate and energy experts. The findings of this survey are cited as “Japanese experts” in the text.
2. Rationale for Japanese-Russian cooperation
2.1. Russia: lack of investments and search for market
Russia’s energy infrastructure is starving for investment. According to Russian Industry and Energy Minister Viktor Khristienko, Russian energy-generating units require some US$48–60 billion investment by 2015 (RosBusinessConsulting 2004). The Russian Energy Strategy until 2020(Government of Russia 2003) states that the whole energy sector requires some US$660–810 billion over 20 years, and US$260–300 billion between 2001 and 2010. There is a widely recognized need to improve energy efficiency in Russia, as the current level of inefficiency could impede economic growth. The need for energy saving is also emphasized in the Russian Energy Strategy, which estimates that the energy-saving potential of the whole economy is some 40–45 percent of current energy use. Two-thirds of this potential is in the energy and industrial sectors.
The Russian government wants to ensure markets for Russian oil and gas that deliver most of the revenues into the state coffers, but investment for further infrastructure building is required. Asia would be a large market for Russian oil and gas; however, so far adequate transport infrastructure is not in place. Neighboring Japan is also a logical market for the Russian Far East’s oil and gas resources.
Russia was allocated surplus emissions allowances under the Kyoto Protocol, due to the economic recession of the early 1990s, and the country has great potential to host JI projects in the energy sector. However, after the withdrawal of the United States from the Kyoto process in 2001, Russia lost the most

Vol. 6, No. 1 Russia and Japan: Energy and Climate 2006
119
important buyer of Russian credits and allowances. Ever since, Russia has been seeking a new partner interested in significant transactions under Kyoto.
2.2. Japan: oil dependency and a tough Kyoto target
The major pillars of Japanese energy strategy illustrate the main concerns of the Japanese government: security of supply, reasonable prices, diversification of energy sources (away from oil), geographical diversification of supply, and energy conservation (Mito 2000). These strategic issues reflect the fact that Japan lacks sufficient indigenous energy sources. Japan imports almost 80 percent of the energy it requires, most of this oil from the politically unstable Middle East (ibid.). Some 85 percent of Japan’s primary energy demand is met by fossil fuels (Agency for Natural Resources and Energy 2005).
Japan’s commitment under the Kyoto Protocol is a 6 percent reduction of emissions from 1990 levels. According to Japan’s Third National Communication, Japan’s emissions exceeded 1990 levels by 6.8 percent in 1999 (Government of Japan 2002), and by 8 percent in 2003 (Kyodo 2004). Consequently, Japan’s Kyoto burden has grown to a 14 percent cut from current levels by 2008–2012. After the 1973 oil crisis, the Japanese economy largely switched from dependency on oil to a mix of coal, nuclear, and renewable energy. Energy efficiency improved dramatically; however, this trend stalled simultaneously with a period of rapid economic growth that began in the mid-1980s and continued during the economic stagnation from the early 1990s onwards (Tangen et al. 2002). Currently, oil meets some half of Japan’s energy demand. Still, to date the Japanese energy sector has not provided many opportunities for reducing emissions, and the domestic potential tends to be expensive per ton of carbon dioxide reduced. According to an estimate by the Japanese government, the country needs to spend more than two trillion yen—USD19 billion—a year in order to comply with the country’s Kyoto target (PointCarbon 2005). The better the deals Japan can make in the international carbon market, the less compliance under Kyoto will cost the country.
Japan has worked on covering some of its emission reductions using the Kyoto mechanisms. The cabinet approved a plan to achieve the Kyoto target in April 2005, after a public consultation process. Under the plan, Japan would apply the Kyoto mechanisms to realize a 1.6 percent reduction on the 1990 emissions levels (Government of Japan 2005), together with implementing domestic measures to reduce greenhouse gas (GHG) emissions and to enhance carbon sinks. The Government will review progress in implementation of the plan every year and revise it in 2007 to ensure that the Kyoto target is achieved.
2.3. Common benefits from the Russian Far East
Japan and Russia share interests in developing the Russian Far East, which is the closest Russian territory to Japan. The rapid economic development of the Asian countries has increased the political and economic importance of the Russian Far Eastern to Moscow. However, this region is currently suffering from severe economic depression and needs more attention in the form of investment and social and development programs. Depopulation, unemployment, and economic recession are causing hardship for those living in the region (Mito 2000).
The Far East region was the second-largest recipient of foreign direct investment (FDI) in Russia in 2002, netting some 18 percent of the total (OECD 2004). The main targets of FDI in the region are

Vol. 6, No. 1 International Review for Environmental Strategies 2006
120
large oil and gas extraction projects, and it has been argued that this FDI does not contribute to improving the lives of most of the region’s population. It is indeed ironic that the energy-rich Russian Far East is experiencing a local energy crisis. For instance, during the winter of 2004–2005, thousands of people were left in the cold and dark due to fuel shortages (PIN 2004).
Energy resources from the Russian Far East offer Japan the opportunities to secure a supply from close by, to diversify Japan’s supply away from dependence on the Middle East, and to replace some oil with gas. The planned oil pipeline from Siberia to Nakhodka, next to Japan, could also contribute to this solution.
Russia is lacking investment, and infrastructure projects to extract and transport oil and gas are very capital intensive. Japanese interest in Russian Far East energy has already generated funding for reform and development of the Russian energy sector, and could probably generate even more if relations between Russia and Japan were stable. JI projects and other Kyoto cooperation could be used as a vehicle for further energy cooperation and improving the social situation in the Russian Far East.
2.4. The burden of history
The history of Japanese-Russian relations is not encouraging. The most famous unsettled dispute is over the Kurile Islands, of which both countries claim ownership. Because of this disagreement, Japan and Russia have still not signed a peace treaty after the Second World War.1 Some Russian sources claim that the Kurile Islands are too rich in natural resources to be handed over to Japan in their entirety (Moscow Times 2005). The Japanese government refuses to consider accepting only half of the islands back, as suggested by the Russian side (Takahashi 2004). So the dispute continues, and complicates any form of cooperation between the countries.
The mutual distrust between the two countries is only partly based on this ongoing territorial dispute, and also has roots in historical rivalry over the northern islands. Also cited as reasons for the modesty of efforts made to improve Japanese-Russian relations are the Japanese opposition to Russian G7/G8 membership (AllPolitics 1997; RIIA 2003), Russia’s Euro- and Sino-centrism, and Japan’s focus on the United States (Mito 2000; RIIA 2003; Tanaka 2000). In addition, some Japanese investments in Russia failed in the 1990s. Disappointment caused by unpaid debts to Japanese trading companies may have understandably contributed to suspicion among Japanese businesses towards Russian projects (Muller 2001).
In general, economic ties between the countries have been weak. While the Russians would like to see the Japanese invest large sums in the Russian economy, the Japanese government wants to ensure that Japanese companies will be allowed into business deals in return.
President Vladimir Putin has managed to improve Russia’s relations with Japan, and the Japanese government is putting a lot of hope in President Putin’s personality (Mito 2000). Also, recent mutually beneficial energy cooperation projects have given the two countries reasons to put past differences
1. For the Japanese perspective on this dispute, see the dedicated Japanese Ministry of Foreign Affairs web page “Japan’s
northern territories” at http://www.mofa.go.jp/region/europe/russia/territory/index.html#I.

Vol. 6, No. 1 Russia and Japan: Energy and Climate 2006
121
behind them. Kyoto projects could provide a platform for further positive experiences between the countries.
3. Current Japanese views on cooperation with Russia
Our survey of Japanese experts was mainly conducted by e-mail. We sent out ten questionnaires and received seven responses, including one interview. Three of our respondents work in the private sector, three are academics or members of NGOs, and one works for the Japanese government. Their expertise is based on years of experience on Kyoto-related work. Responses might have contained stronger opinions if large Japanese trading companies could have been added to the list of respondents.
The widest variety of responses was to the question “Why are there no Japanese-Russian AIJ or JI projects?”2 The main reasons given were:
Russia only ratified the Kyoto Protocol recently (risk that the Protocol will not enter into force)
Lack of capacity of the Russian administration (i.e. capacity to trade, manage JI, and comply with the Kyoto Protocol)
Japan has focused on CDM so far
Past bad experiences with Russian pilot projects
These arguments were all given by three of the seven respondents. Mentioned by two respondents each were the fact that there has been no urgency with JI, which starts only in 2008; the argument that JI projects might not be profitable; the lack of political reliability in Russian JI projects; and the fact that Japanese domestic policy has not yet included incentives for the private sector to implement emission-reduction measures. The inflexible and competitive working environment in Japan was also cited as a reason to avoid risky projects with Russia; failure of a project might influence the personal benefits or even the position of the person responsible. To conclude, the main reasons were related to Russian preparedness; however, interestingly, the Japanese domestic approach to the Kyoto mechanisms was also raised.
According to the experts, the main ways that the Russian government could enhance Kyoto cooperation with Japan include: establishing a framework to manage emissions trading and JI, and establishing clear compliance institutions. These views, both given by three respondents each, reflect the institutional problems experienced in Russia by investors. It is indeed clear that before the Russians can expect any Kyoto cooperation with Japan (or any other country), further domestic preparations are required. The following were also suggested as ways to enhance cooperation:
Provide information on available projects
Provide investment-protection mechanisms for foreign investors
Provide early credits or back projects with assigned amount units (AAUs)
Clarify the intention to sell AAUs without political intervention
2. AIJ: activities implemented jointly.

Vol. 6, No. 1 International Review for Environmental Strategies 2006
122
Establish a green investment scheme
The respondents had somewhat fewer views and less consensus on the types of Russian projects that would be most interesting to Japan. Gas-sector projects gained most support; however, steel-sector and non-carbon-dioxide projects were also mentioned. It was argued by two respondents that project type is not important, and another respondent stated that the investor company’s expertise would determine the project type.
The experts clearly believe that the key expertise with which Japan could provide Russia is in energy efficiency and energy-saving technologies. Alternative energy technologies, methane capture, and the power sector were also mentioned.
The main criterion for project selection was most often said to be cost-effectiveness of the project, though project size was also mentioned. Consequently, shared interest areas between Japan and Russia could easily be identified.
The respondents did not have a clear view on the importance of the location of JI projects. Half of them argued that location is irrelevant, though some also argued that Japanese public financial institutions may prefer the Russian Far East, being a neighboring region. The Japanese government has no official policy on the location issue. This might be because there are no established project plans between the Russian and Japanese governments.
Against this background, we will next explore Japanese interest in Russian projects and the context of climate cooperation with Russia.
4. Japanese interest in Russian projects to date
Apart from some large infrastructure projects, Japanese investment in Russia has been small given the geographical proximity of the two countries. FDI from Japan to Russia totaled some US$1.35 billion in 2003, which was only 5.2 percent of total FDI in Russia in that year (OECD 2004). Barriers to Japanese investment in Russia include the unfavorable investment climate, bureaucracy and complications related to the Russian administrative system and visa procedures, and country risk factors (Tanaka 2000). Lack of legal and business infrastructure in Russia, lack of experience in managing risky investments among Japanese investors, and the long stagnation of the Japanese economy might provide additional explanations for the modest level of economic cooperation between the two countries (Tangen et al. 2002).
4.1. Japanese feasibility studies and JI project plans in Russia
In 1997–2000, a lot of progress was made in expanding Japanese-Russian bilateral cooperation. In November 1997, former Japanese prime minister Ryutaro Hashimoto and former Russian president Boris Yeltsin established the so-called Hashimoto-Yeltsin Plan, which focused on various areas of cooperation between Russia and Japan, including strengthening the energy dialogue. The plan was in line with the Russian government’s 1996 special federal long-term program for the Far East and the Zabaikal. The Kyoto mechanisms were also part of the new plan.

Vol. 6, No. 1 Russia and Japan: Energy and Climate 2006
123
The Japanese government identified the Russian electricity industry as an area for cooperation in promoting Kyoto mechanisms and dispatched study teams and training courses during 1998 and 1999. For example, a survey team of the Japan Electric Power Information Center was dispatched from 29 September to 10 October in 1998 to Eastern Siberia and the Russian Far East in order to evaluate the efficiency of electricity generation and transmission there. The Government organized training courses for executives of the Russian government as well as electric companies in order to support smooth transition to the power sector to market economy. For example, executives from the Ministry of Fuel and Energy (MoFE) of the Russian Federation, RAO-UES, and Irkutsk Energo were invited to attend a training program on the management and operation of electric power companies in a market economy from March 8 to 12 in 1998. Subsequently, experts from MoFE, RAO-UES, and local electric power companies were invited to a training workshop on energy conservation and management of power companies between March 15 and 22, 1998. Executives from the MoFE and Energy of Russia together with personnel in charge of energy conservation from the RAO-UES and executives from private electric power companies were invited to Japan to attend seminars concerning energy conservation between 24 January and 6 February, 1999.
For JI, the Japanese government sent a survey team to explore potential projects under the energy dialogue initiative of the Hashimoto-Yeltsin Plan. On the occasion of then-prime minister of the Russian Federation Sergei Kiriyenko’s visit to Japan in July 1998, survey of 20 promising JI projects was jointly announced by Russia and Japan. Japan’s New Energy and Industrial Technology Development Organization (NEDO) approved feasibility studies for the year 1998. Subsequently, a combined mission composed of the Government and private sector was dispatched to Moscow in November 1999, in order to further discuss the 20 projects with the Russian government and private entities. NEDO approved an additional nine feasibility studies for 1999 (NEDO 2005). The most attractive project types to Japanese industry under the pilot scheme were industrial refurbishment projects in the electricity, steel, and oil-refining sectors, and fuel switching from coal to gas. At least six of these studies were located in the Russian Far East. A breakdown of project types among the feasibility studies is given below:
Project type Number Project type Number
Fuel switching 6 Oil refining industry 6
Pipeline repair 1 Steel industry 5
Renewable energy 1 Electricity industry 10
Coal mine methane 1 Total 30Source: Tangen et al. 2002.
However, the private sector took a rather conservative attitude toward investing in Russia, due to political intervention by the Russian government in companies such as Yukos Oil. The thrust of Japanese-Russian cooperation on promoting JI has weakened since 2000. There have been no more feasibility studies since 2000, except two by NEDO and Japan’s Global Environment Centre Foundation (GEC) in 2003. No feasibility studies have led to implementation of JI projects to date. In addition, the specific arrangement for JI cooperation under the Hashimoto-Yeltsin Plan has not been discussed in

Vol. 6, No. 1 International Review for Environmental Strategies 2006
124
bilateral meetings since 2000. Only the importance of collaboration on further reduction of GHG emissions within the framework of the UNFCCC has been recognized, without further definition of such collaboration being provided. The reasons why none of the feasibility studies have led to implementation are Russia’s uncertain project-approval policy and the lack of guarantees for credit issuance.
In addition, it seems that the Japanese private sector has not been serious about investing in Russia. One expert responding to our survey argued that “most of the people who conducted feasibility studies in Russia were not serious about converting them into real JI projects; they were merely interested in the subsidies.” Such a remark provides evidence that the Japanese pilot JI activities in Russia were initiated by the Government, with only weak motivation on the part of the private sector. Another expert supported this argument by saying that companies also expected subsidies for implementation of projects based on the feasibility studies, but due to the lack of positive developments in Japanese-Russian relations, no funding could be allocated by the Japanese government. In addition, the proposed projects were focused rather on carbon reduction than economic considerations, and consequently were not profitable without government grants or loans.
Japanese industry has expressed some interest in JI projects with the Russian gas giant Gazprom since the intergovernmental cooperation weakened. Nippon Steel Company and the Sumitomo Commercial Investments Corporation are considering US$283 million of JI investment into repairing and modernizing some of Gazprom’s pipelines in Russia. The preliminary studies indicate that GHG reductions could be as much as 5 Mt of CO2 equivalent. This is equal to almost 1 percent of all emissions from Japanese industry (PointCarbon 2002a). Also, Toyota Tsusho has been preparing cooperation with RAO UES (PointCarbon 2002b). However, there have been no further reports on implementation of these projects.
4.2. Energy security of Northeast Asia
Being highly dependent on imports of oil from the Middle East, Japan, Korea, and China are eager to diversify their sources of imported oil and gas. Given that Russia has the seventh-largest oil reserves and the largest reserves of natural gas in the world, these countries, especially Japan and China, look at Russia as an alternative supplier. For example, there has been significant Japanese interest in Russian energy-sector projects, mainly oil and gas extraction, during the last decade. The main rationales for these projects and plans are the geographical proximity to Japan and other issues highlighted in the Japanese energy strategy and mentioned above. Sakhalin Oil and Gas Development Company, a consortium of Japanese companies (JNOC, JAPEX, Itochu, and Marubeni) operating with Exxon Mobil, hold 30 percent of the Sakhalin-1 natural gas pipeline project (Sakhalin-1 2005), and another consortium where Japanese companies Mitsubishi and Mitsui (45 percent of shares together) cooperate with Shell on the similar Sakhalin II project,3 provide examples of cooperation and a good basis for further projects.
The Japanese government and a consortium of companies have been lobbying the Russian government very actively to ensure that that the Russian oil pipeline carrying supplies from Siberian oil fields is routed to Nakhodka on the eastern cost of Russia instead of to Daqing in China, which would
3. For information on Sakhalin II, see http://www.sakhalinenergy.com.

Vol. 6, No. 1 Russia and Japan: Energy and Climate 2006
125
mean that oil did not reach Japan (Oil & Gas Journal 2003). The Russian government had already favored the Chinese option, but Japanese interest and a promise of US$12 billion financing for the project made it reconsider (San Francisco Chronicle 2004). In addition, building the pipeline to Nakhodka would enable exports not only to Japan but also to South Korea, Southeast Asia, and the Pacific coast of the United States. The Russian government prefers this selection of markets over the option of the Chinese market only, which is all that the Daqing route would serve (Daily Yomiuri 2004). Japan has also provided a loan to support the Russia–Turkey gas pipeline “Blue Stream”, which will be using some Japanese pipes produced by Mitsui & Co. Ltd, Sumitomo Corp., and Itochu Corp. (NewsBase 2000).
China has been a net importer of oil since 1993 and has been forecast to import some 60 percent of its oil and 30 percent of its gas by 2020. The Chinese government is trying to address the energy supply security issue by engaging in transnational pipeline projects, development of overseas oil extraction, and development of its domestic gas sector. Dependence on shipped oil imports is a potential source of unwanted foreign pressure, especially from the United States but also from Japan (Strecker Downs 2000). China had the aforementioned pipeline plans with Russia, which could have made China less dependent on the United States and Japan (ibid), but currently it seems that the Japanese offer has gained the support of the Russian government.
Rivalry over energy resources in Asia between Japan and China is a fact (Brooke 2004). Consequently, Japan and Russia are not developing their projects in a vacuum but rather in an environment of interdependence with other actors in the region.
To conclude, there is some cooperation between Russia and Japan, mainly on large-scale energy projects. Failures of the feasibility studies reflect the wider political developments.
5. Context of Kyoto cooperation with Russia
This section explains what is required for Russian compliance under the Kyoto Protocol and outlines other elements of cooperation with Russia.
5.1. Status of Russian compliance4
Institutional compliance under the Kyoto Protocol consists of GHG inventory, registry, and national reporting to the UNFCCC Committee.5 The GHG inventories, which are the basis of institutional compliance under Kyoto, are the main problem for Russia. Without a good-quality GHG inventory, it is impossible to comply with the rest of the requirements of institutional compliance. The federal-level data that have been used so far are too aggregated; hence, the involvement of regions and the application of the available regional data are crucial. Some additional data collection will be required as well. The Russian GHG inventory methodologies are also inconsistent with the Intergovernmental Panel on Climate Change (IPCC) guidelines. This problem could probably be solved at the same time as reform
4. This section is based on Korppoo (2004). 5. In UNFCCC Decision CMP.1 Modalities, Rules, and Guidelines for Emissions Trading under Article 17 of the Kyoto Protocol,
see http://unfccc.int/files/meetings/cop_11/application/pdf/cmp1_16_modalities_rules_and guidelines_art17.pdf.

Vol. 6, No. 1 International Review for Environmental Strategies 2006
126
of data collection, and by providing domestic experts with the necessary resources and training to apply this methodology.
The main gaps in inventory data are as follows:
Forestry inventories are inconsistent with IPCC requirements, and quality varies between regions
Data for gas flaring and coalmine methane are not available or are very approximate
Data for the waste sector are not available
Data for agriculture are very approximate
Some problems with industrial activity data
Lack of data for transport, municipal, and residential fuel consumption
Russia has not established a national registry. However, this is not a serious problem from the compliance point of view. Russian experts argue that it would be quite an easy task to establish a simple national log that would enable Russia to make international transactions at the state level.
The current Russian national reporting could cause a problem for compliance. However, it could be improved fairly easily. Drafting national communications and reporting annual GHG inventories are responsibilities of the Federal Service of Russia for Hydrometeorology and Environmental Monitoring (Roshydromet) together with the Institute of Global Climate and Ecology. More coordination and reassignment of responsibilities could solve the problem. In practice, Roshydromet drafts the sectoral chapters for the national communications and then collects comments from the relevant sectoral ministries. Further involvement of the sectoral ministries in the drafting process would improve the depth of the sectoral chapters. The division of responsibilities between domestic actors is currently under the Government’s consideration. Table 1 summarizes the status of the different aspects of Russian compliance.
Table 1. Status of Russian compliance
Area of compliance Current status in Russia Implications
Emissions Well below target + +
Policies and measures
Enough to show activity +
Registry A simple registry would be easy, quick, and cheap to establish –
Reporting Easy to improve if there were better inventories and more cooperation between administrative units
–
Inventories Data incomplete and quality is not consistent with IPCC requirements – –
Note: Status of Russian compliance: ++ = will not cause problems; + = will not cause serious problems; – = will cause problems that are easy to solve; – – = will cause problems that are difficult to solve
Without full compliance, Russia will be excluded from IET and only able to host JI projects under the more bureaucratic Track 2. Consequently, achieving full compliance should be a priority.

Vol. 6, No. 1 Russia and Japan: Energy and Climate 2006
127
5.2. Joint implementation6
Russia is currently lacking a focal point for JI projects. Kyoto-related legislation is under preparation in Russia and the 2004 National Action Plan lists tasks related to Kyoto implementation and responsible agencies. One of these tasks, allocated to the Ministry of Economic Development and Trade, is establishing a national JI administration.
a. Lessons
The AIJ pilot phase was established in 1995 to gain experience for future project mechanisms. Russia hosted nine official pilot projects and some 25 similar projects implemented outside the official pilot phase.7 The failure level of pilot projects in Russia was high.
The institutional structure of the national administration was the most significant bottleneck in implementing projects in Russia. The fact that over two-thirds of projects fell outside the official pilot scheme in Russia is evidence of the significance of this problem. The project registration process was slow and the division of responsibilities between Russian agencies unclear. Also, legislation-related issues and investing governments’ institutional requirements for cooperation on pilot projects seem to have been barriers to project implementation in some cases.
Investors reported local-level problems with finding a project partner, identifying a project of common interest and benefit, and securing successful implementation of the project. Lack of commitment on the host side, compounded by local physical circumstances, caused problems at the implementation level.
Transaction costs and risks are typically high in Russia, due to anomalies in the economy, infrastructure, and administrative system. It was difficult to secure funding for the pilot projects that did not provide emission-reduction credits carrying economic value. Local co-funding was not available, and most pilot projects were funded completely by foreign investors. These are all symptoms of the unfavorable investment climate. Lessons drawn from the pilot program concerning institutional problems remain relevant to future projects, and this was also recognized by the Japanese experts surveyed. Some practical problems remain, but the situation is gradually improving as eligible Russian project hosts have won international JI project bids. Competitiveness in JI project allocation will reduce the importance of economic problems; however, higher risk and transaction costs remain.
b. Additionality
The additionality rule under the Kyoto Protocol allows credits from emissions reductions generated by project activities only if they are additional to those that might have occurred otherwise. This is a difficult concept to apply in the case of a transition economy such as Russia’s, because the Western economic logic would regard many Russian projects as commercially profitable in the absence of credits from JI. In this case, the expectation is that the project would have happened anyway, and therefore would not fulfill the criterion of additionality. However, in Russia many other constraints, such as
6. Parts of the section to be published in Korppoo, Karas, and Grubb (forthcoming). 7. It was difficult to track down all the similar projects because they were not registered under AIJ. However, the main investor
countries—the Netherlands, the United States, Germany, Sweden, and Finland—reported some 25 projects. No Japanese projects were included. The feasibility studies discussed above were implemented separately from the official AIJ program.

Vol. 6, No. 1 International Review for Environmental Strategies 2006
128
institutional and financial problems, may prevent the implementation of such projects—that is, the general market logic does not always apply (Tangen et al. 2002). Even though the additionality criterion might not rule out too many Russian projects under Track 1, which allows project investor and host to decide on the additionality of a project, it could bar the same projects under Track 2, which is supervised by an external committee.
c. Project type
The greatest practical potential of Russian projects probably lies in fuel switching and energy efficiency improvements in the energy, industrial, and residential/public sectors. These types of projects dominated AIJ pilot projects and the Japanese feasibility studies conducted during the AIJ pilot phase (see the summary in section 4 above). According to Mielke et al. (2004), the majority of JI projects would take the form of investments in new power-generation equipment, reductions in gas losses during transmission, reduction of gas flaring/venting in the oil sector, and energy efficiency investments. Indeed, the gas giant Gazprom lists a range of energy-saving measures at its website (www.gazprom.ru), including gas flow optimization in gas transmission systems, replacement of gas compressor units, implementation of automated control systems, and replacement of boilers (Gazprom 2003). Russia also has significant renewable energy potential, which would be especially appropriate for JI projects. The International Energy Agency (IEA) especially emphasizes the potential of fuel switching from coal to renewables, solar water-heating systems to replace or supplement conventional district heating boilers, and wind power to replace or supplement diesel generators in isolated settlements (IEA 2004). But Mielke et al. (2004) doubt that renewable energy projects could compete with cheap fossil fuel projects in Russia. This may be true for many forms of renewable energy, but biomass might be an exception. There is great potential to switch to local biomass in many northern regions of Russia. In the future, other forms of renewable energy such as wind power and geothermal energy could also play a significant role, as indicated by the project pipeline of RAO UES (Energy Carbon Fund website).
d. Potential hosts
Russian business appears to have recognized the potential for JI and is hoping to explore the opportunities it may provide. For instance, the Dutch ERUPT carbon-credit procurement program has received plenty of expressions of interest from the Russian Federation.8 This is a good sign, since in the past it has been difficult to find reliable project hosts. Indeed, the supply of well-managed projects can be a factor in the Russian JI market. Individual Russian companies, notably RAO UES, which provides 70 percent of electricity and 32 percent of heat in Russia and contributes 30 percent of total Russian GHG emissions (Zelinsky 2004), have spent a great deal of time and resources in preparing projects that could be the subject of JI (Energy Carbon Fund website). The company has identified more than 300 projects that are aimed at improving the energy efficiency of its holdings (Zelinsky 2003). The latest list of RAO UES projects in the pipeline has some energy-sector efficiency projects; however, the main focus of the Energy Carbon Fund seems to be on renewable energy, especially on geothermal energy. RAO UES has implemented a GHG inventory and developed professional JI project-supply services.
8. For further information on ERUPT carbon credit program, see http://www.senternovem.nl/carboncredits/index.asp.

Vol. 6, No. 1 Russia and Japan: Energy and Climate 2006
129
Gazprom’s emissions accounted for some 12.5 percent of Russia’s total in 2000 (Mielke et al. 2000). The company has implemented some pilot projects with the German gas company Ruhrgas, and one project is under consideration with a consortium of Japanese companies. Since Gazprom is the main actor in the Russian gas industry, it is the potential host of most gas-sector projects. The company is planning to attract JI investments to upgrade its infrastructure (Walters 2004) and it has implemented a GHG inventory. However, until now there has been no sign of creating a high-profile JI facility to attract investments, and Gazprom has been cooperating with existing partners instead of looking for new investors (Mielke et al. 2004).
There is a selection of other smaller actors involved in carbon finance. Some industrial actors, such as OJSC Kotlas Pulp and Paper Mill, have submitted project proposals to tenders. In northwest Russia, the local energy-saving companies (ESCOs) have portfolios of projects that were typical of the pilot phase, for example, switching small boiler houses from coal to local biomass and improving the efficiency of buildings. The Moscow-based has submitted proposals to some tenders (National Carbon Sequestration Foundation website). Consequently, it seems that there are some Russian actors able to host JI projects. However, selecting the wrong host is still a significant risk to investment in Russia. Indeed, the tender systems are useful to eliminate incapable hosts.
5.3. International emissions trading
Russia was allocated a significant amount of surplus emission allowances under the Kyoto Protocol, and therefore has allowances to sell in the IET market. These surplus allowances were the legacy of the collapse of the Russian economy and emissions after the dismantling of the Soviet Union in the early 1990s. Contrary to the claims of some observers (Novosti 2004), Russian GHG emissions are not growing as fast as GDP and therefore will not reach the base-year 1990 level by the end of the commitment period. As illustrated in figure 1, Russian GDP was 83.2 percent of the 1990 level in 2003,
50
60
70
80
90
100
1990 1991 1992 1993 1994 1995 1996 1997 1998 1999 2000 2001 2002 2003
% o
f 199
0 le
vel
GDP CO2 emissions
Source: Institute of Energy Investigation of the Russian Academy of Sciences (n.d.)
Figure 1. Trends of Russian GDP and CO2 emissions in 1990–2003

Vol. 6, No. 1 International Review for Environmental Strategies 2006
130
while the corresponding CO2 emission figure was only 68.3 percent of the 1990 level.
Consequently, in theory there should be a lot of allowances to sell without limiting the growth of the Russian economy. But in order to sell this surplus, Russia will need to fully comply with the Kyoto inventory, registry, and reporting requirements. As discussed above, there are still gaps, and if Russia fails to improve its performance, it will be excluded from trading under Kyoto. Indeed, as of June 2005, the Russian government has not performed any Kyoto transactions. Also, the lack of clarity concerning the roles of domestic actors prevails. At the time of writing, no division of responsibilities between domestic actors has been declared and it remains unclear whether the Government is planning to keep the monopoly of trading with allowances or distribute the emitting rights to industrial actors and/or regions in order to let them manage their emissions. These problems also concerned the Japanese experts surveyed. Consequently, institutional problems experienced by pilot project investors in Russia currently apply to purchasing Russian allowances as well.
There has been a long discussion concerning the environmental integrity of replacing real domestic emission-reduction projects with the Russian windfall allowances (see, for instance, Grubb with Vrolijk and Brack 1999). The Russians have indeed argued that the surplus allowances were created by real emissions reductions during the post-Soviet collapse of the economy and are therefore legitimate. However, the Russian government tried to settle the disagreement over this “hot air” trading by suggesting recycling revenues from emissions trading to further emissions-reduction or environmental projects.9 The idea became known as the Green Investment Scheme (GIS) or “greening” (Tangen et al. 2002). However, the idea has not been developed toward practical applications in the case of Russia.10 A theoretical study (ibid.) showed that the opinions of the potential large funders—the EU, Canada, and Japan—differed from each other, so bilateral arrangements would be easier to negotiate than a multilateral scheme. From the Russian side, the most significant problem was once again the lack of institutional setup. The potential investors were expecting the Russian government to suggest how it would manage the GIS funds, while the Russians were waiting for suggestions from the investors. Of course, the lack of clarity concerning the fate of the Kyoto Protocol at the time of the study (2001–2002) might also have held back the practical organization.
The Japanese approach to GIS explored the so-called soft greening options—that is, using revenues for capacity building and even environmental projects without a clear linkage to GHG emissions reductions. This approach may interest the Russian government more than creating an extra bureaucracy for GIS. However, the Japanese government did call for guarantees that these investments would really happen without a cumbersome bureaucracy similar to that for Track 2 JI (Tangen et al. 2002). Indeed, direct emissions trading with Russia is regarded as free transfer of wealth in Japan, and therefore would damage the images of the companies involved.
9. Russian actors used to be offended by the use of the term hot air. Some of them went as far as suggesting another term, fair air,
to replace the troublesome wording (see, for example, International Institute for Sustainable Development). 10. Some other countries, notably Bulgaria, have taken GIS preparations further (World Bank 2004).

Vol. 6, No. 1 Russia and Japan: Energy and Climate 2006
131
GIS is an interesting idea and could indeed be used as a tool to support Russian compliance through forward trading. However, this will require mutual trust between the partners and confidence on the investors’ side that Russia will eventually achieve compliance. Should Russia achieve full compliance, GIS could make the rules of JI more flexible; however, transparency of revenues recycling could cause problems.
6. Discussion: Dynamics of Kyoto cooperation in the energy sector
While Japan’s concern is to diversify its suppliers of oil and natural gas, Russia’s interest lies in diversifying its export destinations into countries such as China, Japan, and Korea (APREC 2003). In this context, the Russian government has been increasingly interested in developing natural resources in the Russian Far East and in eastern Siberia. Various regional pipeline projects that connect such places as Sakhalin, Irkutsk, Yakutsk, and western Siberia with China, Korea, Mongolia, and Japan have been under consideration. This shows that Northeast Asian countries and Russia share a common interest in developing natural resources in the eastern part of Russia. In fact, according to the Asia Pacific Energy Research Centre (APREC), Siberian and Sakhalin resources could supply at least 10 percent of the import demand in North Asia in the next decade (ibid.)
In this context, developing natural resources and enhancing their transportation to Northeast Asian countries seem like potential areas of Japanese-Russian economic cooperation. In this regard, the role of governments is significant due to their dominance over business. The Russian government dominates discussions on energy deals, and indeed needs to act if full compliance under Kyoto is to be achieved. The Japanese government traditionally works closely with the private sector in foreign trade and investment, and could therefore facilitate further climate cooperation by strengthening domestic policies to support Kyoto-related activities by Japanese companies. The current policies were regarded as inadequate by the Japanese experts. Government involvement in deals with Russia could also give confidence to cautious Japanese companies.
The lack of clarity in the Russian institutional setup was regarded as the most significant barrier to Japanese-Russian Kyoto cooperation by the Japanese experts. Clarification by the Russian government of its intention to sell allowances without political intervention was also regarded as a way to support Japanese-Russian Kyoto cooperation. It seems, therefore, that the governments hold the keys to success in Kyoto cooperation.
Finding committed project partners has been difficult in Russia. Japanese companies will probably seek partners in their own field of expertise; for example, steel companies would like to refurbish steel plants. There may be existing relations that can be exploited, or JI projects could contribute to generating new useful relations between Russian and Japanese companies. Also, the same model of ESCOs that has been established in northwestern Russia by European investors could perhaps be established by Japanese investors in the Russian Far East. These ESCOs have received some initial funding from the Norwegian government and further applied project-specific funding from various Nordic financial institutions. ESCOs do business by implementing profitable energy-saving projects. The Japanese government could deal with some of the potential problems with Russian projects by

Vol. 6, No. 1 International Review for Environmental Strategies 2006
132
choosing projects through bidding systems. Choosing partners without a bidding system carries a larger risk of choosing a host that will not deliver on its promises.
Japanese companies have special expertise on pipeline technology that could be used in refurbishing the existing Russian pipeline network, and on the latest—and most efficient—technologies in various industrial sectors, which could legitimately be applied to JI projects. For instance, about 35 percent of feasibility studies looked at introducing combined gas-cycle turbines to replace obsolete technology. In addition, steel-sector and renewable-energy technology transfer provides some opportunities. Track 2 JI would be unlikely to attract Japanese investors, due to frustrating past experiences with the bureaucratic CDM procedure.
There are some projects planned between Russian and Japanese companies. Energy interests dominate project selection, and no Kyoto-related projects have been launched yet in practice. Existing industrial cooperation could facilitate Kyoto projects. Also, existing large-scale energy projects could provide a platform for Kyoto cooperation, as side projects under the existing relations and government agreements. Examples of the forms such cooperation could take are refurbishment of existing pipelines and energy-transfer networks of local communities. These projects could also improve local support for large mining projects such as Sakhalin-1 and Sakhalin II.
It would seem logical that the Russian Far East, as a neighboring region, should have raised the interest of Japanese project investors, but it could not be established based on this study whether this is the case. The feasibility studies show that location is not the main decisive issue: the portfolio of feasibility studies included projects everywhere in Russia, even in the geographically most distant part of Russia, St. Petersburg. Some of the surveyed Japanese experts argued that geographical location was not important to private-sector actors, but public financing institutions such as the Japan Bank for International Cooperation and the Japan Carbon Fund may prefer JI projects in the Russian Far East.
A range of projects is available in the Russian Far East. The region is rich in both fossil fuels and renewable energy, especially wind, hydro, and geothermal energy (Kamchatka; IEA 2003). A portfolio of projects by RAO UES in the Far East is available at the Energy Carbon Fund website. Most of them are in geothermal energy, but wind energy projects and updating of existing power plants are also listed (Energy Carbon Fund website).
The Japanese government has expressed interest in the idea of “greened” trading with Russian “hot air”. But is there potential to use GIS between Russia and Japan in practice? From the Japanese point of view, greened energy projects in the Russian Far East may support Japanese energy supply by improving transport infrastructure, replacing domestic Russian oil and gas consumption with other local sources of energy, or even facilitating energy infrastructure projects that could provide opportunities for fuel switching from coal to gas in Japan. But environmental arguments should be taken into account, since the main point of GIS is to justify trading with the Russian surplus. Renewable-energy projects in the Russian Far East would be attractive from an environmental point of view; however, they might not contribute to achievement of Japanese energy policy goals. Of course, should Russia not achieve compliance, capacity building would be a priority under the GIS arrangement.

Vol. 6, No. 1 Russia and Japan: Energy and Climate 2006
133
7. Conclusion and recommendations
Kyoto-related projects could benefit both Japan and Russia. They could facilitate improved energy security and more affordable Kyoto compliance for Japan, and for Russia, they could facilitate investment in the Russian energy sector, provide assistance to the troubled Russian Far East, and provide a market for Russia’s surplus Kyoto allowances. Some diplomatic disputes may hinder such cooperation; however, positive experiences of the Russian Far East oil and gas extraction projects may pave the way for Kyoto-related projects.
The main criteria for Japanese Kyoto investors include cost-effectiveness of the project and investors’ own expertise. Japanese investors have special expertise in energy efficiency, industrial processes, and fuel transport networks. The importance of geographic location varies between Japanese investors, and it was not possible to establish whether the Russian Far East could be regarded as a priority region. Japanese actors are in principle interested in the Russian surplus AAUs; however, a special greening arrangement is required to facilitate trading. Currently the lack of institutional organization disqualifies Russia as a partner.
The following policy recommendations to enhance chances of cooperation are made based on this study:
Japan could support Russian efforts to achieve compliance under Kyoto by funding local data collection activities and providing expertise on registry and inventories. However, some internal obstacles remain that can only be addressed by the Russian government.
The Japanese government could initiate a dialogue on greening arrangements with the Russian government in order to demonstrate its interest in cooperation under Kyoto. Suggesting a clear institutional setup for transactions and offering an initial bulk buy at set prices would increase the chances of success.
JI projects require a national institutional setup that currently is not complete in Russia. Consequently, it is worthwhile for Japanese investors to wait and see if the Russian institutional setup becomes functional before putting much energy in preparing JI projects with Russia. In any case, it is extremely important to check with the Russian leading agency, the Ministry of Economic Development and Trade, whether a potential Russian project partner can be expected to transfer emission-reduction credits in the future.
The Japanese government should create incentives for Japanese companies to implement Kyoto-related projects if there is political will to facilitate cooperation with Russia.
Larger-scale energy-infrastructure and mining projects may provide Kyoto-related projects with a platform for cooperation that has been difficult to establish between Japan and Russia. The main synergies would include existing relations and government agreements.
The Russian government could try to develop a project portfolio for the Russian Far East and offer it to Japanese investors. RAO UES has already taken some steps toward creating such a project portfolio.

Vol. 6, No. 1 International Review for Environmental Strategies 2006
134
Acknowledgements
The authors would like to thank Kengo Asakura of Asakura Associates, Jusen Asuka of Tohoku University, Sumie Nakayama
of JPower, Yasushi Ninomiya of the Ministry of the Environment of Japan, Yuri Onodera of Friends of the Earth Japan, Taishi
Sugiyama of CRIEPI, and Yutaka Tonooka of Imperial College London for sharing their views. Thank you also to Erik Mielke at
Dresdner Kleinwort Wasserstein, Mikhail Rogankov of RAO UES Energy Carbon Fund, and Evgenii Sokolov of the National
Carbon Sequestration Foundation for their assistance with the research. Anna Korppoo would like to thank the Academy of
Finland for financial support.
References
Agency for Natural Resources and Energy (ANRE). 2005. Energy in Japan 2005. Tokyo: ANRE. http://www .enecho.meti.go.jp/topics/energy2005E.pdf.
AllPolitics. 1997. Clinton, Yeltsin meet today at Denver summit. Russia a player at “Summit of the Eight”. June 20. http://www.cnn.com/ALLPOLITICS/1997/06/20/summit.roundup/.
Asia Pacific Energy Research Centre (APREC). 2003. Energy Security Initiative: Some aspects of oil security. Tokyo: APREC, Institute of Energy Economics, Japan. http://www.ieej.or.jp/aperc/pdf/project2002/security.pdf.
Brooke, J. 2004. Japan and China battle for Russia's oil and gas. http://www.pipeline.com/~rgibson/japanchina.html.
Daily Yomiuri. 2004. Russian ministries endorse Japan’s proposal for Siberian pipeline. Alexander’s Gas & Oil Connections, December 31, 2004. http://www.gasandoil.com/goc/news/nts50409.htm.
Energy Carbon Fund website. Projects presented by ECF. http://www.carbonfund.ru/en/show.cgi?projects.htm.
Gazprom. 2003. Report on environmental protection 2002. http://www.gazprom.ru/eng/articles/article8939.shtml.
Government of Japan. 2002. Japan’s Third National Communication under the United Nations Framework Convention on Climate Change. http://unfccc.int/resource/docs/natc/japnc3.pdf.
———. 2005. Kyoto Protocol target achievement plan. http://www.env.go.jp/houdou/gazou/5937/6699/2278.pdf (in Japanese).
Government of Russia. 2003. The Energy Strategy of Russia for the Period until 2020. http://www.mte.gov.ru/docs/32/189.html (in Russian).
Grubb, M. with C. Vrolijk and D. Brack. 1999. The Kyoto Protocol: A guide and assessment. London: Royal Institute of International Affairs, Energy and Environmental Programme.
International Energy Agency (IEA). 2004. Paris: OECD/IEA. Renewables in Russia: From opportunity to reality. http://www.iea.org/textbase/nppdf/free/2000/renewrus_2003.pdf.
Institute of Energy Investigation of the Russian Academy of Sciences. n.d. Data on Russian GDP and CO2 emissions for 1990–2003. Available via: http://www.energy21.ru.
International Institute for Sustainable Development. Russian view on the future of the Kyoto Protocol. ENB On The Side.http://www.iisd.ca/climate/cop6/side/14_tuesday.html.
Korppoo, A. 2004. Russia and compliance under Kyoto: An institutional approach. Briefing note, December 2004. Royal Institute of International Affairs. http://www.riia.org/pdf/research/sdp/AKDec04.pdf.
Korppoo, A., J. Karas, and M. Grubb, eds. Forthcoming. Russia and the Kyoto Protocol: Opportunities and challenges. London:Royal Institute of International Affairs, Sustainable Development Programme.
Kyodo. 2004. Japan needs to cut emissions by 14 percent from 1990 level for Kyoto pact. November 5.

Vol. 6, No. 1 Russia and Japan: Energy and Climate 2006
135
Mielke, E., P. Spedding, N. Morton, V. Ahuja, R. Beaver, and M. Backman. 2004. Russia and Kyoto: Match made in heaven? N.p.: Dresdner Kleinworth Wasserstein Research.
Mito, T. 2000. Japan’s energy strategy, Russian economic security, and opportunities for Russian energy development: Major issues and policy recommendations. Houston: The James A. Baker III Institute for Public Policy of Rice University. http://www.rice.edu/energy/publications/docs/JES_MajorIssuesPolicyRecommendations.pdf.
Moscow Times. 2005. Russia finds Southern Kurils too rich to give up to Japan. Alexander’s Gas & Oil Connections, February 2, 2005. http://www.gasandoil.com/goc/news/ntr50889.htm.
Muller, B. 2001. Ratifying the Kyoto Protocol: the case for Japanese-Russian joint implementation. Briefing paper, . New SeriesNo. 21, May 2001. Royal Institute of International Affairs, Energy and Environment Programme.
National Carbon Sequestration Foundation website. http://www.ncsf.ru/ru/index.php.
New Energy and Industrial Technology Development Organization (NEDO). 2005. [List of approved feasibility studies in 1999]. http://www.nedo.go.jp/informations/other/110721.html (in Japanese).
NewsBase. Blue Stream partners arrange financing with Italian SACE. Alexander’s Gas & Oil Connections, April 18, 2000. http://www.gasandoil.com/goc/company/cnr01971.htm.
Novosti. 2004. Illarionov: Kyoto Protocol Saps Prospects To Double GDP. Climate Ark Climate Change Portal, September 27, 2004. http://www.climateark.org/articles/print.asp?linkid=35256.
Organisation for Economic Co-operation and Development (OECD). 2004 Russian Federation—Progress and reform challenges.OECD Investment Policy Reviews. Paris: OECD.
Oil & Gas Journal. 2003. Japan to invest in Angarsk-Nakhodka oil pipeline. Alexander’s Gas & Oil Connections, April 16, 2003. http://www.gasandoil.com/goc/news/ntr32070.htm.
PIN. 2004. Energy crisis leaves thousands freezing in Russia's Far East. Alexander’s Gas & Oil Connections, October 16, 2004. http://www.gasandoil.com/goc/news/ntr44394.htm.
PointCarbon. 2002a. Japanese firms consider JI investment in Gazprom pipelines. February 2. http://www.pointcarbon.com /article.php?articleID=3169&categoryID=147.
———. 2002b. Toyota Tsusho seeks Russian carbon credits. February 24. http://www.pointcarbon.com /article.php?articleID=3292.
———. 2005. Japan must spend 2 trillion yen to meet Kyoto target. March 5. http://www.pointcarbon.com /article.php?articleID=7060&categoryID=376.
Prime Minister of Japan website. http://www.kantei.go.jp/jp/singi/ondanka/pc/050330keikaku.pdf.
Royal Institute of International Affairs (RIIA). 2003. Russia/Japan: a lukewarm relationship. Meeting report, July 2003. RIAA, Russia and Eurasia programme. http://www.riia.org/pdf/research/rep/RUSSIA-JAPAN.pdf.
RosBusinessConsulting. 2004. Russian energy industry needs investments. Alexander’s Oil & Gas Connections, December 24, 2004. http://www.gasandoil.com/goc/news/ntr50471.htm.
Sakhalin-1. 2005. Project information—Overview. August 2005. http://www.sakhalin1.com/project/prj_overview.asp.
San Francisco Chronicle. 2004. Oil and natural gas pump new life into Sakhalin Island. Alexander’s Gas & Oil Connections, August 8, 2004. http://www.gasandoil.com/goc/news/ntr43338.htm.
Strecker Downs, E. 2000. China's Quest for Energy Security. Santa Monica, CA: RAND Corporation.
Takahashi, K. 2004. The convoluted case of the coveted Kurils. Asia Times Online. November 25. Available at Alexander’s Gas & Oil Connections. http://www.gasandoil.com/goc/news/nts44994.htm.
Tanaka N. 2000. Japan’s policy toward Russia. Keynote address. http://gsti.miis.edu/CEAS-PUB/200002Tanaka.pdf.
Tangen, K., A. Korppoo, V. Berdin, T. Sugiyama, C. Egenhofer, J. Drexhage, O. Pluzhnikov, M. Grubb, T. Legge, A. Moe, J. Stern, and K. Yamaguchi. 2002. A Russian green investment scheme: Securing environmental benefits from international emissions trading. Climate Strategies.

Vol. 6, No. 1 International Review for Environmental Strategies 2006
136
Walters, G. 2004. Kyoto financial rewards: Who will benefit? St. Petersburg Times, June 15, 2004. http://www.sptimes.ru/archive/times/977/news/b_12716.htm.
World Bank. 2004. Options for Designing a Green Investment Scheme for Bulgaria. Washington, DC: World Bank.
Zelinsky, A. 2003. Emissions trading system in RAO UES reform. Presentation at a side event of the International Emissions Trading Association, “Domestic Greenhouse Gas Emissions Trading Schemes: Update on the Status of Domestic Emissions Trading Systems and Steps to Linking Them”, at COP 9 in Milan, December 8, 2003.
Zelinsky, A. 2004. Kyoto flexible mechanisms: Perspectives for Russian industry. Presentation at EU parlamentary hearings in Brussels, April 26, 2004. http://www.europarl.eu.int/hearings/20040426/itre/zelinsky_en.pdf.

International Review for Environmental Strategies Vol. 6, No. 1, pp. 137 – 152, 2006
© 2006 by the Institute for Global Environmental Strategies. All rights reserved.
137
Research Note
The Use of Residents’ Satisfaction Index in Selective Rehabilitation of Urban Core
Residential Areas in Developing Countries
Abel Afona
Urban planners and elected officials are often under pressure to utilize scarce financial and human resources on selective environmental regeneration programs. Prioritizing such investments is not best based on the guesswork and intuition of those officials. This study posits that priority programs are best identified through a Resident’ Satisfaction Index (RSI), measuring the degree of satisfaction among the public with the environmental amenities available. Data for the study were collected through the use of structured questionnaires administered using stratified random sampling. An Actual-Aspiration Index (AAI) was used to measure the level of importance placed by residents on different amenities. AAI and RSI for each of the 20 objective environmental attributes were measured, and the standard deviation and co-efficient of variations of the two distributions calculated. The study recommends that while priority should be placed on the provision of amenities related to the variables with higher AAI but lower RSI, reasons accounting for residents expressing low AAI and RSI on one or the same set of sensitive amenities should be identified and addressed appropriately.
Keywords: Residents’ Satisfaction Index, Urban regeneration, Public participation, Urban environment, Residents’ Actual-Aspiration Index
1. Introduction
Residents’ satisfaction, as used in this study, refers to the degree of satisfaction felt about the environmental amenities available in different aspects of a residential environment. Information on residents’ satisfaction has become a very useful tool in the hands of housing developers, analysts, and policymakers for a long time now (Galster 1987). This index of satisfaction is capable of being utilized in at least three main situations. These are where:
1. The success of a public-sector, private-sector, or joint housing project is to be evaluated (Afolabi 2001; Cooper 1975; Francescato et al. 1977, 1979; Hourihan 1984; Lansing et al. 1970; Onibokun 1976; Rent 1974)
2. Residents are moving from a residential environment, and factors responsible for such movement (mobility indicators) are to be identified. Studies by Morris et al. (1976), Speare (1974), Speare et al. (1974), and Varady (1983) have found that a Residents’ Satisfaction Index (RSI) could be used in identifying these indicators, especially at the beginning of such movement
a. Lecturer, Department of Urban and Regional Planning, Obafemi Awolowo University, POBox 2014, Obafemi Awolowo Post
Office, Obafemi Awolowo University, Ile-Ife, Nigeria.Tel.: +234 803 3839297.

Vol. 6, No. 1 International Review for Environmental Strategies 2006
138
3. Public and/or private efforts (financial and human) are to be invested in the improvement of a residential environment, and such investments are to be prioritized based on the residents’ perceptions of inadequacies in the existing amenities in their area. The works of Aboyade (2000), Anderson (1983), Graik and Zube (1975), Oladotun (1999), Sanoff and Sawhney (1971), and Western et al. (1974) are good examples of such use of RSI. This is also the use to which RSI is put in this study
One type of zone in the Nigerian urban scenery that needs greater attention in improvement exercises is the core/traditional residential zone. Considering the squalid physical, poor economic, and inadequate infrastructural conditions (Mabogunje 1968; Oduola 1987; Okediji and Aboyade 1967; Onibokun 1972), these areas deserve total clearance. Doing this is extremely difficult for a number of reasons, which are discussed in section 3 of this study. And these areas cannot be left to what Balchin and Kieve (1982) called the do-nothing approach, which would allow them to descend into further decay. This is because the areas are still of importance socially and economically to the people that reside in and outside them, particularly in its provision of housing for low-income earners (Afon 1998; Krapf-Askari 1969; Okewole 1977).
In essence, the selective rehabilitation program is a viable option for raising the environmental quality of core residential zones and indirectly increasing the quality of life of residents therein. To ensure that the exercise achieves its intended objectives, the identification of programs that would meet the aspirations and needs of residents should not be based on the guesswork and intuition of urban and local government administrators.
It is a common practice, especially in developing nations, for elected local government officials to invest public resources in projects initiated according to their intuition and occasionally on the advice of career officials, neither of which methods takes into consideration the needs and aspirations of the end users. Evidence abounds of improvement exercises embarked upon by previous regimes without recourse to consulting the residents. In many such cases, investment of public resources in rehabilitation exercises has had little effectiveness because it has been based on wrong priorities.
Identification of priority projects is a comprehensive decision-making process. A major method of doing this is taking into account the viewpoints of various individuals and different interest groups about the importance placed on, and enjoyment derived from, different environmental attributes. Although the practice of using citizens’ evaluations of environmental services as input in selective rehabilitation exercises has been questioned (Fitzgerald and Derant 1980), there is ample evidence that it is an invaluable tool in identifying priority projects that will meet the needs and aspirations of residents (Davos 1986; Muogholu 1984; Stipak 1979).
This evaluation is done by allowing each individual to assign a number of ratings and/or weights to each of the identified environmental attributes. The aggregated view expressed on each attribute, when arranged in order of magnitude, shows, for example, which of these attributes are considered most important overall.
This approach, according to Sobral and Hipel (1981), is a family of multi-criteria methods. In response to the need for the development of methods for evaluating alternative solutions to

Vol. 6, No. 1 Residents’ Satisfaction Index in Selective Urban Regeneration 2006
139
environmentally sensitive projects, families of multi-criteria model have been proposed in various fields (Central Connecticut State University 2005; Filkins, Allen, and Cordes 1999; Fredrickson et al. 1980; Garlauskas 1975; Grzeskowiak, Sirgy, and Widgery 2003; Opricovic and Tzeng 2003). A careful look at the studies cited above reveals that they all concentrate on advanced countries. This decision-making tool has not often been employed in the developing world. This study is, therefore, aimed at evolving a type of multi-criteria urban environmental decision-making model, tagged RSI, that is appropriate for developing countries. The findings could be used by urban planners and elected officials who are under pressure to utilize scarce financial and human resources to identify priority projects that represent the true needs and aspirations of the people. The study is focused on the traditional residential zone of Ogbomoso City, Nigeria (described in section 3).
2. Issues in residents’ environmental satisfaction
Two contrasting concepts regarding residents’ satisfaction in relation to their residential environment have emerged in the literature. These are the purposive and actual-aspiration gap approaches. The purposive approach is based on the view that there exist certain definitive goals (purposes) that the people want to achieve. These goals are to be achieved through associated goal-directed activities and actions (Galster 1987). In essence, three elements are identified in this approach: the goals, goal-directed actions, and objective environmental attributes. Both the goals and the actions directed towards achieving them are said to be subjective, because they are dependent on individual socio-economic attributes. Canter (1982) and Canter and Rees (1982) observe that the objective environmental attributes have a great influence on goal-directed actions. Thus, the level of residents’ satisfaction is measured in terms of how the objective elements of the environment wherein one resides are perceived as facilitating the goal-directed activities. It therefore follows that where goal-directed actions are inhibited by environmental attributes (natural and/or man-made), irrespective of the social and economic characteristics of residents, environmental satisfaction will be low.
In the actual-aspiration gap approach, the construct of satisfaction rests on the conceptual framework developed by scholars like Francescato et al. (1974, 1977, and 1979), Marans and Rodgers (1975), and Campell et al. (1976). As they postulate, people are seen as having a perception of the main attributes of their physical environment. These attributes are then evaluated against the same people’s aspirations (i.e., the environmental amenities people hope they will be able to enjoy). In this sense, residents are seen as having a cognitive construct of reference conditions for each particular salient feature of the residential environment. Given an environment, then, the quality and quantity of the environmental feature implied by the reference point is dependent on individual self-assessed needs and aspirations (Michelson 1976).
The assessed needs and aspirations are also dependent on individual objective social and economic attributes. If the existing situations of the residential environment are in congruence with (a reasonable portion of) the reference conditions, an affective state of satisfaction is manifested. There is also the possibility that the current environmental variables, when evaluated, are discovered to have fallen short

Vol. 6, No. 1 International Review for Environmental Strategies 2006
140
of the reference situation. In other words, there could be a gap between the aspirations and what the environment offers.
If and when this happens, residents may attempt to reconcile the incongruence by adaptation: their needs have to be redefined and/or modified, resulting in the generation of lower-order aspirations. If they cannot readily adapt, Rossi (1980) observes that options available to residents include altering conditions in their present dwelling unit and general environmental conditions to reduce the degree of dissatisfaction, and moving to another residential area that they believe could meet their aspirations.
The two reactions above may be more or less feasible depending on the household type and context. For instance, the ability to alter one’s residential unit and other environmental features is constrained by economic, social, legislative, and cultural limitations. Realizing the decision to move to another residential district perceived to be more congruous with aspirations is also constrained by these factors.
The issues raised so far have not helped us to identify what is to be done in cases where:
Residents’ degree of dissatisfaction is so high that adaptation is impossible
Alteration to the building unit is constrained
Mobility to other areas is also constrained
What would emerge is a form of forced adaptation. In such a situation, people would be living with tension. Residents’ tension could, however, be eased once the aggregate degrees of satisfaction about each of the main objective attributes of the environment were identified, and resources could be invested to improve these attributes qualitatively and quantitatively in a selective manner. These objective characteristics of the environment may include: physical quality of housing, suitability of the location, the adequacy and efficiency of services (water and electricity), social interaction among neighbors and in the neighborhood, security, economic opportunities, and quality of environmental sanitation, among others (Aboyade 2001; Mabogunje 1974; Oladotun 1999; Onibokun 1978). Some of the above and other environmental attributes are used in the determination of the RSI of the core residential zone of Ogbomoso.
3. The study area
The study area is the core/traditional residential zone of Ogbomoso, the second largest urban center in Oyo state, Nigeria. The town was estimated to cover an area of 27.49 square kilometers in 2003, according to a study of Akinbola (2004). It is located between latitude 8 7 north and 4 15 east. The town consists of two local government councils, created in 1991: Ogbomoso North and Ogbomoso South, whose headquarters are at Kinira and Arowomole respectively. According to the census of 1991, the town has a population of 166,034. More than one-third of this population resideds in the study area. The area has a total of 16 traditional markets (day and night), nine primary schools, four private hospitals, two maternity centers (one private, one government), three government dispensaries, and one government primary health center (Afon 1998).
Two factors were utilized in delineating the study area from the rest of the town. These were (a) historical and (b) physical structure and characteristics of the buildings and the environment.

Vol. 6, No. 1 Residents’ Satisfaction Index in Selective Urban Regeneration 2006
141
Historically, the core area was built prior to the advent of colonialism of the nineteenth century (Mabogunje1967; Okewole 1977). Physically, the area under study is predominantly residential, with many old buildings with mud walls. Many of these buildings are on the traditional courtyard system and their prevalence declines as distance increases from the center (the study area) towards the suburban zone. Besides, the area is still a focus of attraction for residents outside it, especially indigenes of the town. For example, any successful politician in any historic city like Ogbomoso must of necessity start his or her political career from the area. Festivals of cultural and religious significance are celebrated there; and indeed, there is no indigene of the town, irrespective of where he or she currently resides, that does not have what is called a “family house” in the area. The area thus serves as an ancestral place of origin for many residents of the city. Residing in the area is in many respects similar to residing in a rural area, where one is one’s brothers’ keeper. The palace of the king and the houses of traditional chiefs in Yoruba lands (of which Ogbomoso is one) are usually situated in the area (Afon 1998; Krapf-Askari 1969; Mabogunje 1968; Okewole 1977).
Despite these attractive socio-cultural attributes of the area, its environmental problems are multidimensional (Afon 2000; Mabogunje 1968; Oduola 1987; Okediji and Aboyade 1967; Onibokun 1972). For example, water supply to the area is poor and electricity supply equally erratic. The combined effects of this are an unhygienic environment and low output from the operators of local small-scale manufacturing and service industries. A high proportion of houses have leaky roofs and poor ventilation as a result of the small windows and doors. Only a few of them have toilets. Houses are also built close together, with narrow paths connecting them. The physical environmental conditions suggest that total slum clearance would generally be the best option for upgrading the area. However, this would be very difficult, if not impossible, because of the unique characteristics of the area already mentioned. Other problematic peculiarities of the area include:
The large geographical size of the area, which implied that many people will be displaced and thereby have to be resettled (Onibokun 1972)
The social set-up of the area. The area consists mainly of indigenes and early settlers (Mabogunje, 1968) who suffer from abject poverty (Onibokun and Kumuyi 1996)
The unavailability of adequate finance to carry out the tasks that total clearance may require
The social and political chaos that clearance might provoke
The traditional complications of family land ownership
The problem of acquiring land in locations that would be acceptable and economically advantageous to the displaced persons
It therefore follows that selectively rehabilitating the area would go a long way towards improving the living conditions of residents of the study area without destroying the socio-cultural fabric.
4. Methodology: Data collection and analysis
In an earlier work by the author (Afon 2000), some variables with social, economic, and environmental attributes were identified as environmental quality indicators (EQIs). These were those

Vol. 6, No. 1 International Review for Environmental Strategies 2006
142
things that the residents would use to judge the quality of their residential environment, and thus they represented the needs and aspirations of the residents. These variables are used in this study to represent the actual-aspiration of the residents of Ogbomoso.
The concern of the study is the measurement of satisfaction about each of the variables depicting the residents’ actual-aspiration. This measurement is done through the analysis of data collected via structured questionnaires. In administering the questionnaires, the study area was stratified into the political wards used by the Independent National Electoral Commission. The portion of the political ward(s) that extended outside the core area was disregarded. The first building to be sampled was selected randomly. The subsequent units of investigation were chosen at a uniform interval of every tenth building. A household was surveyed in each of the selected buildings, targeting the household head (man or woman). However, where this was not possible, any other person who was not below the age of 18 in the household was targeted. This age limit was based on the assumption that a child under this age was highly unlikely to have an input in the decision about where to live. Research assistants delivered questionnaires to respondents for completion. Where the selected respondent could not read and/or write, the research assistant interpreted and the responses were indicated on the questionnaire accordingly.
Some 219 questionnaires were distributed, out of which 179 (81.74 percent) were recovered. The majority of the questionnaires not recovered went to literate residents, who promised to get the questionnaires completed but failed to do so.
The 20 variables used earlier in the determination of the residents’ EQI were used in this study. The respondents were asked to rate each of the variables using Likert’s scale (Lickert 1961) of very much satisfied, satisfied, just satisfied, dissatisfied, or very much dissatisfied. During analysis, these ratings were assigned weight values of 5, 4, 3, 2, and 1 respectively. The RSI for each of the variables was arrived at by dividing the summation of the weight value (SWV) by the total number of respondents. The SWV is the addition of the product of the numbers of responses to each of the variables and the weight value attached to each rating (see Afon 2000, 118). The RSIs thus ranged between values of 5 and 1.
The mean of the RSI distribution was also computed. Furthermore, the deviation about the mean of each variable, and the variance and standard deviation of the distributions were also calculated to measure the scatter about the mean (Berenson and Levine 1996). The coefficients of variations were calculated to measure the scatter in the data relative to the mean in percentages.
5. Findings
The degree of importance placed on each of the variables, denoted by Actual-Aspiration Index (AAI), is presented in table 1. From the table, it can be seen that the highest AAI was 4.88, while the lowest was 3.59. The amenity with the highest AAI was water availability, while proximity to religious centerhad the lowest. The average AAI for all the identified amenities in the area denoted by y was 4.47. Other environmental variables with AAI higher than y included economic opportunities; clean, healthy environment (environmental sanitation); electricity availability; condition of roads; proximity to health

Vol. 6, No. 1 Residents’ Satisfaction Index in Selective Urban Regeneration 2006
143
facilities; and safety. Each of the variables in this category thus had a positive deviation about the mean of the AAI. Variables with lower AAI than y included the physical condition of housing, proximity to work place, availability of open spaces, amongst friendly people, proximity to public toilet, andproximity to religious center, among others.
Table 1. Residents’ Actual-Aspiration Index on the core area environmental attributes
Environmental attributes SWV (a) AAI )( yy )( yy 2
Water availability 874 4.88 0.41 0.1681
Economic opportunities 861 4.81 0.34 0.1156
Clean, healthy environment 855 4.78 0.31 0.0961
Electricity availability 855 4.78 0.31 0.0961
Condition of roads 848 4.74 0.27 0.0729
Proximity to health facility 846 4.73 0.26 0.0676
Safety 841 4.70 0.23 0.0529
Access to transports network 829 4.63 0.16 0.0256
Access to waste disposal facility 814 4.55 0.08 0.0064
Distance to primary school 813 4.54 0.07 0.0049
Absence of air pollution 801 4.47 0.000 0.0000
Physical condition of housing 798 4.46 -0.01 0.0001
Absence of noise pollution 792 4.42 -0.05 0.0025
Proximity to secondary school 788 4.40 -0.07 0.0049
Proximity to work place 784 4.38 -0.09 0.0081
Access to public toilet 773 4.32 -0.15 0.0225
Amongst friendly people 771 4.31 -0.16 0.0256
Availability of open spaces 740 4.13 -0.34 0.1156
Proximity to recreation facilities 665 3.71 -0.76 0.5776
Proximity to religious center 642 3.59 -0.88 0.7744
Total 89.33 2.2375
Source: Author’s field survey, 2000.
47.420
33.8920AAIy ; variance = 1119.0
202375.2)( 2
Nyyy
Standard deviation (SD) = 33.03354514.01119.0iancevar
Co-efficient of variation = %02.7%10047.433.0%100
ySD
To detect the gap that existed between the residents’ actual-aspiration and the quality and quantity of
the environmental features available to meet those needs and aspirations, the RSI was computed for

Vol. 6, No. 1 International Review for Environmental Strategies 2006
144
each of the variables, as shown in table 2. The value of the RSI has a direct variation with the
satisfaction derived from an attribute. It was established that the highest RSI was 4.13, while the lowest
was 2.56. The average RSI for the study area, represented by y, was 3.30. Therefore, the deviations
around the mean of the highest and the lowest RSI were respectively +0.83 and –0.74.
Table 2. Residents’ Satisfaction Index (RSI) on the objective environmental attributes
Environmental attribute SWV (a) a/179 )( xx )( xx 2
Amongst friendly people 740 4.13 0.83 0.6889
Proximity to religious center 685 3.83 0.53 0.2809
Condition of roads 685 3.83 0.53 0.2809
Proximity to work place 680 3.80 0.50 0.2500
Access to transport network 669 3.73 0.43 0.1849
Safety 668 3.73 0.43 0.1849
Physical condition of housing 668 3.73 0.43 0.1849
Availability of open spaces 612 3.42 0.12 0.1444
Distance to primary school 594 3.32 0.02 0.0004
Economic opportunities 593 3.31 0.01 0.0001
Access to waste disposal facility 592 3.31 0.01 0.0001
Proximity to secondary school 561 3.13 -0.17 0.0289
Electricity availability 558 3.12 -0.18 0.0324
Proximity of health facility 552 3.08 -0.22 0.0482
Absence of noise pollution 592 2.96 -0.34 0.1156
Clean, healthy environment 512 2.86 -0.44 0.1936
Absence of air pollution 495 2.77 -0.53 0.2809
Proximity to recreation facilities 487 2.72 -0.58 0.3364
Access to public toilet 472 2.64 -0.66 0.4356
Water availability 458 2.56 -0.74 0.5476
Total 65.99 4.2196
Source: Author’s field survey, 2000.
30.320
99.65NRSIx
Variance = 2110.0202196.4)( 2
Nxxx
Standard deviation (SD) = 45.02110.0var iance
Co-efficient of variation = %64.13%10030.345.0%100)(
xSD

Vol. 6, No. 1 Residents’ Satisfaction Index in Selective Urban Regeneration 2006
145
To reveal the importance of the degree of satisfaction expressed by residents, in the next stage of analysis the 20 variables were classified into four main groups, as presented in table 3. These were:
Group A: Variables with positive deviation about the mean of AAI (in table 1) but with negative deviation about the mean of RSI (in table 2). These were environmental variables that were considered to be very basic to human existence. The variables represented services without which life would be uncomfortable and/or practically difficult; that is, the residents’ actual-aspiration on these variables was high. However, the present levels of services and infrastructural facilities that could support meeting these needs and aspirations were inadequate. These variables were water availability; clean, healthy environment; electricity availability; and proximity to health facilities. Their deviations around the AAI mean were respectively, 0.44, 0.34, 0.30, and 0.29. The respective deviations about the RSI mean were –0.74, –0.44, –0.18, and –0.22. The variable absence of air pollution had 0.00 deviation around the mean of AAI, but –0.34 about that of RSI.
Group B: The second group of variables were those not considered to be of high priority in meeting the needs and aspirations of residents, but which all yielded very high satisfaction. Each of these variables had negative deviation about the mean of AAI and positive deviation about the mean of RSI. Variables in this category were amongst friendly people, proximity to work place, proximity to religious center, physical condition of housing, and availability of open spaces. Some of these variables were elements that have become part of the cultural life of the residents of the study area, hence they were no longer considered important.
Group C: The third group consisted of variables that had positive deviations about both AAI and RSI means. Environmental amenities in this group were considered to be of some importance. Moreover, satisfaction was also derived from the associated facilities. The environmental attributes in this category were economic opportunities, condition of roads, access to transport network, safety, access to waste-disposal facility, and distance to primary school. Their deviations about the means of AAI and RSI were, respectively, 0.34 and 0.01; 0.27 and 0.53; 0.16 and 0.44; 0.23 and 0.43; 0.08 and 0.01; and 0.07 and 0.002. Indeed, the deviation about the mean of the satisfaction index of each of condition of roads,access to transport network, and safety was higher than their respective AAI. This implies that facilities related to these variables were available in both quantity and quality that greatly satisfied the residents. For example, almost all roads in the area were laid with asphalt. The safety of life and property in the area was also ensured. However, there was a wide gap between the deviations about AAI and RSI means for variables like economic opportunities and access to waste-disposal facility. This is an indication that there was a need for improvement in these environmental attributes in order that residents’ satisfaction might be maximized.

Vol. 6, No. 1 International Review for Environmental Strategies 2006
146
Table 3. The grouping of the variables based on the deviation about the means of AAI and RSI
Group Environmental attributes
Deviationabout AAI
mean
Deviationabout RSI
mean
Water availability +0.41 –0.74
Clean, healthy environment +0.31 –0.44
Electricity availability +0.31 –0.18
Proximity to health facilities +0.26 –0.22
A
Absence of air pollution +0.00 –0.34
Amongst friendly people –0.16 +0.83
Proximity to work place –0.09 +0.50
Proximity to religious center –0.88 +0.53
Physical condition of housing –0.01 +0.43
B
Availability of open spaces –0.34 +0.12
Economic opportunities +0.34 +0.01
Condition of roads +0.27 +0.53
Access to transport network +0.16 +0.44
Safety +0.23 +0.43
Access to waste disposal facility +0.08 +0.01
C
Distance from primary school +0.07 +0.02
Proximity to secondary school –0.07 –0.17
Access to public toilet –0.15 –0.66
Proximity to recreation facilities –0.76 –0.58
D
Absence of noise pollution –0.05 –0.34
Source: Author’s field survey, 2000.
Group D: The fourth group of variables observable in the study had negative deviations about the means of both AAI and RSI. These variables were proximity to secondary school, with deviations of –0.07 (about AAI mean) and –0.17 (about RSI mean); access to public toilet (–0.015 and –0.66); proximity to recreation facilities (–0.76 and –0.58); and absence of noise pollution (–0.05 and –0.34). The amenities relating to these variables were those that were not seen as being of any significance in shaping the quality of the living environment, or for which there was an acceptable substitute. At the same time, the satisfaction derived from the existing services relating to them was also low. For example, there was not a single secondary school in the core area of Ogbomoso; yet this did not affect residents too much as there were secondary schools outside the area that were within a reasonable distance.

Vol. 6, No. 1 Residents’ Satisfaction Index in Selective Urban Regeneration 2006
147
There were public toilets located in the study area, although residents were not happy with them, probably because the toilets were not well kept, so many residents found them difficult to use. However, access to public toilets was not among residents’ indispensable needs and aspirations. This is likely because (a) some residents have toilets in their houses, and (b) those who do not have toilets in their houses often use available open spaces as toilets.
The scatters around the means of the two distributions (AAI and RSI) were small. This implied that the AAI and RSI values of all the variables cluster around their respective mean. The computed AAI variance was 0.1089, with a standard deviation of 0.33. The RSI distribution recorded a variance of 0.2049 and a standard deviation of 0.45. The co-efficients of variation were 7.38 percent and 13.04 percent for AAI and RSI respectively. From these computations, it could be inferred that the scatter of the data relative to the mean was higher in RSI than AAI. This is so as the satisfaction enjoyed by residents from the environmental attributes was more varied, as revealed by the range. The range of AAI distribution was 1.29 (4.88–3.59), while that of RSI was 1.57 (4.12–2.56).
6. Implications and conclusion
Two of the above four groupings are of particular interest to this study. First is group A, of variables with positive and negative deviations about the means of AAI and RSI respectively. These were the elements in the residential environment that were crucial to the healthy living conditions of the residents, but for which the facilities were grossly inadequate.
For selective rehabilitation to really improve the living conditions of the residents of the area, attention must be focused on adequate water and electricity supply, improvement of environmental sanitation, and improvement of access to health facilities in the area. These are true reflections of the environmental problems of the core area of Ogbomoso at the time of the study. For instance, the Water Corporation of Oyo State, through the Urban Water Supply Scheme, could supply only 1 percent of water requirements of the town in 1998 (Afon 1998, 97–99). Nothing has improved since. People of the study area travel up to 3 kilometers in search of well water at the outskirts. The indiscriminate sinking of wells has not solved the problems of water supply. It is suggested that the Water Corporation of Oyo State, in collaboration with the two local governments in the town, should carry out rehabilitation of the urban water supply scheme. Funds for such rehabilitation could be sourced from the Urban Development Bank, the World Bank, or similar agencies. However, effective financial planning and methods to recover costs from the consumers must be worked out.
Electricity supply to the town is also very poor. While the Power Holdings Company of Nigeria (PHCN), formerly known as the National Electric Power Authority, is presently undertaking serious efforts to improve power supply, the populace must also be educated on the need to pay their bills promptly and to stop vandalizing power-supply equipment. The present low level of residents’ satisfaction with public utilities is one of the reasons for their unwillingness to pay charges. The author is of the opinion that the local governments could purchase electric power transformers, on terms to be agreed upon by PHCN and the local governments. Doing this would be far more rewarding than creating television viewing centers, which are hardly patronized by residents.

Vol. 6, No. 1 International Review for Environmental Strategies 2006
148
More public health facilities should be provided in this area. At present within the study area there is not a single public hospital and only one primary health center, in Ogbomoso South. The services of the private hospitals in the area are very costly and, therefore, out of the reach of the majority.
All this selective rehabilitation work should be on the priority lists of the state and local governments. When substantial improvement has been recorded in these important areas, investment can then be directed to other environmental attributes with lower priority.
The second group of particular interest is group C, comprising variables with positive deviations about the means of both AAI and RSI. These variables can be further subdivided into those that have fairly high and those that have fairly low positive deviations about the mean of RSI. Included in the first category are variables like condition of roads and safety. It is suggested that roads must be maintained so that their condition will not depreciate and reduce residents’ satisfaction. The security apparatus put in place through the use of traditional hunters and vigilante groups should be integrated with the efforts of police patrols to ensure sustainable security in the area.
Efforts should be made to increase residents’ satisfaction on variables like economic opportunities,access to waste-disposal facility, and distance to primary school, which have relatively low deviation about the mean of RSI. There is a need for an organized day market, which would improve economic opportunities for residents. The existence of several small markets in the study area does not encourage economics of agglomeration, as the level of economic activities in each is low. Indeed, some of these markets are threats to the free flow of traffic during peak periods. The absence of an organized market is further robbing the two local governments of the opportunity to raise internally generated revenue.
The primary schools in the core area need to be maintained physically and should be equipped with instructional materials. Most of the primary schools in the area are mission schools built a long time ago. Their present physical condition is poor. The low level of satisfaction expressed relative to a higher actual-aspiration level indicates that this important level of education needs attention.
Residents’ satisfaction with the solid-waste management services of the local government in the core area was also very low. In some areas, refuse bins are provided, but the system of collection by the local government is poor. It is suggested that thorough financial planning for solid-waste management is carried out and effective cost-recovery strategies put in place. This will allow the people to participate in the running of the affairs of local government.
While this study opines that these two groups of variables in the core area should be pursued based on suggested priorities, other existing areas where people have been satisfied should not be allowed to deteriorate. The satisfaction enjoyed by residents with social interactions should continue because that is the basis of African communal existence. Even environmental variables that were not considered to be of high priority by residents in the determination of environmental quality, like proximity to religious center, should not be tampered with considering the recent religious crises in some parts of the country.
There is a need to comment briefly on the fourth group of variables identified. The negative deviations about the means of both AAI and RSI on an important environmental consideration like access to public toilet, where a high proportion of the houses in the study area has no toilet facility, calls for concern. That people do not attach much importance to it despite the poor and unsanitary conditions of the few

Vol. 6, No. 1 Residents’ Satisfaction Index in Selective Urban Regeneration 2006
149
existing public toilets suggests two things. In the first place, there is the possibility of accessible substitutes. This includes open spaces, buildings under construction, and riverbanks, all of which are environmentally unfriendly means of disposing of human waste. Second, it indicates that residents do not know the health implications of disposing of excreta in an unsanitary manner. It therefore calls for caution when RSI is used in selecting rehabilitation priorities; negative deviation about the mean of the AAI of an environmental facility does not necessarily mean that it is actually less important, though it may be considered to be so by residents. Facilities relating to sensitive issues like environmental sanitation should be provided in sufficient quantity and be kept in good sanitary condition. In addition, that residents do not attach much importance to sanitation facilities despite very low satisfaction with existing services (as in this study) implies that the need for environmental education is imperative.
In identifying priority projects when selective rehabilitation is to take place in either developed or developing economies, RSI is a feasible and easy-to-use tool. And where all the four categories of variables are identified, efforts must be made to identify reasons why residents would consider some crucial and sensitive environmental amenities as not important in the first place and, at the same time, rate their satisfaction very low. This is necessary as it may imply that what is required is more than simply providing physical facilities but also environmental education.
References
Aboyade, F. 2000. A study of residents’ satisfaction in slum condition in Lagos State. BTech project, Department of Urban and Regional Planning, Ladoke Akintola University of Technology, Ogbomoso, Nigeria.
Afolabi, O. A. 2001. An evaluation of the effectiveness of housing provision strategies. through low cost housing schemes. The case of Offa-meta Estate, Oyo. BTech project, Department of Urban and Regional Planning, Ladoke Akintola University of Technology, Ogbomoso, Nigeria.
Afon, A. O. 1998. Perception of environmental quality of the core of Ogbomoso in Oyo State. MSc thesis, Department,of Urban and Regional Planning, Obafemi Awolowo University, Ile-Ife, Nigeria.
———. 2000. The use of residents’ Environmental Quality Indicator (EQI) data in the core residential housing improvement. In Effective housing in the 21st century Nigeria, ed. O. B. Akinbamijo, A. S. Famehinmi, D. R. Ogunsemi, and A. Olotuah, 115–122. Akure: The Environment Forum.
Anderson, J., S. Weidman, and D. Butterfield. 1983. Using residents’ satisfaction to obtain priorities for housing rehabilitation. In Renewal, rehabilitation and maintenance vol. 1, 149–160. Galve, Sweden: National Swedish Institute for Building Research.
Berenson, M. L. and D. Levine. 1996. Basic business statistics: Concepts and applications. New York: Prentice Hall International Plc.
Balchin, P. N. and J. L. Kieve. 1982. Urban land economics. London: Macmillan Press Ltd.
Campbel, A., P. Converse, and W. Rodgers. 1976. The quality of America life. New York: Rusell Sage Foundation.
Canter, D. 1982. The purposive evaluation of places: A facet approach. Environment and Behaviour 15:659–698.
Canter, D. and K. Rees. 1982. A multivariate model of housing satisfaction. International Review of Applied Psychology 31:145–151.
Central Connecticut State University. 2005. Citizen satisfactory survey: Town of Manchester. New Britain, Connecticut: Center for Public Policy and Social Research, Central Connecticut State University.
Cooper, C. 1975. Easter-Hill villages: Some social implications of design. New York: Free Press.

Vol. 6, No. 1 International Review for Environmental Strategies 2006
150
Davos, C. A. 1986. Group environmental preference aggregation: The principle of environmental justice. Journal of Environmental Management 1:565–594.
Filkins, R., J. C. Allen, and S. Cordes. 1999. Predicting community satisfaction among rural residents: An integrative model. Journal series no. 12,451. Lincoln, Nebraska: Agricultural Research Division, University of Nebraska.
Fitzgerald, M. A. and R. F. Dorant1980. Citizens’ evaluation and urban management: Service delivery in an era of protest. Public Administration Review 40:547–569.
Francescato, G., S. Weidemann, J. Anderson, and R. Chenoweth. 1974. Evaluating residents’ satisfaction in housing for low and moderate finance families. In Man-environment interactions: Evaluations and applications vol. 5 (Methods and Measures), ed. D. Carson, 285–296. Washington, D C: Environmental Design Research Association.
Francescato, G. 1977. Predictors of residents’ satisfaction in high-rise and low-rise housing. In Human responses to tall buildings,ed. D. Conway, 160–167. Stroudsburg, PA: Dowden, Hutchinson, and Ross.
———. 1979. Residents’ satisfaction in HUD-assisted housing: Design and management factors. Washington, DC: U.S. Department of Housing and Urban Development.
Fredrickson, C., H. Tim, F. Glenn, and J. Z. James. 1980. Residential preferences in a model of migration intention. Population and Environment 3:280–297.
Galster, G. 1987. Identifying the correlates of dwelling satisfaction: An empirical critique. Environment and Behaviour 19(5):539– 568.
Garlauskas, A. B. 1975. Conceptual framework of environmental management. Journal of Environmental Management 3:185–203.
Graik, K. and E. Zube. 1975. Issues in perceived environmental quality research... Institute for man and Environment, University of Massachusetts.
Grzeskowiak, S., J. M. Sirgy, and R. Widgery. 2003. Residents’ satisfaction with community services: Predictors and outcomes. Journal of Regional Analysis and Policy 33(2): 1–36. http://www.uwex.edu/ces/cced/jrap/Sergy1.pdf.
Hourihan, K. 1984. Context-dependent models of residential satisfaction. Environment and Behaviour 16:369–393.
Isola, O. A. 2001. An assessment of residents’ patronage of health facilities: A case study of Ogbomoso South local government.BTech project, Department of Urban and Regional Planning, Ladoke Akintola University of Technology, Ogbomoso, Nigeria.
Krapf-Askari, E. 1968. Yoruba towns and cities–An enquiry into the nature of urban social phenomena. Oxford: Clarendon Press.
Lansing, J., R. Marans, and R. Zehner. 1970. Manned residential environments. Ann Arbor: Institute of Social and Research, University of Michigan.
Likert, R. 1961. New patterns of management. New York: McGraw-Hill.
Mabogunje. A. L. 1968. Urbanization in Nigeria. London: University of London Press.
———. 1974. Towards an urban policy in Nigeria. Nigeria Journal of Economic and Social Studies 16(1):85–98.
Marans, R. and W. Rodgers. 1975. Toward an understanding of community Satisfaction. In Metropolitans America in contemporary perspective, ed. A. Hawley and W. Rock. New York: Halsted.
Michelson, W. 1976. Man and his urban environment: A sociological approach. Reading, Massachussets: Addison Wesley.
Morris, E., S. Crull, and M. Winter. 1976. Housing norms, housing satisfaction and the propensity to move. Journal of Marriage and Family 38:309–320.
Muogholu, L. N. 1984. Environmental factors in public housing satisfaction as potential management data: Lesson from Nigeria. Journal of Environmental Management 19:291–305.
Okewole, I. A. 1977. An approach to intergration between the traditional and contemporary areas in Ogbomoso. MSc thesis, Department of Urban and Regional Planning, Ahmadu Bello University, Zaria, Nigeria.
———. 1987. Human behaviour settings: A comparative analysis of adaptation of residential environment in Ibadan, Nigeria. PhD thesis, Department of Town and Country Planning, University of Manchester, England.

Vol. 6, No. 1 Residents’ Satisfaction Index in Selective Urban Regeneration 2006
151
Okediji, F. O. and O. Abayade. 1967. Social and economic aspects of environmental sanitation in Nigeria. A tentative report. Reprint series no. 4. Ibadan, Nigeria: NISER.
Oduola, D. 1987. Urban Renewal: Implementation Strategies. In Urban renewal in Nigeria, ed. G. A. Onibokun, F. Olokesusi, and L. Egunjobi, 44–50. Ibadan: NISER/CURP.
Oladotun, O. 1999. The evaluation of residents’ satisfaction of public utilities in Ogbomoso North Local Government Area. BTech project. Department of Urban and Regional Planning, Ladoke Akintola University of Technology, Ogbomoso, Nigeria.
Onibokun, A. G. 1972. Nigerian cities: Their rehabilitation and Redevelopment. Journal of the Royal Town Planning Institute LVIII(2):51–56.
———. 1974. Evaluating consumers satisfaction with housing: An application of a system approach. Journal of American Institute of Planners 46: 189–200.
———. 1976. Social system correlate of residential satisfaction. Environment and Behaviour 8(3):323–344.
Onibokun, A. G. and A. J. Kumuyi. 1996. Urban Poverty in Nigeria: Towards sustainable strategies for its alleviation. Ibadan,Nigeria: CASSAD.
Opricovic, S. and G. Tzeug. 2003. Fuzzy multi-criteria model for postearthquake land-use. Natural Hazards Review 4(2):59–64.
Rent, G. 1974. Low-income housing in South Carolina: Factors related to residential satisfaction. Princeton, NJ: Princeton University Press.
Rossi, P. 1980. Why people move. Newbury Park, California: Sage Publications.
Sanoff, H. and M. Sawhney. 1971. Residential livability in Roleigh: Urban Affairs and Community Service. North Carolina State University .
Sobral, M. M. and K. W. Hipel. 1981. Multi-criteria model for solid waste management. Journal of Environmental Management 12: 97–110.
Speare, A., S. Goldstein, and S. Frey. 1974. Residential mobility, migration and metropolitan change. Cambridge, Massachusetts: Berhnger.
Speare, A. 1974. Residential satisfaction as an intervening variable in residential mobility. Demography 11:173–188.
Stipak, B. 1979. Citizen satisfaction with urban services: Potential misuse as a performance indicator. Public Administration Review 39:46–52.
Varady, D. 1983. Determinants of residential mobility decisions. Journal of the American Planning Association 49:184–199.
Western, J., P. Weldon, T. and Haung, T. 1974. Housing and satisfaction with environment in Singapore. Journal of the American Institute of Planners 40: 201–208.

Vol. 6, No. 1 International Review for Environmental Strategies 2006
152

International Review for Environmental Strategies Vol. 6, No. 1, pp. 153 – 168, 2006
© 2006 by the Institute for Global Environmental Strategies. All rights reserved.
153
Current development
Implementing the Clean Development Mechanism in China
Duan Maoshenga and Erik Haites b
China accounts for a significant share of global clean development mechanism (CDM) potential. So far, China has lagged behind other large developing countries, such as Brazil and India, in implementing a system for approval of CDM projects. But China now has the foundations for effective participation in the CDM. Eighteen projects had been approved and three had been registered by the CDM Executive Board by the end of 2005. China’s CDM rules have been published, with several aspects of the previously draft CDM rules being modified or clarified. However, the CDM knowledge and awareness of policymakers at the local level needs to be enhanced, and to enable implementation of CDM projects in the rapidly developing energy sector, which is a high priority for China, capacity building for development and commercial banks serving this sector is urgently required.
Keywords: China, Clean development mechanism
1. Introduction
The clean development mechanism (CDM) allows greenhouse-gas emission-reduction and afforestation/reforestation projects in developing countries that have ratified the Kyoto Protocol to earn certified emission reductions (CERs).1 CERs can be used by industrialized countries that have national emission-limitation commitments under the Kyoto Protocol (Annex I parties) to help meet those commitments.2
To earn CERs, a CDM project must go through an international approval process, which includes approval by the host country, supervised by the CDM Executive Board. The main purpose of the international process is to ensure that the emission reductions or removals are additional to any that would occur in the absence of the project. The designated agency of the host government (designated national authority) must approve the project and indicate that the project assists the country in achieving sustainable development.
a. Associate Professor, Global Climate Change Institute and Institute of Nuclear and New Energy Technology, Tsinghua
University, Beijing, China. Corresponding author, Margaree Consultants Inc., 120 Adelaide Street West, Suite 2500, Toronto M5H 1T1, Canada. Tel. +1
416 3690900, Email: [email protected]. President, Margaree Consultants Inc., Toronto, Canada. 1. Afforestation/reforestation projects can earn temporary CERs (tCERs) or long-term CERs (lCERs), which are subject to rules
designed to ensure the permanence of the removal. In this paper, CERs should be interpreted to include tCERs and lCERs unless specifically stated otherwise.
2. In addition, installations subject to the European Union Emissions Trading Scheme can use CERs for compliance with their obligations from 2005.
Vol. 6, No. 1 International Review for Environmental Strategies 2006
154
Various estimates and indicators suggest that China represents a significant share of the global CDM potential. Thus, the manner in which the CDM is implemented in China could affect the global supply and market price of CERs.
This paper describes the enabling environment for CDM projects in China. Section 2 summarizes the estimates of CDM potential for China. Section 3 outlines the roles and responsibilities of government agencies involved in the approval of a CDM project. Section 4 presents the requirements the Chinese government has established for CDM projects. The contribution to sustainable development criteria, environmental impact assessment (EIA) requirements, and public consultation requirements for CDM projects are presented in the next three sections. Section 8 discusses financing of CDM projects by development and commercial banks in China. Section 9 analyzes the possible synergy between the CDM and China’s energy program. How to realize China's CDM potential is discussed in section 10. Section 11 draws some conclusions.
2. Estimates of CDM potential
Table 1 presents several estimates and indicators of the regional distribution of CDM potential. The data cover all developing countries regardless of their ratification of the Kyoto Protocol. The definitions of the regions may differ among data sources. Some of the estimates include sinks while others do not. Several of the indicators are not directly related to greenhouse gases, but those that are focus only on energy-related CO2 emissions.
The data suggest that China has 25 percent to 45 percent of the global CDM potential for greenhouse gas emission reduction and removal. China's potential is roughly equivalent to that of the rest of Asia and larger than that of Latin America, Africa, or the Middle East.
China's potential is not yet reflected in registered CDM projects. As of December 31, 2005, only three CDM projects from China had been registered and they represented 1.2 percent of the annual reductions of the 63 projects registered. The projects submitted for validation as of December 22, 2005 suggest that China may achieve its estimated potential for greenhouse gas emission reductions. The 22 projects in China account for 35 percent of the total annual emission reductions of the 513 projects submitted for validation as of that date (Fenhann 2005). However, four HFC-23-destruction projects represent 94 percent of China’s total annual reductions.3 India and Brazil, with about 200 and 100 projects submitted for validation as of December 22, 2005 each account for about 17 percent of the total annual emission reduction. India (39 percent) and Brazil (16 percent) dominated the emission reductions from developing countries sold between January 2004 and April 2005 (Lecocq and Capoor 2005, 23, figure 3).4
3. HFC-23 is one of the hydrofluorocarbon family, chemical compounds that are potent greenhouse gases regulated by the Kyoto
Protocol. The total annual emission reductions, as in the case of China, are strongly influenced by nine HFC-23-destruction projects, which account for 45 percent of the total (Fenhann 2005).
4. The data have been adjusted to exclude sales of emission reductions originating in OECD and Transition Economy countries. The rest of Latin America (27 percent) and the rest of Asia (18 percent) account for the balance of the sales during this period.

Vol. 6, No. 1 Implementing the Clean Development Mechanism in China 2006
155
As of December 31, 2005, China had approved 18 proposed CDM projects and provided a letter of no-objection for 10 others. These 28 projects include eight methane-recovery-and-utilization projects, 11 wind-power, three small-hydropower, one energy-conservation, four HFC-23-destruction, and one fuel-switching project. All of the projects, except the HFC-23-destruction and fuel-switching projects, fall into China’s priority areas for CDM projects, but the HFC-23 projects dominate the annual emission reductions.
Table 1. Estimates and indicators of the regional distribution of CDM potential
China Asia ex. China Latin America Africa Middle East
Estimates of CDM potential
Jakeman et al. (2001)a 31% 31% 12% 4% 9%
Jotzo and Michaelowa (2002)b 47% 25% 7% 11% 11%
Sijm et al. (2000)c 71 to 78% 10 to 13% 5 to 8% 4 to 11%
Trexler and Associates (2003) 63 to 75% 7 to 15% 5 to 14% 9 to 13%
Indicators of CDM potential
World energy-related CO2 emissions2010 d
35% 30% 14% 8% 13%
CO2 emissions growth 2000 to 2010 d 45% 26% 13% 5% 10%
World population 2000e 26% 42% 11% 13% 8%
World GDP 2000 (purchasing power parity)e
26% 36% 20% 6% 12%
World GDP 2000 (market exchange rates)f
18% 37% 25% 10% 10%
Projected 2010 world GDP (market exchange rates)f
23% 39% 21% 9% 8%
World official development assistance 1997–2001g
4% 33% 13% 50% –
World foreign direct investment 1997–2002g
26% 15% 50% 9% –
Projected energy investment 2001–2010h
30% 25% 18% 13% 14%
Sources: a. Jakeman et al. 2001, 14: CDM potential in 2015, table 3. b. Jotzo and Michaelowa 2002, 187: non-sinks potential in 2010, table 4. c. Sijm et al. 2000, 38: cases A and B, table 4.5. d. Energy Information Administration 2003, 191: energy-related CO2 emissions and emissions growth, table A-10. e. World Resources Institute 2005. f. Energy Information Administration 2003, 184: GDP at market exchange rates, table A-3. g. World Bank 2003, 200: official development assistance, table A.21; 208: foreign direct investment, table A.29. h. International Energy Agency 2003b, 47: table 2.3.
3. Institutional structure for CDM projects in China
The Chinese government has long recognized the importance of mitigating climate change as an important part of sustainable development. In February 1990, the State Council established the National

Vol. 6, No. 1 International Review for Environmental Strategies 2006
156
Climate Change Coordination Committee to coordinate and formulate policies and measures with regard to climate change. As part of the governmental reorganization in 1998, the State Council replaced it with the new National Coordination Committee on Climate Change (NCCCC). In March 2003, China’s new State Council restructured some government institutions, which affected the membership of the committee. The membership of the NCCCC, and of the National CDM Board (NCDMB) as of December 31, 2005 are shown in table 2.
Table 2. Members of the National Coordination Committee on Climate Change (NCCCC) and National CDM Board (NCDMB)
NCCCC NCDMB
National Development and Reform Commission (NDRC) Chair Co-chair
Ministry of Science and Technology (MOST) Vice-chair Co-chair
Ministry of Foreign Affairs (MFA) Vice-chair Vice-chair
China Meteorological Administration Vice-chair Member
State Environmental Protection Administration Vice-chair Member
Ministry of Finance Member Member
Ministry of Agriculture Member Member
Ministry of Water Resources Member –
Ministry of Communications Member –
Ministry of Construction Member –
Ministry of Commerce Member –
State Forestry Administration Member –
State Oceanic Administration Member –
Chinese Academy of Sciences Member –
Civil Aviation Administration of China Member
The NCCCC is responsible for coordination of important activities, policies, and measures relating to climate change. NCCCC staff, located in the NDRC offices, are responsible for coordination and management of domestic activities relevant to climate change, especially activities related to the implementation of the United Nations Framework Convention on Climate Change (UNFCCC).
On June 30, 2004, the Interim Measures for Operation and Management of Clean Development Mechanism Projects in China came into force and established the rules and procedures for management of CDM projects in China. Based on the experience gained through the approval of CDM projects as well as feedback from stakeholders, the Chinese government issued the Measures for Operation and Management of Clean Development Mechanism Projects in China on October 12, 2005,5 which clarify several issues raised by the interim measures.
5. Both the Interim Measures and the Measures are available at http://cdm.ccchina.gov.cn.

Vol. 6, No. 1 Implementing the Clean Development Mechanism in China 2006
157
The institutional structure for management of CDM projects in China has been established. Overall responsibility rests with the NCCCC. The NCDMB serves as the executing agency of the NCCCC. As shown in table 2, its members comprise about half of the institutions represented on the NCCCC.
The NCCCC is responsible for the review and coordination of China's CDM policies. More specifically, its responsibilities are to:
Review national CDM policies, rules, and standards
Approve members of the NCDMB
Review other issues deemed necessary
The responsibilities of the NCDMB are to:
Review CDM projects with respect to:
- Participation qualifications
- Project design documents
- Baseline methodology and emission reductions
- Price of CERs
- Terms relating to funding and technology transfer
- Crediting period
- Monitoring plan
- Expected contribution to sustainable development
- Compliance with EIA requirements
Report to the NCCCC on the overall progress of CDM projects, emerging issues, and further recommendations
Recommend amendments to China’s rules and procedures for CDM
The NDRC, as chair of the NCCCC and co-chair of the NCDMB, has been designated as China’s designated national authority for the CDM. In that capacity, the NDRC has the following responsibilities:
To accept applications for proposed CDM projects
To approve proposed CDM projects jointly with MOST and MFA on the basis of the decision of the NCDMB
To issue written approval letters on behalf of the Government of China
To supervise the implementation of CDM projects
To deal with other relevant issues
This institutional arrangement may appear complex, but the project proponent deals only with NDRC, the focal point for CDM project approval, and is not involved in coordination with the other agencies.

Vol. 6, No. 1 International Review for Environmental Strategies 2006
158
4. Requirements for CDM projects in China
China believes that both developed and developing countries can benefit from CDM projects. To meet the requirements of the CDM, attract foreign financing, and ensure that China benefits from CDM projects, the Interim Measures for Operation and Management of Clean Development Mechanism Projects in China specify that CDM projects must satisfy the following general requirements:
CDM projects must be consistent with China’s laws and regulations, sustainable development strategies and policies, and the overall requirements for national economic and social development planning.
Implementation of CDM projects must not impose any new obligations on China.
CDM projects must be approved by relevant departments under the State Council.
Developed-country funding for CDM projects must be additional to their current official development assistance and their financial obligations under the UNFCCC.
CDM projects should promote transfer of environmentally sound technology to China.
Implementation of CDM projects must be transparent and efficient and ensure accountability.
Current priority areas for CDM projects are energy efficiency, development and utilization of new and renewable energy, and methane recovery and utilization.
The Chinese partner must be Chinese-funded or a Chinese-held enterprise.
The Interim Measures also prescribed that “revenue from the transfer of CERs shall be owned jointly by the Government of China and the project owner, with allocation ratio of the revenue to be decided by the Government of China.” This generated many questions from international and domestic stakeholders. In response, the recently released Measures prescribe that “the allocation ratios of the revenue are: (1) the government charges 65 percent of the revenue from the transfer of CERs, for HFC and PFC CDM projects; (2) the government charges 30 percent of the revenue from the transfer of CERs, for N2O CDM projects; (3) the government charges 2 percent of the revenue from the transfer of CERs, for priority as well as afforestation and reforestation CDM projects.” These revenue-sharing provisions do not apply to projects approved prior to October 12, 2005.
The above provisions affect mainly CDM projects abating non-CO2 gases, with the objectives being to:
Ensure that CDM projects hosted by China really contribute to the country’s sustainable development
Balance the funds flowing into different types of CDM projects
Encourage the development of priority CDM projects in China
Mitigate possible negative impacts of certain types of CDM projects
The Measures specify that “charges by the Government of China on CDM projects will be used to support climate change-related activities. Specific rules on the collection and utilization of the charges will be formulated separately by Ministry of Finance in consultation with NDRC and other relevant

Vol. 6, No. 1 Implementing the Clean Development Mechanism in China 2006
159
agencies.” The Government of China has decided to establish a Clean Development Fund with the charges, and is now in the process of developing the detailed rules of the fund.6
According to the Measures, the Government will also accept CDM projects without CER buyers from Annex I parties, so unilateral CDM projects are now possible in China.
5. Contribution to sustainable development
The host government must confirm in writing that a proposed CDM project assists it in achieving sustainable development. The Chinese government did not include a specific sustainable development requirement in the Measures. Rather, CDM projects will be expected to conform to China’s sustainable development strategy and policies. The project proponent identifies the sustainable development benefits of the proposed project—including contribution to the economy, the environment, employment, education, and/or poverty alleviation—in the CDM project application form. This allows the project proponent considerable flexibility in elaborating the sustainable development benefits of the proposed CDM project.
Sustainable development is one of China’s basic state policies. China’s Agenda 21—White Paper on China’s Population, Environment and Development in the 21st Century (Government of China 1994), published in 1994, clarified China’s sustainable development strategies and policies. The two national reports on sustainable development published in 1997 and 2002 (Government of China 1997, 2002) highlight the headway China has made in putting its sustainable development strategy into practice.
The contribution of a proposed CDM project to sustainable development also may be assessed relative to national and regional priorities for industrial development. Those priorities are outlined in the List of Advantageous Industries for Foreign Investments in Central and Western Regions (NDRC and Ministry of Commerce 2004), Guiding List of Industries for Foreign Investments (SDPC, SETC, and MoFTEC 2002), Tenth Five-Year Plan (2001–2005) (available at http://www.ndrc.gov.cn/), the Catalogue of Currently Encouraged Industries, Products and Technologies (State Economic and Trade Commission 2000), and the sustainable-development strategies of more than 20 provinces.
Based on these resources, a proposed CDM project could be considered as supportive of China’s sustainable development if it:
Supports the sustainable development goals and actions of the national and local governments
Matches the national and local industrial development plans/programs
Is in an industry for which investment is encouraged
Uses encouraged technologies or produces encouraged products
Yields environmental benefits, such as reduction of other air pollutants
Yields social benefits, such as improved quality of life for the local population or alleviation of poverty, and/or
6 . Current information on China’s climate change and CDM process is available from the following official websites:
http://www.ccchina.gov.cn for climate change, and http://cdm.ccchina.gov.cn for CDM project developers in China and international investors.
Vol. 6, No. 1 International Review for Environmental Strategies 2006
160
Yields economic benefits, such as attraction of new investment, or increased local employment
Twenty-three of the 28 projects approved or for which a letter of no-objection has been provided fall into the priority areas specified by the Chinese government in the Measures. They all have obvious sustainable development benefits. The others are four HFC-23-destruction projects and one fuel-switching project. China is the world’s largest emitter of HFC-23. The sustainable development benefits of HFC-23 destruction are not obvious. The Government thus has decided to collect 65 percent of the CER sales revenue and use the funds for sustainable development projects.
6. Environmental impact assessment
If the environmental impacts of a proposed CDM project are significant, the project participants must undertake an EIA in accordance with the procedures established by the host government. The Measures do not impose a specific EIA requirement on proposed CDM projects. But any project implemented in China is subject to the relevant EIA requirements, including public participation in the EIA process.
In China, the laws governing the EIA of a project are the Environmental Protection Law—Regulations on the Environmental Protection of Construction Projects, and Environmental Impact Assessment Law of the People’s Republic of China. The laws divide projects into several categories, according to the extent of possible impact, and define the EIA requirement for each, specifically:
In the case of possible significant impact, an EIA report, including a complete evaluation of the possible impacts, must be compiled.
In the case of possible limited impact, an EIA report sheet must be compiled.
In the case of little impact, an environmental impact sheet must be completed.7
The State Environmental Protection Administration has prepared a list of the EIA requirements for different project types. The EIA requirements for different types of CDM projects are given in table 3.
In addition to the national laws and regulations, some regions have EIA regulations. The Regulationsof Guangdong Province on Environmental Protection in Construction Projects are an example. Thus the EIA requirements for a proposed CDM project may differ by region.
The project participants must inform the NCDMB whether an EIA is required, whether it has been completed, and whether the EIA has been approved by relevant authorities. The NCDMB simply checks that a proposed CDM project has met the relevant EIA requirements; it does not assess the environmental impacts of the proposed project. Unless the EIA document has been approved by the relevant environmental authorities, the CDM project cannot begin operation and thus cannot generate CERs.
7. The format and required information for an EIA report, EIA report sheet, and environmental impact sheet are different. The
time allotted to the relevant environmental authorities to review them and make a decision also differs. For example, the StateEnvironmental Protection Administration must review an EIA report and make relevant decisions within 60 working days, while in the cases of an EIA report sheet and an environmental impact sheet, the time periods are 30 and 15 working days, respectively.

Vol. 6, No. 1 Implementing the Clean Development Mechanism in China 2006
161
Table 3. Expected EIA requirements for different types of possible CDM projects
Project type EIA report EIA report
sheetEnvironmental impact
sheet
Coal-bed methane recovery (in sensitive areas) (in other
areas)
Thermal (except natural gas), hydro, and waste-incineration power plants
Natural gas-fired power plants (>300 MW, in sensitive areas)
(others)
Wind, geothermal, tidal, biogas, and PV power projects
Solid waste sanitary landfill or incineration
Forest planting (in sensitive
areas)(in other areas)
Cement production (in sensitive
areas)(in other areas)
7. Public consultation
As part of the validation of a proposed CDM project, a designated operational entity must verify that comments by local stakeholders have been invited, a summary of the comments received has been provided, and a report on how the comments were taken into account has been received. The Measures do not establish specific requirements regarding stakeholder consultation for CDM projects. The requirement for stakeholder consultation can be met as part of the EIA process, if applicable, or through a consultation process designed by the project participants.
The Environmental Impact Assessment Law of the People’s Republic of China requires the developers of projects with possible significant impacts to invite, before submitting the EIA report to the competent authority for approval, comments from related units, experts, and the public in the form of an assessment meeting or hearing. An explanation of the reasons why the comments received have, or have not, been adopted must be included in the EIA report. Thus, the public consultation requirements of the EIA process for a proposed CDM project with possible significant impacts is likely to meet the validation requirement.
Local authorities may formulate their own requirements for stakeholder participation in EIA. For example, the Regulations of Tianjin Municipal Government on Environmental Protection in Construction Projects prescribe that the project developer shall invite the comments of units and residents in the place where the project is located, in accordance with related laws and regulations, and that the EIA report shall include a chapter describing the participation of the public.
Vol. 6, No. 1 International Review for Environmental Strategies 2006
162
In summary, if the potential impacts are significant and an EIA report is necessary, the EIA process requires consultation with local stakeholders in the form of an assessment meeting or hearing. If the potential impacts are limited or little, consultation with local stakeholders may be required by local regulations or the environmental protection authorities in the process of reviewing and approving the project. Consultation could take the form of a request for comments distributed by the project developer or an assessment meeting or hearing.
8. Financing CDM projects
Most of the 18 CDM projects approved by the Chinese government by December 31, 2005 have relied on foreign financing. The feasibility study for the CDM of each project was funded mainly by foreign sources, and the CDM components of these projects were financed through emission-reduction purchase contracts with Annex I governments or international carbon funds.
Development and commercial banks in China currently view CDM projects as ordinary commercial projects and ignore the expected revenue from the sale of CERs in their analyses. Chinese banks have not yet formulated rules or procedures for CDM projects. This is partly due to the very limited awareness of the CDM within the financial sector and partly due to the unattractive economic potential of many CDM projects.
To achieve China's estimated emission-reduction potential, it will be necessary for development and commercial banks to help finance viable CDM projects. The awareness of the banks regarding CDM projects will thus need to be raised. They can use their existing rules and procedures to evaluate CDM projects, but should include revenue from the sale of CERs in the analysis. They will also need to consider the risks associated with CDM projects, including, inter alia, the possibility that the project will not be approved by the Chinese government, not be validated by the designated operational entity, not be registered by the CDM Executive Board, not earn the projected quantity of CERs, or not receive the projected price for the CERs.
Since the energy sector will be the top priority for CDM project development in China, raising the awareness of development and commercial banks should focus on the groups responsible for the energy sector in banks with a large number of energy-sector clients. Once they understand the CDM, Chinese banks may develop specialized financial products aimed at CDM projects. This will happen only when the CER market has matured and the banks have gained sufficient experience with CDM projects. Considering the uncertainties related to CDM projects, the currently limited size of the international carbon market, and the relevant capacity of banks in China, the process could take some time.
9. Synergies between the CDM and China’s energy program
China is an energy giant, accounting for 11.4 percent of world energy consumption in 2001, which ranks it second, just behind the United States (International Energy Agency 2003a). China’s energy system is dominated by coal. Although its significance has been decreasing since the 1990s, coal still accounted for 67 percent of China’s total energy consumption in 2003. Most of China’s energy experts predict that coal will still account for about 60 percent of the country’s total energy consumption in

Vol. 6, No. 1 Implementing the Clean Development Mechanism in China 2006
163
2020. The production, transportation, and use of coal have caused serious environmental problems in China.
To achieve sustainable development, China has attached great importance to energy policies that: (1) improve energy efficiency, to achieve social and economic development with less energy consumption; (2) improve the energy consumption structure, mainly by decreasing the use of coal to alleviate its environmental consequences; and (3) develop new and renewable energy, to substitute for coal and to electrify remote areas.
China plans to reduce the energy intensity of its GDP by 20 percent during 2001–2005. To achieve this, specific unit energy consumption targets have been set for such products as electricity, steel, non-ferrous metals, synthesis ammonia, cement, glass, etc., and specific energy-efficiency targets have been established for new residential and commercial buildings and industries such as metallurgy, electric power, non-ferrous metal, chemicals, building materials, light industry, textiles, and automobile manufacturing.
China also has set ambitious national renewable-energy development targets for 2005 and 2015: about 0.7 percent and 2 percent of total energy consumption respectively. China’s Renewable Energy Law, which will come into force as of January 1, 2006, provides for: (1) medium- and long-term renewable-energy development goals at both central and provincial levels; (2) compulsory purchase by power grid companies of all renewable electricity generated within the coverage of their grids; (3) economic incentives, such as preferential customs duties, taxes, preferential prices, and low-interest loans, for renewable-energy technologies; and (4) support for research and development of related technologies.
There is no doubt that China's energy sector offers significant greenhouse-gas-reduction potential. Thus CDM projects to improve energy efficiency and utilize renewable energy sources could contribute to achievement of China's energy and sustainable-development goals. Evidence of this synergy is the fact that the 28 CDM projects approved or for which a letter of no-objection has been provided include eight methane-recovery-and-utilization projects, 11 wind, three small-hydro, one energy-conservation, and one fuel-switching project.
Two factors could limit the contribution of CDM projects. China's ambitious energy-efficiency and renewable-energy projects could lead to relatively stringent baselines for such projects and reduce the economic viability of the incremental emission reductions that would earn CERs.8 Secondly, the most cost-effective CDM projects appear to be those that yield large reductions of gases with high global warming potential, such as HFC-23 destruction.9 The global supply of CERs from such projects could reduce the economic viability of some energy-efficiency and renewable-energy projects.
8. The baseline for a CDM project activity should take into account relevant national and/or sectoral policies and circumstances,
such as sectoral reform initiatives, local fuel availability, power-sector expansion plans, and the economic situation in the project sector. The CDM Executive Board has provided clarification on the treatment of some national and/or sectoral policies and regulations in determining a baseline scenario, but additional issues remain unresolved.
9. The global warming potential (GWP) of a greenhouse gas is its cumulative radiative forcing (a measure of its climate impact)relative to that of an equal mass (e.g., 1 ton) of CO2 over a specified time period. The Kyoto Protocol has adopted the 1995 estimates of the 100-year GWPs published by the Intergovernmental Panel on Climate Change. Methodologies submitted and/or approved, address destruction of HFC-23 (GWP of 11,700), reducing emissions of PFCs (CF4 with GWP of 6,500, and C2F6, with a GWP of 9,200) in aluminum production; destruction of N2O (GWP of 310) generated by adipic acid production; and capture and destruction or use of methane (CH4, with a GWP of 21) from landfills, oil wells, wastewater treatment plants, and animal manure.

Vol. 6, No. 1 International Review for Environmental Strategies 2006
164
10. Realizing China's CDM potential
Some authors have claimed that China lags behind other developing countries in implementing a system for identification, approval, and implementation of CDM projects (Haites 2004; Michaelowa et al. 2000; Tangen and Heggelund 2003; Zhang 2004a, 2004b). But China now has the foundations for effective participation in the CDM; the basic policies have been adopted, the institutional structure to approve CDM projects has been established, and the system has been applied to a number of proposed projects. These foundations have been established with the aid of several internationally funded projects. The feasibility study for each proposed project was funded mainly by foreign sources, and their implementation is being financed through emission-reduction purchase contracts.
China also has benefited from several internationally funded CDM capacity-building projects. These projects, listed in table 4, have targeted, respectively: methodological issues; CDM case studies; CDM potential analysis; potential project development; domestic CDM policy recommendations; and training for people from industries, central and local governments, and technical support organizations. They have helped local Chinese experts and relevant national policymakers to better understand CDM issues.
To build on these foundations and realize China's CDM potential will require several initiatives. Some of these are described below.
The CDM capacity of policymakers at local levels needs to be enhanced. Proposed CDM projects may be affected by local policies and regulations, so the support of knowledgeable local officials is a necessity for the success of CDM projects. Systematic in-depth and hands-on training for local experts who are familiar with local circumstances, is very important and necessary. The internationally funded projects have strengthened the capacity of Chinese experts sufficiently to enable them to serve as CDM trainers in China.
Capacity building is needed in the energy sector. Energy efficiency and renewable-energy projects are a priority for China and the potential for such projects is large. China’s energy sector is developing very rapidly, so prompt action is required to capture the associated low-cost emission-reduction potential.
Capacity building for groups responsible for the energy sector in development and commercial banks is urgently needed. Their lack of understanding may lead to rejection of CDM projects proposed by clients. If unilateral projects become common, the support of local financial institutions will be even more crucial.

Vol. 6, No. 1 Implementing the Clean Development Mechanism in China 2006
165
Table 4. Selected CDM capacity-building projects in China
ProjectMethodological
issuesCase
studies
Emissionreductionpotential
Policystudy Training
Supportgovernment
Projectidentification
WorldBank/GTZ/Switzerland/ItalyChina CDM Study Project
x x x – – x x
Asian Development Bank Opportunities for the CDM in China’s Energy Sector Project
– x – – x x x
CDM component of the China-Canada Cooperation on Climate Change (C5) Project
x x – x – x x
UNDP (UNF) Building Capacity for Clean Development Mechanism in China
– – – x x x x
MOST-funded projects x x x x x x x
Canada-funded Local CDM Capacity Building Project
– x – – x – x
Japan-funded Local CDM Capacity Building Project
– x – – x – x
Foreign governments and international development agencies can support these initiatives financially and by contributing expertise. However, China must assume increasing responsibility for the achievement of its CDM potential.
11. Conclusions
China is widely considered to be one of the most important suppliers of CERs. Estimates suggest that China represents 25 percent to 45 percent of the global CDM potential. China's potential is roughly equivalent to that of the rest of Asia and larger than that of Latin America, Africa, or the Middle East.
China has lagged behind other large developing countries, such as Brazil and India, in implementing a system for approval of CDM projects, but it now has the foundations in place for effective participation in the CDM; the basic policies have been adopted, the institutional structure to approve CDM projects has been established, and the system has been applied to a number of proposed projects. These foundations have been established with the aid of several internationally funded projects.
The Chinese government views the CDM as an important mechanism for promoting sustainable development, especially in the energy sector, and thus has made significant efforts to create a favorable environment for implementation of CDM projects. Eighteen projects had been approved and three had been registered by the CDM Executive Board as of December 31, 2005.

Vol. 6, No. 1 International Review for Environmental Strategies 2006
166
The CDM knowledge and awareness of policymakers at the local level needs, however, to be enhanced. Capacity building also is needed in the energy sector, because it is developing very rapidly and CDM projects in this sector are a priority. To enable CDM projects in the energy sector to be implemented, capacity building for groups in development and commercial banks serving this sector is urgently needed.
References
Energy Information Administration. 2003. International energy outlook 2003. DOE/EIA-0484(2003). Washington, DC: Department of Energy.
Fenhann, J. 2005. CDM pipeline overview (updated December 22, 2005). Roskilde, Denmark: UNEP Risø Centre on Energy, Climate and Sustainable Development. http://www.cd4cdm.org/.
Government of China. 1994. China's Agenda 21–White paper on China's population, environment & development in the 21st century. Beijing: China Environmental Science Press.
———. 1997. The People's Republic of China national report on sustainable development 1997. Beijing: China Environmental Science Press.
———. 2002. The People's Republic of China national report on sustainable development 2002. Beijing: China Environmental Science Press.
Haites, E. 2004. Estimating the market potential for the clean development mechanism: Review of models and lessons learned. Washington, DC: World Bank Carbon Finance Business PCFplus research program, International Energy Agency, and International Emissions Trading Association.
International Energy Agency. 2003a. Key world energy statistics 2003. Paris: Organisation for Economic Cooperation and Development (OECD).
————. 2003b. World energy investment outlook: 2003 Insight. Paris: OECD.
Jakeman, G., E. Heyhoe, H. Pant, K. Woffenden, and B.S. Fisher. 2001. The Kyoto Protocol, economic impacts under the terms of the Bonn Agreement. Australian Bureau of Agricultural and Resource Economics (ABARE) Conference Paper 2001.28. Canberra: ABARE.
Jotzo, F., and A. Michaelowa. 2002. Estimating the CDM market under the Marrakech Accords. Climate Policy 2(3–4):179–196.
Lecocq, F., and K. Capoor. 2005. State and trends of the carbon market 2005. Washington, DC: International Emissions Trading Association and World Bank Carbon Finance Business.
Michaelowa, A., A. Jusen, K. Krause, B. Grimm, and T. Koch. 2000. CDM projects in China’s energy supply and demand sectors—Opportunities and barriers. Hamburg Institute of International Economics (HWWA) Discussion Paper 90. Hamburg: HWWA.
National Development and Reform Commission (NDRC) and Ministry of Commerce. 2004. List of advantageous industries for foreign investments in central and western regions. 2004 revision. Beiing: NDRC and Ministry of Commerce.
Sijm, J. P. M., F. T. Ormel, J. W. Martens, S. N. M. van Rooijen, M. H. Voogt, M. T. van Wees, and C. de Zoeten-Dartenset. 2000.Kyoto mechanisms: The role of joint implementation, the clean development mechanism and emissions trading in reducing greenhouse gas emissions. Energy Research Centre of the Netherlands (ECN) report C-00-026. Petten, Netherlands: ECN.
State Development Planning Commission (SDPC), State Economic and Trade Commission (SETC), and Ministry of Foreign Trade and Economic Cooperation (MOFTEC). 2002.Guiding list of industries for foreign investments. Beijing: SDPC, SETC, and MOFTEC.
State Economic and Trade Commission. 2000. Catalogue of currently encouraged industries, products and technologies. Beiing: SETC.

Vol. 6, No. 1 Implementing the Clean Development Mechanism in China 2006
167
Tangen, K., and G. Heggelund. 2003. Will the clean development mechanism be effectively implemented in China? ClimatePolicy 3(3):303–307.
Trexler and Associates. 2003. GHG Supply Tool©, Portland, Oregon.
World Bank. 2003. Global development finance 2003. Washington, DC: World Bank.
World Resources Institute. 2005. CAIT—The Climate Analysis Indicators Tool, version 1.5, World Resources Institute, Washington, D.C.
Zhang, Z. 2004a. Towards an effective implementation of CDM projects in China. Honolulu: East-West Center.
———. 2004b. The World Bank's prototype carbon fund and China. Working paper no. 60. Honolulu: East-West Center.

Vol. 6, No. 1 International Review for Environmental Strategies 2006
168

International Review for Environmental Strategies Vol. 6, No. 1, pp. 169 – 170, 2006
© 2006 by the Institute for Global Environmental Strategies. All rights reserved.
169
Book Review
Climate Trading: Development of Kyoto Protocol Markets
Author: Deborah Stowell
Publisher Information: Palgrave Macmillan, Basingstoke, 2005. Finance and Capital Markets series. 264 pp. Hardcover
ISBN: 1-4039-1616-0
Reviewer: Axel Michaelowaa
Emission trading and the market-based mechanisms of the Kyoto Protocol are becoming more and more fashionable topics for authors with the introduction of the European Union Emission Trading System in January 2005 and the entry into force of the Kyoto Protocol the following month. From the web-based information provider PointCarbon, which offers tailor-made products for business, through traditional management literature (De Jong and Walet 2004), to academic literature (Yamin 2005), all strands of media are represented. Stowell’s book takes an intermediary position between the latter two. Stowell is an old hand in the climate policy field and thus one starts reading her book with high expectations. These are fulfilled insofar as the contents are up to date and factual errors are absent. However, the description is often a little legalistic and tedious, while references could have been more comprehensive and the degree of analysis somewhat deeper.
Stowell starts with a short description of the climate change issue and the negotiation process leading to the Kyoto Protocol. The description of the Kyoto mechanisms rules takes 45 pages. Rightly, a lot of emphasis is put on reporting and monitoring rules, an often neglected issue. A chapter on domestic and regional trading schemes follows. This includes some interesting detail, such as the administration fees of the Danish trading scheme and the exact design of the infamous UK subsidy scheme for participants in emissions trading. Impacts of emission management for industry are then discussed, including a table postulating at what allowance prices changes in power plant use would occur. Also, the Eurelectric trading simulations and the BP/Shell internal trading systems that were the late 1990s, voluntary frontrunners of emissions trading are described. The chapter on acquisition programs for clean development mechanism (CDM) and joint implementation (JI) projects is very interesting. It gives an overview of all funds and tenders, and discusses baseline methodologies and risks encountered when developing CDM and JI projects. The World Bank and Dutch programs that started CDM and JI acquisitions already since 2000 and were crucial for the development of the market are assessed in detail. Then—surprisingly—a new chapter on the global carbon market tries to summarize transactions; it a. International Climate Policy program, Hamburg Institute of International Economics, Neuer Jungfernstieg 21, 20347, Hamburg,
Germany, Email: [email protected]

Vol. 6, No. 1 International Review for Environmental Strategies 2006
170
would have benefited from drawing on sources other than the World Bank. The book is concluded with a somewhat sketchy outlook on climate policy beyond 2012.
Altogether, Climate Trading provides a solid but not fascinating description of the Kyoto Protocol, the Kyoto mechanisms, and other greenhouse gas emission-trading schemes. It will be very helpful for those who need a solid introduction to the Kyoto Protocol and its flexible instruments as well as initiatives at the country level. However, given its high price (£125.00 or US$180.00), I would recommend sticking to a library copy.
References
De Jong, C., and K. Walet, eds. 2004. A guide to emissions trading: Risk management and business implications. London: Risk Books.
Yamin, F., ed. 2005. Climate change and carbon markets: A handbook of emission reduction mechanisms. London: Earthscan.

Subscription Order Form of International Review for Environmental Strategies (IRES)
To order, please fill in this form and send/fax to:
The Secretariat Institute for Global Environmental Strategies (IGES), attn: IRES 2108-11 Kamiyamaguchi, Hayama Kanagawa 240-0115 Japan Tel: +81-46-855-3700, Fax: +81-46-855-3709 E-mail: [email protected] Also order available from, https://www.iges.or.jp/en/pub/ires/subform.html We accept credit cards and bank transfer. No checks money orders, bank draft please.
Please enter my subscription for (please mark , if applicable): Volume 6, Number 2 Issue (Special theme: Groundwater Management and Policy)
1 issue JPY 2,200 (US$ 20)
Volume 6, Number 1 Issue) 1 issue JPY 2,200 (US$ 20)
Volume 5, Number 2 Issue (Special theme: Environmentally Sustainable City) 1 issue JPY 2,200 (US$ 20)
Volume 5, Number 1 Issue (Special theme: The Kyoto Protocol; Its implication, development and the future) 1 issue JPY 2,200 (US$ 20)
Volume 4, Number 2 Issue 1 issue JPY 2,200 (US$ 20)
Back issues
Volume 4, Number 1 (2003) Issue (Special theme: Environmental Education for Sustainable Development) 1 issue JPY 2,200 (US$ 20)
Winter 2002 Issue (Special theme: Sustainable Freshwater Resource Management) Volume 3, Number 2 1 issue JPY 2,200 (US$ 20)
Summer 2002 Issue (Special theme: Globalization and Sustainable Development) Volume 3, Number 1 1 issue JPY 2,200 (US$ 20)
Winter 2001 Issue (Special theme: Towards the Earth Summit 2002) Volume 2, Number 2 1 issue JPY 2,200 (US$ 20)
Summer 2001 Issue Volume 2, Number 1 1 issue JPY 2,200 (US$ 20)
(IRES Subscribe: 1 of 2)

PaymentCharge my credit card:
Visa Mastercard American Express JCBCard Number: Expiration Date:
Signature:
Name: Position: Department: Organization:Address:
Tel: Fax: E-mail:
Send notices of change of address to the IGES Secretariat 6 to 8 weeks in advance. Please include both the old and new addresses.
Thank you very much for your subscription order.
To help us improve the quality of our journal, please answer the following questions:
Q1. Please rate IRES according to your level of interest: Very interesting Moderately interesting Somewhat interesting Not interesting
Q2. How did you find about IRES? Library Web site Friend Direct Mail Others ( )
Q3. If you subscribe to other environmental journals, please list them:
Q4. If there are any specific subjects you would like to see addressed in IRES, please send your comments to the IGES secretariat by E-mail, at [email protected]
(IRES Subscribe: 2 of 2)

173
International Review for Environmental Strategies (IRES) Instructions to Authors
1. Contents: Submitted manuscripts should make new or substantial contributions to the development of effective environmental strategies. The potential readers are expected to be persons not only in research institutions, academic societies and universities, but also in governmental organizations, business corporations and non-governmental organizations.
2. Types of submissions: Manuscripts are solicited in five categories:(a) Article: Original papers on analytical or synthetic research and studies. 10,000 words
maximum.(b) Research Note: Papers concisely stating and analyzing interim findings of studies and
research surveys. 6,000 words maximum.(c) Current Development: Papers reporting the latest developments in environmental
strategies, practices, policies and laws. 3,000 words maximum.(d) Essay: Papers discussing critical environmental and related issues or discussing the state and
directions of environmental policy-oriented research and studies. 3,000 words maximum.(e) Book Review: Reviews of recent books on environment-related policy and related issues,
preferably written in languages other than English. 800 words maximum.
3. Submission guidelines:(a) Hardcopy submissions: One original, single-sided manuscript should be submitted along
with 4 single-sided copies. Rejected manuscripts will not normally be returned. The submission of electronic files on diskettes is encouraged, and electronic files should be in MS Word 6.0 or higher. The hard copy and the electronic files must match exactly. Manuscripts should be sent to:
IRES / IGES SecretariatInstitute for Global Environmental Strategies (IGES) 2108-11 Kamiyamaguchi, Hayama, Kanagawa 240-0115, Japan Tel: +81-46-855-3700 / Fax: +81-46-855-3709
(b) Electronic submissions: IGES welcomes electronic submissions. To submit a paper electronically, please submit your paper in MS Word 6.0 or higher as an attachment to:
[email protected] Upon acceptance for publication, a hard copy of the paper will be required.
4. Technical guidelines: Manuscripts must be written in English and should be type-written on one side of A4 paper, and double-spaced with 3-cm margins. All pages should be numbered consecutively. Titles and subtitles should be short.
5. Manuscript structure: Manuscripts should be structured as follows: Title page, Abstract, Introduction, Main Text, Conclusion, Acknowledgements, References, Tables and Figures. Long papers may require subheadings.The title page of the manuscript should include:
the title, the first and last name of the authors and their affiliations, sources of support in the form of funding or grants,
a short (up to 30 characters, including spaces) title for running heads (the title presented at the top of each page),
keywords (up to 5 key word phrases), the name and address of the author responsible for correspondence, including
telephone and fax numbers and e-mail address (if available).

174
All papers should include an abstract of no more than 250 words.
6. Formulas: Important formulas should appear on separate lines and should be numbered consecutively throughout the manuscript as (1), (2), etc. on the right-hand side of the page.
7. Footnotes: Footnotes are encouraged to be kept to a minimum (under five sentences) and numbered consecutively and placed at the bottom of each page.
8. References: Authors should attempt to reference every authority used in their papers. When directly quoting other materials, page numbers for the quotes should also be provided.
9. Citation style: References should be listed alphabetically by last name or by name of the institutional author at the end of the paper, and should follow the 15th edition of the Chicago Manual of Style. In the text, author(s) and year of publication should be given in parenthesis, e.g., (Brown 1957). When a citation has more than three authors, the first named author should be given followed by "et al.", e.g., (Brown et al. 1957). However, all authors should be listed in the References section, even if there are more than three authors. The conventions (Brown 1957a) and (Brown 1957b) should be used where more than one paper by the same author(s) has appeared in the same year.
For periodicals: Consecutively numbered journals:(1) Names and first initials of all authors. (2) Year of publication. (3) Full title of cited paper. (4) Journal title in full (5) volume number:(6) first and last page numbers.
For example:Daly, H. E. 1990. Towards some operational principles of sustainable development. EcologicalEconomics 2:1-6.Miyamoto, K. 1976. Problems of the environment impact statement system (in Japanese). Kogaikenkyu (Pollution studies) 6:121-27.
Non-consecutively numbered journals: (1) Names and first initials of all authors. (2) Year of publication. (3) Full title of cited paper. (4) Journal title in full (5) volume number, no. issue number:(6) first and last page numbers.
For example:Edmonds, J. 1999. Towards a technology greenhouse strategy. Consequences 5, no. 1:17-28.
For books: (1) Names and first initials of all authors. (2) Year of publication. (3) Full title of book. (4) City of publication: (5) Publisher.
For example:Ostrom, E. 1997. Governing the commons—The evolution of institution for collective action.Cambridge: Cambridge University Press.
For chapters in books: (1) Names and initials of all authors. (2) Year of publication. (3) Full title of chapter. In (4) Full title of book, edited by (5) Initials and names of all editors, (6) first through last page numbers for the chapter. (7) City of publication: (7) Publisher.
For example:Inoue, M. 2000. Participatory forest management. In Rainforest ecosystems of East Kalimantan: El Niño, drought, fire and human impacts, edited by E. Guhardja, M. Fatawi, M. Sutisna, T. Mori and S. Ohta, 299-307. Berlin: Springer-Verlag.
If the list is incomplete, or not in the correct form, it may be returned to the author for amendment, and publication of the paper may be delayed. For more information, please refer to

175
the Chicago Manual of Style, or see further examples on our web site (http://www.iges.or.jp).
10. Figures: Figures should be titled and numbered consecutively in Arabic numerals and placed on separate sheets at the end of the manuscript. Their positions should be indicated in the text. All figures should be copy-ready for reproduction. For line drawings, good-quality glossy prints in the desired final size are preferred. Computer printouts are acceptable, provided they are legible and reproducible. For charts, both X and Y axes should be clearly labeled, and units (if applicable) for the axes should be presented. Black and white images, as opposed to color images, are preferred. If data from other sources are presented, those sources should be referenced and page numbers where the data appear should be provided.
11. Tables: Tables should be titled and numbered separately from figures. Row and column labels should clearly describe the content of the rows and columns, and units should always be included. Accompanying electronic copies are preferred. If data from other sources are presented, those sources should be referenced and page numbers where the data appear should be provided.
12. Units: If applicable, metric units should be used. For currency, if a unit is ambiguous (e.g., "dollars"), the currency's country should be specified (e.g., "U.S. dollars").
13. Abbreviations: The use of abbreviations should be consistent throughout the paper. Standard abbreviations are preferred. If an abbreviation is nonstandard, the full term for which the abbreviation stands should precede its first use in the text, and the abbreviation should be placed in parentheses immediately following the term.
14. Proofs: One set of proofs will be sent to the author(s). Corrections should be limited to printer's errors, because the costs involved in making any other alterations are substantial and may be charged to the author.
15. Copies: Three copies of the journal and twenty offprints will be supplied free of charge.
16. Copyrights: When quoting from someone else's work or when reproducing an illustration or table from a book or journal article, the author should make sure that he/she is not infringing a copyright. In general an author may quote from other published works. However, he/she should try to obtain permission from the holders of the copyright if he/she wishes to make substantial extracts (500 words or more) or to reproduce tables, plates, or other illustrations.
Authors must transfer the copyright of their papers to IGES with the IRES copyright transfer form when papers are accepted for publication. The copyright covers the exclusive rights to reproduce and distribute an article in any form of reproduction (printing, electronic media, or any other form); it also covers translation rights for all languages and countries.
Exclusive copyrights of papers in IRES belong to IGES. No part of this publication may be reproduced or transmitted in any form or by any means, electronic or mechanical, including photocopy, recording, or any information storage and retrieval system, without permission in writing from IGES.
17. Disclaimer: IGES makes no representations or warranties of any kind, express or implied, as to the information, content, materials, data, tables, opinions, arguments, or other information included and contained in IRES. Opinions expressed in IRES do not necessarily represent the views of IGES, and authors will assume full responsibility and liability for all statements of fact or opinions contained in their papers.

Back Issues ofInternational Review for Environmental Strategies (IRES)
Back issues are available for sale. To place an order, please contact: [email protected] or visit our web: https://www.iges.or.jp/en/pub/ires/subform.html
Volume 5 Number 2 issue (2,200 Japanese yen) CONTENTSEDITOR’S NOTE SPECIAL EDITOR’S NOTE by Hidefumi Imura THE ENVIRONMENTALLY SUSTAINABLE CITY OVERVIEW / UEM STRATEGY An Overview of Urban Environmetnal Burdens at Three Scales: Intra-Urban, Urban-Regional, and Global by Gordon McGranahan Urban Environmetnal Issues and Trends in Asia – An Overview by Hidefumi Imura, Sudakar Yedla, Hiroaki Shirakawa, and
Mushtaq A. Memon Sustainability Assessment and Cities by Peter Newman AIR / WATER / SOLID WASTETransport and Environment in Asian Cities: Reshaping the Issues and Opportunities into a Holistic Framework by Shobakar Dhakal
and Lee Schipper Sustainable Urban Wastewater Management and Reuse in Asia by Absar Kazmi and Hiroaki Furumai Financing Urban Water Supply and Sanitation by Brendan Gillespie Waste Management and Recycling in Asia by Atsushi Terazono, Yuichi Moriguchi, Yuko Sato Yamamoto, Shin-ichi Sakai, Bulent
Inanc, Jianxin Yang, Stephen Siu, Ashok V. Shekdar, Dong-Hoon Lee, Azni B. Idris, Albert A. Magalang, Genandrialine L. Peralta,Chun-Chao Lin, Pireeyutma Vanapruk, and Thumrongrut Mungcharoen
Material Flows for a Suustainable City by frank Ackerman CIVIL SOCIETY / INTER-CITY COOPERATIONThe Informal Sector’s Role in Urban Environmental Management by A. T. M. Nurul Amin Inter-city Environmetnal Cooperation: The Case of the Kitakyushu Initiative for a Clean Environment by Mushtaq Ahmed Memon,
Christine Pearson, and Hidefumi Imura REPORT FROM ASIAExecutive Summary of the APFED Final Report: Paradigm Shift Towards Sustainability for Asia and the Pacific – Turning
Challenges into Opportunities by Asia-Pacific Forum for Environment and Development (APFED)
Volume 5 Number 1 issue (2,200 Japanese yen) CONTENTSEDITOR’S NOTE The Legacy of the Kyoto Protocol: Its Role as the Rulebook for an International Climate Framework by Kunihiko Shimada THE KYOTO PROTOCOL: ITS DEVELOPMENT, IMPLICATION, AND THE FUTUR OVERVIEW: ITS DEVELOPMENT AND IMPLICATION FOR THE INTERNATIONAL COMMUNITY Kyoto and the Future of International Climate Change Responses: From Here to Where? By Michael Grubb The Road to and from the Kyoto Protocol: The Perspectives of Germany and Japan by Ryokichi Hirono and Heike Schröder Reflections on the Kyoto Protocol—Looking Back to See Ahead by Michael Zammit Cutajar COUNTRY VIEWS: PERCEPTION AND IMPLEMENTATION OF THE KYOTO SYSTEMEvaluation and Future of the Kyoto Protocol: Japan's Perspective by Yasuko Kameyama Implementing the Kyoto Protocol in the European Community by Theodora Petroula, Rob Swart, Bernd Gugele, Bernd Strobel, and
Peter Taylor The Development of Climate Change Policy in Germany by Rie Watanabe and Lutz Mez The Kyoto Protocol: An Indian Perspective by Jyoti Parikh and Kirit Parikh Implications of the Kyoto Protocol: Indonesia's Perspective by Daniel Murdiyarso The EU-Russia Ratification Deal: The Risks and Advantages of an Informal Agreement by Vladimir Kotov The Perspective of the United States on Climate Change and the Kyoto Protocol by Nigel Purvis Alternatives to the Kyoto Protocol: A New Climate Policy Framework? by Brian S. Fisher, Kate Woffenden, Anna Matysek, Melanie
Ford, and Vivek Tulpulé THE KYOTO MECHANISMS: METHODS AND INTERNATIONAL DEVELOPMENTSOverview of the Kyoto Mechanisms by Erik Haites and Farhana Yamin CDM Incentives in Industrialized Countries—The Long and Winding Road by Axel Michaelowa The Clean Development Mechanism: Issues and Opportunities by Naoki Matsuo The UK Emissions Trading Scheme: Paying the Polluter —A Policy Experiment by Peter J. G. Pearson The Clean Development Mechanism and India: Firm Responses, Baselines, and Development Dynamics by P. R. Shukla,
Balasubramaniam Sivaraman, and A. Yajnik Technological Implications of the Clean Development Mechanism for the Power Sector in Three Asian Countries by Ram M.
ShresthaMitigating Climate Change through the CDM—The Case of China by Shuang Zheng The Clean Development Mechanism: Current Activities of Japan by Yuji Mizuno

FUTURE IMPLICATIONSLessons from the Kyoto Protocol: Implications for the Future by Cédric Philibert
Volume 4 Number 2 issue (2,200 Japanese yen) CONTENTSEDITOR’S NOTE ARTICLENGO Environmental Education Centeres in Developing Countries: Role, Significance and Keys to Success, from a “Change Agent”
Perspective by Ko Nomura, Latipah Hendarti, and Osamu Abe International Political History of the Kyoto rotocol: From the Hague to Marrakech and Beyond by Suraje Dessai, Nuno S. Lacasta,
and Katharine Vincent Land Use Control Strategies Around Urban Growth Boundaries in Korea by Hee-Yun Hwang and Byungseol Byun RESEARCH NOTE International Experience of Public-Private Partnerships for Urban Environmental Infrastructure, and its Application to China by
Miao Chang, Mushtaq Ahmed Memon, and Hidefumi Imura Financing Renewable Energy in India: A Review of Mechanisms in Wind and Solar Applications by Aknksha Chauery, Gueye
Kamal, and N. Yuvaraj Dinesh Babu CURRENT DEVELOPMENT Harmonizing Trade and Environment in Recent Free Trade Agreements in the Asia-Pacific Region by Gueye Kamal and Kenich
ImaiSustainable Livestock Development in Mongolia by Nachin Dashunyam BOOK REVIEW Making Microchips by John Lane Global Warming and the Asian Pacific by Axel Michaelowa
Volume 4 Number 1 issue (2,200 Japanese yen) CONTENTSEDITOR’S NOTE ENVIRONMENTAL EDUCATION FOR SUSTAINABLE DEVELOPMENT Education for a Sustainable Future: Achievements and Lessons form a Decade of Innovation, from Rio to Johannesburg by John
FienReorienting International Development to Accelerate Poverty Reduction and Ensure Sustainability as this Century’s Top
Development Goals by Ryokichi Hirono Promoting Regional Cooperation on Environmental Education and Training in the Asia-Pacific: The Role and Contributions of the
United Nations Environment Programme (UNEP) by Mahesh Pradhan Towards Environmental Education for Sustainable Development: The Contributions of NGOs in the Asia-Pacific Region by
Daniella Tilbnury, Wendy Goldstein, and Lisa Ryan Ecotourism and Edication for Sustainability: A Critical Approach by Rob Gilbert Corporate Environmental Education in Japan: Current Situtation and Problems by Kenjiro Hirayama eLearning and Education for Sustainability (EFS) by Keith Wheeler, Jack Byrne, and Andrea Deri RESEARCH NOTE Tourism in Japan’s Parks and Protected Areas: Challenges and Potential for Sustainable Development by Lisa Hiwasaki CURRENT DEVELOPMENT Assessmsnet of the “Strength” of the New ASEAN Agreement on Transboundary Haze Pollution by Ebinezer R. Florano BOOK REVIEW Enabling Eco Action – A Handbook for Anyone Working with the Public on Conservation: reviewed by Denise Hamu and Wendy
Goldstein Mongolia Today: Science, Culture, Environment and Deveopment: reviewed by Nachin Dashnyam
The Winter 2002 issue (Volume 3 Number 2: 2,200 Japanese yen) CONTENTSEDITOR’S NOTE SUSTAINABLE FRESHWATER RESOURCE MANAGEMENT Current Status and Future Trends in Freshwater Management by Ryutaro Hashimoto Regional Issues and Actions for Sustainable Water Management in the Asia-Pacific by Wouter Lincklaen Arriens Water Resources and Rice Paddy Cultivation in the Asian Monsoon Region by Shigetaka Taniyama Common Problems in Water Supply and Sanitation in Developing Countries by Hidetoshi Kitawaki International Collaboration on Water Systems in Asia and the Pacific: A Case of Transition by Mikiyasu Nakayama Freshwater Resources Management in China: Case Study of the Yellow River Basin by Changming Liu and Hongxing Zheng Climate Variability and Change—and Freshwater Management by Pavel Kabat, R. E. Schulze, M. E. Hellmuth, J. A. Veraart andRoberto Lenton
ESSAYS Local Reform of Community Forest and Fisheries Management in Cambodia by Bashiru M. KoromaIssues and Policy Directions for Sustainable Development in Asia through Trade by Kenichi Imai CURRENT DEVELOPMENTS The Role of Solar Photovoltatics in the Sustainable Development of Mongolia by Nachin Dashnyam

Bhutan’s Current Environmental Strategy: Sustainable Development through Reciprocity, Equity, and Participation by Dipayan Dey BOOK REVIEWS World Water Vision—Making Water Everybody’s Business by William J. Cosgrove and Frank R. Rijsberman (Reviewed by Yutaka Takahasi); Dams and Development—A New Framework for Decision-Making by the World Commission on Dams (reviewed by Yutaka Takahasi); Strategic Environmental Assessment in Transport and Land Use Planning by Thomas B. Fischer (reviewed by Shobhakar Dhakal); Environmental Policy in the European Union—Actors, Institutions and Processesedited by Andrew Jordan (reviewed by Jan-Dirk Seiler-Hausmann); World in Transition 2: New Structures for Global Environmental Policy by the German Advisory Council on Global Change (WBGU) (reviewed by Naoko Matsumoto); andClimate Change: From a Fossil to a Solar Culture by Carl Amery and Hermann Scheer (reviewed by Axel Michaelowa)
The Summer 2002 issue (Volume 3 Number 1: 2,200 Japanese yen) CONTENTSEDITOR’S NOTE A Common Future or Towards a Future Commons: Globalization and Sustainable Development since UNCED by John Byrne and
Leigh Glover“Nationalising” Consensus: Turning Global Debate into Local Dividends by Kader Asmal Globalization and Sustainable Development by Mark Halle Globalisation and Sustainable Development: A Dialogue of the Deaf? by Peter Newell Globalisation and Sustainable Development by Joke Waller-Hunter and Tom JonesSPECIAL CONTRIBUTIONS Eco-economy: Dialogue with Lester R. BrownRestructuring the Economy for Sustainable Development by Lester R. Brown ARTICLESEcological Tax Reform in Germany and Interest Groups by Alexandra BlankeIntegration Prospects of Tidal Energy as a Contribution to the Sustainable Development of Coastal Bangladesh by Md.
Salequzzaman and Peter Newman RESEARCH NOTE Mechanism of Rocky Desertification in the Karst Mountain Areas of Guizhou Province, Southwest China by Wang Shijie, Dianfa
Zhang, and Li Ruiling CURRENT DEVELOPMENTS Cooperative Environmental Efforts in Northeast Asia: Assessment and Recommendations by Yearn Hong Choi Environmental Education: From Idea to Action in the Asia-Pacific by Bishnu B. Bhandari and Osamu Abe Financing Sustainable Development: Trends and Emerging Policy Approaches in Asia and the Pacific by Kamal Gueye Analysis of the U.S.’s New Climate Initiatives: The Attitude of the Bush Administration towards Climate Change by Naoki Matsuo BOOK REVIEWS Globalization and Environmental Reform: The Ecological Modernization of the Global Economy by Arthur P. J. Mol (Reviewed by Takashi Matsumura); Global Environmental Risk edited by Jeanne X. Kasperson and Roger E. Kasperson (reviewed by Michinori Kabuto); Human Ecology: Basic Concepts for Sustainable Development by Gerald G. Marten (reviewed by Hisato Okamoto); Local Control of Land and Forests: Cultural Dimensions of Resource Management in Northern Thailand by Anan Ganjanapan (reviewed by Tongroj Onchan); Environmental Laws of Mongolia edited by the Ministry for the Environment, Mongolia (reviewed by Batjargal Zambia and Nachin Dashnyam); User’s Guide to Forest Education—Not Just for Foresters edited by the Bavarian Ministry for Food, Agriculture and Forests (reviewed by Ryo Kohsaka); and Acquittal for CO2 by Wolfgang Thüne (reviewed by Axel Michaelowa)NOTES FROM ASIA
The Winter 2001 issue (Volume 2 Number 2: 2,200 Japanese yen) CONTENTSEDITOR’S NOTE TOWARDS THE EARTH SUMMIT 2002 The Establishment of a Global Sustainable Development Partnership System by Qu GepingThe World Bank and Sustainable Development by Ian Johnson Globalisation and Sustainable Development: The Choices before Rio+10 by Martin Khor Sustainable Development: From Dream to Reality by Emil Salim Maximizing Opportunities for All at the World Summit by Björn Stigson Where on Earth Are We Going? by Maurice F. Strong Urban Ecosystems and the Millennium Ecosystem Assessment by A. H. Zakri, Peter J. Marcotullio, Awais Piracha, Caroline King,
and W. Bradnee Chambers ARTICLESDo Developing Countries Enjoy Latecomers’ Advantages in Environmental Management and Technology?—Analysis of the
Environmental Kuznets Curve by Hiroyuki Taguchi Socio-economic Impacts of Climate Change on Indian Agriculture by K. S. Kavi Kumar and Jyoti Parikh Urban Environment and City Governance in India by Piyush TiwariRESEARCH NOTES A Model-based Methodology for Baseline Setting in Flexible Instruments—Results for Indonesia by Sven Graehl, Wolf Fichtner,
Martin Wietschel and Otto Rentz Analytical Overview of the Recent Russia-China Timber Trade by Masanobu Yamane and Wenming Lu

BOOK REVIEWS Climate Change—Science, Strategies, and Solutions by Eileen Claussen (ed.); Negotiating the Kyoto Protocol by Heike Schröder The Fuel Tax Protests in Europe 2000-2001 by John Mitchell and Müge Dolun; Earth Summit 2002: A New Deal by Felix Dodds with Toby Middleton (ed.); Environment, Education and Society in the Asia-Pacific by David Yencken, John Fien, and Helen Sykes (ed.)
The Summer 2001 issue (Volume 2 Number 1: 2,200 Japanese yen) CONTENTSEDITOR'S NOTE SPECIAL CONTRIBUTIONS The United States and the Developing Countries in a Globalizing World: Reflections on Six Years in the United Nations by James
Gustave Speth The Economics of Climate Protection by Peter Hennicke Policy-related Research in the Field of Sustainable Development: Challenges and Choices by Rajendra K. Pachauri A Call for a Legal Regime on Transborder Parks by Amado S. Tolentino, Jr. ARTICLESCorporate Citizenship and Environmental Education by Bishnu B. Bhandari and Osamu Abe Financing Urban Environmental Infrastructure in East Asia: Current Situation, Challenges and Strategies by Miao Chang, Yong
Ren and Hidefumi Imura The Role of Networks in Promoting Environmental Education by NGOs in Asia: From a Viewpoint of International Cooperation by
Ko Nomura and Osamu Abe RESEARCH NOTE The Strategic Implications of Japanese Environmental Management by Yong Ren ESSAY The UK Landfill Tax: Effects of the Landfill Tax on Fly-tipping and Inert Waste Recovery by Yoko Mizuno CURRENT DEVELOPMENTS The Regional Preparatory Process for WSSD (Rio+10): Contributions and Involvement of IGES by Takashi Otsuka and Kazuo
MatsushitaRationality in the Statements of President Bush? An Assessment of Whether the Kyoto Protocol is Fatally Flawed by Naoki Matsuo BOOK REVIEWS Connect With Nature Environment in the 21st Century and New Development PatternsReconciling Environment and Trade
The Summer 2000 issue (Volume 1 Number 1: Inaugural Issue) CONTENTSFOREWORDSPECIAL CONTRIBUTIONS FOR THE INAUGURAL ISSUE Some Hopes for a New Journal on Environmental Strategies by Keith Bezanson The Emerging International System and Sustainable Development by Edith Brown Weiss Climate Change Policy and the Sustainable Future by Hoesung Lee Strategic Research on Global Environmental Issues at IGES by Akio Morishima Research Development: Research on the Human Dimensions of Global Environmental Change by Jill Jäger ARTICLESEnvironmental Education in the Asia-Pacific Region: Some Problems and Prospects by Bishnu B. Bhandari and Osamu Abe Japanese Approaches to Environmental Management: Structural and Institutional Features by Young Ren Formation of an East Asian Regime for Acid Rain Control: The Perspective of Comparative Regionalism by Wakana Takahashi Lao Cypress Forests: Causes of Degradation and the Present State of Conservation in Lao P.D.R. by Masanobu Yamane and
Khampha Chanthirath A Comparative Study of Urban Environment in East Asia: Stage Model of Urban Environmental Evolution by Xuemei Bai and
Hidefumi ImuraThe Costs of Implementing the Kyoto Protocol and Its Implications to China by Yun Li Local Forest Management in Indonesia: A Contradiction Between National Forest Policy and Reality by Martinus Nanang and
Makoto InoueRESEARCH NOTE Environmental Governance in Selected Asian Developing Countries by Yohei Harashima BOOK REVIEW Explanation of Korean Environmental Laws