Double divisor mean centering of ratio spectra as a developed spectrophotometric method for the...
10
ORIGINAL ARTICLE Double divisor mean centering of ratio spectra as a developed spectrophotometric method for the analysis of five-component mixture in drug analysis R’afat Mahmoud Nejem a, * , Mahmoud Mohamed Issa b , Alaa Abu Shanab c , Nahed Talab Shaat d a Analytical Chemistry, Department of Chemistry, Alaqsa University, P.O. Box 4051, Gaza, Palestine b Pharmaceutical Analytical Chemistry, Department of Chemistry, Alaqsa University, P.O. Box 4051, Gaza, Palestine c Inorganic Analytical Chemistry, Department of Chemistry, Alaqsa University, P.O. Box 4051, Gaza, Palestine d R and D Department, Middle East Pharmaceuticals and Cosmetics Laboratories, Gaza, Palestine Received 23 September 2013; revised 19 February 2014; accepted 2 March 2014 KEYWORDS Methylparaben; Propylparaben; Chloropheniramine; Pseudoephedrine; Double divisor mean centering ratio; Classical least square Abstract In this paper a simple method was developed for the simultaneous determination of five- component mixtures, without prior separation steps. The method is based on the combination of double divisor-ratio derivative method and mean centering of ratio spectra method. The mathemat- ical explanation of the procedure is illustrated. The linear determination ranges were 0–30, 0–20, 0–20, 0–45 and 0–100 lg ml 1 for paracetamol, methylparaben, propylparaben, chloropheniramine maleate and pseudoephedrine hydrochloride in 0.1 M HCl, respectively. The proposed method was validated by using synthetic five-component mixtures and applied to the simultaneous determina- tion of these drugs in Decamol Flu syrup. No published spectrophotometric method has been reported for simultaneous determination of the five components of this mixture. So the results of the double divisor mean centering of ratio method (DD-MCR) were statistically compared with those of a proposed classical least squares method (CLS). ª 2014 King Saud University. Production and hosting by Elsevier B.V. All rights reserved. 1. Introduction Paracetamol (PA) is an analgesic and antipyretic agent [1], which is associated with pseudoephedrine hydrochloride (PS), a direct- and indirect-acting sympathomimetic agent [2] and chloropheniramine maleate (CM), a potent antihistaminic [3], in addition to methylparaben (MP) and propylparaben, which are used as preservatives. This combination is used for symptomatic treatment of coughs and the common cold. The UV absorption spectra of PA, MA, PP, CH, and PS display considerable overlap, where the application of the con- ventional spectrophotometry failed to resolve it. No spectro- photometric analytical method has been reported for the simultaneous determination of PA, MP, PP, CH, and PS in a multicomponent mixture. * Corresponding author. Tel.: +970 599603459; fax: +970 82845488. E-mail address: [email protected] (R.M. Nejem). Peer review under responsibility of King Saud University. Production and hosting by Elsevier Journal of Saudi Chemical Society (2014) xxx, xxx–xxx King Saud University Journal of Saudi Chemical Society www.ksu.edu.sa www.sciencedirect.com 1319-6103 ª 2014 King Saud University. Production and hosting by Elsevier B.V. All rights reserved. http://dx.doi.org/10.1016/j.jscs.2014.03.001 Please cite this article in press as: R.M. Nejem et al., Double divisor mean centering of ratio spectra as a developed spectrophotometric method for the analysis of five-component mixture in drug analysis, Journal of Saudi Chemical Society (2014), http://dx.doi.org/10.1016/j.jscs.2014.03.001
-
Upload
independent -
Category
Documents
-
view
4 -
download
0
Transcript of Double divisor mean centering of ratio spectra as a developed spectrophotometric method for the...
Journal of Saudi Chemical Society (2014) xxx, xxx–xxx
King Saud University
Journal of Saudi Chemical Society
www.ksu.edu.sawww.sciencedirect.com
ORIGINAL ARTICLE
Double divisor mean centering of ratio spectra as
a developed spectrophotometric method for the analysis
of five-component mixture in drug analysis
R’afat Mahmoud Nejema,*, Mahmoud Mohamed Issa
b, Alaa Abu Shanab
c,
Nahed Talab Shaat d
a Analytical Chemistry, Department of Chemistry, Alaqsa University, P.O. Box 4051, Gaza, Palestineb Pharmaceutical Analytical Chemistry, Department of Chemistry, Alaqsa University, P.O. Box 4051, Gaza, Palestinec Inorganic Analytical Chemistry, Department of Chemistry, Alaqsa University, P.O. Box 4051, Gaza, Palestined R and D Department, Middle East Pharmaceuticals and Cosmetics Laboratories, Gaza, Palestine
Received 23 September 2013; revised 19 February 2014; accepted 2 March 2014
*
E-
Pe
13
ht
Pth
KEYWORDS
Methylparaben;
Propylparaben;
Chloropheniramine;
Pseudoephedrine;
Double divisor mean
centering ratio;
Classical least square
Corresponding author. Tel.:
mail address: rafatnejem@al
er review under responsibilit
Production an
19-6103 ª 2014 King Saud U
tp://dx.doi.org/10.1016/j.jscs.
lease cite this article in press ae analysis of five-component
+970 599
aqsa.edu
y of King
d hostin
niversity
2014.03.0
s: R.M. Nmixture
Abstract In this paper a simple method was developed for the simultaneous determination of five-
component mixtures, without prior separation steps. The method is based on the combination of
double divisor-ratio derivative method and mean centering of ratio spectra method. The mathemat-
ical explanation of the procedure is illustrated. The linear determination ranges were 0–30, 0–20,
0–20, 0–45 and 0–100 lg ml�1 for paracetamol, methylparaben, propylparaben, chloropheniramine
maleate and pseudoephedrine hydrochloride in 0.1 M HCl, respectively. The proposed method was
validated by using synthetic five-component mixtures and applied to the simultaneous determina-
tion of these drugs in Decamol Flu syrup. No published spectrophotometric method has been
reported for simultaneous determination of the five components of this mixture. So the results of
the double divisor mean centering of ratio method (DD-MCR) were statistically compared with
those of a proposed classical least squares method (CLS).ª 2014 King Saud University. Production and hosting by Elsevier B.V. All rights reserved.
1. Introduction
Paracetamol (PA) is an analgesic and antipyretic agent [1],which is associated with pseudoephedrine hydrochloride
603459; fax: +970 82845488.
.ps (R.M. Nejem).
Saud University.
g by Elsevier
. Production and hosting by Elsev
01
ejem et al., Double divisor mean cin drug analysis, Journal of Saud
(PS), a direct- and indirect-acting sympathomimetic agent [2]
and chloropheniramine maleate (CM), a potent antihistaminic[3], in addition to methylparaben (MP) and propylparaben,which are used as preservatives. This combination is used for
symptomatic treatment of coughs and the common cold.The UV absorption spectra of PA, MA, PP, CH, and PS
display considerable overlap, where the application of the con-
ventional spectrophotometry failed to resolve it. No spectro-photometric analytical method has been reported for thesimultaneous determination of PA, MP, PP, CH, and PS ina multicomponent mixture.
ier B.V. All rights reserved.
entering of ratio spectra as a developed spectrophotometric method fori Chemical Society (2014), http://dx.doi.org/10.1016/j.jscs.2014.03.001
2 R.M. Nejem et al.
While official [4] and spectrophotometric methods [5–14]are available for the determination of each of these drugsalone or in mixture with other drugs, the most prominent
method for simultaneous determination of PA, MP, PP,CH, and PS is the HPLC, GC–MS or LC–MS [15–21]. How-ever, these reported methods suffered from time-consuming
extraction procedure and long chromatographic analysistime. Additionally the United States pharmacopeia [22] sug-gested the reduction in the amount of toxic organic solvents
used in HPLC assays that cause harm to human health andenvironment. Therefore, chemometric-assisted spectropho-tometry as a simple, quick and low cost method may be agood alternative if it is combined with multivariate calibra-
tion methods for determination of a complex in pharmaceu-tical quality control laboratories.
Salinas et al. [23] proposed a ratio-derivative spectropho-
tometric method. Their method is based on the derivativeof the ratio spectra for a binary mixture which divided bythe spectra of a standard solution (one divisor). Berzas Neva-
da et al. [24] developed a derivative ratio spectrum-zero cross-ing for the simultaneous determination of three compoundsin ternary mixtures (no divisor used). Dinc et al. [25–27] pro-
posed a double divisor-ratio spectra derivative method for thesimultaneous determination of ternary mixtures. Recently,Afkhami and Bahram proposed a new mean centering of ra-tio spectra method for the simultaneous determination of ter-
nary mixtures [28–30]. Their method is based on the meancentering of the ratio spectra for a binary or ternary mixturewhich divided by the spectra of a standard solution (one
divisor).Unfortunately, the advantages of all these methods are at
least partially offset because they are used only for the determi-
nation of binary or ternary mixtures.In this paper a new and simple method was developed for
the simultaneous determination of five-component mixtures,
without prior separation steps. This method is based on thecombination of double divisor-ratio spectra method andmean centering of ratio spectra method. This method elimi-nates derivative steps and therefore signal to noise ratio is en-
hanced [31]. The technique can be used for other systems,particularly for more than five component systems. It maybe also used more than double divisor (three or four) for
the five component mixtures.No published method has been reported for simultaneous
determination of PA, MP, PP, CH and PS. So the results of
the double divisor mean centering of ratio spectra (DD-MCR) method were compared with those of a proposed clas-sical least squares (CLS) method.
2. Theoretical background
2.1. Double divisor mean centering of ratio spectra method (DD-MCR)
If a mixture of five compounds (PA, MP, PP, CH and PS) is
considered and if Beer’s law is obeyed for all compounds overthe whole wavelength range used, then
Am ¼ aPACPA þ aMPCMP þ aPPCPP þ aCHCCH þ aPSCPS ð1Þ
where Am is the vector of the absorbance of the mixture, aPA,aMP, aPP, aCH, and aPS are the absorptivity vectors of PA, MP,
Please cite this article in press as: R.M. Nejem et al., Double divisor mean cthe analysis of five-component mixture in drug analysis, Journal of Saud
PP, CH and PS and CPA, CMP, CPP, CCH, and CPS are the con-
centrations of PA, MP, PP, CH and PS, respectively. Absorp-tivity A: (1%, 1 cm) values were calculated by using theabsorbance for zero-order spectra for each of the compounds
in the five-component mixture.If Eq. (1) is divided by aMPC
�
MP þ aPPC�
PP
ðC�MP ¼ C�
PP=1 lg ml�1) corresponding to the spectrum of astandard solution of CMP and CPP the first ratio spectrum is
obtained [25,28]:
x¼ Am
aMPþaPP
¼ aMPCMPþaPPCPP
aMPþaPP
þ aPACPA
aMPþaPP
þ aCHCCH
aMPþaPP
þ aPSCPS
aMPþaPP
ð2Þ
Here in our method, in the synthetic mixture, CMP and CPP areequal and in the real sample, standard addition method is used(CMP = CPP + CPP,x)
x ¼ Am þ aPPCPP;x
aMP þ aPP
¼ aMPCMP þ aPPbCPP þ CPP;xcaMP þ aPP
þ aPACPA
aMP þ aPP
þ aCHCCH
aMP þ aPP
þ aPSCPS
aMP þ aPP
ð3Þ
If Eq. (2), (3) are mean centered, therefore
mcx ¼ mcaPACPA
aMP þ aPP
þmcaCHCCH
aMP þ aPP
þmcaPSCPS
aMP þ aPP
ð4Þ
By dividing Eq. (4) by mc aCHaMPþaPP
, the second ratio spectrum isobtained
y ¼ mcx
mc aCHaMPþaPP
¼ CCH þ ðZÞ CPA þmc aPS
aMPþaPP
mc aCHaMPþaPP
CPS
mcy ¼ mcZ CPA0 þ mcmc aPS
aMPþaPP
mc aCHaMPþaPP
ð5Þ
Finally we obtain the third ratio spectrum
mcmcy
mcZ¼ ðconstantÞCPS ð6Þ
Eq. (6) is the mathematical foundation of multicomponent
analysis which permits the determination of the concentrationof each compound without interference from the other compo-nents of the mixture.
In practice, the signal of third ratio spectrum of PS is
dependent only on the concentration values CPS and Am
aMPþaPP
(also Cx in real sample), but is independent of the concentra-tion values CPA, CMP, CPP, and CCH in the mixture. The dou-
ble divisor concentration used in our developed method isshown in Table 1, therefore, the concentration CPS in themixture is proportional to the amount of mc mcy
mcZcorrespond-
ing to a maximum or minimum point.A calibration curve could be constructed by plotting
mc mcymcZ
against different concentrations of PS. As explainedhere, this technique can be used for other systems, particularlyfor more than five component systems. By using the calibra-
tion curve, the concentration of PS is determined in the samplecontaining PA, MA, PP and CH. The concentrations of othercomponents are determined by analogous procedures.
entering of ratio spectra as a developed spectrophotometric method fori Chemical Society (2014), http://dx.doi.org/10.1016/j.jscs.2014.03.001
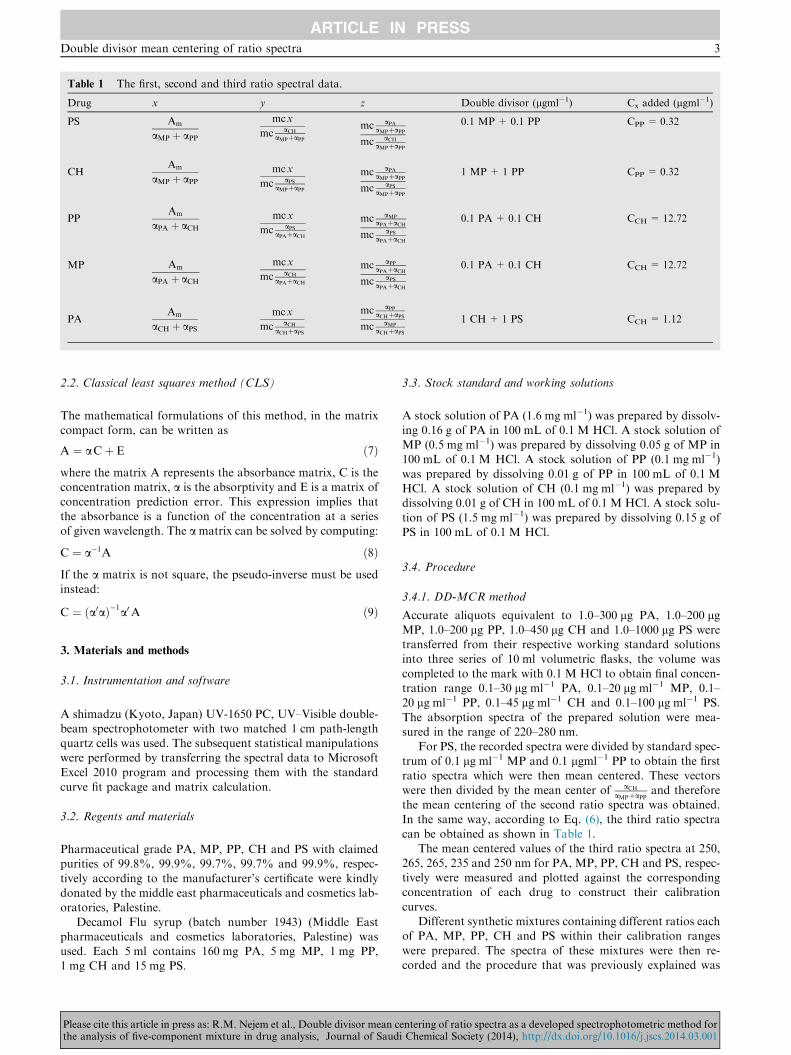
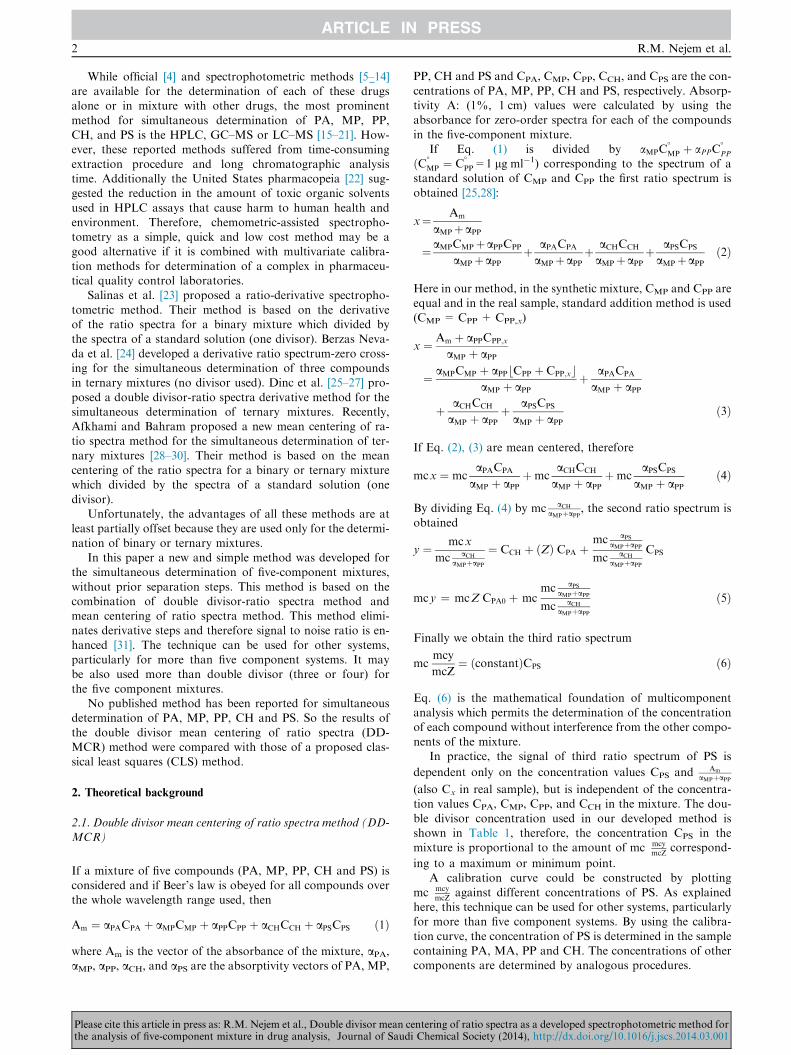
Table 1 The first, second and third ratio spectral data.
Drug x y z Double divisor (lgml�1) Cx added (lgml�1)
PS Am
aMP þ aPP
mcx
mc aCH
aMPþaPP
mc aPA
aMPþaPP
mc aCH
aMPþaPP
0.1 MP+ 0.1 PP CPP = 0.32
CHAm
aMP þ aPP
mcx
mc aPS
aMPþaPP
mc aPA
aMPþaPP
mc aPS
aMPþaPP
1 MP+ 1 PP CPP = 0.32
PPAm
aPA þ aCH
mcx
mc aPS
aPAþaCH
mc aMP
aPAþaCH
mc aPS
aPAþaCH
0.1 PA+ 0.1 CH CCH = 12.72
MP Am
aPA þ aCH
mcx
mc aCH
aPAþaCH
mc aPP
aPAþaCH
mc aPS
aPAþaCH
0.1 PA+ 0.1 CH CCH = 12.72
PAAm
aCH þ aPS
mcx
mc aCH
aCHþaPS
mc aPP
aCHþaPS
mc aMP
aCHþaPS
1 CH+ 1 PS CCH = 1.12
Double divisor mean centering of ratio spectra 3
2.2. Classical least squares method (CLS)
The mathematical formulations of this method, in the matrixcompact form, can be written as
A ¼ aCþ E ð7Þ
where the matrix A represents the absorbance matrix, C is theconcentration matrix, a is the absorptivity and E is a matrix of
concentration prediction error. This expression implies thatthe absorbance is a function of the concentration at a seriesof given wavelength. The a matrix can be solved by computing:
C ¼ a�1A ð8Þ
If the a matrix is not square, the pseudo-inverse must be usedinstead:
C ¼ ða0aÞ�1a0A ð9Þ
3. Materials and methods
3.1. Instrumentation and software
A shimadzu (Kyoto, Japan) UV-1650 PC, UV–Visible double-beam spectrophotometer with two matched 1 cm path-lengthquartz cells was used. The subsequent statistical manipulationswere performed by transferring the spectral data to Microsoft
Excel 2010 program and processing them with the standardcurve fit package and matrix calculation.
3.2. Regents and materials
Pharmaceutical grade PA, MP, PP, CH and PS with claimedpurities of 99.8%, 99.9%, 99.7%, 99.7% and 99.9%, respec-
tively according to the manufacturer’s certificate were kindlydonated by the middle east pharmaceuticals and cosmetics lab-oratories, Palestine.
Decamol Flu syrup (batch number 1943) (Middle Eastpharmaceuticals and cosmetics laboratories, Palestine) wasused. Each 5 ml contains 160 mg PA, 5 mg MP, 1 mg PP,1 mg CH and 15 mg PS.
Please cite this article in press as: R.M. Nejem et al., Double divisor mean cthe analysis of five-component mixture in drug analysis, Journal of Saud
3.3. Stock standard and working solutions
A stock solution of PA (1.6 mg ml�1) was prepared by dissolv-ing 0.16 g of PA in 100 mL of 0.1 M HCl. A stock solution ofMP (0.5 mg ml�1) was prepared by dissolving 0.05 g of MP in100 mL of 0.1 M HCl. A stock solution of PP (0.1 mg ml�1)
was prepared by dissolving 0.01 g of PP in 100 mL of 0.1 MHCl. A stock solution of CH (0.1 mg ml�1) was prepared bydissolving 0.01 g of CH in 100 mL of 0.1 M HCl. A stock solu-
tion of PS (1.5 mg ml�1) was prepared by dissolving 0.15 g ofPS in 100 mL of 0.1 M HCl.
3.4. Procedure
3.4.1. DD-MCR method
Accurate aliquots equivalent to 1.0–300 lg PA, 1.0–200 lgMP, 1.0–200 lg PP, 1.0–450 lg CH and 1.0–1000 lg PS weretransferred from their respective working standard solutionsinto three series of 10 ml volumetric flasks, the volume was
completed to the mark with 0.1 M HCl to obtain final concen-tration range 0.1–30 lg ml�1 PA, 0.1–20 lg ml�1 MP, 0.1–20 lg ml�1 PP, 0.1–45 lg ml�1 CH and 0.1–100 lg ml�1 PS.
The absorption spectra of the prepared solution were mea-sured in the range of 220–280 nm.
For PS, the recorded spectra were divided by standard spec-
trum of 0.1 lg ml�1 MP and 0.1 lgml�1 PP to obtain the firstratio spectra which were then mean centered. These vectorswere then divided by the mean center of aCH
aMPþaPPand therefore
the mean centering of the second ratio spectra was obtained.
In the same way, according to Eq. (6), the third ratio spectracan be obtained as shown in Table 1.
The mean centered values of the third ratio spectra at 250,
265, 265, 235 and 250 nm for PA, MP, PP, CH and PS, respec-tively were measured and plotted against the correspondingconcentration of each drug to construct their calibration
curves.Different synthetic mixtures containing different ratios each
of PA, MP, PP, CH and PS within their calibration ranges
were prepared. The spectra of these mixtures were then re-corded and the procedure that was previously explained was
entering of ratio spectra as a developed spectrophotometric method fori Chemical Society (2014), http://dx.doi.org/10.1016/j.jscs.2014.03.001
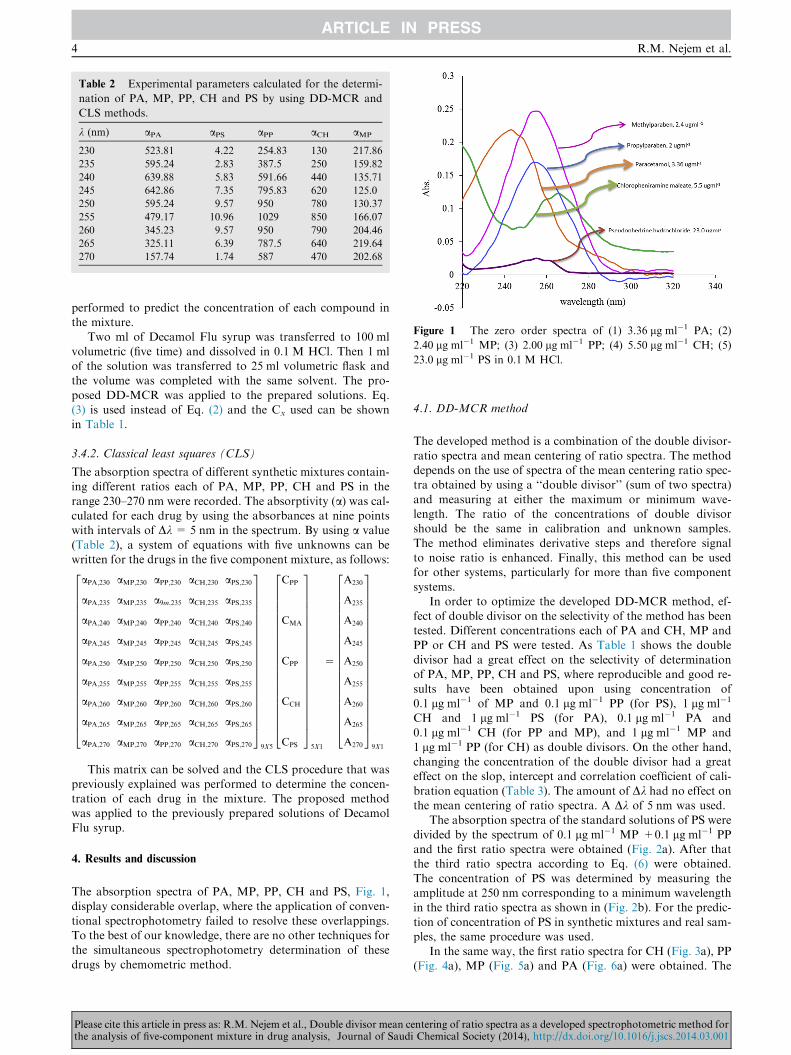
Table 2 Experimental parameters calculated for the determi-
nation of PA, MP, PP, CH and PS by using DD-MCR and
CLS methods.
k (nm) aPA aPS aPP aCH aMP
230 523.81 4.22 254.83 130 217.86
235 595.24 2.83 387.5 250 159.82
240 639.88 5.83 591.66 440 135.71
245 642.86 7.35 795.83 620 125.0
250 595.24 9.57 950 780 130.37
255 479.17 10.96 1029 850 166.07
260 345.23 9.57 950 790 204.46
265 325.11 6.39 787.5 640 219.64
270 157.74 1.74 587 470 202.68
Figure 1 The zero order spectra of (1) 3.36 lg ml�1 PA; (2)
2.40 lg ml�1 MP; (3) 2.00 lg ml�1 PP; (4) 5.50 lg ml�1 CH; (5)
23.0 lg ml�1 PS in 0.1 M HCl.
4 R.M. Nejem et al.
performed to predict the concentration of each compound inthe mixture.
Two ml of Decamol Flu syrup was transferred to 100 ml
volumetric (five time) and dissolved in 0.1 M HCl. Then 1 mlof the solution was transferred to 25 ml volumetric flask andthe volume was completed with the same solvent. The pro-
posed DD-MCR was applied to the prepared solutions. Eq.(3) is used instead of Eq. (2) and the Cx used can be shownin Table 1.
3.4.2. Classical least squares (CLS)
The absorption spectra of different synthetic mixtures contain-ing different ratios each of PA, MP, PP, CH and PS in the
range 230–270 nm were recorded. The absorptivity (a) was cal-culated for each drug by using the absorbances at nine pointswith intervals of Dk = 5 nm in the spectrum. By using a value
(Table 2), a system of equations with five unknowns can bewritten for the drugs in the five component mixture, as follows:
aPA;230 aMP;230 aPP;230 aCH;230 aPS;230
aPA;235 aMP;235 a9m;235 aCH;235 aPS;235
aPA;240 aMP;240 aPP;240 aCH;240 aPS;240
aPA;245 aMP;245 aPP;245 aCH;245 aPS;245
aPA;250 aMP;250 aPP;250 aCH;250 aPS;250
aPA;255 aMP;255 aPP;255 aCH;255 aPS;255
aPA;260 aMP;260 aPP;260 aCH;260 aPS;260
aPA;265 aMP;265 aPP;265 aCH;265 aPS;265
aPA;270 aMP;270 aPP;270 aCH;270 aPS;270
26666666666666666666664
37777777777777777777775
9X5
CPP
CMA
CPP
CCH
CPS
26666666666666666666664
37777777777777777777775
5X1
¼
A230
A235
A240
A245
A250
A255
A260
A265
A270
26666666666666666666664
37777777777777777777775
9X1
This matrix can be solved and the CLS procedure that waspreviously explained was performed to determine the concen-tration of each drug in the mixture. The proposed method
was applied to the previously prepared solutions of DecamolFlu syrup.
4. Results and discussion
The absorption spectra of PA, MP, PP, CH and PS, Fig. 1,display considerable overlap, where the application of conven-
tional spectrophotometry failed to resolve these overlappings.To the best of our knowledge, there are no other techniques forthe simultaneous spectrophotometry determination of these
drugs by chemometric method.
Please cite this article in press as: R.M. Nejem et al., Double divisor mean cthe analysis of five-component mixture in drug analysis, Journal of Saud
4.1. DD-MCR method
The developed method is a combination of the double divisor-
ratio spectra and mean centering of ratio spectra. The methoddepends on the use of spectra of the mean centering ratio spec-tra obtained by using a ‘‘double divisor’’ (sum of two spectra)
and measuring at either the maximum or minimum wave-length. The ratio of the concentrations of double divisorshould be the same in calibration and unknown samples.
The method eliminates derivative steps and therefore signalto noise ratio is enhanced. Finally, this method can be usedfor other systems, particularly for more than five component
systems.In order to optimize the developed DD-MCR method, ef-
fect of double divisor on the selectivity of the method has beentested. Different concentrations each of PA and CH, MP and
PP or CH and PS were tested. As Table 1 shows the doubledivisor had a great effect on the selectivity of determinationof PA, MP, PP, CH and PS, where reproducible and good re-
sults have been obtained upon using concentration of0.1 lg ml�1 of MP and 0.1 lg ml�1 PP (for PS), 1 lg ml�1
CH and 1 lg ml�1 PS (for PA), 0.1 lg ml�1 PA and
0.1 lg ml�1 CH (for PP and MP), and 1 lg ml�1 MP and1 lg ml�1 PP (for CH) as double divisors. On the other hand,changing the concentration of the double divisor had a greateffect on the slop, intercept and correlation coefficient of cali-
bration equation (Table 3). The amount of Dk had no effect onthe mean centering of ratio spectra. A Dk of 5 nm was used.
The absorption spectra of the standard solutions of PS were
divided by the spectrum of 0.1 lg ml�1 MP +0.1 lg ml�1 PPand the first ratio spectra were obtained (Fig. 2a). After thatthe third ratio spectra according to Eq. (6) were obtained.
The concentration of PS was determined by measuring theamplitude at 250 nm corresponding to a minimum wavelengthin the third ratio spectra as shown in (Fig. 2b). For the predic-
tion of concentration of PS in synthetic mixtures and real sam-ples, the same procedure was used.
In the same way, the first ratio spectra for CH (Fig. 3a), PP(Fig. 4a), MP (Fig. 5a) and PA (Fig. 6a) were obtained. The
entering of ratio spectra as a developed spectrophotometric method fori Chemical Society (2014), http://dx.doi.org/10.1016/j.jscs.2014.03.001
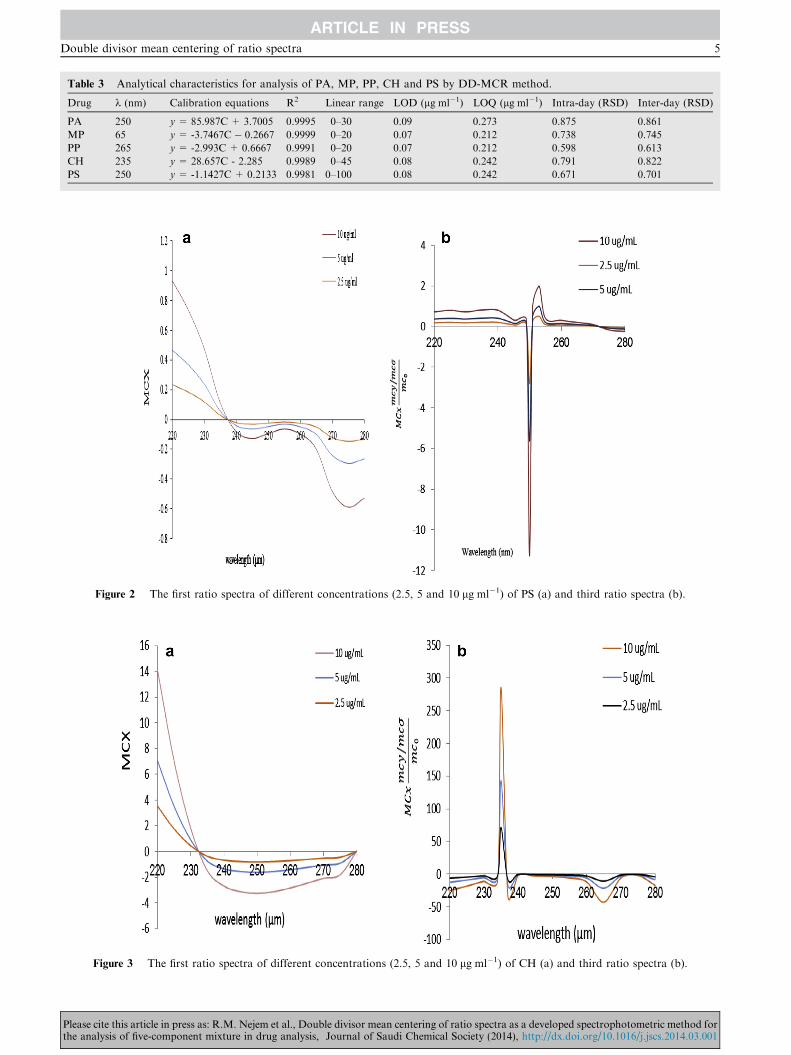
Table 3 Analytical characteristics for analysis of PA, MP, PP, CH and PS by DD-MCR method.
Drug k (nm) Calibration equations R2 Linear range LOD (lg ml�1) LOQ (lg ml�1) Intra-day (RSD) Inter-day (RSD)
PA 250 y= 85.987C+ 3.7005 0.9995 0–30 0.09 0.273 0.875 0.861
MP 65 y= -3.7467C � 0.2667 0.9999 0–20 0.07 0.212 0.738 0.745
PP 265 y= -2.993C + 0.6667 0.9991 0–20 0.07 0.212 0.598 0.613
CH 235 y= 28.657C - 2.285 0.9989 0–45 0.08 0.242 0.791 0.822
PS 250 y= -1.1427C+ 0.2133 0.9981 0–100 0.08 0.242 0.671 0.701
Figure 2 The first ratio spectra of different concentrations (2.5, 5 and 10 lg ml�1) of PS (a) and third ratio spectra (b).
Figure 3 The first ratio spectra of different concentrations (2.5, 5 and 10 lg ml�1) of CH (a) and third ratio spectra (b).
Double divisor mean centering of ratio spectra 5
Please cite this article in press as: R.M. Nejem et al., Double divisor mean centering of ratio spectra as a developed spectrophotometric method forthe analysis of five-component mixture in drug analysis, Journal of Saudi Chemical Society (2014), http://dx.doi.org/10.1016/j.jscs.2014.03.001
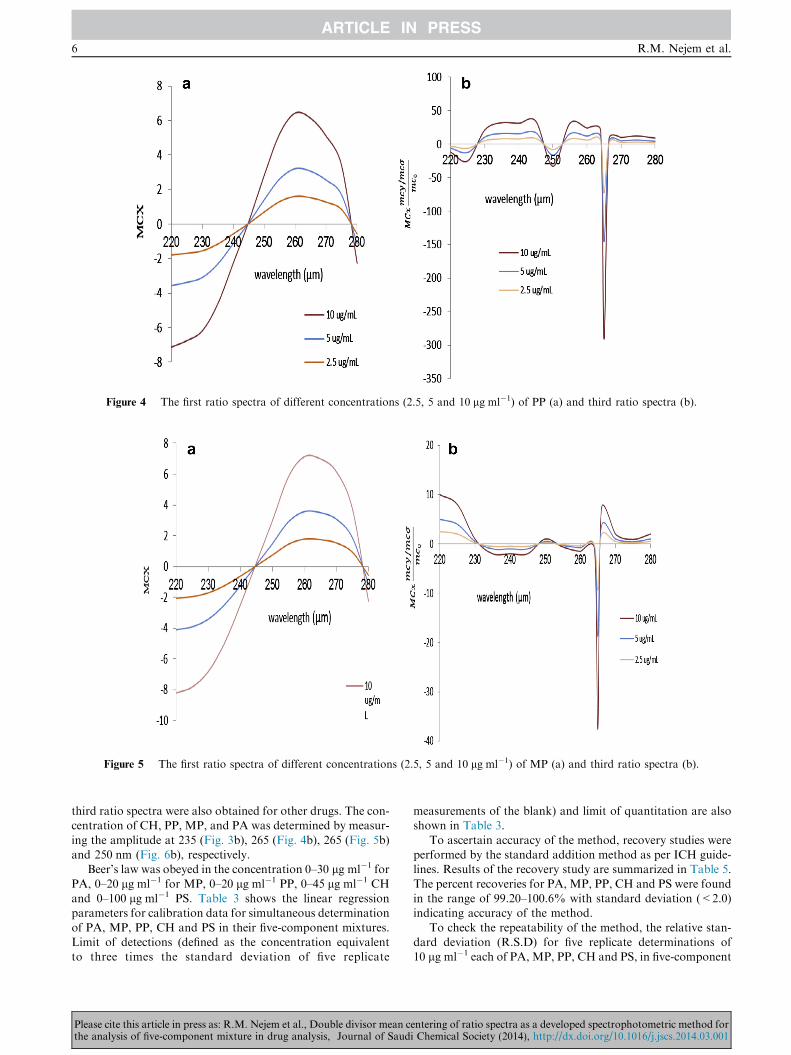
Figure 4 The first ratio spectra of different concentrations (2.5, 5 and 10 lg ml�1) of PP (a) and third ratio spectra (b).
Figure 5 The first ratio spectra of different concentrations (2.5, 5 and 10 lg ml�1) of MP (a) and third ratio spectra (b).
6 R.M. Nejem et al.
third ratio spectra were also obtained for other drugs. The con-centration of CH, PP, MP, and PA was determined by measur-
ing the amplitude at 235 (Fig. 3b), 265 (Fig. 4b), 265 (Fig. 5b)and 250 nm (Fig. 6b), respectively.
Beer’s law was obeyed in the concentration 0–30 lg ml�1 for
PA, 0–20 lg ml�1 for MP, 0–20 lg ml�1 PP, 0–45 lg ml�1 CHand 0–100 lg ml�1 PS. Table 3 shows the linear regressionparameters for calibration data for simultaneous determination
of PA, MP, PP, CH and PS in their five-component mixtures.Limit of detections (defined as the concentration equivalentto three times the standard deviation of five replicate
Please cite this article in press as: R.M. Nejem et al., Double divisor mean cthe analysis of five-component mixture in drug analysis, Journal of Saud
measurements of the blank) and limit of quantitation are alsoshown in Table 3.
To ascertain accuracy of the method, recovery studies wereperformed by the standard addition method as per ICH guide-lines. Results of the recovery study are summarized in Table 5.
The percent recoveries for PA, MP, PP, CH and PS were foundin the range of 99.20–100.6% with standard deviation (<2.0)indicating accuracy of the method.
To check the repeatability of the method, the relative stan-dard deviation (R.S.D) for five replicate determinations of10 lg ml�1 each of PA, MP, PP, CH and PS, in five-component
entering of ratio spectra as a developed spectrophotometric method fori Chemical Society (2014), http://dx.doi.org/10.1016/j.jscs.2014.03.001
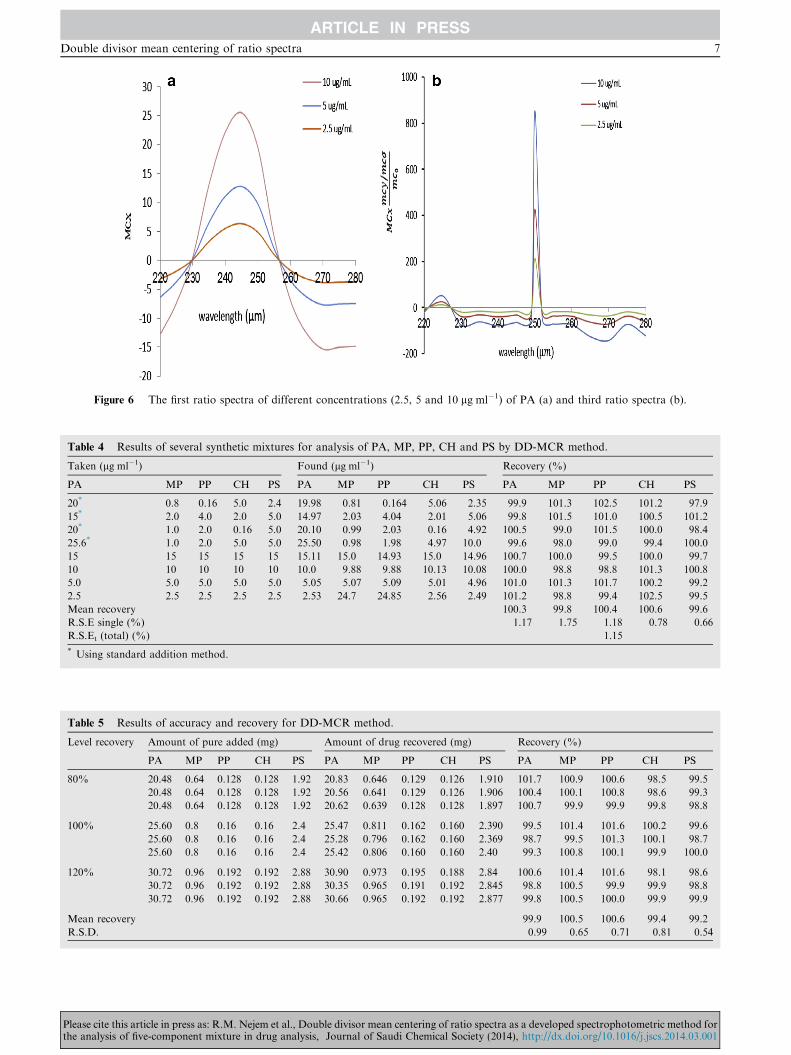
Figure 6 The first ratio spectra of different concentrations (2.5, 5 and 10 lg ml�1) of PA (a) and third ratio spectra (b).
Table 4 Results of several synthetic mixtures for analysis of PA, MP, PP, CH and PS by DD-MCR method.
Taken (lg ml�1) Found (lg ml�1) Recovery (%)
PA MP PP CH PS PA MP PP CH PS PA MP PP CH PS
20* 0.8 0.16 5.0 2.4 19.98 0.81 0.164 5.06 2.35 99.9 101.3 102.5 101.2 97.9
15* 2.0 4.0 2.0 5.0 14.97 2.03 4.04 2.01 5.06 99.8 101.5 101.0 100.5 101.2
20* 1.0 2.0 0.16 5.0 20.10 0.99 2.03 0.16 4.92 100.5 99.0 101.5 100.0 98.4
25.6* 1.0 2.0 5.0 5.0 25.50 0.98 1.98 4.97 10.0 99.6 98.0 99.0 99.4 100.0
15 15 15 15 15 15.11 15.0 14.93 15.0 14.96 100.7 100.0 99.5 100.0 99.7
10 10 10 10 10 10.0 9.88 9.88 10.13 10.08 100.0 98.8 98.8 101.3 100.8
5.0 5.0 5.0 5.0 5.0 5.05 5.07 5.09 5.01 4.96 101.0 101.3 101.7 100.2 99.2
2.5 2.5 2.5 2.5 2.5 2.53 24.7 24.85 2.56 2.49 101.2 98.8 99.4 102.5 99.5
Mean recovery 100.3 99.8 100.4 100.6 99.6
R.S.E single (%) 1.17 1.75 1.18 0.78 0.66
R.S.Et (total) (%) 1.15
* Using standard addition method.
Table 5 Results of accuracy and recovery for DD-MCR method.
Level recovery Amount of pure added (mg) Amount of drug recovered (mg) Recovery (%)
PA MP PP CH PS PA MP PP CH PS PA MP PP CH PS
80% 20.48 0.64 0.128 0.128 1.92 20.83 0.646 0.129 0.126 1.910 101.7 100.9 100.6 98.5 99.5
20.48 0.64 0.128 0.128 1.92 20.56 0.641 0.129 0.126 1.906 100.4 100.1 100.8 98.6 99.3
20.48 0.64 0.128 0.128 1.92 20.62 0.639 0.128 0.128 1.897 100.7 99.9 99.9 99.8 98.8
100% 25.60 0.8 0.16 0.16 2.4 25.47 0.811 0.162 0.160 2.390 99.5 101.4 101.6 100.2 99.6
25.60 0.8 0.16 0.16 2.4 25.28 0.796 0.162 0.160 2.369 98.7 99.5 101.3 100.1 98.7
25.60 0.8 0.16 0.16 2.4 25.42 0.806 0.160 0.160 2.40 99.3 100.8 100.1 99.9 100.0
120% 30.72 0.96 0.192 0.192 2.88 30.90 0.973 0.195 0.188 2.84 100.6 101.4 101.6 98.1 98.6
30.72 0.96 0.192 0.192 2.88 30.35 0.965 0.191 0.192 2.845 98.8 100.5 99.9 99.9 98.8
30.72 0.96 0.192 0.192 2.88 30.66 0.965 0.192 0.192 2.877 99.8 100.5 100.0 99.9 99.9
Mean recovery 99.9 100.5 100.6 99.4 99.2
R.S.D. 0.99 0.65 0.71 0.81 0.54
Double divisor mean centering of ratio spectra 7
Please cite this article in press as: R.M. Nejem et al., Double divisor mean centering of ratio spectra as a developed spectrophotometric method forthe analysis of five-component mixture in drug analysis, Journal of Saudi Chemical Society (2014), http://dx.doi.org/10.1016/j.jscs.2014.03.001
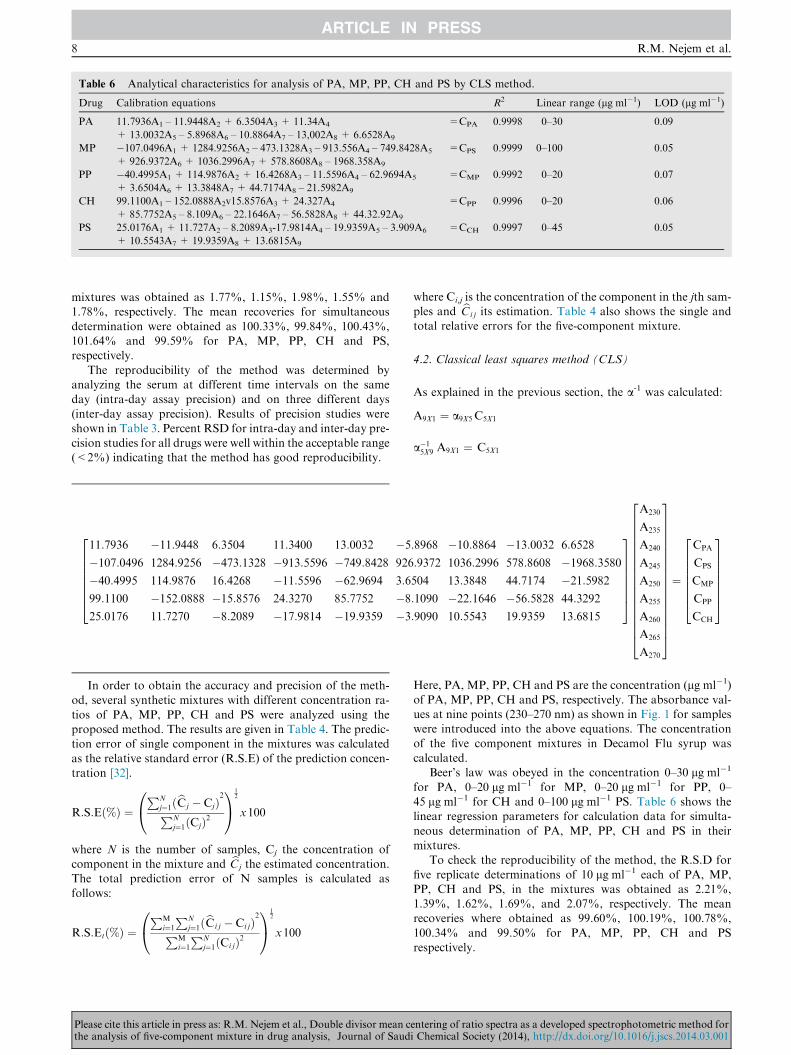
Table 6 Analytical characteristics for analysis of PA, MP, PP, CH and PS by CLS method.
Drug Calibration equations R2 Linear range (lg ml�1) LOD (lg ml�1)
PA 11.7936A1 – 11.9448A2 + 6.3504A3 + 11.34A4
+ 13.0032A5 – 5.8968A6 – 10.8864A7 – 13,002A8 + 6.6528A9
=CPA 0.9998 0–30 0.09
MP �107.0496A1 + 1284.9256A2 – 473.1328A3 – 913.556A4 – 749.8428A5
+ 926.9372A6 + 1036.2996A7 + 578.8608A8 – 1968.358A9
=CPS 0.9999 0–100 0.05
PP �40.4995A1 + 114.9876A2 + 16.4268A3 – 11.5596A4 – 62.9694A5
+ 3.6504A6 + 13.3848A7 + 44.7174A8 – 21.5982A9
=CMP 0.9992 0–20 0.07
CH 99.1100A1 – 152.0888A2v15.8576A3 + 24.327A4
+ 85.7752A5 – 8.109A6 – 22.1646A7 – 56.5828A8 + 44.32.92A9
=CPP 0.9996 0–20 0.06
PS 25.0176A1 + 11.727A2 – 8.2089A3-17.9814A4 – 19.9359A5 – 3.909A6
+ 10.5543A7 + 19.9359A8 + 13.6815A9
=CCH 0.9997 0–45 0.05
8 R.M. Nejem et al.
mixtures was obtained as 1.77%, 1.15%, 1.98%, 1.55% and1.78%, respectively. The mean recoveries for simultaneous
determination were obtained as 100.33%, 99.84%, 100.43%,101.64% and 99.59% for PA, MP, PP, CH and PS,respectively.
The reproducibility of the method was determined byanalyzing the serum at different time intervals on the sameday (intra-day assay precision) and on three different days
(inter-day assay precision). Results of precision studies wereshown in Table 3. Percent RSD for intra-day and inter-day pre-cision studies for all drugs were well within the acceptable range(<2%) indicating that the method has good reproducibility.
11:7936 �11:9448 6:3504 11:3400 13:0032 �5:8968 �10:8864 �13:0032 6:6528
�107:0496 1284:9256 �473:1328 �913:5596 �749:8428 926:9372 1036:2996 578:8608 �1968:3580�40:4995 114:9876 16:4268 �11:5596 �62:9694 3:6504 13:3848 44:7174 �21:598299:1100 �152:0888 �15:8576 24:3270 85:7752 �8:1090 �22:1646 �56:5828 44:3292
25:0176 11:7270 �8:2089 �17:9814 �19:9359 �3:9090 10:5543 19:9359 13:6815
26666664
37777775
A230
A235
A240
A245
A250
A255
A260
A265
A270
266666666666666664
377777777777777775
¼
CPA
CPS
CMP
CPP
CCH
26666664
37777775
In order to obtain the accuracy and precision of the meth-od, several synthetic mixtures with different concentration ra-
tios of PA, MP, PP, CH and PS were analyzed using theproposed method. The results are given in Table 4. The predic-tion error of single component in the mixtures was calculated
as the relative standard error (R.S.E) of the prediction concen-tration [32].
R:S:Eð%Þ ¼PN
j¼1ðbC j � CjÞ2
PNj¼1ðCjÞ2
0@
1A
12
x100
where N is the number of samples, Cj the concentration ofcomponent in the mixture and bCj the estimated concentration.The total prediction error of N samples is calculated as
follows:
R:S:Etð%Þ ¼PM
i¼1PN
j¼1ðbCi j � Ci jÞ2
PMi¼1PN
j¼1ðCi jÞ2
0@
1A
12
x100
Please cite this article in press as: R.M. Nejem et al., Double divisor mean cthe analysis of five-component mixture in drug analysis, Journal of Saud
where Ci,j is the concentration of the component in the jth sam-ples and bCi j its estimation. Table 4 also shows the single andtotal relative errors for the five-component mixture.
4.2. Classical least squares method (CLS)
As explained in the previous section, the a-1 was calculated:
A9X1 ¼ a9X5 C5X1
a�15X9 A9X1 ¼ C5X1
Here, PA, MP, PP, CH and PS are the concentration (lg ml�1)of PA, MP, PP, CH and PS, respectively. The absorbance val-ues at nine points (230–270 nm) as shown in Fig. 1 for sampleswere introduced into the above equations. The concentration
of the five component mixtures in Decamol Flu syrup wascalculated.
Beer’s law was obeyed in the concentration 0–30 lg ml�1
for PA, 0–20 lg ml�1 for MP, 0–20 lg ml�1 for PP, 0–45 lg ml�1 for CH and 0–100 lg ml�1 PS. Table 6 shows thelinear regression parameters for calculation data for simulta-
neous determination of PA, MP, PP, CH and PS in theirmixtures.
To check the reproducibility of the method, the R.S.D for
five replicate determinations of 10 lg ml�1 each of PA, MP,PP, CH and PS, in the mixtures was obtained as 2.21%,1.39%, 1.62%, 1.69%, and 2.07%, respectively. The meanrecoveries where obtained as 99.60%, 100.19%, 100.78%,
100.34% and 99.50% for PA, MP, PP, CH and PSrespectively.
entering of ratio spectra as a developed spectrophotometric method fori Chemical Society (2014), http://dx.doi.org/10.1016/j.jscs.2014.03.001
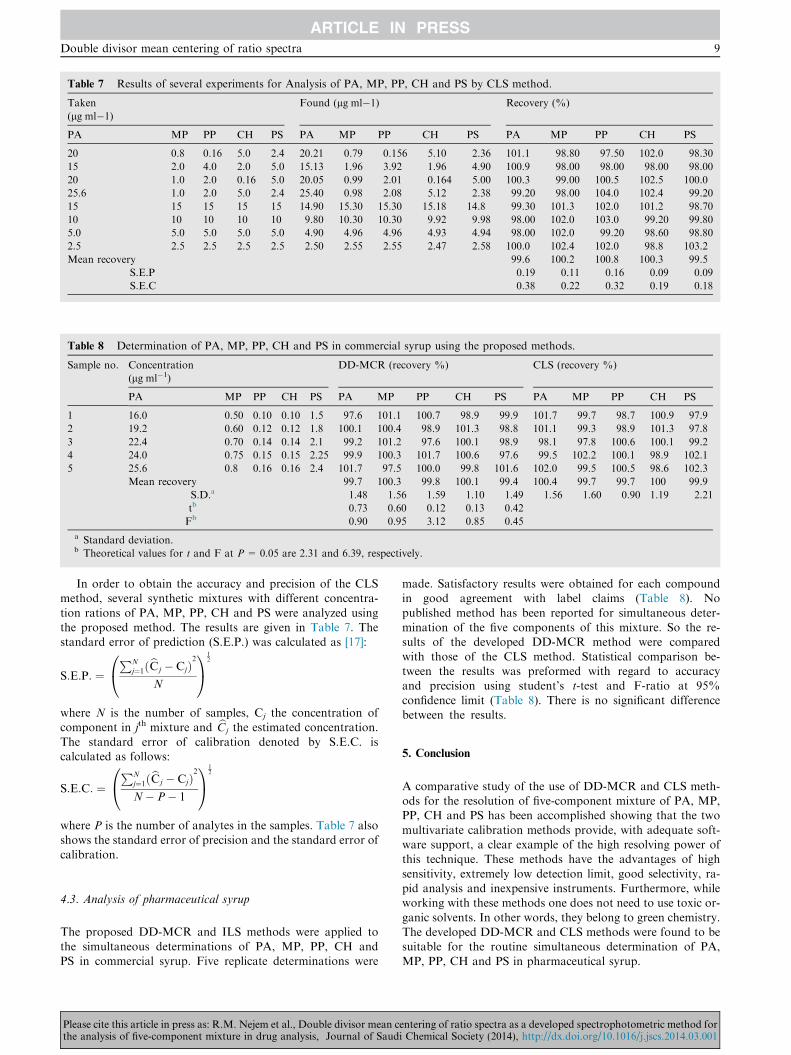
Table 8 Determination of PA, MP, PP, CH and PS in commercial syrup using the proposed methods.
Sample no. Concentration
(lg ml�1)
DD-MCR (recovery %) CLS (recovery %)
PA MP PP CH PS PA MP PP CH PS PA MP PP CH PS
1 16.0 0.50 0.10 0.10 1.5 97.6 101.1 100.7 98.9 99.9 101.7 99.7 98.7 100.9 97.9
2 19.2 0.60 0.12 0.12 1.8 100.1 100.4 98.9 101.3 98.8 101.1 99.3 98.9 101.3 97.8
3 22.4 0.70 0.14 0.14 2.1 99.2 101.2 97.6 100.1 98.9 98.1 97.8 100.6 100.1 99.2
4 24.0 0.75 0.15 0.15 2.25 99.9 100.3 101.7 100.6 97.6 99.5 102.2 100.1 98.9 102.1
5 25.6 0.8 0.16 0.16 2.4 101.7 97.5 100.0 99.8 101.6 102.0 99.5 100.5 98.6 102.3
Mean recovery 99.7 100.3 99.8 100.1 99.4 100.4 99.7 99.7 100 99.9
S.D.a 1.48 1.56 1.59 1.10 1.49 1.56 1.60 0.90 1.19 2.21
tb 0.73 0.60 0.12 0.13 0.42
Fb 0.90 0.95 3.12 0.85 0.45
a Standard deviation.b Theoretical values for t and F at P= 0.05 are 2.31 and 6.39, respectively.
Table 7 Results of several experiments for Analysis of PA, MP, PP, CH and PS by CLS method.
Taken
(lg ml�1)Found (lg ml�1) Recovery (%)
PA MP PP CH PS PA MP PP CH PS PA MP PP CH PS
20 0.8 0.16 5.0 2.4 20.21 0.79 0.156 5.10 2.36 101.1 98.80 97.50 102.0 98.30
15 2.0 4.0 2.0 5.0 15.13 1.96 3.92 1.96 4.90 100.9 98.00 98.00 98.00 98.00
20 1.0 2.0 0.16 5.0 20.05 0.99 2.01 0.164 5.00 100.3 99.00 100.5 102.5 100.0
25.6 1.0 2.0 5.0 2.4 25.40 0.98 2.08 5.12 2.38 99.20 98.00 104.0 102.4 99.20
15 15 15 15 15 14.90 15.30 15.30 15.18 14.8 99.30 101.3 102.0 101.2 98.70
10 10 10 10 10 9.80 10.30 10.30 9.92 9.98 98.00 102.0 103.0 99.20 99.80
5.0 5.0 5.0 5.0 5.0 4.90 4.96 4.96 4.93 4.94 98.00 102.0 99.20 98.60 98.80
2.5 2.5 2.5 2.5 2.5 2.50 2.55 2.55 2.47 2.58 100.0 102.4 102.0 98.8 103.2
Mean recovery 99.6 100.2 100.8 100.3 99.5
S.E.P 0.19 0.11 0.16 0.09 0.09
S.E.C 0.38 0.22 0.32 0.19 0.18
Double divisor mean centering of ratio spectra 9
In order to obtain the accuracy and precision of the CLSmethod, several synthetic mixtures with different concentra-
tion rations of PA, MP, PP, CH and PS were analyzed usingthe proposed method. The results are given in Table 7. Thestandard error of prediction (S.E.P.) was calculated as [17]:
S:E:P: ¼PN
j¼1ðbC j � CjÞ2
N
0@
1A
12
where N is the number of samples, Cj the concentration ofcomponent in jth mixture and bCj the estimated concentration.
The standard error of calibration denoted by S.E.C. iscalculated as follows:
S:E:C: ¼PN
j¼1ðbC j � CjÞ2
N� P� 1
0@
1A
12
where P is the number of analytes in the samples. Table 7 alsoshows the standard error of precision and the standard error of
calibration.
4.3. Analysis of pharmaceutical syrup
The proposed DD-MCR and ILS methods were applied to
the simultaneous determinations of PA, MP, PP, CH andPS in commercial syrup. Five replicate determinations were
Please cite this article in press as: R.M. Nejem et al., Double divisor mean cthe analysis of five-component mixture in drug analysis, Journal of Saud
made. Satisfactory results were obtained for each compoundin good agreement with label claims (Table 8). No
published method has been reported for simultaneous deter-mination of the five components of this mixture. So the re-sults of the developed DD-MCR method were compared
with those of the CLS method. Statistical comparison be-tween the results was preformed with regard to accuracyand precision using student’s t-test and F-ratio at 95%
confidence limit (Table 8). There is no significant differencebetween the results.
5. Conclusion
A comparative study of the use of DD-MCR and CLS meth-ods for the resolution of five-component mixture of PA, MP,PP, CH and PS has been accomplished showing that the two
multivariate calibration methods provide, with adequate soft-ware support, a clear example of the high resolving power ofthis technique. These methods have the advantages of high
sensitivity, extremely low detection limit, good selectivity, ra-pid analysis and inexpensive instruments. Furthermore, whileworking with these methods one does not need to use toxic or-
ganic solvents. In other words, they belong to green chemistry.The developed DD-MCR and CLS methods were found to besuitable for the routine simultaneous determination of PA,
MP, PP, CH and PS in pharmaceutical syrup.
entering of ratio spectra as a developed spectrophotometric method fori Chemical Society (2014), http://dx.doi.org/10.1016/j.jscs.2014.03.001
10 R.M. Nejem et al.
References
[1] R. Clark, R.P.H. Thompson, U. Borirakenanyavat, S. Widdop,
A.R. Davidson, R. Goulding, R. Williams, Lancet 1 (1973).
[2] S.S. Hwang, J. Gorsline, J. Louie, D. Dye, D. Guinta, L. Hamel,
J. Clin. Pharmacol. 353 (1995) 259.
[3] S.U. Yasuda, A. Wellstein, P. Likhari, J.T. Barbey, R.L.
Woosley, Clin. Pharmacol. Ther. 58 (1995) 210.
[4] British Pharmacopoeia, Here Majesty’s Stationary Office,
London, 2009.
[5] E. Dinc, F. Onur, Anal. Lett. 30 (1997) 1179.
[6] N. Erk, J. Pharm. Biomed. Anal. 23 (2000) 1023.
[7] N.B. Pappano, Y.C. De-Micalizzi, N.B. De-Batista, F.H.
Ferretti, Talanta 44 (1997) 633.
[8] M.I. Toral, A. Tassara, C. Soto, P. Richter, J. AOAC Int. 86
(2003) 241.
[9] K.M. Kelani, J. AOAC Int. 81 (1998) 1128.
[10] M.I. Toral, P. Richter, E. Araya, S. Fuentes, Anal. Lett. 29
(1996) 2679.
[11] V. Rodenas, M.S. Garcia, C. Sanchez-Pedreno, M.I. Albero,
Talanta 52 (2000) 517.
[12] M.I. Toral, P. Richter, O. Martinez, Bol. De La Soc. CHil.
Quim. 41 (1996) 283.
[13] N. Erk, F. Onur, Anal. Lett. 30 (1997) 1201.
[14] F. Onur, C. Yucesoy, S. Dermis, M. Kartal, G. Kokdil, Talanta
51 (2000) 269.
[15] T.A. Biemer, J. Chromatogr. 410 (1987) 206.
[16] A.I. Gasco-Lopez, R. Izquierdo, A. Jimenez, J. Chromatogr. A.
775 (1997) 179.
Please cite this article in press as: R.M. Nejem et al., Double divisor mean cthe analysis of five-component mixture in drug analysis, Journal of Saud
[17] L.S. Jensen, J. Valentine, R.W. Milne, A.M. Evans, J. Pharm.
Biomed. Anal. 34 (2004) 585.
[18] R.V. Nirogi, V.N. Kandikere, M. Shukla, K. Mudigonda, S.
Maurya, P. Komarneni, Biomed. Chromatogr. 21 (2007) 241.
[19] O.A. Ismaiel, M.S. Halquist, M.Y. Elmamly, A. Shalaby, H.T.
Karnes, J. Chromatogr. B: Analyt. Technol. Biomed. Life. Sci.
875 (2008) 333.
[20] H. Thomas Eichhold, J. Laura Green-Deld, H. StevenHoke, R.
Kenneth Wehmeyer, J. Mass. Spectrum. 32 (1997) 1205.
[21] H. Lou, H. Yuan, Z. Ruan, B. Jiang, J. Chromatogr. B. 878
(2010) 682.
[22] United state Pharmacopoeia 32 National Formulary 27 (2009).
[23] F. Salinas, J.J. Berzas Nevado, S. Maspoch, J. Riba, Talanta 39
(1990) 347.
[24] J.J. Berzas Nevado, C.C. Guiberteau, F. Salinas, Talanta 39
(1992) 547.
[25] E. Dinc, F. Onur, Anal. Chim. Acta 356 (1998) 93.
[26] E. Dinc, I.M. Palabiyik, O. Ustundag, F. Yurtsever, F. Onur, J.
Pharm. Biomed. Anal. 28 (2002) 591.
[27] E. Dinc, E. Baydan, M. Kanbur, F. Onur, Talanta 58 (2002)
579.
[28] A. Afkhami, M. Bahram, Talanta 66 (2005) 712.
[29] A. Afkhami, M. Bahram, Talanta 68 (2006) 1148.
[30] A. Afkhami, M. Bahram, Anal. Chim. Acta 526 (2004) 211.
[31] N.W. Ali, M.A. Hegazy, M. Abdelkawy, E.A. Abdelaleem, Acta
Pharm. 62 (2012) 191.
[32] H. Abdollahi, Anal. Chim. Acta 442 (2001) 327.
entering of ratio spectra as a developed spectrophotometric method fori Chemical Society (2014), http://dx.doi.org/10.1016/j.jscs.2014.03.001