Tackling magnetoencephalography with particle swarm optimization
Upload
khangminh22Category
view
0download
0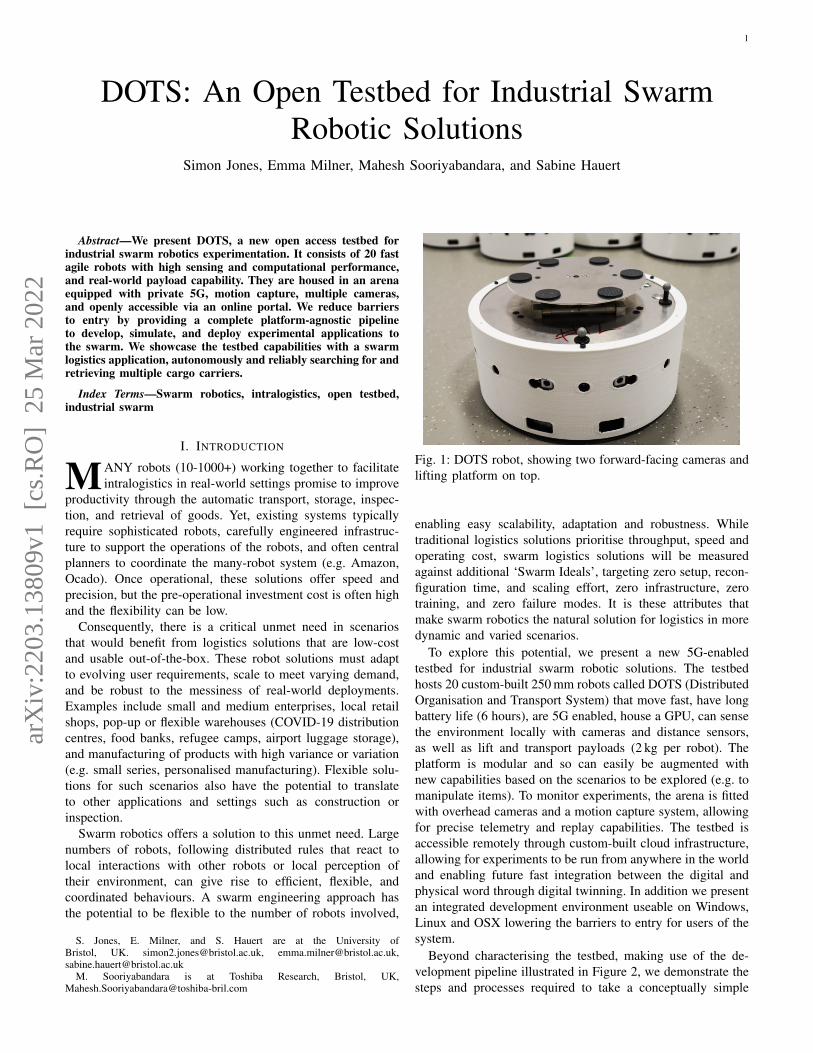
1
DOTS: An Open Testbed for Industrial SwarmRobotic Solutions
Simon Jones, Emma Milner, Mahesh Sooriyabandara, and Sabine Hauert
Abstract—We present DOTS, a new open access testbed forindustrial swarm robotics experimentation. It consists of 20 fastagile robots with high sensing and computational performance,and real-world payload capability. They are housed in an arenaequipped with private 5G, motion capture, multiple cameras,and openly accessible via an online portal. We reduce barriersto entry by providing a complete platform-agnostic pipelineto develop, simulate, and deploy experimental applications tothe swarm. We showcase the testbed capabilities with a swarmlogistics application, autonomously and reliably searching for andretrieving multiple cargo carriers.
Index Terms—Swarm robotics, intralogistics, open testbed,industrial swarm
I. INTRODUCTION
MANY robots (10-1000+) working together to facilitateintralogistics in real-world settings promise to improve
productivity through the automatic transport, storage, inspec-tion, and retrieval of goods. Yet, existing systems typicallyrequire sophisticated robots, carefully engineered infrastruc-ture to support the operations of the robots, and often centralplanners to coordinate the many-robot system (e.g. Amazon,Ocado). Once operational, these solutions offer speed andprecision, but the pre-operational investment cost is often highand the flexibility can be low.
Consequently, there is a critical unmet need in scenariosthat would benefit from logistics solutions that are low-costand usable out-of-the-box. These robot solutions must adaptto evolving user requirements, scale to meet varying demand,and be robust to the messiness of real-world deployments.Examples include small and medium enterprises, local retailshops, pop-up or flexible warehouses (COVID-19 distributioncentres, food banks, refugee camps, airport luggage storage),and manufacturing of products with high variance or variation(e.g. small series, personalised manufacturing). Flexible solu-tions for such scenarios also have the potential to translateto other applications and settings such as construction orinspection.
Swarm robotics offers a solution to this unmet need. Largenumbers of robots, following distributed rules that react tolocal interactions with other robots or local perception oftheir environment, can give rise to efficient, flexible, andcoordinated behaviours. A swarm engineering approach hasthe potential to be flexible to the number of robots involved,
S. Jones, E. Milner, and S. Hauert are at the University ofBristol, UK. [email protected], [email protected],[email protected]
M. Sooriyabandara is at Toshiba Research, Bristol, UK,[email protected]
Fig. 1: DOTS robot, showing two forward-facing cameras andlifting platform on top.
enabling easy scalability, adaptation and robustness. Whiletraditional logistics solutions prioritise throughput, speed andoperating cost, swarm logistics solutions will be measuredagainst additional ‘Swarm Ideals’, targeting zero setup, recon-figuration time, and scaling effort, zero infrastructure, zerotraining, and zero failure modes. It is these attributes thatmake swarm robotics the natural solution for logistics in moredynamic and varied scenarios.
To explore this potential, we present a new 5G-enabledtestbed for industrial swarm robotic solutions. The testbedhosts 20 custom-built 250 mm robots called DOTS (DistributedOrganisation and Transport System) that move fast, have longbattery life (6 hours), are 5G enabled, house a GPU, can sensethe environment locally with cameras and distance sensors,as well as lift and transport payloads (2 kg per robot). Theplatform is modular and so can easily be augmented withnew capabilities based on the scenarios to be explored (e.g. tomanipulate items). To monitor experiments, the arena is fittedwith overhead cameras and a motion capture system, allowingfor precise telemetry and replay capabilities. The testbed isaccessible remotely through custom-built cloud infrastructure,allowing for experiments to be run from anywhere in the worldand enabling future fast integration between the digital andphysical word through digital twinning. In addition we presentan integrated development environment useable on Windows,Linux and OSX lowering the barriers to entry for users of thesystem.
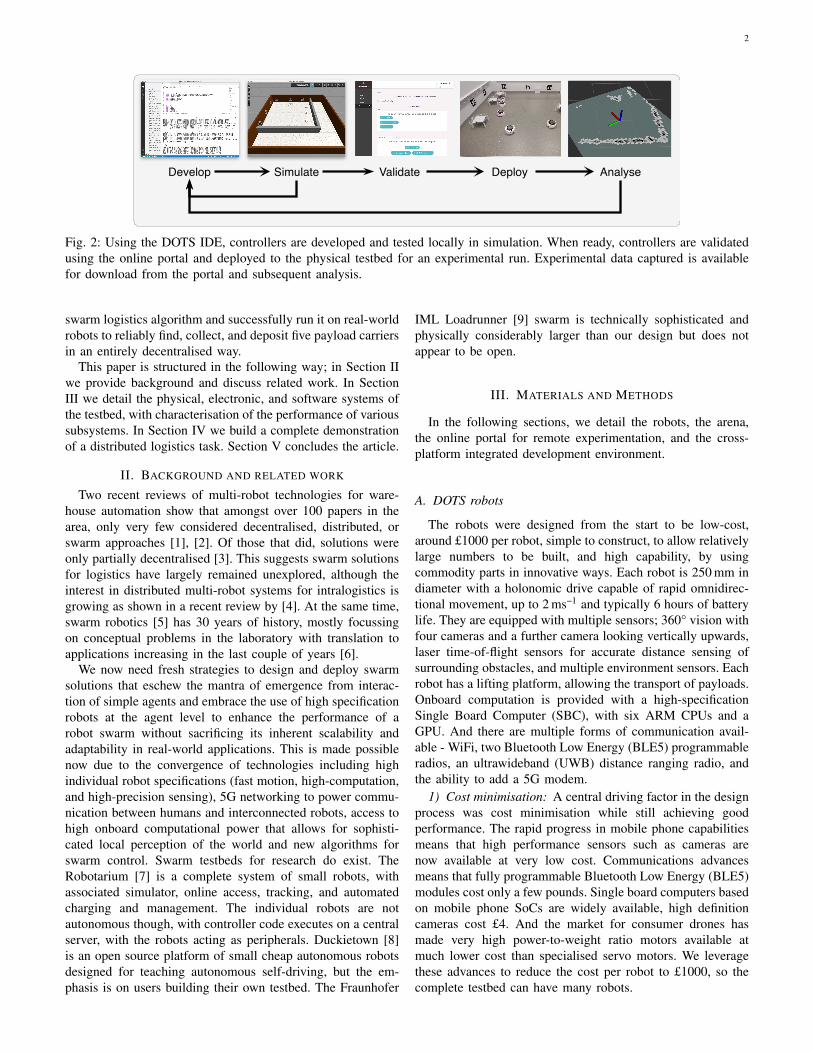
Beyond characterising the testbed, making use of the de-velopment pipeline illustrated in Figure 2, we demonstrate thesteps and processes required to take a conceptually simple
arX
iv:2
203.
1380
9v1
[cs
.RO
] 2
5 M
ar 2
022
2
Develop Simulate Validate Deploy Analyse
Fig. 2: Using the DOTS IDE, controllers are developed and tested locally in simulation. When ready, controllers are validatedusing the online portal and deployed to the physical testbed for an experimental run. Experimental data captured is availablefor download from the portal and subsequent analysis.
swarm logistics algorithm and successfully run it on real-worldrobots to reliably find, collect, and deposit five payload carriersin an entirely decentralised way.
This paper is structured in the following way; in Section IIwe provide background and discuss related work. In SectionIII we detail the physical, electronic, and software systems ofthe testbed, with characterisation of the performance of varioussubsystems. In Section IV we build a complete demonstrationof a distributed logistics task. Section V concludes the article.
II. BACKGROUND AND RELATED WORK
Two recent reviews of multi-robot technologies for ware-house automation show that amongst over 100 papers in thearea, only very few considered decentralised, distributed, orswarm approaches [1], [2]. Of those that did, solutions wereonly partially decentralised [3]. This suggests swarm solutionsfor logistics have largely remained unexplored, although theinterest in distributed multi-robot systems for intralogistics isgrowing as shown in a recent review by [4]. At the same time,swarm robotics [5] has 30 years of history, mostly focussingon conceptual problems in the laboratory with translation toapplications increasing in the last couple of years [6].
We now need fresh strategies to design and deploy swarmsolutions that eschew the mantra of emergence from interac-tion of simple agents and embrace the use of high specificationrobots at the agent level to enhance the performance of arobot swarm without sacrificing its inherent scalability andadaptability in real-world applications. This is made possiblenow due to the convergence of technologies including highindividual robot specifications (fast motion, high-computation,and high-precision sensing), 5G networking to power commu-nication between humans and interconnected robots, access tohigh onboard computational power that allows for sophisti-cated local perception of the world and new algorithms forswarm control. Swarm testbeds for research do exist. TheRobotarium [7] is a complete system of small robots, withassociated simulator, online access, tracking, and automatedcharging and management. The individual robots are notautonomous though, with controller code executes on a centralserver, with the robots acting as peripherals. Duckietown [8]is an open source platform of small cheap autonomous robotsdesigned for teaching autonomous self-driving, but the em-phasis is on users building their own testbed. The Fraunhofer
IML Loadrunner [9] swarm is technically sophisticated andphysically considerably larger than our design but does notappear to be open.
III. MATERIALS AND METHODS
In the following sections, we detail the robots, the arena,the online portal for remote experimentation, and the cross-platform integrated development environment.
A. DOTS robots
The robots were designed from the start to be low-cost,around £1000 per robot, simple to construct, to allow relativelylarge numbers to be built, and high capability, by usingcommodity parts in innovative ways. Each robot is 250 mm indiameter with a holonomic drive capable of rapid omnidirec-tional movement, up to 2 ms−1 and typically 6 hours of batterylife. They are equipped with multiple sensors; 360° vision withfour cameras and a further camera looking vertically upwards,laser time-of-flight sensors for accurate distance sensing ofsurrounding obstacles, and multiple environment sensors. Eachrobot has a lifting platform, allowing the transport of payloads.Onboard computation is provided with a high-specificationSingle Board Computer (SBC), with six ARM CPUs and aGPU. And there are multiple forms of communication avail-able - WiFi, two Bluetooth Low Energy (BLE5) programmableradios, an ultrawideband (UWB) distance ranging radio, andthe ability to add a 5G modem.
1) Cost minimisation: A central driving factor in the designprocess was cost minimisation while still achieving goodperformance. The rapid progress in mobile phone capabilitiesmeans that high performance sensors such as cameras arenow available at very low cost. Communications advancesmeans that fully programmable Bluetooth Low Energy (BLE5)modules cost only a few pounds. Single board computers basedon mobile phone SoCs are widely available, high definitioncameras cost £4. And the market for consumer drones hasmade very high power-to-weight ratio motors available atmuch lower cost than specialised servo motors. We leveragethese advances to reduce the cost per robot to £1000, so thecomplete testbed can have many robots.
3
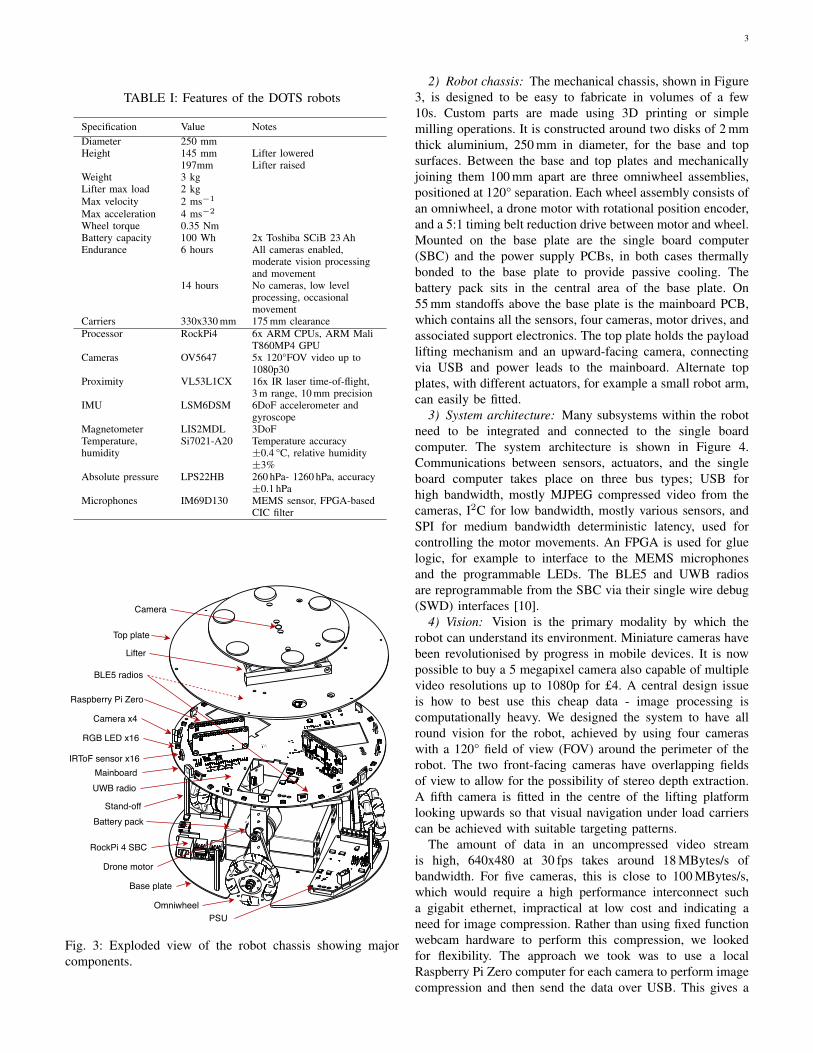
TABLE I: Features of the DOTS robots
Specification Value NotesDiameter 250 mmHeight 145 mm Lifter lowered
197mm Lifter raisedWeight 3 kgLifter max load 2 kgMax velocity 2 ms−1
Max acceleration 4 ms−2
Wheel torque 0.35 NmBattery capacity 100 Wh 2x Toshiba SCiB 23 AhEndurance 6 hours All cameras enabled,
moderate vision processingand movement
14 hours No cameras, low levelprocessing, occasionalmovement
Carriers 330x330 mm 175 mm clearanceProcessor RockPi4 6x ARM CPUs, ARM Mali
T860MP4 GPUCameras OV5647 5x 120°FOV video up to
1080p30Proximity VL53L1CX 16x IR laser time-of-flight,
3 m range, 10 mm precisionIMU LSM6DSM 6DoF accelerometer and
gyroscopeMagnetometer LIS2MDL 3DoFTemperature,humidity
Si7021-A20 Temperature accuracy±0.4 °C, relative humidity±3%
Absolute pressure LPS22HB 260 hPa- 1260 hPa, accuracy±0.1 hPa
Microphones IM69D130 MEMS sensor, FPGA-basedCIC filter
Lifter
Camera
Top plate
Raspberry Pi Zero
Camera x4
IRToF sensor x16Mainboard
Battery pack
RockPi 4 SBC
Drone motor
OmniwheelPSU
Base plate
Stand-off
RGB LED x16
BLE5 radios
UWB radio
Fig. 3: Exploded view of the robot chassis showing majorcomponents.
2) Robot chassis: The mechanical chassis, shown in Figure3, is designed to be easy to fabricate in volumes of a few10s. Custom parts are made using 3D printing or simplemilling operations. It is constructed around two disks of 2 mmthick aluminium, 250 mm in diameter, for the base and topsurfaces. Between the base and top plates and mechanicallyjoining them 100 mm apart are three omniwheel assemblies,positioned at 120° separation. Each wheel assembly consists ofan omniwheel, a drone motor with rotational position encoder,and a 5:1 timing belt reduction drive between motor and wheel.Mounted on the base plate are the single board computer(SBC) and the power supply PCBs, in both cases thermallybonded to the base plate to provide passive cooling. Thebattery pack sits in the central area of the base plate. On55 mm standoffs above the base plate is the mainboard PCB,which contains all the sensors, four cameras, motor drives, andassociated support electronics. The top plate holds the payloadlifting mechanism and an upward-facing camera, connectingvia USB and power leads to the mainboard. Alternate topplates, with different actuators, for example a small robot arm,can easily be fitted.
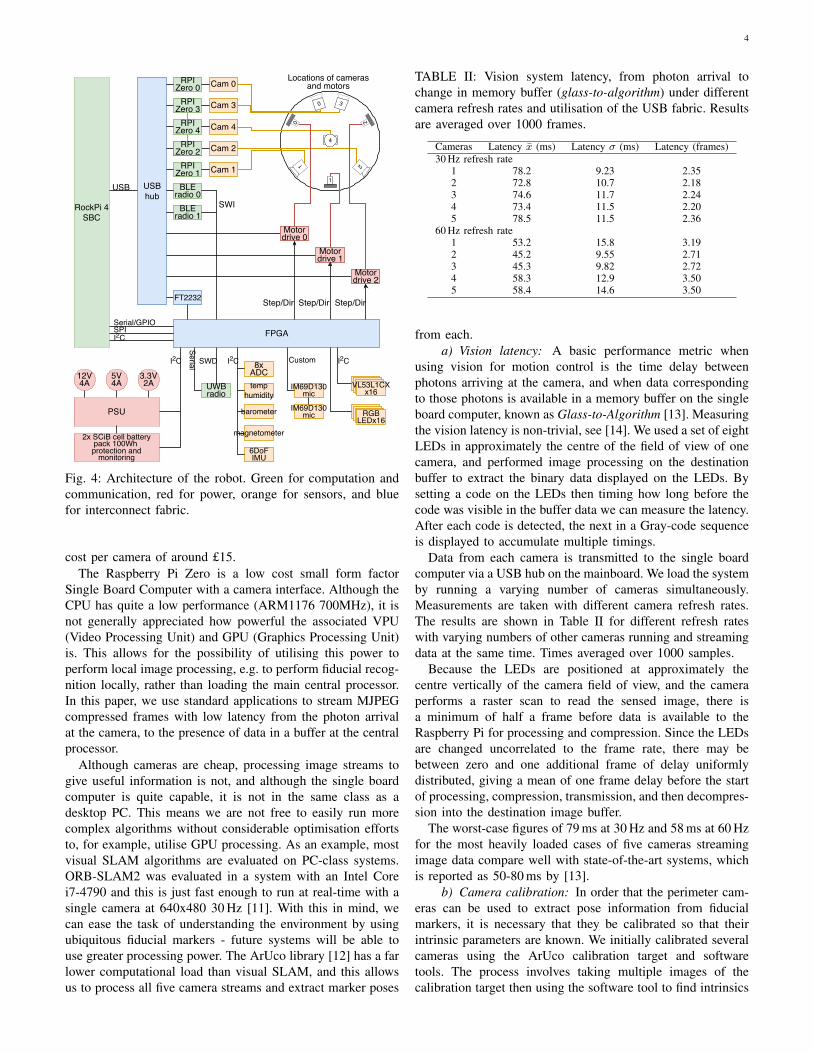
3) System architecture: Many subsystems within the robotneed to be integrated and connected to the single boardcomputer. The system architecture is shown in Figure 4.Communications between sensors, actuators, and the singleboard computer takes place on three bus types; USB forhigh bandwidth, mostly MJPEG compressed video from thecameras, I2C for low bandwidth, mostly various sensors, andSPI for medium bandwidth deterministic latency, used forcontrolling the motor movements. An FPGA is used for gluelogic, for example to interface to the MEMS microphonesand the programmable LEDs. The BLE5 and UWB radiosare reprogrammable from the SBC via their single wire debug(SWD) interfaces [10].
4) Vision: Vision is the primary modality by which therobot can understand its environment. Miniature cameras havebeen revolutionised by progress in mobile devices. It is nowpossible to buy a 5 megapixel camera also capable of multiplevideo resolutions up to 1080p for £4. A central design issueis how to best use this cheap data - image processing iscomputationally heavy. We designed the system to have allround vision for the robot, achieved by using four cameraswith a 120° field of view (FOV) around the perimeter of therobot. The two front-facing cameras have overlapping fieldsof view to allow for the possibility of stereo depth extraction.A fifth camera is fitted in the centre of the lifting platformlooking upwards so that visual navigation under load carrierscan be achieved with suitable targeting patterns.
The amount of data in an uncompressed video streamis high, 640x480 at 30 fps takes around 18 MBytes/s ofbandwidth. For five cameras, this is close to 100 MBytes/s,which would require a high performance interconnect sucha gigabit ethernet, impractical at low cost and indicating aneed for image compression. Rather than using fixed functionwebcam hardware to perform this compression, we lookedfor flexibility. The approach we took was to use a localRaspberry Pi Zero computer for each camera to perform imagecompression and then send the data over USB. This gives a
4
Cam 1
Cam 3
Cam 4
Cam 0
Cam 2
RPIZero 0
RPIZero 3
RPIZero 4
RPI Zero 3
RPIZero 1BLE
radio 0BLE
radio 1
USBhub
Motordrive 0
Motordrive 1
Motordrive 2
FT2232
FPGA
VL53L1CX x16
RGBLEDx16
RPIZero 2
IM69D130mic
IM69D130mic
8xADCtemp
humidity
barometer
magnetometer
6DoFIMU
2x SCiB cell batterypack 100Wh protection and
monitoring
PSU
12V4A
5V4A
3.3V2A
I2C I2CI2C Custom
Step/Dir
RockPi 4SBC
UWBradio
Serial SWD
SWI
I2CSPISerial/GPIO
USB
0
1 2
3
0 2
1
4
Locations of camerasand motors
Step/Dir Step/Dir
Fig. 4: Architecture of the robot. Green for computation andcommunication, red for power, orange for sensors, and bluefor interconnect fabric.
cost per camera of around £15.The Raspberry Pi Zero is a low cost small form factor
Single Board Computer with a camera interface. Although theCPU has quite a low performance (ARM1176 700MHz), it isnot generally appreciated how powerful the associated VPU(Video Processing Unit) and GPU (Graphics Processing Unit)is. This allows for the possibility of utilising this power toperform local image processing, e.g. to perform fiducial recog-nition locally, rather than loading the main central processor.In this paper, we use standard applications to stream MJPEGcompressed frames with low latency from the photon arrivalat the camera, to the presence of data in a buffer at the centralprocessor.
Although cameras are cheap, processing image streams togive useful information is not, and although the single boardcomputer is quite capable, it is not in the same class as adesktop PC. This means we are not free to easily run morecomplex algorithms without considerable optimisation effortsto, for example, utilise GPU processing. As an example, mostvisual SLAM algorithms are evaluated on PC-class systems.ORB-SLAM2 was evaluated in a system with an Intel Corei7-4790 and this is just fast enough to run at real-time with asingle camera at 640x480 30 Hz [11]. With this in mind, wecan ease the task of understanding the environment by usingubiquitous fiducial markers - future systems will be able touse greater processing power. The ArUco library [12] has a farlower computational load than visual SLAM, and this allowsus to process all five camera streams and extract marker poses
TABLE II: Vision system latency, from photon arrival tochange in memory buffer (glass-to-algorithm) under differentcamera refresh rates and utilisation of the USB fabric. Resultsare averaged over 1000 frames.
Cameras Latency x (ms) Latency σ (ms) Latency (frames)30 Hz refresh rate
1 78.2 9.23 2.352 72.8 10.7 2.183 74.6 11.7 2.244 73.4 11.5 2.205 78.5 11.5 2.36
60 Hz refresh rate1 53.2 15.8 3.192 45.2 9.55 2.713 45.3 9.82 2.724 58.3 12.9 3.505 58.4 14.6 3.50
from each.a) Vision latency: A basic performance metric when
using vision for motion control is the time delay betweenphotons arriving at the camera, and when data correspondingto those photons is available in a memory buffer on the singleboard computer, known as Glass-to-Algorithm [13]. Measuringthe vision latency is non-trivial, see [14]. We used a set of eightLEDs in approximately the centre of the field of view of onecamera, and performed image processing on the destinationbuffer to extract the binary data displayed on the LEDs. Bysetting a code on the LEDs then timing how long before thecode was visible in the buffer data we can measure the latency.After each code is detected, the next in a Gray-code sequenceis displayed to accumulate multiple timings.
Data from each camera is transmitted to the single boardcomputer via a USB hub on the mainboard. We load the systemby running a varying number of cameras simultaneously.Measurements are taken with different camera refresh rates.The results are shown in Table II for different refresh rateswith varying numbers of other cameras running and streamingdata at the same time. Times averaged over 1000 samples.
Because the LEDs are positioned at approximately thecentre vertically of the camera field of view, and the cameraperforms a raster scan to read the sensed image, there isa minimum of half a frame before data is available to theRaspberry Pi for processing and compression. Since the LEDsare changed uncorrelated to the frame rate, there may bebetween zero and one additional frame of delay uniformlydistributed, giving a mean of one frame delay before the startof processing, compression, transmission, and then decompres-sion into the destination image buffer.
The worst-case figures of 79 ms at 30 Hz and 58 ms at 60 Hzfor the most heavily loaded cases of five cameras streamingimage data compare well with state-of-the-art systems, whichis reported as 50-80 ms by [13].
b) Camera calibration: In order that the perimeter cam-eras can be used to extract pose information from fiducialmarkers, it is necessary that they be calibrated so that theirintrinsic parameters are known. We initially calibrated severalcameras using the ArUco calibration target and softwaretools. The process involves taking multiple images of thecalibration target then using the software tool to find intrinsics
5
RPI ZeroMJPEG
Arucodetect
RPI ZeroMJPEG
RPI ZeroMJPEG
RPI ZeroMJPEG
USB
Decomp
Arucodetect
USB
Decomp
Arucodetect
USB
Decomp
Arucodetect
USB
Decomp
IMU Odometry
I2C
Extended Kalman Filter (robot_localization)
Pose
Comms fabricROS node
Sensor
Fig. 5: Visual tracking system. Each camera video stream issend as compressed MJPEG to the single board computer, thendecompressed and processed for fiducial marker poses. Theposes, together with IMU and wheel odometry informationare fed to an EKF to output robot pose.
that minimise the reprojection error. This showed that eachcamera had significant differences in their intrinsic parameters,perhaps not surprising given their very low cost, but meaningwe had to calibrate each camera individually, rather than usinga standard calibration. We needed an automated approach - 20robots, each with four cameras to calibrate would require manyhundreds of images captured from different angles.
By attaching a calibration target to the arena wall at a fixedand known location, we could execute a calibration processautomatically taking multiple pictures per camera in about 5minutes per robot. Because the only angle that can be variedbetween the camera and the target is the rotation about robot Z,the calibration is less complete, but sufficient given the robotwill always be horizontal on the arena floor.
c) Vision processing for localisation: To demonstrate theability to usefully process vision from multiple cameras webuilt a simple localisation system, shown in Figure 5, andbased on ArUco markermaps. This is a feature of the ArUcolibrary that allows the specification of a map of the locationsof an arbitrary number of arbitrarily placed fiducial markers,with library functions to return the 3D pose of a calibratedcamera which can see at least one of the markers in the map.We fixed twelve fiducial markers around the walls of the arena,and encoded the locations in a markermap.
Each camera was calibrated automatically, as describedabove. The video stream from each of the four perimetercameras is analysed and if there are any visible fiducials inthe correct ID range, the pose of the robot in the global mapframe is generated. This stream of poses is fed to an ExtendedKalman Filter filter (EKF, robot localization [15]), along with
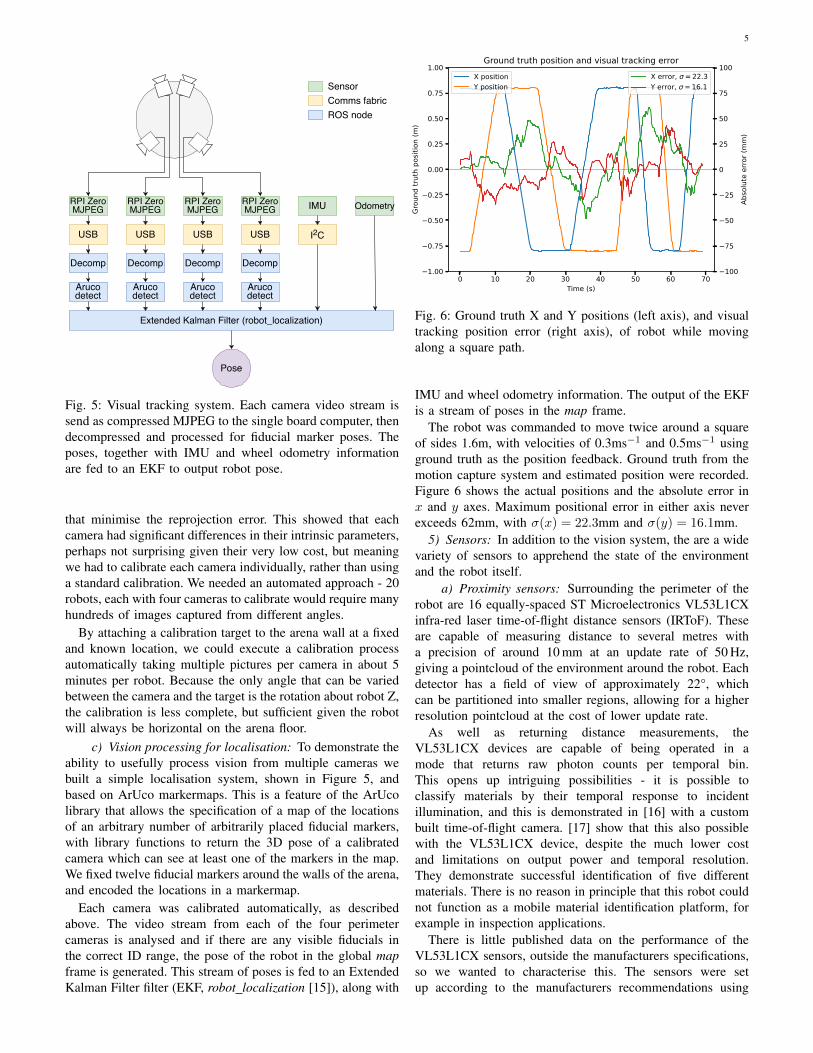
Fig. 6: Ground truth X and Y positions (left axis), and visualtracking position error (right axis), of robot while movingalong a square path.
IMU and wheel odometry information. The output of the EKFis a stream of poses in the map frame.
The robot was commanded to move twice around a squareof sides 1.6m, with velocities of 0.3ms−1 and 0.5ms−1 usingground truth as the position feedback. Ground truth from themotion capture system and estimated position were recorded.Figure 6 shows the actual positions and the absolute error inx and y axes. Maximum positional error in either axis neverexceeds 62mm, with σ(x) = 22.3mm and σ(y) = 16.1mm.
5) Sensors: In addition to the vision system, the are a widevariety of sensors to apprehend the state of the environmentand the robot itself.
a) Proximity sensors: Surrounding the perimeter of therobot are 16 equally-spaced ST Microelectronics VL53L1CXinfra-red laser time-of-flight distance sensors (IRToF). Theseare capable of measuring distance to several metres witha precision of around 10 mm at an update rate of 50 Hz,giving a pointcloud of the environment around the robot. Eachdetector has a field of view of approximately 22°, whichcan be partitioned into smaller regions, allowing for a higherresolution pointcloud at the cost of lower update rate.
As well as returning distance measurements, theVL53L1CX devices are capable of being operated in amode that returns raw photon counts per temporal bin.This opens up intriguing possibilities - it is possible toclassify materials by their temporal response to incidentillumination, and this is demonstrated in [16] with a custombuilt time-of-flight camera. [17] show that this also possiblewith the VL53L1CX device, despite the much lower costand limitations on output power and temporal resolution.They demonstrate successful identification of five differentmaterials. There is no reason in principle that this robot couldnot function as a mobile material identification platform, forexample in inspection applications.
There is little published data on the performance of theVL53L1CX sensors, outside the manufacturers specifications,so we wanted to characterise this. The sensors were setup according to the manufacturers recommendations using
6
0.0 0.5 1.0 1.5 2.0 2.5 3.0Actual distance (m)
0.5
0.0
0.5
1.0
1.5
2.0
2.5
3.0
3.5
Mea
sure
d di
stan
ce (m
)
Time-of-flight measurement accuracyIRToF measurement (left scale)Ideal sensor (slope 1)Multipath (slope 2)Multipath (slope 3)
50
0
50
100
150
200
250
300
350
Mea
sure
men
t erro
r (m
m)
Error: x, (right scale)
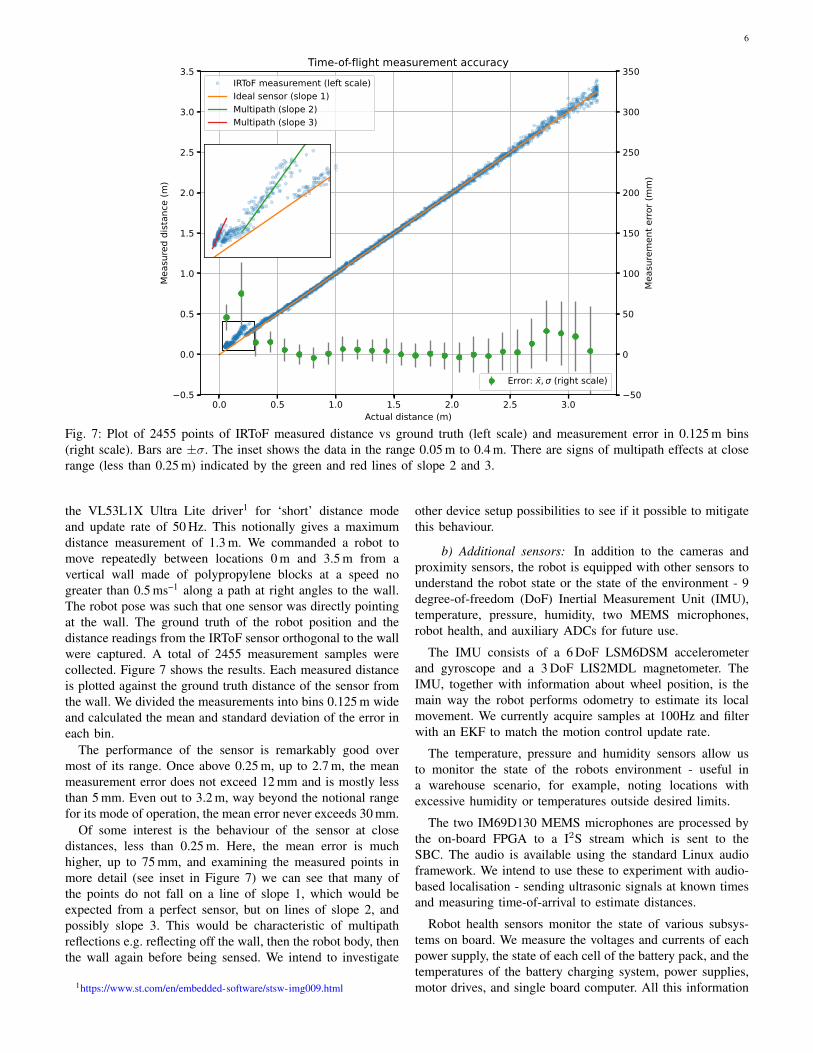
Fig. 7: Plot of 2455 points of IRToF measured distance vs ground truth (left scale) and measurement error in 0.125 m bins(right scale). Bars are ±σ. The inset shows the data in the range 0.05 m to 0.4 m. There are signs of multipath effects at closerange (less than 0.25 m) indicated by the green and red lines of slope 2 and 3.
the VL53L1X Ultra Lite driver1 for ‘short’ distance modeand update rate of 50 Hz. This notionally gives a maximumdistance measurement of 1.3 m. We commanded a robot tomove repeatedly between locations 0 m and 3.5 m from avertical wall made of polypropylene blocks at a speed nogreater than 0.5 ms−1 along a path at right angles to the wall.The robot pose was such that one sensor was directly pointingat the wall. The ground truth of the robot position and thedistance readings from the IRToF sensor orthogonal to the wallwere captured. A total of 2455 measurement samples werecollected. Figure 7 shows the results. Each measured distanceis plotted against the ground truth distance of the sensor fromthe wall. We divided the measurements into bins 0.125 m wideand calculated the mean and standard deviation of the error ineach bin.
The performance of the sensor is remarkably good overmost of its range. Once above 0.25 m, up to 2.7 m, the meanmeasurement error does not exceed 12 mm and is mostly lessthan 5 mm. Even out to 3.2 m, way beyond the notional rangefor its mode of operation, the mean error never exceeds 30 mm.
Of some interest is the behaviour of the sensor at closedistances, less than 0.25 m. Here, the mean error is muchhigher, up to 75 mm, and examining the measured points inmore detail (see inset in Figure 7) we can see that many ofthe points do not fall on a line of slope 1, which would beexpected from a perfect sensor, but on lines of slope 2, andpossibly slope 3. This would be characteristic of multipathreflections e.g. reflecting off the wall, then the robot body, thenthe wall again before being sensed. We intend to investigate
1https://www.st.com/en/embedded-software/stsw-img009.html
other device setup possibilities to see if it possible to mitigatethis behaviour.
b) Additional sensors: In addition to the cameras andproximity sensors, the robot is equipped with other sensors tounderstand the robot state or the state of the environment - 9degree-of-freedom (DoF) Inertial Measurement Unit (IMU),temperature, pressure, humidity, two MEMS microphones,robot health, and auxiliary ADCs for future use.
The IMU consists of a 6 DoF LSM6DSM accelerometerand gyroscope and a 3 DoF LIS2MDL magnetometer. TheIMU, together with information about wheel position, is themain way the robot performs odometry to estimate its localmovement. We currently acquire samples at 100Hz and filterwith an EKF to match the motion control update rate.
The temperature, pressure and humidity sensors allow usto monitor the state of the robots environment - useful ina warehouse scenario, for example, noting locations withexcessive humidity or temperatures outside desired limits.
The two IM69D130 MEMS microphones are processed bythe on-board FPGA to a I2S stream which is sent to theSBC. The audio is available using the standard Linux audioframework. We intend to use these to experiment with audio-based localisation - sending ultrasonic signals at known timesand measuring time-of-arrival to estimate distances.
Robot health sensors monitor the state of various subsys-tems on board. We measure the voltages and currents of eachpower supply, the state of each cell of the battery pack, and thetemperatures of the battery charging system, power supplies,motor drives, and single board computer. All this information
7
is available through the Linux hwmon sensor framework2.6) Communication: Local communication is important for
swarm robotics, and an area where there is much potentialfor novel approaches. To facilitate experimentation, we in-clude multiple different radios. As well as the WiFi built into the single board computer, each robot is equipped withtwo nRF52840-based BLE5 (Bluetooth Low Energy) USB-connected radio modules, and a DWM1001 UWB (Ultra wideband) module. A private 5G modem can be added. All ofthese modules can be reprogrammed with custom firmwareunder the control of the single board computer, allowing foron-the-fly installation of novel communication protocols.
We currently have firmware for the BLE radios that contin-ually advertises the robots unique name and a small amount ofdata, and scans for other BLE radios. Each scan result containsthe name of any nearby robot sensed, along with its receivedsignal strength (RSSI), which can be used as a proxy measurefor distance.
The DWM1001 radio is designed to perform two-wayranging between devices, measuring the distance between apair of radios to a claimed accuracy of around 0.1m. It isinterfaced to the SBC using an SPI bus.
7) Mobility: For the collective transport of large loads, itis necessary for multiple robots to be able to move togetherin a fixed geometric relationship with each other. The onlyway to achieve this with arbitrary trajectories is for the robotsto have holonomic motion. We use a three omniwheel systemwith the wheels equally spaced 120° apart. The kinematics forthis type of drive are well known [18] and are shown below:v1
v2
v3
=
−√
32 0.5 1
0 −1 1√3
2 −0.5 1
vxvyRω
where v1, v2, v3 are the tangential wheel velocities, vx, vy, ωthe robot body linear and angular velocities, and R the radiusfrom centre of robot to wheels.
Another important requirement for the robots is that theycan move fast and accurately. A limitation of other lab-based swarm systems is that the locomotion is often basedon stepper motors or small geared DC motors. These arerelatively cheap and accurate but are slow and heavy. Muchhigher performance is possible with Brushless DC (BLDC)servo motors. These servo motors are paired with a positionencoder and drive electronics that modulates the coil currentto achieve accurate torque, velocity and position control withmuch higher performance to weight and size ratios than istypically possible with stepper motors. This comes at a cost,a typical motor, encoder, and driver with the performance werequire costs around £350.
There has been recent interest in using commodity dronemotors in place of dedicated servo motors [19]–[22]. Thehigh power-to-weight ratios and low costs due to the largemarket size make this an interesting alternative. There aredisadvantages - the motors are not designed for use as servosand certain parameters which are more important in servomotors are not controlled, e.g. the amount of torque cogging,
2https://www.kernel.org/doc/html/latest/hwmon/hwmon-kernel-api.html
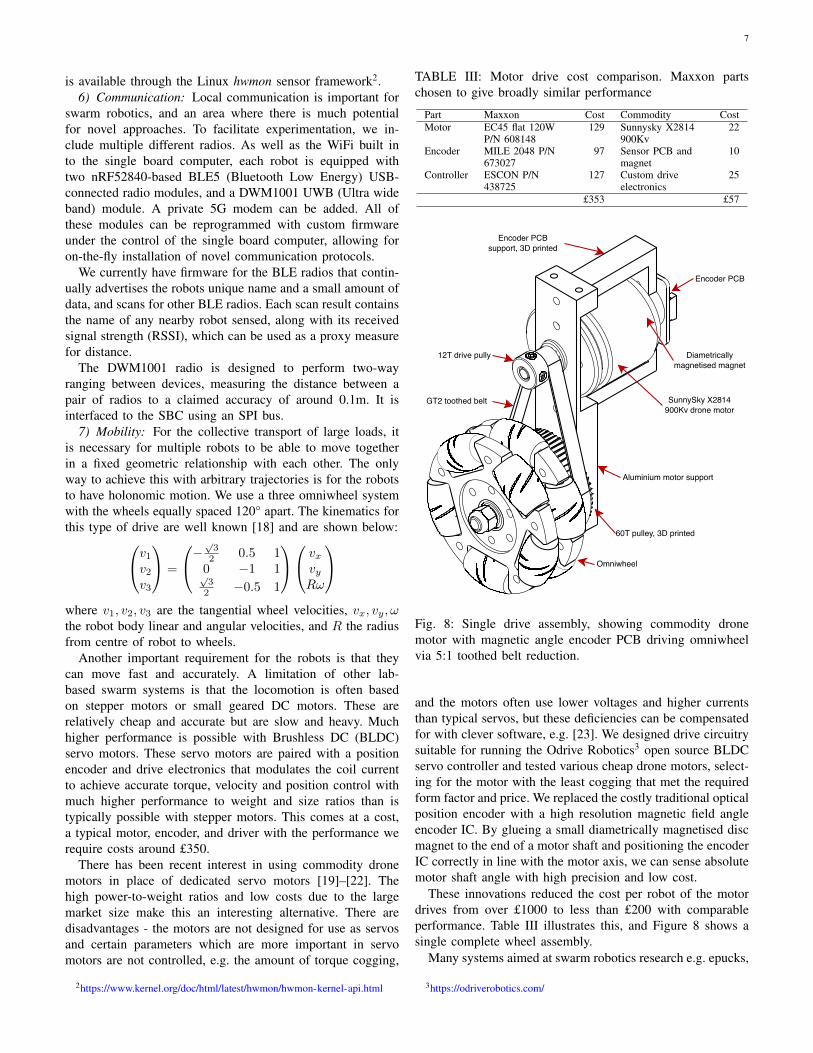
TABLE III: Motor drive cost comparison. Maxxon partschosen to give broadly similar performance
Part Maxxon Cost Commodity CostMotor EC45 flat 120W
P/N 608148129 Sunnysky X2814
900Kv22
Encoder MILE 2048 P/N673027
97 Sensor PCB andmagnet
10
Controller ESCON P/N438725
127 Custom driveelectronics
25
£353 £57
Omniwheel
60T pulley, 3D printed
GT2 toothed belt
12T drive pully
Aluminium motor support
Encoder PCBsupport, 3D printed
Encoder PCB
Diametricallymagnetised magnet
SunnySky X2814900Kv drone motor
Fig. 8: Single drive assembly, showing commodity dronemotor with magnetic angle encoder PCB driving omniwheelvia 5:1 toothed belt reduction.
and the motors often use lower voltages and higher currentsthan typical servos, but these deficiencies can be compensatedfor with clever software, e.g. [23]. We designed drive circuitrysuitable for running the Odrive Robotics3 open source BLDCservo controller and tested various cheap drone motors, select-ing for the motor with the least cogging that met the requiredform factor and price. We replaced the costly traditional opticalposition encoder with a high resolution magnetic field angleencoder IC. By glueing a small diametrically magnetised discmagnet to the end of a motor shaft and positioning the encoderIC correctly in line with the motor axis, we can sense absolutemotor shaft angle with high precision and low cost.
These innovations reduced the cost per robot of the motordrives from over £1000 to less than £200 with comparableperformance. Table III illustrates this, and Figure 8 shows asingle complete wheel assembly.
Many systems aimed at swarm robotics research e.g. epucks,
3https://odriverobotics.com/
8
baseTmotorPID x3
EKF
motorTbase
Motorvelocity
Motorencodervelocities
IMU
M0
M1
M2
ẍimuÿimuωimu
Motordrives
ẋencẏenc ωenc
Pathactionserver
Traj gen
pos
goal ẏbase ẋbase
ωbase
100Hz
wpi=(x,y,θ,ẋ,ẏ,ω)TWaypointPath
p={wp1,..,wpn}
Positiongoal Velocity
req
resfb
g=(x,y,θ)
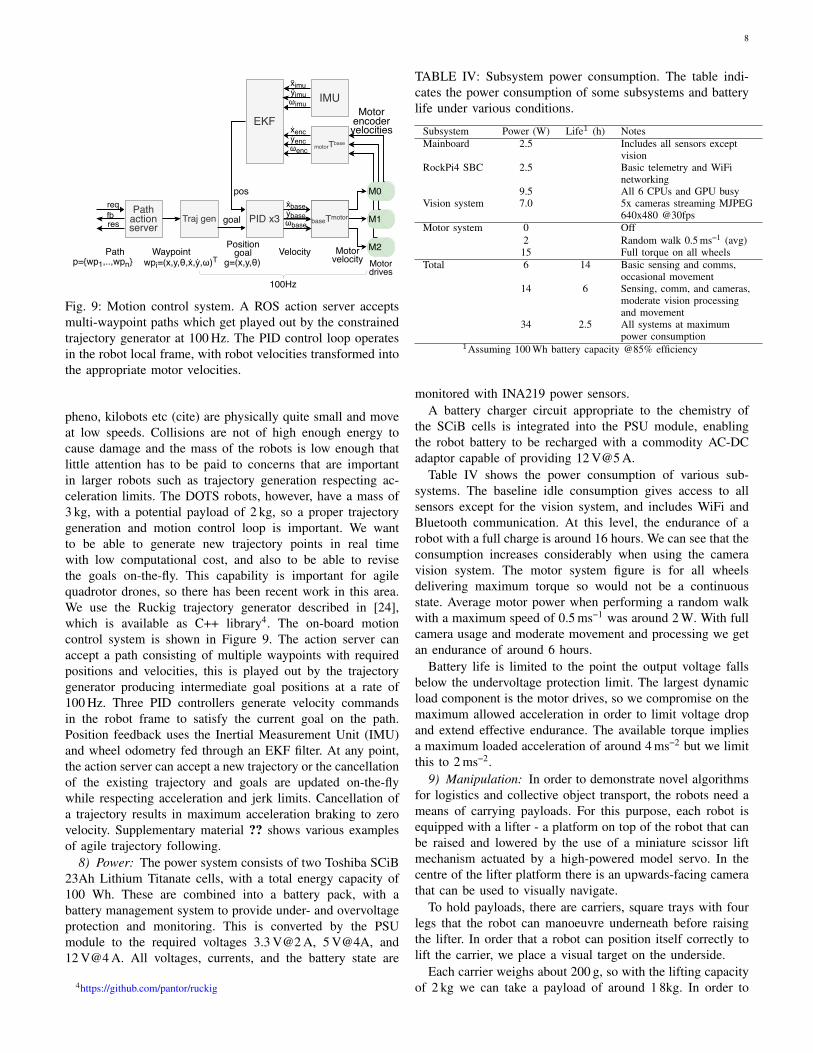
Fig. 9: Motion control system. A ROS action server acceptsmulti-waypoint paths which get played out by the constrainedtrajectory generator at 100 Hz. The PID control loop operatesin the robot local frame, with robot velocities transformed intothe appropriate motor velocities.
pheno, kilobots etc (cite) are physically quite small and moveat low speeds. Collisions are not of high enough energy tocause damage and the mass of the robots is low enough thatlittle attention has to be paid to concerns that are importantin larger robots such as trajectory generation respecting ac-celeration limits. The DOTS robots, however, have a mass of3 kg, with a potential payload of 2 kg, so a proper trajectorygeneration and motion control loop is important. We wantto be able to generate new trajectory points in real timewith low computational cost, and also to be able to revisethe goals on-the-fly. This capability is important for agilequadrotor drones, so there has been recent work in this area.We use the Ruckig trajectory generator described in [24],which is available as C++ library4. The on-board motioncontrol system is shown in Figure 9. The action server canaccept a path consisting of multiple waypoints with requiredpositions and velocities, this is played out by the trajectorygenerator producing intermediate goal positions at a rate of100 Hz. Three PID controllers generate velocity commandsin the robot frame to satisfy the current goal on the path.Position feedback uses the Inertial Measurement Unit (IMU)and wheel odometry fed through an EKF filter. At any point,the action server can accept a new trajectory or the cancellationof the existing trajectory and goals are updated on-the-flywhile respecting acceleration and jerk limits. Cancellation ofa trajectory results in maximum acceleration braking to zerovelocity. Supplementary material ?? shows various examplesof agile trajectory following.
8) Power: The power system consists of two Toshiba SCiB23Ah Lithium Titanate cells, with a total energy capacity of100 Wh. These are combined into a battery pack, with abattery management system to provide under- and overvoltageprotection and monitoring. This is converted by the PSUmodule to the required voltages 3.3 V@2 A, 5 V@4A, and12 V@4 A. All voltages, currents, and the battery state are
4https://github.com/pantor/ruckig
TABLE IV: Subsystem power consumption. The table indi-cates the power consumption of some subsystems and batterylife under various conditions.
Subsystem Power (W) Life1 (h) NotesMainboard 2.5 Includes all sensors except
visionRockPi4 SBC 2.5 Basic telemetry and WiFi
networking9.5 All 6 CPUs and GPU busy
Vision system 7.0 5x cameras streaming MJPEG640x480 @30fps
Motor system 0 Off2 Random walk 0.5 ms−1 (avg)15 Full torque on all wheels
Total 6 14 Basic sensing and comms,occasional movement
14 6 Sensing, comm, and cameras,moderate vision processingand movement
34 2.5 All systems at maximumpower consumption
1Assuming 100 Wh battery capacity @85% efficiency
monitored with INA219 power sensors.A battery charger circuit appropriate to the chemistry of
the SCiB cells is integrated into the PSU module, enablingthe robot battery to be recharged with a commodity AC-DCadaptor capable of providing 12 V@5 A.
Table IV shows the power consumption of various sub-systems. The baseline idle consumption gives access to allsensors except for the vision system, and includes WiFi andBluetooth communication. At this level, the endurance of arobot with a full charge is around 16 hours. We can see that theconsumption increases considerably when using the cameravision system. The motor system figure is for all wheelsdelivering maximum torque so would not be a continuousstate. Average motor power when performing a random walkwith a maximum speed of 0.5 ms−1 was around 2 W. With fullcamera usage and moderate movement and processing we getan endurance of around 6 hours.
Battery life is limited to the point the output voltage fallsbelow the undervoltage protection limit. The largest dynamicload component is the motor drives, so we compromise on themaximum allowed acceleration in order to limit voltage dropand extend effective endurance. The available torque impliesa maximum loaded acceleration of around 4 ms−2 but we limitthis to 2 ms−2.
9) Manipulation: In order to demonstrate novel algorithmsfor logistics and collective object transport, the robots need ameans of carrying payloads. For this purpose, each robot isequipped with a lifter - a platform on top of the robot that canbe raised and lowered by the use of a miniature scissor liftmechanism actuated by a high-powered model servo. In thecentre of the lifter platform there is an upwards-facing camerathat can be used to visually navigate.
To hold payloads, there are carriers, square trays with fourlegs that the robot can manoeuvre underneath before raisingthe lifter. In order that a robot can position itself correctly tolift the carrier, we place a visual target on the underside.
Each carrier weighs about 200 g, so with the lifting capacityof 2 kg we can take a payload of around 1 8kg. In order to
9
demonstrate collective transport, the carriers can be joinedtogether along their edges to form arbitrary shapes, to bemoved with an equal number of robots, one under each carrier.
B. Industrial Swarm Testbed
The industrial swarm testbed is the collection of DOTSrobots, the physical arena - a 5 m x 5 m main room overlookedby an adjacent control room, the communications infrastruc-ture comprising WiFi and private 5G network, motion trackingsystem, video cameras, and the system software architecture.
It also has an associated high fidelity simulation system,based on the widely used Gazebo simulator. Controllers canbe safely developed in simulation and transferred withoutmodification to run on the real robots.
This section details the individual components making upthe testbed, before tying them together with a description ofthe complete system architecture.
1) Robot Operating System (ROS): We use ROS2 Galactic[25] for the testbed. ROS2 is the next generation of ROS[26], and, at first glance, would appear to have severaladvantages over ROS1 for the type of decentralised swarmtestbed we describe here. Firstly, there is no ROS master,ROS2 is completely decentralised. With multiple, potentiallycommunicating, robots, we don’t need to choose one to bethe master, nor do we need to use multimaster techniques(e.g, [27]) as were necessary with ROS1. This is facilitatedby the second major difference - the communications fabric ofROS2 uses middleware conforming to the DDS standard [28]of which there are several suppliers. DDS supports automaticdiscovery of the ROS graph and supports a rich set of Qualityof Service (QoS) policies that can be applied to different ROStopics, or communication channels. This maps onto a swarmperspective quite naturally; communications within the ROSgraph of a single robot may be marked as reliable meaningdata will always be delivered, even if retries are necessary,whereas inter-robot communications could be marked as besteffort meaning data may be lost and dropped with no errorsor retries if the physical channel is unreliable.
However, this enticing vision has yet to be borne out inreality. The DDS discovery process generates network trafficthat increases approximately O(n) where n is the number ofparticipants when using UDP multicast, or O(n2) when usingunicast [29] [30]. A participant is typically a ROS2 process ofwhich there might be many per robot. Complete informationis maintained for all participants at every location, even if theywill never communicate. Additionally, although the standarddiscovery protocol uses UDP multicast, this is very unreliableon WiFi networks [31] forcing the use of unicast discovery.Building robot systems with many mobile agents linked usingwireless communication is becoming more common, and thelimitations of ROS2 in this regard have resulted in severalpossible solutions. One approach, the discovery server, usesa central server to hold information about all participants,greatly reducing traffic. This so far is limited to a single DDSvendor, eProsima5, and is the opposite of the decentralisedvision. Another approach uses bridges between DDS and a
5https://www.eprosima.com/
more suitable protocol, this is the approach we used; Zenoh6
is an open-source project supported Eclipse Foundation7. TheZenoh approach is agnostic of the particular DDS middlewareused, and is intended to be part of the next release of ROS2.The Zenoh protocol is designed to overcome the deficienciesof DDS regarding discovery scalability [32]. By using aZenoh-DDS bridge on each agent (robots and other partici-pants) and disallowing DDS traffic off robot, we can achievetransparent ROS2 connectivity with far lower discovery trafficlevels, granular control over the topics that can seen outsidethe robot, true decentralisation, and no use of problematicmulticast.
A number of ROS nodes are always running on each robot,interfacing to the hardware and providing a set of ROS topicsthat constitute the robot API. This API is available on boththe simulated and real robot, and is intended to be the onlyway a controller has access to the hardware.
2) Coordinate frames: We adhere to the ROS standard forcoordinate frames REP-105 [33], see the arena diagram Figure13, with the extension that each frame name that is related toan individual robot is prefixed with the unique robot name. Theglobal frame map is fixed to the centre of the arena, odomis fixed to the starting position of the robot, and base linkis attached to the robot body, with +x pointing forward,between the overlapping cameras. The base link frames areupdated relative to the odom frames using each robots inertialmeasurements and wheel velocities. There is no transformbetween map and any odom unless some form of localisationis used on a robot, which is not necessary for many swarmapplications. The ROS transform library TF [34] is used tomanage transforms. Each robot has its own transform tree,and a transform relay node is used to broadcast a subset ofthe local transforms to global topics for use in visualisationand data gathering.
3) Containerisation: Controllers for the robots are de-ployed as Docker [35] containers. Docker provides alightweight virtualised environment making it easy to packagean application and associated dependencies into a container,which can then be deployed to computation resources usingan orchestration framework such as Kubernetes, we use thelightweight implementation K3S8.
Containers only have controlled access to the resources ofthe compute node, facilitating security and abstraction - as faras the container is concerned, it has no knowledge of whetherit has been deployed onto a real robot, or a compute nodecommunicating with a simulated environment.
4) Real world: The arena consists of a 5 m x 5 m mainroom, overlooked by an adjacent control room. The main roomis equipped with an OptiTrack [36] motion capture system with8x Flex 13 120Hz cameras for analysis of experiments. Thereare separate high resolution video cameras. Communicationswith the robots are provided with a dedicated 5 GHz WiFiaccess point and a private 5G base station. A Linux serveris used for data collection, Kubernetes orchestration, video
6https://zenoh.io/7https://www.eclipse.org/8https://k3s.io/
10
streaming, and general experiment management. The arenaserver and 5G base station are connected to the UMBRELLAnetwork [37] with a fibre link.
5) Simulation: The standard robot simulator Gazebo isused. The simulation environment consists of a configurablemodel of the real arena with various props such as carriers therobots can pick up, and obstacles, a Unified Robot DescriptionFormat (URDF) model of the robot and some of its senses, anda ROS node that provides the same topic API that is presentin the real robots.
The robot is modelled taking into account the trade-off be-tween speed and fidelity. Rather than modelling the physicallycomplex holonomic drive omniwheels we instead modelledthe motion of the robot as a disc with friction sliding over thefloor, with a custom plugin using a PID loop to apply forceand torque to the robot body in order meet velocity goals. Thishas the advantage over directly applying velocity of avoidingunphysical effects such as infinite acceleration, and results inrealistic behaviour at low computational cost.
The cameras, time-of-flight proximity sensors, and IMU (In-ertial Measurement Unit) are modelled using standard GazeboROS plugins and the ROS node emulates hardware sensorssuch as the battery state and controls actuation of the simulatedlifting platform, presenting the same interface as the realhardware.
Simulation is not reality - there are always differences. Thereality-gap [38] means that keeping in mind the limitations ofsimulation when designing robot behaviours that will transferwell to real robots is important. For example, collisions arehard to simulate, and bad for robots, so behaviours relying onthem in simulation should be avoided.
6) Online portal for remote experimentation: The physicalarena and the simulation environment are designed to beuseable remotely. The UMBRELLA Platform, detailed in [37]provides cloud infrastructure to facilitate this. An online portalis used for managing experiments through which users mayupload controller containers and simulator and experimentconfiguration files - controlling for example the number andstarting positions or the robots, and download data generatedduring an experimental run.
The user can schedule or queue experiments to be run insimulation or on the real robots. Because the real robots couldbe damaged by collisions, the controller containers used forexperiments on them need to be verified in a simulation runthat checks robot trajectories for dangerous approach velocitiesand other potential indicators of hazard. This is an open areaof research [39]–[41].
Controller containers for simulation are run on cloud ma-chines of the same processor architecture as the robots (ARM64 bit), communicating over ROS topics on a virtual networkwith a server running a Gazebo simulator instance. When thecontroller container has been verified and is to be run onthe real robots, it is passed to the testbed Linux server andqueued to be run by the testbed technician, who ensures thephysical arena is correctly set up and the right number ofrobots positioned.
As well as data collected by the experiment containers,the testbed server collects ground truth data from the motion
Server
Comms fabric (WiFi, private 5G, ethernet)
Reality
Umbrella
Zenoh-DDSbridge
Optitrackcameras
Optitrack PC
DDS middleware
Arena ROS management
Robot
Sensorsactuators
Hardwareinterface
ROSnodes
DDSmiddleware
ROS userapplicationcontainer
Zenohbridge
Containerorchestration
Optitrack-ROS bridge
Robot
Sensorsactuators
Hardwareinterface
ROSnodes
DDSmiddleware
Zenohbridge
ROS userapplicationcontainer
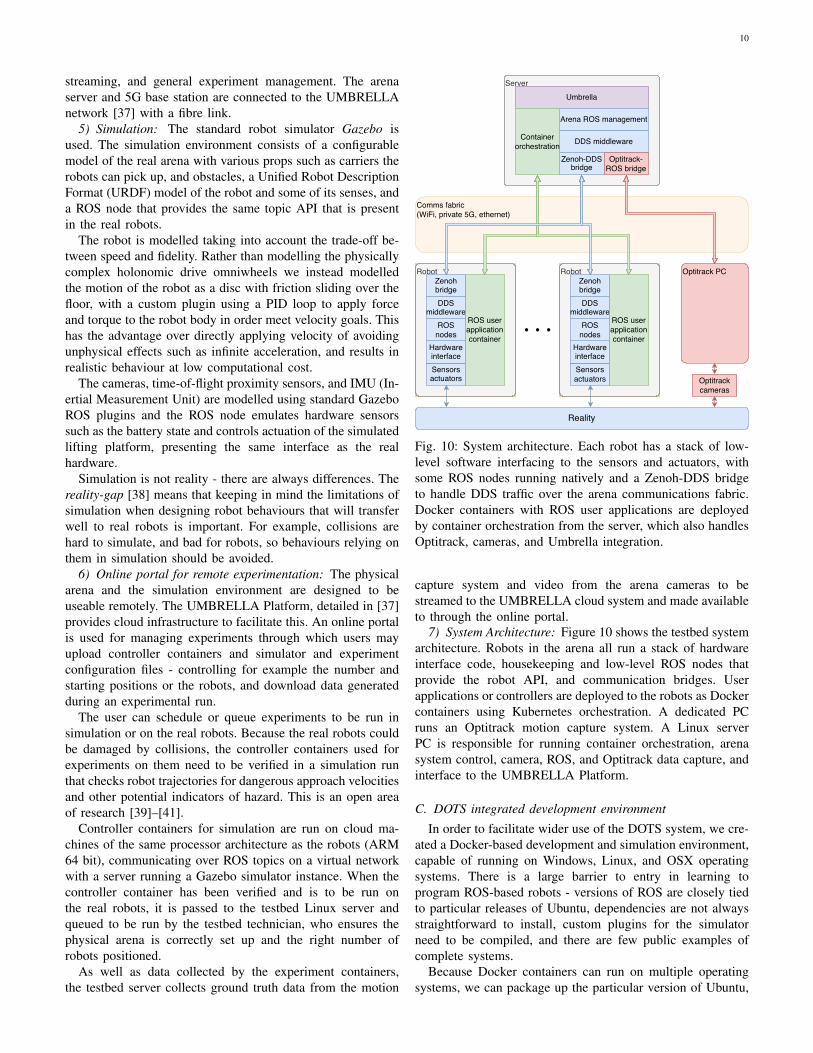
Fig. 10: System architecture. Each robot has a stack of low-level software interfacing to the sensors and actuators, withsome ROS nodes running natively and a Zenoh-DDS bridgeto handle DDS traffic over the arena communications fabric.Docker containers with ROS user applications are deployedby container orchestration from the server, which also handlesOptitrack, cameras, and Umbrella integration.
capture system and video from the arena cameras to bestreamed to the UMBRELLA cloud system and made availableto through the online portal.
7) System Architecture: Figure 10 shows the testbed systemarchitecture. Robots in the arena all run a stack of hardwareinterface code, housekeeping and low-level ROS nodes thatprovide the robot API, and communication bridges. Userapplications or controllers are deployed to the robots as Dockercontainers using Kubernetes orchestration. A dedicated PCruns an Optitrack motion capture system. A Linux serverPC is responsible for running container orchestration, arenasystem control, camera, ROS, and Optitrack data capture, andinterface to the UMBRELLA Platform.
C. DOTS integrated development environment
In order to facilitate wider use of the DOTS system, we cre-ated a Docker-based development and simulation environment,capable of running on Windows, Linux, and OSX operatingsystems. There is a large barrier to entry in learning toprogram ROS-based robots - versions of ROS are closely tiedto particular releases of Ubuntu, dependencies are not alwaysstraightforward to install, custom plugins for the simulatorneed to be compiled, and there are few public examples ofcomplete systems.
Because Docker containers can run on multiple operatingsystems, we can package up the particular version of Ubuntu,
11
ROS, and all the difficult to install dependencies and provideeasy access to a complete ROS2 DOTS code developmentand simulation environment. All access is provided via webinterfaces using open-source technologies developed for cloudapplications. The local file system is mounted within theDocker container.
1) Code-server: Code-server9 takes the popular open-source Microsoft editor VSCode10 and makes it available via abrowser window. We install this within the Docker container.By connecting to a particular port on the localhost, a standardVSCode interface is available in the browser. This not onlyallows browsing and editing of files, but also provides aterminal for command line access to the environment.
2) Gazebo: The Gazebo simulator is architecturally splitinto gzserver which runs the simulation, and gzclient whichpresents the standard user interface on a Linux desktop. Wemake available GZWeb, which is another client for gzserverthat presents a browser-based interface using WebGL [42].This allows browser access and is more performant than usingthe standard interface via VNC.
3) VNC: VNC is a technology for allowing remote desk-top access. We run a virtual framebuffer within the Dockercontainer together with a simple window manager and astandard VNC server, and use the noVNC11 client to makethis available through a browser window. This gives access toa standard Linux desktop and allows the use of other graphicalapplications such as the ROS data visualiser rviz.
These three applications packaged in a Docker containerenable rapid access to a complete DOTS development andsimulation environment in a platform agnostic way. Once acontroller application has been prototyped, it can be convertedinto a Docker container for upload to the UMBRELLA onlineportal to be verified and for deployment to the real robots.
IV. RESULTS
A. Intralogistics use case
In order to demonstrate the whole system, we implementeda conceptually simple swarm intralogistics task. Imagine acloakroom, similar to the scenario described in [43], whereusers can deposit and collect bags and jackets, and a swarmof robots will move these to and from a storage area. It ispossible to perform this search and retrieval task in an entirelydistributed, decentralised manner. Here we implement oneaspect of the task, item retrieval, in this decentralised fashion.
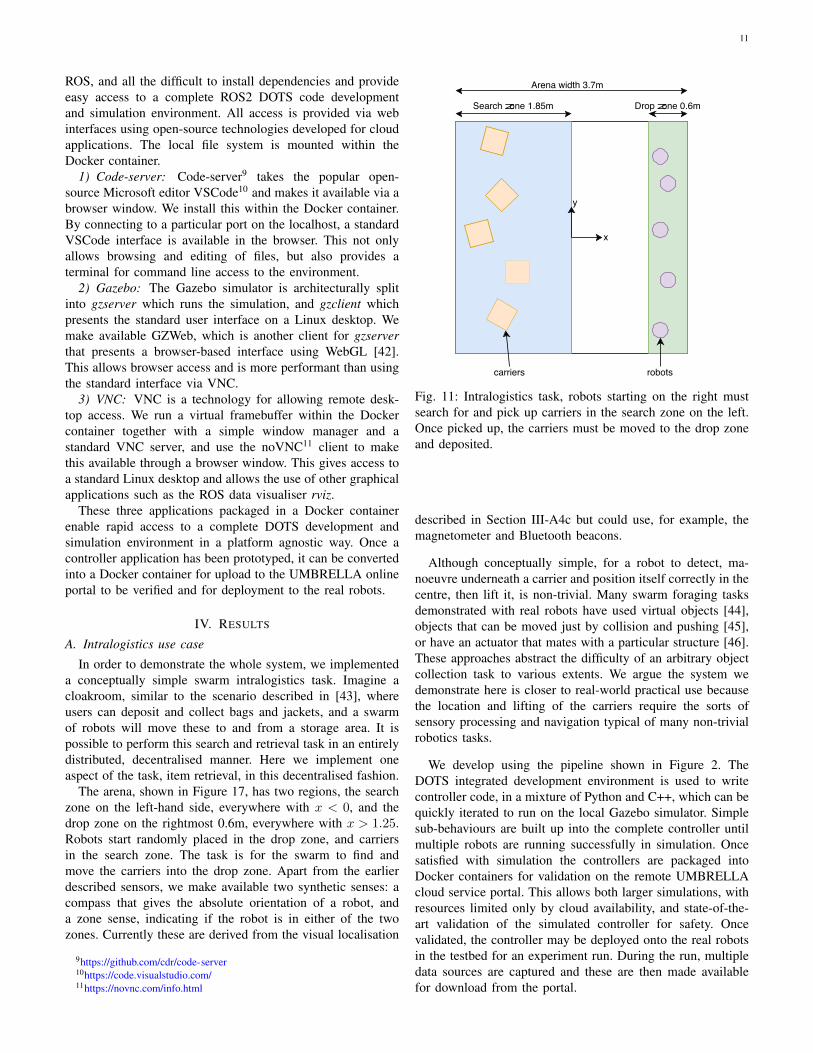
The arena, shown in Figure 17, has two regions, the searchzone on the left-hand side, everywhere with x < 0, and thedrop zone on the rightmost 0.6m, everywhere with x > 1.25.Robots start randomly placed in the drop zone, and carriersin the search zone. The task is for the swarm to find andmove the carriers into the drop zone. Apart from the earlierdescribed sensors, we make available two synthetic senses: acompass that gives the absolute orientation of a robot, anda zone sense, indicating if the robot is in either of the twozones. Currently these are derived from the visual localisation
9https://github.com/cdr/code-server10https://code.visualstudio.com/11https://novnc.com/info.html
y
x
Search zone 1.85m Drop zone 0.6m
robotscarriers
Arena width 3.7m
Fig. 11: Intralogistics task, robots starting on the right mustsearch for and pick up carriers in the search zone on the left.Once picked up, the carriers must be moved to the drop zoneand deposited.
described in Section III-A4c but could use, for example, themagnetometer and Bluetooth beacons.
Although conceptually simple, for a robot to detect, ma-noeuvre underneath a carrier and position itself correctly in thecentre, then lift it, is non-trivial. Many swarm foraging tasksdemonstrated with real robots have used virtual objects [44],objects that can be moved just by collision and pushing [45],or have an actuator that mates with a particular structure [46].These approaches abstract the difficulty of an arbitrary objectcollection task to various extents. We argue the system wedemonstrate here is closer to real-world practical use becausethe location and lifting of the carriers require the sorts ofsensory processing and navigation typical of many non-trivialrobotics tasks.
We develop using the pipeline shown in Figure 2. TheDOTS integrated development environment is used to writecontroller code, in a mixture of Python and C++, which can bequickly iterated to run on the local Gazebo simulator. Simplesub-behaviours are built up into the complete controller untilmultiple robots are running successfully in simulation. Oncesatisfied with simulation the controllers are packaged intoDocker containers for validation on the remote UMBRELLAcloud service portal. This allows both larger simulations, withresources limited only by cloud availability, and state-of-the-art validation of the simulated controller for safety. Oncevalidated, the controller may be deployed onto the real robotsin the testbed for an experiment run. During the run, multipledata sources are captured and these are then made availablefor download from the portal.
12
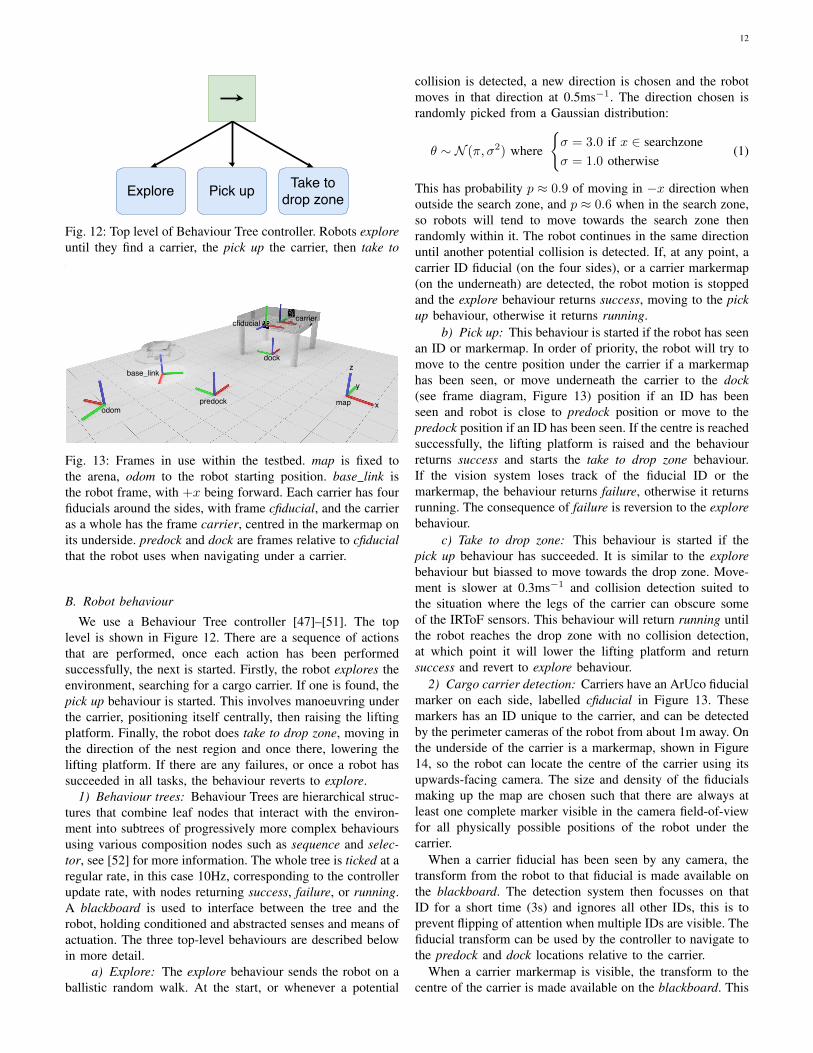
Explore Pick up Take todrop zone
Fig. 12: Top level of Behaviour Tree controller. Robots exploreuntil they find a carrier, the pick up the carrier, then take todrop zone the carrier.
map x
y
z
odom
base_link
predock
dock
cfiducial carrier
Fig. 13: Frames in use within the testbed. map is fixed tothe arena, odom to the robot starting position. base link isthe robot frame, with +x being forward. Each carrier has fourfiducials around the sides, with frame cfiducial, and the carrieras a whole has the frame carrier, centred in the markermap onits underside. predock and dock are frames relative to cfiducialthat the robot uses when navigating under a carrier.
B. Robot behaviour
We use a Behaviour Tree controller [47]–[51]. The toplevel is shown in Figure 12. There are a sequence of actionsthat are performed, once each action has been performedsuccessfully, the next is started. Firstly, the robot explores theenvironment, searching for a cargo carrier. If one is found, thepick up behaviour is started. This involves manoeuvring underthe carrier, positioning itself centrally, then raising the liftingplatform. Finally, the robot does take to drop zone, moving inthe direction of the nest region and once there, lowering thelifting platform. If there are any failures, or once a robot hassucceeded in all tasks, the behaviour reverts to explore.
1) Behaviour trees: Behaviour Trees are hierarchical struc-tures that combine leaf nodes that interact with the environ-ment into subtrees of progressively more complex behavioursusing various composition nodes such as sequence and selec-tor, see [52] for more information. The whole tree is ticked at aregular rate, in this case 10Hz, corresponding to the controllerupdate rate, with nodes returning success, failure, or running.A blackboard is used to interface between the tree and therobot, holding conditioned and abstracted senses and means ofactuation. The three top-level behaviours are described belowin more detail.
a) Explore: The explore behaviour sends the robot on aballistic random walk. At the start, or whenever a potential
collision is detected, a new direction is chosen and the robotmoves in that direction at 0.5ms−1. The direction chosen israndomly picked from a Gaussian distribution:
θ ∼ N (π, σ2) where
{σ = 3.0 if x ∈ searchzoneσ = 1.0 otherwise
(1)
This has probability p ≈ 0.9 of moving in −x direction whenoutside the search zone, and p ≈ 0.6 when in the search zone,so robots will tend to move towards the search zone thenrandomly within it. The robot continues in the same directionuntil another potential collision is detected. If, at any point, acarrier ID fiducial (on the four sides), or a carrier markermap(on the underneath) are detected, the robot motion is stoppedand the explore behaviour returns success, moving to the pickup behaviour, otherwise it returns running.
b) Pick up: This behaviour is started if the robot has seenan ID or markermap. In order of priority, the robot will try tomove to the centre position under the carrier if a markermaphas been seen, or move underneath the carrier to the dock(see frame diagram, Figure 13) position if an ID has beenseen and robot is close to predock position or move to thepredock position if an ID has been seen. If the centre is reachedsuccessfully, the lifting platform is raised and the behaviourreturns success and starts the take to drop zone behaviour.If the vision system loses track of the fiducial ID or themarkermap, the behaviour returns failure, otherwise it returnsrunning. The consequence of failure is reversion to the explorebehaviour.
c) Take to drop zone: This behaviour is started if thepick up behaviour has succeeded. It is similar to the explorebehaviour but biassed to move towards the drop zone. Move-ment is slower at 0.3ms−1 and collision detection suited tothe situation where the legs of the carrier can obscure someof the IRToF sensors. This behaviour will return running untilthe robot reaches the drop zone with no collision detection,at which point it will lower the lifting platform and returnsuccess and revert to explore behaviour.
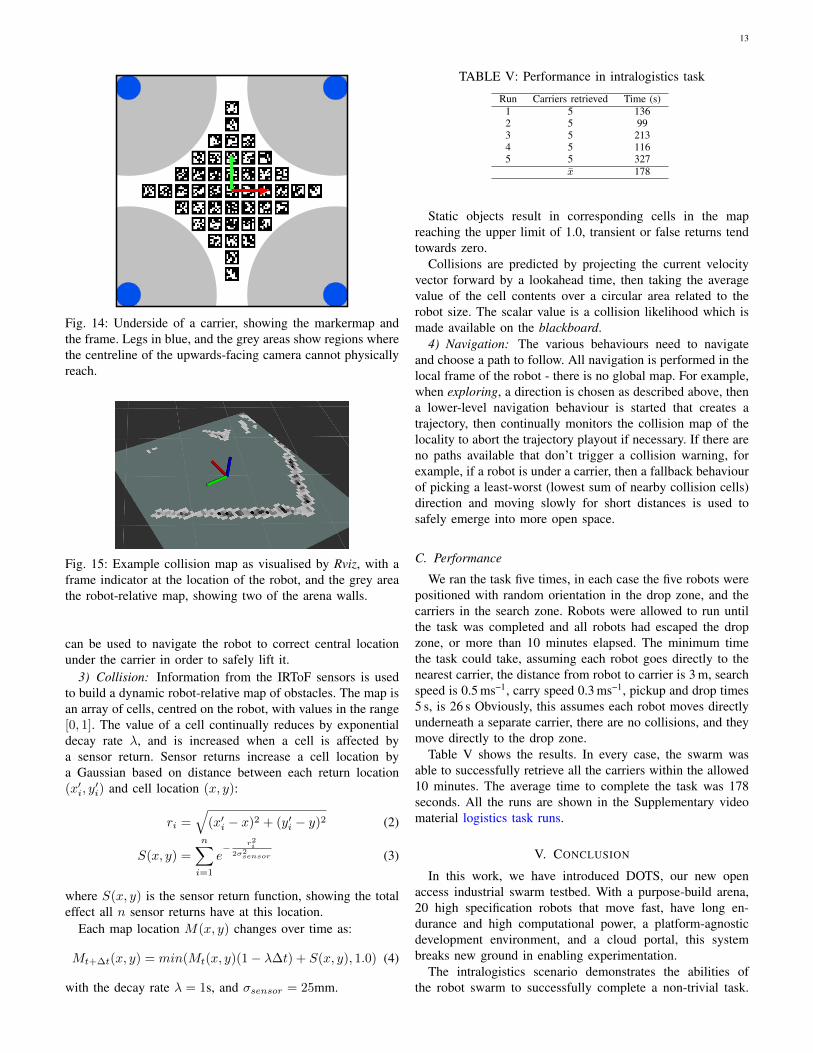
2) Cargo carrier detection: Carriers have an ArUco fiducialmarker on each side, labelled cfiducial in Figure 13. Thesemarkers has an ID unique to the carrier, and can be detectedby the perimeter cameras of the robot from about 1m away. Onthe underside of the carrier is a markermap, shown in Figure14, so the robot can locate the centre of the carrier using itsupwards-facing camera. The size and density of the fiducialsmaking up the map are chosen such that there are always atleast one complete marker visible in the camera field-of-viewfor all physically possible positions of the robot under thecarrier.
When a carrier fiducial has been seen by any camera, thetransform from the robot to that fiducial is made available onthe blackboard. The detection system then focusses on thatID for a short time (3s) and ignores all other IDs, this is toprevent flipping of attention when multiple IDs are visible. Thefiducial transform can be used by the controller to navigate tothe predock and dock locations relative to the carrier.
When a carrier markermap is visible, the transform to thecentre of the carrier is made available on the blackboard. This
13
Fig. 14: Underside of a carrier, showing the markermap andthe frame. Legs in blue, and the grey areas show regions wherethe centreline of the upwards-facing camera cannot physicallyreach.
Fig. 15: Example collision map as visualised by Rviz, with aframe indicator at the location of the robot, and the grey areathe robot-relative map, showing two of the arena walls.
can be used to navigate the robot to correct central locationunder the carrier in order to safely lift it.
3) Collision: Information from the IRToF sensors is usedto build a dynamic robot-relative map of obstacles. The map isan array of cells, centred on the robot, with values in the range[0, 1]. The value of a cell continually reduces by exponentialdecay rate λ, and is increased when a cell is affected bya sensor return. Sensor returns increase a cell location bya Gaussian based on distance between each return location(x′i, y
′i) and cell location (x, y):
ri =√
(x′i − x)2 + (y′i − y)2 (2)
S(x, y) =
n∑i=1
e− r2i
2σ2sensor (3)
where S(x, y) is the sensor return function, showing the totaleffect all n sensor returns have at this location.
Each map location M(x, y) changes over time as:
Mt+∆t(x, y) = min(Mt(x, y)(1− λ∆t) + S(x, y), 1.0) (4)
with the decay rate λ = 1s, and σsensor = 25mm.
TABLE V: Performance in intralogistics task
Run Carriers retrieved Time (s)1 5 1362 5 993 5 2134 5 1165 5 327
x 178
Static objects result in corresponding cells in the mapreaching the upper limit of 1.0, transient or false returns tendtowards zero.
Collisions are predicted by projecting the current velocityvector forward by a lookahead time, then taking the averagevalue of the cell contents over a circular area related to therobot size. The scalar value is a collision likelihood which ismade available on the blackboard.
4) Navigation: The various behaviours need to navigateand choose a path to follow. All navigation is performed in thelocal frame of the robot - there is no global map. For example,when exploring, a direction is chosen as described above, thena lower-level navigation behaviour is started that creates atrajectory, then continually monitors the collision map of thelocality to abort the trajectory playout if necessary. If there areno paths available that don’t trigger a collision warning, forexample, if a robot is under a carrier, then a fallback behaviourof picking a least-worst (lowest sum of nearby collision cells)direction and moving slowly for short distances is used tosafely emerge into more open space.
C. Performance
We ran the task five times, in each case the five robots werepositioned with random orientation in the drop zone, and thecarriers in the search zone. Robots were allowed to run untilthe task was completed and all robots had escaped the dropzone, or more than 10 minutes elapsed. The minimum timethe task could take, assuming each robot goes directly to thenearest carrier, the distance from robot to carrier is 3 m, searchspeed is 0.5 ms−1, carry speed 0.3 ms−1, pickup and drop times5 s, is 26 s Obviously, this assumes each robot moves directlyunderneath a separate carrier, there are no collisions, and theymove directly to the drop zone.
Table V shows the results. In every case, the swarm wasable to successfully retrieve all the carriers within the allowed10 minutes. The average time to complete the task was 178seconds. All the runs are shown in the Supplementary videomaterial logistics task runs.
V. CONCLUSION
In this work, we have introduced DOTS, our new openaccess industrial swarm testbed. With a purpose-build arena,20 high specification robots that move fast, have long en-durance and high computational power, a platform-agnosticdevelopment environment, and a cloud portal, this systembreaks new ground in enabling experimentation.
The intralogistics scenario demonstrates the abilities ofthe robot swarm to successfully complete a non-trivial task.
14
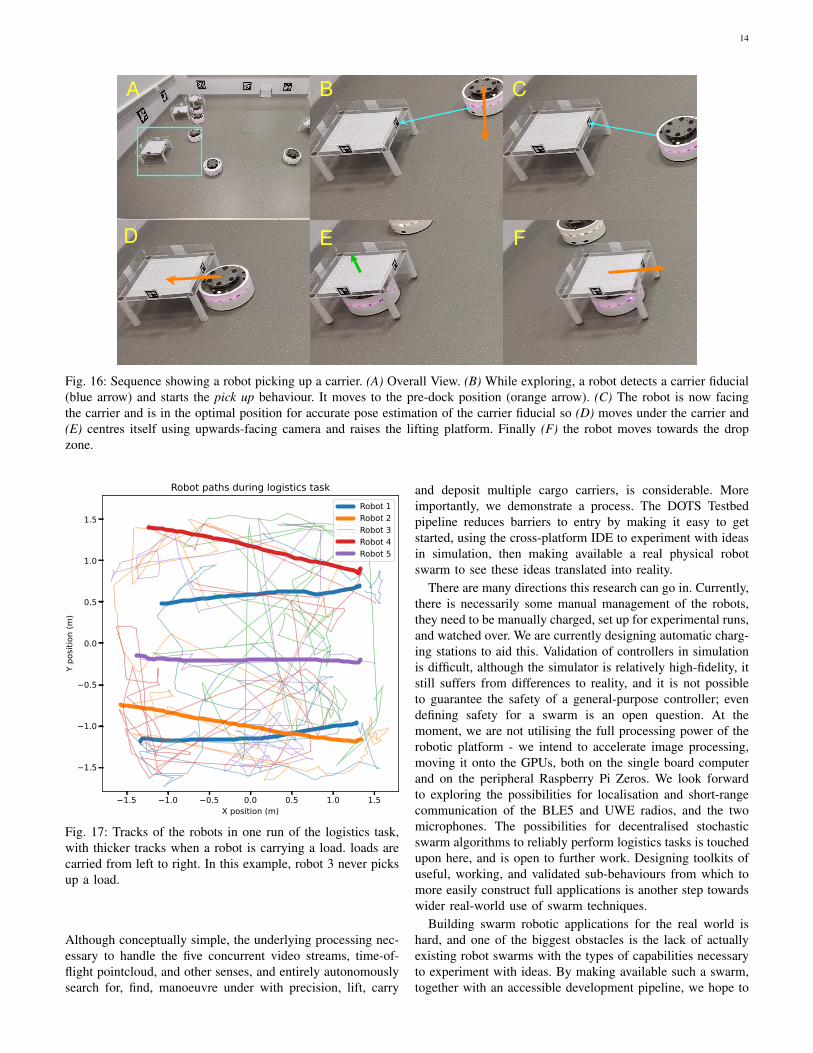
D E FD
B CA
Fig. 16: Sequence showing a robot picking up a carrier. (A) Overall View. (B) While exploring, a robot detects a carrier fiducial(blue arrow) and starts the pick up behaviour. It moves to the pre-dock position (orange arrow). (C) The robot is now facingthe carrier and is in the optimal position for accurate pose estimation of the carrier fiducial so (D) moves under the carrier and(E) centres itself using upwards-facing camera and raises the lifting platform. Finally (F) the robot moves towards the dropzone.
1.5 1.0 0.5 0.0 0.5 1.0 1.5X position (m)
1.5
1.0
0.5
0.0
0.5
1.0
1.5
Y po
sitio
n (m
)
Robot paths during logistics taskRobot 1Robot 2Robot 3Robot 4Robot 5
Fig. 17: Tracks of the robots in one run of the logistics task,with thicker tracks when a robot is carrying a load. loads arecarried from left to right. In this example, robot 3 never picksup a load.
Although conceptually simple, the underlying processing nec-essary to handle the five concurrent video streams, time-of-flight pointcloud, and other senses, and entirely autonomouslysearch for, find, manoeuvre under with precision, lift, carry
and deposit multiple cargo carriers, is considerable. Moreimportantly, we demonstrate a process. The DOTS Testbedpipeline reduces barriers to entry by making it easy to getstarted, using the cross-platform IDE to experiment with ideasin simulation, then making available a real physical robotswarm to see these ideas translated into reality.
There are many directions this research can go in. Currently,there is necessarily some manual management of the robots,they need to be manually charged, set up for experimental runs,and watched over. We are currently designing automatic charg-ing stations to aid this. Validation of controllers in simulationis difficult, although the simulator is relatively high-fidelity, itstill suffers from differences to reality, and it is not possibleto guarantee the safety of a general-purpose controller; evendefining safety for a swarm is an open question. At themoment, we are not utilising the full processing power of therobotic platform - we intend to accelerate image processing,moving it onto the GPUs, both on the single board computerand on the peripheral Raspberry Pi Zeros. We look forwardto exploring the possibilities for localisation and short-rangecommunication of the BLE5 and UWE radios, and the twomicrophones. The possibilities for decentralised stochasticswarm algorithms to reliably perform logistics tasks is touchedupon here, and is open to further work. Designing toolkits ofuseful, working, and validated sub-behaviours from which tomore easily construct full applications is another step towardswider real-world use of swarm techniques.
Building swarm robotic applications for the real world ishard, and one of the biggest obstacles is the lack of actuallyexisting robot swarms with the types of capabilities necessaryto experiment with ideas. By making available such a swarm,together with an accessible development pipeline, we hope to
15
reduce the barriers to entry and stimulate further research.
ACKNOWLEDGMENT
S.J. was supported by EPSRC DTP Doctoral Prize AwardEP/T517872/1. S.J. and S.H. were supported by EPSRC IAAAward EP/R511663/1. E.M. was supported by the EPSRCCentre for Doctoral Training in Future Autonomous andRobotic Systems (FARSCOPE) and an EPSRC ICASE Award.Toshiba Bristol Research and Innovation Laboratory (BRIL)provided additional support.
REFERENCES
[1] L. Custodio and R. Machado, “Flexible automated warehouse: a liter-ature review and an innovative framework,” The International Journalof Advanced Manufacturing Technology, vol. 106, no. 1, pp. 533–558,2020.
[2] Y. Jaghbeer, R. Hanson, and M. I. Johansson, “Automated order pickingsystems and the links between design and performance: a systematicliterature review,” International Journal of Production Research, vol. 58,no. 15, pp. 4489–4505, 2020.
[3] I. Draganjac, D. Miklic, Z. Kovacic, G. Vasiljevic, and S. Bogdan,“Decentralized control of multi-agv systems in autonomous warehousingapplications,” IEEE Transactions on Automation Science and Engineer-ing, vol. 13, no. 4, pp. 1433–1447, 2016.
[4] G. Fragapane, R. de Koster, F. Sgarbossa, and J. O. Strandhagen,“Planning and control of autonomous mobile robots for intralogistics:Literature review and research agenda,” European Journal of Opera-tional Research, 2021.
[5] E. Sahin, “Swarm robotics: From sources of inspiration to domains ofapplication,” in International Workshop on Swarm robotics (SR 2004),S. W. Sahin E., Ed. Santa Monica, CA, USA: Springer, 2005, pp.10–20.
[6] M. Schranz, G. A. Di Caro, T. Schmickl, W. Elmenreich, F. Arvin,A. Sekercioglu, and M. Sende, “Swarm intelligence and cyber-physicalsystems: concepts, challenges and future trends,” Swarm and Evolution-ary Computation, vol. 60, p. 100762, 2021.
[7] D. Pickem, P. Glotfelter, L. Wang, M. Mote, A. Ames, E. Feron, andM. Egerstedt, “The robotarium: A remotely accessible swarm roboticsresearch testbed,” in 2017 IEEE International Conference on Roboticsand Automation (ICRA). IEEE, 2017, pp. 1699–1706.
[8] L. Paull, J. Tani, H. Ahn, J. Alonso-Mora, L. Carlone, M. Cap, Y. F.Chen, C. Choi, J. Dusek, Y. Fang et al., “Duckietown: an open,inexpensive and flexible platform for autonomy education and research,”in 2017 IEEE International Conference on Robotics and Automation(ICRA). IEEE, 2017, pp. 1497–1504.
[9] M. ten Hompel, H. Bayhan, J. Behling, L. Benkenstein, J. Emmerich,G. Follert, M. Grzenia, C. Hammermeister, H. Hasse, D. Hoeninget al., “Technical report: Loadrunner®, a new platform approachon collaborative logistics services,” Logistics Journal: nicht referierteVeroffentlichungen, vol. 2020, no. 10, 2020.
[10] M. Williams, “Low pin-count debug interfaces for multi-device sys-tems,” 2009.
[11] R. Mur-Artal and J. D. Tardos, “Orb-slam2: An open-source slamsystem for monocular, stereo, and rgb-d cameras,” IEEE transactionson robotics, vol. 33, no. 5, pp. 1255–1262, 2017.
[12] F. J. Romero-Ramirez, R. Munoz-Salinas, and R. Medina-Carnicer,“Speeded up detection of squared fiducial markers,” Image and visionComputing, vol. 76, pp. 38–47, 2018.
[13] C. Bachhuber, E. Steinbach, M. Freundl, and M. Reisslein, “On theminimization of glass-to-glass and glass-to-algorithm delay in videocommunication,” IEEE Transactions on Multimedia, vol. 20, no. 1, pp.238–252, 2017.
[14] C. Bachhuber and E. Steinbach, “Are today’s video communicationsolutions ready for the tactile internet?” in 2017 IEEE Wireless Com-munications and Networking Conference Workshops (WCNCW). IEEE,2017, pp. 1–6.
[15] T. Moore and D. Stouch, “A generalized extended kalman filter imple-mentation for the robot operating system,” in Proceedings of the 13thInternational Conference on Intelligent Autonomous Systems (IAS-13).Springer, July 2014.
[16] S. Su, F. Heide, R. Swanson, J. Klein, C. Callenberg, M. Hullin, andW. Heidrich, “Material classification using raw time-of-flight measure-ments,” in Proceedings of the IEEE Conference on Computer Vision andPattern Recognition, 2016, pp. 3503–3511.
[17] C. Callenberg, Z. Shi, F. Heide, and M. B. Hullin, “Low-cost spadsensing for non-line-of-sight tracking, material classification and depthimaging,” ACM Transactions on Graphics (TOG), vol. 40, no. 4, pp.1–12, 2021.
[18] R. Rojas and A. G. Forster, “Holonomic control of a robot with anomnidirectional drive,” KI-Kunstliche Intelligenz, vol. 20, no. 2, pp. 12–17, 2006.
[19] B. Katz, J. Di Carlo, and S. Kim, “Mini cheetah: A platform forpushing the limits of dynamic quadruped control,” in 2019 internationalconference on robotics and automation (ICRA). IEEE, 2019, pp. 6295–6301.
[20] U. H. Lee, C.-W. Pan, and E. J. Rouse, “Empirical characterization ofa high-performance exterior-rotor type brushless dc motor and drive,”in 2019 IEEE/RSJ International Conference on Intelligent Robots andSystems (IROS). IEEE, 2019, pp. 8018–8025.
[21] F. Grimminger, A. Meduri, M. Khadiv, J. Viereck, M. Wuthrich,M. Naveau, V. Berenz, S. Heim, F. Widmaier, T. Flayols et al., “Anopen torque-controlled modular robot architecture for legged locomotionresearch,” IEEE Robotics and Automation Letters, vol. 5, no. 2, pp.3650–3657, 2020.
[22] N. Kau, A. Schultz, N. Ferrante, and P. Slade, “Stanford doggo: An open-source, quasi-direct-drive quadruped,” in 2019 International conferenceon robotics and automation (ICRA). IEEE, 2019, pp. 6309–6315.
[23] P. Dini and S. Saponara, “Cogging torque reduction in brushless motorsby a nonlinear control technique,” Energies, vol. 12, no. 11, p. 2224,2019.
[24] L. Berscheid and T. Kroger, “Jerk-limited real-time trajectory generationwith arbitrary target states,” arXiv preprint arXiv:2105.04830, 2021.
[25] D. Thomas, W. Woodall, and E. Fernandez, “Next-generationROS: Building on DDS,” in ROSCon Chicago 2014. MountainView, CA: Open Robotics, sep 2014. [Online]. Available: https://vimeo.com/106992622
[26] M. Quigley, K. Conley, B. Gerkey, J. Faust, T. Foote, J. Leibs,R. Wheeler, and A. Y. Ng, “ROS: an open-source Robot OperatingSystem,” in IEEE International Conference on Robotics and Automation(ICRA 2009) Workshop on Open Source Robotics, vol. 3, no. 3.2. Kobe,Japan: IEEE, 2009, p. 5.
[27] S. H. Juan and F. H. Cotarelo, “Multi-master ros systems,” Institut deRobotics and Industrial Informatics, pp. 1–18, 2015.
[28] G. Pardo-Castellote, “Omg data-distribution service: Architecturaloverview,” in 23rd International Conference on Distributed ComputingSystems Workshops, 2003. Proceedings. IEEE, 2003, pp. 200–206.
[29] K. An, A. Gokhale, D. Schmidt, S. Tambe, P. Pazandak, and G. Pardo-Castellote, “Content-based filtering discovery protocol (cfdp) scalableand efficient omg dds discovery protocol,” in Proceedings of the 8thACM International Conference on Distributed Event-Based Systems,2014, pp. 130–141.
[30] J. Sanchez-Monedero, J. Povedano-Molina, J. M. Lopez-Vega, andJ. M. Lopez-Soler, “Bloom filter-based discovery protocol for ddsmiddleware,” Journal of Parallel and Distributed Computing, vol. 71,no. 10, pp. 1305–1317, 2011.
[31] W. Kumari, C. E. Perkins, M. McBride, D. Stanley, and J. C. Zuniga,“Rfc 9119-multicast considerations over ieee 802 wireless media,” 2021.
[32] Eclipse Foundation. (2021) Minimizing discovery overhead in ROS2.[Online]. Available: https://zenoh.io/blog/2021-03-23-discovery/
[33] W. Meeussen. (2010, October) Coordinate frames for mobile platforms.[Online]. Available: https://ros.org/reps/rep-0105.html
[34] T. Foote, “tf: The transform library,” in 2013 IEEE Conference onTechnologies for Practical Robot Applications (TePRA). IEEE, 2013,pp. 1–6.
[35] D. Merkel, “Docker: lightweight linux containers for consistent devel-opment and deployment,” Linux journal, vol. 2014, no. 239, p. 2, 2014.
[36] NaturalPoint, Inc. DBA OptiTrack. (2022) Motion capture systems.[Online]. Available: https://optitrack.com/
[37] T. Farnham, S. Jones, A. Aijaz, Y. Jin, I. Mavromatis, U. Raza,A. Portelli, A. Stanoev, and M. Sooriyabandara, “Umbrella collaborativerobotics testbed and iot platform,” in 2021 IEEE 18th Annual ConsumerCommunications & Networking Conference (CCNC). IEEE, 2021, pp.1–7.
[38] J.-B. Mouret and K. Chatzilygeroudis, “20 years of reality gap: afew thoughts about simulators in evolutionary robotics,” in Workshop”Simulation in Evolutionary Robotics”, Genetic and Evolutionary Com-putation Conference (GECCO 2017). Berlin, Germany: ACM, 2017.
16
[39] D. Pickem, L. Wang, P. Glotfelter, Y. Diaz-Mercado, M. Mote, A. Ames,E. Feron, and M. Egerstedt, “Safe, remote-access swarm robotics re-search on the robotarium,” arXiv preprint arXiv:1604.00640, 2016.
[40] G. Beltrame, E. Merlo, J. Panerati, and C. Pinciroli, “Engineering safetyin swarm robotics,” in Proceedings of the 1st International Workshopon Robotics Software Engineering, 2018, pp. 36–39.
[41] K. I. Eder, W.-l. Huang, and J. Peleska, “Complete agent-drivenmodel-based system testing for autonomous systems,” arXiv preprintarXiv:2110.12586, 2021.
[42] Khronos Group, WebGL 1.0 Specification, Khronos Group, 2011.[43] S. Jones, E. Milner, M. Sooriyabandara, and S. Hauert, “Distributed
situational awareness in robot swarms,” Advanced Intelligent Systems,vol. 2, no. 11, p. 2000110, 2020.
[44] L. Pitonakova, R. Crowder, and S. Bullock, “Information exchangedesign patterns for robot swarm foraging and their application in robotcontrol algorithms,” Frontiers in Robotics and AI, vol. 5, p. 47, 2018.
[45] S. Jones, A. F. Winfield, S. Hauert, and M. Studley, “Onboard evolutionof understandable swarm behaviors,” Advanced Intelligent Systems,vol. 1, 2019.
[46] M. Dorigo, D. Floreano, L. M. Gambardella, F. Mondada, S. Nolfi,T. Baaboura, M. Birattari, M. Bonani, M. Brambilla, A. Brutschy et al.,“Swarmanoid: a novel concept for the study of heterogeneous roboticswarms,” IEEE Robotics & Automation Magazine, vol. 20, no. 4, pp.60–71, 2013.
[47] A. Champandard, “Behavior trees for next-gen game AI,” in Gamedevelopers conference, audio lecture, 2007.
[48] P. Ogren, “Increasing modularity of UAV control systems using com-puter game behavior trees,” in AIAA Guidance, Navigation and ControlConference. Minneapolis, MN, USA: AIAA, 2012.
[49] A. Klockner, “Behavior trees for uav mission management.” in IN-FORMATIK 2013 Informatik angepasst an Mensch, Organisation undUmwelt. Koblenz, Germany: Springer, 2013, pp. 57–68.
[50] S. Jones, M. Studley, S. Hauert, and A. F. Winfield, “Evolving be-haviour trees for swarm robotics,” in 13th International Symposiumon Distributed Autonomous Robotic Systems (DARS 2016), R. Groß,A. Kolling, S. Berman, E. Frazzoli, A. Martinoli, F. Matsuno, andM. Gauci, Eds. London, UK: Springer, 2016.
[51] M. Colledanchise, “Behavior trees in robotics,” 2017.[52] A. Marzinotto, M. Colledanchise, C. Smith, and P. Ogren, “Towards a
unified behavior trees framework for robot control,” in IEEE Interna-tional Conference on Robotics and Automation (ICRA 2014). HongKong, China: IEEE, 2014, pp. 5420–5427.
Copyright © 2022 FDOKUMEN